The effect of hospital financial distress on immediate breast reconstruction Catherine A Richards Submitted in partial fulfillment of the requirements for the degree of Doctor of Philosophy under the Executive Committee of the Graduate School of Arts and Sciences COLUMBIA UNIVERSITY 2014

Welcome message from author
This document is posted to help you gain knowledge. Please leave a comment to let me know what you think about it! Share it to your friends and learn new things together.
Transcript

The effect of hospital financial distress on immediate breast reconstruction
Catherine A Richards
Submitted in partial fulfillment of the requirements for
the degree of Doctor of Philosophy
under the Executive Committee of the Graduate School of
Arts and Sciences
COLUMBIA UNIVERSITY
2014

© 2014
Catherine A Richards
All rights reserved
ABSTRACT
The effect of hospital financial distress on immediate breast reconstruction
Catherine A Richards
Hospital financial stress is a common problem. From 1995-2010 15-30% of hospitals every year
were classified as financially distressed based on a negative total profit margin. However, very few
studies to date have assessed the impact of hospital financial distress on quality of care indicators or
patient outcomes. A comprehensive and systematic literature review was conducted to assess the state
of the science on hospital financial distress and quality of care or patient outcomes. A total of three peer-
reviewed articles were found that used a measure of hospital financial distress as an exposure with a
quality of care indicator or health-related factor as an outcome. However, despite the limited research on
this topic, the evidence suggested there was an important relationship between hospital financial distress
and patient outcomes.
What became clear after the systematic literature review was that not only had very few studies
ever assessed the relationship between hospital financial distress and patient outcomes, but there was
also limited evidence on the validity of various measures of hospital financial distress. An analysis
conducted as part of this dissertation assessed the validity of profit margin, as well as two composite
measures, the Financial Strength Index and the modified z-index, to see how well they predicted hospital
closure. Overall, despite the added complexity of the Financial Strength Index and the modified z-index
compared to profit margin, all three measures performed similarly with respect to predicting hospital
closure.
Finally, profit margin, as a measure of hospital financial distress was used to predict the receipt of
immediate breast reconstruction. Women undergoing mastectomy at hospitals under high levels of
hospital financial distress were significantly less likely to receive immediate breast reconstruction
compared to women treated at hospitals under minimal to no financial distress, adjusting for important
confounders. This means hospital financial distress is an important, although unwarranted, determinant of
breast cancer care.
i
TABLE OF CONTENTS
LIST OF FIGURES AND TABLES pg. ii
ACKNOWLEDGEMENTS pg. v
DEDICATION pg. vii
CHAPTER 1: INTRODUCTION & OVERVIEW OF THE DISSERTATION pg. 1
CHAPTER 2: A SYSTEMATIC REVIEW OF THE RELATIONSHIP BETWEEN HOSPITAL FINANCIAL
DISTRESS, QUALITY MEASURES AND PATIENT OUTCOMES pg. 5
CHAPTER 3: ASSESSING THE VALIDITY OF THREE DIFFERENT MEASURES OF HOSPITAL
FINANCIAL DISTRESS pg. 22
CHAPTER 4: THE EFFECT OF HOSPITAL FINANCIAL DISTRESS ON IMMEDIATE BREAST
RECONSTRUCTIVE SURGERY FOLLOWING MASTECTOMY pg. 33
CHAPTER 5: CONCLUSIONS pg. 47
REFERENCES pg. 51
APPENDIX A: COMPARING CALCULATED MEDIANS TO PUBLISHED VALUES pg. 56
APPENDIX B: MEASURING HOSPITAL FINANCIAL DISTRESS pg. 57
APPENDIX C: CATEGORIZING PROFIT MARGIN pg. 58
APPENDIX D: ASSESSMENT OF CONFOUNDING IN DATA pg. 59
APPENDIX E: FULL MODEL RESULTS SHOWN pg. 61
APPENDIX F: RESULTS FOR ALL CATEGORIZATIONS OF PROFIT MARGIN pg. 62
APPENDIX G: RESULTS ADJUSTING FOR INSURANCE STATUS pg. 63
APPENDIX H: BETWEEN HOSPITAL VARIATION pg. 64
ii
LIST OF FIGURES AND TABLES
Chapter 1
Figure 1: Proposed mechanism of hospital financial distress in the proposed research pg. 4
Chapter 2
Table 1: Domains and measures of hospital finance pg. 13
Table 2: Search terms used to identify relevant articles for the systematic review pg. 14
Figure 1: Flowchart of article review process pg. 15
Table 3a: Articles removed based on full-text and explanation for exclusion pg. 16
Table 3b: Additional articles removed based on full-text and explanation for exclusion pg. 18
Table 4a: Summary of articles included in the qualitative review part I pg. 19
Table 4b: Summary of articles included in the qualitative review part II pg. 20
Table 4c: Summary of articles included in the qualitative review part III pg. 21
Chapter 3
Table 1: Financial ratio measures included in the Financial Strength Index pg. 23
Table 2: Normalizing the financial ratio measures for the Financial Strength Index pg. 24
Table 3: Financial ratio measures included in the Modified z-index pg. 25
Figure 1: Median modified z-index values from 2002-2009 pg. 28
Figure 2: Median Financial Strength Index values from 2002-2009 pg. 28
Figure 3: Median profit margin values from 2002-2009 pg. 29
Table 4: Comparing different cut-points pg. 29
iii
Table 5: Proportion of hospitals classified as financially distressed using different cut-points pg. 30
Table 6: Validity statistics from the estimation sample for measures of hospital financial distress pg. 32
Table 7: Validity statistics from the validation sample for measures of hospital financial distress pg. 32
Chapter 4
Table 1: Codes used for identifying mastectomy and immediate breast reconstruction pg. 36
Figure 1: Directed Acyclic Graph of financial distress and immediate breast reconstruction pg. 41
Table 2: Minimally sufficient sets for confounder control pg. 41
Table 3: Descriptive statistics of the sample (N=5,760) pg. 43
Table 4: Effects of hospital financial distress on receipt of immediate breast reconstruction pg. 44
Appendix A
Table 1: Comparison of median values of financial ratio measures from three different sources pg. 56
Appendix B
Table 1: Measuring hospital financial distress with a 1-year lag pg. 57
Table 2: Measuring hospital financial distress using a 3-year average pg. 57
Table 3: Measuring hospital financial distress using a 3-year average with a 1-year lag pg. 57
Appendix C
Table 1: Cell sizes of different classifications of profit margin pg. 58
Appendix D
Table 1: Relationship between hospital financial distress and the confounders pg. 59
Table 2: Impact of confounder adjustment on the crude effect of hospital financial distress pg. 60

iv
Appendix E
Table 1: Full model results pg. 61
Appendix F
Table 1: Analysis results from multiple categorizations of profit margin pg. 62
Appendix G
Table 1: Model results adjusting for insurance status pg. 63

v
ACKNOWLEDGEMENTS
When I started the journey of researching breast reconstruction I never imagined I would venture into the
realm of hospital finance. I am so grateful that my committee gave me the freedom to study whatever I
wanted in order to have a dissertation that would provide meaningful results, regardless of the outcome.
I would like to thank Dawn Hershman, my sponsor, for giving me guidance and support from the very
beginning of the dissertation process and for introducing me to breast cancer research.
I would like to thank Sharon Schwartz, who has been a wonderful mentor. I would not be the
epidemiologist I am today without the brilliant methodological training from Sharon and I would not have
made it through the program without Sharon’s advice and guidance.
I would like to thank Andrew Rundle who hired me as a research assistant when I was two months into
the MPH program and has been a mentor ever since. I am so grateful Andrew believed I would make a
great epidemiologist and worked with me for so many years to ensure that I would be. I would not be the
person I am today without the guidance and mentorship of Andrew.
I would like to thank Norman Toy who taught me everything I needed to know about hospital finance. I
would never have been able to complete this dissertation work if it wasn’t for Norman’s support.
I would like to thank Liliane Zaretsky for all of her help and support over the past eight years. I would have
never made it into the doctoral program or completed my dissertation without her friendship and support.
I would like to thank Samantha Garbers and Edgar Simard for reading countless drafts of my dissertation
for no reason other than to help me succeed.
I would like to thank Al Neugut who supported me for four years as a cancer training fellow.
I would like to thank Don Ward for giving me my first job related to epidemiology. He hired me as
administrative assistant in the bureau of epidemiology at the Florida State Department of Health when I
was a freshman at Florida State University. Don was a great man and is dearly missed.

vi
I would like to thank John Taylor, a professor and epidemiologist at Florida State University that mentored
me and let me sit in on his graduate level epidemiology classes as an undergraduate.
I would like to thank Peter Kanetsky for taking me under his wing at the University of Pennsylvania, where
I finished my undergraduate degree. Peter was such a wonderful mentor and I am so glad he encouraged
me to apply to Columbia.
Finally, I would like to thank all of my friends and family. I would not have made it this far without all their
love and support over the years, especially my beautiful, future wife Kenie Huber.

vii
DEDICATION
This dissertation is dedicated to Bette Anne Oppenheim for giving me the book the “The Hot Zone” by
Richard Preston in the 7th grade and encouraging me to read it. This book introduced me to epidemiology
and I have been in love with the field ever since.
1
CHAPTER 1: INTRODUCTION & OVERVIEW OF THE DISSERTATION
Introduction
The payment system for acute-care hospitals in the U.S. drastically changed in 1983 when the
prospective payment system was introduced for inpatient hospital stays for Medicare enrollees in an
attempt to halt, and hopefully, lower the rising costs of Medicare. The in-patient prospective payment
system began reimbursing acute-care hospitals for in-patient care based on a prospectively determined
fixed payment rate for a specific bundle of services for clinically similar patients. Services were bundled
together into 467 diagnosis-related groups related to the resource intensity that could be expected to be
used for each clinically similar condition.1 Before the prospective payment system hospitals made a
tremendous amount of profit by offering and performing as many in-patient and out-patient services as
they could. After prospective payment, hospitals could no longer profit from offering more in-patient
services per patient. Instead they had to focus on making as much as they could from each patient with
as few services as possible.
After the implementation of the prospective payment system hospital administrators had no
choice but to become more businesslike in order to remain economically viable.1 Hospital administrators
began to ask physicians to make decisions while including cost considerations, rather than in a financially
unconstrained way.1 For example, one of the first notable changes in patient care after the
implementation of prospective payment was to decrease the average length of stay for Medicare patients
from 10.5 days in 1980 to 8.0 days in 1987, a reduction of 25%.1 The phrase “quicker and sicker” was
coined, most likely by physicians, to characterize this trend, as patients were being released after a
shorter length of stay and were discharged before fully recovering. The reason patients were being
released with a shorter length of stay was because they were being discharged or transferred to facilities,
such as rehabilitation facilities or long-term care hospitals, that still operated under the traditional fee for
service system, a system that translated into higher profits for hospitals than prospective payment.1 The
evidence has been mixed as to whether reduced length of stays resulted in higher mortality, but
regardless, administrators made decisions in order to reduce costs without knowing a priori what the
affect would be on patient outcomes.
2
Another example of hospitals making decisions based on financial concerns and not on what is
the best decision for the patient is the hospital practice of “patient dumping”.2 Patient dumping is the
practice of denying care based on a lack of insurance when patients have emergency medical conditions.
Patient dumping can occur in various forms. Patients can be transferred to public hospitals, encouraged
to seek care at a public hospital or discharged early. In 1986 a federal law was passed to prevent patient
dumping. Yet in 2012 some hospitals continue to turn away patients in need of emergency care based on
financial considerations.3
Economic theory suggests that the quality and quantity of medical services a hospital produces is
related to budget constraints.4 Therefore, the types of hospitals most likely to make decisions that may
negatively impact patient outcomes are those under financial distress. When a hospital is experiencing
financial distress this may affect the quantity of medical services by forcing them to reduce the services
they offer, particularly unprofitable ones, or by encouraging physicians to make decisions based on cost,
such as prioritizing operations that bring in the most revenue.
Despite the important link between hospital finance and the quantity and the quality of services
provided, few studies to date have specifically focused on how hospital financial distress might influence
quality measures or patient outcomes. Most literature linking hospital financial factors to quality have used
cost.5,6 Costs only capture the financial resources expended by the hospital. Without knowledge of how
much the hospital is being reimbursed for their expenditures, it is impossible to conclude whether a
hospital is making or losing money from patient care (i.e. profitability). In other words, costs alone do not
measure any of the four domains of hospital finance and therefore are not a good measure of hospital
financial distress. The four domains of hospital finance are profitability, solvency, liquidity and asset
efficiency.7
In parallel with the lack of attention in the literature focusing on the impact that hospital financial
distress may have on quality or patient outcomes, there has also been a lack of adequate validation of
measures of hospital financial distress. There are two prominent composite measures of hospital financial
distress discussed in the literature and trade journals: Altman’s z-index and Cleverely’s Financial Strength
Index.8 However, neither of these composite measures has been adequately validated as a measure of
3
hospital financial distress. The one hospital financial ratio measure that has been validated as a measure
of hospital financial distress that has been used in studies assessing the impact of financial distress on
quality or patient outcomes has been profit margin. However, given that profit margin only measures one
domain of hospital finance (profitability), it is likely that profit margin would not be as good a measure of
hospital financial distress as Altman’s z-index or Cleverley’s Financial Strength Index. But Altman’s
z-index and Cleverley’s Financial Strength Index have never been validated nor has their predictive
validity been directly compared to profit margin.
Hospital financial distress is not a rare occurrence. In fact, the most recent estimate by the
Medicare Payment Advisory Committee estimated that 25% of hospitals were under high levels of
financial distress based on profit margin alone from 2005-2009.9 Because a possible link between
financial distress and patient outcomes is of critical public health importance, the overall goal of this
dissertation is to systematically review the existing literature on hospital financial distress and patient
outcomes, assess the validity of the two most widely cited composite measures of hospital financial
distress and compare their predictive validity to that of profit margin and c) evaluate the impact of hospital
financial distress on a patient outcome likely to be impacted by hospitals under financial distress:
immediate breast reconstruction.
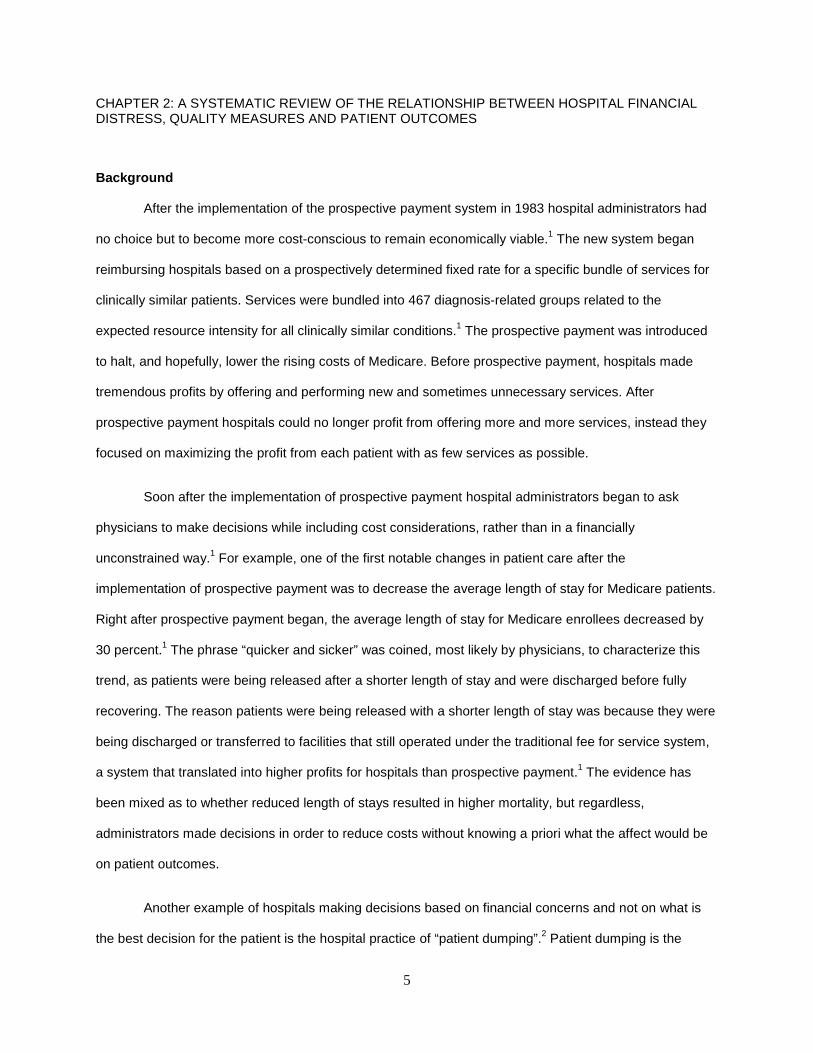
Breast Reconstruction as the case in point One aim of this dissertation is to evaluate the extent to which hospital financial pressure affects
patient outcomes, using immediate breast reconstruction as the case in point. The specific hypothesis is
that patients who undergo mastectomy at hospitals under high levels of financial distress will be less likely
to receive immediate breast reconstruction than patients treated at hospitals with low levels of financial
distress. The mechanism by which financial distress is likely to influence breast reconstructive outcomes
is through limiting the quality of breast reconstructive services (adherence to guideline based care,
availability of plastic surgeon, breast reconstructive options available or operating room priorities), as
shown in Figure 1 below. The quality of breast reconstructive services, as described, is a mediator
between hospital financial distress and receipt of breast reconstruction. The quality of breast
reconstructive services will not be measured in the proposed study it is only mentioned to describe the
mechanism by which hospital financial distress is hypothesized to influence breast reconstruction.
4
Brief overview of immediate breast reconstruction
The clinical guideline issued by the American Society of Clinical Oncology’s (ASCO) National
Initiative for Cancer Care Quality (NICCQ) recommends that all women undergoing mastectomy receive
information on reconstructive options before they undergo mastectomy.10,11 This guideline is based on the
evidence that breast reconstruction following mastectomy is a procedure shown to be associated with
long-term benefits such as increased ratings of self-esteem, body image and sexual functioning, as well
as decreased levels of anxiety and depression.12-14 The guideline for reconstruction is the same for
women with DCIS and invasive breast cancer; both populations should be informed of their options before
having a mastectomy. Breast reconstruction following mastectomy can be performed in an immediate
setting (i.e., during the same operation for mastectomy) or in a delayed setting (i.e. after the healing from
the initial mastectomy surgery). Immediate breast reconstruction has been shown to be associated with
lower rates of psychosocial morbidity and better long-term aesthetic results than delayed
reconstruction.14,15 If breast reconstructive options are not discussed before a woman undergoes
mastectomy receipt of immediate breast reconstruction is not possible.
Figure 1: Proposed mechanism of hospital financial distress in the proposed research
Summary
Hospitals make decisions based on economic considerations, and hospitals under financial distress may
be most likely to make decisions that negatively affect patient outcomes. However, to date very little
research has been done on this topic. The goals of this dissertation are to 1) validate commonly used
measures of hospital financial distress and 2) test whether hospital financial distress influences
immediate breast reconstruction.
Hospital Financial Pressure
Quality/Quantity of Breast Reconstructive Services 1) Surgeon informs patient about BR 2) Availability of plastic surgeon 3) BR options available 4) Operating room priorities
Patient receives IBR
5
CHAPTER 2: A SYSTEMATIC REVIEW OF THE RELATIONSHIP BETWEEN HOSPITAL FINANCIAL DISTRESS, QUALITY MEASURES AND PATIENT OUTCOMES
Background
After the implementation of the prospective payment system in 1983 hospital administrators had
no choice but to become more cost-conscious to remain economically viable.1 The new system began
reimbursing hospitals based on a prospectively determined fixed rate for a specific bundle of services for
clinically similar patients. Services were bundled into 467 diagnosis-related groups related to the
expected resource intensity for all clinically similar conditions.1 The prospective payment was introduced
to halt, and hopefully, lower the rising costs of Medicare. Before prospective payment, hospitals made
tremendous profits by offering and performing new and sometimes unnecessary services. After
prospective payment hospitals could no longer profit from offering more and more services, instead they
focused on maximizing the profit from each patient with as few services as possible.
Soon after the implementation of prospective payment hospital administrators began to ask
physicians to make decisions while including cost considerations, rather than in a financially
unconstrained way.1 For example, one of the first notable changes in patient care after the
implementation of prospective payment was to decrease the average length of stay for Medicare patients.
Right after prospective payment began, the average length of stay for Medicare enrollees decreased by
30 percent.1 The phrase “quicker and sicker” was coined, most likely by physicians, to characterize this
trend, as patients were being released after a shorter length of stay and were discharged before fully
recovering. The reason patients were being released with a shorter length of stay was because they were
being discharged or transferred to facilities that still operated under the traditional fee for service system,
a system that translated into higher profits for hospitals than prospective payment.1 The evidence has
been mixed as to whether reduced length of stays resulted in higher mortality, but regardless,
administrators made decisions in order to reduce costs without knowing a priori what the affect would be
on patient outcomes.
Another example of hospitals making decisions based on financial concerns and not on what is
the best decision for the patient is the hospital practice of “patient dumping”.2 Patient dumping is the
6
practice of denying care based on a lack of insurance when patients have emergency medical conditions.
Patient dumping can occur in various forms. Patients can be can be transferred to public hospitals,
encouraged to seek care at a public hospital or discharged early. In 1986 a federal law was passed to
prevent patient dumping. Yet some hospitals continue to turn away patients in need of emergency care
based on financial considerations.3
While hospital administrative policies encourage and pressure physicians to shorten the average
length of stay or to promote “patient dumping”, these policies do not provide direct evidence that hospital
administrative decisions based on financial considerations negatively affect patient outcomes. However,
these examples do provide evidence that hospital administrators enact policies, written or unwritten, to
ensure the economic viability of the hospital. The change in the reimbursement policy had an immediate
effect and resulted in shorter lengths of stay for all hospitals, regardless of the financial distress they were
under.1
However, few studies to date have specifically focused on how hospital financial distress might
influence hospital or patient-level quality measures or patient outcomes. Most literature linking a hospital
financial variable to quality has used cost, and not a measure of hospital financial distress.5,6 Costs only
capture the financial resources expended by the hospital. Without knowledge of how much the hospital is
being reimbursed for their expenditures it is impossible to conclude whether a hospital is making or losing
money from patient care (i.e. making a profit). In other words, costs alone do not measure any of the four
domains of hospital finance and therefore are not a good measure of hospital financial distress. The four
domains of hospital finance are profitability, solvency, liquidity and asset efficiency. A factor analysis in
1991, commissioned by the American Hospital Association, validated these four domains, as well as
financial indicators that measure each of them.7
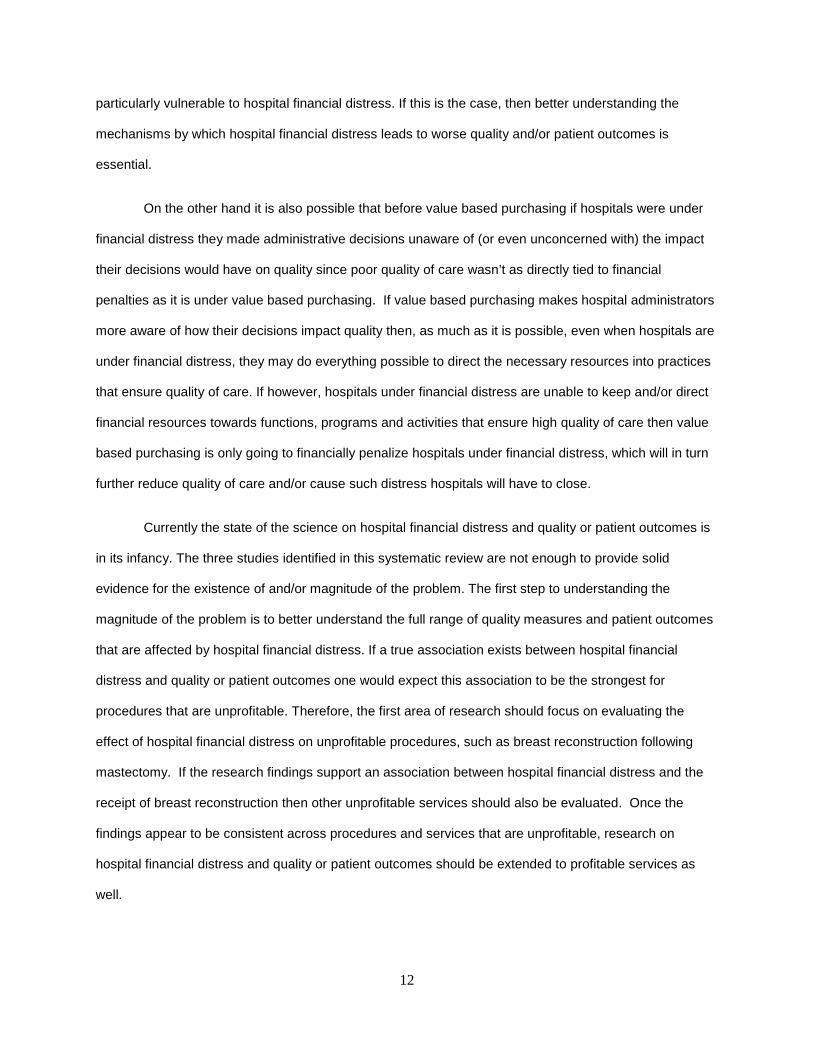
The goal of this systematic review is to evaluate if a relationship exists between hospital financial
distress and quality of care and/or patient outcomes. Any study that includes a financial ratio measure of
at least one domain of hospital finance will be included. Table 1 lists each of the four domains, the
measures commonly used to capture each of the domains and well as the components of each domain.
Because the literature on hospital financial conditions affecting quality of care or patient outcomes was
7
assumed to be very sparse based on unsystematic reviews of the literature a very broad set of search
terms was used. This review includes any peer-reviewed literature published since 1983 that includes a
financial ratio measure of hospital finance and how it may affect quality of care indicators and/or patient
outcomes.
Methods
The peer-review literature published between January 1, 1983 and February 21, 2013 was
reviewed. Literature before 1983 was excluded because 1983 was the year that the inpatient prospective
payment system was implemented and hospital finances significantly changed afterwards. Two
databases were used to search for potentially relevant articles: PubMed and Web of Science. PubMed
allows articles to be searched by medical subject heading (MeSH) terms, minor subject terms, as well as
by keywords. Web of Science only allows for articles to be searched by keywords. PubMed was searched
using both MeSH terms as well as keywords present in the title and/or abstract. Web of Science was only
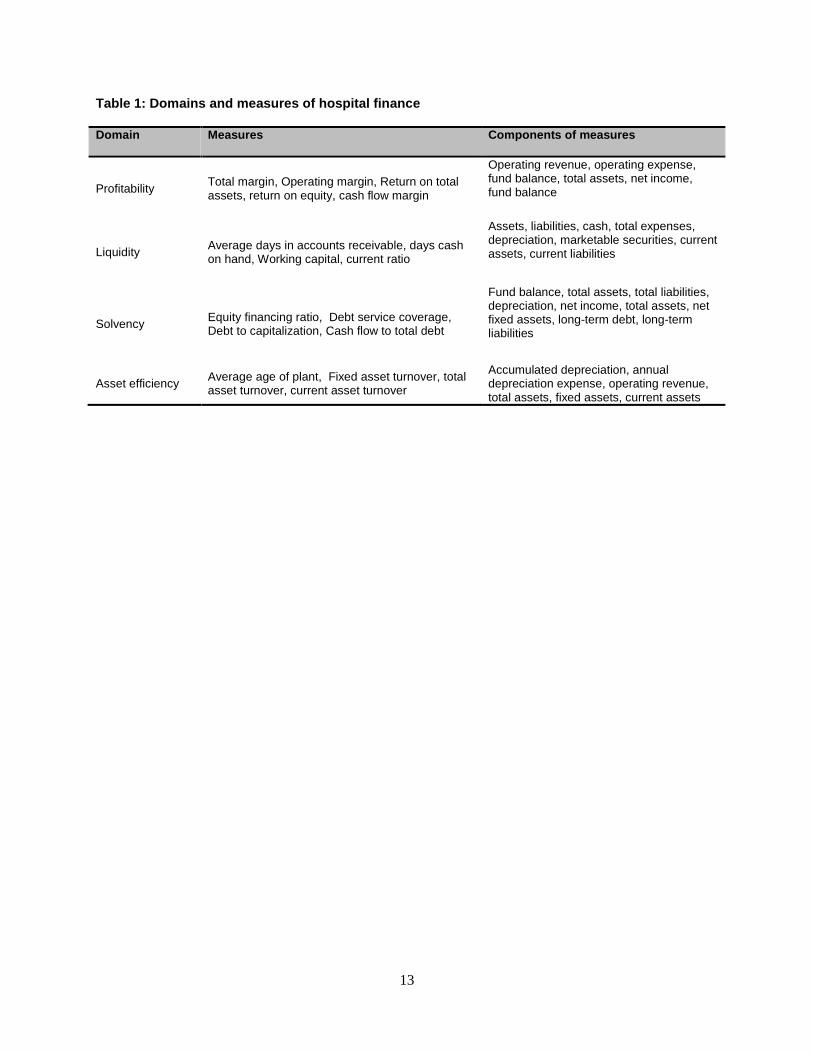
searched using keywords present in the title. The full search strategy, including the specific search terms,
is shown in Table 2. Three main searches were conducted to maximize the number of potential articles to
be included. The first search was conducted in PubMed and included MeSH terms for both hospital
financial conditions and quality measures and patient outcomes. The second search was conducted in
PubMed and included keywords present in the title and/or abstract for hospital financial conditions and
MeSH terms for the quality measures and patient outcomes. The third search was conducted in Web of
Science and included keywords present in the title for hospital financial conditions. Since the number of
keywords that could capture any patient outcome or quality measure is infinite, no keywords were used.
This approach was used, instead of using a list of 50 to 100 possible keywords, in order to maximize the
number of articles identified.
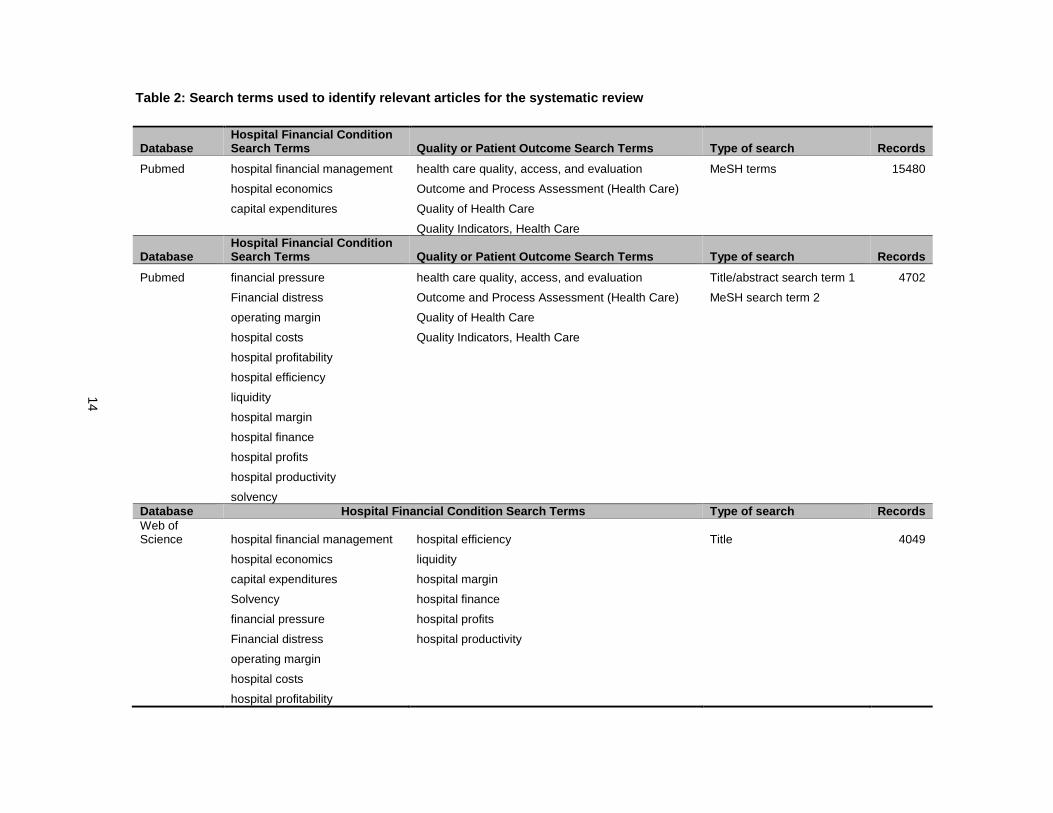
The flowchart of the screening process from titles to final articles included in the review is shown
in Figure 1. The total number of titles that were found searching PubMed and Web of Science with the
previously mentioned MeSH terms and keywords was 24,231. After removing duplicate articles, using
EndNote’s remove duplicate records tool, 19,557 articles remained. At this stage, titles of the 19,557
articles were reviewed. For the majority of papers, the title either did not include information about
8
outcomes or did not include a reference to hospital finance, and were therefore immediately excluded
from the analysis. The majority of articles excluded were related to hospital financial trends, hospital costs
and articles related to hospital management. Most of which appeared to be trade journal articles and not
scientific studies. For example, the Healthcare Financial Management Association journal is searchable
on PubMed, however, none of the articles published in this journal are peer-reviewed and/or original
scientific studies.
After attempting to find the abstract of all 107 remaining articles, 24 were removed, because there
was no abstract and/or the article was not original research, i.e., the article was an editorial or published
interview. After reviewing the abstracts of the remaining 83 articles, articles were removed if there was
clearly not a hospital financial indicator mentioned or a measure of quality and/or a patient outcome. Also,
articles at this stage, and moving forward, were excluded if the hospital financial ratio measure was
included in the study as an outcome, as the goal of this review was to assess the impact of hospital
financial distress on quality or patient outcomes. After reviewing all the abstracts, 57 articles were
removed. This left 26 articles. The full-text of these 26 articles was then reviewed. At this stage, articles
were removed if it became clear there was no measure of one of the four domains of hospital finance
and/or if there was no patient or quality measure as an outcome.
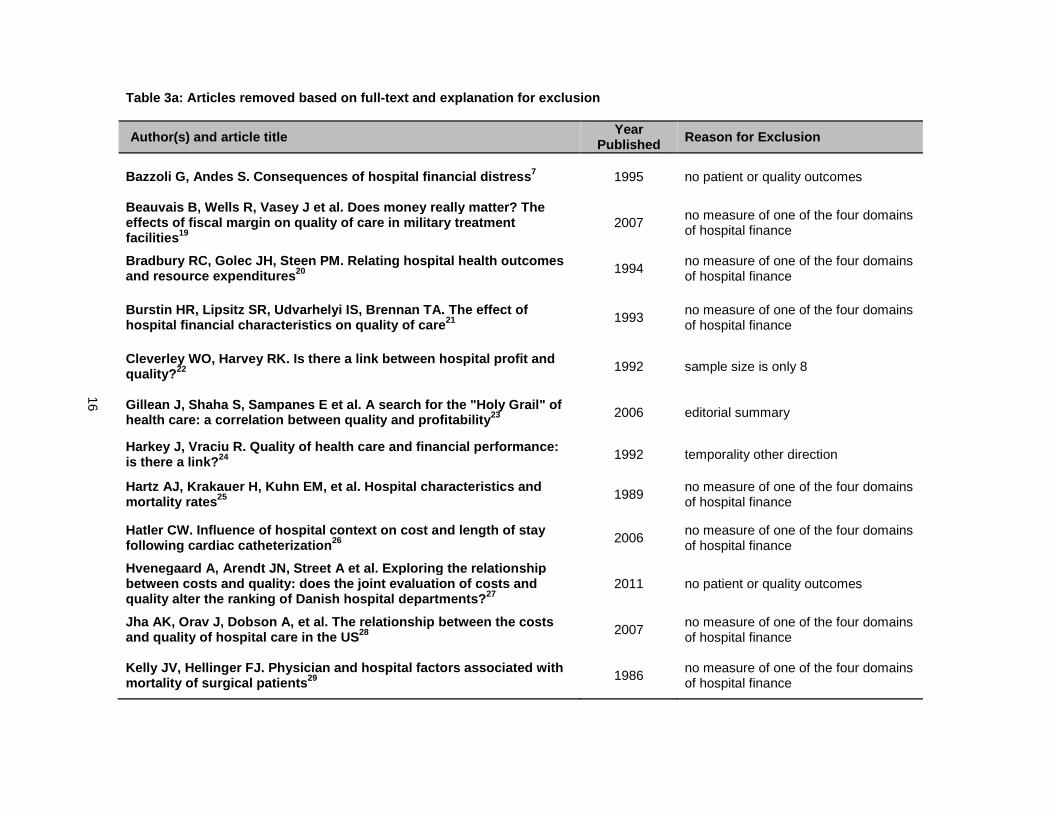
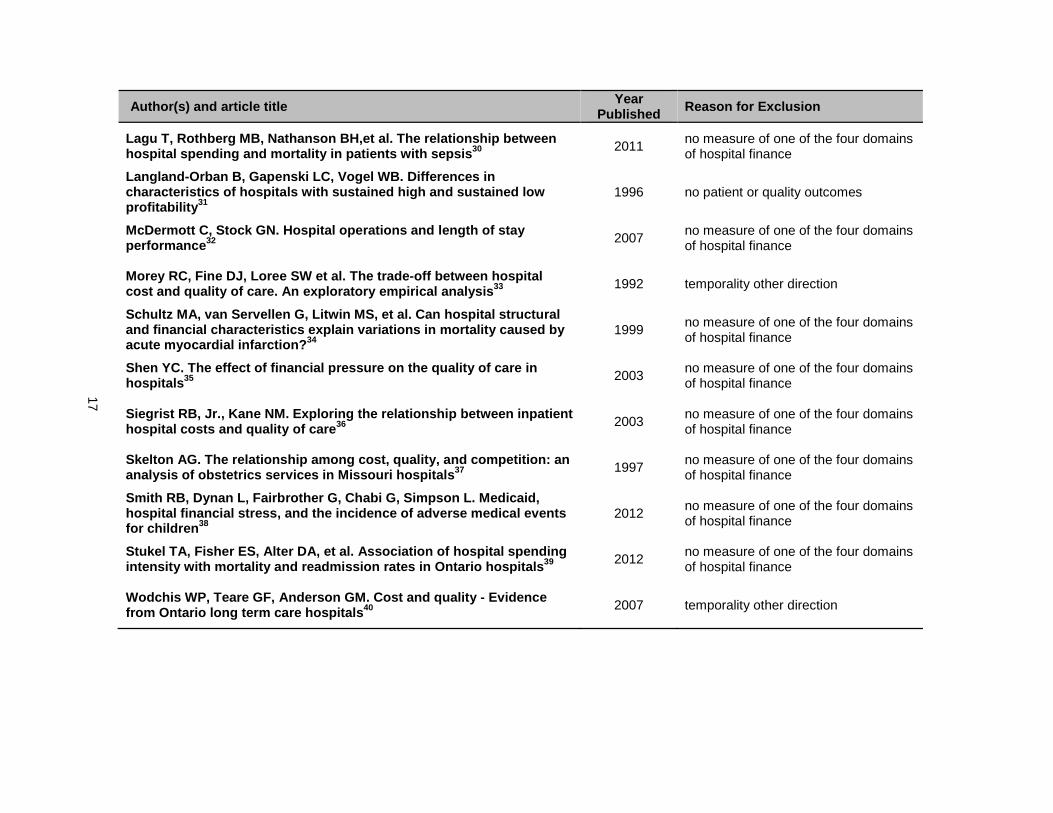
Of the 26 articles reviewed, 23 were excluded, leaving three that met criteria to be included in the
qualitative review. The specific reasons that each of these 23 articles were excluded are presented in
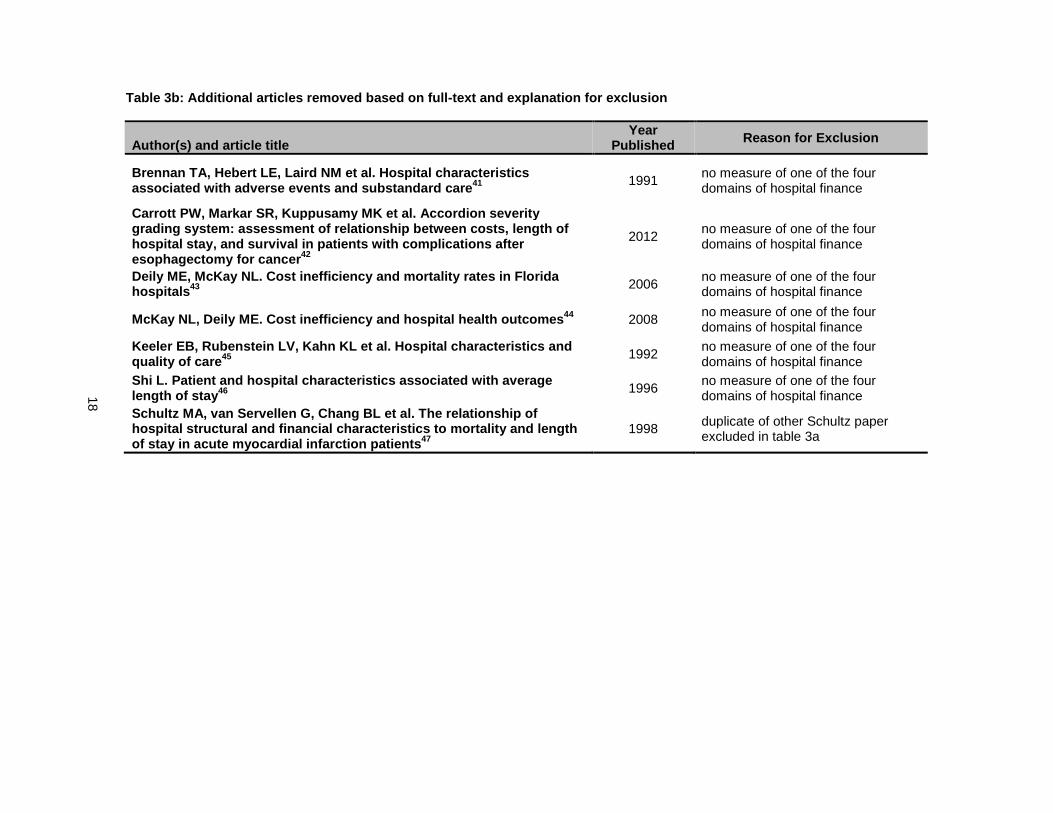
Table 3a. Next, the references of the three articles, in addition to four systematic reviews discovered
through the overall screening process, were reviewed for relevant titles. Nine additional titles were
identified through the review of these articles. Then the abstracts of these nine articles were reviewed and
two of these articles were excluded based on the abstract. The full-text of these seven additional articles
was reviewed for inclusion in the qualitative review. All of these articles were excluded after reviewing the
full-text. The reasons for exclusion are presented in Table 3b. The most common reason articles were
excluded at this stage was because there was no measure of one of the four domains of hospital finance.
This left three articles that were included in the qualitative review.
9
Once the articles were selected for inclusion in the qualitative review relevant information was
extracted from each article. The extracted information included information on how the hospital financial
variable was measured and the time period in which it was measured, how the patient health outcome or
quality indicator was measured as well as the time period in which it was measured, the mechanism
posited about how the measure of hospital finance affects the study outcome, whether or not criteria were
used to identify potential confounders, the magnitude of the effect size, whether a trend was present, and
finally, whether or not the direction of the observed association was in alignment with the theory that
hospital financial distress leads to worse patient outcomes. The information that was extracted was
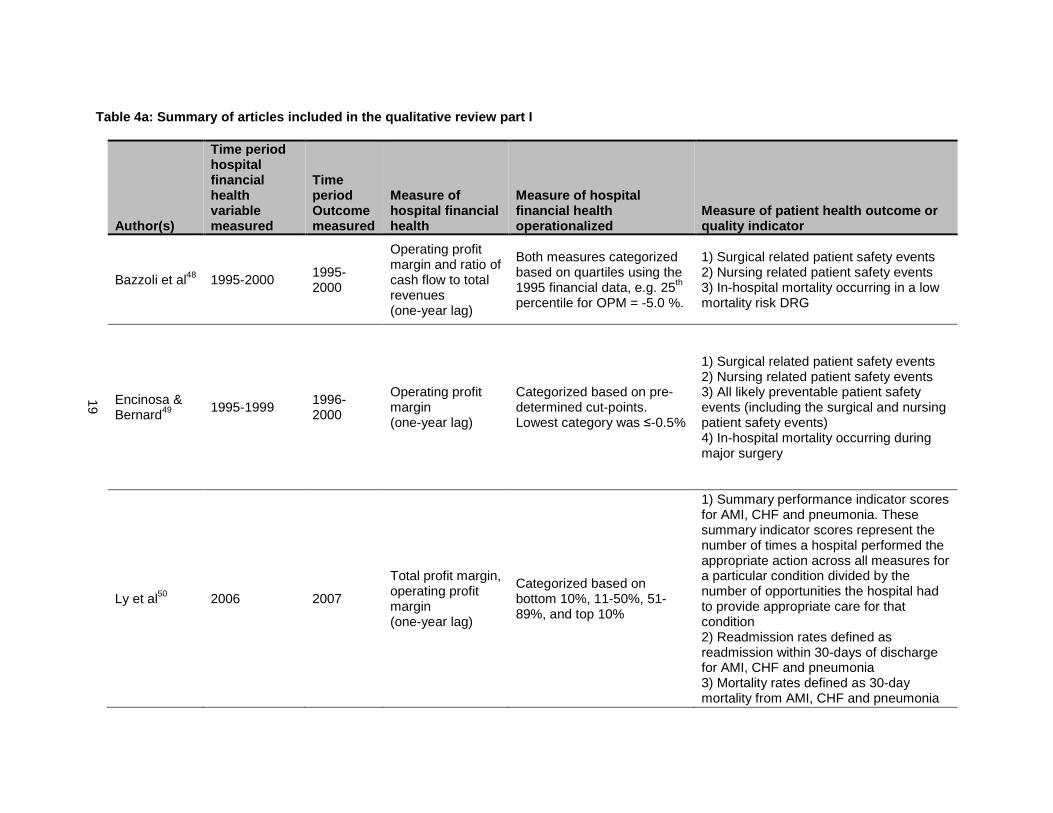
divided into three tables (Tables 4a, 4b and 4c).
Results
Among the three articles included in the review hospital finance was measured in three different
ways: 1) operating profit margin, 2) total profit margin, and 3) cash flow margin. All three of these
measures capture profitability. No measures captured the other three domains of hospital finance:
liquidity, solvency and asset efficiency. As is listed in Table 4A, eight different patient health outcomes or
quality indicators were used in the three studies, including: 1) all likely preventable patient safety events,
2) surgical related patient safety events, 3) nursing related patient safety events, 4) in-hospital mortality,
5) summary performance indicators for three different diseases: acute myocardial infraction (AMI),
congestive heart failure (CHF) and pneumonia, 7) 30-day readmission rates for AMI, CHF and pneumonia
and 8) 30-day mortality rates for AMI, CHF and pneumonia. All likely patient safety events, surgical
related safety events and in-hospital mortality were included as outcomes in two studies. The rest of the
outcomes were only used in one study.
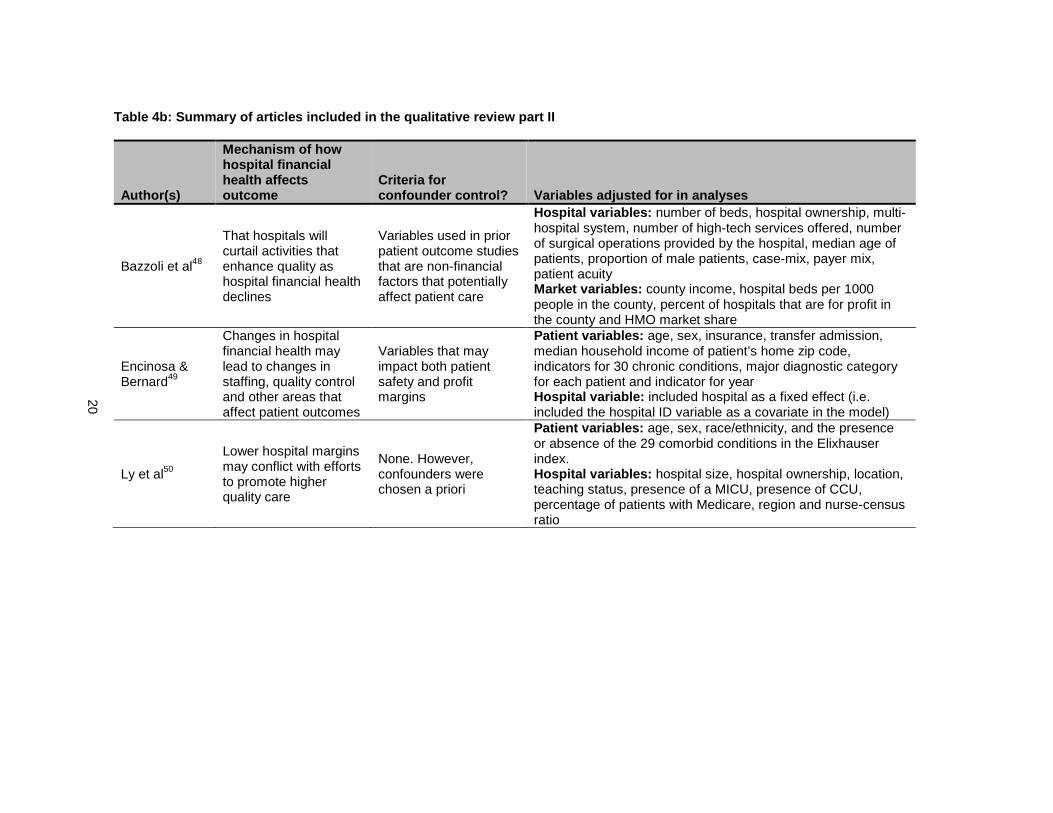
As is shown in table 4b, all three studies hypothesized that hospitals under financial distress
would have to curtail or alter hospital procedures and/or practices in a way that would negatively affect
quality or patient outcomes. While all studies hypothesized a similar mechanism, not all studies used the
same criteria for confounder control. Encinosa and Bernard included variables that may impact both
hospital finance and patient outcomes, Bazzoli only included variables that may impact patient outcomes
and Ly did not specify any criteria, though variables were adjusted for in their analyses. While the
10
variables adjusted for in each study were very different (as is shown in Table 4b), the results are very
similar.
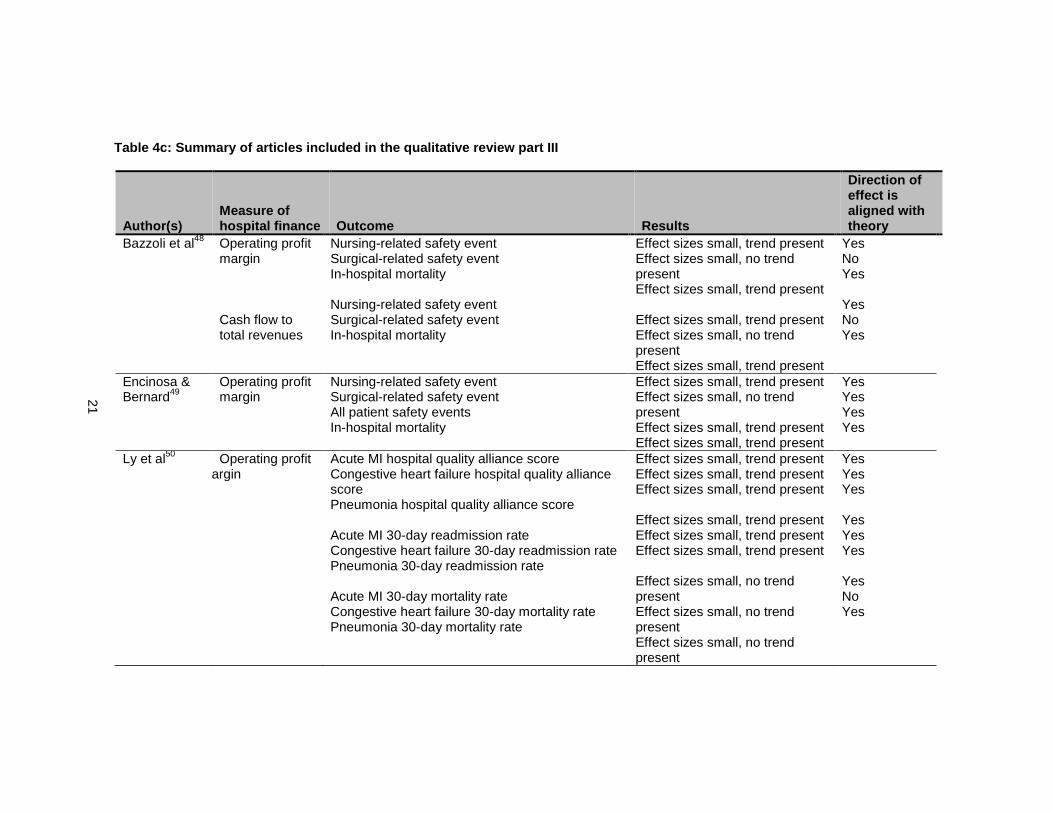
Table 4c highlights the results from each paper. There were 19 different associations tested in the
three papers included in this review. All 19 of the estimated effect sizes were small, 16 out of 19 of the
measured associations were in the direction hypothesized; that hospital financial distress leads to worse
outcomes. Encinosa & Bernard and Bazzoli categorized profit margin into quartiles, though both used
slightly different cut-points. Encinosa & Bernard chose a cut-point based on “expert” opinion while Bazzoli
chose cut-points based on quartiles derived from the sample data. The operating profit margin cut-point
Encinosa & Bernard used was -0.5% whereas the operating profit margin Bazzoli used was -5.0%.
Despite these different cut-points both studies found trends in the hypothesized direction for nursing-
related safety events and in-hospital mortality. Encinosa & Bernard also found a trend for all patient safety
events. Regarding surgical-related safety events neither Encinosa & Bernard nor Bazzoli found a trend in
the hypothesized direction. Ly categorized operating profit margin as based on below the 10th percentile,
between the 11-50th percentile, between the 51-89th percentile and above the 90th percentile. Ly found
small but consistent trends for the effect of operating profit margin on process indicators of quality for
AMI, CHF and pneumonia. Ly also found small but consistent trends for the effect of operating profit
margin on 30-day readmission rates for AMI, CHF and pneumonia. Ly did not find a consistent trend with
operating profit margin and 30-day mortality rates.
Discussion
After limiting the articles to those that included at least one measure of one domain of hospital
finance only three articles remained. This review demonstrates how little is known about this topic, even
with the very broad and general criteria that were used. However, all three studies found small but
consistent relationships between hospital operating profit margin (the measure used for hospital financial
distress) and the majority of quality or patient outcome measures assessed. There was a small, but
consistent trend for operating profit margin and nursing-related safety events, all patient safety events, in-
hospital mortality, process indicators of quality for AMI, CHF and pneumonia as well as 30-day
11
readmission rates for AMI, CHF and pneumonia. The two outcomes for which there were inconsistent
trends were surgical-related safety events and 30-day mortality from AMI, CHF and pneumonia.
A potential explanation of the small effect sizes is the use of a one-year lag of the hospital
financial measures. A one-year measure is not as reliable as a three-year average, as has been
discussed elsewhere16, and will be discussed in more detail in the next paper. Since the one-year lag is
used for all hospitals, if any bias exists it will be non-differential and therefore bias towards the null.
While all three studies looked at operating margin as an outcome, and other measures of
profitability, it is unclear if composite measures of hospital financial conditions are more appropriate
measures of hospital financial distress. There are two commonly cited composite measures that can be
used to assess the financial state of a hospital: the Financial Strength Index developed by Cleverley and
the modified z-index developed by Altman. However, neither of these measures has been validated as
measures of hospital financial distress. Since neither of the composite measures has been validated it is
also unknown how profit margin stacks up against these measures. An aim of the second paper of this
dissertation is to address this current gap in the literature.
One component of the Affordable Care Act that greatly impacts hospitals is the establishment of
the value based purchasing program. Before value based purchasing hospitals were not held accountable
for the quality of care that they provided. Now hospitals are not only being held accountable for the quality
of care they deliver but also the quality of care must be achieved at a reasonable cost. Quality is
measured based on three domains: the Clinical Process of Care Domain, the Patient Experience of Care
Domain and the Outcome Domain. Hospitals are financially rewarded if they provide an overall high
performance of care on all three domains. On the other hand, if hospitals provide low quality of care or
care at a very high cost, they are financially punished. If hospitals under financial distress provide lower
quality of care because they don’t have the financial resources to provide higher quality of care then the
value based purchasing system will financially punish these hospitals, further reducing quality and
worsening patient outcomes. It’s also possible that hospitals will only focus on services and procedures
that are being evaluated as part of the three domains rather than on overall quality. Therefore, a
procedure like breast reconstruction, which is not one of the procedures being evaluated17, may be
12
particularly vulnerable to hospital financial distress. If this is the case, then better understanding the
mechanisms by which hospital financial distress leads to worse quality and/or patient outcomes is
essential.
On the other hand it is also possible that before value based purchasing if hospitals were under
financial distress they made administrative decisions unaware of (or even unconcerned with) the impact
their decisions would have on quality since poor quality of care wasn’t as directly tied to financial
penalties as it is under value based purchasing. If value based purchasing makes hospital administrators
more aware of how their decisions impact quality then, as much as it is possible, even when hospitals are
under financial distress, they may do everything possible to direct the necessary resources into practices
that ensure quality of care. If however, hospitals under financial distress are unable to keep and/or direct
financial resources towards functions, programs and activities that ensure high quality of care then value
based purchasing is only going to financially penalize hospitals under financial distress, which will in turn
further reduce quality of care and/or cause such distress hospitals will have to close.
Currently the state of the science on hospital financial distress and quality or patient outcomes is
in its infancy. The three studies identified in this systematic review are not enough to provide solid
evidence for the existence of and/or magnitude of the problem. The first step to understanding the
magnitude of the problem is to better understand the full range of quality measures and patient outcomes
that are affected by hospital financial distress. If a true association exists between hospital financial
distress and quality or patient outcomes one would expect this association to be the strongest for
procedures that are unprofitable. Therefore, the first area of research should focus on evaluating the
effect of hospital financial distress on unprofitable procedures, such as breast reconstruction following
mastectomy. If the research findings support an association between hospital financial distress and the
receipt of breast reconstruction then other unprofitable services should also be evaluated. Once the
findings appear to be consistent across procedures and services that are unprofitable, research on
hospital financial distress and quality or patient outcomes should be extended to profitable services as
well.
13
Table 1: Domains and measures of hospital finance
Domain Measures Components of measures
Profitability Total margin, Operating margin, Return on total assets, return on equity, cash flow margin
Operating revenue, operating expense, fund balance, total assets, net income, fund balance
Liquidity Average days in accounts receivable, days cash on hand, Working capital, current ratio
Assets, liabilities, cash, total expenses, depreciation, marketable securities, current assets, current liabilities
Solvency Equity financing ratio, Debt service coverage, Debt to capitalization, Cash flow to total debt
Fund balance, total assets, total liabilities, depreciation, net income, total assets, net fixed assets, long-term debt, long-term liabilities
Asset efficiency Average age of plant, Fixed asset turnover, total asset turnover, current asset turnover
Accumulated depreciation, annual depreciation expense, operating revenue, total assets, fixed assets, current assets
14
Table 2: Search terms used to identify relevant ar ticles for the systematic review
Database Hospital Financial Condition Search Terms Quality or Patient Outcome Search Terms Type of search Records
Pubmed hospital financial management health care quality, access, and evaluation MeSH terms 15480
hospital economics Outcome and Process Assessment (Health Care)
capital expenditures Quality of Health Care
Quality Indicators, Health Care
Database Hospital Financial Condition Search Terms Quality or Patient Outcome Search Terms Type of search Records
Pubmed financial pressure health care quality, access, and evaluation Title/abstract search term 1 4702
Financial distress Outcome and Process Assessment (Health Care) MeSH search term 2
operating margin Quality of Health Care
hospital costs Quality Indicators, Health Care
hospital profitability
hospital efficiency
liquidity
hospital margin
hospital finance
hospital profits
hospital productivity
solvency Database Hospital Financial Condition Search Terms Type of search Records Web of Science hospital financial management hospital efficiency Title 4049
hospital economics liquidity
capital expenditures hospital margin
Solvency hospital finance
financial pressure hospital profits
Financial distress hospital productivity
operating margin
hospital costs
hospital profitability
15
Figure 1: Flowchart of article review process
The above figure was adapted from Liberati et al. “The PRISMA Statement for Reporting Systematic Reviews and Meta-Analyses of Studies that Evaluate Health Care Interventions: Explanation and Elaboration”.18 Once eligible articles were chosen, titles of articles cited in those papers were reviewed for potential inclusion. Exception was four systematic reviews which were excluded as an eligible paper but references were screened for relevant titles.
# of records identified through database searching: N = 24,231
# of additional records identified by
title through reviews of relevant2
articles N =9
# of records after duplicates removed N = 19,557
# of records screened through title N = 107
# of records removed N = 19,450
# of full-text articles assessed for eligibility N = 26+ 7 = 33
# of full-text articles excluded, with reasons N = 30
# of studies included in qualitative synthesis N = 3
# of records screened through abstracts (round 1) N = 83
# of records removed N = 24
# of records screened through abstracts (round 2) N = 26
# of records removed N = 57
# of additional records screened through abstracts N = 7
16
Table 3a: Articles removed based on full-text and e xplanation for exclusion
Author(s) and article title Year Published Reason for Exclusion
Bazzoli G, Andes S. Consequences of hospital financ ial distress 7 1995 no patient or quality outcomes
Beauvais B, Wells R, Vasey J et al. Does money real ly matter? The effects of fiscal margin on quality of care in mili tary treatment facilities 19
2007 no measure of one of the four domains of hospital finance
Bradbury RC, Golec JH, Steen PM. Relating hospital health outcomes and resource expenditures 20 1994
no measure of one of the four domains of hospital finance
Burstin HR, Lipsitz SR, Udvarhelyi IS, Brennan TA. The effect of hospital financial characteristics on quality of ca re21 1993
no measure of one of the four domains of hospital finance
Cleverley WO, Harvey RK. Is there a link between ho spital profit and quality? 22 1992 sample size is only 8
Gillean J, Shaha S, Sampanes E et al. A search for the "Holy Grail" of health care: a correlation between quality and prof itability 23 2006 editorial summary
Harkey J, Vraciu R. Quality of health care and fina ncial performance: is there a link? 24 1992 temporality other direction
Hartz AJ, Krakauer H, Kuhn EM, et al. Hospital char acteristics and mortality rates 25 1989
no measure of one of the four domains of hospital finance
Hatler CW. Influence of hospital context on cost an d length of stay following cardiac catheterization 26 2006
no measure of one of the four domains of hospital finance
Hvenegaard A, Arendt JN, Street A et al. Exploring the relatio nship between costs and quality: does the joint evaluatio n of costs and quality alter the ranking of Danish hospital depart ments? 27
2011 no patient or quality outcomes
Jha AK, Orav J, Dobson A, et al. The relationship b etween the costs and quality of hospital care in the US 28 2007
no measure of one of the four domains of hospital finance
Kelly JV, Hellinger FJ. Physician and hospital fact ors associated with mortality of surgical patients 29 1986
no measure of one of the four domains of hospital finance
17
Author(s) and article title Year Published Reason for Exclusion
Lagu T, Rothberg MB, Nathanson BH,et al. The relati onship between hospital spending and mortality in patients with se psis 30 2011
no measure of one of the four domains of hospital finance
Langland -Orban B, Gapenski LC, Vogel WB. Differences i n characteristics of hospitals with sustained high an d sustained low profitability 31
1996 no patient or quality outcomes
McDermott C, Stock GN. Hospital operations and leng th of stay performance 32 2007
no measure of one of the four domains of hospital finance
Morey RC, Fine DJ, Loree SW et al. The trade-off be tween hospital cost and quality of care. An exploratory empirical analysis 33 1992 temporality other direction
Schultz MA, van Servellen G, Litwin MS, et al. Can hospital structural and financial characteristics explain variations in mortality caused by acute myocardial infarction? 34
1999 no measure of one of the four domains of hospital finance
Shen YC. The effect of financial pressure on the qu ality of care in hospitals 35 2003
no measure of one of the four domains of hospital finance
Siegrist RB, Jr., Kane NM. Exploring the relationsh ip between inpatient hospital costs and quality of care 36 2003
no measure of one of the four domains of hospital finance
Skelton AG. The relationship among cost, quality, a nd competition: an analysis of obstetrics services in Missouri hospita ls 37 1997
no measure of one of the four domains of hospital finance
Smith RB, Dynan L, Fairbrother G, Chabi G, Simpson L. Medicaid, hospital financial stress, and the incidence of adv erse medical events for children 38
2012 no measure of one of the four domains of hospital finance
Stukel TA, Fisher ES, Alter DA, et al. Association of hospital spending intensity with mortality and readmission rates in O ntario hospitals 39 2012
no measure of one of the four domains of hospital finance
Wodchis WP, Teare GF, Anderson GM. Cost and quality - Evidence from Ontario long term care hospitals 40 2007 temporality other direction
18
Table 3b: Additional articles removed based on full -text and explanation for exclusion
Author(s) and article title Year
Published Reason for Exclusion
Brennan TA, Hebert LE, Laird NM et al. Hospital cha racteristics associated with adverse events and substandard care 41 1991
no measure of one of the four domains of hospital finance
Carrott PW, Markar SR, Kuppusamy MK et al. Accordion severity grading system: assessment of relationship between costs, length of hospital stay, and survival in patients with compli cations after esophagectomy for cancer 42
2012 no measure of one of the four domains of hospital finance
Deily ME, McKay NL. Cost inefficiency and mortality rates in Florida hospitals 43 2006
no measure of one of the four domains of hospital finance
McKay NL, Deily ME. Cost inefficiency and hospital health outcomes 44 2008 no measure of one of the four domains of hospital finance
Keeler EB, Rubenstein LV, Kahn KL et al. Hospital c haracteristics and quality of care 45 1992
no measure of one of the four domains of hospital finance
Shi L. Patient and hospital characteristics associa ted with average length of stay 46 1996
no measure of one of the four domains of hospital finance
Schultz MA, van Servellen G, Chang BL et al. The relationship of hospital structural and financial characteristics t o mortality and length of stay in acute myocardial infarction patients 47
1998 duplicate of other Schultz paper excluded in table 3a
19
Table 4a: Summary of articles included in the quali tative review part I
Author(s)
Time period hospital financial health variable measured
Time period Outcome measured
Measure of hospital financial health
Measure of hospital financial health operationalized
Measure of patient health outcome or quality indicator
Bazzoli et al48 1995-2000 1995-2000
Operating profit margin and ratio of cash flow to total revenues (one-year lag)
Both measures categorized based on quartiles using the 1995 financial data, e.g. 25th percentile for OPM = -5.0 %.
1) Surgical related patient safety events 2) Nursing related patient safety events 3) In-hospital mortality occurring in a low
mortality risk DRG
Encinosa & Bernard49
1995-1999 1996-2000
Operating profit margin (one-year lag)
Categorized based on pre-determined cut-points. Lowest category was ≤-0.5%
1) Surgical related patient safety events 2) Nursing related patient safety events 3) All likely preventable patient safety
events (including the surgical and nursing patient safety events) 4) In-hospital mortality occurring during major surgery
Ly et al50 2006 2007
Total profit margin, operating profit margin (one-year lag)
Categorized based on bottom 10%, 11-50%, 51-89%, and top 10%
1) Summary performance indicator scores for AMI, CHF and pneumonia. These summary indicator scores represent the number of times a hospital performed the appropriate action across all measures for a particular condition divided by the number of opportunities the hospital had to provide appropriate care for that condition 2) Readmission rates defined as readmission within 30-days of discharge for AMI, CHF and pneumonia 3) Mortality rates defined as 30-day mortality from AMI, CHF and pneumonia
20
Table 4b: Summary of articles included in the qual itative review part II
Author(s)
Mechanism of how hospital financial health affects outcome
Criteria for confounder control? Variables adjusted for in analyses
Bazzoli et al48
That hospitals will curtail activities that enhance quality as hospital financial health declines
Variables used in prior patient outcome studies that are non-financial factors that potentially affect patient care
Hospital variables: number of beds, hospital ownership, multi-hospital system, number of high-tech services offered, number of surgical operations provided by the hospital, median age of patients, proportion of male patients, case-mix, payer mix, patient acuity Market variables: county income, hospital beds per 1000 people in the county, percent of hospitals that are for profit in the county and HMO market share
Encinosa & Bernard49
Changes in hospital financial health may lead to changes in staffing, quality control and other areas that affect patient outcomes
Variables that may impact both patient safety and profit margins
Patient variables: age, sex, insurance, transfer admission, median household income of patient’s home zip code, indicators for 30 chronic conditions, major diagnostic category for each patient and indicator for year Hospital variable: included hospital as a fixed effect (i.e. included the hospital ID variable as a covariate in the model)
Ly et al50
Lower hospital margins may conflict with efforts to promote higher quality care
None. However, confounders were chosen a priori
Patient variables: age, sex, race/ethnicity, and the presence or absence of the 29 comorbid conditions in the Elixhauser index. Hospital variables: hospital size, hospital ownership, location, teaching status, presence of a MICU, presence of CCU, percentage of patients with Medicare, region and nurse-census ratio
21
Table 4c: Summary of articles included in the qualitative review part III
Author(s) Measure of hospital finance Outcome Results
Direction of effect is aligned with theory
Bazzoli et al48 Operating profit margin Cash flow to total revenues
Nursing-related safety event Surgical-related safety event In-hospital mortality Nursing-related safety event Surgical-related safety event In-hospital mortality
Effect sizes small, trend present Effect sizes small, no trend present Effect sizes small, trend present Effect sizes small, trend present Effect sizes small, no trend present Effect sizes small, trend present
Yes No Yes Yes No Yes
Encinosa & Bernard49
Operating profit margin
Nursing-related safety event Surgical-related safety event All patient safety events In-hospital mortality
Effect sizes small, trend present Effect sizes small, no trend present Effect sizes small, trend present Effect sizes small, trend present
Yes Yes Yes Yes
Ly et al50 Operating profit margin
Acute MI hospital quality alliance score Congestive heart failure hospital quality alliance score Pneumonia hospital quality alliance score Acute MI 30-day readmission rate Congestive heart failure 30-day readmission rate Pneumonia 30-day readmission rate Acute MI 30-day mortality rate Congestive heart failure 30-day mortality rate Pneumonia 30-day mortality rate
Effect sizes small, trend present Effect sizes small, trend present Effect sizes small, trend present Effect sizes small, trend present Effect sizes small, trend present Effect sizes small, trend present Effect sizes small, no trend present Effect sizes small, no trend present Effect sizes small, no trend present
Yes Yes Yes Yes Yes Yes Yes No Yes
22
CHAPTER 3: ASSESSING THE VALIDITY OF THREE DIFFERENT MEASURES OF HOSPITAL FINANCIAL DISTRESS
Introduction
The overall objective of this dissertation is to assess the current science on the impact that hospital
financial distress has on patient or quality outcomes, as well as to produce an original analysis that contributes to
the existing body of knowledge. The first paper of this dissertation, the systematic review, showed that very few
studies have attempted to assess this relationship. Since this area of inquiry, linking hospital financial distress to
patient outcomes, is still in its infancy, one area of research that needs more attention is the measure of hospital
financial distress used. All three papers to date that linked a measure of hospital finance to patient or quality
outcomes used profit margin as their measure. While profit margin may be an adequate measure of hospital
financial distress, as it was previously validated against hospital closure, it may not be the best indicator of
hospital financial distress. This is because it only taps into one of the four domains of hospital finance.7 The four
domains of hospital finance are profitability, liquidity, solvency and asset efficiency. Profitability captures the
extent to which the hospital revenues are greater than hospital costs, liquidity captures the ability of a hospital to
pay current bills, solvency captures the ability to cover debt and asset efficiency captures the efficiency in which a
hospital uses its assets. Poor financial performance in any of these domains could signal distress and lead to
organizational or process changes to improve financial performance.
An alternative to using profit margin would be to use a composite measure that captures more than one
domain of hospital finance. The two main composite measures of hospital financial distress that are referenced in
the literature are Cleverley’s Financial Strength Index and Altman’s modified z-index. However, neither of these
measures has been adequately validated, nor have they been validated in comparison to profit margin. That is
why the goal of this dissertation paper is to assess the validity of the Financial Strength Index and the modified z-
index and compare their measurement characteristics to those of profit margin.
Existing literature on measures of hospital financi al distress
A 1993 paper published by Wertheim & Lynn assessed the validity of 21 financial ratio measures for
predicting hospital closure.51 They also assessed differences in validity using a one year or a two year lag for
measuring the financial state of the hospital. They concluded that profit margin was the financial ratio measure
23
with the highest overall accuracy for predicting hospital closure and concluded that a one year lag resulted in
higher accuracy than a two year lag.
While profit margin, as an individual ratio, had the highest prediction accuracy of the 21 financial ratios
tested, hospital financial experts agree that no one financial ratio measure is adequate for capturing the financial
situation of a hospital.52-55 However, there has been limited assessment of the validity of composite measures of
hospital financial distress. The Financial Strength Index and the modified z-index, the two prominent composite
measures of hospital financial distress discussed in the literature, have not been adequately validated.8 The
Financial Strength Index has never been validatedi, while the modified z-index has only ever been validated on a
sample of rural hospitals in Pennsylvania.56
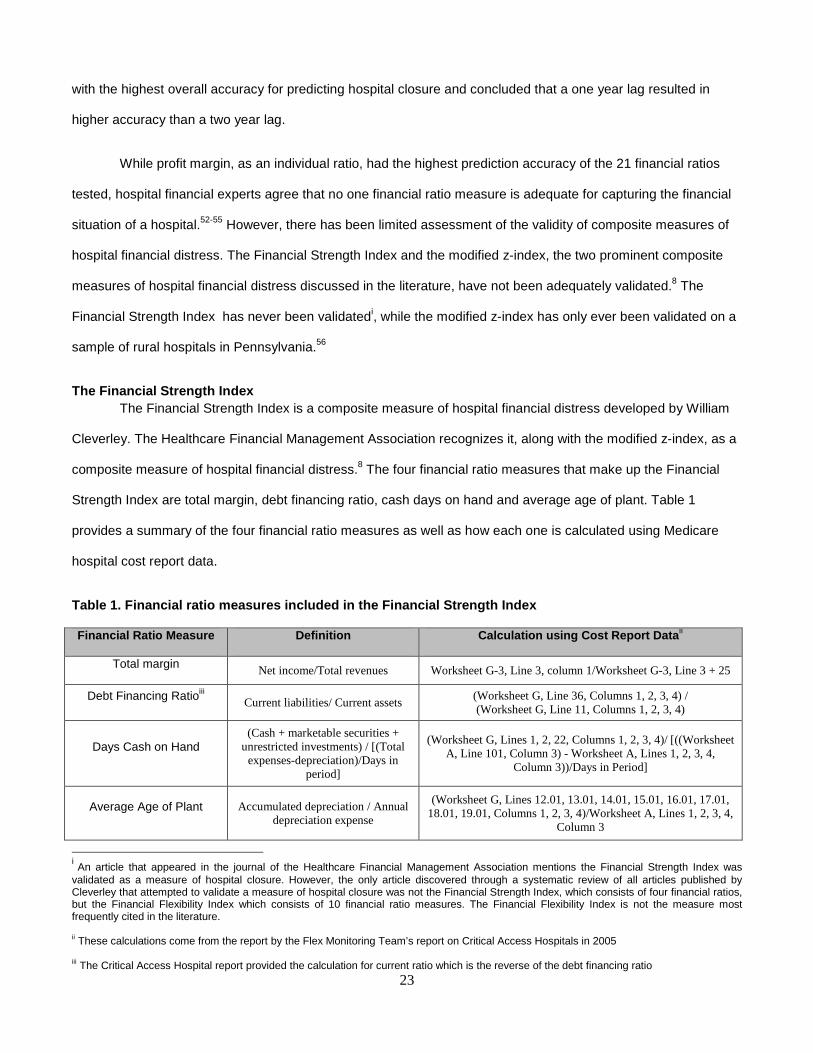
The Financial Strength Index The Financial Strength Index is a composite measure of hospital financial distress developed by William
Cleverley. The Healthcare Financial Management Association recognizes it, along with the modified z-index, as a
composite measure of hospital financial distress.8 The four financial ratio measures that make up the Financial
Strength Index are total margin, debt financing ratio, cash days on hand and average age of plant. Table 1
provides a summary of the four financial ratio measures as well as how each one is calculated using Medicare
hospital cost report data.
Table 1. Financial ratio measures included in the F inancial Strength Index
Financial Ratio Measure Definition Calculation using Cost Report Data ii
Total margin Net income/Total revenues Worksheet G-3, Line 3, column 1/Worksheet G-3, Line 3 + 25
Debt Financing Ratioiii Current liabilities/ Current assets (Worksheet G, Line 36, Columns 1, 2, 3, 4) / (Worksheet G, Line 11, Columns 1, 2, 3, 4)
Days Cash on Hand (Cash + marketable securities +
unrestricted investments) / [(Total expenses-depreciation)/Days in
period]
(Worksheet G, Lines 1, 2, 22, Columns 1, 2, 3, 4)/ [((Worksheet A, Line 101, Column 3) - Worksheet A, Lines 1, 2, 3, 4,
Column 3))/Days in Period]
Average Age of Plant Accumulated depreciation / Annual depreciation expense
(Worksheet G, Lines 12.01, 13.01, 14.01, 15.01, 16.01, 17.01, 18.01, 19.01, Columns 1, 2, 3, 4)/Worksheet A, Lines 1, 2, 3, 4,
Column 3
i An article that appeared in the journal of the Healthcare Financial Management Association mentions the Financial Strength Index was validated as a measure of hospital closure. However, the only article discovered through a systematic review of all articles published by Cleverley that attempted to validate a measure of hospital closure was not the Financial Strength Index, which consists of four financial ratios, but the Financial Flexibility Index which consists of 10 financial ratio measures. The Financial Flexibility Index is not the measure most frequently cited in the literature. ii These calculations come from the report by the Flex Monitoring Team’s report on Critical Access Hospitals in 2005 iii The Critical Access Hospital report provided the calculation for current ratio which is the reverse of the debt financing ratio
24
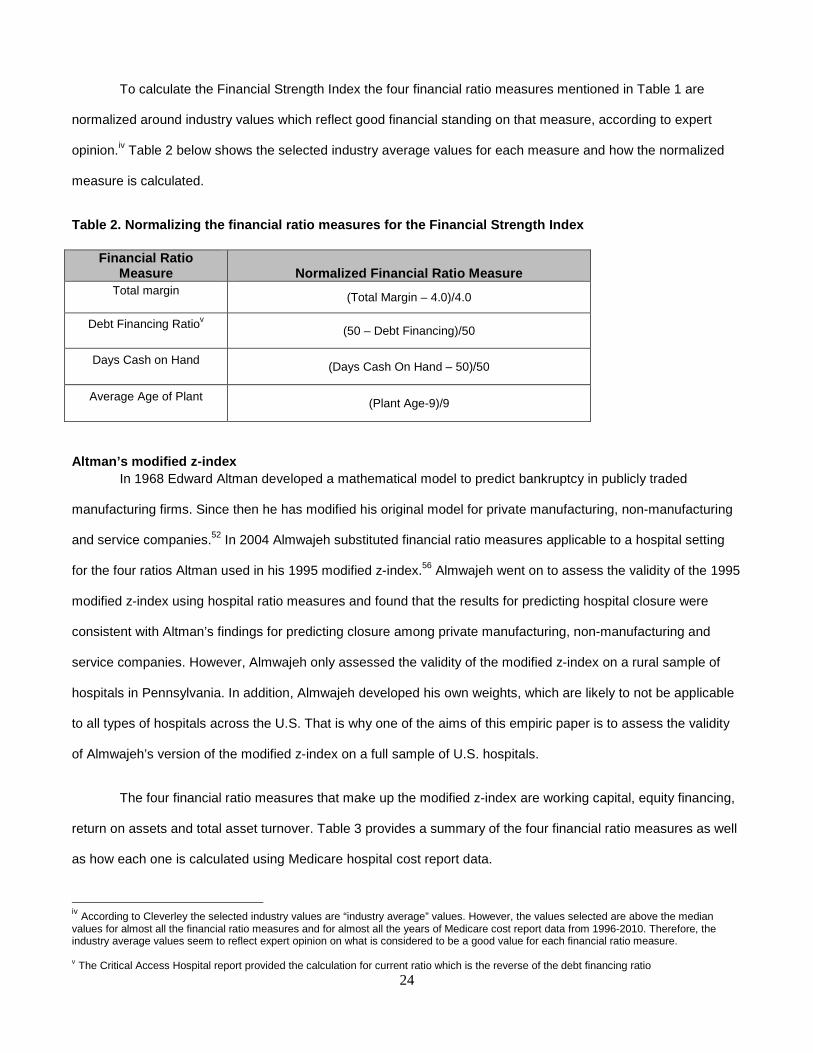
To calculate the Financial Strength Index the four financial ratio measures mentioned in Table 1 are
normalized around industry values which reflect good financial standing on that measure, according to expert
opinion.iv Table 2 below shows the selected industry average values for each measure and how the normalized
measure is calculated.
Table 2. Normalizing the financial ratio measures f or the Financial Strength Index
Indicator Name Definition St. Mary Hos
Altman’s modified z-index In 1968 Edward Altman developed a mathematical model to predict bankruptcy in publicly traded
manufacturing firms. Since then he has modified his original model for private manufacturing, non-manufacturing
and service companies.52 In 2004 Almwajeh substituted financial ratio measures applicable to a hospital setting
for the four ratios Altman used in his 1995 modified z-index.56 Almwajeh went on to assess the validity of the 1995
modified z-index using hospital ratio measures and found that the results for predicting hospital closure were
consistent with Altman’s findings for predicting closure among private manufacturing, non-manufacturing and
service companies. However, Almwajeh only assessed the validity of the modified z-index on a rural sample of
hospitals in Pennsylvania. In addition, Almwajeh developed his own weights, which are likely to not be applicable
to all types of hospitals across the U.S. That is why one of the aims of this empiric paper is to assess the validity
of Almwajeh’s version of the modified z-index on a full sample of U.S. hospitals.
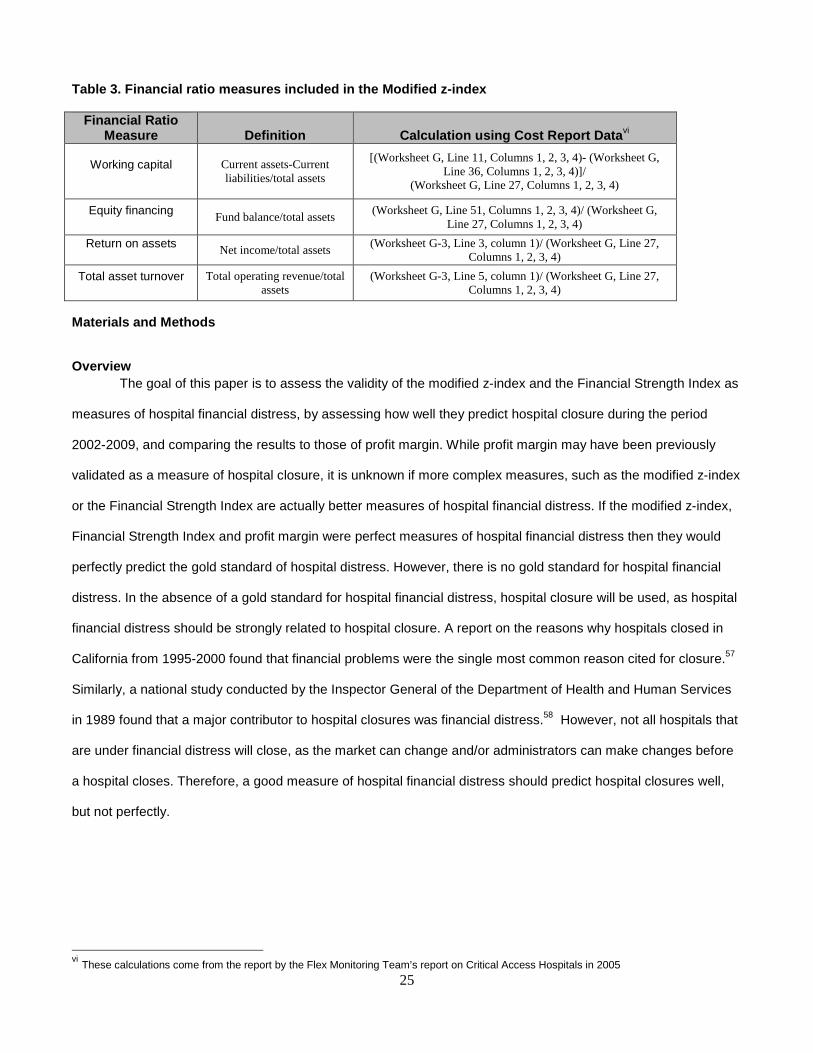
The four financial ratio measures that make up the modified z-index are working capital, equity financing,
return on assets and total asset turnover. Table 3 provides a summary of the four financial ratio measures as well
as how each one is calculated using Medicare hospital cost report data.
iv According to Cleverley the selected industry values are “industry average” values. However, the values selected are above the median values for almost all the financial ratio measures and for almost all the years of Medicare cost report data from 1996-2010. Therefore, the industry average values seem to reflect expert opinion on what is considered to be a good value for each financial ratio measure. v The Critical Access Hospital report provided the calculation for current ratio which is the reverse of the debt financing ratio
Financial Ratio Measure Normalized Financial Ratio Measure
Total margin (Total Margin – 4.0)/4.0
Debt Financing Ratiov (50 – Debt Financing)/50
Days Cash on Hand (Days Cash On Hand – 50)/50
Average Age of Plant (Plant Age-9)/9
25
Table 3. Financial ratio measures included in the M odified z-index
Financial Ratio Measure Definition Calculation using Cost Report Data vi
Working capital Current assets-Current liabilities/total assets
[(Worksheet G, Line 11, Columns 1, 2, 3, 4)- (Worksheet G, Line 36, Columns 1, 2, 3, 4)]/
(Worksheet G, Line 27, Columns 1, 2, 3, 4)
Equity financing Fund balance/total assets (Worksheet G, Line 51, Columns 1, 2, 3, 4)/ (Worksheet G,
Line 27, Columns 1, 2, 3, 4)
Return on assets Net income/total assets (Worksheet G-3, Line 3, column 1)/ (Worksheet G, Line 27,
Columns 1, 2, 3, 4)
Total asset turnover Total operating revenue/total assets
(Worksheet G-3, Line 5, column 1)/ (Worksheet G, Line 27, Columns 1, 2, 3, 4)
Materials and Methods
Overview The goal of this paper is to assess the validity of the modified z-index and the Financial Strength Index as
measures of hospital financial distress, by assessing how well they predict hospital closure during the period
2002-2009, and comparing the results to those of profit margin. While profit margin may have been previously
validated as a measure of hospital closure, it is unknown if more complex measures, such as the modified z-index
or the Financial Strength Index are actually better measures of hospital financial distress. If the modified z-index,
Financial Strength Index and profit margin were perfect measures of hospital financial distress then they would
perfectly predict the gold standard of hospital distress. However, there is no gold standard for hospital financial
distress. In the absence of a gold standard for hospital financial distress, hospital closure will be used, as hospital
financial distress should be strongly related to hospital closure. A report on the reasons why hospitals closed in
California from 1995-2000 found that financial problems were the single most common reason cited for closure.57
Similarly, a national study conducted by the Inspector General of the Department of Health and Human Services
in 1989 found that a major contributor to hospital closures was financial distress.58 However, not all hospitals that
are under financial distress will close, as the market can change and/or administrators can make changes before
a hospital closes. Therefore, a good measure of hospital financial distress should predict hospital closures well,
but not perfectly.
vi These calculations come from the report by the Flex Monitoring Team’s report on Critical Access Hospitals in 2005
26
Data sources Data on all U.S. acute care hospitals that permanently closed from 2002-2009 was provided by the
American Hospital Association. The provided hospital name and address in this data source was used to merge
this data source to the hospital financial data.
Data necessary to calculate the measures of hospital financial distress comes from Medicare cost reports.
All Medicare-certified hospitals are required to report financial statements annually. These reports are made
publically available online by the Center for Medicare and Medicaid services (CMS) through the Healthcare Cost
Report Information System (HCRIS). Hospital cost report data from 1996-2009 was downloaded and imported
into SAS. Hospitals with more than one cost report per fiscal year were flagged for further inspection. If a hospital
had a duplicate report that was recorded as being settled with audit, reopened or amended then that cost report
was dropped. If a hospital had duplicate reports, and they covered non-overlapping time frames, then the cost
reports were combined. Otherwise, if a hospital had duplicate reports, with overlapping time frames, the cost
report with the fewest number of days was deleted. After duplicate records were removed, the financial ratio
measures were calculated and compared to published values in order to evaluate the accuracy of calculated
values (see Appendix 3A for more details). The median values calculated from the HCRIS data were very close to
previously published median values using the same data.
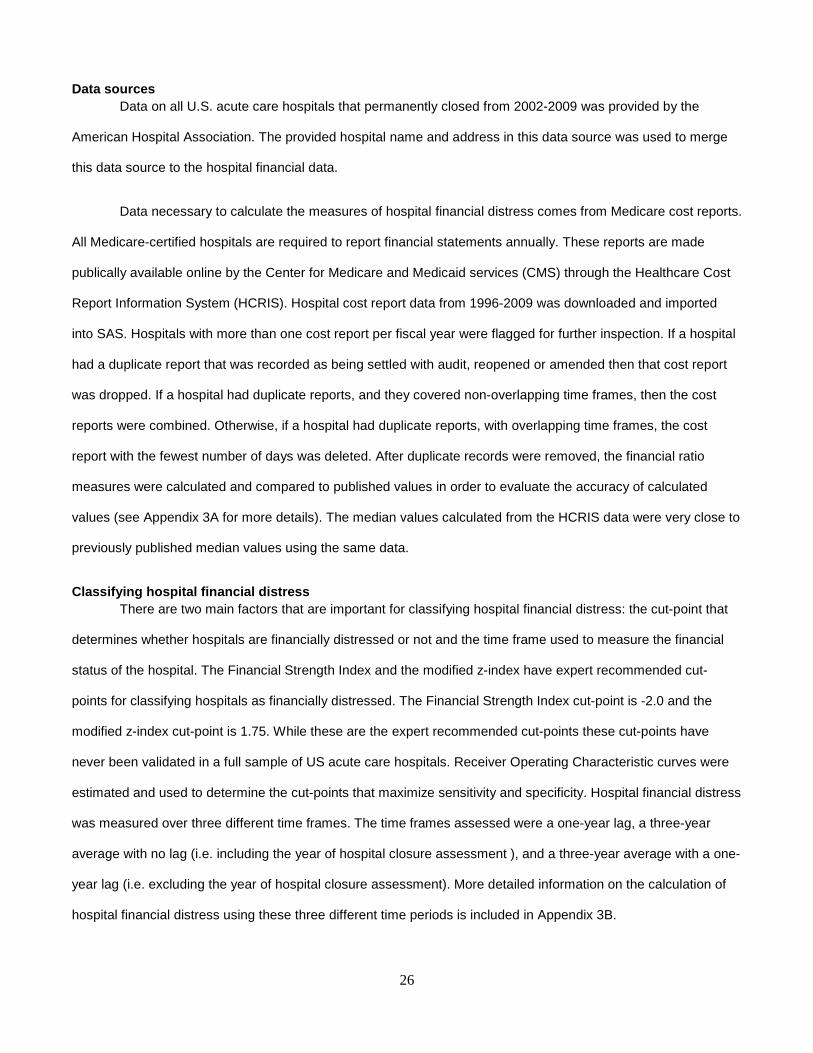
Classifying hospital financial distress There are two main factors that are important for classifying hospital financial distress: the cut-point that
determines whether hospitals are financially distressed or not and the time frame used to measure the financial
status of the hospital. The Financial Strength Index and the modified z-index have expert recommended cut-
points for classifying hospitals as financially distressed. The Financial Strength Index cut-point is -2.0 and the
modified z-index cut-point is 1.75. While these are the expert recommended cut-points these cut-points have
never been validated in a full sample of US acute care hospitals. Receiver Operating Characteristic curves were
estimated and used to determine the cut-points that maximize sensitivity and specificity. Hospital financial distress
was measured over three different time frames. The time frames assessed were a one-year lag, a three-year
average with no lag (i.e. including the year of hospital closure assessment ), and a three-year average with a one-
year lag (i.e. excluding the year of hospital closure assessment). More detailed information on the calculation of
hospital financial distress using these three different time periods is included in Appendix 3B.
27
Statistical analysis The relationship between profit margin, Financial Strength Index, the modified z-index and hospital
closures were assessed using a random sample of hospitals from 2002-2009. The full sample was split into two
random samples, an estimation sample and a validation sample. The optimal cut-point for each measure of
hospital financial distress was estimated using one sample and then the selected cut-points were validated using
the other sample.
The optimal cut-point for each measure was selected by finding Youdan’s index on each generated ROC
curve. Youdan’s index is the point on the Receiver Operating Characteristic (ROC) curve where sensitivity plus
specificity is at its maximum.59 ROC curves were generated for all three times frames for each of the three
financial measures using the estimation sample.
Once the optimal cut-point was identified for each time frame for each measure the positive predictive
value (PPV), negative predictive value (NPV), sensitivity, specificity, accuracy, Youdan’s index (sensitivity +
specificity), summary score (sensitivity + specificity + accuracy) and the risk ratio were calculated for each cut-
point. These measures were calculated in both the estimation and validation samples.
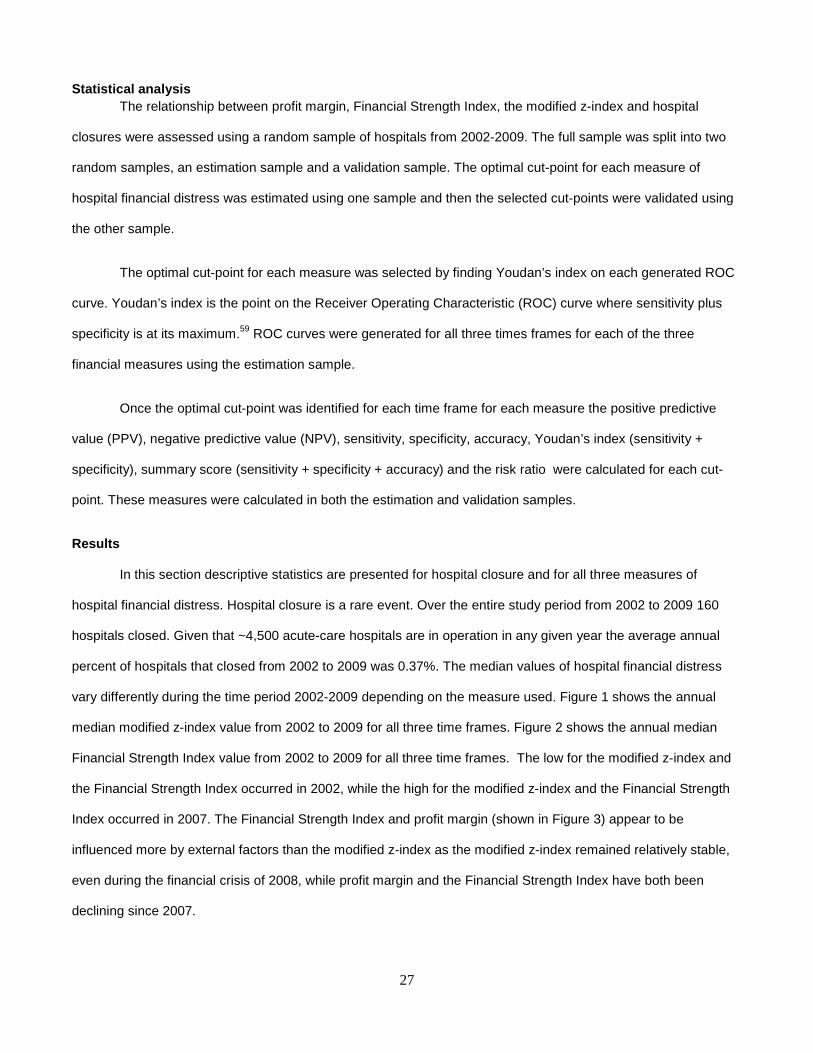
Results
In this section descriptive statistics are presented for hospital closure and for all three measures of
hospital financial distress. Hospital closure is a rare event. Over the entire study period from 2002 to 2009 160
hospitals closed. Given that ~4,500 acute-care hospitals are in operation in any given year the average annual
percent of hospitals that closed from 2002 to 2009 was 0.37%. The median values of hospital financial distress
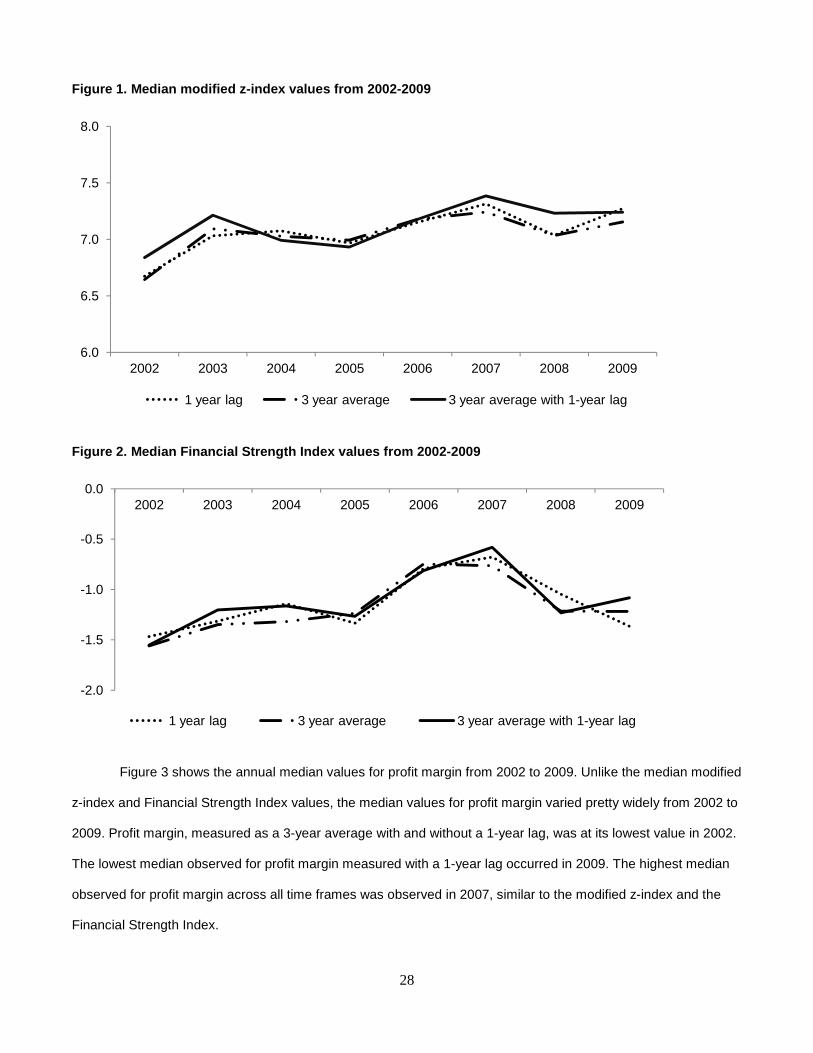
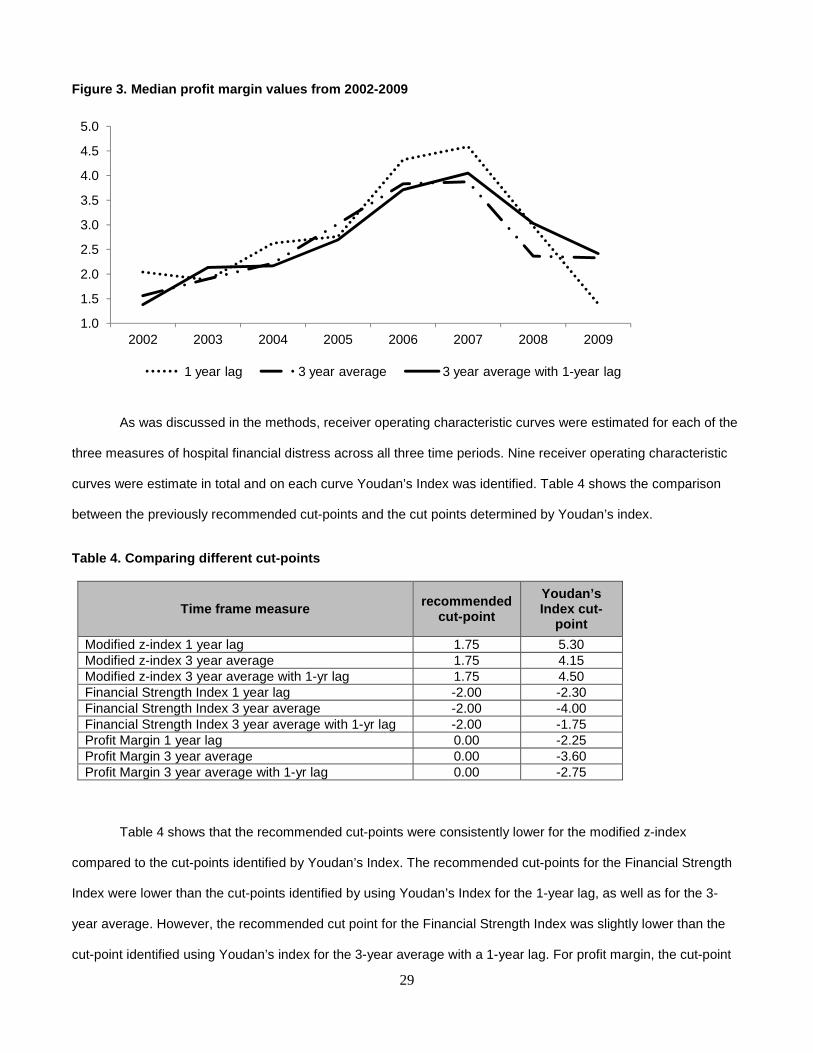
vary differently during the time period 2002-2009 depending on the measure used. Figure 1 shows the annual
median modified z-index value from 2002 to 2009 for all three time frames. Figure 2 shows the annual median
Financial Strength Index value from 2002 to 2009 for all three time frames. The low for the modified z-index and
the Financial Strength Index occurred in 2002, while the high for the modified z-index and the Financial Strength
Index occurred in 2007. The Financial Strength Index and profit margin (shown in Figure 3) appear to be
influenced more by external factors than the modified z-index as the modified z-index remained relatively stable,
even during the financial crisis of 2008, while profit margin and the Financial Strength Index have both been
declining since 2007.
28
Figure 1. Median modified z-index values from 2002- 2009
Figure 2. Median Financial Strength Index values fr om 2002-2009
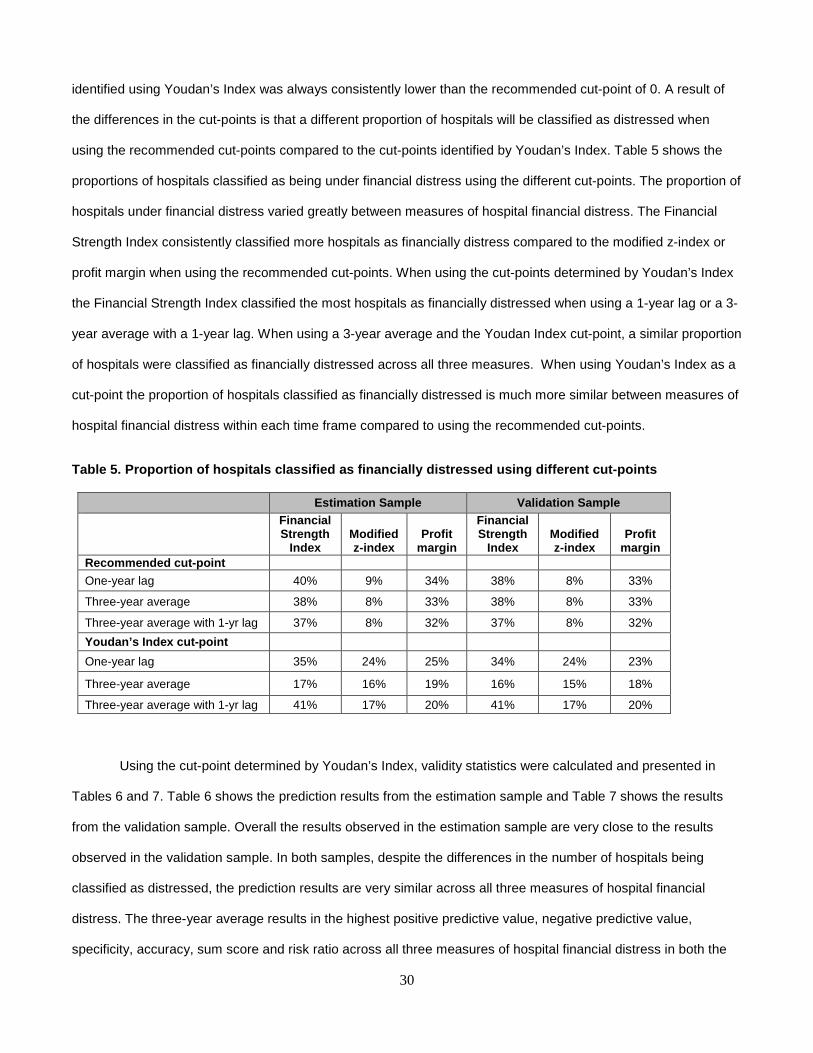
Figure 3 shows the annual median values for profit margin from 2002 to 2009. Unlike the median modified
z-index and Financial Strength Index values, the median values for profit margin varied pretty widely from 2002 to
2009. Profit margin, measured as a 3-year average with and without a 1-year lag, was at its lowest value in 2002.
The lowest median observed for profit margin measured with a 1-year lag occurred in 2009. The highest median
observed for profit margin across all time frames was observed in 2007, similar to the modified z-index and the
Financial Strength Index.
6.0
6.5
7.0
7.5
8.0
2002 2003 2004 2005 2006 2007 2008 2009
1 year lag 3 year average 3 year average with 1-year lag
-2.0
-1.5
-1.0
-0.5
0.02002 2003 2004 2005 2006 2007 2008 2009
1 year lag 3 year average 3 year average with 1-year lag
29
Figure 3. Median profit margin values from 2002-200 9
As was discussed in the methods, receiver operating characteristic curves were estimated for each of the
three measures of hospital financial distress across all three time periods. Nine receiver operating characteristic
curves were estimate in total and on each curve Youdan’s Index was identified. Table 4 shows the comparison
between the previously recommended cut-points and the cut points determined by Youdan’s index.
Table 4. Comparing different cut-points
Time frame measure recommended cut-point
Youdan’s Index cut-
point
Modified z-index 1 year lag 1.75 5.30 Modified z-index 3 year average 1.75 4.15 Modified z-index 3 year average with 1-yr lag 1.75 4.50 Financial Strength Index 1 year lag -2.00 -2.30 Financial Strength Index 3 year average -2.00 -4.00 Financial Strength Index 3 year average with 1-yr lag -2.00 -1.75 Profit Margin 1 year lag 0.00 -2.25 Profit Margin 3 year average 0.00 -3.60 Profit Margin 3 year average with 1-yr lag 0.00 -2.75
Table 4 shows that the recommended cut-points were consistently lower for the modified z-index
compared to the cut-points identified by Youdan’s Index. The recommended cut-points for the Financial Strength
Index were lower than the cut-points identified by using Youdan’s Index for the 1-year lag, as well as for the 3-
year average. However, the recommended cut point for the Financial Strength Index was slightly lower than the
cut-point identified using Youdan’s index for the 3-year average with a 1-year lag. For profit margin, the cut-point
1.0
1.5
2.0
2.5
3.0
3.5
4.0
4.5
5.0
2002 2003 2004 2005 2006 2007 2008 2009
1 year lag 3 year average 3 year average with 1-year lag
30
identified using Youdan’s Index was always consistently lower than the recommended cut-point of 0. A result of
the differences in the cut-points is that a different proportion of hospitals will be classified as distressed when
using the recommended cut-points compared to the cut-points identified by Youdan’s Index. Table 5 shows the
proportions of hospitals classified as being under financial distress using the different cut-points. The proportion of
hospitals under financial distress varied greatly between measures of hospital financial distress. The Financial
Strength Index consistently classified more hospitals as financially distress compared to the modified z-index or
profit margin when using the recommended cut-points. When using the cut-points determined by Youdan’s Index
the Financial Strength Index classified the most hospitals as financially distressed when using a 1-year lag or a 3-
year average with a 1-year lag. When using a 3-year average and the Youdan Index cut-point, a similar proportion
of hospitals were classified as financially distressed across all three measures. When using Youdan’s Index as a
cut-point the proportion of hospitals classified as financially distressed is much more similar between measures of
hospital financial distress within each time frame compared to using the recommended cut-points.
Table 5. Proportion of hospitals classified as fina ncially distressed using different cut-points
Estimation Sample Validation Sample Financial Strength
Index Modified z-index
Profit margin
Financial Strength
Index Modified z-index
Profit margin
Recommended cut-point
One-year lag 40% 9% 34% 38% 8% 33%
Three-year average 38% 8% 33% 38% 8% 33%
Three-year average with 1-yr lag 37% 8% 32% 37% 8% 32%
Youdan’s Index cut-point
One-year lag 35% 24% 25% 34% 24% 23%
Three-year average 17% 16% 19% 16% 15% 18%
Three-year average with 1-yr lag 41% 17% 20% 41% 17% 20%
Using the cut-point determined by Youdan’s Index, validity statistics were calculated and presented in
Tables 6 and 7. Table 6 shows the prediction results from the estimation sample and Table 7 shows the results
from the validation sample. Overall the results observed in the estimation sample are very close to the results
observed in the validation sample. In both samples, despite the differences in the number of hospitals being
classified as distressed, the prediction results are very similar across all three measures of hospital financial
distress. The three-year average results in the highest positive predictive value, negative predictive value,
specificity, accuracy, sum score and risk ratio across all three measures of hospital financial distress in both the
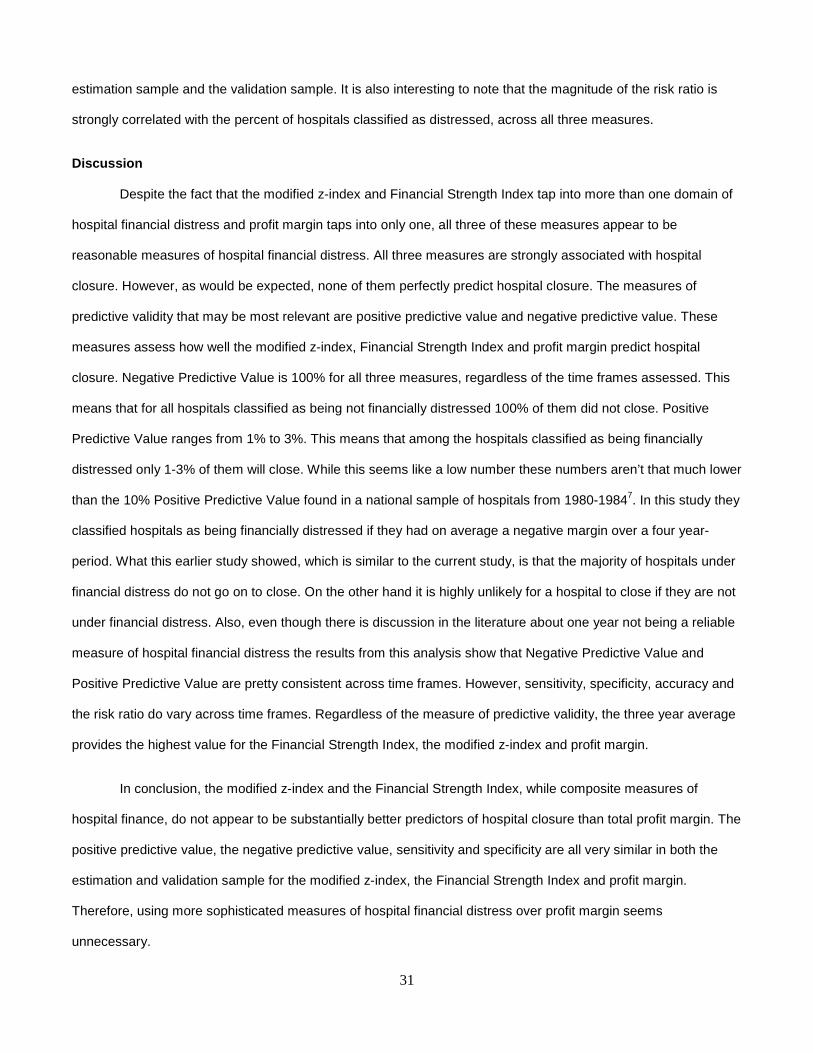
31
estimation sample and the validation sample. It is also interesting to note that the magnitude of the risk ratio is
strongly correlated with the percent of hospitals classified as distressed, across all three measures.
Discussion
Despite the fact that the modified z-index and Financial Strength Index tap into more than one domain of
hospital financial distress and profit margin taps into only one, all three of these measures appear to be
reasonable measures of hospital financial distress. All three measures are strongly associated with hospital
closure. However, as would be expected, none of them perfectly predict hospital closure. The measures of
predictive validity that may be most relevant are positive predictive value and negative predictive value. These
measures assess how well the modified z-index, Financial Strength Index and profit margin predict hospital
closure. Negative Predictive Value is 100% for all three measures, regardless of the time frames assessed. This
means that for all hospitals classified as being not financially distressed 100% of them did not close. Positive
Predictive Value ranges from 1% to 3%. This means that among the hospitals classified as being financially
distressed only 1-3% of them will close. While this seems like a low number these numbers aren’t that much lower
than the 10% Positive Predictive Value found in a national sample of hospitals from 1980-19847. In this study they
classified hospitals as being financially distressed if they had on average a negative margin over a four year-
period. What this earlier study showed, which is similar to the current study, is that the majority of hospitals under
financial distress do not go on to close. On the other hand it is highly unlikely for a hospital to close if they are not
under financial distress. Also, even though there is discussion in the literature about one year not being a reliable
measure of hospital financial distress the results from this analysis show that Negative Predictive Value and
Positive Predictive Value are pretty consistent across time frames. However, sensitivity, specificity, accuracy and
the risk ratio do vary across time frames. Regardless of the measure of predictive validity, the three year average
provides the highest value for the Financial Strength Index, the modified z-index and profit margin.
In conclusion, the modified z-index and the Financial Strength Index, while composite measures of
hospital finance, do not appear to be substantially better predictors of hospital closure than total profit margin. The
positive predictive value, the negative predictive value, sensitivity and specificity are all very similar in both the
estimation and validation sample for the modified z-index, the Financial Strength Index and profit margin.
Therefore, using more sophisticated measures of hospital financial distress over profit margin seems
unnecessary.
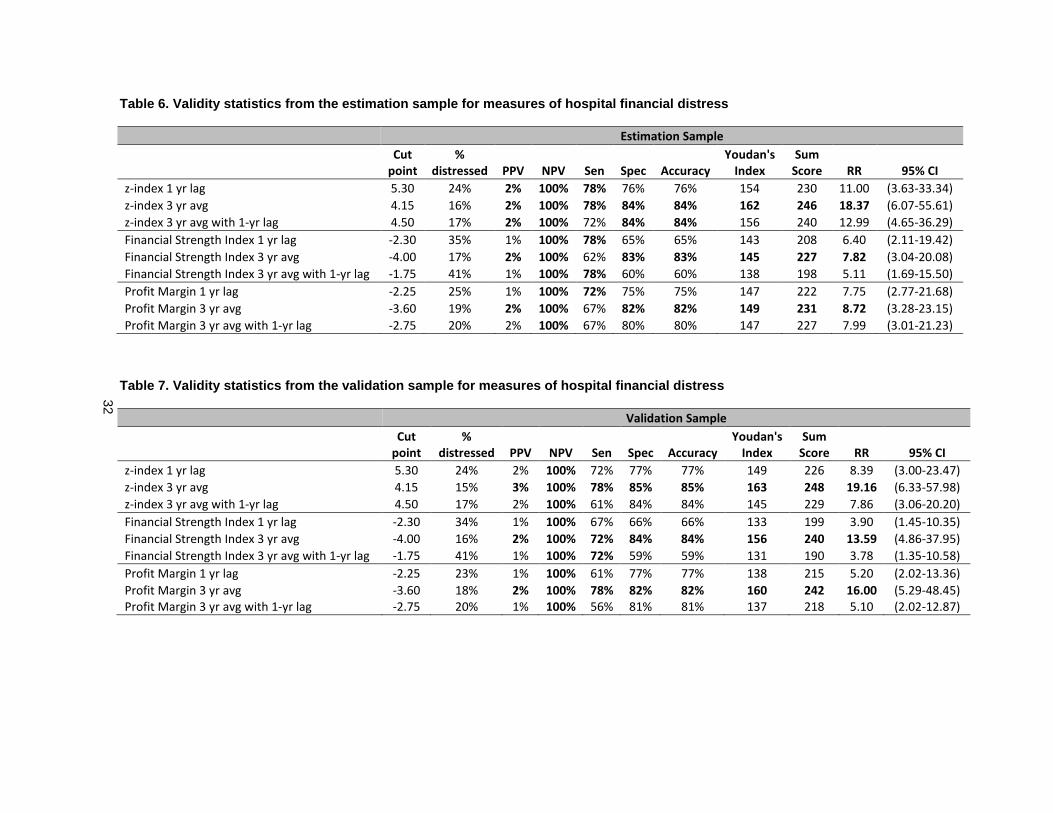
32
Table 6. Validity statistics from the estimation sa mple for measures of hospital financial distress
Estimation Sample
Cut
point
%
distressed PPV NPV Sen Spec Accuracy
Youdan's
Index
Sum
Score RR 95% CI
z-index 1 yr lag 5.30 24% 2% 100% 78% 76% 76% 154 230 11.00 (3.63-33.34)
z-index 3 yr avg 4.15 16% 2% 100% 78% 84% 84% 162 246 18.37 (6.07-55.61)
z-index 3 yr avg with 1-yr lag 4.50 17% 2% 100% 72% 84% 84% 156 240 12.99 (4.65-36.29)
Financial Strength Index 1 yr lag -2.30 35% 1% 100% 78% 65% 65% 143 208 6.40 (2.11-19.42)
Financial Strength Index 3 yr avg -4.00 17% 2% 100% 62% 83% 83% 145 227 7.82 (3.04-20.08)
Financial Strength Index 3 yr avg with 1-yr lag -1.75 41% 1% 100% 78% 60% 60% 138 198 5.11 (1.69-15.50)
Profit Margin 1 yr lag -2.25 25% 1% 100% 72% 75% 75% 147 222 7.75 (2.77-21.68)
Profit Margin 3 yr avg -3.60 19% 2% 100% 67% 82% 82% 149 231 8.72 (3.28-23.15)
Profit Margin 3 yr avg with 1-yr lag -2.75 20% 2% 100% 67% 80% 80% 147 227 7.99 (3.01-21.23)
Table 7. Validity statistics from the validation sa mple for measures of hospital financial distress
Validation Sample
Cut
point
%
distressed PPV NPV Sen Spec Accuracy
Youdan's
Index
Sum
Score RR 95% CI
z-index 1 yr lag 5.30 24% 2% 100% 72% 77% 77% 149 226 8.39 (3.00-23.47)
z-index 3 yr avg 4.15 15% 3% 100% 78% 85% 85% 163 248 19.16 (6.33-57.98)
z-index 3 yr avg with 1-yr lag 4.50 17% 2% 100% 61% 84% 84% 145 229 7.86 (3.06-20.20)
Financial Strength Index 1 yr lag -2.30 34% 1% 100% 67% 66% 66% 133 199 3.90 (1.45-10.35)
Financial Strength Index 3 yr avg -4.00 16% 2% 100% 72% 84% 84% 156 240 13.59 (4.86-37.95)
Financial Strength Index 3 yr avg with 1-yr lag -1.75 41% 1% 100% 72% 59% 59% 131 190 3.78 (1.35-10.58)
Profit Margin 1 yr lag -2.25 23% 1% 100% 61% 77% 77% 138 215 5.20 (2.02-13.36)
Profit Margin 3 yr avg -3.60 18% 2% 100% 78% 82% 82% 160 242 16.00 (5.29-48.45)
Profit Margin 3 yr avg with 1-yr lag -2.75 20% 1% 100% 56% 81% 81% 137 218 5.10 (2.02-12.87)
33
CHAPTER 4: THE EFFECT OF HOSPITAL FINANCIAL DISTRESS ON IMMEDIATE BREAST RECONSTRUCTIVE SURGERY FOLLOWING MASTECTOMY
INTRODUCTION
The delivery of medical treatment should be determined by clinical factors and should be based
on scientific evidence. If more than one equally acceptable treatment option exists then the treatment
delivered should be determined by patient preference. Any factor that determines patient care that is not
clinically relevant or not based on patient preference is an unwarranted determinant of medical care. Most
of the research into the unwarranted determinants of medical care has evaluated individual factors such
as race or physician factors such as physician-specific practice patterns.60-63 While physicians play an
important role in the delivery and quality of medical care patients receive they function in a much larger
system that has largely been ignored as a potential source of unwarranted determinants of medical care.
Hospitals represent an important component of the healthcare system. Yet there has been little research
on the effect that hospitals have on the delivery of medical care. In particular, as was shown in chapter
two of this dissertation, only three papers to date have ever assessed the relationship between hospital
finance and quality or patient outcomes.48-50
Economic theory suggests that the quality and quantity of medical services a hospital produces is
related to budget constraints.4 Therefore, hospitals most likely to make decisions that alter the delivery
and quality of care patients receive are those under financial distress. When a hospital is experiencing
financial distress this may affect the quantity of medical services by reducing the services a hospital
offers, particularly unprofitable ones, or by encouraging physicians to make decisions based on cost,
such as prioritizing operations that bring in the most revenue.
If hospital financial distress is a determinant of unwarranted medical care, then the treatments
and/or services that should be most affected are those that do not change life expectancy, those that
have a less expensive clinically acceptable alternative and/or those services that are unprofitable.
Immediate breast reconstruction following mastectomy is an example of a type of procedure that fits all of
the previously mentioned conditions. Hospitals can bring in more revenue by prioritizing and performing
34
other surgical procedures such as cardiothoracic surgery, transplant surgery and neurologic surgery,
among others, over breast reconstructive surgery.64
Methods
Data Sources The data for this paper come from multiple administrative data sources and from publically
available information on the Internet about cancer centers. Administrative data will come from the
following sources: The Nationwide Inpatient Sample, the Healthcare Cost Report Information System and
the US Census bureau. Information on cancer center designations comes from websites maintained by
the National Comprehensive Cancer Network and the National Cancer Institute.
Nationwide Inpatient Sample
The Nationwide Inpatient Sample is part of the Healthcare Cost and Utilization Project, sponsored
by the Agency for Healthcare Research and Quality. The Nationwide Inpatient Sample approximates a
20% stratified probability sample and is representative of community hospitals in the United States.
Annually, it captures ~2,000 inpatient hospital stays for women undergoing mastectomy to treat ductal
carcinoma in-situ. Information collected on patients includes basic demographic information and the first
15 procedure and diagnostic codes for each inpatient stay, classified according to the International
Classification of Diseases, Ninth Edition, Clinical Modification (ICD-9-CM). Each hospital in the
Nationwide Inpatient Sample is given a unique identification variable which allows for the calculation of
summary statistics based on the discharged patient population from each hospital. In addition, the county,
zip code and address are provided for hospitals as well as teaching status of the hospital and other
hospital-level characteristics.
American community survey (ACS)
The American Community Survey is an ongoing survey conducted by the U.S. Bureau of the
Census that provides 1-year, 3-year and 5-year estimates on socioeconomic characteristics of counties,
which can be linked to the county identifier provided in the Nationwide Inpatient Sample.
35
Healthcare cost report information system (HCRIS)
The Healthcare Cost Report Information System is a healthcare cost resource information
database compiled by the Center for Medicare and Medicaid Services. The database provides
information on hospital cost reports on a quarterly basis. Information from the Healthcare Cost Report
Information System will be extracted to generate measures of hospital financial distress covering four
domains of a hospital’s financial conditions: profitability, liquidity, solvency and asset efficiency. This
database also provides the address and name of each hospital. This information will be used to geo-code
each hospital so that it can be linked to the hospitals in the Nationwide Inpatient Sample. The Nationwide
Inpatient Sample provides the addresses which allows for the geo-coding of each hospital.
National cancer institute (NCI) cancer centers
There are 41 comprehensive cancer centers designated by the National Cancer Institute, some of
which are also National Comprehensive Cancer Network institutions. The 41 comprehensive cancer
centers are considered by NCI to provide excellent cancer care and treatment and the names and
addresses of all 41 comprehensive cancer centers are provided on the internet and will be manually
extracted and linked to hospitals in the Nationwide Inpatient Sample by the address and name of the
institution.
National comprehensive cancer network (NCCN)
The National Comprehensive Cancer Network is made up of 21 institutions located throughout
the United States that have been designated as leaders in cancer treatment and care. The names and
addresses of these 21 institutions are made publically available on the internet and will be manually
extracted and linked to hospitals in the Nationwide Inpatient Sample.
Sample selection The sample of women included in this study come from a cohort of women identified in the Nationwide
Inpatient Sample aged 18 years and older treated with mastectomy for the treatment of ductal carcinoma
in-situ from 2004-2008 that were treated at a hospital in a state that discloses information on hospital
location. Table 1 shows the diagnosis and procedure codes used to select the sample of women. The
types of mastectomy included are subcutaneous (85.33-85.36), simple (85.41-85.44), and radical (85.45-
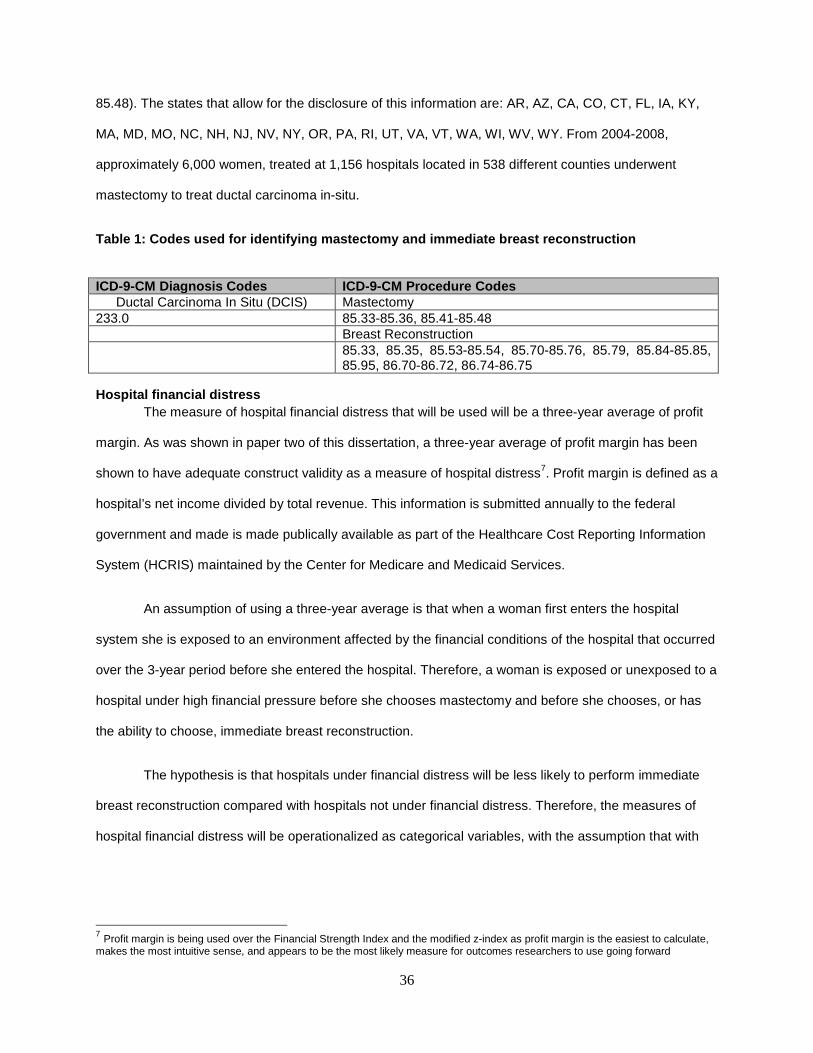
36
85.48). The states that allow for the disclosure of this information are: AR, AZ, CA, CO, CT, FL, IA, KY,
MA, MD, MO, NC, NH, NJ, NV, NY, OR, PA, RI, UT, VA, VT, WA, WI, WV, WY. From 2004-2008,
approximately 6,000 women, treated at 1,156 hospitals located in 538 different counties underwent
mastectomy to treat ductal carcinoma in-situ.
Table 1: Codes used for identifying mastectomy and immediate breast reconstruction
Hospital financial distress The measure of hospital financial distress that will be used will be a three-year average of profit
margin. As was shown in paper two of this dissertation, a three-year average of profit margin has been
shown to have adequate construct validity as a measure of hospital distress7. Profit margin is defined as a
hospital’s net income divided by total revenue. This information is submitted annually to the federal
government and made is made publically available as part of the Healthcare Cost Reporting Information
System (HCRIS) maintained by the Center for Medicare and Medicaid Services.
An assumption of using a three-year average is that when a woman first enters the hospital
system she is exposed to an environment affected by the financial conditions of the hospital that occurred
over the 3-year period before she entered the hospital. Therefore, a woman is exposed or unexposed to a
hospital under high financial pressure before she chooses mastectomy and before she chooses, or has
the ability to choose, immediate breast reconstruction.
The hypothesis is that hospitals under financial distress will be less likely to perform immediate
breast reconstruction compared with hospitals not under financial distress. Therefore, the measures of
hospital financial distress will be operationalized as categorical variables, with the assumption that with
7 Profit margin is being used over the Financial Strength Index and the modified z-index as profit margin is the easiest to calculate, makes the most intuitive sense, and appears to be the most likely measure for outcomes researchers to use going forward
ICD-9-CM Diagnosis Codes ICD-9-CM Procedure Codes Ductal Carcinoma In Situ (DCIS) Mastectomy
233.0 85.33-85.36, 85.41-85.48 Breast Reconstruction 85.33, 85.35, 85.53-85.54, 85.70-85.76, 85.79, 85.84-85.85,
85.95, 86.70-86.72, 86.74-86.75
37
increasing levels of financial distress there will be a decreasing odds of a woman receiving immediate
breast reconstruction. The categories of profit margin will be defined based on quartiles8.
Ductal carcinoma in-situ Ductal carcinoma in-situ makes up approximately 24% of newly diagnosed breast cancer cases65
and the incidence of ductal carcinoma in-situ has been increasing since the 1970’s.66 The sample in this
study is limited to women with ductal carcinoma in-situ because the factors that influence the decision
making process is very different for women with ductal carcinoma in-situ compared with invasive cancer.
Women with ductal carcinoma in-situ have higher survival rates than those with invasive cancer, thus
more women with ductal carcinoma in-situ may be focused on life after mastectomy compared with
women with invasive cancer.67 Also, women with invasive cancer may be under more psychological
pressure to undergo surgery more quickly and therefore forego further consultations with a plastic
surgeon. In addition, there is a controversy in the literature about the appropriate timing of reconstruction
when radiation therapy is given. Radiation post-mastectomy is only recommended for women with stage
III breast cancer so this does not factor into the decision making process for women with ductal
carcinoma in-situ.68 Given these differences in the decision making process the sample of women was
limited to women with ductal carcinoma in-situ.
Immediate breast reconstruction The outcome in this study is the presence or absence of immediate breast reconstruction
following mastectomy. The term “immediate” refers to women undergoing an additional reconstructive
procedure during the same operation as the mastectomy. Immediate reconstruction can be performed in
a one- or two-stage process. One-stage reconstruction is when the entire reconstruction is completed
during the operation immediately following the mastectomy. A two-stage reconstruction is when an
expander is placed immediately following the mastectomy, followed by a reconstruction a few weeks later.
This two stage process is often called an immediate-delayed reconstruction. Immediate-delayed
reconstruction is advantageous in hospital settings where plastic surgeons are not on site. In these
situations an expander can be placed at the time of mastectomy and the patient can later have the
reconstruction at the office of a plastic surgeon.
8 For a more detailed discussion on why quartiles were chosen please see Appendix C
38
Given the multiple procedures that could occur following a mastectomy, if a woman has an ICD-9
code indicating the insertion of a tissue expander or implant, or an ICD-9 code indicating a natural
reconstruction was performed, then the woman will be classified as having had an immediate breast
reconstruction post-mastectomy. This classification of immediate reconstruction captures both the
immediate and immediate-delayed.
Potential confounders For this study, the definition of a confounder is any variable whose adjustment mitigates
confounding. A Directed Acyclic Graph (DAG) will be used to determine the minimally sufficient set of
variables that need to be adjusted to eliminate confounding (shown in Figure 1 below). The literature was
explored to determine the potential causes of hospital financial distress and the potential causes of breast
reconstruction. If after this process there were variables for which evidence supported that it was a cause
of both hospital financial distress and breast reconstruction it was added to the DAG. If there was only
evidence that supported a variable causing hospital financial distress or breast reconstruction but it
seemed plausible based on common knowledge that there could be a relationship in the other direction
these variables were also added to the DAG. The reason for this was to caution on the side of including
too many confounders instead of too few for determining the minimally sufficient set of variables needed
to remove confounding.
Individual-level confounders The individual-level factors that have consistently been shown to predict breast reconstruction are
age, race, stage of cancer at diagnosis and insurance status.60,69-71 Obesity, smoking, hypertension and
diabetes have been shown to be associated with complications from breast reconstruction following
mastectomy72,73, though the findings on diabetes have been inconsistent74, and may impact a woman’s
decision to undergo immediate breast reconstruction. Educational attainment, an individual-level measure
of socioeconomic status (SES), was not a significant predictor of breast reconstruction.60 However, the
study was under powered, and since educational attainment predicts many health outcomes it will still be
included in the DAG as it is likely a predictor of breast reconstruction.
Individual-level factors that are also likely to influence the type of hospital where a woman seeks
treatment for breast cancer are race, stage of disease, insurance status and measures of SES such as
39
education. Women with advanced cancer may be referred to a cancer center for treatment or may seek
out a hospital which she believes will provide the best care. Highly educated women or women with the
economic means to choose which hospital they receive their treatment for breast cancer are likely to
choose a cancer center, an academic medical center/teaching hospital or a private versus public hospital.
Women of low SES and racial minorities based on where they live and/or their economic situation may be
limited in their choice of hospitals and may only have the option of going to the closest hospital. If a
woman is poor or a racial minority it is likely they live in a low SES county and therefore seek treatment at
a hospital also located in a low SES county.
When a woman is diagnosed with breast cancer her two surgical options are breast conserving
surgery and mastectomy. If the tumor is small and the stage is not advanced than either breast
conserving surgery or mastectomy can be performed. In this situation breast conserving surgery is
considered to be the standard of care as it is considered to leave the woman with a better cosmetic result
than mastectomy. In the situation where the tumor is large and/or the cancer is advanced than
mastectomy is the only option. If a woman has the choice of having breast conserving surgery or
mastectomy and she is concerned about the aesthetics of her breasts it is assumed she will choose
breast conserving surgery over mastectomy. However, with the advancement of skin-sparing and nipple-
sparing mastectomy, breast conserving surgery may not always lead to a better cosmetic result over
mastectomy. In the Nationwide Inpatient Sample data the full population of women undergoing breast
conserving surgery or mastectomy is not available. Only inpatient stays are captured in the Nationwide
Inpatient Sample and breast conserving surgery is predominantly done as an outpatient procedure.
Therefore, in the Nationwide Inpatient Sample the population of women is already limited to women who
undergo mastectomy for the treatment of breast cancer. Based on the DAG shown in Figure 1, the
exclusion of women who undergo breast conserving surgery should not induce selection bias and
therefore is not an issue.
Hospital-level confounders Previous research on the impact that hospital-level factors may have on immediate breast
reconstruction has been limited, though a few important hospital characteristics have been identified.
Women treated at a hospital designated as cancer centers are significantly more likely to receive
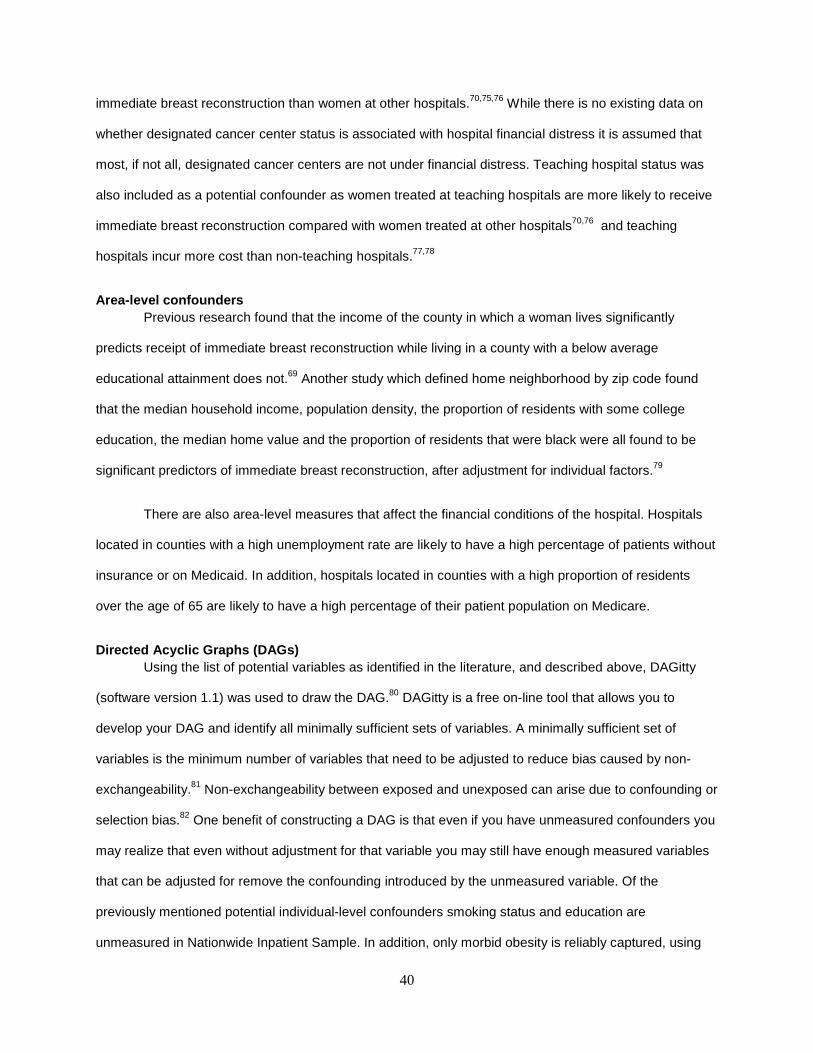
40
immediate breast reconstruction than women at other hospitals.70,75,76 While there is no existing data on
whether designated cancer center status is associated with hospital financial distress it is assumed that
most, if not all, designated cancer centers are not under financial distress. Teaching hospital status was
also included as a potential confounder as women treated at teaching hospitals are more likely to receive
immediate breast reconstruction compared with women treated at other hospitals70,76 and teaching
hospitals incur more cost than non-teaching hospitals.77,78
Area-level confounders Previous research found that the income of the county in which a woman lives significantly
predicts receipt of immediate breast reconstruction while living in a county with a below average
educational attainment does not.69 Another study which defined home neighborhood by zip code found
that the median household income, population density, the proportion of residents with some college
education, the median home value and the proportion of residents that were black were all found to be
significant predictors of immediate breast reconstruction, after adjustment for individual factors.79
There are also area-level measures that affect the financial conditions of the hospital. Hospitals
located in counties with a high unemployment rate are likely to have a high percentage of patients without
insurance or on Medicaid. In addition, hospitals located in counties with a high proportion of residents
over the age of 65 are likely to have a high percentage of their patient population on Medicare.
Directed Acyclic Graphs (DAGs) Using the list of potential variables as identified in the literature, and described above, DAGitty
(software version 1.1) was used to draw the DAG.80 DAGitty is a free on-line tool that allows you to
develop your DAG and identify all minimally sufficient sets of variables. A minimally sufficient set of
variables is the minimum number of variables that need to be adjusted to reduce bias caused by non-
exchangeability.81 Non-exchangeability between exposed and unexposed can arise due to confounding or
selection bias.82 One benefit of constructing a DAG is that even if you have unmeasured confounders you
may realize that even without adjustment for that variable you may still have enough measured variables
that can be adjusted for remove the confounding introduced by the unmeasured variable. Of the
previously mentioned potential individual-level confounders smoking status and education are
unmeasured in Nationwide Inpatient Sample. In addition, only morbid obesity is reliably captured, using
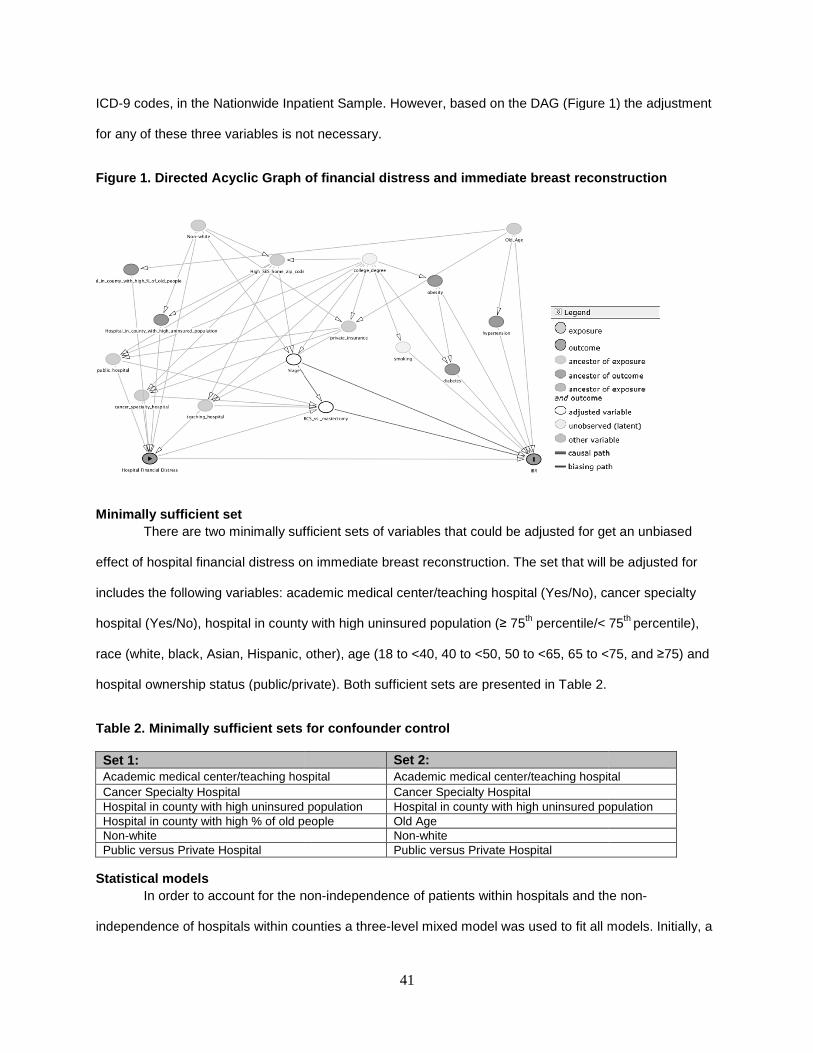
ICD-9 codes, in the Nationwide Inpatient Sample. However, based on the DAG (Figure 1) the adjustment
for any of these three variables is not necessary.
Figure 1. Directed Acyclic Graph of financial distr ess and immediate breast reconstruction
Minimally sufficient set There are two minimally sufficient sets of variables that could be adjusted for get an unbiased
effect of hospital financial distress on immediate breast reconstruction. The set that will be adjusted for
includes the following variables: academic medical center/teaching
hospital (Yes/No), hospital in county with high uninsured population (
race (white, black, Asian, Hispanic, other), age
hospital ownership status (public/private). Both sufficient sets are presented in Table 2.
Table 2. Minimally sufficient sets for confounder c ontrol
Set 1: Academic medical center/teaching hospitalCancer Specialty Hospital Hospital in county with high uninsured populationHospital in county with high % of old peopleNon-white Public versus Private Hospital
Statistical models In order to account for the non
independence of hospitals within counties a three
41
Inpatient Sample. However, based on the DAG (Figure 1) the adjustment
for any of these three variables is not necessary.
Figure 1. Directed Acyclic Graph of financial distr ess and immediate breast reconstruction
inimally sufficient sets of variables that could be adjusted for get an unbiased
effect of hospital financial distress on immediate breast reconstruction. The set that will be adjusted for
includes the following variables: academic medical center/teaching hospital (Yes/No), cancer specialty
hospital (Yes/No), hospital in county with high uninsured population (≥ 75th percentile/< 75
race (white, black, Asian, Hispanic, other), age (18 to <40, 40 to <50, 50 to <65, 65 to <75, and
tal ownership status (public/private). Both sufficient sets are presented in Table 2.
Table 2. Minimally sufficient sets for confounder c ontrol
Set 2: Academic medical center/teaching hospital Academic medical center/teaching hospital
Cancer Specialty Hospital Hospital in county with high uninsured population Hospital in county with high uninsured populationHospital in county with high % of old people Old Age
Non-white Public versus Private Hospital
to account for the non-independence of patients within hospitals and the non
independence of hospitals within counties a three-level mixed model was used to fit all models. Initially, a
Inpatient Sample. However, based on the DAG (Figure 1) the adjustment
Figure 1. Directed Acyclic Graph of financial distr ess and immediate breast reconstruction
inimally sufficient sets of variables that could be adjusted for get an unbiased
effect of hospital financial distress on immediate breast reconstruction. The set that will be adjusted for
hospital (Yes/No), cancer specialty
percentile/< 75th percentile),
18 to <40, 40 to <50, 50 to <65, 65 to <75, and ≥75) and
Academic medical center/teaching hospital
Hospital in county with high uninsured population
independence of patients within hospitals and the non-
level mixed model was used to fit all models. Initially, a
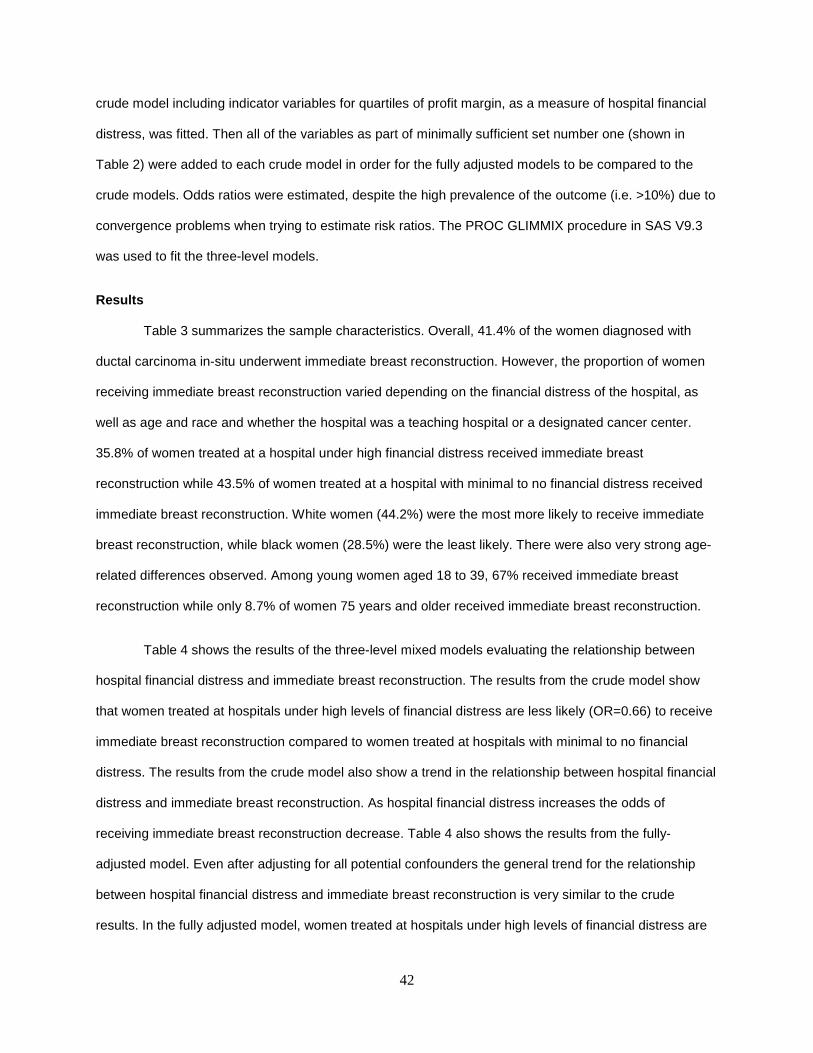
42
crude model including indicator variables for quartiles of profit margin, as a measure of hospital financial
distress, was fitted. Then all of the variables as part of minimally sufficient set number one (shown in
Table 2) were added to each crude model in order for the fully adjusted models to be compared to the
crude models. Odds ratios were estimated, despite the high prevalence of the outcome (i.e. >10%) due to
convergence problems when trying to estimate risk ratios. The PROC GLIMMIX procedure in SAS V9.3
was used to fit the three-level models.
Results
Table 3 summarizes the sample characteristics. Overall, 41.4% of the women diagnosed with
ductal carcinoma in-situ underwent immediate breast reconstruction. However, the proportion of women
receiving immediate breast reconstruction varied depending on the financial distress of the hospital, as
well as age and race and whether the hospital was a teaching hospital or a designated cancer center.
35.8% of women treated at a hospital under high financial distress received immediate breast
reconstruction while 43.5% of women treated at a hospital with minimal to no financial distress received
immediate breast reconstruction. White women (44.2%) were the most more likely to receive immediate
breast reconstruction, while black women (28.5%) were the least likely. There were also very strong age-
related differences observed. Among young women aged 18 to 39, 67% received immediate breast
reconstruction while only 8.7% of women 75 years and older received immediate breast reconstruction.
Table 4 shows the results of the three-level mixed models evaluating the relationship between
hospital financial distress and immediate breast reconstruction. The results from the crude model show
that women treated at hospitals under high levels of financial distress are less likely (OR=0.66) to receive
immediate breast reconstruction compared to women treated at hospitals with minimal to no financial
distress. The results from the crude model also show a trend in the relationship between hospital financial
distress and immediate breast reconstruction. As hospital financial distress increases the odds of
receiving immediate breast reconstruction decrease. Table 4 also shows the results from the fully-
adjusted model. Even after adjusting for all potential confounders the general trend for the relationship
between hospital financial distress and immediate breast reconstruction is very similar to the crude
results. In the fully adjusted model, women treated at hospitals under high levels of financial distress are
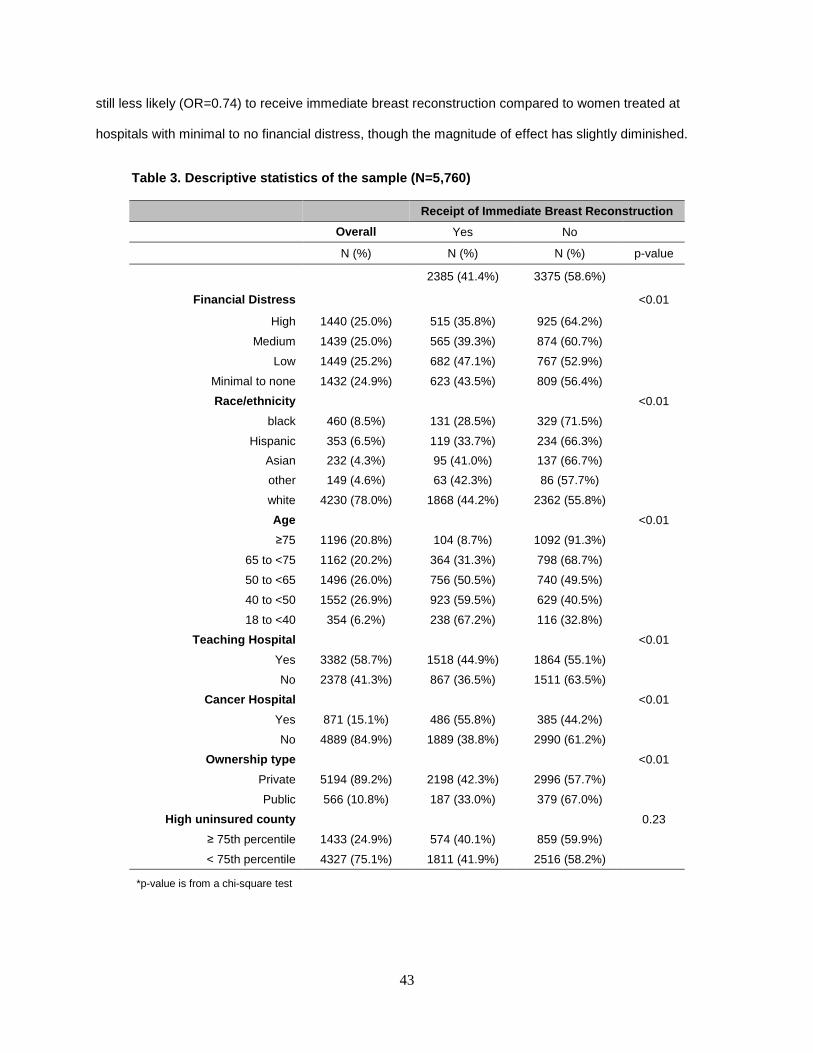
43
still less likely (OR=0.74) to receive immediate breast reconstruction compared to women treated at
hospitals with minimal to no financial distress, though the magnitude of effect has slightly diminished.
Table 3. Descriptive statistics of the sample (N=5, 760)
Receipt of Immediate Breast Reconstruction
Overall Yes No
N (%) N (%) N (%) p-value
2385 (41.4%) 3375 (58.6%)
Financial Distress <0.01
High 1440 (25.0%) 515 (35.8%) 925 (64.2%) Medium 1439 (25.0%) 565 (39.3%) 874 (60.7%)
Low 1449 (25.2%) 682 (47.1%) 767 (52.9%) Minimal to none 1432 (24.9%) 623 (43.5%) 809 (56.4%) Race/ethnicity <0.01
black 460 (8.5%) 131 (28.5%) 329 (71.5%) Hispanic 353 (6.5%) 119 (33.7%) 234 (66.3%)
Asian 232 (4.3%) 95 (41.0%) 137 (66.7%) other 149 (4.6%) 63 (42.3%) 86 (57.7%) white 4230 (78.0%) 1868 (44.2%) 2362 (55.8%) Age <0.01
≥75 1196 (20.8%) 104 (8.7%) 1092 (91.3%) 65 to <75 1162 (20.2%) 364 (31.3%) 798 (68.7%) 50 to <65 1496 (26.0%) 756 (50.5%) 740 (49.5%) 40 to <50 1552 (26.9%) 923 (59.5%) 629 (40.5%) 18 to <40 354 (6.2%) 238 (67.2%) 116 (32.8%)
Teaching Hospital <0.01
Yes 3382 (58.7%) 1518 (44.9%) 1864 (55.1%) No 2378 (41.3%) 867 (36.5%) 1511 (63.5%)
Cancer Hospital <0.01
Yes 871 (15.1%) 486 (55.8%) 385 (44.2%) No 4889 (84.9%) 1889 (38.8%) 2990 (61.2%)
Ownership type <0.01
Private 5194 (89.2%) 2198 (42.3%) 2996 (57.7%) Public 566 (10.8%) 187 (33.0%) 379 (67.0%)
High uninsured county 0.23
≥ 75th percentile 1433 (24.9%) 574 (40.1%) 859 (59.9%) < 75th percentile 4327 (75.1%) 1811 (41.9%) 2516 (58.2%)
*p-value is from a chi-square test
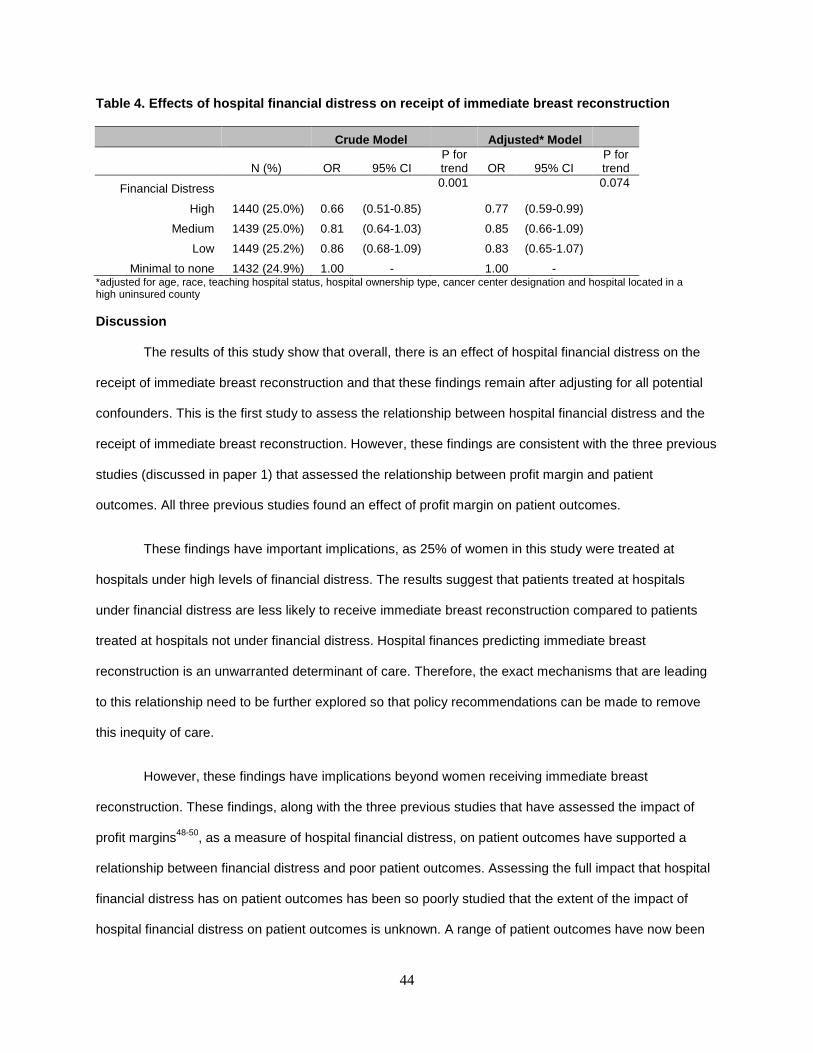
44
Table 4. Effects of hospital financial distress on receipt of immediate breast reconstruction
Crude Model Adjusted* Model
N (%) OR 95% CI P for trend OR 95% CI
P for trend
Financial Distress 0.001 0.074
High 1440 (25.0%) 0.66 (0.51-0.85) 0.77 (0.59-0.99)
Medium 1439 (25.0%) 0.81 (0.64-1.03) 0.85 (0.66-1.09)
Low 1449 (25.2%) 0.86 (0.68-1.09) 0.83 (0.65-1.07)
Minimal to none 1432 (24.9%) 1.00 - 1.00 -
*adjusted for age, race, teaching hospital status, hospital ownership type, cancer center designation and hospital located in a high uninsured county
Discussion
The results of this study show that overall, there is an effect of hospital financial distress on the
receipt of immediate breast reconstruction and that these findings remain after adjusting for all potential
confounders. This is the first study to assess the relationship between hospital financial distress and the
receipt of immediate breast reconstruction. However, these findings are consistent with the three previous
studies (discussed in paper 1) that assessed the relationship between profit margin and patient
outcomes. All three previous studies found an effect of profit margin on patient outcomes.
These findings have important implications, as 25% of women in this study were treated at
hospitals under high levels of financial distress. The results suggest that patients treated at hospitals
under financial distress are less likely to receive immediate breast reconstruction compared to patients
treated at hospitals not under financial distress. Hospital finances predicting immediate breast
reconstruction is an unwarranted determinant of care. Therefore, the exact mechanisms that are leading
to this relationship need to be further explored so that policy recommendations can be made to remove
this inequity of care.
However, these findings have implications beyond women receiving immediate breast
reconstruction. These findings, along with the three previous studies that have assessed the impact of
profit margins48-50, as a measure of hospital financial distress, on patient outcomes have supported a
relationship between financial distress and poor patient outcomes. Assessing the full impact that hospital
financial distress has on patient outcomes has been so poorly studied that the extent of the impact of
hospital financial distress on patient outcomes is unknown. A range of patient outcomes have now been
45
linked to financial distress: breast reconstruction, patient safety events, guideline adherence for acute
myocardial infraction, pneumonia and congestive heart failure, readmission rates and in-hospital
mortality. The current study adds additional evidence that there is a link between hospital financial
conditions and patient outcomes. What this study adds that was previously unknown is that this study
supports a link between hospital financial conditions and breast reconstruction, an elective, non-life
threatening and unprofitable procedure. Previous research focused on patient outcomes that influenced
on potentially life-saving procedures and not just quality of life enhancing procedures. A next important
step in this area of inquiry is to continue to evaluate a wide range of inpatient and outpatient procedures
in order to fully evaluate the procedures that are impacted by hospital financial distress. If hospital
financial distress impacts a wide range of patient outcomes then a lot of patients are at risk. Depending
on how one classifies hospital financial distress, anywhere from 7-30% of hospitals in a given year are
under high levels of financial distress. Therefore, the potential magnitude of this problem is substantial.
A limitation of this study is that there is no measure of a woman’s preference for breast
reconstruction. As a proxy for preference, age, race and hospital factors were included in the model.
Older women are less likely to opt for breast reconstruction if given the choice83, and while some argue
that there may be racial/ethnic differences in preferences as well84, more evidence suggest racial
differences are due to differences in treatment85. Therefore, race is included in the model as it likely
influences the type of hospital where a woman seeks treatment and as a result is influencing her
preference, or really her ability, to choose breast reconstruction. Hospital factors, such as a cancer center
designation, are meant to capture women that sought out specific types of hospitals because of a strong
preference for breast reconstruction. While all of these factors may be good proxies for a women’s
preference it is likely that they do not perfectly correlate with a woman’s preference. However, this bias is
likely to be non-differential and therefore will lead to an underestimate.
In the end, what this study shows is that hospital financial distress is an unwarranted determinant
of immediate breast reconstruction adding to the small body of literature that has assessed the impact of
hospital financial distress on patient outcomes. If current trends continue then 25-30% of hospitals will be
under high levels of financial distress in any given year, with even more hospitals under medium to low

46
levels of financial distress. Fully understanding the implications of the problem is essential, as well as
evaluating the specific mechanisms by which financial distress leads to worse outcomes. Hospitals facing
financial distress may be inevitable, and if that is true, then in an era of patient-informed decision making,
hospital financial conditions should also be part of the package patients use to evaluate where they seek
treatment.
47
CHAPTER 5: CONCLUSIONS
Aims
The three aims of this dissertation were to 1) systematically review the existing literature on
hospital financial distress and quality outcomes and/or patient outcomes, 2) validate three measures of
hospital financial distress and 3) evaluate the impact of hospital financial distress on immediate breast
reconstruction.
Summary of results
In the second chapter of this dissertation, three studies were identified from a systematic review
of the literature that linked hospital financial distress to patient outcomes. The limited identification of
literature on this topic highlights an important gap in the current literature and the need for more research
on the topic. The three papers identified generally supported a relationship between patient safety events,
adherence to guideline based care, readmission rates and in-hospital mortality. However, what was
unknown from the systematic literature review was whether or not profit margin was the appropriate
measure to use over composite measures such as Altman’s modified z-index or Cleverely’s Financial
Strength Index.
Chapter 3 of this dissertation assessed the validity of profit margin for predicting hospital closure,
and compared the results to using the modified z-index and the financial strength index as measures of
financial distress. The results from this analysis showed that profit margin performed as well as the
modified z-index and the Financial Strength Index for predicting hospital closure. Given the more intuitive
nature of profit margin and its accessibility to all levels of health outcomes researchers, profit margin
appears to be the best measure of hospital financial distress compared to the modified z-index and the
Financial Strength Index.
Chapter 4 evaluated the relationship between financial distress, using profit margin as the
measure, and the receipt of immediate breast reconstruction. The results from this analysis supported a
relationship. Women treated at hospitals under high levels of financial distress were less likely to receive
immediate breast reconstruction compared to women treated at hospitals with minimal to no financial
48
distress. However, the magnitude of the effect is small. Women treated at hospitals under financial
distress are 1.5 times less likely to receive immediate breast reconstruction than women treated at
hospitals not under financial distress. The evidence also suggests that there may be an impact on receipt
of immediate breast reconstruction for women treated at hospitals with any amount of financial distress,
though the magnitude of effect decreases with decreasing financial distress.
Overall, the results from this dissertation show the need for increased research on the topic of
hospital financial distress and patient outcomes, the utility of using profit margin as a measure of financial
distress and the importance of hospital financial distress on receipt of immediate breast reconstruction.
However, there are important limitations. First, while profit margin performs as well the modified z-index
and the Financial Strength Index in predicting hospital closure, it still has a very poor negative predictive
value. This is the result of hospital closure being a rare event. Accurately predicting a rare event is
difficult. This non-differential misclassification likely resulted in an underestimate of the association
between financial distress and immediate breast reconstruction. This type of misclassification will also
lead to an underestimate in future studies that use profit margin as a measure of hospital financial
distress.
Another limitation of this work is that there may have been inadequate confounder control in the
analysis of financial distress and immediate breast reconstruction. The assumption of the analysis is that
the DAG (Figure 1 in chapter 4) is correctly specified. If there were a direct link between educational
status and hospital financial pressure then the current minimally sufficient set would not be adequate to
remove all confounding. If this were the case, since the overall main effect is below 1.0 and the
relationship between educational status and hospital financial pressure is likely to be negative, while the
relationship between educational status and receipt of immediate breast reconstruction is likely to be
positive, this would lead to an overestimation of the effect of hospital financial pressure and immediate
breast reconstruction. However, it seems unlikely that a direct relationship between educational status
and hospital financial pressure exists. The financial status of a hospital is never known to a patient when
she is selecting a hospital. Instead, factors such as the type of hospital (public vs. private) or the hospital
being a designated cancer center are the factors that may stand out to an educated woman looking to
49
seek treatment for breast cancer. These factors were included in the DAG and therefore selection factors
related to a woman choosing the type of hospital where she seeks treatment should be properly adjusted
for in the analysis.
Lastly, while the results from this dissertation highlight an important gap in the existing literature
and provide further evidence that hospital financial distress may play an important role in a wide range of
patient outcomes, breast reconstruction is a unique outcome and it is unknown if the findings found here
with respect to breast reconstruction can be generalized to other patient outcomes.
Implications
Despite the above mentioned limitations, the findings from this dissertation have several
important implications. First, women treated at hospitals under high levels of financial distress are less
likely to receive immediate breast reconstruction. Financial factors determining treatment is an
unwarranted determinant of care and a determinant outside of a woman’s control. Therefore, to address
the impact of hospital financial pressure on receipt of immediate breast reconstruction legislative action
may be required. Precedence has already been established for the enactment of health policies related to
breast reconstruction. In 1998, the Women’s Health and Cancer Rights Act (WHCRA) was passed in
order to ensure personal finances did not impede women from receiving breast reconstruction86 and in
2010, a New York state law was passed mandating breast surgeons discuss reconstructive options with
their patients.87 Both of these laws were aimed at reducing unwarranted determinants of breast
reconstruction and an enhancement of these existing policies to ensure hospital finances are eliminated
as a determinant of care would be one potential approach to eliminate this inequity of breast cancer care.
Moving beyond breast reconstruction, the results of this dissertation have important implications
for a wide range of patient outcomes. The systematic review highlighted the limited literature supporting a
relationship between hospital financial distress and patient safety, guideline based adherence to
treatment protocols, readmission rates and in-hospital mortality. The original analyses discussed in
chapter 4 provide further evidence of a relationship between hospital financial distress and patient
outcomes. If there is a relationship between hospital financial distress and patient outcomes, which the
research to date suggests, this means that patients treated at the 18-25% of hospitals under high levels

50
of financial distress are at risk. Due to the large potential public health impact, further research is needed
to fully understand the extent to which hospitals under high levels of financial distress negatively impact
patient outcomes.
51
REFERENCES
1. Mayes R, Berenson RA. Medicare prospective payment and the shaping of U.S. health care. Baltimore: Johns Hopkins University Press; 2006. 2. Ansell DA, Schiff RL. Patient dumping. JAMA: The Journal of the American Medical Association 1987;257:1500-2. 3. Rosenbaum S, Cartwright-Smith L, Hirsh J, Mehler PS. Case Studies At Denver Health: 'Patient Dumping' In The Emergency Department Despite EMTALA, The Law That Banned It. Health Aff (Millwood) 2012;31:1749-56. 4. Chen HF, Bazzoli GJ, Hsieh HM. Hospital Financial Conditions and the Provision of Unprofitable Services. Atl Econ J 2009;37:259-77. 5. Scott WR, Flood AB. Costs and quality of hospital care: a review of the literature. Medical care review 1984;41:213-61. 6. Fleming ST. The relationship between the cost and quality of hospital care: a review of the literature. Medical care review 1990;47:487-502. 7. Bazzoli G, Andes S. Consequences of hospital financial distress. Hospital & health services administration 1995;40:472-95. 8. Price C, Cameron A, Price D. Distress detectors: measures for predicting financial trouble in hospitals. Healthcare financial management: journal of the Healthcare Financial Management Association 2005;59:74. 9. Health care spending and the Medicare program: a data book. 2012. Medicare Payment Advisory Commission (US). 10. Malin JL, Schneider EC, Epstein AM, Adams J, Emanuel EJ, Kahn KL. Results of the National Initiative for Cancer Care Quality: how can we improve the quality of cancer care in the United States? J Clin Oncol 2006;24:626-34. 11. Chen F, Puig M, Yermilov I, et al. Using breast cancer quality indicators in a vulnerable population. Cancer 2011;117:3311-21. 12. Rowland JH, Holland JC, Chaglassian T, Kinne D. Psychological response to breast reconstruction. Expectations for and impact on postmastectomy functioning. Psychosomatics 1993;34:241-50. 13. Al-Ghazal S, Fallowfield L, Blamey R. Comparison of psychological aspects and patient satisfaction following breast conserving surgery, simple mastectomy and breast reconstruction. European Journal of Cancer 2000;36:1938-43. 14. Al-Ghazal SK, Sully L, Fallowfield L, Blamey RW. The psychological impact of immediate rather than delayed breast reconstruction. Eur J Surg Oncol 2000;26:17-9. 15. Dean C, Chetty U, Forrest AP. Effects of immediate breast reconstruction on psychosocial morbidity after mastectomy. Lancet 1983;1:459-62. 16. Wynn B, Coughlin T, Bondarenko S, Bruen B. Evaluating Current Distribution of DSH Using General Measures of Financial Pressure and Vulnerability RAND Project Memorandum: Analysis of the Joint Distribution of Disproportionate Share Hospital Payments 2002.
52
17. Hospital compare: Hospital value-based puchasing. The Center for Medicare and Medicaid Services. . (Accessed 2014, February 26, at http://www.medicare.gov/hospitalcompare/data/hospital-vbp.html.) 18. Liberati A, Altman DG, Tetzlaff J, et al. The PRISMA statement for reporting systematic reviews and meta-analyses of studies that evaluate health care interventions: explanation and elaboration. Annals of internal medicine 2009;151:W65-94. 19. Beauvais B, Wells R, Vasey J, DelliFraine JL. Does money really matter? The effects of fiscal margin on quality of care in military treatment facilities. Hospital topics 2007;85:2-15. 20. Bradbury RC, Golec JH, Steen PM. Relating hospital health outcomes and resource expenditures. Inquiry : a journal of medical care organization, provision and financing 1994;31:56-65. 21. Burstin HR, Lipsitz SR, Udvarhelyi IS, Brennan TA. The effect of hospital financial characteristics on quality of care. JAMA : the journal of the American Medical Association 1993;270:845-9. 22. Cleverley WO, Harvey RK. Is there a link between hospital profit and quality? Healthcare financial management : journal of the Healthcare Financial Management Association 1992;46:40, 2, 4-5. 23. Gillean J, Shaha S, Sampanes E, Mullins C. A search for the "Holy Grail" of health care: a correlation between quality and profitability. Healthcare financial management : journal of the Healthcare Financial Management Association 2006;60:114-21. 24. Harkey J, Vraciu R. Quality of health care and financial performance: is there a link? Health care management review 1992;17:55-63. 25. Hartz AJ, Krakauer H, Kuhn EM, et al. Hospital characteristics and mortality rates. The New England journal of medicine 1989;321:1720-5. 26. Hatler CW. Influence of hospital context on cost and length of stay following cardiac catheterization. Nursing economic$ 2006;24:246-52, 27. 27. Hvenegaard A, Arendt JN, Street A, Gyrd-Hansen D. Exploring the relationship between costs and quality: does the joint evaluation of costs and quality alter the ranking of Danish hospital departments? The European journal of health economics : HEPAC : health economics in prevention and care 2011;12:541-51. 28. Jha AK, Orav J, Dobson A, Book R, Epstein AM. The relationship between the costs and quality of hospital care in the US. J Gen Intern Med 2007;22:69-. 29. Kelly JV, Hellinger FJ. Physician and hospital factors associated with mortality of surgical patients. Medical care 1986;24:785-800. 30. Lagu T, Rothberg MB, Nathanson BH, Pekow PS, Steingrub JS, Lindenauer PK. The relationship between hospital spending and mortality in patients with sepsis. Archives of internal medicine 2011;171:292-9. 31. Langland-Orban B, Gapenski LC, Vogel WB. Differences in characteristics of hospitals with sustained high and sustained low profitability. Hospital & health services administration 1996;41:385-99. 32. McDermott C, Stock GN. Hospital operations and length of stay performance. Int J Oper Prod Man 2007;27:1020-42. 33. Morey RC, Fine DJ, Loree SW, Retzlaff-Roberts DL, Tsubakitani S. The trade-off between hospital cost and quality of care. An exploratory empirical analysis. Medical care 1992;30:677-98.
53
34. Schultz MA, van Servellen G, Litwin MS, McLaughlin EJ, Uman GC. Can hospital structural and financial characteristics explain variations in mortality caused by acute myocardial infarction? Applied nursing research : ANR 1999;12:210-4. 35. Shen YC. The effect of financial pressure on the quality of care in hospitals. Journal of health economics 2003;22:243-69. 36. Siegrist RB, Jr., Kane NM. Exploring the relationship between inpatient hospital costs and quality of care. The American journal of managed care 2003;9 Spec No 1:SP43-9. 37. Skelton AG. The relationship among cost, quality, and competition: an analysis of obstetrics services in Missouri hospitals. Journal of health care finance 1997;24:30-44. 38. Smith RB, Dynan L, Fairbrother G, Chabi G, Simpson L. Medicaid, hospital financial stress, and the incidence of adverse medical events for children. Health services research 2012;47:1621-41. 39. Stukel TA, Fisher ES, Alter DA, et al. Association of hospital spending intensity with mortality and readmission rates in Ontario hospitals. JAMA : the journal of the American Medical Association 2012;307:1037-45. 40. Wodchis WP, Teare GF, Anderson GM. Cost and quality - Evidence from Ontario long term care hospitals. Medical care 2007;45:981-8. 41. Brennan TA, Hebert LE, Laird NM, et al. Hospital characteristics associated with adverse events and substandard care. JAMA : the journal of the American Medical Association 1991;265:3265-9. 42. Carrott PW, Markar SR, Kuppusamy MK, Traverso LW, Low DE. Accordion severity grading system: assessment of relationship between costs, length of hospital stay, and survival in patients with complications after esophagectomy for cancer. J Am Coll Surg 2012;215:331-6. 43. Deily ME, McKay NL. Cost inefficiency and mortality rates in Florida hospitals. Health economics 2006;15:419-31. 44. McKay NL, Deily ME. Cost inefficiency and hospital health outcomes. Health economics 2008;17:833-48. 45. Keeler EB, Rubenstein LV, Kahn KL, et al. Hospital characteristics and quality of care. JAMA : the journal of the American Medical Association 1992;268:1709-14. 46. Shi L. Patient and hospital characteristics associated with average length of stay. Health care management review 1996;21:46-61. 47. Schultz MA, van Servellen G, Chang BL, McNeese-Smith D, Waxenberg E. The relationship of hospital structural and financial characteristics to mortality and length of stay in acute myocardial infarction patients. Outcomes management for nursing practice 1998;2:130-6. 48. Bazzoli GJ, Chen HF, Zhao M, Lindrooth RC. Hospital financial condition and the quality of patient care. Health economics 2008;17:977-95. 49. Encinosa WE, Bernard DM. Hospital finances and patient safety outcomes. Inquiry : a journal of medical care organization, provision and financing 2005;42:60-72. 50. Ly DP, Jha AK, Epstein AM. The association between hospital margins, quality of care, and closure or other change in operating status. J Gen Intern Med 2011;26:1291-6.
54
51. Wertheim P, Lynn ML. Development of a Prediction Model for Hospital Closure Using Financial Accounting Data. Decision Sciences 1993;24:529-46. 52. Altman EI. Predicting financial distress of companies: revisiting the Z-score and ZETA models. Stern School of Business, New York University 2000:9-12. 53. Cleverley WO. Predicting hospital failure with the financial flexibility index. Healthcare financial management: journal of the Healthcare Financial Management Association 1985;39:29. 54. Pink GH, Holmes GM, D’Alpe C, Strunk LA, McGee P, Slifkin RT. Financial indicators for critical access hospitals. The Journal of Rural Health 2006;22:229-36. 55. Gardiner LR, Oswald SL, Jahera Jr JS. Prediction of hospital failure: a post-PPS analysis. Hospital & health services administration 1996;41:441. 56. Almwajeh O. Applying Altman's Z-Score Model of Bankruptcy for the Prediction of Financial Distress of Rural Hospitals in Western Pennsylvania: Indiana University of Pennsylvania.; 2004. 57. Center NCP. California's closed hospitals, 1995-2000. Berkeley, Calif: Nicholas C Petris Center on Health Care Markets and Consumer Welfare, Berkeley School of Public Health, April 2001. 58. Office of Inspector General. Hospital Closure: 1989. OEI-04-90-02440. Department of Health and Human Services. 1989. 59. Schisterman EF, Perkins N. Confidence intervals for the Youden index and corresponding optimal cut-point. Communications in Statistics—Simulation and Computation® 2007;36:549-63. 60. Alderman AK, Hawley ST, Janz NK, et al. Racial and ethnic disparities in the use of postmastectomy breast reconstruction: results from a population- based study. J Clin Oncol 2009;27:5325-30. 61. Alderman AK, Hawley ST, Waljee J, Mujahid M, Morrow M, Katz SJ. Understanding the impact of breast reconstruction on the surgical decision-making process for breast cancer. Cancer 2008;112:489-94. 62. Preminger BA, Trencheva K, Chang CS, et al. Improving access to care: breast surgeons, the gatekeepers to breast reconstruction. J Am Coll Surg 2012;214:270-6. 63. Greenberg CC, Schneider EC, Lipsitz SR, et al. Do variations in provider discussions explain socioeconomic disparities in postmastectomy breast reconstruction? J Am Coll Surg 2008;206:605-15. 64. Wang TY, Nelson JA, Corrigan D, Commack T, Serletti JM. Contribution of plastic surgery to a health care system: our economic value to hospital profitability. Plast Reconstr Surg 2012;129:154e-60e. 65. DeSantis C, Siegel R, Bandi P, Jemal A. Breast cancer statistics, 2011. CA Cancer J Clin 2011;61:409-18. 66. Siegel R, Ward E, Brawley O, Jemal A. Cancer statistics, 2011: the impact of eliminating socioeconomic and racial disparities on premature cancer deaths. CA Cancer J Clin 2011;61:212-36. 67. American Cancer Society. Breast Cancer Facts & Figures 2011-2012. Atlanta: American Cancer Society, Inc. 68. National Comprehensive Cancer Network. The NCCN Guidelines. 2012. (Accessed August 16, 2012, at http://www.nccn.org/professionals/physician_gls/pdf/breast.pdf.)
55
69. Agarwal S, Pappas L, Neumayer L, Agarwal J. An analysis of immediate postmastectomy breast reconstruction frequency using the SEER database. Breast J 2011;17:352-8. 70. Kruper L, Holt A, Xu XX, et al. Disparities in reconstruction rates after mastectomy: patterns of care and factors associated with the use of breast reconstruction in Southern California. Ann Surg Oncol 2011;18:2158-65. 71. Alderman AK, McMahon L, Wilkins EG. The national utilization of immediate and early delayed breast reconstruction and the effect of sociodemographic factors. Plast Reconstr Surg 2003;111:695-703. 72. Hultman CS, Daiza S. Skin-sparing mastectomy flap complications after breast reconstruction: review of incidence, management, and outcome. Ann Plast Surg 2003;50:249-55; discussion 55. 73. Chang DW, Wang B, Robb GL, et al. Effect of obesity on flap and donor-site complications in free transverse rectus abdominis myocutaneous flap breast reconstruction. Plast Reconstr Surg 2000;105. 74. Miller RB, Reece G, Kroll SS, et al. Microvascular breast reconstruction in the diabetic patient. Plast Reconstr Surg 2007;119:38-45; discussion 6-8. 75. Morrow M, Scott SK, Menck HR, Mustoe TA, Winchester DP. Factors influencing the use of breast reconstruction postmastectomy: a National Cancer Database study. J Am Coll Surg 2001;192:1-8. 76. Kruper L, Xu X, Henderson K, Bernstein L. Disparities in Reconstruction Rates after Mastectomy for DCIS. Ann Surg Oncol 2011;18:3210-9. 77. Mechanic R, Coleman K, Dobson A. Teaching hospital costs. JAMA: the journal of the American Medical Association 1998;280:1015-9. 78. Culyer AJ, Wiseman J, Drummond M, West P. What Accounts for the Higher Costs of Teaching Hospitals? Social Policy & Administration 1978;12:20-30. 79. Rosson GD, Singh NK, Ahuja N, Jacobs LK, Chang DC. Multilevel analysis of the impact of community vs patient factors on access to immediate breast reconstruction following mastectomy in Maryland. Arch Surg 2008;143:1076-81; discusion 81. 80. Textor J, Hardt J, Knuppel S. DAGitty: A Graphical Tool for Analyzing Causal Diagrams. Epidemiology 2011;5. 81. Textor J, Liskiewicz M. Adjustment Criteria in Causal Diagrams: An Algorithmic Perspective: UAI Press; 2011. 82. Hernan MA, Hernandez-Diaz S, Robins JM. A structural approach to selection bias. Epidemiology 2004;15:615-25. 83. Handel N, Silverstein MJ, Waisman E, Waisman JR. Reasons why mastectomy patients do not have breast reconstruction. Plast Reconstr Surg 1990;86:1118-22; discussion 23-5. 84. Morrow M, Mujahid M, Lantz PM, et al. Correlates of breast reconstruction: results from a population-based study. Cancer 2005;104:2340-6. 85. Platt J, Baxter N, Zhong T. Breast reconstruction after mastectomy for breast cancer. CMAJ : Canadian Medical Association journal = journal de l'Association medicale canadienne 2011;183:2109-16. 86. United States Department of Labor. Women's Health and Cancer Rights Act of 1998. http://www.dol.gov/ebsa/publications/whcra.html. 87. State of New York Public Health Law. § 6993-2009 A. 10094. 2010.
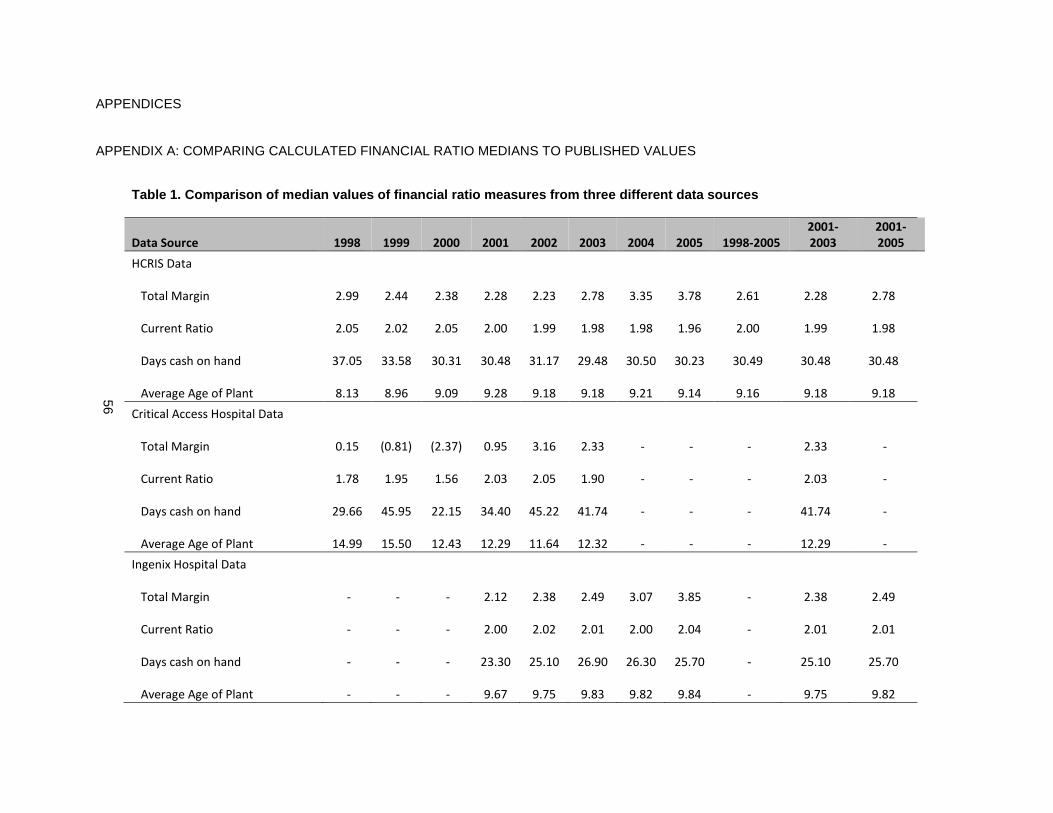
56
APPENDICES
APPENDIX A: COMPARING CALCULATED FINANCIAL RATIO MEDIANS TO PUBLISHED VALUES
Table 1. Comparison of median values of financial r atio measures from three different data sources
Data Source 1998 1999 2000 2001 2002 2003 2004 2005 1998-2005
2001-
2003
2001-
2005
HCRIS Data
Total Margin
2.99
2.44
2.38
2.28
2.23
2.78
3.35
3.78
2.61
2.28
2.78
Current Ratio
2.05
2.02
2.05
2.00
1.99
1.98
1.98
1.96
2.00
1.99
1.98
Days cash on hand
37.05
33.58
30.31
30.48
31.17
29.48
30.50
30.23
30.49
30.48
30.48
Average Age of Plant
8.13
8.96
9.09
9.28
9.18
9.18
9.21
9.14
9.16
9.18
9.18
Critical Access Hospital Data
Total Margin
0.15
(0.81)
(2.37)
0.95
3.16
2.33 - - -
2.33 -
Current Ratio
1.78
1.95
1.56
2.03
2.05
1.90 - - -
2.03 -
Days cash on hand
29.66
45.95
22.15
34.40
45.22
41.74 - - -
41.74 -
Average Age of Plant
14.99
15.50
12.43
12.29
11.64
12.32 - - -
12.29 -
Ingenix Hospital Data
Total Margin - - -
2.12
2.38
2.49
3.07
3.85 -
2.38
2.49
Current Ratio - - -
2.00
2.02
2.01
2.00
2.04 -
2.01
2.01
Days cash on hand - - -
23.30
25.10
26.90
26.30
25.70 -
25.10
25.70
Average Age of Plant - - -
9.67
9.75
9.83
9.82
9.84 -
9.75
9.82
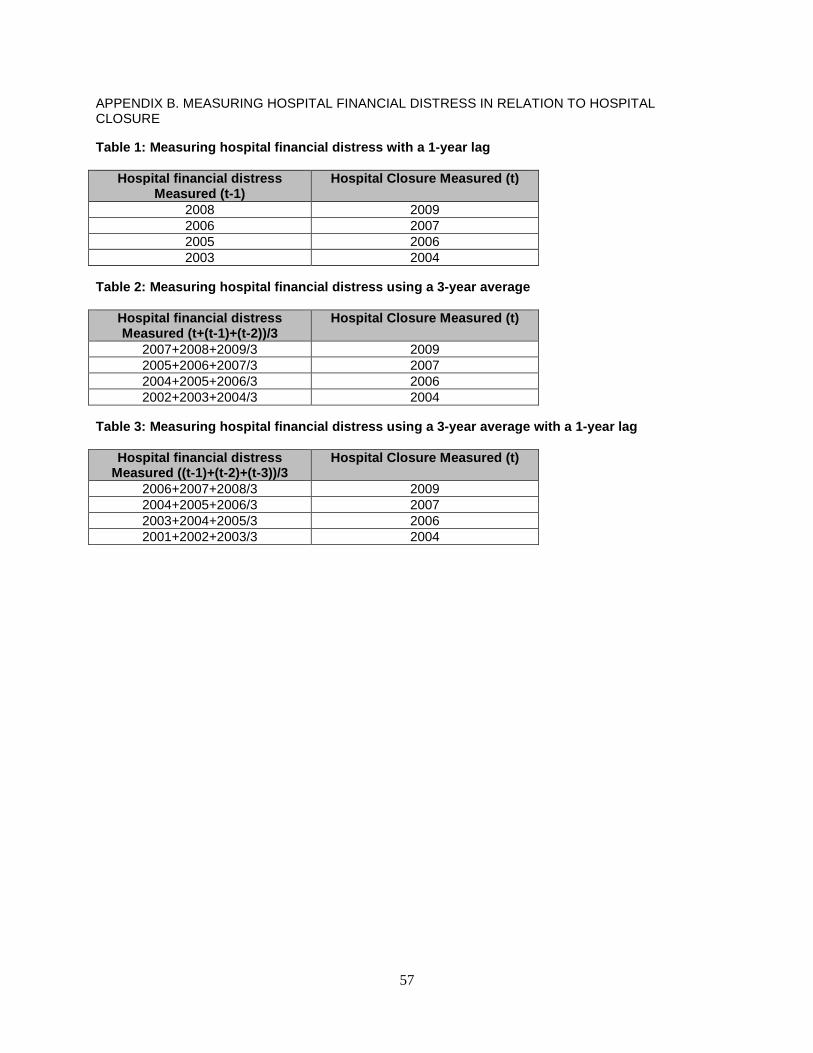
57
APPENDIX B. MEASURING HOSPITAL FINANCIAL DISTRESS IN RELATION TO HOSPITAL CLOSURE
Table 1: Measuring hospital financial distress with a 1-year lag
Hospital financial distress Measured (t-1)
Hospital Closure Measured (t)
2008 2009 2006 2007 2005 2006 2003 2004
Table 2: Measuring hospital financial distress usin g a 3-year average
Hospital financial distress Measured (t+(t-1)+(t-2))/3
Hospital Closure Measured (t)
2007+2008+2009/3 2009 2005+2006+2007/3 2007 2004+2005+2006/3 2006 2002+2003+2004/3 2004
Table 3: Measuring hospital financial distress usin g a 3-year average with a 1-year lag
Hospital financial distress Measured ((t-1)+(t-2)+(t-3))/3
Hospital Closure Measured (t)
2006+2007+2008/3 2009 2004+2005+2006/3 2007 2003+2004+2005/3 2006 2001+2002+2003/3 2004
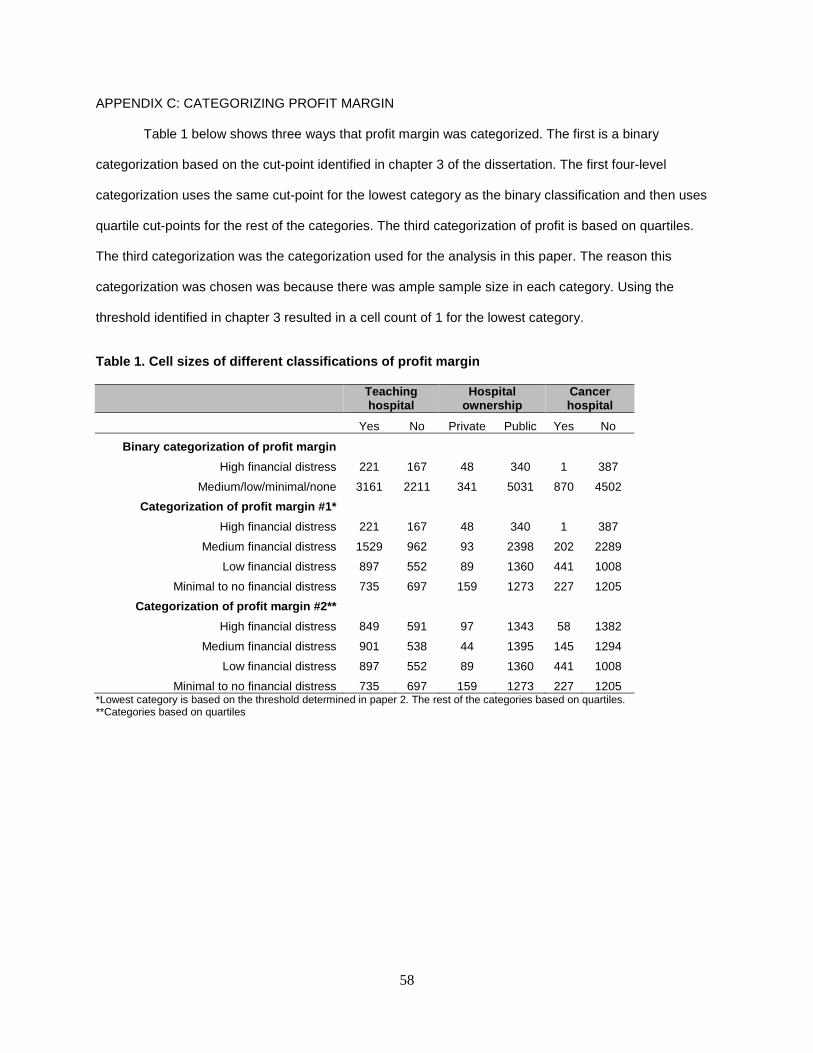
58
APPENDIX C: CATEGORIZING PROFIT MARGIN
Table 1 below shows three ways that profit margin was categorized. The first is a binary
categorization based on the cut-point identified in chapter 3 of the dissertation. The first four-level
categorization uses the same cut-point for the lowest category as the binary classification and then uses
quartile cut-points for the rest of the categories. The third categorization of profit is based on quartiles.
The third categorization was the categorization used for the analysis in this paper. The reason this
categorization was chosen was because there was ample sample size in each category. Using the
threshold identified in chapter 3 resulted in a cell count of 1 for the lowest category.
Table 1. Cell sizes of different classifications of profit margin
Teaching hospital
Hospital ownership
Cancer hospital
Yes No Private Public Yes No
Binary categorization of profit margin
High financial distress 221 167 48 340 1 387
Medium/low/minimal/none 3161 2211 341 5031 870 4502
Categorization of profit margin #1*
High financial distress 221 167 48 340 1 387
Medium financial distress 1529 962 93 2398 202 2289
Low financial distress 897 552 89 1360 441 1008
Minimal to no financial distress 735 697 159 1273 227 1205
Categorization of profit margin #2**
High financial distress 849 591 97 1343 58 1382
Medium financial distress 901 538 44 1395 145 1294
Low financial distress 897 552 89 1360 441 1008
Minimal to no financial distress 735 697 159 1273 227 1205 *Lowest category is based on the threshold determined in paper 2. The rest of the categories based on quartiles. **Categories based on quartiles
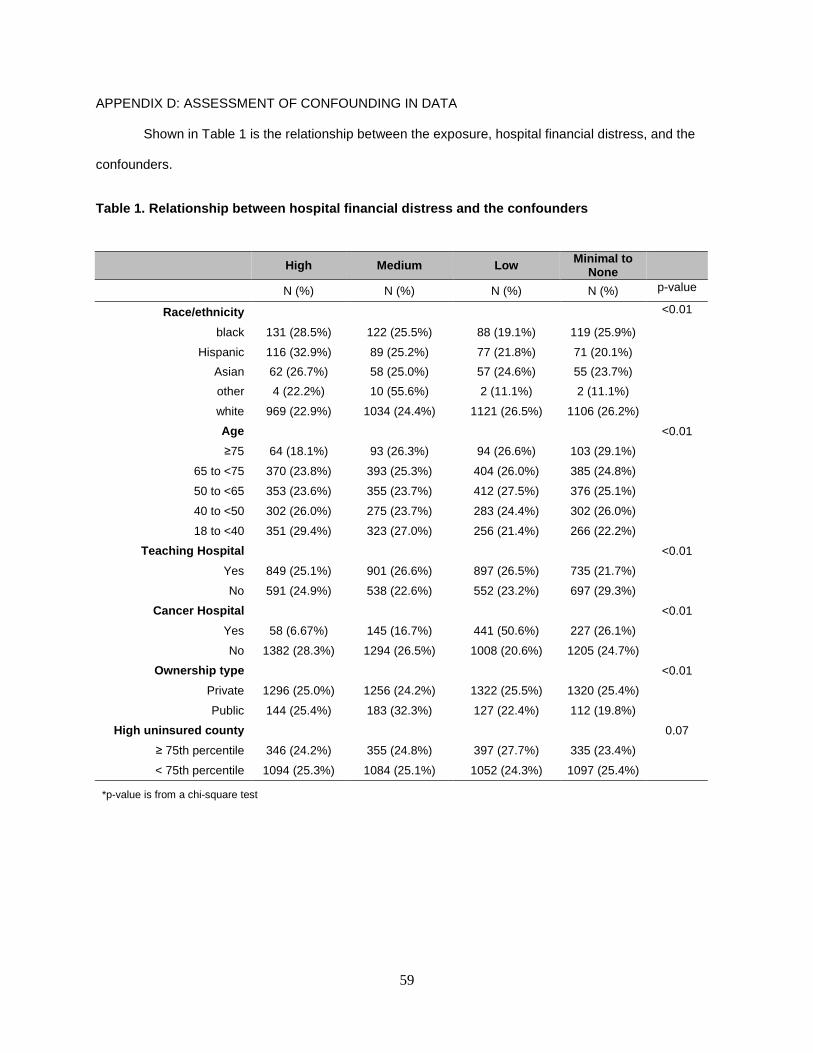
59
APPENDIX D: ASSESSMENT OF CONFOUNDING IN DATA
Shown in Table 1 is the relationship between the exposure, hospital financial distress, and the
confounders.
Table 1. Relationship between hospital financial di stress and the confounders
High Medium Low Minimal to None
N (%) N (%) N (%) N (%) p-value
Race/ethnicity <0.01
black 131 (28.5%) 122 (25.5%) 88 (19.1%) 119 (25.9%)
Hispanic 116 (32.9%) 89 (25.2%) 77 (21.8%) 71 (20.1%)
Asian 62 (26.7%) 58 (25.0%) 57 (24.6%) 55 (23.7%)
other 4 (22.2%) 10 (55.6%) 2 (11.1%) 2 (11.1%)
white 969 (22.9%) 1034 (24.4%) 1121 (26.5%) 1106 (26.2%)
Age <0.01
≥75 64 (18.1%) 93 (26.3%) 94 (26.6%) 103 (29.1%)
65 to <75 370 (23.8%) 393 (25.3%) 404 (26.0%) 385 (24.8%)
50 to <65 353 (23.6%) 355 (23.7%) 412 (27.5%) 376 (25.1%)
40 to <50 302 (26.0%) 275 (23.7%) 283 (24.4%) 302 (26.0%)
18 to <40 351 (29.4%) 323 (27.0%) 256 (21.4%) 266 (22.2%)
Teaching Hospital <0.01
Yes 849 (25.1%) 901 (26.6%) 897 (26.5%) 735 (21.7%)
No 591 (24.9%) 538 (22.6%) 552 (23.2%) 697 (29.3%)
Cancer Hospital <0.01
Yes 58 (6.67%) 145 (16.7%) 441 (50.6%) 227 (26.1%)
No 1382 (28.3%) 1294 (26.5%) 1008 (20.6%) 1205 (24.7%)
Ownership type <0.01
Private 1296 (25.0%) 1256 (24.2%) 1322 (25.5%) 1320 (25.4%)
Public 144 (25.4%) 183 (32.3%) 127 (22.4%) 112 (19.8%)
High uninsured county 0.07
≥ 75th percentile 346 (24.2%) 355 (24.8%) 397 (27.7%) 335 (23.4%)
< 75th percentile 1094 (25.3%) 1084 (25.1%) 1052 (24.3%) 1097 (25.4%)
*p-value is from a chi-square test
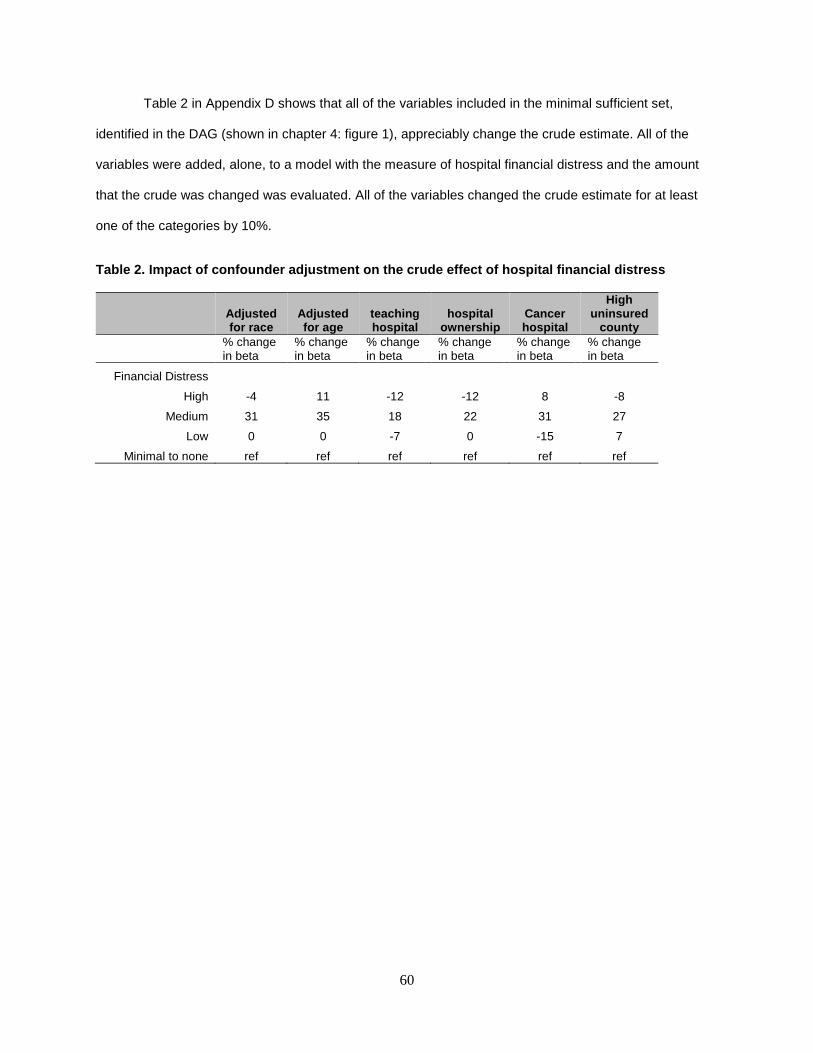
60
Table 2 in Appendix D shows that all of the variables included in the minimal sufficient set,
identified in the DAG (shown in chapter 4: figure 1), appreciably change the crude estimate. All of the
variables were added, alone, to a model with the measure of hospital financial distress and the amount
that the crude was changed was evaluated. All of the variables changed the crude estimate for at least
one of the categories by 10%.
Table 2. Impact of confounder adjustment on the cru de effect of hospital financial distress
Adjusted for race
Adjusted for age
teaching hospital
hospital ownership
Cancer hospital
High uninsured
county
% change in beta
% change in beta
% change in beta
% change in beta
% change in beta
% change in beta
Financial Distress
High -4 11 -12 -12 8 -8
Medium 31 35 18 22 31 27
Low 0 0 -7 0 -15 7
Minimal to none ref ref ref ref ref ref
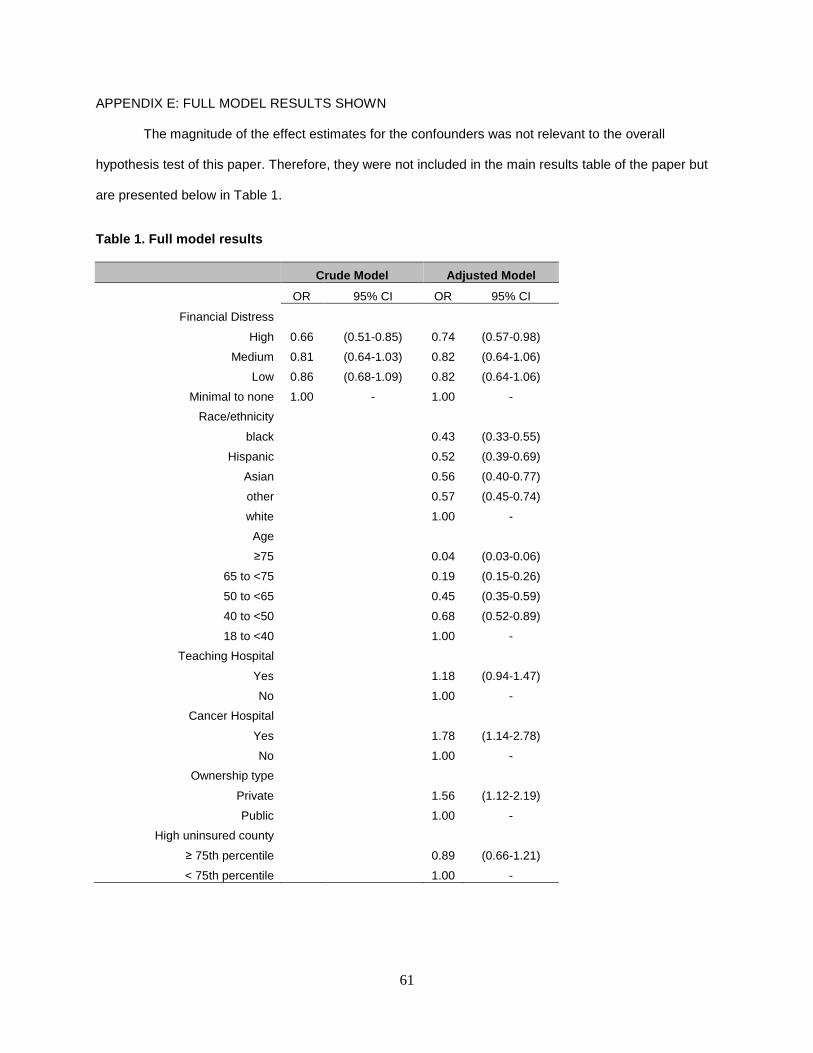
61
APPENDIX E: FULL MODEL RESULTS SHOWN
The magnitude of the effect estimates for the confounders was not relevant to the overall
hypothesis test of this paper. Therefore, they were not included in the main results table of the paper but
are presented below in Table 1.
Table 1. Full model results
Crude Model Adjusted Model
OR 95% CI OR 95% CI
Financial Distress
High 0.66 (0.51-0.85) 0.74 (0.57-0.98)
Medium 0.81 (0.64-1.03) 0.82 (0.64-1.06)
Low 0.86 (0.68-1.09) 0.82 (0.64-1.06)
Minimal to none 1.00 - 1.00 -
Race/ethnicity
black 0.43 (0.33-0.55)
Hispanic 0.52 (0.39-0.69)
Asian 0.56 (0.40-0.77)
other 0.57 (0.45-0.74)
white 1.00 -
Age
≥75 0.04 (0.03-0.06)
65 to <75 0.19 (0.15-0.26)
50 to <65 0.45 (0.35-0.59)
40 to <50 0.68 (0.52-0.89)
18 to <40 1.00 -
Teaching Hospital
Yes 1.18 (0.94-1.47)
No 1.00 -
Cancer Hospital
Yes 1.78 (1.14-2.78)
No 1.00 -
Ownership type
Private 1.56 (1.12-2.19)
Public 1.00 -
High uninsured county
≥ 75th percentile 0.89 (0.66-1.21)
< 75th percentile 1.00 -
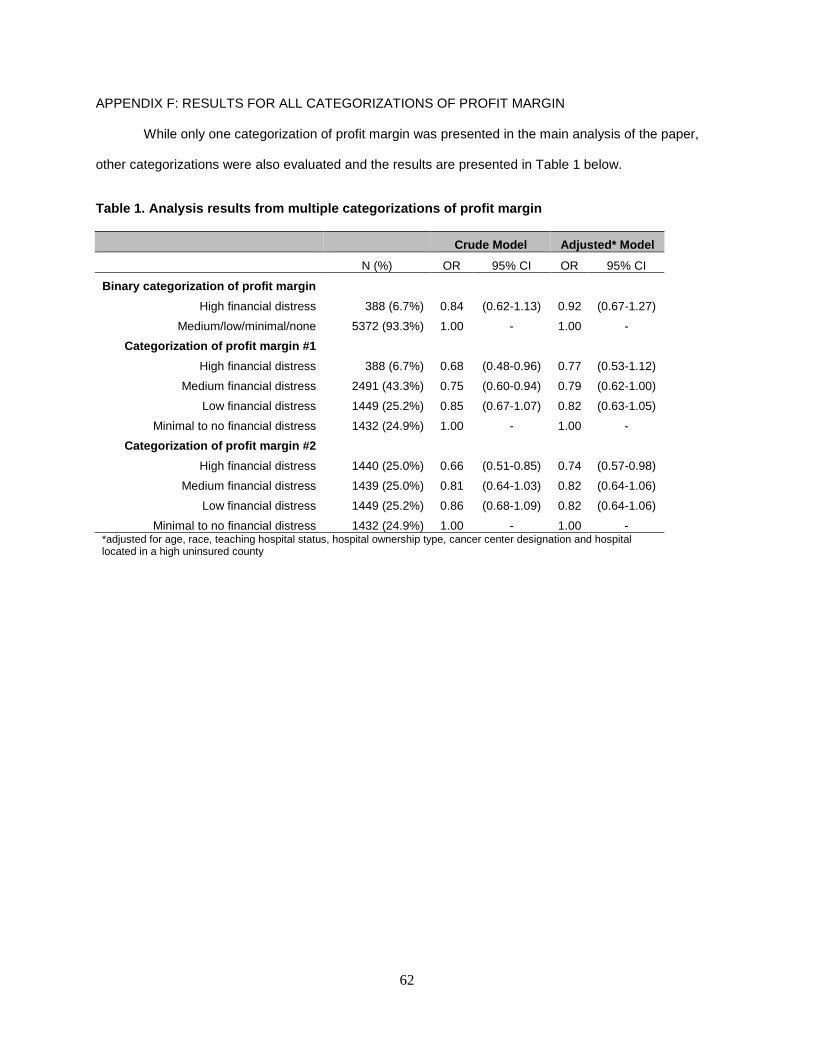
62
APPENDIX F: RESULTS FOR ALL CATEGORIZATIONS OF PROFIT MARGIN
While only one categorization of profit margin was presented in the main analysis of the paper,
other categorizations were also evaluated and the results are presented in Table 1 below.
Table 1. Analysis results from multiple categorizat ions of profit margin
Crude Model Adjusted* Model
N (%) OR 95% CI OR 95% CI
Binary categorization of profit margin
High financial distress 388 (6.7%) 0.84 (0.62-1.13) 0.92 (0.67-1.27)
Medium/low/minimal/none 5372 (93.3%) 1.00 - 1.00 -
Categorization of profit margin #1
High financial distress 388 (6.7%) 0.68 (0.48-0.96) 0.77 (0.53-1.12)
Medium financial distress 2491 (43.3%) 0.75 (0.60-0.94) 0.79 (0.62-1.00)
Low financial distress 1449 (25.2%) 0.85 (0.67-1.07) 0.82 (0.63-1.05)
Minimal to no financial distress 1432 (24.9%) 1.00 - 1.00 -
Categorization of profit margin #2
High financial distress 1440 (25.0%) 0.66 (0.51-0.85) 0.74 (0.57-0.98)
Medium financial distress 1439 (25.0%) 0.81 (0.64-1.03) 0.82 (0.64-1.06)
Low financial distress 1449 (25.2%) 0.86 (0.68-1.09) 0.82 (0.64-1.06)
Minimal to no financial distress 1432 (24.9%) 1.00 - 1.00 - *adjusted for age, race, teaching hospital status, hospital ownership type, cancer center designation and hospital located in a high uninsured county
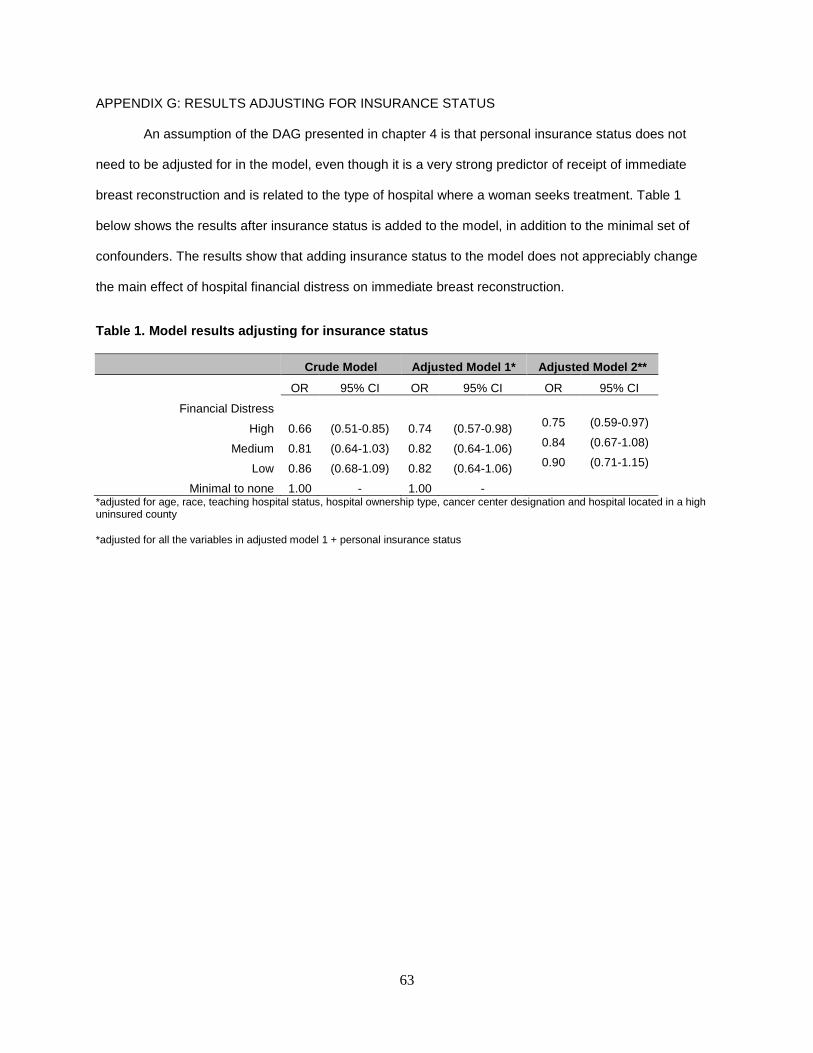
63
APPENDIX G: RESULTS ADJUSTING FOR INSURANCE STATUS
An assumption of the DAG presented in chapter 4 is that personal insurance status does not
need to be adjusted for in the model, even though it is a very strong predictor of receipt of immediate
breast reconstruction and is related to the type of hospital where a woman seeks treatment. Table 1
below shows the results after insurance status is added to the model, in addition to the minimal set of
confounders. The results show that adding insurance status to the model does not appreciably change
the main effect of hospital financial distress on immediate breast reconstruction.
Table 1. Model results adjusting for insurance stat us
Crude Model Adjusted Model 1* Adjusted Model 2**
OR 95% CI OR 95% CI OR 95% CI
Financial Distress
High 0.66 (0.51-0.85) 0.74 (0.57-0.98) 0.75 (0.59-0.97)
Medium 0.81 (0.64-1.03) 0.82 (0.64-1.06) 0.84 (0.67-1.08)
Low 0.86 (0.68-1.09) 0.82 (0.64-1.06) 0.90 (0.71-1.15)
Minimal to none 1.00 - 1.00 -
*adjusted for age, race, teaching hospital status, hospital ownership type, cancer center designation and hospital located in a high uninsured county
*adjusted for all the variables in adjusted model 1 + personal insurance status
64
APPENDIX H: BETWEEN HOSPITAL VARIATION
As part of preliminary analyses for the dissertation the amount of variation due to between hospital
differences and the amount of variation due to between county differences was calculated. Overall, 23%
of the variation in breast reconstructive rates is due to between hospital differences and 17% is due to
between county differences. After adjusting for important patient-level characteristics, such as age, race
and insurance type, there is still significant between hospital and between county variation. In fact, even
after adjusting for teaching hospital status, urban/rural location, various characteristics of the patient mix,
socio-demographic characteristics of the external hospital environment, as well as the percentage of
residents in the county that are over the age of 65 and that are uninsured, there is still significant between
hospital variation in immediate breast reconstructive rates following mastectomy. This remaining between
hospital variation was the impetus for looking more closely at hospital finances since important between
hospital differences remained, even after adjusting for important hospital characteristics.
Related Documents