The effect of heat shocks in skin rejuvenation Dams, S.D. DOI: 10.6100/IR685263 Published: 01/01/2010 Document Version Publisher’s PDF, also known as Version of Record (includes final page, issue and volume numbers) Please check the document version of this publication: • A submitted manuscript is the author's version of the article upon submission and before peer-review. There can be important differences between the submitted version and the official published version of record. People interested in the research are advised to contact the author for the final version of the publication, or visit the DOI to the publisher's website. • The final author version and the galley proof are versions of the publication after peer review. • The final published version features the final layout of the paper including the volume, issue and page numbers. Link to publication Citation for published version (APA): Dams, S. D. (2010). The effect of heat shocks in skin rejuvenation Eindhoven: Technische Universiteit Eindhoven DOI: 10.6100/IR685263 General rights Copyright and moral rights for the publications made accessible in the public portal are retained by the authors and/or other copyright owners and it is a condition of accessing publications that users recognise and abide by the legal requirements associated with these rights. • Users may download and print one copy of any publication from the public portal for the purpose of private study or research. • You may not further distribute the material or use it for any profit-making activity or commercial gain • You may freely distribute the URL identifying the publication in the public portal ? Take down policy If you believe that this document breaches copyright please contact us providing details, and we will remove access to the work immediately and investigate your claim. Download date: 23. Jun. 2018

Welcome message from author
This document is posted to help you gain knowledge. Please leave a comment to let me know what you think about it! Share it to your friends and learn new things together.
Transcript

The effect of heat shocks in skin rejuvenation
Dams, S.D.
DOI:10.6100/IR685263
Published: 01/01/2010
Document VersionPublisher’s PDF, also known as Version of Record (includes final page, issue and volume numbers)
Please check the document version of this publication:
• A submitted manuscript is the author's version of the article upon submission and before peer-review. There can be important differencesbetween the submitted version and the official published version of record. People interested in the research are advised to contact theauthor for the final version of the publication, or visit the DOI to the publisher's website.• The final author version and the galley proof are versions of the publication after peer review.• The final published version features the final layout of the paper including the volume, issue and page numbers.
Link to publication
Citation for published version (APA):Dams, S. D. (2010). The effect of heat shocks in skin rejuvenation Eindhoven: Technische UniversiteitEindhoven DOI: 10.6100/IR685263
General rightsCopyright and moral rights for the publications made accessible in the public portal are retained by the authors and/or other copyright ownersand it is a condition of accessing publications that users recognise and abide by the legal requirements associated with these rights.
• Users may download and print one copy of any publication from the public portal for the purpose of private study or research. • You may not further distribute the material or use it for any profit-making activity or commercial gain • You may freely distribute the URL identifying the publication in the public portal ?
Take down policyIf you believe that this document breaches copyright please contact us providing details, and we will remove access to the work immediatelyand investigate your claim.
Download date: 23. Jun. 2018


The effect of heat shocks in skin rejuvenation
Susanne Dams

A catalogue record is available from the Eindhoven University of Technology Library ISBN: 978‐90‐386‐2314‐6
Cover design: B‐design vormgeving
Printed by Universiteitsdrukkerij TU Eindhoven, The Netherlands
©Koninklijke Philips Electronics N.V. 2010
All rights reserved. Reproduction in whole or in part is prohibited without the written
consent of the copyright owner.

The effect of heat shocks in skin rejuvenation
PROEFSCHRIFT ter verkrijging van de graad van doctor aan de Technische Universiteit Eindhoven, op gezag van de rector magnificus, prof.dr.ir. C.J. van Duijn, voor een commissie aangewezen door het College voor Promoties in het openbaar te verdedigen op donderdag 9 september 2010 om 16.00 uur door Susanne Dorien Dams geboren te Nuenen, Gerwen en Nederwetten

Dit proefschrift is goedgekeurd door de promotor: prof.dr.ir. F.P.T. Baaijens Copromotor: dr.ir. C.W.J. Oomens

I
Contents
List of Abbreviations III
Summary V
Chapter 1 1
General introduction
Chapter 2 15
Modeling and simulation of the heat distribution in human skin caused by laser
irradiation
Chapter 3 31
The effect of pulsed heat shocks collagen type I expression in human dermal
fibroblasts
Chapter 4 47
The effect of pulse duration of the heat shock on collagen type I by human dermal
fibroblasts in‐vitro
Chapter 5 63
The effect of thermal stimuli on dermal fibroblast in ex‐vivo human skin
Chapter 6 81
Procollagen gene upregulation in ex‐vivo human skin after laser irradiation:
A pilot study
Chapter 7 93
General discussion
Bibliography 101
Samenvatting 111
Dankwoord 113
Curriculum Vitae 115
List of Publications 117

II

III
List of Abbreviations
DAB ‐ 3,3′‐Diaminobenzidine tetrahydrochloride
DAPI ‐ 4’, 6‐diamindino‐2‐phenylindoledihydrochloride
EIA ‐ Enzyme Immuno Assay
HDF ‐ Human dermal fibroblast
HRP ‐ Horse Radish Peroxidase
HS ‐ Heat shock
Hsp ‐ Heat shock protein
HSR ‐ Heat shock response
ICTP ‐ carboxy‐terminal telopeptide of collagen type I
MMP ‐ Matrix metalloproteinase
MTT ‐ 3‐[4,5‐dimethylthiazol‐2‐yl]‐2,5‐diphenyl tetrazolium bromide
P1P ‐ Procollagen type I carboxy‐terminal Propeptide
PBS ‐ Phosphate Buffered Saline
PI ‐ Propidium Iodide
qPCR ‐ quantative polymerase chain reaction
RMHS ‐ Repeated mild heat shocks
SD ‐ Standard deviation
TRITC ‐ tetramethyl rhodamine B isothiocyanate

IV

V
Summary The effect of heat shocks in skin rejuvenation
The formation of wrinkles, one of the aspects of aging skin, results as a consequence of a
degenerated dermis. The aged protein network, muscle contractions and gravitation
result in wrinkling of the skin. Currently, in the cosmetic industry, treatments for skin
rejuvenation are rapidly evolving. Only a few techniques are used to counteract the
aging dermis. One of the most promising areas is non‐ablative laser techniques. These
techniques have clinically been tested. However, the physiological basis of their
mechanisms is still to be established.
It is hypothesized that laser induced heat in the skin causes a heat shock and a
subsequent heat shock response by the dermal fibroblasts. This heat shock response is
said to stimulate, through heat shock proteins, the collagen synthesis by these cells.
Subsequently, in addition to its thermal effect the laser also evokes a photochemical
effect. The present thesis focuses on the influence of the thermal effect on the collagen
production of human dermal fibroblasts in culture and in ex‐vivo skin.
A model was developed that describes the interaction of laser light with skin resulting in
the generation of heat. This model was combined with a transport model to describe the
distribution of this heat through the skin. The model was used to determine the optimal
laser conditions for heating and to describe the temperature distribution in the skin as a
function of time.
To investigate the response of human skin to heat shocks, the initial research was
performed on cell cultures. Here, human dermal fibroblasts were cultured and exposed
to heat shocks of 45⁰C and 60⁰C, respectively, each with a pulse duration of 2 seconds.
The results of this study showed that these heat shocks enhanced collagen type I
synthesis. Subsequently, a study was performed with heat shocks of 45⁰C and 60⁰C that
were applied for 2, 4, 8, 10 and 16 seconds. The conclusion from this study is that 8 to 10
second pulses at 45⁰C are the maximum exposure time range at which the collagen type
I synthesis is optimal.
In a separate approach, viable ex‐vivo human skin samples were immersed in PBS at
both 45⁰C and 60⁰C. The 45⁰C heat shock did not damage the skin at all, while the 60⁰C
heat shock appeared to reveal an initial damage response around the cells in the skin. It
was demonstrated that procollagen type I as well as type III were upregulated by both
45⁰C and 60⁰C heat shocks.

VI
Summary
Subsequently, a pilot study of a laser induced heat shock on ex‐vivo skin study was
performed. The results of this research demonstrated that the 45⁰C and 60⁰C laser
induced heat shocks did not induce damage to the collagen structure of the skin
samples. However, the 60⁰C laser induced heat shock, in conjuncture with the previous
ex‐vivo skin study, appeared to reveal the presence of hsp27 in the area of the cells,
suggesting early damage. The gene expression results indicated that the 45⁰C heat
shocks upregulated procollagen type I.
In conclusion, it has been shown in this thesis that a heat shock of 45⁰C applied to
fibroblasts or ex‐vivo skin results in upregulation of in collagen heat shock gene
expression. Furthermore, the cell studies showed the relevance of the combination of
time and temperature; an optimal exposure range of 8 to 10 seconds at 45⁰C was found
to achieve the highest amount of collagen type I. Also the harmful nature of a 60⁰C heat
shock was revealed. Showing that collagen synthesis can be enhanced by the 45⁰C heat
shock is another step towards understanding the physiological pathways that lead to
skin rejuvenation.

Chapter 1 General introduction

2
Chapter 1
1.1 Skin rejuvenation The human body grows, develops and eventually ages. The aging process affects each
organ and cell, resulting in the decline of function causing health problems and
eventually a decrease in the quality of life. The drive for a long and healthy life increases
with prosperity. In our society today a certain vision of beauty is propagated to which
one should measure up to. However, besides the obvious cosmetic reasons, health
issues could in the future also play an important role in skin care. For example, skin
diseases caused by excessive UV‐radiation become more and more an issue (Bernerd
and Asselineau, 2006; Ebling et al., 1992; Giacomoni and D'Alessio, 2007; Gilchrest and
Bohr, 2006).
The skin protects us from external influences such as viruses and infections. Several
functions are characteristic for the skin: it serves as a barrier, a temperature regulator, it
has a prominent role in immune regulation, and it functions as a cushion for external
mechanical loads (Ebling et al., 1992). It is the largest organ and is constantly exposed;
therefore it should be kept in proper health. Aging of the skin results in a decreasing
protective mechanism. Thus there are real advantages in retarding this aging process
and many rejuvenating therapies have been proposed. However, the corresponding
physiological processes are hardly understood. The present thesis is aimed at a better
understanding of these processes in skin rejuvenation. Before the objective and scope
can be discussed in more detail it is necessary to elaborate on the function and
physiology of skin and its aging process.
1.2 Skin physiology Like other organs the skin has the ability to grow, develop and repair. Roughly, it can be
divided into three layers with on top the epidermis, followed by the dermis and the third
layer is the hypodermis.
Figure 1.1: Schematic representation of a cross‐section of the epidermis and dermis of the skin.
The layered structure of the epidermis is depicted in more detail on the right (Farber and Rubin,
1998).

3
Chapter 1General introduction
Figure 1.1 shows the two layers of the skin, most relevant for this thesis; the epidermis
and the dermis.
1.2.1Epidermis The epidermis is 50‐150 μm thick, depending on the part of the body and skin type
(Lewis et al., 1994). It consists of a multilayered sheet of keratin synthesizing cells, called
keratinocytes. In between those cells melanocytes, Langerhans cells and Merker cells
are present. The keratinocytes are distributed in layers in order of increasing
differentiation starting from the basement membrane zone, located immediately on top
of the dermis. These layers, shown in figure 1.1 on the right, are called stratum basale,
stratum spinosum, stratum granulosum and stratum corneum (Ebling et al., 1992;
Humbert and Agache, 2004; Lewis et al., 1994; Mitchell et al., 1999).
In between the keratinocytes of the stratum basale melanocytes are situated, producing
melanins, eumelanin and pheomelanin. Through melanosomes the melanins are
transferred to the neighboring keratinocytes. Millions of epidermal melanin units, an
association of one melanocyte with multiple keratinocytes, cause epidermal
pigmentation. The color of the skin is largely based on the ratio between eumelanin and
pheomelanin (Duval et al., 2002). In skin rejuvenation treatments a distinction of six
different skin types, Fitzpatrick skin type I to VI, is being used. They are distinguished by
the total melanin content (Fitzpatrick et al., 1961; Fitzpatrick, 1988). Type I correlates
with little to no melanin content and in skin type VI melanin is in abundance (Lu et al.,
1996; Roberts, 2009).
The basement membrane zone is the area where the epidermal and dermal layers are
blended together. In this zone the basal membrane of the epidermis is connected to the
papillary dermis through anchoring filaments (Ebling et al., 1992; Farber and Rubin,
1998).
1.2.2 Dermis The dermis, the second layer of the skin, has a thickness that varies from 300 μm on the
eyelids to 3 mm on the back (Ebling et al., 1992; Humbert and Agache, 2004). Left in
figure 1.1 the dermis is depicted. The mechanical properties of the dermis are primarily
determined by the supporting extracellular matrix. The main components of this matrix
are proteins such as collagen, elastin, fibronectin, and proteoglycans (Ebling et al., 1992;
Humbert and Agache, 2004; Mitchell et al., 1999; Prydz and Dalen, 2007).
The dermis can be divided into the papillary dermis and the reticular dermis (Farber and
Rubin, 1998). The papillary dermis is a narrow zone immediately under the basement
membrane zone of the epidermis. The most prominent structures are delicate collagen
and elastin fibrils. Directly underneath the papillary dermis the reticular dermis is
situated. This part contains most of the dermal collagen, organized into coarse bundles,

4
Chapter 1
cross‐linked with one another and with elastic fibers (Daamen et al., 2007; Tzaphlidou,
2007).
The majority of cells found in the dermis are the fibroblasts (Ebling et al., 1992; Farber
and Rubin, 1998; Lewis et al., 1994). Fibroblasts synthesize the extracellular matrix
proteins such as collagen, elastin and proteoglycans. Characteristic for these cells is that,
if their activity is stimulated, for instance by heat, their endoplasmatic reticula and
ribosomes become well developed and they start to synthesize heat shock proteins
(Snoeckx et al., 2007).
1.3 Aging skin Visible changes of the aging skin are roughness (dryness), wrinkling, laxity, and uneven
pigmentation. Aging can biologically be defined as loss of cell function and subsequent
degradation of the dermal matrix, increasing with time and illness (Krutmann, 2007;
Labat‐Robert and Robert, 2007; Wilhelm et al., 2007). This process is divided into
intrinsic and extrinsic aging. Intrinsic aging of the skin refers to the chronological age of
the skin, determined by only internal factors. Extrinsic aging is defined by external
factors, such as gravity and sun light, that cause a constant exposure to mechanical
stresses or irradiation, respectively (Gilchrest et al., 2007; Gilchrest, 2007c).
As a person ages several alterations occur in the skin. Internal factors result in a thinner
skin, because cells, like fibroblasts, melanocytes, and keratinocytes, towards their
senescent state start to divide more slowly and eventually loose their ability to replicate
(Bailey, 2007; Ebling et al., 1992; Gilchrest, 2007a; Gilchrest and Bohr, 2006). Therefore,
the amount of cells decreases and consequently less protein synthesis occurs. This is
particularly noticable in the dermis where less synthesis and more degradation loosens
and unravels the underlying network of proteoglycans, elastin and collagen fibers,
resulting in changed mechanical properties of the dermal matrix (Bailey et al., 2007;
Labat‐Robert and Robert, 2007). The stiffness of the skin is said to be age‐related. One
would expect, because of loosening and unraveling of the dermal matrix that the
stiffness would decrease. However, it is reported that people under the age of 35 have a
Young’s Modulus of approximately 4.2∙105 N/m2 and people above the age of 35 have an
average Young’s Modulus of 8.5∙105 N/m2 (Agache et al., 2007; Branchet et al., 2007;
Humbert and Agache, 2004; Smalls et al., 2006). As a result of the increasing stiffness of
the dermal matrix the skin loses its ability to return to its original form, resulting in
sagging and wrinkling. The formation of wrinkles also results from an interaction of
permanent muscle contractions and gravity upon a thinned, inelastic dermis (Gilchrest,
2007a; Gilchrest and Bohr, 2006; Kurban and Bhawan, 2007). For example frown lines
and crow’s feet appear to develop due to the permanent small muscle contractions, and
gravity contributes to the formation of pouches and drooping eyelids (Gilchrest, 2007b).

5
Chapter 1General introduction
Additionally, the skin is exposed to light. Its optical properties play a major role in
affecting the response of the skin to light. The effects are both wavelength and dose‐
dependent (Narurkar, 2006; Watanabe, 2008). Figure 1.2 shows the optical pathways of
incident radiation into the skin (Anderson and Parrish, 2007; van Gemert et al., 1989;
Welch and van Gemert, 1995).
Figure 1.2: The optical pathways into the skin (van Gemert et al., 1989; Welch and van Gemert,
1995).
1.4 Skin and light Light that penetrates into the skin is believed to have two different effects in the skin.
Firstly, a thermal effect; photons are absorbed by chromophores (water, blood, and
melanin) that convert the energy of the photons into heat and subsequently distribute
this heat in the dermis (Capon and Mordon, 2006; Manstein et al., 2006). Secondly, a
physiological effect; photons are absorbed by cytochrome‐c on the membrane of the
fibroblast and subsequently influence the oxidative phosphorylation. It depends on the
wavelength and the energy of the photon if it will have a stimulating or an inhibiting
effect on the oxidative phosphorylation (Dinh, 2006).
Incident photons must pass through the stratum corneum before they reach the viable
epidermis and dermis. For normally incident photons a small part is reflected (regular
reflectance, figure 1.2) due to the change in refractive index between air and stratum
corneum. This reflectance for healthy skin is between 4% and 7% for a perpendicular
beam of any wavelength (van Gemert et al., 1989). The remaining portion of the light is

6
Chapter 1
transmitted further into the tissue. Besides propagating, the epidermis absorbs light too.
The absorption property results from melanin and water. The melanin absorption level
depends on the volume fraction of the melanin present in the epidermis, varying from
1.3% (skin type I) to 43% (skin type VI) (Bashkatov et al., 2005; Troy and Thennadil, 2001;
van Gemert et al., 1989). Since melanin and water content decrease with age (Gilchrest,
2007a; Yaar et al., 2007), the absorption will decrease as well. The main chromophores
in the dermis are water and hemoglobin (Troy and Thennadil, 2001). However, due to
the change in dermal composition, decrease in amount and thickness of fibers, the
optical properties, such as absorption and scattering, will decrease with age (Humbert
and Agache, 2004; van Gemert et al., 1989).
1.5 Rejuvenation methods To rejuvenate the skin the effects of aging must be stopped or reversed. As a result of
continuous research it is perseved that most aging symptoms can be treated (Bjerring,
2006; Giacomoni and Rein, 2007; Sadick, 2006). Treatments that counteract the dryness
and uneven pigmentation focus on the epidermis. Treatments to decrease the wrinkle
depth and to improve the skin laxity are focused on the dermis. However, fundamental
knowledge about the presumed physiological changes as a result of the rejuvenation
treatments is missing. Some of the assumed mechanisms are associated with inflicting
different degrees of skin damage (table 1.1), causing different degrees of wound healing
that is assumed to result in a rejuvenated skin (Bjerring, 2006; Giacomoni and Rein,
2007; Sadick, 2006). Other theories suggest enhancement of synthesizing dermal
components by stimulating fibroblasts will also result in skin rejuvenation (Dinh, 2006;
Hamblin and Demidova, 2007; Kameyama, 2008).
Table 1.1: An overview of the different rejuvenation treatments including their corresponding
processes. Based on literature literature ( Biesman, 2007; Bjerring, 2006; Bowler, 2007; Dierickx
and Anderson, 2007; Dierickx, 2007; Dinh, 2006; Giacomoni and Rein, 2007; Goldberg, 2006;
Hamblin and Demidova, 2007; Manstein et al., Narurkar, 2006; Sadick, 2006; Sadick et al., 2006;
Sadick, 2007; Swelstad and Gutowski, 2006; Weiss et al., 2006; White et al., 2007).
Technique Treatment
Result after treatment
Damaging the skin
Spectrum of traumatizing → damaging the dermis
Removing stratum corneum
No damage
Optical
LED ×
Non‐ablative lasers ×
IPL ×
Fractional photothermolysis
×
Ablative lasers ×
Electrical Monopolar RF ×
Bipolar RF ×
Mechanical
Micro‐dermabrasion ×
Focused ultrasound ×
Dermabrasion ×
Chemical Superficial peel ×
Deep peel ×

7
Chapter 1General introduction
As depicted in table 1.1 and 1.2 the rejuvenation methods can be divided into four
groups based on the used technique; optical, electrical, mechanical, and chemical. In the
following paragraphs the treatments will be explained briefly, using the order as given in
the first column of the tables.
Table 1.2: An overview of the efficacy of the rejuvenation treatments based on literature
(Biesman, 2007; Bjerring, 2006; Bowler, 2007; Dierickx and Anderson, 2007; Dierickx, 2007; Dinh,
2006; Giacomoni and Rein, 2007; Goldberg, 2006; Hamblin and Demidova, 2007; Manstein et al.,
Narurkar, 2006; Sadick, 2006; Sadick et al., 2006; Sadick, 2007; Swelstad and Gutowski, 2006;
Weiss et al., 2006; White et al., 2007). The efficacy of the treatment is indicated with ++ and +
(positive), ‐ and ‐ ‐ (negative). No difference before and after treatment is indicated with ‘o’
(neutral), and not reported with ‘?’.
Technique Treatment Aging characteristics
Efficacy Down
time
Risk
potential Deep
wrinkles
Fine
lines
Skin
tone
Skin
texture
Spider
veins
Pore
size
Optical
LED ‐ o o o o o o ++ ++
Non‐ablative lasers ‐ + + + + + + + +
IPL ‐ + + + + + + ‐ ‐
Fractional
photothermolysis ‐ + + + + + + ‐ ‐
Ablative lasers + + + + + + + ‐‐ ‐‐
Electrical Monopolar RF o + ‐ ‐ ‐ o o o ?
Bipolar RF o + o o o o o + ?
Mechanical
Micro‐
dermabrasion ‐ o + + o o o ‐‐ ‐‐
Focused ultrasound ? ? ? ? ? ? ? ? ?
Dermabrasion + + + + + + + + +
Chemical Superficial peel ‐ o + + o o o + +
Deep peel + + + + + + + ‐‐ ‐‐
1.5.1 Optical techniques All optical treatments cause two effects, a thermal and a photochemical effect, as
mentioned in paragraph 1.4. However, differences between treatments occur, due to
the used spectrum and the amount of power that is applied. In the text below the
dominating effect of the optical techniques will be explained.
Low‐level light therapy, as mentioned, is performed with light emitting diodes, LEDs. The
emitted photons are absorbed and produce a biological response. As a result this
treatment does not inflict any damage to the skin, table 1.1. All biological systems have a
unique absorption spectrum; this uniqueness determines which wavelengths of light will
be absorbed (Dinh, 2006; Hamblin and Demidova, 2007; Weiss et al., 2006). The
mechanism of low‐power laser therapy at the cellular level is based upon the absorption
of monochromatic visible and near infrared (NIR) radiation by components that play a
role in the cellular respiratory chain, the oxidative phosphorylation. Absorption of these
photons causes changes in redox properties of these molecules and acceleration of
electron transfer, the so called primary reactions. Primary reactions in mitochondria are

8
Chapter 1
followed by a cascade of secondary reactions, photo‐signal transduction and
amplification of cellular signalling. These reactions occur in cell cytoplasm, membrane,
and nucleus. This process is known as photomodulation. Furthermore, it is suggested
that the primary photo acceptor for the red‐NIR range in mammalian cells is a
cytochrome‐c oxidase, an electron carrier in the oxidative phosphorylation (Dinh, 2006;
Hamblin and Demidova, 2007).
Low‐level light therapy aims to enhance collagen and elastin synthesis without causing
injury, table 1.1 (Dinh, 2006; Hamblin and Demidova, 2007; Weiss et al., 2006). The
method uses light emitting diodes, LEDs, for stimulation of the cells, but it does not
traumatize or damage the skin. As a result no visible difference between before and
after treatment can be noticed (table 1.2).
Laser treatments make use of chromophores. Chromophores are molecules, like water,
haemoglobin, and melanin, that are capable of converting the energy of the photon into
heat (Bjerring et al., 2006; Capon and Mordon, 2006; Dinh, 2006; Hamblin and
Demidova, 2007; Sadick, 2006; Weiss et al., 2006). It is hypothesized that this heat shock
triggers a heat shock response (HSR), resulting in the production of heat shock proteins.
These proteins induce an inflammation reaction in the dermis (Capon and Mordon,
2006; Sadick, 2006). The damaging effect in the dermis is believed to induce a wound
healing response (Bjerring et al., 2006; Capon and Mordon, 2006; Goldberg, 2006). The
intact epidermis serves as a natural bandage, ensuring a low risk of infection and a
relatively short recovery period (Bjerring, 2006; Geronemus, 2006; Manstein et al.,
2006). The spectrum of lasers for non‐ablative laser treatment is chosen in such a way
that these lasers are able to selectively create thermal damage, using different
chromophores, without losing the integrity of the epidermis.
Among the non‐ablative technologies, intense‐pulsed‐light (IPL) technology involves
application of a broadband, filtered flash lamp source directed to the skin. Modification
of various parameters allows flexibility in treatment. These parameters include
wavelength, energy fluency, pulse footprint, pulse duration, pulse delay, pulse sequence
and temperature control of the skin (Bjerring et al., 2006; Capon and Mordon, 2006;
Dierickx and Anderson, 2007; Goldberg, 2006; Sadick, 2006; Weiss et al., 2006).
Fractional photothermolysis uses a laser with a wavelength that is absorbed by aqueous
tissue and is therefore not restricted to specific target tissue. It creates a dense pattern
of epidermal and dermal microscopic wounds, but leaves the stratum corneum intact.
The tissue around these microscopic wounds remains undamaged (Geronemus, 2006;
Manstein et al., 2006).
The spectrum of treatments between stimulating and damaging the skin is wide. This
area, from non‐ablative lasers to fractional photothermolysis, is rapidly evolving and
multiple treatments are developed. The positive effect of these treatments is that they

9
Chapter 1General introduction
affect the dermis, but leave the epidermis more or less intact. However, the results of
these treatments vary from traumatizing cells up to damaging the dermis, table 1.1. As
an adverse effect of inflicting more damage to the skin, the risk of infections and scar
formation increases as well (Manstein et al., 2006; Sadick et al., 2006; Sadick, 2007;
White et al., 2007). Due to these different degrees of imposing injury to the skin, the
results of these treatments vary from no difference to reducing wrinkles (table 1.2).
The spectrum of ablative lasers, treatments that cause the most skin damage, is chosen
such that the targeted chromophore is water. The high amount of electromagnetic
energy is absorbed by water molecules in the epidermis and part of the dermis. This
conversion into heat results in vaporizing of the tissue water, leading to the ablation of
the epidermis and part of the dermis (Dierickx and Anderson, 2007; Goldberg, 2006).
Ablative lasers remove the entire epidermis and part of the dermis, creating a deep
wound and new skin is formed by the subsequent wound healing. Clinical studies have
shown that the healing process requires a long time (long ‘down time’) and that it is
hard to control, table 1.1. Therefore, the risk potential (table 1.2), the risk of developing
scars and infections, is high (Dierickx and Anderson, 2007; Goldberg, 2006). However,
the efficacy of these treatments is very good when the mentioned complications do not
occur (table 1.2).
1.5.2 Electrical techniques Monopolar conductive radio frequency generates a current that flows through the body
from a single electrode with a grounding to close the electrical circuit. Sub‐dermal
heating occurs in the area around the electrode. Bipolar conductive radio frequency
makes use of two electrodes that generate the current. However, it penetrates less deep
than the current generated with monopolar RF (Biesman, 2007; Bowler, 2007; Narurkar,
2006).
Like the non‐ablative laser, IPL and fractional photothermolysis treatments, treatments
using RF affect the dermis, without harming the epidermis. Similarly, these treatments
vary in the amount of damage they inflict to the dermis, table 1.1 (Manstein et al., 2006;
Sadick et al., 2006; Sadick, 2007; White et al., 2007). These techniques are still in
development. Therefore, the information about the efficacy of these treatments is
scarce. Supposedly, the result will vary with the amount of inflicted damage (table 1.2).
1.5.3 Mechanical techniques Microdermabrasion and dermabrasion damage the top layer of the skin, using small
crystals to respectively scrape off a part or the entire epidermis (Dierickx and Anderson,
2007; Swelstad and Gutowski, 2006). Focused ultrasound generates a focal heating point
in the dermis by mechanical forces induced by the longitudinal waves. The energy of
ultrasound can be focused in the skin at 4.5 mm to create microscopic lesions (White et
al., 2007).

10
Chapter 1
Micro‐dermabrasion only focuses on counteracting the aging signs in the epidermis. It
removes the stratum corneum, dead cells, and therefore leaves the dermis and the
viable epidermis intact, table 1.1 (Dierickx, 2007; Swelstad and Gutowski, 2006). The
efficacy of these treatments in terms of wrinkle reduction is neutral, as shown in table
1.2.
Dermabrasion, on the other hand, scrapes of the entire epidermis, creating an open
wound, table 1.1. Like the ablative laser treatments, the efficacy of dermabrasion can be
very high (table 1.2), when complications, such as infection and scar formation, do not
occur.
1.5.4 Chemical techniques Superficial and deep chemical peeling use topical formulas to remove, respectively, a
part or the entire epidermis (Swelstad and Gutowski, 2006). The depth of the peeling
depends on the chemicals that are used.
The results of the chemical techniques can be compared to those of the mechanical
techniques. Superficial chemical peelings, like micro‐dermabrasion, only counteract the
aging signs in the epidermis. As a result the efficacy is neutral, as shown in table 1.2. The
deep chemical peelings remove the entire epidermis, like dermabrasion. It also has the
same risk potential, down time and efficacy (Dierickx, 2007; Swelstad and Gutowski,
2006).
1.6 Relevant dermal proteins Collagen, elastin, and proteoglycans are, as discussed earlier, the main extracellular
matrix components of the dermal matrix. A very important aspect of skin rejuvenation is
strongly related to the synthesis of these dermal components. It is therefore necessary
to elaborate a little more on these proteins. Furthermore, heat shock proteins, as an
essential facet of the response to thermal stimuli, will be discussed.
1.6.1 Collagen Collagen represents the main fibrillar component of connective tissue and skin.
Furthermore, it provides the skin its mechanical stiffness and strength (Knott and Bailey,
2007; Smalls et al., 2006). Collagen molecules are composed of three polypeptides. The
intermolecular cross‐links provide the continuous polymeric network and give collagen
its unique properties of high tensile strength and stiffness. Collagen can be divided into
different types based the aminoacid sequence in the α‐chains (Ebling et al., 1992;
Goldberg, 2006; Lewis et al., 1994). Collagen type I and type III are the most dominant
collagen types in the skin. The adult human dermis consists for 80% of collagen type I.
This collagen type represents the bulk of newly formed fully evolved collagen seen after
ablative and most non‐ablative dermal remodeling. Approximately 10% of the adult
human dermis is type III collagen (Ebling et al., 1992; Goldberg, 2006).

11
Chapter 1General introduction
1.6.2 Collagen synthesis and remodeling Collagen consists of a hierarchical structure (figure 1.3) ranging from fibers down to a
triple helical organization. The collagen fibers are composed of fibril bundles, consisting
of hundreds of microfibrils. The microfibrils are assemblies of 5 collagen triple helices.
Rope‐like helices are formed out of three α‐chains, each containing approximately 1000
amino acids.
Figure 1.3: Formation of a collagen fiber (Lewis et al., 1994).
Variations in the amino acid content of the α‐chains result in slightly different structural
components. These distinctions evolve in the nuclei of the cells where mRNA is
transcripted from the different genes that encode for the different types of procollagen.
This specific mRNA is subsequently translated into the various amino acids. This enables
early detection of a specific type of procollagen by means of measuring gene expression.
Collagen synthesis takes place both inside the cell and subsequently in the extracellular
space (Ebling et al., 1992; Farber and Rubin, 1998; Lewis et al., 1994). Inside the cell in
the ribosomes along the Rough Endoplasmic Reticulum, RER, three peptide chains are
formed. These peptide chains, known as preprocollagen, have registration peptides on
each end. These peptide chains are sent into the lumen of the RER. Subsequently, signal
peptides are cleaved inside the RER to form procollagen chains. Hydroxylation of lysine
and proline amino acids occurs inside the lumen. This process is depends on Ascorbic
Acid (Vitamin C) as a cofactor. Glycosylation of specific hydroxylated amino acid occurs.
The triple helical structure is formed inside the RER. The triple helical formation can be
seen in figure 1.4. Procollagen is transported to the Golgi apparatus, where it is
packaged and secreted through the membrane.
Outside the cell, registration peptides are cleaved and tropocollagen is formed by
procollagen peptidase. Multiple tropocollagen molecules form collagen fibrils, and
multiple collagen fibrils form into collagen fibers. This formation is shown in figure 1.4.

12
Chapter 1
Figure 1.4: The formation of a collagen molecule (Lewis et al., 1994).
One of the assumed phenomena in skin rejuvenation is remodeling of collagen type I
(Capon and Mordon, 2006; Fitzpatrick et al., 1961; Fitzpatrick, 1988; Hantash et al.,
2007; Longo et al., 2007; Verrico and Moore, 1997). The production of collagen type I
can be quantified by measuring registration peptides of synthesis and degradation.
Characteristic for collagen type I synthesis is the cleaved registration peptide,
procollagen type I C‐peptide, released upon the formation of collagen. Carboxy‐terminal
telopeptide of type I collagen is released after cleavage of collagen type I and therefore
serves as a degradation marker (Bailey et al., 2007).
1.6.3 Elastin The physiological role of elastin is assumed to be involved in the maintenance of the skin
microstructure. Contribution to the overall mechanical stiffness of the skin is little; due
to its low relative concentration compared to collagen (4% versus 77%) and its low
mechanical stiffness (0.3 MPa versus 100‐1000 MPa) (Ebling et al., 1992). Elastin is
produced by fibroblasts in the dermis. However, starting the fourth decade of life elastic
fibers are wearing down and with a further increasing age the fibers seem to disappear
(Pasquali‐Ronchetti and Baccarani‐Contri, 1997).
1.6.4 Proteoglycans Proteoglycans consist of a core protein with one or more attached glycosaminoglycan
chain(s). These glycosaminoglycan (GAG) chains are long, linear carbohydrate polymers
that are negatively charged under physiological conditions. Proteoglycans are a major
component of the extracellular matrix. Here they form large complexes with other
proteins. Decorin, for example, binds collagen type I fibrils and plays a role in the matrix
assembly. Proteoglycans also bind cations (such as sodium, potassium and calcium) and
water, and regulate the movement of molecules through the matrix (Lewis et al., 1994;
Prydz and Dalen, 2007).

13
Chapter 1General introduction
1.6.5 Heat shock proteins Heat shock proteins, Hsps, are diverse and essential components of cell physiology.
Most of the Hsps are molecular chaperones and have a protective role. They are named
according to their molecular weight in kilo‐Daltons, ranging from 10 to 110. Their
expression can be elevated in the cells exposed to several stress factors, for example a
heat shock. They provide a working environment for correct polypeptide folding, and
perform a pivotal role not only in protein assembly but also in repair and transportation
of proteins. A thermal stimulus that is applied by non‐ablative treatments induces a
temperature increase. This activates heat shock factors, which are inactively present
under unstressed conditions, by changing the membrane composition and by unfolding
proteins. The elevated level of activated heat shock factors results in an increase in Hsp‐
gene transcription and subsequent protein synthesis (Snoeckx et al., 2007). In the
present thesis we are interested in the transcription of certain heat shock proteins.
Three heat shock proteins are of interest to use as biomarkers, namely Hsp27, Hsp47,
and Hsp70.
1.6.5.1 Heat shock protein 27 Heat shock protein 27, Hsp27, is a constitutive protein and an anti‐apoptotic molecule
that protects cells from apoptosis. Hsp27 can act both upstream of mitochondria, by
inhibiting the release of cytochrome‐c as a pro‐apoptotic factor, and downstream of
mitochondria, by preventing caspase‐3 and ‐9 activation; enzymes that play a central
role in the execution phase of a cell (Frank et al., 2004). It is phosphorylated upon stress
and associates with structural proteins, among other things in the cytoskeleton and
nucleus. There it governs re‐folding of other proteins. Heat shock mediated
denaturation of proteins was prevented by adding Hsp27 (Snoeckx et al., 2007).
1.6.5.2 Heat shock protein 47 Heat shock protein 47, Hsp47, is a constitutive protein and serves as a collagen type I‐
specific molecular chaperone. It is localized in the endoplasmic reticulum and plays an
essential role in collagen biosynthesis in skin fibroblasts by transporting procollagen
from the RER to the Golgi system. Hsp47 enables the correct three‐dimensional
conformation of procollagen chains and prevents their aggregation and precipitation
(Hirano et al., 2004; Kuroda et al., 1998; Verrico et al., 2001; Verrico and Moore, 1997).
1.6.5.3 Heat shock protein 70 Heat shock protein 70, Hsp70, is a highly inducible protein and prevents aggregation and
induces dissolution of aggregates. In response to stress, Hsp70 binds to denatured
proteins, preventing their intracellular aggregation and precipitation, whilst targeting
them for the appropriate environment for refolding or proteolysis. Hsp70 also plays a
role in suppressing apoptosis of cells (Bonelli et al., 1999; Marshall and Kind, 2007;
Ohtsuka and Laszlo, 2007; Snoeckx et al., 2007).

14
Chapter 1
1.7 Aim and outline Many skin rejuvenation techniques have been developed. A thorough understanding in
the physiological changes in the skin as a result of the treatment is still lacking. In the
present thesis we focus on the non‐ablative treatments that generate heat in the
dermis. Particularly, non‐ablative laser techniques, because they have the ability to
selectively heat the dermis.
The goal of the present thesis is to study the effect of heat pulses on fibroblasts, in
particular collagen type I synthesis. The work is focused on the question whether or not
collagen production in cultured cells and in ex‐vivo skin can be stimulated by the
generation of heat and which conditions are optimal for this purpose.
First we investigated the heat distribution caused by laser irradiation in skin, using a skin
model. This includes a simulation model to determine the photon distribution combined
with a heat transfer model to calculate the generated heat (chapter 2). This is important
as it provides laser parameters and an estimation of the exposure time to heat shock
cultured cells. Subsequently, the pulse duration from the model is used to study the
effect of 45⁰C and 60⁰C heat shock on human dermal fibroblasts (chapter 3). Differences
in collagen and heat shock proteins are quantified with time at gene expression level. In
addition, the secretion of collagen synthesis and degradation markers is investigated as
a function of time. The cell study continues with investigating the effect of different
exposure times of the heat shocks of 45⁰C and 60⁰C on the collagen amount together
with the heat shock protein gene expression levels of cultured human dermal fibroblasts
(chapter 4). The outcome reveals different responses of the cultured cells between 45⁰C
and 60⁰C heat shocks. Therefore, the effect of similar thermal stimuli on the gene
expressions of collagen and heat shock proteins of dermal fibroblasts in human ex‐vivo
skin was studied by immersing the skin samples in heated phosphate buffered saline
(chapter 5). Furthermore, to complete this thesis the effect of laser irradiation, with
parameter setting acquired in chapter 2, on the gene expressions of collagen and heat
shock proteins of dermal fibroblasts in human ex‐vivo skin samples is investigated
(chapter 6). To conclude this thesis, chapter 7 presents a general discussion based on
the findings of the presented studies.

Chapter 2 Modeling and simulation of the heat
distribution in human skin caused by laser irradiation
Abstract With increasing age the characteristics of the human skin change and its appearance becomes
different resulting in wrinkling and sagging of the skin. Treatment of aging skin with light based
devices is a rapidly evolving area. Characteristic temperatures that are reached within the skin
by non‐ablative therapy are in the range of 45⁰C and 60⁰C. To study the interaction of a laser
with ex‐vivo skin a model system is developed. This paper presents a model combining Monte
Carlo simulation to determine the distribution of heat generated by the photons from the laser
with a finite element analysis to solve the transport of heat equation through skin. The end
result is a temperature distribution as function of time and position in the skin. The model is
used to determine which spectrum, power, and beam diameter are needed to heat the dermis
of a human ex‐vivo skin sample to 45⁰C and 60⁰C, with as little heat generation in the epidermis
as possible. Additionally, a preliminary ex‐vivo skin study with the calculated laser parameters is
performed for validation. We show with this model that a 976 laser with 1 W and a beam
diameter of 4 mm are the best settings for this study. Additionally, we demonstrate that it
requires approximately 8 and 23 seconds to achieve 45⁰C and 60⁰C, respectively, with this kind
of laser.
This chapter is based on S.D. Dams, Y. Luan, A.M. Nuijs, C.W.J. Oomens, F.P.T. Baaijens.
Modeling and simulation of heat distribution in human skin caused by laser irradiation.
(submitted)

16
Chapter 2
2.1 Introduction The skin is a complex heterogeneous medium, where the proteins, blood and cells are
spatially distributed in different layers. The skin comprises three layers: epidermis,
dermis and hypodermis. The epidermis can be subdivided into two sub‐layers: the non‐
living epidermis, stratum corneum, and the living epidermis. The stratum corneum, with
a thickness of 10 ‐ 20 µm, only consists of dead squamous cells, with relatively low water
content. The living epidermis, approximately 50 ‐ 150 µm in thickness, contains most of
the skin pigmentation, melanin, which is produced in melanocytes. It is composed of
four layers: stratum basale, stratum spinosum, stratum granulosum and stratum lucidum
(Ebling et al., 1992; Humbert and Agache, 2004). The dermis is a vascular layer with a
thickness of 0.3 ‐ 3 mm. Based on the distribution of blood vessels, the dermis can be
subdivided into four layers (Bashkatov et al., 2005; Humbert and Agache, 2004): the
papillary dermis with a thickness of about 150 µm, the upper blood net plexus which is
100 µm thick, the reticular dermis of approximately 1‐ 4 mm in thickness and the deep
blood net plexus with a thickness of 100µm. The hypodermis is a subcutaneous adipose
tissue of up to 3 cm in thickness in the abdomen (Bashkatov et al., 2005; Ebling et al.,
1992; Humbert and Agache, 2004). It is formed by an aggregation of fat cells containing
stored lipids in the form of a number of small droplets. There are capillaries and nerves
among the fat cells that provide for the metabolic activity of the fat tissue (Ebling et al.,
1992; Lewis et al., 1994).
With increasing age the characteristics of the skin change and its appearance becomes
different (Dimri et al., 2007). Visible changes are wrinkling and laxity (Bjerring, 2006;
Diridollou et al., 2007; Gilchrest, 2007a; Gilchrest, 2007b; Gilchrest and Bohr, 2006;
Leveque et al., 2007a; Swelstad and Gutowski, 2006). The causes of these changes can
be attributed to two important alterations occurring in the dermal layer of the skin.
Firstly, the ability decreases for fibroblasts to proliferate, resulting in less synthesis of
dermal components. This causes thinning of the dermis. This leads to an increased
susceptibility to damage. Secondly, the elastin and collagen fibers become more
susceptible to damage, which leads to loosening and unraveling of the underlying
network, resulting in wrinkling and sagging of the skin (Gilchrest, 2007b; Kurban and
Bhawan, 2007; Leveque et al., 2007b).
Treatment of aging skin with different rejuvenation methods is a fast developing area.
Among these methods, laser‐based cosmetic surgery is evolving most rapidly. The
underlying mechanism is the thermal effect of photon skin interaction in response to
visible and near‐infrared laser light. This effect can lead to thermal damage. The extent
of this thermal injury of the tissue is governed by the heat deposition caused by the
photon absorption in the skin and its subsequent heat radiation with its temperature
dependent reactions (Welch et al., 1989b; Welch et al., 1991).

17
Chapter 2Modeling and simulation of the heat distribution in human skin caused by laser irradiation
Ablative laser cosmetic surgery vaporizes the top layer of the skin and the skin upon
healing reveals a fresh new surface layer. Since the targeted chromophore is water, the
CO2 laser or Er:YAG laser is commonly used, because of its relatively strong absorption
by water in the far‐infrared wavelength range (Eze and Kumar, 2010). The process of
recovery is slow, because the keratinocytes and fibroblasts from the healthy part of the
skin have to migrate to append for healing. Moreover, side effects of this method
include edema, infection, pigmentary changes, and scarring (Pearlman, 2006). In
contrast, the absence of epidermal damage in non‐ablative dermal remodeling results in
a decreased recovery time. The results of non‐ablative laser treatments vary, as a
consequence of the different settings in temperature and exposure time, from damaging
to mildly traumatizing the skin. Hereby, the dermal tissue is selectively damaged or
traumatized, leaving the skin surface intact (Eze and Kumar, 2010). This is achieved by
using appropriate laser irradiation parameters: spectrum, energy density, pulse
duration, spot size and spatial profile, as well as cooling of the epidermis during
irradiation (Capon and Mordon, 2006; Laubach et al., 2006; Weiss et al., 2006).
It is believed that the thermal trauma that is induced denatures dermal collagen and
stimulates collagen synthesis to promote the healing response (Capon and Mordon,
2006; Laubach et al., 2006; Narurkar, 2006; Weiss et al., 2006). The result is skin
thickening and tightening. Typical lasers that are used for non‐ablative rejuvenation are
the 532 nm pulsed‐dye lasers and lasers that emit in the 676 – 1540 nm region where
absorption by water is not so strong. These types of lasers include Q‐switched 1064nm
Nd:YAG lasers, 976nm diode lasers, 1320nm long‐pulsed Nd:YAG lasers, 1540nm
Er:Glass lasers and 1440nm diode lasers (Narurkar, 2006; Pearlman, 2006).
In the present study, we focus on the heating process in the dermis by non‐ablative laser
treatments that do not cause damage to the skin. Characteristic temperatures that are
reached within the skin are 45⁰C, which is a typical temperature used in photodynamic
therapy (Capon and Mordon, 2006; Verrico et al., 2001; Verrico and Moore, 1997), and
60⁰C , which is known to induce denaturation of collagen. However, the amount of
collagen contraction is determined by a combination of time and temperature (Ruiz‐
Esparza, 2006).
The characteristics of photon propagation include absorption and scattering events
within skin tissue, reflection and transmission at boundaries. Photons can be absorbed
by chromophores (e.g. melanin in the epidermis, hemoglobin and water in the dermis)
that convert the energy into heat, which diffuses into the skin (Atiyeh and Dibo, 2009;
Capon and Mordon, 2006; Sadick, 2006). These chromophores have different absorption
spectra, resulting in absorption of photons of different wavelengths.
The epidermis propagates and absorbs light. The absorption of photons depends on the
wavelength of the laser. Photons are absorbed in the epidermis by natural
chromophores, such as water and melanin, mainly produced in the stratum basale. The

18
Chapter 2
melanin absorption level depends on the volume fraction of the melanin content,
varying from 1.3% (skin type I) to 43% (skin type VI) (Bashkatov et al., 2005; Troy and
Thennadil, 2001; van Gemert et al., 1989). For the dermis, in the visible spectral range,
the main chromophore is hemoglobin (Troy and Thennadil, 2001). Absorption by
hemoglobin is defined by the haemoglobin oxygen saturation, because oxy‐ and de‐oxy
hemoglobin have slightly different absorption spectra. In the IR spectral range
absorption properties of the dermis are determined by the water absorption. The
hypodermis is characterized by a negligible absorption of light and most light reaching
this layer is scattered back to the upper layer (Humbert and Agache, 2004; van Gemert
et al., 1989). In general, the absorption properties of the entire skin are defined by the
hemoglobin and water content in the dermis and the melanin density in the epidermis.
Another important phenomenon is scattering, where the direction of photon
propagation is changed, especially in the visible and near‐IR wavelength range (400nm‐
1200nm) (Bashkatov et al., 2005). The scattering property of human skin can be divided
into two parts: surface scattering and subsurface scattering (Welch et al., 1989a; Welch
et al., 1989b). Surface scattering is caused by the folds in the stratum corneum and is
described by Fresnel equations (van Gemert et al., 1989; Welch et al., 1989b). About 5‐
7% of the light incident on the stratum corneum is reflected at the surface (Bashkatov et
al., 2005; Humbert and Agache, 2004; Troy and Thennadil, 2001; van Gemert et al.,
1989). The remaining portion of the light is transmitted further into the tissue. The skin
is characterized as a forward scattering media (Humbert and Agache, 2004; Troy and
Thennadil, 2001). Two types of subsurface scattering occur within the skin layers, which
can be described for particles larger than the wavelength of light, Mie scattering, and for
particles much smaller than the wavelength of light, Rayleigh scattering (Welch and van
Gemert, 1995). In the dermis, the scattering properties of the skin are defined by the
scattering properties of the reticular dermis (Groff et al., 2008; Humbert and Agache,
2004; Sturesson and Andersson‐Engels, 1995; Troy and Thennadil, 2001). Collagen fibers
(cylindrical with about 2.8 µm in diameter) lead to Mie scattering, while micro‐structures
are responsible for Rayleigh scattering (Groff et al., 2008; Humbert and Agache, 2004).
Light is scattered multiple times inside the dermis before it is either transmitted to
another layer or absorbed.
An exact evaluation of light propagation and the subsequent heat distribution in tissue
requires a model that characterizes the tissue structure and optical properties. The skin
can be considered to be a multi‐layered structure, with each layer assumed to be
isotropic and homogeneous. Several methods for constructing a well‐designed model
have been reported in literature (Eze and Kumar, 2010; Sturesson and Andersson‐Engels,
1995; van Gemert et al., 1989). Gamborg et al. used a CCD camera to measure energy
storage, and analyzed the heat transfer using FEMLAB (Gamborg Andersen et al., 2010).
Crochet et al. applied the Monte Carlo method to simulate heat generation in skin, while
using a finite difference method for the heat diffusion process (Crochet et al., 2006).

19
Chapter 2Modeling and simulation of the heat distribution in human skin caused by laser irradiation
This paper presents a model combining Monte Carlo simulation with finite element
analysis to describe the heat and temperature distribution in ex‐vivo skin, caused by
laser irradiation, as a function of the position and time. The model is used to predict the
desired spectrum, power, and beam diameter needed to heat the dermis of the skin to
45⁰C and 60⁰C, without compromising the epidermis. Preliminary ex‐vivo skin studies
with calculated laser settings are used as an initial validation of the model.
2.2 Methods
2.2.1 Parameter study We consider the skin to be a two‐layered structure distinguishing between the
epidermis and the dermis. The epidermis is considered to be 0.05 mm thick and the
dermis 0.95 mm in thickness. The size and shape of the model is defined according to
our ex‐vivo validation experiments, where the size of the skin sample is 1.0 mm in
height, 1.0 cm in width and 4.0 cm in length.
2.2.2 Monte Carlo simulation The Monte Carlo method for laser‐tissue interaction is used in this simulation. A package
of photons is launched and reaches the skin surface. This photon package is given a
weight, W, which is equal to 1. It propagates to an interaction site with a certain step
size with a rotation angle and a deflection angle, assuming all particles behave similarly.
At each interaction site the package deposits a portion of its energy to the site,
determined by the tissue optical properties. The energy that is transferred to the
interaction site is determined by the weight that the photon package deposits. The
change of weight is defined as (Crochet et al., 2006; van Gemert et al., 1989; Welch and
van Gemert, 1995):
∆ (2.1)
Where µa is the absorption coefficient and µs is the scattering coefficient. The action of
the photon package will be terminated when the value of ∆W is below a defined
threshold. In this simulation the photon package was terminated when one hundredth
of its original weight was left after its interactions with the surrounding media. The value
is chosen arbitrarily in such a way that efficiency and accuracy are optimal. A new
photon package is launched after this termination process and the procedure is
repeated. When the simulation is completed for a sufficient number of photon packages
(typically 106 packages), an absorption power density matrix is generated for the given
tissue configuration. This matrix corresponds to the amount of laser power that is
absorbed by the area in the form of power density (Crochet et al., 2006; Welch and
Gardner, 1997; Welch and van Gemert, 1995). The multiplication of the photon
absorption probability density with the laser power results in the total power that is
absorbed in the area (Crochet et al., 2006; van Gemert et al., 1989; Welch et al., 1989a).

20
Chapter 2
The absorbed power at each location can be used as the heat source for the thermal
diffusion process.
2.2.3 Finite element analysis For the calculation of the thermal diffusion process in the skin sample a finite element
analysis was performed, using Matlab (R2008b, The MathWorks BV, Eindhoven, The
Netherlands) together with Comsol (Multiphysics 3.5, Zoetermeer, The Netherlands).
The diffusion equation with constant thermal properties and steady heat generation can
be used for laser tissue interactions (van Gemert et al., 1989; Welch et al., 1989a):
· (2.2)
Where q is the heat generation rate inside the region (the energy density per unit time),
T is the temperature, k is the thermal conductivity of the tissue, ρ is the density, and Cp
represents the specific heat. Since the temperature increase is not sufficiently large,
constant thermal properties may be assumed. The heat generation rate is calculated as
(Crochet et al., 2006; Welch et al., 1989a):
(2.3)
Where the photon absorption probability, Pabs, represents the portion of the photon
energy deposited in a unit volume. These data are obtained through the Monte Carlo
simulation. Plaser is the laser power. From these equations the temperature increase as a
function of position and time can be calculated.
Table 2.1: Skin optical properties determined at 37⁰C used for Monte Carlo simulation input
(Bashkatov et al., 2005; Groff et al., 2008; Troy and Thennadil, 2001; van Gemert et al., 1989;
Welch and van Gemert, 1995).
Wavelength [nm] Absorption
coefficient, µa [cm‐1]
Scattering coefficient,
µs [cm‐1]
Refractive index, n
532 1.28 322.57 1.38
635 0.6 247.31 1.38
976 0.38 174 1.38
1064 0.25 167.63 1.38
Based on the literature we have tested four different wavelengths, as depicted in table
2.1. These wavelengths were chosen, because they are absorbed by different and the
most important chromphores in the skin (table 2.2). The requirements on the
wavelengths were such that laser irradiation allows:
1. Homogeneous heating of the skin in the longitudinal direction; Tepidermis Tdermis .
2. The homogeneously heated area should be as large as possible.

21
Chapter 2Modeling and simulation of the heat distribution in human skin caused by laser irradiation
3. Appropriate heating efficiency to achieve 45⁰C as well as 60⁰C. Time to reach
Tdesired should be short.
Table 2.2: The different wavelengths and matching chromophores (P.Bjerring et al., 2006;
R.R.Anderson and J.A.Parrish, 2007).
Wavelength
[nm]
Chromophores
Melanin Hemoglobin Oxy‐Hemoglobin Water
532
635
976 1064
2.2.4 Simulation procedure A finite element analysis was performed using the heat generation rate obtained
through Monte Carlo simulations followed by data processing in Matlab. The outcome
was visualized in terms of heat and temperature distribution in time and space. Figure
2.1 shows the flow of the entire simulation process.
Since the source of the energy is the laser, the beam properties must be taken into
consideration. Different parameter sets were tested. The laser beam was considered to
have a top‐hat distribution in all simulations. This flat incident beam is constructed of
multiple concentric rings, where each ring has an equally weighted number of photons.
The result is an isotropic incident beam. The desired radius can be achieved by adjusting
the number of rings. A total of 106 photon packages were used in each of the
simulations in this study. Tables 2.1 and 2.3 contain the optical and thermal properties
of human skin, respectively. The laser beam parameters, resulting from the parameter
study and the configuration as used in the final simulation are depicted in table 2.4. The
size of the geometry is based on the stretched ex‐vivo skin sample.
Table 2.3: Skin thermal properties used for finite element analyses (Bashkatov et al., 2005; Groff
et al., 2008; Troy and Thennadil, 2001; van Gemert et al., 1989; Welch and van Gemert, 1995).
Tissue Density, ρ
[kg/m3]
Thermal
conductivity, k
[W/(m*K)]
Specific heat,
Cp [J/(kg*K)]
Initial
temperature
[⁰C]
Epidermis 1200 0.24 3590 37
Dermis 1200 0.45 3300 37

22
Chapter 2
Table 2.4: Input parameters of experimental conditions.
Wavelength [nm]
x‐
range
[μm]
y‐
range
[μm]
Sample
thickness
[μm]
Beam Laser
power
[W]
Number
of
photons
type radius
[mm]
976 10000 20000 1000 Top‐
hat
2 1 106
Using the finite element analysis, the temperature increase as a function of space and
time is obtained. This heat generation is taken to be constant throughout the irradiation
process. The energy transport is governed by the thermal properties of the area as given
in table 2.3 (Welch and van Gemert, 1995).
2.2.5 Validation of the model
2.2.5.1 Experimental setup All validation experiments were performed using a laser irradiation system that has been
built with settings according to the outcome of the simulations. Figure 2.2 shows the
experimental setup. The laser, a 976 nm laser diode (Sheaumann, Marlborough, USA) is
connected to the computer through a laser driver (VueMetrix, Sunnyvale, USA) with
compatible software installed. The laser is attached to the cooling system (Laser2000,
Vinkeveen, The Netherlands) with a thermal insulation layer in between to cool the laser
Figure 2.1: Architecture of the model (Crochet et al., 2006).

23
Chapter 2Modeling and simulation of the heat distribution in human skin caused by laser irradiation
diode during the experiments. A power meter (Melles Griot, Didam, The Netherlands) is
used to calibrate the power on the surface of skin sample before experiments. The skin
sample is exposed to the laser diode, and the dynamic temperature is measured using a
thermocouple (VoltCraft, Oldenzaal, The Netherlands) and an infrared camera (FLIR,
Berchem, Belgium).
2.2.5.2 Beam profile measurement The intensity distribution of laser beam is measured by moving the spot with a
translational stage over the fixed power meter. The sensor of the power meter is
covered by a 200 μm pinhole. The measurements are performed every 0.5 mm in x and y
direction. Figure 2.3 shows the uniform spot intensity of a top‐hat distributed laser
beam.
Figure 2.2: The experimental setup as used in the validation experiments. (a) A close‐up of thelaser driver, cooler and a 976 nm laser diode placed in a holder fixed and lined out with acollimated objective attached. (b) Schematic representation laser set up with infrared camera.(c) The setup in total with heating plate and control device.

24
Chapter 2
Calibration of the laser was carried out to determine the relation between the applied
current through the laser and the emitted power. The power meter is used for this
calibration.
2.2.6 Preparation of skin samples Ex‐vivo human skin was obtained from the Catharina Hospital in Eindhoven. This
material was anonymized after the procedure, making tracing back to the patient
impossible. The procedure was in conformity with the code of conduct for use of human
material as stated by the Dutch Federation of Biomedical Scientific Societies. Sample
preparation was carried out within 3 hours after harvesting of the tissue. The skin was
stretched in order to cut slices of 1 mm thickness with a dermatome (Humeca,
Enschede, The Netherlands). To ensure the accuracy of measurement, we chose
4cm×1cm×1mm skin samples. Samples were placed in a small amount of culture
medium at 37 ⁰C during the experiments.
2.2.7 Experimental procedure The thermocouple probe was fixed on a 37⁰C heating plate (Leica, Meppel, The
Netherlands) in the middle of the beam. An infrared camera was adjusted to the same
height as the skin sample to obtain a lateral view (figure 2.2(b)). The infrared camera
automatically took images at a frequency of 0.2 Hz. The camera resolution is 320240 pixels. The images from the infrared camera were used for further analyses.
Figure 2.3: Results of the beam profile measurement of the 976 nm laser diode. The x‐axisdepicts the width of the collimated laser beam; the y‐axis shows the measured power. (a) Showsthe beam profile in x‐direction and (b) shows the beam profile in y‐direction.

25
Chapter 2Modeling and simulation of the heat distribution in human skin caused by laser irradiation
2.3 Results
2.3.1 Heat distribution modeling
2.3.1.1 Parametric study As shown in table 2.5, lasers with wavelengths of 635 nm and 1064 nm need
substantially more time to heat the skin samples compared to the lasers with
wavelengths of 532 nm and 976 nm. The wavelength of 976 nm minimally heats the
epidermis and heats the dermis to the required temperatures in the shortest amount of
time. At this wavelength, it takes 7.9 seconds and 26 seconds for the dermis to reach the
desired temperature of 45⁰C and 60⁰C, respectively. As can be noticed at the
wavelength of 532 nm these temperatures are achieved in a shorter time, 7.5 and 20
seconds, respectively. However, it only takes 5.5 and 16 seconds to achieve those
temperatures in the epidermis, meaning that this layer will continue to heat up for 2 and
4 seconds, respectively. The difference in heating time between the epidermis and
dermis should be in a similar time period; otherwise the epidermis will become too hot.
At 976 nm wavelength this additional heating time is only 1.0 seconds for both 45⁰C and
60⁰C. Therefore, it can be said that the 976 nm wavelength fits our requirements best.
Table 2.5: Results parameter study to determine wavelength, P = 1 W and = 4 mm.
Wavelength
[nm]
Desired
temperature
[⁰C]
Laser
irradiation time
epidermis [s]
Laser
irradiation time
dermis [s]
∆t [s]
532 45 5.5 7.5 2
60 16 20 4
635 45 70 80 10
60 180 200 20
976 45 6.9 7.9 1.0
60 25.0 26.0 1.0
1064 45 11.7 13.8 2.1
60 40 45 5
To determine the laser power and beam diameter we tested different power settings,
0.1 and 1 W, and a variety of beam diameters, 1, 2 and 4 mm. For practical applications,
the heated area should be large enough to be able to visualize it. The results are show in
table 2.6. It can be seen that, to achieve an as large as possible area that is
homogeneously heated in the longitudinal direction, the power should be 1 W and the
beam diameter 4 mm.

26
Chapter 2
Table 2.6: Results parameter study to determine beam diameter and power. Time to heat
epidermis and dermis, respectively, at 1mm and 0 mm correspond to the positions in the inset in
figure 2.4.
Power
[W]
Diameter
[mm]
Tdesired
[⁰C]
Time to heat
epidermis (1 mm)
[s]
Time to heat
dermis (0 mm) [s]
Δt [s]
0.1 1 45 18.3 21.9 3.6
60 70.8 74.6 3.8
2 45 31.7 34.6 2.9
60 149.7 152.7 3
4 45 45.5 47.6 2.1
60 228.7 230.7 2
1 1 45 0.4 1.8 1.4
60 2.3 3.7 1.4
2 45 1.3 1.9 0.6
60 4.9 5.6 0.7
4 45 6.9 7.9 1
60 25 26 1
2.3.1.2 Temperature distribution in skin The test conditions relate to the in‐vitro situation of the ex‐vivo skin experiments, where
prior to laser irradiation the sample was placed at 37⁰C. The simulations were run using
the selected laser with the determined laser parameters; a wavelength of 976 nm, 4 mm
in diameter and a power of 1 W. The temperature to cool down to was set at 37⁰C. The
boundary conditions, temperature, T, and heat flux, φ, were set to 37⁰C and 5 W/(m2K)
(Kim and Guo, 2007; Sturesson and Andersson‐Engels, 1995; Welch and van Gemert,
1995).

27
Chapter 2Modeling and simulation of the heat distribution in human skin caused by laser irradiation
Figure 2.4: Visualization of the temperature change, along the symmetry axis of the sample from
0 mm to 1 mm (indicated in the inset), of the heating and cooling process by the 976 nm laser
diode with a beam diameter of 4 mm and a power of 1 W. The x‐axis depicts the time in seconds
and the y‐axis the temperature in degrees Celsius. The corresponding values are depicted in the
tables below. (a) Heating to 45⁰C and cooling process. (b) Heating to 60⁰C and cooling process.
Figure 2.4 depicts the results of the simulations. The heat distribution in the center of
the skin sample along the longitudinal axis is shown. In figure 2.4 (a) the heating process
of the skin to 45⁰C and its subsequent cooling is shown. The irradiation of the skin
sample heated to 60⁰C and its recovery of the dermis to 37⁰C is demonstrated in figure
2.4 (b). It takes roughly 8 seconds to heat the the dermis to 45⁰C. To achieve 60⁰C at in
the dermis, it needs to be exposed to the laser for approximately 23 seconds.
2.3.2 Validation skin model Prior to the validation experiments on ex‐vivo human skin the experimental setup was
calibrated to the acquired settings from the simulation.
2.3.2.1 Heat distribution validation The temperature changes caused by the laser irradiation are visualized with the infrared
camera as shown in figure 2.5 (b) next to the visualization of the simulation results in
figure 2.5 (a). The lateral view in figure 2.5 (b) shows the 37⁰C heating plate on the
bottom and the skin sample on top. The relatively cooler area between the heating plate
and the ex‐vivo skin sample can subscribed to the lateral view. The skin sample was
placed close to the border of the heating plate. However, the uncovered part of the
cooling plate is in contact with room temperature (approximately 20⁰C).

28
Chapter 2
Figure 2.5: The simulation and experimental visualization of the heating process to 60⁰C. (a) The
heat distribution as calculated by the simulation at t = 25 [s]. (b) The heat distribution after 29 ±
3 [s] laser irradiation by the 976 nm laser diode, diameter 4 mm and with a power 1 W.
A linear regression analysis was performed to determine the temperatures of 45⁰C and
60⁰C at the bottom of the skin samples. Mean values of 9 ± 2 seconds and 29 ± 4
seconds, respectively, were calculated (table 2.7).
Table 2.7: Results 976 nm diode laser, 4mm diameter, 1 W.
Time to reach 45⁰C in the
dermis [s]
Time to reach 60⁰C in the
dermis [s]
Simulation 8.4 22.8
Infrared camera 9 ± 2 29 ± 4
2.4 Discussion In this study a mathematical model was developed to predict the temperature field in
human skin under laser irradiation. It combines a Monte Carlo simulation with finite
element analysis to model transport of heat through the skin. The model was validated
by means of experiments with ex‐vivo human skin samples. A parametric study revealed
the optimal laser wavelength of 976 nm for heating the skin to 45⁰C and 60⁰C.
The model was developed for a parametric study to obtain the best wavelength, beam
diameter and power to achieve temperatures of 45⁰C and 60⁰C in human skin. These
temperatures are chosen, because of their relevance in rejuvenating skin treatments.
The temperature of 45⁰C was preferred because it is often applied in photodynamic
therapy (Capon and Mordon, 2006), and 60⁰C was selected because this temperature is
characteristic for protein denaturation (Ebling et al., 1992; Farber and Rubin, 1998;
Mitchell et al., 1999). The different wavelengths for initial testing (table 2.1) are based
on lasers that are currently used for skin treatment. The simulations showed that the
976 nm laser matched our requirements of longitudinal homogeneous heating and a
relatively short time span to reach the desired temperatures of 45⁰C and 60⁰C.

29
Chapter 2Modeling and simulation of the heat distribution in human skin caused by laser irradiation
Additionally, we further optimized the parameters power and beam diameter at this
wavelength. It suggested that the optimal power is 1 W and the most adequate beam
diameter is 4 mm.
In our simulations of the in‐vivo situation it is shown that the temperatures of 45⁰C and
60⁰C are reached in 8.4 and 22.6 seconds, respectively (figure 2.4). Since the
temperature at the epidermis is approximately 1⁰C higher than 1 mm into the dermis in
the center of the laser beam, we also consider the skin sample to be nearly
homogeneously heated in the longitudinal direction.
In our simulation the parameters are wavelength‐dependent. However, they should also
be temperature‐dependent, because the optical parameters change with temperature
of skin samples under laser irradiation (Anderson and Parrish, 2007; Tuchin et al., 2010;
van Gemert et al., 1989; Welch and van Gemert, 1995). The scattering coefficient
becomes higher when the temperature in the skin increases. This increase occurs
because of denaturation of proteins in the dermis that change the structure of the
dermal matrix into a denser configuration (Anderson and Parrish, 2007; Welch and van
Gemert, 1995). However, our parametric studies showed that a temperature‐dependent
scattering coefficient in the heating process to 45⁰C or 60⁰C did not cause different heat
distributions.
Also the anisotropy and refractive index depend on the structure of the dermis. The
absorption coefficient, on the other hand, depends on the amount of water available in
the skin. When the skin temperature rises, water starts to evaporate, resulting in a
decreased absorption coefficient.
The results of the validation experiments of the heating process to 60⁰C showed a
reasonable correlation with the simulated results (figure 2.5). The temperature of the
skin sample was visualized with an infrared camera. An average of 6 images showed that
60⁰C was reached within 29 ± 4 seconds. This time span is in reasonable agreement with
25 seconds in the simulation. However, it should be taken into account that more
extensive validation is necessary.
The main goal in non‐ablative skin rejuvenation is to selectively heat the dermis without
damage in the epidermal layer. The results obtained in this study demonstrate the
feasibility of such a treatment regimen and the method developed in this study can be
used effectively to guide these or similar treatment procedures. Furthermore, this skin
model could in time provide a tool to predict the temperature distribution in the skin of
each patient with its unique skin properties.

30
Chapter 2
Chapter 3 The effect of pulsed heat shocks on collagen
type I expression in human dermal fibroblasts
Abstract The formation of wrinkles is associated with degeneration of the collagen matrix. For
regeneration of the matrix, fibroblasts need to be stimulated in producing new collagen. In this
study, the effect of short pulsed heat shocks on gene expression of procollagen type I,
procollagen type III, hsp27, hsp47, and hsp70 and on expression of remodeling markers, P1P and
ICTP, of human dermal fibroblasts in vitro, is investigated. Temperatures of 45⁰C and 60⁰C were
used for the heat shocks. Proliferation rates, viability and metabolic activity were measured
directly after the pulsed heat shocks and quantitative PCR was performed at five different time
points after the heat shocks. Enzyme Immuno Assays were performed to determine the
concentrations of P1P and ICTP. Results showed a decreased proliferation rate of the 60⁰C heat
shocked cells, whereas the viability and metabolic activity did not differ. Furthermore, gene
expressions were upregulated in both 45⁰C and 60⁰C heat shocked cells. However, remodeling
marker analyses showed a larger amount of collagen produced by 60⁰C heat shocked cells. It can
be concluded that these findings together with upregulation in gene expression show that it is
possible to stimulate the cells to produce more collagen with short pulsed heat shocks.
The content of this chapter is based on: S.D. Dams, M.de Liefde‐van Beest , A.M. Nuijs ,
C.W.J. Oomens, F.P.T. Baaijens. Pulsed heat shocks enhance procollagen type I and
procollagen type III expression in human dermal fibroblasts.Skin Res. and Techn., 16(3):
354‐364, 2010.

32
Chapter 3
3.1 Introduction The skin is the largest organ of the human body. Like other organs it has the ability to
grow, develop and repair itself. Roughly, the skin can be divided into three layers; the
epidermis, dermis and hypodermis. The epidermis is 50‐150 µm thick, depending on the
part of the body and skin type (Lewis et al., 1994). It consists of a multilayered sheet of
keratin synthesizing cells, keratinocytes, located immediately on top of the dermis
(Farber and Rubin, 1998; Humbert and Agache, 2004; Lewis et al., 1994; Mitchell et al.,
1999). Beneath the epidermis, the dermis is located with a varying thickness of 300 µm
on the eyelids to 3 mm on the back (Ebling et al., 1992). The main component of the
dermis is the supporting extracellular matrix, consisting of complexes of supportive
proteins, such as collagen, elastin and proteoglycans, synthesized by dermal fibroblasts
(Ebling et al., 1992; Geronemus, 2006). The dermis can be divided into the papillary
dermis, situated directly under the epidermis, and the reticular dermis, located between
the papillary dermis and the hypodermis (Farber and Rubin, 1998). The hypodermis
insulates the body and plays an important role in wound healing and immune response
(Ebling et al., 1992). This subcutaneous layer is the deepest layer of the skin and is
composed primarily of fat cells.
As well as any other organ of the human body the skin ages. With increasing age the
characteristics of the skin change and its appearance becomes different (Dimri et al.,
2007). Visible changes are roughness (dryness), wrinkling, laxity, and uneven
pigmentation (Bjerring, 2006; Diridollou et al., 2007; Gilchrest et al., 2007; Gilchrest,
2007b; Gilchrest and Bohr, 2006; Leveque et al., 2007a). These features are due to two
important alterations that occur in the different layers of the skin. In this study we focus
on changes in the dermal layer; wrinkling and laxity. Firstly, the fibroblasts divide more
slowly and the dermis becomes thinner, thereby having an increased susceptibility to
damage. Secondly, the underlying network of elastin and collagen fibers loosens and
unravels, resulting in wrinkling and sagging of the skin (Gilchrest, 2007a; Kurban and
Bhawan, 2007). The aging process can be divided into intrinsic aging, changes in e.g.
dermal components like collagen, elastic fibers, proteoglycans and fibroblasts, and
extrinsic aging, which is caused by external factors e.g. damage by UV‐radiation (Ebling
et al., 1992; Geronemus, 2006; Gilchrest, 2007c; Gilchrest, 2007d).
Rejuvenation of the skin aims at reversing the intrinsic and extrinsic causes of skin aging
at both levels of the epidermis and the dermis. Among the rejuvenation methods used,
non‐ablative techniques are gaining popularity: in contrast to ablative techniques, that
ablate the entire epidermis, these non‐ablative methods claim to induce dermal
remodeling without obvious epidermal injury, using a thermal approach. Light sources,
like lasers and broad band lamps, radio frequency and ultrasound are techniques that
can be used as non‐ablative rejuvenation methods. The energy is applied as short
nanosecond to millisecond pulses, or in a continuous wave resulting in a local

33
Chapter 3The effect of pulsed heat shocks on collagen type I expression in human dermal fibroblasts
temperature increase (Bjerring, 2006; Capon and Mordon, 2006; Geronemus, 2006;
Sadick, 2006).
It has been hypothesized that the generation of heat would cause collagen injury and
contraction (Ebling et al., 1992; Geronemus, 2006; Gilchrest, 2007c; Sadick, 2006).
Subsequently, this thermal injury could lead to a wound healing response (Goldberg,
2006; Sadick, 2006), where first collagen type III is synthesized and subsequently is
substituted by collagen type I to approach the ratio of normal young skin (Capon and
Mordon, 2006; Stadelmann et al., 2006). Another study suggests that dermal fibroblasts
react to thermal injury with a heat shock response. This reaction of fibroblasts to the
heat shocks results in the synthesis of heat shock proteins to protect themselves and
their protein network (Bjerring et al., 2007). Relevant heat shock proteins for skin
regeneration are
hsp70; a highly inducible protein that is overproduced when a cell encounters a
rapid increase of temperature (Bowers et al., 2007; Kovalchin et al., 2006;
Marshall and Kind, 2007; Ohtsuka and Laszlo, 2007; Snoeckx et al., 2007; Souil et
al., 2001),
hsp47; a constitutive protein that binds and transports procollagen from
endoplasmic reticulum to the Golgi system and plays an active role in collagen
type I synthesis (Naitoh et al., 2001; Tasab et al., 2000; Verrico et al., 2001;
Verrico and Moore, 1997), and
hsp27; a constitutive protein that in case of overexpression protects the cell
from apoptosis, resulting from a heat shock (Frank et al., 2004; Hirano et al.,
2004; Snoeckx et al., 2007).
However, little physiological evidence of the heat shock response theory can be found in
literature. Nevertheless, several studies have investigated the response of dermal
fibroblasts to repeated mild heat shocks (RMHS). Their results showed that repeated
mild (39⁰C ‐ 42⁰C) heat shocks have beneficial effects on aged cells, resulting in an
increase in procollagen type I and hsp47 and a decrease in the expression of hsp27
(Geronemus, 2006; Mayes and Holyoak, 2008; Rattan, 1998). Nonetheless, the duration
of the heat shocks applied was between 30 minutes and 1 hour, which is relatively long
and could induce thermotolerance (Ohtsuka and Laszlo, 2007). Moreover, the effect of
the heat shocks on procollagen type III expression, as an indication of regeneration of
the extracellular matrix has not been studied.
We aim to reverse the inherent aging processes in the dermis; in particular to counteract
the behavior of the embedded fibroblasts. The focus of the work will be the
degenerated collagen matrix. For regeneration of the collagen matrix dermal fibroblasts
need to be stimulated to synthesize new collagen in line with the wound healing process
where first collagen type III is produced followed by synthesis of collagen type I. To
obtain an early indication if the collagen types indeed are produced we examined the

34
Chapter 3
gene expression of these proteins. In this study we aim to increase the expression of
procollagen type I and procollagen type III of human dermal fibroblasts by applying short
pulsed heat shocks. Furthermore, we make use of heat shock proteins 70, 47 and 27 as
biomarkers for respectively recognition of the heat shock, as a precursor for collagen
synthesis, and for protection from apoptosis. In addition, to gain an insight into the
regeneration process, the secretion of specific collagen remodeling markers was
investigated with time: collagen synthesis marker P1P (procollagen type I carboxy‐
terminal propeptide) and collagen degradation marker ICTP (carboxy‐terminal
telopeptide of type I).
3.2 Materials and Methods
3.2.1 Cell culture Cryopreserved human dermal fibroblasts were obtained from the European Collection of
Cell Cultures (Sailsbury, United Kingdom). Cells were grown at 37⁰C, 5% CO2 and 95%
humidity, in Dulbecco’s advanced Modified Eagle’s Medium (DMEM) (GIBCO,
Invitrogen™, Breda, The Netherlands ) supplemented with 10% fetal bovine serum
(Greiner bio‐one, Germany), 1% Glutamax (BioWhittaker™, Verviers, Belgium) and 0.1%
Gentamycin (BioWhittaker™, Verviers, Belgium). Cells were grown until near confluency
before passaging in a 1:2 ratio. After four serial passagings the cells were transferred to
6‐wells plates for heat shock.
3.2.2 Heat shocks Three distinct heat shock temperatures were used; 45⁰C, which can be induced by non‐
ablative techniques (Capon and Mordon, 2006; Verrico et al., 2001; Verrico and Moore,
1997), 60⁰C as a characteristic temperature for protein denaturation (Verrico and
Moore, 1997) and 90⁰C to determine the limit of survival of the cells. The pulse duration
of the heat shocks was chosen at approximately 2 seconds to approach the thermal
heating time induced by non‐ablative methods. The time points were chosen to enable
early detection of changes by means of gene expression.
The pulsed heat shocks with temperatures of 45⁰C and 60⁰C were applied and as a
control group cells were rinsed with 37⁰C Phosphate‐Buffered Saline (PBS). The heat
shocks were applied by rinsing the cell cultures twice with 1 ml heated PBS, which
results in a heat shock duration of 2 seconds per rinsing. During the experiment cell
cultures were placed on a heating plate of 37⁰C. After the pulsed heat shocks part of the
cells were used for growth and viability curves, another part of the cells was used to
measure the metabolic activity and the remainder was used for quantitative Polymerase
Chain Reaction (qPCR).

35
Chapter 3The effect of pulsed heat shocks on collagen type I expression in human dermal fibroblasts
3.2.3 Determination of the growth rate and viability of the cells An equivalent of six 6‐wells plates per temperature were used for the determination of
the growth rate and viability of the fibroblasts. Cells were harvested for counting by
trypsinization at six different time points; before and directly after the heat shocks to
determine detachment of cells, and at t = 2, 4, 7, and 9 days after the heat shocks. Until
harvesting, the cells were kept under standard culture conditions with refreshments of
culture medium every other day. After harvesting at each time point, the total number
of cells, Ct, and number of non‐viable cells, Cnv, were counted. Counting of the cells was
performed using the Nucleocounter™ (Chemometec, Allerød, Denmark) following the
protocol of the manufacturer. The growth rate was assessed using the average Ct per
time point. An estimation of the viability was made out of the percentage of living cells.
3.2.4 Determination of the metabolic activity of the cells The metabolic activity was measured using the 3‐[4,5‐dimethylthiazol‐2‐yl]‐2,5‐diphenyl
tetrazolium bromide (MTT) based in vitro toxicology assay kit (Sigma, Breda, Nederland).
Six 6‐wells plates per temperature per measurement were used. Cells were used directly
after the heat shocks to determine the metabolic activity. Per well 250 µl MTT solution
(M 5655, Sigma, Breda, The Netherlands) was added immediately and the 6‐wells plates
were placed at 37⁰C for 45 minutes. Subsequently, 250 µl solubilization solution (M
8910, Sigma, Breda, The Netherlands) was added to each well and the 6‐wells plates
were placed on a shaker (Titramax 1000, Heidl Instruments, Germany) at 300 rpm for
another 30 minutes. Metabolically active cells cleaved the molecules of the MTT solution
resulting in an insoluble substrate of formazan crystals. After the 45 minutes of
incubation the crystals were dissolved in acidified isopropanol resulting in a purple
solution. Absorbance was spectrophotometrically measured at a wavelength of 570 nm
(Biotek Synergy, Beun de Ronde, The Netherlands).
3.2.5 Determination of gene expression levels of heat shock proteins 27, 47, 70 and procollagen type I and III Six 6‐wells plates per temperature were used for qPCR. Cells were harvested by
trypsinization at five different time points (t = 5, 15, 35, 65, 95 min) after the heat shocks
and stored as dry pellets at ‐80⁰C. Total RNA was isolated using RNeasy kit (Qiagen,
Venlo, The Netherlands) using the manufacturer’s protocol. The concentration and
purity of the total RNA was determined at OD 260/280 nm measurements (Nanodrop,
Isogen, The Netherlands). RNA integrity was assessed using gel‐electrophoresis. 500 ng
RNA and random primers were used for cDNA synthesis using M‐MLV reverse
transcriptase (Invitrogen™, Breda, The Netherlands). Gene expression analysis was
performed on an iCycler Real‐Time PCR detection system (Biorad, Veenendaal, The
Netherlands) using iQ™ SYBR®‐Green supermix (Biorad, Veenendaal, The Netherlands).
Primers for hsp27, hsp47, hps70 and procollagen type I and III were designed with
Beacon software using the DNA sequences obtained from the gene bank. For all primers
used (Table 1), temperature gradients were performed to set the optimal annealing

36
Chapter 3
temperature and dilution curves were assessed to check the efficiency of the primers.
Results were normalized using reference genes β‐Actin and GAPDH, obtained from
Primerdesign (SouthHampton, U.K.), determined by Genorm (Vandesompele et al.,
2002) to be best suited. Relative changes in quantity levels, 2‐∆Ct, were calculated using
Bio‐Rad iQ5 software.
Table 3.1: Sequences of oligo's, genbank accession numbers, amplification fragments and
annealing temperatures used for quantitative PCR.
Oligo Sequence 5’‐3’ Accession No. Amplification fragment
Annealing temperature [⁰C]
Hsp70 FW CGGAGGCGTGATGACTGC BC002453 96 bp 59
Hsp70 REV GTTGTCGGAGTAGGTGGTGAAG
Hsp47 FW TTGAGTTGGACACAGATG AB010273 108 bp 59
Hsp47 REV GCACTAGGAAGATGAAGG
Hsp27 FW ATCACCATCCCAGTCACCTTC NM_001540 80 bp 59
Hsp27 REV TTGGCGGCAGTCTCATCG
ProColl1 FW AATCACCTGCGTACAGAACGG NM_000088 120 bp 59
ProColl1 REV TCGTCACAGATCACGTCATCG
ProColl3 FW CCCAGAACATCACATATCAC NM_000090 140 bp 59
ProColl3 REV CAA GAGGAACACATATGGAG
3.2.6 Determination of collagen type I remodeling markers Concentrations of the markers for collagen synthesis, P1P, and collagen degradation,
ICTP, were determined in the culture medium by means of enzyme immuno assays (EIA).
P1P was measured using a procollagen type I C‐peptide EIA kit (Takara Bio, Otsu, Shiga,
Japan). ICTP was determined using a quantitative enzyme immunoassay designed for in
vitro measurement of carboxy‐terminal cross‐linked telopeptide of human type I
collagen (Orion Diagnostica, Espoo, Finland). Each assay was performed according to the
recommendations of the suppliers. The assays were performed on medium samples of
the HDFs obtained after 90 minutes, 24 and 48 hours after the pulsed heat shocks of
45⁰C and 60⁰C. For the control group medium samples of HDFs were measured at similar
time points after culturing. The data were normalized to their corresponding amount of
cells, resulting in concentration P1P and ICTP per cell.
3.2.7 Immunocytochemistry To study the synthesis of collagen type I by the HDFs after the applied pulsed heat
shocks immunofluorescent staining with an antibody for collagen type I (Sigma Aldrich,
Breda, The Netherlands) was used. Cells were fixated 90 minutes, 24 and 48 hours after
the pulsed heat shocks with 10% of formalin for 10 minutes before the staining

37
Chapter 3The effect of pulsed heat shocks on collagen type I expression in human dermal fibroblasts
procedure was performed. The actin filaments of the cells were stained with Phalloidin‐
TRITC (Sigma, Breda, The Netherlands) and the cell nuclei with DAPI (Sigma, Breda, The
Netherlands). The results were visualized with fluorescence microscopy at room
temperature (Axiovert 200M, Zeiss B.V., Göttingen, Germany) with a 20 objective (Zeiss LD ACHROPLAN) and a NA of 0.4. A Zeiss AxioCam HRM Camera was used together with
Zeiss AxioVision Rel. 4.8 acquisition software to record representative images.
3.2.8 Statistical analysis Data are presented as mean ± SD (standard deviation) for a sample measurement of n =
6. Comparisons between the control and experimented groups were performed by a
two‐tailed t‐test. Differences were considered significant at p < 0.05.
3.3 Results
3.3.1 Influence of repeated heat shocks on growth rate and viability of cultured human dermal fibroblasts Figure 3.1(a) shows the growth curves of the different groups of heat shocked cells. The
proliferation rate of cells heat shocked at 45⁰C is similar to that of the control group of
37⁰C, while the cells heat shocked at 60⁰C proliferated much slower. The negative slope
in the growth curve of the 90⁰C heat shocked cells indicates that the cells had reduced in
number due to their death.
The viability of the fibroblasts, as depicted in figure 3.1(b), shows that the cells heat
shocked at either 45⁰C or 60⁰C retained a similar viability as the control group, in the
range of 90 to 98%. In case of the 60⁰C heat shocked cells this is noteworthy namely,
that despite the retardation of the proliferation, the viability remains high. The viability
of the cells heat shocked at 90⁰C, as represented in figure 3.1(b), decreased dramatically
to 0% within four days. The presence of cell death after 4 days is necessarily associated
with the growth rate data (figure 3.1(a)).

38
Chapter 3
3.3.2 Influence of heat shocks on metabolic activity of cultured human dermal fibroblasts The effect of the heat shocks on the metabolic activity is illustrated in figure 3.2. The
absorption levels are proportional to the metabolic activity. Furthermore, all results are
normalized to the absorption level of the control group. It can be seen that the
absorption levels of the 45⁰C and the 60⁰C heat shocked cells are 0.76 ± 0.10 (p < 0.01)
and 0.79 ± 0.06 (p < 0.01), respectively. However, there is no significant difference in the
metabolic rates of cells heat shocked at 45⁰C and 60⁰C. The absorption level of the 90⁰C
heat shocked cells is 0.04 ± 0.02, which is significantly lower that of the control value (p
< 0.001). This low metabolic activity confirms that these cells are dead.
Figure 3.1: (a) Growth rate of human dermal fibroblasts after exposure to different pulsed heat shocks; the control was kept at 37⁰C. The x‐axis depicts the time in days and the y‐axis shows the number of cells normalized to their begin situation. The error bars at each point are calculated standard deviations (n = 6). Note: the decreased growth rate of 60⁰C heat shocked cells. (b) Viability curves of human dermal fibroblasts after being exposed to pulsed heat shocks; the control was kept at 37⁰C. The x‐axis depicts the time in days and the y‐axis shows the viability, percentage of living cells, calculated from Ct and Cnv. The error bars at each point are calculated standard deviations (n = 6). Note: the viability of the 60⁰C heat shocked cells.

39
Chapter 3The effect of pulsed heat shocks on collagen type I expression in human dermal fibroblasts
It is noted that the metabolic activity of 45⁰C and the 90⁰C heat shocked cells is in
accordance with the growth rate and viability measurements. However, it should be
noted that the 60⁰C heat shocked cells, although their proliferation rate has decreased,
are still metabolically as active as the faster growing 45⁰C heat shocked cells.
3.3.3 Effect of heat shocks on the expression of heat shock proteins 27, 47 and 70 The relative quantities of hsp70 and their control are depicted in figures 3.3(a) and (b).
After the pulsed heat shocks of 45⁰C the expression significantly increased after 35
minutes (p < 0.05) as shown in figure 3.3(a). The corresponding values of gene
expression of hsp70 are significantly higher at the elevated 60⁰C temperature (p < 0.001
in all cases). Indeed, there is a monotonic increase in the expression of hsp70 in the 95
minutes following the 60⁰C pulsed heat shocks (figure 3.3(b)).
Figures 3.3(c) and (d) represent the relative quantities of hsp47 at the various time
points after the pulsed heat shocks. These data show that the heat shock of 45⁰C
resulted in a significant increase after 35 minutes (p < 0.01) while, after the 60⁰C pulsed
heat shock, a significant increase in hsp47 mRNA level was seen after 95 minutes (p <
0.01).
Regarding the expression of hsp27, figure 3.3(e) shows an overall significant decrease in
gene expression (p < 0.001) after the pulsed heat shocks of 45⁰C. The 60⁰C heat shocks
also resulted in a significant decrease (p < 0.001) as illustrated in figure 3.3(f), although,
with time, the expression was restored to near the control value.
Figure 3.2: The metabolic activity of human dermal fibroblasts after exposure to a pulsed heat shock; the control was kept at 37⁰C. The x‐axis depicts the control and the different heat shock temperatures. The y‐axis shows the absorption levels normalized to the control. The data are shown as the mean ± SD for n = 6 run in triplicates. Significant differences are shown at ** p < 0.01 and *** p < 0.001. Note: the absorption is proportional to the metabolic activity.

40
Chapter 3
Figure 3.3: Relative quantity of heat shock protein 70, heat shock protein 47 and heat shock
protein 27 at the different time points after exposure to pulsed heat shocks. The control was
kept at 37⁰C and the data are relative to the reference genes β‐Actin and GAPDH. The x‐axis
depicts the control and the different points in time given in minutes. The y‐axis shows the
relative quantity of mRNA, respectively hsp70, hsp47 and hsp27, calculated with 2‐∆Ct. Data are
shown as the mean ± SD for three independent experiments each run in duplo with significant
differences compared to control at * p < 0.05, ** p < 0.01 and *** p < 0.001. (a) Hsp70 after
45⁰C pulsed heat shocks. (b) Hsp70 after 60⁰C pulsed heat shocks. (c) Hsp47 after 45⁰C pulsed
heat shocks. (d) Hsp 47 after 60⁰C pulsed heat shocks. (e) Hsp 27 after 45⁰C pulsed heat shocks.
(f) Hsp 27 after 60⁰C pulsed heat shocks

41
Chapter 3The effect of pulsed heat shocks on collagen type I expression in human dermal fibroblasts
3.3.4 Effect of heat shocks on the expression of procollagen type I and III The results of the 45⁰C and 60⁰C pulsed heat shocks on the expression of procollagen
type I are shown in figures 3.4(a) and (b), respectively. A significant decrease in
expression (p< 0.001) can be seen in the first 15 minutes after the 60⁰C pulsed heat
shocks. After 35 minutes an increasing trend up to a significant increase in expression (p
< 0.05) is noticed as presented in figure 3.4(b). The 45⁰C and 60⁰C pulsed heat shocks
resulted in a significant increase after 35 minutes and 95 minutes, respectively. It is
Figure 3.4: Relative quantity of procollagen type I and procollagen type III at the different timepoints after exposure to pulsed heat shocks. The control was kept at 37⁰C and the data arerelative to the reference genes β‐Actin and GAPDH. The x‐axis depicts the control and thedifferent points in time given in minutes. The y‐axis shows the relative quantity of mRNA ofprocollagen type III and procollagen type I calculated with 2‐∆Ct. Data are shown as the mean ±SD for three independent experiments each run in duplo with significant differences comparedto control at * p < 0.05, ** p < 0.01 and *** p < 0.001. (a) Procollagen type I after 45⁰C pulsedheat shocks. (b) Procollagen type I after 60⁰C pulsed heat shocks. (c) Procollagen type III after45⁰C pulsed heat shocks. (d) Procollagen type III after 60⁰C pulsed heat shocks.

42
Chapter 3
noticed that these significant time points of upregulation are similar to the time points
of upregulation of hsp47 for both heat shock temperatures (figures 3.3(c) and (d)).
Figures 3.4(c) and (d) depict the relative quantities of procollagen type III mRNA of the
control and after heat shocks of 45⁰C and 60⁰C, respectively. Even after 5 minutes, there
is a significant increase in expression at both heat shock temperatures. However, there
is a clear distinction between the two groups: at later time points with a continuing
increase in gene expression for 60⁰C heat shocked cells, but little trend with time for the
45⁰C heat shocked cells.
Figure 3.5: Absolute concentrations per cell of P1P (a) and ICTP (b) in culture medium. The x‐axis
depicts the time in hours and the y‐axis the concentration per cell in ng/ml * p < 0.05, ** p <
0.001, and *** p < 0.0001 represent the significant differences between the heat shocked
groups and the control group. Medium samples of the control group were obtained at similar
time points, 90 minutes, 24 and 48 hours after culturing.

43
Chapter 3The effect of pulsed heat shocks on collagen type I expression in human dermal fibroblasts
3.3.5 Effect heat shocks on collagen remodeling markers The effects of the pulsed heat shocks on specific collagen remodeling markers for
collagen synthesis (P1P) and degradation (ICTP) are shown in figure 3.5. The
concentrations of P1P produced by the cells after the 45⁰C and the 60⁰C pulsed heat
shocks increase with time and at 48 hours statistically significant higher values of P1P
can be seen compared to the control values (figure 3.5a). It is worthy of note that the
amount of P1P produced by the cells heat shocked at 60⁰C is also significantly higher
compared to the amount of P1P produced after 45⁰C pulsed heat shocks (p < 0.01). This
appears to be in agreement with the gene expression results that preceed this protein
synthesis.
Whereas the concentration of ICTP after the 45⁰C pulsed heat shocks at 24 hours are
similar to control values, the corresponding values for 60⁰C heat shocks are statistically
significantly lower (figure 3.5(b)). This trend is maintained at 48 hours. This significant
increase and reduction of P1P and ICTP, respectively, results in higher net collagen
content produced by cells being treated with the 60⁰C pulsed heat shocks compared to
the net collagen content that is produced by the 45⁰C heat shocked cells and the
control.
3.3.6 Immunofluorescence Examination of the synthesis of collagen type I by immunofluorescent staining
demonstrated more collagen type I formation after 48 hours by cells that underwent
60⁰C pulsed heat shocks (figure 3.6(c)) compared to the cells that were heat shocked at
45⁰C (figure 3.6(b)). It is noteworthy to point out that these findings are in agreement
with the gene expression results and the results of the enzyme immune assays for P1P
and ICTP.
Figure 3.6: Immunofluorescent staining for collagen type I after 48 hours of the control group
(a), 45⁰C heat shocked cells (b), and 60⁰C heat shocked cells (c). Green indicates collagen type I,
red indicates the actin filaments (Phalloidin) of the cells and blue depicts the cell nuclei (DAPI).

44
Chapter 3
3.4 Discussion This study demonstrates that pulsed heat shocks stimulate the human dermal
fibroblasts in‐vitro to upregulate gene expression of procollagen type I and procollagen
type III as an initial response. Our results show that the stimulation by the pulsed heat
shocks at both heat shock temperatures, 45⁰C and 60⁰C, caused an upregulation in gene
expression of procollagen type I and procollagen type III after 35 and 5 minutes
respectively.
Procollagen type I expression has previously been shown to be upregulated after 3 hours
by human dermal fibroblasts treated with repeated mild heat shocks of 30 minute
duration at 41⁰C (Mayes and Holyoak, 2008). However, our results demonstrate, after
application of short pulsed heat shocks of 45⁰C and 60⁰C, that an upregulation of
procollagen type I can be noticed within 35 minutes. We have also found that the early
response in upregulation of hsp47 of the cells to both heat shock temperatures, 45⁰C
and 60⁰C, is similar to the early response in upregulation of procollagen type I. These
findings are consistent with results shown in literature, which report that hsp47 has the
ability to bind procollagen I for transportation to the Golgi system. Furthermore, it is
stated that hsp47 takes an active role in the collagen type I synthesis (Naitoh et al.,
2001; Tasab et al., 2000; Verrico et al., 2001). Therefore, our results substantiate that
these physiological processes are initiated at a very early stage following thermal
stimulation.
It is hypothesized that the effect of heat generation in the dermis would cause collagen
denaturation and injury, which subsequently would lead to a wound healing response
(Capon and Mordon, 2006). From this perspective, it is known that collagen type III is the
first protein that will be deposited to heal the extracellular matrix. Subsequently, this
protein will be replaced by collagen type I (Farber and Rubin, 1998). Therefore, to detect
early extracellular matrix regeneration procollagen type I and III are effective
biomarkers. Additionally, we hypothesize a differential expression with increasing time
steps between the 45⁰C and the 60⁰C heat shocks. We suggest that the 60⁰C pulsed heat
shocks would result in a more pronounced stimulation of the cells compared to the 45⁰C
pulsed heat shocks. With regard to these findings, we suggest that the 60⁰C pulsed heat
shocks have a beneficial effect in the process of regeneration of the collagen matrix.
Rejuvenation is a complex physiological process that can be related to the complex
physiology of wound healing. The complexity of these physiological pathways goes
beyond our research; nevertheless, our results demonstrate that the heat shocks
stimulate the cells into producing more collagen. Therefore, it is tempting to speculate
that our findings are in accordance with a wound healing response, where first collagen
type III is deposited and subsequently substituted by collagen type I, as our results have
shown a direct upregulation of procollagen type III followed by an upregulation of
procollagen type I after 35‐95 minutes (figures 3.4(a‐d)).

45
Chapter 3The effect of pulsed heat shocks on collagen type I expression in human dermal fibroblasts
Besides quantification of collagen on gene expression level, specific collagen markers
were investigated. Markers for collagen synthesis (P1P) and degradation (ICTP) were
measured to provide insight in the effect of pulsed heat shocks on human dermal
fibroblasts on the overall collagen turnover. Synthesis of collagen from their precursor
molecules, procollagen, occurs by releasing procollagen propeptides (P1P). The balance
between synthesis and degradation, the net collagen content, appeared to be
dependent on the temperature of the pulsed heat shocks. Our results show that
collagen synthesis is enhanced by pulsed heat shocks at both 45⁰C and 60⁰C (figure
3.5(a)). At the same time, the concentration of collagen degradation marker, ICTP, which
is released upon cleavage of collagen by MMPs, was significantly lower than the control
after pulsed heat shocks of 60⁰C, but did not differ from the control after pulsed heat
shocks of 45⁰C (figure 3.5b). This shows that the stimulus of the 60⁰C pulsed heat shocks
results in more collagen synthesis and less collagen degradation and therefore an
enhanced amount of net collagen content than the 45⁰C heat shocked stimulus. The
results of the immunofluorescent staining support these findings (figure 3.6).
As mentioned in the introduction heat shock protein 70 is routinely used as biomarker.
Hsp70 indicates that the cells recognize the heat shock (Mayes and Holyoak, 2008;
Rattan, 1998; Verbeke et al., 2007). Our results show by the increased levels of hsp70
mRNA that we have proven that both heat shock temperatures have evidently
stimulated the cells, which is in accordance with other studies (Snoeckx et al., 2007;
Verbeke et al., 2007). We observed strongly elevated mRNA levels even 5 minutes after
the pulsed heat shock of 60⁰C and we cannot exclude the possibility that the mRNA
levels would continue rising beyond the time of the experiment, namely 95 minutes.
This rising trend remains to be established.
It has been reported that repeated mild heat shocks of 41⁰C for 60 minutes result in a
decreased expression of hsp27 (Verbeke et al., 2007). We also observed a
downregulation of hsp27 in 45⁰C heat shocked cells as well as in 60⁰C heat shocked cells,
but in contrast to the mentioned study, our results of the expression at 60⁰C heat
shocked cells after 95 minutes are not significantly different compared to the control
values (figure 3.3(f)). Another study reports that hsp27 plays a role in protecting cells
against apoptosis (Frank et al., 2004). We have observed that after a pulsed heat shock
of 90⁰C, besides the obvious death of the cells after four days, hsp27 was strongly
upregulated within 60 minutes (data not shown). Therefore, our findings imply that the
heat shock temperatures, 45⁰C and 60⁰C, do not endanger the viability of the
fibroblasts.
Repeated mild heat shocks of 41⁰C for 60 minutes do not influence the proliferation rate
of the cells (Rattan, 1998). In our study, we did not observe any change in proliferation
rate after the 45⁰C pulsed heat shocks. However, we have found that the influence of
the heat shocks of 60⁰C for 2 seconds resulted in lower proliferation rate than that of

46
Chapter 3
the control group and that of the cells heat shocked at 45⁰C (figure 3.1(a)). Taking the
results of the viability curves and the metabolic activity into account, both in line with
the results of the 45⁰C heat shocked cells and controls, a possible explanation for this
difference is that the 60⁰C heat shocked cells use preferentially their energy to
synthesize proteins as opposed to cell proliferation.
Only a few studies have investigated the response of human dermal fibroblasts to heat
shocks. The temperature and duration that were chosen in those studies was 41⁰C and
60 minutes (Mayes and Holyoak, 2008; Rattan, 1998; Verbeke et al., 2007). To approach
the heat shock duration of the rejuvenation methods used by dermatologists, such as
the non‐ablative laser techniques, we have chosen to apply heat shocks with a shorter
duration. However, we are aware that the heat shock duration could play an important
role in the response of the human dermal fibroblasts. The temperatures we have chosen
also differ from these studies, because it is reported in literature that a characteristic
temperature reached in the dermis after laser treatment is between 42 and 45⁰C
(Verrico et al., 2001). In addition, a 60⁰C heat shock temperature was chosen, because it
is known that this is a threshold temperature for protein denaturation (Ebling et al.,
1992; Farber and Rubin, 1998). However, it should be recognised that changes in the
parameters pulse duration and temperature could result in a different response of
human dermal fibroblasts (Altshuler et al., 2007; Watanabe, 2008).
Heat shock response of human dermal fibroblasts induced by either laser treatments or
pulsed heat shocks is poorly understood. In this study we have shown that an early
detection of the cell response to pulsed heat shocks is possible. It is evident that the
pulsed heat shocks of 60⁰C enable the dermal fibroblasts to reduce their proliferation
rate without compromising their viability and metabolic activity. Furthermore, we have
demonstrated that these short pulsed heat shocks of 45⁰C and 60⁰C cause an
upregulation of procollagen type I as well as of procollagen type III. Moreover, we
hypothesized a tendency difference in expression with increasing time steps between
the 45⁰C and the 60⁰C heat shocks. Therefore, the 60⁰C pulsed heat shocks would result
in a more pronounced stimulation of the cells compared to the 45⁰C pulsed heat shocks.
In addition we have strengthened this hypothesis with the measurement of remodeling
markers, where we have shown that the 60⁰C stimulus resulted in higher net collagen
content (figure 3.5 and 3.6). With regard to these findings, it can be suggested that the
60⁰C pulsed heat shocks have, in the early stage of regeneration, a more substantial
effect than the 45⁰C pulsed heat shocks in the process of regeneration of the collagen
matrix.

Chapter 4 The effect of pulse duration of the heat shock
on collagen type I by human dermal fibroblasts invitro
Abstract The formation of wrinkles is associated with degeneration of the collagen matrix of the skin. For
regeneration of the matrix fibroblasts need to be stimulated in producing new collagen. In this
study, the effect of pulse duration of heat shocks on gene expression of procollagen type I,
procollagen type III, hsp27, hsp47, and hsp70 and on expression of remodeling markers, P1P and
ICTP, of human dermal fibroblasts in vitro, is investigated. Temperatures of 45⁰C and 60⁰C were
used as heat shock temperatures which were exposed at times of 2, 4, 8, 10, 16, and 21 seconds.
Proliferation rates, viability and metabolic activity were measured directly after the pulsed heat
shocks and quantitative PCR was performed at three different time points after the heat shocks.
Enzyme Immuno Assays were performed to determine the concentrations of P1P and ICTP.
Results showed a decreased proliferation rate and severe cell loss after the 60⁰C heat shock.
Gene expressions were upregulated in 45⁰C heat shocked cells. Remodeling marker analysis
showed the largest net production of collagen by cells exposed to 45⁰C heat shocks for 8 to 10
seconds. It can be concluded that with short pulsed heat shocks it is possible to stimulate cells
without traumatizing them to enhance new collagen formation.
The contents of this chapter are based on S.D. Dams, M.de Liefde‐van Beest, A.M. Nuijs ,
C.W.J. Oomens, F.P.T. Baaijens. Influence of pulse duration of heat shocks on collagen
type I expression in human dermal fibroblasts. (submitted)

48
Chapter 4
4.1 Introduction In skin rejuvenation dermal fibroblasts play an essential role in the active growth,
development and repair of the skin. Fibroblasts are situated in the dermis. The dermis
can be divided into the papillary dermis, situated directly under the epidermis, the top‐
layer that serves as the primary barrier against influences from the external
environment (Lewis et al., 1994), and the reticular dermis, located between the papillary
dermis and the hypodermis, which is the deeper layer and is involved in the wound
healing and immune response (Farber and Rubin, 1998). The main component that
defines the dermis is the extracellular matrix consisting of complexes of supportive
proteins, such as collagen, elastin and proteoglycans, synthesized by dermal fibroblasts
(Ebling et al., 1992; Geronemus, 2006).
Fibroblasts change with age with an increase in size, but a decrease in their mitotic and
synthetic potential (Gilchrest, 2007a; Kurban and Bhawan, 2007; Ramos‐e‐Silva and da
Silva Carneiro, 2007). Senescent fibroblasts loose their capability to replicate, due to a
shortening of the telomere sequence, until it is no longer present. Then the capacity of
the cell to replicate is lost (Gilchrest, 2007a; Gilchrest and Bohr, 2006).
The dermal components change as well with age. Collagen fibers become thicker and
more susceptible to damage. Furthermore, after the age of 25 the collagen content of
the dermis decreases 1% per year (Kurban and Bhawan, 2007; Ramos‐e‐Silva and da
Silva Carneiro, 2007). Furthermore, elastic fibers decrease in number and fragment with
age. The amount of ground substance, which is the amorphous material composed of
proteoglycans, plasma constituents, metabolites, water, and ions present within the
intracellular space, decreases with age (Gilchrest, 2007b; Kurban and Bhawan, 2007;
Ramos‐e‐Silva and da Silva Carneiro, 2007). These changes contribute to the degradation
of the underlying network of elastin and collagen fibers, resulting in wrinkling and
sagging of the skin (Gilchrest, 2007b; Kurban and Bhawan, 2007).
UV radiation damages collagen fibers and causes accumulation of abnormal elastin. In
response to this accumulation large amounts of metalloproteinases (MMPs) are
produced (Gilchrest, 2007b; Gilchrest, 2007c; Ramos‐e‐Silva and da Silva Carneiro,
2007). The fibroblasts from the dermis are one of the major sources of matrix
metalloproteinases after exposure to UV radiation. The normal function in this case is
generally positive, namely to remodel the sun‐injured tissue by manufacturing and
reforming collagen. However, when following prolonged exposure to the sun, it is an
imperfect damaging process, because some of the metalloproteinases produced by
sunlight actually degrade collagen (Ebling et al., 1992; Gilchrest, 2007c). The result is an
uneven formation of collagen fibers. Repetition of this imperfect skin remodeling causes
wrinkles to form (Ebling et al., 1992; Gilchrest et al., 2007; Gilchrest, 2007c; Ramos‐e‐
Silva and da Silva Carneiro, 2007; West, 2007; Yaar et al., 2007).

49
The effect of pulse duration of the heat shock on collagen type I by human dermal fibroblasts in‐vitro
Chapter 4
Rejuvenation of the skin aims at stopping or reversing of the features of aging. Although,
this can also be achieved in the epidermis, the focus of the present work is on the
dermis where the aim is to stimulate the fibroblasts to regenerate the aged collagen
matrix. To renew the dermal matrix most rejuvenation techniques aim to induce thermal
stress in the dermis. Among these methods, non‐ablative techniques claim to induce
dermal remodeling without global epidermal injury, using a thermal approach. The
energy is applied as short nanosecond to millisecond pulses, or in a continuous wave
resulting in a local temperature increase (Bjerring, 2006; Capon and Mordon, 2006;
Geronemus, 2006; Sadick, 2006). The locally generated heat diffuses throughout the skin
resulting in a temperature gradient (Altshuler et al., 2007). Through this inhomogeneous
heating process of the skin, fibroblasts encounter heat shocks of different temperatures
with different durations.
Heat shocks, which can be applied by various techniques, directly cause a heat shock
response, HSR (Bjerring et al., 2006; Capon and Mordon, 2006). The HSR might induce
temporary changes in cellular metabolism and might be responsible for the release and
production of growth factors and increase the rate of cell proliferation. One of the
changes is associated with a stimulated expression of heat shock proteins, which can
play a major role in the inflammatory reaction process and wound healing (Capon and
Mordon, 2006; Geronemus, 2006). Another physiological process that has been
suggested is that the generation of heat causes collagen injury and contraction and
subsequent repair of collagen injury by activating and recruiting fibroblasts (Geronemus,
2006).
The previous chapter has indicated that a pulsed heat shock of two seconds of both 45⁰C
and 60⁰C can result in an increase of procollagen type I synthesis, preceeded by an
increase of procollagen type I gene expression, by human dermal fibroblasts in‐vitro
(Dams et al., 2010). Moreover, repeated mild heat shocks, with temperatures of 39⁰C up
to 42⁰C and a duration of 30 minutes up to 1 hour, have beneficial effects on aged
fibroblasts, resulting in an increase in procollagen type I and hsp47 and a decrease in the
expression of hsp27 (Geronemus, 2006; Mayes and Holyoak, 2008; Rattan, 1998).
Relevant heat shock proteins for skin regeneration are: (1) hsp70; a highly inducible
protein that is overproduced when a cell encounters a swift change to a higher
temperature (Bowers et al., 2007; Marshall and Kind, 2007; Ohtsuka and Laszlo, 2007;
Snoeckx et al., 2007; Souil et al., 2001; Tandara et al., 2007), (2) hsp47; a constitutive
protein that binds and transports procollagen from the endoplasmic reticulum to the
Golgi system and plays an active role in collagen type I synthesis (Brown et al., 2007;
Naitoh et al., 2001; Verrico and Moore, 1997), and (3) hsp27; a constitutive protein that
when overexpressed can protect the cell from apoptosis when it encounters a heat
shock (Frank et al., 2004; Hirano et al., 2004; Snoeckx et al., 2007). However, it must be
taken into account that fibroblasts exposed to non‐lethal heat shocks acquire a transient

50
Chapter 4
resistance to such a heat challenge, a phenomenon termed thermotolerance (Ohtsuka
and Laszlo, 2007).
Non‐ablative rejuvenation techniques, based on inducing thermal stimuli, are already
used extensively in clinical practice. However, the processes that are taking place as a
result of skin treatment or the influences of the pulse duration in combination with the
chosen temperature are still not fully understood. Thermal exposure times used in non‐
ablative devices vary from nanoseconds to minutes (Watanabe, 2008). Different settings
in pulse duration and temperature are said to enable different treatments of skin
rejuvenation (Capon and Mordon, 2006; Watanabe, 2008). The present research aims at
exploring the effect of different pulse durations of heat shocks of 45⁰C or 60⁰C applied
to human dermal fibroblasts.
The gene expression associated with procollagen type I and type III for human dermal
fibroblasts exposed to pulsed heat shocks with different pulse durations is studied.
Furthermore, heat shock proteins 70, 47 and 27 are used as biomarkers for respectively
recognition of the heat shock, as a precursor for collagen synthesis, and for protection
from apoptosis. In addition, to further examine the regeneration process, the temporal
secretion of specific collagen remodeling markers is investigated, namely, collagen
synthesis marker P1P (procollagen type I carboxy‐terminal propeptide) and collagen
degradation marker ICTP (carboxy‐terminal telopeptide of type I), assuming such an
increase in collagen synthesis is one of the required phenomena in skin rejuvenation
(Bjerring et al., 2007; Capon and Mordon, 2006; Narurkar, 2007; White et al., 2007).
4.2 Materials and Methods
4.2.1 Cell culture Human dermal fibroblasts from a 51 year old male (European Collection of Cell Cultures,
Sailsbury, United Kingdom) were grown in culture flasks (Nunc™, Roskilde, Denmark) at
37⁰C, 5% CO2 and 95% humidity, in Dulbecco’s advanced Modified Eagle’s Medium
(DMEM) (GIBCO, Invitrogen™, Breda, The Netherlands ) supplemented with 10% fetal
bovine serum (Greiner bio‐one, Germany), 1% Glutamax (BioWhittaker™, Verviers,
Belgium) and 0.1% Gentamycin (BioWhittaker™, Verviers, Belgium). When cell density
reached near‐confluency they were passaged in a 1:2 ratio. After four serial passagings
the cells were seeded onto chamber slides (4 and 8 wells, Nunc™) and underwent heat
shock treatments within 24 hours.
4.2.2 Heat shocks For the heat shocks two temperatures were used; 45⁰C, which can be induced by non‐
ablative techniques (Capon and Mordon, 2006; Verrico et al., 2001; Verrico and Moore,
1997) and 60⁰C as a characteristic temperature for protein denaturation (Verrico and
Moore, 1997). For each temperature six different pulse durations were chosen: 2, 4, 8,

51
The effect of pulse duration of the heat shock on collagen type I by human dermal fibroblasts in‐vitro
Chapter 4
10, 16 and 21 seconds. These durations were chosen based on our previous work on
human ex‐vivo skin (chapter 5 and 6). Heat shocks were applied by immersing the slides
in 45⁰C or 60⁰C phosphated buffered saline (PBS) for the desired exposure time. After
the heat shocks the wells were filled with 500 μl culture medium of 37⁰C.
The main experiment incorporated thirteen different test conditions: six different
exposure times for each temperature and a control maintained at 37⁰C. Each test
condition was measured at three points in time: 1.5, 24 and 48 hours. Growth and
viability measurements were also performed after the 48 hours up to 7 days. Before and
after the experimental procedure cell cultures were placed in the incubator. This
experiment was carried out four independent times.
For each time point 500 μl of culture medium on the cells was removed and frozen at
‐80⁰C for subsequent measurement of remodeling markers procollagen type I C‐peptide
(P1P) and C‐terminal telopeptide of collagen type I (ICTP). Cells were then collected by
trypsinization at the different time points, resuspended in culture medium and
centrifuged (1000 g, 5 minutes). Each time point the cell pellets were resuspended, for
determining growth and viability curves, and stored at ‐80⁰C, for quantitative
polymerase chain reaction (qPCR) analysis. Additionally, one chamber slide per time
point was fixed with 10% formalin for 10 minutes and subsequently washed and stored
in PBS at 4⁰C for subsequent immunofluorescence analysis.
4.2.3 Determination of the growth rate and viability of the cells Growth rate and viability of the fibroblasts were determined by harvesting the cells for
counting at several time points; before and directly after the heat shocks to determine
detachment of cells, and at t = 1.5 h, 1 day, 2, 5 and 7 days after the heat shocks. Until
harvesting, the cells were kept under standard culture conditions with refreshments of
culture medium every other day. After harvesting at each time point, the total number
of cells, Ct, and number of non‐viable cells, Cnv, were counted. Counting of the cells was
performed using the Nucleocounter™ (Chemometec, Allerød, Denmark) following the
protocol of the manufacturer. The growth rate was assessed using the average Ct per
time point. The viability, percentage of living cells, was calculated from Ct and Cnv.
4.2.4 Determination of the metabolic activity of the cells Cells were used directly after the heat shocks to determine the metabolic activity, using
the 3‐[4,5‐dimethylthiazol‐2‐yl]‐2,5‐diphenyl tetrazolium bromide (MTT) based in vitro
toxicology assay kit (Sigma, Breda, Nederland). Per well 150 µl MTT solution (M 5655,
Sigma, Breda, The Netherlands) was added immediately and the chamber slides were
placed at 37⁰C for 45 minutes. Metabolically active cells cleaved the molecules of the
MTT solution resulting in precipitation of formazan crystals. Subsequently, 150 µl
solubilization solution (M 8910, Sigma, Breda, The Netherlands) was added to each well
and the slides were placed on a shaker (Titramax 1000, Heidl Instruments, Germany) at
300 rpm for a further 30 minutes, dissolving the crystals in acidified isopropanol

52
Chapter 4
resulting in a purple solution. Absorbance was spectrophotometrically measured at a
wavelength of 570 nm (Biotek Synergy, Beun de Ronde, The Netherlands).
4.2.5 Determination of gene expression levels of heat shock proteins 27, 47, 70 and procollagen type I and III For qPCR analysis total RNA was isolated using RNeasy kit (Qiagen, Venlo, The
Netherlands) using the manufacturer’s protocol. The concentration and purity of the
total RNA was determined at OD 260/280 nm measurements (Nanodrop, Isogen, The
Netherlands). RNA integrity was assessed using gel‐electrophoresis. Random primers
and 225 ng RNA were used for cDNA synthesis using M‐MLV reverse transcriptase
(Invitrogen™, Breda, The Netherlands). Gene expression analysis was performed on an
iCycler Real‐Time PCR detection system (Biorad, Veenendaal, The Netherlands) using
iQ™ SYBR®‐Green supermix (Biorad, Veenendaal, The Netherlands). ). Primers for hsp27,
hsp47, hps70 and procollagen type I and III were used as by Dams et al. (Dams et al.,
2010). Results were normalized using reference genes β‐Actin and GAPDH, obtained
from Primerdesign (South Hampton, U.K.). Fold changes, 2‐∆∆Ct, were calculated
manually.
4.2.6 Determination of collagen type I remodeling markers Concentrations of the markers for collagen synthesis, P1P, and collagen degradation,
ICTP, were determined in the culture medium by means of enzyme immuno assays (EIA).
P1P was measured using a procollagen type I C‐peptide EIA kit (Takara Bio, Otsu, Shiga,
Japan). ICTP was determined using a quantitative enzyme immunoassay designed for in
vitro measurement of carboxy‐terminal cross‐linked telopeptide of human type I
collagen (Orion Diagnostica, Espoo, Finland). Each assay was performed according to the
recommendations of the suppliers. The assays were performed on the acquired medium
samples. The EIA data were normalized to their corresponding amount of cells, resulting
in concentration P1P and ICTP per cell.
4.2.7 Immunofluorescence To study the synthesis of collagen type I by the HDFs after the applied pulsed heat
shocks immunofluorescent staining with an antibody for collagen type I (Sigma Aldrich,
Breda, The Netherlands) was used. The actin filaments of the cells were stained with
Phalloidin‐TRITC (Sigma, Breda, The Netherlands) and the cell nuclei with DAPI (Sigma,
Breda, The Netherlands). The results were visualized with fluorescence microscopy at
room temperature (Axiovert 200M, Zeiss B.V., Göttingen, Germany) with a 20 objective (Zeiss LD ACHROPLAN) and a NA of 0.4. A Zeiss AxioCam HRM Camera was used together
with Zeiss AxioVision Rel. 4.8 acquisition software to take representative images.
4.2.8 Statistical analysis Data are presented as mean ± standard deviation (SD) for a sample measurement of n =
4. Comparisons between the control and the experimental groups were performed using

53
The effect of pulse duration of the heat shock on collagen type I by human dermal fibroblasts in‐vitro
Chapter 4
a two‐tailed t‐test. Differences were considered to be significant at p<0.05.
Furthermore, differences between groups were tested by using analysis of variances
followed by a Dunnet’s multiple comparison tests. Groups were considered to be
different at p<0.05.
4.3 Results
4.3.1 Human dermal fibroblast proliferation and viability The proliferation rate of cells exposed to the different heat shocks is depicted in figure
4.1(a).
Figure 4.1: Growth rate and viability curves of human dermal fibroblasts after exposure to different pulsed heat shocks; the control was kept at 37⁰C. (a) Growth curves. The x‐axis depicts the time in days and the y‐axis shows the number of cells normalized to their begin situation. The error bars at each point are calculated standard deviations (n = 4). Note: the severe cell loss at the 60⁰C heat shocked cells cultures. (b) Viability curves. The x‐axis depicts the time in days and the y‐axis shows the viability, percentage of living cells, calculated from Ct and Cnv. The error bars at each point are calculated standard deviations (n = 4). Note: the decreased viability of the 60⁰C heat shocked cells.

54
Chapter 4
The number of cells per measurement point is normalized to the number of cells prior to
the heat shock. The growth rate of the control is shown as the black dashed line. The
45⁰C heat shocks, as depicted by the black solid lines (figure 4.1(a)), cause a slightly
lower proliferation rate of the cells than the control cells. By contrast the growth curves
of the cells heat shocked at 60⁰C for more than 2 seconds reveal severe cell loss, as
indicated by the black dotted lines in figure 4.1(a).
Figure 4.1(b) indicated the calculated viability of the control and the heat shocked cells
The viability of the 45⁰C heat shocked cells was similar to the control group for all
exposure times. The 60⁰C heat shocked cells indicate that pulse durations beyond 4
seconds, result in a decrease in viability to less than 25%. After an exposure time of 4
seconds approximately 50% of cells survive. The percentage of viable cells after a 2
second heat shock of 60⁰C is shown to be slightly lower, approximately 90%, compared
to control values (96‐98%).
4.3.2 Influence of heat shock exposure time on metabolic activity The complete results of the metabolic activity of the cells per test condition per
measurement point of both heat shock temperatures are depicted in table 4.1.
Absorption values are normalized to the corresponding amount of cells. An overview of
this data can be visualized with the color scale indicated in figure 4.2. White depicts no
difference compared to the corresponding control situation. A color scale of 5 steps is
used to distinguish the differences between the groups. The shades of colors that are
assigned to the different measurement points are based on the values from table 4.1. It
can be seen that beyond an exposure time of 16 seconds for the 45⁰C heat shocked cells
the metabolic activity of all cells is extremely low compared to the control values.
Figure 4.2: The color scale visualization of the metabolic activity of human dermal fibroblasts after exposure to the different heat shock conditions based on the data from table 4.1. The data were normalized to the control situation; the control was kept at 37⁰C. White depicts no difference compared to the corresponding control situation. Light up to dark green indicates more to extensively more metabolically active cells than the control. Light up to dark red depicts a lower to extremely lower metabolic activity compared to the corresponding control. Grey depicts the removed time points. Note: the absorption is proportional to the metabolic activity.
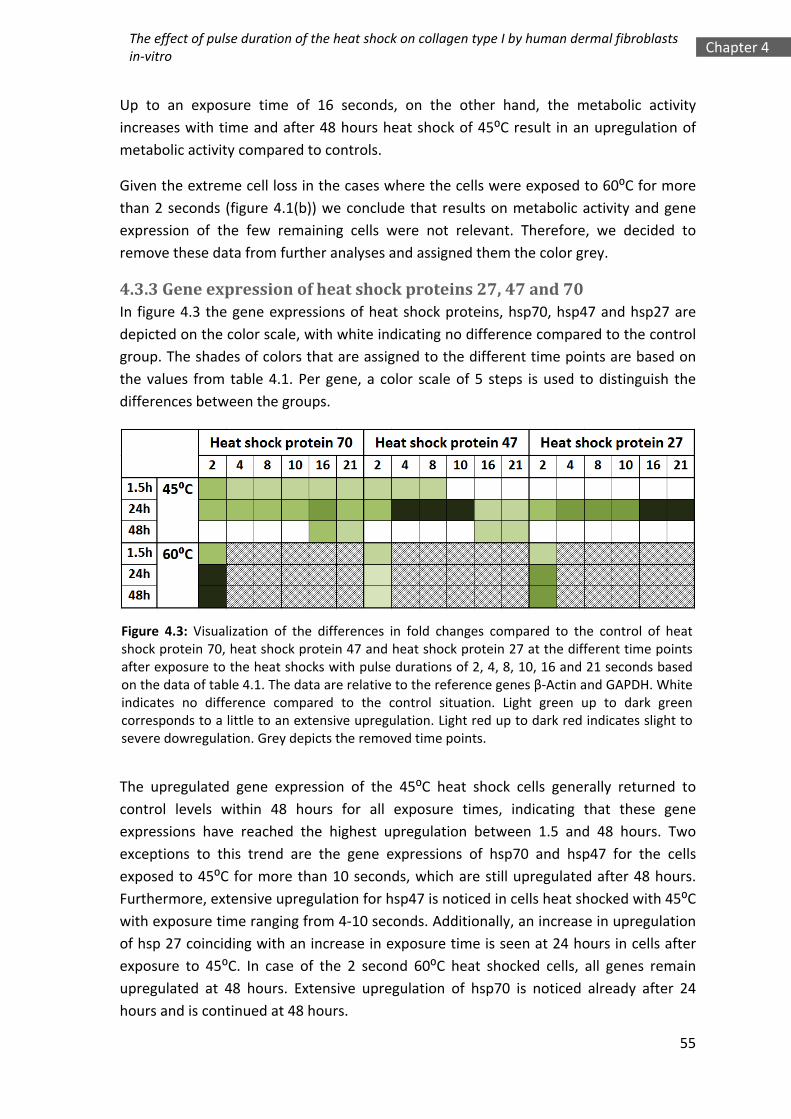
55
The effect of pulse duration of the heat shock on collagen type I by human dermal fibroblasts in‐vitro
Chapter 4
Up to an exposure time of 16 seconds, on the other hand, the metabolic activity
increases with time and after 48 hours heat shock of 45⁰C result in an upregulation of
metabolic activity compared to controls.
Given the extreme cell loss in the cases where the cells were exposed to 60⁰C for more
than 2 seconds (figure 4.1(b)) we conclude that results on metabolic activity and gene
expression of the few remaining cells were not relevant. Therefore, we decided to
remove these data from further analyses and assigned them the color grey.
4.3.3 Gene expression of heat shock proteins 27, 47 and 70 In figure 4.3 the gene expressions of heat shock proteins, hsp70, hsp47 and hsp27 are
depicted on the color scale, with white indicating no difference compared to the control
group. The shades of colors that are assigned to the different time points are based on
the values from table 4.1. Per gene, a color scale of 5 steps is used to distinguish the
differences between the groups.
The upregulated gene expression of the 45⁰C heat shock cells generally returned to
control levels within 48 hours for all exposure times, indicating that these gene
expressions have reached the highest upregulation between 1.5 and 48 hours. Two
exceptions to this trend are the gene expressions of hsp70 and hsp47 for the cells
exposed to 45⁰C for more than 10 seconds, which are still upregulated after 48 hours.
Furthermore, extensive upregulation for hsp47 is noticed in cells heat shocked with 45⁰C
with exposure time ranging from 4‐10 seconds. Additionally, an increase in upregulation
of hsp 27 coinciding with an increase in exposure time is seen at 24 hours in cells after
exposure to 45⁰C. In case of the 2 second 60⁰C heat shocked cells, all genes remain
upregulated at 48 hours. Extensive upregulation of hsp70 is noticed already after 24
hours and is continued at 48 hours.
Figure 4.3: Visualization of the differences in fold changes compared to the control of heat shock protein 70, heat shock protein 47 and heat shock protein 27 at the different time points after exposure to the heat shocks with pulse durations of 2, 4, 8, 10, 16 and 21 seconds based on the data of table 4.1. The data are relative to the reference genes β‐Actin and GAPDH. White indicates no difference compared to the control situation. Light green up to dark green corresponds to a little to an extensive upregulation. Light red up to dark red indicates slight to severe dowregulation. Grey depicts the removed time points.

56
Chapter 4
Ta
ble 4.1: I: M
etabolic activity; The absorption values per cell of the metabolic activity test of all test conditions. Values are norm
alized
to the
corresponding control values and depicted as the mean ± standard deviation (n = 4). II: Gene expression heat shock proteins; The fold change of
heat shock proteins 70, 47 and 27 of all the test conditions. Data are relative to the reference genes β‐Actin and GAPDH. V
alues shown as mean
± standard deviation (n = 4). III: Gene expression procollagen; The fold change of procollagen
type I and type III of all the test conditions. Data
are relative to the reference genes β
‐Actin and G
APDH. Values shown as mean ± standard deviation (n = 4). IV: Rem
odeling m
arkers;
Concentrations P1P and IC
TP per cell of all test conditions. Values are norm
alized
to the corresponding control values and depicted as the mean
± standard deviation (n = 4).

57
The effect of pulse duration of the heat shock on collagen type I by human dermal fibroblasts in‐vitro
Chapter 4
4.3.4 Gene expression of procollagen type I and III A similar color scale is used to show the gene expression of procollagen type I and III for
all time points as illustrated in figure 4.4. The different shades of colors that are assigned
to the different values of each time point are based on the values from table 4.1. After
exposure to heat shock of 45⁰C for each of the pulse durations, there is a maximum
upregulation for both procollagen types I and III gene expression at 24 hours.
Subsequent gene expression decreases to values similar to control by 48 hours. In
contrast to the shorter exposure times, procollagen type III gene expression of cells
exposed to 45⁰C beyond 10 seconds is extensively upregulated. The results of the 2
seconds at 60⁰C heat shocked cells show a different pattern, with procollagen type I
being upregulated within 1.5 hours and remaining upregulated after 48 hours.
Procollagen type III gene expression, on the other hand, starts with upregulation at 1.5
hours and within 48 hours this gene is downregulated.
Figure 4.4: Visualization of the differences in fold changes of procollagen type I and procollagen type III compared to the control at the different time points after exposure to pulsed heat shocks with pulse durations of 2, 4, 8, 10, 16 and 21 seconds based on the values from table 4.1. The data are relative to the reference genes β‐Actin and GAPDH. White indicates no difference compared to the control situation. Light green up to dark green corresponds to a little to an extensive upregulation. Light red up to dark red indicates slight to severe downregulation. Grey depicts the removed time points.
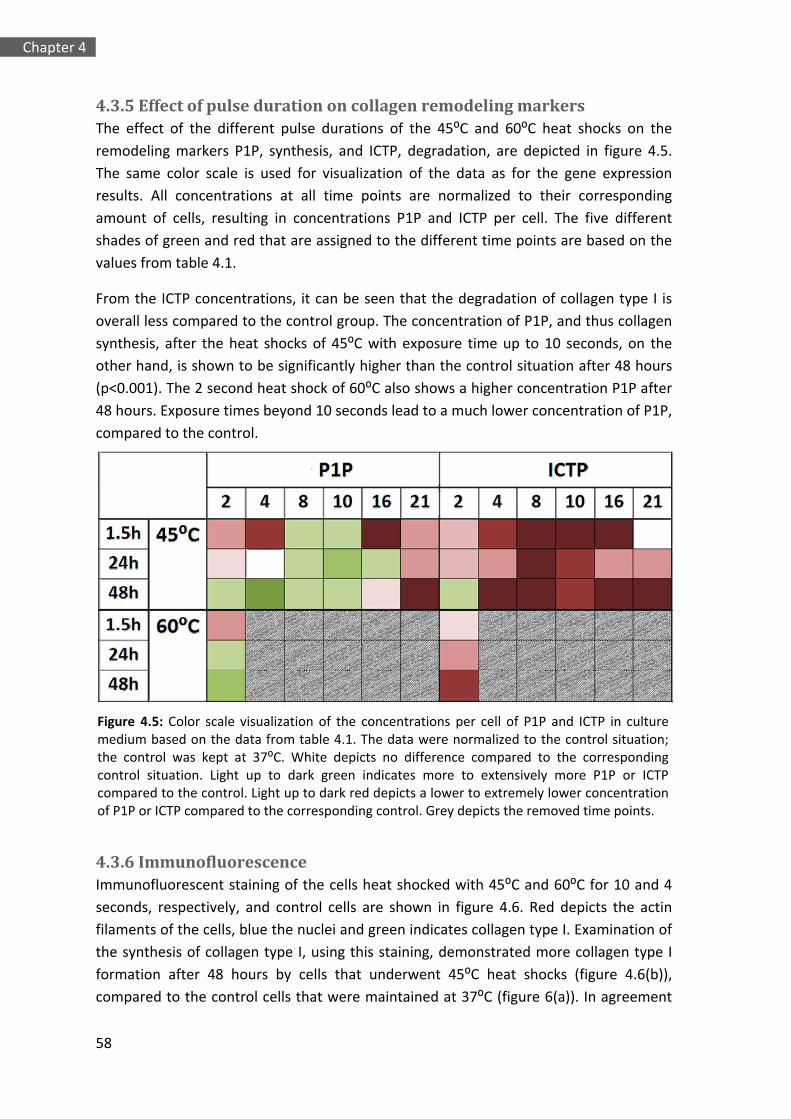
58
Chapter 4
4.3.5 Effect of pulse duration on collagen remodeling markers The effect of the different pulse durations of the 45⁰C and 60⁰C heat shocks on the
remodeling markers P1P, synthesis, and ICTP, degradation, are depicted in figure 4.5.
The same color scale is used for visualization of the data as for the gene expression
results. All concentrations at all time points are normalized to their corresponding
amount of cells, resulting in concentrations P1P and ICTP per cell. The five different
shades of green and red that are assigned to the different time points are based on the
values from table 4.1.
From the ICTP concentrations, it can be seen that the degradation of collagen type I is
overall less compared to the control group. The concentration of P1P, and thus collagen
synthesis, after the heat shocks of 45⁰C with exposure time up to 10 seconds, on the
other hand, is shown to be significantly higher than the control situation after 48 hours
(p<0.001). The 2 second heat shock of 60⁰C also shows a higher concentration P1P after
48 hours. Exposure times beyond 10 seconds lead to a much lower concentration of P1P,
compared to the control.
4.3.6 Immunofluorescence Immunofluorescent staining of the cells heat shocked with 45⁰C and 60⁰C for 10 and 4
seconds, respectively, and control cells are shown in figure 4.6. Red depicts the actin
filaments of the cells, blue the nuclei and green indicates collagen type I. Examination of
the synthesis of collagen type I, using this staining, demonstrated more collagen type I
formation after 48 hours by cells that underwent 45⁰C heat shocks (figure 4.6(b)),
compared to the control cells that were maintained at 37⁰C (figure 6(a)). In agreement
Figure 4.5: Color scale visualization of the concentrations per cell of P1P and ICTP in culture medium based on the data from table 4.1. The data were normalized to the control situation; the control was kept at 37⁰C. White depicts no difference compared to the corresponding control situation. Light up to dark green indicates more to extensively more P1P or ICTP compared to the control. Light up to dark red depicts a lower to extremely lower concentration of P1P or ICTP compared to the corresponding control. Grey depicts the removed time points.

59
The effect of pulse duration of the heat shock on collagen type I by human dermal fibroblasts in‐vitro
Chapter 4
with the remodeling marker data (figure 4.5), the immunostaining of the cells exposed
for 10 seconds to 45⁰C show more expression. Figure 4.6c shows that the heat shock of
60⁰C severely disrupted the cytoskeleton of the cells as indicated by the arrows.
4.4 Discussion This study demonstrates that heat shocks of 45⁰C for 8 to 10 seconds applied to human
dermal fibroblasts in‐vitro result in the highest amount of net collagen content (figure
4.5). These high levels of collagen type I are shown to be preceded by upregulation of
procollagen type I gene expression (figure 4.4).
Procollagen type I expression has previously been shown to be upregulated very shortly
after short pulsed heat shocks (Dams et al., 2010). The present study also demonstrates
an early upregulation of procollagen type I. Moreover, it is noticed that gene expression
of procollagen type I by cells, exposed to 45⁰C for all exposure times, has returned to the
level of the control situation at 48 hours, indicating that the highest upregulation must
have occurred between 1.5 and 48 hours. A similar trend was also observed for the gene
expression of hsp47. Since hsp47 has the ability to bind procollagen I for transportation
to the Golgi system and takes an active role in the collagen type I synthesis (Dams et al.,
2010; Naitoh et al., 2001; Tasab et al., 2000; Verrico and Moore, 1997), it can be
suggested that our findings are consistent with this physiological process.
Apart from quantification of collagen on gene expression level, markers for collagen
synthesis (P1P) and degradation (ICTP) were measured to provide more understanding
in the effect of heat shocks on the collagen metabolic balance. Procollagen propeptides
(P1P) are cleaved from procollagen, which is a precursor molecule, during synthesis of
collagen type I. The balance between synthesis and degradation, resulting in the net
collagen content, clearly depends on the temperature and pulse duration of the heat
shocks. Our results suggest that collagen type I synthesis is highest after heat shocks of
45⁰C of 8 to 10 seconds. For the same exposure times at 45⁰C the concentration of
collagen degradation marker, ICTP, which is released upon cleavage of collagen by
Figure 4.6: Immunofluorescent staining for collagen type I after 48 hours of the control (a) cells exposed to a 45⁰C heat shock for 10 seconds (b), and cells exposed to a 60⁰C heat shock for 4 seconds (c). Green indicates collagen type I, red indicates the actin filaments (Phalloidin) of the cells and blue depicts the cell nuclei (DAPI). Note: the lower cell density and the degradation of the actin filaments after a 60⁰C heat shock.

60
Chapter 4
MMPs, was significantly lower than the control (figure 4.5). This results in the highest
amount of net collagen after treatment 45⁰C for 8 and 10 seconds. In addition, our
findings demonstrated that the 45⁰C heat shock induces a 24 hour upregulation of
procollagen type III.
Heat shock protein 70 is used as biomarker to indicate that the cells recognize the heat
shock (Mayes and Holyoak, 2008; Rattan, 1998; Verbeke et al., 2007). It is clear from the
expression of hsp70 that we have demonstrated that both heat shock temperatures can
stimulate the fibroblasts, which is in accordance with other studies (Snoeckx et al., 2007;
Verbeke et al., 2007). However, it is noticed that the expression of hsp70 by the cells
after being exposed to 45⁰C beyond 10 seconds remains upregulated. A similar trend is
noticed for the gene expression of hsp47. We suggest that a 45⁰C heat shock with an
exposure time beyond 10 seconds has a traumatizing effect on the cells, which results in
a negative response in collagen production of these cells.
The gene expression of hsp27 after the 45⁰C heat shocks is upregulated at 24 hours and
an increasing upregulation is seen with increasing exposure times. However, after 48
hours the gene expressions have returned to the control level, meaning that those cells
are no longer compromised.
A previous study reported that repeated mild heat shocks of 41⁰C for 60 minutes did not
influence the proliferation rate of the cells (Rattan, 1998). In the present study, no
significant changes in proliferation rate were observed after the 45⁰C heat shocks either
(figure 4.1(a)).
The procollagen type III gene expression by cells exposed to the 60⁰C heat shock
returned to control levels at 24 hours and was subsequently downregulated at 48 hours.
However, these cells continue upregulating procollagen type I at 48 hours. We have
found that the influence of the heat shocks of 60⁰C for exposure times beyond 2
seconds resulted in lower proliferation rate than that of the control group (figure 4.1(a)).
A similar trend was evident with the viability, which decreases to 10%‐50% within 2
days. Accordingly, any further analysis was considered only to reflect severe cell loss as
opposed to temperature changes due to heat shocks.
The effect of heat generation in the dermis is thought to cause collagen denaturation
and injury, leading to a wound healing response (Capon and Mordon, 2006). From this
perspective it is known that collagen type III is the first protein that will be deposited to
heal the extracellular matrix. Subsequently, this protein will be replaced by collagen type
I (Farber and Rubin, 1998). Therefore, to detect early extracellular matrix regeneration
procollagen type I and III are effective biomarkers. Rejuvenation is a complex
physiological process that, assuming that an increase in collagen synthesis is one of the
desired phenomena, can be related to the intricate physiology of wound healing. The
complexity of these physiological pathways is beyond the scope of our research;
61
The effect of pulse duration of the heat shock on collagen type I by human dermal fibroblasts in‐vitro
Chapter 4
nevertheless, our results demonstrate that the heat shocks stimulate the cells into
producing more collagen.
There are clear differences in the physiological processes activated during stimulation at
the two temperatures. Hypothetically, it can be suggested that with the 45⁰C heat shock
the cells are mildly stimulated, while at 60⁰C the cells are damaged, as demonstrated by
our immunofluorescent staining results, where a severely compromised cytoskeleton
can be seen (figure 4.6c). Additionally, our gene expression results of hsp27, a damage
marker, reveal a continuous upregulation after the heat shock of 60⁰C, which supports
our suggestion. This does not mean, however, that 60⁰C pulses cannot be useful in
practice. It is clear that at a local level cells are damaged, but in in‐vivo skin this will
trigger a wound healing response that may also be beneficial for rejuvenation.
These findings are based on in‐vitro cell cultures. However, the response of cells in a
three dimensional environment in skin may be different. Therefore, for future research
this study should be extended towards ex‐vivo or in‐vivo skin studies. Moreover, in this
study only temperatures of 45⁰C and 60⁰C were used. However, after our findings of
severe cell loss at 60⁰C, investigating temperatures in between 45⁰C and 60⁰C might
prove an interesting avenue of future research.

62
Chapter 4

Chapter 5 The effect of thermal stimuli on dermal
fibroblast in exvivo human skin
Abstract
Background: Well‐known characteristics of aging skin are the development of fine lines and
wrinkles, but also changes in skin tone, skin texture, thickness and moisture content are features
of aging. Rejuvenation of the skin aims at reversing the signs of aging and can be established in
the epidermis as well as in the dermis. In addition, aged dermis has a degenerated collagen
matrix. To regenerate this matrix, fibroblasts need to be stimulated into synthesizing new
collagen. Aims: In this study, the effects of heat shocks of different temperatures on human
dermal fibroblasts in ex vivo skin on the expression of procollagen 1, procollagen 3, hsp27,
hsp47, and hsp70 are investigated. Materials & Methods: The heat shocks were applied on ex‐
vivo skin samples by immersing the samples in heated PBS at 45⁰C or 60⁰C. Metabolic activity
was measured and, at similar time points, propidium‐iodide‐calcein staining was performed to
establish cell viability. Quantitative PCR was performed after the heat shock to determine gene
expression levels relative to the reference temperature. Furthermore, PicroSirius Red and
Haematoxylin stainings were performed to visualize the collagen network and the cells. Results:
The skin samples appeared to be viable and metabolically active. Histology demonstrated that
the heat shocks did not influence the structure of the collagen network or cell appearance.
Quantitative PCR results showed that, in contrast to the 45⁰C heat shock, the 60⁰C heat shock
resulted in significant upregulations of procollagen type I and III, Hsp 70 and Hsp47. Conclusion:
A 60⁰C heat shock stimulates the human dermal fibroblasts in ex‐vivo skin to upregulate their
procollagen type I and type III expression.
The contents of this chapter are based on S.D. Dams, M. de Liefde‐van Beest, A.M. Nuijs,
C.W.J.Oomens, F.P.T. Baaijens. Heat shocks enhance procollagen type I and III expression
in fibroblasts in ex vivo human skin. Skin Res. Tech. (submitted)

64
Chapter 5
5.1 Introduction The skin is the largest organ of the human body. Like other organs it has the ability to
grow, develop and repair itself. Roughly, the skin can be divided into three layers; the
epidermis, dermis and hypodermis. The epidermis is 50‐150 µm thick, depending on the
part of the body and skin type (Lewis et al., 1994). The dermis thickness varies from 300
µm on the eyelids to 3 mm on the back (Ebling et al., 1992). The main component of the
dermis is the supporting extracellular matrix. This matrix consists of complexes of
supportive proteins, such as collagen, elastin and proteoglycans, which are synthesized
by dermal fibroblasts (Ebling et al., 1992; Geronemus, 2006). The dermis can be divided
into the papillary dermis, situated directly under the epidermis, and the reticular dermis,
located between the papillary dermis and the hypodermis (Farber and Rubin, 1998). The
hypodermis, also called the subcutaneous layer, is the deepest layer and is composed
primarily of fat cells (Ebling et al., 1992).
As well as any other organ of the human body the skin ages. With increasing age the
characteristics of the skin change and its appearance becomes different (Dimri et al.,
2007). Visible changes are roughness (dryness), wrinkling, laxity, and uneven
pigmentation (Bjerring, 2006; Diridollou et al., 2007; Gilchrest, 2007a; Gilchrest, 2007c;
Gilchrest and Bohr, 2006; Leveque et al., 2007b; Swelstad and Gutowski, 2006). These
features are due to two important alterations that occur in the different layers of the
skin. In the present study we are interested in changes, wrinkling and laxity, in the
dermis. Firstly, the fibroblasts divide more slowly and the dermis becomes thinner,
thereby having an increased susceptibility for damage. Secondly, the underlying network
of elastin and collagen fibers loosens and unravels, resulting in wrinkling and sagging of
the skin (Gilchrest, 2007b; Kurban and Bhawan, 2007). The aging process can be
described by changes in e.g. dermal components like collagen, elastic fibers,
proteoglycans and fibroblasts, caused by intrinsic and extrinsic aging (Ebling et al., 1992;
Geronemus, 2006; Gilchrest, 2007a; Gilchrest, 2007b). Therefore cutaneous aging can be
seen as a complex biological phenomenon affecting the different constituents of the
skin.
Reducing effects of aging is a biologically beneficial effect of a physiological process,
called hormesis, which is represented by mild stress‐induced stimulation of protective
mechanisms in cells and organisms. In the aging process hormesis is defined as a
beneficial rejuvenating mechanism resulting from the cellular responses to single or
multiple rounds of mild stress. Single or multiple exposure to low doses of otherwise
harmful agents, such as irradiation and heat stress are some of the factors that induce
hormetic effects (Rattan, 1998).
The aim of many rejuvenation techniques is to induce thermal stress. Among the
rejuvenation methods used, the non‐ablative techniques are gaining popularity. These
methods claim to induce dermal remodeling without global epidermal injury, using a

65
The effect of thermal stimuli on dermal fibroblast in ex‐vivo human skin Chapter 5
thermal approach. Light sources, like lasers and broad band lamps, radio frequency and
ultrasound are techniques that can be used as non‐ablative rejuvenation methods. The
energy is applied as short nanosecond to millisecond pulses or in a continuous wave,
resulting in a local temperature increase (Bjerring, 2006; Capon and Mordon, 2006;
Geronemus, 2006; Sadick, 2006). In literature it is stated that laser treatment causes
two effects. On the one hand, a thermal effect where chromophores absorb the energy
of the photons and convert this into heat, which subsequently diffuses throughout the
skin. On the other hand a non‐thermal photochemical effect on the cells in the skin;
photons are absorbed by cytochrome‐c proteins, that are located on the membrane of
the human dermal fibroblasts, resulting in an increased metabolic activity of the cells
(Dinh, 2006; Lubart et al., 2007; Pereira et al., 2007; Rattan, 1998). The present paper
focuses on the thermal effect on the fibroblasts in ex‐vivo skin.
When tissue, such as skin, is exposed to a temperature increase, different effects are
observed depending on the temperature and duration of the temperature increase. It is
found in literature that denaturation of the enzymes and of the membranes occurs at
40‐45oC; coagulation, necrosis and protein denaturation occur at 60oC (Orringer et al.,
2005). Among these temperatures, 45⁰C is a characteristic temperature used frequently
in photodynamic therapy (Capon and Mordon, 2006; Verrico et al., 2001; Verrico and
Moore, 1997). The temperature range from 57 to 61°C is known to induce shrinkage of
collagen. However, the amount of collagen contraction is determined by a combination
of time and temperature (Ruiz‐Esparza, 2006).
Thermal collagen injury could lead to the complex physiological response of wound
healing (Goldberg, 2006; Sadick, 2006), where in the phase of collagen deposition first
collagen type III is synthesized and subsequently is substituted by collagen type I up to
the ratio of healthy skin (Capon and Mordon, 2006; Stadelmann et al., 2006). It is
suggested that dermal fibroblasts react to thermal injury with a heat shock response.
Heat shock proteins are produced by fibroblasts to protect the surrounding proteins and
the cells from necrosis and apoptosis (Capon and Mordon, 2006). Relevant heat shock
proteins for skin regeneration are:
hsp70; a highly inducible protein that is overproduced when a cell encounters a
swift change to a higher temperature (Bowers et al., 2007; Kovalchin et al., 2006;
Laszlo, 2007; Ohtsuka and Laszlo, 2007; Snoeckx et al., 2007; Souil et al., 2001;
Tandara et al., 2007),
hsp47; a constitutive protein that binds and transports procollagen from
endoplasmic reticulum to the Golgi system and plays an active role in collagen
type I synthesis (Brown et al., 2007; Naitoh et al., 2001; Tasab et al., 2000;
Verrico and Moore, 1997), and

66
Chapter 5
hsp27; a constitutive protein that in case of overexpression protects the cell from
apoptosis when it encounters a heat shock (Frank et al., 2004; Hirano et al.,
2004; Snoeckx et al., 2007).
In our previous study we have shown that these heat shock proteins qualify as
biomarkers (Dams et al., 2010). The response of dermal fibroblasts in culture to
repeated mild heat shocks has been investigated. These results showed that repeated
mild (39⁰C ‐ 42⁰C) heat shocks have beneficial effects on aged cells (Geronemus, 2006;
Mayes and Holyoak, 2008; Rattan, 1998). However, the duration of the heat shocks
applied was between 30 minutes and 1 hour, which is relatively long and could induce
thermotolerance (Ohtsuka and Laszlo, 2007). We showed that a pulsed heat shock of
two seconds of 45⁰C as well as 60⁰C resulted in an increase of procollagen type I
synthesis, preceeded by an increase of procollagen type I gene expression by human
dermal fibroblasts in‐vitro (Dams et al., 2010) .
Although several ablative and non‐ablative rejuvenation techniques, based on inducing
thermal stimuli, are already used extensively, the processes that are taking place as a
result of skin treatment are still not fully understood. A result such as an increase in
collagen synthesis is one of the assumed phenomena in skin rejuvenation (Bjerring et al.,
2007; Capon and Mordon, 2006; Narurkar, 2006; White et al., 2007). The present
research is aimed at answering the question whether thermal shocks lead to an increase
of procollagen type I and III gene expression by the fibroblasts in ex‐vivo skin, being the
precursors for more collagen synthesis.
In this paper we heat shock human dermal fibroblasts in their physiological
environment, the viable dermis. The aspect of interest is how these cells in the skin
respond to the thermal stimulation. For regeneration of the collagen matrix a primary
need is stimulation of the dermal fibroblasts to synthesize new collagen. Therefore, in
this study we aim to stimulate human dermal fibroblasts in human skin to increase the
gene expression of procollagen type I and type III as a precursor for the formation of a
new collagen matrix. In addition we use heat shock proteins 27, 47 and 70 as biomarkers
for respectively the need for protection from apoptosis, a precursor for collagen I
synthesis, and for recognition of the heat shock.
5.2 Materials and Methods
5.2.1 Sample preparation Excised human skin was obtained from 6 patients undergoing abdominoplasty at the
Catharina Hospital Eindhoven. This material was anonymized after the procedure,
making tracing back to the patient impossible. The procedure was in conformity with the
code of conduct for use of human material as stated by the Dutch Federation of
Biomedical Scientific Societies. Sample preparation was carried out quickly after
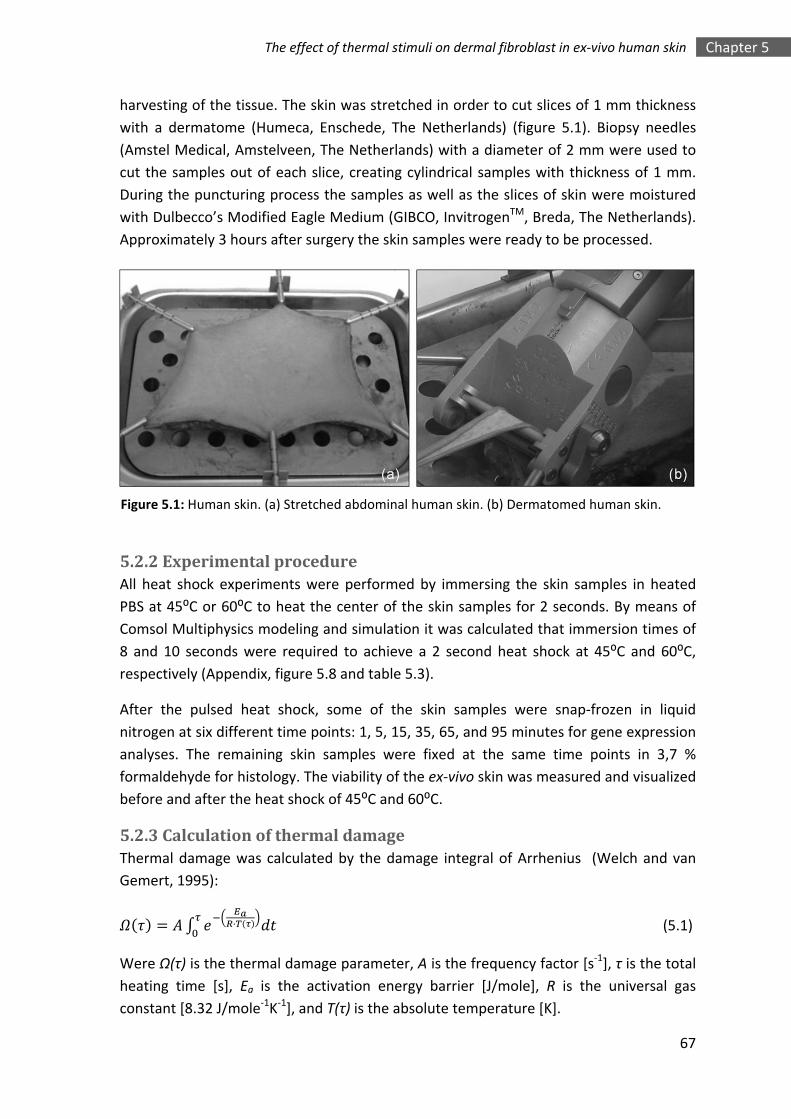
67
The effect of thermal stimuli on dermal fibroblast in ex‐vivo human skin Chapter 5
harvesting of the tissue. The skin was stretched in order to cut slices of 1 mm thickness
with a dermatome (Humeca, Enschede, The Netherlands) (figure 5.1). Biopsy needles
(Amstel Medical, Amstelveen, The Netherlands) with a diameter of 2 mm were used to
cut the samples out of each slice, creating cylindrical samples with thickness of 1 mm.
During the puncturing process the samples as well as the slices of skin were moistured
with Dulbecco’s Modified Eagle Medium (GIBCO, InvitrogenTM, Breda, The Netherlands).
Approximately 3 hours after surgery the skin samples were ready to be processed.
5.2.2 Experimental procedure All heat shock experiments were performed by immersing the skin samples in heated
PBS at 45⁰C or 60⁰C to heat the center of the skin samples for 2 seconds. By means of
Comsol Multiphysics modeling and simulation it was calculated that immersion times of
8 and 10 seconds were required to achieve a 2 second heat shock at 45⁰C and 60⁰C,
respectively (Appendix, figure 5.8 and table 5.3).
After the pulsed heat shock, some of the skin samples were snap‐frozen in liquid
nitrogen at six different time points: 1, 5, 15, 35, 65, and 95 minutes for gene expression
analyses. The remaining skin samples were fixed at the same time points in 3,7 %
formaldehyde for histology. The viability of the ex‐vivo skin was measured and visualized
before and after the heat shock of 45⁰C and 60⁰C.
5.2.3 Calculation of thermal damage Thermal damage was calculated by the damage integral of Arrhenius (Welch and van
Gemert, 1995):
· (5.1)
Were Ω(τ) is the thermal damage parameter, A is the frequency factor [s‐1], τ is the total
heating time [s], Ea is the activation energy barrier [J/mole], R is the universal gas
constant [8.32 J/mole‐1K‐1], and T(τ) is the absolute temperature [K].
Figure 5.1: Human skin. (a) Stretched abdominal human skin. (b) Dermatomed human skin.

68
Chapter 5
The heat shocks in the performed experiments have short durations, 8 and 10 seconds,
to achieve 45⁰C and 60⁰C, respectively. As a result of these pulse durations, the thermal
damage calculation can be simplified by calculating the threshold temperature:
· · (5.2)
Tthresh is the threshold temperature [K] above which irreversible damage to proteins will
occur (Welch and van Gemert, 1995).
5.2.4 Determination of viability of ex vivo skin The viability of the ex‐vivo skin samples was determined before and after the heat
shocks of 45⁰C and 60⁰C by staining with calcein AM (Fluka cat. # 17783) and propidium‐
iodine (Cat. No. P3566, InvitrogenTM). Calcein is well retained within viable cells,
producing an intense uniform green fluorescence. The propidium iodide (PI) dye is
excluded from the viable cells. This dye will enter necrotic cells and binds DNA, which
becomes visible with red fluorescence (Breuls et al., 2003).
Each sample was incubated in calcein at a concentration of 1 µg/ml PBS for 30 minutes
after the thermal stimulus. This step was followed by several washings in PBS and
subsequently the samples were incubated in 7 µg/ml propidium‐iodide concentration
for 15 minutes. The skin samples were washed and their viability was visualized with a
confocal laser scanning microscope (Carl Zeiss B.V., Sliedrecht, The Netherlands).
5.2.5 Determination of the metabolic activity of the ex vivo skin The metabolic activity was measured before and directly after the heat shock
experiment using the 3‐[4,5‐dimethylthiazol‐2‐yl]‐2,5‐diphenyl tetrazolium bromide
(MTT) based in vitro toxicology assay kit (Sigma, Breda, The Netherlands). The skin
samples were placed in a 6‐well plate, one sample per well. Per well 250 µl MTT solution
(M 5655, Sigma, Breda, The Netherlands) was added immediately and the 6‐well plates
were placed at 37⁰C for 3 hours. Subsequently, 250 µl per well isopropanol (Merck,
Darmstadt, Germany) was added and the 6‐well plates were placed on a shaker
(Titramax 1000, Heidl Instruments, Germany) at 300 rpm for another 30 minutes.
Metabolically active cells in the tissue cleaved the molecules of the MTT solution
resulting in precipitation of formazan crystals. After the 30 minutes of incubation the
crystals were dissolved in isopropanol resulting in a purple solution. Absorbance was
spectrophotometrically measured at a wavelength of 570 nm (Biotek Synergy, Beun de
Ronde, The Netherlands).
5.2.6 Histological and immunohistochemical analyses The fixed skin samples were embedded in paraffin and cut into sections of 8 µm. The
sections were de‐waxed and rehydrated before they were incubated with 0.1%
PicroSirius Red for one hour to stain collagen. Subsequently, the sections were placed in
Weigert’s iron Haematoxylin for 10 minutes to visualize the nuclei of the cells. Next, the

69
The effect of thermal stimuli on dermal fibroblast in ex‐vivo human skin Chapter 5
sections were washed in running tapwater for 5 minutes and mounted on coverslips
with entallan (Merck, Darmstadt, Germany). The stained skin samples were visualized
using bright‐field and circular cross‐polarized microscopy (Axiovert 200M, Zeiss) at room
temperature with a 10 objective (Zeiss LD ACHROPLAN) and a NA of 0.4. Haematoxylin
stains the nuclei dark blue/black and PicroSirius Red stains the collagen fibers
orange/red when visualized with bright‐field microscopy. When visualizing the stained
tissue sections with circular cross‐polarized microscopy, the cells appear black whereas
the thin immature collagen fibers appear green and the thick mature collagen bundles
are orange (Bancroft and Gamble, 2002).
For heat shock protein 27, immunohistochemical analysis on the paraffin embedded skin
sample sections was performed. The sections were de‐waxed, rehydrated, washed in
PBS for 5 minutes and incubated in Tris‐EDTA buffer at room temperature for 20
minutes for epitope retrieval. Subsequently, the sections were incubated in 1% BSA for
30 minutes, to block non‐specific binding, and washed for 5 minutes in 0.1% Tween 20, 5
minutes in 1% Triton X‐100 and 5 minutes in PBS. After these washing steps the sections
were incubated at 4⁰C overnight with the primary antibody against Hsp27 (1:100)
(Abcam, Cambridge, USA). Next, the sections were washed for 5 minutes with 0.1%
Tween 20 and 3 times at 5 minutes with PBS. Then, the sections were incubated with
horse radish peroxidase‐conjugated goat anti rabbit IgG secondary antibody (1:1000)
(Abcam, Cambridge, UK). After washing, the sections were visualized with DAB, 3,3′‐
Diaminobenzidine tetrahydrochloride, (Sigma Aldrich, Breda, The Netherlands) followed
by washing in PBS twice for 5 minutes. Then, the sections were counterstained with
Weigert’s iron Haematoxylin for 10 minutes and mounted with Mowiol. The sections
were evaluated using bright‐field microscopy (Axiovert 200M, Zeiss) at room
temperature with a 20 obejective (Zeiss LD ACHROPLAN) at an NA of 0.6. The HRP with DAB reaction results in a dark brown color.
For the histology as well as the immunohistochemistry analyses a Zeiss AxioCam HRM
camera was used with Zeiss AxioVision Rel. 4.6 acquisition software.
5.2.7 Determination of gene expression levels of heat shock proteins 27, 47, 70 and procollagen type I and III The skin samples, used for quantitative PCR, were snap‐frozen in liquid nitrogen at six
different time points (t = 1, 5, 15, 35, 65, 95 min) after the heat shock and stored at
‐80⁰C. The skin samples were mashed in lysis buffer (Qiagen, Venlo, The Netherlands)
containing 1% β‐mercaptoethanol (Merck, Darmstadt, Germany) with an Ultraturrax
(IKA, Staufen , Germany), before total RNA could be obtained. Total RNA was isolated
using RNeasy kit (Qiagen) in accordance with the manufacturer’s protocol. The
concentration and purity of the total RNA was determined at OD 260/280 nm
measurements (Nanodrop, Isogen, Scotland). RNA integrity was assessed using gel‐
electrophoresis. 225 ng RNA and random primers were used for cDNA synthesis using

70
Chapter 5
M‐MLV reverse transcriptase (Invitrogen™, Carlsbad, USA). Gene expression analysis was
performed on an iCycler Real‐Time PCR detection system (Biorad, Veenendaal, The
Netherlands) using iQ™ SYBR®‐Green supermix (Biorad). Primers for hsp27, hsp47, hps70
and procollagen type I and III were used as recently described in chapter 3 (Dams et al.,
2010). Results were normalized using reference genes β‐Actin and GAPDH, obtained
from Primerdesign (South Hampton, U.K.). Fold changes, 2‐∆∆Ct, were calculated
manually.
5.2.8 Statistical analysis All data are presented as means and their standard deviations for a sample
measurement of n = 6. Comparisons of gene expression levels between the control and
experimental groups were performed by a one‐sampled unpaired t‐test. Comparisons of
gene expression levels between the experimental groups were performed by a two‐
sampled unpaired t‐test. Differences in both comparisons were considered significant at
p < 0.05.
5.3 Results
5.3.1 Viability and structure ex vivo skin The effects of the heat shocks on the metabolic activity and the corresponding cellular
viability are illustrated in figure 5.2. The absorption levels are proportional to the
metabolic activity. As depicted in the figure the absorption levels of the 45⁰C and the
60⁰C heat shocked skin samples do not differ significantly from the samples before the
heat shock. Therefore, suggesting comparable cell viability between the three samples.
Figure 5.2: Metabolic activity of human dermal fibroblasts in ex vivo skin before (referred to ascontrol) and after exposure to the heat shocks. The control was kept at 37⁰C. The y‐axis showsthe absorption levels normalized to the control. Note: the absorption is proportional to themetabolic activity. The corresponding confocal images show viable cells appearing green andnon‐viable cells red.

71
The effect of thermal stimuli on dermal fibroblast in ex‐vivo human skin Chapter 5
Figure 5.3(a‐d) shows the results of the picrosirius red and haematoxylin staining
visualized with bright field microscopy. It can be seen in figure 5.3(a‐c) that the collagen
network, visualized in red, does not show any visible structural change in contrast to the
images of the skin sample kept at 60⁰C for one hour (figure 5.3(d)). In the latter case,
changes can be seen, including severe damage of the epidermal cells and disruption of
the dermal cells. Furthermore, structural details of the collagen network in the dermal
matrix are no longer evident. In figure 5.3(b) and (c) the epidermal cells, visualized in
dark blue, stay intact. Furthermore, the dermis shows similar structural details as in the
control sample, depicted in figure 5.3(a).
Figures 5.3(e‐h) depict the results of identical slices as in figure 5.3(a‐d) focused on the
same locations visualized with circular cross‐polarized microscopy. The mature, thick
collagen fibers are depicted in orange and the young, thin collagen fibers are shown in
green. Figures 5.3(e‐g) demonstrate the intact collagen structure; with no difference in
the ratio of orange and green fibers between the heat shocked skin samples and the
control samples, indicating an intact collagen matrix. Figure 5.3(h), however, clearly
shows a disrupted collagen matrix. The ratio of orange and green fibers in this treated
skin sample is changed to predominantly orange compared to the control sample. This
result implies destruction of the immature collagen fibers.
5.3.2 Effect of heat shocks on the gene expression of heat shock proteins 27, 47 and 70 The average fold change of hsp70 of the cells in the skin samples over six patients per
time point is depicted in figure 5.4(a). It is noticed that the pulsed heat shocks of 45⁰C as well as the heat shocks of 60⁰C result in an elevated expression of hsp70 after 15
minutes. The upregulation after the 60⁰C heat shock, however, shows a more
substantial increase after 65 minutes.
Figure 5.4 (b) represents the averaged fold changes per time point of hsp47 in the skin
samples of six different patients after the pulsed heat shocks. These data show that the
60⁰C heat shock resulted in an immediate overall significant increase in hsp47 mRNA,
while the heat shock of 45⁰C caused a delayed upregulation after 65 minutes.
Regarding the mean fold changes of hsp27, figure 5.4 (c) shows an overall significant
instantaneous increase in expression after the heat shock of 60⁰C. Results of the
expression of hsp27 in cells in the skin samples heat shocked with 45⁰C showed no
significant upregulation.

72
Chapter 5
Figure 5.3: Picrosirius red with Haematoxilyn staining results visualized with bright field (a‐d) andcross‐polarized (e‐h) microscopy. Cells are depicted in dark blue and the collagen bundles arecolored red. Figures 3(a) and 3(e) depict the control samples fixated after 95 minutes aftertreatment. In figures 3(b) and 3(f) the staining on the fixated tissue samples of 95 minutes afterthe 45⁰C heat shock are shown. The skin samples heat shocked at 60⁰C and fixated at t = 95 afterthe pulsed heat shock is depicted in figures 3(c) and 3(g). In figures 3(d) and 3(h) results aredemonstrated of a skin sample 95 minutes after treatment with 60⁰C for one hour.

73
The effect of thermal stimuli on dermal fibroblast in ex‐vivo human skin Chapter 5
Figure 5.4: Mean fold changes, 2‐∆∆Ct of heat shock protein 70 (a), heat shock protein 47 (b) andheat shock protein 27 (c) at the different time points after exposure to the heat shock. The dataare relative to the control and the reference genes β‐Actin and GAPDH. The x‐axis depicts thetime given in minutes. The y‐axis shows the mean fold changes of the cells in the skin samplesheat shocked at 45⁰C and 60⁰C, dashed and solid line, respectively. Data are shown as the mean± SD for 6 independent experiments each run in duplicate with significant differences comparedto control for 45⁰C heat shocked samples at + p < 0.05, ++ p < 0.01 and +++ p < 0.001 and for 60⁰Cheat shocked samples at * p < 0.05, ** p < 0.01 and *** p < 0.001.

74
Chapter 5
5.3.3 Effect of heat shocks on the gene expression of procollagen type I and III The results of both 45⁰C and 60⁰C heat shock on the expression of procollagen type I
and type III are shown in figure 5.5. The figure indicates the mean fold changes over 6
patients per time point. An overall significant increase in expression for procollagen
type I can be seen for heat shocks at 45⁰C and, more substantially at 60⁰C (figure 5.5(a)).
As demonstrated in 5.5(b) both 45⁰C and 60⁰C heat shock resulted in an overall
significant increase in expression of procollagen type III instantaneously. However, the
60⁰C heat shock appeared to result in a higher upregulation compared to the 45⁰C heat
shock.
Figure 5.5: Mean fold changes, 2‐∆∆Ct, of procollagen type I (a) and procollagen type III (b) at thedifferent time points after exposure to the heat shock. The data are relative to the control andto the reference genes β‐Actin and GAPDH. The x‐axis depicts the time given in minutes. The y‐axis shows the mean fold changes of procollagen type III and procollagen type I of the cells inthe skin samples heat shocked at 45⁰C and 60⁰C, dashed and solid line, respectively. Data areshown as the mean ± SD for 6 independent experiments each run in duplicate with significantdifferences compared to control for 45⁰C heat shocked samples at + p < 0.05, ++ p < 0.01 and +++ p< 0.001 and for 60⁰C heat shocked samples at * p < 0.05, ** p < 0.01 and *** p < 0.001.

75
The effect of thermal stimuli on dermal fibroblast in ex‐vivo human skin Chapter 5
However, the 60⁰C heat shock appeared to result in a higher upregulation compared to
the 45⁰C heat shock. A different tendency over time can be observed: The heat shock of
60⁰C shows a consistent upregulation over time over the population, while the effect of
the 45⁰C heat shock appears to be more substantial after 65 minutes.
5.3.4 Thermal damage As explained in the introduction heat shock protein 27 is a biomarker to indicate early
damage response by fibroblasts. In figure 5.6 the results of the immunohistochemical
staining for hsp27 are shown. The stained skin samples heat shocked at 60⁰C appear to
show brown coloration around the cells, suggesting deposition of hsp27, indicated by
the arrows (figure 5.6(c)). By contrast the 45⁰C heat shock results in much less brown
coloration around the cells, as shown in figure 5.6(b), and cannot be distinguished from
the control, figure 5.6(a). The brown coloration in the epidermis, seen in all images, is a
result of the reaction of endogenous peroxidases in the epidermis with DAB (Shindo et
al., 1994).
The parameters for the calculation of the thermal damage according to the Arrhenius
integral are listed in table 5.1 in the Appendix. It follows from figure 5.7 that exposing
the sample for 10 seconds at 60⁰C likely causes irreversible damage to the proteins,
whereas following an exposure of 8 seconds at 45⁰C areas of damage are likely to be
reversible. However, it should be noticed that only the outer layer of the skin sample is
exposed to 60⁰C for the full 10 seconds.
5.4 Discussion This study has demonstrated that heat shocks stimulate cells in ex‐vivo skin to
upregulate gene expression of procollagen type I and procollagen type III as an initial
response. The heat shocks at both 45⁰C and 60⁰C cause an upregulation of procollagen type I and type III directly after the stimulus. In the case of the expression of procollagen
Figure 5.6: Immunohistochemical staining for hsp27 after 95 minutes of the control skin samplekept at 37⁰C (a), 45⁰C heat shocked skin sample (b), and 60⁰C heat shocked skin sample (c). Thedark brown region around the cells in the dermis (arrows) suggests the presence of hsp27. Thenuclei of the cells are depicted in blue. Note: the brown coloration in the epidermis is a result ofthe reaction of endogenous peroxidases with DAB (Shindo et al., 1994).
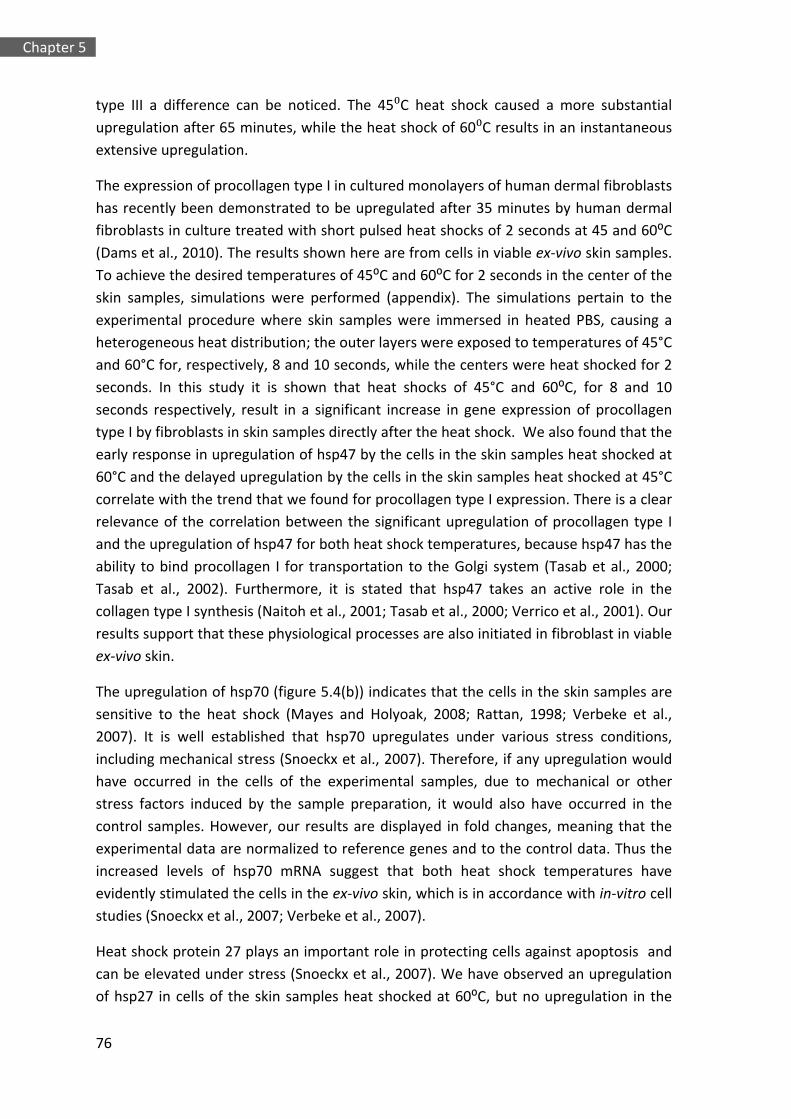
76
Chapter 5
type III a difference can be noticed. The 45⁰C heat shock caused a more substantial
upregulation after 65 minutes, while the heat shock of 60⁰C results in an instantaneous extensive upregulation.
The expression of procollagen type I in cultured monolayers of human dermal fibroblasts
has recently been demonstrated to be upregulated after 35 minutes by human dermal
fibroblasts in culture treated with short pulsed heat shocks of 2 seconds at 45 and 60⁰C
(Dams et al., 2010). The results shown here are from cells in viable ex‐vivo skin samples.
To achieve the desired temperatures of 45⁰C and 60⁰C for 2 seconds in the center of the
skin samples, simulations were performed (appendix). The simulations pertain to the
experimental procedure where skin samples were immersed in heated PBS, causing a
heterogeneous heat distribution; the outer layers were exposed to temperatures of 45°C
and 60°C for, respectively, 8 and 10 seconds, while the centers were heat shocked for 2
seconds. In this study it is shown that heat shocks of 45°C and 60⁰C, for 8 and 10
seconds respectively, result in a significant increase in gene expression of procollagen
type I by fibroblasts in skin samples directly after the heat shock. We also found that the
early response in upregulation of hsp47 by the cells in the skin samples heat shocked at
60°C and the delayed upregulation by the cells in the skin samples heat shocked at 45°C
correlate with the trend that we found for procollagen type I expression. There is a clear
relevance of the correlation between the significant upregulation of procollagen type I
and the upregulation of hsp47 for both heat shock temperatures, because hsp47 has the
ability to bind procollagen I for transportation to the Golgi system (Tasab et al., 2000;
Tasab et al., 2002). Furthermore, it is stated that hsp47 takes an active role in the
collagen type I synthesis (Naitoh et al., 2001; Tasab et al., 2000; Verrico et al., 2001). Our
results support that these physiological processes are also initiated in fibroblast in viable
ex‐vivo skin.
The upregulation of hsp70 (figure 5.4(b)) indicates that the cells in the skin samples are
sensitive to the heat shock (Mayes and Holyoak, 2008; Rattan, 1998; Verbeke et al.,
2007). It is well established that hsp70 upregulates under various stress conditions,
including mechanical stress (Snoeckx et al., 2007). Therefore, if any upregulation would
have occurred in the cells of the experimental samples, due to mechanical or other
stress factors induced by the sample preparation, it would also have occurred in the
control samples. However, our results are displayed in fold changes, meaning that the
experimental data are normalized to reference genes and to the control data. Thus the
increased levels of hsp70 mRNA suggest that both heat shock temperatures have
evidently stimulated the cells in the ex‐vivo skin, which is in accordance with in‐vitro cell
studies (Snoeckx et al., 2007; Verbeke et al., 2007).
Heat shock protein 27 plays an important role in protecting cells against apoptosis and
can be elevated under stress (Snoeckx et al., 2007). We have observed an upregulation
of hsp27 in cells of the skin samples heat shocked at 60⁰C, but no upregulation in the

77
The effect of thermal stimuli on dermal fibroblast in ex‐vivo human skin Chapter 5
cells heat shocked at 45⁰C. It is interesting to compare these results with the predictions
of the calculated thermal damage using the model of Arrhenius (Welch and van Gemert,
1995). According to this model the threshold temperature predicts that irreversible
damage occurs at 60⁰C after roughly 1 second (figure 5.7). Hence, an upregulation of hsp27 can be expected. Additionally, we suggest by means of immunohistochemical
analysis for hsp27 that this protein is notably present in the dermis after the heat shock
of 60⁰C (figure 5.6(c)).
Although several studies have shown that 60⁰C heat would destroy living tissue
(Mertyna et al., 2009), it can be concluded from our data that 45⁰C and 60⁰C heat shocks do not compromise the structure nor the viability of skin in the time range of 8
and 10 seconds, respectively (figure 5.2 and figure 5.3). However, this is not in
accordance with the calculation of the thermal damage with the Arrhenius equation.
This contradiction can be explained by the fact that only the outer layers of the skin
samples are exposed to 60⁰C for 10 seconds. Furthermore, the parameters used, A and
Ea, are based on values for porcine skin, whereas in this study human skin is used.
Figure 5.7: Threshold temperature versus exposure duration for skin according the Arrheniusequation indicating the border between irreversible and reversible damage zones (black line).Within the graph schematic representations are depicted of the different time zones within theskin samples heat shocked at 45⁰C (left) and 60⁰C (right). The cross‐sections of the blue dashedand the solid red lines depict the final situations of the 45⁰C and 60⁰C heat shock skin samples,respectively.

78
Chapter 5
In literature a large number of clinical studies on laser skin rejuvenation treatments is
described (Bjerring, 2006; Capon and Mordon, 2006; Goldberg, 2006; Sadick, 2006). In
this study, we wanted to isolate the thermal effects from the photochemical effects. To
approach the pulse duration of the heat shock of rejuvenation methods like non‐ablative
laser treatments, we have chosen to apply heat shocks through conductive heating over
a short duration. However, the heterogeneous heat distribution caused by immersing
the skin samples results in different exposure times of the cells located in the center of
the skin sample versus the cells located at the edges of the sample. We expect that this
difference in exposure time reflects on the response of the fibroblasts, as has been
noticed in the thermal damage calculation. The temperature of 45⁰C was chosen in the
present study, because the temperature reached in the dermis after laser treatment is
between 42 and 45⁰C (Verrico et al., 2001). In addition, the 60⁰C heat shock
temperature was chosen, because it is known that this is a threshold temperature for
protein denaturation (Ebling et al., 1992; Farber and Rubin, 1998; Mitchell et al., 1999).
However, it needs to be considered that changes in the pulse duration and temperature
could result in a different response of human dermal fibroblasts in ex vivo skin (Altshuler
et al., 2007; Watanabe, 2008).
Heat shock response of human dermal fibroblasts induced by either laser treatments or
pulsed heat shocks is poorly understood. In this study we have shown that the thermally
induced heat shocks stimulate the cells in ex‐vivo skin. With regard to our findings, it can
be suggested that the 60⁰C heat shock leads to a more pronounced effect on the
stimulation of fibroblasts in ex‐vivo skin than the 45⁰C heat shock in the complex process
of regeneration of the collagen matrix. Moreover, the heat shock resulted in a
temperature gradient over the skin samples resulting in heat shocking fibroblasts from 2
up to 8 and 10 seconds to achieve 45⁰C and 60⁰C, respectively. In order to identify the
actual process of collagen synthesis in the skin this research has to be extended to
investigating the effect of the pulse duration of the heat shocks on the human dermal
fibroblasts. Furthermore, to enable quantitative protein measurements a more suitable
skin model should be developed.
5.5 Acknowledgements The authors would like to thank Sarita Soekhradj‐Soechit for the immunohistological
analysis of the paraffinized skin samples. Furthermore, they would like to thank the
Catharina hospital for providing the human tissue.
5.6 Appendix
5.6.1 Numerical modeling and simulation of the experimental procedure For modeling and simulation COMSOL Multiphysics®3.5 (COMSOL BV, Zoetermeer, The
Netherlands) is used. A 3D skin model is built up for simulating the skin heating and

79
The effect of thermal stimuli on dermal fibroblast in ex‐vivo human skin Chapter 5
cooling process in a constant temperature bath. This skin model enables exploration of
several factors beneficial for controlling the experiment. Because of the shape and the
size of the samples it is a priori not clear how the temperature field within the skin will
evolve in place and time. A theoretical model was developed to estimate the
temperature profiles as a function of time.
Table 5.1: Input constants thermal damage (Welch and van Gemert, 1995).
Desired
temperature [⁰C]
Activation energy
barrier, Ea [J/mole]
Frequency factor, A
[s‐1]
Total heating time
[s]
45 6.28∙105 3.1∙1098
8
60 10
As required by the experiment, a cylindrical mesh is created with a diameter of 2 mm
and thickness of 1 mm (figure 5.8). The initial temperature is set to 37 °C. Boundary
conditions are varied to simulate the water bath conditions.
Skin thermal properties, as listed in table 5.1, are set in sub‐domain conditions in
COMSOL Multiphysics®. The following diffusion equation is solved:
T+ (5.3)
Figure 5.8: Schematic cylindrical mesh of the skin sample (right), z = 1 mm and = 2 mm. A 2Dcross‐section is depicted to point out the boundary conditions. The graph (left) depicts theresults of the simulation of the heating process in the center of the mesh (depicted by the blackbullet). It demonstrates the temperature, y‐axis, versus time, x‐axis, for a skin sample heating upto 45⁰C or 60⁰C, dashed and solid line respectively. The blue and the red zone indicate the 2second interval of the final temperature.

80
Chapter 5
Were T is temperature, is heat generation rate in each element, k thermal conductivity
of the skin, ρ density of skin, c specific heat of skin and t is time (Table 5.2). The
metabolism of the cells is neglected; hence this heat generation rate is set to zero.
Table 5.2: Thermal properties of human skin (Humbert and Agache, 2004; Tuchin et al., 2010).
Tissue Density, ρ
[kg/ m3]
Thermal conductivity ,
k [W/(m*K)]
Specific heat, c
[J/(kg*K)]
Initial
temperature, T
[°C]
Epidermis 1200 0.24 3590 37
Dermis 1200 0.45 3300 37
The procedure is based on our previous cell research where we heat shocked
monolayers of human dermal fibroblasts for 2 seconds with 45°C and 60°C (Dams et al.,
2010). This procedure runs a simulation were the skin sample is initially kept at 37°C,
followed by a heat shock were it is heated up to 45°C and 60°C using heated PBS,
subsequently kept at the highest temperature for 2 seconds, then cooled down to 37 °C.
5.6.2 Numerical modeling and simulation results Figure 5.8 shows a schematical representation of the cylindrical mesh of the skin sample,
with height, h = 1 mm and diameter, = 2 mm. Next to the mesh a 2D slice is shown
where the boundary conditions, Γ1, Γ2 and Γ3 are depicted. The graph in figure 5.8 depicts
the results of the simulation of the heating process in the center of the mesh in point A.
It demonstrates the temperature versus time for a skin sample immersed in 45⁰C and
60⁰C, dashed line and solid line respectively. The grey zones indicate the 2 seconds of
the pulse durations.
Table 5.3: Results simulation heat shock experiment.
Desired
Temp. [ ]
Threshold [ ] Time to final
temp. [s]
Time to begin
cooling [s]
Time to cool down
to 37 [s]
45 44.5 6 8 3
60 59.5 8 10 4
In this graph and in table 5.3 it is demonstrated that it takes roughly 8 seconds and 10
seconds to heat shock the center of a skin sample for two seconds with thickness of 1.0
mm and a diameter of 2 mm at 45⁰C and 60⁰C, respectively. The accuracy of the
immersion times were set at 0.5⁰C. Therefore the cutoff was at 44.5⁰C in case of the
45⁰C heat shock simulation. In case of the 60⁰C heat shock this was 59.5⁰C.

Chapter 6 Procollagen gene upregulation in exvivo
human skin after laser irradiation:
A pilot study

82
Chapter 6
6.1 Introduction To rejuvenate the skin is to stop or reverse the aging effects of the skin. Some of these
effects, such as loosening and unraveling of the dermis, cause visible changes like
sagging skin and wrinkles (Gilchrest, 2007a; Kurban and Bhawan, 2007). It is believed
that injury of the skin and the subsequent wound healing response is one of the
mechanisms that results in a younger looking skin (Capon and Mordon, 2006;
Geronemus, 2006; Manstein et al., 2006).
The development of rejuvenation treatments for aged skin is booming, especially the
area of the laser‐based techniques, consisting of ablative and non‐ablative laser
cosmetic surgery (Eze and Kumar, 2010). In this chapter we focus on the non‐ablative
laser treatments that traumatize the dermis (Capon and Mordon, 2006; Laubach et al.,
2006; Weiss et al., 2006).
An induced thermal trauma by laser therapy leads to stimulation of collagen synthesis
(Capon and Mordon, 2006; Laubach et al., 2006; Narurkar, 2007; Weiss et al., 2006). The
result is skin thickening and tightening. Typical lasers that are used for non‐ablative
rejuvenation are lasers that emit in the 676 – 1540 nm region where absorption by
water is not so strong (Narurkar, 2006; Pearlman, 2006). In this chapter we will use a
laser diode of 976 nm.
It was shown in chapter 3 that pulsed heat shocks of two seconds of 45⁰C as well as 60⁰C
resulted in an increase of procollagen type I synthesis, preceded by an increase of
procollagen type I gene expression in human dermal fibroblasts in‐vitro. Furthermore, in
chapter 5 a heat shock of 45⁰C as well as 60⁰C on ex‐vivo human skin demonstrated
upregulated procollagen type I and type III expression. The aim in this chapter is to
investigate the effect of laser treatment that induces temperatures of 45⁰C and 60⁰C in
the dermis.
We have performed a pilot study on the effect of a laser induced heat shock applied to
human dermal fibroblasts in their physiological environment, the viable dermis.
Simulations are performed to establish the irradiaton time of the laser diode to the ex‐
vivo skin samples to achieve 45⁰C as well as 60⁰C for approximately 2 seconds in the
center of the skin samples. Additionally, experiments were performed in which ex‐vivo
skin samples were exposed to the laser in order to stimulate the cells in the skin to
increase the gene expression of procollagen type I and type III as a precursor for the
formation of a new collagen matrix (chapter 3 and 4). Gene expressions of heat shock
proteins 27, 47 and 70 were used as biomarkers.

83
Procollagen type I and type III upregulation in ex‐vivo human skin after laser irradiation: A pilot study
Chapter 6
6.2 Materials and methods
6.2.1 Sample preparation Excised human skin was obtained from 6 patients undergoing abdominoplasty at the
Catharina Hospital Eindhoven. This material was anonymized after the procedure. The
procedure is in conformity with the code of conduct for use of secondary human
material as stated by the Dutch Federation of Biomedical Scientific Societies. Sample
preparation was carried out quickly after harvesting of the tissue, conform the protocol
used in chapter 5.
6.2.2 Simulation laser irradiation Heat distribution was calculated with the skin model used in chapter 2. The geometrical
configuration used in the simulations is similar to the geometry of the ex‐vivo skin
samples (diameter = 2 mm, h = 1 mm).
6.2.3 Experimental procedure All heat shock experiments were performed by exposing the skin samples to a 976 nm
laser diode. Based on the simulations the skin samples were exposed to the laser diode
for approximately 8 and 23 seconds, resulting in a temperature rise to a maximum of
45⁰C and 60⁰C, respectively. This maximum temperature was maintained for a period of
2 seconds. For positive control to verify structural damage, a few samples were heated
for approximately 35 seconds to achieve 75⁰C in the skin samples.
After the heat shock, some skin samples were snap‐frozen in liquid nitrogen at six
different time points: 1, 1.5, 3, 6, 12 and 24 hours for gene expression analyses. Some
skin samples were fixed at the same time points after treatment in 10% formalin for
histology. Metabolic activity and gene expression levels were measured and histology,
immuno‐histochemical staining were performed conform the protocols used in chapter
5. The immuno staining of hsp 27, however, contains one exception. An extra incubation
step in 3% hydrogen peroxide in methanol for 20 minutes was performed in order to
block the endogeneous peroxidases in the epidermis.
6.2.4 Statistical analysis All data are presented as the mean and standard deviation for a sample measurement of
n = 6. Comparisons of gene expression levels between the control and experimental
groups were performed by a one‐tailed unpaired t‐test. Comparisons of gene expression
levels between the experimental groups were performed by a two‐tailed unpaired t‐test.
Differences in both comparisons were considered significant at p < 0.05

84
Chapter 6
6.3 Results
6.3.1 Calculation exposure time The test conditions relate to the experimental conditions. To mimic the experimental
situation, the initial temperature at all sides was set at 37⁰C. The simulations were run
using the laser parameters determined in chapter 2; a wavelength of 976 nm, 4 mm in
diameter and a power of 1 W.
Figure 6.1 depicts the results of the simulations. The heat distribution in the center of
the skin sample along the longitudinal axis is shown. According to our simulations the
surface of the skin is heated to 45⁰C in the dermis within 8.4 seconds (figure 6.1(a)). To
achieve 60⁰C at the surface of the skin, it needs to be exposed to the laser for
approximately 23 seconds (figure 6.1(b)). The skin samples remained at 45⁰C and 60⁰C
for approximately 2 seconds after the laser was turned off. The sample was cooled after
2 seconds to 37⁰C, by placing the sample in 37⁰C medium.
The temperature at the epidermis, the surface of the skin sample, is approximately 1⁰C
higher than 1 mm into the dermis, the bottom of the skin sample. In contrast to the
heterogeneous heat distribution with time that is obtained with the immersion
procedure in chapter 5, laser treatment results in a more homogeneous distribution.
Figure 6.1: Simulation results of heating and cooling process of the skin samples with diameter 2mm and height 1 mm exposed to a 976 nm laser diode with beam diameter of 4 mm and apower of 1W. The heating process in the skin due to laser irradiation and the recovery processto 37⁰C. (a) 45⁰C laser induced heat shock (b) 60⁰C laser induced heat shock.

85
Procollagen type I and type III upregulation in ex‐vivo human skin after laser irradiation: A pilot study
Chapter 6
6.3.2 Metabolic activity, structure, and damage of exvivo skin The effects of the laser heat shocks on the metabolic activity are illustrated in figure 6.2.
The absorption levels of the 45⁰C heat shocked skin samples do not differ significantly
from the samples before the heat shock. The 60⁰C heat shocked skin samples, on the
other hand, differ significantly from the control.
Figure 6.3 shows the results of the picrosirius red and haematoxylin staining visualized
with bright field microscopy (left images) and circular cross‐polarized microscopy
(images on the right). The collagen network of the skin samples exposed to 45⁰C and
60⁰C (figure 6.3(c‐f)) visualized with the bright‐field microscopy, depicted in red, does
not show any visible structural change compared to the control (figure 6.3(a‐b)) in
contrast to the collagen network that was subjected to 75⁰C, figure 6.3(g‐h). Structural
changes can be seen, the epidermal cells are severely damaged and dermal cells are
disrupted. Furthermore, structural details of the collagen network in the dermal matrix
are not clearly noticeable anymore, in contrast to the 45⁰C and 60⁰C heat shock skin
samples. In the figures 6.3(c) and (e) the epidermal cells, visualized in dark blue, stay
intact. Furthermore, the dermis shows similar structural details as in the control sample,
depicted in figure 6.3(a).
Circular cross‐polarized microscopy reveals differences in fiber thickness. The mature,
thick collagen fibers are colored in orange and the young, thin collagen fibers are shown
in green. It is demonstrated in figures 6.3(d) and (f) that the heat shocks of 45⁰C and
60⁰C leave the collagen structure intact. Figure 6.3(h), clearly shows that heating to 75⁰C
resulted in a disrupted collagen matrix. The ratio of orange and green fibers in this
treated skin sample is changed to predominantly orange compared to the control
sample.
Figure 6.2: Metabolic activity 1.5 hours after the heat shock. The absorption levels areproportional to the metabolic activity. The values are normalized to the control value. The x‐axisdepicts the two heat shock temperatures and the y‐axis the normalized absorption.

86
Chapter 6
Figure 6.3: Picrosirius red with Haematoxilyn staining results visualized with bright field (a, c, e,g) and cross‐polarized (b, d, f, h) microscopy. Cells are depicted in dark blue and the collagenbundles are colored red. Figures 3(a) and 3(b) depict the control samples fixated after 6 hoursafter treatment. In figures 3(c) and 3(d) the staining on the fixated tissue samples of 6 hoursafter the 45⁰C heat shock are shown. The skin samples heat shocked at 60⁰C and fixated at t =6h after the pulsed heat shock is depicted in figures 3(e) and 3(f). In figures 3(g) and 3(h) resultsare demonstrated of a skin sample 6 hours after heating to 75⁰C.

87
Procollagen type I and type III upregulation in ex‐vivo human skin after laser irradiation: A pilot study
Chapter 6
In figure 6.4 the results of the immunohistochemical staining for hsp27 are shown. Heat
shock protein 27 serves as a biomarker to indicate early damage response by fibroblasts.
Expression of this protein suggests an initial response to damage. It can be seen that the
laser induced heat shock of 60⁰C results in deposition of hsp27 around the fibroblasts,
indicated by the dashed circles (figure 6.4 (c)). As shown in figure 6.4 (b), the laser
induced heat shock of 45⁰C resulted in very little deposition of hsp27, and cannot be
distinguished from the control, figure 6.4(a). Although we do not address the epidermis
and therefore hsp27 synthesis by keratinocytes (Gloaguen et al., 2008) in this thesis, we
would like to point out the brown coloration of the epidermis in the 60⁰C heat shocked
sample (figure 6.4(c)), showing a clear difference compared to the 45⁰C heat shocked
and the control samples (figures 6.4(a) and (b)).
6.3.3 Effect of the laser irradiation on the gene expression of heat shock proteins 70, 47 and 27 The average fold change of hsp70 of the cells in the skin samples over six patients per
time point is shown in figure 6.5(a). It is noticed that the laser induced heat shocks of 60⁰C result in an elevated expression of hsp70 after 1.5 ‐ 3 hours. Beyond three hours
after the heat shock downregulation of hsp70 is noticed. The gene expression of hsp70
after the 45⁰C laser induced heat shocks, however, does not show any upregulation,
albeit after 6 hours a downregulation of the gene can be seen.
Hsp47 gene expression is depicted in figure 6.5(b). These data show that the 60⁰C as
well as the 45⁰C laser induced heat shocks resulted in an immediate overall significant
increase in hsp47 mRNA. After 24 hours no significant up‐ or downregulation is noticed.
Regarding the mean fold changes of hsp27, figure 6.5(c) shows an overall significant
instantaneous increase in expression after the laser induced heat shock of 60⁰C. The
gene expression of hsp27 in cells in the skin samples after the laser induced heat shock
of 45⁰C showed no significant upregulation. This seems to be consistent with histology.
Figure 6.4: Immunohistochemical staining for hsp27 after 1.5 hours of the control skin samplekept at 37⁰C (a), 45⁰C heat shocked skin sample (b), and 60⁰C heat shocked skin sample (c). Thedark brown region around the cells in the dermis (dashed circles) suggests the presence ofhsp27. The nuclei of the cells are depicted in blue.

88
Chapter 6
Figure 6.5: Mean fold changes, 2‐∆∆Ct of heat shock protein 70 (a), heat shock protein 47 (b) and heat shock protein 27 (c) at the different time points after exposure to the heat shock. The data are relative to the control and the reference genes β‐Actin and GAPDH. The x‐axis depicts the time given in hours. The y‐axis shows the mean fold changes of the cells in the skin samples heat shocked at 45⁰C and 60⁰C, solid and dashed line, respectively. Data are shown as the mean ± SD for 6 independent experiments each run in duplo with significant differences compared to control for 45⁰C heat shocked samples at * p < 0.05, ** p < 0.01 and *** p < 0.001 and for 60⁰C heat shocked samples at + p < 0.05, ++ p < 0.01 and +++ p < 0.001.

89
Procollagen type I and type III upregulation in ex‐vivo human skin after laser irradiation: A pilot study
Chapter 6
6.3.4 Effect of laser irradiation on the gene expression of procollagen type I and type III The results of the 45⁰C and 60⁰C heat shock on the expression of procollagen type I and
type III are shown in figure 6.6. The figure shows the average of the fold changes over 6
patients per time point. Figure 6.6(a) depicts the fold changes of procollagen type I. A
significant increase in expression can be seen after both the 45⁰C and the 60⁰C laser
induced heat shocks after 1.5 hours.
Figure 6.6: Mean fold changes, 2‐∆∆Ct, of procollagen type I (a) and procollagen type III (b) at the different time points after exposure to the heat shock. The data are relative to the control and to the reference genes β‐Actin and GAPDH. The x‐axis depicts the time given in minutes. The y‐axis shows the mean fold changes of procollagen type III and procollagen type I of the cells in the skin samples heat shocked at 45⁰C and 60⁰C, solid and dashed line, respectively. Data are shown as the mean ± SD for 6 independent experiments each run in duplo with significant differences compared to control for 45⁰C heat shocked samples at * p < 0.05, ** p < 0.01 and *** p < 0.001 and for 60⁰C heat shocked samples at + p < 0.05, ++ p < 0.01 and +++ p < 0.001.

90
Chapter 6
The 45⁰C laser induced heat shock results in an upregulation of procollagen type I up to
6 hours. Beyond 6 hours the gene expression does not differ from the control level. The
60⁰C laser induced heat shock results in an upregulation of procollagen type I the first
three hours. Beyond 3 hours, procollagen type I is downregulated.
As shown in figure 6.6(b) the 45⁰C and 60⁰C laser induced heat shocks resulted in an
overall significant increase in expression of procollagen type III up to 3 hours after the
heat shock. Beyond three hours, the gene expression of procollagen type III, after the
45⁰C laser induced heat shock, returns to the level of the control, while the gene
expression after the 60⁰C laser induced heat shock is downregulated.
6.4 Discussion In this chapter we have shown that the laser induced heat shocks stimulate ex‐vivo skin
to upregulate gene expression of procollagen type I and procollagen type III as an initial
response. The heat shocks of 45⁰C as well as the heat shocks of 60⁰C caused an
upregulation of procollagen type I and type III within 1.5 hours after the stimulus.
Although the upregulation was significantly relevant, the experiments were performed
on ex‐vivo human skin. Here several other factors could play a role in up‐ or
downregulation of a gene and the cells are not so well controlled as in‐vitro in chapter 3.
In literature fold change values between 0.5 and 2 are considered not to be biologically
relevant (Zeller et al., 2010). Taking this into account, only after the heat shocks of 45⁰C
the gene expression of procollagen type I is upregulated, while the heat shock of 60⁰C
results in a significant downregulation after 12 hours. Additionally, it can be concluded
that the up‐ and downregulated gene expression of procollagen type III and the heat
shock proteins 70, 47 and 27 will be considered as not biologically relevant.
Gene expression analysis of hsp27 showed not to be biologically relevant, while
immunohistological analysis nonetheless appeared to demonstrate an elevated brown
coloration, suggesting the presence of heat shock protein 27 around the cells in skin
samples exposed to the 60⁰C laser induced heat shock (figure 6.4). Since hsp27 plays an
important role in protecting cells against apoptosis (Snoeckx et al., 2007), it is tempting
to suggest that a 60⁰C heat shock causes damage to the cells. The upregulation was not
visible on genetic level, but evidently hsp27, as a constitutive protein, can be
upregulated at protein level as well.
A major problem for the interpretation of the results of chapter 5 as well as chapter 6 is
that the “heat shock” is not a step function in time. In the mono‐layer experiments in
chapters 3 and 4 the temperature increase and decrease can be achieved very fast, so
the exposure times to the different temperatures are fairly accurate. In the ex‐vivo skin
samples it takes much longer to reach the required temperatures of 45⁰C and 60⁰C (for
the immersion experiments up to 10 seconds in the laser irradiation experiments up to

91
Procollagen type I and type III upregulation in ex‐vivo human skin after laser irradiation: A pilot study
Chapter 6
23 seconds). In addition, the immersion experiments of ex‐vivo skin samples lead to a
non‐uniform temperature distribution in the skin with the longest exposure times to
high temperatures at the skin surface, while the laser treatment leads to a more
homogeneous distribution.
We have shown previously that thermal shocks stimulate the cells in ex‐vivo skin
(chapter 5). With this pilot study, we have shown that laser induced heat shocks of 45⁰C
also result in an upregulation of procollagen type I. However, more studies have to be
performed to unravel the exact results of laser induced heating of the skin.
6.5 Acknowledgements The authors would like to thank the Catharina Hospital in Eindhoven for providing the
tissue. Furthermore, they would like to thank Sarita Soekhradj‐Soechit for the
immunohistological analysis of the paraffinized skin samples.

92
Chapter 6

Chapter 7 General discussion

94
Chapter 7
7.1 Introductory remarks
Skin rejuvenation is defined as stopping or reversing the characteristics of skin aging
(Gilchrest, 2007b; Gilchrest and Bohr, 2006; Rattan, 1998). Skin aging is a natural
process. In recent years this subject has led to an increased research interest, fueled by
the cosmetic industry (Capon and Mordon, 2006; Goldberg, 2006; Sadick, 2006).
However, fundamental knowledge on the underlying physiological processes is still
scarce. Despite this, many skin rejuvenation techniques are available in practice and, as
a consequence, some are successful and some are not (chapter 1). The non‐ablative
treatments, specifically non‐ablative laser techniques, are of interest as these optical
techniques enable selective heating without compromising the integrity of the skin.
Laser irradiation is said to stimulate human dermal fibroblasts via two distinct
mechanisms. The first mechanism is thermal stimulation, in which the energy of a
photon is converted into by chromophores present in the skin. The second mechanism is
photochemical stimulation of the human dermal fibroblasts. Hereby, photons are
absorbed by cytochrome‐c on the membranes of the cells. By doing so, the metabolic
activity of the HDFs, and therefore their protein synthesis, is said to be stimulated (Dinh,
2006). In this thesis, we have chosen to primarily focus on the first mechanism, the
thermal effect.
As a consequence of a heat shock at a certain temperature and exposure time, skin can
either be stimulated or damaged (Watanabe, 2008). As a result, upregulation of the
production of constructive proteins, (e.g. collagen, elastin and proteoglycans) and heat
shock proteins can be achieved (Snoeckx et al., 2007).
The goal of this research is to elucidate the effect of heat shocks on both fibroblasts in
culture and skin explants. This knowledge can be used for improvement of existing
rejuvenation techniques or in other areas of (bio‐) medical research, such as tissue
engineering and cancer treatment (Lecomte et al., 2010).
In the following sections the adopted methodologies are analysed, namely, the
experimental and numerical models, the application of the heat shocks and biomarker
panel (section 7.2). The main results of the presented studies will be summarized in
section 7.3. Directions for future persepectives are indicated in section 7.4.
7.2 Model systems The research methods used to study viability, metabolic activity, gene expression and
protein production are all destructive in nature. This makes in‐vivo studies difficult or
impossible to perform. Animal studies are not an option because of ethical reasons.
Studies involving human volunteers are also problematic, because of the invasive nature

95
Chapter 7General discussion
of collection skin biopsies. These issues motivated the use of in‐vitro cell studies and ex‐
vivo skin, as first attempts to study the reaction of cells in skin to heat stimulation.
It is known that many rejuvenation methods are based on a wound healing response of
the skin and evidently our used model systems are not suitable for this. Our focus has
been on non‐ablative techniques. However, it has been shown that 60⁰C pulses longer
than 2 seconds lead to considerable cell damage (chapter 4). This does not mean that
these settings cannot be used in practice, but it is clear that a wound healing model is
required to further investigate this.
7.2.1 Experimental model system Any heat pulse method that is used will inevitably result in a heterogeneous
temperature distribution in the skin, so different parts of the skin “feel” different heat
shocks. Thus, to be able to predict the response of skin after exposure to a laser pulse, it
is important to clarify how skin behaves to various heat pulses. Important parameters
are the temperature, as well as the pulse duration. This motivated the initial
experiments involving cell cultures, where temperature and time could be controlled
accurately and independently. For this an adult cell line of HDFs was used, since these
cells are representative of aging skin.
The cell culture system and the technique to apply the heat shocks have led to
reproducible results. The developed experimental set up enabled large scale studies,
where many variables can be introduced. We would have liked to determine from these
studies a theoretical model that could predict collagen production as a function of
temperature and pulse duration. However, to develop such a model more variables,
such as the measurement of different MMPs must also be investigated. Furthermore,
these tests are performed in a 2D cell culture, which does not physiologically relate to
the 3D matrix of human dermis.
For ex‐vivo studies skin obtained from abdominoplastic surgery was used (chapter 5 and
6). The advantage of this experimental setup is that it approaches the physiological
relevance for investigation skin rejuvenation. However, our METC (“medisch etische
toetsings commissie”) approval required that this material was anonymized after the
surgical procedure. This is a severe disadvantage, because variations found in the results
cannot be related to possible characteristic features of individual patients. Indeed, it
would be interesting and quite relevant to investigate the correlation of the cellular
response with the age of the skin. The latter would require a different protocol for
including patients, and thus a more extensive medical ethical approval, and a multi‐
center trial to get enough samples in a reasonable time period.

96
Chapter 7
7.2.2 Numerical model system Different model systems were used to describe the heat distribution of the skin samples
heated by laser irradiation and of the skin samples that were immersed in heated PBS.
Both models were designed for in‐vitro settings.
In chapters 2 and 6, the probability of photon absorption in the skin was estimated,
which was multiplied by the laser power. This provided heat sources to calculate the
diffusion process throughout the skin. The advantage of using Monte Carlo simulation is
two‐fold: First, it is three dimensional, which approaches the experimental studies more
accurately. Secondly, it predicts the absorption of photons by the skin using the different
skin properties of the skin layers.
Settings to simulate the temperature distribution in the ex‐vivo skin studies in chapter 5
and 6 were chosen in such a way that the center or the bottom of the dermis of the skin
sample was heated for 2 seconds, respectively. In the case of the immersion experiment
(chapter 5), this led to a temperature gradient from the edges to the center of the skin
sample, leaving the cells in the outer region exposed longer to the heat shock
temperatures than the inner cells (chapter 5). In the case of the laser heated skin
samples, this led to a relatively long exposure time to reach 60⁰C in the dermal layer.
Therefore, the investigation of different exposure times of 45⁰C and 60⁰C is highly
relevant in acquiring more understanding of the response of HDFs to the thermal stimuli
in the skin.
7.2.3 Heat shock application As stated above laser methods can have a thermal as well as a photo‐chemical effect.
To be able to separate those we have chosen to use immersion experiments for the in‐
vitro cell cultures. The method was simple, reproducible and accurate.
To thoroughly investigate the effect of specific temperatures on HDFs either in in‐vitro
or in ex‐vivo skin, the immersion protocol was most accurate. The temperature reached
with the laser induced heating process was difficult to measure. Some preliminary
experiments for validation of the skin model were performed (chapter 2). However,
more extensive research is necessary to accurately validate the model.
Furthermore, it should be taken into account that the two heating processes differ in the
way they “deliver” the heat in the skin. The temperature increase generated by the laser
is predominantly induced by the energy of the photons that has been absorbed and
converted into heat by chromphores in the skin, while the temperature increase caused
by the immersion procedure is purely a conduction process of heat. For comparison of
the two heating procedures further extensive research is required.

97
Chapter 7General discussion
7.2.4 Biomarker panel Gene expression analysis is widely used to determine early synthesis of a protein.
However, the method is based on the amount of RNA present within the cells. It should
therefore be taken into account that an upregulation in gene expression does not
necessarily result in an upregulation of the translated protein.
Upregulation of a gene can be measured accurately over time with qPCR techniques.
Therefore, many papers report statistically significant differences in fold changes which
are just above 1. In literature fold change values between 0.5 and 2 are considered not
to be biologically relevant (Zeller et al., 2010). Because of the biological diversity of
human tissue, this is taken into account in the interpretation of the gene expression
results of the ex‐vivo skin sample studies (chapter 5 and 6).
The use of heat shock proteins as biomarkers was shown to be useful. Our results
demonstrated the response to the heat shock by elevated levels of hsp70. Furthermore,
hsp27 has shown to be a relevant marker for damage at cellular level, although the
staining procedure for hsp27 must be further improved. Additionally, measuring the
hsp47 RNA levels has indicated their relevance in collagen type I synthesis, since the
data sets of procollagen type I and hsp47 correlated (chapters 3‐6).
One of the most dominant and important building blocks of the the structure of the
dermal matrix is collagen type I. However, skin rejuvenation comprises much more than
collagen type I synthesis. Other important structural dermal proteins that are
worthwhile investigating are elastin and proteoglycans. The production of collagen type
III is also an interesting research area that should be adressed, since the ration of
collagen type I and collagen type III indicates whether the newly formed skin is healthy
or that scar formation has taken place. Therefore, correct remodeling of the
extracellular matrix of the dermis is important for development of new skin. In this
thesis we look at remodeling markers for collagen type I: procollagen type I carboxy‐
terminal propeptide, P1P, and carboxy‐terminal telopeptide of type I, ICTP, since our
focus is on the synthesis of collagen type I. However, the process of dermal remodeling
comprises a far more complex physiological process. Besides P1P and ICTP it also
involves, among others, the ration of collagen type I and collagen type III synthesis,
matrix metalloproteinases, MMPs, and tissue inhibitors of metalloproteinases, TIMPs
(Madlener et al., 2006; Park et al., 2007; Vaalamo et al., 2006). Using them as
biomarkers would be beneficial for further understanding of the dermal remodeling
process.
7.3 Main findings The effect of non‐ablative laser treatment was investigated in this thesis. The heat
distribution, caused by laser irradiation, was simulated and examined in chapter 2.
Furthermore, the model was used to perform parametric studies to obtain the required

98
Chapter 7
laser parameter settings; wavelength, beam diameter and output power. It was
demonstrated that a 976 nm laser with a beam diameter of 4 mm and a power of 1 W
matched the requirements of the design best (table 2.6). Further simulations revealed
that the exposure times to achieve 45⁰C and 60⁰C were 8.4 seconds and 22.6 seconds,
respectively (fig 2.4).
The calculated heat distribution and the estimated exposure times in chapter 2,
provided more insight in the thermal gradient in which the skin would be exposed to in
an in‐vivo situation.
In table 7.1 the effect of the thermal heat shocks on the gene and protein expression of
collagen type I and heat shock protein 27 is summarized. It also provides an overview of
the correlation between gene and protein expression. Collagen type I is depicted as one
of the most important constituents of young skin and heat shock protein 27 is chosen,
because of its relevance to thermal damage that is induced by the applied heat shocks.
It was demonstrated that HDFs in‐vitro produced more collagen type I after being
exposed to a 2 seconds pulsed heat shock (figure 3.6). As can be seen in table 7.1, this
increase in protein expression was preceded by an increase in procollagen type I gene
expression.
Table 7.1: Summary of the effects of the thermal stimuli of 45⁰C and 60⁰C to HDFs in‐vitro and in
ex‐vivo skin. The influence of the heat shock is indicated with – (decrease) or with + and ++
(increase). No change is indicated with ‘o’ and not available with N.A.
Chapter
Applied heat
shock
[s]
Collagen type I Heat shock protein 27
Gene
expression
Protein
synthesis
Gene
expression
Protein
expression
45⁰C 60⁰C 45⁰C 60⁰C 45⁰C 60⁰C 45⁰C 60⁰C
3 & 4 2 + + + ++ ‐ ++ N.A. N.A.
4
4 +
N.A.
+
N.A.
+
N.A. N.A. N.A.
8 ++ ++ +
10 + ++ +
16 + ‐ ++
21 + ‐ ++
5 8 and 10 + + N.A. N.A. o + o +
6 8 and 21 + + N.A. N.A. o + o +
Results of hsp27 gene expression revealed that the 60⁰C heat shock caused an
upregulation of this gene; a first indication that the HDFs are compromised after a 60⁰C
heat shock.
Since our simulations indicated that heating of skin causes a temperature gradient,
investigation of the combination of temperature and exposure time is essential. In

99
Chapter 7General discussion
chapter 4 the effect of different exposure times in combination with the chosen heat
shock temperatures, 45⁰C and 60⁰C, is demonstrated. Findings suggest, as can be seen in
table 7.1 and figure 4.4, that the optimal exposure time range for the 45⁰C heat shock
temperature to produce the highest amount of net collagen content is 8 to 10 seconds.
Furthermore, after 48 hours the gene expression levels returned to control levels, which
indicate the end of the effect of the stimulus. Additionally, the 60⁰C heat shock used
with an exposure time beyond 2 seconds has evidently been shown to be harmful for
the cultured HDFs (figure 4.1).
The question of how fibroblasts in the skin are influenced by the heat shocks is still to be
answered. Therefore, the influence of the thermal stimuli on HDFs in ex‐vivo human skin
was investigated (chapter 5). Both heat shock temperatures showed an upregulation of
procollagen type I (table 7.1 and figure 5.5). However, in conjuncture with the calculated
prediction of thermal damage, visualizing the early damage marker hsp27 appeared to
reveal that the 60⁰C heat shock, in contrast to the 45⁰C, might have induced damage
(figure 5.6).
As mentioned in the general introduction, the present thesis focuses on the thermal
stimulus of the non‐ablative laser treatments. Therefore, a pilot study was performed to
study the effect of the heat shocks of the same temperature, as used in chapter 5, only
induced by a laser. The effect of a laser induced heat shock of 45⁰C has also been shown
to stimulate the gene expression of collagen type I. Furthermore, it demonstrated that
the 60⁰C laser induced heat shock also compromised the HDFs in the skin, because gene
upregulation (table 7.1) as well as supposed protein expression of hsp27 was noticed
(figure 6.4).
Results of chapters 5 and 6 demonstrated that the heating process of laser irradiation
differed from the heating process by immersion of the skin sample. The irradiated skin
samples are heated for approximately 2 seconds at 45⁰C and 60⁰C, while the immersed
skin samples were heated for 8 and 10 seconds at 45⁰C and 60⁰C, respectively.
7.4 Recommendations for future perspectives The present thesis demonstrates that heat shocks of 45⁰C have resulted in an increase in
collagen type I synthesis and that 60⁰C heat shocks beyond 2 seconds are harmful for
cell cultures. However, as mentioned in this chapter, skin rejuvenation is far more
complex. Therefore, to fully unravel the physiological implications of skin rejuvenation
upon thermal stimuli several recommendations for future work can be provided.
For example in‐vitro studies, that address stimulation rather than injury, should aim at
different temperatures between 45⁰C and 60⁰C. Since the present thesis has shown that
heating the dermis is not a step function in time, it is of interest to investigate different
temperatures between 45⁰C and 60⁰C with different exposure times. For the
100
Chapter 7
investigation of combinations of exposure time and temperature that induce thermal
damage, it is recommended to use a different model, such as a wound healing model.
Recommendations for investigation of the physiological process, the question whether
production of proteoglycans and elastin will be stimulated by thermal stimuli also needs
to be addressed. For regeneration of skin these proteins play an important role as “filling
moisturizers” and “elasticity providers”, respectively. Without these proteins the skin
would become stiff and “scar‐like”.
Another recommendation is extending the in‐vitro cell studies to cells seeded in three
dimensional matrices, for the purpose of quantifying the amount of synthesized
proteins.
The present work involves two extreme model systems, one encompassing cells alone
and the other employing ex‐vivo skin. The use of full thickness skin equivalents,
incorporating keratinocytes and fibroblasts, could be argued, because such an approach
would be necessarily costly. However, it is an important step for enabling similar test
conditions for the fibroblasts. Furthermore, for future ex‐vivo skin research it is also
relevant to investigate the correlation between the age of the skin and the subsequent
response of the cells in the skin.
Before testing in‐vivo a non‐invasive method for measuring newly formed dermal
components should be developed, to obviate the need for taking a biopsy.
Consequently, well‐defined in‐vivo studies should be performed as well. Here, it should
be taken into account that such studies are time consuming and are difficult to interpret
without proper background information that can be obtained as mentioned above.
The development of a skin model (as in chapter 2) is helpful for the prediction of the
heat distribution or even for the prediction of collagen remodeling. It should be taken
into account that extensive validation is necessary. Furthermore, more detailed data
about exposure time and heat shock temperature would be beneficial for the
development of such a model.
Ultimately, the combination of a well‐validated skin model and experimental data
obtained from in‐vivo studies could lead to a tool that can be used in multiple areas of
skin rejuvenation research, such as wound healing, scar formation and the development
of preventative or treatment strategies.

101
Bibliography
Bibliography
Agache, P. G., Monneur, C., Leveque, J. L., De Rigal, J., (2007). Mechanical properties and Young's modulus of human skin in vivo. Archives of Dermatologic Restoration 269, 221‐232.
Altshuler, G. B., Anderson, R. R., Manstein, D., Zenzie, H. H., Smirnov, M. Z., (2007). Extended theory of selective photothermolysis. Lasers in Surgery and Medicine 29, 416‐432.
Anderson, R. R., Parrish, J. A., (2007). The optics of human skin. Journal of Investigative Dermatology 77, 13‐19.
Atiyeh, B. S., Dibo, S. A., (2009). Nonsurgical nonablative treatment of aging skin: radiofrequency technologies between aggressive marketing and evidence‐based efficacy. Aesthetic Plast.Surg. 33, 283‐294.
Bailey, A. J., (2007). Review: Molecular mechanisms of ageing in connective tissues. Mechanisms of Ageing and Development 122, 735‐755.
Bailey, A. J., Paul, R. G., Knott, L., (2007). Review: Mechanisms of maturation and ageing of collagen. Mechanisms of Ageing and Development 106, 1‐56.
Bancroft, J. D., Gamble, M., (2002). Theory and Practice of Histological Techniques. Harcourt Publishers.
Bashkatov, A. N., Genina, E. A., Kochubey, V. I., Tuchin, V. V., (2005). Optical properties of human skin, subcutaneous and mucous tissues in the wavelength range from 400‐2000 nm. Journal of Physics section D: Applied Physics 35, 2543‐2555.
Bernerd, F., Asselineau, D., (2006). UVA exposure of human skin reconstructed in vitro induces apoptosis of dermal fibroblasts: subsequent connective tissue repair and implications in photoaging. Cell Death and Differentiatioin 5, 792‐802.
Biesman, B. S., (2007). Non‐invasive skin tightening. Aesthetic Dermatology Phototherapy 38‐40.
Bjerring, P., (2006). Photorejuvenation ‐ An Overview. Medical Laser Application 19, 186‐195.
Bjerring, P., Christiansen, K., Troilius, A., Dierickx, C., (2006). Facial Photo Rejuvenation Using Two different Intense Pulsed Light (IPL) Wavelength Bands. Lasers in Surgery and Medicine 34, 120‐126.
102
Bibliography
Bjerring, P., Clement, M., Heickendorff, L., Hybecker, H., Kiernan, M., (2007). Dermal collagen production following irradiation by dye laser and broadband light source. Journal of Cosmetic & Laser Therapy 4, 39‐43.
Bonelli, M. A., Alfieri, R. R., Petronini, P. G., Brigotti, M., Campanini, C., Borghetti, A. F., (1999). Attenuated expression of 70‐kDa heat shock protein in WI‐38 human fibroblasts during aging in vitro. Exp.Cell Res. 252, 20‐32.
Bowers, W., Blaha, M., Alkhyyat, A., Sankovich, J., Kohl.J., Wong, G., Patterson, D., (2007). Artificial human skin: cytokine, prostaglandin, HSP70 and histological responses to heat exposure. Journal of Dermatological Science 20, 172‐182.
Bowler, P., (2007). Radio Frequency: A Real Non‐Surgical Face‐Lift? Aesthetic Medicine 49‐52.
Branchet, M. C., Boisinic, S., Frances, C., Robert, A. M., (2007). Skin thickness changes in normal aging skin. Gerontology 36, 28‐35.
Breuls, R. G., Mol, A., Petterson, R., Oomens, C. W., Baaijens, F. P., Bouten, C. V., (2003). Monitoring local cell viability in engineered tissues: a fast, quantitative, and nondestructive approach. Tissue Eng 9, 269‐281.
Brown, S. A., Farkas, J. P., Arnold, C., Hatef, D. A., Kim, J., Hoopman, J., Kenkel, J. M., (2007). Heat shock proteins 47 and 70 expression in rodent skin model as a function of contact cooling temperature: Are we overcooling our target? Lasers Surg.Med. 39, 504‐512.
Capon, A., Mordon, S., (2006). Can Thermal Lasers Promote Skin Wound Healing? American Journal of Clinical Dermatology 4, 1‐12.
Crochet, J. J., Gnyawali, S. C., Chen, Y., Lemley, E. C., Wang, L. V., Chen, W. R., (2006). Temperature distribution in selective laser‐tissue interaction. J.Biomed.Opt. 11, 34031.
Daamen, W. F., Veerkamp, J. H., van Hest, J. C., van Kuppevelt, T. H., (2007). Elastin as a biomaterial for tissue engineering. Biomaterials 28, 4378‐4398.
Dams, S. D., de Liefde‐van Beest, M., Nuijs, A. M., Oomens, C. W. J., Baaijens, F. P. T., (2010). Pulsed heat shocks enhance procollagen type I and procollagen type III expression in human dermal fibroblasts.
Dierickx, C. C., (2007). The role of deep heating for noninvasive skin rejuvenation. Lasers in Surgery and Medicine 38, 799‐807.
Dierickx, C. C., Anderson, R. R., (2007). Visible light treatment of photoaging. Dermatologic Therapy 18, 191‐208.
Dimri, G. P., Lee, X., Basile, G., Acosta, M., Scott, G., Roskelley, C., Medrano, E. E., Linskens, M., Rubelj, I., Pereira‐Smith, O., Peacocke, M., Campisi, J., (2007). A biomarker

103
Bibliography
that identifies senescent human cells in culture and in aging skin in vivo. Cell Biology 92, 9363‐9367.
Dinh, V., (2006). Low‐Power Laser Therapy. Biomedical Photonics Handbook. CRC Press, pp. 48‐1‐48‐25.
Diridollou, S., Vabre, V., Berson, M., Vaillant, L., Black, D., Lagarde, J. M., Grégoire, J. M., Gall, Y., Patat, F., (2007). Skin ageing: Changes of physical properties of human skin in vivo. International Journal of Cosmetic Science 23, 353‐362.
Duval, C., Smit, N. P., Kolb, A. M., Regnier, M., Pavel, S., Schmidt, R., (2002). Keratinocytes control the pheo/eumelanin ratio in cultured normal human melanocytes. Pigment Cell Res. 15, 440‐446.
Ebling, Rook, Wilkinson, (1992). Textbook of Dermatology. Blackwell Scientific Publcations.
Eze, R., Kumar, S., (2010). Laser transport through thin scattering layers. Appl.Opt. 49, 358‐368.
Farber, J. L., Rubin, E., (1998). Pathology. Lippincott Williams & Wilkins.
Fitzpatrick, T. B., (1988). The validity and practicality of sun‐reactive skin types I through VI. Arch.Dermatol. 124, 869‐871.
Fitzpatrick, T. B., SEIJI, M., McGUGAN, A. D., (1961). Melanin pigmentation. N.Engl.J.Med. 265, 430‐434.
Frank, S., Oliver, L., Lebreton‐De Coster, C., Moreau, C., Lecabellec, M. T., Michel, L., Vallette, F. M., Dubertret, L., Coulomb, B., (2004). Infrared radiation affects the mitochondrial pathway of apoptosis in human fibroblasts. J.Invest Dermatol. 123, 823‐831.
Gamborg Andersen, G., Petrunin, V. V., Baurichter, A., (2010). Numerical calculations of pulsed laser heating of non‐isotropic materials. Proceedings COMSOL Multiphysics User's Conference 2005.
Geronemus, R. G., (2006). Fractional Photothermolysis: Current and Future Applications. Lasers in Surgery and Medicine 38, 169‐176.
Giacomoni, P. U., D'Alessio, P., (2007). Open questions in photobiology IV. Photoaging of the skin. Journal of Photochemistry and Photobiology 33, 267‐272.
Giacomoni, P. U., Rein, G., (2007). Review: A mechanistic model for the aging of human skin. Micron 35, 179‐184.
Gilchrest, B. A., (2007a). A review of skin ageing and its medical therapy. British Journal of Dermatology 135, 867‐875.

104
Bibliography
Gilchrest, B. A., (2007b). Clinical features of photageing differ from those of intrinsinc ageing. Journal of Dermatological Treatment 7, S5‐S6.
Gilchrest, B. A., (2007c). The spectrum of photodamage and its treatment. Dermatology 190, 260‐264.
Gilchrest, B. A., (2007d). The variable face of photoaging: Influence of skin type. Cosmetics & Toiletries 107, 41‐42.
Gilchrest, B. A., Bohr, V. A., (2006). Aging processes, DNA damage, and repair. Federation of American Societies for Experimental Biology Journal 11, 322‐330.
Gilchrest, B. A., Garmyn, M., Yaar, M., (2007). Aging and photoaging affect gene expression in cultured human keratinocytes. Archives of Dermatology 130, 82‐86.
Gloaguen, V., Krausz, P., Brudieux, V., Closs, B., Leroy, Y., Guerardel, Y., (2008). Structural patterns of rhamnogalacturonans modulating Hsp‐27 expression in cultured human keratinocytes. Molecules. 13, 1207‐1218.
Goldberg, D. J., (2006). Lasers for Facial Rejuvenation. American Journal of Clinical Dermatology 4, 225‐234.
Groff, W. F., Fitzpatrick, R. E., Uebelhoer, N. S., (2008). Fractional carbon dioxide laser and plasmakinetic skin resurfacing. Semin.Cutan.Med.Surg. 27, 239‐251.
Hamblin, M. R., Demidova, T. N., (2007). Mechanisms of Low Level Light Therapy. Proceedings of the Society for Photo‐optical Instruments and Engineering 6140.
Hantash, B. M., Bedi, V. P., Chan, K. F., Zachary, C. B., (2007). Ex vivo histological characterization of a novel ablative fractional resurfacing device. Lasers Surg.Med. 39, 87‐95.
Hirano, S., Shelden, E. A., Gilmont, R. R., (2004). HSP27 regulates fibroblast adhesion, motility, and matrix contraction. Cell Stress.Chaperones. 9, 29‐37.
Humbert, P., Agache, P. G., (2004). Measuring the Skin. Springer.
Kameyama, K., (2008). Histological and clinical studies on the effects of low to medium level infrared light therapy on human and mouse skin. J.Drugs Dermatol. 7, 230‐235.
Kim, K., Guo, Z., (2007). Multi‐time‐scale heat transfer modeling of turbid tissues exposed to short‐pulsed irradiations. Comput.Methods Programs Biomed. 86, 112‐123.
Knott, L., Bailey, A. J., (2007). Collagen Cross‐Links in Mineralizing Tissues: A Review of Their Chemistry, Function, and Clinical Relevance. Bone 22, 181‐187.
Kovalchin, J. T., Wang, R., Wagh, M. S., Azoulay, J., Sanders, M., Chandawarkar, R. Y., (2006). In vivo delivery of heat shock protein 70 accelerates wound healing by up‐regulating macrophage‐mediated phagocytosis. Wound.Repair Regen. 14, 129‐137.

105
Bibliography
Krutmann, J., (2007). Skin aging. Hautarzt 54, 809‐817.
Kurban, R. S., Bhawan, J., (2007). Histologic changes in skin associated with aging. Journal of Dermatology, Surgery & Oncology 16, 908‐914.
Kuroda, K., Tsukifuji, R., Shinkai, H., (1998). Increased expression of heat‐shock protein 47 is associated with overproduction of type I procollagen in systemic sclerosis skin fibroblasts. J.Invest Dermatol. 111, 1023‐1028.
Labat‐Robert, J., Robert, L., (2007). Mini‐Review: Aging of the extracellular matrix and its pathology. Experimental Gerontology 23, 5‐18.
Laszlo, A., (2007). The relationship of heat‐shock proteins, Thermotolerance, and Protein Synthesis. Experimental Cell Research 178, 401‐414.
Laubach, H. J., Tannous, Z., Anderson, R. R., Manstein, D., (2006). Skin responses to fractional photothermolysis. Lasers Surg.Med. 38, 142‐149.
Lecomte, S., Desmots, F., Le, M. F., Le, G. P., Michel, D., Christians, E. S., Le, D. Y., (2010). Roles of heat shock factor 1 and 2 in response to proteasome inhibition: consequence on p53 stability. Oncogene.
Leveque, J. L., Corcuff, P., De Rigal, J., Agache, P. G., (2007a). In vivo studies of the evolution of physical properties of the human skin with age. International journal of dermatology 23, 322‐329.
Leveque, J. L., De Rigal, J., Agache, P. G., Monneur, C., (2007b). Influence of ageing on the in vivo extensibility of human skin at low stress. Archives of Dermatologic Research 269, 127‐135.
Lewis, J., Raff, M., Roberts, K., Watson, J. D., Alberts, B., Bray, D., (1994). Molecular Biology of the Cell. Garland Publisher.
Longo, L., Lubart, R., Friedmann, H., Lavie, R., (2007). A possible mechanism for visible‐light‐induced skin rejuvenation. Proceedings of the Society for Photo‐optical Instruments and Engineering 5610, 158‐164.
Lu, H., Edwards, C., Gaskell, S., Pearse, A., Marks, R., (1996). Melanin content and distribution in the surface corneocyte with skin phototypes. Br.J.Dermatol. 135, 263‐267.
Lubart, R., Friedmann, H., Lavie, R., Longo, L., Krutmann, J., Baruchin, O., Baruchin, A. M., (2007). A reasonable mechanism for visible light‐induced skin rejuvenation. Lasers in Medicine and Science 22, 1‐3.
Madlener, M., Parks, W. C., Werner, Sa., (2006). Matrix Metalloproteinases (MMPs) and Their Physiological Inhibitors (TIMPs) Are Differentially Expressed during Excisional Skin Wound Repair. Experimental Cell Research 242, 201‐210.

106
Bibliography
Manstein, D., Herron, G. S., Sink, R. K., Tanner, H., Anderson, R. R., (2006). Fractional Photothermolysis: A New Concept for Cutaneous Remodeling Using Microscopic Patterns of Thermal Injury. Lasers in Surgery and Medicine 34, 426‐438.
Marshall, H., Kind, C. N., (2007). Detection and cellular localization of stress‐induced 72kD heat shock protein in cultured swiss 3T3 mouse fibroblasts. Toxicology in Vitro 8, 545‐548.
Mayes, A. E., Holyoak, C. D., (2008). Repeat mild heat shock increases dermal fibroblast activity and collagen production. Rejuvenation.Res. 11, 461‐465.
Mertyna, P., Goldberg, W., Yang, W., Goldberg, S. N., (2009). Thermal ablation a comparison of thermal dose required for radiofrequency‐, microwave‐, and laser‐induced coagulation in an ex vivo bovine liver model. Acad.Radiol. 16, 1539‐1548.
Mitchell, L. G., Campbell, N. A., Reece, J. B., (1999). Biology. Adison‐Wesley.
Naitoh, M., Hosokawa, N., Kubota, H., Tanaka, T., Shirane, H., Sawada, M., Nishimura, Y., Nagata, K., (2001). Upregulation of HSP47 and collagen type III in the dermal fibrotic disease, keloid. Biochem.Biophys.Res.Commun. 280, 1316‐1322.
Narurkar, V. A., (2006). Lasers, light sources, and radiofrequency devices for skin rejuvenation. Semin.Cutan.Med.Surg. 25, 145‐150.
Narurkar, V. A., (2007). Skin rejuvenationwith microthermal fractional photothermolysis. Dermatologic Therapy 20, S10‐S13.
Ohtsuka, K., Laszlo, A., (2007). The relationship between hsp70 localization and heat resistance. Experimental Cell Research 202, 507‐518.
Orringer, J. S., Voorhees, J. J., Hamilton, T., Hammerberg, C., Kang, S., Johnson, T. M., Karimipour, D. J., Fisher, G., (2005). Dermal matrix remodeling after nonablative laser therapy. J.Am.Acad.Dermatol. 53, 775‐782.
P.Bjerring, K.Christiansen, A.Troilius, C.Dierickx, (2006). Facial Photo Rejuvenation Using Two different Intense Pulsed Light (IPL) Wavelength Bands. Lasers in Surgery and Medicine 34, 120‐126.
Park, C. H., Lee, M. J., Ahn, J., Kim, S., Kim, H. H., Kim, K. H., Eun, H. C., Chung, J. H., (2007). Heat shock‐induced matrix metalloproteinase (MMP)‐1 and MMP‐3 are mediated through ERK and JNK activation and via an autocrine interleukin‐6 loop. Journal of Investigative Dermatology 123, 1012‐1019.
Pasquali‐Ronchetti, I., Baccarani‐Contri, M., (1997). Elastic fiber during development and aging. Microsc.Res.Tech. 38, 428‐435.
Pearlman, S. J., (2006). Surgical treatment of the nasolabial angle in balanced rhinoplasty. Facial.Plast.Surg. 22, 28‐35.

107
Bibliography
Pereira, A. N., Eduardo, C. P., Matson, E., Marques, M. M., (2007). Effect of low‐power laser irradiation on cell growth and procollagen synthesis of cultured fibroblasts. Lasers in Surgery and Medicine 31, 263‐267.
Prydz, K., Dalen, K. T., (2007). Synthesis and sorting of proteoglycans. Journal of Cell Science 113, 193‐205.
R.R.Anderson, J.A.Parrish, (2007). The optics of human skin. Journal of Investigative Dermatology 77, 13‐19.
Ramos‐e‐Silva, M., da Silva Carneiro, S. C., (2007). Elderly skin and its rejuvenation: products and procedures for the aging skin . Journal of Cosmetic Dermatology 6, 40‐50.
Rattan, S. I., (1998). Repeated mild heat shock delays ageing in cultured human skin fibroblasts. Biochem.Mol.Biol.Int. 45, 753‐759.
Roberts, W. E., (2009). Skin type classification systems old and new. Dermatol.Clin. 27, 529‐33, viii.
Ruiz‐Esparza, J., (2006). Near [corrected] painless, nonablative, immediate skin contraction induced by low‐fluence irradiation with new infrared device: a report of 25 patients. Dermatol.Surg. 32, 601‐610.
Sadick, N. S., (2006). Update on Non‐Ablative Ligth Therapy for Rejuvenation: A Review. Lasers in Surgery and Medicine 32, 120‐128.
Sadick, N. S., (2007). Combination radiofrequency and light energies: electro‐optical synergy technology in esthetic medicine. America Society for Dermatologic Surgery 31, 1211‐1217.
Sadick, N. S., Alexiades‐Armenakas, M., Bitter, P., Hruza, G., Mulholland, S., (2006). Enhanced Full‐Face Skin Rejuvenation Using Synchronous Intense Pulsed Optical and Conducted Bipolas Radiofrequency Energy (ELOS): Introducing Selective Radiophotothermolysis. Journal of Drugs in Dermatology 4, 181‐186.
Shindo, Y., Witt, E., Han, D., Epstein, W., Packer, L., (1994). Enzymic and non‐enzymic antioxidants in epidermis and dermis of human skin. J.Invest Dermatol. 102, 122‐124.
Smalls, L. K., Randall, W. R., Visscher, M. O., (2006). Effect of dermal thickness, tissue composition, and body site on skin biomechanical properties. Skin Res.Technol. 12, 43‐49.
Snoeckx, L. H. E. H., Cornelussen, R. N., van Nieuwenhoven, F. A., Reneman, S., an der Vusse, G. J., (2007). Heat shock proteins and cardiovascular pathophysiology. Physiological Reviews 81, 1461‐1497.
Souil, E., Capon, A., Mordon, S., Dinh‐Xuan, A. T., Polla, B. S., Bachelet, M., (2001). Treatment with 815‐nm diode laser induces long‐lasting expression of 72‐kDa heat shock protein in normal rat skin. Br.J.Dermatol. 144, 260‐266.

108
Bibliography
Stadelmann, W. K., Digenis, A. G., Tobin, G. R., (2006). Physiology and Healing Dynamics of Chronic Cutaneous Wounds. The American Journal of Surgery 176, 26S‐38S.
Sturesson, C., Andersson‐Engels, S., (1995). A mathematical model for predicting the temperature distribution in laser‐induced hyperthermia. Experimental evaluation and applications. Phys.Med.Biol. 40, 2037‐2052.
Swelstad, M. R., Gutowski, K. A., (2006). Facial Rejuvenation. Clinical Obstetrics and Gynecology 49, 353‐366.
Tandara, A. A., Kloeters, O., Kim, I., Mogford, J. E., Mustoe, T. A., (2007). Age effect of HSP70: Decreased resistance to ischemic and oxidative stress in HDF. Journal of Surgical Research 132, 32‐39.
Tasab, M., Batten, M. R., Bulleid, N. J., (2000). Hsp47: a molecular chaperone that interacts with and stabilizes correctly‐folded procollagen. EMBO J. 19, 2204‐2211.
Tasab, M., Jenkinson, L., Bulleid, N. J., (2002). Sequence‐specific recognition of collagen triple helices by the collagen‐specific molecular chaperone HSP47. J.Biol.Chem. 277, 35007‐35012.
Troy, T. L., Thennadil, S. N., (2001). Optical properties of human skin in the near infrared wavelength range of 1000 to 2200 nm. J.Biomed.Opt. 6, 167‐176.
Tuchin, V. V., Yaroslavsky, A. N., Jacques, S. L., Popp, J., (2010). Biophotonics for dermatology: science & applications. J.Biophotonics. 3, 9‐10.
Tzaphlidou, M., (2007). The role of collagen and elastin in aged skin: an image processing approach. Micron 35, 173‐177.
Vaalamo, M., Leivo, T., Saarialho‐Kere, U., (2006). Differential Expression of Tissue Inhibitors of Metallproteinases (TIMP‐1, ‐2, ‐3, and ‐4) in Normal and Aberrant Wound Healing. Human Pathology 30, 795‐802.
van Gemert, M. J., Jacques, S. L., Sterenborg, H. J., Star, W. M., (1989). Skin optics. IEEE Trans.Biomed.Eng 36, 1146‐1154.
Vandesompele, J., De, P. K., Pattyn, F., Poppe, B., Van, R. N., De, P. A., Speleman, F., (2002). Accurate normalization of real‐time quantitative RT‐PCR data by geometric averaging of multiple internal control genes. Genome Biol. 3, 1‐11.
Verbeke, P., Clark, B. F. C., Rattan, S. I. S., (2007). Reduced levels of oxidized and glycoxidized proteins in human fibroblasts exposed to repeated mild heat shock during serial passaging in vitro. Free Radical Biology & Medicine 31, 1593‐1602.
Verrico, A. K., Haylett, A. K., Moore, J. V., (2001). In vivo expression of the collagen‐related heat shock protein HSP47, following hyperthermia or photodynamic therapy. Lasers Med.Sci. 16, 192‐198.

109
Bibliography
Verrico, A. K., Moore, J. V., (1997). Expression of the collagen‐related heat shock protein HSP47 in fibroblasts treated with hyperthermia or photodynamic therapy. Br.J.Cancer 76, 719‐724.
Watanabe, S., (2008). Basics of laser application to dermatology. Arch.Dermatol.Res. 300 Suppl 1, S21‐S30.
Weiss, R. A., McDaniel, D. H., Geronemus, R. G., (2006). Review of Nonablative Photorejuvenation: Reversal of the Aging effects of the Sum and Environmental Damage Using Laser and Light Sources. Seminars in Cutaneous Medicine and Surgery 22, 93‐106.
Welch, A. J., Gardner, C. M., (1997). Monte Carlo model for determination of the role of heat generation in laser‐irradiated tissue. J.Biomech.Eng 119, 489‐495.
Welch, A. J., Motamedi, M., Rastegar, S., LeCarpentier, G. L., Jansen, D., (1991). Laser thermal ablation. Photochem.Photobiol. 53, 815‐823.
Welch, A. J., Pearce, J. A., Diller, K. R., Yoon, G., Cheong, W. F., (1989a). Heat generation in laser irradiated tissue. J.Biomech.Eng 111, 62‐68.
Welch, A. J., Torres, J. H., Cheong, W. F., (1989b). Laser physics and laser‐tissue interaction. Tex.Heart Inst.J. 16, 141‐149.
Welch, A. J., van Gemert, M. J., (1995). Optical‐Response Of Laser‐Irradiated Tissue. Kluwer Academic Publishers.
West, M. D., (2007). The cellular and molecular biology of skin aging. Archives of Dermatology 130, 87‐95.
White, W. M., Makin, I. R. S., Barthe, P. G., Slayton, M. H., Gliklich, R. E., (2007). Selective creation of thermal injury zones in the superficial musculoaponeurotic system using intense ultrasound therapy ‐ A new target for noninvasive facial rejuvenation. Archives of Facial Plastic Surgery 9, 22‐29.
Wilhelm, K. P., Cua, A. B., Maibach, H. I., (2007). Skin aging. Archives of Dermatology 27, 1806‐1809.
Yaar, M., Eller, M. S., Gilchrest, B. A., (2007). Fifty years of skin aging. Journal of Investigative Dermatology 7, 51‐58.
Zeller, T., Wild, P., Szymczak, S., Rotival, M., Schillert, A., Castagne, R., Maouche, S., Germain, M., Lackner, K., Rossmann, H., Eleftheriadis, M., Sinning, C. R., Schnabel, R. B., Lubos, E., Mennerich, D., Rust, W., Perret, C., Proust, C., Nicaud, V., Loscalzo, J., Hubner, N., Tregouet, D., Munzel, T., Ziegler, A., Tiret, L., Blankenberg, S., Cambien, F., (2010). Genetics and beyond‐‐the transcriptome of human monocytes and disease susceptibility. PLoS.One. 5, e10693.

110
Bibliography

111
Samenvatting Het effect van warmtepulsen op
huidverjonging
De vorming van rimpels is één van de aspecten van het verouderen van huid die voort
komt uit een gedegenereerde dermis. Het verouderde netwerk van eiwitten, de
spiersamentrekkingen en de zwaartekracht resulteren in het rimpelen van de huid.
Momenteel gaan de ontwikkelingen voor huidverjonging in de cosmetische industrie erg
snel. Slechts enkele technieken zijn toepasbaar voor het verjongen van de dermis. Één
van de meest veelbelovende technieken is het gebruik van niet‐ablatieve lasers. Deze
techniek is klinisch getest en wordt veelal gebruikt om de huid te verjongen. Echter, de
achterliggende fysiologie zal nog moeten worden bevestigd.
Het is verondersteld dat de warmte die gegenereerd wordt door een laser een
warmteshock veroorzaakt waar fibroblasten op reageren. Deze warmteshock brengt een
cascade aan reacties teweeg, onder andere de productie van ‘heat shock proteïnen’, die
de collageensynthese zouden stimuleren. Naast het thermische effect heeft de laser ook
een fotochemisch effect. Het huidige proefschrift richt zich op het effect van de
thermische puls op de collageenproductie van de dermale fibroblasten in kweek en in
ex‐vivo huid.
Een model is ontwikkeld dat de interactie van fotonen met huid en de veroorzaakte
temperatuursontwikkeling berekent. Dit model werd gecombineerd met een
transportmodel om de verdeling van de temperatuursverhoging in de huid te
beschrijven. Vervolgens werd het model gebruikt om de optimale laserparameters, voor
het beschrijven van de warmte verdeling als gevolg van een laser in de huid, te bepalen
als functie van tijd en plaats.
Om het effect te onderzoeken van warmteshocks op menselijke huid, werd het
aanvankelijke onderzoek uitgevoerd op celkweken. De dermale fibroblasten werden in
kweek gebracht en blootgesteld aan temperaturen van 45⁰C en 60⁰C en met een
pulsduur van 2 seconden. De resultaten van deze studie toonden aan dat deze
temperaturen collageentype I synthese stimuleerden. Daarna werd er een studie
uitgevoerd met dezelfde temperaturen, 45⁰C en 60⁰C. Echter een variatie in pulsduur: 2,
4, 8, 10 en 16 seconden, werd toegepast. Geconcludeerd kan worden uit deze studie dat
8 tot 10 seconden bij 45⁰C de optimale duur van de blootstellingstijd is waarbij de
collageentype I synthese het hoogst is.

112
Samenvatting
Om te kijken of fibroblasten in de huid hetzelfde reageren als in kweek, werd een ex‐vivo
huidstudie gedaan. Humane huidstukjes werden ondergedompeld in verwarmde PBS
van 45⁰C en 60⁰C. De 45⁰C warmteshock leidde niet tot schade, echter de 60⁰C
warmteshock lijkt vroege schade rond de cellen in de huid aan te tonen. Verder is
aangetoond dat procollagentype I evenals type III geupreguleerd was door zowel de
45⁰C als de 60⁰C warmteshocks.
Om grip te krijgen wat laseropwarming voor invloed heeft op de huid, werd een pilot
gedaan waarbij huidstukjes werden opgewarmd met behulp van een laser. De resultaten
van dit onderzoek toonden aan dat de 45⁰C lasershock de huidstukjes niet beschadigde. De 60⁰C warmteshock, daarentegen, leek de aanwezigheid van hsp27 rond de cellen aan
te tonen wat een aanwijzing is van vroege schade. De resultaten van de genexpressie
lieten zien dat de 45⁰C warmteshocks leidden tot een verhoogde expressie van
procollagentype I.
Samenvattend, hebben we in dit proefschrift aangetoond dat een temperatuur van 45⁰C zowel op fibroblasten als in huid ex‐vivo een upregulatie van collageentype I
teweegbrengt. Voorts toonden de celstudies de relevantie aan van de combinatie van
tijd en temperatuur; een optimale duur van de blootstellingstijd van 8 tot 10 seconden
bij 45⁰C resulteerde in de hoogste hoeveelheid collageentype I. Ook werd de schadelijke aard van een 60⁰C warmteshock aangetoond. Het aantonen dat de collageensynthese
door de 45⁰C hitteschok kan worden verbeterd, is een volgende stap naar een beter begrip van de fysiologische processen die tot huidverjonging leiden.

113
Dankwoord Het voltooien van een promotie onderzoek is vergelijkbaar met kampioen worden. Het
vereist optimisme, veel inzet, hard werken, gedrevenheid en ook vertrouwen.
Vertrouwen in jezelf, maar ook in anderen, want hoewel promoveren een solistiche
aangelegenheid lijkt, niets is minder waar. Daarom wil ik middels dit dankwoord de
gelegenheid aangrijpen om een aantal mensen te bedanken voor hun steun, zowel van
wetenschappelijke als persoonlijke aard.
Graag wil ik iedereen bedanken die direct of indirect een bijdrage heeft geleverd aan de
totstandkoming van dit proefschrift. Een aantal mensen wil ik specifiek bedanken.
Allereerst Frank en Paco bedankt voor het mogelijk maken van mijn project binnen deze
bijzondere constructie tussen Philips en TU/e. Door de samenwerking heb ik kunnen
profiteren van de faciliteiten alsmede de kennis van beide zijdes. Cees, bedankt voor het
vertrouwen en je positieve relativerende kijk op zaken. Tom, bedankt voor je nuchtere
en fysische kijk op het onderzoek, het heeft me veel geholpen. Moniek, ontzettend
bedankt voor je onuitputtelijke optimisme en gedrevenheid. Jouw input is vele malen
erg nuttig gebleken. Ook Kang Yuen, Sarrita en Marina, bedankt voor het zorgvuldig
uitvoeren van talrijke analyses. Ook de studenten Steven, Ying, Aaron en Claudia en
verscheidene projectgroepjes wil ik bedanken voor hun inzet en bijdrage. Zij hebben wat
van mij geleerd, maar bovenal heb ik ook zeker wat van hun geleerd. Debbie, Roel en
Marion, het was bijzonder prettig dat er ook andere mensen met ex‐vivo huid bezig
waren, zodat we de lugubere verhalen konden delen.
Door het samenwerkingsverband tussen Philips en TU/e heb ik heel veel fijne collega’s
gehad. Ik zou mijn kamergenootjes bij Philips alsook op de TU/e specifiek willen
bedanken voor hun gezelschap. Alberto, “good luck with your thesis, I’m sure you’ll get
there!” en Callina en Sipke, als was het niet lang, het was altijd reuze gezellig en bovenal
leerzaam. Ook Robbert, Lenieke, Marieke en Linda wil ik zeker niet vergeten te
bedanken voor hun motiverende woorden en overheerlijke hamburgerlunches! Danook
Jeroen, Rudi, Marc en Yavat wat hebben we toch gelachen over de meest uiteenlopende
zaken. Heerlijk even het verstand op nul en discussieren over helemaal niks. Natuurlijk
ook mijn koffiemaatjes Robbert, Peter, Marc en Bas. Wat hebben we menig ochtend
slaperig uit onze ogen zitten kijken, maar ook jullie relativerende woorden waren een
welkome ontspanning.
Ik wil het personeel van de afdelingen plastische chirurgie en de operatiekamers in het
Catharina Ziekenhuis in Eindhoven bedanken voor alle emmertjes met huid. In het
bijzonder de plastisch chirurgen Van Rappard en Hoogbergen die deze samenwerking
mogelijk hebben gemaakt alsook Marjolein (en je directe collega‟s) en de OK‐receptie.

114
Dankwoord
Lieve dames van Nayade, wat was het toch heerlijk om zo lang bij jullie te kunnen
blijven. We hebben samen heel wat meegemaakt. Het was heerlijk om “stoom” af te
kunnen blazen tijdens een training of een wedstrijd. Nu ik klaar ben is het voor mij
helaas tijd om naar de Classic dames te gaan, maar ik hoop jullie daar te zijner tijd toch
ook weer te zien. Bedankt voor al die jaren van gezelligheid en sportiviteit!
Johanneke en Rudi, Elise en Gertjan, Niels en Mirelle, Lydia en Arjan, Anne en Peter,
Daan en Karlijn, Dennis en Ilse, Joost en Anouk, Bjorn en Sabine, Rob en Lindsy bedankt
voor julie interesse, medeleven en luisterende oren en natuurlijk voor de gezelligheid
tijdens uitjes, etentjes en BBQs.
Lieve papa en mama, jullie wil ik in het bijzonder bedanken voor alle steun en het
onvoorwaardelijke vertrouwen dat jullie altijd in me hebben gehad. Jullie hebben mij
gevormd tot wie ik nu ben en daarvoor ben ik jullie eeuwig dankbaar. Chris, Ine, Roel,
Willemijn, Wim, Liesbeth, Hennie en Harry, bedankt voor jullie steun.
Lieve Henk, mijn laatst dankwoorden zijn voor jou. Jouw onvoorwaardelijke steun,
liefde, geduld en vertrouwen hebben mij de kracht gegeven door te gaan. Het valt niet
in woorden uit te drukken wat dat betekent voor mij, maar zonder jou zou ik nooit zo
ver gekomen zijn. Ik kijk uit naar de vele mooie avonturen die wij samen zullen gaan
beleven!
Susanne, juli 2010

115
Curriculum Vitae
Susanne Dams werd op 24 april 1979 geboren te Nuenen. In 1999 behaalde zij haar
VWO diploma aan Scholengemeenschap Augustinianum in Eindhoven. Aansluitend
studeerde zij Biomedische Technologie aan de Technische Universiteit Eindhoven. Als
onderdeel van deze studie heeft zijn stage gelopen aan de University of California San
Diego (De Verenigde Staten). Hier onderzocht zij de invloed van mechanische rek op de
contractie van hartspiercellen. Haar afstudeerwerk in de vakgroep cardiovasculaire
biomechanica richtte zich op het bepalen en modelleren van de viscoelastische
eigenschappen van de thrombus van abdominaal aneurysma in de aorta. In 2006 startte
zij met haar promotieonderzoek bij Philips Research Eindhoven in de groep Care &
Health Applications. Zij deed haar onderzoek in samenwerking met de Technische
Universiteit Eindhoven in de vakgroep Soft Tissue Biomechanics & Engineering,
resulterend in dit proefschrift.

116

117
List of Publications
S.D. Dams, Y. Luan, A.M. Nuijs, C.W.J. Oomens, F.P.T. Baaijens. Modeling and simulation
of heat distribution in human skin caused by laser irradiation. J. of Biomech. (submitted)
S.D. Dams, M.de Liefde‐van Beest , A.M. Nuijs , C.W.J. Oomens, F.P.T. Baaijens. Pulsed
heat shocks enhance procollagen type I and procollagen type III expression in human
dermal fibroblasts.Skin Res. and Techn., 16(3): 354‐364, 2010.
S.D. Dams, M.de Liefde‐van Beest, A.M. Nuijs , C.W.J. Oomens, F.P.T. Baaijens. Influence
of pulse duration of heat shocks on collagen type I expression in human dermal
fibroblasts. (submitted)
S.D. Dams, M. de Liefde‐van Beest, A.M. Nuijs, C.W.J.Oomens, F.P.T.Baaijens. Heat shocks enhance procollagen type I and III expression in fibroblasts in ex vivo human skin. Skin Res. Tech. (submitted)

Related Documents