1 THE EFFECT OF FRAME-OF-REFERENCE ON THE CONSTRUCT VALIDITY OF THE SOUTH AFRICAN PERSONALITY INVENTORY by MARIAAN BOTHA Submitted in partial fulfilment for the degree MAGISTER COMMERCII (Industrial Psychology) in the FACULTY OF ECONOMIC AND MANAGEMENT SCIENCES at the UNIVERSITY OF PRETORIA Supervisor: Prof JA Nel PRETORIA July 2018

Welcome message from author
This document is posted to help you gain knowledge. Please leave a comment to let me know what you think about it! Share it to your friends and learn new things together.
Transcript

1
THE EFFECT OF FRAME-OF-REFERENCE ON THE
CONSTRUCT VALIDITY OF THE SOUTH AFRICAN
PERSONALITY INVENTORY
by
MARIAAN BOTHA
Submitted in partial fulfilment for the degree
MAGISTER COMMERCII
(Industrial Psychology)
in the
FACULTY OF ECONOMIC AND MANAGEMENT SCIENCES
at the
UNIVERSITY OF PRETORIA
Supervisor: Prof JA Nel
PRETORIA July 2018

1
REMARKS / COMMENTS
The layout of the study followed a mini-dissertation article route. Although it was based on
an article route, there was no page limitation.
In this mini-dissertation, the M student referred to herself as the researcher.
Primary data was used.
The 6th edition of the APA referencing style was used.
Multiple authorship of a single reference will apply plural tenses throughout this mini-
dissertation.
Please take note that symbols and acronyms will be utilised throughout the mini-
dissertation (refer to list of symbols and abbreviations on p. xi). However, in some instances
a concept will be written out when referring to key words or terms.
The words sub-constructs and factors have similar meanings and will be used
interchangeable, where the word sub-constructs will be applied in the literature review
section and the word factors will be applied in the analysis and discussion sections.
Specific acronyms will be used when referring to items of the Frame–of–Reference (see
list of symbols and abbreviations on p. x).

ii
ACKNOWLEDGEMENTS
I wish to express my sincere gratitude to the following people, without whom the completion
of this study and degree would not have been possible. I acknowledge not only their special
contributions in the completion of this study, but also to my life in its entirety:
First and foremost our Heavenly Father for the talents, the opportunity, the divine
guidance as well as the strength and protection that He has bestowed upon me whilst
encountering difficult times and challenges in completing this mini-dissertation.
Professor Alewyn Nel, my supervisor, for his excellent guidance, patience,
understanding and remarkable support.
Professor Karel Stanz for his kind assistance and guidance when it was needed most.
Christa Smit for all her guidance, support and constant motivation. Assisting in any and
every way needed. Believing in me and encouraging me in the final completion of this
study. Words will never be able to express my gratitude.
The South African Personality Inventory (SAPI) team for not only the financial
assistance, but also for granting me with the opportunity to contribute to the SAPI
project.
To Karien van Weele, the language editor, for your patience and kind assistance.
My wonderful, loving parents for all their love and support. The encouragement,
constant reminders of what is important in life, advice and empathy. Words fail when I
think of their unwavering support. I cannot imagine my life without them.

iii
My beautiful children, Mia and Minay, for the sacrifices they had to make while I was
busy completing my studies. There were days that I was unable to give them the
attention so desperately required. However, they kept me going with hugs and kisses
and the knowing that the completion of this study will teach them about perseverance
and the ultimate feeling of accomplishment. You inspire and challenge me. You have
my heart.
To myself for having the courage and strength to complete the final 100 metres that
took every bit of strength I had. I am able, I am strong and I do have the tenacity and
resilience required. I got through this; I can get through anything.

iv
DECLARATION
I, Mariaan Botha, declare that The effect of Frame of Reference on the construct validity of the
South African Personality Inventory in my own unaided work both in content and execution.
All the resources I used in this study are cited and referred to in the reference list by means of
a comprehensive referencing system. Apart from the normal guidance from my study leader, I
have received no assistance, except as stated in the acknowledgements.
I declare that the content of this thesis has never been used before for any qualification at any
higher education institution.
I, Mariaan Botha, declare that the language in this mini-dissertation was edited by Karien van
Weele.
Mariaan Botha Date: 31 December 2017
____________________________
Signature

v
LANGUAGE EDITING REPORT
Confirmation of editing
I, Karien Slabbert (BA Hons. Applied Language Studies, UP) confirm that this document has been
language edited.
Thank you,
Karien Slabbert

vi
TABLE OF CONTENTS
REMARKS / COMMENTS i
ACKNOWLEDGEMENTS ii
DECLARATION iv
LANGUAGE EDITING REPORT v
ABSTRACT xi
INTRODUCTION 1
RESEARCH PURPOSE AND OBJECTIVES 3
General objective 4
The potential value-add of the study 4
LITERATURE REVIEW 6
PERSONALITY PSYCHOLOGY 6
PERSONALITY ASSESSMENTS IN A SOUTH AFRICAN CONTEXT 7
Background 7
Test fairness cross culturally 9
Frame of reference and fakeability 10
Contextualisation of personality assessments 11
Methods to inventory contextualisation 13
Validity and Reliability 15
Construct validity and reliability 15
RESEARCH DESIGN 20
RESEARCH PARADIGM AND APPROACH 21
Research Strategy 22
Sampling 22
Research Procedure and Ethical Considerations 26
Statistical Analysis 27
RESULTS 29
DESCRIPTIVE STATISTICS 29
Non-contextualised inventory 29
Contextualised 35

vii
EXPLORATORY FACTOR ANALYSIS (EFA) 36
DISCUSSION 40
PRACTICAL IMPLICATIONS 43
LIMITATIONS 44
RECOMMENDATIONS 45
CONCLUSION 46
REFERENCES 47
APPENDIX A: EXAMPLE OF CONSENT FORM
APPENDIX B: ORGANISATIONAL PERMISSION
APPENDIX C: DEMOGRAPHICS QUESTIONNAIRE

viii
LIST OF TABLES
Table 1: FOR effect on reliability 19
Table 2: Characteristics of participants (Non-contextualised vs. Contextualised) 23
Table 3: Total demographical information of participants 25
Table 4: Descriptive Statistics for the non-contextualised SAPI 33
Table 5: Eigenvalues of the sample correlation matrix of the non-contextualised SAPI 30
Table 6: Goodness-of-fit 33
Table 7: Factor loadings and Communalities (h2) 34
Table 8: Descriptive statistics for the contextualised SAPI 35
Table 9: Eigenvalues of sample correlation matrix 37
Table 10: Goodness-of-fit 38
Table 11: Factor loadings and Communalities (h2) 39

ix
LIST OF FIGURES
Figure 1: Scree plot of Eigenvalues for the non-contextualised SAPI 32
Figure 2: Scree plot of Eigenvalues for the non-contextualised SAPI 38

x
LIST OF ABBREVIATIONS AND SYMBOLS
ABBREVIATIONS
EFA Exploratory factor analysis
FOR Frame of Reference
PCA Principle component analysis
RQ Research question
SAPI South African Personality Inventory
ML Maximum likelihood
SYMBOLS
X² Chi-square
α Cronbach alpha
ℎ² Communalities
M Mean
n Sample Size
p Statistical significance

xi
The effect of “Frame-of-Reference” on the construct validity of
the South African Personality Inventory
ABSTRACT
o Orientation: Organisations in South Africa have increasingly become more reliant on
personality inventories, not only for selection purposes but also for developmental
purposes. When testing candidates and/or employees, language and cultural differences
should be taken into consideration. This may be affected by the respondent’s frame of
reference when completing a personality inventory. To standardise the context
participants use when completing a personality inventory, adding a standard frame-of-
reference after each line item could affect the construct validity of the inventory. This
presents a new set of challenges to personality researchers.
o Research purpose: The purpose of the study is to investigate the effect of a
contextualised versus a non-contextualised inventory on the reliability and construct
validity of the six-factor South African Personality Inventory, hereafter referred to as the
SAPI1. The use of research objectives guided the developing arguments in order to
achieve the purpose of the study.
o Motivation for the study: Language and culture play a very important role when testing
individuals from a cross-cultural background. Studies have shown that language affects
the responses to line items, especially when the test is not in the respondent’s home
language. Recently, researchers started experimenting with using contextualised
inventories and the effect on criterion-related validity. This study will investigate the
effect of contextualisation on the construct validity of the SAPI, by adding a specific
frame of reference, hereafter referred to as FOR, to each line item of the inventory. Each
line item received an “in the workplace” tag, i.e. I am happy “in the workplace”.
1“The South African Personality Inventory (SAPI) project aims to develop an indigenous personality measure
for all 11 official languages in South Africa. Participants are Byron Adams (University of Johannesburg and
Tilburg University, the Netherlands), Carin Hill (University of Johannesburg), Leon Jackson (North-West
University), Deon Meiring (University of Pretoria), Alewyn Nel (University of Pretoria), Ian Rothmann (North-
West University), VelichkoFetvadjiev (University of Pretoria), and Fons van de Vijver (North-West University,
Tilburg University, the Netherlands, and University of Queensland, Australia).”

xii
o Research design, approach and method: A quantitative, descriptive, cross-sectional
research design was followed. The sample was determined through the use of a
convenient non-probability sampling technique, used to administer the SAPI within a
large Retailer operating in all nine provinces of South Africa. The respondents are both
based in offices as well as working in stores and functioning at administrative, junior
management and senior management levels. Two parallel inventories were distributed
amongst participants and randomly assigned to complete either the contextualised
inventory (n = 144) or the non-contextualised inventory (n = 193). Through the use of
exploratory factory analysis (EFA) and Cronbach alpha coefficients the researcher
matched the pattern of the contextualised inventory to the pattern of the non-
contextualised inventory.
o Practical/managerial implications: The SAPI has been designed specifically for South
Africa and has through research proved to be a valid, reliable measurement of
personality. The instrument should assist South African organisations to foster and create
a workforce measured by an instrument that is truly culturally unbiased. Personality types
can be matched to specific positions as the instrument can be used for both selection as
well as developmental purposes.
o Contribution/value-add: By expanding knowledge on the conceptualisation of the FOR
effect on personality inventories this study added value to both the theoretical as well as
practical aspects of the research on the SAPI. The study will contribute on a practical
level by means of analysing the effect that FOR have on the construct validity and
reliability to the SAPI specifically.
o Keywords: Contextualisation, Non-Contextualisation, Frame-of-Reference, Reliability
Construct validity, Exploratory Factor Analysis (EFA)
1
INTRODUCTION
South Africa is a diverse country. It has 11 official languages (isiXhosa, isiZulu, Afrikaans,
Tshivenda, isiNdebele, Sepedi, Setswana, Southern Sotho, siSwati and Xitsonga) and four
cultural groupings, namely African, Indian, Coloured and White (Stats SA, 2014). The African
population is further sub-categorised into Nguni, Sotho, Shangaan-Tsonga and Venda.
Therefore, it is unsurprising that South Africa is referred to as the ‘Rainbow Nation’ (Bornman,
2010). Organisations face daily challenges with regard to managing diversity within the
workplace. One of these challenges is conducting behavioural assessments within a richly
diverse country (Foxcroft & Roodt, 2010).
For decades, personality researchers investigated and researched the use of personality
inventories as a performance predictor of certain job functions (Barrick & Mount, 1991;
Barrick, Mount & Judge, 2001; Bauer & Hammer, 2003; Hunthausen, Truxillo, Mount, Barrick
& Stewart, 1998 Hough, 1992; Hurtz & Donovan, 2000, Salgado & Tauritz, 2012, Tett,
Rothstein & Jackson, 1991 and Vinchur, Schippman & Switzer, 1998.). Due to the increase in
the application of personality inventories during the prospective employees’ selection
processes, researchers started to investigate different techniques to increase the validity of
personality inventories. One of these techniques investigated includes using Frame-of-
Reference Consistency (FOR), to standardise the context within which respondents’ complete
personality inventories (Holtz, Ployhart, & Dominguez, 2005).
In previous studies, a substantial amount of attention was paid to predictive validity by adding
FOR. In this study, FOR will be applied to the South African Personality Inventory (SAPI) and
its effect on the construct validity will be tested. The SAPI project aims to create a South
African personality inventory that will cater for a multi-lingual, multi-cultural South Africa. It
is possible that various positions and the application of FOR might have different effects on
the validation and application of context in inventories (Hunthausen et al., 2003). For example,
a customer services manager at a store should show high levels of extraversion, whereas an IT
specialist might show low ratings of extraversion. This could leave the FOR effect open to
interpretation, as the researcher might indicate that the ‘in the workplace’ tag had a negative
effect on the construct extraversion.
By using SAPI and contextualising the inventory by adding the ‘in the workplace’ tag to each
line item, the researcher will contribute to the SAPI project’s corpus of data. These insights

2
could add to the construct validity and findings in relation to the former nine-factor structure
and the recently adapted six-factor structure. De Raad et al. (2008) noted that certain line items
in a personality inventory require contextualisation. However, this is not relevant to all line
items. When inventories are being contextualised, the construct validity will need to be tested.
De Raad et al. (2008), further stated that, should the assumption indicate that all constructs in
a personality questionnaire need to be contextualised, it could cause problems when creating
new personality inventories. Since personality inventories are used for various purposes,
respondents can apply any situation to statement to the inventory. As such, the statement
remains open for interpretation. However, where FOR is applied to the inventory’s line items,
it provides context and all respondents complete the inventory with the same FOR (Bing,
Whanger, Davidson, & Van Hook, 2004).
Personality inventories are used in a range of applications: from selection to developmental
purposes. However, there is still some concern that respondents can fake personality
inventories. A concern when using personality inventories in selection is that respondents
might complete the inventory with the ‘ideal candidate’ in mind (McFarland, Ryan, & Ellis,
2002). Kunda & Sanitiosa (1989) suggest that an alleged desirability of possessing certain
attributes influences a person’s self-concept. Various situations determine how a person will
react and behave and what personality traits will be exhibited. Different procedures have been
advocated in order to minimise the effect of faking. Some of the suggested procedures include
informing respondents of a lie scale (Doll, 1971), possible verification of answers
(Lautenschlager, 1994) and randomisation of items (Anastasi, 1976).
When line items of different constructs are placed at random, respondent take longer to respond
to the questions. The retrieval process takes longer than where line items are listed according
to measured constructs. In the latter case, respondents should be able to answer more quickly
since the memories and experiences have already been accessed cognitively (McFarland et al.,
2002). Cilliers (2015) recently conducted a study on randomised and block item sequencing
within the SAPI. The author noticed minor differences and she concluded that whether the line
items have been randomised or not, had no effect on the construct validity of the SAPI. A
similar logic should apply to the contextualisation of inventories than the randomisation of line
items in a personality inventory. When a FOR of ‘in the workplace’ is added to each line item
across the personality inventory, the respondent would not need to rely on different memories
and past experiences to answer the questions. The specific FOR should contextualise the
respondent’s response to the line items.

3
This study focuses on contextualising the line items of the SAPI and validating to which extent
construct validity affects a contextualised SAPI, versus that of a non-contextualised SAPI. This
research will contribute to the SAPI Project and therefore has both practical and academic
significance. The justification of this study was to investigate the effect of adding a specific
FOR to the construct validity on the six-factor SAPI. Foxcroft & Roodt (2010) stated that,
given South Africa’s history, diversity and Employment Equity Act (No. 55 of 1998)
regulations, the role and the effectiveness of psychometric assessments have a pivotal function
when used within local organisations. South African legislation require, as specified in the
Employment Equity Act (No. 55 of 1998), that psychological instruments must be culturally
fair, valid and reliable before it can be utilised (Mahembe & Engelbrecht, 2014). Notably, it is
personality researchers’ responsibility to minimise bias, yet ensure that the construct validity
and reliability of the inventory remains unchanged.
Research purpose and objectives
Many scholarly articles investigated and made reference to the use of FOR in personality
inventories (see De Raad et al.2008. , Holtz et al., 2005, 2008; Lievens et al. and Schaffer &
Postlethwaite, 2012). These scholarly articles refer to how FOR affects predictive validity
(Reddock, Biderman, & Nguyen, 2011). In turn, the purpose of this research is to investigate
and report on the effect that item contextualisation with a specific FOR has on the construct
validity and reliability of the SAPI. The researcher selected this topic, as there is limited
research on how contextualisation affects personality inventories’ construct validity. As
mentioned earlier, South Africa is a multi-cultural nation and South African legislation
manages and mitigates assessments in the workplace. It is therefore important that all
personality assessments developed by researchers are fair and non-biased.
Based on these arguments, the following research questions (RQ) were constructed:
RQ1: How does literature conceptualise the contextualisation of personality
inventories and the effect it has on the construct validity and reliability of the
inventory?
RQ2: What is the construct validity and reliability of the non-contextualised
inventory after performing exploratory factor analysis (EFA)?
RQ3: What is the construct validity and reliability of the contextualised inventory
after performing exploratory factor analysis (EFA)?

4
RQ4: What recommendations (research and practice) can be made for future use
relating to the contextualisation of the SAPI?
The general objective, specific research objectives and the study’s contributions will be
outlined and reviewed in the next three sub-sections. Thereafter, the literature review will
follow.
General objective
The overall objective of this research study was to determine whether a contextualised
inventory has higher reliability and construct validity than that of a non-contextualised
inventory.
Specific research objectives
To conceptualise how FOR affects construct validity in the SAPI, in accordance
to literature.
To determine the construct validity of the SAPI by performing exploratory factor
analysis (EFA) on a contextualised inventory.
To determine the construct validity of the SAPI by performing EFA on a non-
contextualised inventory.
To make recommendations for future research and practice.
The potential value-add of the study
The results of this study will contribute to the overall SAPI research project on various levels.
Firstly, it will contribute on an academic level by expanding overall knowledge on
conceptualising the FOR effect on personality inventories. Secondly, on a practical level, it
will help analyse the effect FOR has on SAPI’s construct validity and reliability.
This research will potentially assist with future research on the effect contextualisation has on
the construct validity of the SAPI, as well as the need for line item contextualisation. Although
this study does not focus on whether or not contextualisation is needed, it may assist future
researchers to identify and answer this question. South African legislation require, as specified
5
in the Employment Equity Act (No. 55 of 1998), that psychological instruments must be
culturally fair, valid and reliable before it can be utilised (Mahembe & Engelbrecht, 2014).
With the limited available research on how FOR affects personality inventories’ construct
validity, De Raad et al. (2008) explained that contextualisation could profoundly influence the
use and development of personality inventories within South Africa.
The next section of the study will focus on current literature relating to personality psychology
and assessments. More specifically, it will investigate contextualised and non-contextualised
inventories, as well as to which extent contextualisation influences an inventory’s reliability
and construct validity. This will be followed by a section on methodology that includes the
research design, paradigm, procedures and statistical analysis used in the study. The results
will be followed by a discussion that addresses the respective research questions. In conclusion,
the limitations, recommendations and practical implications will be presented based on the
research results.

6
LITERATURE REVIEW
Personality psychology
Traditionally, personality psychology was embedded in trait, situational and cognitive-
affective systems theory. Trait theorists suggest that a specific situation is not a key determiner
in personality measurement (Steyer, Schmidt & Eid, 1999). However, Pervin (1994) suggest
that there is consensus around the personality structure with specific reference to the ‘Big Five’,
namely openness to experience, conscientiousness, extraversion, agreeableness and
neuroticism). Situational theory focuses on the argument that individuals’ behaviour is
influenced by the environment they find themselves in at that specific point in time (Mischel,
1968). Lastly, cognitive affective theory focuses on different dispositions inherent to a person
that affect behaviour across various situations (Mischel & Shoda, 1995; Funder, 2007, and
Wagerman & Funder, 2009).
According to Murtha, Kanfer & Ackerman (1996), trait and situational theorists have reached
a contextual deadlock, as neither party can substantiate that its theory is better than the other.
To try to resolve this deadlock, researchers have tried to incorporate these theories to a
situational interaction. As such, they attempted to create three different personality taxonomies
for responses, researchers used the similarity in kind of response, the similarity of the situation
and the similarity of both the situation and the type of response.
In the past theorists, have also debated over the total number of personality traits and
identifying the most common traits (Laher, 2008). According to Donnellan & Robins (2010),
social psychology and personality tend to look at similar facets. Yet, linking these theories
seems to fill researchers with apprehension. Areas such as emotion, self-esteem and
relationship harmony are factors that link the two areas. However, the procedures, methods and
assumptions ultimately differ from each other (Tracey, Robins & Sherman, 2009). This study
is based on the conditional dispositions theory (Shaffer & Postlethwaite, 2012). This is linked
to Wright & Mischel’s (1987) notion that different personality traits present themselves at
different times. As such, personality traits are being conditional to the situation in which
individuals find themselves.
Personality assessments were used to investigate predictive, descriptive and explanatory
personality structures (Asendorpf, Borkenau, Ostendorf & Van Aken, 2001) and were
generally used to determine a candidate’s organisational fit. However, the research focus has
shifted to administrating personality inventories to determine career success and job fit (Seibert

7
& Kraimer, 2001). Organisations use competency models to determine career success and job
fit. In turn, personality inventories have a supporting function to test for the required
competencies for a specific position. Commonly used personality inventories, such as the 16PF
and the NEO-PI, were developed and tested on Western populations and based on Western
theories (Cheung, Cheung & Fan, 2013). The Big Five model was used to test the dimensions
of agreeableness, extraversion, emotional stability, intellectual stability and conscientiousness
(Goldberg, 1981).
Personality assessments in a South African context
Personality and performance in the workplace has been divided into task and contextual
performance (Bornman & Motowidlo, 1993). According to Small & Diendendorf (2006), task
performance assists a person to complete his/her job function, while contextual performance
are activities that help enhance effectiveness, such as conscientiousness when completing a
task at hand. Ability tests are used as predictors for task performance where personality
inventories are utilised to predict contextual performance (McMannus & Kelly, 1999). The
following sections will discuss the background to personality assessments and test fairness
from a cross-cultural perspective. Thereafter, the researcher will discuss the contextualisation
of inventories, validity and reliability.
Background
Bedell, Van Eeden and Van Staden (1999) stated, in South Africa, the testing of the African
ethnic group developed into a more systematic and empirically orientated approach from 1920.
During the 1940s and 1950s, there was a focus on the educability and trainability of South
Africa’s African cultural group. During these early years, researchers found that the cultural
differences among respondents influenced the testing outcomes. During the 1970s and 1980s,
researchers started recognising how culture affected testing results. Notably, researchers found
that culture influences behaviour, which influences the constructs of the personality inventories
used. Due to the Apartheid regime in South Africa, limited research was done from the 1960s
to the to mid-1980s (Claasen, 1997 and Owen, 1992). According to Van de Vijver and Rothman
(2004), in the 1980s, there was an interest in using cognitive tests for cross-cultural

8
comparisons. Meiring, Van de Vijver, Rothman and Barrick (2005) stated that, during this time,
there was a greater focus on areas such as bias, fairness and discriminatory practices.
In more recent studies, researchers found that there are different influential factors to test
development and use personality inventories. Some of these influences include social, political
and economic conditions (Oakland 2004). In a study conducted on the use of psychometric
inventories in South Africa, Patterson & Uys (2005) concluded that, even though not all
inventories have been tested for cross-cultural applicability, administrators still make use of
these tests. What is of concern is that if personality inventories fail to measure what they ought
to measure, all results and conclusions from test results should be questioned (Wallis, 2004).
In South Africa, personality inventories are conducted on an on-going basis. In a study
conducted by Valchev, Van de Fijver, Nel, Rothmann, Meiring & de Bruin (2011), it was
concluded that personality could be conceptualised across different cultures. Cheung et al.
(2013) stated that, although there is a need to measure personality in a multi-cultural setting,
legislative requirements might stipulate non-discriminatory, culturally valid inventories.
As South Africa is characterised by multilingualism and cultural diversity, it is important to
have a personality inventory that adheres to legislative requirements when assessing
personality. Hambleton (1994) explains that due to the differences in such a diverse country,
individuals across various cultures could interpret constructs such as linguistic context, cultural
diversity, worldviews and traditions very differently. Foxcroft (2004) clarifies this concept by
using the construct of intelligence as an example. Eastern cultures view intelligence as being
reflective and thoughtful, while Western cultures view intelligence as the ability to provide
swift responses and being sharp witted. Cross-cultural testing does not come without its
challenges. As such, it is imperative to investigate how this influences personality, as well as
whether race and gender might influence personality results (Costa, Terracciano, & McCrae,
2001). Hambleton, Swanepoel & Kruger (2011) takes this a step further by including the
argument that individuals in South Africa might speak more than one official language. As
such, they may be representing more than one cultural group, which could complicate the effect
on constructs and personality testing.
It has been argued that the instruments imported to South Africa do not work well across the
different language groups who mainly communicate in their native tongue (Hill et al., 2013).
These arguments and frustrations culminated the development of the SAPI, a South African
personality inventory that caters for South Africa’s different language and cultural groups.

9
Meiring (2007) explains that the Employment Equity Act of 1998 clearly indicates that South
Africa needs an equitable personality inventory. The South African legislation requires
personality measurements to be reliable, valid, unbiased and fair, and, as such, the SAPI was
developed to fulfil these requirements (French, 2011).
Bedell et al. (1999) stated that the Employment Equity Act and the Professional Board of
Psychology’s policy place test developers under increased pressure to ensure fair practises
when testing individuals. The development of the SAPI aimed to create a multi-cultural, emic
personality inventory that can be used across all eleven official language groups in South Africa
(Lotter, 2011). According to Van de Vijver & Leung (2001), construct equivalence has to be
established before cross-cultural data can be compared. Thus, it is imperative to establish
whether the characteristics being compared truly represent the different cultures being
measured. The International Guideline for Test Use (ITC, 2001) states that, when multicultural
respondents are being tested, the constructs must be meaningful to all cultural groups. In cross-
cultural personality assessments, a notable methodological issue is whether personality
structures can be compared across cultures (bias) and whether cross-cultural scores can be
compared (equivalence) (Van de Vijver & Van Hemert, 2008).
Test fairness cross-culturally
Fairness relates to the equitable treatment of different minority groups when administering
personality assessments and the interpretation and use of the results derived from the
assessment. It further includes groups that consist of different ethnic origins, languages and
ages, to name but a few (Huysamen, 2002). According to Cheung et al. (2013), personality
traits were generally regarded as stable in nature with a biological base. Therefore, these traits
could be applied consistently across cultures. However, the cultural variances were never
considered. The fairness of a test reflects the philosophies and social values that underscore
test use (Bedell et al., 1999).
Personality inventories that are administered in South Africa are generally valid and reliable,
but the application is mainly related to the group for which it was standardised (Owen, 1996).
In the past, test developers focused on developing inventories for separate cultural and
language groups (see Claasen, 1997; Foxcroft, 1997 and Meiring et al., 2005). Patterson & Uys
(2005) stated that the more test administrators became aware of the advantages of conducting

10
quality assessments, as well as the changes and improvements in inventory development
ultimately lead to tests being implemented and applied fairly across cultures. Undeniably,
internal and external influences affect the fairness of cross-cultural testing. Some of these
influences include aspects such as language barriers, economic stance and educational levels.
Not all the psychometric tests used in South Africa have been validated cross-culturally, which
may affect the conclusions and inferences drawn from them.
Frame of reference and fakeability
Personality inventories are widely used with different applications varying from selection to
developmental purposes. However, there remains some concern that respondents can fake
personality inventories. One of the concerns relating to using personality inventories in
selection is that applicants (respondents) will complete the inventory with the ‘ideal candidate’
in mind (McFarland, Ryan, & Ellis, 2002). Kunda & Sanitiosa (1989) suggest that a person’s
self-concept is influenced by an alleged desirability of having certain attributes. Various
situations determine how a person will react and behave and which personality traits will be
exhibited.
Different procedures have been advocated to minimise the effect of faking. Some of the
suggested procedures include informing respondents of a lie scale (Doll, 1971); possible
verification of answers (Lautenschlager, 1994); and randomisation of items (Anastasi, 1976).
When line items of different constructs are placed randomly, the respondent takes longer to
respond to the questions. In this instance, the retrieval process takes longer, as opposed to where
line items are listed according to constructs being measured. In the latter instance, respondents
should be able to answer more quickly, since memories and experiences have already been
accessed cognitively (McFarland et al. 2002).
The same logic should be applicable to the FOR effect than with the randomisation of line
items in a personality inventory. When a FOR is added across the personality inventory, the
respondent would not need to rely on different memories and past experiences to answer the
questions. Notably, the FOR should provide respondents with a context in which they should
respond to the line items.
Often – especially in a self-report inventory – respondents tend to portray themselves more
favourably, which is referred to as social desirability (Taylor, 2004). Notably, social

11
desirability differs from fakeability in that the person does not intentionally portray him/herself
more favourably to be considered for a specific position (Lanyon & Goldstein, 1997). Since
personality inventories are used for various purposes such as selection and development,
respondents can apply any situation to the question being asked in the inventory. As such, the
question is left open for interpretation. However, where FOR is applied to the inventory’s line
items, context is being provided and therefore respondents complete the inventory with the
same FOR (Bing, Whanger, Davidson & Van Hook, 2004).
Contextualisation of personality assessments
With the increased use of personality inventories in the selection process of prospective
employees, different techniques have been investigated to bolster validity. One of the
techniques identified was the use of FOR (Holtz, Ployhart, & Dominguez, 2005). Funder
(2010) stated that, although personality is mainly assessed through self-reporting, it is
important that data be collected through a standardised situation.
The Oxford Dictionary (2010) defines context as the “circumstances that form the setting for
an event, statement or idea”. Personality inventories are generally developed and structured for
individuals to indicate general behaviour, emotions and attitudes in a questionnaire that adds
no context to the questions (Robie et al., 2000). When a respondent answers line items in a
personality inventory, depending on the question, s/he accesses past experiences, memories,
behaviours and feelings from various life stages (McFarland, Ryan, & Ellis, 2002 and Lievens,
De Corte & Schollaert, 2008). Respondents tend to present inaccurate self-images, as they rate
their self-perceptions differently depending on the situation (Kunda & Sanitioso, 1989) and
because they are tested for selection purposes (Schmit et al., 1995). Roberts & Donahue (1994)
also found that, depending on the situation, people have different views of themselves and as
personality inventories are a form of self-presentation, their responses may vary according to
the type of self they would like to portray (Schmit et al., 1995 and Small & Diedendorf, 2006).
In a meta-analytic investigation, Shaffer & Postlethwaite (2012), noted that there are two
independent dimensions for personality inventories namely FOR, thus, contextualised and non-
contextualised inventories and developmental inventories. In other words, general personality
inventories versus workplace-specific inventories. For example, inventories that were
specifically designed for general use have been used to conduct validity studies and
subsequently changed to indicate a work-related FOR.

12
Small & Diendendorf (2006) stated that by adding a work-related FOR to a personality
inventory’s line items, the participant is asked to describe his/her personality at work.
Conducting a personality inventory without contextualisation might present a problem with
regard to the inventory’s predictive validity. According to the self-presentation theory,
inventories without a specific context may affect the accuracy of a respondent’s self-
presentation, as s/he may use the incorrect FOR when answering the line item (Hogan, 1991).
The theory of personality-item response indicates that there is considerable evidence to support
using line items with a work-related context (Schmit et al., 1995). Holtz et al. (2004) followed
a ‘justice framework’ approach to investigate multiple ways to improve the use of personality
inventories. The well-known NEO – five-factor inventory was used. By using N = 345, the
administered inventory was changed by adding a work-based FOR. The results showed the
inventory to have inconsistent responses. There was a change in relation to the applicant’s job-
related perceptions. It appears that respondents adjusted their responses when context was
added to the inventory.
Notably, the contextualisation of line items increase predictive validity with regard to certain
constructs such as conscientiousness and emotional stability (see Barrick & Mount, 1991 and
Tett, Jackson & Rothstein, 1991). However, how does contextualisation affect the construct
validity of an inventory? De Raad et al., 2008 state that certain line items in a personality
inventory need contextualisation. However, this is not relevant to all line items. The authors
state that, when one assumes that all constructs in a personality questionnaire requires FOR, it
might cause problems when creating new personality inventories. Schmit et al., (1995) state
that item content manipulation could have psychometric implications. The authors explain that
a multi-factor inventory could be changed to a one-factor inventory, which could result in
questionable scale integrity.
Participants often comment that the answer to a specific construct depends on the situation (De
Raad, Sullot & Barends, 2008). Lievens, De Corte & Schollaert (2008) propose adding context
to the inventory to help participants formulate a FOR to render results that are more accurate.
Researchers started to investigate contextualised inventories to improve personality
inventories’ criterion validity. The relationship between personality and predictive validity has
been researched extensively (see Barrick & Mount, 1991; Tett, Jackson, & Rothstein, 1991;
Salgado, 1998 and Hurtz & Donovan, 2000). These researchers conducted a meta-analysis to
determine which constructs display a correlation of nonzero to job performance (Small &

13
Diedendorf 2006). According to Hogan & Holland (2003), a theory linking performance and
assessment, based on individual differences and effectiveness at work, would increase
predictive validity. A study conducted by Shaffer & Postlethwaite (2012) found that the
criterion validity of the contextualised inventory was higher than that of a non-contextualised
inventory.
By adding context to the line items of a personality inventory, the participant will only retrieve
relevant experiences that will increase the construct validity of the inventory. Lievens et al.
(2008) explain that when respondents’ complete personality inventories with generic line
items, some will answer the line items with a specific FOR in mind, while others use a different
FOR across all the items. Alker (1972) explain that it is possible for an individual to answer
different line item options with different circumstances as FOR. Pace & Brannick (2010)
explained this phenomenon by stating that a person’s work environment could possibly be
substantially different to the same person’s recreational or home environment, which might
influence one’s persona and their responses to the personality inventory.
In the critical appraisal of the Five Factor Model, McAdams (1992), states that adding context
seems to be important for better understanding, making provision of a more detailed description
and to assist with an accurate prediction. Bing et al., (2004) explains that FOR line items can
be clarified and might reduce error in measurement. Notably, respondents do not answer all
line items with different context specificity. In addition, the line items that actually showed
differences in the context specificity did not necessarily display errors in the variances (Robie
et al., 2000). The purpose of adding a FOR is to ensure consistency relating to a relevant
situation, as opposed to showing responses across different situations (Holtrop, Born, De Vries
& De Vries, 2014). According to Robie et al. (2000), people tend to display consistent
behaviour in similar situations. As such, personality researchers should research FOR and the
specific types of this approach before implementing it in any inventory.
Methods of inventory contextualisation
A personality inventory is contextualised when a specific context is applied to each line item
within the inventory. Gilliland (1993) states that adding FOR to an inventory helps improve
the respondent’s reaction, as the line item help the respondent relate to a specific situation that
will increase the overall perception of fairness. Three methods are commonly applied when

14
contextualising inventories. The first method is that of instructional contextualisation, the
second is tagged contextualisation and the third is complete contextualisation (Holtrop et al.,
2014)
With instructional contextualisation, a group of participants are being instructed to think of a
specific situation when completing a personality inventory, such as their work environment.
This method is commonly applied to South African organisations (Holtrop et al., 2014). The
typical approach is that before starting the process, the administrator will instruct participants
on how to complete the inventory. Hereafter, the administrator will inform participants to
consider how they would typically behave in a work environment when answering the line
items (Holtrop et al., 2014).
With tagged contextualisation, a line item merely receives an additional tag, such as ‘in the
workplace’. For example, the line item ‘I pray for others’ is tagged to read ‘I pray for others in
the workplace’. According to Holtrop et al. (2014) the tagged contextualisation method is used
most often. This adds to the researchers’ findings that a tagged inventory better supports the
current research than that of instructional contextualisation. Contrary to Gilliland (1993) who
found that participants prefer tagged inventories, Holtrop et al. (2014) found that respondents
who participated in their study preferred generic to tagged inventories. Some reasons for
respondents disliking tagged items, as suggested by Holtrop et al. (2014), included that tagged
line items seemed artificial, was boring to complete and some respondents felt that it restricted
their response options. Pace & Brannick (2010) measured the predictive validity of a work-
specific FOR to the construct openness to experiment against the same construct, by using
generic line items. The authors found that contextualised items perform better than merely
instructional inventories.
With complete contextualisation, a line item is changed and redesigned completely to match a
specific context. For example, ‘I pray for others’ gets redesigned to read ‘I pray for the people
that work with me’. According to Lievens et al. (2008), a personality inventory’s line items
should be adapted to a completely contextualised item, as opposed to a mere tag. In their study,
Holtrop et al. (2014) found that complete contextualisation has a greater FOR effect than
tagged inventories.
Even though the tagged approach seems appropriate when adding FOR to various line items,
evidence in research conducted by de Raad et al. 2008 shows that it is better to follow a
complete contextualised approach. However, this approach is more time consuming and

15
requires considerable input and research to ensure that validity remains intact (De Raad et al.
2008).
Validity and Reliability
Criterion, content and construct validity are the three areas of validity that researchers focus on
(Maree, 2012 and Cronbach & Meehl, 1955). According to Laher (2010), for psychometric
inventories to be reliable, valid and fair, it is important to determine the construct validity,
reliability and internal consistency. Where a new psychometric instrument is being developed,
different scale techniques can be used to determine the construct validity of studies. It is
important to validate inventories, as these validation studies underline the credibility of
inventories measuring different constructs (Hopwood & Donnellan, 2010).
Construct validity and reliability
Where constructs measure differently across cultures, specifically with a non-standardised
inventory, the use of cross-cultural tests can be discriminatory (Van der Vijver & Rothman,
2004). The test developer is responsible for ensuring that the same constructs are being
measured cross-culturally, as well as across various language groups (Patterson & Uys, 2005).
Huysamen (2002) states that psychometric theories such as fairness, bias, reliability and
validity evolve and change as test theories develop. Retief (1988) supported this and stated that
personality tests hardly ever retain their reliability, as validity is affected when it is applied
across different cultures.
As this research aims to add the context of ‘in the workplace’ to each line item of the SAPI, it
is important to note the statement made by Bredell et al. (1999). According to the authors,
changing the wording of a line item can affect a personality inventory’s construct validity, as
well as the predictive and score validity.
According to Maree (2007), construct validity is to ensure standardisation and to test to which
extent the constructs are covered by the inventory used. In a study by Worthington & Whittaker
(2006) the authors state that EFA, confirmatory factor analysis (CFA) and structural equation
modelling (SEM) can be used as scale techniques. Hopwood & Donnellan (2010) explain that
if CFA is performed first, the inventory often shows low measures of validity. As such, they

16
recommended that researchers use different scale techniques (Hopwood & Donnellan, 2010).
The CFA is used to test for convergent of discriminant validity. Convergent validity focuses
on to which extent multiple methods of measuring a variable will render a similar result, while
discriminant validity focuses on to which extent different latent variables are unique (O'Leary-
Kelly & Vokurka, 1998). The researcher aims to attain convergent validity, as it will indicate
greater construct validity for the SAPI.
When developing a new inventory, the researcher must adhere to the following steps:
establishing exactly what it is that needs to be measured; compiling items and grouping these
items according to the constructs being measured; and determining the measurement format.
Furthermore, the item groupings need to be reviewed by experts; validation items need to be
considered for inclusion; the researcher must pilot the items to a group of respondents; the
results of the pilot must be assessed; and the length of the inventory must be optimised
(Worthington & Whittaker, 2006). As mentioned earlier, criterion validity (predictive validity)
has been researched over the years to test job- person fit in organisations.
O'Leary-Kelly & Vokurka (1998) describe construct validity as a process consisting of multiple
facets. It is explained that the first step aims to identify a group of items that has to be measured.
The second step involves a process where the researcher has to establish to which degree the
items measure the construct. The last step aims to determine to what extent the construct relates
to others. Researchers generally agree that when describing personality, there should be a
minimum of five factors, commonly known as the ‘Big Five’. Goldberg (1992) and Schmit et
al. (1995) raised concern that the contextualisation of an inventory might affect factors.
However, after performing a series of factor analyses, it was found that including the ‘at work’
context influences neither the structure nor the psychometric properties.
As South Africa is characterised by cultural and language differences, the question needs to be
asked, whether adding FOR would influence the reliability and validity of respondents’ scores.
The FOR effect takes place when the way respondents respond to personality scales, and how
the validity of the scales are affected by adding a specific context to the line items (Shaffer &
Postlethwaite, 2012). Lievens et al. (2008) provide two explanations for the FOR effect. The
first is the ‘traditional’ explanation, while the second is the ‘alternative’ explanation. The
traditional explanation of the FOR is that, when answering the inventory, that the between-

17
person difference is reduced since all the respondents have the same reference in mind when
completing the inventory. It is explained that the traditional approach is ‘person-centred’, as
the inventory results are grouped according to individuals’ scores. Furthermore, the assumption
has been made that between-person variability raises the reliability of inventories with a FOR,
which, in turn, leads to an increase in validity.
The alternative explanation, as indicated by Lievens et al. (2008), is that the between-person
variability and within-person inconsistency is reduced when a FOR is introduced in an
inventory. The alternative explanation assumes that the criterion-related validity will increase,
since the FOR will be applied consistently across the inventory, i.e. using the correct FOR
while completing the inventory.
Heller, Watson, Komar, Min & Perunovic (2007) state that the effect of FOR could cause
challenges in the validity of personality studies, as inventories that are designed to assess non-
contextualised personality might not have the same validity for contextualised, behaviour
specific outcomes. There is limited research that compares the validity of contextualised and
non-contextualised inventories and the research conducted has mainly been on students (see
Bing et al. 2004; Lievens et al., 2008 and Robie et al., 1995). Notably, these studies mainly
focused on its effect on predictive rather than on construct validity. Lievens et al., (2008) states
that contextualised inventories show higher levels of internal reliability than non-
contextualised inventories. Again, a reason for this is that respondents refer to different
situations when answering a generic, non-contextualised personality inventory.
Table 1 provides a summary of previous research conducted on contextualised and non-
contextualised inventories and its effect on reliability, derived from Schaffer & Postlethwaite
(2012).

18
TABLE 1: FOR effect on reliability
Researcher Content of the
study
Contextualised
inventory
Non-
contextualised
inventory
Schmit et al.,
(1995)
Testing four of the
Big Five traits
(excluding
openness)
Lower error
variance
Higher error
variance
Robie et al.,
(2000)
Testing facet level
measures of
conscientiousness
Lower error
variance
Higher error
variance
Lievens et al.,
(2008)
Testing all Big Five
traits
Lower error
variance
Higher error
variance
Source: Schaffer & Postlethwaite, 2012.
Table 1 on the FOR effect on reliability highlights that more research needs to be conducted in
this field. However, at this point, evidence seems to support the view that contextualised
inventories may have a higher validity because the internal reliability measures are higher.
From this literature review, it is clear that the conditional dispositions theory may present
problems when measuring personality, as test takes might interpret the line items of non-
contextualised inventories differently (Lievens et al., 2004). Both multilingual and cross-
cultural testing, and the challenges thereof, was discussed briefly. The research indicated that
South Africa has grown in terms of personality testing, not only among all cultural groups, but
also in recognising that personality testing should be conducted fairly, as stated in the
Employment Equity Act. Personality inventories are used interchangeably in South Africa,
regardless of whether they are suitable. Another interesting finding was that of Swanepoel and
Kruger (2011), who stated that one individual might represent more than one cultural and
linguistic group in South Africa. Notably, personality researchers need to take cognisance of
this. Measuring personality across different cultures is already a challenge in itself. Adding
different dimensions, such as using inventory, a general or work-specific context and adding
contextualisation brings about more challenges for personality researchers.
It is also evident that researchers spent considerable time on researching the effect of FOR on
predictive validity. However, more research is required to establish how tagging and complete
contextualisation affects an inventory’s construct validity. A lot still needs to be done in terms
of personality testing, as well as with regard to developing a valid, reliable measure across
different groups. Notably, the SAPI aims to do just this.

19
RESEARCH DESIGN
The study followed a quantitative, positivist paradigm for the research problem, as this
paradigm explains that true events can be observed and explained through logical statistical
analysis. In other words, social phenomena can be investigated or researched from an objective
truth (Leitch, Hill & Harrison, 2010). Research designs and methods provide different ways to
gather and analyse data (Saunders, Lewis, & Thornhill, 2012). It is described as a plan to
address research questions. Struwig & Stead (2007) describe quantitative studies as a structured
research process that includes large representative samples and data collection procedures.
The research design followed Mouton’s (1996) instructions and guidelines in measuring the
construct validity of SAPI’s contextualised and non-contextualised inventories. Hopkins
(2008), explains that, when conducting quantitative research, the design can either be
descriptive or experimental. This study will be descriptive, as the subjects will only be
measured once and furthermore, there will be a specific focus on establishing associations
between variables.
The aim of this study is to explore how FOR affects the construct validity of SAPI. Literature
suggest that adding FOR to personality inventories increases construct and criterion validity
specifically relating to selection purposes (Robie, Schmit, Ryan, & Zickar, 2000 and Van der
Merwe, 2005). Construct validity is a measurement used to ensure that the inventory is
measuing what it was set out to measure. Trochim & Donnelly (2007:58) refer to construct
validity as ‘pattern matching’. This implies that the researcher matches observed pattern with
the theoretical pattern when measuring construct validity. For the purpose of this study, the
researcher will therefore match the pattern of the contextualised inventory to the pattern of the
non-contextuallised inventory.
Additionally the researcher followed a cross-sectional developmental design. Cross-sectional
research focusses on a single point in time (Welman et al., 2012 and Du Plooy, 2002). These
studies help provide the researcher with information when s/he investigates a point in time and
data collection is also established at a certain point in time (Salkind, 2009). As this design is
not geographically bound, the researcher was able to get participants to complete the survey in
different regions of South Africa. An advantage of conducting a cross-sectional design is that
it is easy to administer, inexpensive and not as time consuming as other possible methods
(Welman et al., 2012).

20
Research paradigm and approach
Maree (2012) describes a research paradigm as the filter or principles through which one can
interpret true reality. In addition, the author states that these paradigms include aspects of a
worldview, such as belief systems and fundamental principles. When selecting a paradigm,
Mills, Bonner & Francis (2006) suggest that researchers choose a paradigm that is consistent
with their own beliefs about reality. According to Creswell & Plano (2007), some of the most
popular paradigms include post-positivism, pragmatism, constructivism and advocacy.
When considering an applicable research paradigm, Wahyuni (2012) states that the following
aspects should be considered: a) ontology (type of reality), b) epistemology (what is seen as
acceptable knowledge), c) axiology (values of the researcher) and d) research methodology.
The study used a positivist paradigm for the research problem, as it explains that true events
can be observed and explained through logical, statistical analysis. In other words, social
phenomena can be investigated or researched from an objective truth (Leitch, Hill & Harrison,
2010).
Positivism can be described as a scientific method and is based on rationalistic, empiricist
philosophies (Maree, 2012). As the primary data will be gathered via a developed personality
inventory, the researcher will need to interpret the obtained data using a scientific perspective.
Ontologically, the positivism paradigm establishes causal and statistical relationships.
Therefore, the processes and procedures will be transparent, so that the study can be replicated
in future. Epistemologically, it mirrors beliefs of objective realities (Maree, 2012). For
example, it is assumed that all respondents understand different line items in the SAPI the same
way. At an axiological level, the positivist paradigm will be judged by the generalisation
capability of results to the wider population. Therefore, the inquiry strategy and research design
was adapted to a positivist philosophical approach. Wildemuth & Barbara (1993) state that the
positivist approach is associated with quantitative confirmatory studies. As such, it would suit
the purpose of this study.

21
Research strategy
Two surveys were administered to test the effect of FOR on SAPI. The first survey consisted
of non-contextualised line items and the second inventory was contextualised with an ‘in the
workplace’ tag. The surveys were administered electronically, as this is indicated to be a more
convenient approach to reaching a wider audience across an organisation. According to Cook,
Heath & Thompson (2000), it is widely recognised that there is a continuous increase in the
use of the Internet, with the number of users doubling annually (Cobangoglu, Warde & Moreo,
2001). During the 1990s, the Internet was introduced as a way of administering surveys to
participants (Cook et al., 2000). Some benefits of computer-based surveys include relatively
limited costs, the ability to reach a wide target population in different geographical locations
and that technology is easy to use. According to Sills & Song (2002), disadvantages include
bias, non-response or various demographic factors, such as race and gender.
To ensure that this study was conducted successfully, it was decided that a computer-based
administration method would be the most appropriate option. Due to the nature of its business,
the organisation has a wide geographical scope. Therefore, it would be more beneficial for
employees to complete the survey when they are not pressured for time. Qualtrix, the web-
based system that was used to collect data, was populated with the contextualised and non-
contextualised versions of the survey. Respondents were sent a link, at which point the system
randomised the surveys between users. The participants were asked to complete an inventory
with two different scenarios. The one questionnaire was non-contextualised while the other
questionnaire had a FOR (in the workplace) listed after each line item.
Sampling
In order to select a diverse sample across different geographical locations in South Africa, the
researcher selected a large retailer that operates in all nine provinces of South Africa. Although
the retail chain has stores in all provinces, operating offices are only located in five of the nine
provinces, namely KwaZulu-Natal, Gauteng, the Western Cape, Free State and the Eastern
Cape.
For this study, a convenience sampling technique was used to obtain participants. It is not as
time consuming, costly and labour intensive but the downside to this is that it could lead to
poor data quality. The study focused on non-proportional sampling, as the actual proportion of

22
the population was not important for the purpose of this study. Shortly after compiling the
sampling plan, the researcher attained ethical clearance from the retailer, as well as from the
University of Pretoria (UP) in order to commence with the study. Written permission was
received from respondents and the sample size was determined. A sample size of 400 (N = 400)
respondents was identified, regardless of their gender or ethnicity, as this was not an important
factor in conducting this research.
The population group consisted of both males and females from different ethnic backgrounds
and language groups that work in the various regions of the retailer across South Africa. The
respondents are office based or work in stores and perform job functions at administrative,
junior management and senior management levels.
The Qualtrix computer-based system created a link that was emailed to the participants, which
they then selected in order to complete the online survey. The system randomly allocated
different surveys to each participant and the sample size ultimately consisted of
N = 338. Table 2 provides a summary of the data.
TABLE 2: Characteristics of participants (non-contextualised vs. contextualised) (N=338)
Frequen
cy
Percentage
Valid Non-Contextualised 193 57.1
Contextualised 144 42.6
Total 337 99.7
Missing System 1 .3
Total 338 100.0
The data from Table 3 below highlights that more (55.7%) female respondents completed the
non-contextualised inventory than the contextualised inventory (44.3%). The majority of the
respondents were White (63.6%), while Indian respondents were in the minority (7.4%).
Coloured respondents (16.1%) and African respondents (12.7%) also had a lower level of
representation in the study. The majority of the respondents who completed the non-
contextualised inventory equally possessed either a Grade 12 (13%) or a Diploma (13%), with
the lowest qualification being Grade 9 (0.6%). In the case of the contextualised inventory, the
majority of respondents possessed a Grade 12 (12%), with the highest educational level being

23
a Master’s degree (3.4%) and the lowest Grade 12, respectively. The most representative
language in the study is English (55.5%), followed by Afrikaans (31.2%) and isiXhosa at 3.0%.
The ability to read English ranged from good (18.5%) to very good (79.87%), while five
respondents indicated that their reading ability is poor (0.6%) and very poor (0.9%).

24
TABLE 3: Total demographical information of participants (N = 338)
Non-
contextualised
Percenta
ge
Contextualised
Percenta
ge
Total
Gende
r
Male 71 55.0% 58 45.0% 129
Female 108 55.7% 86 44.3% 194
Total 179 55.4% 144 44.6% 323
Race White 113 55.1% 92 44.9% 205
African 20 48.8% 21 51.2% 41
Indian 17 70.8% 7 29.2% 24
Coloured 28 53.8% 24 46.2% 52
Total 178 55.3% 144 44.7% 322
Educatio
n
Grade 9 2 100.0% 0 0.0% 2
Grade 12 42 51.9% 39 48.1% 81
Certificat
e
10 41.7% 14 58.3% 24
Diploma 42 57.5% 31 42.5% 73
Bachelor’
s
34 57.6% 25 42.4% 59
Honours 35 64.8% 19 35.2% 54
Master’s 12 52.2% 11 47.8% 23
Other 2 28.6% 5 71.4% 7
Total 179 55.4% 144 44.6% 323
Language Afrikaan
s
50 49.0% 52 51.0% 102
English 112 61.9% 69 38.1% 181
isiNdebel
e
2 100.0% 0 0.0% 2
isiXhosa 2 20.0% 8 80.0% 10
isiZulu 2 22.2% 7 77.8% 9
Sepedi 1 100.0% 0 0.0% 1
Sesotho 1 33.3% 2 66.7% 3
Setswana 4 57.1% 3 42.9% 7
Siswati 1 100.0% 0 0.0% 1
Tshivend
a
1 100.0% 0 0.0% 1
Xitsonga 4 80.0% 1 20.0% 5
Other 2 20.0% 2 50.0% 4
Total 182 55.8% 144 44.2% 326
Literac
y
Very Poor 1 33.3% 2 66.7% 3
Poor 0 0.0% 2 100.0% 2
Good 30 50.0% 30 50.0% 60

25
Very Good 148 57.4% 110 42.6% 258
Total 179 55.4% 144 44.6% 323
Research procedure and ethical consideration
The researcher made use of primary data to conduct the study. In order for the researcher to
approach the organisation’s employees, authorisation was obtained from its Human Resources
(HR) Director. In addition, prior to data collection, ethical clearance was obtained from the
Ethical Committee of the University of Pretoria. A letter was sent via email to employees,
inviting them to participate in the study. The data was collected via an online survey approach.
This method included links to email accounts that were sent out and followed an online
completion of questionnaires. From the 400 emails sent out, only 338 responded and were
deemed usable for analysis (84.5.9% response rate).
Noting the importance of an ethical approach, the respondents were asked to give consent to
participate in the research by selecting a tick box stating that they agree. The letter of consent
informed respondents of their rights as participants, such as confidentiality, the right to
withdraw from the process and anonymity. The ethical consideration was used as a guideline
to using and interpreting results (Foxcroft & Roodt, 2009), as well the way the research was
conducted to prevent participants from being harmed (Orb, Eisenhauer, & Wynaden, 2000).
The ethical guidelines used and followed in this study are addressed and discussed briefly
below:
Informed consent: According to Flick, Von Kardoff & Steineke (2004), this is
the most important ethical principle prior to conducting research. Participants
must know their rights and give consent to participate in the research study.
Electronic consent was received from all participants who completed the online
survey. APPENDIX B provides an example of the informed consent forms.
Confidentiality: Participants have the right to confidentiality and anonymity
(Whiting, 2008) and no information is to be used for any purposes other than that
of the research.

26
Voluntary participation: Each respondent was informed that participation in
this research is completely voluntarily, a principle that is supported by Leedy &
Ormond (2013) and Shaw (2003).
Statistical analysis
The statistical analysis was conducted by using IBM SPSS (SPSS Inc., 2003). Descriptive
statistics, factor analysis and Cronbach’s alpha coefficient analysis was done. These analyses
aimed to determine which of the inventories showed the highest construct validity and
reliability. The data distribution data was analysed though standard deviation, mean, skewness
and kurtosis for both the contextualised and non-contextualised inventories.
De Bruin (2009) developed a step-by-step SAPI analysis manual that was used to analyse the
data statistically. As part of the data analysis, the criteria for extracting the factors and the
method for rotation used will be described and explained in detail in the following sections. A
table of the rotated factor loadings will be created and values above the criterion value will be
indicated. Both the percentage of variance and the eigenvalue will be highlighted. Field (2009)
recommends including a table of correlation and sample size.
The three steps followed to conduct the factor analysis included assessing the suitability of the
data, factor extraction and factor rotation and interpretation (Pallant, 2013). As this study
investigates whether adding FOR influences the constructs currently being measured, factor
analysis provides the researcher with the needed information.
Step 1: Descriptive analysis
Descriptive statistics was used to summarise, analyse and explore the assumptions underlying
the data analysis. The data quality is determined by calculating and including exclusions on the
mean, standard deviation, skewness >2 and kurtosis >4 (DeCarlo, 1997).
Step 2: Factor analysis
Factor analysis was used to measure the latent variables, to understand the structure of a set of
variables, and to ensure that the questions asked related to the construct being measured (Field

27
2009). The two possible approaches to factor analysis are exploratory and confirmatory factor
analysis. In a study conducted by Worthington & Whittaker (2006), the authors state that EFA,
CFA and SEM can be used as scale techniques. According to Pallant (2013), CFA is a
sophisticated technique that researchers use to confirm specific theories or hypotheses of a
structure that is fundamental to a set of variables. EFA is used to study the interrelationship
between variables (Pallant, 2013).
For the purpose of this study, EFA was chosen as the analytical method to determine the factors
within the constructs, as well as to investigate the statistical characteristics of these factors
(Murphy & Davidshofer, 2005). Salgado & Moscoso (2003) explain that both the
contextualised and non-contextualised inventories will only be seen as equivalent if there are
equal underlying factors amounting to the same proportionate variances between the results.
Factor and item analysis needs to be performed to determine construct validity, (Maree, 2012)
and thereafter the EFA. Maree (2012) explains that the reason for factor analysis is to determine
which line items should be grouped together to measure similar factors. To identify loadings
and communalities, principle component analysis (PCA) was performed. By using the PCA
extraction method, the total number of factors for extraction was determined. Eigenvalues >1,
as well as the Scree plot were analysed to indicate the factors (Maree, 2010 and Muca, Puka,
Bani & Shahu, 2013). After the six factors were identified, the maximum likelihood (ML)
extraction method was used to compare the model fit. Oblimin rotation methods were used for
further interpretation, as correlations were found between factors. Thereafter, the pattern matrix
was used to determine which factors were loaded inaccurately or double. The goodness-of-fit
was applied to confirm communalities between the constructs. Commonalities aim to
determine whether an item is a strong, reliable measure of the relevant factor. Hair, Black,
Babin, Anderson & Tathum (2006) explain communalities as the total variances that a variable
share inclusive of all other variables within the analysis. Larger communalities indicate higher
quality measures. For the purpose of this study, it was decided to disregard coefficients below
0.20, as these coefficients generally indicate poor factorial congruence.
Step 3: Internal reliability analysis
Reliability had to be tested so that the researcher could indicate to which degree the scale is
free from random error. According to Pallant (2013), test-retest reliability and internal

28
consistency are two of the most frequently used indicators of a scale’s reliability. In order to
measure internal reliability, the most commonly used coefficient is that of Cronbach’s
coefficient alpha α as the coefficient of reliability.
Pallant (2013:6) describes internal reliability as “…the degree to which the items that make up
the scale are all measuring the same underlying attribute”. Almehrizi (2013) also describes it
as the most commonly used coefficient to measure internal reliability. According to Lumpur,
Maizura, Masilamani & Aris (2009), the α coefficient ranges from 0 to 1. A high α value
represents a more reliable scale and is recommended by Nunnally (1978) to be at a minimum
level of .7.
RESULTS
The following section outlines the study’s results. This section is structured in such a manner
to first report on the descriptive results on the non-contextualised inventory. This will be
followed by the results of the individualised contextualised inventory. Thereafter, during the
exploratory factor analysis, a comparison between both inventories will be made, as well as
when presenting the results of the reliability of the respective constructs.
Descriptive statistics
Non-contextualised inventory
TABLE 4: Descriptive statistics for the non-contextualised SAPI
Item Mean Std Deviation Skewness Kurtosis
C_C_Achiev01_1 3.88 .891 -1.155 1.786
C_C_Achiev04_1 4.25 .669 -.765 1.038
C_C_Achiev05_1 4.17 .647 -.950 2.402
C_C_Achiev06_1 4.24 .604 -.606 1.362
C_C_Achiev08_1 4.18 .696 -.704 .882
C_C_Achiev09_1 4.47 .663 -1.262 1.999
C_C_Achiev10_1 4.32 .552 -.060 -.619
C_C_Order02_1 4.19 .689 -.648 .587
C_C_Order08_1 4.12 .629 -.307 .162
C_C_Order09_1 4.33 .599 -.359 -.486
C_INTEG_Integ05_1 4.34 .644 -1.219 4.135
EX_EX_Play04_1 3.78 .839 -.395 .326
EX_EX_Play05_1 4.15 .646 -.152 -.630
EX_EX_Play06_1 3.08 .975 -.040 -.335
EX_EX_Sociab02_1 3.47 .996 -.217 -.565
EX_EX_Sociab04_1 3.92 .719 -.482 .453

29
EX_EX_Sociab06_1 3.60 .953 -.313 -.434
IO_INTEL_Intel04_1 4.37 .540 -.520 1.251
IO_O_Epist01_1 4.50 .580 -.783 -.209
IO_O_Epist03_1 4.43 .527 -.361 -.495
IO_O_Epist07_1 4.49 .573 -.671 -.410
IO_O_Epist08_1 4.39 .538 -.146 -.772
N_ES_Negat02_1 2.93 1.076 .090 -.526
N_ES_Negat03_1 2.82 1.117 .168 -.689
N_ES_Negat04_1 3.53 .975 -.288 -.239
N_ES_Negat09_1 2.98 1.019 .294 -.360
SRNeg_INTEG_Deceit03_1 1.62 .690 1.017 1.134
SRNeg_SH_HostEg01_1 1.88 .797 1.447 3.626
SRNeg_SH_HostEg04_1 2.45 .891 .437 .242
SRNeg_SH_HostEg07_1 1.57 .585 1.220 3.485
SRNeg_SH_HostEg09_1 1.68 .829 1.228 1.328
SRNeg_SH_HostEg11_1 1.69 .773 1.464 3.419
SRPos_FC_Facil01_1 4.16 .621 -.504 .966
SRPos_FC_Facil02_1 3.97 .614 -.300 .740
SRPos_FC_Facil03_1 4.22 .584 -.392 .751
SRPos_FC_Facil04_1 3.61 .655 .183 -.030
SRPos_FC_Facil05_1 4.09 .577 -.457 1.674
SRPos_FC_Facil06_1 3.81 .703 .016 -.311
SRPos_FC_Facil09_1 3.88 .764 -.348 -.026
SRPos_RH_IntRel09_1 3.97 .608 -.817 2.409
SRPos_SH_WarmH10_1 3.97 .488 -.040 1.283
Table 4 includes the means, standard deviations, skewness and kurtosis of the 41 items used.
When analysing each item’s skewness and kurtosis values, Table 4 shows that only one item
was not distributed normally. This item showed a kurtosis > 4.00. As a result, this item was
excluded from further data analysis. All other items showed a skewness < 2.00 and a kurtosis
of < 4.00 and will therefore be included in further analysis. Of the initial 41 items, 40 items
were retained after this process. When looking at the mean scores of the non-contextualised
personality inventory, it was found that it had an average mean of 3.63. This indicates that with
most items, the test-takers tended to choose the ‘agree’ or ‘strongly agree’ option. This is an
indication that most items had a positive response rate.
Exploratory factor analysis
TABLE 5: Eigenvalues and Total Variance explained of the non-contextualised SAPI
Factor Total % of Variance Cumulative %
1 10.060 24.537 24.537
2 3.108 7.581 32.117
3 2.594 6.326 38.443
4 2.224 5.423 43.867
5 1.875 4.574 48.441
6 1.649 4.021 52.462
7 1.569 3.827 56.288
8 1.236 3.016 59.304
9 1.080 2.634 61.938
10 .990 2.415 64.353
11 .937 2.286 66.639

30
12 .875 2.133 68.772
13 .854 2.084 70.856
14 .791 1.929 72.785
15 .744 1.814 74.599
16 .731 1.784 76.383
17 .704 1.716 78.100
18 .677 1.651 79.750
19 .659 1.608 81.358
20 .617 1.506 82.864
21 .592 1.443 84.306
22 .555 1.353 85.659
23 .526 1.283 86.942
24 .510 1.245 88.187
25 .468 1.143 89.329
26 .432 1.055 90.384
27 .403 .982 91.366
28 .387 .945 92.311
29 .367 .895 93.206
30 .344 .838 94.044
31 .323 .788 94.832
32 .298 .727 95.559
33 .267 .650 96.209
34 .263 .642 96.851
35 .246 .600 97.451
36 .224 .545 97.996
37 .195 .477 98.473
38 .186 .453 98.926
39 .160 .391 99.317
40 .154 .377 99.694
41 .125 .306 100.000
Table 5 includes the eigenvalues, percentage of variance and the cumulative percentage of
variance for the non-contextualised inventory. The number of factors was extracted according
to the maximum likelihood estimation ML extraction method with an oblimin rotation. The
results in Table 5 highlights that nine eigenvalues were >1. It is therefore recommended to
extract a total of nine factors. A total of 61.93% of the variance is explained and accounted for
by the first nine constructs. The eigenvalues of the first nine factors were above 1 (Factor 1 =
10.060; Factor 2 =3.108; Factor 3 = 2.594; Factor 4 =2.224; Factor 5 = 1.875; Factor 6 = 1.649;
Factor 7 = 1.569; Factor 8 = 1.236; Factor 9 = 1.080).

31
Figure 1: Scree plot of Eigenvalues for the non-contextualised SAPI
The Scree plot, Figure 1, suggests that six factors should be extracted, as a clear change can be
observed after the sixth factor. The first six factors can explain more of the variance than all
the remaining factors. There is a difference between Table 5, where nine factors are being
recommended and Figure 1. De Koster (1998) theoretically supports the recommended six
factors and it can therefore be utilised in the study. Interestingly, given the history of the SAPI,
nine constructs were identified originally but further research suggests six factors to be the
norm (Fetvadjiev et al., 2015).

32
TABLE 6: Goodness-of-fit
Goodness-of-fit Test
Χ2 df Sig. Χ2/df
816.662 589 .000 1.387
Table 6 indicates the Chi-square (Χ2), degrees of freedom (df) and normed chi-square (Χ2/df)
to assess goodness-of-fit for the six-factor non-contextualised inventory. As indicated in the
table, the chi-square and degrees of freedom yielded values of 816.662 and 589, respectively,
and a statistical significant value of 0.000. The calculated value of the normed chi-square
indicated a total of 1.387.
TABLE 7: Factor loadings, Communalities (h2) and Cronbach Alpha Coefficients (α)
Item Factor loadings
1 2 3 4 5 6 h2
C_C_Achiev01_1 .113 -.081 -.075 -.142 .096 .290 .255
C_C_Achiev04_1 .030 -.120 -.172 -.049 .190 .466 .473
C_C_Achiev05_1 .016 -.100 -.081 -.132 .281 .357 .405
C_C_Achiev06_1 .219 -.263 -.092 .063 .194 .163 .342
C_C_Achiev08_1 -.058 -.024 -.123 -.238 .173 .531 .509
C_C_Achiev09_1 -.018 -.002 .095 -.136 .012 .557 .346
C_C_Achiev10_1 .073 -.084 .033 -.015 .271 .386 .375
C_C_Order02_1 .072 -.020 .001 .058 -.086 .750 .561
C_C_Order08_1 .084 -.154 .061 .076 -.182 .515 .317
C_C_Order09_1 .075 .067 -.083 .168 .289 .553 .510
C_INTEG_Integ05_1 -.059 -.107 .072 -.076 .148 .462 .324
EX_EX_Play04_1 .107 .057 .041 -.718 -.082 .030 .547
EX_EX_Play06_1 .293 .219 .080 -.513 -.049 .003 .431
EX_EX_Sociab02_1 .111 -.115 .005 -.430 .088 -.119 .266
EX_EX_Sociab04_1 .157 -.106 -.109 -.517 .002 .091 .441
EX_EX_Sociab06_1 -.124 -.056 -.052 -.810 -.061 .074 .625
IO_INTEL_Intel04_1 .257 .006 -.024 .074 .045 .416 .319
IO_O_Epist01_1 -.016 .100 -.029 .039 .705 .166 .563
IO_O_Epist03_1 .168 .226 .006 -.031 .584 .051 .467
IO_O_Epist07_1 -.004 -.181 .126 -.081 .791 -.096 .682
IO_O_Epist08_1 .143 -.095 -.076 .023 .535 .029 .425
N_ES_Negat02_1 -.026 .068 .628 -.076 -.009 .003 .420
N_ES_Negat03_1 .032 .118 .684 .068 .064 .136 .496
N_ES_Negat04_1 .075 -.041 .745 .040 -.052 .004 .546

33
N_ES_Negat09_1 -.161 -.135 .755 .000 .061 -.021 .596
SRNeg_INTEG_Deceit03
_1
.171 .506 .159 .167 -.038 -.136 .399
SRNeg_SH_HostEg01_1 -.136 .488 .110 -.159 .115 -.082 .335
SRNeg_SH_HostEg04_1 -.142 .371 -.035 -.023 -.033 .011 .276
SRNeg_SH_HostEg07_1 -.085 .552 .057 -.111 -.079 .017 .356
SRNeg_SH_HostEg09_1 .121 .598 .015 .037 .016 -.089 .384
SRNeg_SH_HostEg11_1 .064 .694 -.021 .123 .071 -.152 .563
SRPos_FC_Facil01_1 .508 -.162 -.120 -.151 .195 -.019 .567
SRPos_FC_Facil02_1 .685 -.194 -.078 -.058 .157 -.072 .695
SRPos_FC_Facil03_1 .517 -.217 .003 -.048 .227 .024 .561
SRPos_FC_Facil04_1 .445 .056 -.061 -.200 .015 .100 .348
SRPos_FC_Facil05_1 .658 .070 -.093 -.045 .040 .242 .655
SRPos_FC_Facil06_1 .543 -.041 -.109 -.146 .044 .201 .576
SRPos_FC_Facil09_1 .741 .033 -.071 -.067 -.035 .015 .582
SRPos_RH_IntRel09_1 .165 -.327 .109 -.153 .074 -.032 .215
SRPos_SH_WarmH10_1 .532 -.047 .135 -.031 .087 .069 .382
α .890 .728 .791 .769 .785 .838
Table 7 provides the item loadings as well as the communalities on the six factors of each item.
The ML extraction method and oblimin rotation method were used. The Pattern Matrix
revealed acceptable loadings on all of the related factors which showed values of 0.300 and
higher. Hair et al, (1995) states that loadings with a value of < 0.300 are acceptable. All items
loaded except for C_C_Achiev01_1 and C_C_Achiev06_1, and two items loaded onto the
wrong factor namely the Intellect-Openness item IO_INTEL_Intel04_1 that loaded to
Conscientiousness, and Social Relational Positive item SRPos_RH_IntRel09_1 that loaded to
Social Relational Negative. These items were omitted for reliability analysis. The factors were
labelled, and the Cronbach Alpha Coefficient was calculated for each; Factor 1 (Social
Relational Positive = .890), Factor 2 (Social Relational Negative = .728), Factor 3 (Neuroticism
= .791), Factor 4 (Extraversion = .769), Factor 5 (Intellect – Openness = .785) and Factor 6
(Conscientiousness = .838).

34
Results of the contextualised inventory
Descriptive statistics
TABLE 8: Descriptive statistics for the contextualised SAPI
Mean SD Skewness Kurtosis
C_C_Achiev01_1 3.9035 .76840 -1.735 5.098
C_C_Achiev04_1 4.1667 .85428 -1.293 2.255
C_C_Achiev05_1 4.1382 .76203 -1.618 5.151
C_C_Achiev06_1 4.1789 .65172 -1.578 7.203
C_C_Achiev08_1 3.9624 .94071 -1.255 2.029
C_C_Achiev09_1 4.4286 .73119 -1.814 5.662
C_C_Achiev10_1 4.2707 .77974 -1.489 3.824
C_C_Order02_1 4.1679 .68703 -1.518 5.982
C_C_Order08_1 4.1017 .65586 -1.457 6.366
C_C_Order09_1 4.2713 .69361 -1.550 5.880
C_INTEG_Integ05_1 4.2672 .68340 -1.709 6.952
EX_EX_Play04_1 3.6767 .81230 -.718 .941
EX_EX_Play06_1 2.7099 .94939 .240 -.103
EX_EX_Sociab02_1 3.3664 .96300 -.078 -.375
EX_EX_Sociab04_1 3.9268 .74030 -1.006 2.821
EX_EX_Sociab06_1 3.7068 .92754 -.537 .016
IO_INTEL_Intel04_1 4.1404 .68399 -2.123 9.038
IO_O_Epist01_1 4.3411 .75374 -1.973 6.800
IO_O_Epist03_1 4.2456 .64622 -1.947 8.966
IO_O_Epist07_1 4.4394 .69911 -1.941 7.084
IO_O_Epist08_1 4.3053 .71661 -1.668 5.782
N_ES_Negat02_1 2.4574 .97707 .394 -.270
N_ES_Negat03_1 2.4318 1.13614 .502 -.488
N_ES_Negat04_1 2.9624 1.00307 .076 -.709
N_ES_Negat09_1 2.2727 1.00823 .552 -.191
SRNeg_INTEG_Deceit03_1 1.3534 .55317 1.286 .711
SRNeg_SH_HostEg01_1 1.5748 .75398 1.785 4.331
SRNeg_SH_HostEg04_1 2.0526 .74714 .449 .178
SRNeg_SH_HostEg07_1 1.4153 .58162 1.756 4.460
SRNeg_SH_HostEg09_1 1.3664 .69855 2.589 8.236
SRNeg_SH_HostEg11_1 1.4167 .60355 1.377 1.911
SRPos_FC_Facil01_1 4.1102 .68786 -1.437 5.509
SRPos_FC_Facil02_1 3.8644 .65035 -.979 3.171
SRPos_FC_Facil03_1 4.1271 .64604 -1.034 3.942
SRPos_FC_Facil04_1 3.6850 .72510 -.735 1.907
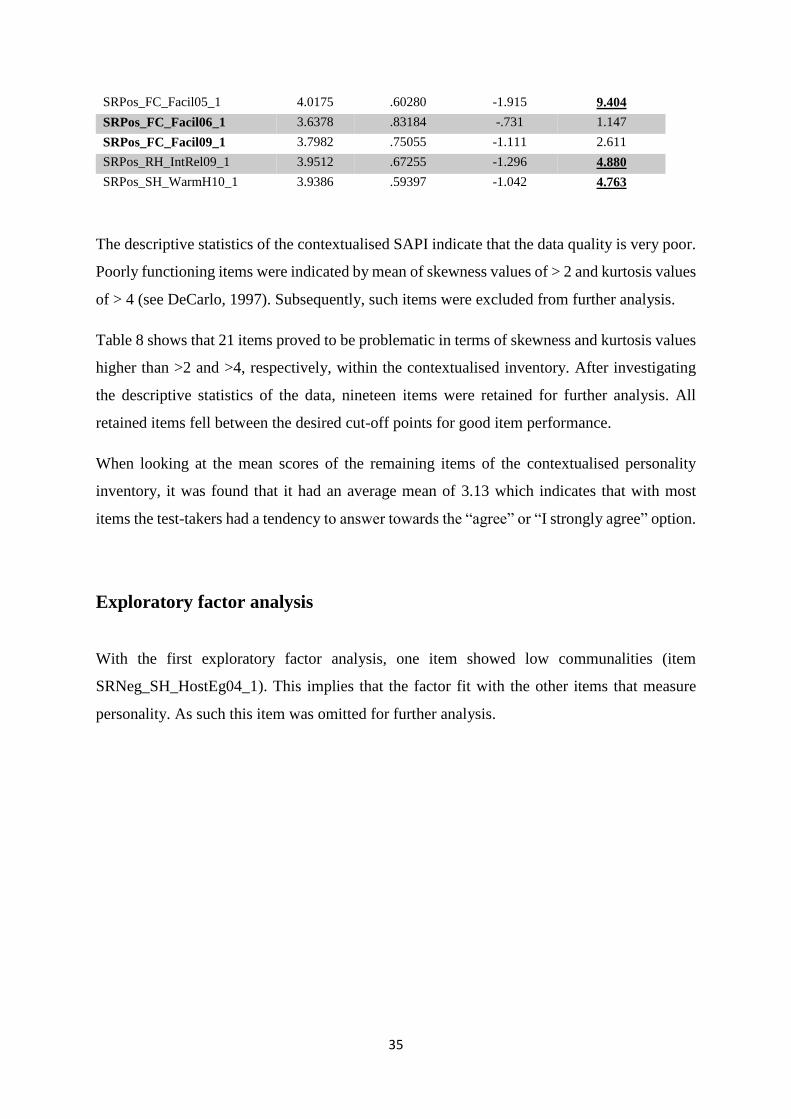
35
SRPos_FC_Facil05_1 4.0175 .60280 -1.915 9.404
SRPos_FC_Facil06_1 3.6378 .83184 -.731 1.147
SRPos_FC_Facil09_1 3.7982 .75055 -1.111 2.611
SRPos_RH_IntRel09_1 3.9512 .67255 -1.296 4.880
SRPos_SH_WarmH10_1 3.9386 .59397 -1.042 4.763
The descriptive statistics of the contextualised SAPI indicate that the data quality is very poor.
Poorly functioning items were indicated by mean of skewness values of > 2 and kurtosis values
of > 4 (see DeCarlo, 1997). Subsequently, such items were excluded from further analysis.
Table 8 shows that 21 items proved to be problematic in terms of skewness and kurtosis values
higher than >2 and >4, respectively, within the contextualised inventory. After investigating
the descriptive statistics of the data, nineteen items were retained for further analysis. All
retained items fell between the desired cut-off points for good item performance.
When looking at the mean scores of the remaining items of the contextualised personality
inventory, it was found that it had an average mean of 3.13 which indicates that with most
items the test-takers had a tendency to answer towards the “agree” or “I strongly agree” option.
Exploratory factor analysis
With the first exploratory factor analysis, one item showed low communalities (item
SRNeg_SH_HostEg04_1). This implies that the factor fit with the other items that measure
personality. As such this item was omitted for further analysis.

36
TABLE 9: Eigenvalues of sample correlation matrix
Factor Initial Eigenvalues
Total % of Variance Cumulative %
1 5.134 28.521 28.521
2 2.472 13.733 42.254
3 1.707 9.481 51.735
4 1.272 7.068 58.803
5 1.012 5.622 64.424
6 .885 4.917 69.341
7 .844 4.687 74.029
8 .696 3.865 77.894
9 .610 3.390 81.284
10 .601 3.338 84.622
11 .531 2.953 87.574
12 .459 2.550 90.124
13 .421 2.341 92.465
14 .372 2.066 94.531
15 .293 1.627 96.159
16 .271 1.508 97.666
17 .240 1.331 98.997
18 .181 1.003 100.000
Table 9 shows the eigenvalues, percentage of variance and the cumulative percentage of
variance explained for the contextualised inventory. From the results presented in Table 9, it is
clear that a total eight eigenvalues were >1. It is recommended that these factors be extracted
and a total of 67.66% of the variance is explained and accounted for. The eight-factor structure
explained a total of 67.66% of the variance. The eigenvalues of the first eight factors were
above 1 (Factor 1 = 14.392; Factor 2 =3.213; Factor 3 = 2.483; Factor 4 =1.960; Factor 5 =
1.705; Factor 6 = 1.183; Factor 7 = 1.094; Factor 8 = 1.036).

37
Figure 2: Scree plot of Eigenvalues for the non-contextualised SAPI
The scree plot reflects a total of six factors to be extracted, as a clear dent can be viewed and
observed after the sixth factor. The first six factors can explain more of the variance than all
the remaining factors. As with the non-contextualised inventory, there is a difference between
Table 9 that represents eight factors and Figure 2, but is consistent between both the
contextualised and non-contextualised inventories, which are the ideal situation (De Koster,
1998).
TABLE 10: Goodness-of-fit
Chi-square df Sig.
77.284 60 .066
Table 10 indicates the Chi-square (Χ2), Degrees of freedom (df) and Normed chi-square (Χ2/df)
to assess goodness-of-fit for the six-factor contextualised inventory. As indicated in the table,
the Chi-square and Degrees of freedom yielded values of 77.284 and 60 respectively and a

38
statistical significant value of 0.066. The calculated value of the Normed chi-square indicated
a total of 1.314.
TABLE 11: Factor loadings, Communalities (h2) and Cronbach’s alpha (α)
Factor
1 2 3 4 5 6 h2
C_C_Achiev04_1 -.002 .307 -.049 -.081 -.466 .432 .722
C_C_Achiev08_1 -.034 -.021 .019 .004 .045 .834 .696
EX_EX_Play04_1 .052 .106 .669 .019 -.054 .094 .561
EX_EX_Play06_1 .112 .056 .655 -.167 .218 -.057 .502
EX_EX_Sociab02_1 -.088 -.045 .480 .058 .121 .149 .311
EX_EX_Sociab04_1 -.172 .318 .341 .044 -.274 .089 .534
EX_EX_Sociab06_1 -.119 -.013 .788 .060 -.422 -.061 .791
N_ES_Negat02_1 .073 .068 .056 .447 .264 -.026 .329
N_ES_Negat03_1 .034 -.063 -.078 .700 -.143 -.073 .525
N_ES_Negat04_1 -.093 .128 .018 .529 .026 .026 .299
N_ES_Negat09_1 .174 -.168 -.028 .831 -.042 .061 .792
SRNeg_INTEG_Deceit03
_1
.410 -.019 .136 .156 .105 -.093 .295
SRNeg_SH_HostEg11_1 .903 .025 -.092 -.037 -.138 .042 .999
SRPos_FC_Facil02_1 -.042 .902 -.107 .000 .099 -.096 .901
SRPos_FC_Facil03_1 .010 .778 -.025 .005 -.100 -.058 .583
SRPos_FC_Facil04_1 .030 .567 .095 .046 .141 .168 .479
SRPos_FC_Facil06_1 .005 .470 .174 -.061 -.090 .221 .500
SRPos_FC_Facil09_1 -.007 .490 .159 .020 -.085 .163 .459
α .838 .761 0.725
Table 11, which provides the item loadings on the six factors and the communalities of each
item, highlights that there is no clear pattern of the sub-factors and loadings on <300. It seems

39
that Factors 5 and 6 contain one or two items (both from Conscientiousness; C_C_Achiev04_1
and C_C_Achiev08_1). Factor 1 also contained only two items from Social Relational
Negative (SRNeg_INTEG_Deceit03_1 and SRNeg_SH_HostEg11_1). Therefore, these
factors and items were disregarded for reliability analysis. Only three factors were retained,
which were subsequently labelled. This was followed by the calculation of the Cronbach’s
alpha coefficients; Factor 2 – Social Relational Positive (.838), Factor 3 – Extraversion (.761)
and Factor 4 – Neuroticism (.725). All alphas fall above the guideline of 0.70.
DISCUSSION
The purpose of the discussion is to present interpretations and findings of the results based on
the research objectives. The general objective of this study was to determine the effect of FOR
on the construct validity of the SAPI. The results and discussion from this research will assist
the SAPI with future research relating to contextualisation. In addition, it could help other
personality researchers to determine whether an inventory should be contextualised and to
which extent the inventory should be contextualised. As previously mentioned, the literature
review already addressed the first study objective. This section will address and discuss the
empirically specific objectives. The discussion will simultaneously focus on both the non-
contextualised and contextualised results.
After analysing the descriptive statistics of both the contextualised and non-contextualised
inventory, it is clear that the non-contextualised inventory has considerably less discrepancies
and variances than the contextualised inventory. The non-contextualised inventory has one
item with a kurtosis of 4.135, where the contextualised inventory had a total of 20 items with
a kurtosis <4.
With kurtosis, it means that participants mostly answered items in the same way (West, Finch
& Curren, 1995) and within a contextualised context, participants are more inclined to agree or
disagree with items which may indicate a social desirable element in the context of study. The
20 items that showed kurtosis cannot be used for this context as the study was conducted in the
participants workplace and alternative items will need to be developed to measure these
concepts. It seems that nine items from Conscientiousness, all five items from Intellect-
Openness, three items from Social Relational Negative, and four items from Social Relational
Positive showed kurtosis. Concerning Conscientiousness, employees will most likely believe

40
they possess traits of Conscientiousness since most participants agree to strongly agree to these
items (referring to mean scores). Therefore, it was not surprising to see so many items of
Conscientiousness to show high kurtosis. Additionally, none of the Intellect-Openness items
were retained based on their high kurtosis scores. It means social desirability may have played
a role since most participants agreed with the items, rather than disagreeing with it. In the work
place, intelligence and open-mindedness are desirable traits for employers, therefore,
participants may agree more with these traits rather based it on their actual score. Half of the
Social Relational Negative’s items showed high skewness, and it seems most participants
disagreed with the items. Showing negative behaviour and emotions in the workplace are not
desirable, since professional conduct should be upheld. Therefore, participants would rather
disagree with the items than to indicate they possess these negative traits.
Looking at the skewness of the data, the non-contextualised inventory had no skewness
however, the contextualised inventory delivered one item with a skewness of 2.589. This Social
Relational Negative item measured levels of hostility. With skewness we measure how random
or inconsistent an item was answered by participants (West et al. 1995). With this particular
item, it seems that a portion of the participants either agreed or disagreed with the item, so it
means that too many variant responses were generated.
The mean scores for the contextualised inventory ranged between 1 and 4 with an average of
M = 3.478. The non-contextualised inventory were also close to the centre of the seven-point
Likert scale, with an average of M = 3.631. Where means are located at the extreme ends of
the scales, it is possible that line items are worded incorrectly (De Villes, 2003), which
happened to be the case with the contextualised version’s Conscientiousness items. Personality
can be stable across context and according to Steyer et al. (1999), if there is too much context,
it becomes cumbersome and people start responding randomly to line items. In this study 21
items were disregarded from the contextualised version pertaining to the results of the
descriptive statistics, therefore only 19 items were retained for further analysis.
The PCA extraction was executed. The suitability for both the 40-item contextualised as well
as the retained 19-item non-contextualised were established. With the non-contextualised
inventory, the PCA indicated a six-factor extraction. After the six factors were identified, the
ML extraction method was used to compare the model-fit. Oblimin rotation methods were used
for further interpretation, as correlations were found between factors. The contextualised
version showed one item (from Social Relational Negative) with a low communality value with

41
the first PCA. It meant that this item did not fit with the overall instrument and share little to
none correspondence with the other items. This item was omitted and a second PCA was
conducted with the retained 18 items that showed six factors can be extracted when viewing
the scree plot, while five factors were found to have eigenvalues higher than 1. Since the SAPI
measures six factors, six factors were analysed by using the Maximum Likelihood (ML)
extraction method with an Oblimin rotation (Fetvadjiev et al. 2015).
The goodness-of-fit analysis (for both versions) found that the normed chi-square yielded a
value of 1.387 for the non-contextualised inventory and 1.314 for the contextualised inventory.
To establish an acceptable model-fit, the Chi-square goodness-of-fit should be <0.400 and
preferably between 0.200 and 0.300 (Raykov & Marcoulides, 2000). The contextualised
version’s model was significant, with a p-value of 0.000. This implies that inferences based on
this model may be questioned. The contextualised version showed that the Chi-square is non-
significant which made it more valid to make further inferences. However, since it was still an
exploratory analysis of both versions, inferences were made further pertaining to the factor
loadings and reliability values.
Most items for the non-contextualised version showed acceptable factor loadings onto the
correct factor. Only four items showed no loadings (less than .30) or wrong loadings (load onto
another factor) and were omitted when continuing with the reliability analysis. As can be seen,
the reliability analysis yielded acceptable values. With the non-contextualised version, it was
found that all six factors of the SAPI can be measured. When reviewing the contextualised
version, it did not yield as acceptable results concerning factor loadings. No items of the
Intellect-Openness items were retained, while only two items of Conscientiousness and Social
Relational Negative respectively were retained after the descriptive statistics analysis and
communalities inspection. These four items loaded onto three factors (the two
Conscientiousness items loaded onto the Conscientiousness factor, the Social Relational
Negative items loaded onto the Social Relational Negative factor and one of the
Conscientiousness items loaded onto its own factor). None of these three factors were viable
for further analysis since reliability analysis cannot be conducted with two or less items per
factor. These items and factors were disregarded. The factor and reliability analysis found that
only three factors of the SAPI can be measured for the contextualised version, namely
Extraversion, Neuroticism and Social Relational Positive. An inference can be made that the
omitted factors, namely Conscientiousness, Intellect-Openness and Social Relational Negative
cannot be valid and reliable measures for the work context.

42
Practical implications
The application of the study will be of value to researchers in the field of personality
psychology, as well as organisations that use inventories for selection and developmental
purposes.
Although this study mainly focused on the how contextualisation affects construct validity,
future organisational use may include certain personality factors (in this case Extraversion,
Neuroticism and Social Relational Positive) in contextualised inventories to align an
individual’s values to that of the organisation. This study may also help industrial and
occupational practitioners to look into the personality factors (in this case Conscientiousness,
Intellect-Openness and Social Relational Negative) that may be questioned when included in
contextualised inventories. One cannot ignore the fact that certain dispositions inherent to an
individual affect behaviour in different situations, as described and explained in cognitive
affective theory. A non-contextualised inventory is interpreted to a contextualised environment
(i.e. in the workplace). This may affect the predictive validity and reliability of results if they
are not interpreted in an open context.
Personality researchers can use this study to further explore the impact of contextualised versus
non-contextualised inventories. Although the researcher has a strong affiliation with the
cognitive affective theorists, this research indicated that contextualising a personality inventory
does not render the desired results on the inventory’s construct validity. Contextualising all line
items negatively affected the construct validity in the SAPI. One reason might be that the tag
‘in the workplace’ was merely added to the line item construction. There may be an opportunity
to reword the line items more carefully to not affect the construct validity and start researching
how contextualisation affects predictive validity and reliability in the workplace.
With personality inventories, the aim is for the participants not to lead and there should not be
a condition to the line items, while the contextualised inventory does both leading as well as
adding conditions to the inventory. As there is limited research on the effect of FOR on the
inventory’s construct validity, this study can aid researchers to re-consider using
contextualisation to certain line items – and possibly not including contextualisation in all line
items – to ascertain whether an individual’s personal values align with an organisation’s culture
and values.

43
Limitations
The researcher acknowledges several limitations to the overall study.
Overall the study design should have had a more detailed approach. With the sample size being
so small, the researcher was unable to use statistical methods such as CFA / SEM and therefore
only EFA was used. The sampling technique may have posed a limitation in that the use of
non-probability sampling techniques should be kept in mind when it comes to the
generalisability of results across the population. The study can only apply to the context in
which the sample was used and other contexts within the South African population may not be
suitable for generalising findings. A stratified sample may have been a better decision as the
sample would have been more controlled than that of a convenience sample.
Another factor concerning the research design was the application of the cross-sectional design.
Welman et al. (2012) confirm the challenges of cross-sectional designs in terms of threats to
internal validity, based on sufficient representation of groups and variables responsible for
differences between participants (apart from age) that may have a relationship with the racial
prejudice variable. This implies that the study did not take the causal variable in consideration
when it came to the test-retest reliability factor of results, as participants’ responses may change
in future depending on their cultural context, work environments or cultural interactions or
experiences. It would have been advantageous to have done a longitudinal design on order to
detect variants in responses in time. Online delivered links tend to affect the response rate and
the researcher should have rather conducted a pen and pencil assessment in order to get more
responses.
The data analyses approach should also be considered, since it did not cover a detailed item
analysis between the different groups and only tested item discrimination (skewness and
kurtosis) in the general sample. The skewness and kurtosis analysis yielded variant results for
both versions, but a differential item functioning (DIF) and comparison between demographic
groups might provide different results or detect item bias, which in return may have an effect
on the reliability of scores. Meyer (2014) confirms that item discrimination has an effect on
item variance, since the idea of acceptable item discrimination values maximises item variance,
which in return contributes to increase score reliability.

44
Recommendations
In order to improve findings and inference the researcher acknowledges that certain
recommendations are needed for possible future expansion on this research:
As mentioned the research design should include a longitudinal design and making use of a
stratified sample in order to increase the diversity of the participants. It is recommended that a
pen and paper approach should be followed in conjunction with an online delivered link. It is
the recommendation from the researcher that future research should not be limited to a specific
industry as this will increase diversity amongst age, gender and other social considerations.
By adding context to the line items, the personality inventory is at risk that the construct could
be changed. The implication is that the instrument would not measure across cultures as it was
intended to. Although this study merely investigated the effect that FOR have on the construct
validity of the SAPI, researchers will have to test the influence of FOR on the construct validity
on all 11 official languages that the SAPI has been developed for. It is recommended for the
study to be replicated using participants performing the same job function and possibly increase
the participants across different organisations within the same sector. It is further recommended
that a stratified sampling technique is used in order to ensure equal representation amongst
both cultural as well linguistic groups within South Africa. It may even be helpful to narrow
the research by merely conducting research on a specific construct such as Extraversion at a
point in time in order to determine whether all line items need contextualisation, if any.
In order to further increase the value to the study, it would be the recommendation of the
researcher to measure within-person consistency. In other words, have a participant complete
the contextualised assessment and some weeks later have the same participant complete the
non-contextualised inventory which will not only assist with the with-in person consistency
but also the measurement of reliability to increase the indicator of the scale’s reliability as it
would be the recommendation of the researcher to look at the test-retest reliability.
It is important that more detailed reliability studies are being conducted. The Goodness-of-Fit
should not be statistical significant which means that there is still factors in the SAPI that does
not fit. It is recommended that the line items get analised and adjusted in order to add more
value to the study. Furthermore, the recommendation is for future research to test

45
contextualisation on fakeability of personality inventories as well as social desirability needs
to be assessed in the context of measurement. If the context is the workplace, certain behaviours
and emotions are more acceptable than for instance in an informal setting (with family and
friends). Therefore, the context should be considered before attempting to measure certain
constructs, and careful inspection of items should be done
Conclusion
It seems that contextualising a questionnaire is not a valid and reliable measurement for all
personality factors. The results showed that only a portion of the personality factors in SAPI
can be measured in the workplace, therefore items need to be revised or omitted when
contextualising an instrument. With personality measurement, it seems keeping it open-ended
(non-contextualised) yield better results for the SAPI, therefore participants are more inclined
to answer items honestly and consistently (as opposed to the contextualised version where
items were answered inconsistently and with more social desirable intent). Although it seems
SAPI is a valid and reliable instrument, it does show some gaps in the wording of items, and
the concepts that are measured across contexts.

46
REFERENCES
Alker, H. (1972). Is personality situationally specific or intrapsychically consistent? Journal of
Personality. doi:10.1111/j.1467-6494.1972.tb00644.x
Almehrizi, R. (2013). Coefficient Alpha and Reliability of Scale Scores. Applied Psychological
Measurement. doi:10.1177/0146621613484983
Asendorpf, J. B., Borkenau, P., Ostendorf, F., & Van Aken, M. A. (2001). Carving personality
description: Confirmation of three replicable personality prototypes for both children and
adults. European Journal of Personality. doi:10.1002/per.408
Barrick, M., & Mount, M. (1991). The Big Five personality dimensions and Job Performance:
A Meta -Analysis. Personnel Psychology. doi:10.1111/j.1744-6570.1991.tb00688.x
Barrick, M. R., Mount, M. K., & Judge T. A, (2001) Personality and Performance at the
Beginning of the New Millennium: What Do We Know and Where Do We Go Next?
International Journal of Selection and Assessment. doi:10.1111/1468-2389.00160
Bedell, B., Van Eeden, R., & Van Staden, F. (1999). Culture as moderator variable in
psychological test performance: Issues and trends in South Africa. SA Journal of Industrial
Psychology. doi:10.4102/sajip.v25i3.681
Bing, M. N., Whanger, J. C., Davidson, K. H., & VanHook, J. B. (2004). Incremental validity
of the frame of reference effect in personality scale scores: A replication and extension.
Journal of Applied Psychology. doi:10.1037/0021-9010.89.1.150
Bornman, E. (2010). Emerging Patterns of Social Identification in Post-apartheid South
Africa. Journal of Social Issues. doi:10.1111/j.1540-4560.2010.01643.x
Bornman, E., & Mynhardt, J. (1993). Ethnic attitudes and factors associated with social
comparison and relative deprivation. South African Journal
Sociology. doi:10.1080/02580144.1993.10429879
Cheung F. M., Wan, S. L. Y., Fan, W., Leong, F., & Mok, P .C. H. (2013). Collective
contributions to career efficacy in adolescents: A cross-cultural study. Journal of Vocational
Behavior. doi:10.1016/j.jvb.2013.05.004
Cook, C., Heath, F., & Thompson, R. (2000). A Meta-Analysis of Response Rates in Web- or
Internet-Based Surveys. Educational and Psychological
Measurement. doi:10.1177/00131640031970934
47
Costa, P., Terracciano, A., & McCrae, R. (2001). Gender differences in Personality traits across
cultures: Robust and Surprising findings. Journal of Personality and Social Psychology.
doi:10.1037//0022-3514.81.2.322
Creswell, J., Hanson, W., Clark Plano, V., & Morales, A. (2007). Qualitative Research
Designs. The Counselling Psychologist. doi:10.1177/0011000006287390
Cronbach, L., & Meehl, P. (1955). Construct validity in psychological tests. Psychological
Bulletin. doi:10.1037/h0040957
De Raad, B., Sullot, E., & Barends, P. (2008). Which of the big five factors are in need
situational specification. European Journal of Personality. doi:10.1002/per.688
Doll, R. (1971). Item susceptibility to attempted faking as related to item characteristic and
adopted fake set. The Journal of Psychology. doi:10.1080/00223980.1971.9916848
Employment Equity Act No. 55 of 1998. Retrieved from
http://bee.b1sa.co.za/docs/The%20Employment%20Equity%20Act%201998.pdf
Engelhart, M. (1976). Book reviews: Anne Anastasi - Psychological Testing. (4th ed., pp. XII).
New York, NY: Macmillan. Educational and Psychological Measurement.
doi:10.1177/001316447603600334
Fetvadjiev, V. H., Meiring D., van de Vijver, F. J., Nel, J. A., & Hill, C. (2015). The South
African Personality Inventory (SAPI): A culture-informed instrument for the country's main
ethnocultural groups. Psychological assessment. doi:10.1037/pas0000078
Foxcroft, C. D. (1997). Psychological testing in South Africa: Perspectives regarding ethical
and fair practices. European Journal of Psychological Assessment. doi:10.1027/1015-
5759.13.3.229
Foxcroft C. (2004). Planning a psychological test in the multicultural South African context.
SA Journal of Industrial Psychology. doi:10.4102/sajip.v30i4.171
Foxcroft, D., & Roodt, G. (2010). Introduction to psychological assessment in the South
African context. Cape Town, South Africa: Oxford University Press Southern Africa.
Heller, D., Watson, D., Komar, J., Min, J. A., & Perunovic W. Q. (2007). Contextualized
personality: traditional and new assessment procedures. Journal of personality.
doi:10.1111/j.1467-6494.2007.00474.x
Hill, C., Adams, B. G., De Bruin, G. P., Nel, J. A., Van de Vijver, F. J. R., & Meiring, D.,
(2013). Developing and testing items for the South African Personality Inventory (SAPI).
SA Journal of Industrial Psychology. doi:10.4102/sajip.v39i1.1122

48
Hogan, J., & Holland, B., (2003). Using theory to evaluate personality and job-performance
relations: a socioanalytic perspective. The Journal of Applied Psychology.
doi:10.1037.0021-9010.88.1.100
Holtrop, D., Born, M., De Vries, R., & De Vries, A. (2014). Predicting performance with
contextualized inventories: Two field studies yielding different results. Personality and
Individual Differences. doi:10.1016/j.paid.2013.07.107
Holtz, B. C., Ployhart, R. E., & Dominguez, A. (2005). Testing the rules of justice: the effects
of frame-of-reference and pre-test validity information on personality test responses and test
perceptions. International Journal of Selection and Assessment. doi:10.1111/j.0965-
075x.2005.00301
Hopwood, C. J., & Donnellan, B. M. (2010). How should the internal structure of personality
inventories be evaluted? Personality and Social Psychology Review.
doi:10.1177/1088868310361240
Hunthausen, J. M., Truxillo, D. M., Bauer, T. N., & Hammer, L. B. (2003). A field study of
Frame of Reference effects on personality test validity. Journal of Applied Psychology.
doi10.1037/0021-9010.88.3.545
Hurtz, G., & Donovan, J. (2000). Personality and job performance: The Big Five
revisited. Journal of Applied Psychology. doi:10.1037//0021-9010.85.6.869
Huysamen, G. (2002). The Relevance of the New APA Standards for Educational and
Psychological Testing for Employment Testing in South Africa. South African Journal Of
Psychology. doi:10.1177/008124630203200203
Kruger, C., & Swanepoel, I. (2011). Revisiting validity in cross-cultural psychometric test
development: a systems-informed shift towards qualitative research designs. South African
Journal of Psychiatry. doi:10.4102/sajpsychiatry.v17i.1.250
Kunda, Z., & Sanitioso, R. (1989). Motivated changes in the self-concept. Journal of
Experimental Social Psychology. doi:10.1016/0022-1031(89)90023-1
Leitch, C., Hill, F., & Harrison, R. (2010). The philosophy and practice of interpretivist
research in entrepreneurship. Organizational Research Methods.
doi:10.1177/1094428109339839
Lievens, F., De Corte, W., & Schollaert, E. (2008). A closer look at the frame-of-reference
effect in personality scale scores and validity. Journal of Applied
Psychology. doi:10.1037/0021-9010.93.2.268

49
Mahembe, B., & Engelbrecht, A. (2014). A preliminary study to assess the construct validity
of a cultural intelligence measure on a South African sample. SA Journal Of Human
Resource Management. doi:10.4102/sajhrm.v12i1.558
Maree, K. (2012). First steps in research. Pretoria, South Africa: Van Schaick Publishers.
McAdams D. P. (1992). The five-factor model in personality: a critical appraisal. Journal of
Personality. doi:10.1111/j.1467-6494.1992.tb00976.x
McFarland, L. A., Ryan, A. M., & Ellis, A. (2002). Item placement on a personality measure:
Effects on faking behaviour and test measurement properties. Journal of Personality
Assessment. doi:10.1207/s15327752jpa7802_09
Meiring, D, Van de Vijver, F. J. R., Rothmann, S., & Barrick, M. (2006) Construct, item and
method bias of cognitive and personality tests in SA. SA Journal of Industrial Psychology.
doi:10.4102/sajip.v31i1.182
Mills, J., Bonner, A., & Francis, K. (2006). Adopting a constructivist approach to grounded
theory: Implications for research design. International Journal of Nursing
Practice. Doi:10.1111/j.1440-172x.2006.00543.x
Mischel, W. (2009). From personality and assessment (1968) to personality science
(2009). Journal of Research in Personality. doi:10.1016/j.jrp.2008.12.037
Mischel, W., & Shoda, Y. (1995). A cognitive-affective system theory of personality:
Reconceptualizing situations, dispositions, dynamics, and invariance in personality
structure. Psychological Review, doi:10.1037//0033-295x.102.2.246
Mount, M., Barrick, M., & Stewart, G. (1998). Five-Factor Model of personality and
Performance in Jobs Involving Interpersonal Interactions. Human
Performance. doi:10.1080/08959285.1998.9668029
Murtha, T., Kanfer, R., & Ackerman, P. (1996). Toward an interactionist taxonomy of
personality and situations: An integrative situational--dispositional representation of
personality traits. Journal of Personality and Social Psychology. doi:10.1037//0022-
3514.71.1.193
Nel, J. A., Valchev, V. H., Rothmann, S., Vijver, F. J. R., Meiring, D., & Bruin, G. P. (2012).
Exploring the personality structure in the 11 Languages of South Africa. Journal of
Personality. doi:10.1111/j.1467-6494.2011.00751.x
Oakland, T. (2004). Use of Educational and Psychological Tests Internationally. Applied
Psychology. doi:10.1111/j.1464-0597.2004.00166.x

50
Orb, A., Eisenhauer, L., & Wynaden, D. (2000). Ethics in Qualitative Research. Journal of
Nursing Scholarship, 33(1), 93-96.
Pace, V., & Brannick, M. (2010). How similar are personality scales of the “same” construct?
A meta-analytic investigation. Personality and Individual
Differences. doi:10.1016/j.paid.2010.06.014
Pallant, J. (2013). SPSS survival manual. London, UK: McGraw-Hill.
Pervin, L. (1994). Further reflections on Current Trait Theory. Psychological
Inquiry. Doi:10.1207/s15327965pli0502_19
Reddock, C. M., Biderman, M. D., & Nguyen, N. T. (2011). The relationship of reliability and
validity of personality tests to frame of reference instructions and within person
inconsistency. International Journal of Selection and Assessment. doi:10.1111/j.1468-
2389.2011.00540.x
Roberts, B., & Donahue, E. (1994). One personality, multiple selves: Integrating personality
and social roles. Journal of Personality. doi:10.1111/j.1467-6494.1994.tb00291.x
Salgado, J., & Moscoso, S. (2003). Internet-based personality testing: Equivalence of measures
and assesses' perceptions and reactions. International Journal of Selection and
Assessment. doi:10.1111/1468-2389.00243
Salgado, J., Moscoso, S., & Lado, M. (2003). Evidence of cross-cultural invariance of the big
five personality dimensions in work settings. European Journal of
Personality. doi:10.1002/per.482
Seibert, S., & Kraimer, M. (2001). The Five-Factor Model of personality and career
success. Journal of Vocational Behavior. doi:10.1006/jvbe.2000.1757
Statistics South Africa. (2014). Mid-year population estimates. Retrieved from
http://beta2.statssa.gov.za/publications/P0302/P03022014.pdf
Stevenson, A. (2010). Oxford dictionary of English. Oxford, UK: Oxford Univ. Press.
Steyer, R. Schmidt, M. and Eid, M. (1999). Latent State – trait theory and research in
personality and individual differences. European Journal of Personality.
doi:10.1002/(sici)1099-0984(199909/10)13:5::aid-per361>3.3.co;2-1
Swanepoel, I., & Kruger, C. (2011). Revisiting validity in cross-cultural psychometric-test
development: A systems-informed shift towards qualitative research designs. South African
Journal of Psychiatry. Doi: 10.4102/sajpsychiatry.v17i1.250
Valchev, V. H., van de Fijver, F. J., Nel, J. A., Rothmann, S., Meiring, D., & de Bruin, G. P.
(2011). Implicit personality conceptions of the Nguni Cultural - Linguistic groups of South
Africa. Cross-Cultural Research. doi:10.1177/1069397111402462

51
Van de Vijver, F., & Leung, K. (2000). Methodological issues in psychological research on
culture. Journal of Cross-Cultural Psychology. doi:10.1177/0022022100031001004
Van de Vijver, F., & Van Hemert, D. (2008). Cross-cultural personality assessment. In G.
Boyle, G. Matthews, & D. Saklofske (Eds), The SAGE handbook of personality theory and
assessment (pp. 54-71). Los Angeles, CA: SAGE.
Van de Vijver, F. J. R., & Rothmann, S. (2004). Assessment in multicultural groups: The South
African case. South African Journal of Industrial Psychology. doi:10.4102/sajip.v30i4.169
Wagerman, S., & Funder, D. (2007). Acquaintance reports of personality and academic
achievement: A case for conscientiousness. Journal of Research in
Personality. doi:10.1016/j.jrp.2006.03.001
Wagerman, S. A., & Funder, D. C. (2009). Personality psychology of situations. In P. J. Corr,
& G. Matthews (Eds.), Cambridge handbook of Ppersonality (pp. 27-42). Cambridge, UK:
Cambridge University Press
Wayuni, S. (2012). Technique of questioning carried out by novice teachers. English Teaching
Journal. doi:10.26877/eternal.v1i1.165
Worthington, R. L., & Whittaker, T. A. (2006). Scale development research: A content analysis
and recommendations for best practice. The Counselling Psychologist.
doi:10.1177/0011000006288127
Wright, J., & Mischel, W. (1987). A conditional approach to dispositional constructs: The local
predictability of social behavior. Journal of Personality and Social Psychology, doi:
10.1037//0022-3514.53.6.1159
Related Documents