Walden University ScholarWorks Walden Dissertations and Doctoral Studies Walden Dissertations and Doctoral Studies Collection 1-1-2009 e effect of faculty performance measurement systems on student retention Timothy Woods Walden University Follow this and additional works at: hps://scholarworks.waldenu.edu/dissertations Part of the Educational Psychology Commons , Elementary and Middle and Secondary Education Administration Commons , Instructional Media Design Commons , and the Secondary Education and Teaching Commons is Dissertation is brought to you for free and open access by the Walden Dissertations and Doctoral Studies Collection at ScholarWorks. It has been accepted for inclusion in Walden Dissertations and Doctoral Studies by an authorized administrator of ScholarWorks. For more information, please contact [email protected].

Welcome message from author
This document is posted to help you gain knowledge. Please leave a comment to let me know what you think about it! Share it to your friends and learn new things together.
Transcript
Walden UniversityScholarWorks
Walden Dissertations and Doctoral Studies Walden Dissertations and Doctoral StudiesCollection
1-1-2009
The effect of faculty performance measurementsystems on student retentionTimothy WoodsWalden University
Follow this and additional works at: https://scholarworks.waldenu.edu/dissertations
Part of the Educational Psychology Commons, Elementary and Middle and SecondaryEducation Administration Commons, Instructional Media Design Commons, and the SecondaryEducation and Teaching Commons
This Dissertation is brought to you for free and open access by the Walden Dissertations and Doctoral Studies Collection at ScholarWorks. It has beenaccepted for inclusion in Walden Dissertations and Doctoral Studies by an authorized administrator of ScholarWorks. For more information, pleasecontact [email protected].

Walden University
COLLEGE OF MANAGEMENT AND TECHNOLOGY
This is to certify that the doctoral dissertation by
Timothy Woods
has been found to be complete and satisfactory in all respects, and that any and all revisions required by the review committee have been made.
Review Committee Dr. Raghu Korrapati, Committee Chairperson, Management Faculty
Dr. Marilyn Simon, Committee Member Management Faculty Dr. Anthony Lolas, Committee Member Management Faculty
Dr. John Nirenberg, School Representative Management Faculty
Chief Academic Officer
Denise DeZolt, Ph.D.
Walden University 2009

ABSTRACT
The Effect of Faculty Performance Measurement Systems on Student Retention
By
Timothy Woods
M.A., International Relations, California State University, Fresno B.A., Political Science, University of California, Riverside
Dissertation Submitted in Partial Fulfillment of the Requirements for the Degree of
Doctor of Philosophy Applied Management and Decision Sciences
Information Systems Management
Walden University December 2008
ABSTRACT
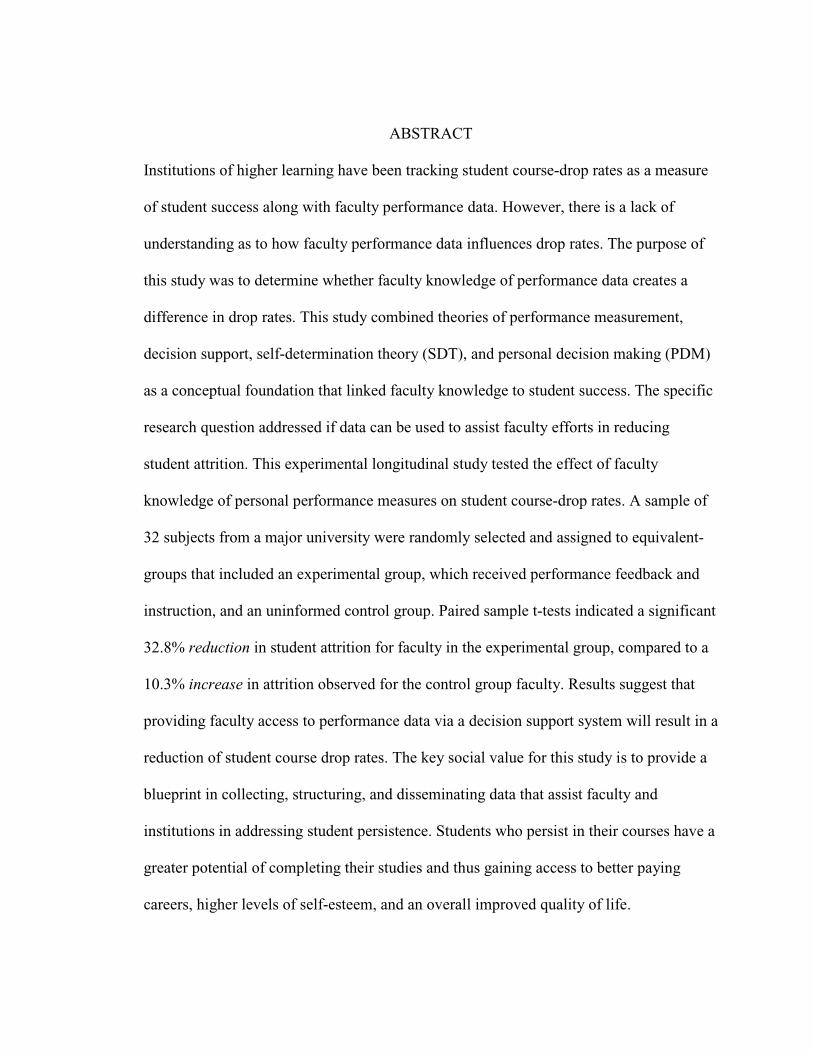
Institutions of higher learning have been tracking student course-drop rates as a measure
of student success along with faculty performance data. However, there is a lack of
understanding as to how faculty performance data influences drop rates. The purpose of
this study was to determine whether faculty knowledge of performance data creates a
difference in drop rates. This study combined theories of performance measurement,
decision support, self-determination theory (SDT), and personal decision making (PDM)
as a conceptual foundation that linked faculty knowledge to student success. The specific
research question addressed if data can be used to assist faculty efforts in reducing
student attrition. This experimental longitudinal study tested the effect of faculty
knowledge of personal performance measures on student course-drop rates. A sample of
32 subjects from a major university were randomly selected and assigned to equivalent-
groups that included an experimental group, which received performance feedback and
instruction, and an uninformed control group. Paired sample t-tests indicated a significant
32.8% reduction in student attrition for faculty in the experimental group, compared to a
10.3% increase in attrition observed for the control group faculty. Results suggest that
providing faculty access to performance data via a decision support system will result in a
reduction of student course drop rates. The key social value for this study is to provide a
blueprint in collecting, structuring, and disseminating data that assist faculty and
institutions in addressing student persistence. Students who persist in their courses have a
greater potential of completing their studies and thus gaining access to better paying
careers, higher levels of self-esteem, and an overall improved quality of life.


The Effect of Faculty Performance Measurement Systems on Student Retention
By
Timothy Woods
M.A., International Relations, California State University, Fresno B.A., Political Science, University of California, Riverside
Dissertation Submitted in Partial Fulfillment of the Requirements for the Degree of
Doctor of Philosophy Applied Management and Decision Sciences
Information Systems Management
Walden University December 2008

2009

ii
ACKNOWLEDGMENTS
I would like to express my absolute gratitude to my wife Cynthia and son Trevor who had
endured great sacrifices as a result of my pursuing this lifelong dream of academic
accomplishment. I would not have been able to face many of the challenges this journey
brought without their unconditional love and support.
iii
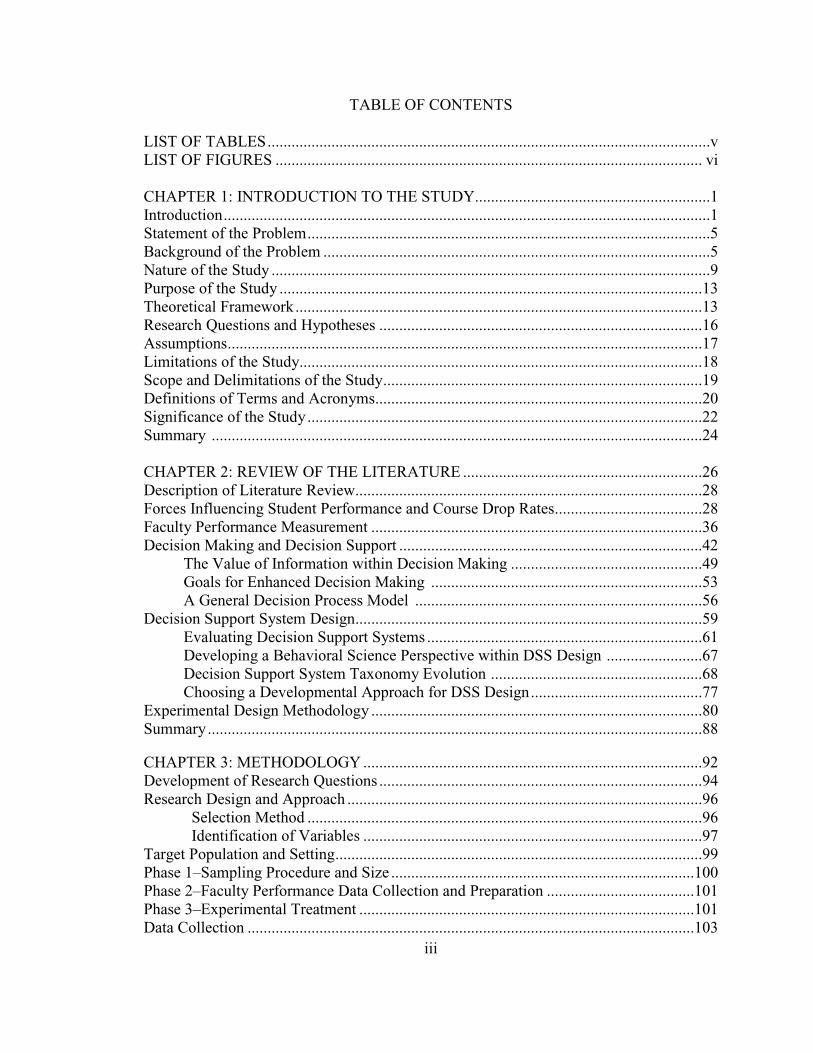
TABLE OF CONTENTS
LIST OF TABLES ...............................................................................................................v LIST OF FIGURES ........................................................................................................... vi CHAPTER 1: INTRODUCTION TO THE STUDY ...........................................................1 Introduction ..........................................................................................................................1 Statement of the Problem .....................................................................................................5 Background of the Problem .................................................................................................5 Nature of the Study ..............................................................................................................9 Purpose of the Study ..........................................................................................................13 Theoretical Framework ......................................................................................................13 Research Questions and Hypotheses .................................................................................16 Assumptions .......................................................................................................................17 Limitations of the Study.....................................................................................................18 Scope and Delimitations of the Study ................................................................................19 Definitions of Terms and Acronyms..................................................................................20 Significance of the Study ...................................................................................................22 Summary ...........................................................................................................................24 CHAPTER 2: REVIEW OF THE LITERATURE ............................................................26 Description of Literature Review .......................................................................................28 Forces Influencing Student Performance and Course Drop Rates .....................................28 Faculty Performance Measurement ...................................................................................36 Decision Making and Decision Support ............................................................................42 The Value of Information within Decision Making ................................................49 Goals for Enhanced Decision Making ....................................................................53 A General Decision Process Model ........................................................................56 Decision Support System Design.......................................................................................59 Evaluating Decision Support Systems .....................................................................61 Developing a Behavioral Science Perspective within DSS Design ........................67 Decision Support System Taxonomy Evolution .....................................................68 Choosing a Developmental Approach for DSS Design ...........................................77 Experimental Design Methodology ...................................................................................80 Summary ............................................................................................................................88 CHAPTER 3: METHODOLOGY .....................................................................................92 Development of Research Questions .................................................................................94 Research Design and Approach .........................................................................................96
Selection Method ...................................................................................................96 Identification of Variables .....................................................................................97
Target Population and Setting ............................................................................................99 Phase 1–Sampling Procedure and Size ............................................................................100 Phase 2–Faculty Performance Data Collection and Preparation .....................................101 Phase 3–Experimental Treatment ....................................................................................101 Data Collection ................................................................................................................103
iv
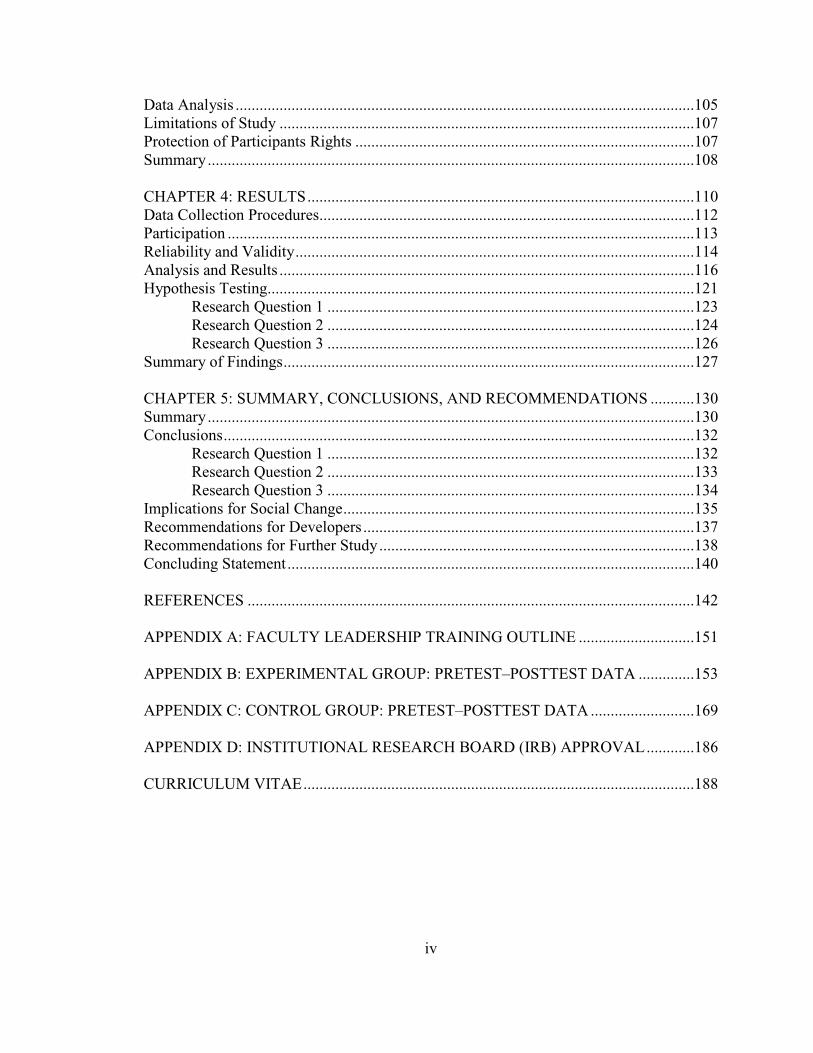
Data Analysis ...................................................................................................................105 Limitations of Study ........................................................................................................107 Protection of Participants Rights .....................................................................................107 Summary ..........................................................................................................................108 CHAPTER 4: RESULTS .................................................................................................110 Data Collection Procedures ..............................................................................................112 Participation .....................................................................................................................113 Reliability and Validity ....................................................................................................114 Analysis and Results ........................................................................................................116 Hypothesis Testing...........................................................................................................121
Research Question 1 ............................................................................................123 Research Question 2 ............................................................................................124 Research Question 3 ............................................................................................126
Summary of Findings .......................................................................................................127 CHAPTER 5: SUMMARY, CONCLUSIONS, AND RECOMMENDATIONS ...........130 Summary ..........................................................................................................................130 Conclusions ......................................................................................................................132
Research Question 1 ............................................................................................132 Research Question 2 ............................................................................................133 Research Question 3 ............................................................................................134
Implications for Social Change ........................................................................................135 Recommendations for Developers ...................................................................................137 Recommendations for Further Study ...............................................................................138 Concluding Statement ......................................................................................................140 REFERENCES ................................................................................................................142 APPENDIX A: FACULTY LEADERSHIP TRAINING OUTLINE .............................151 APPENDIX B: EXPERIMENTAL GROUP: PRETEST–POSTTEST DATA ..............153 APPENDIX C: CONTROL GROUP: PRETEST–POSTTEST DATA ..........................169 APPENDIX D: INSTITUTIONAL RESEARCH BOARD (IRB) APPROVAL ............186 CURRICULUM VITAE ..................................................................................................188
v
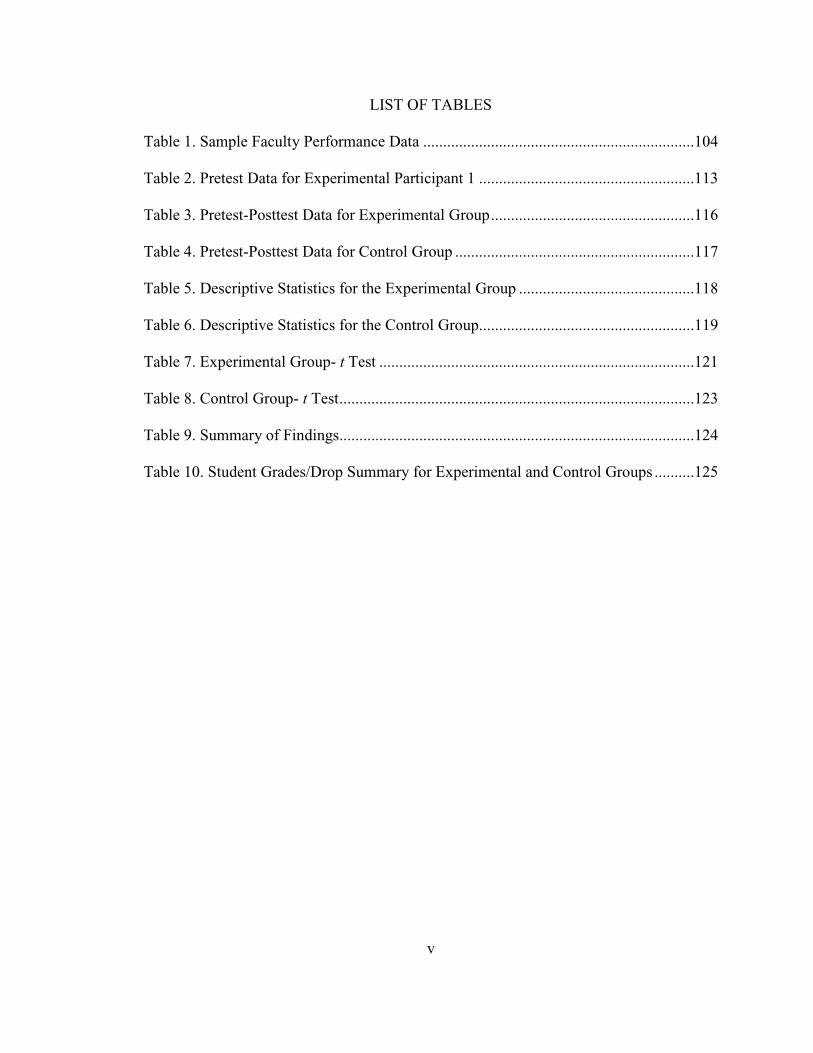
LIST OF TABLES
Table 1. Sample Faculty Performance Data ....................................................................104
Table 2. Pretest Data for Experimental Participant 1 ......................................................113
Table 3. Pretest-Posttest Data for Experimental Group ...................................................116
Table 4. Pretest-Posttest Data for Control Group ............................................................117
Table 5. Descriptive Statistics for the Experimental Group ............................................118
Table 6. Descriptive Statistics for the Control Group......................................................119
Table 7. Experimental Group- t Test ...............................................................................121
Table 8. Control Group- t Test .........................................................................................123
Table 9. Summary of Findings.........................................................................................124
Table 10. Student Grades/Drop Summary for Experimental and Control Groups ..........125
vi
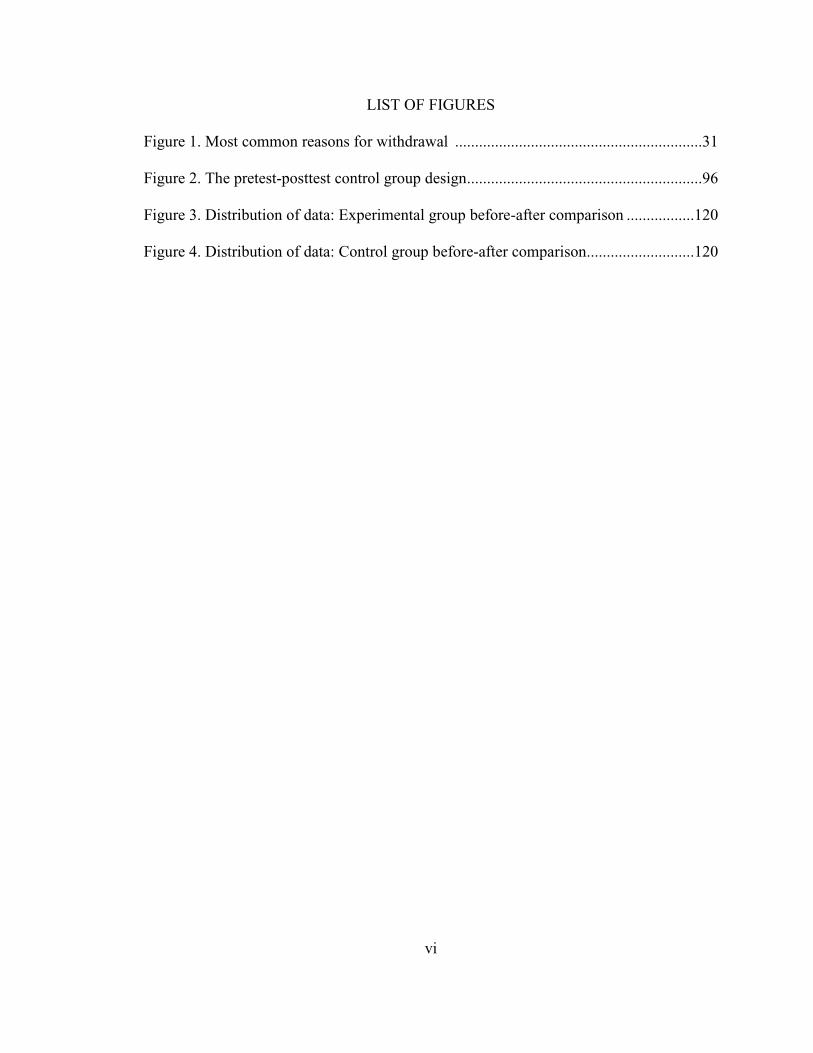
LIST OF FIGURES Figure 1. Most common reasons for withdrawal ..............................................................31 Figure 2. The pretest-posttest control group design ...........................................................96 Figure 3. Distribution of data: Experimental group before-after comparison .................120 Figure 4. Distribution of data: Control group before-after comparison ...........................120

CHAPTER 1: INTRODUCTION TO THE STUDY
Introduction
Institutions of higher learning have long sought ways to identify, collect, and
evaluate meaningful data that could lead to improved instruction and higher academic
quality. A fundamental drive has existed within these institutions to strive for greater
levels of student success. The view of students as consumers of education has led
institutions to reevaluate traditional roles and institutional priorities where exceptional
customer service is reflected through high quality curriculum and instruction. Institutions
have also sought ways to better understand and respond to student persistence as
expressed in course and program completion. Student persistence, also referred to as
retention, is a primary institutional concern in determining how students might be better
served to avoid pressures and challenges leading to course withdrawals.
The study of student persistence involves several highly complex and
interdependent factors. Student retention studies have focused, “on interactive and causal
links between student background, educational and institutional commitment, and
academic and social interaction” (Herzog, 2005, p. 884). Other studies have argued that
student persistence is directly related to the level of student preparation, or lack thereof,
for higher education (Cox, Schmidt, Bobrowski, & Graham, 2005; Kress, 2005; Parmar
& Trotter, 2004). Christie, Munro, and Fisher (2004) found that students withdrew for
many reasons beyond student academic commitment and preparation including factors
such as loneliness, poor course choices, and financial issues (p. 631).
Regardless of the cause, student success as expressed through persistence is a
major problem institutions of higher education must address (Ashby, 2004; Braunstein,
2
Lesser, & Pescatrice, 2006; Gaide, 2004; Gregory, 2005; Herzog, 2005). Braunstein et al.
provided an observation as to why a lack of student persistence represents a significant
social problem. Their research found that attrition rates can range from 10 to as much as
80 % (Braunstein et al., p. 33). High attrition rates are problematic because they create
serious consequences for both the student and the institution. Braunstein et al. observed,
Students who do not persist often lose present and future income and tend to develop lower self-esteem. Institutions that rely heavily on tuition and fees to support academic programs, the physical plant, and student services are especially impacted by attrition. Also, it is much more costly for institutions to recruit and admit new students than it is to retain existing students. (p. 33) The observations offered by Braunstein et al. (2006) are especially important
when considering the view of student as an educational consumer. Educational
institutions have stressed the importance of developing a student-centered learning
environment when considering the needs of current and future student populations
(Write, 2006, p. 417). This student-centered perspective has led to the view that students
are consumers and as such play an important role in evaluating faculty. Researchers such
as Levine and Curetan (1998) and Gregory (2005), have argued that the student/teacher
relationship is one factor that can positively affect retention. Faculty members serve as
the principle interpersonal link between the student and the institution. If students have
needs that they feel are not met within the classroom, then the faculty member has the
greatest potential in addressing these concerns quickly and directly (Gregory). The close
interpersonal tie between faculty and students could play a significant role in reducing
student attrition.
3
The pertinent question is how faculty performance measurement can be used to
supplement faculty efforts in addressing student attrition. Adams (2003) wrote, “There is
perhaps no task more difficult, or more likely to produce controversy, than that of
assessing the performance and accomplishments of members of a faculty” (p. 240).
Institutions have long used performance measurement to guide the decisions in granting
faculty promotions and tenure (Adams; McInnis, 2002; Wright, 2006).
Institutions have been tracking faculty performance measurement data such as
student evaluation of teaching, faculty grade variance, as well as, student drop rates by
course for many years. Often, performance data are collected via several disparate
systems and requires highly complex manipulation for the generation and dissemination
of meaningful information.
Historically, faculty performance evaluation has included measures for levels of
participation in curricular governance and quality of instruction, along with the level of
academic contribution (Adams, 2003). Institutions are reevaluating how faculty
performance should be measured given evolving technological capabilities along with a
redefined perspective of their students. Faculty performance measurement has also
evolved to becoming increasingly more focused upon instructional quality. As McInnis
(2002) wrote, “Technology is changing the way faculty work is defined and evaluated.
Data sources now have the potential to provide comprehensive and detailed information
about the quality and quantity of faculty and student work” (p. 53). The collection,
organization, storage, and retrieval of vast amounts of data for assessing teaching quality
has been traditionally viewed as a highly complex and arduous process (Jones, 2006;
4
Murnane, Sharkey, & Boudett, 2005; Wayman, 2005). In addition, educators may not
have the appropriate technical experience or time to deal with cumbersome data
collection systems (Murnane et al., 2005).
Advances in data warehousing and data mining systems have led to more user-
friendly decision support system (DSS) applications which have significantly reduced
complexity and time factors associated with their use. DSS applications represent a large
and highly specialized field of information systems. In the context of this study, a
decision support system is any combination of technology that can provide data to
decision makers. DSS tools have traditionally been designed to support specific task-
oriented activities rather than, tacit decision making efforts. Advances in DSS tools and
greater research in examining complex decisional environments have led to the
development of systems that can support more intuitive decisional needs, such as student
retention. The evolution of faculty performance measurement/decision support systems
(FPM/DSSs) has offered institutions the power to exercise greater potential control over
academic quality performance.
The art and science of faculty performance measurement (FPM) is an area where
enhanced decision support systems could offer a meaningful contribution to support a
quality educational experience. Enhancing students’ educational experiences could lead
to improved retention. Faculty performance measurement and the role of decision support
systems as related to student retention are discussed in greater depth in chapter 2.
5
Statement of Problem
A problem exists in that student course-drop rates remain at high levels. There is a
lack of understanding as to how individual knowledge of faculty performance data affects
student course-drop rates. Thus, developing decision support systems to assist in reducing
student-drop rates has become a major challenge. DSS applications are highly dependent
upon a firm understanding of data and their interrelationships. A system created without
this understanding could easily lead to inconsistent and inaccurate reporting, which in
turn, could lead to flawed decision-making.
While there are several studies that have documented factors related to student
retention (Ashby, 2004; Braunstein et al., 2006; Gaide, 2004; Gregory, 2005; Herzog,
2005), there is a distinct lack of research that identifies any links between faculty
performance measurement and student retention rates. This quantitative study tested the
potential link between the independent variable of faculty awareness and knowledge of
personal performance measures with the dependent variable of student course drop-rates.
This study used an experimental pretest-posttest equivalent groups design. The study
compared student drop-rates for faculty prior to the treatment and after. The key social
value for this study is to provide institutions of higher education a potential new path to
improve student course retention rates.
Background of the Problem
Student course drops can be a disruptive force within the student's educational
career and overall feelings of personal self-worth (Devonport & Lane, 2006). Student
drops also carry a significant weight in raising problems with graded group work, which
6
negatively impacts the academic performance of other students. Higher levels of
education can lead to higher, better paying forms of employment. Students who drop
courses place themselves at-risk of not completing their formal education. Students drop
courses for a variety of reasons. Some include overall student performance records, time
commitment in comparison with perceived value of course, family or personal issues,
matters related to personal finance and/or financial aid status, personal workload, course
subject matter, or possibly concerns with a particular faculty (Bosshardt & Kennedy,
2004; Braunstein et al., 2006.; Christie et al., 2004; Gregory, 2005; Lesser, & Pescatrice,
2006; Parmar, & Trotter, 2004).
Institutions of higher education have a social obligation to offer individuals an
opportunity to improve their lives through better education. Kirwan (2007) observed,
In an era in which public accountability has become a way of life in most sectors of society, we will continue to ignore these calls for information at our peril…Higher education has long played a pivotal role in honoring our nation’s “social contract”: the obligation of the current generation to educate the next generation. (p. 24)
The student-faculty relationship may have a great deal of influence on whether or not
students decide to drop a course. One factor that might be associated with this
relationship is faculty performance. Faculty performance evaluation involves complex
and dynamic data that can often lead towards inconsistent and unexpected outcomes
(Alter, 1980; Holsapple & Whinston, 2001). The role of FPM/DSS is to provide quality
data that leads toward more informed decision making that result in improved classroom
instruction.

7
For institutions of higher learning to make sound decisions, it is important that the
right data are collected and appropriately considered (Remus & Kottemann, 1986). An
organization depends upon sound decision-making practices to compete. DSS
applications have evolved to serve as valuable tools in augmenting the decisional process.
Over the last 40 years, systems have risen to become an integral part of complex
decision-making endeavors (Lee, 1989).
For FPM/DSS systems to be considered useful, “Decision-makers in educational
institutions must be able to justify their decision and point out clear and consistent
correlation between their principles and the rationale behind them, and the decisions
actually made” (Klein, 2005, p. 228). FPM/DSS applications must also be designed to
provide useful and meaningful feedback upon which faculty can reflect. As Richardson
(2005) noted, “Roche and Marsh (2002) found that teachers’ perceptions of their own
teaching became more consistent with their students perceptions of their teaching as a
result of receiving feedback in the form of students’ evaluations” (p. 389).
For FPM/DSS to be valued as an effective tool, faculty acceptance and utilization
is crucial. McInnis (2002) provided an observation in that advances in educational
technology has shifted faculty focus from the transmission of information more towards
the active engagement of student participation within the learning process. FPM/DSS
applications can provide valuable insight as to student perception of classroom and
educational dynamics. Technology can provide valuable information that could assist
faculty in monitoring, analyzing, and adjusting classroom and instructional conditions
(McInnis). If a meaningful link were to be determined to exist between faculty
8
knowledge of performance data and student course drops, then it could be possible to
provide an FPM/DSS to assist faculty in refining classroom and instructional strategies.
For example, faculty grade point average for grades issued may have a significant
link with student course drop rates (Ashby, 2004; Herzog, 2005). Bosshardt and Kennedy
(2004) found that students were not compelled to finish courses where their grade
performance was less than satisfactory (p. 113). Failing a course could result in additional
time, effort, and potential stress in replacing an unsatisfactory grade. If a course or
instructor is perceived as too rigorous there is the possibility that students could drop
such courses.
The tracking of faculty GPA could serve as a valuable indicator for the faculty
member to assess grading rigor or possible lack thereof. For example, if a faculty member
has a cumulative GPA of 4.0 within a particular course for 150 grades issued, what might
that value signify? On the other end of the spectrum, what might a cumulative GPA of
2.5 for a particular course for 100 grades issued signify? Could there be a potential
benefit for faculty to be able to track their GPA performance as a means of self-
calibration for assignment and lecture alteration?
A particularly controversial independent variable possibly related with course
drop rates is student evaluation of teaching. Richardson (2005) observed that, “Many
students and teachers believe that student feedback is useful and informative, but many
teachers and institutions do not take student feedback sufficiently seriously” (p. 410).
Faculty performance measurement can have a real effect in assessing the quality of
instruction if genuinely accepted by faculty and institutions (Engelland, 2004;
9
Richardson; Write, 2006). Faculty reluctance to accept student feedback at face value is
due, in part, to the great debate about whether or not student evaluation of teaching (SET)
is valid as an objective measure of faculty performance. Other concerns over SET include
questionable student objectivity, the internal and external validity of the SET survey
instruments, and the designation and classification of appropriate data to be used when
assessing faculty quality performance. These concerns are discussed in greater depth
within chapter 2.
Nature of the Study
This quantitative study utilized an experimental pretest-posttest equivalent groups
design. This method was selected because it carries inferential weight when studying
phenomenon. Heffner (2004) observed, “The pretest posttest equivalent groups design
provides for both a control group and a measure of change but also adds a pretest to
assess any differences between the groups prior to the study taking place” (para. 3). This
true experimental design method is considered one of the more effective approaches to
demonstrate causality (Heffner; Singleton, & Straits, 2005).
There are several reasons why true experimental designs are considered to have
higher internal validity. First, both the experimental and control groups are randomly
selected. Using randomized assignment eliminates conditions associated with selection
and regression errors. Secondly, true experimental design requires a rigorous structure
that strives for the optimal control over threats to both internal and external validity. As
Simon (2006) observed concerning experimental approaches, “The goal of experimental
research is toward certainty–that is precision, accuracy and reliability” (p. 46).
10
Ultimately, good experiments should bring balance between internal and external
validity concerns. The core requirements for a true experiment include random
assignment, distinct manipulation of an independent variable, measurement of a
dependent variable, two or more groups for comparison, and consistent environmental
conditions across groups.
A good experiment should lead to a better understanding of potential causal
relationships between variables in an environment. Independent variables are potential
influencers of dependent variables. Therefore, a specific, focused, and distinct treatment
(manipulation) is applied to an independent variable with the goal of studying potential
cause and effect associations. A well-defined experimental manipulation has higher
measurement validity in that independent variables (conditions) are limited in number
and complexity. Bear in mind that the challenge within experimental manipulation is in
the ability to separate and observe independent variable manipulation apart from the
effects of extraneous variables (multiple meanings).
The pretest-posttest equivalent groups design provides the ability to compare
averages of course drop rates for an experimental group before and after a specialized
training related to faculty performance measurement. The comparison of findings for the
experimental group with an equivalent control group (a group that would not receive
specialized training) allows for greater control over confounding extraneous variables
such as influencers due to history, maturation, and/or unidentifiable environmental
factors (i.e., seasonality). These concerns are discussed in greater detail in chapter 3.

11
As noted by Singleton and Straits (2005), the debate over the nature of causality
has continued with no one clear definition rising to theoretical dominion. Within the
realm of social science, three conditions have evolved over time when attempting to
ascertain causality. These potentially evidentiary conditions are association, direction of
influence, and nonspuriousness.
Statistical association indicates that there is a potential relationship between
variables. The power in statistical measure is not in the ability to define absolute
correlations; rather, the value of inferential statistics allows researchers to go beyond
casual observation to better understand the potential interplay between variables. The
intuitive understanding of potential variable interactions is of central importance when
considering the logical design for decision support systems. Misinterpretation of
relationships between variables could fundamentally lead towards flawed assumptions
that could corrupt and invalidate DSS output.
Direction of influence, a second condition of potential causality, seeks to identify
areas where independent variables influence changes within dependent variables. In
database management theory, this is known as transitivity. In other words, the application
of sales tax upon the subtotal sales price results in (direction of influence) a higher total
price. In the case of faculty performance, the example of perceived course or faculty rigor
might be associated with a pattern of higher student course-drop rates.
Nonspuriousness infers that the relationship between two variables is not random,
nor are there hidden extraneous variables that also influence the dependent variable.
Singleton and Straits (2005) make an important point in that in an ideal study the
12
researcher could be able to demonstrate a relationship while all extraneous variables are
fixed. The greater control over extraneous variables, the greater the chances that the
relationship within the observed phenomenon is nonspurious. This study had been
designed to embody these conditions as closely as possible.
The study involved a private university that provides both undergraduate and
graduate degrees for students within the San Francisco Bay Area region of California.
The student population is over 3600 learners. The faculty population is comprised of 76
active adjunct faculty members who teach in the areas of humanities, business, education,
and technology. Faculty instructional experience with the university ranged between 3 to
23 years. A random sample of at 32 faculty participants was sought. This minimum
sample size allows for a 95% confidence level in either rejecting or accepting the study’s
null hypothesis with a potential error of 13.2%. Sample selection and study utilization of
quantitative analysis are discussed further in chapter 3.
The institution currently tracks student course drop rates (CDR), faculty grade
point averages (average GPA for grades issued), and student evaluation of teaching
(SET). Using historical data spanning the past 2 years, the study considered measures of
central tendency (mean) along with measures of variability (standard deviation) for CDR.
A faculty training program (the treatment) was developed sharing individualized
performance data and administered to a randomly sampled experimental group. GPA,
SET, and CDR data were collected for a period of three months after the treatment for
both the experimental and control groups. Data for the groups were compared to
13
individual subject historical data. The study design is described in greater detail in
chapter 3.
Purpose of Study
The purpose of this study was to determine whether faculty knowledge of
performance measurement creates a difference in student course drop rates. If faculty
awareness of performance data and training leads to a reduction in student course drop
rates, then it would be possible to develop an effective FPM/DSS that could support both
faculty and institutional efforts in raising student retention. This study provides
institutions with an important blueprint in collecting, structuring, and disseminating data
that assists in adapting to dynamic factors that may be associated with student
persistence. Several institutions already utilize data-driven reporting to guide decisions.
There still exists a critical gap of understanding between data collected and the provision
of an accessible and meaningful FPM/DSS.
Theoretical Framework
The evaluative use of faculty performance measurement is not without theoretical
controversy. Both faculty and institutions have exhibited reservations in using SET as
bases for faculty performance evaluation. The question as to the validity in using student
feedback as a measure of faculty performance is not new. As Wright (2006) explained,
“Despite the widespread use of data from student evaluations for the purpose of
determining faculty teaching effectiveness, a review of literature in the areas indicates
that issues concerning the validity and usefulness of such evaluations remain unresolved”
14
(p. 417). Concerns associated with validity and usefulness of SET are discussed in greater
detail in chapter 2.
Another significant theoretical concept centrally related to this study is that of
intrinsically motivated self-leadership. Lee and Chang (2006) made the observation that
innovation ability and leadership are two very basic functions within an organization. Lee
and Chang (2006) defined innovation ability as a special form of change management
where efforts are made to initiate improvement efforts that would lead to competitive
advantage (p. 218). From an educational perspective, innovation ability is equated with a
faculty member’s ability to strive for constant improvement in their instruction.
The theoretical concepts of self-determination theory (SDT) and motivation also
provide an important context for observing how faculty performance measurement may
influence course drop rates. Li, Tan, Teo, and Mattar (2006) published an important study
that utilized self-determination theory (SDT) as related to motivation. SDT identifies two
basic forms of motivation, intrinsic and extrinsic.
Intrinsic motivation is defined as the drive to be doing an activity (e.g., develop OSS) because of the inner satisfaction achieved from it rather than to get a desired result…Extrinsic motivation can be perceived as the drive to take actions to attain externally administered rewards, including career, prestige and positive evaluations from others. (Li et al., p. 35) Because faculty members represent a highly specialized class of knowledge
workers, a greater degree of intrinsic motivation and self-leadership is required.
Houghton and Yoho (2005) defined self-leadership as a process where individuals
develop self-direction and self-motivation to perform their duties (p. 66). Self-direction is
most closely related to intrinsic motivation, the achievement of inner satisfaction. Self-
15
direction is “based on self-control and self management theory, self-leadership’s
behavior-focused strategies include self-observation, self-goal setting, self-reward, and
self-correcting feedback” (Houghton & Yoho, p. 67). Utilizing a behavior-focused
strategy such a self-direction involves a high degree of personal awareness along with a
high receptivity to developmental feedback. According to Gregory (2005), inspired
teaching emanates from highly motivated, self-inspired faculty.
Beyond faculty intrinsic motivation, the level of access faculty have to
institutionally collected datum is also of central importance within this study. There are
several works within DSS literature that have identified considerable discrepancies
between personal decision making (PDM) and available computer-assisted DSS
(Holsapple & Whinston, 2001; Keen & Morton, 1978; Klein, 2005; Power, 2002;
Sprague & Carlson; Alter, 1980). Decision environments are complex and dynamic
which often leads towards inconsistent and unexpected decisional outcomes. A non-fluid
decisional environment can often lead to flawed decisions given that outcomes are
dependent upon the individual’s abilities to store, process, and disseminate vast amounts
of data. “The more complicated a decision, the greater these difficulties; as a result,
decision-makers make an accommodation known as ‘bounded rationality,’ which
manifests itself as carelessness in ensuring orderly stages in decision-making, and
inadequate treatment of each stage” (Klein, p. 222).
The evolution of FPM/DSS applications have offered institutions the potential
ability to exercise greater control over academic quality through thoughtful identification
of independent, dependent, and extraneous variables associated with faculty performance

16
measurement. Faculty performance evaluation represents a complex decisional process.
FPM/DSS applications must support dynamic and complex decisional environments.
Established theories of faculty performance measurement, student evaluation of
teaching, decision support system design, along with decision theory and analysis,
provided an analytical overview and synthesis of frameworks for decision-making and
decision support systems as developed by Morton (1971), Alter (1980), Keen (1978),
Power (2002), Sprague, Jr. and Carlson (1982).
Research Questions and Hypotheses
Validity of knowledge is the foundation of successful, effective decision support
systems. Credibility and accuracy of information provided via DSS applications greatly
influence how these systems are utilized and valued. Holsapple and Whinston (2001)
observed concerning validity of knowledge,
Is the knowledge that goes into a decision-making process sufficiently valid? Answering this question depends on assessing the accuracy of the knowledge, its consistency with other knowledge, and our certainty or confidence in the knowledge. It might be nice if all knowledge involved in decision making were scientifically validated as being entirely correct and consistent. It might also be nice if all knowledge involved in decision making could be philosophically certified as being absolutely trustworthy and certain. As a practical matter, however, it is often not feasible to validate scientifically all raw materials of decision making and demonstrate absolutely their trustworthiness with philosophical certitude. (p. 109)
Holsapple and Whinston’s observations are of central importance to this study. The
following research questions are inspired by these observations along with the problem
involving practitioner acceptance as to the validity in using faculty performance
measurement to influence student persistence.
17
1. What is the effect of faculty access and knowledge of faculty performance
data in reducing CDR?
2. What is the effect of faculty performance measurement data on student
persistence?
3. What are implications for institutions of higher learning seeking to utilize
decision support systems in addressing student persistence?
To explore these research questions, the following hypothesis was tested:
Null Hypothesis (H0): Informing faculty on faculty performance measures will
not have an effect upon student course drop rates.
Assumptions
Primary assumptions for the study include:
1. All participants are interested in student success.
2. All participants view student course-drops as an important concern.
3. All participants are intrinsically motivated in the pursuit of constant self-
improvement.
4. While specific faculty may not be the reason for student drops, they may have
a direct influence in creating positive change in reducing those drops.
18
Limitations of Study
The analysis of 2 years of historical data provided a set of descriptive statistical
data that reflect a high level of internal data validity. A common theme within trend
analysis is that as the time (or length) of study increases, the greater the chances are for
valid trends to emerge. As more and more data are collected, the less significance
anomalies and outliers play in potentially skewing the data. The study used historical data
as a baseline for comparison. The limitation of the study is that the time factor for
tracking performance after the experimental treatment is relatively short. Data were
collected for only a 3-month period after the treatment.
Another limitation of this study is that student drops represent a complex array of
interdependent variables. For example, student motivation and level of academic
preparation are major factors that influence a commitment to finish a course. This study
was not designed to test student motivation or level of academic preparation. There are
several extraneous variables that influence student drops beyond faculty motivation,
leadership, and support. It is quite likely that after the treatment little or no change in
student drops may be observed.
A final limitation for the study is the sample itself. While every effort is made to
generate a truly random sample from the university population, the sample is derived
from a pool of actively teaching faculty. Because these faculty members are actively
teaching, their personal performance indicators may already reflect a high level of
performance. Higher levels of performance are hard to improve upon regardless of data
access and training. One cannot improve a 100% student approval rating. Another issue

19
associated with sampling is external validity, or generalizeability of the study. The
analysis of faculty members from a specific institution does not reflect an adequately
sized sample to equate findings with other institutions of higher learning. Another
limitation of this study involves threats to internal validity including evaluation
apprehension, experimenter expectancies, and diffusion or imitation of treatment. These
threats are discussed in greater detail in chapter 2.
Scope and Delimitations of the Study
Simon’s (2006) statement, “The goal of experimental research is toward
certainty–that is precision, accuracy, and reliability” (p. 46), represents a central driving
force for this study. All decisions, directions, and approaches within this study are the
direct result of a strict adherence to the principles of precision, accuracy, and reliability.
The study sample faculty members were selected to reflect a fair representation of
those who teach the most in any given academic year for that particular university. The
sample was pulled from active teaching rosters. The primary goal was to establish a
sound proportional sample. While findings of the study may have limited
generalizeability for other institutions of higher learning, the internal validity for this
particular institution’s general population is significant.
All faculty members selected for this study are working professionals from
various fields within business and education. These faculty members teach in all areas
ranging from research, mathematics, business principles, technology, education, arts and
sciences, and teacher education/credentialing. As adjunct faculty, their classes are often
20
considered supplementary activities. The sample was selected from faculty teaching in
the San Francisco Bay Area region of Northern California.
The focus of this study was to observe any changes within individual performance
indicators as compared with student drops rates. Since the study focuses upon the
individual, no analytical attention was given to the nature of subject material being
taught, tenure or seniority status of participants, or potential cross-discipline data
correlations. The particular institution selected for study is a predominantly adjunct
faculty population.
Definitions of Terms and Acronyms
Behavior-focused strategy: Refers to strategies that target individual behaviors to
invoke some form of personal change. In the context of this study, the term refers to
faculty personal adjustments to exercise changes within the classroom.
Course drop rates (CDR)–Student: Refers to the number of individual students
dropping a course. Course drop rates are calculated by taking the total number of grades
issued by a faculty member divided by the total number of student course drops within
the same period of time. This study compared student drop rates for faculty prior to an
experimental treatment and after.
Data–intuitive: In terms of knowledge management and information systems,
intuitive data refers to abstract, highly unstructured data. (Examples include student
evaluation of teaching and faculty responsiveness).
21
Data–tacit: In terms of knowledge management and information systems, tacit
data refers to concrete, highly specific data. (Examples include number of student drops,
GPA).
Data mining: The activity of using specialized database management tools to
extract and aggregate data from a database management system.
Data warehousing: Represents a highly specialized form of database management
systems. Data warehouses are used for the collection of data from extremely large data
environments.
Faculty performance measurement (FPM): Refers to a form of employee
assessment performed by an educational institution. Typically, performance
measurements are used in the determination of promotions, raises, and the granting of
tenure. FPM measures can include elements such as faculty GPA and SET.
Faculty performance measurement/decision support systems (FPM/DSS): Refers
to a class of information systems that are specifically designed to support decisions
associated with faculty performance.
Grade point average–Faculty: Represents the cumulative grade point score given
by faculty for a particular course.
Informed faculty: Represent test subjects who have received the experimental
treatment for this study. The experimental treatment is defined in depth in chapter three.
Faculty informed drop rates (FiDR): Represents the number of individual
students dropping a course.
22
Faculty non-informed drop rates (FniDR): Represents the number of individual
students dropping a course.
Non-informed faculty: Represent test subjects who have not received the
experimental treatment for this study.
Student evaluation of teaching rating (SET): A form of faculty performance
measurement usually determined through student surveys.
Student-centered culture: Refers to an academic culture that views student
learning and success as the central focus for all academic endeavors.
Student persistence: A term found within education literature that is used
synonymously with the term, student retention.
Significance of Study
The significance of this study is to provide data to reduce the gap in scholarly
research concerning the potential effects between remediable faculty performance
measurement and student course-drop rates. Such research can be used for the creation of
a new model for FPM/DSS design that can assist both faculty and institutions in reducing
course-drop rates. The key social value an effective FPM/DSS can provide is in the
ability to support institutional efforts to significantly raise the educational levels of our
community and the enrichment of student lives.
Rapidly changing political, social, and economic forces within a converging
global community have a tremendous impact upon nation’s wellbeing. There is little
debate that the social and economic strength and stability of a nation is highly dependent
upon the level of education found within its population. An individual’s quality of life

23
can be greatly improved through higher education. Course-drop rates represent a highly
disruptive force within students’ educational careers. Identifying actual reasons for
student course withdrawal is a challenging prospect. There are several known and
unknown variables that influence a student’s decision to withdraw from a course. This
study might help institutions reduce student course drop rates by identifying the need to
reassess how performance data are collected, used, and disseminated to faculty to support
professional development and trend-based adaptation. As nations become more
susceptible to hyper-competitive global markets, it has become apparent that the social
responsibility for institutions of higher learning must change.
Historically, institutions of higher learning have been a community force for
social change. To meet current social demands, a student-centered culture must be
developed where both institutions and faculty are focused upon determining strategies for
greater student retention, growth, and graduation. To accomplish these objectives, it is
important to identify causal factors that may influence actual student drops rates. The
development of sophisticated FPM/DSS applications can greatly assist in the quest to
invoke positive change in course drops rates. For example, the aggregation of student
drop rates for a particular course over a long period of time might provide valuable
insight as to an expected average course-drop rate. This study utilized 2 years of
historical data to test if faculty access to such data would make a difference in future
course-drop rates.
The design and development of effective DSS applications represents a complex
and challenging endeavor. Developers must not only be proficient in developmental
24
methodologies, they also must understand the psychology of decision making. There is
little doubt that the rapid evolution of technology has revolutionized how systems are
used within decision making. Ultimately, effective DSS applications must take into
account the nuances and behavior of the decisional process.
Developing a fixed standard framework for decision making has been a challenge
given that problems are often complex, dynamic, and dependent upon an intricate
combination of structured and unstructured data. System developers have wrestled many
years with the unique challenges in creating “intelligent” information systems that
provide enhanced problem-solving aids that meet the decisional needs of decision
makers. A potential result of this research is the identification of a credible example of
where an educational DSS can make a real difference in improving student success
through the reduction of student drop rates by providing faculty direct access to
performance data that might be improved. The key social value an effective FPM/DSS
provides is in the ability to support institutional efforts to significantly raise the
educational levels of our community and the enrichment of student lives.
Summary
The evolution of DSS to support faculty performance measurement has produced
both great advances and controversies. Faculty performance has been a major concern for
institutions given the direct role faculty play in supporting an institution’s credibility and
reputation. The tracking of faculty performance had traditionally focused upon academic
publication and community service as primary factors for granting promotion and/or
tenure. Technological advances allow massive data collection, collation, and reporting
25
along with a renewed perspective of the student as a consumer has led towards a
reexamination of faculty performance. Given the seriousness of student drops it is
important to provide faculty with the tools necessary to make informed decisions as they
adapt classroom and instructional strategies. Effective decision making is reliant upon the
decision maker’s ability to manipulate, reconcile, and synthesize structured and
unstructured data toward a better solution.
Chapter 1 represented a conceptual overview for the research problem in
developing an accurate and user-accepted FPM/DSS that could greatly enhance student
success through a reduction of student course drop rates. A brief review of decision
support and student retention literature is provided to build a theoretical foundation for
the study. Specific study scope, assumptions, limitations, mechanics, and definitions of
technical terms are provided to serve as the framework for the study. Chapter 2 is a
detailed review of literature that delves deeper into the areas of decision science, decision
support system design, faculty performance measurement, and student retention. Chapter
3 represents the research design and approach. A detailed description of the study is
presented. Particular attention is given to the study design, sample selection and
justification. A detailed statistical framework is presented that was used in assessing
observations within the experiment. Chapter 4 is a description of data collection
procedures, experimental results, data analysis, and hypothesis testing related to the
study’s research questions. Chapter 5 represents the summary and conclusions that can be
made from this study. Discussion also covers implications for social change,
recommendations for developers, and recommendations for further study.

CHAPTER 2: REVIEW OF LITERATURE
As stated in chapter 1, the purpose of this experimental study was to determine
whether faculty knowledge performance measurement data leads to a reduction in student
course-drop rates. The study of student persistence as a social phenomenon presents a
challenge given the complex and interdependent nature of factors associated with student
success. Analytical focus within recent persistence literature often identifies both
individual and social factors that may contribute to student course drop rates. Individual
concerns may relate to personal stress levels, self-confidence, along with students’
overall level of academic preparedness. Social factors that potentially influence
persistence can involve family dynamics, prevailing institutional conditions, the existence
and quality of social support networks through friends and/or acquaintances, and a
student’s realistic self-appraisal of readiness for continuing studies.
Also explored in the literature is the relationship that exists between faculty and
the student (Cox et al., & Graham, 2005; Devonport & Lane, 2006; McArthur, 2005;
Pompper, 2006; Robotham & Julian, 2006). There have also been numerous studies
addressing the topics of faculty performance measurement (Adams, 2003; Baldwin &
Blattner, 2003; Chalmeta & Grangel, 2005; Chang & King, 2005; Engelland, 2004;
Feldman, 2005; Fenner, Lerch, & Kulik, 1990). There has also been a significant research
focus on the evolution of technology in assessing the topics of faculty performance and
student success (Adams, 2003; Agrell & Steuer, 2000; Ashby, 2004; Chang & King,
2005; Dooris, 2002; Fenner et al.; George, 1996; Irving, Higgins, & Safayeni, 1986;
Klein, 2005). In reviewing the decision support literature, one finds several studies that
have explored the evolution of DSS technology toward greater business effectiveness and
27
operating efficiencies (Chalmeta & Grangel, 2005; Chang & King; Cody, 2002;
Davenport & Harris, 2005; Davenport & Prusak, 2000; Fenner et al.; George, 1996; Halit,
2005; Holsapple & Whinston, 2001).
These studies have significantly enhanced our understanding of student-faculty
relationships, student persistence, faculty performance, and technical evolution as a DSS
tool. In reviewing the literature, one finds an important question remains unresolved: In
what ways are faculty performance measurement data related to student course-drop
rates? The nature of this relationship was the central focus for this study. The
determination of an effect would mean that it is possible to design a decision support
system that could aid institutions and faculty in supporting student success. The
development of an accurate and user-accepted FPM/DSS could provide educators with
essential data that could be useful in assessing how best to create and nurture an effective
student-centered learning environment.
The objectives for this chapter are to review literature associated with student
performance and course drop rates, faculty performance measurement, decision making
and decision support, and decision support system design. The design, development, and
implementation of effective DSSs require a strong foundation in both system design
methodology along with a profound understanding of decision science. Stinchcomb
(2006) noted that while future events are destined to occur despite human efforts,
outcomes can be influenced by our actions. Developing a deeper understanding of student
persistence and the role FPM/DSS systems may play can lead to improved student
success.
28
Description of the Literature Review
The foundation of any literature review is based upon information seeking and
critical appraisal. Essentially, literature reviews represent the art of locating substantive
information which is unbiased and valid (Taylor & Procter, n.d.). Materials used for this
literature review were obtained via electronic library resources both within academic and
professional collections. Seminal texts were also selected from DSS literature. Criteria
for source selection gave considerable weight to source quality, depth, breadth, accuracy,
and authority. Internet databases used for research included EBSCOhost, ProQuest, and
the Association for Computing Machinery (ACM) Digital Library.
Forces Influencing Student Performance and Course Drop Rates
Alter (2002) argued, that researchers have spent far too much time in considering
the mechanism of decision science, rather than analyzing the foundation of sound
decisions. Identifying the foundation of sound decisions is an important consideration
when attempting to address a highly complex phenomenon such as student persistence.
“Student retention has been the focus of research in higher education for some time, not
least due to efforts to establish a benchmark indicator of institutional performance and to
gain a better understanding of enrollment-driven revenue streams” (Herzog, 2005, p.
883).
A significant amount of literature supports the highly complex and
multidimensional nature of student persistence (Ashby, 2004; Cox et al., 2005; Herzog,
2005). Thus,
Any drive to improve student retention has to take account of the learning experience of the student in its broadest sense. Varied approaches to learning and
29
teaching can affect levels of student confidence and motivation and also meet their need for support. (Parmar & Trotter, 2004, p. 162) Factors influencing student persistence include student background, year in
program, commitment to education, commitment to subject material, course load, student
GPA, academic preparedness, level of social integration, existing family support,
financial situation, levels of personal stress and/or efficacy (Christie et al., 2004; Herzog,
2005; Wilcox, Winn, & Fyvie-Gauld, 2005). Developing a system that collects accurate
information concerning these factors is a challenge given the elusive nature of the data
itself. Ashby (2004) observed, “Getting at the real reasons for withdrawal is of course
notoriously difficult since students may not wish to reveal their real reasons, and it is
important to triangulate information from different sources” (p. 72).
Ashby’s (2004) concept of data triangulation is of key importance when
considering the potential value an FPM/DSS system can bring to the institution and
faculty in attempting to improve student persistence. The true power of a DSS lies in its
ability to provide the decision maker ready access to large amounts of highly complex
and interdependent data to formulate better decisions. There are many factors outside the
control of faculty when attempting to influence student persistence. While faculty may
have little or no control in certain areas, several studies have found that faculty can have
a significant influence in reducing student drops (Devonport & Lane, 2006; Gregory,
2005; Robotham & Julian, 2006).
There is a significant amount or research claiming that students’ early and
frequent interaction with institutional faculty and staff can lead to higher retention levels
(Bosshardt & Kennedy, 2004; Cox et al, 2005; Christie et al.; Devonport & Lane, 2006;

30
Gregory, 2005, McArthur, 2005). High levels of interaction lead to greater feeling of
academic competence along with an improved sense of self-efficacy (Cox et al.). Faculty
have the potential to play an important role within the student’s academic life. The
faculty-student relationship can be an incredibly strong bond that provides students with a
sense of both encouraging support along with clear academic guidance and mentorship
(Devonport & Lane, 2006; Gregory, 2005; Robotham & Julian, 2006). McArthur (2005)
noted,
Clearly, community college leaders cannot overlook the significance of the research indicating such an important role for the faculty in student retention. Of course, the primary function of the faculty is to facilitate learning, but because the student experience on campus is so transitory, the faculty role becomes even more crucial at a commuter college (Pascarella & Terenzini, 1991). One of the ways that the faculty can have additional impact on the life of the student is through a program of quality academic advisement. According to King (1993), academic advisement and the role the faculty plays in the delivery is the most critical service available for community college students. (p. 2) Significant evidence suggests that students are entering institutions of higher
learning with fewer skills and less preparation (Braunstein et al., 2006; Gregory, 2005;
Parmar & Trotter, 2004). Given the direct interaction between faculty and students,
faculty assessment of student learning can have a positive influence in supporting
persistence. “Although lecturers set the assignments, they might underestimate
difficulties of the tasks or fail to consider the competencies deemed important by students
(e.g., availability of computers, books, library opening times, how to manage time)”
(Devonport & Lane, 2006, p. 130). What is not evident from the literature is how the
mountain of data institutions collect concerning faculty performance may also be used to
help reduce student drops.
31
Faculty awareness and sensitivity to these issues provides for greater
opportunities to share with students strategies in academic planning along with skill
development that leads to successful assignment completion and overall course
performance. “It is argued that planning helps individuals to break complex tasks into
manageable units and set interim goals to achieve them. Because of such planning efforts,
the achievement of interim goals should influence self-efficacy” (Devonport & Lane,
2006, p.136). While faculty mentorship and support can help influence student
persistence, students still face many issues outside the classroom. Ashby (2004) noted
that the demands of a “modern life” may have also added to student stress levels,
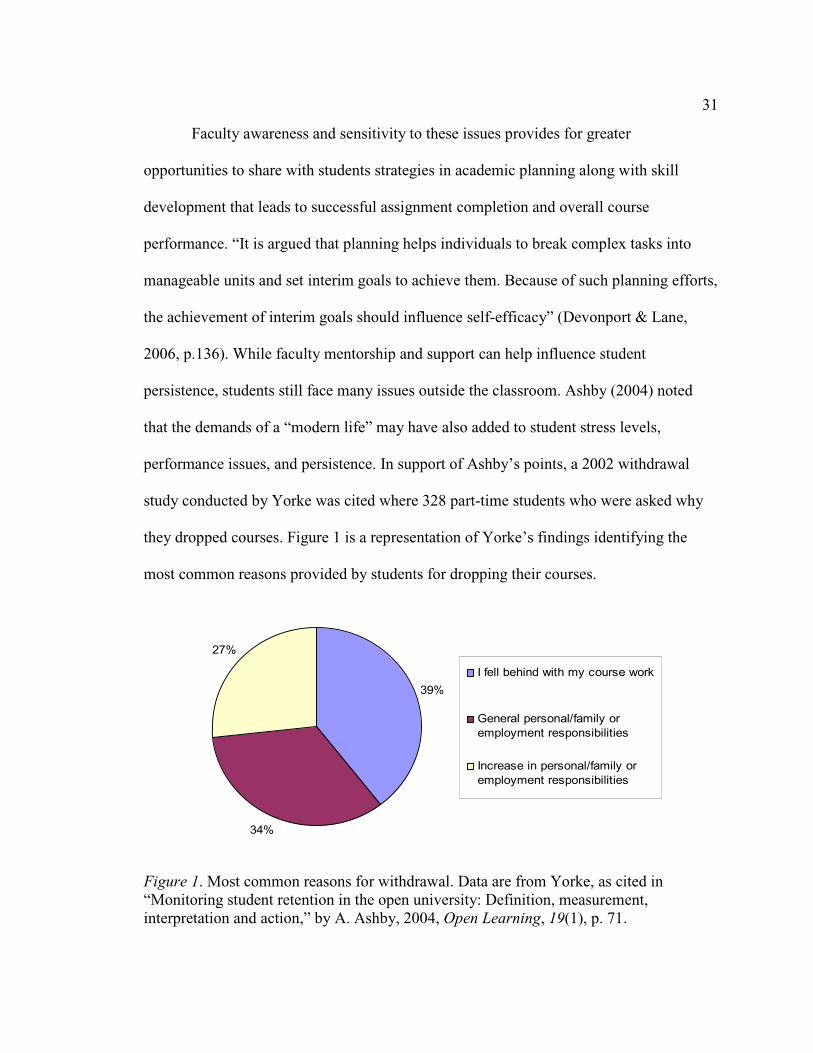
performance issues, and persistence. In support of Ashby’s points, a 2002 withdrawal
study conducted by Yorke was cited where 328 part-time students who were asked why
they dropped courses. Figure 1 is a representation of Yorke’s findings identifying the
most common reasons provided by students for dropping their courses.
39%
34%
27%
I fell behind with my course work
General personal/family oremployment responsibilities
Increase in personal/family oremployment responsibilities
Figure 1. Most common reasons for withdrawal. Data are from Yorke, as cited in “Monitoring student retention in the open university: Definition, measurement, interpretation and action,” by A. Ashby, 2004, Open Learning, 19(1), p. 71.
32
In addition to falling behind, personal and family responsibilities, along with
employment demands had a great impact influencing student decisions to withdraw form
a course or courses. Financial conditions also exist in the student’s ability to secure funds
for the rising costs of education. These factors are obviously outside the control of the
faculty member. For these very reasons, many institutions are reevaluating how they
approach student retention. Several studies within literature identify a student’s first year
experience as a critical factor in student persistence behavior (Braunstein et al., 2006;
Christie et al.; Cornell & Mosley, 2006; Parmar & Trotter, 2004).
Several institutions have increased resources to provide crucial services early on
in the student experience. For example, Paradise Community College has implemented a
First-Year Experience (FYE) program that has enjoyed significant success.
In FYE, students find a supportive environment to ease the transition to college. Students have the same block of teachers, so any learning difficulties can be identified early, discussed by the teaching team, and quickly resolved. Instructors also serve as advocates for students by answering a variety of questions related to academic and college life. (Cornell & Mosley, 2006, p. 23) Monroe Community College has taken a three-pronged approach in addressing
student persistence: managing student expectations, managing support services, and
managing academics (Gaide, 2004, p. 6). Gaide provided an important quote by Marie
Fetzner, Assistant to the VP of Educational Technology,
In a traditional bricks and mortar educational setting, students interact with a wide variety of people on a daily basis—fellow students, faculty, advisers and administrators. This daily interaction is the basis of a support system whereby students have the opportunity to seek help and guidance as well as have course expectations explained and reinforced. Based upon online retention research conducted at MCC, we found that students come to the online environment without a clear set of expectations and often do not know where to look for help. As a result, their questions go unanswered and they slowly fall behind or drop out
33
of their online courses. At MCC, we’ve taken a proactive approach to addressing the issues related to student expectations as a means of improving the online learning environment and increasing student retention,” says Fetzner. (as cited in Gaide, 2004, p. 4) Recent literature supports the concept that student persistence is influenced by
complex interactions between the individual student with their community, family,
institution, and faculty (McArthur, 2005; Pompper, 2006; Robotham & Julian, 2006).
Pompper (2006) observed,
In recent decades, theories of student persistence, attrition and retention have sought to explain and predict college student enrollment fluctuations from year to year. Education scholars have framed some remedies as "student-centered" because institutions have probed variables affecting students' ability to persist through graduation. Other scholars have framed remedies as "institution-centered" approaches—as if institutions can control student behavior. The current study sought to blend both perspectives by advancing a "relationship-centered" approach to students' persistence through graduation. (p. 29) The shift to a relationship-centered approach to improving student persistence has
great promise. “In October 2000, Santa Fe Community College (SFCC) began a project
of significant institutional change, funded by a 5-year, $1.75 million grant from the US
Department of Education Title III, Part A program” (Kress, 2005, p. 655). SFCC sought
to revamp a 30 year old program that would completely alter their approach in servicing
their associate of arts (AA) degree. The cornerstone for this new initiative was the
creation of an online student support system. A Web portal had been created (eSantaFe)
that provides students with services 24 hours a day, 7 days a week. “The immediate
success of the portal indicates that students prefer to interact with many college services
from their homes, and at times of their choosing. One third of all eSantaFe activity took
34
place after the college’s business offices had closed. These students might not have been
able to obtain these services without eSantaFe” (Kress, p. 655).
In addition to the student Web portal, a DSS was developed to assist staff and
faculty. to build such a system, it was first necessary to initiate institutional assessment
processes, collect information from several disparate information systems into a
centralized data warehouse (Kress, 2005). The data warehouse is equipped with
traditional data mining tools such a query report writers. As Kress describes the College
created, “A decision support system, using Web-enabled business intelligence tools to
make the data accessible to college stakeholders” (p. 655). The system was specifically
designed to “prepare faculty and staff to deliver the innovative, student centered
academic and support services” (p. 655).
SFCC has also implemented a decision support system (DSS): a data warehouse accessed by Crystal Decisions software. Stakeholders can access ad hoc and regularly scheduled reports through the eStaff portal. Reports are interactive and Web-based, allowing users to drill down to the information critical to their decision-making. For example, a single report on enrollment contains information on six levels: college, division, program, department, course, and section. This same information can also be sorted by various parameters (e.g., college site, day/time, etc.)—all from the user’s desktop. The DSS-combined with results from the Noel Levitz Student Satisfaction Inventory, the Community College Survey of Student Engagement, and various college surveys and focus groups—has provided the data framework for institutional change. In support of these changes, personnel have participated in workshops on retention, diversity, assessment, innovative student services, data evaluation, and formation theory. (Kress, 2005, p. 655) The system has been quite effective. “As SFCC enters year 4 of the project, it has
fundamentally changed how it serves AA students: 40% of new students applied online;
50% attended orientation online; 80% accessed online advisement; and 75% registered
35
online” (Kress, 2005, p. 656). Kress also noted that the college has reported noticeable
improvement in student performance, satisfaction, and overall retention.
Cox et al. (2005) observed that there is extensive research that indicates that
student persistence is positively influenced by
1. Early and frequent interaction with faculty, staff, and peers 2. Clearly communicated academic expectations and requirements 3. Learning opportunities that increase involvement with other students 4. Academic, social, and personal support. (p. 42) Developing an FPM/DSS system to meet these demands represents a true
challenge both conceptually and technically. The need for such systems is apparent.
Visionary institutions have shown that the creation of effective DSS systems to support
student persistence programs is definitely possible. There still exists great opportunities
to fill in the gap for analyzing both student and faculty performance as influencers with
student persistence. Faculty members find that access to quality performance data can be
highly inconsistent and often piecemeal, depending upon the institution and systems
available.
Pompper (2006) observed,
Nearly half (40%) of faculty and staff respondents reported that they primarily consult memoranda to obtain information needed to answer students' questions and to advise them, while 28% said that they use email, 20% said they walk to the appropriate office for face-to-face meetings, and 12% reported that they pick up the telephone to call someone who has the information they seek. (p. 34)
To make more effective decisions, it is necessary to provide decision makers with data
which is accurate, consistent, and clearly identifies forces that influence the outcome of
the decision. To increase organizational and faculty response to student persistence

36
concerns, it is necessary to provide faculty with the key tools (data) that assist in raising
student confidence, security, and success.
As McArthur (2005) noted,
Faculty members represent the authority figure, the mentor, and the role model that may not appear anywhere else in the student's life. Because the faculty members are in such a position, their influence over students can be very significant. In a frequently cited study of student retention, Astin (1993) concluded, "Next to peer group, the faculty represents the most significant aspect of the student's undergraduate development" (p. 410). Studies of transfer students (Volkwein, King, & Terenzini, 1986) and freshman students (Pascarella & Terenzini, 1977) confirmed the importance of student-faculty contact as an influential factor in student achievement, persistence, academic skill development, and personal development. (p. 2)
Faculty Performance Measurement
Faculty performance measurement has evolved to become increasingly more
focused upon instructional quality than other scholarly activities such as publication or
academic governance. There has been a fundamental shift in the perceived role students
represent within an institution. The view of students as “consumers” of education has led
institutions to reevaluate traditional roles and institutional priorities where exceptional
customer service is reflected through high-quality curriculum and instruction. This
evolution for faculty performance measurement represents a significant departure from
past institutional practices.
An example of faculty performance measurement as it was done in the past is a
survey designed by Adams (2003) which was administered to 148 institutions with a total
of 109 responses from senior faculty administrators to place in rank order faculty
activities that would be important in performance evaluation. The top ranking items noted
for advancement were publishing books and articles that advanced the candidate’s field
37
(Adams, p.245). The development of grants and other external contract opportunities
placed third. It is interesting to note that only 2 criteria out of 11 are related to quality of
instruction, teaching awards or nominations, which placed fourth, and favorable written
student teaching evaluations, which placed fifth (p. 245). The top two criteria indicate
that the quantity and quality of research or other scholarly products rank highest in
faculty performance evaluation with community service ranking second.
Blanton et al. (2006) identified five approaches commonly used in evaluating
faculty performance (p. 116). Of the five approaches, survey instruments were found to
have certain positive and negative traits as a form of student evaluation of teaching
(SET). As far as representations of teacher quality through large-scale surveys, Blanton et
al. found that utility is a definite strength meaning that surveys are widely used for SET.
Survey instruments also ranked highly for generality, soundness, and practicality as a
means of collecting student feedback. As for weaknesses, survey credibility and
comprehensiveness were identified as major concerns (Blanton et al.).
Jones (2006) made an important observation that
School leaders in some data-driven schools have become fixated on one number or one set of numbers standardized tests to judge the quality of their instructional program. Social science are trying to imitate the natural science by using quantitative sources to identify the causes and solutions of human problems. (p. 13)
Legitimate questions arise as to whether the right data are being obtained. Are data
accurate? Are appropriate factors being measured that truly relate to quality of
instruction? One argument holds that educational leaders need to, “stop looking at the
38
data, no matter how beguiling its calls, and start looking in the classrooms” (Jones, p. 17).
A major factor influencing survey credibility is the level of internal validity the
instrument reflects.
Three major areas of concern associated with internal validity involve
spuriousness, double-barreled, and confusing questions (Engelland, 2004). Spurious
statements are those that at face value have little or nothing related to the phenomena
being measured. Statements such as, “The course content is consistent with my prior
expectations,” have no correlation with faculty performance (Engelland, p. 42). Many
instruments have been found to include double-barreled questions rolling two or more
questions into one response.
For example, “The assignments were appropriate in amount and level”
(Engelland, 2004, p.42). This statement mixes two very distinct dimensions: the volume
of work being assigned and the degree of complexity of those assignments. Volume of
work and the degree of complexity should be measured separately. Confusing questions
are those that provide little focus as to what inferences can be made from a response. A
question asking if the student was challenged by a course does not provide clear
distinction as to whether being challenged is a direct reflection upon faculty teaching
performance. Engelland provided an important insight,
A well-rounded assessment of teaching performance requires authentic assessment to determine if students learned what was intended, student self-assessment to determine student satisfaction with their own performance, and student evaluation of teaching to determine student satisfaction with the quality of the teaching they receive. (p. 45)
39
Another concern for survey instrument credibility in SET lies with external
viability, or generalizeability of survey findings. Significant concerns arise when
attempting to use generalized survey instruments as a primary measure for faculty
effectiveness. Two major factors influencing external validity are response rates along
with improved internal validity through the isolation of extraneous variables. Typically,
response rates for SET survey instruments are relatively low, often representing less than
fifty percent of students in attendance. Richardson concluded that higher response rates
of 60% are more desirable for they may reduce the influence of outliers such as student
grade performance (Richardson, 2005). Thus it might be asserted that higher response
rates lead towards greater confidence levels in an instrument’s external validity.
External validity can also be influenced by ensuring the SET instrument focuses
upon relevant educational measures of instruction that provides for the isolation of
extraneous variables such as,
perceived fairness of the instructor, timing of the administration of the SEI (student evaluation of instruction), the amount and difficulty of work required in the course, student motivation and interest in the course, perceived leniency of grading, size of class, students’ ability level, and the gender of either the faculty member or the student. (Baldwin & Blattner, 2003, para. 9) As far as the designation and classification of appropriate data to be used when
assessing faculty quality performance, institutions are best served if SET instruments
focused upon objective data that can provide faculty and administration with feedback
that can guide actual improvement of teaching performance (Engelland, 2004). “For
instance, Marsh (1984, 1987) identified nine dimensions, including learning/value,
enthusiasm, organization, group interaction, individual rapport, breadth of coverage,
40
examination/grading, assignments, and workload/difficulty” (Engelland, p. 40). for SET
evaluation to be effective it is important to take into consideration of variables such as
“age, year in school, major, GPA, expected grade in course, and measured aptitude are
student characteristics that significantly correlate with SET scores” (Engelland, p. 41). To
raise appreciation and actual use of SET feedback, faculty and institutions must see real
value in the measures. As Centra indicated, “First, teachers must learn something new
from them. Second, they must understand how to make improvements. And, finally,
teachers must be motivated to make improvements, either intrinsically or extrinsically”
(as cited in Hobson & Talbot, 2001, para. 10).
Another factor potentially influencing faculty/administration acceptance and use
of FPM/DSS may be attributed to application complexity. There are several works
within DSS literature that have identified considerable discrepancies between personal
decision making (PDM) and available computer-assisted DSS (Klein, 2005; Lee, 1989;
Power, 2002; Remus & Kotteman, 1986; Sprague & Carlson, 1982). Obstacles such as
FPM/DSS complexity along with end user reluctance to embrace automated DSS have
led toward restricted system implementations that were, “limited to highly quantitative
areas such as measuring the effectiveness of promotion pricing” (Davenport & Harris,
2005, para. 3). Tool complexity can be greatly reduced if prior to the application of any
DSS development a decision-oriented diagnosis be performed first (Power, 2002). The
developer must clearly identify current practices, tools, and data used for faculty
performance measurement. A developmental eye must focus upon data collection,
collation, manipulation, and output from the end users’ perspective (administration,
41
faculty, and students). Application complexity can be overcome with time and training if
the tool has been designed from the intuitive end users’ perspective. End-user
development is a controversial approach in system development. Despite controversy, it
is important to acknowledge the value end user perspectives bring in creating a decisional
context for which FPM/DSS must support. Final judgments in end user acceptance and
overall system effectiveness come down to how well the DSS aligns with the decisional
needs of administration and faculty.
FPM/DSS represent a form of data analysis, data-driven DSS application. As
Power (2002) indicates, data-driven DSS provide the greatest opportunities for enhancing
the decision making process given that the manipulation of massive amounts of historical
data allows for comprehensive what-if analysis. The development and use of FPM/DSS
systems must be approached with a firm understanding as to what data within these
systems represent.
The problem arises when considering causality versus providing a generalized
account of possible outcomes.
To answer them (causal linkages) with any degree of empirical certainty, the procedures used to evaluate such initiatives must meet certain methodological standards. Additionally, the findings must be subject to test determining whether they are statistically significant, or whether they could have occurred simply by chance. (Stinchcomb, 2006, p.78)
The validity of inferential data, then, becomes extremely difficult to ensure.
As Stinchcomb (2006) observed, “For such reason, descriptive statistics are much
more prevalent than inferential outcomes as decision-making tools” (p. 78). Descriptive
statistics are used to better portray the existing nature of observed events. Descriptive
42
statistics, “offer valuable insights into patterns and trends that can guide informed
decision-making” (p. 78).
The validity of targeting, collecting, and collating descriptive statistical data are,
as Hobson and Talbot (2001) noted, “based on the belief that instructor effectiveness
should correlate with the amount learned by students” (para. 23). The challenge then
becomes the identification of appropriate data that leads towards a better understanding
the nature of factors that influence instructional quality and student learning. While
FPM/DSS applications can possess great promise, there are significant concerns that must
be addressed when designing and implementing these applications.
Decision Making and Decision Support
Determining an accurate interpretation of any given decisional context is a
daunting task at best.
After nearly two decades of advancements in information technology, the real nature of information system requirements is not well understood. The issue is further complicated by the realization that managers’ needs and the needs of other “knowledge workers’ with which they interact are heavily interdependent. The DSS philosophy and approach has already shed some light on this issue by emphasizing “capabilities”–the ability for a decision maker to do things with an information system–rather than just “information needs”. (Sprague & Carlson, 1982, p. 36)
This is not to say that a framework for conceptualizing the decision making process is
unattainable. Understanding decision-making involves the breakdown of decisional
processes (steps) that decision makers go through to arrive at a conclusion. A primary
concern arises in that not all decision environments are structured or definable. Power
(2002) observed that managerial problem-solving is not always a “deliberate, coherent,
and continuous decision-making process” (p.37). Executive decision-making is a
43
dynamic phenomenon where a variety of fragmented activities lead to a decision.
Successful DSS design is highly dependant upon the developer’s ability to reconcile the
highly unstructured nature of human decision-making with the highly structured physical
limitations of hardware/software capabilities. Some have argued that the future of DSS is
highly questionable given the developers require a definable context in which to guide
programming objectives.
Developing a fixed standard framework for decision making has been a challenge
given that decision problems are often complex, dynamic, and dependent upon an
intricate combination of structured and unstructured data. When considering issues such
as student course drop rates, there are several factors both structured and unstructured
that influences a student’s decision to drop (Bosshardt, 2004; McArthur, 2005; Pompper,
2006). The identification of a well-defined decision process could enhance a faculty
member’s ability to respond to unique student needs.
Decision theorists such as Herbert Simon have provided foundational concepts
that have led towards the development of such basic decision process models. Morton
(1971) observed,
It is important to have some framework in which to think of management decision making, otherwise we cannot assess the impact of computers so far. Nor can we predict the future development of the framework of computers and their use in the actual process of decision making. (p. 7)
Morton, building upon the work of Simon, proposed a framework that places decisions
into the categories of being either structured or unstructured in nature. Morton then
applied Simon’s phased decision process model of Intelligence, Design, and Choice to
create an overall framework for decision analysis.
44
Morton (1971) wrote,
The decision-making process can be thought of as being divided into three major phases: (1) Intelligence, or the search for problems; (2) Design, or the invention of solutions; and (3) Choice, or the selection of a course of action. Each of these major phases has three subphases; (a) Generation of input data; (b) Manipulation of the data; and (c) Selection for the following phase. This framework applies equally to programmed decisions (those that are well-structured) and nonprogrammed decisions (Decisions that are ill-structured). (p. 35) Morton’s adaptation of Simon’s decision process model is important because it
provides a framework that can be applied towards both structured (i.e., GPA, CDR) and
unstructured data (i.e., student efficacy, faculty/student relationship). The generation,
manipulation, and selection of both structured and unstructured data lead towards the
creation of knowledge. Davenport and Prusak (2000) provided as to the role of
knowledge within the organization,
Once found, someone must evaluate the knowledge to assess its usefulness and importance to the organization, and to determine what kind of knowledge it is. Is it the rich, tacit, intuitive knowledge of a seasoned expert, or is it rule-based, schematic, explicit knowledge (or something in between)? (p. 69) As implied above, tacit knowledge carries with it the sense of experiential
development and evolutionary learning. The collection of explicit data concerning
student drop rates, GPA, and SET can be used in conjunction with faculty tacit
knowledge (experience) to better understand factors influencing student success. An
FPM/DSS tool can provide the ability to merge both tacit and explicit knowledge that
could support enhanced faculty-student interaction. The tacit knowledge held by the
faculty member can be a powerful tool in helping students remain on track continuing
their studies. A good example for the power of tacit knowledge can be seen in project
45
management studies. For instance, the art of project management relies heavily upon tacit
knowledge. One of the more powerful statements by Meredith & Mantel (2003) noted,
Models do not make decisions–people do. The manager, not the model, bears responsibility for the decision. The manager may “delegate” the task of making the decision to a model, but the responsibility cannot be abdicated…All models, however sophisticated are only partial representations of reality they are meant to reflect. Reality is far too complex for us to capture more than a small fraction of it in any model. Therefore, no model can yield an optimal decision except within its own, possibly inadequate, framework. (p. 44) The nature and extent of planning in daily lives has a tremendous effect on the
potential for success. To change a certain behavior, the decision maker must be able to
recognize the behavior. One cannot control the change of what one cannot perceive. An
FPM/DSS application could provide faculty members with a real time view of data that
could be used to refine instructional preparation and classroom interaction. For instance,
if a faculty member were to find that they have an extremely low cumulative GPA for
grades issued, then it could be possible to consider why student performance might be
less than expected (i.e., subject matter, course rigor, student preparation along with
motivation, etc.). Such knowledge might lead to redesigning assignments, lectures, and/or
exams to respond to shifting factors that may influence student success. Effective
decision making, then, relies upon the thoughtful integration of both tacit (unstructured)
and explicit (structured) knowledge. Keskin (2005) noted,
Tacit knowledge and explicit knowledge complete each other; and they are important components of KM (knowledge management) approaches in organizations (Beijerse, 1999). Serban and Luan (2002), note that KM can be identified as systematic and organized approaches that ultimately lead organizations to create new knowledge, which can manipulate both tacit and explicit knowledge and use their advantages. (p. 170)

46
Effective decision making, then, is reliant upon the decision maker’s ability to
manipulate, reconcile, and synthesize structured and unstructured data to derive a better
solution.
Structured data are transactional in nature. The calculation of income tax is a
prime example of structured data. Income values, deductions, allowances, tax rates are all
pre-established. Educational structured data includes student grade performance, student
drop rates, typically any data that can be accurately identified, isolated, and quantified.
Structured data represent explicit knowledge. Explicit knowledge is finite, definable, and
tangible. Decisions based upon structured data are often the result of set practices,
policies, and procedures which can be easily programmed within a transactional
processing system (TPS) such as processing student transcripts. Explicit knowledge
within the classroom can be observed through specific tangible items such as student test
scores, assignments, and overall grade point average performance.
Unstructured data provide a greater challenge. Unstructured data represent tacit
knowledge. Tacit knowledge is abstract, undefined, and intangible. Decisions based upon
unstructured data often involve highly subjective associations created by the decision
maker. Decisions such as curriculum development, or essay test evaluation involve a
highly sophisticated intuitive sense of tacit knowledge. Knowledge in these cases takes
the form of instructional experience which qualitatively accumulates over the years.
Faculty use tacit knowledge developed from years of experience in assessing student
learning. Faculty constantly observe student interactions within the classroom to gauge
the level of student comprehension and degree of subject mastery. The challenge remains,
47
how does one program unstructured, tacit knowledge within a system that relies upon an
explicit universe?
According to Morton (1971), a DSS potentially has a high impact in the areas of
data manipulation and selection during the Intelligence phase of decision making (i.e.
running date ranges for faculty GPA and CDR). The Intelligence phase of decision
making is where the decision maker establishes the context, structure, and boundaries of
the decision issue. Bottlenecks can easily develop in the decision process during the
Intelligence phase given the extremely large amounts of data involved (Morton, p. 55). A
DSS has a high impact due to the inherent ability to perform massive computation within
relatively short time period. An FPM/DSS could provide faculty with a wide array of data
that spans a significant amount of time. Computational power, albeit important, is still
grounded in explicit knowledge.
Morton’s framework reflects a low impact for DSS in the generation and input of
data because the decision maker must first use tacit knowledge to codify data. Data
capture, then becomes a mere transactional operation such as the collection of SET
through an online survey.
The Design phase of the decision process, or invention of solutions, is where the
DSS can take a more prominent role. A good example can be seen in current modeling
software where multiple scenarios can be played out through what-if analysis using both
available and hypothetical data. A faculty member might review the nature and degree of
student evaluations as a tool to guide future instructional choices. For instance, should
student evaluations indicate that assignments are too challenging, the instructor might
48
experiment with more in class examples and activities targeting areas of student concern.
The DSS can have a medium impact during the generation sub-phase in the
implementation of a specific design strategy. The FPM/DSS can provide solid explicit
data concerning student drops rates. A well designed FPM/DSS could also provide a
series of model responses based upon manipulation of what-if analysis factors. The
generation and implementation of specific alternative strategies beyond the FPM/DSS
ultimately resides with the decision maker.
The Choice, or selection of a specific course of action, is where the DSS may
provide the greatest value; the selection of a course of action based upon a, “comparison
of multidimensional alternatives” (Morton, 1971, p. 55). The Choice function of decision
theory is where faculty could possibly have the greatest impact in attempting to engineer
a richer learning environment where students are more inspired to remain dedicated to
their studies. Manipulation and Selection become moot at this point, because decision
focus shifts using the comparative output of the DSS in conjunction with the intuitive
tacit knowledge within the decision maker to implement a chosen solution.
Developing a decision framework for DSS design was not the only objective for
Morton. Morton (1971) saw, early on, the potential DSS could have for the organization.
“It is even less possible for the organization itself to benefits from the accumulated
wisdom of it managers since so much of their knowledge is never made explicit and
hence cannot be “learned” by the organization” (p. 145). Morton envisioned the
development of an adaptive DSS system that “learns” as decision makers utilized the
application. “The system would recognize the patterns of problem-solving behavior by its
49
users, and when it came across a problem that had occurred before, it could interrupt the
user to suggest to him an appropriate solution based on it past experience” (p. 152).
Morton’s work became the foundation for many of the developmental principles for
expert systems and artificial intelligence (AI). It is conceivable that an FPM/DSS
containing the ability to draw associations between variables such as student drop rates,
GPA, and SET could also provide an early warning capability for students who are at-risk
for dropping their course. The ability to recommend sound alternatives relies heavily
upon the validity of data along with an accurate interpretation of data correlations.
The Value of Information within Decision Making
Sound decision making relies upon the availability of quality data that provides
insight into both tacit and explicit decision factors (Remus & Kottemann, 1986, p. 17).
An educational institution depends upon sound decision-making practices to provide a
consistent quality learning environment. Current collection and use of institutional data
are varied covering areas such as enrollment pattern, program growth, to student
diversity. Deriving a sound decisional context striving for reduced student course drop
rates is challenging in a diverse data environment given the potential for a lack of data
focus. Institutions must clearly identify data relationships to achieve system and
decisional focus. To target student drop rates through faculty performance measurement,
institutions must truly understand the links between these two elements. This study was a
test of the potential link between faculty performance measurement and student
persistence. Once understood, DSS design can be focused.
50
DSSs have evolved to serve as a valuable tool in augmenting the decisional
process. “During the past four decades, computers have been successfully applied to
structured tasks. However, the highest payoff the computer can make is not in transaction
processing, but in decision-making” (Lee, 1989, p. 123).
There has been great developmental debate in balancing the two roles of
transactional DSS (efficiency) with the decisional DSS (effectiveness). To support
enhanced decision making, it becomes necessary to reconcile the function of computer
automation processing with human cognitive processing (Lee, 1989). The massive
availability of information both internally and externally has made it more difficult to
identify valuable data (Cody, Kreulin, Krishna, & Spangler, 2002). A DSS brings the
advantages of collection, collation, and aggregation with relative speed and accuracy,
which provides for enhanced efficiency. These advantages must also be in alignment with
the preservation of data quality to support more effective decision making.
The development of business intelligence (BI) and subsequent knowledge
management (KM) are not replacements for human cognition. They are available
resources for the decision maker to generate a more informed decision. DSS utilizes
model management to address semi-structured and/or structured decision-making.
A model is a representation of some event, fact, or situation. Businesses use models to represent variables and their relationships. For example, you would use a statistical model called analysis of variance to determine whether newspaper, television, and billboard advertising are equally effective in increasing sales. (Haag, Cummings &, McCubbrey, 2004, p. 186)
51
The application of models and other decisional paradigms toward decision-making tasks
allows greater flexibility in DSS performance alignment with the decisional environment.
Alter (2002), a DSS pioneer, made an important statement regarding the future of DSS,
DSS was once a revolutionary idea, but in the intervening decades the original issues that led to the DSS movement have receded to ancient history. Declaring victory on the initial DSS agenda raises questions about whether DSS today is anything other than an umbrella term for disparate types of systems whose main commonality involves overlapping interests of researchers rather than substantive characteristics of the systems themselves. (p. 150) Alter’s theory is that researchers have spent far too much time in considering the
mechanisms of decision science, rather than the analyzing the foundation of sound
decisions (Alter, 2002). Alter’s call for analytical focus to shift away from systems
towards first developing a better understanding of the decisional process resurrected the
concept of information economics introduced by Andrus in 1971.
Information economics is the study of the value or worth of information. As R.R.
Andrus related, “The value of information increases as (1) the format, language, and
degree of detail approach the desire of the user; (2) the ease and right of access increases;
and (3) the time of acquisition approaches the time of use (p.43)” (as cited in Keen &
Morton, 1978, p. 44). Sound decision-making, then, can be enhanced through controlled
format, language, and detail manipulations that better align data with the cognitive
perspective of the decision maker. An important element missing from Andrus’s model
are end user concerns with data validity. A major factor influencing end user acceptance
of DSS outputs is their belief that data are accurate and valid. As Write (2006) noted,
“despite the widespread use of data from student evaluations for the purpose of
determining faculty teaching effectiveness, a review of the literature in the areas indicates
52
that issues concerning the validity and usefulness of such evaluations remain unresolved”
(p. 417).
Should data be perceived as internally valid, the provision of an FPM/DSS tool
could enhance faculty abilities in reviewing and comparing past performance indicators
with current data. A DSS has high impact in the manipulation and selection of
unstructured data, as noted within Morton’s decision making framework, which supports
Andrus’ concept of increasing information value through precise data manipulation.
Quantifying the value of information after such manipulations could be extremely
difficult given the highly personalized nature of the decision making process. While
worth may be difficult to quantify, it is apparent that effective DSS design relies upon our
ability to truly understand the foundation of sound decisions. Developers must be able to
understand how decisions are really made in the environment.
Alter (1980) built upon Keen and Morton’s concept in improving personal
effectiveness through the identification of five specific areas where a DSS could enhance
decision making (Alter, p. 95). First, if properly aligned, a DSS can enhance personal
efficiency through broader data access along with rapid manipulation of massive data
stores. Secondly, DSS provides for expedited problem solving. Expedited problem
solving could be conceivable using Morton’s decisional framework, given the high DSS
impact upon the creation decision alternatives along with generation decision choice
criteria when working with unstructured data. In addition, DSS environments often
provide for a centralized repository of data, which would have been previously scattered
throughout the organization. Thirdly, Alter held that developing a DSS facilitates
53
interpersonal communication in that managers must come to an agreement as to what
reports are needed, along with a shared vision of what information is valuable.
A fourth enhancement for increased personal effectiveness is realized through the
promotion of learning or continued training. As decision makers continue to use DSS
models, new opportunities for insight and understanding are ever present. This fourth
dimension, increased personal effectiveness, is where the creation of an FPM/DSS can
have the greatest impact in guiding faculty self-improvement. The dynamics in achieving
performance above and beyond expectations involves a heightened sense of self-
concept/self-efficacy (Bass & Riggio, 2006). Enhanced self-efficacy leads toward a
desire to perform at higher levels for the greater good and the sense of accomplishment
that follows exceptional action.
Finally, Alter (1980) maintained that DSS increase personal effectiveness through
the imposition of increased organizational control. “One of the results of bringing up our
distributed inventory control system is that literally hundreds of usable spare parts have
come out of the woodwork in many sites. We had a significant saving by just shifting
spare parts instead of buying new ones” (Alter, p. 96).
Goals for Enhanced Decision Making
Decision makers will assess the value of a DSS application based upon how
closely the tool aligns with decisional needs and context. In the case of FPM/DSS
development, the overriding focus should be upon the identification of data that provide
an accurate and genuine assessment of faculty performance. Focusing upon the nature of
the decisions requires that to truly achieve enhanced decision making, DSS must be able
54
to not only support all levels of decisions, but also provide integration of information at
all levels. Overall, an FPM/DSS should provide faculty with the ability to observe data
patterns over time as a resource in guiding self-leadership and development.
Faculty motivation has a great influence over the success or failure of any
FPM/DSS. Li et al. (2006) published a unique study that utilized self-determination
theory (SDT) as related to motivation. SDT identifies two basic forms of motivation:
intrinsic and extrinsic. “Intrinsic motivation is defined as the drive to be doing and
activity (e.g., develop OSS) because of the inner satisfaction achieved from it rather than
to get a desired result…Extrinsic motivation can be perceived as the drive to take actions
to attain externally administered rewards, including career, prestige and positive
evaluations from others” (p. 35). Professional educators, by their very nature, tend to
align with intrinsic motivation and inner gratification.
Enhanced decisions are reliant upon the understanding that problems and issues
within various levels of the institution (student performance, faculty performance, quality
of curriculum, organizational responsiveness to stakeholders) are all unique, yet
interconnected (Sprague & Carlson, 1982). Power (2002) added that multiple levels of
decision support not only exist, but also stand as one of the greater barriers restricting
enhanced decision making. “Today, many companies have fragmented and isolated
decision support capabilities that are hard to use and hard to access” (Power, p. 21).
Power (2002) argued that for enhanced decision making a DSS must: (a) improve
individual productivity, (b) improve decision quality while also speeding-up problem
solving, (c) improve interpersonal communications, (d) improve decision making skills,

55
and finally, (e) increase organizational control (p. 32). Power also noted that while a DSS
may provide for an enhanced decision support, ultimately users define the nature of their
decision environment through either acceptance or rejection of the DSS. Power identified
several factors that might influence end user DSS acceptance (p. 34). Firstly, the
individual may have limited or insufficient computer training. Secondly, some
individuals might perceive the use of DSS as a loss of status requiring more clerical,
rather than, managerial duties. Thirdly, Power noted that using a DSS might simply not
fit the decisional style of the manager. Fourthly, the DSS might not work with the
manager’s work habits in conducting verbal and non verbal communication. A fifthly
factor for user rejection might be based upon a poorly developed DSS. A sixth
consideration is that a few managers might consider the extensive time and expense
associated with DSS development to be too costly for justification. A seventh factor
involves information overload. “Information overload is a major problem for people,
managers already receive too much information, and many DSS increase the overload”
(p. 35). For truly enhanced decision making, one should consider all seven of these
factors. An important element missing from Power’s model for enhanced decision
making is again the concept of end user faith in the data. Faculty members are high-level
knowledge workers where an FPM/DSS might be considered a tool of reactive
management-by-exception.
As Li et al. (2006) observed,
Passive management by exception–typified by a reactive intervention by the leader only when things go wrong or when problems occur [10]–could have a negative impact on both forms of extrinsic motivation. Such inactiveness in scanning for potential problems and delayed provision of feedbacks could
56
discourage developers who are very keen to improve their skills or to get recognition from the peers to boost their self-esteem. (p. 36)
A General Decision Process Model
Power (2002) made an important point in that, “Decision making is more than
deciding. Each of the steps in the decision process is important; each step can cause
errors and each can potentially be supported by some type of computerized decision aid”
(p. 45). As previously discussed, effective decision making is reliant upon the decision
maker’s ability to manipulate, reconcile, and synthesize structured and unstructured data
toward a better solution. Adding Simon’s stages of intelligence design, and choice, the
decision can be viewed as a process of specific activities of data collection, manipulation,
and alternative solution development. Sprague and Carlson’s work adds the important
realization that the decisional context (strategic planning, management control,
operational control, or operational performance) have a great influence in determining an
appropriate decision process.
To minimize errors and provide enhanced decision making, Power (2002)
provided a general decision process model (p. 46). The first task is to define the problem.
This first stage is crucial in determining the scope and focus for the decisional issue.
Once a problem is properly framed (i.e., student preparation for subject matter versus
inherent course rigor), then the decision process adjusts to a specific decisional flow. The
second stage of Power’s framework calls for the identification of who within the
organization is the most appropriate choice for final decisional control. Will the decision
process be participative or top-down? Who shall determine solution criteria? These
57
questions highlight the importance in understand human engineering for the decision
climate has a definite influence over the decision process.
The third stage is to collect data. As data are being collected, the decision maker
has the ability to identify and evaluate alternatives, which in turn iteratively guides the
data collection process. The fourth step then is to decide upon a decision path that is to
be implemented. Once implemented, outcomes are evaluated as compared with original
intent established in the first phase.
As Power (2002) related, “Many managers feel that a well-defined problem is
much easier to solve and that problem definition reduces the chances of having a good
answer to the wrong problem. When the wrong problem is defined, it is impossible to
make a successful decision” (p.46).
In the case of faculty performance, Power’s decision process model provides a
good frame for faculty self-evaluation and potential instructional calibration. The
collection of information is then guided by the problem frame along with priorities
identified by the final decision maker. Power expresses that the identification and
evaluation of alternatives is the most creative part of the decision making process
(Defined in Morton’s framework as Choice) (Morton, 1971; Power, 2002). It is during
this stage that decision makers can use qualitative, quantitative, and/or mixed methods to
prioritize, weigh, and assess potential decision avenues.
Faculty can utilize FPM/DSS tools as an import feedback mechanism that guides
and supports self-calibration of effort and action. Referring back to Morton’s decision
framework, the DSS is extremely useful in the generation of multiple scenarios within an
58
unstructured data environment. Intuitive manipulation and final decision selection remain
with the decision maker. In other words, while a DSS may be extremely powerful in
quickly generating models for what-if analysis, these models are reliant upon finite data
and explicit definition of variable relationships.
To decide, or select, a decision is, “to commit to a course of action or inaction”
(Power, 2002, p. 47). The commitment to a specific course of action is part science, part
wizardry. “In decision situations with ample time to collect information and evaluate
alternatives, the decision is not forced and the result may be a more thoughtful decision
or in a worst case a delayed and postponed decision” (p. 47). In a fast-paced
hypercompetitive world decision makers are finding that many crucial decisions must be
made with relative speed along with steadfast commitment to have any real positive
affect. Thus, the implementation becomes the physical manifestation of action to bring
forth desired outcomes. As with any project implementation, Power noted, the decision
maker follows action with an evaluation of consequences.
Power’s decision process model provides a general framework where decision
quality can be studied. The main objective for a well defined decision framework is to be
able to ultimately yield good decisions. Good decisions are the ones that resolve the
problem identified. Not all decisions have this intended outcome. No decision maker
always makes the right decision. Factors that are unforeseeable, or over which the
decision maker has no control, ensure that some wrong decisions are made (Power, 2002,
p. 48).
59
The creation of an FPM/DSS represents a needed extension and evolution of
decision support system theory and application. There are a great many cases where DSS
tools are used for specific decisions that result in specific actions. In seeking to address
faculty performance measurement, there are many factors that intertwine beyond a
specific identifiable decision. Performance is an evolutionary force that represents a
constantly shifting dynamic both within the individual and within their environment. The
goals for a performance-based DSS could extend beyond a single decision. An FPM/DSS
tool could provide a means to track and potentially adjust several factors that could lead
toward enhanced performance.
Decision Support System Design
In defining DSS, Power (2002) acknowledged two early DSS pioneers, According to Sprague and Carlson (1982), “DSS comprise a class of information system that that draws on transaction processing systems and interacts with other parts of the overall information system to support the decision-making activities of managers and other knowledge workers in organizations (p.9). Decision Support Systems are defined broadly in this book as interactive computer-based systems that help people use computer communications, data, documents, knowledge, and models to solve problems and make decisions. DSS are ancillary or auxiliary systems; they are not intended to replace skilled decision makers”. (p. 1) Complex concerns such as student persistence represent an ideal environment
where DSS applications could greatly enhance decision maker control over available data
and subsequent issue analysis. Institutions have approached student persistence from
many different angles (i.e., student-focused, curriculum-focused, institution focused,
instructor focused) (Ashby, 2004; Herzog, 2005; Parmar & Trotter, 2004; Taylor, 2005).
Although a universally accepted comprehensive definition of decision making has not

60
been developed, our understanding of decisional forces greatly influences the potential
success or failure of any DSS.
Morton (1971) alluded to the future of DSS where systems not only support the
need for sound decisions, but also to assist the organization in developing an informed
awareness and control of the decisional process itself. As noted earlier, Simon’s three
stages of Intelligence, Design, and Choice have assisted in bringing focus to actual DSS
development. Effective DSS environments provide improved data capture, advanced
correlations and cross indexing. Sprague and Carlson (1982) believe that a, “DSS should
support all phases of the decision-making process” (p. 26). They proposed that Simon’s
stages of decision making (Intelligence, Design, and Choice) be used as guide when
considering DSS (Sprague & Carlson, p. 26). Sprague and Carlson (1982) also
maintained that:
• A DSS should provide support for decision making, but with emphasis on semistructured and unstructured decisions…
• A DSS should provide decision-making support for all levels, assisting in integration between levels whenever appropriate…
• A DSS should support decisions that are interdependent as well as those that are independent…
• DSS should support a variety of decision-making processes but not be dependent upon any one. Simon’s model, although widely accepted, is only one model of how decisions are actually made…
• Finally ad DSS should be easy to use. (p. 26)
Sprague, Carlson, Power, and Alter all offer the important observation that DSS design
must be flexible, adaptive, and suited for the decisional environment in which the DSS
must operate.
61
Evaluating Decision Support Systems
The evaluation of DSS applications requires the developer to be adept in both
complex system design along with possessing an intuitive understanding of the nuances
of divergent human cognitive styles. Although the evolution of DSS technology has
made advanced tools readily available, there still exists the need to bridge the gap
between technical capability and desired decision support (Alter, 1980, p. 191). To
gauge a DSS application’s effectiveness it is important to consider several system and
environmental factors.
First and foremost are the decision outputs (Keen & Morton, 1978). Consideration
must be given to the type of data required for reporting that supports enhanced decision
making. “DSS cannot just be plugged in; institutionalizing a system is an evolutionary
process that requires careful attention to the individual and organizational context” (Keen
& Morton, p. 99). Decision makers must clearly identify data criteria for monitoring and
capture. Once the nature and characteristics of tracking data has been identified, it is then
necessary to assign relative weights to data values that align with individual decision
priorities.
Complex decisions such as faculty performance evaluation also require a close
examination of changes in the decision process (Keen & Morton, 1978). While certain
data characteristics may remain static (i.e., attributes), the relationships between
independent and dependant variables are highly dynamic. Changes in the decision
maker’s perspective and/or priorities most definitely alter decision output. DSS
applications must support both rigid data definition while also allowing dynamic
62
relational data association. Ultimately a DSS application’s value is determined by the
decision maker’s assessment. “Evaluation of DSS thus requires measuring change and,
more particularly, “better” decisions. There can be no simple technique” (p. 215).
DSS applications may be significantly improved if assessed from both technical
and functional decision making perspectives. Sprague and Carlson provide an extremely
useful top-down four step DSS development framework that can be used as a guide for
system evaluation: the identification of overall objectives, general capabilities, specific
capabilities, and specific device features (hardware/software) that can be used to generate
decision output (Sprague & Carlson, 1982, p. 69). DSS evaluation should also address an
examination of the relative system impact upon the final decision output (Alter, 1980).
As Power (2002) related, a truly effective DSS must (a) improve individual productivity,
(b) improve decision quality while also “speeding-up” problem solving, (c) improve
interpersonal communications, (d) improve decision making skills, and finally, (e)
increase organizational control (p. 21).
A very common theme within DSS literature is that ideal systems should function
as an extension of the decision maker capability, where productivity and enhanced data
manipulation lead towards better solutions (Alter, 1980; Keen & Morton, 1978; Power,
2002). DSS system analysis is not complete without considering the data and
environment these applications support. Keen and Morton suggested that decision task
variables such as (a) accuracy of information, (b) level of detail, (c) time horizon, (d)
frequency of use, (e) sources of information, (f) scope of information, (g) type of
63
information, (h) currency or age of information all have a definite impact over DSS
performance and decision quality (Keen & Morton, p. 83).
Standard system development considerations such as amount of data, number of
actual system users, available infrastructure (hardware, software, and telecommunications
backbone), budget restrictions, and so forth also influence the effectiveness of any DSS
application. As with any solid system design, the ultimate goal is to provide an effective,
efficient, and meaningful tool for the decision maker.
A system that is perceived by the end user as cumbersome and counter-intuitive is
most likely to be left unused (Alter, 1980; Power, 2002). “The system is what it looks
like to the user; thus the software interface between the user and the underlying models
and data bases must be humanized. The likelihood of the decision-maker accepting the
DSS often depends on how it is presented through this interface” (Keen & Morton, 1978,
p. 99). For these reasons, The FPM/DSS interface must possess what Keen and Morton
term as, Communicability (Keen & Morton). Communicability is the ability for the
application interface to intuitively guide the end user to the functionality and information
they need.
In addition to intuitive design and ease of use, a solid FPM/DSS must be robust.
Robust systems are those that exhibit high system reliability and bombproof (resistant to
attacks and system crashes). For an FPM/DSS to be considered effective, it is important
to assess how well the system supports the subphases of data input generation, data
manipulation capabilities, and overall reporting features. Again, “The underlying issue,
64
therefore, is not can managers use such systems, but rather, when and under what
conditions are such systems useful” (Morton, 1971, xiii).
As stated earlier, it is first necessary to understand the nature of the processing
environment in which one wishes to support to move closer toward a better
developmental design. Morton (1971) had conducted several experimental observations
in developing his seminal work, Management Decision Systems. What truly set Morton’s
work apart comes from his observation that, “Traditional management Information
Systems have typically focused on generating data and reports for functional aspects of
business…Rarely are they deliberately designed to support significant managerial
decisions” (p. 130).
In approaching revolutionary management decision systems (MDS) design,
Morton’s experimental observations alluded that decision support systems could be
developed that go well beyond the capabilities of current transactional processing
systems. Morton held that to truly support complex significant managerial decisions, the
developer needs to have a firm appreciation for the actual decisional environment for
which they are developing. Morton proposed a very basic five-step framework to begin
the quest for decision process identification.
First, the definition and classification of decision objectives is necessary to
provide an overall guiding decision context. It is important to clearly define decision
goals, supporting objectives, along with the maintenance of a solid operational
foundation (Morton, 1971, p. 131). This first phase serves as the foundation and context
upon which a system must be developed.
65
Second, the developer must have a firm description of the current decision
process (Morton, 1971). Using Power’s general decision process model, it is possible to
develop a comprehensive decision flow model that assists in mapping explicit portion of
the decision process. Once decision flow has been identified, it could then be possible to
dive deeper into the process in an attempt to explore the more tacit and unstructured
nuances within the current decision process. Once an explicit and tacit mapping has been
achieved, the developer could then seek to create a, “definition of a normative (ideal)
model of the decision-making process” (p. 132). This phase proves to be the real
challenge in developing a versatile DSS. As expressed earlier, the decisional environment
is extremely fluid and dynamic. Consequently, developing an agile DSS requires the
development of a system that can be flexible enough to support multiple objectives, while
adhering to finite and explicitly defined application code structure.
The normative model needs to be compared with actual decision performance.
“The design criteria for the new system should be clear, as soon as the comparison has
been made. To be successful, the new design must move the decision process
substantially toward the normative model” (p. 132).
The final phase from Morton’s development framework is in, “building a
descriptive model of the manager’s decision-process using the new system” (p. 132). The
comparison of the new decision process model with the previous process allows the
developer to observe any significant changes between ideal and actual decision outcomes.
Morton strongly believed that this five step analysis of MDS design was essential if an
effective useful system was to be created.

66
In addition to understanding the nature of the decisional environment, Keen and
Morton (1978) added that the developer must also understand of the decision maker’s
perspective and decisional style.
The methodology used to develop a DSS is to work mainly from the manager’s perspective and accept his or her implicit definition of which components must be left to personal judgment. Frequently, of course, a manager’s perceptions will shift over time; the DSS, which automates certain parts of his or her existing process, may later help to identify other potentially structural subtasks. The designer should thus look for “semistructured” tasks. Where a decision process is fully structured, automation is feasible (at a price) and the traditional techniques of EDP and OR/MS are practicable. (p. 11)
The search for semistructured tasks serves as a solid developmental starting point for two
reasons. First, as Keen and Morton indicate, semistructured tasks by their very nature
tend to be less dynamic than a manger’s perception and much easier to isolate and
capture (i.e., data flow diagrams). Secondly, once structured and semi structured tasks are
identified; the developer would have created a fairly comprehensive and substantial
framework for the overall DSS application. The developer is then able to build upon this
framework seeking to better identify and codify support requirements for unstructured
tasks within the DSS.
Morton (1971) strongly believed that to accurately capture support requirements
for unstructured tasks, upper management must be actively involved.
The overriding necessity of having serious top management involvement and the full-time attention of a technically qualified individual who also has management breadth and experience. The managers involved in the decision, those for whom the system is being built, have to be actively involved in design, evaluation, and evolution. (p. 138)
The notion in attempting to gain more upper management involvement within initial DSS
design aligns with Alter’s point in that more attention must be spent in accurately

67
identifying the nature of the decision environment. Only the actual decision maker can
provide insight within the decision process and ultimately what could be deemed good
support for a good decision.
Developing a Behavioral Science Perspective within DSS Design
“Behavioral science is concerned with people–in organizations and small groups,
and as individuals” (Keen & Morton, 1978, p. 49). As mentioned earlier, a key
evolutionary shift within DSS design came when Alter and others emphasized that
developers need to look beyond basic data structures. To provide a system that can
effectively support a dynamic and highly complex decision-making environment,
developers must be intimately aware of the human aspect within the process. Human,
also known as social, engineering has now been acknowledged as an important
developmental factor influencing overall system performance. “There are many
documented cases where complex, innovative systems failed because of a lack of
attention to human engineering” (p. 51).
The behavioral science perspective takes into account the decision maker’s
priorities, needs, decisional style, along with actual steps and processes used in
developing a solution (p. 59). Human engineering not only provides for better DSS
alignment with actual decisional needs, the social focus also provides an opportunity to
overcome resistance to change through increased end user involvement within the design.
The phrase resistance to change is a common theme in management literature. By looking in detail at computer innovations as an organizational and social change process, behavioral research has highlighted the fact that resistance may not be pathological but a very reasonable response, that the technical change the computer represents is not necessarily desirable simply because it is change. Similarly, research on the differences in attitude, training, and personality of
68
managers and technical specialist has led to much clearer awareness of the importance of the user in systems development: personal needs, involvement, and “style” are all now recognized as major constraints on systems design. (Keen & Morton, 1978, p. 52) Multiple studies have shown that end user technology acceptance is highly
dependent upon the individual perception of value the system may or may not bring to
their work environment (Alter, 1980; Keen & Morton, 1978; Power, 2002). For a DSS to
be truly perceived as a value-added tool it must be supportive, flexible, provide fast
response, and easy to use (Keen & Morton). “The payoff is in extending the range and
capability of managers’ decision processes to help them improve their effectiveness”
(Keen & Morton, 1978, p. 2).
Decision Support System Taxonomy Evolution
When Morton first introduced the term Management Decision Systems (MDS),
the definition of decision support was extremely narrow, focusing on a very specific
classification of computer systems. Over the past forty years technology has evolved to
become many things to many people. Many systems can be classified as decision support
tools. Do these systems really embody the requirements of a true decision support tool?
Alter (1980) was one of the first to recognize the need for a definitive DSS
taxonomy.
It seemed important to develop a classification scheme to help in understanding which issues are relevant to most DSSs and which were relevant mainly to particular types of DSS…The taxonomy that eventually emerged is based on what can be called the “degree of action implication of system, outputs,” i.e., the degree to which the system’s output can directly determine the decision. (p. 73)
Alter’s use of output-based definition for DSS classification is important because it was
the first time that these types of systems were being considered based upon the nature of
69
information provided for decision making; rather than type of hardware and/or
application code. Alter suggested seven basic categories for the DSS taxonomy: File
drawer systems, Data analysis systems, Analysis of information systems, Accounting
models, Representational models, Optimization models, and Suggestion models (p. 74).
File drawer systems, as the name alludes, provide for instant data access at all
times. A good example for a file drawer system is a system that provides access to online
contracts, negotiated leases, and any information that would normally be filed. File
drawer systems are simple, provide fast access on an ad hoc basis and require little to no
development. This type of system is considered to be focused on operational functions
and data oriented (Alter, 1980).
Data analysis systems are those used to review and analyze current or historical
data. Like file drawer systems, data analysis systems provide for ad hoc analysis focusing
again on operational function with a heavy data orientation. Alter (1980) noted that there
are essentially two types of data analysis systems, tailored and generalized. Tailored
systems are designed for a specific analytical function or job tasks, where generalized
systems are less rigidly defined.
Data analysis systems emerged in response to the limitations found within highly
structured management information systems. “Although these systems could be used
conveniently to generate standard periodic reports, their requirements for consistency and
efficiency precluded the generation of management information relevant to decisions or
situations whose essential components varied over time” (p. 79). To overcome this
70
limitation, multiple decision-oriented databases are created that could allow for the
creation of small data models.
Accounting models utilize standard formulas and calculations that are well
defined within accountancy. These models are used for budget analysis, monthly
calculation, along with basic to advanced financial tracking (Alter, 1980). Accounting
models, for obvious reasons, are also considered functional and data-oriented.
Representational models are the first class of model-oriented, rather than data, DSS.
Model orientation focuses on planning and other higher level task requirements.
Representational models are primarily developed for, “estimating consequences of
particular actions” (p. 84). This form of DSS is extremely useful in developing budgets,
general planning, along with risk analysis.
Optimization models also live up to their name! This form of DSS, like
representational, is focused upon possible outcomes for the issue being considered, not
the data itself. Optimization models are extremely useful in long-range planning, material
and resource usage optimization, always calculating the optimal solution based upon
provided data. Suggestion models are DSS applications that provide suggested actions
based upon complex mathematics. Suggestion models are the precursor to Expert
systems. “In a sense, suggestion systems are even more structured that optimization
systems, since their output is pretty much the answer, rather than a way of viewing trade-
offs, the importance of constraints, and so on” (p. 86).
Alter’s taxonomy still serves today as the foundation for how DSS applications
are not only categorized but also developed. In a sense, Alter was among the first to
71
provide a developmental context for DSS design that could allow for better more closely
associated decision support tools. An essential element for effective Decision Support
Systems lies in how well the application aligns with the decisional need and environment
in which the system is implemented. For example, applying highly defined accounting
models to what-if analysis could provide a very narrow scope of financial analysis; where
the application of representational models could allow for much richer cost/benefit
analysis.
Power noted that Alter’s foundational taxonomy developed in 1980 was in need
of expansion to accommodate current technological evolution of DSS applications.
Power (2002) observed, “A broader framework than Alter’s is needed today because DSS
are much more diverse than when he conducted his research and proposed his taxonomy”
(p. 12). The rapid evolution of DSS systems had led to the emergence of several hybrid
applications that easily fits into several categories within Alter’s taxonomy. to update
Alter’s original work, Power added the following categories for DSS classification: Data-
driven DSS, Knowledge-driven DSS, Document-driven DSS, Communications and
Group-driven DSS, Inter-organizational and Intra-organizational DSS, Function-specific
or General purpose DSS, and finally Web-based DSS. The categorization of multiple
DSS allows for a more accurate designation of how systems are used to support unique
decisional environments.
Data-driven DSS applications are utilized in the analysis of large amounts of
unstructured data (p. 13). Data warehouse applications can be classified as Data-driven
DSS. As Power indicated, data-driven DSS provide the greatest opportunities for
72
enhancing the decision making process given that the manipulation of massive amounts
of historical data allows for comprehensive what-if analysis (Power).
What-if analysis and BI are generated through ad hoc data query and mining
techniques, such as Online Analytical Processing (OLAP) to yield a more
comprehensive understanding of core data required for decision making. While data
warehouses have potential, there are several important considerations that could affect a
successful application implementation. First, data warehouses are expensive, highly
complex, requiring professional-level support, and extremely difficult to implement.
Secondly, data-driven DSS applications, by their very definition, are designed for simple
data aggregation and calculation. Senior management must be very cautious when
interpreting, correlating, and extrapolating data-driven DSS output.
Knowledge-driven DSS are an ever-evolving area of technology that support core
KM and BI needs of organizations seeking sustainable competitive advantage.
Knowledge-driven DSS are heavily grounded in business rules and expert knowledge
databases. As Power expresses, “These DSS are person-computer systems with
specialized problem-solving expertise. The expertise consists of knowledge about a
particular domain, understanding of problems within that domain, and skill at solving
some of these problems” (Power, p. 13).
Document-driven DSS represent an emerging group of decision support
technology. Document-driven DSS applications provide organizations the tools necessary
to collect, store, organize, and retrieve massive amounts of business documentation and
core data. Document-driven DSS applications have become especially important given
73
increased regulatory demands organizations face such as Sarbanes-Oxley and the Health
Insurance Portability and Accountability Act of 1996 (HIPPA), which have established
corporate social and legal accountability when handling sensitive data.
Communication-driven and Group DSS as Power notes are a broader category of
DSS that encompasses many group decision opportunities that did not exist in 1980.
“This type of DSS includes communication, collaboration, and decision support
technologies that do not fit within those DSS types identified by Alter” (Power, 2002, p.
14). This form of DSS combines traditional communication technology such as
interactive video, email and messaging systems with advanced document sharing and
group collaboration applications. As Power indicated, these systems are highly
specialized and specifically designed to enhance predetermined areas of collaboration. If
planned appropriately, GDSS can have a tremendous impact on a group’s collaborative
production (Morton, 1971; Power, 2002; Sprague & Carlson, 1982).
Interorganizational or Intraorganizational DSS are applications that have emerged
through the evolution of internet technologies (Power, 2002). The rise or of both intra and
extranet technology have allowed significant advances in supply chain management
given that suppliers, producers, and consumers can substantively interact via systems
such as Electronic Data Interchange (EDI) and interactive purchasing applications. This
area of DSS also incorporates advanced Enterprise Resource Program (ERP) applications
that are designed to provide centralized access to information from multiple independent
systems such a Material Resource Programs (MRP), Customer Relationship Management
(CRM), along with Supply Chain Management (SCM).
74
Function-specific or general purpose DSS are, as the name alludes, designed for a
specific business functions and decision requirements. As Power (2002) related, “A task-
specific DSS has an important purpose in solving a routine or recurring decision task” (p.
15). Function-specific DSS applications have become increasingly popular given the
developmental efforts and accomplishments made by database applications as provided
by vendors such as Oracle, SAP, IBM, and Microsoft. Red Robin International provides
an excellent example of how function-specific DSS might be supported through advanced
data mining and electronic supply chain management (ESCM). The 75 corporate
restaurants use SQL Server 7.0 in conjunction with Cognos’ multidimensional OLAP,
PowerPlay (Watterson, 2001). Red Robin International utilizes 13 OLAP cubes to
organize data views ranging from financial data, hourly sales, labor costs, and promotion
(Jenkins, 2002). The implementation of OLAP cubes removed the need for ad hoc
reports. If a new report or measure is needed, then a new cube is created. The ability to
create cubes quickly and easily puts the end user in the driver’s seat (Jenkins, 2002).
Power introduced a new category to be added to Alter’s DSS Taxonomy, the
Web-based DSS. The rapid evolution of Web-based technologies such as markup
languages (i.e., html, dhtml, and xml) have allowed organizations to implement large
enterprise-level Web-based Intranets that extensively use browser, or client-based,
application interfaces for system and data access. “Today, Web technologies are powerful
tools for creating DSS and especially interorganizational DSS that support the decision
making of customers and suppliers. Web or Internet technologies are the leading edge for
building DSS” (Power, 2002, p. 15).
75
When attempting to approach a complex issue such as student persistence,
educational institutions might benefit from analyzing how leaders within the business
community apply principles of knowledge management through enhanced DSS
applications. Companies such as Xerox, Inc and Eureka provide a powerful example as to
how an organization can utilize Web-based KM technologies to raise competitive action
and enhance direct customer service. According to Davenport and Prusak (2000), KM has
four tasks:
(a) creating knowledge repositories where knowledge can be stored and retrieved easily; (b) enhancing a knowledge environment to conduct more effective knowledge creation, transfer, and use; (c) managing knowledge as an asset so as to increase the effective use of knowledge assets over time; and (d) improving knowledge access to facilitate its transfer between individuals. The knowledge access and transfer between individuals is part of knowledge usage and sharing. (as cited in Turban, King, Lee, & Viehland, 2004, p. 365)
The innovative Eureka system embodies each of these KM dimensions providing a
knowledge-sharing medium where Xerox engineers and repair technicians can quickly
and effectively service their clients.
Eureka’s greatest impact in knowledge sharing is through the provision of a
collaborative workflow environment (Turban et al., p. 325). As Turban et al. cite,
Ray Everett, program manager for Eureka describes the powerful impact the program has had on service: You went from not knowing how to fix something to being able to get the answer instantaneously. Even better, you could share any solution you found with your peers around the globe within a day, as opposed to the several weeks it used to take. (p. 366)
Xerox is able to provide clearly distinguished technical support through this strategic
collaborative KM system.
76
The Eureka system represents an extremely powerful Web-based Knowledge
Portal (Turban et al., 2004). “Corporate portals offer employees, business partners, and
customers an organized focal point for their interactions with the firm. Through the
portal, these people can have structured and personalized access to information across
large, multiple, and disparate enterprise information systems, as well as the Internet” ( p.
321). Xerox field professionals have full global access to technical specifications that
allowed for faster resolution times and overall improved service calls.
The Xerox knowledge portal effectively illustrates core elements found in such
EC collaborative systems. “Core knowledge management activities for companies doing
EC should include the following: identification, creation, capture and codification,
classification, distribution, utilization, and evolution of the knowledge needed to develop
products and partnerships” (p. 367).
Engineers and field professionals are able to gather new and unexpected
information with each service call which brings to the Eureka system a condition of
constant growth and evolution. This constant growth does not go unchecked. Xerox
provided an important check and balance where suggested solutions are evaluated and
tested for repeatability and technical validity (p. 366). Once validated, knowledge
distribution becomes a matter of simply publishing material to the KM portal.
It is important to note that while the EC medium may be new, the core technology
is not. The Eureka system reflects the qualities of a Group Decision Support System
(GDSS).
Group Decision Support Systems (GDSS) and groupware came first, but now a broader category of communication-driven DSS can be identified. This type of
77
DSS includes communication, collaboration, and decision support technologies that do not fit within those DSS types identified by Alter. Therefore, communication-driven DSS need to be identified as specific category of DSS. (Power, 2002, p. 14)
As Power indicated, these systems are highly specialized and specifically designed to
enhance predetermined areas of collaboration. If planned appropriately, GDSS can have a
tremendous impact on a group’s collaborative production (Morton, 1971; Power, 2002;
Sprague & Carlson, 1982).
Choosing a Developmental Approach for DSS Design
There exist several developmental approaches and methodologies that are
suggested for DSS design. A universally accepted model has not been established. Power
suggests, “If managers and DSS analysts understand the various methods, they can make
more informed and better choices when building or buying a specific DSS” (Power,
2002, p. 55). Using Power’s decision-oriented approach makes a great deal of sense
given that the methodology takes into account the specialized demands and requirements
for enhancing the decision making process.
Prior to the application of any DSS development it is generally agreed that it is
important to first conduct a decision-oriented diagnosis (Power, p. 57). Diagnosis of the
current decision making process provides for “the identification of problems or
opportunities for improvement in current decision behavior” (p. 57). The analyst must
clearly identify current practices and tools utilized in formulating key decisions.
A developmental eye must focus upon data collection, manipulation, and output
as related to decision making. Ultimately, a gap analysis must be made that identifies any
discrepancies between available resources and desired decisional outcomes. The intent of
78
this study is to address the decisional diagnosis gap that currently exists between the use
of faculty performance data in relation to student persistence patterns. It is highly
improbable that an institution could be able to construct a meaningful FPM/DSS without
first understanding how faculty performance data may be related with student persistence.
Once a decision-oriented diagnosis has been conducted, the developer must then
turn attention towards feasibility. A DSS feasibility study should identify technical,
operational, and economic considerations that impact system design, implementation, and
overall DSS performance. Power suggests that a basic DSS feasibility study should
include, at the very minimum, an executive summary (key business needs), background
and definitions (key questions and concerns), background needs assessment (goals,
constraints, decision support diagnosis), objectives, DSS scope and target users,
anticipated DSS impacts, and proposed solution (Power, 2002, p. 60).
Power noted that there are three major developmental approaches discussed in IS
and DSS circles, the systems development life cycle (SDLC), rapid prototyping, and end-
user development (Power, p. 61). The SDLC approach is comprised of seven major
phases: (a) confirm user requirements, (b) systems analysis, (c) system design, (d)
programming, (e) testing implementation, and (f) use/evaluation. The formal SDLC
approach makes a great deal of sense when considering the nature of DSS design. “The
development of a large, shared, enterprise-wide DSS is often an undertaking of great
complexity” (p. 62). Enterprise-wide DSS applications require a systematic approach in
their design. The SDLC is a strong systematic method that works well in complex
environments.
79
The rapid prototyping methodology was later developed based upon perceived
limitations of the SDLC (Power, 2002). These limitations primarily focused upon the
condition that the SDLC’s process could often become extremely lengthy as detailed end
user specifications were needed to proceed. Rapid prototyping allows the developer to
work with the end user in defining general requirements that can be used to create basic
prototypes of the eventual system. The prototyping approach adds a level of developer
and end user iteration that could lead towards faster system development. As Power
indicated rapid prototyping involves five distinct steps: “identify user requirements,
develop and test a first iteration DSS prototype, create the next iteration DSS prototype,
test the DSS prototype and return to step 3 if needed, and pilot testing, phased or full-
scale implementation” (p. 63).
End-user development is a controversial approach in DSS design. As Power
(2002) wrote, “End-user DSS development of complex DSS is much less desirable.
Managers are paid to manage, not to develop DSS” (p. 64). While Power’s observation
may hold for actual system and application development, it is important to acknowledge
the value end user perspectives bring in creating a decisional context for which the DSS
must support. Final judgments in end user acceptance and overall system effectiveness
come down to how well the DSS aligns with the environment studied during the decision-
oriented diagnosis phase.
There are several factors which influence the developmental validity of any
selected methodology. Then developer must consider the level of detailed specification
that exists for the decisional environment. The developer must also understand which
80
type of DSS is most appropriate for the situation (i.e., data-driven, communication-
driven, function-driven, etc.). Standard system development considerations such as
amount of data, number of actual system users, available infrastructure (hardware,
software, and telecommunication backbone), budget restrictions, and so forth also
influence the selection of any given developmental path. In many cases, a hybrid
approach that combines elements from all three major approaches may be .
Experimental Design Methodology
The selection of a research method was driven by the nature of the research
problem (Singelton & Straits, 2005; Steinberg, 2004). As mentioned earlier, the central
purpose and need for this study was to test the potential link between faculty performance
measurement and student persistence. The experimental design methodology is explicitly
suited for studies of causality (Changeau, 2004; Halat, 2007; Singelton & Straits, 2005;
Steinberg, 2004; Zlowodzki, Jonsson, & Bhandari, 2006). Steinberg (2004) observed that
experimental designs are most appropriate when three criteria are in place: (a) a great
deal of information exists about the subject to possibly support an educated guess
concerning causality, (b) it is possible to manipulate a specific cause to observe a
measurable effect, and finally (c) you can control who gets the cause or treatment (p. 52).
True experimental design carries a great deal of inferential weight when studying
phenomenon. True experimental design requires an extremely rigorous structure that
allows optimal control over threats to both internal and external validity. Ultimately,
good experiments should bring balance between internal and external validity concerns.
The core requirements for a true experiment include random assignment, distinct

81
manipulation of an independent variable, measurement of a dependent variable, two or
more groups for comparison (ideally one experiment and one comparison or control), and
consistent environmental conditions across groups (Changeau, 2004; Singelton & Straits,
2005; Steinberg, 2004; Zlowodzki, Jonsson, & Bhandari, 2006) .
Ultimately, a good experiment should lead to a better understanding of potential
causal linkages between variables in an environment. Independent variables are potential
influencers of dependent variables. Therefore, a specific, focused, and distinct treatment
(manipulation) is applied to an independent variable with the goal of studying potential
cause and effect associations. A well-defined experimental manipulation has higher
measurement validity in that independent variables (conditions) are limited in number
and complexity (Singleton & Straits, 2005).
Reliability is the foundation upon which a well-designed study is based.
Reliability addresses the stability, consistency, and overall quality of the researcher’s
operational definitions (Singleton & Straits, 2005). Validity complements reliability
concerns by focusing on the “goodness of fit” (Singleton & Straits). In other words, how
well do the selected indicators (operationalization) align with the theoretical/conceptual
objectives? For example, a reliability measure might look at the variation of response
within a survey. If all respondents have the same response, the instrument may be
potentially biased.
Reliability and validity measures are empirical attempts to bring understanding of
truth closer to the real condition of natural laws. For this reason, Trochim’s (2001)
acknowledgement of True score theory (X = T + ex) highlighted the importance of

82
contextual analysis of any given source. Reliability measures are most concerned with
addressing the added condition (dilemma) of variability; var(X) = var(T) + var(e).
Reliability measures focus upon repeatability, consistency, and dependability as a means
to distill scientific observation to reduce the influence of variability to surmise a constant
T (truth). The addition of concepts such as discriminate, convergent, or even construct
validity adds a contextual anchor upon which reliability and nomological examination
can be assessed in regard to current understanding of the T, truth.
Rosenberg (2000) provided a defense as to why both philosophers and
metaphysicists are needed,
For the difference between explanatory laws and accidental generalizations, and the difference between causal sequences and mere coincidences, appears to be some sort of necessity that the sciences themselves cannot uncover…Answering the question takes us from philosophy of science into the furthest reaches of metaphysics, and epistemology, where the correct answer may lie. (p. 35) A good example for validity testing is the study of time. The accurate distinction
of time within a data set as being either interval or ratio has a tremendous affect as to
which inferential analysis tools you can appropriately utilize. Interval data may be added
or subtracted; however, you cannot multiply or divide interval data. Ratio data allows all
major operations for analysis addition, subtraction, multiplication, and/or division. An
incorrect designation of time level of measurement can lead to flawed inferences (Aczel
& Sounderpandian, 2006).
The challenge within experimental manipulation is in the ability to separate and
observe independent variable manipulation apart from the effects of extraneous variables.
(Singleton & Straits, 2005). This is why the application of manipulation checks can

83
greatly enhance measurement validity, which leads to potentially greater inferential
weight (internal validity) and accuracy (external validity).
Internal validity is an extremely important factor within experimental design. If an
experiment has a high internal validity, then one can make strong inferences when
considering potential causality of relationships because the effects of extraneous variables
are isolated and controlled (Singleton & Straits, 2005).
There are many potential threats to the internal validity of any study. One social
threat is known as evaluation apprehension. Trochim (2001) observed, “Many people are
anxious about being evaluated. Some are even phobic about testing and measurement
situations. If their apprehension makes them perform poorly (and not your program
conditions), you certainly can’t label that as a treatment effect” (p. 77).
Another social threat to internal validity is in experimenter expectancies. “The
researcher can bias the results of a study in countless ways, both consciously or
unconsciously” (Trochim, 2001, p. 78). It is possible that the research insert biased
instruction to study participants. It is also possible for the researcher to indirectly guide
participants towards certain behaviors or expectancies that could confound inferential
capability.
Diffusion or imitation of treatment is another potential threat to a study’s internal
validity. Trochim (2001) observed that diffusion of treatment, “occurs when a
comparison group learns about the program either directly or indirectly from program
group participants” (p. 185). For small populations, diffusion becomes a concern given
that such environments are often highly socially interactive.
84
External validity differs from internal validity in that it, “is the degree to which
the conclusions in your study could hold for other persons in other places and at other
times” (Trochim, 2001, p. 42). The external validity of a study is important because it
defines the accuracy of generalizations of finding to a large population. Trochim defined
three major threats to external validity people, places, and times (Trochim, p. 43).
Your critics could, for example, argue that the results of your study were due to the unusual type of people who were in the study, or they could claim that your results were obtained only because of the unusual place in which you performed the study. (Perhaps you did your study educational study in a college town with lots of high-achieving, educationally oriented kids.) They might suggest that you did your study at a peculiar time. For instance, if you did your smoking0cessation study the week after the Surgeon General issued the well-publicized results of the latest smoking and cancer studies, you might get different results than if you had done it the week before. (p. 43) Research design has a direct influence upon attempts to reduce threats to both
external and internal validity (Trochim, 2001). The pretest-posttest control group design
provides several controls that support higher internal validity (Singleton & Straits, 2005).
Measuring the experimental group before and after the treatment provides greater insight
over threats to internal validity such as history, maturation, testing and instrumentation
(Singleton & Straits, 2005). The addition of the control group allows the experimenter to
isolate potential effects that individuals experience during the experiment. If there were
any major events (history) between the pre and post tests, then the researcher has the
ability to compare these changes between the experimental and control groups. The
ability to observe both the experimental and control groups also allows the research to
identify changes resulting from maturation, testing and instrumentation. The addition of
random assignment reduces the chance for selection and regression tendencies.
85
Campbell and Stanley observed that the pretest-posttest control group design
provides sound control for potential errors in maturation, testing, instrumentation,
regression, selection, and mortality (as cited in Changeau, 2004, p. 8). This is not to say
that experimental design does not contain inherent concerns as well. Zlowodzki et al.
(2006) observed,
Several pitfalls in the design and conduct of clinical research include: lack of randomization, lack of concealment, lack of blinding, and errors in hypothesis testing (type I and II errors). A basic understanding of these principles of research will empower both investigators and readers when applying the results of research to clinical practice. (p.1) To avoid such errors, Zlowodzki et al. (2006) added, “Understanding basic
principles of the hierarchy of evidence, errors in hypothesis testing and other basic
methodological issues empower both researchers and the consumers of research papers to
apply only the highest quality evidence to their clinical practice” (p.1). For example,
alpha (Type I) errors, “can be avoided by clearly stating primary and secondary outcome
parameters before conducting the trial and adjusting the significance level of secondary
outcome measures to the number of calculated secondary outcome parameters”
(Zlowodzki et al., p. 4). An experiment can have several possible outcomes. In all cases,
the outcome of an experiment requires some form of measurement. Statistical
significance refers to the likelihood that a causal result (association) between two or more
variables is more than by chance. The higher the statistical significance, the less chance is
involved. Within statistics, a credibility rating is used to measure statistical significance,
the p-Value (Singleton & Straits, 2005).

86
The significance level, referred to as alpha, is used to measure the credibility
(likelihood) that a hypothesis is true. The general rule of thumb is that when the p-Value
is less than alpha, then the null hypothesis is rejected (Singleton & Straits, 2005). The
standard values for alpha are: 10%, 5%, and 1%. The lower the alpha test, the greater our
confidence that the results are not due to chance and that our null hypothesis is true.
Beta (Type II) errors can be avoided by, “an a priori power and sample size
calculation and a realistic assessment of the feasibility of a study, considering incidence
of the investigated problem, enrollment time, single versus multi center approach”
(Zlowodzki et al., 2006, p. 5). Once Type I and Type II errors have been taken into
account, the experiment is then performed, and the results are tested against the study’s
hypothesis.
Wright (2006) observed that when considering statistical testing for the pretest-
posttest control group design,
The two most common statistical approaches are doing a t test on the gain scores (post-score minus pre-score) and an analysis of covariance (ANCOVA) partialling out the initial score. Lord (1967) showed that these alternatives can lead to different conclusions. Both approaches are valid descriptions of the data and they address very similar research questions; thus the apparent paradox. However, the questions they address are different (Hand, 1994) and subsequent conclusions require different assumptions (Wainer, 1991; Wainer & Brown, 2004). (p. 663)
The t test is typically used when researchers wish to focus upon differences between two
groups (Wright, 2006). T tests are also used specifically for small samples where n<30
(Freeman & Modarres, 2006; Singleton & Straits, 2005).
As noted by Singleton and Straits (2005), the raging debate over the nature of
causality has worn on with no one clear definition rising to theoretical dominion.
87
However, within the realm of Social science three conditions have evolved over time
when attempting to ascertain causality. These potentially evidentiary conditions are
association, direction of influence, and nonspuriousness (Singleton & Straits, 2005).
Statistical association indicates that there is a potential relationship between
variables. The power in statistical measure is not in the ability to define absolute
correlations; rather, the value of inferential statistics brings allows one to go beyond
casual observation to better understand the potential interplay between variables.
Questions such as positive or negative associations (correlations) can give one potentially
important forecasting capabilities (Singleton & Straits, 2005).
Direction of influence, a second condition of potential causality, seeks to identify
areas where independent variables influence changes within dependent variables. In
database management theory, this is known as transitivity. In other words, the application
of sales tax upon the subtotal sales price results in (direction of influence) a higher total
price (Singleton & Straits, 2005).
Nonspuriousness infers that the relationship between two variables is not random,
nor are there hidden extraneous variables that also influence the dependent variable.
Singleton and Straits (2005) make an important point in that in an ideal study the
researcher is able to demonstrate a relationship while all extraneous variables are fixed.
The greater control one can invoke over extraneous variable, the greater the chances that
the relationship within the observed phenomenon is nonspurious.
Several important factors must be taken into consideration when attempting to
infer relationships among variables. In addition to understanding the subtle interplays
88
between independent and dependent variables, researchers are to be extremely cognizant
of their intended research purpose. In essence, the selected research purpose (focus)
serves as the very foundation upon which the entire study was built. As Singleton and
Straits (2005) alluded, the section of approach is an extremely important factor that
impacts the way data can be acquired, how data and variables may or may not be
aggregated/studied, while also guiding which inferences may or may not be made from
phenomenon observation.
Summary
This review of literature set out to highlight key works in the areas of decision-
making and decision support, faculty performance measurement, forces influencing
student performance and persistence, along with decision support system design
concepts. This study represents a distinct extension of current literature where a critical
gap exists in determining what ways faculty performance measurement data are related to
student persistence and how DSS applications may be used to improve student success.
Researchers, theorists, and practitioners such as Alter, Power, Morton, Sprague,
and Carlson agree that a universally accepted comprehensive definition has not been
achieved that captures the magnitude and multidimensionality of the human decision-
making process. It can also be argued that there is a definite need to test the potential
relationship between faculty performance measurement and student persistence. It could
be possible to construct more effective FPM/DSS applications if the nature of influence is
understood between faculty performance data and student persistence.
89
Many look at Simon’s (1960) stages of Intelligence, Design, and Choice as the
basic building blocks upon which a generalized DSS can be developed. A key challenge
for any DSS is in the system’s ability to address alternatives and highly complex,
interdependent relationships that may not always be obvious. Hence, Multidimensional
analysis has itself risen to become an entire sub field within DSS studies.
Faculty performance measurement, as presented in the literature, has been focused
upon evaluating instructor-based quality activities (Adams, 2003; Blanton et al., 2006).
Performance reviews are not without great controversy given that they are often tied to
promotions and the granting of tenure. The creation of an FPM/DSS could significantly
alter the role of performance measurement. The provision of an FPM/DSS for faculty use
in decision making could provide educators potentially valuable data that could support
better decisions and strategy development that target improved student persistence.
There is a significant body of work that identifies a fundamental shift in how
institutions view their student populations (Engelland, 2004; Hobson, 2001; Richardson,
2005). The rise of student consumerism (or, the view of students as educational
consumers) within higher education has been shown to be a definitive force in shaping an
institution direction toward enhancing both instructional and curricular design. “Now that
retention is so firmly on the agenda, commentators have explained the trends identified
above by looking to the structural processes which underpin non-completion. Especially
important here have been the links between non-completion, the class system and major
changes in higher education (Parry, 2002)” (Christie et al., 2004, p. 619).
90
As stated earlier, student persistence is a highly complex multidimensional
concern. Given the wide variety of forces that can influence student persistence, an
effective support system needs to closely align with the decisional needs related to
student retention. System design must take into consideration that, “it is important that
retention models sufficiently measure the curricular gateways to persistence at the college
level that are typical extensions of key hurdles students encounter in high school (Herzog,
2005, p. 886).
The experts agree that the wide variety of decisional need calls for a high degree
of flexibility and adaptability within any effective DSS. Sprague and Carlson provide
valuable insights in that DSS may not always be explicitly defined, but simply subscribe
to a few basic truths to function in any environment. Power’s work, which is the latest to
date, provides an important insight into current and emerging roles for DSS as a means of
decisional enhancement. For institutions to truly capture the essence of student
persistence issues, it is necessary to reevaluate the selection, capture, and manipulation of
data relevant to student persistence. Rather than blaming student persistence issues on
students, institutions, or faculty, it is more important to study the relationship between
these shareholders so that one might develop better programs and approaches that
respond to the needs of retention issues. “The evident commitment to education shown by
many of those who had withdrawn makes it even more pressing to consider the various
ways in which students can be better supported to the successful conclusion of a degree at
the first opportunity” (Christie et al., 2004, p. 627).
91
In chapter 3, a detailed description is provided that identifies how research design
and methodology have been developed to consider directly faculty performance
measurement, student persistence, and FPM/DSS design. The chapter also presents
sample selection methodology, along with a detailed description for the experimental
treatment that was applied. Particular attention is given in identifying how study design
directly correlates with foundational issues that impact student persistence.
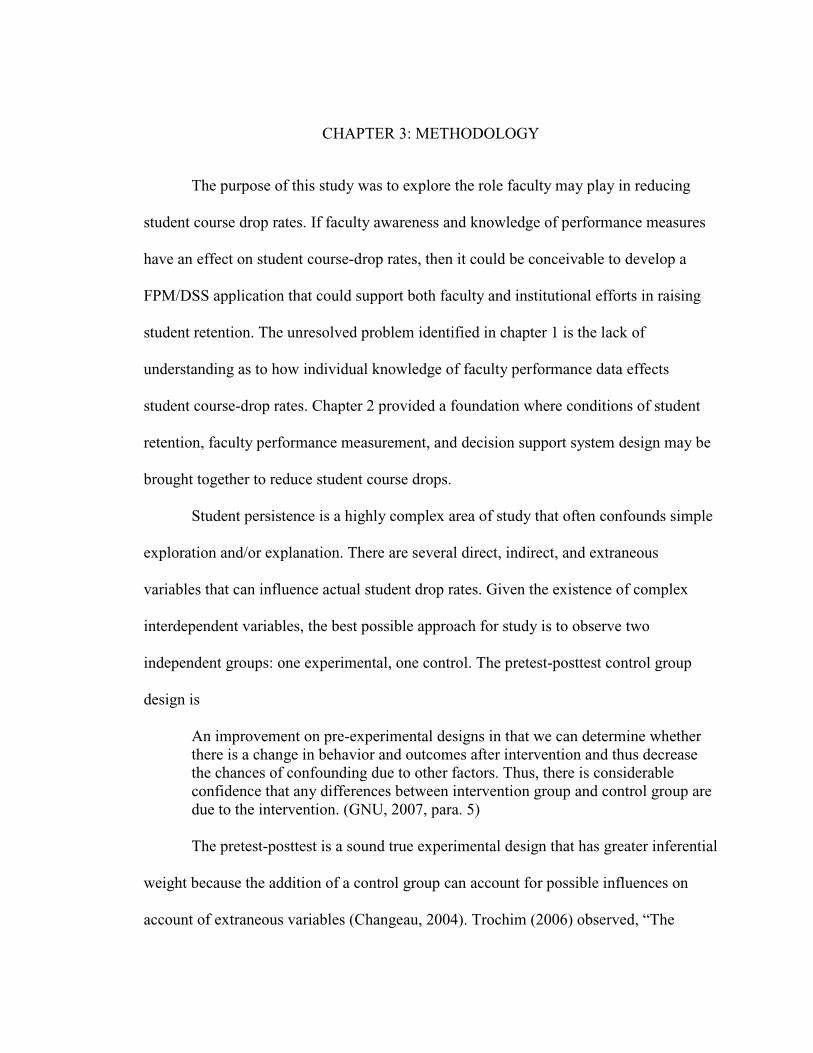
CHAPTER 3: METHODOLOGY
The purpose of this study was to explore the role faculty may play in reducing
student course drop rates. If faculty awareness and knowledge of performance measures
have an effect on student course-drop rates, then it could be conceivable to develop a
FPM/DSS application that could support both faculty and institutional efforts in raising
student retention. The unresolved problem identified in chapter 1 is the lack of
understanding as to how individual knowledge of faculty performance data effects
student course-drop rates. Chapter 2 provided a foundation where conditions of student
retention, faculty performance measurement, and decision support system design may be
brought together to reduce student course drops.
Student persistence is a highly complex area of study that often confounds simple
exploration and/or explanation. There are several direct, indirect, and extraneous
variables that can influence actual student drop rates. Given the existence of complex
interdependent variables, the best possible approach for study is to observe two
independent groups: one experimental, one control. The pretest-posttest control group
design is
An improvement on pre-experimental designs in that we can determine whether there is a change in behavior and outcomes after intervention and thus decrease the chances of confounding due to other factors. Thus, there is considerable confidence that any differences between intervention group and control group are due to the intervention. (GNU, 2007, para. 5) The pretest-posttest is a sound true experimental design that has greater inferential
weight because the addition of a control group can account for possible influences on
account of extraneous variables (Changeau, 2004). Trochim (2006) observed, “The
93
posttest-only randomized experimental design is, despite its simple structure, one of the
best research designs for assessing cause-effect relationships” (para. 5).
As previously noted, student course drop rates are influenced by many extraneous
variables. The use of a pretest-posttest equivalent group design allows for a significant
isolation of noise caused by these extraneous variables. The isolation of extraneous
variables allows for a more accurate observation of potential causal relationships between
the dependent variable of student course drops and the independent variable of an
informed faculty.
Data-driven institutions have for some time been collecting mountains of data
regarding student persistence, performance, and overall success. Data are also often
collected concerning faculty performance and evaluation. The main concern lies in
determining how this datum can be processed in a meaningful way that supports making
positive changes within the institution and classroom. Most intuitions find that
meaningful analysis of these data can be extremely time consuming and complex given
that data are often inconsistently captured, organized, and often spread across several
disparate systems. This study tested how the use and communication of faculty
performance measurement data influence student course drop rates.
This chapter represents a detailed description of the study’s research design and
approach. The chapter also contains the rationale justifying choices made in
methodology, processes, and analysis. Particular attention was given to the study design,
sample selection, and justification. The study’s treatment is also defined in detail so that
clear theoretical mappings are established between observed variables with elements

94
mentioned within the literature as identified in chapter 2. The ultimate goal for this
chapter is to present a research design that represents a logical extension for study of
research problems.
Development of Research Questions
As previously mentioned, there are several factors that exist outside the sphere of
faculty control when considering student persistence (Ashby, 2004; Cox et al., 2005;
Herzog, 2005). There is a significant amount of literature that identifies factors such as
student background, motivation, academic preparation, year in program, course load,
along with level of social integration as having a profound influence upon student
persistence (Bosshardt & Kennedy, 2004; Braunstein et al., 2006; Christie et al., 2004;
Gregory, 2005; Parmar & Trotter, 2004). The question that remained unanswered was the
first concern for this study:
1. What is the effect of faculty access and knowledge of faculty performance data
have in reducing CDR?
While student persistence may be driven by several environmental factors, can specially
trained and informed faculty offset these forces through enhanced curriculum and
instruction? The faculty-student bond is a unique and potentially powerful social
phenomenon. It may be argued that faculty awareness and sensitivity to student
challenges in achieving academic success can lead to strategic changes within curriculum
and instructional approach.
While faculty may have a potential for influencing student persistence, a second
question arose:
95
2. What is the effect of faculty performance measurement data on student
persistence?
Ashby’s (2004) concept of data triangulation provides the theoretical foundation for this
question. As expressed in chapter two, there is no shortage of data-driven schools. Data
collection has never been higher than what is experienced in today’s information age.
Through an extensive review of literature it is quite apparent that most data stores are
highly fragmented and dispersed across several disparate systems. Subsequently, the
triangulation of data that could lead towards more informed action is problematic at best.
The nature and form of data collected is also important when considering
information requirements needed for enhanced decision making. Collecting explicit data
such as student grade performance or course drop rates may not provide enough
meaningful information to guide faculty intuitive knowledge and performance in
attempting to influence student persistence. Effective decision making relies upon the
thoughtful integration of both explicit and tacit knowledge (Halit, 2005).
Informing faculty through strategic data collection may provide an opportunity for
improved performance targeting higher student persistence. As demonstrated in the
literature review, the way in which data are collected, structured, stored, and distributed
has a profound impact upon faculty acceptance and use of this information.
The third question for this study focused upon these practical concerns:
3. What are implications for institutions of higher learning seeking to utilize
decision support systems in addressing student persistence?
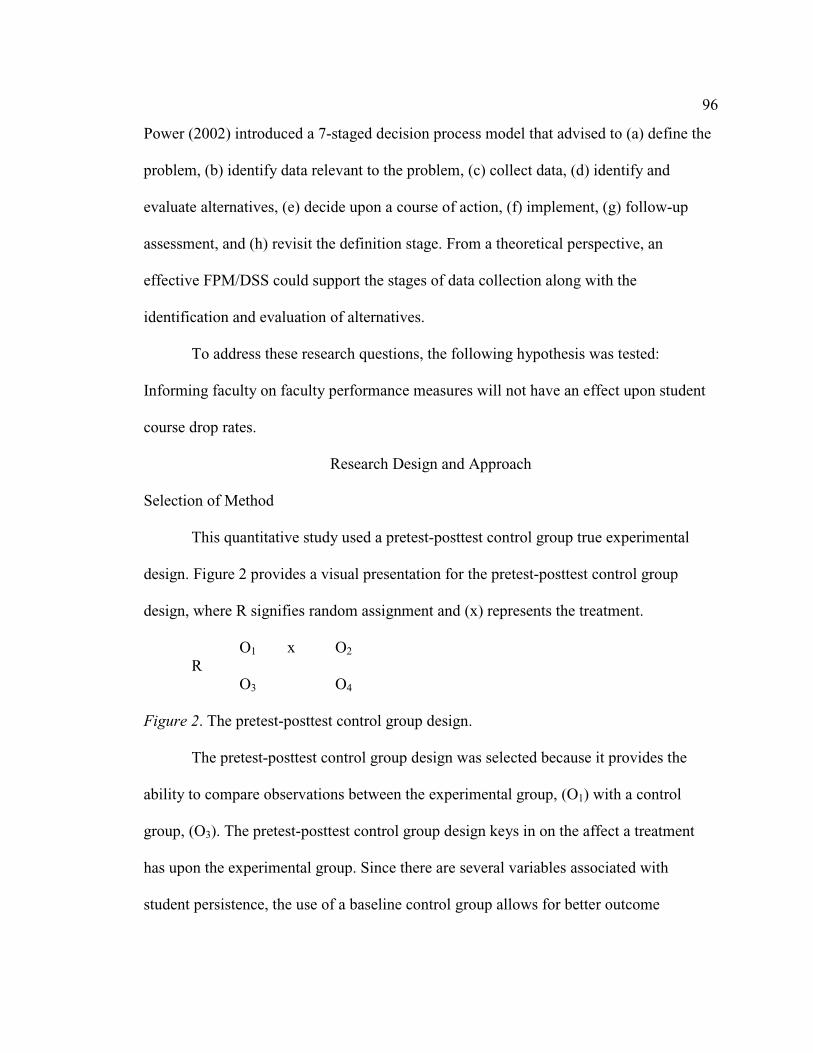
96
Power (2002) introduced a 7-staged decision process model that advised to (a) define the
problem, (b) identify data relevant to the problem, (c) collect data, (d) identify and
evaluate alternatives, (e) decide upon a course of action, (f) implement, (g) follow-up
assessment, and (h) revisit the definition stage. From a theoretical perspective, an
effective FPM/DSS could support the stages of data collection along with the
identification and evaluation of alternatives.
To address these research questions, the following hypothesis was tested:
Informing faculty on faculty performance measures will not have an effect upon student
course drop rates.
Research Design and Approach
Selection of Method
This quantitative study used a pretest-posttest control group true experimental
design. Figure 2 provides a visual presentation for the pretest-posttest control group
design, where R signifies random assignment and (x) represents the treatment.
O1 x O2 R
O3 O4
Figure 2. The pretest-posttest control group design.
The pretest-posttest control group design was selected because it provides the
ability to compare observations between the experimental group, (O1) with a control
group, (O3). The pretest-posttest control group design keys in on the affect a treatment
has upon the experimental group. Since there are several variables associated with
student persistence, the use of a baseline control group allows for better outcome
97
analysis. Using an experimental approach in studying student persistence is much better
method than survey design. Survey instruments are not able to isolate the influence
extraneous variables have upon the phenomenon being studied. Thus, survey outcomes
could easily be confounded by these unidentified extraneous influences.
The study can be classified as a field experiment because pretest and posttest data
compared were CDR from selected actual faculty courses. The pretest-posttest control
group methodology was useful for increasing internal study validity even if performed in
the field, given that both groups went through the same experiences with the exception of
the treatment (Singleton & Straits, 2005).
The selection of research method was driven by the nature of the research
problem: can informed faculty have a positive effect in reducing student course drops?
The application of a treatment designed for informing faculty concerning student
persistence data was experimentally considered in reviewing student persistence pretest
and posttest rates in each group. A second benefit in using the pretest-posttest control
group design lies in the randomization of selected groups. As Singleton and Straits (2005)
observed, “even if the subject pool consisted only of extreme scores–for example, all
introverts–random assignment of these subjects to experimental and control groups
should ensure initially equivalent groups that regress about the same amount on the
posttest” (p. 195).
Identification of Variables
As mentioned in chapter 1, the institution being studied currently tracks interval
data in the form of student course drop rates (CDR), faculty grade point averages

98
(average GPA for grades issued), and student evaluation of teaching (SET). Using
historical data spanning the past 2 years, the study considered measures of central
tendency (mean) along with measures of variability (standard deviation). There are
several advantages in using 2 years of historical data as a comparative baseline. A great
deal of social research utilizes the survey instrument as a principle method for data
collection.
Singleton and Straits (2005) identified a distinct advantage that comes with
historical data analysis that transcends the use of surveys,
Despite the avowed focus of the social sciences on properties and changes in social structure, much of social research focuses on individual attitudes and behavior. Surveys are of individuals, and very few surveys utilize contextual or social network designs, which provide direct measures of social relations; experiments rarely study the group as the unit of analysis; and field studies are based on the observation of individual behavior. Available data, however, often enable the researcher to analyze larger social units. (p. 355)
The ability to analyze student persistence data for the entire institution as compared with
individual faculty performance provides great insight as to how the individual could
influence student drop rates.
Ultimately, a good experiment should lead to a better understanding of potential
causal relationships between variables in an environment. Independent variables are
potential influencers of dependent variables. Therefore, a specific, focused, and distinct
treatment (manipulation) was applied to an independent variable with the goal of
studying potential cause and effect associations. A well-defined experimental
manipulation has higher measurement validity in that independent variables (conditions)
are limited in number and complexity. Bear in mind that the challenge within
99
experimental manipulation is in the ability to separate and observe independent variable
manipulation apart from the effects of extraneous variables (multiple meanings). This is
why the application of manipulation checks greatly enhances measurement validity,
which leads to potentially greater inferential weight (internal validity) and accuracy
(external validity).
The study utilized the following elements:
1. Concept–measuring faculty influence on student course drops
2. Dependent variable–student course drops
3. Independent variables–faculty awareness of individual performance datum
4. Control variables–2 years of historical data for the entire institution including
student course drop rates, faculty GPA, and SET
5. Unit of analysis–faculty
Target Population and Setting
The determination of a target population, sampling frame, and unit of analysis has
tremendous impact on the controls and measurements that may be applied. Effective
experimental design requires at least two well-defined groups that can be compared
through either self-reporting and/or observation as treatments are applied (manipulation
of an independent variable), constructing the groups to balance internal and external
validity threats. The target population of interest is a community of 76 actively teaching
adjunct faculty. The institutional setting is a private, nontraditional university that
provides both undergraduate and graduate business degrees for students located in the
San Francisco Bay Area region in Northern California.

100
Phase 1–Sampling Procedure and Size
To conduct a valid experiment it was necessary to establish a random sample of
participants. The sample frame consisted of two randomly sampled independent groups,
an experimental (O1) and a control (O3). The sample was derived from the institution’s
directory of actively teaching faculty. Simple random sampling was used to derive the
two groups.
Sample size was determined using the following expression:
B
Zn
2
2
2
2σ
α
=
A random sample of 32 faculty participants that were actively teaching was used in this
study. This sample size allowed for a 95% confidence level in either rejecting or
accepting the study’s hypothesis with a potential 13.2% margin of error.
The use of simple random sampling from this specific population provided a
strong potential for enhancing internal validity. As Singleton and Straits (2005) noted,
“The defining property of a simple random sample is that every possible combination of
cases has an equal chance of being included in the sample” (p. 119). No specific selection
criteria were used beyond membership within the institution’s faculty directory. There
was an equal chance for all colleges and disciplines to be represented within the strata
since the sample was randomly derived from a single pool of all 76 faculty members.
Participants for both the experimental and control groups were selected using a
randomization function within Microsoft Excel 2003.
101
Phase 2–Faculty Performance Data Collection and Preparation
The treatment involved two core elements: the collection, organization, and
distribution of individual faculty performance data, along with a formalized training
session on faculty performance measurement as related to student retention. The targeted
university selected for this study has a long established practice of collecting faculty
performance data. Data are currently collected through several different systems.
Retrieving performance data from these systems is a highly complex process requiring a
high-level of computer expertise. Consequently, the sharing of this datum with faculty is
highly inconsistent and infrequent. In many cases, adjunct faculty never receive this
datum.
Systems collect data for all faculty members that includes college, course, faculty
name, local faculty GPA, regional GPA, local student course drops, regional course
drops, local faculty student evaluation of teaching (SET), and regional faculty SET.
Faculty currently have no direct access to this datum. Existing individual performance
data were manually retrieved and organized for a randomly selected sample of adjunct
faculty members. Once retrieved, the data were put into a readable format and sealed
within individual packets.
Phase 3–Experimental Treatment
The experimental treatment for this study was a one-time, 3-hour training session
for the experimental group. The first element within the treatment was to provide each
faculty member within the experimental group a sealed individual performance report
that provided all data mentioned above for the past 2 years of their instruction (2006-
102
2007). The experimental group report included course taught, name of faculty, total
grades issued for the period, number of student course drops, number of regional drops
for that course, faculty student drops as a percentage of regional student drops, local
faculty SET, along with regional SET for that course.
The second element within the treatment was a formalized training session
entitled, Faculty Leadership. The training was an interactive faculty symposium where
faculty had the opportunity to receive specific training on student persistence, as well as,
sharing best practices related to the data within the aforementioned performance report.
The training session was presented in a 3-hour format that included lecture and small
group activities. The first hour of the training was an interactive lecture that identified
and defined (a) how the institution collects faculty and student performance data, (b) how
data are currently distributed to faculty, (c) how attendees were selected for this training
as a special pilot group, (d) the institutional perspective seeking to improve student
persistence, (e) the training mission, whether informed faculty have a positive influence
upon student course drop rates.
The second hour included an interactive lecture format. The objectives for the
second hour were to present and define the data items from the performance report. This
second hour of lecture was crucial because faculty received specific information as to
how the institution interprets and uses performance data (such as faculty GPA and SET)
in developing curriculum, faculty development, and student success programs. Faculty
had an opportunity to see how individual performance indicators compare regional
performance data.
103
The training concluded with a third-hour section where faculty were divided into
small groups to brainstorm and share best practices concerning: assessment of student
learning, communication strategies for enhanced learning environments, strategies to
raise student self-confidence, methods to balance rigor with expectations, and finally the
role faculty may play in supporting student success. The experimental group received an
updated individual performance report three months after the training event. Appendix A
presents a basic outline for the faculty leadership training session.
Data Collection
As mentioned previously, the university has developed several systems that
collect classroom data. Scheduling systems identify courses, dates, and assigned faculty.
Attendance tracking systems monitor student registration, course adds, and drops.
Grading systems collect faculty grade input data. The university had developed a
reporting system to pull data from these various data sources. Two years of data were
collected from this reporting system to serve as a pretest baseline for posttest comparison.
Table 1 is a representation of sample performance data that was used within this study.
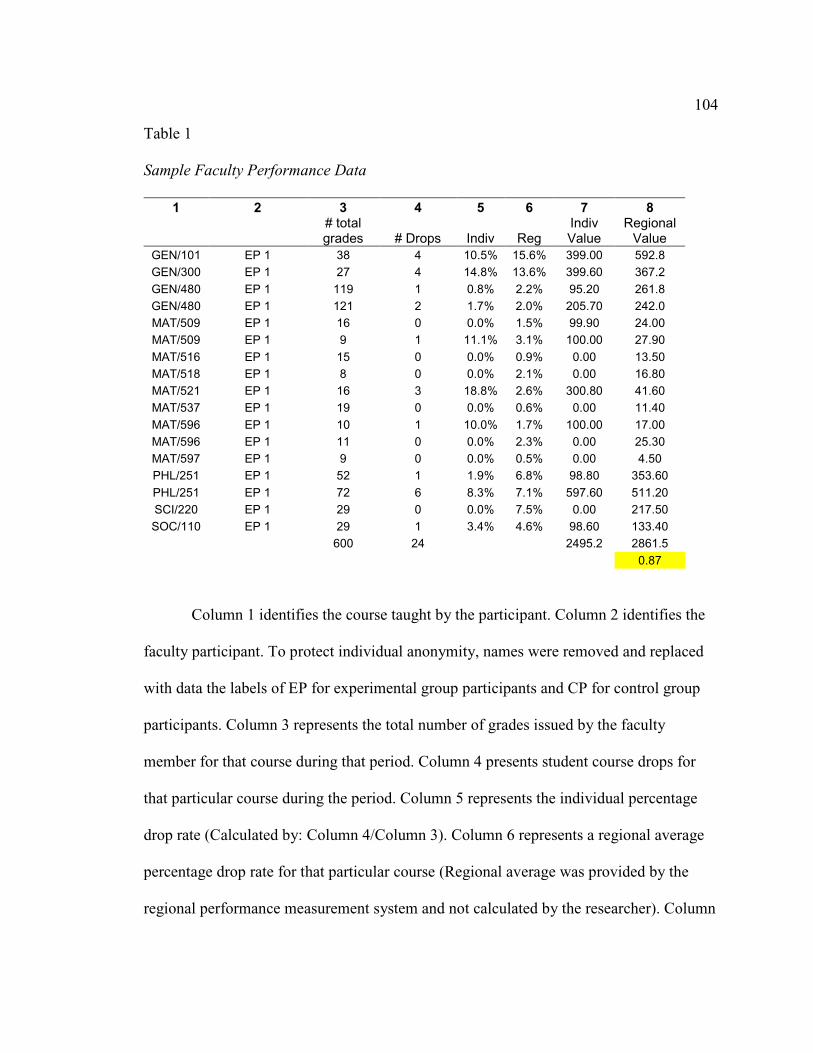
104
Table 1
Sample Faculty Performance Data
1 2 3 4 5 6 7 8
# total grades # Drops Indiv Reg
Indiv Value
Regional Value
GEN/101 EP 1 38 4 10.5% 15.6% 399.00 592.8 GEN/300 EP 1 27 4 14.8% 13.6% 399.60 367.2 GEN/480 EP 1 119 1 0.8% 2.2% 95.20 261.8 GEN/480 EP 1 121 2 1.7% 2.0% 205.70 242.0 MAT/509 EP 1 16 0 0.0% 1.5% 99.90 24.00 MAT/509 EP 1 9 1 11.1% 3.1% 100.00 27.90 MAT/516 EP 1 15 0 0.0% 0.9% 0.00 13.50 MAT/518 EP 1 8 0 0.0% 2.1% 0.00 16.80 MAT/521 EP 1 16 3 18.8% 2.6% 300.80 41.60 MAT/537 EP 1 19 0 0.0% 0.6% 0.00 11.40 MAT/596 EP 1 10 1 10.0% 1.7% 100.00 17.00 MAT/596 EP 1 11 0 0.0% 2.3% 0.00 25.30 MAT/597 EP 1 9 0 0.0% 0.5% 0.00 4.50 PHL/251 EP 1 52 1 1.9% 6.8% 98.80 353.60 PHL/251 EP 1 72 6 8.3% 7.1% 597.60 511.20 SCI/220 EP 1 29 0 0.0% 7.5% 0.00 217.50 SOC/110 EP 1 29 1 3.4% 4.6% 98.60 133.40
600 24 2495.2 2861.5 0.87
Column 1 identifies the course taught by the participant. Column 2 identifies the
faculty participant. To protect individual anonymity, names were removed and replaced
with data the labels of EP for experimental group participants and CP for control group
participants. Column 3 represents the total number of grades issued by the faculty
member for that course during that period. Column 4 presents student course drops for
that particular course during the period. Column 5 represents the individual percentage
drop rate (Calculated by: Column 4/Column 3). Column 6 represents a regional average
percentage drop rate for that particular course (Regional average was provided by the
regional performance measurement system and not calculated by the researcher). Column
105
7 is an individual value (Calculated by: Column 3 times Column 5). Column 8 is a
regional value (Calculated by: Column 3 times Column 6). Column 8 applies the regional
drop grade rate to the faculty’s statistics. It is the value that this faculty would have had if
they performed at the regional rate. A composite score (highlighted in Table 1) was then
created by dividing the sum of Column 7 by the sum of Column 8. This portion of the
table "characterizes" this faculty's performance over all courses taught the last two years
to establish their particular index in relation to all faculty (region) for same courses in the
same period. For this faculty the index is 0.87, which means the composite drop grade
rate for this individual is 87% of the region average. This index was calculated to
determine the level of faculty in the study. This composite was the data value used to
compare pretest conditions with posttest outcomes. The date range for individual pretest
performance reports was April 2006 to May 2008. Data were manually obtained through
report queries collected from existing regional systems. The posttest data collection
period was from June 2008 to July 2008.
Data Analysis
The study compared student drop rates for faculty prior to the treatment and after.
The potential link between the two data sets were evaluated using a parametric t test, also
referred to as a paired simple test. The paired simple test was used to evaluate the means
of Faculty Informed Drop Rates (FiDR) with Faculty Non-Informed Drop Rates (FniDR).
The hypotheses tested:
Null Hypothesis (H0): Informing faculty on faculty performance measures will not have
an effect upon student course drop rates.
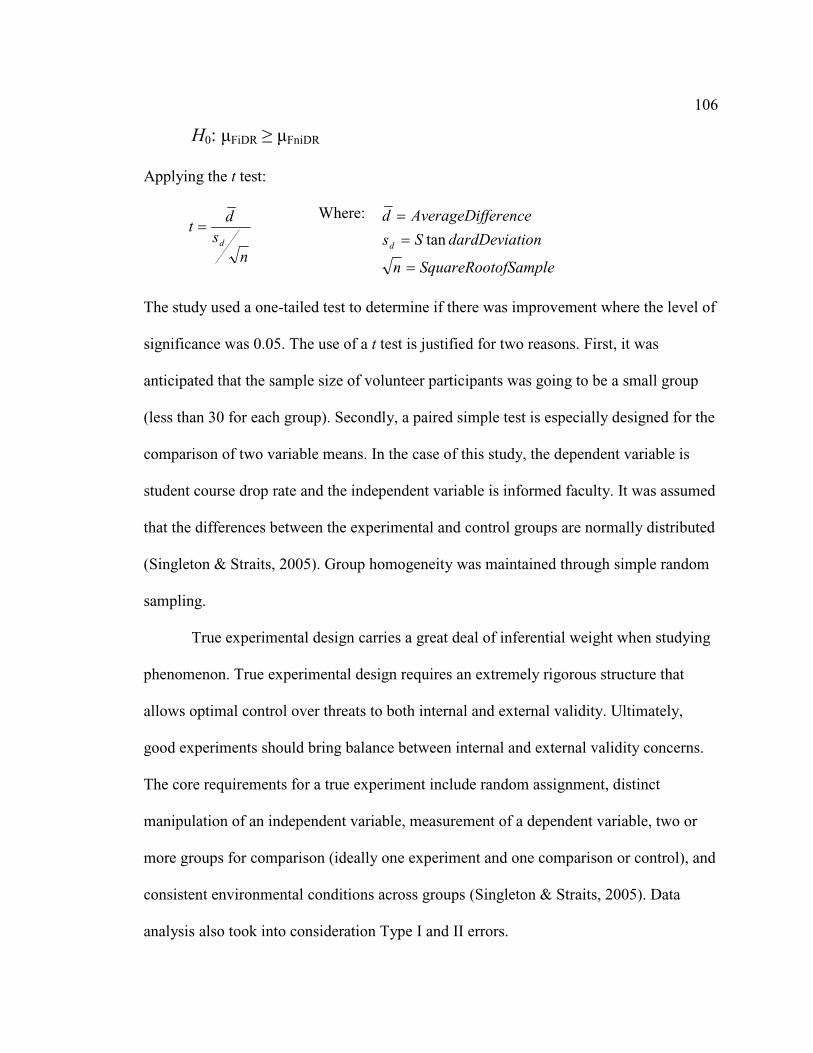
106
H0: µFiDR ≥ µFniDR
Applying the t test:
ns
dt
d
= Where:
ofSampleSquareRootn
iondardDeviatSs
ferenceAverageDifd
d
=
=
=
tan
The study used a one-tailed test to determine if there was improvement where the level of
significance was 0.05. The use of a t test is justified for two reasons. First, it was
anticipated that the sample size of volunteer participants was going to be a small group
(less than 30 for each group). Secondly, a paired simple test is especially designed for the
comparison of two variable means. In the case of this study, the dependent variable is
student course drop rate and the independent variable is informed faculty. It was assumed
that the differences between the experimental and control groups are normally distributed
(Singleton & Straits, 2005). Group homogeneity was maintained through simple random
sampling.
True experimental design carries a great deal of inferential weight when studying
phenomenon. True experimental design requires an extremely rigorous structure that
allows optimal control over threats to both internal and external validity. Ultimately,
good experiments should bring balance between internal and external validity concerns.
The core requirements for a true experiment include random assignment, distinct
manipulation of an independent variable, measurement of a dependent variable, two or
more groups for comparison (ideally one experiment and one comparison or control), and
consistent environmental conditions across groups (Singleton & Straits, 2005). Data
analysis also took into consideration Type I and II errors.
107
Limitations of Study
As stated in chapter 1, a primary consideration and limitation for this study was
time. The analysis of 2 years of historical data provided a set of descriptive statistical data
that reflects a high level of internal data validity as a starting point. A common theme
within trend analysis is that as time (or length) of study increases, the greater the chances
are for true trends to emerge. As more and more data are collected, the less significance
anomalies and outliers play in potentially skewing the data. The study used historical data
as a baseline for comparison. The limitation of the study was that the time factor for
tracking performance after the experimental treatment was relatively short. Data were
collected for only 2 months after the treatment. It was also be important to be aware of
limitations due to evaluation apprehension, experimenter expectancies, and diffusion or
imitation of treatment threats to internal validity.
Protection of Participants’ Rights
Singleton and Strait identified four problem areas regarding the ethical treatment
of human subjects in social research potential harm, lack of informed consent, deception,
and privacy invasion (Singleton & Straits, 2005, p. 518). Special measures were taken to
assure that no harm is done as a result of this study. As mentioned previously, generic
data labels were used in place of participant identities in all data.
The first issue to be addressed was to reduce potential harm. The data being
collected were already in use as an established tracking system that had been in use by
the university for many years. Data from performance reports are currently
communicated to individual faculty, although such communication is sporadic at best.
108
Faculty look upon the provision of a detailed 2-year report as informative. Assurances
were made that any and all data analysis from this study was to have no effect upon their
employment.
Faculty randomly selected for the experimental group were notified of their
selection and invited to participate in a formal training related to this study. Faculty were
given the opportunity to opt out with no repercussions. On the night of the actual faculty
training, participants were once again given the opportunity to opt out from the study.
As noted in Appendix A, participants within the experimental group were given a
detailed introduction to the purpose and structure for the study. There was no attempt to
mislead or deceive study participants. Besides, the central premise for the study was that
informed faculty can possibly make a difference.
Data related to participants were coded to protect identity. Faculty names were
replaced with group designation and number (i.e., Experimental Group Participant, EP1).
Individual performance reports were distributed by hand within a sealed envelope during
the training event.
Summary
Chapter 3 included a detailed description of the study research design and
approach. The development of research questions was inspired by a comprehensive
literature review for student persistence and faculty performance issues. The three
primary questions for research were:
1. What is the effect of faculty access and knowledge of faculty performance
data have in reducing CDRs?
109
2. What is the effect of faculty performance measurement data on student
persistence?
3. What are implications for institutions of higher learning seeking to utilize
decision support systems in addressing student persistence?
Utilizing Power’s (2002) general decision process model it is clear to see that the
incorporation of an FPM/DSS system was theoretically plausible. The results from this
study helped determine if the creation of an FPM/DSS could be beneficial. The
experimental pretest-posttest control group design was selected to provide a method of
observation that has strong internal validity, while also having potential external
generalizeability. The study compared student drop rates (pretest and posttest) for two
randomly sampled faculty groups (experimental and control). The potential link between
the two data sets was evaluated using a parametric t test. If a link can be observed
between student course drop rates and informed faculty, then the creation of an FPM/DSS
could provide faculty and institutions a valuable tool for addressing student persistence.
In chapter 4, a detailed description of the study’s results and findings are
presented. Discussion includes an accounting of data collection procedures, participation,
reliability and validity issues, along with analysis of the data and hypothesis testing as
related to the study’s research questions.
CHAPTER 4: RESULTS
This study was designed to investigate whether faculty knowledge of performance
measurement data creates a difference in student course drop-rates. The first research
question considered in this study was: What is the effect of faculty access and knowledge
of performance data have in reducing CDR? If faculty awareness of performance data
and training lead to a reduction in student course drop-rates, then it could be possible to
develop an effective FPM/DSS that could support both faculty and institutional efforts in
raising student retention. A target population of 76 adjunct faculty was selected for this
study. Realizing that 100% participation was not likely, a random sample frame of 32
faculty participants was sought. Two years of faculty performance data were collected to
serve as a pretest data set. Individual performance data were then provided to an
experimental group, along with a 3-hour training session. The training session covered
how performance data were collected by the institution and how data trends were thought
to relate with student retention patterns. Student course-drop rates were then tracked for a
2 month period following the treatment. Posttest course-drop rates for the experimental
were then compared to a control group that had not been exposed to the historical data or
special training.
The second research question was: What is the effect of faculty performance
measurement data on student persistence? The core issue surrounding this research
question is in determining how the absence of information affects a knowledge worker’s
ability to respond to complex problems, such as student persistence. Ashby’s (2004)
concept of data triangulation provided the theoretical foundation for this question.
Faculty performance data are often captured, stored, and maintained across fragmented
111
and disparate systems. Subsequently, the triangulation of data that could lead towards
more informed action is problematic at best. The nature and form of data collected is also
important when considering information requirements needed for enhanced decision
making. Collecting explicit data such as student grade performance or course drop-rates
may not provide enough meaningful information to guide faculty intuitive knowledge and
performance in attempting to influence student persistence.
The final research question considered by this study was: What are the
implications for institutions of higher learning seeking to utilize decision support systems
in addressing student persistence? There is no shortage of data-driven institutions wishing
to use available data to develop better and more effective responses to student persistence
conditions. To address these research questions, the hypothesis that informing faculty on
faulty performance measures will not have an effect upon student course drop-rates was
tested.
This chapter begins with a description of data collection procedures, along with a
description of study participation. Validity issues for the study are also addressed. Two-
year baseline data are presented for both the experimental and control groups. Discussion
continues with an analysis of experimental results as related to the study’s research
questions. The chapter concludes with a summary of findings.
112
Data Collection Procedures
The university selected for this study collects faculty performance data using
various relational databases. These databases and applications had been created for the
collection, management, and dissemination of data related to both academic and business
operation functions. The data for this study were collected utilizing a proprietary SQL-
based query tool developed by the institution. Data query results were then exported to a
Microsoft Excel 2003 spreadsheet. Data collected were courses taught by the participant,
total number of grades issued by participant, student course drops for each course,
participant individual percentage drop rate, regional percentage drop rate for each course,
an individual value (Calculated by: total number of grades issued by participant times
participant individual percentage drop rate), and a regional value (Calculated by: total
number of grades issued by participant times regional percentage drop rate).
A composite score was then created by dividing the sum of the individual value
by the sum of the regional value. This composite data value was used to compare pretest
conditions with posttest outcomes. A higher composite number indicates a higher drop-
rate as compared with the regional value. Composite data values were used to compare
pretest conditions with posttest outcomes because they reduce potential errors that may
occur due to seasonality or occurrences of one-time events. The date range for individual
pretest performance reports was April 2006 to May 2008.
Table 2 is a sample representation of 2-year historical pretest data for
experimental participant 1 (EP1). All data collected were depersonalized and stored in an
encrypted format. EP 1 has a composite score of 1.08. If the composite score for EP1
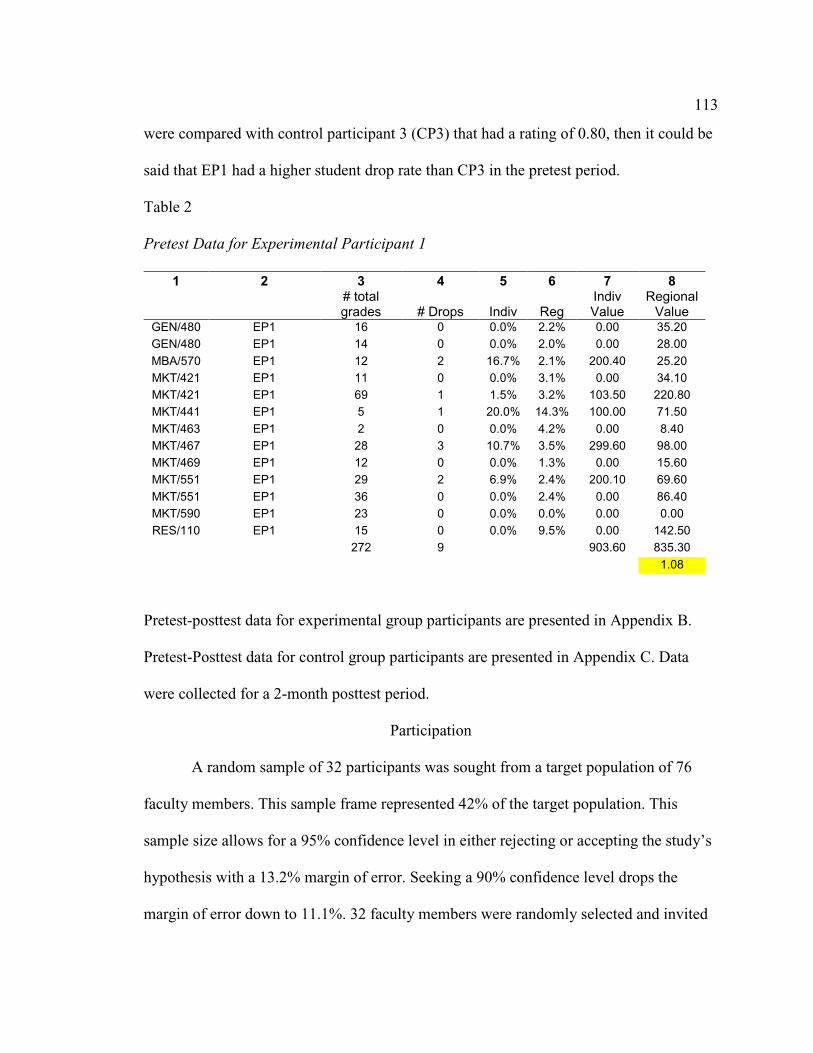
113
were compared with control participant 3 (CP3) that had a rating of 0.80, then it could be
said that EP1 had a higher student drop rate than CP3 in the pretest period.
Table 2
Pretest Data for Experimental Participant 1
1 2 3 4 5 6 7 8
# total grades # Drops Indiv Reg
Indiv Value
Regional Value
GEN/480 EP1 16 0 0.0% 2.2% 0.00 35.20 GEN/480 EP1 14 0 0.0% 2.0% 0.00 28.00 MBA/570 EP1 12 2 16.7% 2.1% 200.40 25.20 MKT/421 EP1 11 0 0.0% 3.1% 0.00 34.10 MKT/421 EP1 69 1 1.5% 3.2% 103.50 220.80 MKT/441 EP1 5 1 20.0% 14.3% 100.00 71.50 MKT/463 EP1 2 0 0.0% 4.2% 0.00 8.40 MKT/467 EP1 28 3 10.7% 3.5% 299.60 98.00 MKT/469 EP1 12 0 0.0% 1.3% 0.00 15.60 MKT/551 EP1 29 2 6.9% 2.4% 200.10 69.60 MKT/551 EP1 36 0 0.0% 2.4% 0.00 86.40 MKT/590 EP1 23 0 0.0% 0.0% 0.00 0.00 RES/110 EP1 15 0 0.0% 9.5% 0.00 142.50
272 9 903.60 835.30 1.08
Pretest-posttest data for experimental group participants are presented in Appendix B.
Pretest-Posttest data for control group participants are presented in Appendix C. Data
were collected for a 2-month posttest period.
Participation
A random sample of 32 participants was sought from a target population of 76
faculty members. This sample frame represented 42% of the target population. This
sample size allows for a 95% confidence level in either rejecting or accepting the study’s
hypothesis with a 13.2% margin of error. Seeking a 90% confidence level drops the
margin of error down to 11.1%. 32 faculty members were randomly selected and invited
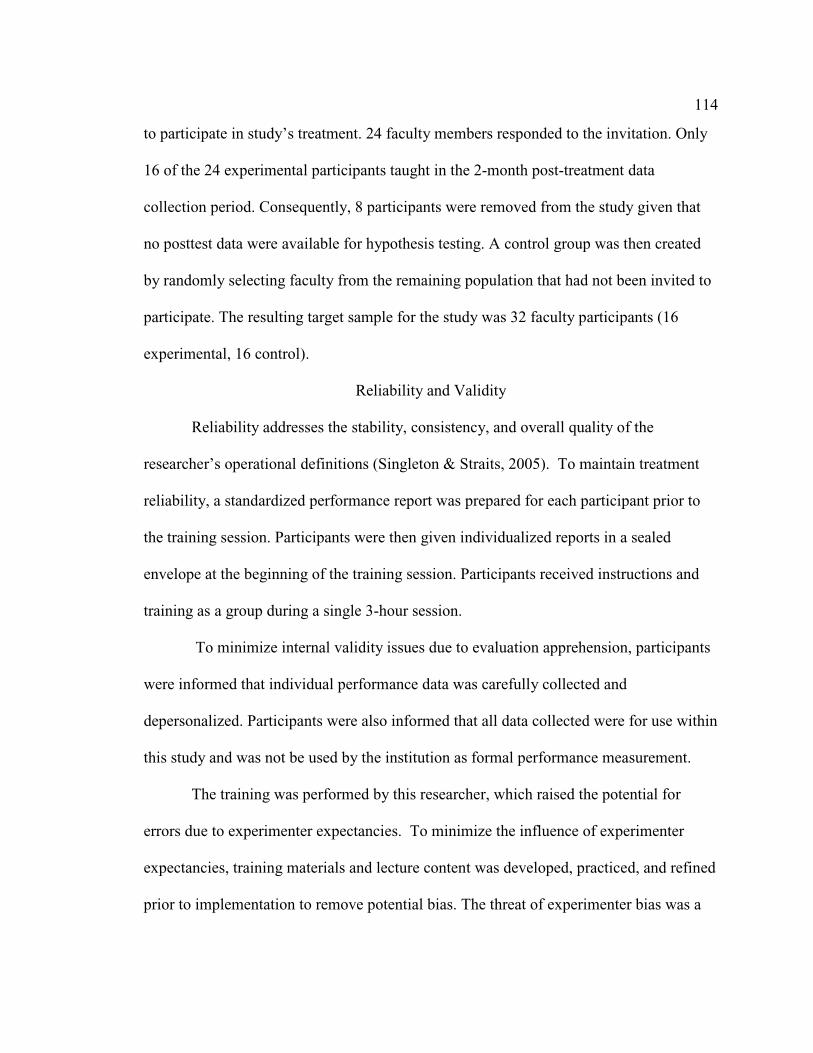
114
to participate in study’s treatment. 24 faculty members responded to the invitation. Only
16 of the 24 experimental participants taught in the 2-month post-treatment data
collection period. Consequently, 8 participants were removed from the study given that
no posttest data were available for hypothesis testing. A control group was then created
by randomly selecting faculty from the remaining population that had not been invited to
participate. The resulting target sample for the study was 32 faculty participants (16
experimental, 16 control).
Reliability and Validity
Reliability addresses the stability, consistency, and overall quality of the
researcher’s operational definitions (Singleton & Straits, 2005). To maintain treatment
reliability, a standardized performance report was prepared for each participant prior to
the training session. Participants were then given individualized reports in a sealed
envelope at the beginning of the training session. Participants received instructions and
training as a group during a single 3-hour session.
To minimize internal validity issues due to evaluation apprehension, participants
were informed that individual performance data was carefully collected and
depersonalized. Participants were also informed that all data collected were for use within
this study and was not be used by the institution as formal performance measurement.
The training was performed by this researcher, which raised the potential for
errors due to experimenter expectancies. To minimize the influence of experimenter
expectancies, training materials and lecture content was developed, practiced, and refined
prior to implementation to remove potential bias. The threat of experimenter bias was a

115
determining factor in the selection of an experimental methodology for this study. The
pretest-posttest control group design provides several controls that potentially reduce bias
and support higher internal validity (Singleton & Straits, 2005).
Diffusion or imitation of treatment was also a potential threat to the study’s
internal validity. The faculty population selected for this study is a small and socially
interactive group. There are several opportunities for faculty to communicate both
formally and informally. Experimental participants were informed as to the potential
concerns diffusion or imitation could have in confounding study results. Participants were
asked not to divulge the nature and content of the training session.
External validity for this study is limited given that analysis of results for faculty
members from a specific institution does not reflect an adequately sized sample to equate
findings with other institutions of higher learning. While study findings provide insight
for the internal target population, external generalizeability needs to be further tested.
116
Analysis and Results
Analysis was conducted using data analysis tools available within Microsoft
Excel 2003 and Palisade’s StatTools 5.0 Professional Edition software. Table 3 is a
representation of pretest-posttest data for the experimental group.
Table 3
Pretest-Posttest Data for Experimental Group
1 2 3 4 Before After Treatment Treatment Number Period Period Grades EP1 1.07 0.00 45 EP2 0.82 0.73 25 EP3 1.56 1.23 25 EP4 0.78 0.52 59 EP5 0.72 0.00 99 EP6 0.83 0.26 29 EP7 0.84 1.02 41 EP8 0.98 0.23 79 EP9 1.00 0.78 48 EP10 0.86 0.00 26 EP11 0.99 1.36 38 EP12 1.12 1.01 45 EP13 1.23 1.09 38 EP14 1.48 1.85 44 EP15 0.85 0.00 39 EP16 0.80 0.47 39
Total 719
In referring to Table 3, experimental participant 2 (EP2) achieved a pretest composite
value of 0.82. The posttest composite value for EP 2 is 0.73, which signifies an
improvement in course-drop rates over pretest values. EP 2 issued 25 grades in the 2-
month posttest data collection. As a whole, 719 grades were issued by the experimental
group in the 2-month posttest period.
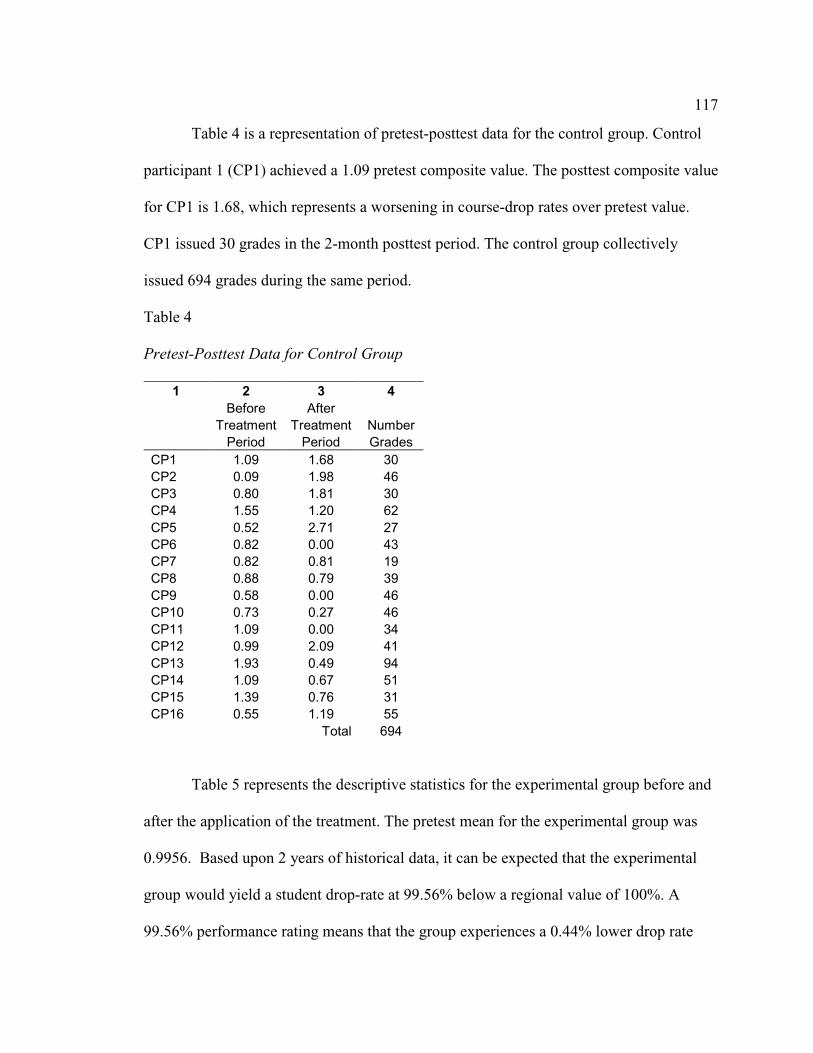
117
Table 4 is a representation of pretest-posttest data for the control group. Control
participant 1 (CP1) achieved a 1.09 pretest composite value. The posttest composite value
for CP1 is 1.68, which represents a worsening in course-drop rates over pretest value.
CP1 issued 30 grades in the 2-month posttest period. The control group collectively
issued 694 grades during the same period.
Table 4
Pretest-Posttest Data for Control Group
1 2 3 4 Before After Treatment Treatment Number Period Period Grades CP1 1.09 1.68 30 CP2 0.09 1.98 46 CP3 0.80 1.81 30 CP4 1.55 1.20 62 CP5 0.52 2.71 27 CP6 0.82 0.00 43 CP7 0.82 0.81 19 CP8 0.88 0.79 39 CP9 0.58 0.00 46 CP10 0.73 0.27 46 CP11 1.09 0.00 34 CP12 0.99 2.09 41 CP13 1.93 0.49 94 CP14 1.09 0.67 51 CP15 1.39 0.76 31 CP16 0.55 1.19 55
Total 694
Table 5 represents the descriptive statistics for the experimental group before and
after the application of the treatment. The pretest mean for the experimental group was
0.9956. Based upon 2 years of historical data, it can be expected that the experimental
group would yield a student drop-rate at 99.56% below a regional value of 100%. A
99.56% performance rating means that the group experiences a 0.44% lower drop rate
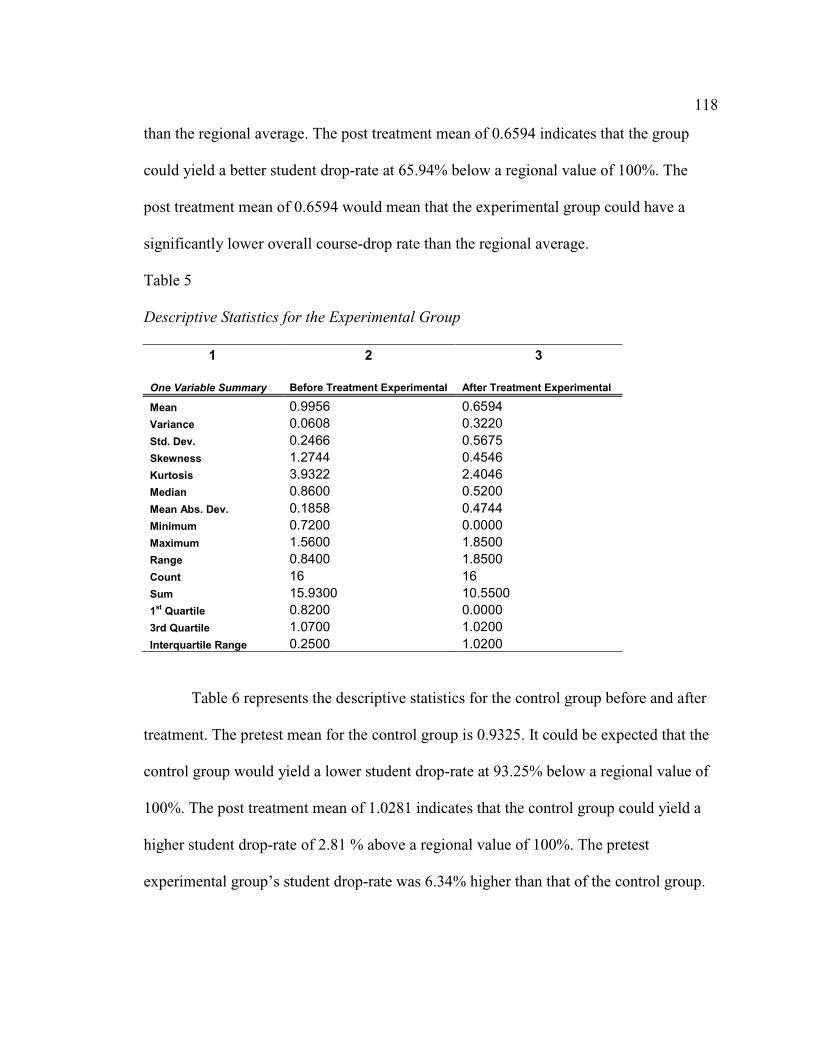
118
than the regional average. The post treatment mean of 0.6594 indicates that the group
could yield a better student drop-rate at 65.94% below a regional value of 100%. The
post treatment mean of 0.6594 would mean that the experimental group could have a
significantly lower overall course-drop rate than the regional average.
Table 5
Descriptive Statistics for the Experimental Group
1 2 3
One Variable Summary Before Treatment Experimental After Treatment Experimental
Mean 0.9956 0.6594 Variance 0.0608 0.3220 Std. Dev. 0.2466 0.5675 Skewness 1.2744 0.4546 Kurtosis 3.9322 2.4046 Median 0.8600 0.5200 Mean Abs. Dev. 0.1858 0.4744 Minimum 0.7200 0.0000 Maximum 1.5600 1.8500 Range 0.8400 1.8500 Count 16 16 Sum 15.9300 10.5500 1st Quartile 0.8200 0.0000 3rd Quartile 1.0700 1.0200 Interquartile Range 0.2500 1.0200
Table 6 represents the descriptive statistics for the control group before and after
treatment. The pretest mean for the control group is 0.9325. It could be expected that the
control group would yield a lower student drop-rate at 93.25% below a regional value of
100%. The post treatment mean of 1.0281 indicates that the control group could yield a
higher student drop-rate of 2.81 % above a regional value of 100%. The pretest
experimental group’s student drop-rate was 6.34% higher than that of the control group.
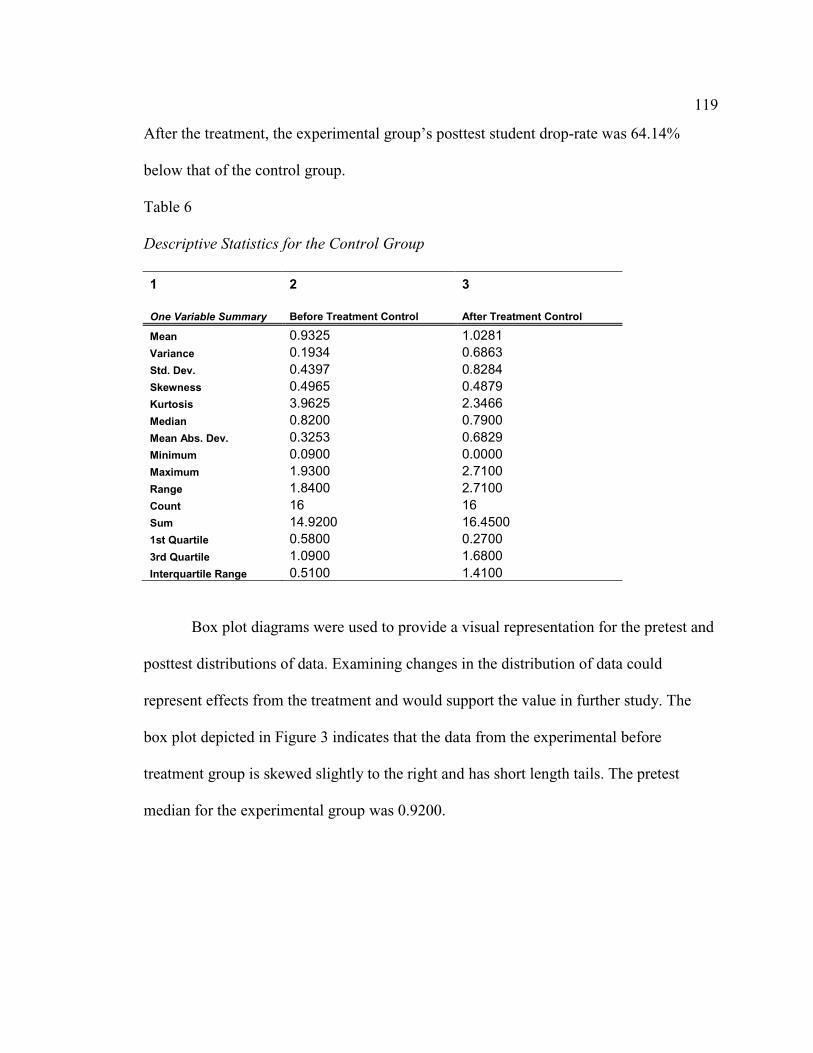
119
After the treatment, the experimental group’s posttest student drop-rate was 64.14%
below that of the control group.
Table 6
Descriptive Statistics for the Control Group
1 2 3
One Variable Summary Before Treatment Control After Treatment Control
Mean 0.9325 1.0281 Variance 0.1934 0.6863 Std. Dev. 0.4397 0.8284 Skewness 0.4965 0.4879 Kurtosis 3.9625 2.3466 Median 0.8200 0.7900 Mean Abs. Dev. 0.3253 0.6829 Minimum 0.0900 0.0000 Maximum 1.9300 2.7100 Range 1.8400 2.7100 Count 16 16 Sum 14.9200 16.4500 1st Quartile 0.5800 0.2700 3rd Quartile 1.0900 1.6800 Interquartile Range 0.5100 1.4100
Box plot diagrams were used to provide a visual representation for the pretest and
posttest distributions of data. Examining changes in the distribution of data could
represent effects from the treatment and would support the value in further study. The
box plot depicted in Figure 3 indicates that the data from the experimental before
treatment group is skewed slightly to the right and has short length tails. The pretest
median for the experimental group was 0.9200.
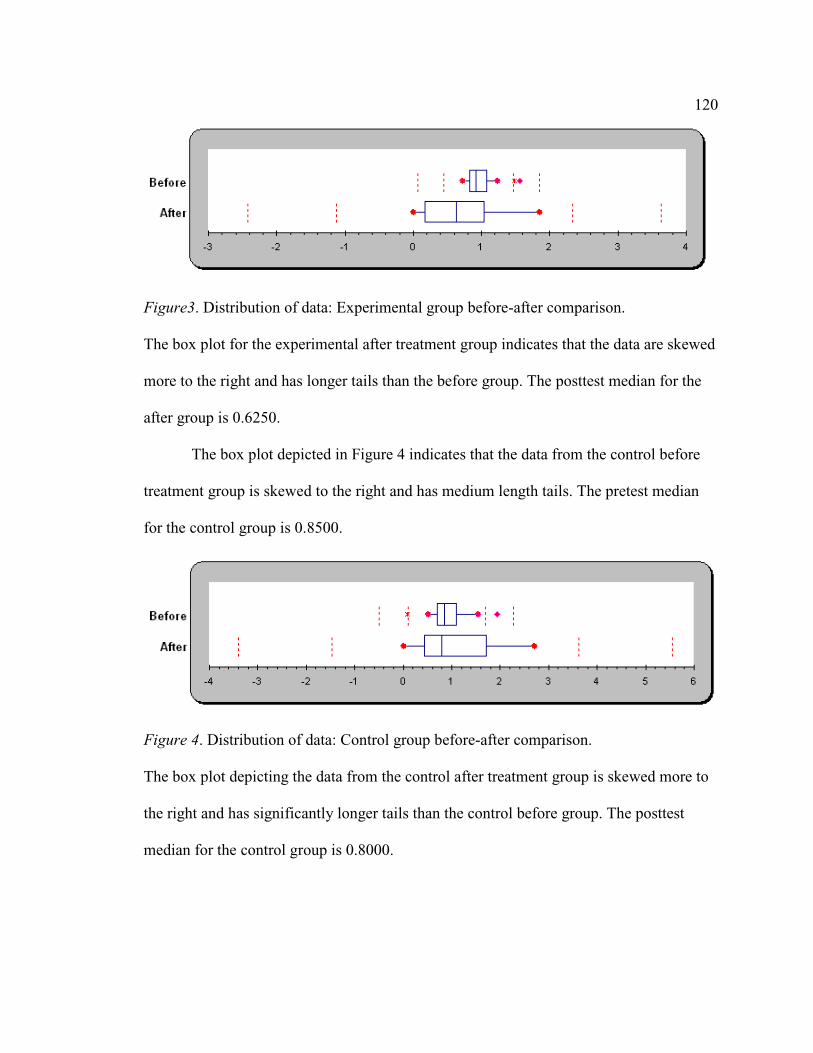
120
Figure3. Distribution of data: Experimental group before-after comparison.
The box plot for the experimental after treatment group indicates that the data are skewed
more to the right and has longer tails than the before group. The posttest median for the
after group is 0.6250.
The box plot depicted in Figure 4 indicates that the data from the control before
treatment group is skewed to the right and has medium length tails. The pretest median
for the control group is 0.8500.
Figure 4. Distribution of data: Control group before-after comparison.
The box plot depicting the data from the control after treatment group is skewed more to
the right and has significantly longer tails than the control before group. The posttest
median for the control group is 0.8000.
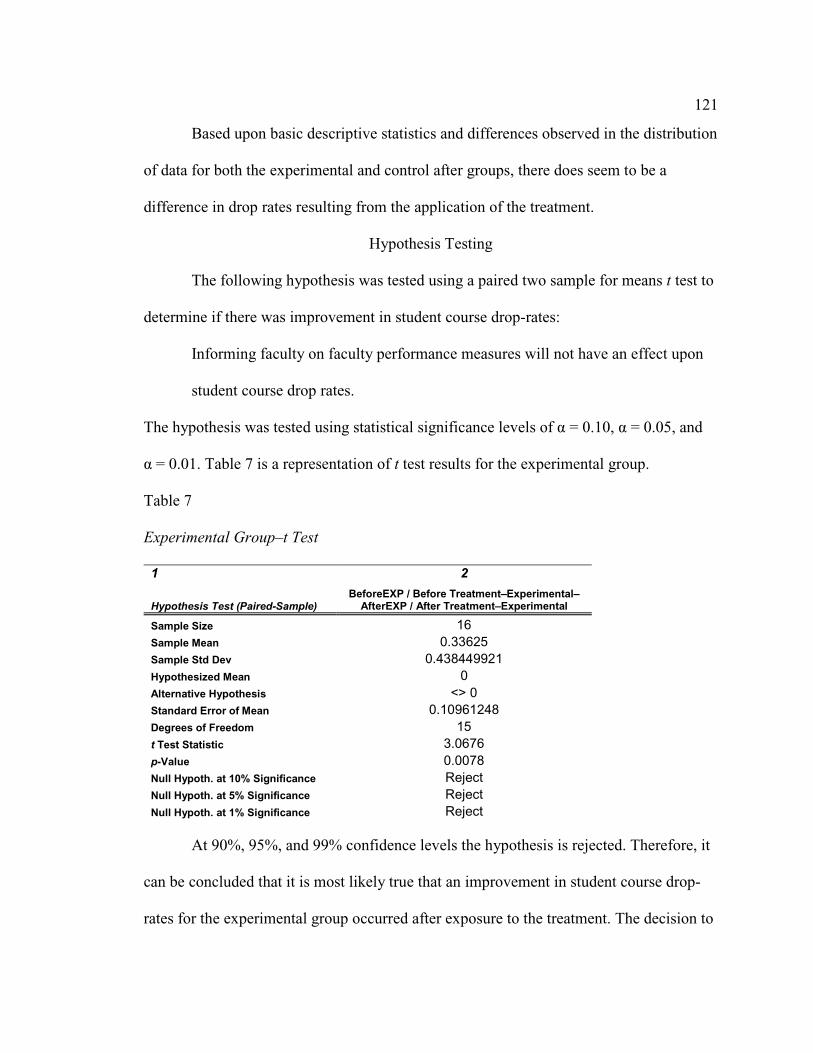
121
Based upon basic descriptive statistics and differences observed in the distribution
of data for both the experimental and control after groups, there does seem to be a
difference in drop rates resulting from the application of the treatment.
Hypothesis Testing
The following hypothesis was tested using a paired two sample for means t test to
determine if there was improvement in student course drop-rates:
Informing faculty on faculty performance measures will not have an effect upon
student course drop rates.
The hypothesis was tested using statistical significance levels of α = 0.10, α = 0.05, and
α = 0.01. Table 7 is a representation of t test results for the experimental group.
Table 7
Experimental Group–t Test
1 2
Hypothesis Test (Paired-Sample) BeforeEXP / Before Treatment–Experimental–
AfterEXP / After Treatment–Experimental
Sample Size 16 Sample Mean 0.33625 Sample Std Dev 0.438449921 Hypothesized Mean 0 Alternative Hypothesis <> 0 Standard Error of Mean 0.10961248 Degrees of Freedom 15 t Test Statistic 3.0676 p-Value 0.0078 Null Hypoth. at 10% Significance Reject Null Hypoth. at 5% Significance Reject Null Hypoth. at 1% Significance Reject
At 90%, 95%, and 99% confidence levels the hypothesis is rejected. Therefore, it
can be concluded that it is most likely true that an improvement in student course drop-
rates for the experimental group occurred after exposure to the treatment. The decision to
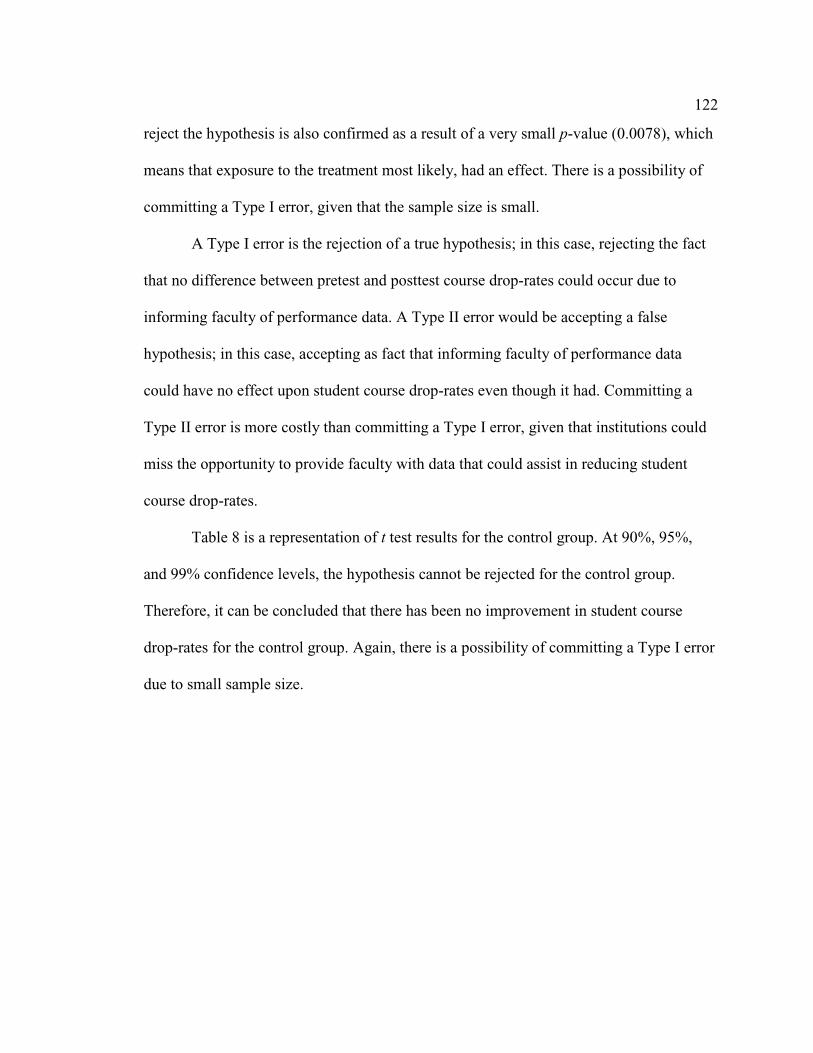
122
reject the hypothesis is also confirmed as a result of a very small p-value (0.0078), which
means that exposure to the treatment most likely, had an effect. There is a possibility of
committing a Type I error, given that the sample size is small.
A Type I error is the rejection of a true hypothesis; in this case, rejecting the fact
that no difference between pretest and posttest course drop-rates could occur due to
informing faculty of performance data. A Type II error would be accepting a false
hypothesis; in this case, accepting as fact that informing faculty of performance data
could have no effect upon student course drop-rates even though it had. Committing a
Type II error is more costly than committing a Type I error, given that institutions could
miss the opportunity to provide faculty with data that could assist in reducing student
course drop-rates.
Table 8 is a representation of t test results for the control group. At 90%, 95%,
and 99% confidence levels, the hypothesis cannot be rejected for the control group.
Therefore, it can be concluded that there has been no improvement in student course
drop-rates for the control group. Again, there is a possibility of committing a Type I error
due to small sample size.
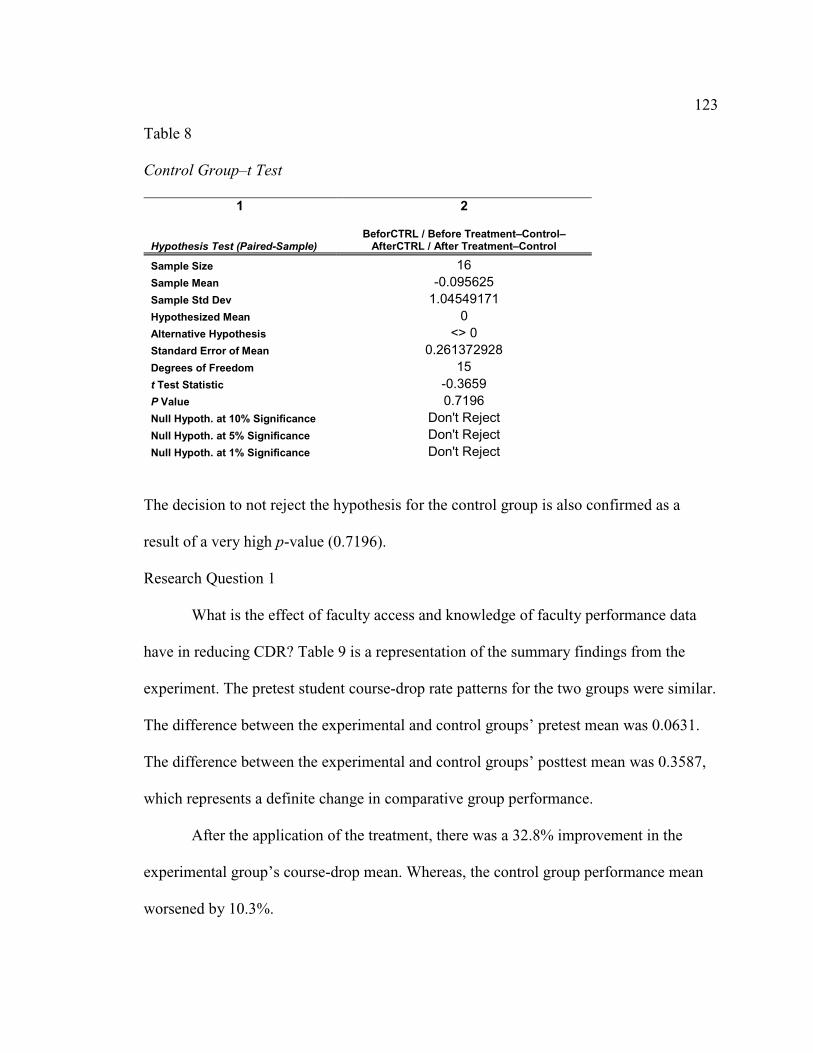
123
Table 8
Control Group–t Test
1 2
Hypothesis Test (Paired-Sample) BeforCTRL / Before Treatment–Control–
AfterCTRL / After Treatment–Control
Sample Size 16 Sample Mean -0.095625 Sample Std Dev 1.04549171 Hypothesized Mean 0 Alternative Hypothesis <> 0 Standard Error of Mean 0.261372928 Degrees of Freedom 15 t Test Statistic -0.3659 P Value 0.7196 Null Hypoth. at 10% Significance Don't Reject Null Hypoth. at 5% Significance Don't Reject Null Hypoth. at 1% Significance Don't Reject
The decision to not reject the hypothesis for the control group is also confirmed as a
result of a very high p-value (0.7196).
Research Question 1
What is the effect of faculty access and knowledge of faculty performance data
have in reducing CDR? Table 9 is a representation of the summary findings from the
experiment. The pretest student course-drop rate patterns for the two groups were similar.
The difference between the experimental and control groups’ pretest mean was 0.0631.
The difference between the experimental and control groups’ posttest mean was 0.3587,
which represents a definite change in comparative group performance.
After the application of the treatment, there was a 32.8% improvement in the
experimental group’s course-drop mean. Whereas, the control group performance mean
worsened by 10.3%.
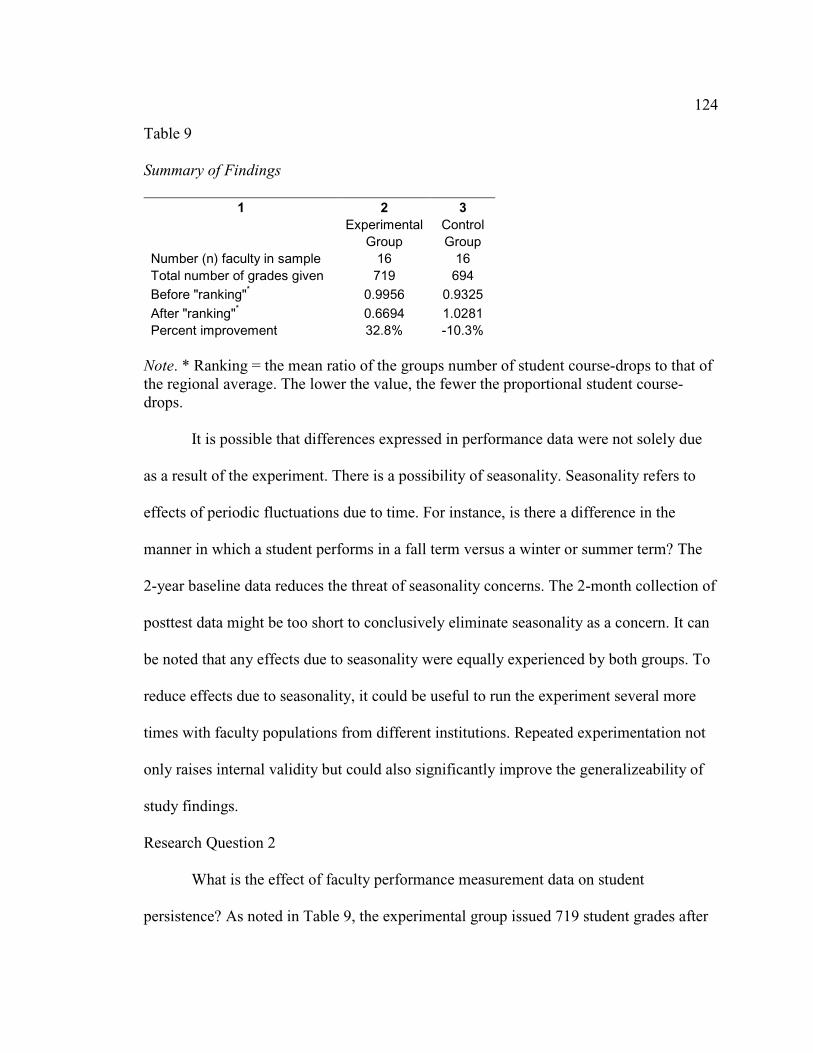
124
Table 9
Summary of Findings
1 2 3 Experimental Control Group Group Number (n) faculty in sample 16 16 Total number of grades given 719 694 Before "ranking"* 0.9956 0.9325 After "ranking"* 0.6694 1.0281 Percent improvement 32.8% -10.3%
Note. * Ranking = the mean ratio of the groups number of student course-drops to that of the regional average. The lower the value, the fewer the proportional student course-drops.
It is possible that differences expressed in performance data were not solely due
as a result of the experiment. There is a possibility of seasonality. Seasonality refers to
effects of periodic fluctuations due to time. For instance, is there a difference in the
manner in which a student performs in a fall term versus a winter or summer term? The
2-year baseline data reduces the threat of seasonality concerns. The 2-month collection of
posttest data might be too short to conclusively eliminate seasonality as a concern. It can
be noted that any effects due to seasonality were equally experienced by both groups. To
reduce effects due to seasonality, it could be useful to run the experiment several more
times with faculty populations from different institutions. Repeated experimentation not
only raises internal validity but could also significantly improve the generalizeability of
study findings.
Research Question 2
What is the effect of faculty performance measurement data on student
persistence? As noted in Table 9, the experimental group issued 719 student grades after
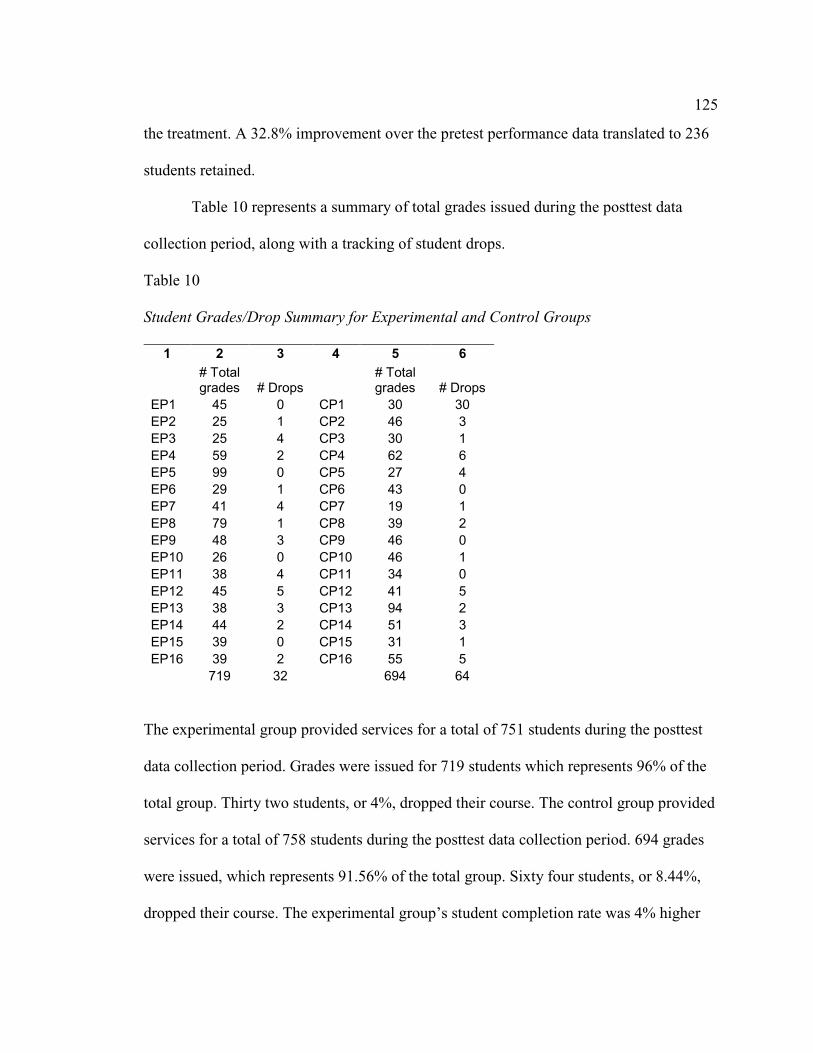
125
the treatment. A 32.8% improvement over the pretest performance data translated to 236
students retained.
Table 10 represents a summary of total grades issued during the posttest data
collection period, along with a tracking of student drops.
Table 10
Student Grades/Drop Summary for Experimental and Control Groups
1 2 3 4 5 6
# Total grades # Drops
# Total grades # Drops
EP1 45 0 CP1 30 30 EP2 25 1 CP2 46 3 EP3 25 4 CP3 30 1 EP4 59 2 CP4 62 6 EP5 99 0 CP5 27 4 EP6 29 1 CP6 43 0 EP7 41 4 CP7 19 1 EP8 79 1 CP8 39 2 EP9 48 3 CP9 46 0 EP10 26 0 CP10 46 1 EP11 38 4 CP11 34 0 EP12 45 5 CP12 41 5 EP13 38 3 CP13 94 2 EP14 44 2 CP14 51 3 EP15 39 0 CP15 31 1 EP16 39 2 CP16 55 5 719 32 694 64
The experimental group provided services for a total of 751 students during the posttest
data collection period. Grades were issued for 719 students which represents 96% of the
total group. Thirty two students, or 4%, dropped their course. The control group provided
services for a total of 758 students during the posttest data collection period. 694 grades
were issued, which represents 91.56% of the total group. Sixty four students, or 8.44%,
dropped their course. The experimental group’s student completion rate was 4% higher
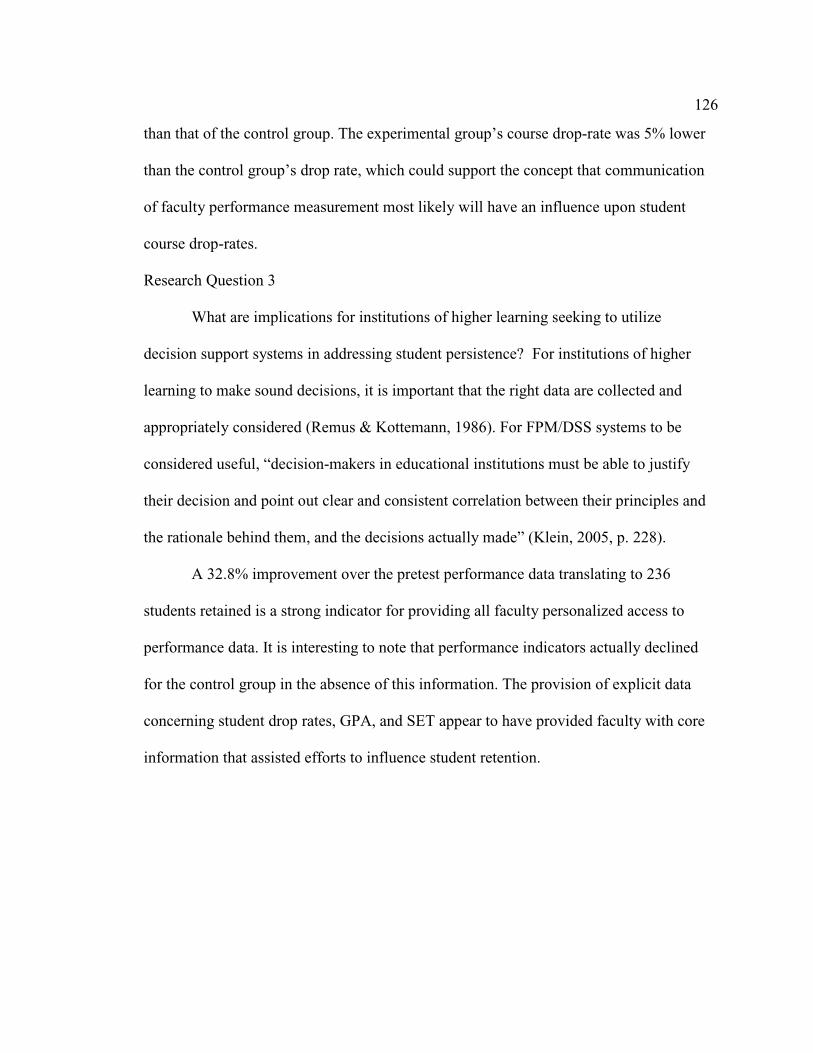
126
than that of the control group. The experimental group’s course drop-rate was 5% lower
than the control group’s drop rate, which could support the concept that communication
of faculty performance measurement most likely will have an influence upon student
course drop-rates.
Research Question 3
What are implications for institutions of higher learning seeking to utilize
decision support systems in addressing student persistence? For institutions of higher
learning to make sound decisions, it is important that the right data are collected and
appropriately considered (Remus & Kottemann, 1986). For FPM/DSS systems to be
considered useful, “decision-makers in educational institutions must be able to justify
their decision and point out clear and consistent correlation between their principles and
the rationale behind them, and the decisions actually made” (Klein, 2005, p. 228).
A 32.8% improvement over the pretest performance data translating to 236
students retained is a strong indicator for providing all faculty personalized access to
performance data. It is interesting to note that performance indicators actually declined
for the control group in the absence of this information. The provision of explicit data
concerning student drop rates, GPA, and SET appear to have provided faculty with core
information that assisted efforts to influence student retention.
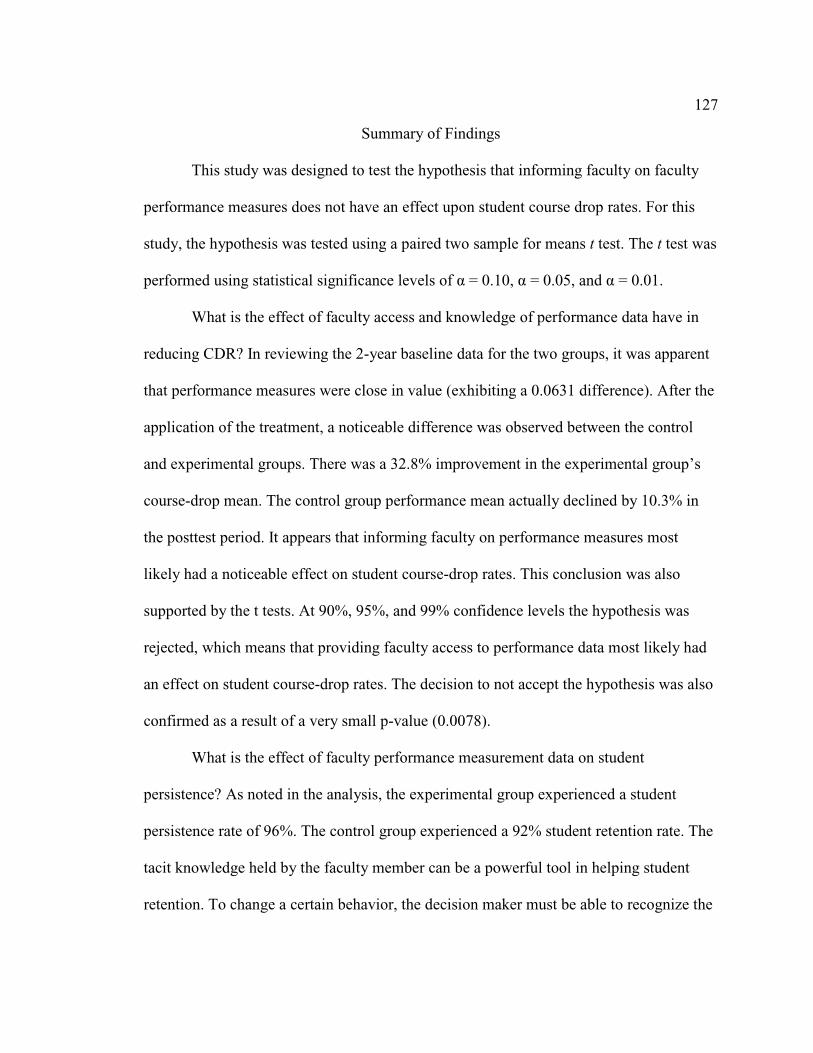
127
Summary of Findings
This study was designed to test the hypothesis that informing faculty on faculty
performance measures does not have an effect upon student course drop rates. For this
study, the hypothesis was tested using a paired two sample for means t test. The t test was
performed using statistical significance levels of α = 0.10, α = 0.05, and α = 0.01.
What is the effect of faculty access and knowledge of performance data have in
reducing CDR? In reviewing the 2-year baseline data for the two groups, it was apparent
that performance measures were close in value (exhibiting a 0.0631 difference). After the
application of the treatment, a noticeable difference was observed between the control
and experimental groups. There was a 32.8% improvement in the experimental group’s
course-drop mean. The control group performance mean actually declined by 10.3% in
the posttest period. It appears that informing faculty on performance measures most
likely had a noticeable effect on student course-drop rates. This conclusion was also
supported by the t tests. At 90%, 95%, and 99% confidence levels the hypothesis was
rejected, which means that providing faculty access to performance data most likely had
an effect on student course-drop rates. The decision to not accept the hypothesis was also
confirmed as a result of a very small p-value (0.0078).
What is the effect of faculty performance measurement data on student
persistence? As noted in the analysis, the experimental group experienced a student
persistence rate of 96%. The control group experienced a 92% student retention rate. The
tacit knowledge held by the faculty member can be a powerful tool in helping student
retention. To change a certain behavior, the decision maker must be able to recognize the
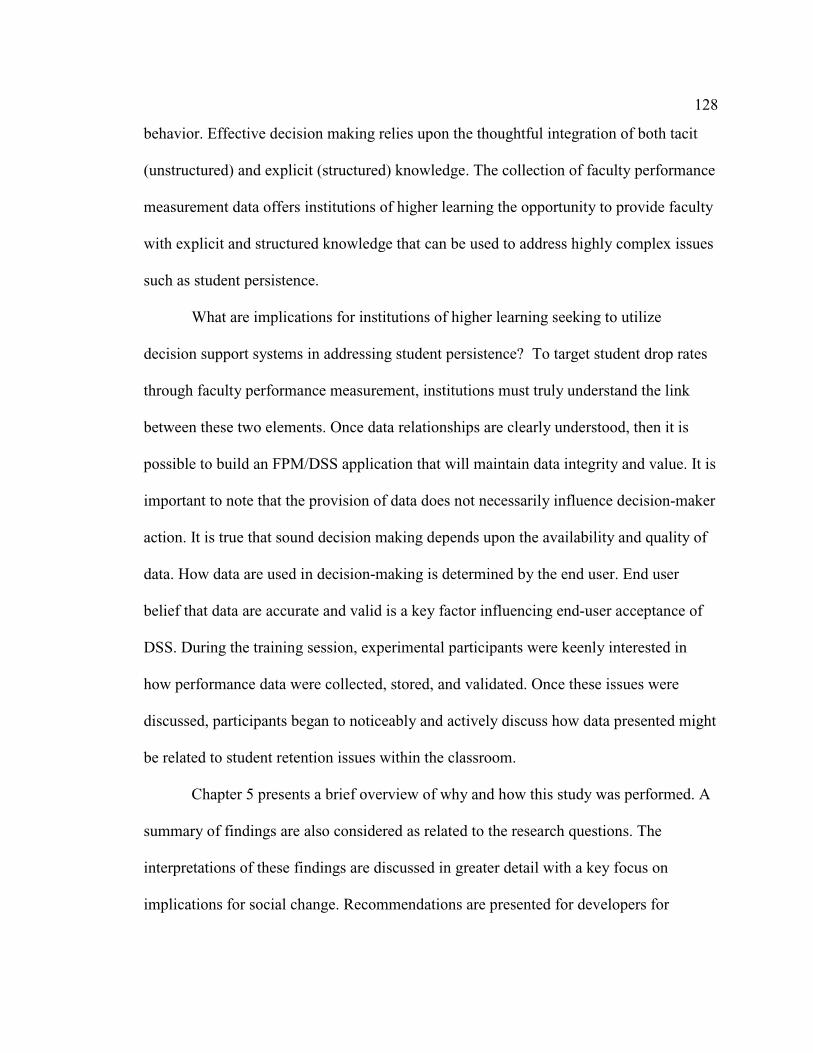
128
behavior. Effective decision making relies upon the thoughtful integration of both tacit
(unstructured) and explicit (structured) knowledge. The collection of faculty performance
measurement data offers institutions of higher learning the opportunity to provide faculty
with explicit and structured knowledge that can be used to address highly complex issues
such as student persistence.
What are implications for institutions of higher learning seeking to utilize
decision support systems in addressing student persistence? To target student drop rates
through faculty performance measurement, institutions must truly understand the link
between these two elements. Once data relationships are clearly understood, then it is
possible to build an FPM/DSS application that will maintain data integrity and value. It is
important to note that the provision of data does not necessarily influence decision-maker
action. It is true that sound decision making depends upon the availability and quality of
data. How data are used in decision-making is determined by the end user. End user
belief that data are accurate and valid is a key factor influencing end-user acceptance of
DSS. During the training session, experimental participants were keenly interested in
how performance data were collected, stored, and validated. Once these issues were
discussed, participants began to noticeably and actively discuss how data presented might
be related to student retention issues within the classroom.
Chapter 5 presents a brief overview of why and how this study was performed. A
summary of findings are also considered as related to the research questions. The
interpretations of these findings are discussed in greater detail with a key focus on
implications for social change. Recommendations are presented for developers for

129
enhanced DSS development. Finally, the chapter concludes with recommendations for
further study.
CHAPTER 5: SUMMARY, CONCLUSIONS, AND RECOMMENDATIONS
Summary
Institutions of higher learning have long sought ways to help students realize their
educational goals. Student persistence has risen to become a major issue that directly
impacts student success. A continued problem exists in that student course-drop rates
remain at high levels with attrition rates ranging from 10% to as much as 80%
(Braunstein et al., 2006, p. 33). Institutions have attempted to better understand student
persistence through the collection of large amounts of data related to student,
instructional, program, and institutional performance. Much of this data were collected
across multiple disparate systems, which makes data utilization and interpretation a
highly complex and sometimes arduous process. Institutions have been tracking faculty
performance measurement data such as student evaluation of teaching, faculty grade
variance, as well as, student drop rates by course for many years. Data-driven institutions
have sought to use faculty performance data as a means to better understand forces that
come into play within the classroom.
After performing a detailed literature review, the researcher discovered there was
a lack of understanding as to how individual knowledge of faculty performance data
effects student course-drop rates. The pertinent question was how faculty performance
measurement can be used to supplement faculty efforts in addressing student attrition.
This study was performed to provide empirical data that tested the potential link between
faculty awareness and knowledge of performance data with student course-drop rates.
This quantitative study utilized an experimental pretest-posttest equivalent groups
design to test the hypothesis that informing faculty on faculty performance measures does
131
not have an effect upon student course drops rates. The study was conducted with a
randomly selected sample of 32 participants from a population of 76 actively teaching
adjunct faculty which was divided into two equal groups, experimental and control. The
institutional setting was a private, nontraditional university that provides both
undergraduate and graduate business degrees for students located in the San Francisco
Bay Area region in Northern California.
2 years of faculty performance data were collected and organized for study
participants. This data included college, course, faculty name, local faculty GPA, regional
GPA, local student course drops, regional course drops, local faculty SET, and regional
faculty SET. Faculty currently have no direct access to this datum. Experimental
participants were given their individual performance data at a 3-hour training session on
faculty performance measurement and student persistence. Data were then collected for a
2-month period after the treatment and compared with a control group that had not been
exposed to the treatment.
The study compared student drop rates for faculty prior to the treatment and after.
The potential link between the two data sets was evaluated using a parametric paired
simple t test. The paired simple test was used to evaluate the means of Faculty Informed
Drop Rates (FiDR) with Faculty Non-Informed Drop Rates (FniDR). Given the small
sample size of 32 participants, at a 95% confidence level there is a 13.2% margin of
error. For this reason, the hypothesis was tested using statistical significance levels of α =
0.10, α = 0.05, and α =.01. At 90%, 95%, and 99% confidence levels the hypothesis was
rejected. Therefore, it was concluded that there had most likely been an improvement in
132
student course drop-rates for the experimental group after exposure to the treatment. The
decision to not accept the hypothesis was also confirmed as a result of a very small p-
value (0.0078).
Conclusions
Research Question 1
What is the effect of faculty access and knowledge of faculty performance data
have in reducing CDR? It was concluded that informing faculty of individual
performance measures did have an impact on student-course drop rates. There are many
forces that influence a student’s decision to a drop a course. There are many factors
outside the control of faculty when attempting to influence student persistence. While
faculty may have little or no control in certain areas, the provision of performance
measures provides faculty with meaningful explicit data points that can be used to help
guide faculty and institutional efforts in reducing student course-drop rates. This study
has shown that motivated faculty through self-determination theory (SDT) can make a
significant difference in reducing student course-drop rates if provided with data that can
be used in guiding adaptive faculty behavior. Faculty awareness and sensitivity to
persistence data provides for greater opportunities in developing strategies and
instructional approaches in raising student success.
The provision of faculty performance measurement data assists faculty in the
design phase of decision-making. The design phase, or invention of solutions, is where
faculty can use data to study past indicators that might be influencing student persistence.
Consequently, faculty personal decision making (PDM) is significantly improved given
133
the availability of meaningful performance data. From this more informed position;
faculty can make better choices in determining future courses of action in response to
data patterns expressed via an FPM/DSS application.
Research Question 2
What is the effect of faculty performance measurement data on student
persistence? There is a significant positive effect faculty performance measurement data
can have in addressing student persistence. Data unto itself cannot have an effect upon
environmental conditions. It is the distribution and perceived value of data that most
influences decision makers in altering their actions. The measurement of faculty GPA,
student evaluation of teaching, and overall course drop rate patterns provide differing
data points that can be used to better understand the interactions and interdependencies of
highly complex variables.
Conventional wisdom holds that one cannot control what is not measured or
perceived. FPM/DSS applications have the potential to assist in raising personal
efficiencies through the provision of broader access to and manipulative control of large
data stores. The decision-making process is significantly enhanced given the expedited
nature of automated data access found within FPM/DSS applications. Decision-making is
also improved when vast and isolated data stores from across the organization are
brought together within a centralized and cohesive FPM/DSS system.
The provision of an FPM/DSS application provides decision makers with the
ability for continual learning and process improvement. Combined with SDT, individuals
can continually seek to achieve performance above and beyond expectations. The
134
findings within this study support the perspective that informed knowledge workers can
have a greater positive influence over complex concerns such as student persistence, even
if many of the influencing variables are outside of their direct control.
Research Question 3
What are implications for institutions of higher learning seeking to utilize
decision support systems in addressing student persistence? To make more effective
decisions it is necessary to provide decision makers with data which is accurate,
consistent, and clearly identifies forces that influence the outcome of the decision. To
increase organizational and faculty response to student persistence concerns, it is
necessary to provide faculty with the key tools (data) that assist in raising student
confidence, security, and success. Experimental results from this study indicated that in
the absence of faculty performance measurement data, student course-drop rates
worsened for the control group.
The creation of an FPM/DSS system can have a significant influence in assisting
institutions of higher learning in responding to student persistence forces. Effective
decision making is reliant upon the decision maker’s ability to manipulate, reconcile, and
synthesize structured and unstructured data to derive a better solution. The development
of an accurate and user-accepted FPM/DSS could provide educators with essential data
that could be useful in assessing how best to create and nurture an effective student-
centered learning environment.
During the experiment, it was observed that participant acceptance of faculty
performance data validity was highly dependent upon the transparency of data collection,
135
storage, and manipulation activities. As mentioned earlier, human engineering is an
important developmental factor that influences overall system performance. The 3-hour
training session was an essential component that offered participants the opportunity to
critically discuss and assess the overall perceived value proposition of the data being
measured and presented.
Implications for Social Change
The progression of scientific study may be considered a refinement of current
paradigm principles in seeking better articulation of phenomena and theories already
established. This concept of refinement gains considerable weight when adding
perspectives such as Karl Popper’s empirical falsification where scientific study is not the
establishment of new theory, but the disconfirmation of previous assumptions
(Rosenberg, 2000).
Kuhn (1996) wrote,
But those restrictions, born from the confidence in a paradigm, turn out to be essential to the development of science. By focusing attention upon a small range of relatively esoteric problems, the paradigm forces the scientist to investigate some part of nature in a detail and depth that would otherwise be unimaginable. (p.24)
To invoke true social change within higher education, institutions must critically test
current perceptions as to how forces such as faculty performance interact and ultimately
influence student persistence. To understand and influence a phenomenon, researchers
are to raise the integrity of perceptions. The integrity of perceptions can be raised through
continued empirical testing (Kuhn, 1996). This study has tested the condition that faculty
awareness and receptivity to performance data can tremendously influence student

136
persistence. For institutions to positively impact dynamic and complex student
persistence conditions, these entities should reassess the nature, composition and use of
performance data.
There is little debate that the social and economic strength and stability of a nation
is dependent upon the level of education found within its population. There exists an
important need to for academic institutions to reassess how students are being served
given the rise of student persistence as a social problem. An individual’s quality of life
can be greatly improved through higher education. Course-drop rates represent a
disruptive force within students’ educational careers. Students who persist in their
courses have a greater potential for better paying careers, higher levels of self-esteem,
and an overall improved quality of life. As nations become more susceptible to hyper-
competitive global markets, it has become apparent that the social responsibility for
institutions of higher learning must change.
To meet current social demands, institutions of higher learning must develop a
student-centered culture where both the institution and faculty are focused upon
determining strategies for greater student retention, growth, and graduation. To
accomplish these objectives, these entities need to identify causal factors that may
influence actual student drops rates. The development of sophisticated FPM/DSS
applications can greatly assist in the quest to invoke positive change in course drops
rates.
137
Recommendations for Developers
For institutions to truly capture the essence of student persistence conditions, they
must reevaluate the selection, capture, and manipulation of data as related to this
phenomenon. The challenge then becomes the identification of appropriate data that
could lead towards a better understanding the nature of factors that influence instructional
quality and student learning. While FPM/DSS applications can possess great promise,
there are significant concerns that must be addressed when designing and implementing
these applications. Rather than attributing student persistence issues on students,
institutions, or faculty, it is more important to study the linkages between these
shareholders so that one might develop better programs and approaches that respond to
the needs of retention issues.
There are several implications for developers that arose from this study. A keen
developmental eye must focus upon data collection, manipulation, and output as related
to decision making; in this case, student persistence. Ultimately, a gap analysis must be
made that identifies any discrepancies between available resources and desired decisional
outcomes. It is necessary to study the data, processes, and operational conditions that are
unique to complex decisional environments such as performance and persistence
measures. The ultimate goal for the creation of an effective FPM/DSS system requires
thoughtful planning in bringing disparate systems together within centralized enterprise-
level architecture.
From a technical perspective, developers must study existing application metadata
to see what database management system (DBMS) applications have been developed.
138
They must then identify how operational rules have been incorporated within data and
application structures. Developers must also consider data constraints such as validation
rules, interface design, and data/application distribution (i.e., centralized data with
distributed client/server applications). The solution for addressing system and data
disparity resides in the developer’s true understanding of the existing systems both in
construction and operation, along with an intuitive understanding of the decisional
context systems need to support. When approaching FPM/DSS development it will be
necessary to build upon existing data-driven DSS applications, moving to a more
knowledge-driven DSS approach since end users are more inclined to embrace systems
that closely align with their individual decisional needs and style.
To provide a system that can effectively support dynamic and highly complex
decision-making environments, developers must be intimately aware of the human aspect
within the process. As previously noted, study observations indicated that a high level of
end user involvement and developmental transparency led to a greater data acceptance.
User acceptance of the data value led to a positive influence in reducing student course-
drops rates.
Recommendations for Further Study
The findings presented in this study have identified that a link does exist between
faculty knowledge of performance data and student persistence. There are several
important areas where this study can be expanded upon. As noted earlier, the small
sample size within this study limits overall generalizeability of findings. It could be very
beneficial to have a similar experiment performed with a significantly larger sample from
139
another institution to validate these early findings. Future experimentation could also be
useful if run for a longer duration of posttest data collection. A longer posttest data
collection period could further reduce the chances of seasonality effects on the data and,
more importantly, the durability of personal change or experimenter effects. The
researcher might also consider administering pretest and posttest questionnaires in
addition to running the experiment. The addition of a questionnaire instrument could
potentially provide more insight as to changes in participant perceptions as a result of the
study.
As noted in chapter 2, there is a great deal of research concerning SET. A major
emerging controversy associated with SET involves the evolution and implementation of
computerized survey applications. There are several important questions to be studied
concerning the validity of electronic SET, student/faculty acceptance of SET, electronic
SET effectiveness as compared with traditional pen and paper evaluation processes.
The emergence of decision support systems as a field of study has raised several
important questions as to the evolution of decision-making modeling, issues surrounding
the decision-maker, decisional tasks, along with the importance of understanding
decisional context and strategies.
From simple spreadsheets and reports to decision support systems, data warehousing, data mining, knowledge management, and expert systems, a wide range of technologies intended to support and assist decision makers in organizations has evolved over the last three decades. to design and implement these decision support technologies more effectively, it is important to understand how they influence the process and outcomes of managerial decision making. (Todd & Benbasat, 2000, p. 1)
140
A fundamental question that has yet to be comprehensively answered, let alone
communally accepted, is what impact does the linkages between process, task, the
person, and technology has on the quality of a decision. A future study might explore the
relationship between student performance, faculty performance, and persistence rates as
related to the development of early warning systems. An unrealized potential for
FPM/DSS lies in the potential predictive power such applications may provide.
Another important area for study could be in exploring how colleges and
universities currently utilize decision support systems to support students who are at high
risk in failing to persist. During the literature review, forces influencing a student’s
decision to drop were identified. There still remains a great uncertainty as to how
decision support systems can be used to preemptively support student success during
their studies. How might faculty use DSS systems to improve student/faculty
communication? How might DSS systems be used to identify/predict potential areas of
student failure? How might DSS systems be used by the student to develop a strong path
of study based upon current skills, aptitude, and performance? It is important to note that
society is entering into a new world where forces of globalization have increased the
pressure on society to properly raise the educational levels of its population.
Concluding Statement
Institutions of higher education have a clear challenge before them when
considering the complex problem of student persistence. It is evident that data-driven
institutions must thoughtfully consider what data are being tracked and, more
importantly, why. For an FPM/DSS application to be truly effective, it is necessary that

141
the perspectives and attitudes of all stakeholders are taken into consideration as these
systems are developed. As demonstrated by this experiment, there is great potential for
FPM/DSS applications to provide the necessary information that enables faculty and
institutions to offer meaningful assistance in helping students succeed.
REFERENCES
Aczel, A. D., & Sounderpandian, J. (2006). Complete business statistics (6th ed.). New York: McGraw-Hill Irwin.
Adams, J. (2003, Autumn). Assessing faculty performance for merit: An academic accomplishment index. Journalism & Mass Communication Educator, 58(3), 240-250.
Agrell, P. J., & Steuer, R. E. (2000, April 6). ACADEA–A decision support system for faculty performance. Journal of Multi-Criteria Decision Analysis, 9(5), 191-204.
Alter, S. (2002). A work system view of DSS in its fourth decade. Eighth Americas Conference on Information Systems, 1(1), 150-156.
Alter, S. L. (1980). Decision support systems: Current practice and continuing challenges. Reading, MA: Addison-Wesley Publishing Company.
Ashby, A. (2004, February). Monitoring student retention in the open university: definition, measurement, interpretation and action. Open Learning, 19(1), 65-77.
Baldwin, T., & Blattner, N. (2003). Guarding against potential bias in student evaluations: what every faculty member needs to know. Manuscript in preparation. Retrieved May 3, 2007, from http://www.accessmylibrary.com/comsite5/bin/comsite5.pl?page=document_print&item
Bass, B. M., & Riggio, R. E. (2006). Transformational leadership (Second ed.). Mahwah, NJ: Lawrence Erlbaum Associates, Publishers.
Blanton, L. P., Sindelar, P. T., & Correa, V. I. (2006). Models and measures of beginning teacher quality. Journal of Special Education, 40(2), 115-127.
Bosshardt, W., & Kennedy, P. (2004). Student drops and failure in principles courses. Journal of Economic Education, 35(2), 111-128.
Braunstein, A. W., Lesser, M., & Pescatrice, D. R. (2006). The business of freshmen student retention: Financial, institutional, and external factors. Journal of Business & Economic Studies, 12(2), 33-53.
Cade, B. S., Richards, J. D., & Mielke, P. W.Jr (2006). Rank score and permutation testing alternatives for regression quantile estimates. Journal of Statistical Computation & Simulation, 76(4), 331-355.
143
Chalmeta, R., & Grangel, R. (2005). Performance measurement systems for virtual enterprise integration. International Journal of Computer Integrated Manufacturing, 18(1), 73-84.
Chang, J. C., & King, W. R. (2005). Measuring the performance of information systems: a functional scorecard. Journal of Management Information Systems, 22(1), 85-115.
Changeau, D. (2004). Citizenship and constructing sense in voting: An experimental approach. Conference Papers -- American Sociological Association, 1(1), 1-16.
Christie, H., Munro, M., & Fisher, T. (2004). Leaving university early: exploring the differences between continuing and non-continuing students. Studies in Higher Education, 29(5), 617-636.
Cody, W. F. (2002). The integration of business intelligence and knowledge management. IBM Systems Journal, 22(1), 85-115.
Cornell, R., & Mosley, M. L. (2006). Intertwining college with real life: The community college first-year experience. Peer Review, 8(3), 23-25.
Cox, P. L., Schmitt, E. D., Bobrowski, P. E., & Graham, G. (2005). Enhancing the first-year experience for business students: Student retention and academic success. Journal of Behavioral & Applied Management, 7(1), 40-68.
Creative Research Systems (2003). Sample size formulas. Manuscript in preparation. Retrieved January 1, 2007, from http://www.surveysystem.com/ssformu.htm
Dahl, J. (2004). Strategies for 100 percent retention: Feedback, interaction. Distance Education, 8(16), 5-7.
Davenport, T. H., & Harris, J. G. (2005). Automated decision making comes of age: after decades of anticipation, the promise of automated decision-making systems is finally becoming a reality in a variety of industries. MIT Sloan Management Review, 46(4). Retrieved May 14, 2007, from http://www.accessmylibrary/coms2/summary-0286-11973698_ITM
Davenport, T. H., & Prusak, L. (2000). Working knowledge: How organizations manage what they know. Boston: Harvard Business School Press.
De Anda, D. (2007). Intervention research and program evaluation in the school setting: Issues and alternative research designs. Children & Schools, 29(2), 87-94.
Devonport, T. J., & Lane, A. M. (2006). Relationships between self-efficacy, coping and student retention. Social Behavior and Personality, 34(2), 127-138.

144
Dooris, M. J. (2002). Institutional research to enhance faculty performance. New Directions for Institutional Research, 114(1), 85-95.
Engelland, B. T. (2004). Making effective use of student evaluations to improve teaching performance. Journal for Advancement of Marketing Education, 5(1), 40-46.
Feldman, P. (2005). Faculty performance reviews: Accountability in teacher education. Education, 125(3), 349-352.
Fenner, D. B., Lerch, F. J., & Kulik, C. T. (1990). Computerized performance monitoring and performance appraisal. ACM SIGCHI Bulletin, 21(3), 25-29.
Fouladi, R. T., & Shieh, Y. (2004). A comparison of two general approaches to mixed model longitudinal analyses under small sample size conditions. Communications in Statistics: Simulation & Computation, 33(3), 807-824.
Freeman, J., & Modarres, R. (2006, June). Efficiency of t -test and hotelling's T 2 -test after box-cox transformation. Communications in Statistics: Theory & Methods, 35(6), 1109-1122.
Fujian, S., Jerosch-Herold, C., Holland, R., De Loudes Drachler, M., Mares, K., & Harvey, I. (2006, April). Statistical methods for analyzing barthel scores in trials of poststroke interventions: a review and computer simulations. Clinical Rehabilitation, 20(4), 347-356.
GNU (2007, March). Pretest-posttest control group design. Manuscript in preparation. Retrieved January 1, 2008, from http://www.informatics-review.com/wiki/index.php/Pretest-Posttest_Control_Group_Design
Gaide, S. (2004). Community college identifies student expectations as key element in online retention. Distance Education Report, 8(15), 4-6.
George, J. F. (1996, December). Computer-based monitoring: Common perceptions and empirical results. MIS Quarterly, 459-480.
Gregory, L. (2005). Student retention through teaching: Teacher immediacy in the enrollment management funnel. Conference Papers–International Communication Association, 1-23.
Haag, S., Cummings, M., & McCubbrey, D. J. (2004). Management information systems for the information age (4th ed.). New York: McGraw-Hill/Irwin.
Halat, E. (2007). Reform- based curriculum and acquisition of the levels. Eurasia Journal of Mathematics, Science & Technology Education, 3(1), 1-49.
145
Halit, K. (2005). The relationships between explicit and tacit oriented KM strategy, and firm performance. Journal of American Academy of Business, 7(1), 169-175.
Heffner, C. L. (2004, March 11). Research methods. Manuscript in preparation. Retrieved October 3, 2007, from http://allpsych.com/researchmethods/trueexperimentaldesign.html
Herzog, S. (2005). Measuring determinants of student return vs. dropout/stopout vs. transfer: A First-to-Second Year Analysis of New Freshmen. Research in Higher Education, 46(8), 883-928.
Hobson, S. M. (2001). Understanding student evaluations. Manuscript in preparation. Retrieved May 20, 2007, from http://www.accessmylibrary.com/comsite5/bin/comsite5.pl?page=document_print&item
Hogarth, K., & Dawson, D. (2008). Implementing e-learning in organisations: What e-learning research can learn from instructional technology (IT) and organisational studies (OS) innovation studies. International Journal on E-Learning, 7(1), 87-105.
Holsapple, C., & Whinston, A. (2001). Decision support systems: A knowledge-based approach. Cincinnati: Thompson Learning Custom Publishing.
Hoplin, H. P. (1992). Information technologies for 1990's and beyond: people oriented research methods are changing information systems research. Manuscript in preparation. Retrieved March 13, 2007, from http://portal.acm.org/results.cfm?coll=portal&dl=ACM&CFID=2464946&CFTOKEN=84049044
Houghton, J. D., & Yoho, S. K. (2005). Toward a contingency model of leadership and psychological empowerment: When should self-leadership be encouraged?. Journal of Leadership and Organizational Studies, 11(4), 65-83.
Irving, R. H., Higgins, C. A., & Safayeni, F. R. (1986). Computerized performance monitoring systems: use and abuse. Communication of the ACM, 29(8), 794-801.
Jenkins, H. (2002, October). Smart reports: Business intelligence in a single-click, zero-footprint, secure environment. Manuscript in preparation. Retrieved April 10, 2007, from http://www.htmagazine.com/archive/Oct2002/Oct2002_7.html
Jones, A. (2006). The myths that drive data-driven schools. Education Digest, 71(5), 13-17.
146
Jones, M., Onslow, M., Packman, A., & Gebski, V. (2006). Guidelines for statistical analysis of percentage of syllables stuttered data. Journal of Speech, Language & Hearing Research, 49(4), 867-878.
Keen, P. G., & Morton, M. S. (1978). Decision support systems: An organizational perspective (1st ed.). Reading, MA: Addison-Wesley Publishing Company, Inc..
Kirwan, W. E. (2007). Higher education's "accountability" imperative: How the university system of Maryland responded. Change, 39(2), 21-25.
Klein, J. (2005). The contribution of a decision support system to complex educational decisions. Educational Research & Evaluation, 11(3), 221-234.
Klenke, K. (1991). New human resources infrastructures: computer mediated performance appraisals. Special Interest Group on Computer Personnel Research Annual Conference, 1(1), 80-93.
Kress, A. (2005). Transforming educational services for a changing student population at Santa Fe community college. Community College Journal of Research and Practice, 29(1), 655-656.
Kreulin, W. F., Krishna, J. T., & Spangler, W. S. (2002). The integration of business intelligence and knowledge management. IBM Systems Journal, 22(1), 85-115.
Kuhn, T. S. (1996). The Structure of Scientific Revolutions (3rd ed.). Chicago, IL: The University of Chicago Press, Ltd..
Lajer, K. (2007). Statistical tests as inappropriate tools for data analysis performed on
non-random samples of plant communities. Folia Geobotanica, 42(2), 115-122.
Lee, D. T. (1989). An overview of intelligent decision systems. Journal of Information Technology, 4(3), 123-135.
Lee, Y., & Chang, H. (2006). Leadership style and innovation ability: An empirical study of Taiwanese wire and cable companies. The Journal of American Academy of Business, Cambridge, 9(2), 218-222.
Li, Y., Tan, C., Teo, H., & Mattar, A. T. (2006). Motivating open source software developers: Influence of transformational and transactional leaderships. ACM SIG MIS-CPR, 1(1), 34-43.
Lincoln, T. D. (2004). Reviewing faculty competency and educational outcomes: The case of doctor of ministry education. Teaching Theology and Religion, 7(1), 13-19.

147
Linden, A. (2007). Use of the pre-post method to measure cost savings in disease management. Disease Management & Health Outcomes, 15(1), 13-18.
Liu, Y. (2007). A comparative study of learning styles between online and traditional students. Journal of Educational Computing Research, 37(1), 41-43.
Lumsden, K., & Scott, A. (1995). Evaluating faculty performance on executive programmes. Education Economics, 3(1), 19+.
Mallard, K. S., & Atkins, M. W. (2004). Changing academic cultures and expanding expectations: Motivational factors influencing scholarship at small christian colleges and universities. Christian Higher Education, 3(1), 373-389.
McArthur, R. C. (2005). Faculty -- Based advising: An important factor in community college retention. Community College Review, 32(4), 1-12.
McInnis, C. (2002). The impact of technology on faculty performance and its evaluation. New Directions for Institutional Research, 114(1), 53-95.
Meredith, J. R., & Mantel, S. J. (2003). Project management: A managerial approach (5th ed.). Hoboken: John Wiley & Sons, Inc.
Morton, M. S. (1971). Management decision systems (1st ed.). Boston: Harvard University, Division of Research.
Murnane, R., Sharkey, N., & Boudett, K. (2005). Using student-assessment results to improve instruction: Lessons from a workshop. Journal of Education for Students Placed at Risk, 10(3), 269-280.
OWL–Purdue University (2004). Evaluating sources of information. Retrieved May 12, 2007, from http://owl.english.purdue.edu/workshops/hypertext/EvalSrcW
Owusu, Y. A. (2006). Systems model for improving standards and retention in engineering education. The Journal of American Academy of Business, 8(1), 210-214.
Parkan, C., & Wu, M. (2000). Comparison of three modern multicriteria decision-making tools. International Journal of Systems Science, 31(4), 497-517.
Parmar, D., & Trotter, E. (2004). Keeping our students: identifying factors that influence student withdrawal and strategies to enhance the experience and retention of first-year students. Learning and Teaching in the Social Sciences, 1(3), 149-168.
Perkins, K. K., Adams, W. K., Pollock, S. J., Finkelstein, N. D., & Wieman, C. E. (2005). Correlating student beliefs with student learning using the Colorado learning attitudes about science survey. Physics Education Research Conference, 61-64.
148
Pompper, D. (2006). Toward a “relationship-centered” approach to student retention in higher education. Public Relations Quarterly, 51(2), 29-36.
Power, D. J. (2002). Decision support systems: Concepts and resources for managers. Westport, CT: Quorum Books.
Raykov, T., & Peney, S. (2005). Estimation of reliability for multiple-component measuring instruments in test-retest designs. British Journal of Mathematical & Statistical Psychology, 58(2), 285-299.
Remus, W. E., & Kotteman, J. E. (1986). Toward intelligent decision support systems: An artificially intelligent statistician. MIS Quarterly, 10(4), 402.
Richardson, J. T. (2005). Instruments for obtaining feedback: a review of literature. Assessment & Evaluation in Higher Education, 30(4), 387-415.
Robotham, D., & Julian, C. (2006). Stress and the higher education student: a critical review of the literature. Journal of Further and Higher Education, 30(2), 107-117.
Roman, M. A. (2007, Winter). Community college admission and student retention. Journal of College Admission, 19-23.
Rosenberg, A. (2000). Philosophy of science: A contemporary introduction (1st ed.). New York: Routledge.
Savalli, C., Paula, G. A., & Cysneiros, F. J. (2006). Assessment of variance components
in elliptical linear mixed models. Statistical Modeling: An International Journal, 6(1), 59-76.
Sibthorp, J., Paisley, K., Gookin, J., & Ward, P. (2007). Addressing response-shift bias: Retrospective pretests in recreation research and evaluation. Journal of Leisure Research, 39(2), 295-315.
Silberschatz, A., Korth, H. F., & Sudarshan, S. (2002). Database System Concepts (4th ed.). New York, N.Y.: McGraw-Hill.
Simon, H. A. (1960). The new science of decision making. New York: Harper & Row.
Simon, M. K. (2006). Dissertation & scholarly research: recipes for success. Dubuque, IA: Kendall/Hunt Publishing Company.
Singer, J. M., Nobre, J. S., & Sef, H. C. (2004). Regression models for pretest/postest data in blocks. Statistical Modeling, 4, 324-338.
149
Singleton, R. A., & Straits, B. C. (2005). Approaches to social research (4th ed.). New York: Oxford University Press.
Soper, J. C. (1973). Soft research on a hard subject: Student evaluations reconsidered. The Journal of Economic Education, 1(1), 22-26.
Sprague, R. H., & Carlson, E. D. (1982). Building effective decision support systems. Englewood Cliffs, New Jersey: Prentice-Hall, Inc..
Steinberg, D. M. (2004). Social work student's handbook. Binghamton, New York: Haworth Press, Inc..
Stinchcomb, J. B. (2006). Envisioning the future: Proactive leadership through data-driven decision-making. Corrections Today, 68(5), 78-80.
Stover, C. (2005). Measuring and understanding student retention. Distance Education, 9(16), 1-3.
Taylor, D., & Procter, M. (n.d.). The literature review: A few tips on conducting it. Retrieved May 12, 2007, from http://www.utoronto.ca/writing/litrev.html
Taylor, R. (2005). Creating a connection: tackling student attrition through curriculum development. Journal of Further and Higher Education, 29(4), 367-374.
Todd, P. & Benbasat, I. (2000). The impact of information technology on decision making: A cognitive perspective. In R. W. Zmud (Ed.), Framing the Domains of IT Management: Projecting the Future...Through the Past (pp. 1-14). Cincinnati, Ohio: Pinnaflex Educational Resources, Inc..
Trochim, W. M. (2001). The research methods knowledge base (Second ed.). Cincinnati:
Atomic Dog Publishing. Trochim, M. K. (2006). Two-group experimental designs. Manuscript in preparation.
Retrieved January 1, 2008, from http://www.socialresearchmethods.net/kb/expsimp.php
Turban, E., King, D., Lee, J., & Viehland, D. (2004). Electronic commerce 2004: A managerial perspective. Upper Saddle River: Pearson Prentice Hall.
Watterson, K. (2002). Real-time data warehousing requires different job skills. Retrieved April 10, 2007, from http://www.htmagazine.com/archive/May2001/May2001_2.html

150
Wayman, J. C. (2005). Involving teachers in data-driven decision making: Using computer data systems to support teacher inquiry and reflection. Journal of Education for Students Placed at Risk, 10(3), 295-308.
Wilcox, P., Winn, S., & Fyvie-Gauld, M. (2005). ‘It was nothing to do with the university, it was just the people’: The role of social support in the first-year experience of higher education. Studies in Higher Education, 30(6), 707-722.
Williams, T. (2007). The effects of expectations on perception: Experimental design issues and further evidence. Working Paper Series (Federal Reserve Bank of Boston), 7(14), 1-26.
Wright, D. B. (2003). Making friends with your data: Improving how statistics are conducted and reported. British Journal of Educational Psychology, 73, 123-136.
Wright, D. B. (2006). Comparing groups in a before--after design: When t test and ANCOVA produce different results. British Journal of Educational Psychology, 76(3), 663-675.
Wright, R. E. (2006). Student evaluations of faculty: Concerns raised in the literature, and possible Solutions. College Student Journal, 40(2), 417-422.
Yunker, P. J., & Yunker, J. A. (2003). Are student evaluations of teaching valid? Evidence From an Analytical Business Core Course. Journal of Education for Business, 78(6), 313-317.
Zimmerman, D. (2004). Conditional probabilities of rejecting H0 by pooled and separate-variances t tests given heterogeneity of sample variances. Communications in Statistics: Simulation & Computation, 33(1), 69-81.
Zimmerman, D. W. (2004). A note on preliminary tests of equality of variances. British Journal of Mathematical & Statistical Psychology, 57(1), 173-181.
Zimmerman, D. W. (2004). Inflated statistical significance of student's t test associated with small intersubject correlation. Journal of Statistical Computation & Simulation, 74(9), 691-696.
Zlowodzki, M., Jonsson, A., & Bhandari, M. (2006). Common pitfalls in the conduct of clinical research. Medical Principles & Practice, 15(1), 1-8.

APPENDIX A:
FACULTY LEADERSHIP TRAINING OUTLINE
I. Welcome to the Faculty Leadership Symposium a. Introduce Trainer b. Introduce Training Purpose c. Introduce the Study d. Introduce Agenda
II. How does the university collect student and faculty performance data a. Identify specific data instruments, role, and purpose b. Identify specific systems used regionally and locally c. Identify current report distribution challenges
III. Introduce Pilot Training a. Inform faculty how they were selected for this pilot training b. Discuss the objectives for the session
i. Equipping faculty with historical performance data ii. Addressing student course drops
iii. Primary Objective: Can informed faculty have a positive influence upon student drop rates?
IV. Measuring Student Success
a. Homework evaluation b. Classroom interaction
V. Faculty Tools a. Curriculum b. Syllabus
VI. Faculty Performance Measurement a. Class visits b. Peer Reviews c. Faculty GPA d. Student Evaluation of Teaching (SET) e. Student Course Drops
VII. Performance Report Overview a. Report Data–Definitions
i. Year ii. College
iii. Course iv. Faculty Name v. Faculty GPA
vi. Regional GPA vii. Local Student Course Drops
viii. Regional Student Course Drops ix. Local SET x. Regional SET
VIII. Student Evaluation of Teaching
a. Faculty Performance
152
i. Provision of feedback ii. Classroom Instruction
iii. Faculty Credentials
IX. Group Activity–Brainstorming & Best Practices a. Assessment of student learning b. Communication strategies for enhanced learning environments c. Strategies to raise student self-confidence d. Methods to balance rigor with expectations e. The role faculty may play in supporting student success
X. Workshop Conclusion
a. Next Steps b. Thank you!
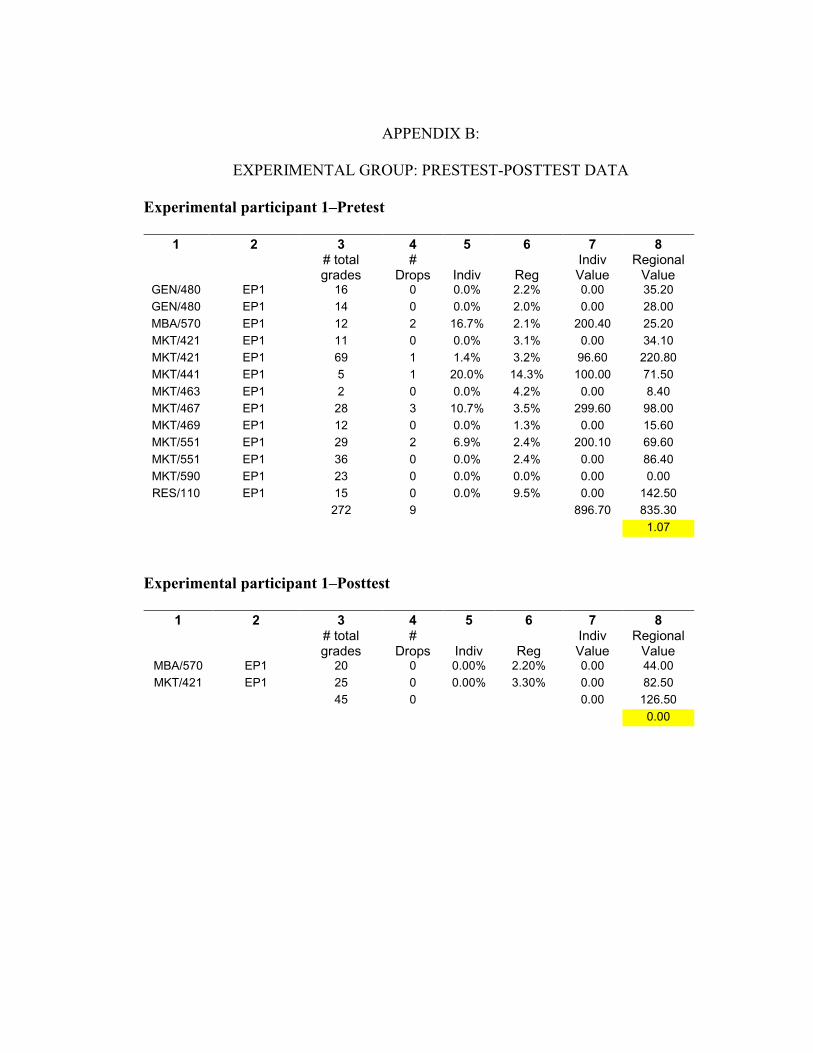
APPENDIX B:
EXPERIMENTAL GROUP: PRESTEST-POSTTEST DATA
Experimental participant 1–Pretest
1 2 3 4 5 6 7 8
# total grades
# Drops Indiv Reg
Indiv Value
Regional Value
GEN/480 EP1 16 0 0.0% 2.2% 0.00 35.20 GEN/480 EP1 14 0 0.0% 2.0% 0.00 28.00 MBA/570 EP1 12 2 16.7% 2.1% 200.40 25.20 MKT/421 EP1 11 0 0.0% 3.1% 0.00 34.10 MKT/421 EP1 69 1 1.4% 3.2% 96.60 220.80 MKT/441 EP1 5 1 20.0% 14.3% 100.00 71.50 MKT/463 EP1 2 0 0.0% 4.2% 0.00 8.40 MKT/467 EP1 28 3 10.7% 3.5% 299.60 98.00 MKT/469 EP1 12 0 0.0% 1.3% 0.00 15.60 MKT/551 EP1 29 2 6.9% 2.4% 200.10 69.60 MKT/551 EP1 36 0 0.0% 2.4% 0.00 86.40 MKT/590 EP1 23 0 0.0% 0.0% 0.00 0.00 RES/110 EP1 15 0 0.0% 9.5% 0.00 142.50
272 9 896.70 835.30 1.07
Experimental participant 1–Posttest
1 2 3 4 5 6 7 8
# total grades
# Drops Indiv Reg
Indiv Value
Regional Value
MBA/570 EP1 20 0 0.00% 2.20% 0.00 44.00 MKT/421 EP1 25 0 0.00% 3.30% 0.00 82.50
45 0 0.00 126.50 0.00
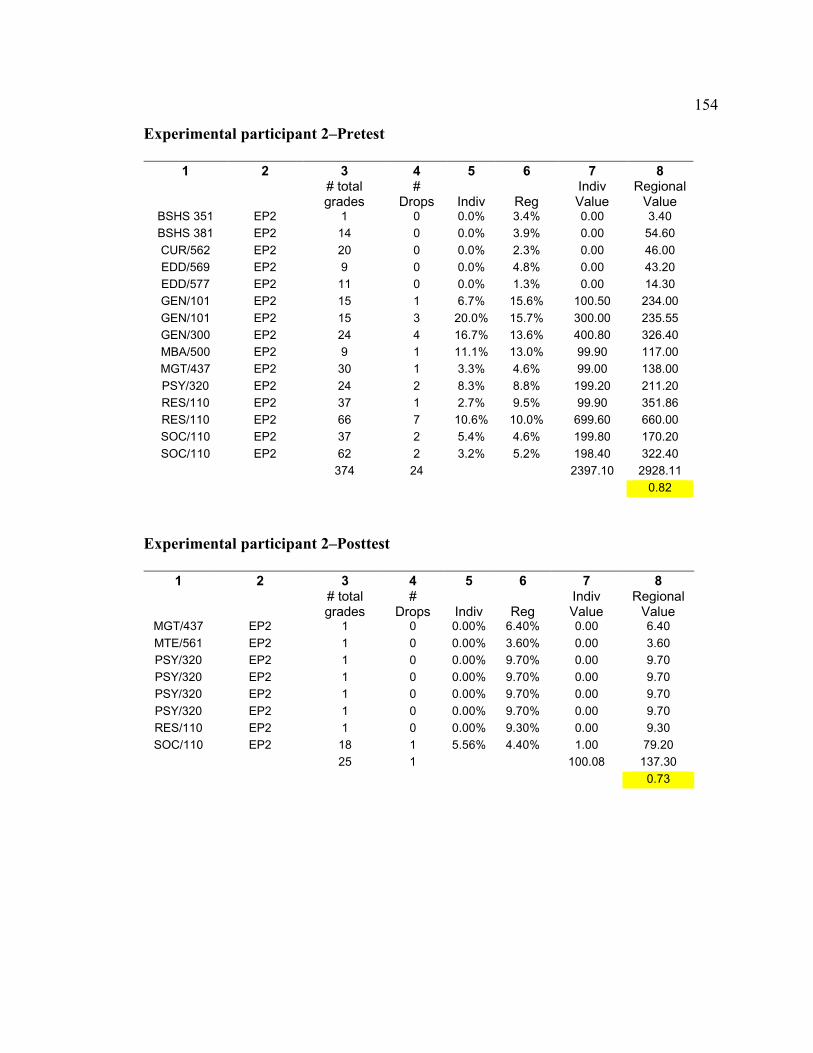
154
Experimental participant 2–Pretest
1 2 3 4 5 6 7 8
# total grades
# Drops Indiv Reg
Indiv Value
Regional Value
BSHS 351 EP2 1 0 0.0% 3.4% 0.00 3.40 BSHS 381 EP2 14 0 0.0% 3.9% 0.00 54.60 CUR/562 EP2 20 0 0.0% 2.3% 0.00 46.00 EDD/569 EP2 9 0 0.0% 4.8% 0.00 43.20 EDD/577 EP2 11 0 0.0% 1.3% 0.00 14.30 GEN/101 EP2 15 1 6.7% 15.6% 100.50 234.00 GEN/101 EP2 15 3 20.0% 15.7% 300.00 235.55 GEN/300 EP2 24 4 16.7% 13.6% 400.80 326.40 MBA/500 EP2 9 1 11.1% 13.0% 99.90 117.00 MGT/437 EP2 30 1 3.3% 4.6% 99.00 138.00 PSY/320 EP2 24 2 8.3% 8.8% 199.20 211.20 RES/110 EP2 37 1 2.7% 9.5% 99.90 351.86 RES/110 EP2 66 7 10.6% 10.0% 699.60 660.00 SOC/110 EP2 37 2 5.4% 4.6% 199.80 170.20 SOC/110 EP2 62 2 3.2% 5.2% 198.40 322.40
374 24 2397.10 2928.11 0.82
Experimental participant 2–Posttest
1 2 3 4 5 6 7 8
# total grades
# Drops Indiv Reg
Indiv Value
Regional Value
MGT/437 EP2 1 0 0.00% 6.40% 0.00 6.40 MTE/561 EP2 1 0 0.00% 3.60% 0.00 3.60 PSY/320 EP2 1 0 0.00% 9.70% 0.00 9.70 PSY/320 EP2 1 0 0.00% 9.70% 0.00 9.70 PSY/320 EP2 1 0 0.00% 9.70% 0.00 9.70 PSY/320 EP2 1 0 0.00% 9.70% 0.00 9.70 RES/110 EP2 1 0 0.00% 9.30% 0.00 9.30 SOC/110 EP2 18 1 5.56% 4.40% 1.00 79.20
25 1 100.08 137.30 0.73
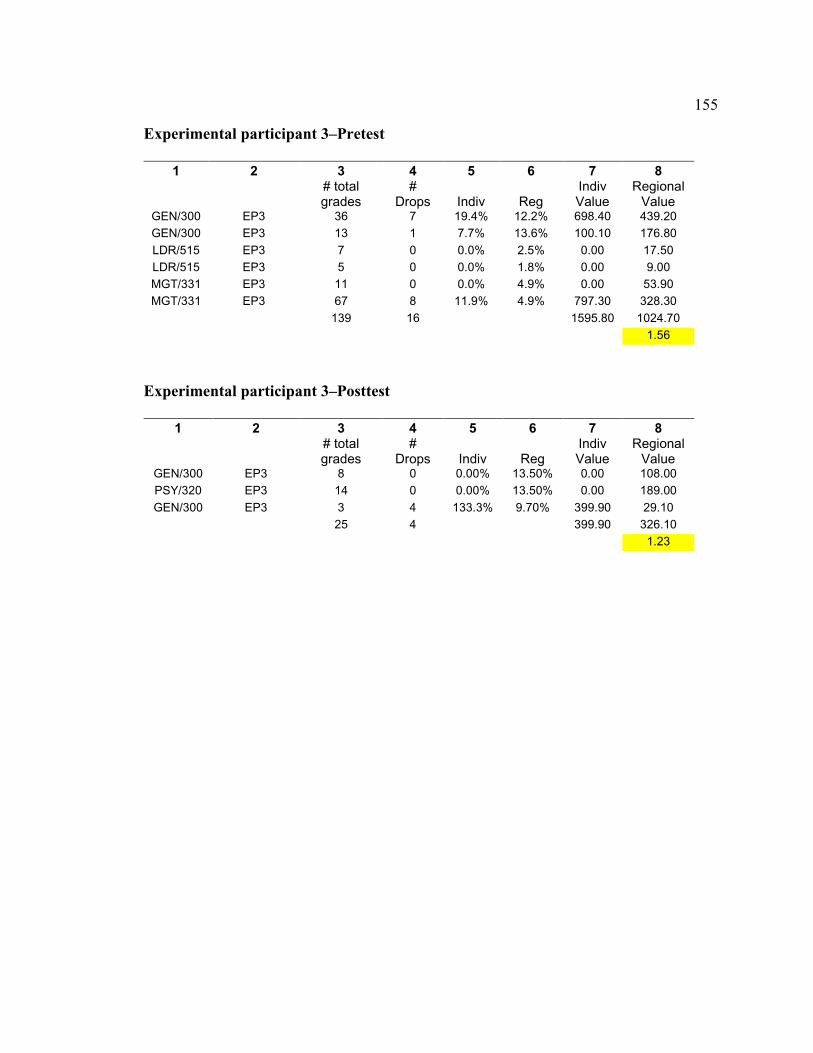
155
Experimental participant 3–Pretest
1 2 3 4 5 6 7 8
# total grades
# Drops Indiv Reg
Indiv Value
Regional Value
GEN/300 EP3 36 7 19.4% 12.2% 698.40 439.20 GEN/300 EP3 13 1 7.7% 13.6% 100.10 176.80 LDR/515 EP3 7 0 0.0% 2.5% 0.00 17.50 LDR/515 EP3 5 0 0.0% 1.8% 0.00 9.00 MGT/331 EP3 11 0 0.0% 4.9% 0.00 53.90 MGT/331 EP3 67 8 11.9% 4.9% 797.30 328.30
139 16 1595.80 1024.70 1.56
Experimental participant 3–Posttest
1 2 3 4 5 6 7 8
# total grades
# Drops Indiv Reg
Indiv Value
Regional Value
GEN/300 EP3 8 0 0.00% 13.50% 0.00 108.00 PSY/320 EP3 14 0 0.00% 13.50% 0.00 189.00 GEN/300 EP3 3 4 133.3% 9.70% 399.90 29.10
25 4 399.90 326.10 1.23
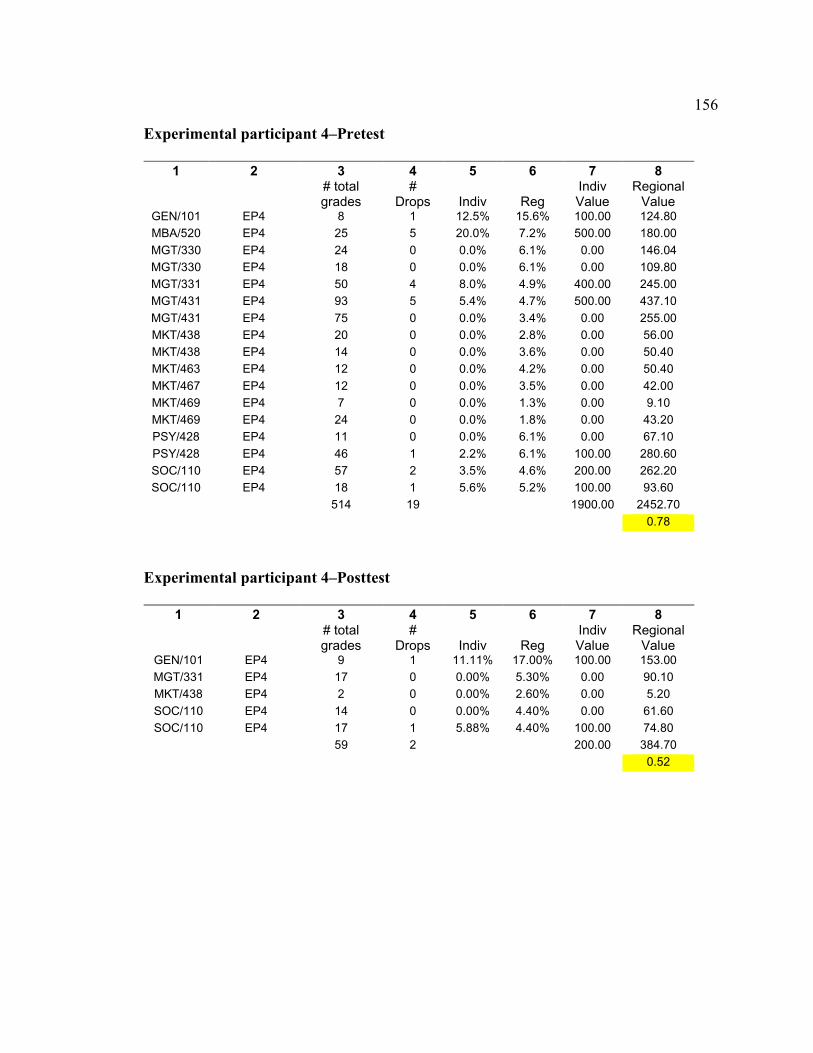
156
Experimental participant 4–Pretest
1 2 3 4 5 6 7 8
# total grades
# Drops Indiv Reg
Indiv Value
Regional Value
GEN/101 EP4 8 1 12.5% 15.6% 100.00 124.80 MBA/520 EP4 25 5 20.0% 7.2% 500.00 180.00 MGT/330 EP4 24 0 0.0% 6.1% 0.00 146.04 MGT/330 EP4 18 0 0.0% 6.1% 0.00 109.80 MGT/331 EP4 50 4 8.0% 4.9% 400.00 245.00 MGT/431 EP4 93 5 5.4% 4.7% 500.00 437.10 MGT/431 EP4 75 0 0.0% 3.4% 0.00 255.00 MKT/438 EP4 20 0 0.0% 2.8% 0.00 56.00 MKT/438 EP4 14 0 0.0% 3.6% 0.00 50.40 MKT/463 EP4 12 0 0.0% 4.2% 0.00 50.40 MKT/467 EP4 12 0 0.0% 3.5% 0.00 42.00 MKT/469 EP4 7 0 0.0% 1.3% 0.00 9.10 MKT/469 EP4 24 0 0.0% 1.8% 0.00 43.20 PSY/428 EP4 11 0 0.0% 6.1% 0.00 67.10 PSY/428 EP4 46 1 2.2% 6.1% 100.00 280.60 SOC/110 EP4 57 2 3.5% 4.6% 200.00 262.20 SOC/110 EP4 18 1 5.6% 5.2% 100.00 93.60
514 19 1900.00 2452.70 0.78
Experimental participant 4–Posttest
1 2 3 4 5 6 7 8
# total grades
# Drops Indiv Reg
Indiv Value
Regional Value
GEN/101 EP4 9 1 11.11% 17.00% 100.00 153.00 MGT/331 EP4 17 0 0.00% 5.30% 0.00 90.10 MKT/438 EP4 2 0 0.00% 2.60% 0.00 5.20 SOC/110 EP4 14 0 0.00% 4.40% 0.00 61.60 SOC/110 EP4 17 1 5.88% 4.40% 100.00 74.80
59 2 200.00 384.70 0.52
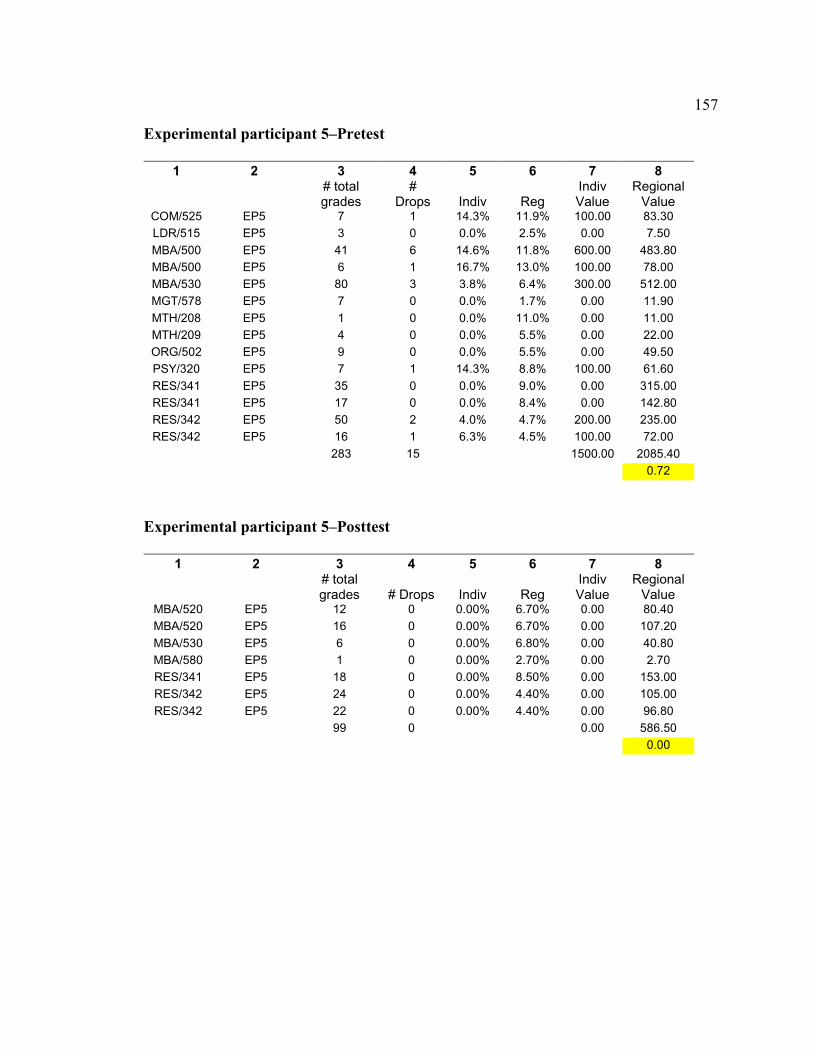
157
Experimental participant 5–Pretest
1 2 3 4 5 6 7 8
# total grades
# Drops Indiv Reg
Indiv Value
Regional Value
COM/525 EP5 7 1 14.3% 11.9% 100.00 83.30 LDR/515 EP5 3 0 0.0% 2.5% 0.00 7.50 MBA/500 EP5 41 6 14.6% 11.8% 600.00 483.80 MBA/500 EP5 6 1 16.7% 13.0% 100.00 78.00 MBA/530 EP5 80 3 3.8% 6.4% 300.00 512.00 MGT/578 EP5 7 0 0.0% 1.7% 0.00 11.90 MTH/208 EP5 1 0 0.0% 11.0% 0.00 11.00 MTH/209 EP5 4 0 0.0% 5.5% 0.00 22.00 ORG/502 EP5 9 0 0.0% 5.5% 0.00 49.50 PSY/320 EP5 7 1 14.3% 8.8% 100.00 61.60 RES/341 EP5 35 0 0.0% 9.0% 0.00 315.00 RES/341 EP5 17 0 0.0% 8.4% 0.00 142.80 RES/342 EP5 50 2 4.0% 4.7% 200.00 235.00 RES/342 EP5 16 1 6.3% 4.5% 100.00 72.00
283 15 1500.00 2085.40 0.72
Experimental participant 5–Posttest
1 2 3 4 5 6 7 8
# total grades # Drops Indiv Reg
Indiv Value
Regional Value
MBA/520 EP5 12 0 0.00% 6.70% 0.00 80.40 MBA/520 EP5 16 0 0.00% 6.70% 0.00 107.20 MBA/530 EP5 6 0 0.00% 6.80% 0.00 40.80 MBA/580 EP5 1 0 0.00% 2.70% 0.00 2.70 RES/341 EP5 18 0 0.00% 8.50% 0.00 153.00 RES/342 EP5 24 0 0.00% 4.40% 0.00 105.00 RES/342 EP5 22 0 0.00% 4.40% 0.00 96.80
99 0 0.00 586.50 0.00
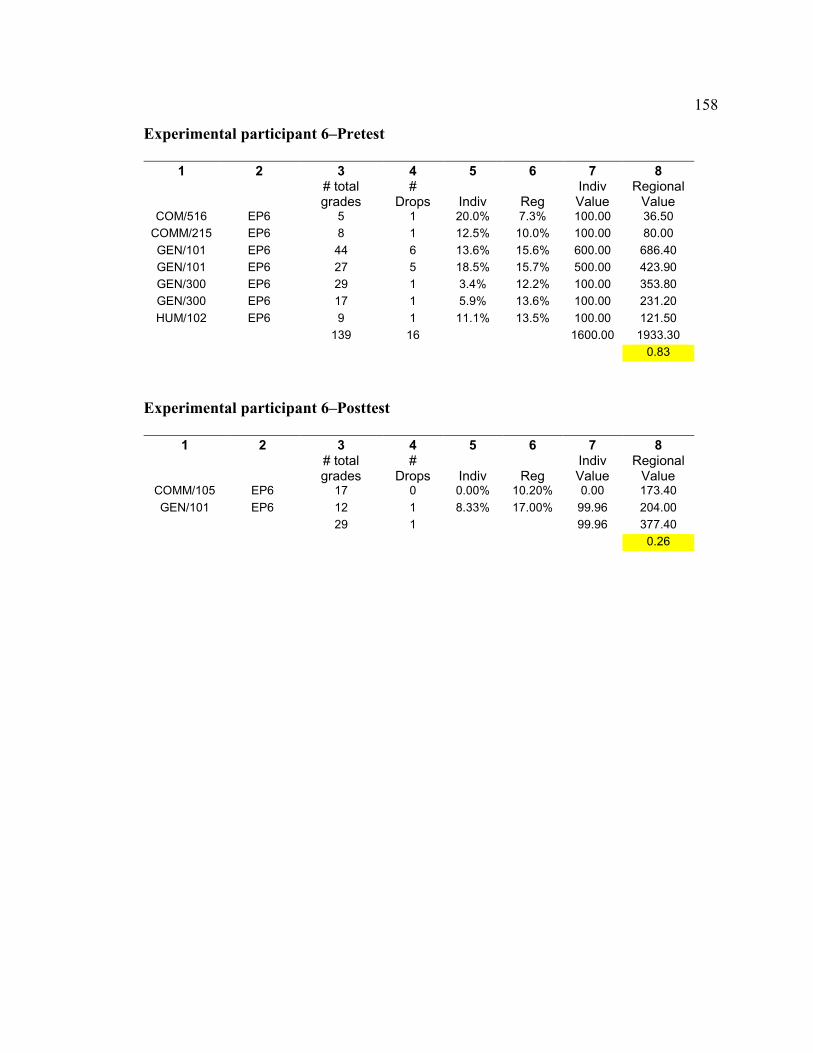
158
Experimental participant 6–Pretest
1 2 3 4 5 6 7 8
# total grades
# Drops Indiv Reg
Indiv Value
Regional Value
COM/516 EP6 5 1 20.0% 7.3% 100.00 36.50 COMM/215 EP6 8 1 12.5% 10.0% 100.00 80.00 GEN/101 EP6 44 6 13.6% 15.6% 600.00 686.40 GEN/101 EP6 27 5 18.5% 15.7% 500.00 423.90 GEN/300 EP6 29 1 3.4% 12.2% 100.00 353.80 GEN/300 EP6 17 1 5.9% 13.6% 100.00 231.20 HUM/102 EP6 9 1 11.1% 13.5% 100.00 121.50
139 16 1600.00 1933.30 0.83
Experimental participant 6–Posttest
1 2 3 4 5 6 7 8
# total grades
# Drops Indiv Reg
Indiv Value
Regional Value
COMM/105 EP6 17 0 0.00% 10.20% 0.00 173.40 GEN/101 EP6 12 1 8.33% 17.00% 99.96 204.00
29 1 99.96 377.40 0.26
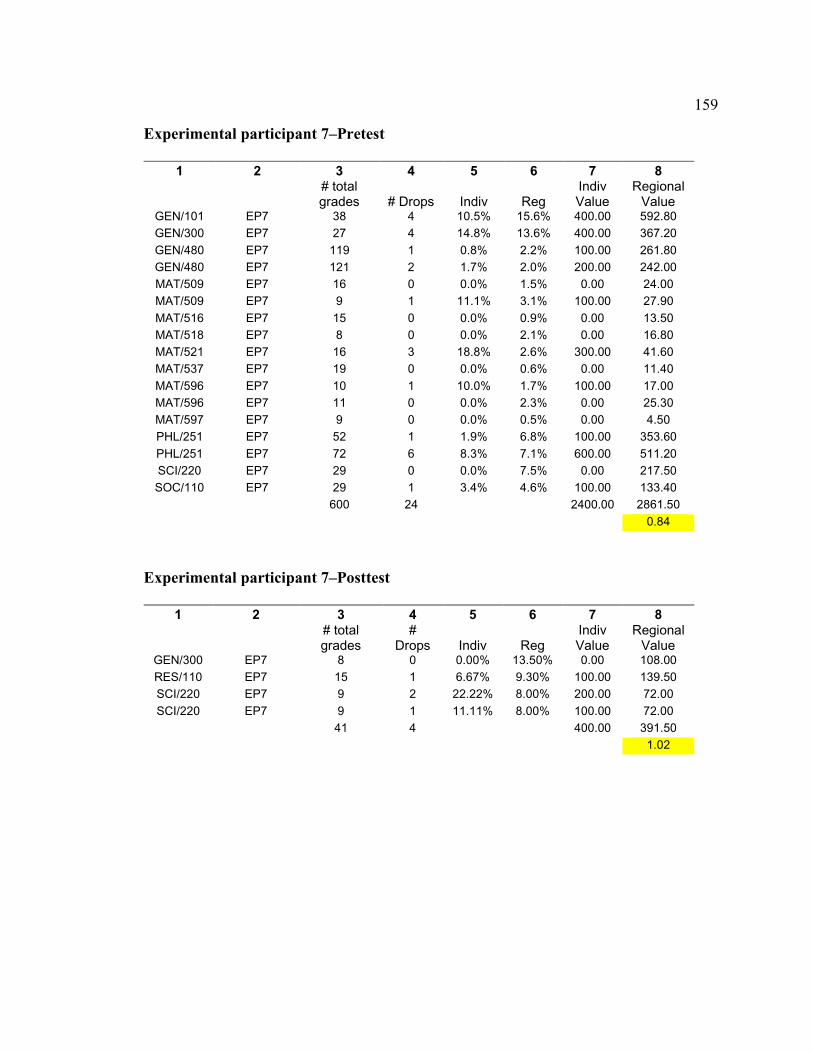
159
Experimental participant 7–Pretest
1 2 3 4 5 6 7 8
# total grades # Drops Indiv Reg
Indiv Value
Regional Value
GEN/101 EP7 38 4 10.5% 15.6% 400.00 592.80 GEN/300 EP7 27 4 14.8% 13.6% 400.00 367.20 GEN/480 EP7 119 1 0.8% 2.2% 100.00 261.80 GEN/480 EP7 121 2 1.7% 2.0% 200.00 242.00 MAT/509 EP7 16 0 0.0% 1.5% 0.00 24.00 MAT/509 EP7 9 1 11.1% 3.1% 100.00 27.90 MAT/516 EP7 15 0 0.0% 0.9% 0.00 13.50 MAT/518 EP7 8 0 0.0% 2.1% 0.00 16.80 MAT/521 EP7 16 3 18.8% 2.6% 300.00 41.60 MAT/537 EP7 19 0 0.0% 0.6% 0.00 11.40 MAT/596 EP7 10 1 10.0% 1.7% 100.00 17.00 MAT/596 EP7 11 0 0.0% 2.3% 0.00 25.30 MAT/597 EP7 9 0 0.0% 0.5% 0.00 4.50 PHL/251 EP7 52 1 1.9% 6.8% 100.00 353.60 PHL/251 EP7 72 6 8.3% 7.1% 600.00 511.20 SCI/220 EP7 29 0 0.0% 7.5% 0.00 217.50 SOC/110 EP7 29 1 3.4% 4.6% 100.00 133.40
600 24 2400.00 2861.50 0.84
Experimental participant 7–Posttest
1 2 3 4 5 6 7 8
# total grades
# Drops Indiv Reg
Indiv Value
Regional Value
GEN/300 EP7 8 0 0.00% 13.50% 0.00 108.00 RES/110 EP7 15 1 6.67% 9.30% 100.00 139.50 SCI/220 EP7 9 2 22.22% 8.00% 200.00 72.00 SCI/220 EP7 9 1 11.11% 8.00% 100.00 72.00
41 4 400.00 391.50 1.02
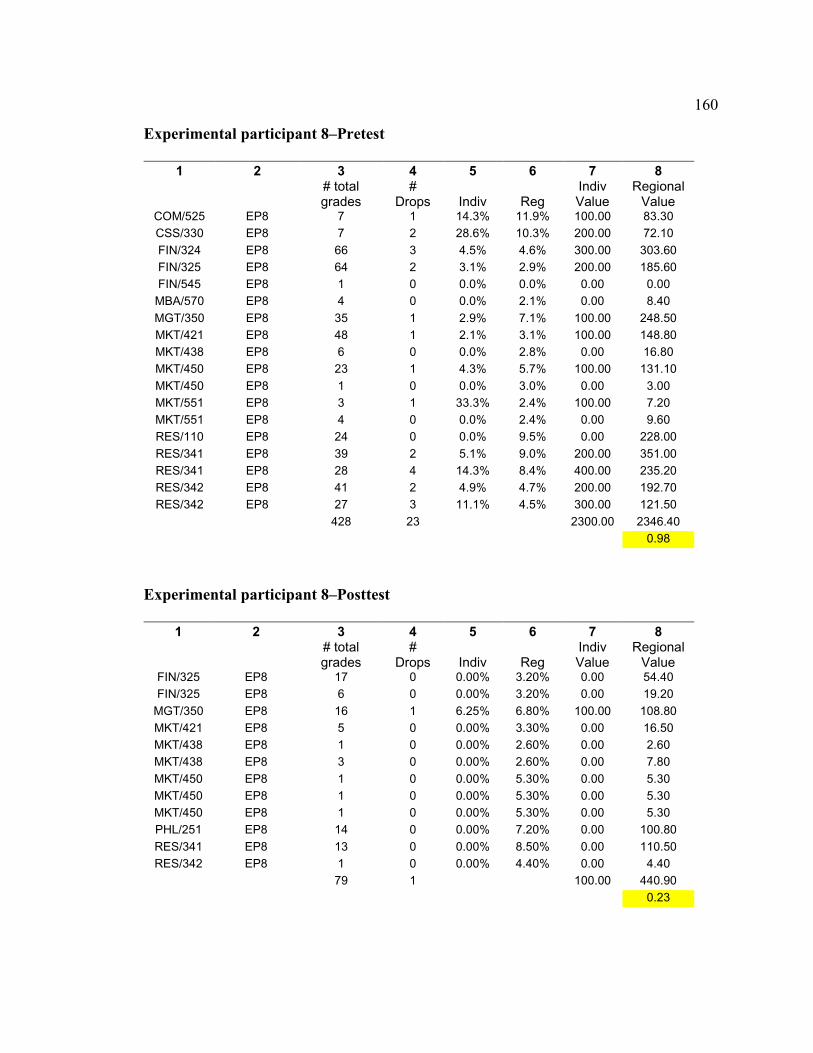
160
Experimental participant 8–Pretest
1 2 3 4 5 6 7 8
# total grades
# Drops Indiv Reg
Indiv Value
Regional Value
COM/525 EP8 7 1 14.3% 11.9% 100.00 83.30 CSS/330 EP8 7 2 28.6% 10.3% 200.00 72.10 FIN/324 EP8 66 3 4.5% 4.6% 300.00 303.60 FIN/325 EP8 64 2 3.1% 2.9% 200.00 185.60 FIN/545 EP8 1 0 0.0% 0.0% 0.00 0.00
MBA/570 EP8 4 0 0.0% 2.1% 0.00 8.40 MGT/350 EP8 35 1 2.9% 7.1% 100.00 248.50 MKT/421 EP8 48 1 2.1% 3.1% 100.00 148.80 MKT/438 EP8 6 0 0.0% 2.8% 0.00 16.80 MKT/450 EP8 23 1 4.3% 5.7% 100.00 131.10 MKT/450 EP8 1 0 0.0% 3.0% 0.00 3.00 MKT/551 EP8 3 1 33.3% 2.4% 100.00 7.20 MKT/551 EP8 4 0 0.0% 2.4% 0.00 9.60 RES/110 EP8 24 0 0.0% 9.5% 0.00 228.00 RES/341 EP8 39 2 5.1% 9.0% 200.00 351.00 RES/341 EP8 28 4 14.3% 8.4% 400.00 235.20 RES/342 EP8 41 2 4.9% 4.7% 200.00 192.70 RES/342 EP8 27 3 11.1% 4.5% 300.00 121.50
428 23 2300.00 2346.40 0.98
Experimental participant 8–Posttest
1 2 3 4 5 6 7 8
# total grades
# Drops Indiv Reg
Indiv Value
Regional Value
FIN/325 EP8 17 0 0.00% 3.20% 0.00 54.40 FIN/325 EP8 6 0 0.00% 3.20% 0.00 19.20
MGT/350 EP8 16 1 6.25% 6.80% 100.00 108.80 MKT/421 EP8 5 0 0.00% 3.30% 0.00 16.50 MKT/438 EP8 1 0 0.00% 2.60% 0.00 2.60 MKT/438 EP8 3 0 0.00% 2.60% 0.00 7.80 MKT/450 EP8 1 0 0.00% 5.30% 0.00 5.30 MKT/450 EP8 1 0 0.00% 5.30% 0.00 5.30 MKT/450 EP8 1 0 0.00% 5.30% 0.00 5.30 PHL/251 EP8 14 0 0.00% 7.20% 0.00 100.80 RES/341 EP8 13 0 0.00% 8.50% 0.00 110.50 RES/342 EP8 1 0 0.00% 4.40% 0.00 4.40
79 1 100.00 440.90 0.23
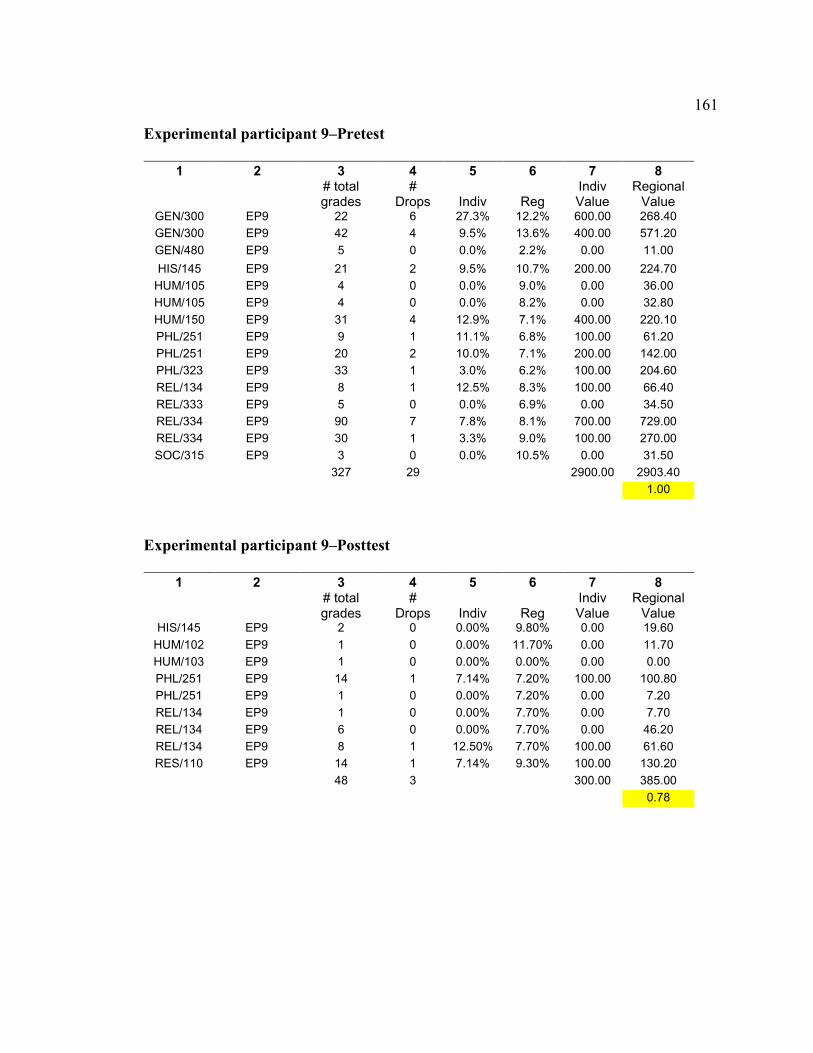
161
Experimental participant 9–Pretest
1 2 3 4 5 6 7 8
# total grades
# Drops Indiv Reg
Indiv Value
Regional Value
GEN/300 EP9 22 6 27.3% 12.2% 600.00 268.40 GEN/300 EP9 42 4 9.5% 13.6% 400.00 571.20 GEN/480 EP9 5 0 0.0% 2.2% 0.00 11.00
HIS/145 EP9 21 2 9.5% 10.7% 200.00 224.70 HUM/105 EP9 4 0 0.0% 9.0% 0.00 36.00 HUM/105 EP9 4 0 0.0% 8.2% 0.00 32.80 HUM/150 EP9 31 4 12.9% 7.1% 400.00 220.10 PHL/251 EP9 9 1 11.1% 6.8% 100.00 61.20 PHL/251 EP9 20 2 10.0% 7.1% 200.00 142.00 PHL/323 EP9 33 1 3.0% 6.2% 100.00 204.60 REL/134 EP9 8 1 12.5% 8.3% 100.00 66.40 REL/333 EP9 5 0 0.0% 6.9% 0.00 34.50 REL/334 EP9 90 7 7.8% 8.1% 700.00 729.00 REL/334 EP9 30 1 3.3% 9.0% 100.00 270.00 SOC/315 EP9 3 0 0.0% 10.5% 0.00 31.50
327 29 2900.00 2903.40 1.00
Experimental participant 9–Posttest
1 2 3 4 5 6 7 8
# total grades
# Drops Indiv Reg
Indiv Value
Regional Value
HIS/145 EP9 2 0 0.00% 9.80% 0.00 19.60 HUM/102 EP9 1 0 0.00% 11.70% 0.00 11.70 HUM/103 EP9 1 0 0.00% 0.00% 0.00 0.00 PHL/251 EP9 14 1 7.14% 7.20% 100.00 100.80 PHL/251 EP9 1 0 0.00% 7.20% 0.00 7.20 REL/134 EP9 1 0 0.00% 7.70% 0.00 7.70 REL/134 EP9 6 0 0.00% 7.70% 0.00 46.20 REL/134 EP9 8 1 12.50% 7.70% 100.00 61.60 RES/110 EP9 14 1 7.14% 9.30% 100.00 130.20
48 3 300.00 385.00 0.78
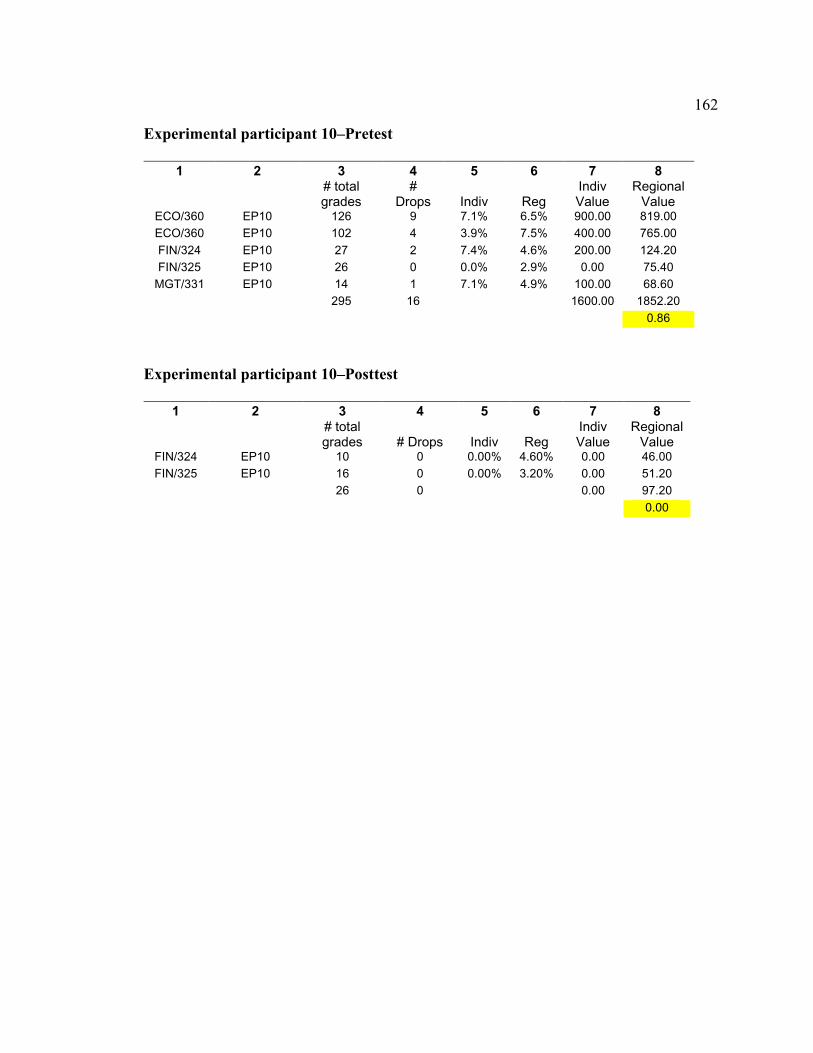
162
Experimental participant 10–Pretest
1 2 3 4 5 6 7 8
# total grades
# Drops Indiv Reg
Indiv Value
Regional Value
ECO/360 EP10 126 9 7.1% 6.5% 900.00 819.00 ECO/360 EP10 102 4 3.9% 7.5% 400.00 765.00 FIN/324 EP10 27 2 7.4% 4.6% 200.00 124.20 FIN/325 EP10 26 0 0.0% 2.9% 0.00 75.40
MGT/331 EP10 14 1 7.1% 4.9% 100.00 68.60 295 16 1600.00 1852.20 0.86
Experimental participant 10–Posttest
1 2 3 4 5 6 7 8
# total grades # Drops Indiv Reg
Indiv Value
Regional Value
FIN/324 EP10 10 0 0.00% 4.60% 0.00 46.00 FIN/325 EP10 16 0 0.00% 3.20% 0.00 51.20
26 0 0.00 97.20 0.00
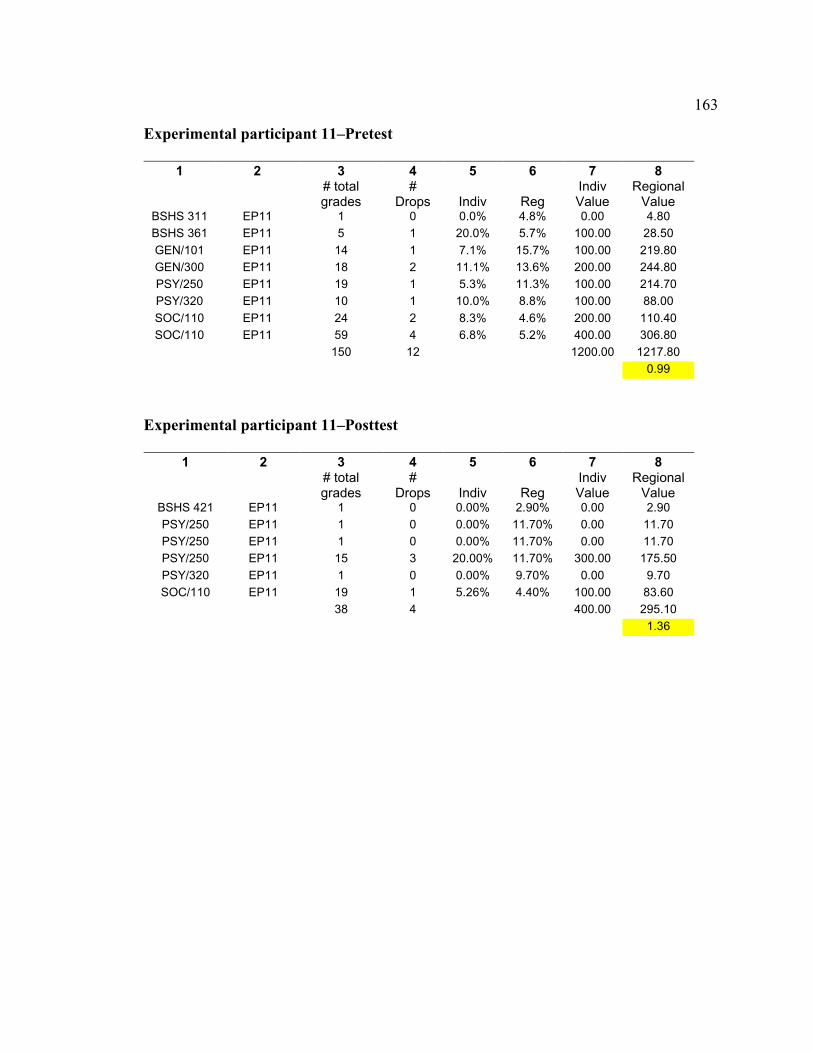
163
Experimental participant 11–Pretest
1 2 3 4 5 6 7 8
# total grades
# Drops Indiv Reg
Indiv Value
Regional Value
BSHS 311 EP11 1 0 0.0% 4.8% 0.00 4.80 BSHS 361 EP11 5 1 20.0% 5.7% 100.00 28.50 GEN/101 EP11 14 1 7.1% 15.7% 100.00 219.80 GEN/300 EP11 18 2 11.1% 13.6% 200.00 244.80 PSY/250 EP11 19 1 5.3% 11.3% 100.00 214.70 PSY/320 EP11 10 1 10.0% 8.8% 100.00 88.00 SOC/110 EP11 24 2 8.3% 4.6% 200.00 110.40 SOC/110 EP11 59 4 6.8% 5.2% 400.00 306.80
150 12 1200.00 1217.80 0.99
Experimental participant 11–Posttest
1 2 3 4 5 6 7 8
# total grades
# Drops Indiv Reg
Indiv Value
Regional Value
BSHS 421 EP11 1 0 0.00% 2.90% 0.00 2.90 PSY/250 EP11 1 0 0.00% 11.70% 0.00 11.70 PSY/250 EP11 1 0 0.00% 11.70% 0.00 11.70 PSY/250 EP11 15 3 20.00% 11.70% 300.00 175.50 PSY/320 EP11 1 0 0.00% 9.70% 0.00 9.70 SOC/110 EP11 19 1 5.26% 4.40% 100.00 83.60
38 4 400.00 295.10 1.36
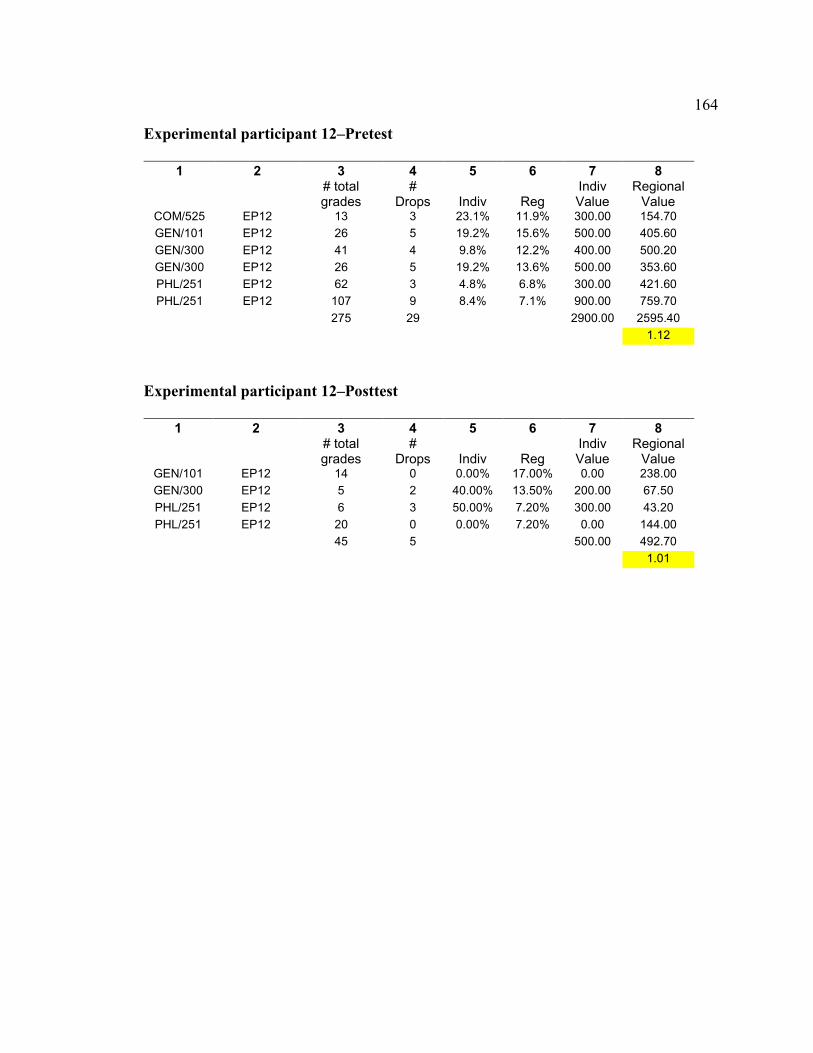
164
Experimental participant 12–Pretest
1 2 3 4 5 6 7 8
# total grades
# Drops Indiv Reg
Indiv Value
Regional Value
COM/525 EP12 13 3 23.1% 11.9% 300.00 154.70 GEN/101 EP12 26 5 19.2% 15.6% 500.00 405.60 GEN/300 EP12 41 4 9.8% 12.2% 400.00 500.20 GEN/300 EP12 26 5 19.2% 13.6% 500.00 353.60 PHL/251 EP12 62 3 4.8% 6.8% 300.00 421.60 PHL/251 EP12 107 9 8.4% 7.1% 900.00 759.70
275 29 2900.00 2595.40 1.12
Experimental participant 12–Posttest
1 2 3 4 5 6 7 8
# total grades
# Drops Indiv Reg
Indiv Value
Regional Value
GEN/101 EP12 14 0 0.00% 17.00% 0.00 238.00 GEN/300 EP12 5 2 40.00% 13.50% 200.00 67.50 PHL/251 EP12 6 3 50.00% 7.20% 300.00 43.20 PHL/251 EP12 20 0 0.00% 7.20% 0.00 144.00
45 5 500.00 492.70 1.01
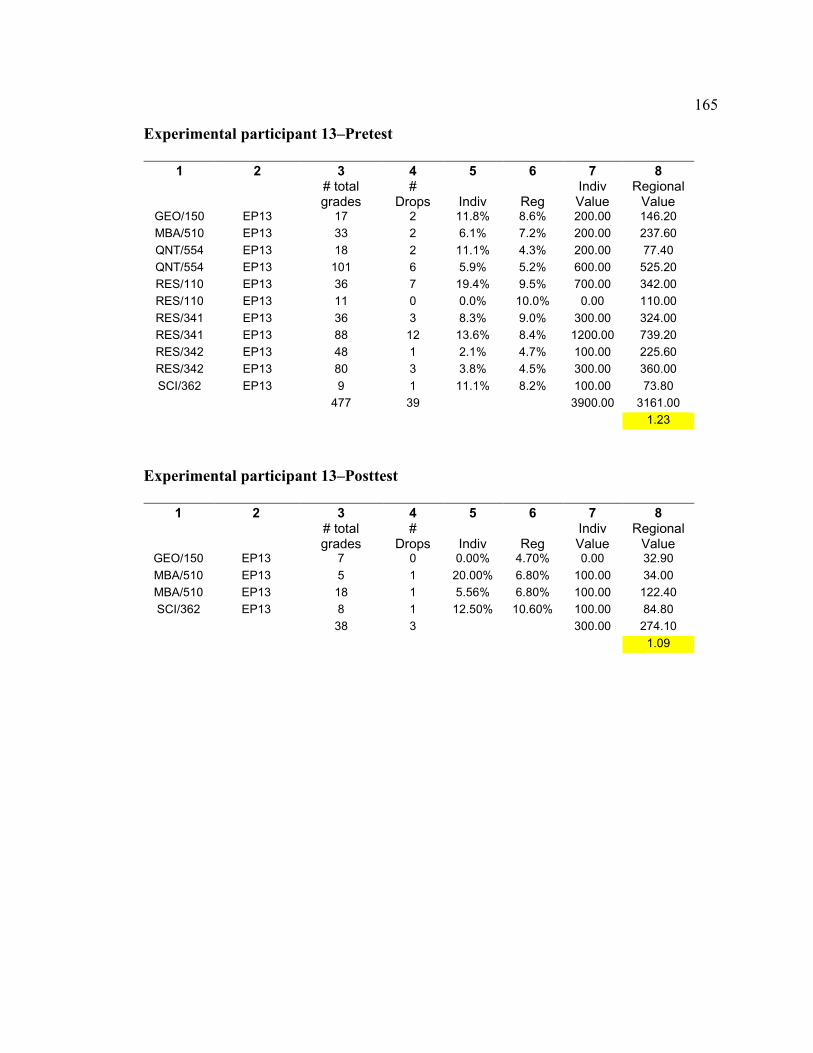
165
Experimental participant 13–Pretest
1 2 3 4 5 6 7 8
# total grades
# Drops Indiv Reg
Indiv Value
Regional Value
GEO/150 EP13 17 2 11.8% 8.6% 200.00 146.20 MBA/510 EP13 33 2 6.1% 7.2% 200.00 237.60 QNT/554 EP13 18 2 11.1% 4.3% 200.00 77.40 QNT/554 EP13 101 6 5.9% 5.2% 600.00 525.20 RES/110 EP13 36 7 19.4% 9.5% 700.00 342.00 RES/110 EP13 11 0 0.0% 10.0% 0.00 110.00 RES/341 EP13 36 3 8.3% 9.0% 300.00 324.00 RES/341 EP13 88 12 13.6% 8.4% 1200.00 739.20 RES/342 EP13 48 1 2.1% 4.7% 100.00 225.60 RES/342 EP13 80 3 3.8% 4.5% 300.00 360.00 SCI/362 EP13 9 1 11.1% 8.2% 100.00 73.80
477 39 3900.00 3161.00 1.23
Experimental participant 13–Posttest
1 2 3 4 5 6 7 8
# total grades
# Drops Indiv Reg
Indiv Value
Regional Value
GEO/150 EP13 7 0 0.00% 4.70% 0.00 32.90 MBA/510 EP13 5 1 20.00% 6.80% 100.00 34.00 MBA/510 EP13 18 1 5.56% 6.80% 100.00 122.40 SCI/362 EP13 8 1 12.50% 10.60% 100.00 84.80
38 3 300.00 274.10 1.09
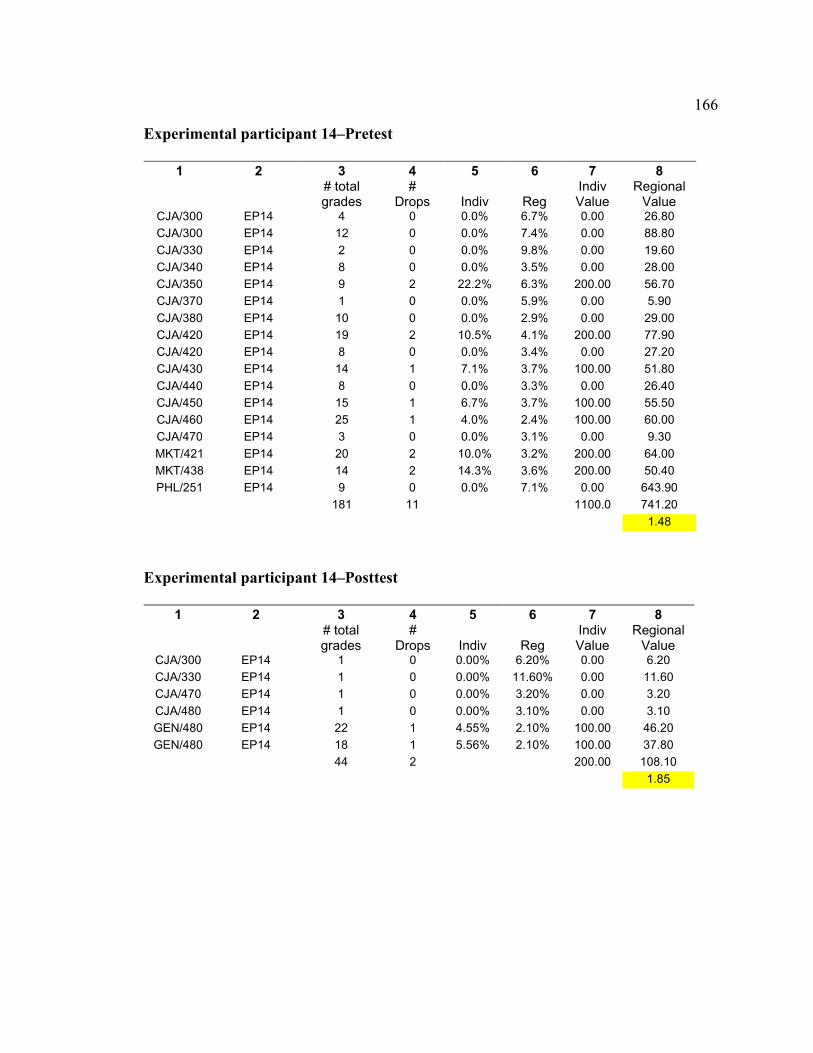
166
Experimental participant 14–Pretest
1 2 3 4 5 6 7 8
# total grades
# Drops Indiv Reg
Indiv Value
Regional Value
CJA/300 EP14 4 0 0.0% 6.7% 0.00 26.80 CJA/300 EP14 12 0 0.0% 7.4% 0.00 88.80 CJA/330 EP14 2 0 0.0% 9.8% 0.00 19.60 CJA/340 EP14 8 0 0.0% 3.5% 0.00 28.00 CJA/350 EP14 9 2 22.2% 6.3% 200.00 56.70 CJA/370 EP14 1 0 0.0% 5.9% 0.00 5.90 CJA/380 EP14 10 0 0.0% 2.9% 0.00 29.00 CJA/420 EP14 19 2 10.5% 4.1% 200.00 77.90 CJA/420 EP14 8 0 0.0% 3.4% 0.00 27.20 CJA/430 EP14 14 1 7.1% 3.7% 100.00 51.80 CJA/440 EP14 8 0 0.0% 3.3% 0.00 26.40 CJA/450 EP14 15 1 6.7% 3.7% 100.00 55.50 CJA/460 EP14 25 1 4.0% 2.4% 100.00 60.00 CJA/470 EP14 3 0 0.0% 3.1% 0.00 9.30 MKT/421 EP14 20 2 10.0% 3.2% 200.00 64.00 MKT/438 EP14 14 2 14.3% 3.6% 200.00 50.40 PHL/251 EP14 9 0 0.0% 7.1% 0.00 643.90
181 11 1100.0 741.20 1.48
Experimental participant 14–Posttest
1 2 3 4 5 6 7 8
# total grades
# Drops Indiv Reg
Indiv Value
Regional Value
CJA/300 EP14 1 0 0.00% 6.20% 0.00 6.20 CJA/330 EP14 1 0 0.00% 11.60% 0.00 11.60 CJA/470 EP14 1 0 0.00% 3.20% 0.00 3.20 CJA/480 EP14 1 0 0.00% 3.10% 0.00 3.10 GEN/480 EP14 22 1 4.55% 2.10% 100.00 46.20 GEN/480 EP14 18 1 5.56% 2.10% 100.00 37.80
44 2 200.00 108.10 1.85
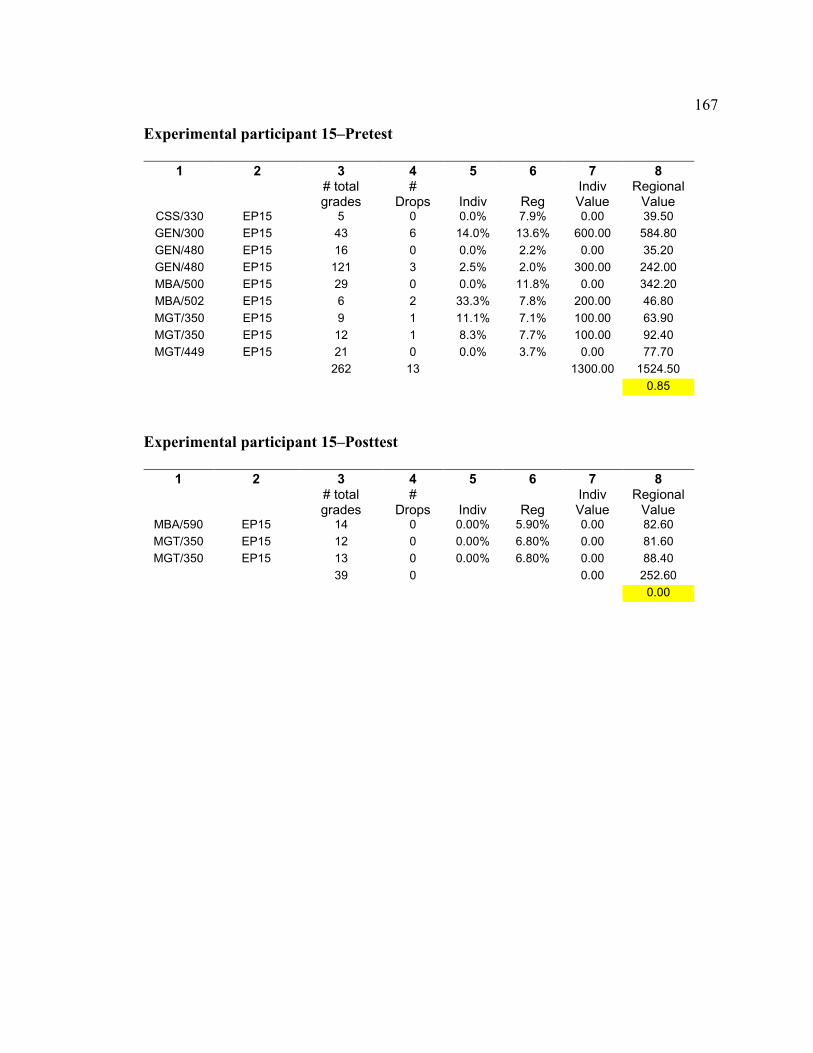
167
Experimental participant 15–Pretest
1 2 3 4 5 6 7 8
# total grades
# Drops Indiv Reg
Indiv Value
Regional Value
CSS/330 EP15 5 0 0.0% 7.9% 0.00 39.50 GEN/300 EP15 43 6 14.0% 13.6% 600.00 584.80 GEN/480 EP15 16 0 0.0% 2.2% 0.00 35.20 GEN/480 EP15 121 3 2.5% 2.0% 300.00 242.00 MBA/500 EP15 29 0 0.0% 11.8% 0.00 342.20 MBA/502 EP15 6 2 33.3% 7.8% 200.00 46.80 MGT/350 EP15 9 1 11.1% 7.1% 100.00 63.90 MGT/350 EP15 12 1 8.3% 7.7% 100.00 92.40 MGT/449 EP15 21 0 0.0% 3.7% 0.00 77.70
262 13 1300.00 1524.50 0.85
Experimental participant 15–Posttest
1 2 3 4 5 6 7 8
# total grades
# Drops Indiv Reg
Indiv Value
Regional Value
MBA/590 EP15 14 0 0.00% 5.90% 0.00 82.60 MGT/350 EP15 12 0 0.00% 6.80% 0.00 81.60 MGT/350 EP15 13 0 0.00% 6.80% 0.00 88.40
39 0 0.00 252.60 0.00
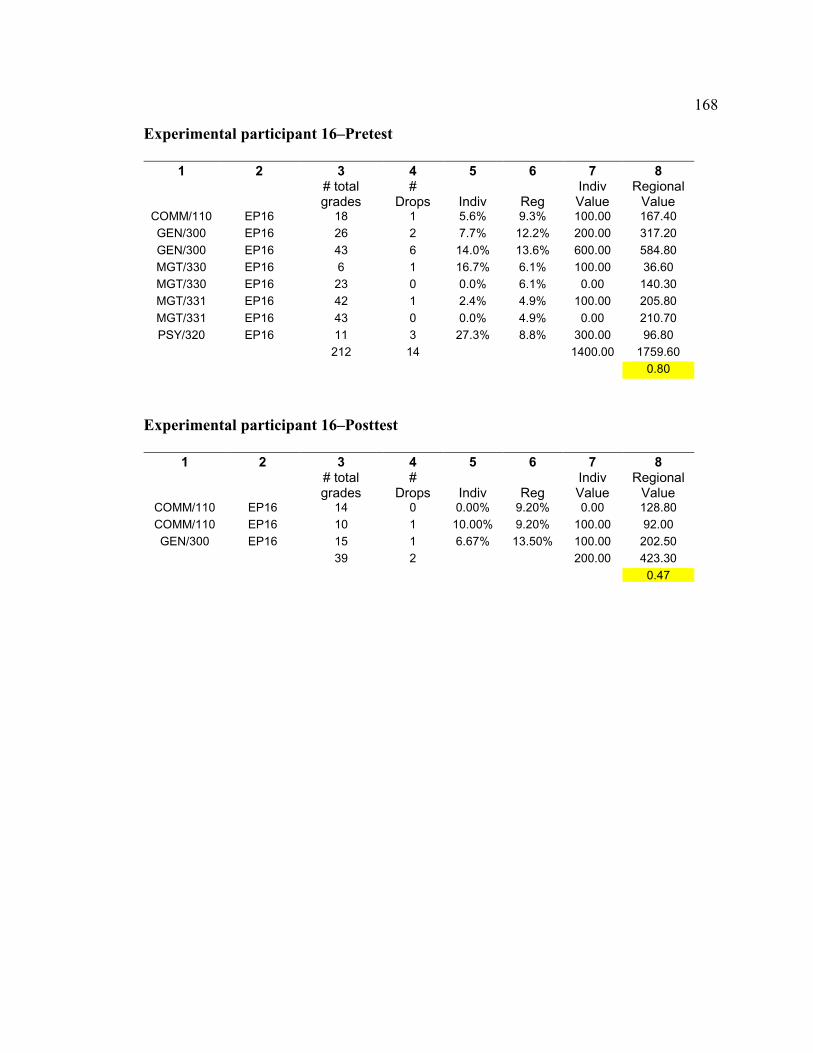
168
Experimental participant 16–Pretest
1 2 3 4 5 6 7 8
# total grades
# Drops Indiv Reg
Indiv Value
Regional Value
COMM/110 EP16 18 1 5.6% 9.3% 100.00 167.40 GEN/300 EP16 26 2 7.7% 12.2% 200.00 317.20 GEN/300 EP16 43 6 14.0% 13.6% 600.00 584.80 MGT/330 EP16 6 1 16.7% 6.1% 100.00 36.60 MGT/330 EP16 23 0 0.0% 6.1% 0.00 140.30 MGT/331 EP16 42 1 2.4% 4.9% 100.00 205.80 MGT/331 EP16 43 0 0.0% 4.9% 0.00 210.70 PSY/320 EP16 11 3 27.3% 8.8% 300.00 96.80
212 14 1400.00 1759.60 0.80
Experimental participant 16–Posttest
1 2 3 4 5 6 7 8
# total grades
# Drops Indiv Reg
Indiv Value
Regional Value
COMM/110 EP16 14 0 0.00% 9.20% 0.00 128.80 COMM/110 EP16 10 1 10.00% 9.20% 100.00 92.00 GEN/300 EP16 15 1 6.67% 13.50% 100.00 202.50
39 2 200.00 423.30 0.47
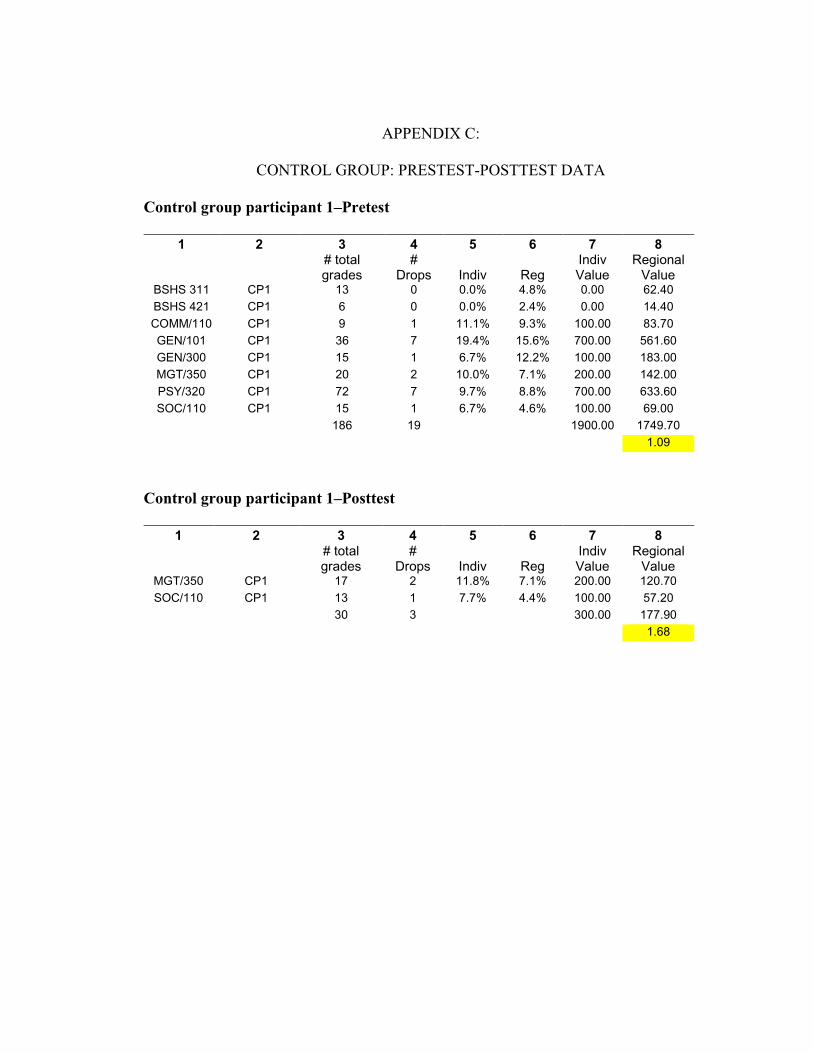
APPENDIX C:
CONTROL GROUP: PRESTEST-POSTTEST DATA
Control group participant 1–Pretest
1 2 3 4 5 6 7 8
# total grades
# Drops Indiv Reg
Indiv Value
Regional Value
BSHS 311 CP1 13 0 0.0% 4.8% 0.00 62.40 BSHS 421 CP1 6 0 0.0% 2.4% 0.00 14.40 COMM/110 CP1 9 1 11.1% 9.3% 100.00 83.70 GEN/101 CP1 36 7 19.4% 15.6% 700.00 561.60 GEN/300 CP1 15 1 6.7% 12.2% 100.00 183.00 MGT/350 CP1 20 2 10.0% 7.1% 200.00 142.00 PSY/320 CP1 72 7 9.7% 8.8% 700.00 633.60 SOC/110 CP1 15 1 6.7% 4.6% 100.00 69.00
186 19 1900.00 1749.70 1.09
Control group participant 1–Posttest
1 2 3 4 5 6 7 8
# total grades
# Drops Indiv Reg
Indiv Value
Regional Value
MGT/350 CP1 17 2 11.8% 7.1% 200.00 120.70 SOC/110 CP1 13 1 7.7% 4.4% 100.00 57.20
30 3 300.00 177.90 1.68
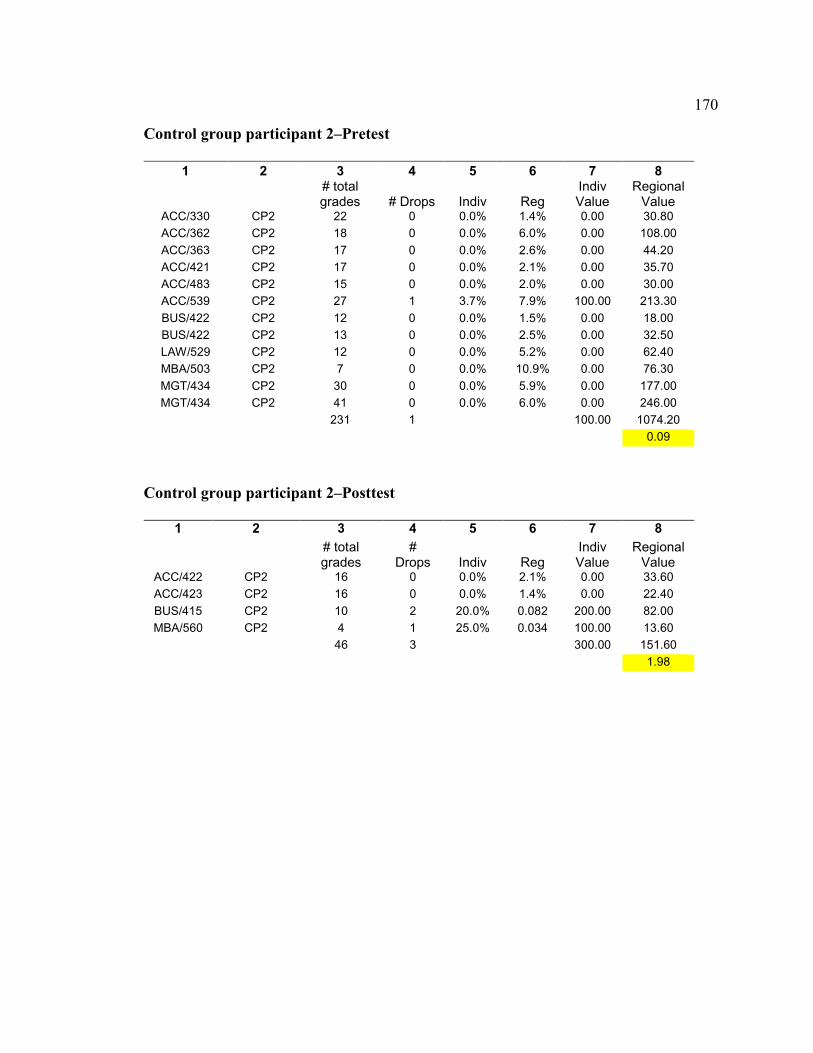
170
Control group participant 2–Pretest
1 2 3 4 5 6 7 8
# total grades # Drops Indiv Reg
Indiv Value
Regional Value
ACC/330 CP2 22 0 0.0% 1.4% 0.00 30.80 ACC/362 CP2 18 0 0.0% 6.0% 0.00 108.00 ACC/363 CP2 17 0 0.0% 2.6% 0.00 44.20 ACC/421 CP2 17 0 0.0% 2.1% 0.00 35.70 ACC/483 CP2 15 0 0.0% 2.0% 0.00 30.00 ACC/539 CP2 27 1 3.7% 7.9% 100.00 213.30 BUS/422 CP2 12 0 0.0% 1.5% 0.00 18.00 BUS/422 CP2 13 0 0.0% 2.5% 0.00 32.50 LAW/529 CP2 12 0 0.0% 5.2% 0.00 62.40 MBA/503 CP2 7 0 0.0% 10.9% 0.00 76.30 MGT/434 CP2 30 0 0.0% 5.9% 0.00 177.00 MGT/434 CP2 41 0 0.0% 6.0% 0.00 246.00
231 1 100.00 1074.20 0.09
Control group participant 2–Posttest
1 2 3 4 5 6 7 8
# total grades
# Drops Indiv Reg
Indiv Value
Regional Value
ACC/422 CP2 16 0 0.0% 2.1% 0.00 33.60 ACC/423 CP2 16 0 0.0% 1.4% 0.00 22.40 BUS/415 CP2 10 2 20.0% 0.082 200.00 82.00 MBA/560 CP2 4 1 25.0% 0.034 100.00 13.60
46 3 300.00 151.60 1.98
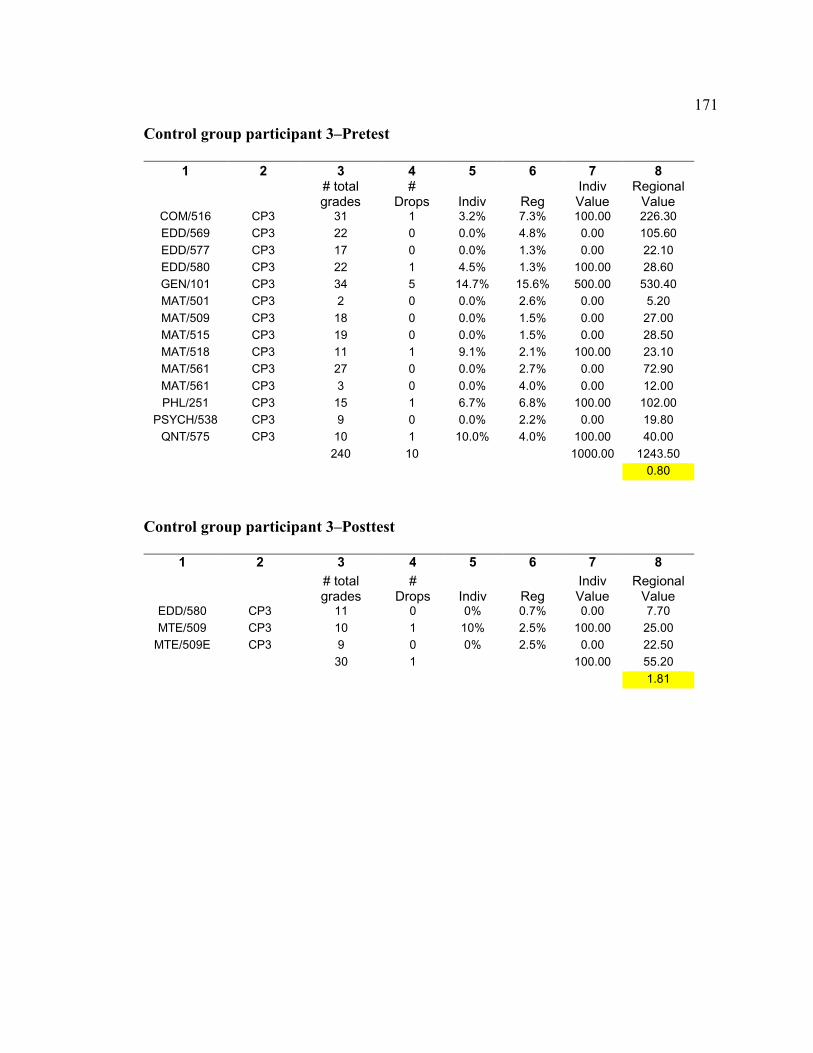
171
Control group participant 3–Pretest
1 2 3 4 5 6 7 8
# total grades
# Drops Indiv Reg
Indiv Value
Regional Value
COM/516 CP3 31 1 3.2% 7.3% 100.00 226.30 EDD/569 CP3 22 0 0.0% 4.8% 0.00 105.60 EDD/577 CP3 17 0 0.0% 1.3% 0.00 22.10 EDD/580 CP3 22 1 4.5% 1.3% 100.00 28.60 GEN/101 CP3 34 5 14.7% 15.6% 500.00 530.40 MAT/501 CP3 2 0 0.0% 2.6% 0.00 5.20 MAT/509 CP3 18 0 0.0% 1.5% 0.00 27.00 MAT/515 CP3 19 0 0.0% 1.5% 0.00 28.50 MAT/518 CP3 11 1 9.1% 2.1% 100.00 23.10 MAT/561 CP3 27 0 0.0% 2.7% 0.00 72.90 MAT/561 CP3 3 0 0.0% 4.0% 0.00 12.00 PHL/251 CP3 15 1 6.7% 6.8% 100.00 102.00
PSYCH/538 CP3 9 0 0.0% 2.2% 0.00 19.80 QNT/575 CP3 10 1 10.0% 4.0% 100.00 40.00
240 10 1000.00 1243.50 0.80
Control group participant 3–Posttest
1 2 3 4 5 6 7 8
# total grades
# Drops Indiv Reg
Indiv Value
Regional Value
EDD/580 CP3 11 0 0% 0.7% 0.00 7.70 MTE/509 CP3 10 1 10% 2.5% 100.00 25.00
MTE/509E CP3 9 0 0% 2.5% 0.00 22.50 30 1 100.00 55.20 1.81
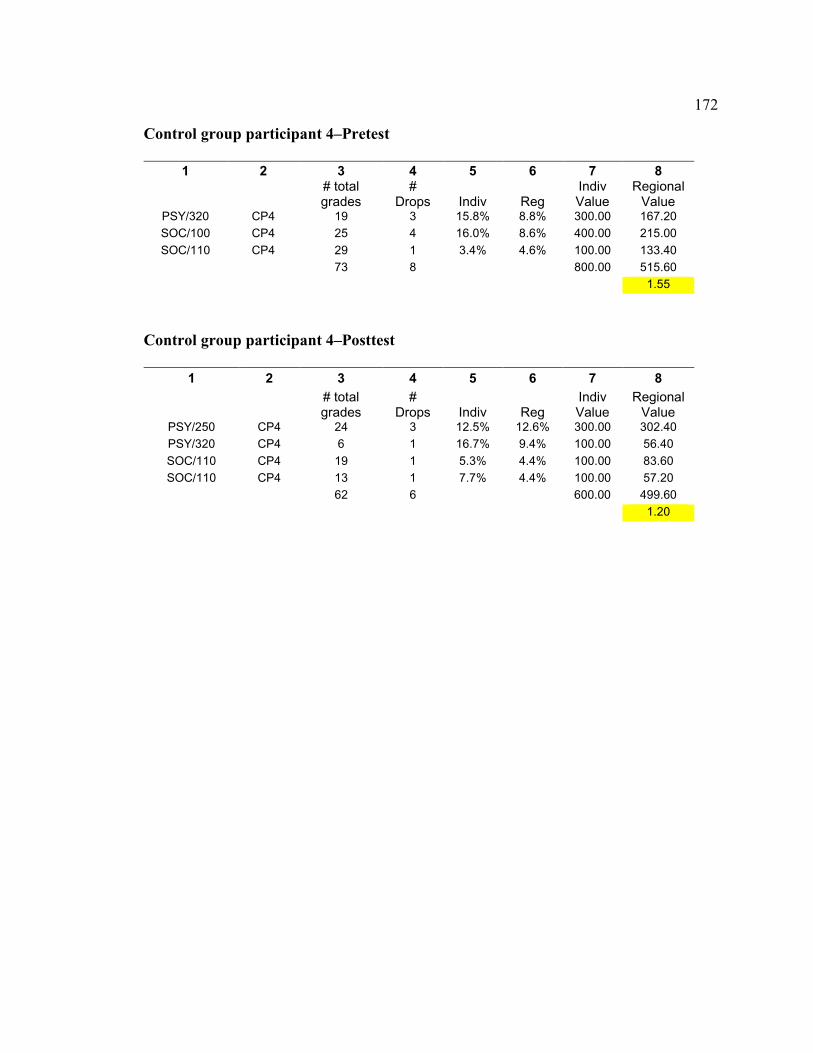
172
Control group participant 4–Pretest
1 2 3 4 5 6 7 8
# total grades
# Drops Indiv Reg
Indiv Value
Regional Value
PSY/320 CP4 19 3 15.8% 8.8% 300.00 167.20 SOC/100 CP4 25 4 16.0% 8.6% 400.00 215.00 SOC/110 CP4 29 1 3.4% 4.6% 100.00 133.40
73 8 800.00 515.60 1.55
Control group participant 4–Posttest
1 2 3 4 5 6 7 8
# total grades
# Drops Indiv Reg
Indiv Value
Regional Value
PSY/250 CP4 24 3 12.5% 12.6% 300.00 302.40 PSY/320 CP4 6 1 16.7% 9.4% 100.00 56.40 SOC/110 CP4 19 1 5.3% 4.4% 100.00 83.60 SOC/110 CP4 13 1 7.7% 4.4% 100.00 57.20
62 6 600.00 499.60 1.20
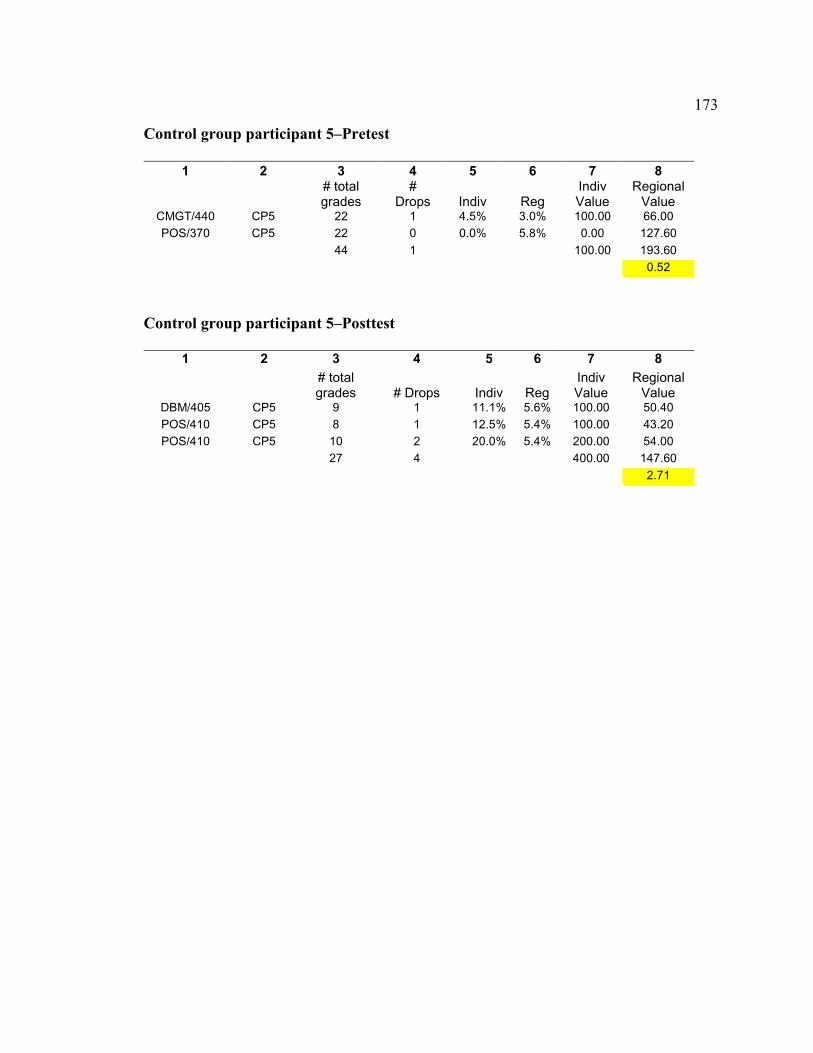
173
Control group participant 5–Pretest
1 2 3 4 5 6 7 8
# total grades
# Drops Indiv Reg
Indiv Value
Regional Value
CMGT/440 CP5 22 1 4.5% 3.0% 100.00 66.00 POS/370 CP5 22 0 0.0% 5.8% 0.00 127.60
44 1 100.00 193.60 0.52
Control group participant 5–Posttest
1 2 3 4 5 6 7 8
# total grades # Drops Indiv Reg
Indiv Value
Regional Value
DBM/405 CP5 9 1 11.1% 5.6% 100.00 50.40 POS/410 CP5 8 1 12.5% 5.4% 100.00 43.20 POS/410 CP5 10 2 20.0% 5.4% 200.00 54.00
27 4 400.00 147.60 2.71
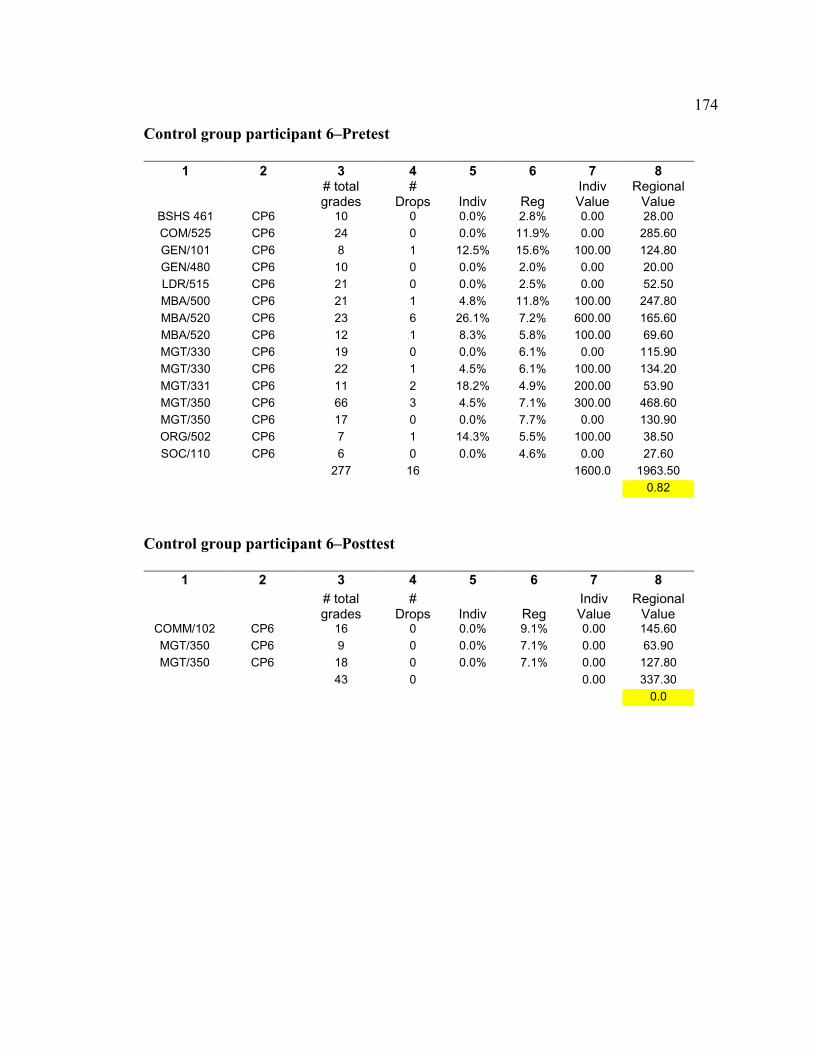
174
Control group participant 6–Pretest
1 2 3 4 5 6 7 8
# total grades
# Drops Indiv Reg
Indiv Value
Regional Value
BSHS 461 CP6 10 0 0.0% 2.8% 0.00 28.00 COM/525 CP6 24 0 0.0% 11.9% 0.00 285.60 GEN/101 CP6 8 1 12.5% 15.6% 100.00 124.80 GEN/480 CP6 10 0 0.0% 2.0% 0.00 20.00 LDR/515 CP6 21 0 0.0% 2.5% 0.00 52.50 MBA/500 CP6 21 1 4.8% 11.8% 100.00 247.80 MBA/520 CP6 23 6 26.1% 7.2% 600.00 165.60 MBA/520 CP6 12 1 8.3% 5.8% 100.00 69.60 MGT/330 CP6 19 0 0.0% 6.1% 0.00 115.90 MGT/330 CP6 22 1 4.5% 6.1% 100.00 134.20 MGT/331 CP6 11 2 18.2% 4.9% 200.00 53.90 MGT/350 CP6 66 3 4.5% 7.1% 300.00 468.60 MGT/350 CP6 17 0 0.0% 7.7% 0.00 130.90 ORG/502 CP6 7 1 14.3% 5.5% 100.00 38.50 SOC/110 CP6 6 0 0.0% 4.6% 0.00 27.60
277 16 1600.0 1963.50 0.82
Control group participant 6–Posttest
1 2 3 4 5 6 7 8
# total grades
# Drops Indiv Reg
Indiv Value
Regional Value
COMM/102 CP6 16 0 0.0% 9.1% 0.00 145.60 MGT/350 CP6 9 0 0.0% 7.1% 0.00 63.90 MGT/350 CP6 18 0 0.0% 7.1% 0.00 127.80
43 0 0.00 337.30 0.0
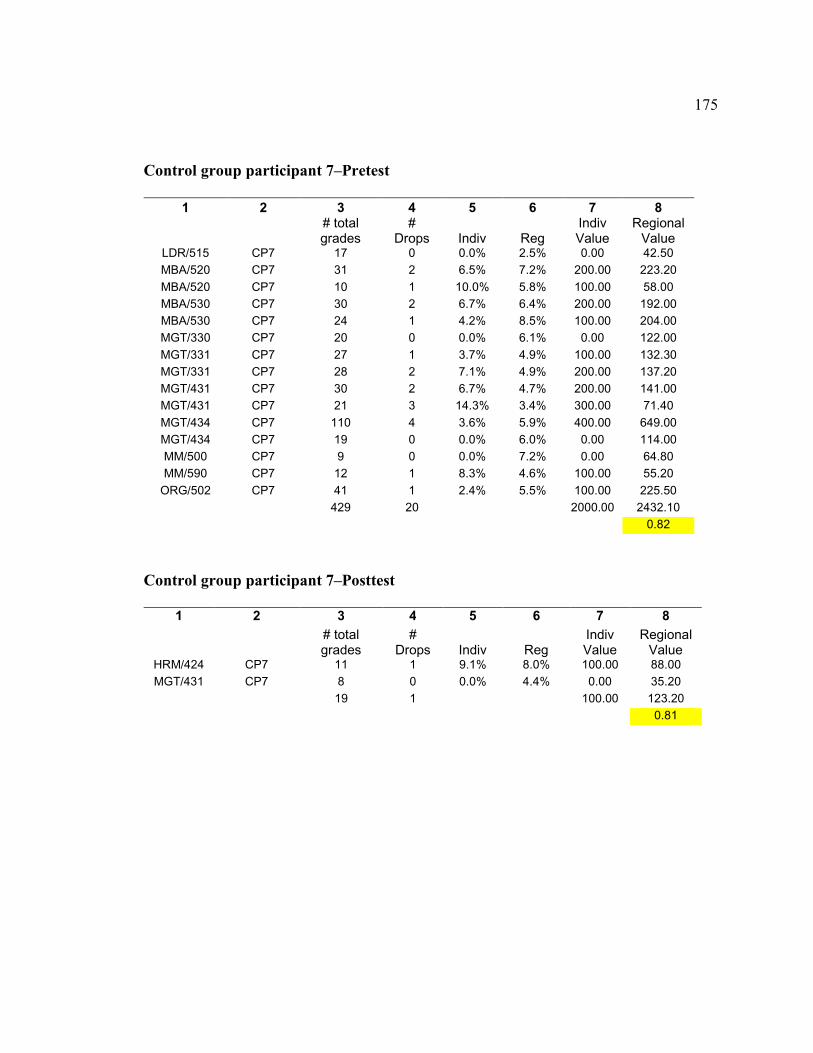
175
Control group participant 7–Pretest
1 2 3 4 5 6 7 8
# total grades
# Drops Indiv Reg
Indiv Value
Regional Value
LDR/515 CP7 17 0 0.0% 2.5% 0.00 42.50 MBA/520 CP7 31 2 6.5% 7.2% 200.00 223.20 MBA/520 CP7 10 1 10.0% 5.8% 100.00 58.00 MBA/530 CP7 30 2 6.7% 6.4% 200.00 192.00 MBA/530 CP7 24 1 4.2% 8.5% 100.00 204.00 MGT/330 CP7 20 0 0.0% 6.1% 0.00 122.00 MGT/331 CP7 27 1 3.7% 4.9% 100.00 132.30 MGT/331 CP7 28 2 7.1% 4.9% 200.00 137.20 MGT/431 CP7 30 2 6.7% 4.7% 200.00 141.00 MGT/431 CP7 21 3 14.3% 3.4% 300.00 71.40 MGT/434 CP7 110 4 3.6% 5.9% 400.00 649.00 MGT/434 CP7 19 0 0.0% 6.0% 0.00 114.00 MM/500 CP7 9 0 0.0% 7.2% 0.00 64.80 MM/590 CP7 12 1 8.3% 4.6% 100.00 55.20
ORG/502 CP7 41 1 2.4% 5.5% 100.00 225.50 429 20 2000.00 2432.10 0.82
Control group participant 7–Posttest
1 2 3 4 5 6 7 8
# total grades
# Drops Indiv Reg
Indiv Value
Regional Value
HRM/424 CP7 11 1 9.1% 8.0% 100.00 88.00 MGT/431 CP7 8 0 0.0% 4.4% 0.00 35.20
19 1 100.00 123.20 0.81
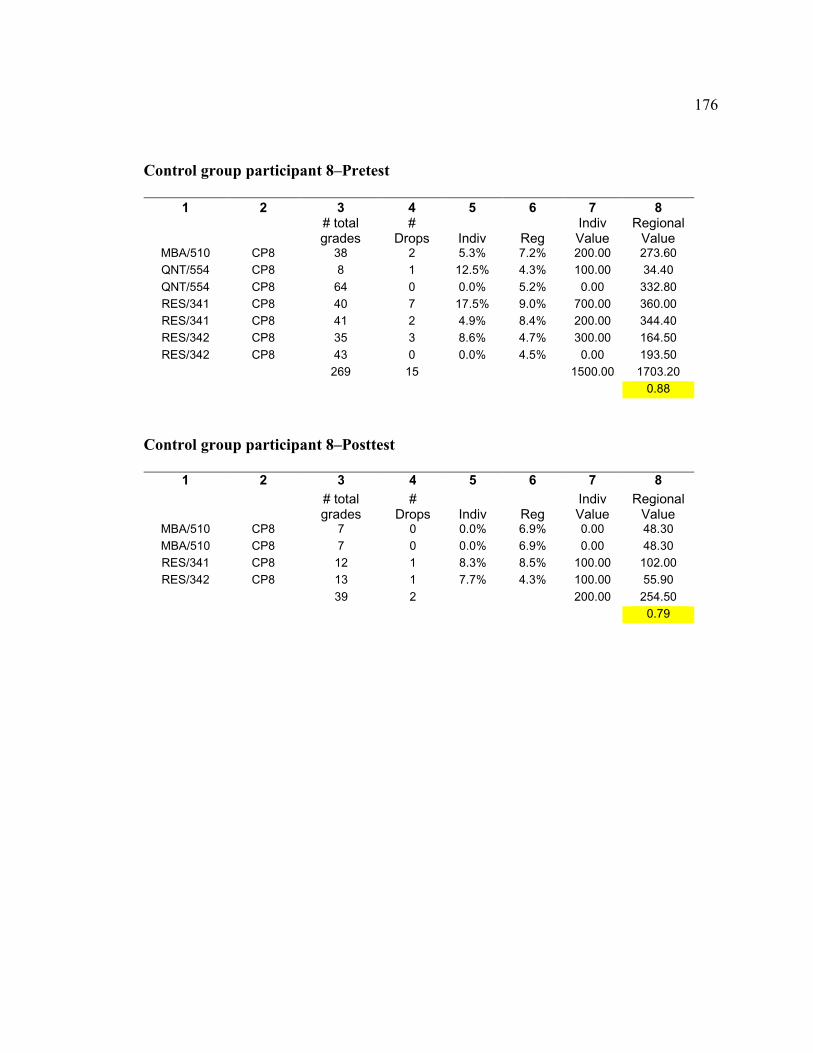
176
Control group participant 8–Pretest
1 2 3 4 5 6 7 8
# total grades
# Drops Indiv Reg
Indiv Value
Regional Value
MBA/510 CP8 38 2 5.3% 7.2% 200.00 273.60 QNT/554 CP8 8 1 12.5% 4.3% 100.00 34.40 QNT/554 CP8 64 0 0.0% 5.2% 0.00 332.80 RES/341 CP8 40 7 17.5% 9.0% 700.00 360.00 RES/341 CP8 41 2 4.9% 8.4% 200.00 344.40 RES/342 CP8 35 3 8.6% 4.7% 300.00 164.50 RES/342 CP8 43 0 0.0% 4.5% 0.00 193.50
269 15 1500.00 1703.20 0.88
Control group participant 8–Posttest
1 2 3 4 5 6 7 8
# total grades
# Drops Indiv Reg
Indiv Value
Regional Value
MBA/510 CP8 7 0 0.0% 6.9% 0.00 48.30 MBA/510 CP8 7 0 0.0% 6.9% 0.00 48.30 RES/341 CP8 12 1 8.3% 8.5% 100.00 102.00 RES/342 CP8 13 1 7.7% 4.3% 100.00 55.90
39 2 200.00 254.50 0.79
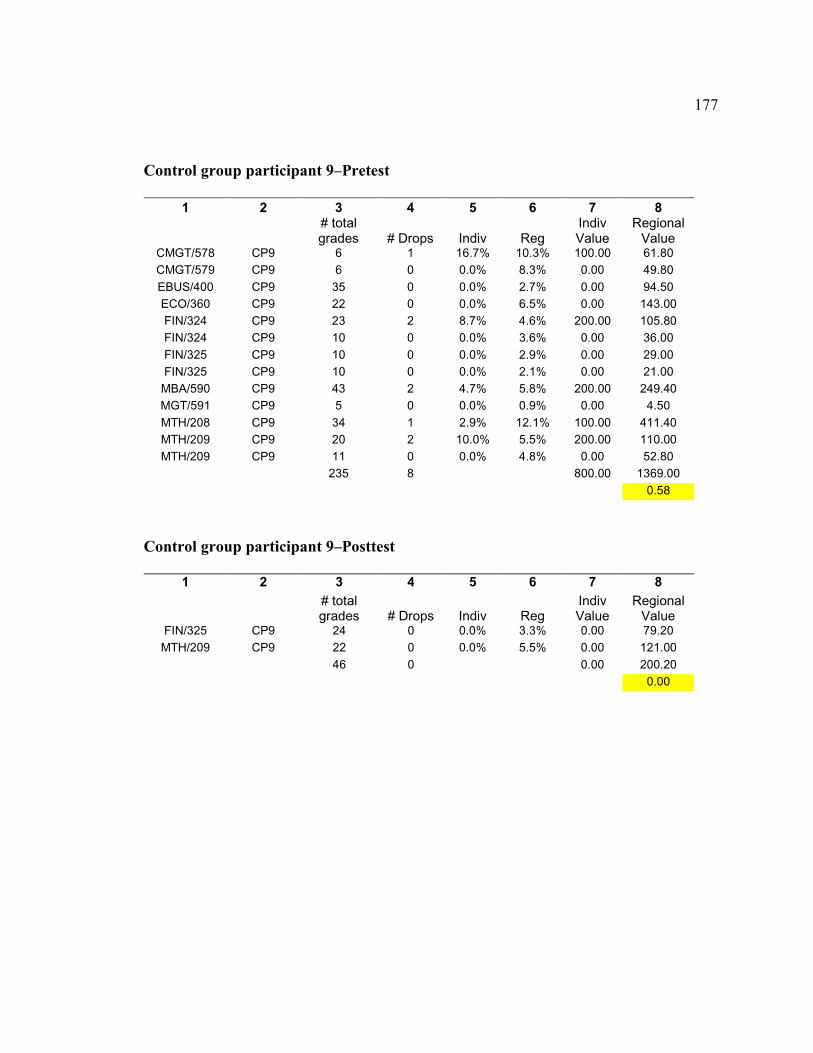
177
Control group participant 9–Pretest
1 2 3 4 5 6 7 8
# total grades # Drops Indiv Reg
Indiv Value
Regional Value
CMGT/578 CP9 6 1 16.7% 10.3% 100.00 61.80 CMGT/579 CP9 6 0 0.0% 8.3% 0.00 49.80 EBUS/400 CP9 35 0 0.0% 2.7% 0.00 94.50 ECO/360 CP9 22 0 0.0% 6.5% 0.00 143.00 FIN/324 CP9 23 2 8.7% 4.6% 200.00 105.80 FIN/324 CP9 10 0 0.0% 3.6% 0.00 36.00 FIN/325 CP9 10 0 0.0% 2.9% 0.00 29.00 FIN/325 CP9 10 0 0.0% 2.1% 0.00 21.00
MBA/590 CP9 43 2 4.7% 5.8% 200.00 249.40 MGT/591 CP9 5 0 0.0% 0.9% 0.00 4.50 MTH/208 CP9 34 1 2.9% 12.1% 100.00 411.40 MTH/209 CP9 20 2 10.0% 5.5% 200.00 110.00 MTH/209 CP9 11 0 0.0% 4.8% 0.00 52.80
235 8 800.00 1369.00 0.58
Control group participant 9–Posttest
1 2 3 4 5 6 7 8
# total grades # Drops Indiv Reg
Indiv Value
Regional Value
FIN/325 CP9 24 0 0.0% 3.3% 0.00 79.20 MTH/209 CP9 22 0 0.0% 5.5% 0.00 121.00
46 0 0.00 200.20 0.00
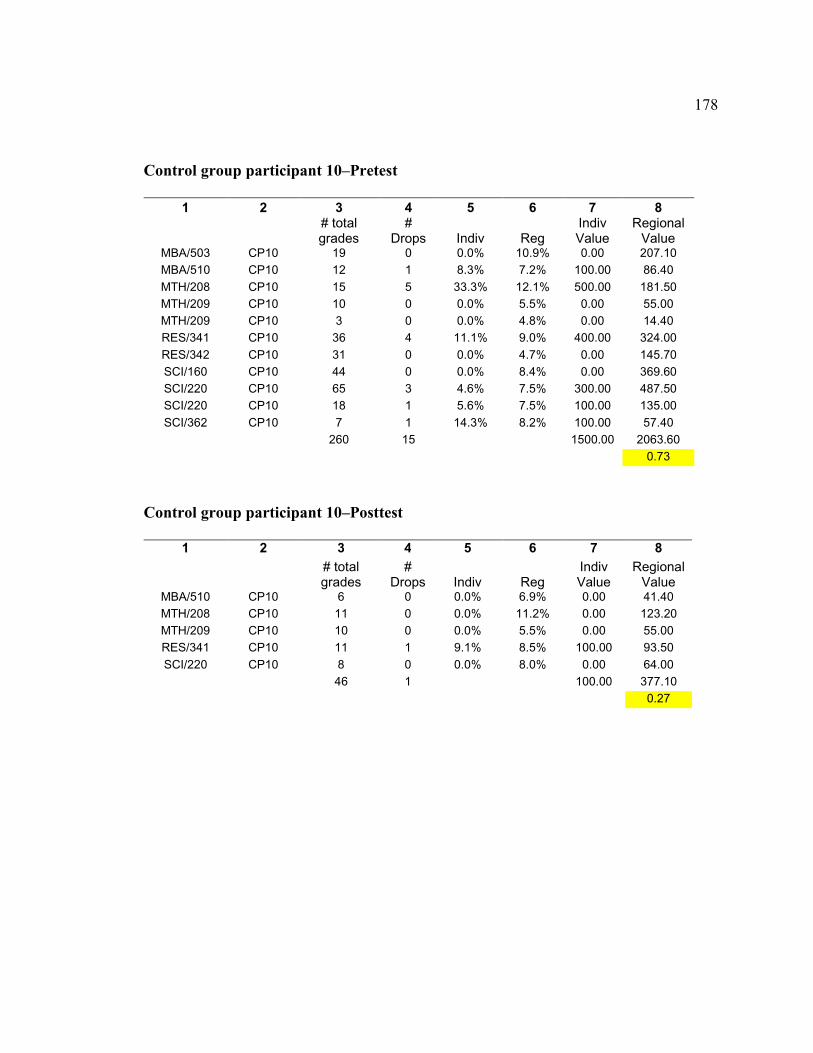
178
Control group participant 10–Pretest
1 2 3 4 5 6 7 8
# total grades
# Drops Indiv Reg
Indiv Value
Regional Value
MBA/503 CP10 19 0 0.0% 10.9% 0.00 207.10 MBA/510 CP10 12 1 8.3% 7.2% 100.00 86.40 MTH/208 CP10 15 5 33.3% 12.1% 500.00 181.50 MTH/209 CP10 10 0 0.0% 5.5% 0.00 55.00 MTH/209 CP10 3 0 0.0% 4.8% 0.00 14.40 RES/341 CP10 36 4 11.1% 9.0% 400.00 324.00 RES/342 CP10 31 0 0.0% 4.7% 0.00 145.70 SCI/160 CP10 44 0 0.0% 8.4% 0.00 369.60 SCI/220 CP10 65 3 4.6% 7.5% 300.00 487.50 SCI/220 CP10 18 1 5.6% 7.5% 100.00 135.00 SCI/362 CP10 7 1 14.3% 8.2% 100.00 57.40
260 15 1500.00 2063.60 0.73
Control group participant 10–Posttest
1 2 3 4 5 6 7 8
# total grades
# Drops Indiv Reg
Indiv Value
Regional Value
MBA/510 CP10 6 0 0.0% 6.9% 0.00 41.40 MTH/208 CP10 11 0 0.0% 11.2% 0.00 123.20 MTH/209 CP10 10 0 0.0% 5.5% 0.00 55.00 RES/341 CP10 11 1 9.1% 8.5% 100.00 93.50 SCI/220 CP10 8 0 0.0% 8.0% 0.00 64.00
46 1 100.00 377.10 0.27
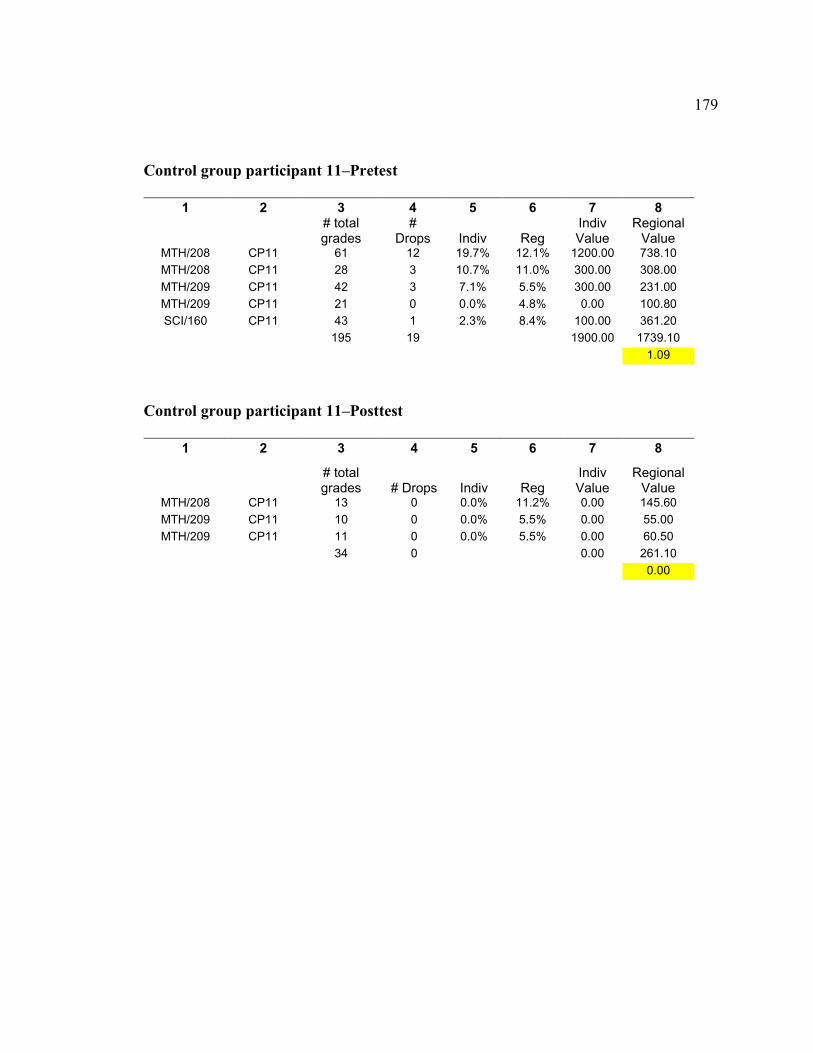
179
Control group participant 11–Pretest
1 2 3 4 5 6 7 8
# total grades
# Drops Indiv Reg
Indiv Value
Regional Value
MTH/208 CP11 61 12 19.7% 12.1% 1200.00 738.10 MTH/208 CP11 28 3 10.7% 11.0% 300.00 308.00 MTH/209 CP11 42 3 7.1% 5.5% 300.00 231.00 MTH/209 CP11 21 0 0.0% 4.8% 0.00 100.80 SCI/160 CP11 43 1 2.3% 8.4% 100.00 361.20
195 19 1900.00 1739.10 1.09
Control group participant 11–Posttest
1 2 3 4 5 6 7 8
# total grades # Drops Indiv Reg
Indiv Value
Regional Value
MTH/208 CP11 13 0 0.0% 11.2% 0.00 145.60 MTH/209 CP11 10 0 0.0% 5.5% 0.00 55.00 MTH/209 CP11 11 0 0.0% 5.5% 0.00 60.50
34 0 0.00 261.10 0.00
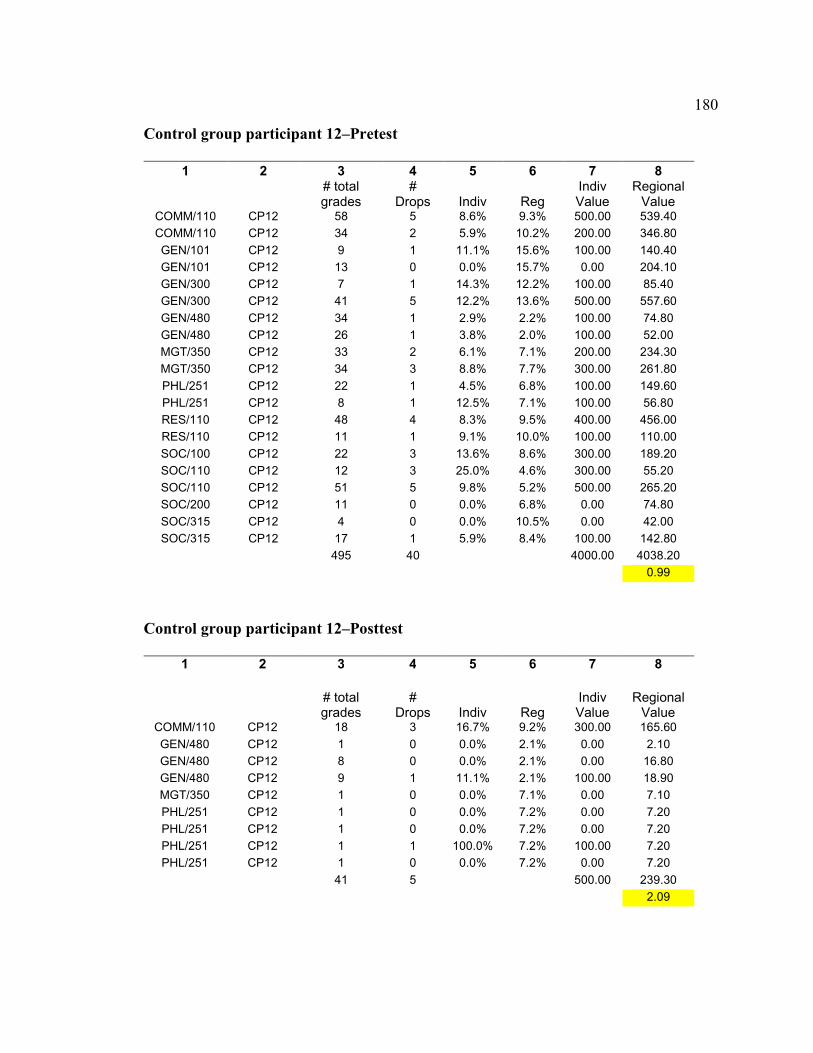
180
Control group participant 12–Pretest
1 2 3 4 5 6 7 8
# total grades
# Drops Indiv Reg
Indiv Value
Regional Value
COMM/110 CP12 58 5 8.6% 9.3% 500.00 539.40 COMM/110 CP12 34 2 5.9% 10.2% 200.00 346.80 GEN/101 CP12 9 1 11.1% 15.6% 100.00 140.40 GEN/101 CP12 13 0 0.0% 15.7% 0.00 204.10 GEN/300 CP12 7 1 14.3% 12.2% 100.00 85.40 GEN/300 CP12 41 5 12.2% 13.6% 500.00 557.60 GEN/480 CP12 34 1 2.9% 2.2% 100.00 74.80 GEN/480 CP12 26 1 3.8% 2.0% 100.00 52.00 MGT/350 CP12 33 2 6.1% 7.1% 200.00 234.30 MGT/350 CP12 34 3 8.8% 7.7% 300.00 261.80 PHL/251 CP12 22 1 4.5% 6.8% 100.00 149.60 PHL/251 CP12 8 1 12.5% 7.1% 100.00 56.80 RES/110 CP12 48 4 8.3% 9.5% 400.00 456.00 RES/110 CP12 11 1 9.1% 10.0% 100.00 110.00 SOC/100 CP12 22 3 13.6% 8.6% 300.00 189.20 SOC/110 CP12 12 3 25.0% 4.6% 300.00 55.20 SOC/110 CP12 51 5 9.8% 5.2% 500.00 265.20 SOC/200 CP12 11 0 0.0% 6.8% 0.00 74.80 SOC/315 CP12 4 0 0.0% 10.5% 0.00 42.00 SOC/315 CP12 17 1 5.9% 8.4% 100.00 142.80
495 40 4000.00 4038.20 0.99
Control group participant 12–Posttest
1 2 3 4 5 6 7 8
# total grades
# Drops Indiv Reg
Indiv Value
Regional Value
COMM/110 CP12 18 3 16.7% 9.2% 300.00 165.60 GEN/480 CP12 1 0 0.0% 2.1% 0.00 2.10 GEN/480 CP12 8 0 0.0% 2.1% 0.00 16.80 GEN/480 CP12 9 1 11.1% 2.1% 100.00 18.90 MGT/350 CP12 1 0 0.0% 7.1% 0.00 7.10 PHL/251 CP12 1 0 0.0% 7.2% 0.00 7.20 PHL/251 CP12 1 0 0.0% 7.2% 0.00 7.20 PHL/251 CP12 1 1 100.0% 7.2% 100.00 7.20 PHL/251 CP12 1 0 0.0% 7.2% 0.00 7.20
41 5 500.00 239.30 2.09
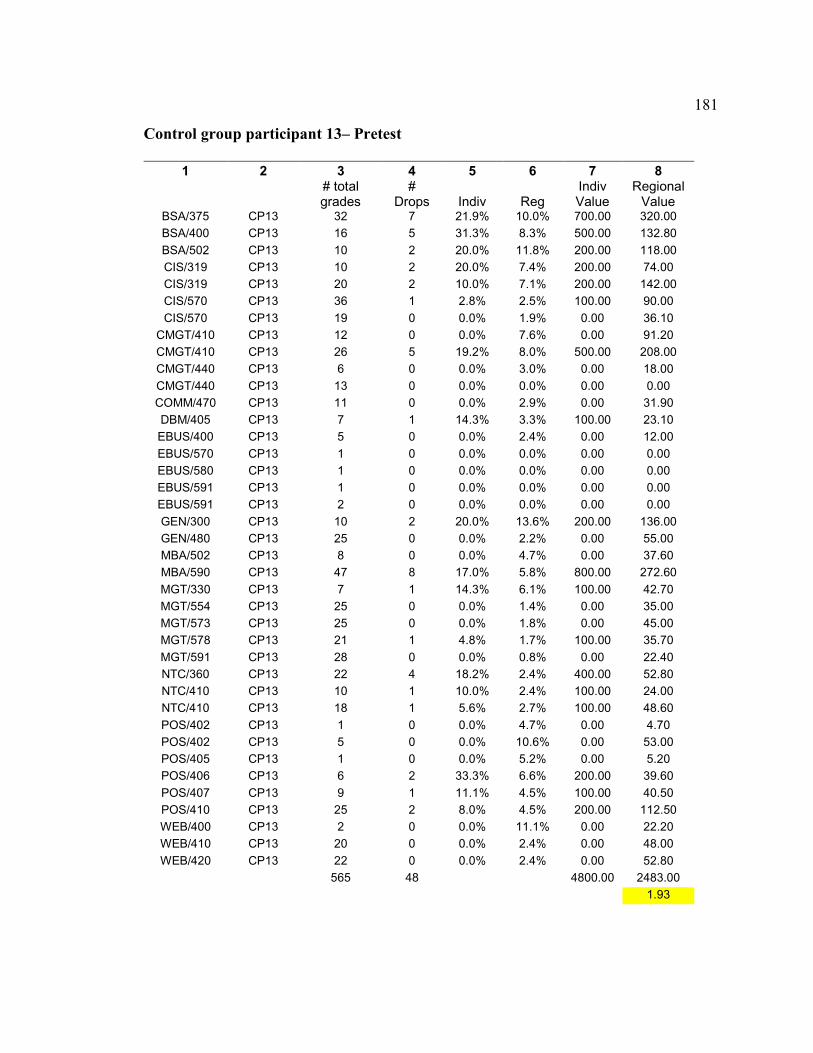
181
Control group participant 13– Pretest
1 2 3 4 5 6 7 8
# total grades
# Drops Indiv Reg
Indiv Value
Regional Value
BSA/375 CP13 32 7 21.9% 10.0% 700.00 320.00 BSA/400 CP13 16 5 31.3% 8.3% 500.00 132.80 BSA/502 CP13 10 2 20.0% 11.8% 200.00 118.00 CIS/319 CP13 10 2 20.0% 7.4% 200.00 74.00 CIS/319 CP13 20 2 10.0% 7.1% 200.00 142.00 CIS/570 CP13 36 1 2.8% 2.5% 100.00 90.00 CIS/570 CP13 19 0 0.0% 1.9% 0.00 36.10
CMGT/410 CP13 12 0 0.0% 7.6% 0.00 91.20 CMGT/410 CP13 26 5 19.2% 8.0% 500.00 208.00 CMGT/440 CP13 6 0 0.0% 3.0% 0.00 18.00 CMGT/440 CP13 13 0 0.0% 0.0% 0.00 0.00 COMM/470 CP13 11 0 0.0% 2.9% 0.00 31.90 DBM/405 CP13 7 1 14.3% 3.3% 100.00 23.10 EBUS/400 CP13 5 0 0.0% 2.4% 0.00 12.00 EBUS/570 CP13 1 0 0.0% 0.0% 0.00 0.00 EBUS/580 CP13 1 0 0.0% 0.0% 0.00 0.00 EBUS/591 CP13 1 0 0.0% 0.0% 0.00 0.00 EBUS/591 CP13 2 0 0.0% 0.0% 0.00 0.00 GEN/300 CP13 10 2 20.0% 13.6% 200.00 136.00 GEN/480 CP13 25 0 0.0% 2.2% 0.00 55.00 MBA/502 CP13 8 0 0.0% 4.7% 0.00 37.60 MBA/590 CP13 47 8 17.0% 5.8% 800.00 272.60 MGT/330 CP13 7 1 14.3% 6.1% 100.00 42.70 MGT/554 CP13 25 0 0.0% 1.4% 0.00 35.00 MGT/573 CP13 25 0 0.0% 1.8% 0.00 45.00 MGT/578 CP13 21 1 4.8% 1.7% 100.00 35.70 MGT/591 CP13 28 0 0.0% 0.8% 0.00 22.40 NTC/360 CP13 22 4 18.2% 2.4% 400.00 52.80 NTC/410 CP13 10 1 10.0% 2.4% 100.00 24.00 NTC/410 CP13 18 1 5.6% 2.7% 100.00 48.60 POS/402 CP13 1 0 0.0% 4.7% 0.00 4.70 POS/402 CP13 5 0 0.0% 10.6% 0.00 53.00 POS/405 CP13 1 0 0.0% 5.2% 0.00 5.20 POS/406 CP13 6 2 33.3% 6.6% 200.00 39.60 POS/407 CP13 9 1 11.1% 4.5% 100.00 40.50 POS/410 CP13 25 2 8.0% 4.5% 200.00 112.50 WEB/400 CP13 2 0 0.0% 11.1% 0.00 22.20 WEB/410 CP13 20 0 0.0% 2.4% 0.00 48.00 WEB/420 CP13 22 0 0.0% 2.4% 0.00 52.80
565 48 4800.00 2483.00 1.93
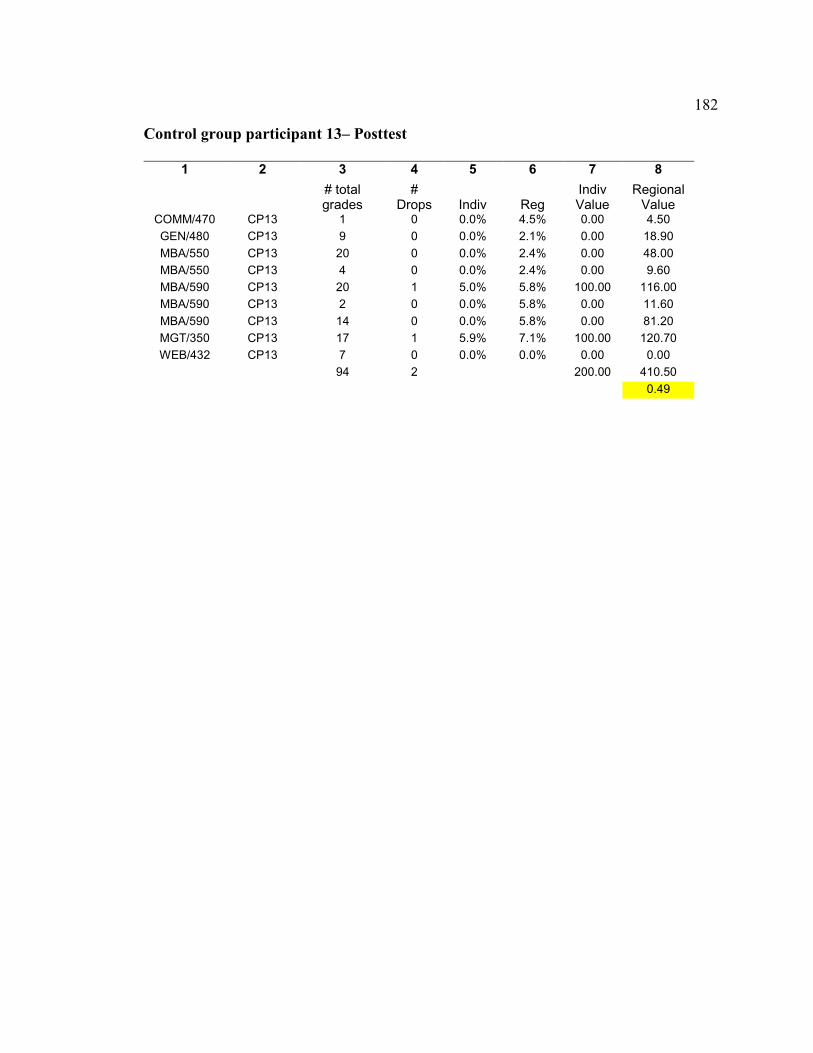
182
Control group participant 13– Posttest
1 2 3 4 5 6 7 8
# total grades
# Drops Indiv Reg
Indiv Value
Regional Value
COMM/470 CP13 1 0 0.0% 4.5% 0.00 4.50 GEN/480 CP13 9 0 0.0% 2.1% 0.00 18.90 MBA/550 CP13 20 0 0.0% 2.4% 0.00 48.00 MBA/550 CP13 4 0 0.0% 2.4% 0.00 9.60 MBA/590 CP13 20 1 5.0% 5.8% 100.00 116.00 MBA/590 CP13 2 0 0.0% 5.8% 0.00 11.60 MBA/590 CP13 14 0 0.0% 5.8% 0.00 81.20 MGT/350 CP13 17 1 5.9% 7.1% 100.00 120.70 WEB/432 CP13 7 0 0.0% 0.0% 0.00 0.00
94 2 200.00 410.50 0.49
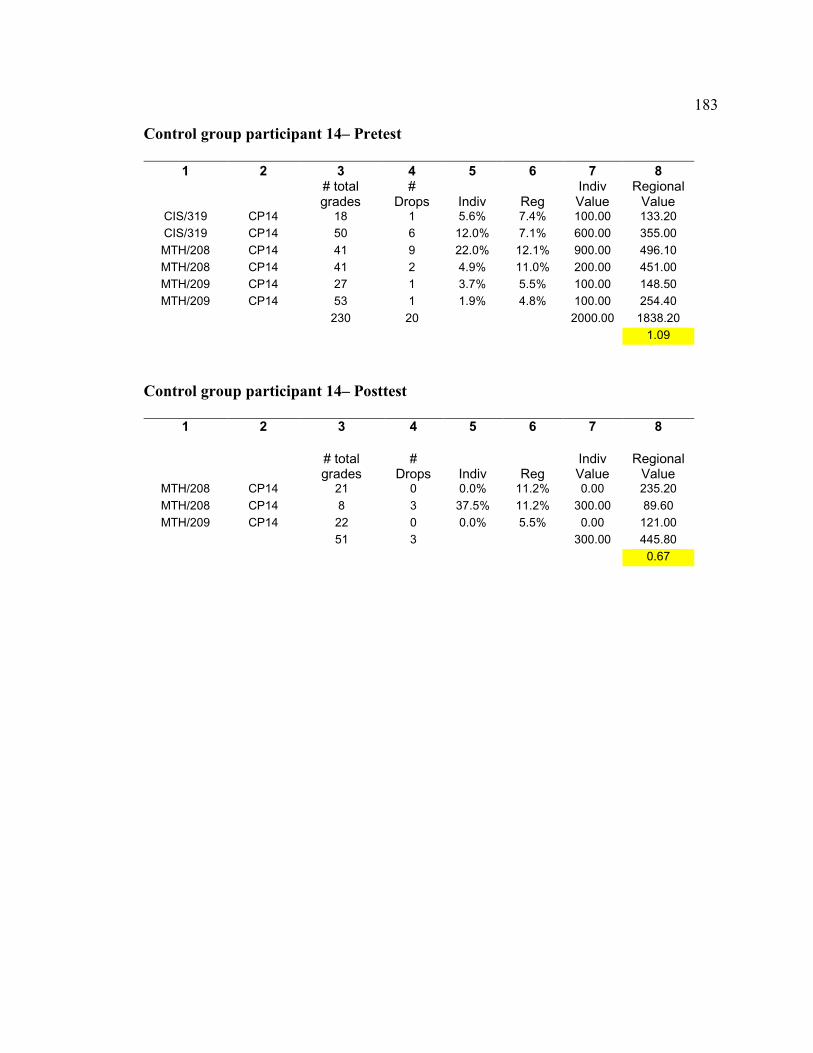
183
Control group participant 14– Pretest
1 2 3 4 5 6 7 8
# total grades
# Drops Indiv Reg
Indiv Value
Regional Value
CIS/319 CP14 18 1 5.6% 7.4% 100.00 133.20 CIS/319 CP14 50 6 12.0% 7.1% 600.00 355.00 MTH/208 CP14 41 9 22.0% 12.1% 900.00 496.10 MTH/208 CP14 41 2 4.9% 11.0% 200.00 451.00 MTH/209 CP14 27 1 3.7% 5.5% 100.00 148.50 MTH/209 CP14 53 1 1.9% 4.8% 100.00 254.40
230 20 2000.00 1838.20 1.09
Control group participant 14– Posttest
1 2 3 4 5 6 7 8
# total grades
# Drops Indiv Reg
Indiv Value
Regional Value
MTH/208 CP14 21 0 0.0% 11.2% 0.00 235.20 MTH/208 CP14 8 3 37.5% 11.2% 300.00 89.60 MTH/209 CP14 22 0 0.0% 5.5% 0.00 121.00
51 3 300.00 445.80 0.67
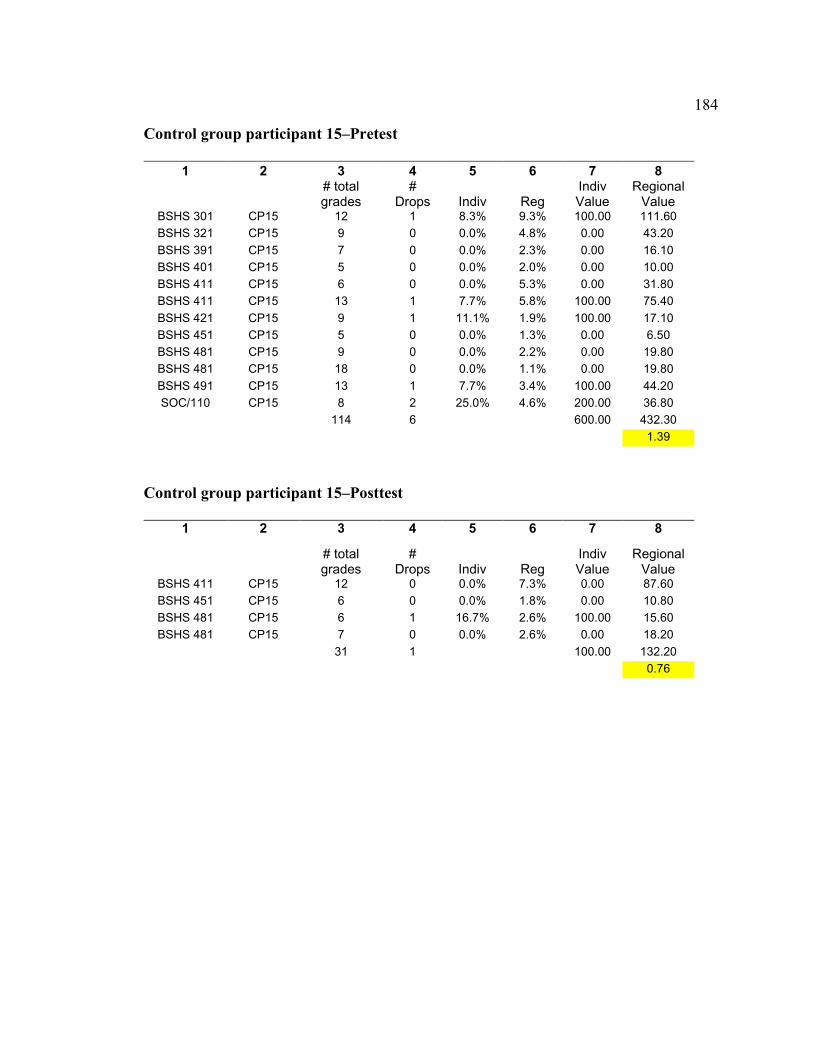
184
Control group participant 15–Pretest
1 2 3 4 5 6 7 8
# total grades
# Drops Indiv Reg
Indiv Value
Regional Value
BSHS 301 CP15 12 1 8.3% 9.3% 100.00 111.60 BSHS 321 CP15 9 0 0.0% 4.8% 0.00 43.20 BSHS 391 CP15 7 0 0.0% 2.3% 0.00 16.10 BSHS 401 CP15 5 0 0.0% 2.0% 0.00 10.00 BSHS 411 CP15 6 0 0.0% 5.3% 0.00 31.80 BSHS 411 CP15 13 1 7.7% 5.8% 100.00 75.40 BSHS 421 CP15 9 1 11.1% 1.9% 100.00 17.10 BSHS 451 CP15 5 0 0.0% 1.3% 0.00 6.50 BSHS 481 CP15 9 0 0.0% 2.2% 0.00 19.80 BSHS 481 CP15 18 0 0.0% 1.1% 0.00 19.80 BSHS 491 CP15 13 1 7.7% 3.4% 100.00 44.20 SOC/110 CP15 8 2 25.0% 4.6% 200.00 36.80
114 6 600.00 432.30 1.39
Control group participant 15–Posttest
1 2 3 4 5 6 7 8
# total grades
# Drops Indiv Reg
Indiv Value
Regional Value
BSHS 411 CP15 12 0 0.0% 7.3% 0.00 87.60 BSHS 451 CP15 6 0 0.0% 1.8% 0.00 10.80 BSHS 481 CP15 6 1 16.7% 2.6% 100.00 15.60 BSHS 481 CP15 7 0 0.0% 2.6% 0.00 18.20
31 1 100.00 132.20 0.76
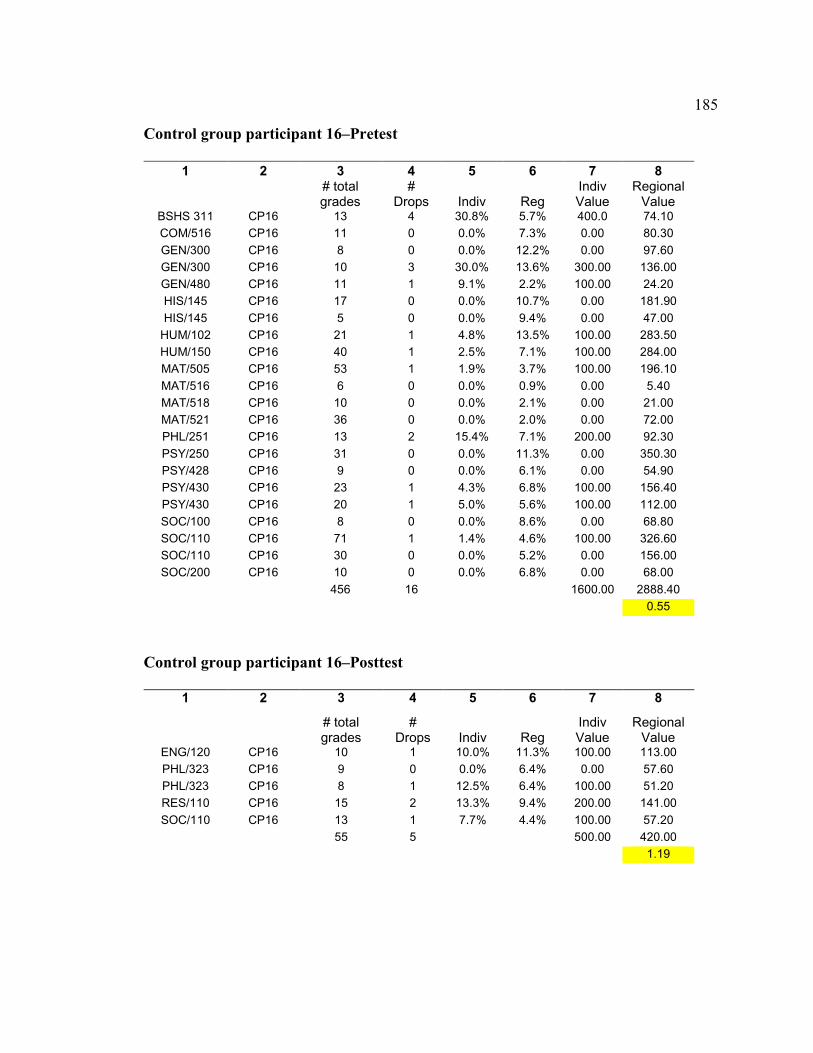
185
Control group participant 16–Pretest
1 2 3 4 5 6 7 8
# total grades
# Drops Indiv Reg
Indiv Value
Regional Value
BSHS 311 CP16 13 4 30.8% 5.7% 400.0 74.10 COM/516 CP16 11 0 0.0% 7.3% 0.00 80.30 GEN/300 CP16 8 0 0.0% 12.2% 0.00 97.60 GEN/300 CP16 10 3 30.0% 13.6% 300.00 136.00 GEN/480 CP16 11 1 9.1% 2.2% 100.00 24.20 HIS/145 CP16 17 0 0.0% 10.7% 0.00 181.90 HIS/145 CP16 5 0 0.0% 9.4% 0.00 47.00
HUM/102 CP16 21 1 4.8% 13.5% 100.00 283.50 HUM/150 CP16 40 1 2.5% 7.1% 100.00 284.00 MAT/505 CP16 53 1 1.9% 3.7% 100.00 196.10 MAT/516 CP16 6 0 0.0% 0.9% 0.00 5.40 MAT/518 CP16 10 0 0.0% 2.1% 0.00 21.00 MAT/521 CP16 36 0 0.0% 2.0% 0.00 72.00 PHL/251 CP16 13 2 15.4% 7.1% 200.00 92.30 PSY/250 CP16 31 0 0.0% 11.3% 0.00 350.30 PSY/428 CP16 9 0 0.0% 6.1% 0.00 54.90 PSY/430 CP16 23 1 4.3% 6.8% 100.00 156.40 PSY/430 CP16 20 1 5.0% 5.6% 100.00 112.00 SOC/100 CP16 8 0 0.0% 8.6% 0.00 68.80 SOC/110 CP16 71 1 1.4% 4.6% 100.00 326.60 SOC/110 CP16 30 0 0.0% 5.2% 0.00 156.00 SOC/200 CP16 10 0 0.0% 6.8% 0.00 68.00
456 16 1600.00 2888.40 0.55
Control group participant 16–Posttest
1 2 3 4 5 6 7 8
# total grades
# Drops Indiv Reg
Indiv Value
Regional Value
ENG/120 CP16 10 1 10.0% 11.3% 100.00 113.00 PHL/323 CP16 9 0 0.0% 6.4% 0.00 57.60 PHL/323 CP16 8 1 12.5% 6.4% 100.00 51.20 RES/110 CP16 15 2 13.3% 9.4% 200.00 141.00 SOC/110 CP16 13 1 7.7% 4.4% 100.00 57.20
55 5 500.00 420.00 1.19
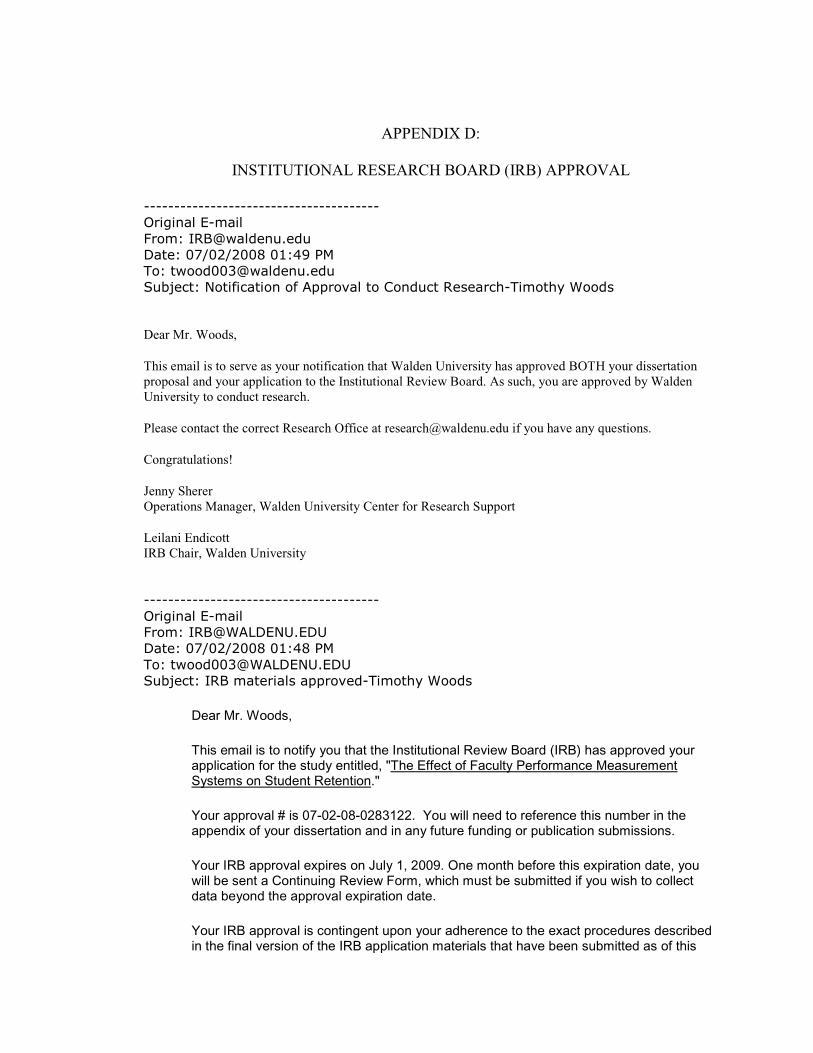
APPENDIX D:
INSTITUTIONAL RESEARCH BOARD (IRB) APPROVAL
---------------------------------------
Original E-mail
From: [email protected]
Date: 07/02/2008 01:49 PM
Subject: Notification of Approval to Conduct Research-Timothy Woods
Dear Mr. Woods, This email is to serve as your notification that Walden University has approved BOTH your dissertation proposal and your application to the Institutional Review Board. As such, you are approved by Walden University to conduct research. Please contact the correct Research Office at [email protected] if you have any questions. Congratulations! Jenny Sherer Operations Manager, Walden University Center for Research Support Leilani Endicott IRB Chair, Walden University ---------------------------------------
Original E-mail
From: [email protected]
Date: 07/02/2008 01:48 PM
Subject: IRB materials approved-Timothy Woods
Dear Mr. Woods,
This email is to notify you that the Institutional Review Board (IRB) has approved your application for the study entitled, "The Effect of Faculty Performance Measurement Systems on Student Retention." Your approval # is 07-02-08-0283122. You will need to reference this number in the appendix of your dissertation and in any future funding or publication submissions. Your IRB approval expires on July 1, 2009. One month before this expiration date, you will be sent a Continuing Review Form, which must be submitted if you wish to collect data beyond the approval expiration date. Your IRB approval is contingent upon your adherence to the exact procedures described in the final version of the IRB application materials that have been submitted as of this
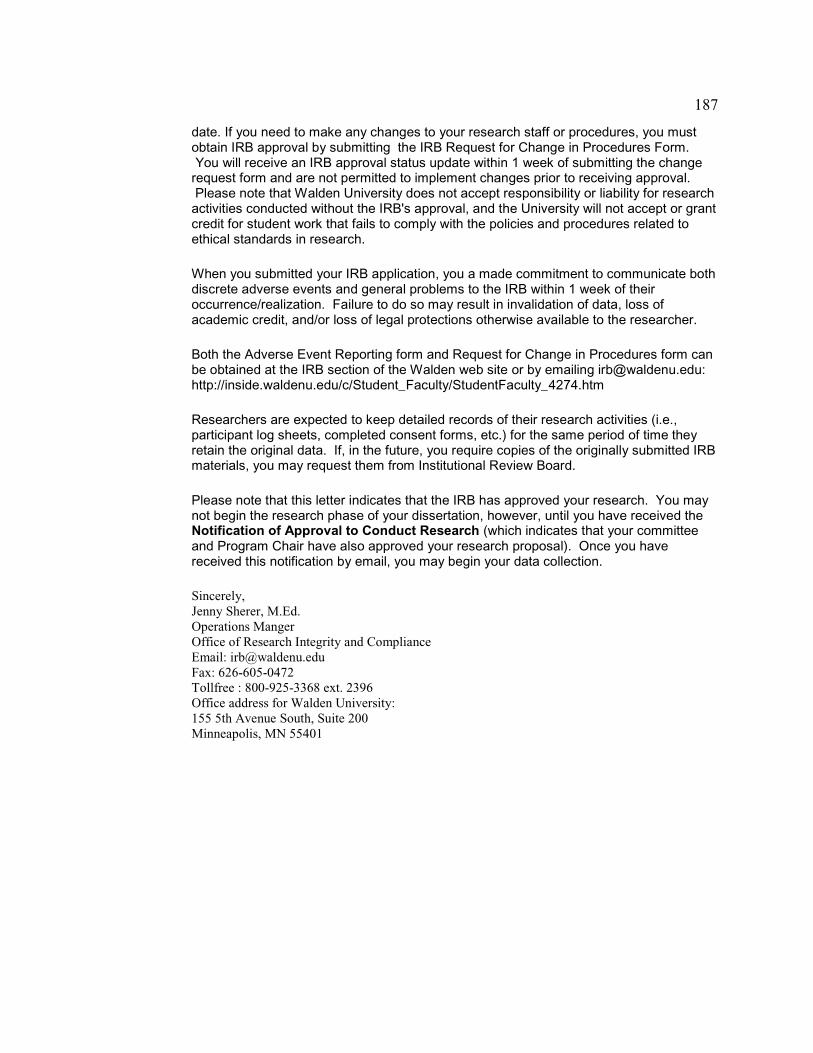
187
date. If you need to make any changes to your research staff or procedures, you must obtain IRB approval by submitting the IRB Request for Change in Procedures Form. You will receive an IRB approval status update within 1 week of submitting the change request form and are not permitted to implement changes prior to receiving approval. Please note that Walden University does not accept responsibility or liability for research activities conducted without the IRB's approval, and the University will not accept or grant credit for student work that fails to comply with the policies and procedures related to ethical standards in research. When you submitted your IRB application, you a made commitment to communicate both discrete adverse events and general problems to the IRB within 1 week of their occurrence/realization. Failure to do so may result in invalidation of data, loss of academic credit, and/or loss of legal protections otherwise available to the researcher. Both the Adverse Event Reporting form and Request for Change in Procedures form can be obtained at the IRB section of the Walden web site or by emailing [email protected]: http://inside.waldenu.edu/c/Student_Faculty/StudentFaculty_4274.htm Researchers are expected to keep detailed records of their research activities (i.e., participant log sheets, completed consent forms, etc.) for the same period of time they retain the original data. If, in the future, you require copies of the originally submitted IRB materials, you may request them from Institutional Review Board. Please note that this letter indicates that the IRB has approved your research. You may not begin the research phase of your dissertation, however, until you have received the Notification of Approval to Conduct Research (which indicates that your committee and Program Chair have also approved your research proposal). Once you have received this notification by email, you may begin your data collection. Sincerely, Jenny Sherer, M.Ed. Operations Manger Office of Research Integrity and Compliance Email: [email protected] Fax: 626-605-0472 Tollfree : 800-925-3368 ext. 2396 Office address for Walden University: 155 5th Avenue South, Suite 200 Minneapolis, MN 55401
CURRICULUM VITAE
Timothy J. Woods
SUMMARY OF QUALIFICATIONS • Detailed experience in strategic planning, solution development, and management. • Proven leadership ability in goal setting, planning, and implementation at strategic, tactical, and
operational levels. • Extensive experience in coordinating diverse, dynamic collaborative groups toward unified objectives. • Solid experience in establishing, organizing, and managing complex projects and procedures. • Proven ability to work independently, handle simultaneous projects and meet deadlines. • Extensive experience in system development methodologies, analysis & design (both administrative
and production), telecommunications, distributed decision support systems, DBMS application and programming development, IT incident management and computing support.
• Designed and implemented several enterprise-level systems and architectures involving Enterprise Resource Planning/Programming (ERP) & Enterprise Application Integration (EAI).
• Detailed experience in budgeting, metric development, and financial analysis of operations • Strong communication, organization, and problem-solving skills.
SUMMARY OF WORK EXPERIENCE
Foothill College Division Dean–Computers, Technology & Information Systems
Los Altos Hills, Ca. 2007-Current
University of Phoenix Campus College Chair Information Systems & Technology/ Criminal Justice & Security
Northern California Territory 1995–2007
Notre Dame de Namur University Part-Time Faculty School of Business & Management
Belmont, Ca. 2007–Current
Computing Made Simple, Inc. Chief Executive Officer/President
Fresno, Ca. 1995-2001
Cannon–USA/Taylor Made Office Systems Account Representative, Digital Systems
Fresno, Ca. 1994-1995
Embassy of the United States of America - Pacific Architects & Engineers Operations Manager
Moscow, Russia 1991-1994
189
EDUCATION Ph.D. Walden University, Current Status: ABD (Dissertation in progress, expected graduation–Fall2008) • Major: Applied Management and Decision Sciences • Concentration: Information Systems Management • Dissertation Title: The Effect of Faculty Performance Measurement Systems on Student Retention • Dissertation Chair: Dr. Raghu Korrapati, Ph.D. M.A. California State University Fresno, College of Political Science, May 1992 • Major: International Relations • Concentration: Comparative Systems • Thesis Title: Mass Political Participation Within the Former Soviet Union • Thesis Chair: Dr. Alfred Evans, Ph.D. B.A. University of California Riverside, College of Humanities & Social Sciences, August 1989
• Major: Political Science • Concentration: Comparative Politics • Senior Thesis: Perestroika & Glasnost: A Historical Perspective
TEACHING EXPERIENCE Adjunct Faculty, Notre Dame de Namur–School of Business and Management, 2007-Current Successfully teaching several courses with positive student and administrative feedback.
• Graduate Course Subject Area: Organizational and Management Theory • Undergraduate Course Subject Area: Telecommunication Management
Full-Time Faculty, University of Phoenix–College of Information Systems & Technology (IS&T), 1995-Current. Appointed Area Chair for the College of IS&T April 2001. Faculty of the Year for Information Systems and Technology, Northern California Campus 2005. Successfully conducted courses for the Fresno, Bakersfield, Pleasanton, Walnut Creek, and San Jose campuses. Experience includes teaching in both graduate and undergraduate programs. During this ten-year period over numerous courses have been taught with favorable end-of-course surveys in management, information systems, and operational concepts. For the past four years, conducted faculty training phases I and II, and faculty governance as a primary instructor. Extensive experience as an online instructor and FlexNet instructor and mentor (Combination of online and in-class modalities).
• Graduate Teaching: Cyber Crime and Information Systems Security (CJA 570), CIS Risk Management (CMGT 579), CIS Risk Management & Strategic Planning (CMGT/585), Managerial Communication and Ethics (COM 525), Conflict Management (SYS 560), Information Management in Business (CIS 564.3), CIS Strategic Planning (CMGT 552), CIS Project Management (CMGT 573), CIS Risk Management (CMGT 552), Software Engineering
190
(CSS 553), Database Concepts I (CSS 558), Database Concepts II (CSS 559), Information Technology Application Project (CSS 586), Database Concepts (DBM 500), Database Management (DBM 502), Creating Change within Organizations (HCS 587), Foundations of Problem-Based Learning (MBA 500), International Business Systems (MBGM 568), Human Behavior in the Technological Organization (MGT 532), Managing Information (MGT 540), External Environment of Business (MGT 580), Introduction to Technology Systems (MGT 500), Executive Management in a Global Economy (MGT 548.2), Technology and Organizations (MGT 545), Operating Systems (POS 568), Technology Transfer in the Global Economy (TMGT 581), Seminar in Technology Management (TMGT 591).
• Undergraduate Teaching: Introduction to Information Systems Security (CMGT 440),
Fundamentals of Business Systems Development (BSA 375), Business Systems Development II (BSA 400), Business Systems I (BSA 410), Business Systems II (BSA 420), Systems Analysis Methodologies (BSA 430), Systems Analysis Tools (BSA 440), Applied Business Cases (BSA 450), Project Planning and Implementation (CMGT 410), Information Resource Management (CMGT 424), Applied Studies in Information Technology (CMGT 450), (HCS/441) Introduction to Health Care Information Systems, (HCS/463) Application of Health Care Management Principles, Organizational Behavior (MGT 332), Organizational Communication (MGT 333), Introduction to Research and Information Utilization (RES 110), Computers and Information Processing (CIS 319), Programming Concepts (POS 429), Computer Architecture (CSS 420), Data Design and Information Retrieval (CSS 416), Database Management Systems (CSS 417), Database Concepts (DBM 380), Database Management Systems (DBM 405), Decision Support Systems (DBM 410), Applications Maintenance and Migration (DBM 450), Global Business Strategies (MGT 448), Skills For Lifelong Learning I (GEN 101), Skills for Lifelong Learning II (GEN 102), Interdisciplinary Capstone (GEN 480), Introduction to Health Care Information Systems (HCS 441), Project Management (MGT 437), Telecommunications (TCM 420), Wealth and Power in America (POL 443).
Chief Executive Officer, Computing Made Simple, Incorporated, 1995-2001.
• Teaching and Curriculum Development: computer utilization and management principles. Developed numerous professional training programs for corporations ranging from computerized project management, program operation, departmental structuring, to advanced IS technical implementation. Extensive time is spent in developing and conducting upper management training programs for the positions of: Chief Operations Manager, Chief Programming Manager, Chief Information Systems Manager, Chief Financial Officer. Training activities include, but are not limited to: sexual harassment, conflict resolution, proactive departmental management, and strategic departmental management.
Teaching Assistant, University of California Riverside, College of Humanities and Social Sciences, Department of Political Science, 1987-1989.
• Demonstrated versatility and ability by teaching several sessions over a two-year period. Teaching assignment: International Organizations.
Teacher (Emergency Credential), Fresno Unified School District, Awahnee Middle School, 1990-1991.
• Successfully taught 8th grade US history, preparing students to meet state curriculum and testing requirements.
Substitute Teacher, Fresno/Sanger/Kingsburg Unified School Districts, 1989-1990.
191
• Primary teaching areas: Computer Science, History, English, Latin, and Social Studies.
HIGHLIGHTS OF WORK EXPERIENCE Foothill College (2007-Current). Division Dean–Computer Technology & Information Systems
• Duties: Provide leadership for the Computer, Technology and Information Systems Division which consists of Computer Information Systems (CIS), Computer Networking and Electronics (CNET), Computers and Software Training (CAST), Computers on the Internet (COIN), Business Technology, Cooperative Work Experience (CWE), Certified Electricians Program; and the Apprenticeship Program. Manage assignments, enrollment, and evaluate load for full-time and part-time faculty. Hire, supervise, develop, direct and evaluate faculty and classified staff. Develop, implement and manage Division budget. Develop curriculum, new programs and course scheduling activities. Develop Saturday, summer, evening, and extended campus classes and programs. Coordinate responsibilities with counseling, transfer center, Middlefield Campus and other college staff. Participate in and develop program advisory committees. Ensure innovative and effective use of instructional technology. Provide oversight and maintenance of specialized computer labs and ensure compliance with hazardous materials regulations. Serve as the administrator for evening classes and programs for the Foothill Campus. Serve as liaison for career center and job placement program.
University of Phoenix, Northern California Territory (2001-2007). Campus College Chair–Information Systems & Technology/ Criminal Justice & Security Programs
• 1995–Hired as adjunct faculty for Information Systems & Technology (IS&T) • 2001–Appointed Campus College Chair, IS&T • Primary responsibility involves selecting, evaluating, and mentoring quality faculty. • Develops and maintains the quality and integrity of the School's Programs. This position is
accountable for program integrity and implementation at existing campuses, as well as new campuses and learning centers.
• Develops and maintains strong relationships by serving as a program resource for campus staff,
faculty, and students, as well as a liaison to corporate academic affairs staff. Responds to student issues and concerns, as well as, evaluates students for retention and counsels them into other University programs as necessary.
• Develops and administers program curriculum. Authored current national process engineering
course, Fundamentals of Business Systems Development BSA 375.
• Represents the organization as appropriate in its relationship with the community by participating in targeted events, conferences, meetings, and workshops. This includes developing and maintaining active linkages with agencies and educational institutions to promote positive relationships and articulation with the School's programs.
192
• Develops and maintains faculty enrichment programs. Developed and implemented a successful pilot of the Total Quality Instruction Forum for IT faculty. The forum focused on facilitation skill development, grading/evaluating across the curriculum, and course enhancement strategies. Presented several training programs for faculty including: Classroom management, grading and evaluation, classroom assessment techniques, facilitating the sciences, strategic studying technique using technology, technology-based instruction.
• Develops and administers strategic plan for the College of IS & T covering faculty recruitment,
student retention, staff development, and quality instruction.
• Successfully work with student issues pertaining to curriculum revisions, grade and instructor grievances. Performed campus visits to present College information to students, faculty, and staff.
Computing Made Simple, Incorporated Chief Executive Officer/President (1995-2001)
• Administrative Duties: Corporation Founder, responsible for all corporate and business functions for CMS, Inc., evaluate organizational structures and formulate strategic business plans and organizational direction, development of strategic recruiting programs, analysis and policy formations based upon EDD, OSHA, and other state and federal employment laws as they apply to a service-based industry, development of corporate Standards of Operation, development of internal productivity analysis tools (including: turnover, absenteeism, pay production, and skills development analysis), developed several skills analysis tests for organizational performance, developed monitoring systems to gauge organizational efficacy, directly supervise day-to-day HR and employee cross-training issues.
• Financial Duties: Developed financial tracking system to analyze corporate profit and loss,
balance statement, pro forma, cash flow, accounts receivable, and accounts payable. Personal experience in preparing quarterly payroll and corporate financial statements, including the annual report for the Board of Directors.
• International Missions: Served as a lead member on the first US SBA trade mission to Ireland
with Administrator Aida Alvarez. Conducted high-level negotiations with the Irish government, national firms, and the Irish Trade Board. The mission’s focus was to establish contractual trade relations as initiated by President Clinton, if possible. My principal role in this activity was to negotiate lucrative relationships for CMS, Inc. A critical component to these talks was in interacting with various agencies, on both sides, to develop specific technological trade arrangements that adhered to current US-Irish trade agreements and European Union Articles. The result of this trip is the formulation of a multi-million dollar Agent relationship. My personal activities on a day-to-day basis include: partner teleconferencing, customs negotiation, product shipment, establishment of intellectual property rights, interaction with several trade organizations on both sides of the Atlantic, and coordination with the US Department of Commerce and Small Business Administration.
o In 1996, participated in negotiations with Canadian technology firms. Central focus was
to determine intellectual property transfers with our partners under NFTA rules established. Talks included labor exchange mechanisms, commodity exchanges and tax ramifications, and future partnering areas based on profitability issues.
o In 1995, negotiated service contracts with Eastern European Web Development
companies. Principle activities included: tax treaty identification, establishment of specific work transfer mechanisms, and relationship definition.
193
• Digital Security and Investigation: Extensive experience in cyber crime research, detection, and defense; specializing in identity theft, intrusion detection, and cyber crime forensic methodology. As CEO of CMS, Inc. he developed/implemented the west coast WAN security framework for GlaxcoSmithKline Beecham. He has personally developed network and security protocols for several clients including: the Department of Labor, the State Department, along with County, City entities (including local law enforcement agencies). Served as chief resource to the Department of Justice in organizing the CAL ID project. This $ 40 million dollar project involved the implementation of digital booking and criminal identification systems throughout the California Law Enforcement community. Responsibilities included evaluation of current technology and provide the strategy for implementation. Advising on the coordination of all LAN configurations with the State’s CLETS WAN.
• Business Systems Development: Analyzed Saint Agnes Medical Center’s 80 million dollar
budgeting process developed/implemented collaborative procedures and systems to facilitate a streamlined process. Professionally managed SDLC, RAD, JAD, ERP, CRM processes to successfully conclude several development projects. Developed and implemented security, risk/contingency, disaster recovery procedures/systems for several government and school district entities.
• Telecommunication System Design and Implementation: Experience in both a “mainframe”
and personal computer information technology environment. Direct experience associated with the design, implementation and management of LAN/WAN data communication networks. Personal experience involves all areas of development, implementation, and management covering microcomputer, AS 370, AS 400, HP 3000, RISC 6000 configuration of hardware and software core systems. Developed and implemented Sanger Unified School District WAN connecting 14 LAN sites for a 3000-user network. Designed and Implement Glaxco-SmithKline Beecham’s Central California LAN and WAN integration. Developed several LAN configurations throughout California utilizing Windows NT, Novell, and Unix environments.
• Database Management Systems: Developed several relational database-constructs utilizing MS
Access, SQL Server, DB 2/4, and Oracle. Programming and management experience in logical and physical software design, as Primary Software Engineer, involved managing several software development projects ranging from $ 20,000 to over $ 1 million covering Point of Sale to Information Management systems. Direct experience in ERD, ERP, Data Normalization, including programming in Visual Basic, SQL, and DB basic. Developed several distributed systems for enterprise management.
• Internet/Intranet Development: Developed over 200 websites utilizing HTML, DHTML,
VRML, and Java languages. Assisted clients in developing content and strategic purpose for Internet presentation. Developed several e-commerce sites utilizing MIVA merchant. Designed and implemented DBMS distributed systems utilizing Intranet constructs.
Cannon–USA/Taylor Made Office Systems Account Representative–Digital Systems (1994-1995)
• Organized and Conducted 228 hours of technical training and implementation: Digital Systems–Operation, Peripheral Introduction in Network Environments, Information System Management, Applications Development and implementation, IS Department Organizational Issues, Connectivity Integration, Compatibility Issues and Departmental Performance, Information System Profitability Analysis, Flow of Information Analysis, Analog Systems and Environmental Characteristics, Digital Marketing Applications, Digital systems internal consultation. Primary responsibility was to advise sales representatives in network integration, information systems management, application development and implementation. Formulated and conducted projects
194
representing over 4 million dollars in allocated revenue. Advised corporations on implementation strategies using tools such as profitability analysis, flow of information analysis, PERT and CPM trending.
Embassy of the United States of America–Pacific Architects & Engineers; Moscow, Russia Operations Manager, (1991-1994)
• Planned and directed high-level US government visits within the former Soviet republics (including: U.S. Presidents Reagan, Bush, Carter, Nixon, and Clinton) over a three-year period. Duties included: negotiation with Russian officials, logistics planning, and interpretation (Russian State Department Language Rating 3/3). Managed staff of 45 to ensure quality operations.
• Responsible for developing departmental budget that reflected a two million-dollar allocation. On
several occasions, duties included supervising customs clearance and general advisement to American businesses concerning Russian customs and trade laws. Direct negotiation with the Russian Foreign Ministry over visa issues occurred on several occasions.
• Embassy Procurement duties included: contract negotiation, staffing and operational line items,
and general budget and policy adherence to federal standards.
• Developed departmental relational databases for operation management tracking utilizing MS Access, Paradox, and Oracle. Developed and implemented asset tracking and dispatch systems.
SERVICE Educational:
• Advisory Board Member–Fresno Institute of Technology, 1996-1999. • Advisory Board Member–Heald College, 1997-1999.
Community:
• Advisory Board Member–ID Advocates, 2004-2007. • Chair–International Committee–Fresno Airport Rotary, 1999-2001. • Ambassador–Fresno Chamber of Commerce, 1995-1997.
HONORS SOCIETIES
• Sigma Iota Epsilon, Zeta Rho Chapter. Walden University. Vice President, (2005-Current).
• Alpha Phi Sigma, Eta Theta Chapter. University of Phoenix.
Western Regional Advisor (2007-Current).
195
JOURNAL PUBLICATIONS Woods, T. J. (2007, August). Unleashing the Inspired Educator: Motivating Faculty
through Transactional/Transformational Leadership Strategies. Journal of Leadership Studies, 1(2).
Konzen, D. P., Selke, S. D., Woods, T. J., & Young, P. F. (2006, January 20). Crossing
the Digital Divide: The Application of Effective and Efficient Technology Strategies for Graduate Students. Proceedings of the Second Annual Conference on Applied Management and Decision Sciences, 1(1), 129-144.
PUBLICATIONS–TEXTS Woods, T. J. (2000). E Commerce: Strategic Business Principles. Entrepreneurial Resource Center. Woods, T.J. (1996). Beginning MS Word. Computing Made Simple, Inc. Woods, T. (1996). Intermediate WordPerfect. Computing Made Simple, Inc. Woods, T. (1996). Intermediate MS Access. Computing Made Simple, Inc. Woods, T. (1996). Introduction to Networking Principles. Computing Made Simple, Inc. Woods, T. (1995). Beginning MS Access. Computing Made Simple, Inc. Woods, T. (1995). Beginning MS Windows. Computing Made Simple, Inc. Woods, T. (1995). Beginning WordPerfect. Computing Made Simple, Inc. Woods, T. (1995). Intermediate Windows 95. Computing Made Simple, Inc. PUBLICATIONS–CURRICULUM DEVELOPMENT Woods, T. (2006). CMGT/430–Enterprise Security. University of Phoenix. Woods, T. (2006). BSA/400–Business Systems Development II. University of Phoenix. Woods, T. (2005). BSA/375–Business Systems Development I. University of Phoenix. PRESENTATIONS/WORKSHOPS/CONFERENCES Woods, T. (2006, November 16). Cyber Crime & The Organization: Intrusion Detection, Security
Investigation and Response. ACE Commuter Services. Woods, T. (2006, October 18). Cyber Crime & The Individual: Identity Theft Deterrence, Detection, and
Defense. ACE Commuter Services. Konzen, D., Woods, T., & Wasescha, A. (2006). Investing in lifelong excellence. Unpublished Doctoral
Residency Presentation. Sigma Iota Epsilon, Zeta Rho Chapter.
196
Wasescha, A., Woods, T., & Konzen, D. (2006). Excellence in social change. Unpublished Doctoral Residency Presentation. Sigma Iota Epsilon, Zeta Rho Chapter.
Woods, T., Konzen, D., & Wasescha, A. (2006). Scholarship in action. Unpublished Doctoral Residency Presentation. Sigma Iota Epsilon, Zeta Rho Chapter.
Woods, T. (2005). Database Security: Oracle 10g and Grid-based Distributed Computing Environments
Conference paper, Walden University. Woods, T. (2005). Internet Addiction and Emerging Distance Education Trends KCNS TV Interview. Woods, T. (2005). Internet Addiction and Emerging Distance Education Trends NBC Ch. 11 TV Interview. Woods, T. (2005). Project Management: Why IT Projects Fail. ACE Commuter Services. Woods, T. (2005). Conflict Management: Negotiating true win-win solutions. ACE Commuter Services. Woods, T. (2005). Security 101: Privacy & Identity Theft, University of Phoenix. Woods, T. (2005). Security 102: Threat Assessment and Intrusion Detection, University of Phoenix. Woods, T. (2005). Security 103: Establishing a Technology Security Plan , University of Phoenix. Woods, T. (2005, March). Aligning Career Growth w/ Education C-SIX general meeting. Woods, T. (2005, January).Student Use of the Center for Writing Excellence; and Strategic rEsource.
University of Phoenix–General Faculty Meeting. Woods, T. (2005, January).Global Technology Supply Chain Management. C-SIX general meeting. Woods, T. (2004, October). Offshoring: Solutions for the Silicon Valley Worker. C-SIX Discussion Panel
Member. Woods, T. (2004, October). Offshoring and the Bay Area Economy. Bay Area Today NBC 11. Woods, T. (2004, September).Adult Education, Online Learning, and You! KK Kaneshiro TV Talk Show. Woods, T. (2004, July). Bringing Strategies to Life! ACE Train Seminar. University of Phoenix. Woods, T. (2001, September). Virtual Private Networking & Security. University of Phoenix IT Forum,
Fresno. Woods, T. (2001, August). QuickBooks for Managers. Small Business Development Center, Fresno. Woods, T. (2001, September).QuickBooks for Managers. Small Business Development Center, Fresno. Woods, T. (1999, February).Global Business Forces and the Central Valley’s Economy. Fresno Rotary
International. This topic traced current pacific rim economic and political conditions to local economic conditions. Strategies were presented concerning indicator analysis and organizational response.
Woods, T. (1999, April).Crisis Management. Pacific Association of Health Care Managers, Fresno.

197
Woods, T. (1999, October). Establishing Successful Joint Ventures and Collaborative Business Mechanisms. National Small Business Development Center (SBDC) Director’s Convention. This half-day seminar covered the necessary components in developing, nurturing, and performing under joint venture agreements both domestically and abroad. This seminar topic is one of twenty selected from nation-wide submission by SBDC Directors.
Woods, T. (1999, April). Establishing Successful Joint Ventures and Collaborative Business Mechanisms.
Central California Small Business Development Center (SBDC). Director’s Convention. This half-day seminar covered the necessary components in developing, nurturing, and performing under joint venture agreements both domestically and abroad. This seminar topic is one of twenty selected from nation-wide submission by SBDC Directors.
Woods, T. (1998, November). Developing Effective Training Programs. National Association of Human
Resource Managers, Fresno. Woods, T. (1997, September). Using Technology to improve Human Resource Management. Fresno
Rotary. Woods, T. (1996, August). Workforce Development and Technology. Small Business Development Center
(SBDC), Fresno. Woods, T. (1998, September). Joint Venture Development and Strategic Alliances. Small Business
Administration (SBA) Region VII Seminar. This 3-hour presentation covered the contractual and negotiated elements of both formal joint ventures and project-specific strategic alliances.
Woods, T., (1998, June)Global Business Strategies and the Internet. Madera Rotary International. This
presentation offered specific strategies in utilizing the Internet in strengthening international joint ventures.
Woods, T. (1993, December). Russian Economic and Political Conditions as Related to American
Business. The Ray Appleton Show (NBC Nationally Syndicated Radio Show).
Related Documents