INTRODUCTION Life history theory views the number and size of the offspring produced in a single reproductive event as having been adjusted by evolution to optimize individual fitness, including evolved reactions to environmental conditions (Stearns 1994). Egg size in birds shows a great deal of variation within avian populations but varies little within individuals (Christians 2002). Among many assumptions made by Bernardo (1996a) or quoted by him, there is one stating that offspring fitness increases as a function of per offspring investment, and that the amount of resources allocated to the propagule come at the cost to the parental decreased fecundity and hence fitness. Propagule size is the relevant variable affecting offspring fitness. According to Bernardo (1996b) “maternal effects then are a part of offspring’s phenotype that does not result from the action of its own genes and the interactions of those genes with its environment”. Maternal (paternal) effect is a direct effect of a parent’s phenotype on the phenotype of its offspring. Poultry breeders know for a long time that larger eggs produce larger chickens that grow and survive better (e.g. Halbersleben & Mussehl 1922, Wiley 1950). In wild birds, the study of this problem was initiated in the 1970s (Parsons 1970, Schifferli 1973), but already in 1994, Williams ACTA ORNITHOLOGICA Vol. 39 (2004) No. 2 The effect of egg size on growth and survival of the Tree Sparrow Passer montanus nestlings Barbara PіћќѤѠјю¹, Miłosława BюџјќѤѠјю², Jan PіћќѤѠјі¹, Andrzej Bюџѡѕю³, Kyu-Hwang Hюѕњ⁴ & Natalia Lђяђёђѣю⁵ 1 Centre for Ecological Research, Polish Academy of Sciences, Dziekanów Leśny, 05–092 Łomianki, POLAND, e-mail: [email protected] 2 Department of Ecology, Institute of Zoology, University of Warsaw, Banacha 2, 02–097 Warszawa, POLAND, e-mail: [email protected] 3 Museum and Institute of Zoology, Polish Academy of Sciences, Wilcza 64, 00–679 Warszawa, POLAND 4 Environmental Research Institute, Kyungnam University, 449 Wolyoung-Dong, Masan 630–701, REPUBLIC OF KOREA ⁵Southern Scientific Center of Russian Academy of Sciences, Chekhova, 41, Rostov-na-Donu, 344006, RUSSIAN FEDERATION, e-mail: [email protected] Pinowska B., Barkowska M., Pinowski J., Bartha A., Hahm K-H, Lebedeva N. 2004. The effect of egg size on growth and survival of the Tree Sparrow Passer montanus nestlings. Acta Ornithol. 39: 121–135. Abstract. The paper analyses the effect of egg dimensions (volume, breadth, and length) on the growth and development of Tree Sparrow nestlings on successive days of life. Egg size did not influence nestling mortality. It was found that for most days of nestling life, the mean volume and breadth of eggs were positively correlated with the mean mass of nestlings in the nest. Similarly, the deviation of the volume and breadth of a particular egg from the mean egg volume and breadth in the clutch was positively correlated with the deviation of nestling mass from the mean nestling mass in the nest. Nestling growth and development in terms of asymptotic mass (g), maximum growth rate (g/day), tarsus length, and longest remex length were also positively correlated with egg size. The effect of egg size was particularly pronounced in the period of termination of intensive growth rate, development of thermoregulation, and feather development. It is possible that larger eggs contain more microelements, hormones, antioxidants, and vitamins. Key words: Tree Sparrow, Passer montanus, egg size, nestling growth, survival Received — June 2004, accepted — Aug. 2004

Welcome message from author
This document is posted to help you gain knowledge. Please leave a comment to let me know what you think about it! Share it to your friends and learn new things together.
Transcript
INTRODUCTION
Life history theory views the number and size of the offspring produced in a single reproductive event as having been adjusted by evolution to optimize individual fitness, including evolved reactions to environmental conditions (Stearns 1994). Egg size in birds shows a great deal of variation within avian populations but varies little within individuals (Christians 2002). Among many assumptions made by Bernardo (1996a) or quoted by him, there is one stating that offspring fitness increases as a function of per offspring investment, and that the amount of resources allocated to the propagule come at the cost to the
parental decreased fecundity and hence fitness. Propagule size is the relevant variable affecting offspring fitness. According to Bernardo (1996b) “maternal effects then are a part of offspring’s phenotype that does not result from the action of its own genes and the interactions of those genes with its environment”. Maternal (paternal) effect is a direct effect of a parent’s phenotype on the phenotype of its offspring.
Poultry breeders know for a long time that larger eggs produce larger chickens that grow and survive better (e.g. Halbersleben & Mussehl 1922, Wiley 1950). In wild birds, the study of this problem was initiated in the 1970s (Parsons 1970, Schifferli 1973), but already in 1994, Williams
ACTA ORNITHOLOGICA Vol. 39 (2004) No. 2
The effect of egg size on growth and survival of the Tree Sparrow Passer montanus nestlings
Barbara P ¹, Miłosława B ², Jan P ¹, Andrzej B ³, Kyu-Hwang H ⁴ & Natalia L ⁵
1Centre for Ecological Research, Polish Academy of Sciences, Dziekanów Leśny, 05–092 Łomianki, POLAND, e-mail: [email protected] of Ecology, Institute of Zoology, University of Warsaw, Banacha 2, 02–097 Warszawa, POLAND, e-mail: [email protected] and Institute of Zoology, Polish Academy of Sciences, Wilcza 64, 00–679 Warszawa, POLAND4Environmental Research Institute, Kyungnam University, 449 Wolyoung-Dong, Masan 630–701, REPUBLIC OF KOREA⁵Southern Scientific Center of Russian Academy of Sciences, Chekhova, 41, Rostov-na-Donu, 344006, RUSSIAN FEDERATION, e-mail: [email protected]
Pinowska B., Barkowska M., Pinowski J., Bartha A., Hahm K-H, Lebedeva N. 2004. The effect of egg size on growth and survival of the Tree Sparrow Passer montanus nestlings. Acta Ornithol. 39: 121–135.
Abstract. The paper analyses the effect of egg dimensions (volume, breadth, and length) on the growth and development of Tree Sparrow nestlings on successive days of life. Egg size did not influence nestling mortality. It was found that for most days of nestling life, the mean volume and breadth of eggs were positively correlated with the mean mass of nestlings in the nest. Similarly, the deviation of the volume and breadth of a particular egg from the mean egg volume and breadth in the clutch was positively correlated with the deviation of nestling mass from the mean nestling mass in the nest. Nestling growth and development in terms of asymptotic mass (g), maximum growth rate (g/day), tarsus length, and longest remex length were also positively correlated with egg size. The effect of egg size was particularly pronounced in the period of termination of intensive growth rate, development of thermoregulation, and feather development. It is possible that larger eggs contain more microelements, hormones, antioxidants, and vitamins.
Key words: Tree Sparrow, Passer montanus, egg size, nestling growth, survival
Received — June 2004, accepted — Aug. 2004
122 B. Pinowska et al.
(1994) could sum up the results of 40 papers. Among them, only 11 deal with altricial birds, including nine passerines. After the review by Williams (1994), several papers were published on the relation of egg size to growth and survival of passerine nestlings (e.g. Smith et al. 1995, Smith & Bruun 1998, Reed 1999, Styrsky et al. 1999). Styrsky et al. (1999) found that the mass of nes-tling House Wren Troglodytes aedon was related to the mean egg mass in the clutch by day 6 in the first brood, and by day 10 in the second brood. Smith & Bruun (1998) found a similar relationship in Starlings Sturnus vulgaris by day 7, and Reed et al. (1999) even for a shorter period in Red-winged Blackbirds Agelaius phoeniceus.
Larger eggs may be advantageous for two reasons: 1) they may give rise to nestlings which are structurally larger or which hatch at a more advanced stage of development, 2) they may produce nestlings which hatch with larger nutri-ent reserves (O’Connor 1979). The relative impor-tance of these two different effects of large eggs to offspring fitness may vary between species (Ricklefs et al. 1978).
In contrast to other groups of birds, maternal or paternal quality during the nestling period can have a greater effect on growth and survival of altricial birds than does egg size (Reid & Boersma 1990, Bolton 1991, Williams 1994). For this reason, maternal effect should be eliminated when ana-lyzing the effect off egg size on nestling growth and survival. The strength of the relationship between egg parameters indicative of female condition and nestling performance has been evaluated only in part.
The objective of this paper is to test the hypoth-esis that egg size per se influences the growth, development, and survival of nestling Tree
Sparrow. We will evaluate relationships between egg size and the mass of nestlings on successive days of life, as well as other parameters of nestling development. These problems have not been examined in this taxonomic and ecological group, and many authors emphasise that the effect of egg size on nestling fitness can differ among species (Ricklefs et al. 1978, Reed et al. 1999).
STUDY AREA, MATERIAL AND METHODS
The study was carried out in the villages situated between the Vistula river and Kampinos National Park, about 15 km NW of Warsaw, Poland (52°20’N, 20°50’E), where 200 nest-boxes were erected. The data were collected from 15 April to 20 August in 1994 and from 20 April to 20 July in 1995. In total, 261 clutches (1332 eggs) were analyzed, including 125 in 1994 and 136 in 1995 (Table 1). They were dominated by 5-egg clutches (49%), and 6-egg clutches (38.7%). Other clutch sizes (3-, 4-, and 7-egg) were rare, so they were not analyzed. In the analyzed clutches, 1167 nestling Tree Sparrows were examined, including 560 in 1994 and 607 in 1995 (Table 1).
Eggs were marked with a permanent marker on the day of laying, so that we knew the lay-ing sequence. The egg length (L) and maximum breadth (B) were measured to the nearest 0.1 mm, using vernier calipers. Using this formula:
V = 0.00051×L×B²
we calculated the egg volume in cm³ (Hoyt 1979).To know from which egg a nestling hatched,
nest-boxes were visited during hatching three times a day — in the morning (6.30–10.00), at
Table 1. Number of clutches and nestlings in successive broods and years.
Year Brood N of clutches N of nestlings
N of nestlings hatched from known eggs
in clutches
all 5-egg 6-egg
1994 1 64 300 83 35 362 38 169 71 21 473 23 91 31 20 8
1995 1 58 264 55 20 302 44 202 112 55 473 34 141 68 39 20
Total 261 1167 420 190 188
Egg size and nestling growth in Tree Sparrow 123
noon (11.00–14.00) and in the afternoon (16.00–20.00), depending on the stage of hatching. On the day of the expected hatching, the eggs were examined to detect a bulge on shell surface that indicated the position of the bill with egg-tooth. If it was present, a 2 × 2-mm opening was pierced in the shell and the bill of the hatching nestling was marked with a color. This method is described in detail by Lebedeva (1996). In this way we knew from which egg a nestling hatched (Table 1). Then, the legs of nestlings were individually marked with waterproof ink. Since the day of hatching, each nestling was weighed at the same time every day with Pesola spring balance (10
and 50 g capacity) to the nearest 0.1 g in 1994, and with an electronic balance to the nearest 0.01 g in 1995. After day 7, the nestlings were ringed with aluminium rings. In 1994, the length of the rachis and web of the longest remiges (5–7) were measured to the nearest 1 mm on days 12, 13, 14 of nestling life. In 1995, tarsus length of nestling of the second and third broods, aged 12–14 days, was measured to the nearest 1 mm. Tarsus length in the Tree Sparrow increases until day 10 (Fetisov & Gaginskaya 1981). Notes were taken of the date of detecting a dead nestling in the nest or disap-pearance of a nestling, also the date of destruction of the brood and the reason of destruction. Also
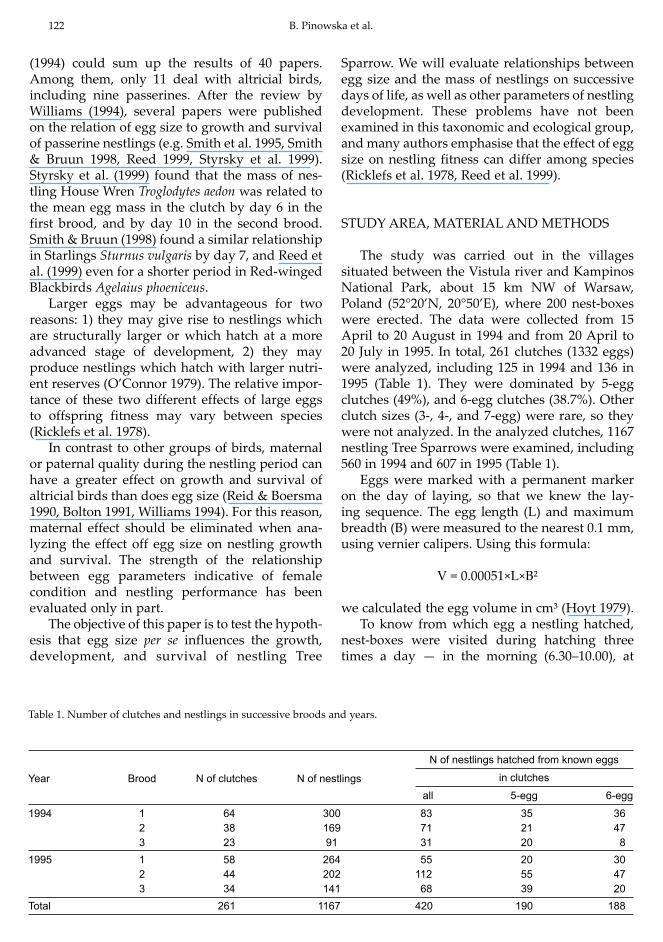
Table 2. Mean values and repeatability index (R) for all variables analyzed. n — number of eggs or nestlings analysed. Eggs that hatched and nestlings that fledged and were weighted at a given age were analysed. Parameters of the Richards curve were calculated for nestlings that fledged and were weighted at least 7 times until age of 11 days inclusive. k — number of clutches or broods. Repeatability of egg variables was calculated for clutches in which at least one nestling hatched; repeatability of nestling mass and parameters of Richards’ curve were calculated for nests from which at least one nestling fledged, the mass of dead nestlings being excluded.
Variable Age (day) n Mean ± SD k R F df1 df2 p
eggvolume [cm3] 1076 2.05 ± 0.2 255 0.60 8.93 254 1101 < 0.001breadth [mm] 1076 14.4 ± 0.5 255 0.53 7.10 254 1101 < 0.001length [mm] 1076 19.4 ± 0.9 255 0.69 13.00 254 1101 < 0.001
Nestling mass [g]
1 630 2.2 ± 0.5 186 0.51 4.54 185 444 < 0.0012 757 3.5 ± 0.7 198 0.55 5.85 197 559 < 0.0013 779 5.3 ± 1.1 203 0.53 5.44 202 576 < 0.0014 771 7.6 ± 1.4 203 0.55 5.78 202 568 < 0.0015 741 9.9 ± 1.8 196 0.58 6.24 195 545 < 0.0016 750 12.4 ± 2.1 200 0.59 6.49 199 550 < 0.0017 773 14.6 ± 2.4 203 0.58 6.46 202 570 < 0.0018 729 16.3 ± 2.4 196 0.54 5.38 195 533 < 0.0019 686 17.5 ± 2.7 189 0.56 5.64 188 497 < 0.001
10 700 18.3 ± 2.7 192 0.58 6.17 191 508 < 0.00111 698 18.7 ± 2.8 193 0.59 6.29 192 505 < 0.00112 690 18.9 ± 2.7 190 0.63 7.18 189 500 < 0.00113 553 18.6 ± 2.8 168 0.66 7.45 167 385 < 0.00114 354 18.2 ± 2.7 121 0.70 7.78 120 233 < 0.001
Asymptotic growth [g] 794 18.2 ± 2.6 207 0.57 6.19 206 587 < 0.001Max growth rate [g/day] 794 2.6 ± 0.4 207 0.61 7.22 206 587 < 0.001Time of growth [day] 794 10.2 ± 1.0 207 0.60 6.82 206 587 < 0.001
Difference between nestling mass and its asymptotic growth
12 651 0.8 ± 1.8 180 0.58 6.07 179 471 < 0.00113 521 0.7 ± 2.3 160 0.71 9.06 159 361 < 0.00114 346 0.6 ± 2.7 117 0.77 11.00 116 229 < 0.001
Remex length [mm] 12 103 31.5 ± 3.3 44 0.35 2.26 43 59 < 0.0113 245 33.9 ± 3.0 79 0.42 3.26 78 166 < 0.00114 272 36.1 ± 2.5 93 0.35 2.56 92 179 < 0.001
Web length [mm] 12 103 22.2 ± 3.7 44 0.24 1.76 43 59 < 0.0313 245 26.4 ± 4.1 79 0.51 4.28 78 166 < 0.00114 272 30.4 ± 4.0 93 0.47 3.62 92 179 < 0.001
Tarsus length [mm] 231 63 0.40 3.46 62 168 < 0.001
124 B. Pinowska et al.
the parasites found on nestlings or in the nest were described (Draber-Mońko 1997, Pinowski et al. 1997, Krumpal et al. 2000–2001). A more detailed description of the study area and meth-ods is in Pinowski et al. (2000–2001), Pinowska et al. (2002a, 2002b) and Barkowska et al. (2003).
The following independent variables were con-sidered: 1) total volume of all eggs in the clutch, 2) volume of individual eggs, 3) egg breadth, 4) egg length. The dependent variables comprised: 1) body mass of nestlings on successive 14 days of life, 2) asymptote of nestling growth calculated from Richards’ growth curve (Richards 1959), 3) max-imum growth rate of a nestling calculated from Richards’ growth curve, 4) time of nestling growth calculated as the age at which nestlings reached 95% of the asymptote, 5) difference between the masses of nestlings aged 12, 13, and 14 days and the asymptotic mass, 6) length of remiges on days 12, 13, and 14, 7) length of the web on days 12, 13, and 14, 8) length of the tarsus on days 12, 13, and 14, 9) death of a nestling in the nest, or its disap-pearance, or fledging, 10) percentage of nestlings fledged in relation to clutch size and to the number of eggs hatched.
For statistical analyses we used program SPSS 10.1 PL for Windows and our own programs in Pascal 7.0. All results are presented as mean ± SD.
Differences in mean values of all variables between years or broods were evaluated by the analysis of variance (ANOVA) for six different broods. No cross-comparisons were made.
The variances were estimated by using the formulas presented in Lessells & Boag (1987) and Sokal & Rohlf (1995).
Because of a high repeatability of the values of all egg and nestling variables (Table 2), the follow-ing comparisons were made:
1. Mean egg size variables in the clutch with mean values of variables describing the mass growth and development of nestlings hatched from these eggs. This analysis is based on 261 nests in which eggs hatched and at least one nestling fledged.
2. Deviations of egg size from the mean value in the clutch with deviations of variables describing mass growth and development of nestlings hatched from these eggs from their mean values in the nest. This analysis was performed for 278 nestlings that hatched from a specified egg and fledged.
Analysis at point 1 include genetic and mater-nal effect as measured by the mean egg size in the clutch, and parental effect as measured by the mean growth and development of nestlings in the nest. At point 2, maternal and paternal effects are largely eliminated, and the comparison concerns the effect of egg size within the clutch (which markedly depends on the sequence of egg laying, Pinowski et al. 2000–2001) on genetic traits that determine better growth and development of nestlings in this nest.
Because of significant differences in egg size and in variables describing nestling growth and development between successive years and broods (see Results Table 3), we basically used the multifactor analysis of covariance (ANCOVA) and its part — the aggregate correlation (the aver-age within class correlation; Blalock 1960, Lowry 1999–2000) for years and broods, as calculated from the formula:
Σ Σ ΣΣ Σ Σ
Σ Σ Σ
= = == = =
= = =
−−
−−=
1995
1994
3
1 1
2,,,
1995
1994
3
1 1
2,,,
1995
1994
3
1 1,,,,,,
,,
,
)()(
))((
year brood
n
ibroodyearibroodyear
year brood
n
ibroodyearibroodyear
year brood
n
ibroodyearibroodyearbroodyearibroodyear
cbroodyearbroodyear
broodyear
yyxx
yyxxr
where:nyear, brood is the number of nestlings (nests) in a given year and brood,xyear, brood, i is an independent variable character-izing the size of an egg laid in a given year and brood, from which the i-th nestling hatched,xyear, brood is the mean value of an independent variable for a given year and brood,
yyear, brood, i is the value of dependent variable describing growth or development of the i-th nestling hatched in a given year and brood,yyear, brood is the mean value of dependent variable in a given year and brood.
Using the analysis of covariance (ANCOVA, Blalock 1960, Lowry 1999–2000), we tested if the aggregate correlations are significantly different from zero.
Egg size and nestling growth in Tree Sparrow 125
Growth of nestling was compared with the Richards’ curve (Richards 1959) according to the formula:
where: W(t) — body mass [g] at t+1 days after hatching, A — asymptotic mass, R — integration constant, K — growth rate constant, m — recipro-cal of shape parameter.
Parameters of Richards’ curve were estimated for each nestling separately, using nestling mass by day 11 inclusive. It can be assumed that by this day the assumptions of the Richards’ formula (Richards 1959) are valid. Only nestlings weighed at least 7 times during this time were analyzed.
It was assumed that if on day i the expected body mass of a nestling is W(i), then the variance of the possible body masses of this nestling on this day is proportional to W(i). This means that the square of the difference between the measured nestling mass, wi, and the expected mass from the Richards’ curve, W(i), is proportional to the expected mass W(i):
(wi – W(i))2 = ei2 W(i)
where ei represents some additive error.
Assuming that Σ=
11
0i
2ie calculated for each nes-
tling should have a minimum value, the param-
eters of Richards’ curve were calculated as the solution to a system of non-linear equations obtained by equating to zero partial derivatives of the function:
where ( )mKiRe1
A)i(W−+
=
Calculations were performed by using author’s own program in PASCAL 7.0.
The following variables characterising nestling growth were considered (Ricklefs 1967): asymp-totic mass A; absolute growth rate (equals to slope of tangent to Richards’ curve at inflection point
1mmax
m11
AKv +
⎟⎠⎞
⎜⎝⎛ +
= ) and time of growth (age at
which nestling mass reached or exceeded 95% of the asymptotic mass), expressed by the formula:
Repeatability of female captureIn the method of the analysis of covariance
we used, the year and brood were control factors. This eliminated a large part of the replication of data from the same female in different broods. In the regression between egg size and nestling mass only joint slope of these lines was calculated for all nestlings, whereas constant parameters were calculated for each brood separately. Replication error would be the possibility of replication in successive broods of the accordance of an egg size with the mass of nestlings that hatched from this egg (if some females, laying small eggs, produced small nestlings, and other females, laying large eggs, produced large nestlings). In our study, the replication of this kind is possible, but former studies (Pinowski 1968, Pinowski et al. 1973, own unpubl. data) show, that such effect should be very small.
RESULTS
The effect of egg size on nestling survivalOf the total of 1167 nestlings, 868 (74.4%)
survived until fledging, whereas 299 (25.6%) died or disappeared. The percentage of dead or dis-appeared nestlings differed between years and broods (Table 4, χ2 = 56.46, df = 5, p < 0.001).
Mean egg size and deviations of egg size from the mean egg size in the clutch showed no dif-ference between fledged and dead nestlings (vol-ume: fledged 2.05 ± 0.17 cm3, dead 2.04 ± 0.17 cm3, F1,395 = 0.27, p > 0,06; breadth: fledged 14.36 ± 0.43 mm, dead 14.38 ± 0.47 mm, F1,377 = 0.20, p > 0.09; length: fledged 19.43 ± 0.92 mm, dead 19.28 ± 0.74 mm, F1,395 = 1.07, p > 0.3; deviation from: the mean volume: fledged: -0.000 ± 0.105 cm3, dead 0.005 ± 0.113 cm3, F1,377 = 0.190, p > 0.6; mean breadth: fledged 0.000 ± 0.286 mm, dead 0.017 ± 0.309 mm, F1,377 = 0.57, p > 0.8; mean length: fledged -0.013 ± 0.459 mm, dead 0.015 ± 0.469 mm, F1,377 = 0.763, p > 0.3). Among clutches with at least one nestling hatched, 15.2% did not fledge nestlings at all, 66.2% fledged less nestlings than eggs laid, and 18.6% fledged all the nestlings hatched from all eggs laid.
Σ=
−=
11
1i
2i
)i(W))i(Ww(
)m,K,R,A(f
K)195.0ln(Rln m/1 −− −
( )mKtRe1A)t(W
−+=
126 B. Pinowska et al.
Influence of egg size on nestling growthFurther analyses were performed only for
nestlings that fledged. Mean values of dependent variables were calculated without nestlings that died. Deviations of dependent variables from mean values of variables in the nest were also calculated only for nestlings that fledged.
Nestling mass (weigh)The mean mass of nestlings that survived until
fedging increased from 2.15 ± 0.46 g on day 1 to 18.86 ± 2.73 g on day 12, and it declined on days 13 and 14 . Significant differences were found in nestling mass on each day of life for years and broods (Table 3).
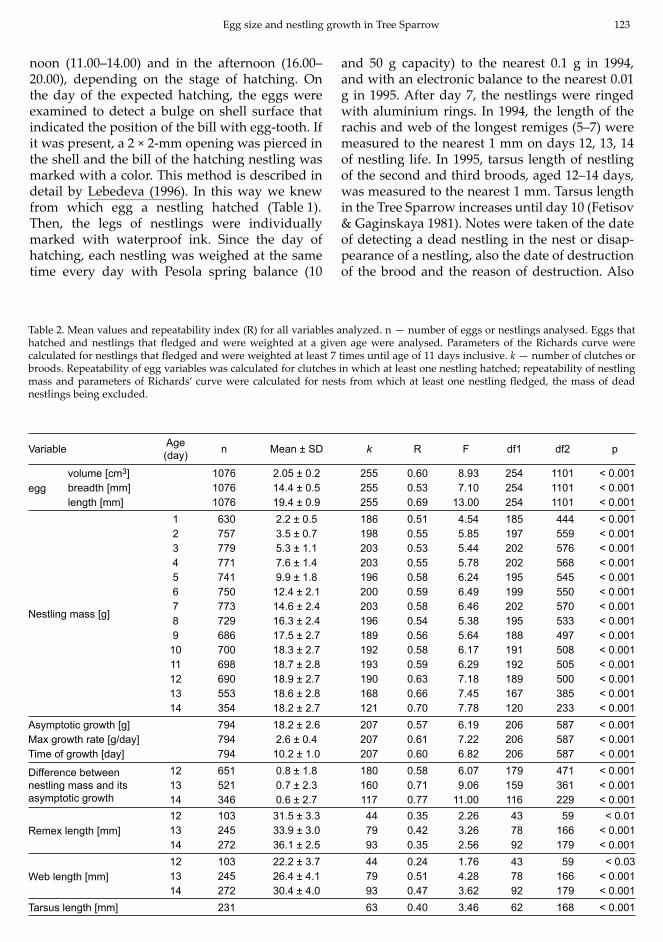
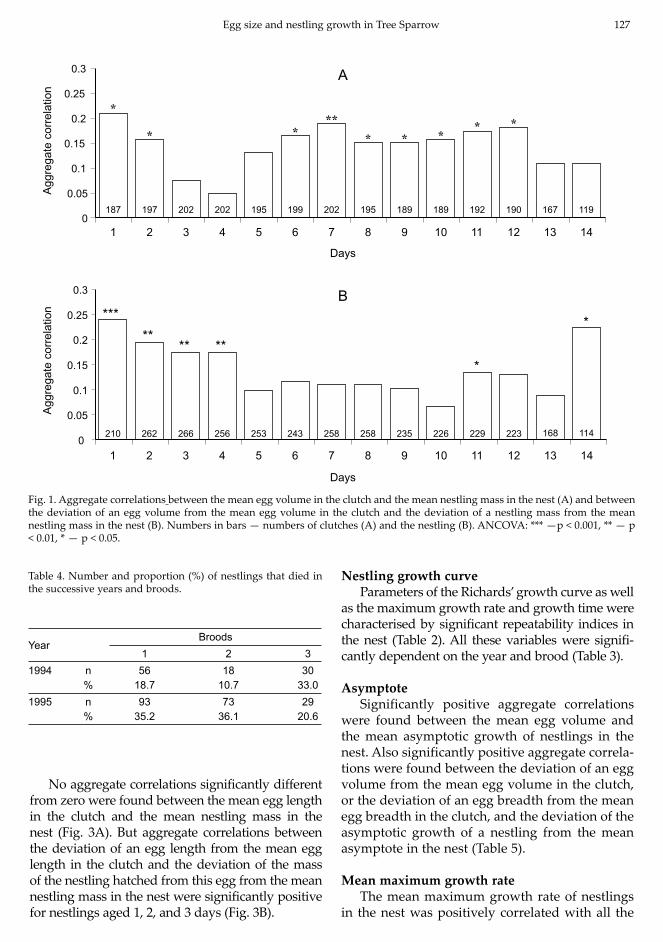
Significantly positive aggregate correlations between the mean egg volume in the clutch and the
mean nestling mass were found by day 12 inclusive, except for days 3, 4, and 5 (Fig. 1A). Aggregate cor-relations between the deviation of an egg volume from the mean egg volume in the clutch and the deviation of a nestling mass from the mean mass of nestlings in the nest were significantly different from zero on days 1, 2, 3, 4, 11, and 14 (Fig. 1B).
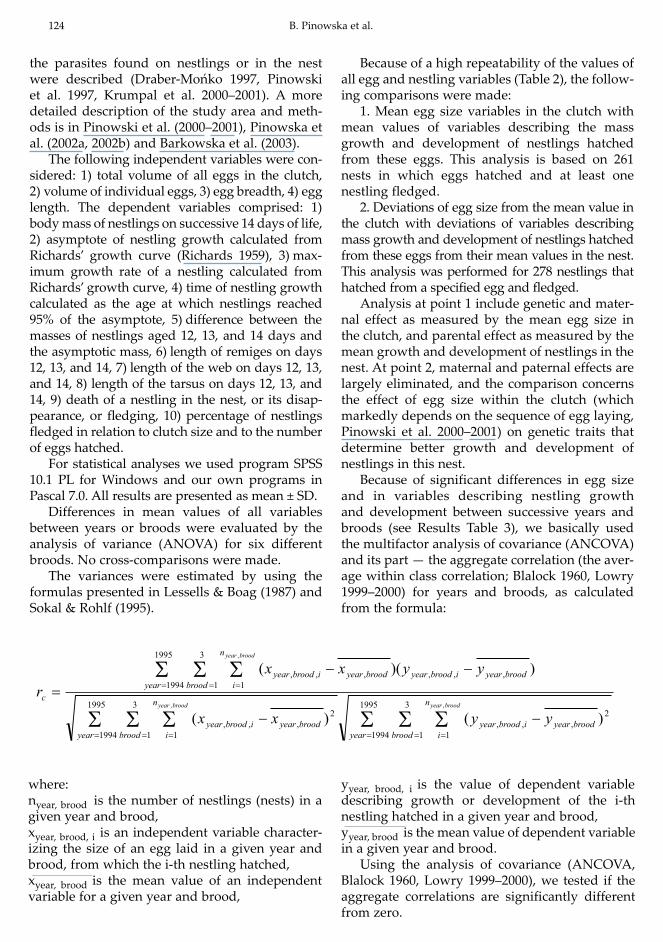
Significantly positive aggregate correlations between the mean egg breadth in the clutch and the mean mass of nestlings hatched from this clutch were found on days 1, 2, 6, 7, 11, and 12 (Fig. 2A). All aggregate correlations between the deviation of an egg breadth from the mean egg breadth in the clutch and the deviation of an nestling mass from the mean nestling mass in the nest were significantly positive, except for those on days 5, 6, 10, and 13 (Fig. 2B).
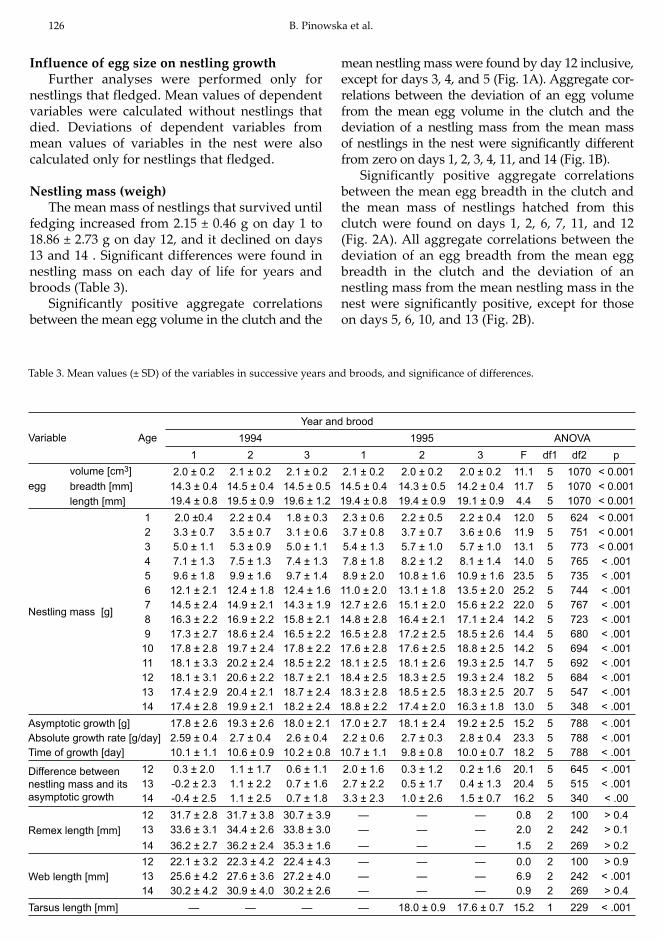
Table 3. Mean values (± SD) of the variables in successive years and broods, and significance of differences.
Variable Age Year and brood
1994 1995 ANOVA1 2 3 1 2 3 F df1 df2 p
egg volume [cm3] 2.0 ± 0.2 2.1 ± 0.2 2.1 ± 0.2 2.1 ± 0.2 2.0 ± 0.2 2.0 ± 0.2 11.1 5 1070 < 0.001breadth [mm] 14.3 ± 0.4 14.5 ± 0.4 14.5 ± 0.5 14.5 ± 0.4 14.3 ± 0.5 14.2 ± 0.4 11.7 5 1070 < 0.001length [mm] 19.4 ± 0.8 19.5 ± 0.9 19.6 ± 1.2 19.4 ± 0.8 19.4 ± 0.9 19.1 ± 0.9 4.4 5 1070 < 0.001
Nestling mass [g]
1 2.0 ±0.4 2.2 ± 0.4 1.8 ± 0.3 2.3 ± 0.6 2.2 ± 0.5 2.2 ± 0.4 12.0 5 624 < 0.0012 3.3 ± 0.7 3.5 ± 0.7 3.1 ± 0.6 3.7 ± 0.8 3.7 ± 0.7 3.6 ± 0.6 11.9 5 751 < 0.0013 5.0 ± 1.1 5.3 ± 0.9 5.0 ± 1.1 5.4 ± 1.3 5.7 ± 1.0 5.7 ± 1.0 13.1 5 773 < 0.0014 7.1 ± 1.3 7.5 ± 1.3 7.4 ± 1.3 7.8 ± 1.8 8.2 ± 1.2 8.1 ± 1.4 14.0 5 765 < .0015 9.6 ± 1.8 9.9 ± 1.6 9.7 ± 1.4 8.9 ± 2.0 10.8 ± 1.6 10.9 ± 1.6 23.5 5 735 < .0016 12.1 ± 2.1 12.4 ± 1.8 12.4 ± 1.6 11.0 ± 2.0 13.1 ± 1.8 13.5 ± 2.0 25.2 5 744 < .0017 14.5 ± 2.4 14.9 ± 2.1 14.3 ± 1.9 12.7 ± 2.6 15.1 ± 2.0 15.6 ± 2.2 22.0 5 767 < .0018 16.3 ± 2.2 16.9 ± 2.2 15.8 ± 2.1 14.8 ± 2.8 16.4 ± 2.1 17.1 ± 2.4 14.2 5 723 < .0019 17.3 ± 2.7 18.6 ± 2.4 16.5 ± 2.2 16.5 ± 2.8 17.2 ± 2.5 18.5 ± 2.6 14.4 5 680 < .00110 17.8 ± 2.8 19.7 ± 2.4 17.8 ± 2.2 17.6 ± 2.8 17.6 ± 2.5 18.8 ± 2.5 14.2 5 694 < .00111 18.1 ± 3.3 20.2 ± 2.4 18.5 ± 2.2 18.1 ± 2.5 18.1 ± 2.6 19.3 ± 2.5 14.7 5 692 < .00112 18.1 ± 3.1 20.6 ± 2.2 18.7 ± 2.1 18.4 ± 2.5 18.3 ± 2.5 19.3 ± 2.4 18.2 5 684 < .00113 17.4 ± 2.9 20.4 ± 2.1 18.7 ± 2.4 18.3 ± 2.8 18.5 ± 2.5 18.3 ± 2.5 20.7 5 547 < .00114 17.4 ± 2.8 19.9 ± 2.1 18.2 ± 2.4 18.8 ± 2.2 17.4 ± 2.0 16.3 ± 1.8 13.0 5 348 < .001
Asymptotic growth [g] 17.8 ± 2.6 19.3 ± 2.6 18.0 ± 2.1 17.0 ± 2.7 18.1 ± 2.4 19.2 ± 2.5 15.2 5 788 < .001Absolute growth rate [g/day] 2.59 ± 0.4 2.7 ± 0.4 2.6 ± 0.4 2.2 ± 0.6 2.7 ± 0.3 2.8 ± 0.4 23.3 5 788 < .001Time of growth [day] 10.1 ± 1.1 10.6 ± 0.9 10.2 ± 0.8 10.7 ± 1.1 9.8 ± 0.8 10.0 ± 0.7 18.2 5 788 < .001
Difference between nestling mass and its asymptotic growth
12 0.3 ± 2.0 1.1 ± 1.7 0.6 ± 1.1 2.0 ± 1.6 0.3 ± 1.2 0.2 ± 1.6 20.1 5 645 < .00113 -0.2 ± 2.3 1.1 ± 2.2 0.7 ± 1.6 2.7 ± 2.2 0.5 ± 1.7 0.4 ± 1.3 20.4 5 515 < .00114 -0.4 ± 2.5 1.1 ± 2.5 0.7 ± 1.8 3.3 ± 2.3 1.0 ± 2.6 1.5 ± 0.7 16.2 5 340 < .00
Remex length [mm]12 31.7 ± 2.8 31.7 ± 3.8 30.7 ± 3.9 — — — 0.8 2 100 > 0.413 33.6 ± 3.1 34.4 ± 2.6 33.8 ± 3.0 — — — 2.0 2 242 > 0.114 36.2 ± 2.7 36.2 ± 2.4 35.3 ± 1.6 — — — 1.5 2 269 > 0.2
Web length [mm]12 22.1 ± 3.2 22.3 ± 4.2 22.4 ± 4.3 — — — 0.0 2 100 > 0.913 25.6 ± 4.2 27.6 ± 3.6 27.2 ± 4.0 — — — 6.9 2 242 < .00114 30.2 ± 4.2 30.9 ± 4.0 30.2 ± 2.6 — — — 0.9 2 269 > 0.4
Tarsus length [mm] — — — — 18.0 ± 0.9 17.6 ± 0.7 15.2 1 229 < .001
Egg size and nestling growth in Tree Sparrow 127
No aggregate correlations significantly different from zero were found between the mean egg length in the clutch and the mean nestling mass in the nest (Fig. 3A). But aggregate correlations between the deviation of an egg length from the mean egg length in the clutch and the deviation of the mass of the nestling hatched from this egg from the mean nestling mass in the nest were significantly positive for nestlings aged 1, 2, and 3 days (Fig. 3B).
Nestling growth curveParameters of the Richards’ growth curve as well
as the maximum growth rate and growth time were characterised by significant repeatability indices in the nest (Table 2). All these variables were signifi-cantly dependent on the year and brood (Table 3).
AsymptoteSignificantly positive aggregate correlations
were found between the mean egg volume and the mean asymptotic growth of nestlings in the nest. Also significantly positive aggregate correla-tions were found between the deviation of an egg volume from the mean egg volume in the clutch, or the deviation of an egg breadth from the mean egg breadth in the clutch, and the deviation of the asymptotic growth of a nestling from the mean asymptote in the nest (Table 5).
Mean maximum growth rateThe mean maximum growth rate of nestlings
in the nest was positively correlated with all the
Fig. 1. Aggregate correlations between the mean egg volume in the clutch and the mean nestling mass in the nest (A) and between the deviation of an egg volume from the mean egg volume in the clutch and the deviation of a nestling mass from the mean nestling mass in the nest (B). Numbers in bars — numbers of clutches (A) and the nestling (B). ANCOVA: *** —p < 0.001, ** — p < 0.01, * — p < 0.05.
5
253
6
243
7
258
8
258
9
235
10
226
12
223
13
168
11
229
*
1
210
***
2
262
**
3
266
**
4
256
**
14
114
*
2
*
197
3
202
4
202
5
195
6
*
199
8
*
195
11
*
192
13
167
14
119
7
202
**
1
187
*
9
189
*
10
189
*
12
190
*
0
0.05
0.1
0.15
0.2
0.25
0.3
Days
A
0
0.05
0.1
0.15
0.2
0.25
0.3
Days
B
Agg
rega
te c
orre
latio
nA
ggre
gate
cor
rela
tion
Table 4. Number and proportion (%) of nestlings that died in the successive years and broods.
YearBroods
1 2 31994 n 56 18 30
% 18.7 10.7 33.01995 n 93 73 29
% 35.2 36.1 20.6

128 B. Pinowska et al.
three measurements: volume, breadth, and length of the eggs. The deviations of the maximum growth rate of a nestling from the mean growth rate of nestlings in the nest were positively cor-related with the deviations of an egg breadth from the mean value in the clutch (Table 5).
Mean growth timeMean growth time of nestlings in the nest,
and the deviation of the growth time of a nestling from the mean for the nest were not significantly dependent on the egg size (Table 5).
The difference between nestling mass and its asymptote
The difference between nestling mass and its asymptotic growth was significantly dependent on the year and brood (Table 3).
No aggregate correlations significantly different from zero were found between egg size, mean egg size, and the deviation of an egg size from the mean egg size in the clutch, on the one hand, and respective
variables characterizing the difference between the masses of nestlings and their asymptotic growth.
Remix and websNo significant differences were found in the
length of remiges for nestlings aged 12, 13, and 14 days between successive broods in 1994 (Table 3).
For nestlings aged 12 days, significantly posi-tive aggregate correlations were found between the deviation of an egg size from the mean egg size in the clutch and the deviation of remex length of the nestlings that hatched from these eggs from the mean remex length in the nest. This relationship concerned egg volume (rc = 0.414, n = 42, ANCOVA: F1,38 = 7.86, p < 0.01), egg breadth (rc = 0.333, n = 42, ANCOVA: F1,38 = 4.75, p < 0.04), and egg length (rc = 0.424, n = 42, ANCOVA: F1,38 = 8.351, p < 0.01). In nestlings aged 13 and 14 days no aggregate correlations significantly different from zero were found between the vari-ables of the egg size and remex length.
The mean web length in nestlings aged 13 days showed significant differences between successive
253 243 226 168210
**
262
*
266
*
256
*
258
*
258
*
235
*
229
**
223
*
115
*
Agg
rega
te c
orre
latio
nA
ggre
gate
cor
rela
tion
0
0.05
0.1
0.15
0.2
0.25
0.3
0.35
3 4 5 6 7 8 9 10 11 12 13 14
Days
2
*
197 202 202 195 195 189 189 167 119192
**
190
*
A
1
187
***
199
*
202
*
0
0.05
0.1
0.15
0.2
0.25
0.3
0.35
1 2 3 4 5 6 7 8 9 10 11 12 13 14
Days
B
Fig. 2. Aggregate correlations for years and broods between the mean egg breadth in the clutch and mean nestling mass in the nest (A) and between the deviation of an egg breadth from the mean egg breadth in the clutch and the deviation of a nestling mass from the mean nestling mass in the nest (B). Numbers in bars — numbers of clutches (A) and the nestling (B). ANCOVA: *** — p < 0.001, ** — p < 0.01, * — p < 0.05.

Egg size and nestling growth in Tree Sparrow 129
broods in 1994 (Table 3). No difference was found for nestlings aged 12 and 14 days (Table 3).
The deviation of a web length from the mean web length in the nest for nestlings aged 12 days was positively correlated with the deviation of an egg volume from the mean egg volume in the
clutch (rc = 0.305, n = 42, ANCOVA: F1,38 = 5.28, p < 0.03). The mean web length in nestlings aged 12 days was negatively correlated with the mean egg breadth in the clutch (rc = -0.317, n = 41, ANCOVA: F1,37 = 4.14, p < 0.05). But in nestlings aged 14 days the aggregate correlation between the mean web
Agg
rega
te c
orre
latio
nA
ggre
gate
cor
rela
tion
-0.2
-0.1
0
0.1
0.2
1 2 3 4 5 6 7 8 9 10 11 12 13 14
Days
187
A
197 202 202 195 202 195 189 189 192 190 167 119199
-0.2-0.15
-0.1-0.05
00.05
0.10.15
0.2
1 2 3 4 5 6 7 8 9 10 11 12 13 14
Days
256253
243258
258235
226229
223 115
B
210
**
262
*
266
*
168
Fig. 3. Aggregate correlations for years and broods between the mean egg length in the clutch and the mean nestling mass in the nest (A) and between the deviation of a nestling mass from the mean nestling mass in the nest (B). Number in bars — numbers of clutches (A) and the nestling (B). ANCOVA: *** — p < 0.001, ** — p < 0.01, * — p < 0.05.
Table 5. Aggregate correlations for years and broods between the egg volume, breadth or length in the nest and the variables characterizing nestling growth: growth asymptote, maximum growth rate, and time of growth. A — asymptotic mass [g], v — maximum growth rate [g/day], t — time of growth [day], n — number of nestlings, k — number of nests, ANCOVA, * — p < 0.05; ** — p < 0.01, *** — p < 0.001.
Egg variables MeanA
Deviation of A from mean
Meanv
Deviation of v from mean
Meant
Deviation of t from mean
Mean egg volume in clutch k = 222 0.161* 0.195** -0.041Deviation of egg volume from mean n = 265 0.138* 0.071 0.015Mean egg breadth in clutch k = 222 0.176** 0.158* -0.045Deviation of egg breadth from mean n = 265 0.213** 0.127* 0.049Mean egg length in clutch k = 222 0.063 0.142* -0.022Deviation of egg length from mean n = 265 -0.055 -0.059 -0.046
130 B. Pinowska et al.
length in the nest, and the mean egg breadth in the clutch was significantly positive (rc = 0.215, n = 87, ANCOVA: F1,83 = 4.02, p < 0.05). No other significant aggregate correlations were found between egg sizes and web lengths.
Relationship between tarsus length and egg sizeTarsus was significantly longer in nestlings of
the second brood than in nestlings of the third brood (Table 3).
Aggregate correlations between the mean egg volume in the clutch and the mean tarsus length in the nest, (rc = 0.31, n = 62, ANCOVA: F1,59 = 6.27, p < 0.02) and between the mean egg length in the clutch and the mean tarsus length in the nest (rc = 0.324, n = 62, ANCOVA: F1,59 = 6.90, p < 0.02) were significantly positive. No signifi-cant aggregate correlations were found between tarsus length and other variables of egg size.
No significant correlation was found between any dependent variable analyzed and the clutch size.
DISCUSSION
The objective of our paper was to test if the egg size per se can influence the growth, develop-ment, and survival of Tree Sparrow nestlings. The relationships between chick growth or survival and egg size seems to be more clear in precocial compared to altricial species. That is why this issue was mainly investigated for precocial and semiprecocial species (Williams 1994). Smith & Bruun (1998), Christians (2002) concluded that the results are consistent with the idea that larger eggs may only confer an advantage in low-quality environment.
The effect of genetic factorsWhen correlating the mean egg size in a
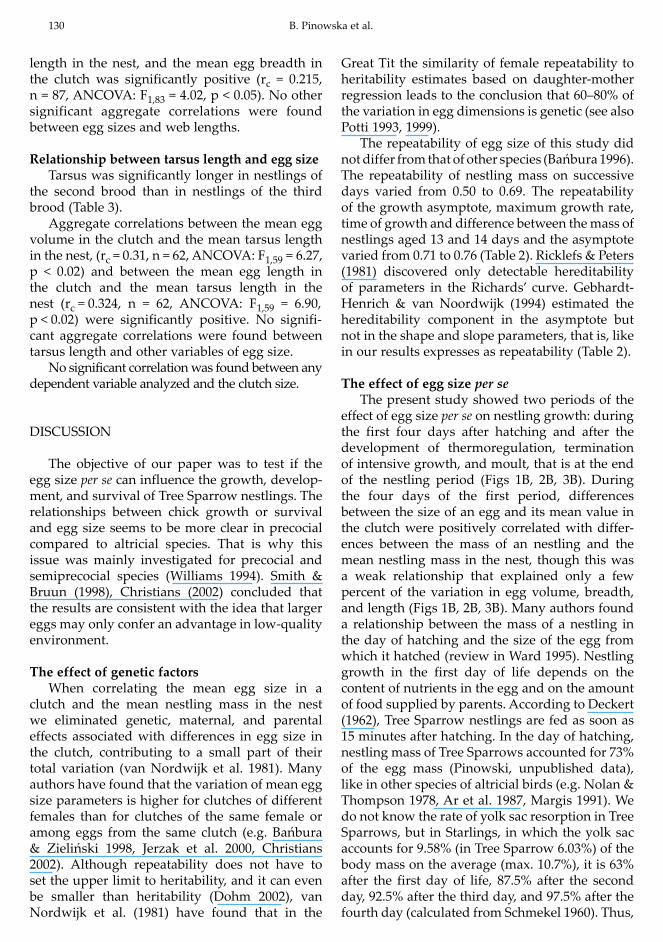
clutch and the mean nestling mass in the nest we eliminated genetic, maternal, and parental effects associated with differences in egg size in the clutch, contributing to a small part of their total variation (van Nordwijk et al. 1981). Many authors have found that the variation of mean egg size parameters is higher for clutches of different females than for clutches of the same female or among eggs from the same clutch (e.g. Bańbura & Zieliński 1998, Jerzak et al. 2000, Christians 2002). Although repeatability does not have to set the upper limit to heritability, and it can even be smaller than heritability (Dohm 2002), van Nordwijk et al. (1981) have found that in the
Great Tit the similarity of female repeatability to heritability estimates based on daughter-mother regression leads to the conclusion that 60–80% of the variation in egg dimensions is genetic (see also Potti 1993, 1999).
The repeatability of egg size of this study did not differ from that of other species (Bańbura 1996). The repeatability of nestling mass on successive days varied from 0.50 to 0.69. The repeatability of the growth asymptote, maximum growth rate, time of growth and difference between the mass of nestlings aged 13 and 14 days and the asymptote varied from 0.71 to 0.76 (Table 2). Ricklefs & Peters (1981) discovered only detectable hereditability of parameters in the Richards’ curve. Gebhardt-Henrich & van Noordwijk (1994) estimated the hereditability component in the asymptote but not in the shape and slope parameters, that is, like in our results expresses as repeatability (Table 2).
The effect of egg size per seThe present study showed two periods of the
effect of egg size per se on nestling growth: during the first four days after hatching and after the development of thermoregulation, termination of intensive growth, and moult, that is at the end of the nestling period (Figs 1B, 2B, 3B). During the four days of the first period, differences between the size of an egg and its mean value in the clutch were positively correlated with differ-ences between the mass of an nestling and the mean nestling mass in the nest, though this was a weak relationship that explained only a few percent of the variation in egg volume, breadth, and length (Figs 1B, 2B, 3B). Many authors found a relationship between the mass of a nestling in the day of hatching and the size of the egg from which it hatched (review in Ward 1995). Nestling growth in the first day of life depends on the content of nutrients in the egg and on the amount of food supplied by parents. According to Deckert (1962), Tree Sparrow nestlings are fed as soon as 15 minutes after hatching. In the day of hatching, nestling mass of Tree Sparrows accounted for 73% of the egg mass (Pinowski, unpublished data), like in other species of altricial birds (e.g. Nolan & Thompson 1978, Ar et al. 1987, Margis 1991). We do not know the rate of yolk sac resorption in Tree Sparrows, but in Starlings, in which the yolk sac accounts for 9.58% (in Tree Sparrow 6.03%) of the body mass on the average (max. 10.7%), it is 63% after the first day of life, 87.5% after the second day, 92.5% after the third day, and 97.5% after the fourth day (calculated from Schmekel 1960). Thus,
Egg size and nestling growth in Tree Sparrow 131
positive correlations in the first days of life can result from the size of the yolk sac.
In the second period, a statistically significant correlation between the deviation of the volume of an egg from the mean egg volume in the clutch and the deviation of the mass of a nestling from the mean nestling mass in the nest occurred only for nestlings aged 11 and 14 days, and this was a weak relationship (Fig. 1B). For egg breadth, this relationship was significant over the nestling period, except for days 5, 6, 10 and 13 (Fig. 2B). For egg length no such relationship was found in older nestlings.
We can only speculate about the reasons for the correlation between egg size parameters and older nestling mass. Eggs are the source of many substances necessary for the development of speci-fied organs or physiological functions, such as essential or semiessential aminoacids — taurine for bile production or cysteine for feather development (Bolotnikov et al. 1978, Houston 1999, Ramsay & Houston 1998, 2003), microelements, vitamins, car-otenoids (Blount et al. 2002, Hõrak et al. 2002, Royle et al. 2003), hormones (Schwabl 1993, Schwabl et al. 1997, Lipar et al. 1999), or acquired immunogenic factors transferred by the female through eggs (Nordling et al. 1988, Apanius 1998, Grindstaffet et al. 2003). Possibly the content of these substances depends on egg size. It cannot be excluded that the effect of egg size on nestling development is better pronounced in nestlings subjected to stress (Smith & Bruun 1998, Christians 2002).
In the Tree Sparrow population that we stud-ied, the mass and breadth of eggs increased from the first to penultimate egg laid, and the first egg laid was the smallest one. The mass of the last egg laid in the clutch did not differ from the mean egg mass in this clutch. The length of eggs did not depend on the sequence of laying (Pinowski et al. 2000–2001). The effect of the sequence of laying on the growth of nestling analysed in this paper, that is, fledged ones, was significant only on day 2 after hatching and only for 5-egg clutches (Pinowska et al. unpublished). When analysing the relationship between the deviation of egg dimensions from the mean in the clutch and the deviation of nestling mass from the mean in the nest, we observed for how long the nestlings hatched from the largest eggs remain the largest in the brood. It has been shown that this relation occurred only in the first days after hatching until the yolk stored in the yolk sack was exhausted, and it practically disap-peared afterwards (Figs 1B, 3B). This implies that the mass of nestlings hatched from the smallest
eggs (laid as the first ones) rapidly equals the mass of siblings hatched from larger eggs.
The sequence of hatching corresponds to the sequence of egg laying in the Tree Sparrow (r = 0.999, df = 85, p < 0.0001; Veiga 1990). They start incubation from the penultimate egg. In our study we defined asynchronous clutches as those in which nestlings were hatching for more than 24 hours. Such clutches accounted for 54% of all clutches. The nestling hatched from the first egg in the clutch, which was the smallest of all the nestlings, had an advantage in that it hatched as the first one and thus had extra time to reach the mass of siblings that hatched from larger eggs. However, the first egg may lose viability, as stated by the “viability hypothesis” (Veiga 1990, Veiga & Vinuela 1993) because it is not incubated for 3–5 days. The nestling hatched from the penultimate egg is in the best situation as it is the biggest and does not wait for incubation. Most often, the nestling hatched from the last egg is lost in the Tree Sparrow (Veiga 1990, Lebedeva 1994a, 1994b). Typically the last egg is of the poorest quality (Bolotnikov et al. 1978), but we do not know the quality of last egg in the Tree Sparrow (the content of microelements, amino acids, hormones, vitamins, and others). The most frequent mortality of the nestling hatched from the last egg in the clutch, laid on the day of the onset of incubation, corresponds to the “insurance off-spring hypothesis” (Lundberg 1985, Forbes 1991, Konarzewski 1993), and it is the most common pat-tern of asynchronous hatching in small passerine birds (Clark & Wilson 1981).
Similar results concerning the effect off egg volume on growth of altricial birds were obtained by other authors (e.g. Magrath 1992, Nilsson & Svensson 1993, Smith et al. 1995, Smith & Bruun 1998). Only Ricklefs (1984) did not find any rela-tionship between egg size and nestling growth. Styrsky et al. (1999) found such a relationship for the second brood of the House Wren day 10 and for the first brood until day 6 of nestling life. Schifferli (1973) and Jarvinen & Ylimaunu (1984) also found an effect of egg size on nestling mass but they did not eliminate the effect of parental quality. All these authors analyzed only the effect of egg mass on nestling growth and often also on their mortality. The present study shows that the egg breadth was correlated with nestling mass or other variables characterizing the development, on some occasions also when the egg volume was not. In Tree Sparrows, egg breadth varies in a different way than does egg length. Egg breadth increases with the sequence of laying of the first four eggs

132 B. Pinowska et al.
and than it decreases and does not depend on the clutch size, whereas egg length does not depend on the sequence of laying but it does depend on the clutch size (Pinowski et al. 2000–2001). This indicates that egg breadth depends on anatomic traits of the female, for example, on the breadth of oviduct (van Noordwijk et al. 1981). Warham (1990) found a relationship between egg shape index (B/L) and pelvis width and depth in Petrels. We do not know how the egg breadth can influ-ence the egg composition in the Tree Sparrow. Anderson & Deeming cited by Deeming (2002) showed that in the Houbara Chlamydotis undulata wet yolk was significantly correlated with breadth. Chylarecki (2000) provides evidence that in elon-gated eggs, breadth may be correlated mainly with the content of yolk and length with the con-tent of albumen. We do not know the relationship between egg composition and egg volume in Tree Sparrows. In passerines the content of albumen increases with egg volume (Hill 1995). In Starlings the albumen mass increases with egg volume but the yolk mass decreases (Ricklefs 1977, 1984). The percentage of yolk reminded constant as an egg mass increased for Great Tit but decreased for Pied Flycatcher (Ojanen 1983).
In this study, we have found a positive rela-tionship between the mean egg volume or egg length and length of tarsus of nestlings in the nest. Finkler et al. (1998) have experimentally demon-strated that the length of tarsus depends on the content of albumen rather than yolk in the egg.
Effect of egg size on nestling survivalIn the Tree Sparrow, the hatchability of small
eggs is lower than that of large eggs (Pinowska et al. 2002a). But we did not find correlation between egg size and nestling survival, like many other authors (e.g. Jarvinen & Ylimaunu 1984, Magrath 1992, Smith et al. 1995 and Styrsky et al. 1999). Schifferli (1973) found such a correlation only for the second brood, Ojanen (1983) only in some years, and Smith & Bruun (1998) in a poorer habitat. All these papers concern passerines. Among other altricial birds, a positive relationship between egg size and nestling survival was found in Wood Pigeons Columba palumbus (Murton et al. 1974) and in Swifts Apus apus (O’Connor 1979). Among precocial and semiprecocial species, the relation-ship between egg size and chick survival has been more frequently recorded (Williams 1994).
Phenotypic selection occurs when the phe-notypic value of a trait correlates with fitness. Among traits of passerine nestlings conferring
selective advantage there are mass asymptote, tarsus length, growth rate, and fledgling mass. These traits are correlated with survival, recruit-ment rate, and acquisition of territory (Gebhardt-Henrich & Richner 1998). We have found a cor-relation between the deviation of the volume of an egg from the mean value in the clutch and the deviation of a specified developmental trait of a nestling from the mean value of this trait in the nest: R2 from 0.4 to 5.7%, depending on the day — for nestling mass, 1.9% for the asymptote, 4.5% for the maximum growth rate, 2.8% for the tarsus length, 11–18%, depending on the day — for remex length, and 8–12% for web length. Many authors (review in Gebhardt-Hendrich & Richner 1998) provide evidence that these traits are corre-lated with fitness (survival, fecundity, acquisition of a better territory).
CONCLUSIONS
Egg size influences nestling size not only in the first days after hatching but also during the period of thermoregulation development and feather growth, it increases the chance of reaching greater body mass (the asymptote), structural size (tarsus length), and plumage development before fledging (length of remiges and webs), and all these may increase fitness.
ACKNOWLEDGEMENTS
Many thanks to J. Bańbura, M. Cichoń, J. Konarzewski and an anonymous referee for valu-able comments on earlier drafts of the manuscript. We appreciate the help of T. Hetmański with the fieldwork. This study was partly supported by the grant no. 3 P04F 05924 from the Polish Science Research Committee. The nest control, marking of eggs and nestlings were investigated under permission of nature conservancy authorities.
Translated by Barbara Diehl
REFERENCES
Apanius V. 1998. Ontogeny of immune function. In: Starck J. M., Ricklefs R. E. (eds). Avian growth and development. Oxford Univ. Press, New York–Oxford, pp. 203–222.
Ar A., Arieli B., Bellinsky A., Yom-Tov Y. 1987. Energy of Avian egg and hatchlings: utilization and transfer. J. Experimental Zool., Suppl. 1: 151–154.
Egg size and nestling growth in Tree Sparrow 133
Bańbura J. 1996. [lntra-population variability of egg measur-ments in the Barn Swallow Hirundo rustica]. Wydawnictwo Uniwersytetu Łódzkiego.
Bańbura J., Zieliński P. 1998. An analysis of egg-size repeatabil-ity in Barn Swallow Hirundo rustica. Ardeola 45: 183–192.
Barkowska M., Pinowski J., Pinowska B. 2003. The effect of trend in ambient temperature on egg volume in the Tree Sparrow Passer montanus. Acta Ornithol. 38: 5–13.
Bernardo J. 1996a. Maternal effect in animal ecology. Am. Zool. 36: 83–105.
Bernardo J. 1996b. The particular maternal effect of propagule size, especially egg size: patterns, models, quality of evi-dence and interpretations. Am. Zool. 36: 216–236.
Blalock H. M. 1960. Social statistics. McGraw-Hill Book Company Inc., New York, Toronto, London.
Blount J. D., Surai P. F., Nager R., Houston D. C., Møller A. P., Trewby M. L., Kennedy M. W. 2002. Carotenoids and egg quality in the lesser Black-backed Gull Larus fuscus: a supplemental feeding study of maternal effects. Proc. R. Soc. London B 269: 29–36.
Bolotnikov A. M., Skryleva L. F., Tarasov V. A., Angalt V. Z. 1978. [Differentiation of egg quality in a clutch and sur-vival of nestling Rooks]. Ekologija 2: 86–88.
Bolton M. 1991. Determination of chick survival in the lesser black-backed gull: relative contributions of egg-size and parental quality. J. Anim. Ecol. 60: 949–960.
Christians J. K. 2002. Avian egg size: variation within species and inflexibility within individuals. Biological Reviews 77: 1–26.
Chylarecki P. 2000. [Variation in components of the reproduc-tive effort of females in a population of Ringed Plover Charadrius hiaticula]. Ph.D. thesis, Institute of Ecology PAS, Ornithological Station, Gdańsk.
Deckert G. 1962. Zur Ethologie des Feldsperlings (Passer m. montanus L.). J. Ornithol. 103: 428-486.
Deeming D. C. 2002. Functional characteristics of eggs. In: Deeming D. C. (ed.) Avian incubation. Oxford Univ. Press, pp. 28–53.
Dohm M. R. 2002. Repeatability estimates do not always set an upper limit to hereditability. Functional Ecol. 16: 273–280.
Draber-Mońko A. 1997. Protocalliphora azurea (Fall.) (Diptera, Calliphoridae) and other insects found in nests of spar-rows, Passer domesticus (L.) and Passer montanus (L.) in the vicinity of Warsaw. International Studies on Sparrows 22–23: 3–21.
Fetisov S. A., Gaginskaya A. R. 1981. [The growth and development of the nestlings. In: Noskov G. A. (ed.) The Sparrows Passer montanus L. (Characteristic of species on area of distribution)]. LGU, Leningrad, pp. 166–187.
Finkler M. S., Van Orman J. B., Sotherland P. R. 1998. Experimental manipulation of egg quality in chickens: influence of albumen and yolk on the size and body composition of near-term embryos in a precocial bird. J. Compar. Physiol. B 168: 17–24.
Forbes L. S. 1991. Insurance offspring and brood reduction in a variable environment: the costs and benefits of pessimism. Oikos 62: 325–332.
Gebhardt-Henrich S. G., Richner H. 1998. Causes of growth variation and its consequences for fitness. In: Starck J. M., Ricklefs R. E. (eds). Avian growth and development. Oxford Univ. Press, New York–Oxford, pp. 324–339.
Gebhardt-Henrich S. G., van Noordwijk A. J. 1994. The genetical ecology of nestling growth in the Great Tit. Environmental influence on the expression of genetic vari-ances during growth. Functional Ecol. 8: 469–476.
Grinstaff J. L., Brodie III E. D., Ketterson E. D. 2003. Immune function across generations: integrating mechanism and
evolutionary process in maternal antibody translation. Proc. R. Soc. London B 270: 2309–2319.
Halberson D. L., Mussel F. F. 1922. The relationship of egg weight to chick weight at hatching. Poultry Science 1: 143–144.
Hill W. L. 1995. Intraspecific variation in egg composition. Wilson Bull. 107: 382–387.
Hõrak P., Surai P. F., Møller A. P. 2002. Fat-soluble antioxidants in the eggs of Great Tits Parus major in relation to breeding habitat and laying sequence. Avian Science 2: 1–8.
Houston D. C. 1999. Nutritional constraints on breeding in birds. In: Adams N. J., Slotow R. H. (eds). Proc. 22th Int. Omithol. Congr., Durban, Johannesburg, Bird Life South Africa, pp. 52–66.
Hoyt D. F. 1979. Practical methods of estimating volume and fresh egg weight of bird eggs. Auk 96: 73–77.
Järvinen A., Ylimaunu J. 1984. Significance of egg size on the growth of nestling Pied Flycatchers Ficedula hypoleuca. Ann. Zool. Fenn. 21: 213–216.
Jerzak L., Bocheński M., Kuczyński L., Tryjanowski P. 2000. Repeatability of size and shape of eggs in the urban Magpie Pica pica (Passeriformes; Corvidae) population. Acta Zool. Crac. 43: 165–169.
Konarzewski M. 1993. The evolution of clutch size and hatch-ing asynchrony in altricial birds: the effect of environmen-tal viability, egg failure and predation. Oikos 67: 97–106.
Krumpál M., Cyprich D., Fend’a P., Pinowski J. 2000–2001. Invertebrate fauna in nests of the House Sparrow Passer domesticus and the Tree Sparrow Passer montanus in central Poland. International Studies on Sparrows 27–28: 35–58.
Lebedeva N. 1994. [Nidicolous and post-nidicolous mortality of young from asynchronous broods of some passerine birds (Passeriformes)]. Zool. Zhurnal 73: 122–131.
Lebedeva N. 1996. [Marking technique on embryo in egg for identification of small passerine (Passeriformes) nestlings after hatching]. Zool. Zhurnal 75: 757–762.
Lessels C. M., Boag P. T. 1987. Unrepeatable repeatabilities: a common mistake. Auk 104: 116–121.
Lipar J. L., Ketterson E. D., Nolan V. Jr. 1999. Intra-clutch varia-tion in testosterone content of Red-winged Blackbird eggs. Auk 116: 231–235.
Lowry R. 1999–2000. Concepts and applications of inferential statistics. Available online: http://faculty.vassar.edu/lowry/webtext.html
Lundberg S. 1985. The importance of egg hatchability and nest predation in clutch size evolution in altricial birds. Oikos 45: 110–117.
Magrath R. D. 1992. The effect of egg mass on the growth and survival of Blackbirds: a field experiment. J. Zool. 227: 639–653.
Margis G. 1991. Composition of European Starling eggs. Acta Ornithol. Lit. 4: 68– 75.
Murton R. K., Westwood N. J., Isaacson A. J. 1974. Factors affecting egg-weight, body weight, and moult of the Wood Pigeon Columba palumbus. Ibis 116: 52–73.
Nilsson J. A., Svensson E. 1993. Causes and consequences of egg mass variation between and within blue tit clutches. J. Zool. 230: 469–481.
Nolan V., Thompson C. F. 1978. Egg volume as a predictor of hatching weight in the Brown-headed Cowbird. Wilson Bull. 90: 353–358.
van Noordwijk A. J., Keizer L. C. P., van Balen J. H., Scharloo W. 1981. Genetic variation in egg dimensions in natural population in Great Tit. Genetica 55: 221–232.
Nordling D., Andersson M., Zohari S., Gustafsson L. 1988. Reproductive effort reduces specific immune response and parasite resistence. Proc. R. Soc. London B 265: 1291–1298.

134 B. Pinowska et al.
O’Connor R. J. 1979. Egg weights and brood reduction in the European Swift (Apus apus). Condor 81:133–145.
Ojanen M. 1983. Composition of the eggs of the great tit (Parus major) and the pied flycatcher (Ficedula hypoleuca). Ann. zool. Fenn. 20: 57–63.
Parsons J. 1970. Relationship between egg size and post-hatch-ing chick mortality in the Herring Gull (Larus argentatus). Nature 228: 1222–1223.
Pinowska B., Barkowska M., Pinowski J., Hahm K.-H., Lebedeva N. 2002a. Influence of temperature on Tree Sparrow Passer montanus egg mass according to laying sequence. International Studies on Sparrows 29: 33–47.
Pinowska B., Barkowska M., Pinowski J., Hahm K.-H., Lebedeva N. 2002b. The efect of egg size on hatching rate in the Tree Sparrow Passer montanus (study in Central Poland). Acta Ornithol. 37: 7–14.
Pinowski J. 1968. Fecundity, mortality, numbers and biomass dynamics of a population of the Tree Sparrow (Passer m. montanus L.). Ekol. Pol. Ser. A 16: 1–58.
Pinowski J., Barkowska M., Hahm K.-H., Lebedeva N. 2000–2001. Variation in Tree Sparrow Passer montanus eggs. International Studies on Sparrows 27–28: 5–34.
Pinowski J., Hahm K.-H., Barkowska M. 1997. The effect of ectoparasitism by the blowfly Protocalliphora azurea (Diptera: Calliphoridae) on nestling Tree Sparrows (Passer montanus). International Studies on Sparrows 22–23: 11–21.
Pinowski J., Pinowska B., Truszkowski J. 1973. Escape from the nest and brood desertion by the Tree Sparrow (Passer m. montanus L.), the House Sparrow (Passer d. domesticus L.), and the Great Tit (Parus major L.). In: Kendeigh S. C., Pinowski J. (eds). Productivity, population dynamics and systematics of granivorous birds, PWN, 397–405 pp.
Potti J. 1993. Environmental, ontogenetic, and genetic vari-ation in egg size of Pied Flycatchers. Can. J. Zool. 71: 1534–1542.
Potti J. 1999. Maternal effects and the pervasive impact of nestlings history on egg size in a passerine bird. Evolution 53: 279–285.
Ramsay S. L., Houston D. C. 1998. The effect of dietary amino acid composition on egg production in blue tits. Proc. R. Soc. Lond. B 265: 1401-1405.
Ramsay S. L., Houston D. C. 2003. Amino acid composition of some woodland arthropods and its implications for breed-ing tits and other passerines. Ibis 145: 227–232.
Reed W. L., Turner A. M., Sotherland P. R. 1999. Consequences of egg size variation in the Red-winged Blackbird. Auk 116: 549–552.
Reid W. V., Boersma P. D. 1990. Parental quality and selection on egg size in the Magellanic Penguin. Evolution 44: 1780–1786.
Richards F. J. 1959. A flexible growth function for empirical use. J. Exp. Bot. 10: 290–300.
Ricklefs R. E. 1967. A graphical method of fitting equations to growth curves. Ecology 48: 978–983.
Ricklefs R. E. 1977. Variation in the size and quality of the Starling egg. Auk 94: 167–168.
Ricklefs R. E. 1984. Variation in the size and composition of eggs of the European Starling. Condor 86: 1–6.
Ricklefs R. E., Hahn D. C., Montevecchi W. A. 1978. The rela-tionship between egg size and chick size in the Laughing Gull and Japanese Quail. Auk 95: 135–144.
Ricklefs R. E., Peters S. 1981. Parental components of vari-ance in growth rate and body size of nestling European Starlings Sturnus vulgaris in Eastem Pennsylvania. Auk 98: 39–48.
Royle N. J., Surai P., Hartley I. R. 2003. The effect of variation in dietary intake on maternal deposition of antioxidants in zebra finch eggs. Functional Ecol. 17: 472–481.
Schifferli L. 1973. The effect of egg weight on the subse-quent growth of nestling Great Tit Parus major. Ibis 115: 549–558.
Schmekel L. 1960. Daten über das Gewicht des Vogeldottersackes vom Schlüpftag bis Schwinden. Revue Suisse de Zoologie 68: 103–109.
Schwabl H. 1993. Yolk is a source of maternal testoster-one for developing birds. Proc. Nat. Acad. Sci. USA 90: 11446–11450.
Schwabl H., Mock D. W. Gieg J. A. 1997. A hormonal mecha-nism for parental favouritism. Nature 386: 231.
Smith H. G., Bruun M. 1998. The effect of egg size and habitat on starling nestling growth and survival. Oecologia 115: 59–63.
Smith H. G., Ohlsson T., Wettermark K.-J. 1995. Adaptive sig-nificance of egg size in the European Starling: Experimental tests. Ecology 76: 1–7.
Sokal R. R., Rohlf F. J. 1995. Biometry. W. H. Freeman and Company, New York.
Stearns S. C. 1994. The evolution of Life Histories. Oxford Univ. Press.
Styrsky J. D., Eckerle K. P., Thompson C. F. 1999. Fitness-related consequences of egg mass in nestling house wrens. Proc. R. Soc. Lond. B 266: 1253–1258.
Veiga J. P. 1990. A comparative study of reproductive adapta-tions in House and Tree Sparrows. Auk 107: 45–49.
Veiga J. P., Vinuela J. 1993. Hatching asynchrony and hatching success in the House Sparrow: evidence for egg viability hypothesis. Ornis Scand. 24: 237–242.
Ward S. 1995. Causes and consequences of egg size variation in Swallows Hirundo rustica. Avocetta 19: 201–208.
Warham J. 1990. The Petrels, their ecology and breeding systems. Academic press, London.
Wiley H. W. 1950. The influence of egg weight on the pre-hatching and post-hatching growth rate in the fowl. Poultry Science 29: 570–574.
Williams T. D. 1994. Intraspecific variation in egg size and egg composition in birds: effects on offspring fitness. Biological Review 68: 35–59.
STRESZCZENIE
[Wpływ wielkości jaja (objętości, szerokości i długości) na wzrost i rozwój piskląt mazurka]
Badania prowadzono nad populacją mazur-ków żyjących na terenie wsi położonych między Wisłą a Kampinoskim Parkiem Narodowym, 15 km na NW od Warszawy. Mazurki gnieździły się w skrzynkach lęgowych Odbywały 3 lęgi w roku. W latach 1994, 1995 analizowano 261 zniesień, z których wykluło się 1167 piskląt (Tab. 1). Częstość kontroli i metody znakowania jaj i piskląt pozwo-liły na określenie jaja, z którego każde z piskląt wykluło się. Jaja mierzono i wyliczono ich objętość. Pisklęta codziennie ważono i w ich 12-14 dniu życia mierzono długość skoku, najdłuższych lotek i chorągiewek. Dla każdego pisklęcia wyznaczono parametry krzywej wzrostu Richardsa.
Do analiz statystycznych, jako zmienne nieza-leżne przyjęto średnie wartości cechy metrycznych jaj w zniesieniu oraz odchylenia wymiarów jaja od
Egg size and nestling growth in Tree Sparrow 135
średniego wymiaru jaja w zniesieniu. Zmiennymi zależnymi były średnie wartości cech wylatują-cych piskląt pochodzących z danego zniesienia oraz odchylenia cechy pisklęcia od średniej cechy piskląt pochodzących z danego zniesienia.
Różnice wartości zmiennych oceniono za pomocą analizy wariancji (ANOVA).
Wzajemna zależność między zmiennymi zależ-nymi i niezależnymi analizowano za pomocą ana-lizy kowariancji (ANCOVA) ze względu na istotne różnice prawie wszystkich analizowanych zmien-nych między kolejnymi latami i lęgami (Tab. 3). Jako podstawę analizy statystycznej przyjęto „aggregate correlation”, dla której istotność różni-cy od zera sprawdzano przy pomocy ANCOVA.
Stwierdziliśmy istotne, chociaż słabe dodatnie korelacje między średnią objętością jaj i szero-kością jaj w zniesieniu, a średnią masą piskląt w gnieździe dla większości dni rozwoju gniaz-dowego (Fig. 1A, 2A). Średnia długość jaj nie korelowała ze średnią masą piskląt (Fig. 3A).
Odchylenie objętości jaja od średniej objętości jaj w zniesieniu korelowała dodatnio z odchy-leniem masy pisklęcia od średniej masy piskląt w gnieździe w czasie czterech dni po wykluciu i po zakończeniu intensywnego wzrostu pod koniec pobytu piskląt w gnieździe (Fig. 1B). Odchylenie szerokości jaja od średniej szerokości jaja w zniesieniu a odchylenie masy pisklęcia od średniej masy piskląt w gnieździe korelowało dodatnio niemal w każdym dniu życia piskląt,
ale korelacje te wyjaśniały tylko kilka procent zmienności (Fig. 2B). Dla długości jaj związek taki (poza pierwszym dniem życia piskląt) nie istniał (Fig. 3B).Średnie maksymalne tempo wzrostu dodatnio
korelowało z każdą z analizowanych cech (Tab. 5). Średni czas wzrostu piskląt w gnieździe oraz odchylenie czasu wzrostu pisklęcia w gnieździe od średniego czasu pobytu piskląt w gnieździe nie zależały istotnie od zmiennych związanych z wymiarami jaj, ale miały tendencję ujemną. Długość lotki w 12 dniu życia piskląt jako miara stopnia rozwoju dodatnio korelowała z każdą z analizowanych cech jaj. Odchylenie długości cho-rągiewki pisklęcia od średniej długość chorągiew-ki piskląt w gnieździe korelowało z odchyleniem objętości jaja od średniej objętości jaj w gnieździe. Odchylenie długości lotki pisklęcia od średniej długości lotki piskląt w gnieździe korelowało dodatnio z odchyleniem masy jaja od średniej masy jaj w gnieździe i wpływ tej cechy tłumaczył kilkanaście procent zmienności (Tab. 3).
Wielkość strukturalna piskląt w lęgu drugim była większa niż w lęgu trzecim. Korelacja prze-ciętna była dodatnia dla średnich objętości jaj i długości jaj a tarsus (Tab. 3).
Wielkość jaj, poza okresem czerpania z zapa-sów zawartych w woreczku żółtkowym (do 4 dnia), wpływa na wzrost i rozwój piskląt głów-nie w dniach rozwoju termoregulacji, intensyw-nego wzrostu i rozwoju upierzenia.
Related Documents


