THE EFFECT OF CROSSHEAD SPEED, LOAD CELL CONFIGURATION AND CURING TIME ON THE SHEAR BOND STRENGTH OF ORTHODONTIC BRACKETS By Vivek Cheba A thesis submitted to the Faculty of Graduate Studies of the University of Manitoba in partial fulfillment of the requirements for the degree of MASTER OF SCIENCE Department of Preventive Dental Science University of Manitoba Winnipeg Copyright ©2012 by Vivek Cheba

Welcome message from author
This document is posted to help you gain knowledge. Please leave a comment to let me know what you think about it! Share it to your friends and learn new things together.
Transcript

THE EFFECT OF CROSSHEAD SPEED, LOAD CELL
CONFIGURATION AND CURING TIME ON THE
SHEAR BOND STRENGTH OF ORTHODONTIC
BRACKETS
By
Vivek Cheba
A thesis submitted to the Faculty of Graduate Studies of the University of
Manitoba in partial fulfillment of the requirements for the degree of
MASTER OF SCIENCE
Department of Preventive Dental Science
University of Manitoba
Winnipeg
Copyright ©2012 by Vivek Cheba

2
Abstract
Objective: Evaluate the effect of crosshead speed, load cell configuration and curing time on
shear bond strengths.
Methods: 160 human molars were divided into equal groups of 20 second and 40 second
photopolymerization times and then into 1kN or 10kN load cell groups. Each of the groups were
divided into 0.5mm/min or 5mm/min crosshead speeds.
Results: Regarding photopolymerization time (20s vs. 40s) and crosshead speeds (0.5mm/min
vs. 5.0mm/min) there were no significant differences in SBS (p>0.05). The load cell
configuration (1kN vs. 10kN) however showed statistically significant differences (p<0.05) with
the 1kN producing higher bond strengths.
Conclusion: Only load cell configuration affected the shear bond strengths.

3
Acknowledgements
My supervising committee
o Dr. William Wiltshire
o Dr. Robert Schroth
o Dr. Noriko Boorberg
All the staff, friends, and colleagues at Graduate Orthodontics
Dr. Xiem Phan
Dr. Andy Ho
Dr. Collin Dawes
All companies for their generous donations of products
o 3M Unitek
o GAC international

4
Table of Contents
1 INTRODUCTION 7
2 LITERATURE REVIEW 9
2.1 Evolution of Bonding 9
2.2 Bond Testing in Orthodontics 10 2.2.1 Shear Testing 11
2.2.2 Tensile Testing 12
2.2.3 Sheer-Peel Bond Strength 12
2.2.4 Fracture Toughness Testing 12
2.2.5 Debonding Force and Bond Strength 12
2.2.6 Testing Machine 13
2.2.7 Minimum Recommended Bond Strength 15
2.3 Testing Standardization 16
2.4 Bond Strength Testing Standardization 17
2.5 Literature on Bond Strength Testing Standardization 17
Table 2.1: Shear bond strength studies showing their test parameters used in
present study 21
3 PURPOSE 23
4 NULL HYPOTHESES 24
5 MATERIALS AND METHODS 25
5.1 Materials used in the study 25
5.1.1 Transbond XT Light Cure Adhesive System 25 Figure 5.1: Transbond XT Light Cure Adhesive System 25
Figure 5.2: Transbond XT Etching Gel 35% Phosphoric Acid 25
5.1.2 Artificial Saliva 26
5.1.3 Orthodontic Buttons 26
Table 5.1: Shear Bond Material Manufacture and Batch Number 27
5.2 Experimental Method 28 5.2.1 Tooth Collection, Storage, and Preparation 28
5.2.2 Bonding Procedure 28
5.2.3 Debonding Procedure 29
Table 5-2: Summary of the Study 30
Figure 5.3: Laser Level with Copper Rings Set Up 30
Figure 5.4: Cut Tooth Held by Wax in Copper Ring before Acrylic Placement 31
Figure 5.5: Bonded Tooth Embedded in Acrylic Mounted in Universal
Testing Machine 31
Figure 5.6: Universal Testing Machine 31
Figure 5.7: Bencor Multi-T Loading Apparatus 32
5.2.4 Statistical Analysis of Data 32
6 RESULTS 33
6.1 Shear Bond Strength after 24 hours 34 Table 6.1: Descriptive Data of Shear Bond Strengths 34
6.2 Statistical Analysis of Subgroups 35 Table 6.2: Statistical difference between 20 second vs. 40 second curing time 36

5
Table 6.3: Statistical differences between crosshead speed 0.5mm/min and 5.0mm/min 36
Table 6.4: Statistical differences between load cell configuration 1kN vs. 10kN 37
7 DISCUSSION 38
7.1 Shear Bond Strength 39
7.2 Photopolymerization Time 39
7.3 Crosshead Speed 41
7.4 Load Cell Configuration 43
7.5 Limitations of the current study 44
8 CONCLUSIONS 47
9 RECOMMENDATIONS 48
10 RAW DATA 49
11 REFERENCES 53
12 APPENDIX
12.1 Ethics Approval 58
12.2 Journal Article and Submission Confirmation 59

6
List of Tables and Figures
Table 2.1: Shear Bond Strength Studies Showing their Test Parameters 20
Table 5.1: Shear Bond Material Manufacture and Batch Number 26
Table 5-2: Summary of the Study 29
Table 6.1: Descriptive Data of Shear Bond Strengths at 24 hours 31
Table 6.2: Statistical Difference between 20 vs. 40 sec. Photopolymerization Time 35
Table 6.3: Statistical Differences between the 0.5 and 5.0mm/min cross head speeds 35
Table 6.4: Statistical Differences between 1kN vs. 10kN load cell configuration 36 Figure 2.1: Instron Universal Testing Machine 3360 Series 12
Figure 2.2: Zwick GmBH Universal Testing Machine 13
Figure 5.1: Transbond XT Light Cure Adhesive System 24
Figure 5.2: Transbond XT Etching Gel 35% Phosphoric Acid 24
Figure 5.3: Laser Level with Copper Rings Set Up 29
Figure 5.4: Cut Tooth Held by Wax in Copper Ring before Acrylic Placement 30
Figure 5.5: Bonded Tooth Embedded in Acrylic Mounted in Universal Testing
Machine 30
Figure 5.6: Universal Testing Machine 30
Figure 5.7: Bencor Multi-T Loading Apparatus 31

7
1. INTRODUCTION
Since the introduction of different bracket adhesive materials to the orthodontic market,
both in vivo and in vitro studies have been conducted to test their effectiveness and working
characteristics. As new bonding agents have been introduced, research focused on this area and
the resultant publication rate of papers on orthodontic bonding increased considerably. This is
illustrated in the steadily increasing number of bonding papers appearing in orthodontic journals
(Eliades & Brantley, 2000).
Studies involving orthodontic adhesive materials have mainly focused on shear bond
strength studies. The results obtained from these studies show the strength of the adhesive
between the tooth and bracket. Typically higher bond strengths indicate a better adhesive
material. To conduct the actual tests, brackets are bonded to extracted teeth, tightly secured into a
tooth test ring using acrylic and then mounted onto a testing machine. The machine contains a
steel rod attached to a crosshead and once the rod is activated it contacts the mounted bracket
and shears it off. A computer electronically connected to the Universal Test Machine records the
strength of the adhesive of each test in megapascals. The speed of the crosshead and load cell
weight can be changed and as a result may affect the overall results (Eliades & Brantley, 2000).
Although many bonding studies have been conducted, there lacks a universally accepted
protocol to conduct these studies. As a result, it is difficult and sometimes impossible to compare
the materials and techniques used in the studies as well as the results within themselves (Bishara,
Soliman, Laffoon, & Warren, 2005). Fox (1994) found that even changing one test parameter
could significantly affect the interpretation of the results. In addition, it was observed that there
was a large variation in the methodology used for orthodontic material testing of bond strength.

8
From this it was suggested that researchers should adopt a standard methodological approach
that included tooth type, surface enamel preparation, storage medium, testing equipment and
technique, sample size, statistical analysis, and bond strength units (Fox, McCabe, & Buckley,
1994). Finnema et al. (2010) reported that many studies on in vitro orthodontic bond strength fail
to report test conditions that could significantly affect their outcome. In their systematic review
and meta-analysis, a summary of factors is given that can affect the in vitro bond strength of
orthodontic brackets. Experimental conditions that significantly influence in-vitro bond strength
are water storage of the bonded specimens, photopolymerization time, and crosshead speed
(Finnema, Ozcan, Post, Ren, & Dijkstra, 2010).
New dental products are constantly being introduced to the orthodontic market and are
continually being tested for their effectiveness. In order for clinicians to critically evaluate new
products and better serve their patients, it remains essential that thorough testing of new
materials be conducted by independent sources, in addition to the potentially biased “in house”
tests undertaken by manufacturers. Materials need to bond sufficiently strong, yet not too strong
to cause enamel damage on debonding. The bond should not deteriorate during orthodontic
treatment over time, it should be non-toxic, non-allergenic and preferably anticariogenic. Only
eventual standardized testing of orthodontic products will allow accurate evaluation, comparison
and full disclosure scrutiny of new and evolving products (W. A. Wiltshire, 2012a).

9
2. LITERATURE REVIEW
2.1 Evolution of Bonding
Michael G Buonocore (1955) revolutionized the field of dentistry by introducing the acid
etch technique that allowed adhesion of an acrylic filling material to enamel surfaces
(BUONOCORE, 1955). The basis of bonding materials, the bisphenyl A glycidyl dimethacrylate
(Bis-GMA) was synthesized and introduced by Bowen in 1956 and eventually led to the first
successful production of composite resin for filling teeth (BOWEN, 1956). The popularity of the
bonding technology improved significantly and eventually Newman (1965), introduced direct
bonding of orthodontic attachments as an alternative to banding as a viable clinical option
(Newman, 1965). Over the past 45 years, many advances and innovations in adhesion and
bonding have occurred, from multi-step to one-step bonding procedures, and all with claims of
improved adhesivity (W. A. Wiltshire & Noble, 2010). Subsequently, orthodontic bonding
developed as an excellent alternative to banding and eventually over the years its properties,
applications, and techniques of use significantly increased. Eliminating the need for banding of
individual teeth, allowed clinicians to increase treatment efficiency, patient comfort, elimination
of pretreatment tooth separation, improve oral hygiene and esthetics, and reduce chair time (W.
A. Wiltshire & Noble, 2010).
Retief et al. (1970) brought clarification to the bonding mechanics by explaining the
process of adhesion, wetting and contact angles that allowed a more focused approach to
studying orthodontic bonding. The group also initiated much of the research in comparing
orthodontic adhesives and were able to illustrate that fresh adhesive outperformed a similar old
sample (Retief, Dreyer, & Gavron, 1970). Conventional laboratory bond strength testing has

10
been described in numerous peer-reviewed journals. It is important to review the methodology
before applying the results of a project clinically. Bond strength studies, irrespective whether
shear bond strength (SBS) or tensile bond strength (TBS), use the “mechanical mouth,” better
known scientifically as the Universal Testing Machine (P. Emile, 2010). This testing device
provides standardized bond strength results which can be compared between various studies and
can allow new adhesive products to be manufactured and introduced to the marketplace based on
its improved properties. A standardized approach in laboratory testing of new self-etching primer
systems is quite difficult to achieve due to variations in methodologies and techniques.
2.2 Bond Testing in Orthodontics
Ensuring an adequate bond between the bracket base and the tooth is important to the
clinical success of orthodontic treatment. The bracket must be able to withstand the masticatory
forces during the length of the treatment; otherwise, treatment can be unnecessarily delayed and
costly for the patient and orthodontist. On the other hand, if the bond strength between the
bracket interface and tooth is too strong, the enamel surface can be damaged during debonding
(Proffit WR, Fields HW, Sarver DM, 2007). It is important to initiate preliminary in vitro studies
of new bonding agents to provide clinical insight as to how they may actually perform. Without
the input from in vitro studies, research in orthodontic bonding will not progress and
orthodontics will not be able to utilize and take advantage of possibly more effective and
efficient bonding agents entering the market.
In general, studies on orthodontic bonding are classified according to mode of load
application and testing environment. Load applications are shear, tension or torsion and testing
environments are either in vitro, in vivo, or ex vivo. Due to the relative simplicity of experimental

11
configuration and presumably increased reliability of simulating debonding that occurs during
treatment, shear testing is the most popular mode of load application in an in vitro environment
(Eliades T, 2000).
2.2.1 Shear Testing
In shear testing, the load can be applied parallel to the base of the bracket by a blade in
compression or by a wire loop in tension (T. R. Katona & Long, 2006). However, pure shear
testing is extremely difficult to obtain due to the complexities of the forces involved and instead
is a combination of shear, peel and shear peel forces. Bond failure occurs due to a combination
of bending of the bracket base resulting in tensile stress and shearing. When the adhesive bond
strength is too high, fractures in the enamel and dentine can occur due to bending action that will
predispose any crack that forms to deviate into the dentine or enamel, which would be
considered problematic in a clinical situation. Overall, it is difficult, if not impossible to have
pure shear testing and replicate the in vivo masticatory forces, but laboratory studies can provide
the clinician an understanding of how biomaterials may perform in the complex oral
environment (W. A. Wiltshire & Noble, 2010).
2.2.2 Tensile Testing
In tensile testing, the bracket is pulled off perpendicular to the bracket base. The idea
behind this design is that all measurements are taken in the central part of the specimen, well
away from the clamping site, such that a uniform stress field is generated and the local tensile
stress can be calculated simply from the load divided by the cross-sectional area. In clinical
tensile testing, the bracket is pulled perpendicularly from the enamel substrate (Phan, Akyalcin,
Wiltshire, & Rody, 2011a).

12
2.2.3 Shear-Peel Bond Strength
In this method of testing, the debonding force is applied at some distance from and
perpendicular to the adhesive-attachment junction. This method results in a combination of shear
stress and some component of “peel” force being applied to the adhesive interfaces. The distance
of the debonding apparatus from the attachment-adhesive junction will determine the amount of
shear and peel force being applied. It is difficult to determine the exact amount of each force,
however, it is well understood that studies reporting shear bond strengths are in fact testing
shear-peel bond strength since it is difficult to get shear bond strength alone (T. R. Katona, 1994;
T. R. Katona, 1997).
2.2.4 Fracture Toughness Testing
The ability of a material to resist fracture (breakage) is the mechanical property that most
distinguishes ceramics from metals. This ability is called fracture toughness. A shallow scratch
on the surface of a ceramic will drastically reduce the load required for fracture, whereas the
same scratch on a metal surface will have little, if any, effect on fracture under load. In
orthodontics this testing is mainly undertaken to compare ceramic (poly crystalline or
monocrystalline) and metal brackets. If a scratch of the same dimension is made on the surface
of a metal and ceramic bracket, and they are flexed, the ceramic rods will break. Typical values
of fracture toughness for stainless steel are in the 80-95 MPa range, and 2.4-4.5 MPa range for
ceramics (Scott, 1988).
2.2.5 Debonding Force and Bond Strength
Force is known to be measured in Newtons (N) and one N is required to accelerate a
mass of 1Kg at a rate of 1m/s2. Forces are often expressed in kilo Newtons (kN) (1 kN= 1000N),

13
or pound (lb) or pound force (lbf) (1N ≈ 0.22481 lbf) (W. A. Wiltshire & Noble, 2010). In
orthodontic bond strength testing terms, use is often made of the Pascal (Pa), or metric unit of
pressure or stress (1 Pa = 1 N acting on an area of 1 m2). Pound per square inch (psi) as a unit of
stress is also frequently used in bond strength reporting (1 psi = 1 lbf/in2) (1 psi = 6894.76 Pa)
(W. A. Wiltshire & Noble, 2010). Megapascals (MPa) is currently accepted as the preferred unit
for reporting bond strengths. Bond strength can also be reported as bond force in units of
Newtons (N), kilograms (kg) or pounds (lbs). Bond strength is the bond force divided by the
area of the bonded interface (e.g. 1 Pa = 1 N/m2, 1 MPa = 1 N/mm
2). Thus, experimental studies
using a universal testing machine (e.g. Zwick GmBH) can measure the force (N) needed to
debond a bracket with a known bracket base area (mm2) to give a bond strength value in N/mm
2
or MPa (Powers, Kim, & Turner, 1997).
2.2.6 Testing Machine
There are two types of machines that are used to test shear and tensile strength of
orthodontic materials. These machines are classified as screw-driven (have a large screw located
at each end of the crosshead) or servo-hydraulic (use the pressure of oil pumped into a hydraulic
piston to move the crosshead)(Phan, Akyalcin, Wiltshire, & Rody, 2011a). Electromechanical or
universal testing machines are most commonly used for static testing in a tensile or compression
mode. Additional test types include tensile, compression, shear, flexure, peel, tear, cyclic, and
bend tests. Capacities for these systems range from low-load forces of 0.5 kN (112 lbf) up to
high-capacity 600 kN (135,000 lbf). These systems are frequently configured for automated
testing. In addition to the testing equipment, specimen preparation is an extremely important
factor to consider when evaluating the repeatability of results. Specimens with nicks, cuts, and
non-parallel edges will have an adverse impact on repeatability of results (Instron® Products: By

14
Product Type, Electromechanical Systems, 2012). The two most common testing machines in the
field of dentistry and orthodontics are Instron, Norwood, MA (Figure 2.1) and Zwick Universal
Testing Machines, Zwick GmBH, Ulm, Germany (Figure 2.2) (W. A. Wiltshire, 2012a).
Figure 2.1: Instron Universal Testing Machine 3360 Series
Figure 2.2: Zwick GmBH Universal Testing Machine

15
2.2.7 Minimum recommended bond strength
The posterior region of the mouth can produce a biting force of about 20MPa and this may
be an indication of the minimum bond strength required. In addition to the masticatory forces,
the clinical bond strength of a bracket needs to be strong enough to resist the applied orthodontic
forces placed by the orthodontist but weak enough to allow for debonding at the end of
treatment. Reynolds (1975) proposed that “clinically acceptable” bond strengths should be in the
6-8 MPa range. This recommendation was deduced if a typical bracket has a bonding area of
16mm2 and the average force transmitted to a bracket during function is between 40 – 120 N (1
MPa = 1 N/mm2). Thus, the minimum bond strength needed to withstand the applied force of
120 N is 7.5 MPa (Powers et al., 1997; Reynolds, 1975). However, the Reynolds study was
published 30 years ago and testing systems, computerization, and products have changed
significantly.
According to Wiltshire & Noble (2010), an “ideal bond strength” is difficult to define
because each individual differs in their masticatory forces, eating habits, and intra-oral
environment. They recommended that to achieve the minimal reliable clinical bond strength, in
vitro bond strengths should be at least 3-4 MPa. It is also important to note that during in vitro
testing, it is essential to not only look at the means but to also examine the range of values; in
particular the low end of the range. (Wiltshire & Noble, 2010) This recommendation was based
on clinical trials using glass ionomers to bond orthodontic brackets. It was demonstrated that
there was no significant differences in failures rates between the glass ionomer (3.3%) and
conventional orthodontic resin (1.6%). (Fricker, 1994)

16
2.3 Testing Standardization
For useful standards to be developed for orthodontic products, test protocols for important
physical properties need to be standardized (Stanford, Wozniak, & Fan, 1997). Despite this
abundance of studies on dental materials in the scientific literature, it is often difficult to
meaningfully compare the performance of these products because of the lack of a universally
accepted protocol to conduct these experiments. It has been reported that changing one of the test
parameters could significantly affect the results as well as the interpretation of the outcome
(Bishara et al., 2005).
In 1970, the American National Standards Committee (ASC) MD156 was created for the
development of standards in dentistry with the American Dental Association (ADA) as
Secretariat. As of this date, all ADA specifications for dental materials, instruments, and
equipment are submitted and then approved as American National Standards. As part of this
program, a manufacturer or distributor of a product submits data showing that the product meets
the requirement values of the appropriate specification. The ADA then confirms this compliance
by testing the marketed product in its evaluation laboratories. Currently, two ASC MD 156
working groups are active in the development of standards for orthodontic products. These
working groups evaluate test methods reported by researchers and determine appropriate tests
that best fit the need of the standard. A proposed test method is then evaluated by round robin
testing in several laboratories, using products chosen to be representative of safe and effective
products for that category. It is well recognized in ASC MD156 that to facilitate the development
of a suitable test method, standardization of test protocols must come first. Similar activities are
conducted on an international basis by the International Organization for Standardization (ISO)
TC106 Dentistry.

17
Currently, a review of recent publications in the orthodontic literature involving laboratory
testing shows that there is a lack of standardized test protocols in evaluation of orthodontic
products, including bond strength testing (Stanford et al., 1997).
2.4 Bond Strength Testing Standarization
The major classification of bonding studies can be divided into three categories:
1. Test environment: in vivo, in vitro, ex vivo
2. Substrate: enamel, composite resin, porcelain, amalgam
3. Loading mode: shear, tensile, torsion, shear-peel
In-vitro studies possibly allow for more standardization procedures since clinically it is
almost impossible to distinguish the adhesive potential of a specific bonding system independent
of many other variables (Eliades & Brantley, 2000). Many factors influencing adhesive shear and
tensile bond strengths have been studied, including time elapsed between bonding and
debonding, whether the bonded samples were subjected to thermal stresses, whether
contamination occurred during the bonding procedure, the type of curing light, the composition
of the adhesive, the use of fluorides on teeth, the type and concentration of etchant, etching time,
the type of brackets, the preparation of enamel, and the use of bleaching prior to bonding
(Bishara et al., 2005; Finnema et al., 2010).
2.5 Literature on Bond Strength Testing Standardization
Finnema (2010) conducted a systematic review of the available literature regarding in-
vitro orthodontic shear bond strength testing. To date, this publication has been the most
comprehensive review of bond strength testing conditions. Results from this paper showed bond
strength testing was negatively influenced when the test teeth were stored in water. Water

18
storage on average decreased bond strength by 10.7 MPa, assuming that the other predictors
remain constant. Although this was the most pronounced effect of an experimental condition,
this finding was mainly influenced by one relatively large study sample in which artificial saliva
was used as a storage medium for specimens. It was reported that bond strengths were
significantly higher when teeth were stored in artificial saliva. Analogously, each second of
photopolymerization time increased the bond strength by 0.077 MPa. The studies in the meta-
analysis showed considerable variations in photopolymerization time: from 2 to 50 seconds,
however, most studies reported 40 seconds for polymerizing adhesive and this corresponds to the
routine clinical standard. Although the results indicated increasing photopolymerization time
yields higher bond strengths, the most optimal time for polymerizing still needs to be determined
in future studies. When crosshead speed increased by 1 mm per minute, bond strength increased
by 1.3 MPa. However, the studies used in the meta-analysis reported conflicting results with no
obvious explanations. The discrepancy in the results indicates that additional research is required
for this important parameter. Overall, they suggested because of developments in adhesive
dentistry and the increasing numbers of bond strength studies, uniform guidelines for
standardization of the experimental conditions of in-vitro bond strength research is clearly
indicated (Finnema et al., 2010). The guidelines from this study were used to select the testing
conditions used in this study, including storage medium for teeth, cross-head speed,
photopolymerization time, and load cell configuration.
Bishara et al. (2005) attempted to standardize testing conditions when they conducted a
study to determine the effect of crosshead speed of the testing machine on shear bond strength
while standardizing all other variables. They found changing the crosshead speed from 5.0 to
0.5mm/min increased shear bond strength by approximately 57% and also decreased the ratio of

19
the standard deviation to the mean by half, from 66% to 33%. They also suggested that
identifying and standardizing other testing parameters included in shear bond testing would make
the results more useful for comparative purposes. Though this study presented some very
valuable information regarding the speed at which the crosshead should contact the bracket, it
failed to standardize other important variables such as the load cell configuration and
photopolymerization time (Bishara et al., 2005).
While depth of cure is an important consideration for the restorative dentist, it is much
less of a concern for the orthodontist because the layer of composite that bond brackets to teeth is
very thin. Manufacturers have recommended light-curing times of 20-40 second for
polymerizing composite restorative materials 2mm thick but the thickness of orthodontic
adhesive is considerably less and therefore shorter polymerization times might be adequate
(Swanson, Dunn, Childers, & Taloumis, 2004). Swanson et al. (2004) demonstrated lower shear
bond strengths for 10 second vs. 40 second curing with light emitting diode (LED) light curing
units, however, found that all experimental groups had mean SBS’s greater than 8MPa.
Mavropoulos, A (2005) also found a curing time of 10 seconds to be sufficient to bond metallic
brackets to incisors using intensive LED curing units, however, higher curing times (5sec vs 40
sec) did show higher bond strengths. (Mavropoulos, Staudt, Kiliaridis, & Krejci, 2005).
Similarily, with a Resin Modified Glass Ionomer Cement (RMGIC) enhanced with 37%
phosphoric acid etching and 40 s light-curing time, did not show difference in SBS when the
light-curing time was increased, regardless of the acid used (Maruo et al., 2010).
From the studies conducted by Finnema, K.J. (2010) and Bishara et al. (2005), it has been
suggested to use artificial saliva for the storage medium, photopolymerization times ranging
from 20 to 40 seconds, and use cross-head speeds ranging from 0.5mm/min to 5.0mm/min

20
(Bishara et al., 2005; Finnema et al., 2010). These studies however failed to address the
important issue of load cell configuration and from the studies analyzed in Table 2.1 and from
Wiltshire, W.A. (2012) load cell configuration is possibly an important factor in shear bond
strength testing and should be further investigated (W. A. Wiltshire, 2012a).
The aim of the present study was not to find testing conditions that would produce the
highest bond strengths. For example, the goal of this study is not to decrease cross-head speed or
load cell configuration and thus achieve higher bond strengths. Instead we desire to find test
parameters that are most clinically relevant. Wiltshire W.A. (1994) conducted a study to compare
the shear bond strengths of mesh-backed orthodontic buttons bonded to human enamel using a
glass ionomer marketed for direct bonding in orthodontics, both in conjunction with, as well as
without, enamel etching and to compare the results with a no-mix composite bonding resin.
Results showed the no-mix bonding resin had significantly higher shear bond strength than the
glass ionomer cement (26.6±6 MPa vs. 4.4±1.8). Enamel etching with 37% orthophosphoric acid
increased the mean shear bond strength of the glass ionomer, however, not significantly
(5.5±1.8) (W. A. Wiltshire, 1994). Though this study had much lower bond strengths for glass
ionomer than resin, stronger bond strengths are not necessarily better, however, clinically
relevant bond strengths are most valuable (Kusy, 1994). The requirement is that the bond
strength is sufficient to keep the bracket bonded for the duration of orthodontic treatment, yet
weak enough to be able to be debonded at the end of treatment, or during a repositioning
appointment, without any macro or micro damage to the enamel at debond (W. A. Wiltshire,
2012a).

21
Table 2.1: Shear bond strength studies showing their test parameters used in present study Study Study Crosshead
Speed
Load
Cell
Storage
Medium
Curing
Time
Average SBS ± S.D.
(MPa)
Range Test Condition
(Pinto et al.,
2011)
SBS 0.5mm/min NS Distilled
Water
40 sec Transbond Resin:
12.70±3.35
NS Bracket to
human enamel
(Phan, Akyalcin, Wiltshire, &
Rody, 2011a)
SBS 0.5mm/min 1kN Saliva 20 sec 24hrs Unbleached: 18.0±4.4
10.13-28.95 Button to human enamel
(Ho ACS,
Bonstein T, Akyalcin S, et
al., 2010)
SBS 0.5mm/min 1kN De-
ionized Water
20 sec Tranbond Resin:
16.65±6.04
2.63-26.87 Button to
human enamel
(Maruo et al.,
2010)
SBS 0.5mm/min NS Distilled
Water
40 sec RMGIC: 3.60±0.98 NS Bracket to
human enamel
(Yuasa et al., 2010)
SBS 0.5mm/min NS Distilled Water
20 sec Transbond: 9.8 NS Bracket to human enamel
(Vilar et al.,
2009)
SBS 0.5mm/min NS Distilled
Water
20 sec Transbond:
11.22±1.68
NS Bracket to
bovine enamel
(Scougall
Vilchis et al., 2009)
SBS 0.5mm/min NS Distilled
Water
30 sec Transbond Resin:
19.0±6.7
7.6-29.2 Bracket to
human enamel
(Nemeth,
Wiltshire, &
Lavelle, 2006)
SBS 0.5mm/min 10kN Distilled
Water
30 sec Transbond Resin:
10.57±2.83
7.10-15.73 Button to
human enamel
(Mavropoulos et al., 2005)
SBS 0.5mm/min NS Saliva (24hours)
5-40 sec
Resin: 9.5±4.3 – 19.26.8
NS Bracket to bovine enamel
(Swanson et al.,
2004)
SBS 0.5mm/min NS Saliva
(24hours)
10-
40sec
Resin: 8.1±6.3-
18.6±5.8
NS Bracket to
human Enamel
(Bishara, Gordan,
VonWald, &
Jakobsen, 1999)
SBS 0.5mm/min NS Distilled Water
20 sec Transbond: 10.4±2.8
3.4-17.1 Bracket to human enamel
(W. A. Wiltshire, 1994)
SBS 0.5mm/min 20kN Distilled Water
NS Resin: 26.6± 6 GI: 5.5±1.8
16-31 Buttons to human enamel
(Summers, Kao,
Gilmore, Gunel,
& Ngan, 2004)
SBS 1mm/min NS Distilled
Water
40 sec Resin: 18.46±2.95 15.44-23.47 Bracket to
human enamel
(Abdelnaby & Al-Wakeel Eel,
2010)
SBS 2 mm/min NS Distilled Water
20 sec Transbond Resin: 11.2±3.1
NS Bracket to human enamel
(Halpern &
Rouleau, 2010a)
SBS 2 mm/min 5 kN Distilled
Water
40 sec Transbond: 7.24 NS Bracket to
human enamel
(Banerjee & Banerjee, 2011)
SBS 5.0mm/min NS Saliva 40 sec Transbond Resin: 14.12
NS Bracket to human enamel
(Bishara et al.,
2005)
SBS 0.5mm/min
5.0mm/min
NS Distilled
Water
20 sec Transbond Resin:
0.5mm/min: 12.2±4.0
5.0mm/min: 7.0±4.6
2.8-18.5 Bracket to
human enamel
NS= Not Stated
From Table 2.1 we can see that there are many similarities and yet many differences that
exist within bond strength testing study parameters. To compare each of the above studies is
difficult due to the different testing conditions. All of the studies included the crosshead speed of
the Universal Testing Machine, storage medium for teeth and curing time for the adhesives used,
however, very few studies included the load cell configuration. In fact, the studies which
included the load cell configuration were those conducted at the University of Manitoba,

22
Winnipeg, and from these a noticeable difference in bond strengths was observed. Comparing
the same adhesives, we can see that when increasing the load cell (1 vs. 5 vs. 10kN) the bond
strengths decrease (Ho et al., 2011; Phan, Akyalcin, Wiltshire, & Rody, 2011a)(Halpern &
Rouleau, 2010a). Generally, the SBS for crosshead speeds of 0.5mm/min tend to be higher than
a crosshead speed of 2-5mm/min (Table 2.1). Photopolymerization time does not show any trend
that allows us to make any conclusions regarding SBS’s, however, the range for curing times
usually varies between 20-40 seconds. Although most studies examined have used distilled water
as a storage medium and there is no difference in SBS’s, artificial saliva is the preferred storage
medium as suggested by the recent systematic review (Finnema et al., 2010). Furthermore, there
is an expert who has developed an unique recipe for artificial saliva at the University of
Manitoba, Department of Oral Biology (Dr. Colin Dawes) and this storage medium was used in
two previous studies at the University of Manitoba (McNeill, Wiltshire, Dawes, & Lavelle, 2001;
Phan, Akyalcin, Wiltshire, & Rody, 2011b).
Overall, the need for standardization in testing protocols is emphasized (table 2.1) to
obtain valuable interpretation and use of data generated by researchers. Standardization of test
protocols will lead to improved standards for orthodontic products and ultimately higher-quality
products for orthodontists and their patients and improved interpretation of data from benchside
to the clinical situations.

23
3. PURPOSE
Even with many of the variables accounted for, one has to determine whether the
mechanics of the testing itself may influence the results. Therefore the purpose of this study was
to determine the effect of changing the crosshead speed of the testing machine, the load cell
configuration (a lesser dimension load cell may be more clinically relevant), and the light-curing
time, on the shear bond strength of orthodontic brackets while standardizing other variables, such
as tooth type, adhesive system, brackets, and debonding time.

24
4. NULL HYPOTHESIS
1. There is no difference in mean shear bond strength values when changing the cross head
speed in orthodontic bonding.
2. There is no difference in mean shear bond strength values when changing the load cell
configuration in orthodontic bonding.
3. There is no difference in mean shear bond strength values when changing
photopolymerization time in orthodontic bonding.

25
5. MATERIALS AND METHODS
5.1 Materials used in the study
5.1.1 Transbond XT Light Cure Adhesive System
This system (Figure 5.1) is composed of primer, adhesive paste, and etching gel (3M
Unitek, Monrovia, CA). The adhesive paste is a composite resin and contains 10-20% wt
Bisphenol A diglycidylether methacrylate, 5-10% wt Bisphenol A bis (2-hydroxyethyl ether)
dimethacrylate (bis-EMA), 70-80% wt silane treated quartz and less than 2% silane treated silica.
The primer is an unfilled light cured resin and is made of Bis-GMA and Triethylene glycol
dimethacrylate (TEGDMA) in a 1:1 ratio, and the photoinitiator. The etching gel (Figure 5.2) is
composed of 35% phosphoric acid in water and amorphous silica (Material and Safety Data
Sheet: Transbond XT Light Cure Adhesive, 2008).
Figure 5.1: Transbond XT Light Cure Adhesive System
Figure 5.2: Transbond XT etching gel 35% phosphoric acid

26
5.1.2 Artificial Saliva
The artificial saliva contained KCl (1.04 g/L), NaH2PO4 (0.68 g/L), NaHCO3 (0.42 g/L),
CaCl2 (0.03 g/L), and MgCl2 (0.01 g/L). The pH of the artificial saliva was 6.95 and stored in an
incubator at 37°C (McNeill et al., 2001). The artificial saliva was made up by Dr. Colin Dawes at
the University of Manitoba, Department of Oral Biology.
5.1.3 Orthodontic Buttons
One hundred and sixty curved stainless steel lingual orthodontic buttons (#30-000-01,
GAC International, Central Islip, NY) were used with the diameter of 3.31mm (surface area of
approximately 8.60 mm2. The Zwick computer required the input of the surface area of the base
of button. With this information, and the load upon failure, it recorded the shear-peel bond
strength in MPa (megapascals). Consistency in diameter was achieved by measuring the
diameter of 20 buttons and then averaging the diameter.

27
Table 5.1 Shear Bond Material Manufacturer and Batch Number
Material Manufacturer Reference Number
Lot
Bonding Agents
Transbond XT 3M Unitek, Monrovia, California 712-035 CR3BW
Adhesive paste 712-035 N220837
Primer 712-034 CQ8C1
35% etching gel 712-039 9802 8KY
Bonding Materials
Curved stainless steel lingual buttons
GAC International, Central Islip, NY 30-000-01 A597
Loading apparatus gauge Federal: Miracle Movement 0.001” C81S, Providence, RI
Diamond saw Buehler, Lake Bluff, Ill
Copper Rings
Mini LED Blue Ray - Light curing unit
American Orthodontist 149220-003
Bosworth Fastray Bosworth, Illinois 0921375
Monomer liquid C13504
Polymer powder C14783
Debonding Materials
Universal Testing Machine Zwick GmBH, Ulm, Germany
Bencor Multi-T testing apparatus
Danville Engineering, San Ramon, CA
Chemicals
Chloramine-T trihydrate 98% Acros Organics, New Jersey A0236347
Other
Digital Caliper Mastercraft
Laser Level
Incubator 37°C Thelco/Canlab Model 2, Precision Scientific, Chicago, IL

28
5.2 Experimental Method
Prior to collecting results for the study, Research ethics board (REB) approval was
obtained from the Bannatyne campus University of Manitoba (Appendix 11.1).
5.2.1 Tooth Collection, Storage, and Preparation
One hundred and sixty lower first, second, and third molar teeth were collected from four
maxillofacial and oral surgery clinics in Winnipeg and were stored in 0.5% Chloramine T. The
criteria for tooth selection included characteristics like: intact buccal enamel, similar buccal
surface contour, not subjected to any pretreatment agents, no cracks, and no caries on any
surface. Prior to the bonding process, roots of all included teeth were removed using the diamond
saw.
5.2.2 Bonding Procedure
All 160 teeth were cleansed and polished with residue free, nonfluoridated, nonflavored
pumice (Preppies) in a pumice and water slurry for 10 seconds with a slow speed dental hand
piece and rubber prophylactic cup (Nemeth et al., 2006). Teeth were then etched with 37%
phosphoric acid gel for 30 seconds and then rinsed with water spray for 20s and dried with an
oil-free air spray for 20 seconds until the enamel appeared frosty. Adhesive primer Transbond
XT (3M Unitek, Monrovia, California) was applied on the enamel surface with a bond applicator
and cured for 20 seconds. The metal lingual buttons were then applied with Transbond XT
adhesive paste and placed on the etched enamel surface. A light finger pressure was applied by a
bracket holder pushing on the buttons until the buttons touched the surface of the enamel. Excess
adhesive was removed with a scaler and the samples were cured for 20 or 40 seconds, depending

29
on which group they belonged, with LED light. The teeth were stored in artificial saliva for 24
hours in a covered dish at 37C in an incubator before the tests.
5.2.3 Debonding Procedure
Twenty four hours after the bonding procedure, the teeth were embedded with
Bosworth Fastray Acrylic in cooper rings of 22.5 mm in diameter. The copper rings were applied
with Vaseline prior to acrylic placement. The laser level was positioned on a flat table projecting
a horizontal light on a white box. Each pre-vaselined ring was placed parallel to the horizontal
laser beam. Each tooth was held inside each ring with sticky wax so that a parallel relationship
with the base of the button and the laser beam was achieved (Figure 5.3 and Figure 5.4).
Bosworth Fastray Acrylic was mixed according to the manufacturer’s recommendation and was
poured into the rings. After ten minutes, the embedded teeth were removed and were mounted in
the Zwick Universal testing machine in a Bencor Multi-T Loading Apparatus (Danville
Engineering, San Ramon, CA) (Figure 5.6 and Figure 5.7). A knife-edged shearing blade was
used and when a direct sharp shearing force is applied to the enamel-adhesive-bracket interface
parallel to the height of contour in an occluso-gingival direction, the button debonds (Figure 5.7).
The apparatus was developed in 1989 by Dr. Cornel Driessen at the University of Pretoria, South
Africa, and the first article was published in 1994 using this device for orthodontic bond strength
testing (W. A. Wiltshire, 1994). The speed of the crosshead was set at 0.5 mm/min and the shear
bond strength was measured using a 1KN load cell. The shear bond strength values were
recorded by the computer. The same debonding procedures were performed for each of the
groups outlined in Table 5-1. In order to change the cross-head speed, the default was changed in
the computer and the load was changed by removing the 1kN load cell from the machine and
30
attaching the 10kN load cell. Once the load cell was changed the testing machine was re-
calibrated to the new load cell.
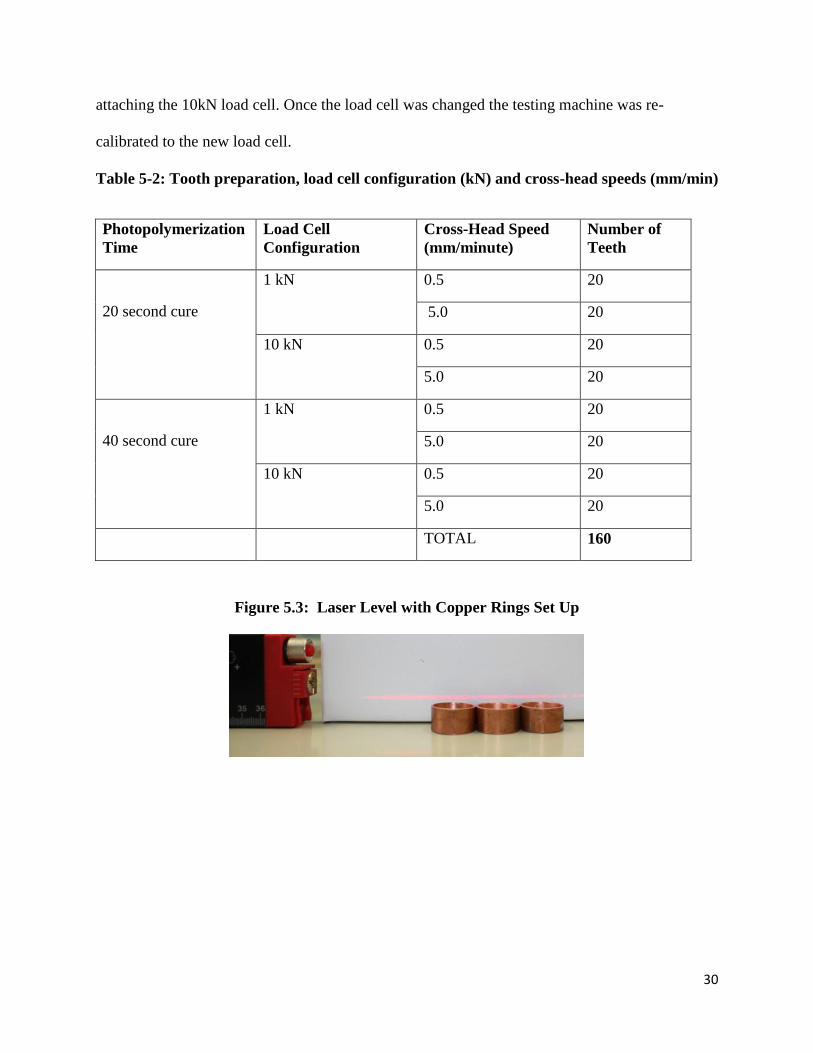
Table 5-2: Tooth preparation, load cell configuration (kN) and cross-head speeds (mm/min)
Photopolymerization
Time
Load Cell
Configuration
Cross-Head Speed
(mm/minute)
Number of
Teeth
20 second cure
1 kN 0.5 20
5.0 20
10 kN 0.5 20
5.0 20
40 second cure
1 kN 0.5 20
5.0 20
10 kN 0.5 20
5.0 20
TOTAL 160
Figure 5.3: Laser Level with Copper Rings Set Up

31
Figure 5.4: Cut Tooth Held by Wax in Copper Ring before Acrylic Placement
Figure 5.5: Bonded Tooth Embedded in Acrylic Mounted in the Zwick Universal Testing
Machine
Figure 5.6: Zwick Universal Testing Machine

32
Figure 5.7: Bencor Multi-T Loading Apparatus with the knife-edged shearing blade in
position prior to performing the debond test
5.2.4 Statistical Analysis of Data
All statistical analyses were performed with the Statistical Analysis Software (SAS 9.2
for Windows 10.0.1, SAS Institute Inc., Cary, NC, USA). Descriptive statistics, including the
mean, standard deviation, and minimum and maximum values and coefficients of variation were
calculated for the groups of teeth tested. Comparisons of means of shear bond strength values
were done with Students t-tests. Multiple regression analysis for SBS was also performed.
Significance was predetermined at p≤0.05.

33
6. RESULTS
6.1 Shear Bond Strengths after 24 hours
The descriptive statistics for each of the test conditions are presented in Table 6.1.
Observation and interpretation of the minimum bond strengths, provide clinical meaning to the
bond strengths measured during in vitro studies. Reynolds (1975) first recommended a
minimum value of 6-8 MPa (Reynolds, 1975). However, since then, there have been many
advances in materials, computer technology and testing systems. Recently, Wiltshire & Noble
(2010) recommended that the minimal reliable clinical bond strength should be at least 3-4 MPa.
They decided on this value when evaluating clinical studies in vivo on glass ionomers and
relating the clinical studies to in vitro studies (W. A. Wiltshire & Noble, 2010).
The coefficient of variation was also calculated and presented with the data (Table 6.1).
The goal for bonding studies is to achieve a coefficient of variation (standard deviation/mean) in
the range of 20-30% (Powers et al., 1997) or even less, if possible (W. A. Wiltshire, 2012b).
Results show that all the measured mean bond strengths were above the minimally accepted
magnitudes (W. A. Wiltshire & Noble, 2010) and the coefficients of variation were within or
close to the acceptable range (Powers et al., 1997).

34
Table 6.1: Descriptive data of shear bond strengths
Photo-
polymerization
Time (s)
Load Cell
Configuration
(kN)
Crosshead
Speed
(mm/min)
Sample
Size
(N)
Mean
(MPa)
Std
Dv
Min
(MPa)
Max
(MPa)
Δ
max-
min
Coefficient
of
Variation
(%)
20
1 0.5 20 23.51 3.36 17.14 30.88 13.74 14.29
5.0 20 21.88 3.96 14.84 28.84 14.00 18.10
10 0.5 20 14.32 2.31 9.09 17.89 8.8 16.13
5.0 20 12.07 3.42 5.97 19.32 13.35 28.33
40
1 0.5 20 22.62 3.01 16.69 29.52 12.83 13.31
5.0 20 20.01 3.13 14.23 24.92 10.69 15.64
10 0.5 20 15.05 3.08 9.57 21.14 11.57 20.47
5.0 20 14.41 4.51 6.28 18.85 12.57 31.30
Judging from Table 6.1 it is evident that with a 1kN load cell configuration, irrespective
of photopolymerization time or crosshead speed, the average shear bond strength was in the
same order of magnitude (between 20.01MPa and 23.51 MPa) (Refer to table 6.4 for further
information). Similarly, judging from table 6.1 it is also evident that with a 10kN load cell
configuration, irrespective of photopolymerization time, the average shear bond strength was in
the same order of magnitude (between 12.1 MPa and 15.1 MPa) (Refer to Table 6.4 for further
information).
Table 6.1 also shows that the minimum acceptable SBS values were achieved with a 10
kN load cell at 20 sec and 40 sec photopolymerization times and 0.5 and 5.0 mm/min crosshead
speeds (between 5.97 MPa and 9.57 MPa).

35
On the other hand, the highest maximum SBS’s were recorded in the entire test range
with a 1 kN load cell configuration at 20 sec and 40sec photopolymerization times and 0.5 and
5.0 mm/min crosshead speeds (between 24.92 and 30.88 MPa)(Table 6.1).
The coefficient of variation showed that for the 1kN load cell configuration and
0.5mm/min crosshead speeds, the coefficients of variation were the lowest (14.29% and
13.31%). The results under these conditions were the most accurate and had the least spread of
values of SBS’s around the mean value. In contrast, a load cell configuration of 10kN and
5mm/min crosshead speed resulted in higher coefficient of variations (28.33% and 31.30%) and
less accurate representation of overall SBS values.
6.2 Statistical Analysis of subgroups
T-test analysis was performed to determine whether there were significant differences
between the tested groups. All significant differences were pre-determined at a probability value
of 0.05 or less.
In the photopolymerization subgroup, the overall mean shear bond strengths were 17.95 ±
3.26 MPa and 18.02 ± 3.43 MPa for the 20 sec and 40 sec, respectively. While, the overall mean
shear bond strengths were higher for the 40 sec versus the 20 sec curing time group, there was no
statistically significant difference (p > 0.05) (Table 6.2). Although, the 40 sec test condition
showed higher shear bond strengths than the 20 sec group overall, it is clear that when the load
cell configuration was 1kN, the 20 sec curing groups showed higher shear bond strengths (23.51
vs. 22.62 and 21.88 vs. 20.01). Similarily, when the load cell configuration was 10kN the 40 sec
curing groups showed higher bond strengths (14.32 vs. 15.01 MPa and 12.07vs. 14.41MPa)
(Table 6.2).

36
Table 6.2: Statistical difference between 20 second vs. 40 second photopolymerization time
Load Cell (kN) and
Crosshead Speed
(mm/min)
Mean ± SD (MPa)
p-value Time = 20 sec Time = 40 sec
Load = 1, Speed = 0.5 23.51±3.36 22.62±3.01 0.38
Load = 1, Speed = 5.0 21.88±3.96 20.01±3.13 0.11
Load = 10, Speed = 0.5 14.32±2.31 15.05±3.08 0.40
Load = 10, Speed = 5.0 12.07±3.42 14.41±4.51 0.07
Average 17.95 ± 3.26 18.02 ± 3.43 0.88
Meanwhile, in the crosshead speed subgroups, the overall mean SBS were 18.88 ± 2.94
MPa and 17.09 ± 3.76 MPa for 0.5mm/min and 5mm/min, respectively (Table 6.3). Overall,
there were no significant differences in crosshead speeds (0.5mm/min vs. 5mm/min) on shear
bond strength (p>0.05). When comparing the crosshead speeds (0.5mm/min vs. 5.0mm/min) the
mean shear bond strengths were higher for the 0.5mm/min subgroup, however, significant
differences (p<0.05) in crosshead speeds were only found at (time=20, load 10) and (time=40,
load=1)(Table 6.3). Evaluation of the confidence intervals (CI) of mean differences proved that
there was no significance. Mean differences of (time=20, load=10) = 2.2 with CI (0.4-4.1).
Mean differences of (time=40, load=1) = 2.6 with CI (0.6-4.6).
Table 6.3: Statistical differences between crosshead speed 0.5mm/min and 5.0mm/min
Photopolymerization
time (sec) and Load
Cell (kN)
Mean ± SD (MPa)
p-value Speed = 0.5mm/min Speed = 5.0mm/min
Time = 20, Load = 1 23.51±3.36 21.88±3.96 0.16
Time = 20, Load = 10 14.32±2.31 12.07±3.42 0.02*
Time = 40, Load = 1 22.62±3.01 20.01±3.13 0.01*
Time = 40, Load = 10 15.05±3.08 14.41±4.51 0.60
Average 18.88 ± 2.94 17.09 ± 3.76 0.12
*p<0.05
In the load cell configuration subgroup, the overall mean shear bond strengths were 22.05
± 3.37 MPa and 13.96 ± 3.33 for the 1kN load cell and 10kN load cell groups. The load cell

37
configuration (1kN vs. 10kN) showed highly statistically significant differences in SBS’s when
considering crosshead speed and photopolymerization time (p<0.05) (Table 6.4).
Table 6.4: Statistical differences between load cell configuration 1kN vs. 10kN
Photopolymerization
Time (sec) and
Crosshead Speed
Mean ± SD
p-value Load=1kN Load=10kN
Time=20, Speed=0.5 23.51±3.36 14.32±2.31 *
Time=20, Speed=5 21.88±3.96 12.07±3.42 *
Time=40, Speed=0.5 22.62±3.01 15.05±3.08 *
Time=40, Speed=5 20.01±3.13 14.41±4.51 *
Average 22.05 ± 3.37 13.96 ± 3.33 *
*all values highly significant
Further analysis of the data was attempted using a multiple regression model for SBS,
however, this failed to demonstrate any further relationships between the data, yet was able to
confirm the findings from the stratified method of statistical analysis.

38
7. DISCUSSION
This study evaluated the effect of changing the crosshead speed of the testing machine,
the load cell configuration, and the light curing time on the shear bond strength of orthodontic
brackets while controlling other variables, such as storage medium, tooth type, adhesive system,
brackets, and debonding time. Crosshead speed and photopolymerization time were selected
based on a systematic review conducted by Finnema (2010) and load cell configuration was
selected since the institution where the study was conducted had a 1kN load cell and 10kN load
cell and when the two were used in different studies (Ho ACS, Bonstein T, Akyalcin S, et al.,
2010; Nemeth et al., 2006; Phan, Akyalcin, Wiltshire, & Rody, 2011b) lower bond strengths
were achieved with the 10kN load cell vs. 1kN. The goal for the study was not to achieve the
highest bond strengths and the variables that are most important, but, instead find the variables
that were most clinically relevant and then test them against each other (W. A. Wiltshire, 2012a).
Testing the most clinically relevant variables and determining the most optimal test conditions
would allow us to better evaluate orthodontic shear bond strength studies and standardize testing
conditions (Fox et al., 1994; W. A. Wiltshire, 2012b). Although, bond strength testing has been
conducted for over 40 years, no standardization of testing exists. The literature regarding test
condition standardization is limited and typically testing follows manufacturer’s
recommendations and methodologies used in previous studies. Fox (1994) suggested that
researchers should adopt a standard methodological approach that includes tooth type, surface
enamel preparation, storage medium, testing equipment and technique, sample size, statistical
analysis and bond strength units, however, this study focused on clinically relevant variables
(Fox et al., 1994).

39
7.1 Shear Bond Strength
Overall, the results from this study found that photopolymerization time and crosshead
speeds did not affect orthodontic shearbond strength, however, load cell configuration was an
important factor of in-vitro bond strength testing.
7.2 Photopolymerization Time
Findings indicated that photopolymerization time did not affect the overall shear bond
strength. When the curing time was 20 sec the average shear bond strength was lower than the 40
sec subgroup (17.95 ± 3.26 MPa and 18.02 ± 3.43 MPa), however, this was not statistically
significant (p > 0.05). When analyzing each subgroup separately there was still no statistically
significant relationship between 20 and 40 sec curing times. However, mean shear bond
strengths were higher when the load cell was 1kN with speeds of 0.5mm/min and 5.0mm/min for
20 sec vs. 40 sec curing times (Table 6.2). On the other hand when a 10kN load cell was used
SBS’s were higher for 40 sec vs. 20 sec curing times at both speeds of 0.5mm/min and
5.0mm/min. Although, these relationships were not significant they do show that
photopolymerization times variably affect orthodontic SBS’s and perhaps are not a test factor for
times between those ranges. Finnema et al. (2010) had found that photopolymerization times
significantly affected in vitro bond strength and that each additional second of
photopolymerization increased bond strength by 0.077 MPa. In our study, for test conditions at
1kN for both crosshead speeds (0.5 and 5.0 mm/min) this was not found to be the case, however,
with a 10 kN load cell, this was true. On average, for the 10kN subgroup each additional second
of curing increased the SBS’s by 0.076 MPa and was almost identical to the value in the
systematic review. Although, the systematic review found increasing curing times resulted in
40
increased SBS’s, they were unable to suggest the most optimal time for polymerizing the
adhesive (Finnema et al., 2010). Swanson (2004) conducted a study comparing different light
units (LED and Halogen) while standardizing other test conditions similar to our study. The
results from their study found statistically significant differences between 10 sec vs. 40 sec
curing times, where 40 sec curing times had higher shear bond strengths (Swanson et al., 2004).
Similarly, Mavropoulos (2005) found a curing time of 10 sec was sufficient to bond metallic
brackets to incisors using intensive LED curing units, however, 40 sec of curing resulted in
higher bond strengths (Mavropoulos et al., 2005). Mauro et al. (2010) assessed the influence of
etching and light-curing time on the shear bond strength (SBS) of a resin-modified glass ionomer
cement (RMGIC) upon debonding of orthodontic brackets. They found RMGIC SBS enhanced
with 37% phosphoric acid etching and 40 sec light-curing time, but this did not occur when the
light-curing time was increased, therefore light-curing time did not affect SBS (Maruo et al.,
2010).
Reynolds (1975) recommended minimum shear bond strength values between 6-8 MPa
and all 4 experimental subgroups produced bond strengths that appear to be able to withstand
normal orthodontic forces (Reynolds, 1975). Results of this study also demonstrated higher
bond strengths as curing time was increased. This can easily be explained by the higher
conversion rate of monomer to polymer at increased polymerization times (Mavropoulos et al.,
2005). The data of this in vitro study should be compared only with groups in the study, and the
laboratory findings should not be extrapolated to the clinical situation. Studies appear to indicate
that mean bond strengths recorded in vivo following comprehensive orthodontic treatment are
significantly lower than bond strengths recorded in vitro (Pickett, Sadowsky, Jacobson, &

41
Lacefield, 2001). However, in vitro studies are an important first step prior to confirming any
clinical situation.
7.3 Crosshead Speed
The findings of this study indicated that variations in the crosshead speed of the testing
machine can influence the test results; however, this was not significant overall. More
specifically, by slowing the crosshead speed of the Zwick machine during shear bond testing of
the orthodontic brackets from 5.0mm/min to 0.5mm/min, the mean shear bond strength increased
from 17.09 to 18.88 MPa, an increase of only 9.4%. In other words crosshead speed did not
affect the shear bond strength. Klocke et al. (2005) investigated the influence of cross-head
speed on debonding force of orthodontic brackets and selected speed of 0.1mm/min, 0.5mm/min,
1mm/min and 5.0mm/min. Their results, similar to those from the present study, showed cross-
head speed variation between 0.1 and 5 mm/min did not seem to influence debonding force
measurements of brackets bonded to enamel with a composite adhesive (Klocke & Kahl-Nieke,
2005a). Bishara et al. (2005) conducted a similar study where they tested the effect of changing
crosshead speed from 5.0 to 0.5mm/min and their results did not support the present findings.
Their study found that changing the crosshead speed from 5.0 to 0.5 mm/min significantly
increased the shear bond strength from 7.0 to 12.2 MPa, an increase of 57%. Furthermore, the
ratio between the mean standard deviation for 5.0mm/min testing speed was 66%, whereas for
the slower 0.5mm/min testing speed, it was 33%. In other words, there was an increase in the
shear bond strength values and a decrease in relative variation (Bishara et al., 2005). Eliades et
al. (2004) examined the effect of crosshead speed on the bond strength of brackets bonded to
enamel. Crosshead speeds of a standard 1 mm/min and a fast 200 mm/min, which better
approximates the actual jaw velocity during chewing, were selected. The results indicated that an

42
increased crosshead speed resulted in decreased shear bond strength. Furthermore, they stated
that this was probably due to the induction of a stiff body response and elimination of the
visoelastic properties of the resin (Eliades, Katsavrias, Zinelis, & Eliades, 2004). Finnema et al
(2010) reported in her systematic review that an increase in crosshead speed of 1mm/min yielded
an increase in average bond strength of 1.3 MPa. From the studies presented in Table 2.1 it is
evident that crosshead speeds of 0.5mm/min (8.1-26.6 MPa) typically produced higher shear
bond strengths than those at higher crosshead speeds (7.0-18.46 MPa) (Refer to Table 2.1 in
introduction chapter). Also, from the studies in Table 2.1 we can see that most studies use
0.5mm/min as their crosshead speeds since this produces more consistent results. The
consistency of results was evident in our study if you examine the coefficients of variation. From
Table 6.1 we can see at 0.5mm/min there was less variation of the shear bond strength values
(13.31-20.47%) compared to 5.0mm/min (15.64-31.30%). This shows that our results at
0.5mm/min are more accurate and there is more confidence regarding the shear bond strength
values.
An interesting issue raised by Eliades (2004) was regarding the clinical relevance of the
reported bond strength values and how they come in to question since the standard crosshead
speeds cited in the literature are irrelevant to the velocity of tooth occlusion during chewing.
Although the reported crosshead speeds range from 0.1mm/min-200mm/min, it must be noted
that these rates are many orders of magnitude lower than the actual masticatory velocity in
humans. A complete masticatory cycle (sequential opening and closing) of a healthy individual
lasts 800ms, with the closing movement having duration of less than 400 ms, which translates to
over 2000mm/min and this value is much higher than the standard crosshead speed used in bond
strength testing. However, using crosshead speeds observed in human chewing cycles is not

43
practical in laboratory testing since testing is restricted to the upper limit of the effective
crosshead speed of the testing apparatus (Eliades et al., 2004). The present study aims to find
test conditions that are clinically relevant; however, when standardizing crosshead speed in the
laboratory we demonstrated this is not relevant. That said, it is difficult, if not impossible to
reproduce and replicate the actual clinical situation in vitro. Seldom, if ever, for example, is a
sustained, perfect shear force produced on an orthodontic bracket and furthermore, replication of
the human chewing cycle has not been effectively mimicked intra-orally (W. A. Wiltshire,
2012a).
7.1.3 Load Cell Configuration
The third experimental condition shown to significantly affect outcomes of bond strength
testing was load cell configuration. An increase in load cell configuration from 1kN to 10kN
resulted in significantly lower bond strengths (22.05 vs. 13.96MPa) (p<0.05). Even for all 4
subgroups tested, increases in load cell configuration resulted in significantly lower bond
strengths (p<0.01). To date no study has been conducted that supports or refutes the findings of
this test condition. In fact, reporting of the load cell configuration is limited (Halpern & Rouleau,
2010c; Ho ACS, Bonstein T, Akyalcin S, et al., 2010; Phan, Akyalcin, Wiltshire, & Rody,
2011a; W. A. Wiltshire, 1994) and has not been considered a factor in the majority of the bond
strength testing literature. As mentioned previously, Wiltshire (2012) felt this was an important
test factor since the Department of Orthodontics, University of Manitoba, Canada, had two
different load cells (1kN and 10kN) that were producing different results under similar test
conditions. Ho et al. (2010) and Phan (2011) conducted studies using similar test conditions as
the present study (1kN load cell, 0.05mm/min crosshead speed, 20sec curing time) and the
results showed shear bond strengths of 16.7 and 18.0 MPa, whereas our study had a bond

44
strength of 23.51MPa (Ho ACS, Bonstein T, Akyalcin S, et al., 2010; Phan, Akyalcin, Wiltshire,
& Rody, 2011a). Comparing these studies with Nemeth (2006) who used a 10kN load cell,
0.05mm/min crosshead speed and 30sec curing time and found a shear bond strength of
10.6Mpa, we can note that the shear bond strengths are lower when the load cell configuration is
increased (Nemeth et al., 2006). Similarly, Halpern (2010) used a 5kN load cell, with a
2mm/min crosshead speed and 40 second curing time and found an even lower bond strength
(7.24MPa) than the above studies at 1kN load cell configuration(Halpern & Rouleau, 2010b). On
the other hand, when Wiltshire (1994) used a 20kN load cell with a 0.05mm/min crosshead
speed and 40sec curing time, the shear bond strength was much higher (resin: 26.6MPa) than all
the studies mentioned above. However, it must be noted that the same resin (Tranbond XT, 3M
Unitek, Monrovia, CA) was not used and could be the reason for the major difference in shear
bond strengths (W. A. Wiltshire, 1994). With respect to occlusal forces of mastication generated
in the human, one might argue in favor of higher load cell usage. On the flip side, the lighter load
cell may improve the test sensitivity.
The results of the study also found that the coefficients of variation, a measure of the
variability about the mean, were highest for the 10kN load cell and 5.0mm/min crosshead speed
(28.33 and 31.30%) and this was above the recommended 20-25% (W. A. Wiltshire, 2012b).
Furthermore, the lowest coefficient of variation was achieved when a more sensitive 1kN load
and slower crosshead speed of 0.05mm/min were used (14.29 and 13.31%). This demonstrates
that when using a 1kN load cell the results are more consistent and uniform than for a 10kN load
cell. Lighter load cells tend to produce higher bond strengths and higher bond strengths are what
manufacturers may be interested in, in order to market their products. If adhesives display higher
bond strengths, the clinician may assume that this results in fewer debonds and may be more

45
inclined to purchasing that product. In order to be more stringent it would make more sense to
use a heavier load cell which would result in lower bond strengths, but may be a better indicator
of the clinical applicability of a product. Independent researchers may be more in favor of using
a higher load cell configuration and manufacturers may use a lower load cell configuration, but,
overall, from this study we suggest to use both 1 and 10 kN load cells. Results would be more
uniform with a 1kN load cell but a 10kN load cell would produce lower values.
The major finding of this study shows that load cell configuration is an important test
parameter that rarely appears in the literature. In order to adequately compare products this
parameter needs to be stated otherwise studies cannot be accurately evaluated and clinicians may
have higher expectations of an orthodontic adhesive.
7.5 Limitations of the Study
To our knowledge, this is the first investigation on the influence of load cell
configuration in orthodontic bond strength testing. In contrast, other studies have been conducted
on crosshead speeds and photopolymerization time (Banerjee & Banerjee, 2011; Bishara et al.,
2005; Eliades, Eliades, Bradley, & Watts, 2000; Eliades et al., 2004; Klocke & Kahl-Nieke,
2005a; Maruo et al., 2010; Mavropoulos et al., 2005; Summers et al., 2004; Swanson et al.,
2004). That being said, during shear bond strength testing cross head speed and load cell may
influence the adhesive interface in a similar way. Higher crosshead speeds can be similar to
heavier load cells and lower cross head speeds may act like lighter load cells. Assuming the two
parameters behave similarly, Hara et al. (2001) found that cross-head speeds of 0.50 and
0.75mm/min produce more adhesive failure and those are preferable in SBS testing. They further
stated that relatively high cross-head speeds may develop abnormal stress distributions during

46
the shear testing, including cohesive failures in the tooth substrate or in the resin-based
composite which would influence the bond strength values achieved (Hara, Pimenta, &
Rodrigues, 2001). For adhesive failures elastic behavior of the adhesive resin might increase the
shear bond strength and slower crosshead speeds may allow an extended recovery period during
which stress and strain are compensated for by the elasticity. At lower speeds the resin behaves
like a viscous material, deforming more as pressure is applied, where at higher impact velocity
this phenomenon plays a minor role, resulting in lower shear bond strengths (Lindemuth, J.S.
2000). Overall, slower crosshead speeds and lighter load cells may increase the shear bond
strength values and higher crosshead speeds and heavier load cells may decrease the shear bond
strength values. This study was not interested in determining the Adhesive Remnant Index (ARI)
or the fracture rate, however, we did not observe any enamel fractures and all debonds were
adhesive or cohesive.
The present study aimed to ensure the debonding force location was at the
enamel/adhesive interface and not on the bracket. This was done using a Bencor Multi-T
Loading Apparatus with the knife-edged shearing blade. The blade was in a perpendicular
position prior to performing the debond test. Although care was taken to ensure the location was
consistent, this could have varied. Debonding force location can have a significant influence on
shear bond strength measurements and bond failure pattern. Mean shear bond strengths are
higher when the force is applied closer to the tooth adhesive interface than further away (Klocke
& Kahl-Nieke, 2005b).

47
8. CONCLUSIONS
Based on this in vitro study on the SBS of when changing test parameters of
photopolymerization time, crosshead speed, and load cell configuration, we can conclude that:
1. Photopolymerization time does not affect orthodontic SBS testing
2. Crosshead speed does not affect orthodontic SBS testing
3. Load cell configuration does affect orthodontic SBS testing, where the more sensitive
1kN load cell configuration produced higher bond strengths

48
9. RECOMMENDATIONS
Future studies on orthodontic bond strength testing should state the load cell used.
1 kN and 10kN load cells used in together will be the most accurate evaluation method.
Bond strength testing of new products is an important method for the clinician to estimate
the efficacy of new adhesives and clinicians should overview the results of such studies
prior to product selection.
Independent and unbiased University-based studies are urged when new products enter
the marketplace.

49
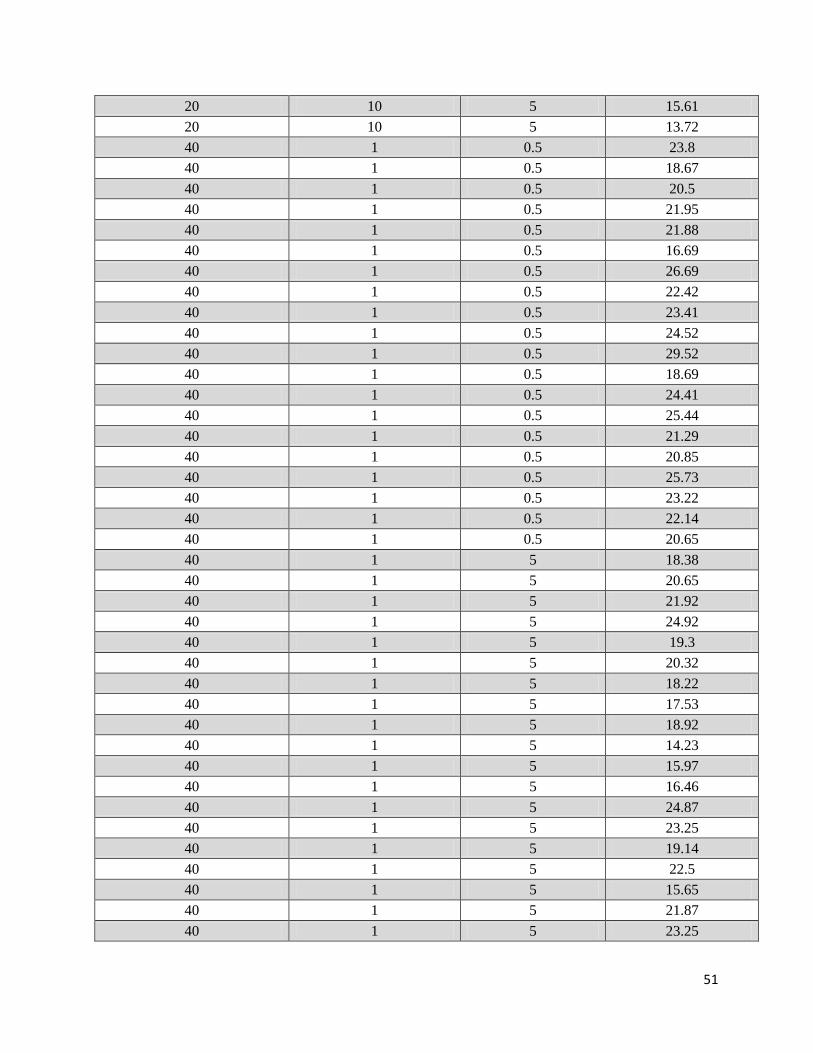
10. RAW DATA
Table 10-1: Raw data for 24 hour shear bond strengths
Photopolymertization time Load Cell Configuration Cross-Head Speed Shear Bond Strength
20 1 0.5 23.91
20 1 0.5 18.72
20 1 0.5 26.22
20 1 0.5 24.81
20 1 0.5 30.88
20 1 0.5 24.02
20 1 0.5 17.14
20 1 0.5 22.29
20 1 0.5 18.71
20 1 0.5 21.52
20 1 0.5 26.31
20 1 0.5 25.37
20 1 0.5 28.11
20 1 0.5 24.18
20 1 0.5 20.73
20 1 0.5 25.32
20 1 0.5 23.58
20 1 0.5 23.63
20 1 0.5 24.88
20 1 0.5 19.94
20 1 5 21.22
20 1 5 23.28
20 1 5 28.84
20 1 5 16.67
20 1 5 12.34
20 1 5 24.28
20 1 5 22.76
20 1 5 25.21
20 1 5 20.2
20 1 5 21.38
20 1 5 24.46
20 1 5 27.61
20 1 5 14.84
20 1 5 18.91
20 1 5 23.66
20 1 5 23.04
20 1 5 22.87

50
20 1 5 21.7
20 1 5 20.64
20 1 5 23.72
20 10 0.5 15.04
20 10 0.5 11.5
20 10 0.5 15.8
20 10 0.5 15.41
20 10 0.5 13.32
20 10 0.5 10.7
20 10 0.5 13.27
20 10 0.5 17.49
20 10 0.5 10.78
20 10 0.5 15.2
20 10 0.5 16.13
20 10 0.5 14.79
20 10 0.5 17.89
20 10 0.5 9.09
20 10 0.5 16.32
20 10 0.5 15.4
20 10 0.5 13.18
20 10 0.5 15.32
20 10 0.5 15.09
20 10 0.5 14.72
20 10 5 13.1
20 10 5 9.75
20 10 5 19.32
20 10 5 7.37
20 10 5 5.97
20 10 5 10.64
20 10 5 6.21
20 10 5 8.28
20 10 5 11.31
20 10 5 10.64
20 10 5 15.83
20 10 5 14.34
20 10 5 13.88
20 10 5 13.27
20 10 5 11.49
20 10 5 11.86
20 10 5 13.99
20 10 5 14.91
51
20 10 5 15.61
20 10 5 13.72
40 1 0.5 23.8
40 1 0.5 18.67
40 1 0.5 20.5
40 1 0.5 21.95
40 1 0.5 21.88
40 1 0.5 16.69
40 1 0.5 26.69
40 1 0.5 22.42
40 1 0.5 23.41
40 1 0.5 24.52
40 1 0.5 29.52
40 1 0.5 18.69
40 1 0.5 24.41
40 1 0.5 25.44
40 1 0.5 21.29
40 1 0.5 20.85
40 1 0.5 25.73
40 1 0.5 23.22
40 1 0.5 22.14
40 1 0.5 20.65
40 1 5 18.38
40 1 5 20.65
40 1 5 21.92
40 1 5 24.92
40 1 5 19.3
40 1 5 20.32
40 1 5 18.22
40 1 5 17.53
40 1 5 18.92
40 1 5 14.23
40 1 5 15.97
40 1 5 16.46
40 1 5 24.87
40 1 5 23.25
40 1 5 19.14
40 1 5 22.5
40 1 5 15.65
40 1 5 21.87
40 1 5 23.25

52
40 1 5 22.84
40 10 0.5 21.14
40 10 0.5 20.73
40 10 0.5 18.11
40 10 0.5 17.22
40 10 0.5 10.81
40 10 0.5 18.97
40 10 0.5 13.46
40 10 0.5 15.34
40 10 0.5 14.92
40 10 0.5 17.5
40 10 0.5 9.57
40 10 0.5 12.34
40 10 0.5 12.99
40 10 0.5 15.02
40 10 0.5 14.76
40 10 0.5 13.75
40 10 0.5 12.79
40 10 0.5 13.27
40 10 0.5 15.02
40 10 0.5 13.38
40 10 5 15.46
40 10 5 25.16
40 10 5 17.23
40 10 5 14.43
40 10 5 18.85
40 10 5 20.29
40 10 5 13.73
40 10 5 22.13
40 10 5 11.56
40 10 5 12.97
40 10 5 12.48
40 10 5 11.76
40 10 5 13.79
40 10 5 12.52
40 10 5 12.56
40 10 5 6.28
40 10 5 9.16
40 10 5 15.75
40 10 5 11.79
40 10 5 10.38

53
11. REFERENCES
Abdelnaby, Y. L., & Al-Wakeel Eel, S. (2010). Effect of early orthodontic force on shear bond
strength of orthodontic brackets bonded with different adhesive systems. American Journal
of Orthodontics and Dentofacial Orthopedics : Official Publication of the American
Association of Orthodontists, its Constituent Societies, and the American Board of
Orthodontics, 138(2), 208-214. doi:10.1016/j.ajodo.2008.09.034
Banerjee, S., & Banerjee, R. (2011). A comparative evaluation of the shear bond strength of five
different orthodontic bonding agents polymerized using halogen and light-emitting diode
curing lights: An in vitro investigation. Indian Journal of Dental Research : Official
Publication of Indian Society for Dental Research, 22(5), 731-732. doi:10.4103/0970-
9290.93469
Bishara, S. E., Gordan, V. V., VonWald, L., & Jakobsen, J. R. (1999). Shear bond strength of
composite, glass ionomer, and acidic primer adhesive systems. American Journal of
Orthodontics and Dentofacial Orthopedics : Official Publication of the American
Association of Orthodontists, its Constituent Societies, and the American Board of
Orthodontics, 115(1), 24-28.
Bishara, S. E., Soliman, M., Laffoon, J., & Warren, J. J. (2005). Effect of changing a test
parameter on the shear bond strength of orthodontic brackets. The Angle Orthodontist,
75(5), 832-835. doi:2
Bowen, R. L. (1956). Use of epoxy resins in restorative materials. Journal of Dental Research,
35(3), 360-369.
Buonocore, M. G. (1955). A simple method of increasing the adhesion of acrylic filling materials
to enamel surfaces. Journal of Dental Research, 34(6), 849-853.
Eliades, T., & Brantley, W. A. (2000). The inappropriateness of conventional orthodontic bond
strength assessment protocols. European Journal of Orthodontics, 22(1), 13-23.
Eliades, T., Eliades, G., Bradley, T. G., & Watts, D. C. (2000). Degree of cure of orthodontic
adhesives with various polymerization initiation modes. European Journal of Orthodontics,
22(4), 395-399.
Eliades, T., Katsavrias, E., Zinelis, S., & Eliades, G. (2004). Effect of loading rate on bond
strength. Journal of Orofacial Orthopedics = Fortschritte Der Kieferorthopadie :
Organ/official Journal Deutsche Gesellschaft Fur Kieferorthopadie, 65(4), 336-342.
doi:10.1007/s00056-004-0327-x
Finnema, K. J., Ozcan, M., Post, W. J., Ren, Y., & Dijkstra, P. U. (2010). In-vitro orthodontic
bond strength testing: A systematic review and meta-analysis. American Journal of
Orthodontics and Dentofacial Orthopedics : Official Publication of the American
54
Association of Orthodontists, its Constituent Societies, and the American Board of
Orthodontics, 137(5), 615-622.e3. doi:10.1016/j.ajodo.2009.12.021
Fox, N. A., McCabe, J. F., & Buckley, J. G. (1994). A critique of bond strength testing in
orthodontics. British Journal of Orthodontics, 21(1), 33-43.
Halpern, R. M., & Rouleau, T. (2010a). The effect of air abrasion preparation on the shear bond
strength of an orthodontic bracket bonded to enamel. European Journal of Orthodontics,
32(2), 224-227. doi:10.1093/ejo/cjp080
Hara, A. T., Pimenta, L. A., & Rodrigues, A. L.,Jr. (2001). Influence of cross-head speed on
resin-dentin shear bond strength. Dental Materials : Official Publication of the Academy of
Dental Materials, 17(2), 165-169.
Ho ACS, Bonstein T, Akyalcin S, et al. (2010). Shear bond strengths of two new self-etching
primers. (Unpublished MSc. Ortho.). University of Manitoba, Winnipeg.
Ho, A. C., Akyalcin, S., Bonstein, T., & Wiltshire, W. A. (2011). In vitro shearing force testing
of two seventh generation self-etching primers. Journal of Orthodontics, 38(4), 269-274.
doi:10.1179/14653121141623
Instron® Products: By Product Type, Electromechanical Systems. (2012). Retrieved May 14th,
2012, from http://www.instron.us/wa/product/Universal-Electromechanical-Systems.aspx
Katona, T. R. (1994). The effects of load location and misalignment on shear/peel testing of
direct bonded orthodontic brackets--a finite element model. American Journal of
Orthodontics and Dentofacial Orthopedics : Official Publication of the American
Association of Orthodontists, its Constituent Societies, and the American Board of
Orthodontics, 106(4), 395-402.
Katona, T. R. (1997). Stresses developed during clinical debonding of stainless steel orthodontic
brackets. The Angle Orthodontist, 67(1), 39-46. doi:2
Katona, T. R., & Long, R. W. (2006). Effect of loading mode on bond strength of orthodontic
brackets bonded with 2 systems. American Journal of Orthodontics and Dentofacial
Orthopedics, 129(1), 60-64. doi:10.1016/j.ajodo.2004.09.020
Klocke, A., & Kahl-Nieke, B. (2005a). Influence of cross-head speed in orthodontic bond
strength testing. Dental Materials : Official Publication of the Academy of Dental Materials,
21(2), 139-144. doi:10.1016/j.dental.2004.03.004
Kusy, R. P. (1994). Commentary on dr. wiltshire's article: When is stronger better? American
Journal of Orthodontics and Dentofacial Orthopedics : Official Publication of the American
Association of Orthodontists, its Constituent Societies, and the American Board of
Orthodontics, 106(2), 17A.

55
Maruo, I. T., Godoy-Bezerra, J., Saga, A. Y., Tanaka, O. M., Maruo, H., & Camargo, E. S.
(2010). Effect of etching and light-curing time on the shear bond strength of a resin-
modified glass ionomer cement. Brazilian Dental Journal, 21(6), 533-537.
Mavropoulos, A., Staudt, C. B., Kiliaridis, S., & Krejci, I. (2005). Light curing time reduction: In
vitro evaluation of new intensive light-emitting diode curing units. European Journal of
Orthodontics, 27(4), 408-412. doi:10.1093/ejo/cji021
McNeill, C. J., Wiltshire, W. A., Dawes, C., & Lavelle, C. L. (2001). Fluoride release from new
light-cured orthodontic bonding agents. American Journal of Orthodontics and Dentofacial
Orthopedics : Official Publication of the American Association of Orthodontists, its
Constituent Societies, and the American Board of Orthodontics, 120(4), 392-397.
doi:10.1067/mod.2001.118103
Nemeth, B. R., Wiltshire, W. A., & Lavelle, C. L. (2006). Shear/peel bond strength of
orthodontic attachments to moist and dry enamel. American Journal of Orthodontics and
Dentofacial Orthopedics : Official Publication of the American Association of
Orthodontists, its Constituent Societies, and the American Board of Orthodontics, 129(3),
396-401. doi:10.1016/j.ajodo.2004.12.017
Newman, G. V. (1965). Epoxy adhesives for orthodontic attachments: Progress report. American
Journal of Orthodontics, 51(12), 901-912.
P. Emile, R. (2010). A historical overview of the development of the acid-etch bonding system in
orthodontics. Seminars in Orthodontics, 16(1), 2-23. doi:10.1053/j.sodo.2009.12.002
Phan, X., Akyalcin, S., Wiltshire, W. A., & Rody, W. J. (2011a). Effect of tooth bleaching on
shear bond strength of a fluoride-releasing sealant. The Angle Orthodontist,
doi:10.2319/052711-353.1
Pickett, K. L., Sadowsky, P. L., Jacobson, A., & Lacefield, W. (2001). Orthodontic in vivo bond
strength: Comparison with in vitro results. The Angle Orthodontist, 71(2), 141-148. doi:2
Pinto, C. M., Ferreira, J. T., Matsumoto, M. A., Borsatto, M. C., Silva, R. A., & Romano, F. L.
(2011). Evaluation of different LED light-curing devices for bonding metallic orthodontic
brackets. Brazilian Dental Journal, 22(3), 249-253.
Powers, J. M., Kim, H. B., & Turner, D. S. (1997). Orthodontic adhesives and bond
strengthtesting. Seminars in Orthodontics, 3(3), 147-156. doi:10.1016/S1073-
8746(97)80065-5
Proffit WR, Fields HW, Sarver DM. (2007). Contemporary orthodontics. 4th ed. St. Louis, MO:
Mosby Elsevier.

56
Retief, D. H., Dreyer, C. J., & Gavron, G. (1970). The direct bonding of orthodontic attachments
to teeth by means of an epoxy resin adhesive. American Journal of Orthodontics, 58(1), 21-
40.
Reynolds, I. R. (1975). Letter: 'composite filling materials as adhesives in orthodontics'. British
Dental Journal, 138(3), 83.
Scott, G. E.,Jr. (1988). Fracture toughness and surface cracks--the key to understanding ceramic
brackets. The Angle Orthodontist, 58(1), 5-8. doi:2
Scougall Vilchis, R. J., Yamamoto, S., Kitai, N., & Yamamoto, K. (2009). Shear bond strength
of orthodontic brackets bonded with different self-etching adhesives. American Journal of
Orthodontics and Dentofacial Orthopedics : Official Publication of the American
Association of Orthodontists, its Constituent Societies, and the American Board of
Orthodontics, 136(3), 425-430. doi:10.1016/j.ajodo.2007.08.024
Stanford, S. K., Wozniak, W. T., & Fan, P. L. (1997). The need for standardization of test
protocols. Seminars in Orthodontics, 3(3), 206-209.
Summers, A., Kao, E., Gilmore, J., Gunel, E., & Ngan, P. (2004). Comparison of bond strength
between a conventional resin adhesive and a resin-modified glass ionomer adhesive: An in
vitro and in vivo study. American Journal of Orthodontics and Dentofacial Orthopedics :
Official Publication of the American Association of Orthodontists, its Constituent Societies,
and the American Board of Orthodontics, 126(2), 200-6; quiz 254-5.
doi:10.1016/S0889540604001611
Swanson, T., Dunn, W. J., Childers, D. E., & Taloumis, L. J. (2004). Shear bond strength of
orthodontic brackets bonded with light-emitting diode curing units at various polymerization
times. American Journal of Orthodontics and Dentofacial Orthopedics : Official
Publication of the American Association of Orthodontists, its Constituent Societies, and the
American Board of Orthodontics, 125(3), 337-341. doi:10.1016/S0889540603010084
Vilar, R. V., Souza, N. F., Cal-Neto, J. P., Galvao, M., Sampaio-Filho, H., & Mendes Ade, M.
(2009). Shear bond strength of brackets bonded with two light-curing orthodontic adhesives.
The Journal of Adhesive Dentistry, 11(4), 259-262.
Wiltshire, W. A. (1994). Shear bond strengths of a glass ionomer for direct bonding in
orthodontics. American Journal of Orthodontics and Dentofacial Orthopedics : Official
Publication of the American Association of Orthodontists, its Constituent Societies, and the
American Board of Orthodontics, 106(2), 127-130.
Wiltshire, W. A. (2012a). In Vivek Cheba (Ed.), Discussion on orthodontic shear bond strength
testing
Wiltshire, W. A. (2012b). In Cheba V. (Ed.), Discussion on orthodontic shear bond strength
testing

57
Wiltshire, W. A., & Noble, J. (2010). Clinical and laboratory perspectives of improved
orthodontic bonding to normal, hypoplastic, and fluorosed enamel. Seminars in
Orthodontics, 16(1), 55-65. doi:10.1053/j.sodo.2009.12.005
Yuasa, T., Iijima, M., Ito, S., Muguruma, T., Saito, T., & Mizoguchi, I. (2010). Effects of long-
term storage and thermocycling on bond strength of two self-etching primer adhesive
systems. European Journal of Orthodontics, 32(3), 285-290. doi:10.1093/ejo/cjp118
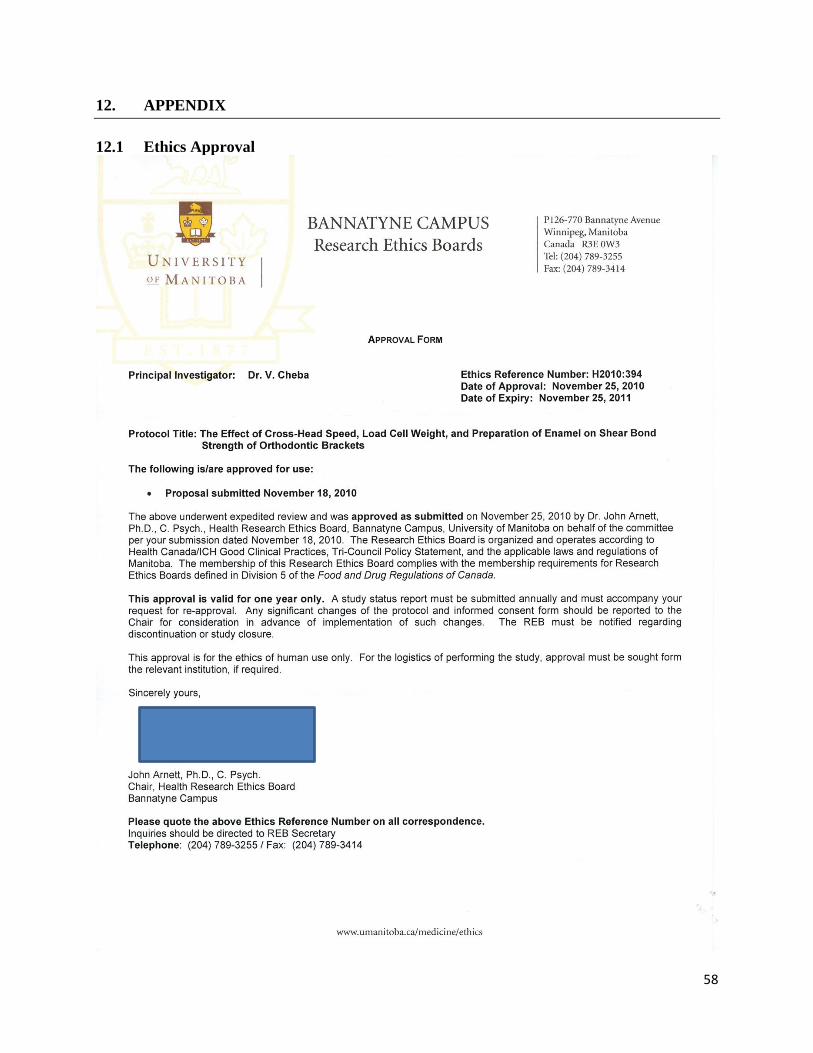
58
12. APPENDIX
12.1 Ethics Approval

59
12.2 Journal Approval

60
11.3 Journal Article Submitted to Angle Orthodontics
The effect of crosshead speed, load cell configuration and curing time on the shear bond
strength of orthodontic brackets
1Vivek Cheba, BSc, BSc(dent) DMD
Graduate Orthodontic Resident
2William A. Wiltshire, BChD, BChD (Hons), MDent, MChD (Orth), DSc, FRCD(C)
Professor
Program Director, Orthodontics
Head, Department of Preventive Dental Sciences
Address for Correspondence:
Dr. William A. Wiltshire
Professor and Head of Graduate and Undergraduate Orthodontics, Head of the Department of Preventive Dental Sciences
Faculty of Dentistry
780 Bannatyne Avenue
Winnipeg, MB
R3E 0W2
Canada
Phone: (204) 789-3628
Fax: (204) 977-5699
Email: [email protected]
1,2 University of Manitoba, Winnipeg, Manitoba, Canada

61
Abstract
Objective: The purpose of this study was to evaluate the effect of crosshead speed, load cell
configuration and curing time on the shear bond strength of orthodontic bracket
Materials and Methods: One hundred and eighty human molars were randomly divided into
two equal groups of 20 sec and 40 sec photopolymerization time and stored in artificial saliva at
37C in incubator for two weeks before bonding. The teeth were bonded using regular primer
and Transbond XT (R) adhesive (3M Uniktek). Each group was further divided into 1kN or
10kN load cell groups and each of those groups were divided into 0.5mm/min or 5mm/min
crosshead speeds. The test assemblies were subjected to shear-testing 24 hours after bonding
using a Zwick Universal Test Machine in a Bencor Multi-T testing castle.
Results: In terms of the photopolymerization(Sfondrini, Cacciafesta, Scribante, Boehme, & Jost-
Brinkmann, 2006) time (20sec vs. 40sec) there were no significant differences in SBSs
considering load cell configuration and crosshead speeds (p>0.05). When comparing the
crosshead speeds (0.5mm/min vs. 5.0mm/min) there were significant differences (p<0.05) in
crosshead speeds at (time=20, load 10) and (time=40, load=1). However, evaluation of the
confidence intervals (CI) of mean differences, there was no significance. Overall, there were no
significant differences in crosshead speeds (0.5mm/min vs. 5mm/min) on SBS’s. The load cell
configuration (1kN vs. 10kN) showed statistically significant differences in SBS’s when
considering crosshead speeds and photopolymerization time (p<0.05). In the load cell
configuration subgroup, shear bond strengths attained were 21.11 ± 3.47 MPa and 13.9±3.33
MPa for 1kN and 10kN load cells respectively.

62
Conclusion: Changing the crosshead speeds and photopolymerization time does not affect the
shear bond strengths. However, the more sensitive 1kN load cell configuration produced higher
bond strengths.
Introduction
Since the introduction of different bracket adhesive materials to the orthodontic market,
both in vivo and in vitro studies have been conducted to test their effectiveness and working
characteristics. As new bonding agents have been introduced, research focused on this area and
the resultant publication rate of papers on orthodontic bonding increased considerably. This is
illustrated in the steadily increasing number of bonding papers appearing in the leading
orthodontic journals (Eliades & Brantley, 2000).
Orthodontic adhesive materials have mainly been subjected to shear bond strength
studies. The results obtained from these studies show the strength of the adhesive between the
tooth and bracket. Typically higher bond strengths indicate a better adhesive material. To
conduct the actual tests, brackets are bonded to extracted teeth, tightly secured into a tooth test
ring using acrylic and then mounted onto a testing machine. The machine contains a steel rod
attached to a crosshead and once the rod is activated it contacts the mounted bracket and shears it
off. A computer electronically connected to the Universal Test Machine records the strength of
the adhesive of each test in megapascals. The speed of the crosshead and load cell weight can be
changed and as a result may affect the overall results (Eliades & Brantley, 2000).
Although many bonding studies have been conducted, there lacks a universally accepted
protocol to conduct these studies. As a result, it is difficult and sometimes impossible to compare
the materials and techniques used in the studies as well as the results within themselves (Bishara,
Soliman, Laffoon, & Warren, 2005). Fox (1994) found that even changing one test parameter

63
could significantly affect the interpretation of the results. In addition, it was observed that there
was a large variation in the methodology used for orthodontic material testing of bond strength.
From this it was suggested that researchers should adopt a standard methodological approach
that included tooth type, surface enamel preparation, storage medium, testing equipment and
technique, sample size, statistical analysis, and bond strength units (Fox, McCabe, & Buckley,
1994). Finnema et al. (2010) reported that many studies on in vitro orthodontic bond strength fail
to report test conditions that could significantly affect their outcome. In their systematic review
and meta-analysis, a summary of factors is given that can affect the in vitro bond strength of
orthodontic brackets. Experimental conditions that significantly influence in-vitro bond strength
are water storage of the bonded specimens, photopolymerization time, and crosshead speed
(Finnema, Ozcan, Post, Ren, & Dijkstra, 2010).
New dental products are constantly being introduced to the orthodontic market and
continually being tested for their effectiveness. In order for clinicians to critically evaluate new
products and better serve their patients, it remains essential that thorough testing of materials
new to the market be tested by independent sources, in addition to the potentially biased “in
house” tests undertaken by manufacturers. Materials need to bond sufficiently strongly, yet not
too strong to cause enamel damage on debonding, the bond should not deteriorate during
orthodontic treatment over time, it should be non-toxic and non-allergenic and preferably
anticariogenic. Only eventual standardized testing of orthodontic products will allow accurate
evaluation, comparison and full disclosure scrutiny of new and evolving products (W. A.
Wiltshire, 2012a).
Finemma (2010) conducted a systematic review of the available literature regarding in-
vitro orthodontic shear bond strength testing. To date this publication has been the most

64
comprehensive review of bond strength testing conditions. Results from this paper showed bond
strength testing was negatively influenced when the teeth were stored in water. Water storage on
average decreased bond strength by 10.7 MPa, assuming that the other predictors remain
constant. Although this was the most pronounced effect of an experimental condition, this
finding was mainly influenced by 1 relatively large study sample in which artificial saliva was
used as a storage medium for specimens. It was reported that bond strengths were significantly
higher when teeth were stored in artificial saliva. Analogously, each second of
photopolymerization time increased the bond strength by 0.077 MPa. The studies in the meta-
analysis showed considerable variations in photopolymerization time: from 2 to 50 seconds,
however, most studies reported 40 seconds for polymerizing adhesive and this corresponds to the
routine clinical standard. Although the results indicated increasing photopolymerization time
yields higher bond strengths, the most optimal time for polymerizing still needs to be deduced in
future studies. When crosshead speed increased by 1 mm per minute, bond strength increased by
1.3 MPa. However, the studies used in the meta-analysis reported conflicting results with no
obvious explanations. The discrepancy in the results indicates that more research is required for
this important parameter. Overall, they suggested because of developments in adhesive dentistry
and the increasing numbers of bond strength studies, uniform guidelines for standardization of
the experimental conditions of in-vitro bond strength research is clearly indicated(Finnema et al.,
2010). The guidelines from this study were used to select the testing conditions used in this
study, including storage medium for teeth, cross-head speed, photopolymerization time, and load
cell configuration.
Bishara et al. (2005) attempted to standardize testing conditions when they conducted a
study to determine the effect of crosshead speed of the testing machine on shear bond strength

65
while standardizing all other variables. They found changing the crosshead speed from 5.0 to
0.5mm/min increased shear bond strength by approximately 57% and also decreased the ratio of
the standard deviation to the mean by half, from 66% to 33%. They also suggested that
identifying and standardizing other testing parameters included in shear bond testing would make
the results more useful for comparative purposes. Though this study presented some very
valuable information regarding the speed at which the crosshead should contact the bracket, it
failed to standardize other important variables such as the load cell configuration and
photopolymerization time (Bishara et al., 2005).
While depth of cure is an important consideration for the restorative dentist, it is much
less of a concern for the orthodontist because the layer of composite that bond brackets to teeth is
very thin. Manufacturers have recommended light-curing times of 20-40 second for
polymerizing composite restorative materials 2mm thick but the thickness of orthodontic
adhesive is considerably less and therefore shorter polymerization times might be adequate
(Swanson, Dunn, Childers, & Taloumis, 2004) Swanson et al. (2004) demonstrated lower shear
bond strengths for 10 second vs. 40 second curing with light emitting diode (LED) light curing
units, however, found that all experimental groups had mean SBS’s greater than 8MPa.
Mavropoulos, A (2005) also found a curing time of 10 seconds to be sufficient to bond metallic
brackets to incisors using intensive LED curing units, however, higher curing times (5sec vs 40
sec) did show higher bond strengths. (Mavropoulos, Staudt, Kiliaridis, & Krejci, 2005).
From the studies conducted by Finnema, K.J. (2010) and Bishara et al. (2005), it has been
suggested we use artificial saliva for the storage medium, photopolymerization times ranging
from 20 to 40 seconds, and use cross-head speeds ranging from 0.5mm/min to 5.0mm/min
(Bishara et al., 2005; Finnema et al., 2010). These studies however failed to address the

66
important issue of load cell configuration and we have added this parameter in our present study
since we believe that increasing the load cell would reduce the bond strengths (W. A. Wiltshire,
2012a)
Even with many of the variables accounted for, one has to determine whether the
mechanics of the testing itself may influence the results. Therefore the purpose of this study is to
determine the effect of changing the crosshead speed of the testing machine, the load cell
configuration (a lesser dimension load cell may be more clinically relevant), and the light-curing
time, on the shear bond strength of orthodontic brackets while standardizing other variables, such
as tooth type, adhesive system, brackets, and debonding time.
Materials and Methods:
One hundred and sixty lower first, second, and third molar teeth were collected from four
maxillofacial and oral surgery clinics in Winnipeg and were stored in 0.5% Chloramine T. The
criteria for tooth selection included characteristics like: intact buccal enamel, similar buccal
surface contour, not subjected to any pretreatment agents, no cracks, and no caries on any
surface. Prior to the bonding process, roots of all included teeth were removed using the diamond
saw.
All 160 teeth were cleansed and polished with residue free, nonfluoridated, nonflavored
pumice (Preppies) in a pumice and water slurry for 10 seconds with a slow speed dental hand
piece and rubber prophylactic cup. Teeth were then etched with 37% phosphoric acid gel for 30
seconds and then rinsed with water spray for 20s and dried with an oil-free air spray for 20
seconds until the enamel appeared frosty. Adhesive primer Transbond XT (3M Unitek,
Monrovia, California) was applied on the enamel surface with a bond applicator and cured for 20
seconds. The metal lingual buttons were then applied with Transbond XT adhesive paste and

67
placed on the etched enamel surface. One hundred and sixty curved stainless steel lingual
orthodontic buttons (#30-000-01, GAC International, Central Islip, NY) were used with the
diameter of 3.31mm (surface area of approximately 8.60 mm2). A light finger pressure was
applied by a bracket holder pushing on the buttons until the buttons touched the surface of the
enamel. Excess adhesive was removed with a scaler and the samples were cured for 20 or 40
seconds, depending on which group they belonged, with LED light. The teeth were stored in
artificial saliva (McNeill et al., 2001) for 24 hours in a covered dish at 37C in an incubator
before the tests.
Debonding Procedure
Twenty four hours after the bonding procedure, the teeth were embedded with
Bosworth Fastray Acrylic in cooper rings of 22.5 mm in diameter. The copper rings were applied
with Vaseline prior to acrylic placement. The laser level was positioned on a flat table projecting
a horizontal light on a white box. Each pre-vaselined ring was placed parallel to the horizontal
laser beam. Each tooth was held inside each ring with sticky wax so that a parallel relationship
with the base of the button and the laser beam was achieved. Bosworth Fastray Acrylic was
mixed according to the manufacturer’s recommendation and was poured into the rings. After ten
minutes, the embedded teeth were removed and were mounted in the Zwick Universal testing
machine in a Bencor Multi-T Loading Apparatus (Danville Engineering, San Ramon, CA)
(Figure 1). A knife-edged shearing blade was used and when a direct sharp shearing force is
applied to the enamel-adhesive-bracket interface parallel to the height of contour in an occluso-
gingival direction, the button debond. The speed of the crosshead was set at 0.5 mm/min and the
shear bond strength was measured using a 1KN load cell. The shear bond strength values were
recorded by the computer. The same debonding procedures were performed for each of the

68
groups outlined in Table 5-1. In order to change the cross-head speed, the default was changed in
the computer and the load cell configuration was changed by removing the 1kN load cell from
the machine and attaching the 10kN load cell. Once the load cell was changed the testing
machine was re-calibrated to the new load cell.
Table 1: Tooth preparation, load cell configuration (kN) and cross-head speeds (mm/min)
Photopolymerization
Time
Load Cell
Configuration
Cross-Head Speed
(mm/minute)
Number of
Teeth
1
20 second cure
1 kN 0.5 20
5.0 20
2
10 kN 0.5 20
5.0 20
3
40 second cure
1 kN 0.5 20
5.0 20
4
10 kN 0.5 20
5.0 20
TOTAL 160
Figure 1: Bonded Tooth Embedded in Acrylic Mounted in the Zwick Universal Testing
Machine

69
Statistical Analysis of Data
All statistical analyses were performed with the Statistical Analysis Software (SAS 9.2
for Windows 10.0.1, SAS Institute Inc., Cary, NC, USA). Descriptive statistics, including the
mean, standard deviation, and minimum and maximum values and coefficients of variation were
calculated for the groups of teeth tested. Comparisons of means of shear bond strength values
were done with Students t-tests. Significance was predetermined at p≤0.05.
Results
Table 2 : Descriptive data of shear bond strengths
Photo-
polymerization
Time (s)
Load Cell
Configuration
(kN)
Crosshead
Speed
(mm/min)
Sample
Size
(N)
Mean
(MPa)
Std
Dv
Min
(MPa)
Max
(MPa)
Δ
max-
min
Coefficient
of
Variation
(%)
20
1 0.5 20 23.51 3.36 17.14 30.88 13.74 14.29
5.0 20 21.88 3.96 14.84 28.84 14.00 18.10
10 0.5 20 14.32 2.31 9.09 17.89 8.8 16.13
5.0 20 12.07 3.42 5.97 19.32 13.35 28.33
40
1 0.5 20 22.62 3.01 16.69 29.52 12.83 13.31
5.0 20 20.01 3.13 14.23 24.92 10.69 15.64
10 0.5 20 15.05 3.08 9.57 21.14 11.57 20.47
5.0 20 14.41 4.51 6.28 18.85 12.57 31.30
Judging from Table 2 it is evident that with a 1kN load cell configuration, irrespective of
photopolymerization time or crosshead speed, the average shear bond strength was in the same
order of magnitude (between 20.01MPa and 23.51 MPa) (Refer to table 3 for further
information). Similarly, judging from table 2 it is also evident that with a 10kN load cell
configuration, irrespective of photopolymerization time, the average shear bond strength was in
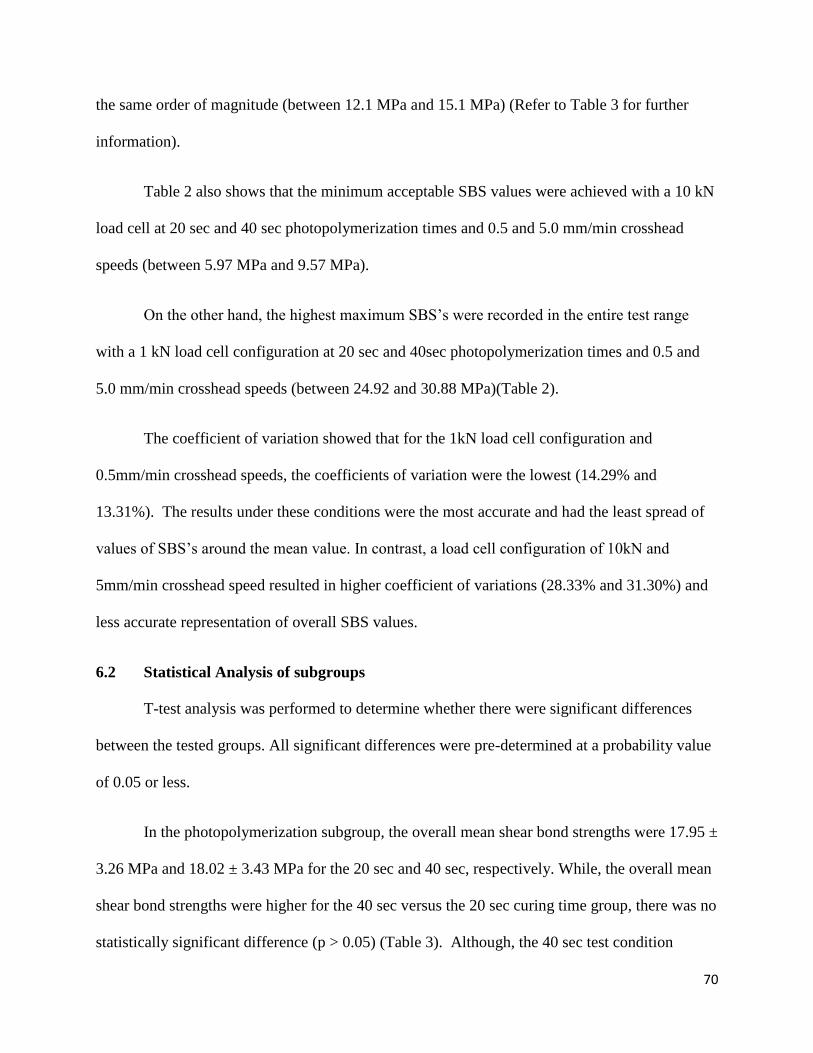
70
the same order of magnitude (between 12.1 MPa and 15.1 MPa) (Refer to Table 3 for further
information).
Table 2 also shows that the minimum acceptable SBS values were achieved with a 10 kN
load cell at 20 sec and 40 sec photopolymerization times and 0.5 and 5.0 mm/min crosshead
speeds (between 5.97 MPa and 9.57 MPa).
On the other hand, the highest maximum SBS’s were recorded in the entire test range
with a 1 kN load cell configuration at 20 sec and 40sec photopolymerization times and 0.5 and
5.0 mm/min crosshead speeds (between 24.92 and 30.88 MPa)(Table 2).
The coefficient of variation showed that for the 1kN load cell configuration and
0.5mm/min crosshead speeds, the coefficients of variation were the lowest (14.29% and
13.31%). The results under these conditions were the most accurate and had the least spread of
values of SBS’s around the mean value. In contrast, a load cell configuration of 10kN and
5mm/min crosshead speed resulted in higher coefficient of variations (28.33% and 31.30%) and
less accurate representation of overall SBS values.
6.2 Statistical Analysis of subgroups
T-test analysis was performed to determine whether there were significant differences
between the tested groups. All significant differences were pre-determined at a probability value
of 0.05 or less.
In the photopolymerization subgroup, the overall mean shear bond strengths were 17.95 ±
3.26 MPa and 18.02 ± 3.43 MPa for the 20 sec and 40 sec, respectively. While, the overall mean
shear bond strengths were higher for the 40 sec versus the 20 sec curing time group, there was no
statistically significant difference (p > 0.05) (Table 3). Although, the 40 sec test condition

71
showed higher shear bond strengths than the 20 sec group overall, it is clear that when the load
cell configuration was 1kN, the 20 sec curing groups showed higher shear bond strengths (23.51
vs. 22.62 and 21.88 vs. 20.01). Similarily, when the load cell configuration was 10kN the 40 sec
curing groups showed higher bond strengths (14.32 vs. 15.01 MPa and 12.07vs. 14.41MPa)
(Table 3).
Table 3: Statistical difference between 20 sec vs. 40 sec photopolymerization time
Load Cell (kN) and
Crosshead Speed
(mm/min)
Mean ± SD (MPa)
p-value Time = 20 sec Time = 40 sec
Load = 1, Speed = 0.5 23.51±3.36 22.62±3.01 0.38
Load = 1, Speed = 5.0 21.88±3.96 20.01±3.13 0.11
Load = 10, Speed = 0.5 14.32±2.31 15.05±3.08 0.40
Load = 10, Speed = 5.0 12.07±3.42 14.41±4.51 0.07
Average 17.95 ± 3.26 18.02 ± 3.43 0.88
Meanwhile, in the crosshead speed subgroups, the overall mean SBS were 18.88 ± 2.94
MPa and 17.09 ± 3.76 MPa for 0.5mm/min and 5mm/min, respectively (Table 4). Overall, there
were no significant differences in crosshead speeds (0.5mm/min vs. 5mm/min) on shear bond
strength (p>0.05). When comparing the crosshead speeds (0.5mm/min vs. 5.0mm/min) the mean
shear bond strengths were higher for the 0.5mm/min subgroup, however, significant differences
(p<0.05) in crosshead speeds were only found at (time=20, load 10) and (time=40, load=1)(Table
4). Evaluation of the confidence intervals (CI) of mean differences proved that there was no
significance. Mean differences of (time=20, load=10) = 2.2 with CI (0.4-4.1). Mean differences
of (time=40, load=1) = 2.6 with CI (0.6-4.6).

72
Table 4: Statistical differences between crosshead speed 0.5mm/min and 5.0mm/min
Photopolymerization
time (sec) and Load
Cell (kN)
Mean ± SD (MPa)
p-value Speed = 0.5mm/min Speed = 5.0mm/min
Time = 20, Load = 1 23.51±3.36 21.88±3.96 0.16
Time = 20, Load = 10 14.32±2.31 12.07±3.42 0.02*
Time = 40, Load = 1 22.62±3.01 20.01±3.13 0.01*
Time = 40, Load = 10 15.05±3.08 14.41±4.51 0.60
Average 18.88 ± 2.94 17.09 ± 3.76 0.12
*p<0.05
In the load cell configuration subgroup, the overall mean shear bond strengths were 22.05
± 3.37 MPa and 13.96 ± 3.33 for the 1kN load cell and 10kN load cell groups. The load cell
configuration (1kN vs. 10kN) showed highly statistically significant differences in SBS’s when
considering crosshead speed and photopolymerization time (p<0.05) (Table 5).
Table 5: Statistical differences between load cell configuration 1kN vs. 10kN
Photopolymerization
Time (sec) and
Crosshead Speed
Mean ± SD
p-value Load=1kN Load=10kN
Time=20, Speed=0.5 23.51±3.36 14.32±2.31 *
Time=20, Speed=5 21.88±3.96 12.07±3.42 *
Time=40, Speed=0.5 22.62±3.01 15.05±3.08 *
Time=40, Speed=5 20.01±3.13 14.41±4.51 *
Average 22.05 ± 3.37 13.96 ± 3.33 *
*all values highly significant
Discussion
Overall, the results from this study found that photopolymerization time and crosshead
speeds did not affect orthodontic shearbond strength, however, load cell configuration was an
important factor of in-vitro bond strength testing.
Photopolymerization Time
Findings indicated that photopolymerization time did not affect the overall shear bond
strength. When the curing time was 20 seconds the average shear bond strength was lower than

73
the 40 second subgroup (17.95 ± 3.26 MPa and 18.02 ± 3.43 MPa), however, this was not
statistically significant (p > 0.05). When analyzing each subgroup separately there was still no
statistically significant relationship between 20 and 40 second curing times. However, mean
shear bond strengths were higher when the load cell was 1kN with speeds of 0.5mm/min and
5.0mm/min for 20 sec vs. 40 second curing times (Table 6.2). On the other hand when a 10kN
load cell was used SBS’s were higher for 40 sec vs. 20 sec curing times at both speeds of
0.5mm/min and 5.0mm/min. Although, these relationships were not significant they do show that
photopolymerization times variably affect orthodontic SBS’s and perhaps are not a test factor for
times between those ranges. Finnema et al. (2010) had found that photopolymerization times
significantly affected in vitro bond strength and that each additional second of
photopolymerization increased bond strength by 0.077 MPa. In our study, for test conditions at
1kN for both crosshead speeds (0.5 and 5.0 mm/min) this was not found to be the case, however,
with a 10 kN load cell, this was true. On average, for the 10kN subgroup each additional second
of curing increased the SBS’s by 0.076 MPa and was almost identical to the value in the
systematic review. Although, the systematic review found increasing curing times resulted in
increased SBS’s, they were unable to suggest the most optimal time for polymerizing the
adhesive (Finnema et al., 2010). Swanson (2004) conducted a study comparing different light
units (LED and Halogen) while standardizing other test conditions similar to our study. The
results from their study found statistically significant differences between 10 sec vs. 40 sec
curing times, where 40 second curing times had higher shear bond strengths (Swanson et al.,
2004). Similarily, Mavropoulos (2005) found a curing time of 10 seconds was sufficient to bond
metallic brackets to incisors using intensive LED curing units, however, 40 seconds of curing
resulted in higher bond strengths (Mavropoulos et al., 2005). Mauro et al. (2010) assessed the

74
influence of etching and light-curing time on the shear bond strength (SBS) of a resin-modified
glass ionomer cement (RMGIC) upon debonding of orthodontic brackets. They found RMGIC
SBS enhanced with 37% phosphoric acid etching and 40 s light-curing time, but this did not
occur when the light-curing time was increased, therefore light-curing time did not affect SBS
(Maruo et al., 2010).
Reynolds (1975) recommended minimum shear bond strength values between 6-8 MPa
and all 4 experimental subgroups produced bond strengths that appear to be able to withstand
normal orthodontic forces (Reynolds, 1975). Results of this study also demonstrated higher
bond strengths as curing time was increased. This can easily be explained by the higher
conversion rate of monomer to polymer at increased polymerization times (Mavropoulos et al.,
2005). The data of this in vitro study should be compared only with groups in the study, and the
laboratory findings should not be extrapolated to the clinical situation. Studies appear to indicate
that mean bond strengths recorded in vivo following comprehensive orthodontic treatment are
significantly lower than bond strengths recorded in vitro (Pickett, Sadowsky, Jacobson, &
Lacefield, 2001). However, in vitro studies are an important first step prior to confirming any
clinical situation.
Crosshead Speed
The findings of this study indicated that variations in the crosshead speed of the testing
machine can influence the test results; however, this was not significant overall. More
specifically, by slowing the crosshead speed of the Zwick machine during shear bond testing of
the orthodontic brackets from 5.0mm/min to 0.5mm/min, the mean shear bond strength increased
from 17.09 to 18.88 MPa, an increase of only 9.4%. In other words crosshead speed did not
75
affect the shear bond strength. Klocke et al. (2005) investigated the influence of cross-head
speed on debonding force of orthodontic brackets and selected speed of 0.1mm/min, 0.5mm/min,
1mm/min and 5.0mm/min. Their results, similar to those from the present study, showed cross-
head speed variation between 0.1 and 5 mm/min did not seem to influence debonding force
measurements of brackets bonded to enamel with a composite adhesive (Klocke & Kahl-Nieke,
2005a). Bishara et al. (2005) conducted a similar study where they tested the effect of changing
crosshead speed from 5.0 to 0.5mm/min and their results did not support the present findings.
Their study found that changing the crosshead speed from 5.0 to 0.5 mm/min significantly
increased the shear bond strength from 7.0 to 12.2 MPa, an increase of 57%. Furthermore, the
ratio between the mean standard deviation for 5.0mm/min testing speed was 66%, whereas for
the slower 0.5mm/min testing speed, it was 33%. In other words, there was an increase in the
shear bond strength values and a decrease in relative variation (Bishara et al., 2005). Eliades et
al. (2004) examined the effect of crosshead speed on the bond strength of brackets bonded to
enamel. Crosshead speeds of a standard 1 mm/min and a fast 200 mm/min, which better
approximates the actual jaw velocity during chewing, were selected. The results indicated that an
increased crosshead speed resulted in decreased shear bond strength. Furthermore, they stated
that this was probably due to the induction of a stiff body response and elimination of the
visoelastic properties of the resin (Eliades, Katsavrias, Zinelis, & Eliades, 2004). Finnema et al
(2010) reported in her systematic review that an increase in crosshead speed of 1mm/min yielded
an increase in average bond strength of 1.3 MPa. From the studies presented in Table 2.1 it is
evident that crosshead speeds of 0.5mm/min (8.1-26.6 MPa) typically produced higher shear
bond strengths than those at higher crosshead speeds (7.0-18.46 MPa) (Refer to Table 2.1 in
introduction chapter). Also, from the studies in Table 2.1 we can see that most studies use

76
0.5mm/min as their crosshead speeds since this produces more consistent results. The
consistency of results was evident in our study if you examine the coefficients of variation. From
Table 6.1 we can see at 0.5mm/min there was less variation of the shear bond strength values
(13.31-20.47%) compared to 5.0mm/min (15.64-31.30%). This shows that our results at
0.5mm/min are more accurate and there is more confidence regarding the shear bond strength
values.
An interesting issue raised by Eliades (2004) was regarding the clinical relevance of the
reported bond strength values and how they come in to question since the standard crosshead
speeds cited in the literature are irrelevant to the velocity of tooth occlusion during chewing.
Although the reported crosshead speeds range from 0.1mm/min-200mm/min, it must be noted
that these rates are many orders of magnitude lower than the actual masticatory velocity in
humans. A complete masticatory cycle (sequential opening and closing) of a healthy individual
lasts 800ms, with the closing movement having duration of less than 400 ms, which translates to
over 2000mm/min and this value is much higher than the standard crosshead speed used in bond
strength testing. However, using crosshead speeds observed in human chewing cycles is not
practical in laboratory testing since testing is restricted to the upper limit of the effective
crosshead speed of the testing apparatus (Eliades et al., 2004). The present study aims to find
test conditions that are clinically relevant; however, when standardizing crosshead speed in the
laboratory we demonstrated this is not relevant. That said, it is difficult, if not impossible to
reproduce and replicate the actual clinical situation in vitro. Seldom, if ever, for example, is a
sustained, perfect shear force produced on an orthodontic bracket and furthermore, replication of
the human chewing cycle has not been effectively mimicked intra-orally (W. A. Wiltshire,
2012a).

77
Load Cell Configuration
The third experimental condition shown to significantly affect outcomes of bond strength
testing was load cell configuration. An increase in load cell configuration from 1kN to 10kN
resulted in significantly lower bond strengths (22.05 vs. 13.96MPa) (p<0.05). Even for all 4
subgroups tested, increase in load cell configuration resulted in significantly lower bond
strengths (p<0.01). To date no study has been conducted that supports or refutes the findings of
this test condition. In fact, reporting of the load cell configuration is limited (Halpern & Rouleau,
2010c; Ho ACS, Bonstein T, Akyalcin S, et al., 2010; Phan, Akyalcin, Wiltshire, & Rody,
2011a; W. A. Wiltshire, 1994) and has not been considered a factor in the majority of the bond
strength testing literature. As mentioned previously Wiltshire (2012) felt this was an important
test factor since the Department of Orthodontics, University of Manitoba, Canada, had two
different load cells (1kN and 10kN) that were producing different results under similar test
conditions. Ho et al. (2010) and Phan (2011) conducted studies using similar test conditions as
the present study (1kN load cell, 0.05mm/min crosshead speed, 20sec curing time) and the
results showed shear bond strengths of 16.7 and 18.0 MPa, whereas our study had a bond
strength of 23.51MPa (Ho ACS, Bonstein T, Akyalcin S, et al., 2010; Phan, Akyalcin, Wiltshire,
& Rody, 2011a). Comparing these studies with Nemeth (2006) who used a 10kN load cell,
0.05mm/min crosshead speed and 30sec curing time and found a shear bond strength of
10.6Mpa, we can note that the shear bond strengths are lower when the load cell configuration is
increased (Nemeth et al., 2006). Similarly, Halpern (2010) used a 5kN load cell, with a
2mm/min crosshead speed and 40 second curing time and found an even lower bond strength
(7.24MPa) than the above studies at 1kN load cell configuration(Halpern & Rouleau, 2010b). On
the other hand, when Wiltshire (1994) used a 20kN load cell with a 0.05mm/min crosshead

78
speed and 40sec curing time, the shear bond strength was much higher (resin: 26.6MPa) than all
the studies mentioned above. However, it must be noted that the same resin (Tranbond XT, 3M
Unitek, Monrovia, CA) was not used and could be the reason for the major difference in shear
bond strengths (W. A. Wiltshire, 1994). With respect to occlusal forces of mastication generated
in the human, one might argue in favor of higher load cell usage. On the flip side, the lighter load
cell may improve the test sensitivity.
The results of the study also found that the coefficients of variation, a measure of the
variability about the mean, were highest for the 10kN load cell and 5.0mm/min crosshead speed
(28.33 and 31.30%) and this was above the recommended 20-25% (W. A. Wiltshire, 2012b).
Furthermore, the lowest coefficient of variation was achieved when a more sensitive 1kN and
slower crosshead speed of 0.05mm/min was used (14.29 and 13.31%). This just shows that when
using a 1kN load cell the results are more consistent and uniform than for a 10kN load cell.
Lighter load cells tend to produce higher bond strengths and higher bond strengths are what
manufacturers may be interested in, in order to market their products. If adhesives display higher
bond strengths, the clinician may assume that this results in fewer debonds and may be more
inclined to purchasing that product. In order to be more stringent it would make more sense to
use a heavier load cell which would result in lower bond strengths, but may be a better indicator
of the clinical applicability of a product. Independent researchers may be more in favor of using
a higher load cell configuration and manufacturers may use a lower load cell configuration, but,
overall, from this study we suggest to use both 1 and 10 kN load cells. Results would be more
uniform with a 1kN load cell but a 10kN load cell would produce lower values.
The major finding of this study shows that load cell configuration is an important test
parameter that rarely appears in the literature. In order to adequately compare products this

79
parameter needs to be stated otherwise studies cannot be accurately evaluated and clinicians may
have higher expectations of an orthodontic adhesive.
Conclusions
Based on this in vitro study on the SBS of when changing test parameters of
photopolymerization time, crosshead speed, and load cell configuration, we can conclude that:
1. Photopolymerization time does not affect the orthodontic SBS testing
2. Crosshead speed does not affect orthodontic SBS testing
3. Load cell configuration does affect orthodontic SBS testing, where the more sensitive
1kN load cell configuration produced higher bond strengths
References
Abdelnaby, Y. L., & Al-Wakeel Eel, S. (2010). Effect of early orthodontic force on shear bond
strength of orthodontic brackets bonded with different adhesive systems. American Journal
of Orthodontics and Dentofacial Orthopedics : Official Publication of the American
Association of Orthodontists, its Constituent Societies, and the American Board of
Orthodontics, 138(2), 208-214. doi:10.1016/j.ajodo.2008.09.034
Banerjee, S., & Banerjee, R. (2011). A comparative evaluation of the shear bond strength of five
different orthodontic bonding agents polymerized using halogen and light-emitting diode
curing lights: An in vitro investigation. Indian Journal of Dental Research : Official
Publication of Indian Society for Dental Research, 22(5), 731-732. doi:10.4103/0970-
9290.93469
Bishara, S. E., Gordan, V. V., VonWald, L., & Jakobsen, J. R. (1999). Shear bond strength of
composite, glass ionomer, and acidic primer adhesive systems. American Journal of
Orthodontics and Dentofacial Orthopedics : Official Publication of the American
Association of Orthodontists, its Constituent Societies, and the American Board of
Orthodontics, 115(1), 24-28.
Bishara, S. E., Soliman, M., Laffoon, J., & Warren, J. J. (2005). Effect of changing a test
parameter on the shear bond strength of orthodontic brackets. The Angle Orthodontist,
75(5), 832-835. doi:2

80
Eliades, T., & Brantley, W. A. (2000). The inappropriateness of conventional orthodontic bond
strength assessment protocols. European Journal of Orthodontics, 22(1), 13-23.
Eliades, T., Eliades, G., Bradley, T. G., & Watts, D. C. (2000). Degree of cure of orthodontic
adhesives with various polymerization initiation modes. European Journal of Orthodontics,
22(4), 395-399.
Eliades, T., Katsavrias, E., Zinelis, S., & Eliades, G. (2004). Effect of loading rate on bond
strength. Journal of Orofacial Orthopedics = Fortschritte Der Kieferorthopadie :
Organ/official Journal Deutsche Gesellschaft Fur Kieferorthopadie, 65(4), 336-342.
doi:10.1007/s00056-004-0327-x
Finnema, K. J., Ozcan, M., Post, W. J., Ren, Y., & Dijkstra, P. U. (2010). In-vitro orthodontic
bond strength testing: A systematic review and meta-analysis. American Journal of
Orthodontics and Dentofacial Orthopedics : Official Publication of the American
Association of Orthodontists, its Constituent Societies, and the American Board of
Orthodontics, 137(5), 615-622.e3. doi:10.1016/j.ajodo.2009.12.021
Fox, N. A., McCabe, J. F., & Buckley, J. G. (1994). A critique of bond strength testing in
orthodontics. British Journal of Orthodontics, 21(1), 33-43.
Halpern, R. M., & Rouleau, T. (2010a). The effect of air abrasion preparation on the shear bond
strength of an orthodontic bracket bonded to enamel. European Journal of Orthodontics,
32(2), 224-227. doi:10.1093/ejo/cjp080
Halpern, R. M., & Rouleau, T. (2010b). The effect of air abrasion preparation on the shear bond
strength of an orthodontic bracket bonded to enamel. European Journal of Orthodontics,
32(2), 224-227. doi:10.1093/ejo/cjp080
Halpern, R. M., & Rouleau, T. (2010c). The effect of air abrasion preparation on the shear bond
strength of an orthodontic bracket bonded to enamel. European Journal of Orthodontics,
32(2), 224-227. doi:10.1093/ejo/cjp080
Hara, A. T., Pimenta, L. A., & Rodrigues, A. L.,Jr. (2001). Influence of cross-head speed on
resin-dentin shear bond strength. Dental Materials : Official Publication of the Academy of
Dental Materials, 17(2), 165-169.
Ho ACS, Bonstein T, Akyalcin S, et al. (2010). Shear bond strengths of two new self-etching
primers. (Unpublished MSc. Ortho.). University of Manitoba, Winnipeg.
Ho, A. C., Akyalcin, S., Bonstein, T., & Wiltshire, W. A. (2011). In vitro shearing force testing
of two seventh generation self-etching primers. Journal of Orthodontics, 38(4), 269-274.
doi:10.1179/14653121141623

81
Klocke, A., & Kahl-Nieke, B. (2005a). Influence of cross-head speed in orthodontic bond
strength testing. Dental Materials : Official Publication of the Academy of Dental Materials,
21(2), 139-144. doi:10.1016/j.dental.2004.03.004
Klocke, A., & Kahl-Nieke, B. (2005b). Influence of force location in orthodontic shear bond
strength testing. Dental Materials : Official Publication of the Academy of Dental Materials,
21(5), 391-396. doi:10.1016/j.dental.2004.07.004
Kusy, R. P. (1994). Commentary on dr. wiltshire's article: When is stronger better? American
Journal of Orthodontics and Dentofacial Orthopedics : Official Publication of the American
Association of Orthodontists, its Constituent Societies, and the American Board of
Orthodontics, 106(2), 17A.
Maruo, I. T., Godoy-Bezerra, J., Saga, A. Y., Tanaka, O. M., Maruo, H., & Camargo, E. S.
(2010). Effect of etching and light-curing time on the shear bond strength of a resin-
modified glass ionomer cement. Brazilian Dental Journal, 21(6), 533-537.
Mavropoulos, A., Staudt, C. B., Kiliaridis, S., & Krejci, I. (2005). Light curing time reduction: In
vitro evaluation of new intensive light-emitting diode curing units. European Journal of
Orthodontics, 27(4), 408-412. doi:10.1093/ejo/cji021
McNeill, C. J., Wiltshire, W. A., Dawes, C., & Lavelle, C. L. (2001). Fluoride release from new
light-cured orthodontic bonding agents. American Journal of Orthodontics and Dentofacial
Orthopedics : Official Publication of the American Association of Orthodontists, its
Constituent Societies, and the American Board of Orthodontics, 120(4), 392-397.
doi:10.1067/mod.2001.118103
Nemeth, B. R., Wiltshire, W. A., & Lavelle, C. L. (2006). Shear/peel bond strength of
orthodontic attachments to moist and dry enamel. American Journal of Orthodontics and
Dentofacial Orthopedics : Official Publication of the American Association of
Orthodontists, its Constituent Societies, and the American Board of Orthodontics, 129(3),
396-401. doi:10.1016/j.ajodo.2004.12.017
Phan, X., Akyalcin, S., Wiltshire, W. A., & Rody, W. J. (2011a). Effect of tooth bleaching on
shear bond strength of a fluoride-releasing sealant. The Angle Orthodontist,
doi:10.2319/052711-353.1
Phan, X., Akyalcin, S., Wiltshire, W. A., & Rody, W. J. (2011b). Effect of tooth bleaching on
shear bond strength of a fluoride-releasing sealant. The Angle Orthodontist,
doi:10.2319/052711-353.1
Pickett, K. L., Sadowsky, P. L., Jacobson, A., & Lacefield, W. (2001). Orthodontic in vivo bond
strength: Comparison with in vitro results. The Angle Orthodontist, 71(2), 141-148. doi:2

82
Pinto, C. M., Ferreira, J. T., Matsumoto, M. A., Borsatto, M. C., Silva, R. A., & Romano, F. L.
(2011). Evaluation of different LED light-curing devices for bonding metallic orthodontic
brackets. Brazilian Dental Journal, 22(3), 249-253.
Powers, J. M., Kim, H. B., & Turner, D. S. (1997). Orthodontic adhesives and bond
strengthtesting. Seminars in Orthodontics, 3(3), 147-156. doi:10.1016/S1073-
8746(97)80065-5
Reynolds, I. R. (1975). Letter: 'composite filling materials as adhesives in orthodontics'. British
Dental Journal, 138(3), 83.
Scougall Vilchis, R. J., Yamamoto, S., Kitai, N., & Yamamoto, K. (2009). Shear bond strength
of orthodontic brackets bonded with different self-etching adhesives. American Journal of
Orthodontics and Dentofacial Orthopedics : Official Publication of the American
Association of Orthodontists, its Constituent Societies, and the American Board of
Orthodontics, 136(3), 425-430. doi:10.1016/j.ajodo.2007.08.024
Sfondrini, M. F., Cacciafesta, V., Scribante, A., Boehme, A., & Jost-Brinkmann, P. G. (2006).
Effect of light-tip distance on the shear bond strengths of resin-modified glass ionomer
cured with high-intensity halogen, light-emitting diode, and plasma arc lights. American
Journal of Orthodontics and Dentofacial Orthopedics : Official Publication of the American
Association of Orthodontists, its Constituent Societies, and the American Board of
Orthodontics, 129(4), 541-546. doi:10.1016/j.ajodo.2005.12.025
Summers, A., Kao, E., Gilmore, J., Gunel, E., & Ngan, P. (2004). Comparison of bond strength
between a conventional resin adhesive and a resin-modified glass ionomer adhesive: An in
vitro and in vivo study. American Journal of Orthodontics and Dentofacial Orthopedics :
Official Publication of the American Association of Orthodontists, its Constituent Societies,
and the American Board of Orthodontics, 126(2), 200-6; quiz 254-5.
doi:10.1016/S0889540604001611
Swanson, T., Dunn, W. J., Childers, D. E., & Taloumis, L. J. (2004). Shear bond strength of
orthodontic brackets bonded with light-emitting diode curing units at various polymerization
times. American Journal of Orthodontics and Dentofacial Orthopedics : Official
Publication of the American Association of Orthodontists, its Constituent Societies, and the
American Board of Orthodontics, 125(3), 337-341. doi:10.1016/S0889540603010084
Vilar, R. V., Souza, N. F., Cal-Neto, J. P., Galvao, M., Sampaio-Filho, H., & Mendes Ade, M.
(2009). Shear bond strength of brackets bonded with two light-curing orthodontic adhesives.
The Journal of Adhesive Dentistry, 11(4), 259-262.
Wiltshire, W. A. (1994). Shear bond strengths of a glass ionomer for direct bonding in
orthodontics. American Journal of Orthodontics and Dentofacial Orthopedics : Official
Publication of the American Association of Orthodontists, its Constituent Societies, and the
American Board of Orthodontics, 106(2), 127-130.

83
Wiltshire, W. A. (2012a). In Vivek Cheba (Ed.), Discussion on orthodontic shear bond strength
testing
Wiltshire, W. A. (2012b). In Cheba V. (Ed.), Discussion on orthodontic shear bond strength
testing
Wiltshire, W. A., & Noble, J. (2010). Clinical and laboratory perspectives of improved
orthodontic bonding to normal, hypoplastic, and fluorosed enamel. Seminars in
Orthodontics, 16(1), 55-65. doi:10.1053/j.sodo.2009.12.005
Yuasa, T., Iijima, M., Ito, S., Muguruma, T., Saito, T., & Mizoguchi, I. (2010). Effects of long-
term storage and thermocycling on bond strength of two self-etching primer adhesive
systems. European Journal of Orthodontics, 32(3), 285-290. doi:10.1093/ejo/cjp118
Related Documents