THE EFFECT OF COMPETITIVE ADVANTAGE ON CUSTOMER ATTRACTION TO RIDE HAILING APPS. A CASE STUDY OF USIU-AFRICA BY STELLA WANJIRU GITAU UNITED STATES INTERNATIONAL UNIVERSITY AFRICA SUMMER 2018

Welcome message from author
This document is posted to help you gain knowledge. Please leave a comment to let me know what you think about it! Share it to your friends and learn new things together.
Transcript
THE EFFECT OF COMPETITIVE ADVANTAGE ON CUSTOMER
ATTRACTION TO RIDE HAILING APPS. A CASE STUDY OF USIU-AFRICA
BY
STELLA WANJIRU GITAU
UNITED STATES INTERNATIONAL UNIVERSITY AFRICA
SUMMER 2018
THE EFFECT OF COMPETITIVE ADVANTAGE ON CUSTOMER
ATTRACTION TO RIDE HAILING APPS. A CASE STUDY OF USIU-AFRICA
BY
STELLA WANJIRU GITAU
A Research Project Submitted to the Chandaria School of Business in Partial
Fulfilment of the Requirement for the Degree of Masters in Business Administration
(MBA)
UNITED STATES INTERNATIONAL UNIVERSITY AFRICA
SUMMER 2018

ii
STUDENT’S DECLARATION
I, the undersigned, declare that this is my original work and has not been submitted to any
other college, institution or university other than the United States International
University- Africa in Nairobi for academic credit.
Signed: __________________________ Date: _____________________________
Stella Wanjiru Gitau (ID No. 630887) This project has been presented for examination with my approval as the appointed
supervisor.
Signed: __________________________ Date: _____________________________
Timothy Okech, PhD
Signed: __________________________ Date: _____________________________
Dean, Chandaria School of Business

iii
COPYRIGHT
© Copyright by Stella Wanjiru Gitau 2018
All rights reserved. No part of this project report may be produced or transmitted in any
form or by any means, electronic, mechanical, including photocopying, recording or any
information storage without prior written permission from the author.

iv
ABSTRACT
The purpose of this study was to establish the effect of competitive advantage on
attracting customers to a ride hailing app basing on USIU-Africa students. The research
questions of the study investigated on: the extent at which cost leadership influences
customer attraction to a ride hailing app, the effect of differentiation on customer
attraction to a ride hailing app and the influence of focus strategy on customer attraction
to a ride hailing app.
The descriptive research design was used to obtain data that defined the characteristics
of the purpose of this study by measuring the features in the research questions. A
structured questionnaire was used to collect primary data from the target population of
USIU-Africa students. The researcher used simple random sampling technique to attain
the sample size of 173 students across the three education levels: undergraduate, masters
and doctorate. Descriptive statistics such as mean, standard deviation and inferential
statistics, which include: correlation analysis and regression analysis, were used to test
the influence of competitive advantage on attracting customers to ride hailing apps.
Analysis of the first research question determined the impact of cost leadership on
customer attraction to a ride hailing app. The findings revealed that majority of
respondents are attracted to their preferred ride hailing apps because of low prices. From
the findings Uber emerged as the most preferred ride hailing app demonstrating the
firm has embarked on gaining competitive advantage by having the lowest cost in the
industry. One of the ways which Uber offer customers low prices is through discounts
which most of the respondents agreed attracts them to the ride hailing app. The study
also revealed that most of the respondents agreed the price charged represents the value
of money. This indicates though the preferred ride hailing apps offer services at a lower
cost they endeavour to offer quality standard services.
Examination of the second research question established the effect of differentiation on
customer attraction to a ride hailing app. Based on most of the respondents agreed their
preferred ride hailing app has better features compared with the rest. This signifies the
firms have invested in offering unmatched services to deliver superior value to a wide
range of customers to become the preferred brand of choice in the industry. Based on
the outcome of the survey most of the respondents indicated the drivers of their

v
preferred ride hailing app are readily available, they are professional and the cars are in
good condition. This depicts the ride hailing apps have assimilated the functioning
processes between the customers and the drivers to offer superior services and achieve
competitive advantage through differentiation.
Investigation of the third objective determined how the focus strategy influences
customer attraction to a ride hailing app either through low cost or differentiation focus.
The result findings demonstrated focus strategy has an impact on attracting customers
to ride hailing apps either through the low-cost focus or the differentiation focus
strategy. This is based on the result findings that indicated most respondents are willing
to switch to the cheapest app also to the app with the best services. The respondents
willing to switch to the cheapest app represent the extremely cost-conscious customers
while those who were willing to switch to the app with the best services represents the
customers who are in pursuit of the best value in specialty services which come at a
high price that they don’t mind paying for.
The study concludes that while cost leadership, differentiation and focus strategies does
influence customer attraction to ride hailing apps, a combination of all three brings
forth a higher competitive edge. However, it was noted that cost leadership strategy has
the greatest impact on attracting customers to ride hailing apps.
It was recommended that for the ride hailing apps to achieve competitive advantage
they need to: pay attention to proprietary technology to produce the most efficient
services in the market and sell it at the lowest price, use technology to attain the cutting
edge of innovation that will help limit easy imitation of the firm’s distinctiveness and
extensively scan the environment and possess intimate knowledge that will help
identify the best niche to concentrate on either low cost or differentiation. For further
studies, there is a need to undertake a study to establish the effect of competitive
advantage on attracting drivers to partner with the ride hailing apps.
vi
ACKNOWLEDGEMENT
I would like to acknowledge my parents Mr. & Mrs. Gideon and Ruth Gitau for their
moral and financial support as well as my dear sisters Nancy and Polly Gitau for the
constant motivation. My gratitude also goes to my supervisor; Dr. Timothy Okech, all my
lecturers since undergraduate, classmates, colleagues and everyone whose contribution
and positive criticism accelerated, aided and enhanced this study. Thank you all.

vii
DEDICATION
This study is dedicated to my parents Mr. & Mrs. Gideon and Ruth Gitau for their love
and devotion to my destiny of greatness.

viii
TABLE OF CONTENTS
STUDENT’S DECLARATION ....................................................................................... ii
COPYRIGHT ................................................................................................................... iii
ABSTRACT ....................................................................................................................... iv
ACKNOWLEDGEMENT ................................................................................................ vi
DEDICATION ................................................................................................................ vii
LIST OF TABLES ............................................................................................................. x
LIST OF FIGURES .......................................................................................................... xi
LIST OF ACRONYMS AND ABBREVIATIONS ...................................................... xii
CHAPTER ONE ................................................................................................................ 1
1.0 INTRODUCTION ....................................................................................................... 1
1.1 Background of the Problem ....................................................................................... 1
1.2 Statement of the Problem ........................................................................................... 3
1.3 Purpose of the Study .................................................................................................. 4
1.4 Research Questions .................................................................................................... 4
1.6 Significance of the Study ........................................................................................... 4
1.7 Scope of the Study ..................................................................................................... 5
1.8 Definitions of Terms .................................................................................................. 6
1.9 Chapter Summary ...................................................................................................... 6
CHAPTER TWO ............................................................................................................... 8
2.0 LITERATURE REVIEW ........................................................................................... 8
2.1 Introduction ................................................................................................................ 8
2.2 Influence of Cost Leadership on Customer Attraction .............................................. 8
2.3 Influence of Differentiation on Customer Attraction .............................................. 13
2.4 Influence of Focus on Customer Attraction ............................................................. 18
2.5 Chapter Summary .................................................................................................... 23
CHAPTER THREE ......................................................................................................... 24
3.0 RESEARCH METHODOLOGY ............................................................................. 24
3.1 Introduction .............................................................................................................. 24
3.2 Research Design ...................................................................................................... 24
3.3 Population and Sampling Design ............................................................................. 25
3.4 Data Collection Methods ......................................................................................... 27
3.5 Research Procedure .................................................................................................. 27
3.6 Data Analysis Methods ............................................................................................ 27
3.7 Chapter Summary .................................................................................................... 27
CHAPTER FOUR ............................................................................................................ 29
ix
4.0 RESULTS AND FINDINGS ..................................................................................... 29
4.1 Introduction .............................................................................................................. 29
4.2 Response Rate and Background Information .......................................................... 29
4.3 The Effect of Cost Leadership Strategy on Customer Attraction ............................ 33
4.4 The Effect of Differentiation Strategy on Customer Attraction .............................. 36
4.5 The Effect of Focus Strategy on Customer Attraction............................................. 39
4.6 Chapter Summary .................................................................................................... 42
CHAPTER FIVE ............................................................................................................. 43
5.0 DISCUSSION, CONCLUSION AND RECOMMENDATIONS .......................... 43
5.1 Introduction .............................................................................................................. 43
5.2 Summary .................................................................................................................. 43
5.3 Discussion ................................................................................................................ 44
5.4 Conclusion ............................................................................................................... 51
5.4. Recommendation .................................................................................................... 51
REFERENCES ................................................................................................................. 53
APPENDICES .................................................................................................................. 62
Appendix I: Cover Letter ............................................................................................... 62
Appendix II: Questionnaire ............................................................................................. 63

x
LIST OF TABLES
Table 3.1: The Population of USIU-Africa........................................................................ 25
Table 3.2: Sample Size Distribution .................................................................................. 26 Table 4.1: Response Rate ................................................................................................... 29
Table 4.2: Car Ownership .................................................................................................. 31
Table 4. 3 Reasons why the Respondents Prefer the Selected Ride Hailing App ............. 32
Table 4.4: The Effect of Cost Leadership Strategy on Customer Attraction ..................... 34
Table 4.5: Correlation results on the Effect of Cost Leadership Strategy on Customer
Attraction ........................................................................................................................... 35
Table 4.6: ANOVA on Cost Leadership Strategy ............................................................. 36
Table 4.7: The Effect of Differentiation Strategy on Customer Attraction ....................... 37
Table 4.8: Correlation results on the Effect of Differentiation Strategy on Customer
Attraction ........................................................................................................................... 38
Table 4.9: Regression Analysis on Differentiation Strategy ............................................. 39
Table 4.10: ANOVA on Differentiation Strategy .............................................................. 39
Table 4.11: The Effect of Focus Strategy on Customer Attraction ................................... 40
Table 4.12: Correlation results on the Effect of Focus Strategy on Customer Attraction . 41
Table 4.13: Regression Analysis on Focus Strategy .......................................................... 42
Table 4.14: ANOVA on Focus Strategy ............................................................................ 42

xi
LIST OF FIGURES
Figure 4.1: Gender ............................................................................................................. 30
Figure 4.2: Current Level of Education ............................................................................. 30
Figure 4.3: The Preferred Ride Hailing App ..................................................................... 31
Figure 4.4: Frequency of Usage ......................................................................................... 32
Figure 4.5: Amount Spent in a Week on Ride Hailing Apps ............................................ 33
xii
LIST OF ACRONYMS AND ABBREVIATIONS
ANOVA - Analysis of Variances
GPS - Global Positioning System
DF - Degrees of Freedom
SD - Standard Deviation
SPSS - Statistical Package for Social Sciences
1
CHAPTER ONE
1.0 INTRODUCTION
1.1 Background of the Problem
Competitive advantage is one of the earliest concepts in the strategic management
literature which has been studied by key academics that have immensely contributed to
this field. Ansoff defined competitive advantage as the unique opportunities within the
growth vector and product-market scope that gives firms a strong competitive position
(Sigalas, Economou, & Georgopoulos, 2013). Correspondingly, Porter described the
firm’s ability to position itself favorably in an industry to outdo competition as
transformation of the competitive strategy into a competitive advantage (Meihami &
Meihami, 2013). Wang (2014) indicated that a firm will possess competitive advantage
over its competitors when it earns a persistently higher rate of profit due to inimitable,
distinctive, rare and valuable firm-level resources.
In recent studies, competitive advantage has been defined as the benefit gained by firms
over competitors when they offer customers with greater value, either by providing
additional benefits or through lower prices (Attiany, 2014). This can be likened to the
observations made by Wang (2014) that when companies create more economic value
than the marginal competitor, it indicates the firm has gained competitive advantage.
Superior firm performances relative to its rivals in the industry also serve as an empirical
indicator of gaining competitive advantage (Schilke, 2014).
In recent years, there has been an upturn in the number of innovative app-based ride
services, generally referred to as Commercial Transport Apps (International Transport
Forum, 2016). The ride hailing apps have become popular due to superior consumer
value than most current services in metropolitan areas (City of New Orleans, 2016). In a
recent study of the ride hailing market, MarketsandMarkets (2017), observed that the
industry is expected to grow at a compound annual growth rate of 19.81% through the
forecast period of 2017, to reach USD 276.00 Billion by 2025. The main global players
dominating the market include: Uber Technologies Inc. (U.S.), Denso Corporation
(Japan), Delphi Automotive Plc (U.K.), TomTom NV (The Netherlands) and Intel
Corporation (U.S.) (Goldman Sachs, 2017).
2
Taxis had long been one of the leading forms of transportation in most of the cities
around the world. In the late 1930, most cities had placed government regulations to
combat the oversupply, stabilize prices, ensure the safety and quality of taxis, as well as
give drivers a habitable wage (Snead, 2015). Snead observed that the industry now faces
competition from a new type of transportation service dubbed ride-sharing with
emergence of companies like Uber, Lyft and other competitors offering smartphone
applications that link riders with drivers. A passenger would request a ride through the
mobile application, which then links the passenger’s location to a driver via GPS. These
apps charge a distance variable fare; approximately 80% of which goes to the driver
while the remaining goes to the ride sourcing service. Many of these applications
maintain a rating system that allows drivers and passengers to rate each other after the
trip is completed (Rayle, Shaheen, Chan, Dai, & Cervero, 2014).
Kenya has witnessed the era of digital revolution that has contributed to the fast growth
of information and communications technology (ICT) affecting all stakeholders including
users, operators, and the government (Mureithi, Ndemo, & Weiss, 2017). Several internet
companies have set up shop, including the ride hailing apps which have been welcomed
by consumer bodies and residents in Nairobi (Wesangula, 2016). The digital taxi space
has experienced an increase in innovations ever since the arrival of Uber in 2015
followed by Taxify; the Estonian app and Mondo Ride; the Dubai Based app (Kumar,
2016). Local based firms such as Safaricom also entered the fray through Little Cab and
Sendy. Senga, a Kenyan startup was launched in public beta, also entered the fray to offer
an on-demand platform linking shippers and transporters of goods (Njanja, 2016).
The increased innovations within the digital taxi space has brought about rivalry among
the ride hailing apps within the industry leading to the delivery of low-priced and
dependable transport preferences, along with varieties of fresh promos and IT product
offerings (Bright, 2016). The rivalry among the ride hailing apps has forced them to
aggressively innovate to maintain the grip in the battle of attracting more customers to
use their app (Wesangula, 2016). Herbling (2016), indicates the innovations pursued by
the key players in the lucrative but chaotic ride hailing space are geared towards not only
lowering fares to woo passengers but also offering value to customer.
3
The players in the Kenya ride hailing space are facing the pressure to offer value to
customers by expanding their services through additional benefits like the free WI-FI
provided by Little Cab to its customers (Design Your World, 2016). This requires the
ride hailing apps to differentiate themselves by looking at what they are offering with
bundled services in their vehicles and offer greater value to their customers (Bright,
2016). Oloo (2016), remarks the ride hailing apps have to constantly add value to
customers as a result the stiff competition to gain market share that has been brought
about by aggressive counters among the key players on the product options that find high
traction in the market. Bright further notes, the winner in the ongoing market share wars
have been the Nairobi residents due to the concurrent price reductions and service
expansion.
1.2 Statement of the Problem
Organizations set out to achieve competitive advantage in their day to day activities
subsequently gaining economic success (Hana, 2013). This success is achieved when the
economic value created is grander than that of its competitors, if it is equivalent to the
competitors, the organization is said to have competitive parity, and if it is subordinate
than its competing organizations it is deemed to have a competitive disadvantage (Sabol
& Sverer, 2016). Moreover, an organization will gain competitive advantage when their
target market customers perceive their products or services to be better than those of its
competitors (Dash, 2013). However, as highlighted by Hana, there is need for companies
to outdo competition and attract new customers through innovation with heavy reliance
on the top management’s support to gain competitive advantage.
This study sought to establish how the various ride hailing apps are innovating to achieve
economic success by attracting customers through creation of greater economic value.
Research has been conducted on the ride hailing apps focusing on the significance and
disruption in several countries across America and China to provide discernments into
the nature and dynamics of competition within this industry (Lee, 2017). In Africa
various reports have been published depicting the current state of ride hailing apps in
Africa and the emerging rivalry in the ride-sharing economy among the 56 ridesharing
services in Africa (Oreva, 2016).
4
In Kenya very, studies have been carried out on the ride hailing apps due to the recent
entry of the companies into the Kenyan market. A topical study carried out by Onyango,
(2016) concentrates on the adoption of ride hailing applications and the competitiveness
of the app-based taxi operators in Nairobi, Kenya. This study investigated the relation
between e-application adoption and the competitiveness of an organization. Nonetheless,
it did not address how the various ride hailing companies have adopted the competitive
advantage strategy to attract customers to use their apps instead of their competitors
which will be the case in this study. The study by Ang'asa, (2017), investigated the
competitive strategies adopted by the ride hailing companies in Nairobi to sustain
competitive advantage in the taxi industry. It sought out to identify the competitive
strategies the various ride hailing service providers employ in Nairobi and the effect it
has on the competitive advantage attained within the ride hailing sector. Just like
Onyango’s study, this study didn’t address how the competitive strategies adopted by the
various ride hailing apps have influenced customer attraction to their apps.
1.3 Purpose of the Study
The purpose of this study was to establish the influence of competitive advantage on
attracting customers to a ride hailing app basing on USIU-Africa students.
1.4 Research Questions
The following research questions guided the study:
1.4.1. To what extent does cost leadership influence customer attraction to a ride hailing
app?
1.4.2. What is the effect of differentiation on customer attraction to a ride hailing app?
1.4.3. How does focus influence customer attraction to a ride hailing app?
1.6 Significance of the Study
The study aimed at providing valuable info that may prove essential to the following
stakeholders:
1.6.1 Researchers and Academicians
The research is aimed at contributing considerably to the body of knowledge on the effect
of competitive advantage on attracting customers to a ride hailing app within Nairobi
5
County. The study has provided acumen by investigating the pursuit of the various ride-
hailing service apps to gain competitive advantages which translates to customer
attraction and equates to economic success. The references used will also be of
importance to scholars for further reading.
1.6.2 Ride Hailing Companies
The study will offer additional information to the management of the ride hailing
companies by providing the perception that the target market customers have on their
apps. The results will be beneficial in their strategic planning and development which
they can use to improve their services to gain competitive advantage as well as market
share.
1.6.3 Policy Makers and Regulators
Policy makers and regulators in the transport industry will benefit from this study as
they will be enlightened on the ride hailing services. This will enable them to make
informed decision when developing policies to improve the industry as well as solve
challenges driving the Kenyan government’s vision of 2030.
1.7 Scope of the Study
The geographical scope of this study was limited to Nairobi County which has been the
setup base for new entrants into the Kenyan Market for the ride hailing apps. This has
been attributed by the huge market which has an estimated population of about 3.1
Million creating a base that can house at least 20 competitive ride hailing apps (Jackson,
2015). The industry has been getting busy ever since the entry of Uber; the first ride
hailing app into the market in 2015 recording100, 000 hits a month (Bright, 2016). Little
cab on the other handset up shop in 2016 and was recording 10, 000 rides a day one year
down the line (Africanews, 2017). The population considered for this study was limited
to USIU-Africa students who were session in Summer 2018. They come from various
parts of Nairobi County and tend to use the ride hailing apps frequently.
6
1.8 Definitions of Terms
1.8.1 Competitive Advantage
It refers to the way an organization utilizes its resources and capabilities to create value
through strategy that their competitors will find it very difficult to imitate (Rasiah,
Kanagasundram, & Lee, 2013).
1.8.2 Customer Attraction
It denotes a stage that entails informing the customers on the value proposition offered by
the organization hence drawing them to use its products (Doligalski, 2014).
1.8.3 Ride Hailing Apps
These are smartphone applications that connect drivers with riders by communicating the
rider’s location to the drivers via GPS (Rayle, Shaheen, Chan, Dai, & Cervero, 2014).
1.8.4 Cost Leadership Strategy
It focuses on gaining competitive advantage through emphasis on production of
standardized products at very low cost compared to competitors to attract the price-
sensitive customers (Scheele, 2014).
1.8.5 Differentiation Strategy
It involves seeking to gain an advantage over other players within an industry by
distinguishing products attributes to establish eminence in a wide market scope (Shilbury,
Westerbeek, Quick, Funk & Karg, 2014).
1.8.6 Focus Strategy
It entails gaining a competitive advantage either through cost leadership or differentiation
tactic in a niche or narrow market (Shilbury, Westerbeek, Quick, Funk, & Karg, 2014).
1.9 Chapter Summary
This chapter has provided a background elaborating on competitive advantage, customer
attraction and e-hailing apps while adopting the funnel approach. Furthermore, the
research questions related to effect of competitive advantage on customer attraction to
ride hailing apps have been depicted. The scope and the importance of carrying out the
study have also been shown. Chapter two will cover the literature review in relation to the
7
research questions then chapter three will give details on the methodology to be used.
Chapter four provides the findings, while Chapter five contains the summary of the
findings, discussions, conclusion and recommendations.
8
CHAPTER TWO
2.0 LITERATURE REVIEW
2.1 Introduction
This chapter analyses literature on competitive advantage highlighting the effects it has
on customer attraction. It is categorized into the three research questions; cost leadership,
differentiation and focus strategy. Literature per research question is examined to show
how each helps to achieve competitive advantage to attract customers.
2.2 Influence of Cost Leadership on Customer Attraction
Cost leadership is a strategy that emphases on a firm gaining competitive advantage by
having the lowest cost in the industry through pursuit of economies of scale, proprietary
technology and access to raw materials (Arasa & Gathinji, 2014).It is based on achieving
operational efficiency by adopting different resource allocation methods such as
benchmarking, cost reduction, large-scale facilities, process improvements and overhead
control (Banker, Mashruwala, & Tripathy, 2014).The strategy entails attracting customers
to win the majority market share in the industry by either having the lowest price to value
ratio or the lowest prices in the target market segment (Nyauncho & Nyamweya, 2017).
Cost Leadership has been defined by several authors. Hilman and Kaliappen (2014),
defines cost leadership as one of the generic approaches to competitive advantage that
employs numerous activities like demand forecasting, economies of scale, high capacity
utilization, learning curve, outsourcing and technology advancement to achieve
competitive advantage by means of having the lowest cost within the industry. Garg,
Priem, and Rashe, (2013) also define cost leadership as a generic strategy that is based on
a set of functional policies aimed at aggressively lowering costs in the industry by means
of intense supervision of labor, a low-cost distribution system, process engineering skills,
products designed for ease of manufacture and a sustained capital investment.
Teeratansirikool, Badir and Charoenngam (2013), describe cost leadership as a cohesive
set of activities related to organizational performance pursued to produce goods and
services sold to customers at the lowermost cost compared to competitors in the industry
to achieve competitive advantage. Therefore, cost leadership entails managing
organizational activities to become the industry leader in producing the lowest priced
products to attract as many customers as possible.

9
Producing the lowest goods and services in a market focuses on a firm’s ability to set the
lowest price of their products thru production of standard goods and services aimed at
attracting the price sensitive customers (Hardjito, 2015). Placing a premium on
operational efficiency in the production of standard goods and services ensures there is
control in every expense ensuring the firm has the lowest cost structures within the
industry (Jeong, Lee, & Kim, 2017).The low-cost structures in a firm are dependent on
variables that drive a company within a specific industry to reach the bottommost cost in
the industry and achieve the cost leadership position (Bertozzi et al. 2017).
Drivers of cost leadership strategy have been defined by various authors who have
attributed them as variables that determine its success and sustainability. Tanwar (2013),
notes that an efficacious cost leadership strategy involves a significant market share
advantage, preferential access to raw materials as well as important component or input
such as inexpensive labor to reduce the easiness of competitors mimicking the strategy.
Banker et al. (2014), indicates: cost efficiency, economies of scale and capitalizing on
learning effects as the drivers of a successful cost leadership strategy which are built on
history, uncertainty, or socially complex resources and capabilities. Kubai and Waiganjo
(2014) describes a firms capabilities as a driver of cost leadership which enables
innovation, efficiency, quality and most importantly customer attraction thus positioning
the firm at a cost advantage thru delivering the same benefit as competitors but at a lower
cost. In this study: pursuit of economies of scale, proprietary technology and access to
raw material, will be discussed as the three sources of cost leadership that results to
customers attraction.
2.2.1 Pursuit of Economies of Scale
Economies of scale are returns of cumulative production factors that enable a firm to
form competitive advantages in decreasing average fixed costs equating to a falling long-
run average cost function (Ariffin, Sulaiman, Mohammad, & Yaman, 2016). It exists
when the volume of output increases while the average cost per unit decreases (Besanko,
Dranove, & Schaefer, 2012). For instance, a company producing widgets using only one
input (labor) will double its output if the input of labor is increased and subsequently the
average amount of labor required per widget will decrease as the output increases
(Krugman, Maurice, & Melitz, 2014). Once a firm realizes economies of scale, prices are

10
reduced as an effect of low costs consequently attracting more customers because of
efficiencies created by larger operations (Council Of Economic Advisers, 2016).
Several authors have defined the two main kinds of economies of scale as external and
internal. Krugman, Maurice and Melitz (2014) distinguishes external economies of scale,
which arises when the cost per unit of output relies on the size of the industry from
internal economies of scale, which arises when the cost per unit of output relies on the
size of a firm. Turok and McGranahan (2013), also differentiates the external aspect of
economies of scale that enables a firm to gain benefits from being close to other firms in
the industry due to reduced transaction costs from the internal aspect of economies of
scale that relates to the lower unit costs resulting to larger-scale production. Additionally,
Rivera, Sheff andWelsch (2014) discusses external economies of scale as a subsequent of
multiple firms within an industry agglomerating geographically as opposed to internal
economics of scale where a single firm enlarges its production.
Internal economies of scale are interior to the firm and relay to the efficiencies or lower
unit costs that are as an outcome of a larger-scale production (Turok & McGranahan,
2013).Firms attain internal economies of scale through efficient use of specialized
knowledge and expertise within the internal structure (Ariffin, Sulaiman, Mohammad, &
Yaman, 2016). Similary, increase in internal efficiency results to attaining scale
economies through cooperation networks( Camagni, Capello , & Caragliu, 2014).The
levels of returns that a firm would enjoy are determined by the level of resource
utilization which includes: technology, labor, capital and the production system
(Nikiforos, 2013). Apart from theinternal economies of scale there are the external
economies,which apply to the overall economic activity within a specific industry.
External economies of scale are a subsequent of several firms agglomerating
geographically to bring about either urbanization which arise from several firms in
different industries concentrating in the same region or localization which ascend from
several firms in one industry concentrating in the same region (Rivera, Sheff, & Welsch,
2014). The benefits that arise from firms agglomerating geographically include; efficient
production due to advantages of specialization, economies of large scale operation,
11
common infrastructural facilities, and rapid overall development of the economy (Mitra,
2014).
2.2.2 Proprietary Technology
Proprietary technologies take in equipment, ideas and resources that are developed
internally by firms to circumvent duplication thus playing avital role in attaining
competitive advantage (Jina, Vonderembseb, & Ragu-Nathan, 2013). Firms can utilize
proprietary technology to attain competitive advantage by producing the most efficient
products or services in the market and selling it at a low price (Sterman, 2014) .Product
and process innovation paves way for firms to produce effectual products and services
resulting to superior business performance (Almor, 2014).
Product innovation constitutes the attainment of new technological knowledge through
the development of new products or in the enhancement of existing ones (Martín-de
Castro, Delgado-Verde, Navas-López, & Cruz-González, 2013). It enables firms to open
new markets by changing the rules of the game in the industry (Lew & Sinkovics,
2013).Grant (2016), describes product innovation as the procedure of designing products
for ease of production to offer significant cost savings to the firm. Grant supplements his
description by giving an example of Motel 6, the cost leader of US budget motels. Motel
6 has carefully designed its products to keep functioning at low cost by occupying
inexpensive out of town locations, adopting standard motel designs, designing rooms to
enable easy cleaning and maintenance and also avoiding facilitites such as restaurants and
pools.
Process innovation refers to the execution of a new or significantly enhanced production
or delivery method that comprises of substantial changes in techniques, equipment and
software (Atalay, Anafarta, & Sarvan, 2013). Shortening of the production time and
speeding up of new product development in comparison to competitors is enabled
through innovation of processes (Hana, 2013).Grant (2016), explicates that when process
innovation is embodied in new capital equipment, the outcome is superior processes that
are a huge source of cost economies. Grant backups his explanation by giving an example
of Dell’s cost leadership in personal computer during the 1990s which was a consequence
of reconfiguring the industry traditional value chain.
12
2.2.4 Preferential Access to Raw Materials
One of the key variables that drive the success of the cost leadership strategy is the
preferential access to raw materials that allows firms to keep the costs at the minimum
probable level making it very difficult for competitors to imitate (Tanwar, 2013). In
addition, for a firm to reduce diseconomies of scale and logistics it is essential to establish
an efficient supply chain capitalizing on preferential access to raw materials (Dansereau,
El-Halwagi, Chambost, & Stuart, 2015).Maintaining the cost leadership position entails
having a superior source of raw materials to reduce lead time and avoid delays involved
in the procuring process (Samarasinghe, Ariadurai, & Perera, 2015). Therefore, with
preferential access to raw materials firms can attain a cost advantage position that allows
them to make above average returns as well as command price in the market (Atikiya,
2015).
Preferential access to raw materials is highly dependent on various factors. Proximity to
the raw materials from suppliers is one of the factors that deliver a quick turnaround time
in the procuring process (Atikiya, 2015). Properly planned and programmed lead-times is
another factor that enables firms to reconcile low cost with high quality as well as
technological progressiveness offering a substantial opportunity for developing cost
advantage (Samarasinghe et al. 2015). Very efficient procuring logistics and lower cost
base of raw materials compared to those of competitors gives firms an opportunity to
reduce the cost of its products positing it as a cost leader in the market (Fathali, 2016).
The government can be considered as a major contributor to a firm gaining access to raw
materials. For instance, South Korea has been successful in promoting cost-effectiveness
in local firms by supplying EPZ factories preferential access to intermediate and raw
materials (Bräutigam & Tang, 2014). With preferential access to raw material the gap
amid the unit price and the unit cost widens, providing a greater cost advantage to firms
in the specified markets (Mishra, 2015).
There are numerous benefits that a firm stands to gain from preferential access to raw
materials that consequently builds up to cost advantage. An efficient supply chain is one
of the gains and it result to a higher volume production without increasing the unit cost
(Dansereau, El‐Halwagi, Chambost, & Stuart, 2014). The aptitude to square low cost with
high quality and technological modernism is another gain which is well experienced with
13
Japanese companies in consumer goods industries such as consumer electronics, cars,
motorcycles, and musical instruments (Atikiya, 2015).One more benefit includes
operational excellence on the procuring side that results from significant investments in
raw materials including preferential access (Wu, Gao, & Gu, 2015).
2.3 Influence of Differentiation on Customer Attraction
Differentiation is the act of designing a set of meaningful modifications to distinguish the
company's offerings from that of the competitors with the objective of retaining existing
customers as well as attracting new ones (Semuel, Siagian, & Octavia, 2017). A firm can
differentiate itself by being unique in the industry along the dimensions of its product or
service that is widely valued by customers because their needs are satisfied (Tanwar,
2013). Mutongi & Chiwanza (2016) state that when an organization distinguishes its
products from all other players in the industry, it is deemed to be employing
differentiation strategy by capitalizing on competitive advantage. Companies with this
strategy tend to create unique products that are valued by customers to allow a price
premium that translates to profit margin with emphasis on product design, the supply
chain and the marketing approach (Kinyuira, 2014) .
Differentiation has been defined by various writers. Bertozzi et al. (2017), define
differentiation as one of the generic approaches to competitive advantage that entails the
production of unique products or service to set a firm’s offerings apart from those of
competitors within the industry thus attracting customer with exquisite taste or with a
peculiar knowledge on subject. Isfahan and Yaghoobi (2014), also define differentiation
as the ability of a firm to offer unique and superior value to the customers thru specific
features of a product or service after the sale with the objective of attracting customers
who concentrate on the brand and are insensitive to high prices. Hales and Mclarney
(2017), describes differentiation as a channel used by firms to achieve competitive
advantage by offering unmatched products or services that deliver superior value to a
wide range of customers who in return pay higher prices that positions a firm to earn
higher returns enabling it to outdo the competition within the industry. Therefore,
differentiation strategy entails seeking distinction in the industry thru superior products
and brands to attract a broad spectrum of customers and achieve competitive advantage.
14
Means of achieving competitive advantage through differentiation is a journey rather than
destination, therefore there are various courses explained by different authors on how
firms can achieve this strategy. Yang, Sonmez, Li and Duan (2014), notes that an
effective differentiation strategy attracts customers, creates fulfilment and boosts brand
performance by means of innovative technology, superior quality as well as brand image.
Mnjala (2014), indicates the key aspects of differentiation strategy includes uniqueness in
product, brand as well as technology enabling firms to produce goods and services that
competitors are not yet offering or are not able to copy. Chege and Bula (2015) indicate
research and development is the gateway for firms to achieve differentiation strategy and
attract custromers by developing the most unique products in the industry that utmost
satisfies their needs. In this study: product differentiation, the supply chain differentiation
and the marketing approach will be conversed as the drivers of the differentiation strategy
that results to attracting customers.
2.3.1 Product Differentiation
Becerra, Santaló and Silva (2013), viewed product differentiation as one of the ways for
firms to rise above competitors and obtain superior performance. It occurs when a firm
pursues competitive advantage to increase the perceived value of its products comparative
to the perceived value of other firm's products (Nolega, Oloko, William, & Oteki, 2015).
New product attributes are added to differentiate a firm’s products from those of
competitors to attract customers by providing them with a greater brand choice
(Grundvag, Larsen, & Young, 2014).Various scholars have reviewed product
differentiation based on the distinction between vertical and horizontal differentiation.
Vertical differentiation offers variance by conversing status or indicating one’s
superiority to others in a group whereas horizontal differentiation offers variance through
the expression of personality, taste, and traits (Dommer, Swaminathan, & Ahluwalia,
2013). Silva (2015) illustrate their distinction by describing vertical differentiation as a
process entailing a firm making its products more attractive to all customers while
horizontal differentiation as a process entailing a firm making its products more attractive
to some customers and less attractive to others. In competition; horizontal differentiation
is experienced during the early stages of industry development whereas vertical
differentiation is experienced as the industry matures with new entrants having an upper

15
hand in beating incumbents (Becerra, Santaló, & Silva, 2013).From this perspective;
vertical differentiation is about a firm being the preferred option to all customers while
horizontal differentiation is about a firm being different to a customer segment.
Vertical differentiation refers to a firm moving to a superior position in the industry by
improving some product features without deteriorating any and in a costly manner
increasing both the customers’ willingness to pay and the firm’s variable cost (Makadok
& Ross, 2013). In the occasion of vertical differentiation where available products are
offered at an equal price; all customers will settle for these products in a preference
ranking as the competition shapes up to only one dimension with the most differentiated
firm providing the highest level of such a dimension in the industry (Becerra, Santaló, &
Silva, 2013). Consumers are presumed to want higher quality, although they may differ
in their willingness to pay for quality improvements and as such firms are able to increase
prices and subsequently the economic value (Silva, 2015).
Horizontal differentiation is primarily based on a product’s qualities and it refers to a
scenario where two firms in an industry are competing in a market where customers differ
on their level of a product attribute (Makadok & Ross, 2013). Firms obtain different
market shares in pursuit of horizontal differentiation despite selling all products at an
equal price due to the unique combination of product attributes that are preferred by one
specific set of customers with similar needs thus limiting the degree of substitutability
among competing firms (Becerra, Santaló, & Silva, 2013). Consumers are reputed to have
different preferences regarding the attributes of a given firm or product; thus, even if
products are offered at the same price, each will have a positive market share (Silva,
2015).
2.3.2 The Supply Chain Differentiation
Various scholars have studied the various elements of supply chain illustrating how each
brings about differentiation to deliver competitive advantage. Estampe, Lamouri, Paris
and Djelloul (2013), explicates how supply chain is one of the key element in a firm’s
competitiveness viewed as the keystone of the differentiation strategy that involves
assimilating all important operative processes at any level between the final users and
original suppliers to offer supplementary value to customers and other stakeholders.
16
Blome, Schoenherr and Rexhausen (2013) denotes supply agilitywhich refers to a firm’s
ability to effectively and quickly respond to changes in its environment in conjunction
with its key suppliers and customers, as a source of competitive differentiation. Huo, Qi,
Wang and Zhao (2014) describes how supply chain integration aids firms to reconfigure
their resources and capabilities internally and externally to merge their supply chain to
improve performance and gain competitive advantage through differentiation.
In this study the literature analysis will focus on supply chain integration. It refers to the
degree at which a firm tactically joins forces with its supply chain partners and
collaboratively thru external integration as well as internal integration (Huo, Qi, Wang, &
Zhao, 2014) . Supply chain integration can be viewed as a strategic resource that leads to
competitive advantage through differentiation by developing unique capability and
excelling in integrating with firms in the supply chain (Leuschner, Roger, & Charvet,
2013). Huo et al.( 2014), identify the components of supply chain integration as a process
and product integration which are effective in improving a firm’s performance attributing
to competitive advanatge through differentiation.
Product integration denotes the involvement of suppliers and customers in the
development of new products and purposes to support such development through close
relations with the supply chain partners (Huo, Qi, Wang, & Zhao, 2014) . It is also
referred to as external integration which involves the strategic alignment of information
distribution, business processes and collaboration with suppliers and customers (Wong,
Wong, & Boon-itt, 2013).The advantage of product integration is primarily streamlining
business processes with the goal of meeting customer demand through new product
formation and innovation (Blackhurst, Cantor, & Crum, 2015).
Process integration refers to the creation of collective and harmonized processes with
suppliers and customers with the objective of supporting product making and delivery
(Huo et al. (2014). It is also denoted as internal integration which includes working
collaboratively to improve the ability of firms to exploit and synchronize internal
resources by eliminating functional barriers and encouraging collaboration amid internal
functions Wong et al. (2013). The benefit that comes with process integration includes
unifying the departments along a single goal by preventing internal departments from

17
forming pockets of power that will impair other departments, reducing costs, creating
efficiencies and eliminating redundancies Blackhurst et al. (2015).
2.3.3 The Marketing Approach
Marketing differentiation points towards making a unique image for a product via
advertising, promotions and prestige pricing (Rashidirad, Soltani, & Syed, 2013). Firms
that embark on market differentiation lay emphasis on creating superior brands through
rigorous promotion efforts (Tian & Slocum, 2013). Phadtare (2014), describes the
differentiated marketing startegy as a scenario where a firm opts to acknowldge and act
on the heteroginity of the market it is operating in resulting to having a fully satisfied and
loyal customer base . Thus marketing differentiation entails creating a distiction in the
industry through rigurous promotional activities about the superiority of a firms produts.
The focus on marketing differentiation lies on building brands through rigorous
marketing efforts (Balodi, 2014).These efforts cannot be easily imitated by other
competitors in the industry thus enabling the firm to earn price premiums owing to the
superior brand that attracts customers (Banker et al. 2014). Xiaowen and Slocum also
notes that attention is paid to creating unique marketing effors on the respective products,
line and brand extensions exploiting the innovatoveness of each to create a superior brand
that is inimitable. Innovation in marketing techniques namley: brand indentification,
advertising and channels of distribution with emphasize on outside-in variables rather
than inside-in variabales builds up to an efficacious marketing differentitaion straatgey
retaining existing customers as well as attracting new ones (Rashidirad, Salimia, Soltan,
& Fazeli, 2017).
Customer attraction through marketing differentiation can be achieved in various ways as
described in various studies. Giving each customer a unique consumption experience by
means of product personalization is defined as a market differentiation strategy aimed at
meeting their unique needs and wants for keeping them satisfied at a profit (Wali &
Opara, 2013). A good brand identity is another approach used by firms to attain market
differentiation. This approach attracts new customers by emphasizing on the superior
advantages a firm has over other competitors in the industry thus creating a superior
perception in the market (Sebolao & Mburu, 2017). Similarly, brand identification tactics
18
have been linked to differentiation strategy by creating a positive reputation of the firm’s
product and providing high specialty for high price market segments products resulting to
a high perceived value of a firm’s products (Vera, 2016) .
2.4 Influence of Focus on Customer Attraction
Focus denotes creation of products and services to fulfil the needs of specific groups of
consumers with the objective of enjoying a high degree of customer loyalty which is a
consequence of attracting more customers while discouraging other firms from competing
directly (Maina & Oloko, 2016). It occurs when a firm pursues a narrow competitive
scope, selects a segment or a group of segments within the industry and modifies its
strategy to serve them to the segregation of others (Tanwar, 2013). Arasa and Gathinji
(2014), describes focus as a strategy that is concentrated on implementing narrow
competitive scope in a niche market which arise from geography, buyer characteristics,
and product specifications or requirements. This strategy is about concentrating on a set
of customers, geographic areas or a segment of the market to serve that specific target
very well (Tansey, Spillaneb, & Meng, 2014).Companies aim at serving customers in a
narrow market segment either through low cost or differentiation to attract more
customers and achieve a competitive edge over other players in the industry (Pulaj,
Kume, & Cipi, 2015) .
Maina and Oloko (2016), distinguishes the two focus strategies by indicating that the
low-cost focus strategy aims at offering products or services to a niche group of
customers at the lowest price available in the market while the differentiation strategy
aims at offering a niche group of customers products or services that meet their needs
better than rivals’ products do. Correspondingly as indicated by Tansey et al. (2014), low
cost focus purposes to serve customers better through operational efficiencies or
marketing activities while differentiation focus purposes to serve customers better by
providing superior products and services within the niche Market. Therefore, cost focus
approach is employed by firms seeking a lesser cost advantage in the narrow market
segments while the differentiation is employed by firms seeking to distinguish their
products within the narrow market (Kiragu, 2014).
19
On the other hand, cost and differentiation focused strategies share similarities. Both
variants concentrate on target segments which must either have customers with unique
needs or a delivery system that is out of the ordinary from the rest of the other systems
within the industry (Tanwar, 2013). Salavou (2015), also indicates that the two stratgey
variants serve a segment that is specialized in terms of inadequate geographic market with
a segment of customer with unique needs which represents a narrow range of products,
and doing so more efficiently, effectively and better than competitors serving the broader
market. Thus, firms following a focus strategy can protect their niche market by either
through low cost focus approach that emphases on product quality and branding or
differentiation focus approach that emphasis on offering higher products or services than
the average price (Bader, 2014).
A couple of authors have highlighted the necessary requirements for the focus strategy to
secure competitive advantage based on either low cost or differentiation. Pulaj et al.
(2015), outline the following requirements: the industry needs to have extremely diverse
target segments to allow firms to select a competitively attractive niche suitable to its
strengths and competences, the target niche should have great potential to generate profit
and the products offered to the customers in the niche market should be very difficult to
imitate. Peng (2013), indicates that possession of intimate knowledge about a niche
market and extremeunique needs of customers in the targeted niche are crucial for a firms
to gain competitive advantage through the focus strategy.Hence, the success of this
strategy is dependent on the customers’ distinct preferences, existence of a large industry
segment with a good growth potential and a niche that has not been pursued by rivals
(Arasa et al., 2014). In this study: low cost and differentiation focus will be discussed as
the key variables to secure competitive advantage through focus strategy.
2.4.1 Low Cost Focus
Low cost focus is a fusion of focus and strategy trailed by firms that intend to attain
operational efficiency while also converging on specific niche aspects of the product or
service presented to the customers (Bertozzi, Ali, & Gul, 2017).It exploits differences in
cost behavior within the targeted segment which must have customers with unusual needs
with the aim of securing a completive edge within the target segment (Tanwar, 2013).
Firms pursuing this strategy offer exclusive low prices, incredible discounts only to the
20
targeted customers who will find the products extremely relevant to their needs
(Faziljanovna & GAO, 2016). This strategy works well when a firm is able significantly
lower cost to the well-defined targeted customers eventually becoming the cost leader in
the niche market (Singh, 2014).
The nature of products driven by the low-cost focused strategy is very definite to the
customers’ needs and wants thus more attention is paid to the product features and
requirements (Rizea, 2015). Firms tailor make products to meet the unique low-cost
needs of customers in the niche market who are not properly served by the broad-
targeted customers (Ofunya, 2013). Rizea also indicates that the pricing assumes the
lowest cost in the niche market for instance, Ryan Air concentrates on very cost sensitive
commercial travelers by offering flights at the lowest prices in the niche market. Thus,
the product will be basic possibly alike to the one from the market leader which is highly
priced and featured but then it will be satisfactory to customers in the niche market
(Kiragu, 2014).
Low cost focus involves firms taking the lead in offering the lowest price to the target
customers and becoming the market leaders within the niche market (Bader, 2014).
Serving the niche market requires a firm to limit its competitive scope in addition to
tailoring its products, processes and capabilities to satisfy the unique needs of customers
for lowly priced products (Lam, Ho, & Law, 2015). The lowly priced product offering is
the gateway for a firm to outdo competition in the niche and attract more customers hence
gaining competitive advantage (Alstete, 2014). Therefore, the low-cost focus entails
concentrating on attracting specific customers who are extremely price sensitive for
instance, a hotel operator in any part of the world can compete on a low-cost basis in a
niche segment based on a modern, comfortable but not luxurious hotel located in a
popular and convenient location appearing to offer good value to the extreme cost-
conscious customers (Cheng, 2013).
Customers attracted thru the low-cost focus approach poses the following characteristics.
They are extremely price conscious yet they have unique needs which are not met in the
mass markets, for instance insurance packages offered to self-employed people or the
unbanked population requires specialization but at a very low price (Rizea,
21
2015).Likewise, these customers are attracted to firms that are willing to satisfy their
specialized requirements offered at a lower cost compared to equivalent products in the
mass market (Kyengo, Ombui, & Iravo, 2016). Subsequently the income levels of
customers within the low-cost niche tend to be low hence; firms in pursuit of this strategy
need to offer products that are less costly than the rest of the market to effectively match
the needs of these customers (Gituku & Kagiri, 2015).
Consequently, this strategy will work well with customers who are extremely cost-
conscious and are part of a specific group of the population and in some scenarios from a
specific ethnic minority and geographical location for instance, the McDonald’s
customers in Philippines are able to get rice and chicken at a low cost compared to the
traditional hamburgers and French fries served by McDonalds (Bertozzi et al., 2017). In
addition, the concentrated focus paid by firms in meeting the customers’ unique needs of
very low-priced products keeps on attracting them such that the firm starts benefiting
from entrenched customer loyalty which finally results to competitive advantage (Arasa
et al., 2014).
2.4.2 Differentiation Focus
Differentiation focus has been defined as a concentrated approach based on creating
variance by offering the niche customers the products that they remark as well-suited to
satisfy their own unique preferences and tastes (Mutongi & Chiwanza, 2016) .A firm
pursuing differentiation focus exploits the special needs of customers in the niche
segment and ensures the production and delivery system best serves them (Tanwar,
2013).For firms to meet the special needs of niche customers they embark on producing
exquisite products or high-quality services as well as delivering unmatched products or
services in the industry (Bertozzi, Ali, & Gul, 2017).
The nature of products driven by the differentiation focused strategy is based on the
perceived value which is very unique and sophisticated to meet the customers’ individual
and specific requirements (Rizea, 2015). The sophistication and uniqueness of these
products allows firms to pass the higher costs on to the customers as close substitute
products are not readily available (Arasa & Gathinji, 2014).Rizea also indicates that these
products are extremely custom-made, specialized, very rare and unique positioning them

22
as high end in the niche market for instance, the luxury cars like the Austin Martin and
Maserati. Hence, the product is evidently unlike to the ones produced by competitors
targeting the broader market segment to meet the special needs of customers in the niche
market (Kiragu, 2014).
Differentiation focus entails firms taking the lead in offering the most unique products to
the target customers and becoming the market leaders within the niche market (Bader,
2014). Serving the niche market requires a firm to limit its competitive scope in addition
to tailoring its products, processes and capabilities to satisfy the unique needs of
customers for highly differentiated products (Lam, Ho, & Law, 2015). A product offering
that satisfies the tastes and preferences of the customers better than that of other firms
within the niche is the gateway for a firm to outdo competition and attract more
customers hence gaining competitive advantage (Alstete, 2014). Therefore, the
differentiation cost focus entails concentrating on attracting specific customers who
prioritize on the satisfying their tastes and preferences irrespective of the price for
instance, customers who buy organic food they concentrate on eating healthy and they are
ready to cater for the high cost (Marian, Chrysochou, Krystallis, & Thøgersen, 2014).
Customers attracted thru the differentiation focus approach poses the following
characteristics. They have very explicit and distinct needs to be met which they are
willing to pay for high price charged due to the uniqueness and sophistication of the
product, for instance the engagements rings (Rizea, 2015). Likewise, these customers are
attracted to firms that offer products of more superior value compared to equivalent
products in the mass market to satisfy their exquisite taste and preferences (Kyengo,
Ombui, & Iravo, 2016). Subsequently the income levels of customers within the
differentiation niche tend to be high hence, firms in pursuit of this strategy need to offer
highly differentiated tailor-made products that are costly than the rest of the market to
meet the sophisticated needs of these customers (Gituku & Kagiri, 2015).
Consequently, this strategy will work well with customers seeking the best value and for
certain scenarios inimitability in specialty products and services which come at a high
price which they don’t mind paying for instance, Rolex charges exorbitant price for its
exquisite luxury fine watches that contain gold and diamonds to its significantly small

23
customer base that don’t mind the price (Bertozzi et al., 2017). In addition, the
concentrated focus paid by firms in meeting the customers unique needs of premium
products leads up to customer stickiness due to the constant attraction to use the firm’s
product and subsequently customer loyalty which finally results to competitive advantage
(Arasa et al., 2014).
2.5 Chapter Summary
This chapter analyses literature review on the impact of competitive advantage on
customer attraction focusing the specific objectives of this research. In cost leadership:
pursuit of economies of scale, proprietary technology and preferential access to raw
materials was discussed. Under the differentiation strategy: product differentiation, the
supply chain differentiation and the marketing approach was discussed. In the focus
strategy: low cost focus and differentiation focus was discussed. The next chapter
provides the research design and methodology used in collecting the data.

24
CHAPTER THREE
3.0 RESEARCH METHODOLOGY
3.1 Introduction
This chapter provides a methodology that was used to collect and analyse data for this
study. It outlines the research approach that was adopted depicting its relevance to
understanding the theory of this study. In addition, it provides a description of the data
collection tools that were used as well as the methods of measuring and presenting the
data to meet the objectives of this study.
3.2 Research Design
A research design is the theoretical structure within which a study is conducted
constituting of the framework for the generation of evidence that is well-matched to a
certain set of the research question (Bryman & Bell, 2015). The research objective, the
type of research questions as well as the accessibility of data plus the time constraints are
key determinants in the selecting the type of research design to be adopted (Sekaran &
Bougie, 2016).The kinds of research design as indicated by Creswell (2014) include
qualitative, quantitative and mixed approach which spans the comprehensive means of
data collection, analysis and interpretation.
This study adopted the descriptive research design which is intended to get data that
defines the characteristics of the topic of interest, measuring the features described in the
research questions (Hair, 2015) . It is characterized by the prior formulation of the
hypotheses requiring clear specification of the six Ws of the research question which
includes what, when, where, who, why and way (Ríos, 2016). This design is appropriate
for this study as it enables analysis of the relationship between the competitive advantage
and customer attraction in addition to determining the frequencies and percentages of the
study variables in the defined population (Bryman & Bell, 2015). In this study the
independent variable is the competitive advantage which includes cost leadership,
differentiation and focus while the dependent variable is customer attraction.

25
3.3 Population and Sampling Design
3.3.1 Target Population
Population is the entire number of individuals, events, incidences and phenomena with
certain mutual observable features (Creswell, 2014). The population has also been
defined as the aggregate of all elements that share some mutual set of characteristics
(Ríos, 2016). The elements in a population can be people, churches, schools, hospitals
and so on forming a universe with a common set of characteristics (Hair, 2015).The
population for this study encompassed all students enrolled at the United States
University (USIU)-Africa as provided in table 3.1.
Table 3.1: The Population of USIU-Africa
Education Level Population
Percentage (%)
Undergraduate 5 098 75
Master's Students 1 543 23
Doctorate 122 2
Total 6 763 100
Source: USIU-Africa, 2018
3.3.2 Sampling Design
Sampling design denotes the means of choosing primary unit for data collection and
analysis which are suitable for a precise research question (Lameck, 2013). It requires the
researcher to minimize the error that might occur by making inferences regarding the
population parameters (Hair, 2015).
3.3.2.1 Sampling Frame
The sampling frame is a list of population elements from which the sample is selected
and obtained once the scope of the population has been established (Vaus, 2013). In this
study, the sampling frame was the list of all students obtained from registrar’s office.
3.3.2.2 Sampling Technique
Sampling techniques is a scientific or statistical method of selecting the sampling units
26
which can be categorized into probability and non-probability techniques (Ríos, 2016).
The choice of a technique is dependent on the scale of measurement and the number of
variables (Hair, 2015). This study employed the stratified sampling method to select the
respondents for the study with the advantage of minimizing the cost and reducing the
time for data collection. Taherdoost (2016), indicate stratified sampling involves
dividing the population into strata (or subgroups) and selecting a random sample from
each subgroup.
3.3.2.3 Sample Size
Sample size is an important consideration in both qualitative and quantitative research
(Hair, 2015). It refers to the number of elements to be counted in the study which is
determined through a series of complex and numerous qualitative and quantitative
deliberations (Ríos, 2016).
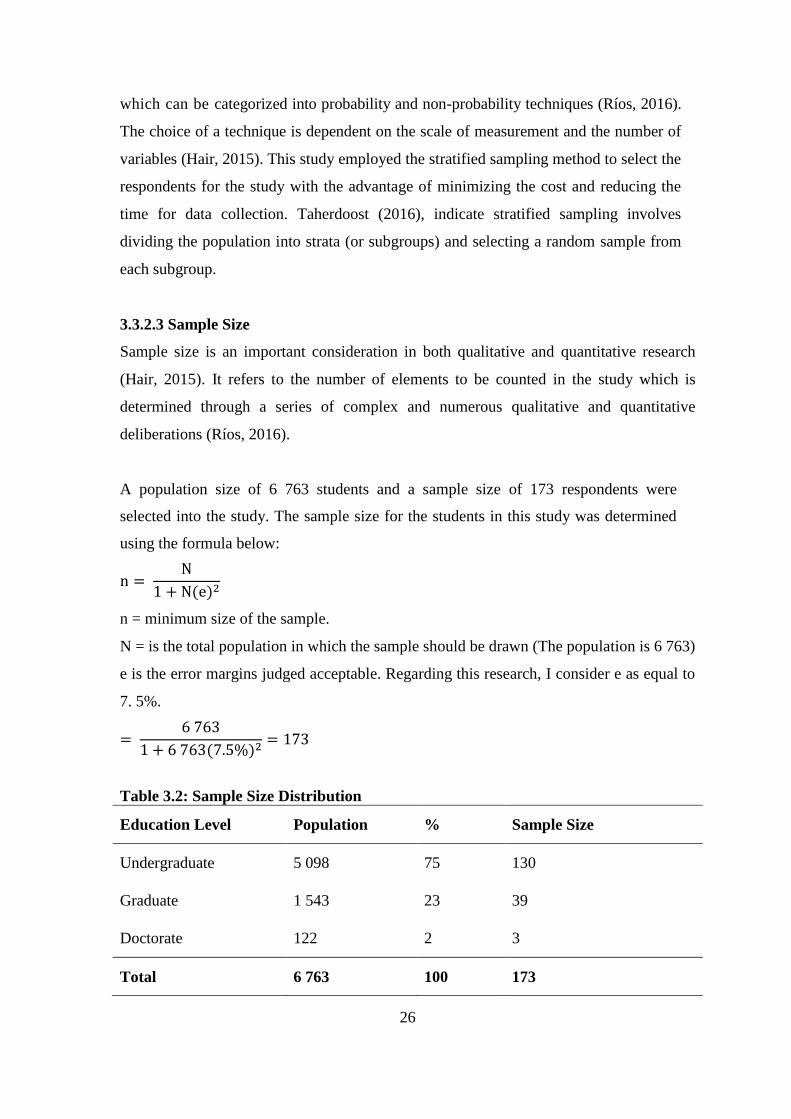
A population size of 6 763 students and a sample size of 173 respondents were
selected into the study. The sample size for the students in this study was determined
using the formula below:
n = N
1 + N(e)2
n = minimum size of the sample.
N = is the total population in which the sample should be drawn (The population is 6 763)
e is the error margins judged acceptable. Regarding this research, I consider e as equal to
7. 5%.
= 6 763
1 + 6 763(7.5%)2= 173
Table 3.2: Sample Size Distribution
Education Level Population % Sample Size
Undergraduate 5 098 75 130
Graduate 1 543 23 39
Doctorate 122 2 3
Total 6 763 100 173
27
3.4 Data Collection Methods
In this study primary data was used with the questionnaire as the main research
instrument. Taherdoost (2016) defines a questionnaire as a research instrument used to
gather data and obtain relevant information in a reliable and valid manner. In this study
the questionnaires comprised of closed-ended questions that ensured respondents were
restricted to certain categories in their responses. It was categorized into four segments.
The first section looked at the background of the respondents. The second, third and
fourth section of the questionnaire looked at questions based on the research questions
of this research employing the Likert scale rating. A letter to the respondents notifying
them of privacy and use of the information they disseminated was attached to the
questionnaire.
3.5 Research Procedure
Research procedure refers to the way an empirical study is designed and carried out to
achieve a specific research objective (Bulmer, 2017). A few respondents were randomly
selected to pre-test the questionnaire with the aim of testing the understanding of the
questions which would then be revised to confirm clarity in delivering the purpose of the
study. The objective of the pre-test is to authenticate the data collection tool. This study
was conducted with the aid of a research assistant who was be used to allocate and
gather the questionnaires through a drop and pick process. Respondents were
encouraged to participate through follow-up calls and emails to ensure a high response
rate.
3.6 Data Analysis Methods
Data collected was first checked for completeness before coding and formatting,
thereafter it was analyzed using SPSS to obtain both descriptive and inferential statistics.
Descriptive statistics included frequency, tables, charts, mean and standard deviation. On
the other hand, inferential statistics included correlation, regression and ANOVA.
3.7 Chapter Summary
Chapter three has deliberated on the process that was adopted in carrying out the study.
Research design, population and sampling design has been discoursed and how relevant
they are in determining the influence of cost leadership, differentiation and focus strategies

28
on attracting customers to the ride hailing apps. Questionnaires were used to collect data
from the respondent. SPSS Data Analysis tool was used to analyze the data. The next
chapter presents the results of study based on three research questions as presented in
chapter one.

29
CHAPTER FOUR
4.0 RESULTS AND FINDINGS
4.1 Introduction
This chapter presents the outcome of the investigation on the effect of competitive
advantage on attracting USIU-Africa students to use the various ride hailing apps. The
first section of the analysis illustrates the demographics of the population used in the
study. Subsequently the findings on the effect of cost leadership, differentiation and focus
on customer attraction are depicted in the second, third and fourth section respectively
and after that a chapter summary is provided.
4.2 Response Rate and Background Information
In the sub-section, the response and respondents’ background are provided. It starts with
response rate followed by background information of the responded.
4.2.1 Response Rate
Out of total of 160 students that received the questionnaire to participate in the survey,
131 completed resulting to a responsive rate of 81.88% as indicated in Table 4.1. This
relatively high response rate was ascribed to the convenience offered in completing the
survey at their own time.
Table 4.1: Response Rate
Questionnaires Number Percentage
Responded/Filled 131 75.72
Non-Responded or Not
Utilized
42 24.28
Total 173 100
4.2.2 Background of Respondents
The findings of this study showcased primary data for the assessment of the effect of
competitive advantage on customer attraction to ride hailing apps.

30
4.2.2.1 Gender
The study established 60 respondents representing 45.8% were female while 71
respondents representing 54.2% were male as represented in Figure 4.1. This indicates
the university is rather cognizant about gender balance.
Figure 4.1: Gender
4.2.2.2 Current level of Education
From the survey findings on the current education levels of the students at USIU-Africa;
67.94% are undergraduates, 25.95% are graduate students while 6.11% are doctorate
students as shown in the Figure 4.2.
Figure 4.2: Current Level of Education
[CATEGORY NAME]
71 (54.2%)
[CATEGORY NAME]
60 (45.8%)
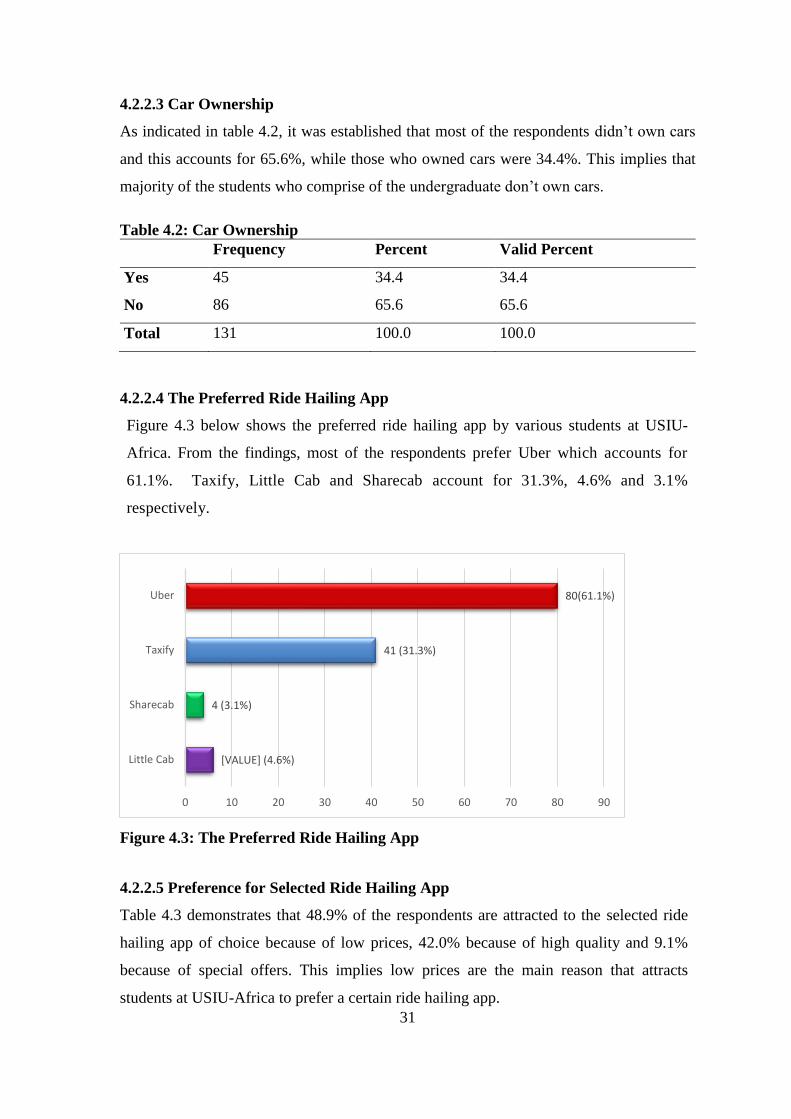
31
4.2.2.3 Car Ownership
As indicated in table 4.2, it was established that most of the respondents didn’t own cars
and this accounts for 65.6%, while those who owned cars were 34.4%. This implies that
majority of the students who comprise of the undergraduate don’t own cars.
Table 4.2: Car Ownership Frequency Percent Valid Percent
Yes 45 34.4 34.4
No 86 65.6 65.6
Total 131 100.0 100.0
4.2.2.4 The Preferred Ride Hailing App
Figure 4.3 below shows the preferred ride hailing app by various students at USIU-
Africa. From the findings, most of the respondents prefer Uber which accounts for
61.1%. Taxify, Little Cab and Sharecab account for 31.3%, 4.6% and 3.1%
respectively.
Figure 4.3: The Preferred Ride Hailing App
4.2.2.5 Preference for Selected Ride Hailing App
Table 4.3 demonstrates that 48.9% of the respondents are attracted to the selected ride
hailing app of choice because of low prices, 42.0% because of high quality and 9.1%
because of special offers. This implies low prices are the main reason that attracts
students at USIU-Africa to prefer a certain ride hailing app.
[VALUE] (4.6%)
4 (3.1%)
41 (31.3%)
80(61.1%)
0 10 20 30 40 50 60 70 80 90
Little Cab
Sharecab
Taxify
Uber
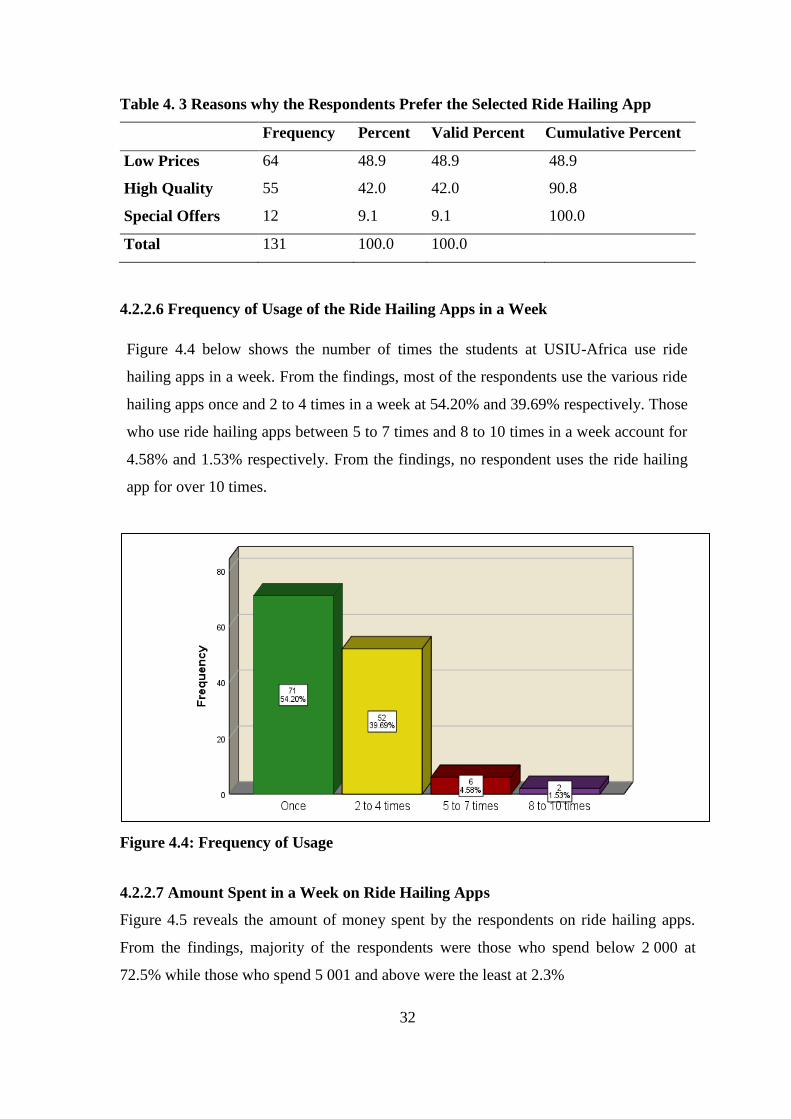
32
Table 4. 3 Reasons why the Respondents Prefer the Selected Ride Hailing App
Frequency Percent Valid Percent Cumulative Percent
Low Prices 64 48.9 48.9 48.9
High Quality 55 42.0 42.0 90.8
Special Offers 12 9.1 9.1 100.0
Total 131 100.0 100.0
4.2.2.6 Frequency of Usage of the Ride Hailing Apps in a Week
Figure 4.4 below shows the number of times the students at USIU-Africa use ride
hailing apps in a week. From the findings, most of the respondents use the various ride
hailing apps once and 2 to 4 times in a week at 54.20% and 39.69% respectively. Those
who use ride hailing apps between 5 to 7 times and 8 to 10 times in a week account for
4.58% and 1.53% respectively. From the findings, no respondent uses the ride hailing
app for over 10 times.
Figure 4.4: Frequency of Usage
4.2.2.7 Amount Spent in a Week on Ride Hailing Apps
Figure 4.5 reveals the amount of money spent by the respondents on ride hailing apps.
From the findings, majority of the respondents were those who spend below 2 000 at
72.5% while those who spend 5 001 and above were the least at 2.3%
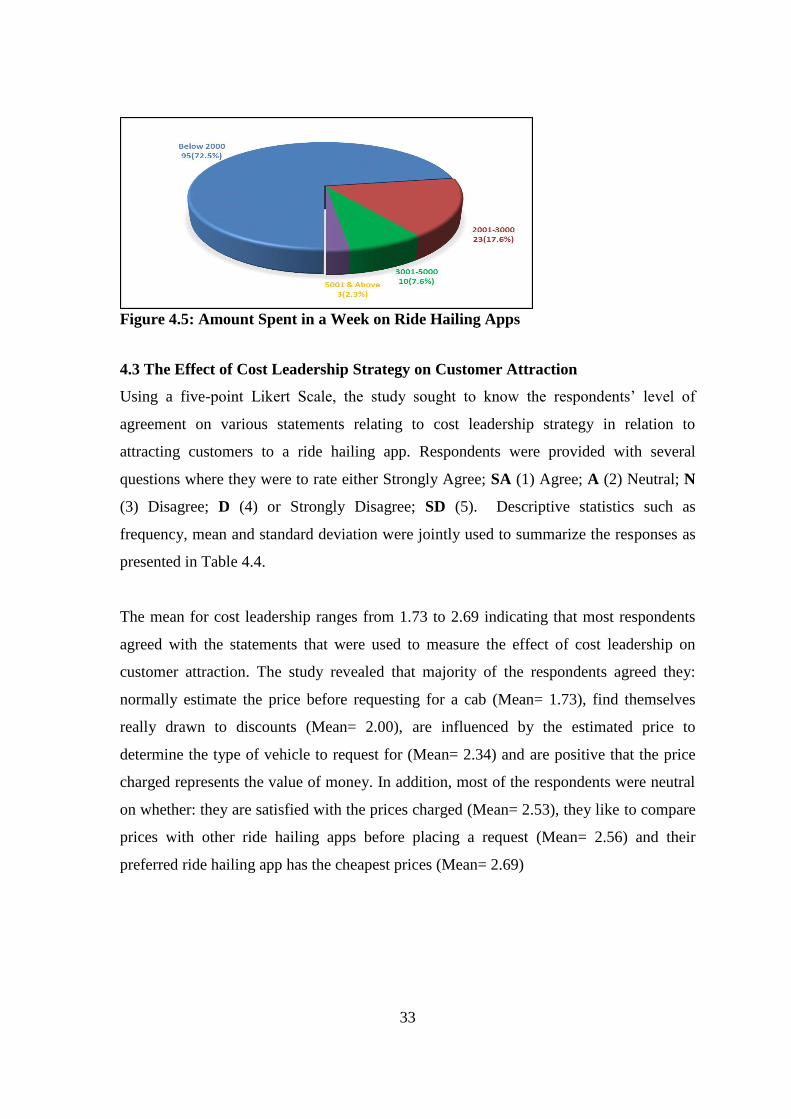
33
Figure 4.5: Amount Spent in a Week on Ride Hailing Apps
4.3 The Effect of Cost Leadership Strategy on Customer Attraction
Using a five-point Likert Scale, the study sought to know the respondents’ level of
agreement on various statements relating to cost leadership strategy in relation to
attracting customers to a ride hailing app. Respondents were provided with several
questions where they were to rate either Strongly Agree; SA (1) Agree; A (2) Neutral; N
(3) Disagree; D (4) or Strongly Disagree; SD (5). Descriptive statistics such as
frequency, mean and standard deviation were jointly used to summarize the responses as
presented in Table 4.4.
The mean for cost leadership ranges from 1.73 to 2.69 indicating that most respondents
agreed with the statements that were used to measure the effect of cost leadership on
customer attraction. The study revealed that majority of the respondents agreed they:
normally estimate the price before requesting for a cab (Mean= 1.73), find themselves
really drawn to discounts (Mean= 2.00), are influenced by the estimated price to
determine the type of vehicle to request for (Mean= 2.34) and are positive that the price
charged represents the value of money. In addition, most of the respondents were neutral
on whether: they are satisfied with the prices charged (Mean= 2.53), they like to compare
prices with other ride hailing apps before placing a request (Mean= 2.56) and their
preferred ride hailing app has the cheapest prices (Mean= 2.69)

34
Table 4.4: The Effect of Cost Leadership Strategy on Customer Attraction Statement SA A N D SD Mean Std.
Deviation
1. I am satisfied with the prices charged. 22 42 50 10 7 2.53 1.033
2. The app has the cheapest prices. 21 43 38 14 15 2.69 1.203
3. The price charged represents the value
of money.
30 45 38 11 7 2.39 1.092
4. I normally estimate the price before
requesting for a cab.
82 22 12 10 5 1.73 1.142
5. The estimated price influences the type
of vehicle to request.
53 29 17 15 17 2.34 1.435
6. I find myself really drawn to discounts. 60 34 22 7 8 2.00 1.183
7. I like to compare prices with other ride
hailing apps before placing a request.
43 30 14 29 15 2.56 1.431
4.3.1 Correlation results on the Effect of Cost Leadership Strategy on Customer
Attraction
The coefficient results revealed the following relationships as shown in Table 4.5. There
was a strong correlation between respondents being satisfied with the price charged and
the price charged representing the value of money (r= 0.690). A nearly positive
correlation was identified between respondent being satisfied with the prices charged and
the app having the cheapest prices (r= 0.443). In addition, a weak correlation was
identified in: respondents being satisfied with the prices charged versus their actions to
normally estimate the price before requesting for a cab(r=0.342), respondents being
satisfied with the prices charged versus finding themselves really drawn to discounts (r =
0.094) and respondents being satisfied with the prices charges versus comparing prices
with other ride hailing apps before placing a request (r = -0.125).

35
Table 4.5: Correlation results on the Effect of Cost Leadership Strategy on
Customer Attraction
Satisfaction
with the
prices
charged.
The app
has the
cheapest
prices.
Price
reflects
value of
money.
Price
estimation
before
requesting
for a cab.
Estimated
price
influences
the type of
vehicle.
Discounts
Attraction.
Comparison
of prices
charged
Satisfaction
with the
prices
charged.
Pearson
Correlation
1 .443**
.690**
.342**
.038 .094 -.125
Sig. (2-
tailed)
.000 .000 .000 .667 .283 .156
N 131 131 131 131 131 131 131
The app has
the cheapest
prices.
Pearson
Correlation
.443**
1 .421**
.353**
.139 .130 .148
Sig (2-
tailed)
.000 .000 .000 .115 .140 .091
N 131 131 131 131 131 131 131
Price reflects
value of
money.
Pearson
Correlation
.690**
.421**
1 .355**
.096 .286**
.040
Sig. (2-
tailed)
.000 .000 .000 .277 .001 .648
N 131 131 131 131 131 131 131
Price
estimation
before
requesting
for a cab.
Pearson
Correlation
.342**
.353**
.355**
1 .437**
.506**
.234**
Sig. (2-
tailed)
.000 .000 .000 .000 .000 .007
N 131 131 131 131 131 131 131
Estimated
price
influences
the type of
vehicle.
Pearson
Correlation
.038 .139 .096 .437**
1 .186* .208
*
Sig. (2-
tailed)
.667 .115 .277 .000 .034 .017
N 131 131 131 131 131 131 131
Discounts
Attraction.
Pearson
Correlation
.094 .130 .286**
.506**
.186* 1 .091
Sig. (2-
tailed)
.283 .140 .001 .000 .034 .302
N 131 131 131 131 131 131 131
Comparison
of prices
charged.
Pearson
Correlation
-.125 .148 .040 .234**
.208* .091 1
Sig. (2-
tailed)
.156 .091 .648 .007 .017 .302
N 131 131 131 131 131 131 131
4.3.2 Regression Analysis on the Effect of Cost Leadership Strategy on Customer
Attraction
Regression analysis was undertaken and the findings showed that the coefficient of
determination (R squared) of 0.113 shows that 11.3% of customer attraction can be
explained by the cost leadership strategy. The adjusted R-square of 0.062 indicates
competitiveness by 6.2%, the remaining percentage can be explained by other factors
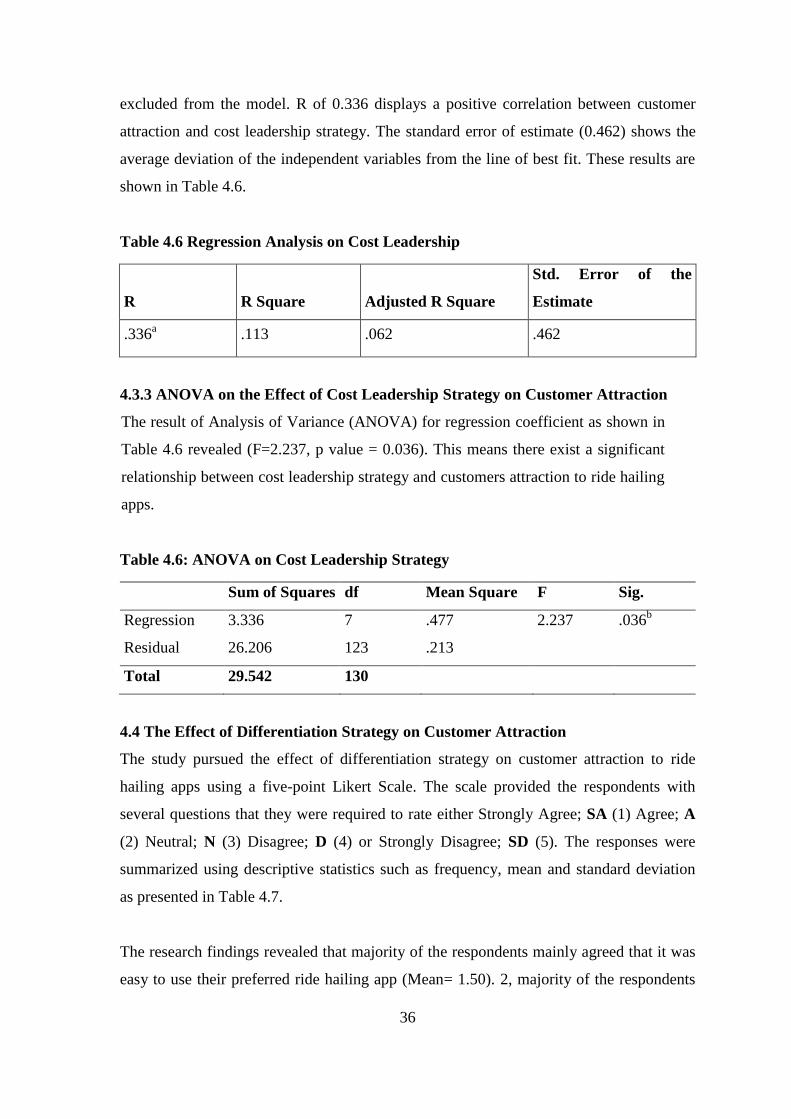
36
excluded from the model. R of 0.336 displays a positive correlation between customer
attraction and cost leadership strategy. The standard error of estimate (0.462) shows the
average deviation of the independent variables from the line of best fit. These results are
shown in Table 4.6.
Table 4.6 Regression Analysis on Cost Leadership
R R Square Adjusted R Square
Std. Error of the
Estimate
.336a .113 .062 .462
4.3.3 ANOVA on the Effect of Cost Leadership Strategy on Customer Attraction
The result of Analysis of Variance (ANOVA) for regression coefficient as shown in
Table 4.6 revealed (F=2.237, p value = 0.036). This means there exist a significant
relationship between cost leadership strategy and customers attraction to ride hailing
apps.
Table 4.6: ANOVA on Cost Leadership Strategy
Sum of Squares df Mean Square F Sig.
Regression 3.336 7 .477 2.237 .036b
Residual 26.206 123 .213
Total 29.542 130
4.4 The Effect of Differentiation Strategy on Customer Attraction
The study pursued the effect of differentiation strategy on customer attraction to ride
hailing apps using a five-point Likert Scale. The scale provided the respondents with
several questions that they were required to rate either Strongly Agree; SA (1) Agree; A
(2) Neutral; N (3) Disagree; D (4) or Strongly Disagree; SD (5). The responses were
summarized using descriptive statistics such as frequency, mean and standard deviation
as presented in Table 4.7.
The research findings revealed that majority of the respondents mainly agreed that it was
easy to use their preferred ride hailing app (Mean= 1.50). 2, majority of the respondents

37
least agreed that complaints are resolved fast enough (Mean= 2.41). The mean for
differentiation ranges from 1.50 to 2.41 indicating that majority respondents agreed with
the statements that were used to measure the effect of differentiation on customer
attraction.
Table 4.7: The Effect of Differentiation Strategy on Customer Attraction
Statement SA A UN D SD Mean Std.
Deviation
1. It is easy to use the app. 83 36 8 2 2 1.50 0.807
2. The app has better features compared
with the rest.
37 36 42 15 1 2.29 1.026
3. The drivers are readily available. 39 58 24 8 2 2.05 0.931
4. The drivers are professional. 33 56 31 8 3 2.18 0.957
5. The cars are in good condition. 43 65 16 7 0 1.90 0.812
6. I have encountered very few issues
using the app.
29 53 28 12 9 2.38 1.133
7. Complaints are resolved fast enough. 31 38 42 17 3 2.41 1.059
4.4.1 Correlation results on the Effect of Differentiation Strategy on Customer
Attraction
Table 4.8 reveals the coefficient results of the following relationship based on the
respondents preferred apps. Strong correlations were identified in: encountering very few
issues while using the app versus the drivers being readily available(r=6.22), the app
having better features versus the drivers being readily available (r= 0.539) also drivers
being professional versus the cars being in good condition (r= 0.538). A weak correlation
was established between the cars being in good condition and encountering very few
problems while using the app (r= 0.033).
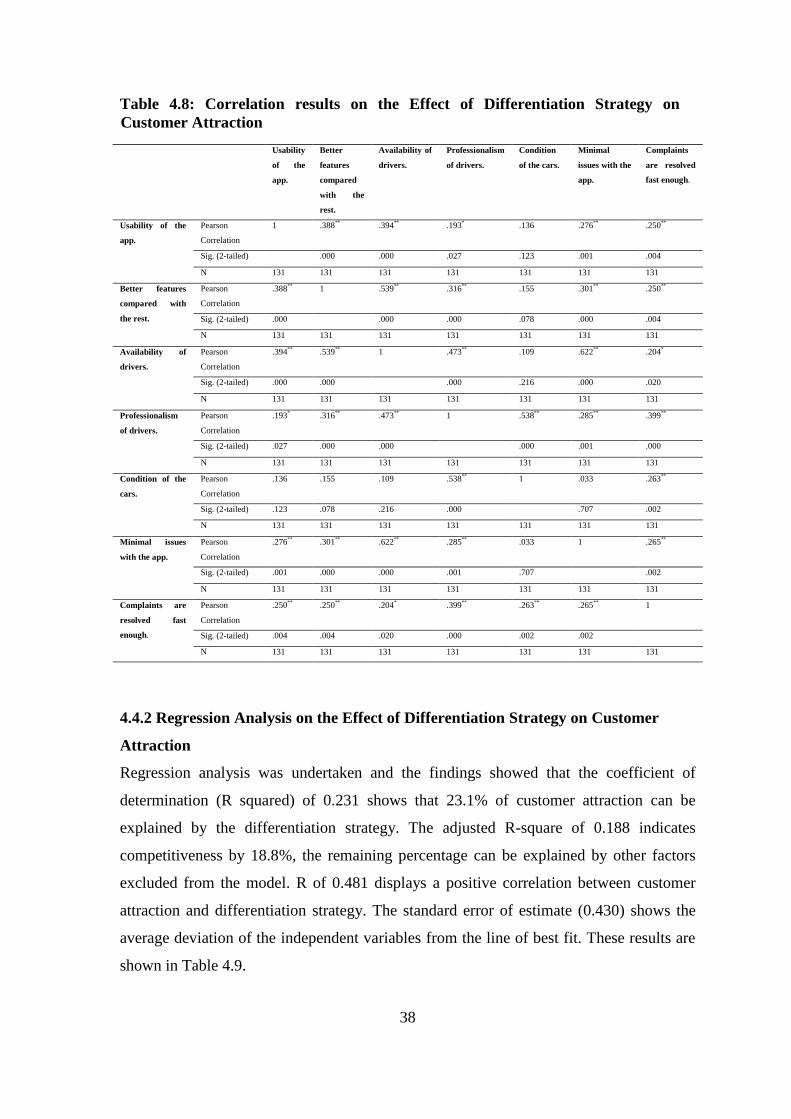
38
Table 4.8: Correlation results on the Effect of Differentiation Strategy on
Customer Attraction
Usability
of the
app.
Better
features
compared
with the
rest.
Availability of
drivers.
Professionalism
of drivers.
Condition
of the cars.
Minimal
issues with the
app.
Complaints
are resolved
fast enough.
Usability of the
app.
Pearson
Correlation
1 .388**
.394**
.193* .136 .276
** .250
**
Sig. (2-tailed) .000 .000 .027 .123 .001 .004
N 131 131 131 131 131 131 131
Better features
compared with
the rest.
Pearson
Correlation
.388**
1 .539**
.316**
.155 .301**
.250**
Sig. (2-tailed) .000 .000 .000 .078 .000 .004
N 131 131 131 131 131 131 131
Availability of
drivers.
Pearson
Correlation
.394**
.539**
1 .473**
.109 .622**
.204*
Sig. (2-tailed) .000 .000 .000 .216 .000 .020
N 131 131 131 131 131 131 131
Professionalism
of drivers.
Pearson
Correlation
.193* .316
** .473
** 1 .538
** .285
** .399
**
Sig. (2-tailed) .027 .000 .000 .000 .001 .000
N 131 131 131 131 131 131 131
Condition of the
cars.
Pearson
Correlation
.136 .155 .109 .538**
1 .033 .263**
Sig. (2-tailed) .123 .078 .216 .000 .707 .002
N 131 131 131 131 131 131 131
Minimal issues
with the app.
Pearson
Correlation
.276**
.301**
.622**
.285**
.033 1 .265**
Sig. (2-tailed) .001 .000 .000 .001 .707 .002
N 131 131 131 131 131 131 131
Complaints are
resolved fast
enough.
Pearson
Correlation
.250**
.250**
.204* .399
** .263
** .265
** 1
Sig. (2-tailed) .004 .004 .020 .000 .002 .002
N 131 131 131 131 131 131 131
4.4.2 Regression Analysis on the Effect of Differentiation Strategy on Customer
Attraction
Regression analysis was undertaken and the findings showed that the coefficient of
determination (R squared) of 0.231 shows that 23.1% of customer attraction can be
explained by the differentiation strategy. The adjusted R-square of 0.188 indicates
competitiveness by 18.8%, the remaining percentage can be explained by other factors
excluded from the model. R of 0.481 displays a positive correlation between customer
attraction and differentiation strategy. The standard error of estimate (0.430) shows the
average deviation of the independent variables from the line of best fit. These results are
shown in Table 4.9.
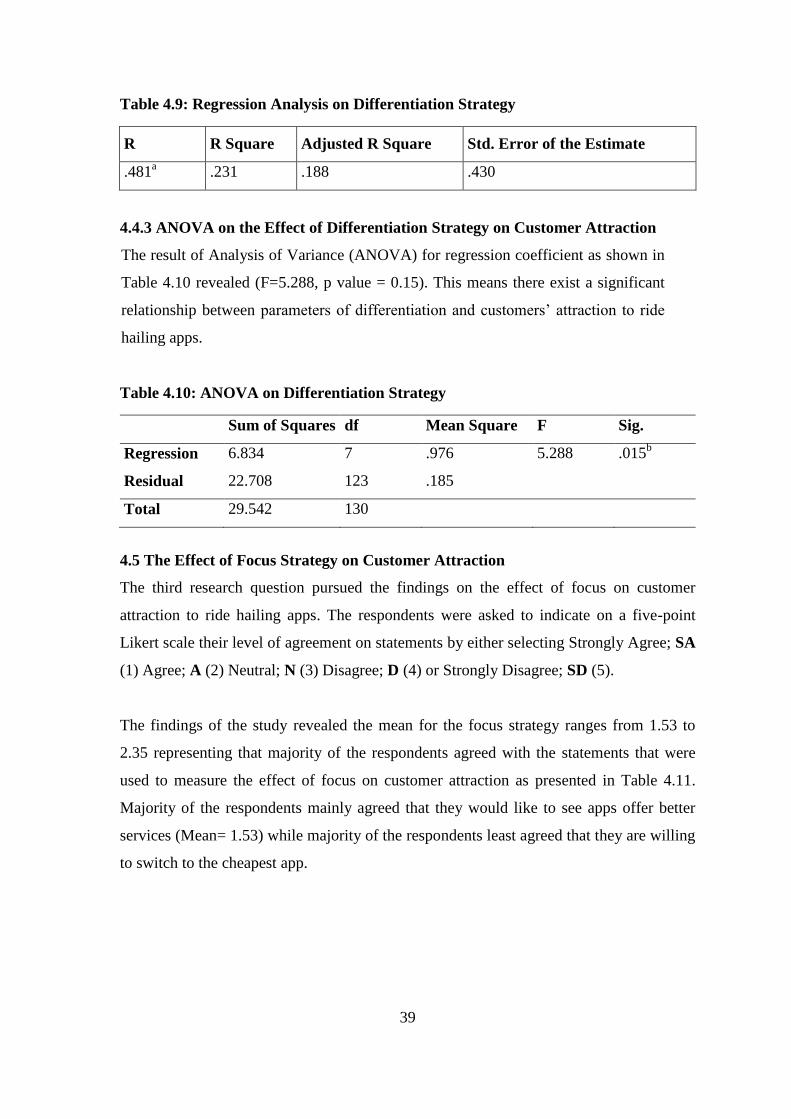
39
Table 4.9: Regression Analysis on Differentiation Strategy
R R Square Adjusted R Square Std. Error of the Estimate
.481a .231 .188 .430
4.4.3 ANOVA on the Effect of Differentiation Strategy on Customer Attraction
The result of Analysis of Variance (ANOVA) for regression coefficient as shown in
Table 4.10 revealed (F=5.288, p value = 0.15). This means there exist a significant
relationship between parameters of differentiation and customers’ attraction to ride
hailing apps.
Table 4.10: ANOVA on Differentiation Strategy
Sum of Squares df Mean Square F Sig.
Regression 6.834 7 .976 5.288 .015b
Residual 22.708 123 .185
Total 29.542 130
4.5 The Effect of Focus Strategy on Customer Attraction
The third research question pursued the findings on the effect of focus on customer
attraction to ride hailing apps. The respondents were asked to indicate on a five-point
Likert scale their level of agreement on statements by either selecting Strongly Agree; SA
(1) Agree; A (2) Neutral; N (3) Disagree; D (4) or Strongly Disagree; SD (5).
The findings of the study revealed the mean for the focus strategy ranges from 1.53 to
2.35 representing that majority of the respondents agreed with the statements that were
used to measure the effect of focus on customer attraction as presented in Table 4.11.
Majority of the respondents mainly agreed that they would like to see apps offer better
services (Mean= 1.53) while majority of the respondents least agreed that they are willing
to switch to the cheapest app.
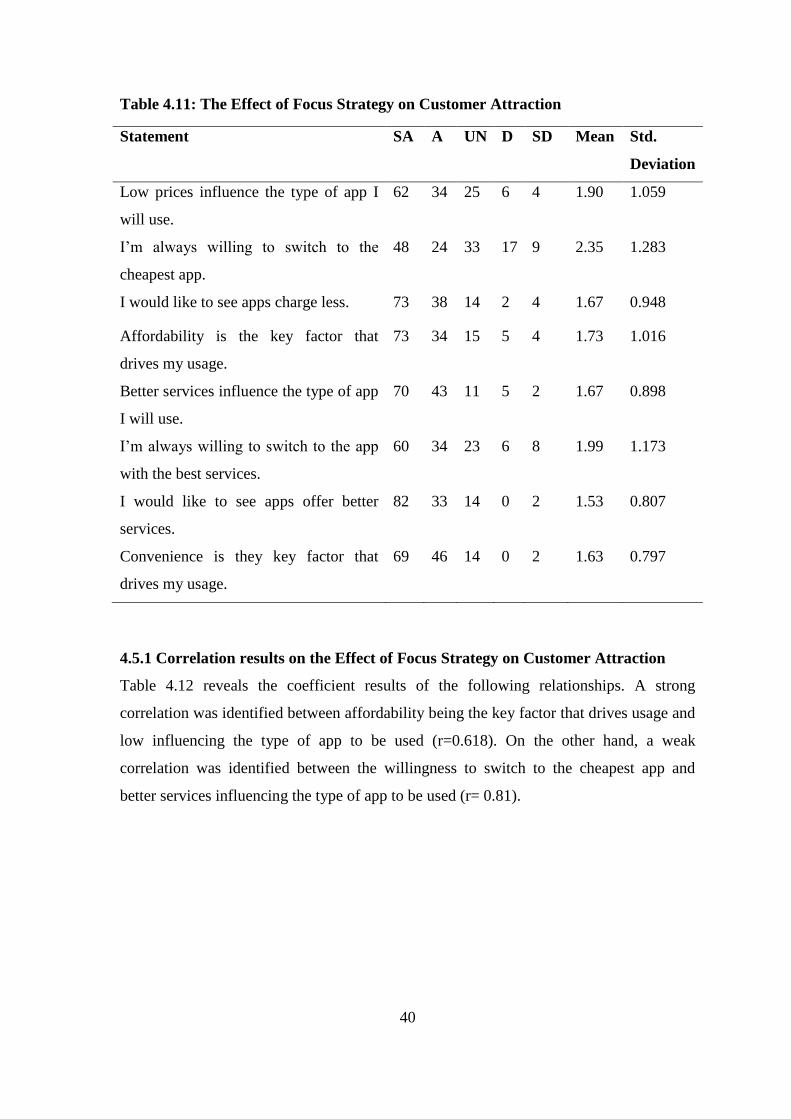
40
Table 4.11: The Effect of Focus Strategy on Customer Attraction
Statement SA A UN D SD Mean Std.
Deviation
Low prices influence the type of app I
will use.
62 34 25 6 4 1.90 1.059
I’m always willing to switch to the
cheapest app.
48 24 33 17 9 2.35 1.283
I would like to see apps charge less. 73 38 14 2 4 1.67 0.948
Affordability is the key factor that
drives my usage.
73 34 15 5 4 1.73 1.016
Better services influence the type of app
I will use.
70 43 11 5 2 1.67 0.898
I’m always willing to switch to the app
with the best services.
60 34 23 6 8 1.99 1.173
I would like to see apps offer better
services.
82 33 14 0 2 1.53 0.807
Convenience is they key factor that
drives my usage.
69 46 14 0 2 1.63 0.797
4.5.1 Correlation results on the Effect of Focus Strategy on Customer Attraction
Table 4.12 reveals the coefficient results of the following relationships. A strong
correlation was identified between affordability being the key factor that drives usage and
low influencing the type of app to be used (r=0.618). On the other hand, a weak
correlation was identified between the willingness to switch to the cheapest app and
better services influencing the type of app to be used (r= 0.81).
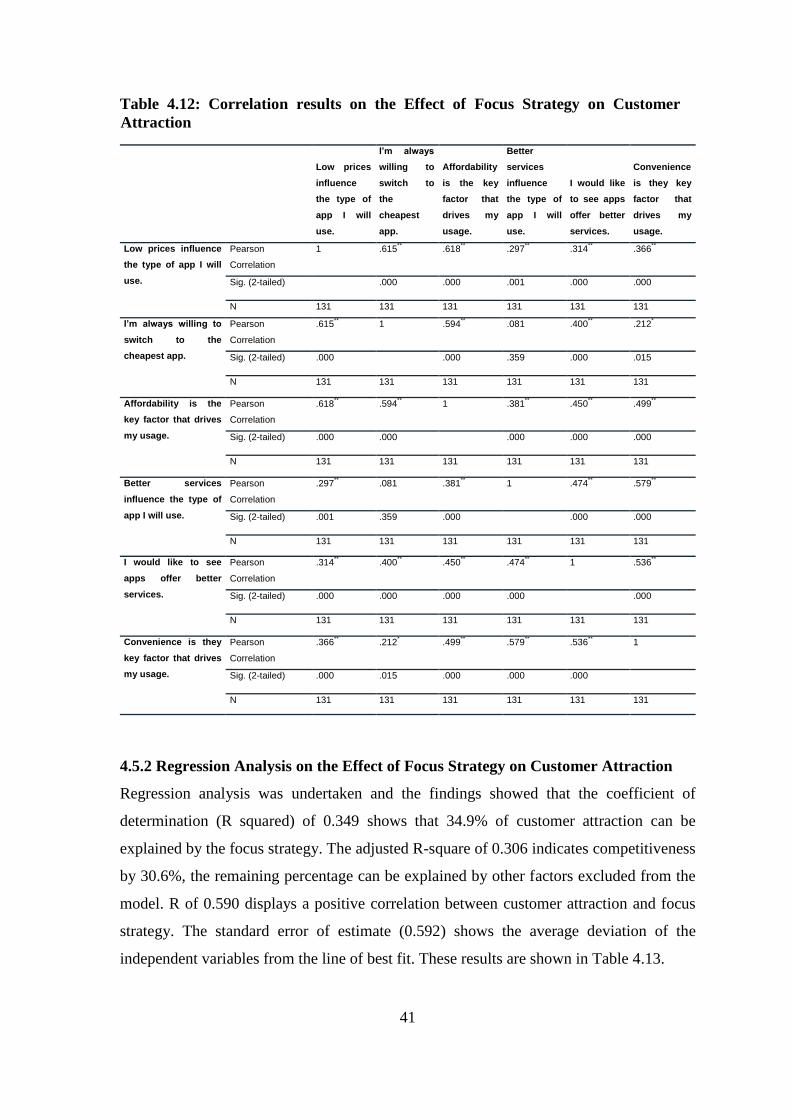
41
Table 4.12: Correlation results on the Effect of Focus Strategy on Customer
Attraction
Low prices
influence
the type of
app I will
use.
I’m always
willing to
switch to
the
cheapest
app.
Affordability
is the key
factor that
drives my
usage.
Better
services
influence
the type of
app I will
use.
I would like
to see apps
offer better
services.
Convenience
is they key
factor that
drives my
usage.
Low prices influence
the type of app I will
use.
Pearson
Correlation
1 .615** .618
** .297
** .314
** .366
**
Sig. (2-tailed) .000 .000 .001 .000 .000
N 131 131 131 131 131 131
I’m always willing to
switch to the
cheapest app.
Pearson
Correlation
.615** 1 .594
** .081 .400
** .212
*
Sig. (2-tailed) .000 .000 .359 .000 .015
N 131 131 131 131 131 131
Affordability is the
key factor that drives
my usage.
Pearson
Correlation
.618** .594
** 1 .381
** .450
** .499
**
Sig. (2-tailed) .000 .000 .000 .000 .000
N 131 131 131 131 131 131
Better services
influence the type of
app I will use.
Pearson
Correlation
.297** .081 .381
** 1 .474
** .579
**
Sig. (2-tailed) .001 .359 .000 .000 .000
N 131 131 131 131 131 131
I would like to see
apps offer better
services.
Pearson
Correlation
.314** .400
** .450
** .474
** 1 .536
**
Sig. (2-tailed) .000 .000 .000 .000 .000
N 131 131 131 131 131 131
Convenience is they
key factor that drives
my usage.
Pearson
Correlation
.366** .212
* .499
** .579
** .536
** 1
Sig. (2-tailed) .000 .015 .000 .000 .000
N 131 131 131 131 131 131
4.5.2 Regression Analysis on the Effect of Focus Strategy on Customer Attraction
Regression analysis was undertaken and the findings showed that the coefficient of
determination (R squared) of 0.349 shows that 34.9% of customer attraction can be
explained by the focus strategy. The adjusted R-square of 0.306 indicates competitiveness
by 30.6%, the remaining percentage can be explained by other factors excluded from the
model. R of 0.590 displays a positive correlation between customer attraction and focus
strategy. The standard error of estimate (0.592) shows the average deviation of the
independent variables from the line of best fit. These results are shown in Table 4.13.
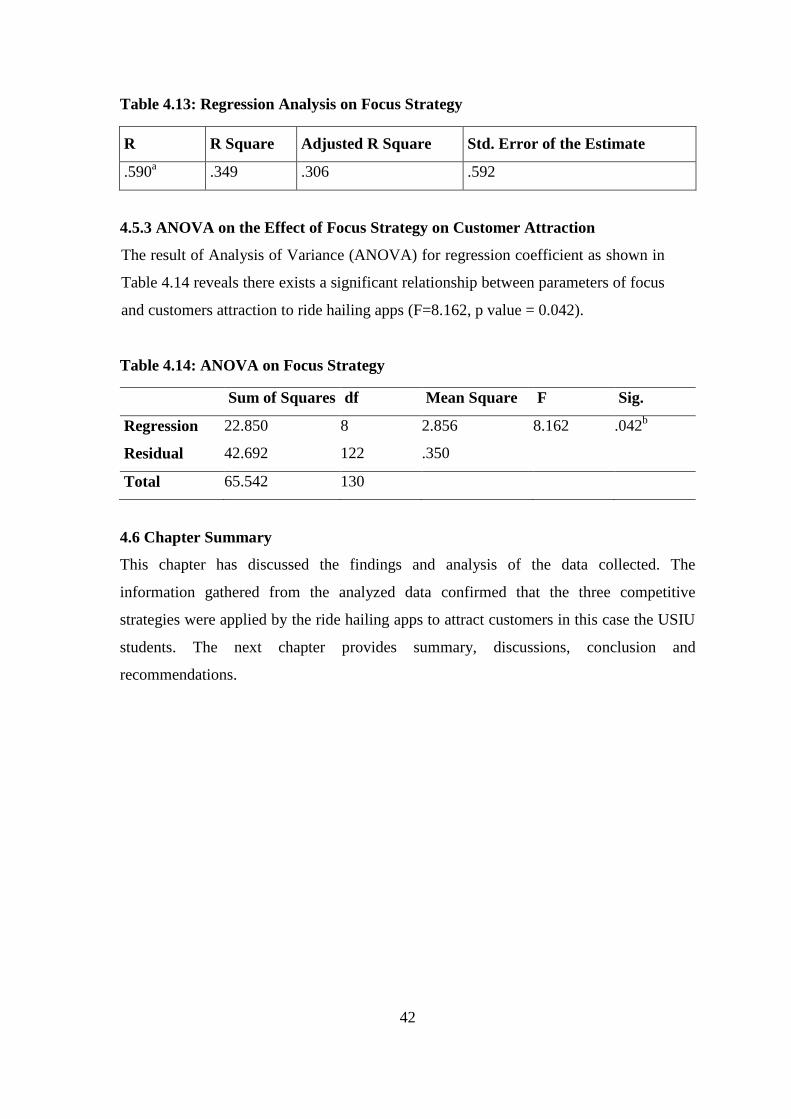
42
Table 4.13: Regression Analysis on Focus Strategy
R R Square Adjusted R Square Std. Error of the Estimate
.590a .349 .306 .592
4.5.3 ANOVA on the Effect of Focus Strategy on Customer Attraction
The result of Analysis of Variance (ANOVA) for regression coefficient as shown in
Table 4.14 reveals there exists a significant relationship between parameters of focus
and customers attraction to ride hailing apps (F=8.162, p value = 0.042).
Table 4.14: ANOVA on Focus Strategy
Sum of Squares df Mean Square F Sig.
Regression 22.850 8 2.856 8.162 .042b
Residual 42.692 122 .350
Total 65.542 130
4.6 Chapter Summary
This chapter has discussed the findings and analysis of the data collected. The
information gathered from the analyzed data confirmed that the three competitive
strategies were applied by the ride hailing apps to attract customers in this case the USIU
students. The next chapter provides summary, discussions, conclusion and
recommendations.

43
CHAPTER FIVE
5.0 DISCUSSION, CONCLUSION AND RECOMMENDATIONS
5.1 Introduction
This chapter brings forth the thoughts in line with the findings recognized from the data
analysis done. This is done by evaluating of the findings achieved to previous studies
done in relation to this topic. The chapter will also draw conclusions as well as
recommendations for the present and future studies.
5.2 Summary
The purpose of this study was to investigate the effect of competitive advantage on
attracting customers to a ride hailing basing on USIU- Africa students. This was guided
by three research questions namely: to what extent does cost leadership influence
customer attraction to a ride hailing app? What is the effect of differentiation on customer
attraction to a ride hailing app? And how does focus influence customer attraction to a
ride hailing app?
The study adopted a descriptive correlation research method design to establish the
impact of competitive advantage on customer attraction to ride hailing apps with a focus
on USIU-Africa students. The descriptive research method was used to identify and
explain the association between customer attractions the competitive advantage strategies
which comprise of cost leadership, differentiation and focus strategies. Stratified
sampling method was use to select 173 respondents out of a population of 6 763 students.
A questionnaire was used to gather responses from the respondents cutting across all the
education levels that is undergraduate, graduate and doctorate. The use of a structured
questionnaire helped the researcher to utilize descriptive and inferential statistics during
data analysis and presentation.
Analysis of the first research question determined the impact of cost leadership on
customer attraction to a ride hailing app. The findings of the study affirmed through
responses indicated Uber; the most preferred app employs this strategy to provide
services at the lowest price by offering discounts enabling it to attract as many customers
as possible thus gaining the majority market in the industry. Most of the respondents
agreed that before selecting the app to use, they normally estimate the price and this

44
influences the type of vehicle to request for. In addition, majority of the respondents
agreed the price charged represents the value of money indicating the preferred ride
hailing app offers great services but a lower cost. On the other hand, majority of
respondents displayed uncertainty on their preferred ride hailing app having the cheapest
prices and comparing prices with other ride hailing apps before placing a request.
Examination of the second research question established the effect of differentiation on
customer attraction to a ride hailing app. Based on the findings most of the respondents
agreed that it’s is easy to use their preferred ride hailing app, the drivers are readily
available and the cars are in good condition. Moreover, most of the respondents agreed
their preferred ride hailing app has better features compared with the rest demonstrating
the quest of these firms to deliver superior value to an extensive range of customers. On
the other hand, majority of the respondents least agreed that their complaints are resolved
fast enough and they have encountered very few issues while using their preferred ride
hailing app.
Investigation of the third objective determined how the focus strategy influences
customer attraction to a ride hailing app either through low cost or differentiation focus.
From the result findings, majority of the respondents indicated that their usage is driven
by convenience and that they would like to see the apps offer better services.
Respondents were asked to indicate if they were willing to switch to the app with the best
services and the app with the cheapest prices and from the findings majority least agreed
they were willing to switch to the cheapest app. This demonstrates a larger gap in
meeting the need of customers in the differentiation niche than in the low-cost focus
niche. The respondents in the differentiation niche indicated their choice of ride hailing
app is mainly influenced by provision of better services while the respondents in the low-
cost niche indicated their choice of the ride hailing app is mainly influenced by low
prices.
5.3 Discussion
5.3.1 Influence of Cost Leadership on Customer Attraction to Ride Hailing Apps
The study analysed the impact of cost leadership strategy and based on the findings most
of the respondents indicated that they normally estimate the price before placing a
45
request to determine the type of vehicle to select. This is in line with Nyaucho and
Nyamweya (2018) who stated that cost leadership entails attracting customers by either
having the lowest price in the target segment or having the lowest price to value ratio to
win the majority market share in the respective industry. This is consistent with the
findings of Hardjito (2015) that depict that low prices attract price sensitive customer
thru firms producing standard good and services to achieve the cost leadership position.
The findings also established that customers are attracted to discounts indicating that the
preferred ride hailing app tends to offer numerous discounts. This supports the findings
from Kubai and Waiganjo (2014) who inidcated that firms that have achieved cost
leadership they are able to deliver the same benefit as competitors but at a lower cost by
riding on cost efficiency and economies of scale to drive this strategy. This concurs with
the work of Council Of Economic Advisers(2016) that indicate that firms reduce prices
once they realize economies of scale which is an effect of low cost consequently
attracting more customers because of efficiencies created by larger operations.
On the other hand, there was a high level of uncertainty in the satisfaction of the prices
charged and this explains why majority of the respondnets indicate the use the ride
hailing app once yet the contribute to the majority of those who don’t own cars.
Moreover, the majority were also uncertain on whether the preferred ride hailing app has
the cheapest prices. The latter can be because of lack of will to compare or lack of
effective platforms to enable seamless comparions and this can be attributed to the
results that indicate uncertainty in comparing prices with other ride hailing apps before
placing a request. This indicates that customers are not only concerned about the low
prices but also the quality of the standard goods and services. This is supplemented by
Jeong, Lee and Kim (2017) who emphasize on the need of firms to place a premium on
operational efficiency in the production of standard goods and services to ensures there
is control in every expense ensuring the firm is effectively and efficiently serving the
price sensitize customers.
Based on the outcome, majority agreed that the price charged represents the value of
money. This shows that the preferred ride hailing app offers great services but a lower
cost and this is supplemented by the results findings that indicate that after low prices the
46
second factor that attracts the customers to ride hailing apps is high quality. This concurs
with study of Sterman (2014) who indicated that firms can attain cost leadership by
producing the most efficient products or services in the market and selling at a low price
through proprietary technology. This can be achieved either through product and/or
process innovation to paves way to produce effectual products and services that results to
superior business performance thrust leadership (Almor, 2014). In this study product
innovation comes out strongly and it supports the study by Grant (2016) who noted that
when firms innovate products by focusing the design on ease of production the gain
competitive advantage by means of significant cost savings. Grant adds on to his
explanation by giving an illustration of Motel 6 which is the cost leader of US budget
motels. It has prudently designed its products to keep operating at low cost thru adopting
standard motel designs , occupying inexpensive out of town locations, avoiding facilitites
such as restaurants and pools and also designing rooms to enable easy cleaning and
maintenance .
From the result findings it is well established that Uber is the most preferred ride hailing
app and the reason why it is mainly preferred it’s due to the low prices that customers are
charged. This demonstrates that Uber has embarked on gaining competitive advantage by
having the lowest cost in the industry as demonstrated by Teeratansirikool, Badir and
Charoenngam, (2013) who describe cost leadership as selling goods and services to
customers at the lowermost cost compared to competitors in the industry by means of
pursuing a cohesive set of activities related to organizational performance to achieve
competitive advantage. Hilman and Kaliappen (2014), further notes that firms achieve
cost leadership by having the lowest cost within the industry by applying numerous
activities such as technology advancement, learning curve, demand forecasting,
economies of scale, high capacity utilization as well as outsourcing.
5.3.2 Influence of Differentiation on Customer Attraction to Ride Hailing Apps
The study analysed the impact of differentiation strategy and based on the findings most
of the respondents indicated that they agree with the following based on their preferred
ride hailing app: it is easy to use the app, it has better features compared with the rest and
that they have encountered very few issues while using the app. Tanwar (2013) indicates
that firms pursuing differentiation are widely valued by customers because they produce

47
unique products and services that satisfy the customers’ needs.Hales and Mclarney
(2017), further adds on to describes differentiation as a channel used by firms to achieve
competitive advantage by attracting customers through offering supreme products or
services that deliver higher value to a wide range of customers who in return pay higher
prices that positions a firm to earn higher returns enabling it to outdo the competition
within the industry.
The findings of this study indicate that most of the respondents agreed their preferred ride
hailing app has better features compared with the rest. These results are consistent with
the study by Hales, et al. (2017) that illustrates firms achieve competitive advantage by
offering unmatched products or services to deliver superior value to a wide range of
customers. Moreover, the study by Becerra, et al. (2013) indicate one of the ways that
firms rise above competition to attract more customer is by pursuing product
differentiation to increase the perceived value of its product making the customers prefer
their product over the competitors’. The study by Grundvag, et al. (2014) further
explicate that new product attributes are added to differentiate a firm’s products from
those of competitors to become the preferred brand of choice in the industry. Referring to
the study findings, we can assume that the preferred ride hailing apps have made their
apps superior by adding new product attributes that make their apps very easy to use and
customers to experience very few issues while using the apps.
Based on the study findings high quality is the second key factor that attracts customers
to prefer a ride hailing app after low prices. This confirms the assertion by Silva (2015)
that consumers are presumed to want higher quality, although they may differ in their
willingness to pay for quality improvements. Becerra, et al. (2013) elucidate that where
available products are offered at an equal price; all customers will settle for these
products in a preference ranking as the competition shapes up to only one dimension with
the most differentiated firm providing the highest level of such a dimension in the
industry. This attributes to horizontal differentiation as illustrated in the study by
Makadok, et al. (2013) who indicate that despite firm selling their products at an equal
price customer will differ on the preference of a product based on their level of a product
attribute. Thus, differentiation strategy is equally important to firms for attracting
customer and winning the majority market share.

48
Firm can achieve competitive advantage through differentiation by strategically
integrating the supply chain integration as indicate by Leuschner, et al. (2013). The
supply chain integration as described by Huo, et al. (2013) refers to the extent at which a
firm preemptively link forces with its supply chain partners thru internal and external
internal integration. The result findings of this study concur with these studies by the
indication of most respondents agreeing that the drivers of their preferred ride hailing app
are readily available, they are professional and the cars are in good condition. This
indicates that the ride hailing apps firms that provide the platform that connects drivers to
customers at a fee have tactically joint forces with drivers who own the cars. This has
resulted to assimilation of all functioning processes at all level between the customers and
the drivers to offer additional value to customers.
Moreover, firms achieve competitive advantage by means of laying emphasis on creating
superior brands through rigorous promotion efforts as defined by Tian, et al. (2013).
Phadtare (2014) refer to this as marketing differentiation; whereby where a firm chooses
to acknowldge and act on the heteroginity of the market it is operating in resulting to
having a fully satisfied and loyal customer base. This accords to the result findings that
indicate most respondents agreed that the complaints they raise on their preferred ride
hailing apps are resolved fast enough.Therefore, the ride hailing apps have invested in
innovating the channel of distribution as indicated in the study by Rashidirad, et al.
(2013). The study denoted that firm emphasize on outside-in variables rather than inside-
in varaibales to build an efficacious marketing differentitaion strategey to enabling them
attract new customers as well as retainexisting customer base. This aproach is targeted
toward creating a postive brand identity in the industry as described in the study by Vera
(2016) . The study further explain that brand indentification tactics are employed to create
a positive impression of the firm’s product to attain market differentiation.
5.3.3 Influence of Focus Strategy on Customer Attraction to Ride Hailing Apps
The study confirms that focus strategy has an impact on attracting customers to ride
hailing apps. Based on the findings most respondents agreed they are willing to switch to
the cheapest app and they are also willing to switch to the app with the best services. This
concur with the study by Punjab, et al. (2015) that companies pursue focus strategy to

49
achieve competitive advantage by either serving customer in a narrow market either
through low cost or differentiation to attract more customers than other players in the
industry. Tanwar (2013) further explain firms trail the narrow competitive scope by
selecting a segment or a group of segments within the industry and modifying its strategy
to serve them to the segregation of others. This results to firms enjoying a high degree of
customer loyalty and attracting more customers while discouraging other firms in the
industry from competing directly (Maina & Oloko, 2016).
Bader (2014) explains one of the ways firms pursue the focus strategy to attain
competitive advantage in the niche market is through low cost focus approach that
emphases on product quality and branding to produce lowly priced products. This relates
to the results findings that indicate most respondents agreed that they would like to see
the ride hailing apps charge less. Secondly, firms pursue the focus strategy to attain
competitive advantage in the niche market through the differentiation focus approach that
emphases on offering higher products or services than the average price. This relates to
the results findings that indicate most respondents agreed that they would like to see the
ride hailing apps offer better services. Therefore, we can assume that the preferred ride
hailing apps target both the low-cost niche market segment and the niche market with
explicit and distinct needs.
However, there is need for the firms to possess intimate knowledge about the two niche
markets to serve the extreme unique need of customers wanting to see the apps charge
less and offer better services. This is crucial of firms to gain competitive advantage
through the focus strategy as explicated by Peng (2013).
The preferred ride hailing apps seek a lesser cost advantage in the narrow market
segments by offering services to a niche group of customers at the lowest price available
in the market. This can be illustrated by most of the respondents agreeing that their choice
of a ride hailing is influenced by low price and they are always willing to switch to the
cheapest app. Alstete (2014), indicate that the lowly priced product offering is the
gateway for firms to attract the extremely price sensitive customers and outdo
competition thus gaining competitive advantage. Customers within the low-cost niche
tend to have low income levels (Gituku & Kagiri, 2015), this resonates with the study

50
findings which indicate that majority of the respondents agreed that affordability is the
key factor that drives their usage. This can also be explained by the findings indicating on
average majority of the respondents use the ride hailing app once in a week spending at
least Below KES 2 000.
On the other hand, the preferred ride hailing apps aims at distinguishing their products to
offer a niche group of customers services that meet their needs better than competition.
This resonates with the study findings that most of the respondents agreed that they are
willing to switch to the app with the best services and the choice of ride hailing app is
influenced by provision of better services. Rizea (2015) indicates that distinguished
products are custom-made, specific, very rare and unique positioning them as high end in
the niche market to satisfy the unique needs of customers for highly differentiated
products. The income levels of customers within the differentiation niche tend to be high
hence they don’t mind paying for the high prices to satisfy their sophisticated needs
(Gituku & Kagiri, 2015). This concurs with the study findings that indicate most
respondents are always willing to switch to the app with better services and that
convenience is the key driver of their usage.
The study reveals that customers are attracted to ride hailing apps either through the low-
cost focus strategy and the differentiation focus strategy. It’s is evident that the preferred
ride hailing apps have been employed the two focus strategies to attract customers. This
success can be attributed to the distinct preferences, existence of a large industry segment
with a good growth potential and a niche that has not been pursued by rivals to secure
competitive advantage (Arasa et al., 2014). Tansey, et al. (2014) adds on to the success
factors of the focus strategy highlighting concentrating on a set of customers, geographic
areas or a segment of the market and serving that specific target very leads to a successful
focus strategy. Bertozzi, et al. (2017) also adds on explain the factors that contribute to
success of the focus strategy. The low-cost focus strategy works well with customers who
are extremely cost-conscious and are part of a specific group of the population and in
some scenarios from a specific ethnic minority and geographical location. Conversely,
the differentiation strategy will work well with customers seeking the best value and for
certain scenarios inimitability in specialty products and services which come at a high
price which they don’t mind paying for.

51
5.4 Conclusion
5.4.1 Influence of Cost Leadership on Customer Attraction to Ride Hailing Apps
A firm pursuing the cost leadership strategy endeavours to become the lowest cost
producer in the industry. This entails delivering the same benefit as the competitor but at
a lower cost to attract the price sensitive customers. Cost leader seeks to drive low costs
through innovation, efficiency and economies of scale. From the study it is evident
pursuit of the cost leadership strategy has attracted customers to prefer certain ride hailing
apps. However, Uber has emerged as the cost leader among the other ride hailing apps
since it’s the most preferred and due to its low prices.
5.4.2 Influence of Differentiation on Customer Attraction to Ride Hailing Apps
Differentiation strategy has a considerable impact on attracting customers to ride hailing
apps. The study depicts the preferred ride hailing apps aggressively pursue differentiation
strategy to win the majority market either through: product differentiation, supply chain
differentiation or marketing approach. Differentiation strategy emerges as the second key
factor that attracts customers to ride hailing apps after cost leadership.
5.4.3 Influence of Focus Strategy on Customer Attraction to Ride Hailing Apps
From the study it can be inferred that the focus strategy attracts customers to ride hailing
apps either through low cost or focus strategy. The preferred ride hailing apps have
adopted this strategy to more customers and achieve competitive advantage in the
specified niches. The study indicated needs of the customers in the low cost and
differentiation niches have not been fully met due to the demand of cheaper prices and
better services.
5.4. Recommendation
5.4.1 Recommendations for Improvement
5.4.1.1 Influence of Cost Leadership on Customer Attraction to Ride Hailing Apps
Cost leadership strategy has a statistically significant impact on attracting customers to
ride hailing apps. It is evident from the literature that cost leadership strategy is a major
consideration for the ride hailing apps in Kenya since low prices is the driver for
customers to prefer a ride hailing app over the rest in the market. Therefore, the study
recommends the various ride hailing apps to pursue the cost leadership strategy to attract
52
more customers and win the majority market share in the industry. It is further
recommended that the ride hailing apps need to pay attention to proprietary technology to
attain competitive advantage by producing the most efficient services in the market and
selling it at a low price.
5.4.1.2 Influence of Differentiation on Customer Attraction to Ride Hailing Apps
The ride hailing apps should utilize differentiation strategy as it has been established in
this study to have a statistically weighty influence on attracting customers to ride hailing
apps. There is also need for the ride hailing apps to further look deeper into how to create
a distinctive brand in the market without increasing the price to make differentiation a
significant practice in the industry. This strategy can be achieved through use of
technology to attain the cutting edge of innovation that helps to limit easy imitation of the
firm’s distinctiveness.
5.4.4.1.3 Influence of Focus Strategy on Customer Attraction to Ride Hailing Apps
To attain competitive advantage the ride hailing apps also need to adopt the focus
strategy either through low cost or differentiation. Based on the success factors for each
the focus strategy, it is essential for the ride hailing apps to extensively scan the
environment and possess intimate knowledge that will help identify the best niche to
concentrate on that will give them competitive advantage.
5.4.2 Recommendations for Further Studies
The purpose of this study was to establish the effect of competitive advantage on
attracting customers to a ride hailing app based on USIU-Africa students with the main
areas of concentration being to identify: to what extent does the cost leadership influence
customer attraction to a ride hailing app, effect of differentiation on customer attraction to
a ride hailing app and the influence of the focus strategy to attracting customers to a ride
hailing apps. For further studies, there is a need to undertake a study to establish the
effect of competitive advantage on attracting drivers to partner with the ride hailing apps.
53
REFERENCES
Africanews. (2017). Kenyan taxi app 'Little' looking to make profits. Africanews.
Alhawari , S. (2012). Evaluating Customer Process to Contribute to. IBIMA Business
Review, 1-15.
Almor, T. (2014). Conceptualizing Paths of Growth for Technology Based Born-Global
Firms Originating in a Small Population Advanced Economy. International
Studies of Management & Organization, 56-78.
Alstete, J. (2014). Strategy Choices of Potential Entrepreneurs. Journal of Education for
Business, 77-83.
Ang'asa, M. (2017). Effect of Competitive Strategies adopted by Ride Hailing Companies
in Nairobi, Kenya to Sustain Competitive Advantage in the Taxi Industry. Nairobi:
University of Nairobi.
Arasa, R., & Gathinji, L. (2014). The Relationship Between Competitive Strategies And
Firm Performance: A Case Of Mobile Telecommunication Companies In Kenya.
International Journal of Economics, Commerce and Management, 1-15.
Ariffin, S., Sulaiman, S., Mohammad, H., & Yaman, S. (2016). Factors Of Economies Of
Scale For Construction Contractors. International Congress on Technology,
Engineering, and Science. Kuala Lumpur.
Atalay, M., Anafarta, N., & Sarvan, F. (2013). The relationship between innovation and
firm performance: An empirical evidence from Turkish automotive supplier
industry. Social and Behavioral Sciences, 226-235.
Atikiya, R. (2015). Effect of Cost Leadership Strategy on the Performance of
Manufacturing Firms in Kenya. The Strategic Journal of Business & Change
Management, 134-143.
Attiany, M. (2014). Competitive Advantage Through Benchmarking: Field Study of
Industrial. Journal of Business Studies Quarterly, 41-51.
Bader, K. (2014). Understanding a firm’s choice for openness. Int. J. Technology
Management, 156-182.
Balodi, K. (2014). Strategic orientation and organizational forms: an integrative
framework. European Business Review, 188-203.
Banker, R., Mashruwala, R., & Tripathy, A. (2014). Does a differentiation strategy lead
to more sustainable financial performance than a cost leadership strategy?
Management Decision, 872-896.
54
Becerra, B., Santaló, J., & Silva, R. (2013). Being better vs. being different:
Differentiation, competition, and pricing strategies in the Spanish hotel industry.
Tourism Management, 71-79.
Bertozzi, F., Ali, C., & Gul, F. (2017). Porter’s Five Generic Strategies; A Case Study
from the. International Journal For Research In Mechanical & Civil Engineering,
9-23.
Besanko, D., Dranove, D., & Schaefer, S. (2012). Economics of Strategy. Wiley Global
Education, .
Blackhurst, J., Cantor, D., & Crum, M. (2015). A Structure–conduct–performance
Perspective Of How Strategic Supply Chain Integration Affects Firm
Performance. Journal of Supply Chain Management, 47-64.
Blanche, M. T., Durrheim, K., & Painter, D. (2002). Research in Practice. Cape Town,
SA: University of Cape Town Press.
Bräutigam, D., & Tang, X. (2014). Going Global in Groups: Structural Transformation
and China’s Special Economic Zones Overseas. World Development, 78-91.
Bright, J. (2016). Kenya’s ride-hail market is giving globalization an African twist. And
it’s paying off. Retrieved February 26, 2018, from The World Economic Forum:
https://www.weforum.org/agenda/2016/10/kenya-is-giving-globalization-an-
african-twist-and-it-s-paying-off/
Bryman, A., & Bell, E. (2015). Business Research Methods. Oxford University Press.
Bulmer, M. (2017). Sociological Research Methods. New York: Routledge.
Cheng, D. (2013). Analyze the Hotel Industry in Porter Five Competitive Forces. The
Journal of Global Business Management, 52-57.
City of New Orleans. (2016). City provides update On ridesharing operations since
introduction to New Orleans Market In Spring 2015. Retrieved January 31, 2018,
from http://content.govdelivery.com/accounts/LANOLA/bulletins/1381bf3
Council Of Economic Advisers. (2016). Benefits Of Competition And Indicators.
Creswell, J. W. (2014). Research Design: Qualitative, Quantitative and Mixed Methods
Approaches (4th ed.). London, United Kingdom: Sage Publications, Inc.
Dansereau, L., El‐Halwagi, M., Chambost, V., & Stuart, P. (2014). Methodology for
biorefinery portfolio assessment using supply‐chain fundamentals of bioproducts.
Biofuels, Bioproducts and Biorefining, 716-727.
55
Dansereau, L., El-Halwagi, M., Chambost, V., & Stuart, P. (2015). Methodology for
biorefinery portfolio assessment using supply-chain fundamentals of bioproducts.
Biofuels, Bioprod. Bioref.
Dash, A. K. (2013). Competitive Advantage: Its Importance and Impact on Design of
Strategy. International Journal of Application or Innovation in Engineering &
Management , 7-10.
Design Your World. (2016). In Kenya, Safaricom's Little Cab app goes head to head with
Uber. Retrieved from Design Your World:
http://designingyourworlds.blogspot.com/2016/07/blog-post_1856.html
Doligalski, T. (2014). Internet-Based Customer Value Management: Developing
Customer Relationships Online. Springer.
Dommer, S., Swaminathan, V., & Ahluwalia, R. (2013). Using Differentiated Brands to
Deflect Exclusion and Protect Inclusion: The Moderating Role of Self-Esteem on
Attachment to Differentiated Brands. Journal of Consumer Research, Inc, 657-
675.
Fathali, A. (2016). Examining The Impact Of Competitive Strategies On Corporate
Innovation: An Empirical Study In Automobile Industry . International Journal of
Asian Social Science, 135-145.
Faziljanovna, M., & GAO, Y. (2016). Effective Business Strategy for International
Strategic Performance: An Empirical Study of Chinese Construction Firms.
International Journal of Management Science and Business Administration, 43-
52.
Gituku, G., & Kagiri, A. (2015). Effects of competitive strategies on performance of
middle level colleges in Thika sub county. International Academic Journal of
Human Resource and Business Administration, 83-106.
Goldman Sachs. (2017). Rethinking Mobility. New Jersey: Prineton University Press.
Grundvag, G., Larsen, T., & Young, J. (2014). Product Differentiation with Credence
Attributes and Private Labels: The Case of Whitefish in UK Supermarkets.
Journal of Agricultural Economics, 368-382.
Hair, J. (2015). Essentials of Business Research Methods. M.E. Sharpe.
Hana, U. (2013). Competitive Advantage Achievement through. Journal of
Competitiveness, 82-96.

56
Hardjito, A. (2015). Analysis of Comparative Advantage Strategy Implementation on the
Customer Loyalty of BRI Sharia in DIY. Global Review of Islamic Economics
and Business, 1-17.
Herbling, D. (2016). Safaricom’s Little Cab triggers price war with Uber. Business Daily.
Huo, B., Qi, Y., Wang, Z., & Zhao, X. (2014). The impact of supply chain integration on
firm performance: Supply Chain Management. An International Journa, 369-384.
International Transport Forum. (2016). App-Based Ride and Taxi Services. Paris:
International Transport Forum.
Jackson, T. (2015). Nairobi’s taxi hailing startups: too much of a good thing? Disrupt
Africa.
Jeong, I., Lee, J.-H., & Kim, E. (2017). Product Strategy And Export Performance: The
Roles Of Exploitative And Exploratory Innovation Capability. Global Fashion
Management Conference , 30-35.
Jina, Y., Vonderembseb, M., & Ragu-Nathan, T. (2013). Proprietary technologies:
building a manufacturer’s flexibility and competitive advantage. International
Journal of Production Research, 5711-5727.
Khan, I. (2012). Impact of Customers Satisfaction And Customers Retention on Customer
Loyalty. International Journal of Scientific & Technology, 106-110.
Kinyuira, D. (2014). Effects of Porter’s Generic Competitive Strategies on the. Journal of
Business and Management, 93-105.
Kiragu, S. (2014). Assessment of challenges facing insurance companies in building
competitive advantage in Kenya: A survey of insurance firms. International
Journal of Social Sciences and Entrepreneurship, 467-490.
Krugman, P., Maurice, O., & Melitz, M. (2014). International Economics: Theory and
Policy. Pearson.
Kumar, T. V. (2016). Smart Economy in Smart Cities: International Collaborative
Research: Ottawa, St.Louis, Stuttgart, Bologna, Cape Town, Nairobi, Dakar,
Lagos, New Delhi, Varanasi, Vijayawada, Kozhikode, Hong Kong. Singapore:
Springer.
Kyengo, J., Ombui, K., & Iravo, M. (2016). Influence of competitive strategies on the
performance of telecommunication companies in Kenya. International Academic
Journal of Human Resource and Business Administration, 1-16.
57
Lam, C., Ho, G., & Law, R. (2015). How can Asian hotel companies remain
internationally competitive? International Journal of Contemporary Hospitality
Management, 827-852.
Lameck, W. (2013). Sampling Design, Validity and Reliability in General Social Survey.
International Journal of Academic Research in Business and Social Sciences,
212-218.
Lee, C. (2017). Dynamics of Ride Sharing Competition. Singapore: ISEAS – Yusof Ishak
Institute.
Leuschner, R., Roger, D., & Charvet, F. (2013). A Meta-analysis Of Supply Chain
Integration And Firm Performance. Journal of Supply Chain Management, 34-57.
Lew, Y., & Sinkovics, R. (2013). Crossing Borders and Industry Sectors: Behavioral
Governance in Strategic Alliances and Product Innovation for Competitive
Advantage. Long Range Planning, 13-38.
Maina, N., & Oloko, M. (2016). The Relationship between Michael Porter’s Generic
Strategies and Performance of Edible Oil Firms in Kenya. International Journal
of Management and Commerce Innovations, 240-249.
Makadok, R., & Ross, D. (2013). Taking Industry Structuring Seriously Strategic
Perspective On Product Differentiation. Strategic Management Journal, 509-532.
Marian, L., Chrysochou, P., Krystallis, A., & Thøgersen, J. (2014). The role of price as a
product attribute in the organic food context: An exploration based on actual
purchase data. Food Quality and Preference.
Martín-de Castro, G., Delgado-Verde, M., Navas-López, J., & Cruz-González, J. (2013).
The moderating role of innovation culture in the relationship betweenknowledge
assets and product innovation. Technological Forecasting & Social Change, 351-
362.
Meihami, B., & Meihami, H. (2013). Knowledge Management a way to gain a
competitive advantage in firms (evidence of manufacturing companies).
International Letters of Social and Humanistic Sciences, 80-91.
Mishra, C. (2015). Business Model Design. In Getting Funded: Proof-of-Concept, Due
Diligence, Risk and Reward (pp. 103-135). New York: Palgrave Macmillan US.
Mitra, A. (2014). Agglomeration Economies and Wellbeing: Evidence from India. Athens
Journal of Health.

58
Mugenda, O., & Mugenda, A. (2003). Research Methods – Quantitative & Qualitative
Approaches. African Centre for Technology.
Mureithi, M., Ndemo, B., & Weiss, T. (2017). Digital Kenya: An Entrepreneurial
Revolution in the Making. London: Palgrave Macmillan UK.
Mutongi, C., & Chiwanza, K. (2016). The Use of Differentiation Strategy by Libraries to
Gain. Journal of Business and Management, 126-130.
Nikiforos, M. (2013). The (Normal) Rate Of Capacity Utilization At The Firm Level.
Metroeconomica, 513-538.
Njanja, A. (2016). Battle for Kenya e-hailing market share moves to personalised
services. Business Daily Africa.
Nolega, K., Oloko, M., William, S., & Oteki, E. (2015). Effects of Product
Differentiation Strategies on Firm Product Performance: A Case of Kenya Seed
Company (KSC), Kitale. International Journal of Novel Research in Marketing
Management and Economics, 100-110.
Nyauncho, M. J., & Nyamweya, I. N. (2017). Assessment of the effect of Cost
Leadership Strategy on the performance of Liquefied Petroleum Gas Companies
in Eldoret town, Uasin Gishu County, Kenya . International Journal of Business
and Management Invention, 01-07.
Ofunya, F. (2013). Effects of strategic management practices on performance of financial
institutions in Kenya: A case of Kenya Post Office Savings Bank. International
Journal of Business Management and Administration, 122-141.
Oloo, J. (2016). CIO East Africa. Retrieved from Competition is not the determining
factor in Uber 35% fare reduction: https://www.cio.co.ke/mobile/competition-is-
not-the-determining-factor-in-uber-35-fare-reduction/
Oreva. (2016). The State Of Ridesharing In Africa. Retrieved from Techcabal:
https://techcabal.com/2016/11/16/the-state-of-ridesharing-in-africa/
Pulaj, E., Kume, V., & Cipi, A. (2015). The Impact Of Generic Competitive Strategies
On Organizational Performance. The Evidence From Albanian Context. European
Scientific Journal, 273-284.
Rashidirad, M., Salimia, H., Soltan, E., & Fazeli, Z. (2017). mpetitive strategy, dynamic
capability, and value creation: Some empirical evidence from UK
telecommunications firms. Strategic Change, 333-342.
59
Rasiah, R., Kanagasundram, T., & Lee, K. (2013). Innovation and Learning Experiences
in Rapidly Developing East Asia. Routledge.
Rayle, L., Shaheen, S., Chan, N., Dai, D., & Cervero, R. (2014). App-Based, On-Demand
Ride Services: Comparing Taxi and Ridesourcing Trips and User Characteristics
in San Francisco. Berkeley: University of California Transportation Center
(UCTC).
Ríos, V. (2016). Business Research Methods. Theory and Practice. ESIC.
Rivera, L., Sheff, Y., & Welsch, R. (2014). Logistics agglomeration in the US.
Transportation Research Part A, 222-238.
Rizea, R. (2015). Growth Strategies of Multinational Companies. Economic Insights –
Trends and Challenges, 59-66.
Sabol, A., & Sverer, F. (2016). A Review of the Economic Value added Literature and
Applicatio. Journal of Economics, 19-27.
Samarasinghe, N., Ariadurai, S. A., & Perera, M. E. (2015). Facing the Future Challenges
of the Sri Lankan Apparel Industry: An Approach based on Porter’s Diamond
Model for the Competitive Advantage of Nations. Journal of Engineering and
Technology, 1-18.
Samira, S., Mohammadreza, D., & Navid, N. (2013). Explain the Theory of Competitive
Advantage and Comparison. International Journal of Economy, Management and
Social Sciences, 841-848.
Scheele, D. (2014). The trade-off between cost leadership and differentiation. GRIN
Verlag.
Schilke, O. (2014). On the Contingent Value of Dynamic Capabilities. Strategic
Management Journal, 179-203.
Sebolao, L., & Mburu, P. (2017). Marketing Approaches Used By Private Secondary
Schools In Botswana . International Journal of Economics, Commerce and
Management, 653-680.
Sekaran, U., & Bougie, R. (2016). Research Methods For Business: A Skill Building
Approach. John Wiley & Sons.
Semuel, H., Siagian, H., & Octavia, S. (2017). The Effect of Leadership and Innovation
on Differentiation Strategy and Company Performance. Procedia - Social and
Behavioral Sciences, 1152-1159.
60
Shilbury, D., Westerbeek, H., Quick, S., Funk, D., & Karg, A. (2014). Strategic Sport
Marketing. Allen & Unwin.
Sigalas, C., Economou, V., & Georgopoulos, N. (2013). Revisiting the concept of
competitive advantage. Journal of Strategy and Management, 61-80.
Silva, R. (2015). Multimarket contact, differentiation, and prices of chain hotels. Tourism
Management, 305-315.
Singh, S. (2014). Strategy: An Empirical Study. Global Journal of Management and
Business Research: A, 52-56.
Snead, J. (2015). Taxicab Medallion Systems: Time for a Change. Washington, D.C.: The
Heritage Foundation. Retrieved February 26, 2018, from
https://www.heritage.org/transportation/report/taxicab-medallion-systems-time-
change
Sterman, J. (2014). Interactive web-based simulations for strategy and sustainability: The
MIT Sloan LearningEdge management flight simulators, Part I. System Dynamics
Review, 89-121.
Taherdoost, H. (2016). Sampling Methods in Research Methodology; How to Choose a
Sampling Technique for Research. International Journal of Academic Research in
Management, 18-27.
Tansey, P., Spillaneb, J., & Meng, X. (2014). Linking response strategies adopted by
construction firms during the 2007 economic recession to Porter’s generic
strategies. Construction Management and Economics, 705-724.
Tanwar, R. (2013). Porter’s Generic Competitive Strategies . Journal of Business and
Management , 11-17.
Tian, X., & Slocum, J. (2013). What determines MNC subsidiary performance? Evidence
from China§. Journal of World Business, 1-10.
Turok, I., & McGranahan, G. (2013). Urbanization and economic growth: the arguments
and evidence for. Environment & Urbanization, 465-482.
Vaus, D. (2013). Surveys in Social Research. Routledge.
Vera, J. (2016). Two paths to customer loyalty: the moderating effect of the
differentiation level strategy in the performance-satisfaction-value-intentions
relationship. Journal of Product & Brand Management, , 171-183.
Wali, A., & Opara, B. (2013). Customer Appreciation Strategy: Conceptualizing the
Model for Measurement . Information and Knowledge Management, 1-5.

61
Wang, H.-L. (2014). Theories for competitive advantage. Being Practical with Theory: A
Window into Business Research , 33-43.
Wesangula, D. (2016, September 16). Uber and Little Cab's battle to control the streets
of Nairobi. Retrieved February 26, 2018, from The Guardian:
https://www.theguardian.com/sustainable-business/2016/sep/16/uber-little-cabs-
kenya-nairobi-battle-taxi
Wong, C., Wong, C., & Boon-itt, S. (2013). The combined effects of internal and external
supply chain integration on product innovation. Int. J. Production Economics ,
566-574.
Wu, P., Gao, L., & Gu, T. (2015). Business strategy, market competition and earnings
management Evidence from China. Chinese Management Studies, 401-424.
Zikmund, W., Babin, B., Carr, J., & Griffin, M. (2013). Business Research Methods.
Cengage Learning.

62
APPENDICES
Appendix I: Cover Letter
25th
May 2018
Dear Respondent,
I am a student pursuing a Master degree in Business Administration in strategic
management at United States International University (USIU)-Africa. As part of the
requirement, I am supposed to undertake a research project in a related area. In this
regard, I am conducting a study on: The Effect of Competitive Advantage on
Customer Attraction to Ride Hailing Apps. A Case Study of USIU-Africa.
By means of random sampling, you have been selected to facilitate in providing
information that will assist in finalizing the study. Kindly spend some of your valuable
time (5-10 minutes) to complete this questionnaire to the best of your knowledge. Thank
you in advance for accepting to be a positive contributor to the economy. Your responses
will be treated with the confidentiality it deserves.
Yours Sincerely,
Stella Gitau
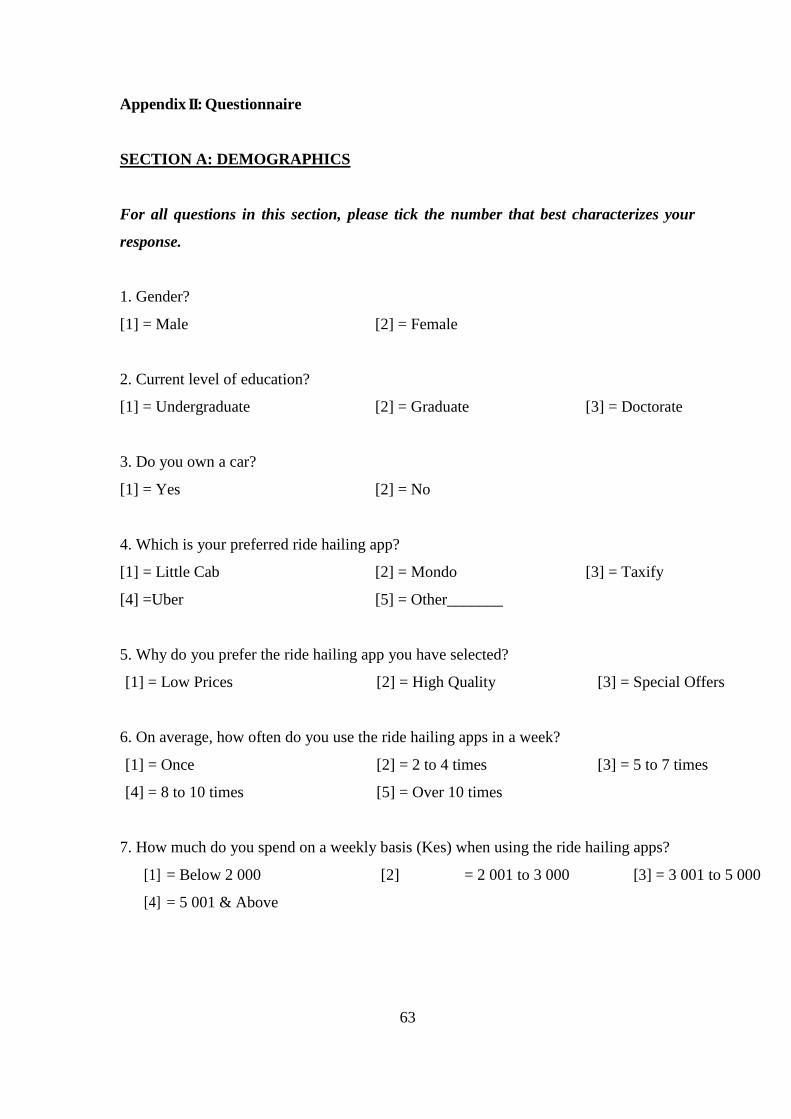
63
Appendix II: Questionnaire
SECTION A: DEMOGRAPHICS
For all questions in this section, please tick the number that best characterizes your
response.
1. Gender?
[1] = Male [2] = Female
2. Current level of education?
[1] = Undergraduate [2] = Graduate [3] = Doctorate
3. Do you own a car?
[1] = Yes [2] = No
4. Which is your preferred ride hailing app?
[1] = Little Cab [2] = Mondo [3] = Taxify
[4] =Uber [5] = Other_______
5. Why do you prefer the ride hailing app you have selected?
[1] = Low Prices [2] = High Quality [3] = Special Offers
6. On average, how often do you use the ride hailing apps in a week?
[1] = Once [2] = 2 to 4 times [3] = 5 to 7 times
[4] = 8 to 10 times [5] = Over 10 times
7. How much do you spend on a weekly basis (Kes) when using the ride hailing apps?
[1] = Below 2 000 [2] = 2 001 to 3 000 [3] = 3 001 to 5 000
[4] = 5 001 & Above

64
SECTION B: COST LEADERSHIP
Please select the option that best characterizes your response based on your preferred
ride hailing app.
Statements
Strongly
Agree
Agree Neutral Disagree
Strongly
Disagree
1 2 3 4 5
1. I am satisfied with the prices
charged.
2. The app has the cheapest
prices.
3. The price charged represents
the value of money.
4. I normally estimate the price
before requesting for a cab.
5. The estimated price
influences the type of
vehicle to request.
6. I find myself really drawn to
discounts.
7. I like to compare prices with
other ride hailing apps
before placing a request.
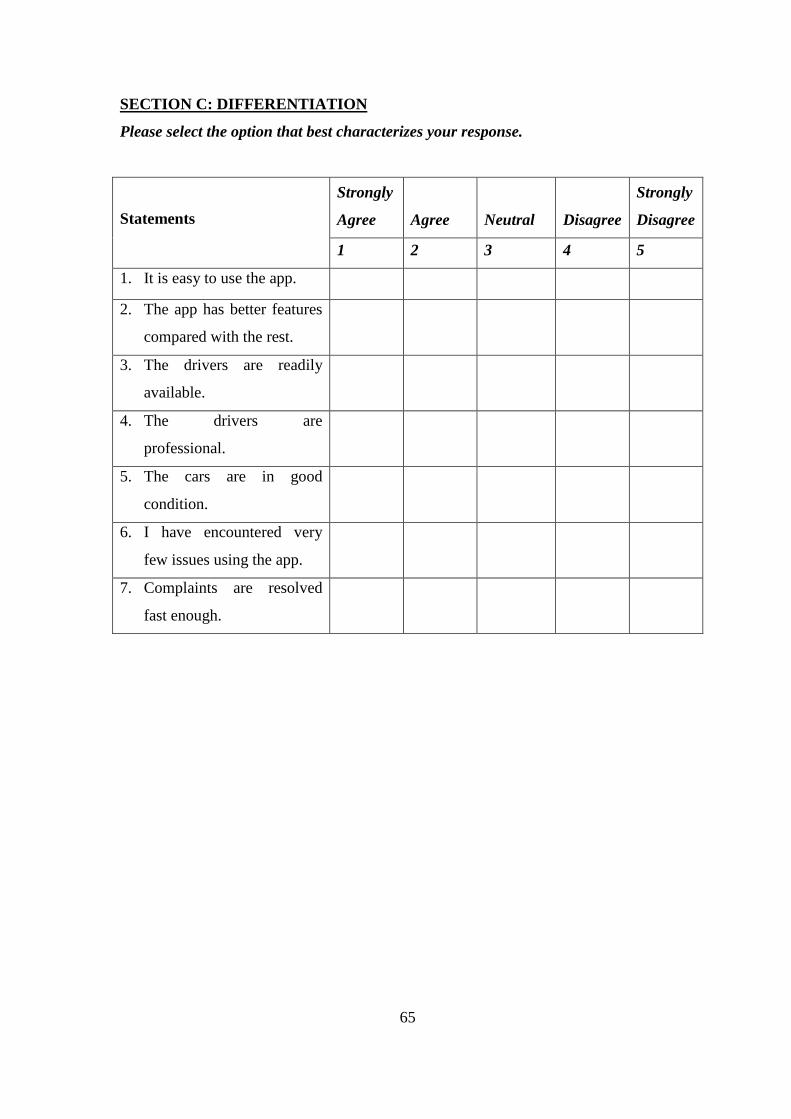
65
SECTION C: DIFFERENTIATION
Please select the option that best characterizes your response.
Statements
Strongly
Agree
Agree Neutral Disagree
Strongly
Disagree
1 2 3 4 5
1. It is easy to use the app.
2. The app has better features
compared with the rest.
3. The drivers are readily
available.
4. The drivers are
professional.
5. The cars are in good
condition.
6. I have encountered very
few issues using the app.
7. Complaints are resolved
fast enough.

66
SECTION D: FOCUS STRATEGY
Please select the option that best characterizes your response.
Statements
Strongly
Agree
Agree Neutral Disagree
Strongly
Disagree
1 2 3 4 5
1. Low prices influence the
type of app I will use.
2. I’m always willing to
switch to the cheapest app.
3. I would like to see apps
charge less.
4. Affordability is the key
factor that drives my usage.
5. Better services influence
the type of app I will use.
6. I’m always willing to
switch to the app with the
best services.
7. I would like to see apps
offer better services.
THANK YOU FOR YOUR TIME!
Related Documents