THE EFFECT OF CASH MANAGEMENT AND FIRM LIQUIDITY ON SHARE PRICES OF COMPANIES LISTED AT THE NAIROBI SECURITIES EXCHANGE BY CLIFFORD NYAMAI NZIOKA D61/61403/2010 A RESEARCH PROJECT REPORT SUBMITTED IN PARTIAL FULFILLMENT OF THE REQUIREMENTS FOR THE AWARD OF THE DEGREE OF MASTER OF BUSINESS ADMINISTRATION, SCHOOL OF BUSINESS, UNIVERSITY OF NAIROBI OCTOBER, 2012

Welcome message from author
This document is posted to help you gain knowledge. Please leave a comment to let me know what you think about it! Share it to your friends and learn new things together.
Transcript

THE EFFECT OF CASH MANAGEMENT AND FIRM LIQUIDITY ON
SHARE PRICES OF COMPANIES LISTED AT THE NAIROBI
SECURITIES EXCHANGE
BY
CLIFFORD NYAMAI NZIOKA
D61/61403/2010
A RESEARCH PROJECT REPORT SUBMITTED IN PARTIAL
FULFILLMENT OF THE REQUIREMENTS FOR THE AWARD OF THE
DEGREE OF MASTER OF BUSINESS ADMINISTRATION, SCHOOL OF
BUSINESS, UNIVERSITY OF NAIROBI
OCTOBER, 2012

ii
DECLARATION
This research project report is my original work and has not been presented for the award of a
degree in this or any other university.
Signature: ………………………………. Date: ………………………
CLIFFORD N.NZIOKA
D61/61403/2010
This project report has been submitted for examination with my approval as University Supervisor.
Signed ………………………………………. Date …………………………….
DR. FREDRICK OGILO
Lecturer, Department of Finance & Accounting
This project report has been submitted for examination with my approval as Department
Chairman.
Signed ………………………………………. Date …………………………….
DR. JOSIAH ADUDA
Chairman, Department of Finance & Accounting

iii
DEDICATION
This work is dedicated to my family especially my dear wife Rita Muthoni and my children who
have sacrificed to see me through my MBA Studies.

iv
ACKNOWLEDGEMENT
The completion of the project would not have been possible without the blessing of Almighty God
for all his glory in guiding me through the project, given me good health and resources to
accomplish my studies. I would like to acknowledge and thank my supervisor Dr. Fredrick Ogilo
for his wise counsel, guidance and direction on how to go about the research, and for being
available for consultation.
I also acknowledge the support of my family particularly my loving wife Rita Muthoni and my
dear daughters Vanessa Nyamai and Brianna Nyamai. I thank them for the love and patience and
encouragement as I toiled long hours towards accomplishing this piece of work. Lastly I appreciate
and acknowledge the entire faculty of the School of Business, University of Nairobi and my fellow
students, friends and Kenya National Highways Authority staff who made it easy for me during
my studies.

v
ABSTRACT
Liquidity refers to the ability of a firm to meet its short term and long-term financial obligations as
they fall due. Liquidity management is very important for every organization that needs to pay
current obligations on business, the payment obligations include operating and financial expenses
that are short term but maturing long term debt. The objective of the study was to establish
whether cash management and liquidity have an effect on share performance at the Nairobi
Securities Exchange (N.S.E). The study was a census study because data was gathered on every
member of the population. The population of interest in this study consisted of all the firms quoted
at the NSE. There were 59 companies listed at the NSE as at August 2012.This study was
facilitated by the use of secondary data, which was obtained at the NSE library and from other
financial intermediaries. Secondary data was collected for a period of 5years back dating 2011
December so as to get the prices changes. The data collected was analyzed using multiple
regression analysis to estimate the effect of liquidity and cash management on share prices of
companies quoted at the NSE. Company’s liquidity had positive influence on share performance
at the NSE. The study concludes that liquidity had positive significant influence on share
performance; however, cash management had no significant influence on share performance for
companies listed on the NSE. The study recommends further analysis of other micro and macro –
economic variables that affect share performance could be conducted for companies listed in the
NSE. Furthermore, the impact of Liquidity and cash management on intrinsic value share
performance could be extended to Small and Medium term enterprises.

TABLE OF CONTENT
DECLARATION ........................................................................................................................... ii
DEDICATION ................................................................................. Error! Bookmark not defined.
ACKNOWLEDGEMENT .............................................................. Error! Bookmark not defined.
ABSTRACT ..................................................................................... Error! Bookmark not defined.
ABBREVIATION……………………...……………………………………...………..……...viii
LIST OF TABLES……………………...……………………………………...………..……...ix
CHAPTER ONE: INTRODUCTION ......................................................................................... 1
1.1 Background of the Study .............................................. Error! Bookmark not defined.
1.1.1 Cash Management ...................................................... Error! Bookmark not defined.
1.1.2Liquidity ..................................................................................................................... 3
1.1.3Share prices ................................................................................................................ 5
1.1.4Effect of Cash Management and Liquidity on Share Prices ......................................... 5
1.1.5Nairobi Security Exchange .......................................................................................... 6
1.2 Research Problem ............................................................................................................. 7
1.3 Objective of the Study ...................................................................................................... 9
1.4 Value of the Study .......................................................................................................... 10
CHAPTER TWO: LITERATURE REVIEW .......................................................................... 12
2.1 Introduction .................................................................................................................... 12
2.2 Theoretical Review ......................................................................................................... 12
2.2.1 The Cash Conversion Cycle Theory .......................................................................... 12

vii
2.2.2 Dow Theory .............................................................................................................. 13
2.2.3 Random Walk Theory ............................................................................................... 14
2.3 Empirical Review ............................................................. Error! Bookmark not defined.
2.4 Summary of Literature Review ....................................... Error! Bookmark not defined.
CHAPTER THREE: RESEARCH METHODOLOGY .......................................................... 20
3.1 Introduction .................................................................................................................... 20
3.2 Research Design ............................................................................................................. 20
3.3 Population of the study ................................................................................................... 20
3.4 Data Collection ............................................................................................................... 20
3.5 Data Analysis ................................................................................................................. 21
CHAPTER FOUR: DATA ANALYSIS .................................................................................... 23
4.1 Introduction .................................................................................................................... 23
4.2 Regression Results and Analysis ..................................................................................... 24
4.3 Relationship between Liquidity and Share Prices in Various Sectors ............................... 25
CHAPTER FIVE:SUMMARY OF FINDINGS, CONCLUSIONS AND
RECOMMENDATIONS ............................................................................................................ 47
5.1 Introduction .................................................................................................................... 47
5.2 Summary of Findings ...................................................................................................... 47
5.3 Conclusion ...................................................................................................................... 48
5.4 Recommendations........................................................................................................... 48
REFERENCES ............................................................................................................................ 50
APPENDICES……………………………………………………………………...……………55

viii
ABBREVIATIONS
ASI - All Share Index
CCC - Cash Conversion Cycle
CMA - Capital Market Authority
GDP - Gross Domestic Product
NASDAQ - National Association of Securities Dealers Automated Quotation
NSE - Nairobi Securities Exchange
ix
LIST OF TABLES
Table 4.1 -Model Summary for five years
Table 4.2 -Analysis of Variance for five years
Table 4.3 -Coefficient for five years
Table 4.4 -Model Summary for 2011
Table 4.5 -Analysis of Variance 2011
Table 4.6 -Coefficient 2011
Table 4.7 -Model Summary for 2010
Table 4.8 -Analysis of Variance 2010
Table 4.9 -Coefficient 2010
Table 4.10 -Model Summary for 2009
Table 4.11 -Analysis of Variance 2009
Table 4.12 -Coefficient 2009
Table 4.13 -Model Summary for 2008
Table 4.14 -Analysis of Variance 2008
Table 4.15 -Coefficient 2008
Table 4.16 -Model Summary for 2007
Table 4.17 -Analysis of Variance 2007
Table 4.18 -Coefficient 2007

x
Table 4.19 -Correlation Agriculture Sector
Table 4.20 -Correlation Automobile and Accessories Sector
Table 4.21 -Correlation Commercial & Service Sector
Table 4.22 -Correlation Construction & Allied Sector
Table 4.23 -Correlation Energy & Petroleum Sector
Table 4.24 -Correlation Investment Sector
Table 4.25 -Correlation Manufacturing & Allied Sector
Table 4.26 -Correlation Telecommunication & Technology Sector

1
CHAPTER ONE: INTRODUCTION
1.1 Background of the Study
Liquidity refers to the ability of a firm to meet its short term and long-term financial obligations
as they fall due. It is therefore not surprising that liquidity is an important concept in the world of
business. Research has established that liquidity is an important determinant of financial distress
(Mervin, 1942; Beaver, 1966). Consequently, it is used by a variety of persons to evaluate the
riskiness of firms as well as their performance. Murphy (2005) points out that Enron’s
bankruptcy was nearly in evitable because of the combination of the company’s low cash
resources and its reliance on manipulative trading profits that could not be expected to continue
indefinitely. Liquidity management is concerned with making sure the firm has exactly the right
amount of money and lines of credit available to the business at all times. Cash is the lifeline of a
company. If this lifeline deteriorates, so does the company’s ability to fund operations, reinvest
and meet capital requirements and payments (McClure, 2003).
Working capital management therefore is probably one of the most central and most important
responsibilities of finance managers. Current assets and current liabilities represent a significant
investment by business and the liquidity position of the firm is determined by the composition
and financing of these current accounts (Lamberson, 1985). Adequate working capital for
business firms relative to their size is a requisite for proper conduct of business (Lamberson,
1985). The study is motivated by the importance of liquidity to determine if this have any
bearing on the share performance of listed firms. Previous research provides evidence that much
of the cross sectional variation in share prices can be explained by firm characteristics such as
Market Capitalization and Price to Earnings Ratio (P/E), Change in Operating Earnings and
Book-to- Market Ratios. For example, the market capitalization anomaly is documented by
Banz (1981). Fama and French (1992, 1996) examine many of these variables simultaneously

2
and conclude that two factors specifically, Size and Book-to-Market, explain the majority of the
cross sectional variation in stock returns.
Liquidity is a broad and elusive concept that generally denotes the ability to trade large quantities
quickly, at low cost, and without moving the price (Pastor and Stambugh, 2005) just as Kyle
(1985) advises, it is an ‘elusive’ and ‘slippery’ concept that is difficult to define in view of its
being composed of multiple dimensions. Kyle (1985) focused on an aspect of liquidity
associated with temporary price fluctuations induced by illiquidity. Liquidity is an important
factor in asset pricing and Lack of liquidity has the important effects on wealth, because
investors worried about the performance and capabilities of its securities trading. It is often
viewed as an important feature of the investment environment and macro economy, and recent
studies find that fluctuations in various measures of liquidity are correlated across assets.
Similarity, investors prefer to commit capital to liquid investment, which can be traded quickly
and at low cost trading (cost of illiquidity). In equilibrium, the expected returns on capital assets
are increasing functions of both risk and illiquidity (Amihud and Mendelson, 1991). Illiquidity
reflects the impact of order flow on price, the discount that a seller concedes or the premium that
a buyer pays when executing a market order that results from adverse selection costs and
inventory costs (Amihud, 2002).
1.1.1 Cash Management
Pandey (2009) defines cash management as the managing of cash flow into and out of the firm,
cash flows within the firm and the cash balances held by the firm at a point in time, by financing
deficit or investing surplus cash. Cash availability is regarded as very important for any business;
cash is both the basic input needed to keep the business running on a continuous basis and the
ultimate output realized by selling the services or product manufactured by the firm.

3
Weston (1998) stated that management of cash is closely related to management of marketable
securities which are regarded as near cash asset, serve as a backup to the cash account and can
easily be converted into cash. When a firm has excess cash or cash that is not immediately
required the cash is invested in marketable securities maturing when the cash may be required.
A firm usually becomes insolvent because it is unable to either generate sufficient cash internally
or to obtain needed cash from external sources to sustain operating, investment and financing
activities (Keige, 1991). Liquidity analysis therefore generally focuses on the relationship
between the demand for and the supply of cash or near cash items. It is for this reason that
financial ratios have been widely used to estimate liquidity of firms. Therefore, it is important to
note that both the demand for and supply of near cash items is to a greater extent influenced by
prevailing economic circumstances, for example interest rates will be high when the economy is
in recession and this will tend to place a heavier burden on firms with outstanding obligations
which will, holding other factors constant, lead to a worsening of the liquidity positions of such
firms. Thus we can see that in an economy where firms compete with each other, the economy
exerts a similar impact on all firms, however since some firms are healthier (financially) than
others, they are able to withstand the rigors of economic downturns whereas less healthy firms
fail (Ochieng, 2006).
1.1.2 Liquidity
Liquidity refers to the ease by which an asset can be sold immediately after purchase without
lowering the price and without incurring transaction costs. This means that whenever an investor
considers a potential investment in an asset, she considers very thoroughly the ability to sell it
again, what it will cost to trade it in the future and at what price it can be sold. These
considerations relate to the liquidity of the asset, and the issues considered can affect the future
cash flows of the asset. As future cash flows are affected by liquidity, it must be an important

4
factor in asset pricing. Costly trading and possible future price reductions in case of forced sale
are not pricing factors solely related to financial assets such as stocks - thus, liquidity affects the
pricing of most asset classes (Acharya and Pedersen, 2005).
Liquidity measure a business' ability to meet the payment obligations by comparing the cash and
near cash with the payment obligations. If the coverage of the latter by the former is insufficient,
it indicates that the business might face difficulties in meeting its immediate financial
obligations. This can, in turn, affect the company's business operations and profitability. The
Liquidity versus Profitability Principle: There is a trade-off between liquidity and profitability;
gaining more of one ordinarily means giving up some of the other (Bhushan, 1991).
Companies and financial institutions in the economic structure of communities have high
importance and nature of business and investment so that to gain returns, bearing of risk is
required, and risk averse investors require higher expected returns to compensate for greater risk,
this issue indicates liquidity risk in mind of investors. In other words, risk and liquidity risk are
one of the major financial markets paradigms so that depend maximizing shareholder wealth on,
and one of the major duty of capitalization markets provide liquidity (Brealey & Myers, 2010).
Liquidity is the capacity of stocks trades without high price spread and in a minimum time.
Literature investigated three aspects of liquidity: cost of tightness, depth and resiliency. The first
cost is measured by bid-ask spread, and estimate the over cost bore by an impatient investor. The
second aspect estimates the possibility of absorption of a large size order. The third aspect
approximate the necessary delay for that prices return to their equilibrium state after to be
deviated by a liquidity shocks (Omri & et al. 2000). Other definition is, Liquidity is a
fundamental concept in finance which can, broadly speaking, be defined as the time and cost
which are associated with the liquidation (or purchase) of a given quantity of financial securities.

5
Gonzalez & Rubio (2007) suggest that Liquidity consist the ease of trading any amount of a
security without affecting its price and that liquidity has two key dimensions; its price and
quantity characteristics1. It is very common to proxy these two dimensions by the relative bid-
ask spread and depth respectively. Liquidity thus refers to both the time and costs associated with
the transformation of a given position into cash and vice versa. In regard to the above was a
summary, Liquidity is an indefinable concept because it that cannot be directly observed it has
many aspects. Liquidity reflects the impact of order flow on price. This impact can be observed
as the discount that a seller concedes or the premium that a buyer pays when executing a market
order, which results from adverse selection costs and inventory costs.
1.1.3 Share Prices
Investors normally value share prices of companies according to the available public financial
information, e.g. information in annual reports and statements. However, this information hardly
gives an observable explanation of the share volatility, since the annual statements are published
when the market has already incorporated the information in the form of press releases and/or
quarterly statements in the stock prices. Researchers who defend the efficient market hypothesis
claim that the market quickly adapts to and reflects the new information, hence no abnormal
returns, i.e. returns that differ from what other risky market actors, earn.
1.1.4 Effect of Cash Management and Liquidity on Share Prices
Cash management influences the general economy through a transmission mechanism. Both a
restrictive and an expansionary monetary policy might have bilateral effects. In case of
expansionary cash management, the government creates excess liquidity by engaging in open
market operation, which results in an increase in bond price and lower interest rates. The lower
interest rate would lead to the lower required rate of return and thus, the higher stock price.

6
Additionally, an increase in monetary growth indicates excess liquidity available for buying
stocks, eventually resulting in higher stock prices due to an increase of demand to both common
stocks and the real good markets. However, cash management growth might result in higher
inflation and hence, higher nominal interest rate according to Fisher equation. The higher interest
rate leads to the higher required rate of return, which will result in the lower stock price (Fisher,
1930).
Prices of individual stocks reflect investors’ hopes and fears about the future and taken in the
aggregate stock price movements can generate a tidal wave of activity (Chen and Siems, 2002).
Disastrous events can have negative implications for stocks and bonds because of their impact on
liquidity (Barrett et. al. 1987). Decisions to buy and sell quickly, easily and inexpensively can be
reversed in liquid markets. Investors are concerned about liquidity risk because it affects their
ability to trade the quantity of shares they want to buy or sell within their desired time frame
(Vassalou et.al. 2005). Most importantly investors fear that in the event of a financial crisis they
may not be able to exit the market fast enough to contain their losses. Generally stock market
liquidity is affected by various cataclysmic events and macroeconomic variables but our main
emphasis in this study is firm’s liquidity.
1.1.5 Nairobi Securities Exchange
The Nairobi Securities Exchange (NSE) is the principal stock exchange of Kenya. It began in
1954 as an overseer security exchange while Kenya was still a British colony with permission of
the London Stock Exchange. From being a small market, the current NSE has transformed into a
vibrant capital market in East and Central Africa being rated 4th
best performing bourse in
Africa. In 1991 the NSE faced out the call-out system in favour of the open-cry system that had
been in application there before. These development was aimed at enhancing the growth of
capital market that were facilitated by the Kenya governments through the policy reforms to

7
foster sustained economic development through the creation of the Capital Market Authority
(CMA) as the industry regulator through an Act of Parliament (1989).
In particular it set out to reduce the demand of public enterprises on the exchequer, rationalize
the operations of the public enterprises, to broaden the base of ownership, and enhance the
capital market operations. The exchange controls were also removed allowing foreign
participation in the market. The NSE trades a wide range of products both fixed and variable
income securities i.e. preference shares, stocks, debentures, municipal and government bonds
The capital market performance is measured using two indices i.e. the NSE 20 share index
(comprised of the best 20 blue chip companies) and the All Share Index (ASI) that measures the
performance of all companies trading on the NSE respectively.
Ngugi and Njiru (2005) in their study stated that the NSE came into being in the 1920s when
Kenya was a British colony when an informal way of dealing in shares and stocks was
commenced. The business of shares trading was restricted only to the resident of European
community and Africans and Asians were not permitted to deal in securities. In 1963, Kenya
became independent and Africans and Asians were permitted to deal in securities. The NSE is a
member of the African Stock Exchanges Association. It is Africa's fourth largest stock exchange
in terms of trading volumes, and fifth in terms of market capitalization as a percentage of gross
Domestic Product (GDP).It has changed its name to Nairobi Securities Exchange this year 2011.
This study will be carried out based on only those companies quoted in Nairobi Securities
Exchange.
1.2 Research Problem
Liquidity management is very important for every organization that means to pay current
obligations on business, the payment obligations include operating and financial expenses that
are short term but maturing long term debt. Liquidity ratios are used for liquidity management in

8
every organization in the form of current ratio, quick ratio and Acid test ratio that greatly effect
on profitability of organization. So business has enough liquid assets (Cash, Bank) to meet the
payment schedule by comparing the cash and near-cash with the payment obligations. Liquidity
ratios work with cash and near-cash assets (together called "current" assets) of a business on one
side, and the immediate payment obligations (current liabilities) on the other side. The near-cash
assets mainly include receivables from customers and inventories of finished goods and raw
materials. The payment obligations include dues to suppliers, operating and financial expenses
that must be paid shortly and maturing installments under long-term debt (Chan et al; 2005).
Operating cash generate by assets will affect continuing firm liquidity. It is not only because of
the value of liquidation (Soenen, 1993). Firms with fewer current assets will having problem in
continuing their operations while if the current assets are too much, it shows the return on
investment is not in perfect condition (Horne and Wachowicz, 2000). Since optimum cash levels
are influenced by the factors outside the preventive concept of treasury, the company must think
broad and take serious operational decisions on how to the profit opportunities that is available in
cash flow process. According to Amihud and Mendelson (1986) illiquidity is driven by the
explicit and implicit costs of buying or selling the stock. The cost of liquidity is therefore the
sum of three components: adverse selection costs, opportunity costs, and direct costs
(commissions and fees). Liquidity is an important determinant of financial distress, because
without liquidity a firm cannot meet its financial obligations (Mervin, 1942; Beaver, 1996).
In developing countries, governments often do not pay attention to issues related to cash
management. Budget execution procedures and the management of cash flows focus on
compliance issues, while daily cash needs are met at low cost by the Central Bank. Spending
units are not concerned with borrowing costs since their interests are already taken account in the
budget prepared by the Ministry of Finance. According to the central bank of Kenya guidelines
on liquidity management, it is a crucial element in the management of an institution. It is

9
therefore important for management of any firm to not only measure liquidity on an ongoing
basis but also examine ways of how to fund liquidity requirements during distress. The apparent
variability of liquidity of companies with time has real implications for the business community
especially its effect on Share performance and is therefore deserving of further research.
Previous research done on liquidity and share performance include a study by Sitienei (2005) in
which he set to determine the relationship between liquidity and stock ownership patterns at the
NSE, Wahiu (1999) looked at the relationship between liquidity and macro-economic variables
and Simbovo (2006) who studies the effect of stock splits and large stock dividend on liquidity,
evidence from the NSE. The focus of these, and other more studies is on liquidity of the market
but considering the important role firm liquidity play in creating value for the shareholders of
corporations, this paper proposes to study the relationship firm liquidity and cash management
on share performance. Lumbasyo (1976) carried out a case study on cash management in Kenya
firms. Since then, a lot of factors may have changed. Sales trend, level of expenditure and
receipts, inflation rates, foreign exchange rates, level of awareness of the significance of proper
management and level of computerisation are example of factors that have changed. Despite the
importance of liquidity no study has been undertaken in Kenya to determine what effect it has on
share prices. The study attempts to investigate the relationship between the liquidity of quoted
firms and share performance. This study attempted to answer the following questions: Does a
relationship exist between the liquidity of quoted firms and share performance? What is the
magnitude or strength of the relationship, if one exists? What is the effect of sector
categorization on the relationship between liquidity and share performance?

10
1.3 Objective of the Study
The overall objective was to establish whether cash management and liquidity have an effect on
share performance at the Nairobi Securities Exchange.
The specific objectives were:
i) To establish the relationship between the liquidity of quoted firms and share performance.
ii) To determine the magnitude of the relationship between liquidity and share performance
of quoted firms.
iii) To find the effect of sector categorization on the relationship between liquidity and share
performance of quoted firms.
1.4 Value of the Study
The study will offer valuable contribution to theory and practice.First the study will add value to
the body of corporate financial management discipline especially in the more demanding
concerns of financial market and behavioral finance. The research will contribute to the general
body of knowledge and form a basis for further research by identifying the knowledge gap that
arises from this study. In addition, the study will enhance further discussions on firm liquidity
among financial consultants and financiers thus making significant contribution to the body of
knowledge that already exist.
To practice, the findings of this study will be of interest to financial managers, investors,
financial analysts, academicians and the Government. This study will be of use to financial
analysts since liquidity is a key indicator and predictor of bankruptcy and solvency. Financial
analysts will therefore be in a position to appreciate the relationship between liquidity and share
performance and therefore advice the firms appropriately.

11
To the financial managers and economic policy makers, identification of factors influencing
pricing of stocks at emerging markets such as NSE is essential to the institution of public and
private policies geared towards improving the stability and efficiency of stock markets. Investors
are concerned about liquidity risk. It affects their ability to trade the quantity of shares they want
to buy or sell within their desired time-framework. Investors will be in a position to make better
investment decisions aided by the findings of the study.
Academicians will find the study necessary in forming the basis for future research in finance.
Policy maker mainly the government which is positive to influence some of the variables tackled
in this study through either monetary or fiscal policy. These parties would gain a deeper
appreciation of the impact of their decisions on the shared performance.

12
CHAPTER TWO: LITERATURE REVIEW
2.1 Introduction
This chapter looked into the various existing literature both foreign and local studies on cash
management and firm liquidity. In addition it looks at theories relevant to the study, the
Significance of Liquidity Management on Performance, Measures of Liquidity and NSE in brief
and concludes by highlighting the measures used in liquidity by different authors.
2.2 Theoretical Review
The specific areas covered here were theories on cash conversion cycle, Dow Theory, random
walks theory and its effect on share prices.
2.2.1 The Cash Conversion Cycle Theory
The theory integrates both sides of working capital. In their seminal paper, Richards and
Laughlin (1980) devised this method of working capital as part of a broader framework of
analysis known as the working capital cycle. It claims that the method is superior to other forms
of working capital analysis that rely on ratio analysis or a decomposition of working capital as
claimed above. The CCC is calculated by subtracting the payables deferral period (360/annual
payables turnover) from the sum of the inventory conversion period (360/annual inventory
turnover) and the receivables conversion period (360/annual receivables turnover). More
recently, the number of days per year that appears in the denominator as 360 has been replaced
by 365 to improve accuracy. Since, each of these three components is denominated by some
number of days; the CCC is also expressed as a number of days. It has been interpreted as a time
interval between the cash outlays that arise during the production of output and the cash inflows
that result from the sale of the output and the collection of the accounts receivable (Olufemi &
Olubanjo, 2009).

13
2.2.2 Dow Theory
The Dow Theory is a theory dealing with the technical analysis of stock and is perhaps one of the
first theory’s dealing with technical analysis. It was created by Charles H. Dow in the early
1900’s who theorized on how the stock market behaved and how the market can be used to
measure the health of businesses in general. While his theory focused mainly on price, it differs a
bit from mainstream technical analysis because the theory is concerned with movements of the
broad markets rather than with specific securities. Charles Dow believed that all information
including past, present and future is reflected in the price of stocks and indexes. The Dow Theory
also suggests that the market discounts everything. As a result investors only need to focus on
the stock price movements itself rather than on the reasons for the price movement. Again, this
falls in line with the basic principles of stock technical analysis as opposed to fundamental
analysis.
These factors that affect pricing however include many things such as inflation, interest rates,
state of the economy, politics, as well as investor sentiment and emotion. Many long term traders
study these intrinsic factors, through fundamental analysis, while technical analysts believe that
these factors are already expressed in the price movements. Basically the Dow Theory suggests
that all factors are priced into the market, those that could happen, those that have happened, and
those that are expected to happen. The stock market then adjusts, along with the prices, to reflect
the new information. Under the Dow Theory a major reversal from a bear to a bull market cannot
be signaled unless both indexes both show it occurring (Fisher, 1930).
The Dow Theory also suggests that when stock market is doing well it is because conditions are
good overall. Conversely, when the market is doing poorly, then it is due to poor business
conditions. Again, as stated above, if the two market indexes are conflicting, then there is no
clear trend in the general condition of businesses. There are many other theories and tools

14
available to investors who are interested particularly in short term stock trading. Explore the
basics as well as the technical indicators that signal things which are occurring in the markets.
Candlestick analysis is extremely good for analyzing the market trends in general. The question
that is often asked is which market index is best to use for analyzing the market trend. The Dow
is often criticized for having too few stocks to represent the overall market. The NASDAQ or the
S&P 500 are more representative of the markets in general because of the larger number of
stocks represented. When applying candlestick analysis, time is not lost when analyzing all three
indexes. Due to the simplicity of the visual analysis, making an assessment of the market trend
can be done relatively easy in less than one minute total each afternoon (Rhea, 1932).
Although the Dow is comprised of only 30 stock positions, it is representative of what the big
money managers are thinking (Rhea, 1932). The Dow stocks have daily volume that can
accommodate large trade positions. Large trade positions obviously come from the large
managed money. When you have billions of dollars to be employed, the money managers of
large investment funds are going to be restricted to the stock positions that can bear the brunt of
their large money positions. The Dow continues to be a very good representation of investor
sentiment.
2.2.3 Random Walks Theory
Malkiel, a Princeton Economist, argues that price movements are largely random and investors
cannot outperform the major indices. Malkiel asserts that price movements in securities are
unpredictable. Because of this random walk, investors cannot consistently outperform the market
as a whole. Applying fundamental analysis or technical analysis to time the market is a waste of
time that will simply lead to underperformance. Investors would be better off buying and holding
an index fund.

15
Random walk theory jibes with the semi-strong efficient hypothesis in its assertion that it is
impossible to outperform the market on a consistent basis. This theory argues that stockprices are
efficient because they reflect all known information (earnings, expectations, dividends). Prices
quickly adjust to new information and it is virtually impossible to act on this information.
Furthermore, price moves only with the advent of new information and this information is
random or unpredictable (Admati & Pfleiderer, 1988).
In order to put the theory of random walks into perspective we first discuss, in brief and general
terms, the two approaches to predicting stock prices that are commonly espoused by market
professionals. These are (1) "chartist" or "technical" theories and (2) the theory of fundamental
or intrinsic value analysis. The basic assumption of all the chartist or technical theories is that
history tends to repeat itself, i.e., past patterns of price behavior in individual securities will tend
to recur in the future. Thus the way to predict stock prices (and, of course, increase one's
potential gains) is to develop a familiarity with past patterns of price behavior in order to
recognize situations of likely recurrence. Essentially, then, chartist techniques attempt to use
knowledge of the past behavior of a price series to predict the probable future behavior of the
series. A statistician would characterize such techniques as assuming that successive price
changes in individual securities are dependent. That is, the various chartist theories assume that
the sequence of price changes prior to any given day is important in predicting the price, change
for that day (Fama & Schwert, 1977).
The techniques of the chartist have always been surrounded by a certain degree of mysticism,
however, and as a result most market professionals have found them suspect. Thus it is probably
safe to say that the pure chartist is relatively rare among stock market analysts. Rather the typical
analyst adheres to a technique known as fundamental analysis or the intrinsic value method. The
assumption of the fundamental analysis approach is that at any point in time an individual
security has an intrinsic value (or in the terms of the economist, an equilibrium price) which

16
depends on the earning potential of the security. The earning potential of the security depends in
turn on such fundamental factors as quality of management, outlook for the industry and the
economy. Through a careful study of these fundamental factors the analyst should, in principle,
be able to determine whether the actual price of a security is above or below its intrinsic value. If
actual prices tend to move toward intrinsic values, then attempting to determine the intrinsic
value of a security is equivalent to making a prediction of its future price; and this is the essence
of the predictive procedure implicit in fundamental analysis (Cootner,1964).
Chartist theories and the theory of fundamental analysis are really the province of the market
professional and to a large extent teachers of finance. Historically, however, there has been a
large body of academic people, primarily economists and statisticians, who adhere to a radically
different approach to market analysis of the theory of random walks in stock market prices. The
remainder of this article will be devoted to a discussion of this theory and its major implications.
Random walk theorists usually start from the premise that the major security exchanges are good
examples of "efficient" markets. An "efficient" market is defined as a market where there are
large numbers of rational, profit-maximizers actively competing, with each trying to predict
future market values of individual securities, and where important current information is almost
freely available to all participants. In an efficient market, competition among the many
intelligent participants leads to a situation where, at any point in time, actual prices of individual
securities already reflect the effects of information based both on events that have already
occurred and on events which, as of now, the market expects to take place in the future. In other
words, in an efficient market at any point in time the actual price of a security will be a good
estimate of its intrinsic value (Bernanke & Kuttner, 2005).
The challenge of the theory of random walks to the proponent of fundamental analysis, however,
is more involved. If the random walk theory is valid and if security exchanges are "efficient"
markets, then stock prices at any point in time will represent good estimates of intrinsic or

17
fundamental values. Thus, additional fundamental analysis is of value only when the analyst has
new information which was not fully considered in forming current market prices, or has new
insights concerning the effects of generally available information which are not already implicit
in current prices. If the analyst has neither better insights nor new information, he may as well
forget about fundamental analysis and choose securities by some random selection procedure. In
essence, the challenge of the random walk theory to the proponent of fundamental analysis is to
show that his more complicated procedures are actually more profitable than a simple random
selection policy. As in the case of the chartist, the challenge is an empirical one. The analyst
cannot merely protest that he thinks the securities he selects do better than randomly selected
securities; he must demonstrate that this is in fact the case (Chalmers & Kadlec, 1998).
2.3 Empirical Review
A review of the empirical studies and previous studies done in Kenya on stock market and
liquidity indicate that very little work has been done in this area. A lot has been done on the
effects of macroeconomic variables on the stock market returns which finally relates to stock
market liquidity (Waciira, 1999). Sitienei (2005) studied the relationship between liquidity and
stock ownership pattern at the NSE. His main objectives were to document the ownership pattern
and liquidity of stocks listed at the NSE; and to determine the relationship between stock
liquidity and stock ownership patterns traded at NSE. The results of his study support the fact
that there is a positive relationship between liquidity, shares outstanding, number of
shareholders, public ownership as well as foreign ownership.
Kamanda (2001) set out to determine and evaluate quoted equity portfolios of insurance
companies. He did this by examining the risk return characteristics of the equity portfolios held
by the individual insurance companies. His major finding was that quoted equity portfolios held
by Insurance companies were poorly diversified as they had performed worse than the market
18
portfolio. Kangethe (2000) set out to investigate the effect of Government ownership on share
price volatility of companies quoted at Nairobi Securities Exchange for the period 1997 to 1998.
The specific objective of the study was to establish whether government ownership influences
the share price volatility of the companies quoted at the Nairobi Securities Exchange. He found
that there was a significant difference in the share stock volatility between the companies in
which the government had shareholding and the market index.
Ochieng (2006) studied the relationship between working capital of firms listed in NSE and
economic activities in Kenya. The objective was to examine how the changes in economic
activities affect changes in working capital by firms listed in NSE. The liquidity position of the
50 small firms included in this study as measured by the current and quick ratios increased
slightly during economic expansions and decreased during economic slowdown. However the
liquidity positions reacted differently to different economic indications.
A study done by Tamari (1966) has shown that liquidity ratios are strong predictors of financial
distress in a study of companies based in the US and elsewhere. In Kenya, similar work has been
done by Keige (1991) who also established the viability of liquidity ratios in predicting financial
distress as early as two years in advance. Meigs and Meigs (1999), observe that being too liquid
is as costly as having too little liquidity. The objective of liquidity management therefore is to
ensure that a firm will be able to meet in full all its obligations as and when they fall due
(Gardner and Mills, 1994).
2.4 Summary of Literature Review
This chapter comprised of the theoretical review and the review of previous studies on the study
area. This study was guided by cash conversion cycle, Dow theory and the random walks theory.
These theories show the relationship between cash management, liquidity and share
performance. Various studies were also reviewed in an attempt to explain the effect of cash

19
management, liquidity on share prices. However, a review of the literature established that very
few studies have been conducted in the Kenyan context in regard to the study topic. This study
there will fill this gap conducting a study to show the relationship between cash management,
liquidity and share prices on companies listed in the NSE.

20
CHAPTER THREE: RESEARCH METHODOLOGY
3.1 Introduction
This chapter discussed the research methodology used in the study including the research design,
population of the study, sample size, data collection instruments and procedures and data
analysis.
3.2 Research Design
The study was a census study because data was gathered on every member of the population.
Sometimes, the entire population is Cooper & Schindler (2007) a census is feasible when the
population is small and necessary when the elements are quite different from each other. When
the population is small and variable, any sample we draw may not be representative of the
population from which it is drawn. Hence, this was appropriate for the study.
3.3 Population of the study
The population of interest in this study consisted of all the firms quoted at the Nairobi Securities
Exchange (N.S.E). There were 59 companies listed on the NSE as at August 2012. The study
collected data for all the companies listed at the NSE thus a census study was adopted and there
was no sampling since the population was small.
3.4 Data Collection
This study was facilitated by the use of secondary data, which was obtained at the N.S.E library
and from other financial intermediaries. Where data was not available from Nairobi Securities
Exchange reference was made to annual financial reports published by companies studied.
Secondary data was collected for a period of 5years back dating 2011 December so that we could
get the prices changes. The following data was collected, average share prices for the month,

21
3.5 Data Analysis
The data collected was analyzed using multiple regression analysis to estimate the effect of
liquidity and cash management on share prices of companies quoted at the NSE. Regression
analysis was used to establish the relationship between the liquidity and share prices. Positive p-
value showed a direct relationship while a negative p-value showed an inverse relationship. The
test of significance was undertaken to analyze the magnitude of the relationship.
The following formula was adopted
The regression model was as follows:
y = β0+ β1X1+β2X2+ẹ
Where:
y = Share Prices: The average monthly share prices from NSE
β0 = Constant Term
β1= Beta coefficients
X1= Liquidity: Liquidity ratio=Current Assets/Current Liabilities
X2= Cash Management: Use Cash Conversion Cycle (CCC)
Inventory Conversion Period=Inventory/Sales per day
Receivables Collection Period=Receivables/Sales per day
Payables deferral Period=Payables/Cost of goods sold per day
CCC=Inventory conversion period +Receivable collection period-Payable deferral period.
E = error term

22
The analysis of quantitative data was carried out using SPSS (Statistical Package for Social
Science) and then presented inform of tables. F test was used to test for the strength of the
relationship between Y and X. The f- test determined the significance of the overall model and
whether all the variables influence the dependent variable. Z -test was also adopted to test
formulated hypotheses.

23
CHAPTER FOUR: DATA ANALYSIS
4.1 Introduction
This chapter focused on presentation and analysis of research data. Data analysis addressed
the main objective identified in chapter one, which sought to determine whether cash
management and liquidity have an effect on share performance at the Nairobi Securities
Exchange.
4.2 Regression Results and Analysis
4.2.1 Overall Regression for Five Years
The table below presents the model summary results for all the five years for listed
companies in the Nairobi Securities exchange.
Table 4. 1: Model Summary for Five Years
Model R R Square Adjusted R Square Std. Error of the
Estimate
1 .205a .042 .028 68.56616
a. Predictors: (Constant), X2Overall, X1Overall
Source: Research data NSE
The study established the correlation coefficient R for all the five years under study to be
0.205 implying that the strength of linear relationship between company share prices and
liquidity and cash management variables were fairly weak.

24
The study further established the R2
value to be 0.042. This implied that up to 4.2% of
variations in share prices could be explained by changes in liquidity and cash management
for the entire five years. 95.8% of variations in share prices were due to other factors other
than liquidity and cash management variations.
The table below presents summary results for Analysis of Variance of the entire five years
under study.
Table 4. 2: ANOVAa
for Five Years
Model Sum of Squares df Mean Square F Sig.
1
Regression 29380.355 2 14690.177 3.125 .047b
Residual 672288.494 143 4701.318
Total 701668.848 145
a. Dependent Variable: Y1Overall
b. Predictors: (Constant), X2Overall, X1Overall
Source: Research data NSE
Based on the results the study established that the p-value for the model was 0.047. This
implied that the entire model was significant at 5% level of significance since the p-value was
less than 0.05. Hence the regression model would be reliable to draw conclusions from.
The table below presents coefficient results obtained for the regression model for the five
years under study.

25
Table 4. 3: Coefficients for Five Years
Model Unstandardized Coefficients Standardized
Coefficients
t Sig.
B Std. Error Beta
1
(Constant) 28.041 13.090 2.142 .034
X1Overall 17.534 7.347 .202 2.387 .018
X2Overall -.026 .020 -.112 -1.319 .189
a. Dependent Variable: Y1Overall
Source: Research data NSE
Based on the results the study established the regression model for the entire five years to be
as follows:
The constant coefficient of 28.041 implies that in absence of liquidity and cash management
variables the share price of a security would be Ksh.28.041. The corresponding p-value was
0.034. Since 0.034 was less than 0.05, this implied that the constant coefficient was
significant at 5% level of significance.
The liquidity coefficient X1 was found to be 17.054. This implied that a unit increase in
current asset to current liability variable would increase the share price of the company by
Ksh.17.534. The corresponding p-value was found to be 0.018. Since the coefficients p-value
was less than 0.05, this implied that liquidity was significant at 5% level of significance in
influencing variations in share prices.

26
The cash management coefficient X2 was found to be -0.026. This implied that an increase in
the cash conversion cycle by 1 day would cause a corresponding decrease in the share price
by Ksh.0.026. The corresponding p-value was found to be 0.189. Since the p-value was
greater than 0.05, this implied that cash management was not significant at 5% level of
significance in influencing variations in share prices.
4.2.2 Regression Results 2011
The table below presents the model summary results for the year 2011 for listed companies in
the Nairobi Securities Exchange.
Table 4. 4: Model Summarya 2011
Model R R Square Adjusted R Square Std. Error of the
Estimate
1 .058a .003 -.068 63.05712
a. Predictors: (Constant), X22011, X12011
Source: Research data NSE
The study established the correlation coefficient R for the year 2011 under study to be 0.058
implying that the strength of linear relationship between company share prices and liquidity
and cash management variables were weak.
The study further established the R2
value to be 0.003. This implied that up to 0.3% of
variations in share prices in 2011 could be explained by changes in liquidity and cash
management for the year 2011. 99.7% of variations in share prices were due to other factors
other than liquidity and cash management variations.
The table below presents summary results for Analysis of Variance of the year 2011.

27
Table 4. 5: ANOVAa
2011
Model Sum of Squares df Mean Square F Sig.
1
Regression 378.739 2 189.369 .048 .954b
Residual 111333.618 28 3976.201
Total 111712.357 30
a. Dependent Variable: Y2011
b. Predictors: (Constant), X22011, X12011
Source: Research data NSE
Based on the results the study established that the p-value for the model was 0.954. This
implied that the entire model was not significant at 5% level of significance since the p-value
was greater than 0.05. Hence the regression model would not be reliable to draw conclusions
from.
The table below presents coefficient results obtained for the regression model for the year
2011.

28
Table 4. 6: Coefficientsa 2011
Model Unstandardized Coefficients Standardized
Coefficients
t Sig.
B Std. Error Beta
1
(Constant) 37.102 26.420 1.404 .171
X12011 2.884 15.589 .038 .185 .855
X22011 -.007 .024 -.060 -.298 .768
a. Dependent Variable: Y2011
Source: Research data NSE
Based on the results the study established the regression model for the year 2011 to be as
follows:
The constant coefficient of 37.102 implies that in absence of liquidity and cash management
variables the share price of a security would be Ksh.37.102. The corresponding p-value was
0.171. Since 0.171 was greater than 0.05, this implied that the constant coefficient was not
significant at 5% level of significance.
The liquidity coefficient X1 was found to be 2.884. This implied that a unit increase in current
asset to current liability variable would increase the share price of the company by Ksh.
2.884. The corresponding p-value was found to be 0.855. Since the coefficients p-value was
greater than 0.05, this implied that liquidity was not significant at 5% level of significance in
influencing variations in share prices.

29
The cash management coefficient X2 was found to be -0.007. This implied that an increase in
the cash conversion cycle by 1 day would cause a corresponding decrease in the share price
by Ksh.0.007. The corresponding p-value was found to be 0.768. Since the p-value was
greater than 0.05, this implied that cash management was not significant at 5% level of
significance in influencing variations in share prices.
4.2.3 Regression Results 2010
The table below presents the model summary results for all the year 2010 for listed
companies in the Nairobi Securities exchange.
Table 4. 7: Model Summary 2010
Model R R Square Adjusted R Square Std. Error of the
Estimate
1 .133a .018 -.053 72.47832
a. Predictors: (Constant), X22010, X12010
Source: Research data NSE
The study established the correlation coefficient R for year 2010 under study to be 0.133
implying that the strength of linear relationship between company share prices and liquidity
and cash management variables were fairly weak.
The study further established the R2
value to be 0.018. This implied that up to 1.8% of
variations in share prices could be explained by changes in liquidity and cash management
for the year 2010. 98.2% of variations in share prices were due to other factors other than
liquidity and cash management variations.

30
The table below presents summary results for Analysis of Variance of the year 2010 under
study.
Table 4. 8: ANOVAa
2010
Model Sum of Squares df Mean Square F Sig.
1
Regression 2632.382 2 1316.191 .251 .780b
Residual 147087.008 28 5253.107
Total 149719.390 30
a. Dependent Variable: Y2010
b. Predictors: (Constant), X22010, X12010
Source: Research data NSE
Based on the results the study established that the p-value for the model was 0.780. This
implied that the entire model was not significant at 5% level of significance since the p-value
was greater than 0.05. Hence the regression model would not be reliable to draw conclusions
from.
The table below presents coefficient results obtained for the regression model for the year
2010 under study.

31
Table 4. 9: Coefficientsa 2010
Model Unstandardized Coefficients Standardized
Coefficients
t Sig.
B Std. Error Beta
1
(Constant) 55.108 30.064 1.833 .077
X12010 -1.629 16.551 -.019 -.098 .922
X22010 -.027 .041 -.127 -.655 .518
a. Dependent Variable: Y2010
Source: Research data NSE
Based on the results the study established the regression model for the entire five years to be
as follows:
The constant coefficient of 55.108 implies that in absence of liquidity and cash management
variables the share price of a security would be Ksh.55.108. The corresponding p-value was
0.077. Since 0.077 was greater than 0.05, this implied that the constant coefficient was not
significant at 5% level of significance.
The liquidity coefficient X1 was found to be -1.629. This implied that a unit increase in
current asset to current liability variable would decrease the share price of the company by
Ksh.1.629. The corresponding p-value was found to be 0.922. Since the coefficients p-value
was greater than 0.05, this implied that liquidity was not significant at 5% level of
significance in influencing variations in share prices.

32
The cash management coefficient X2 was found to be -0.027. This implied that an increase in
the cash conversion cycle by 1 day would cause a corresponding decrease in the share price
by Ksh.0.027. The corresponding p-value was found to be 0.518. Since the p-value was
greater than 0.05, this implied that cash management was not significant at 5% level of
significance in influencing variations in share prices.
4.2.4 Regression Results 2009
The table below presents the model summary results for the year 2009 for listed companies in
the Nairobi Securities Exchange.
Table 4. 10: Model Summary 2009
Model R R Square Adjusted R Square Std. Error of the
Estimate
1 .457a .209 .148 65.64294
a. Predictors: (Constant), X22009, X12009
Source: Research data NSE
The study established the correlation coefficient R for all the year 2009 under study to be
0.457 implying that the strength of linear relationship between company share prices and
liquidity and cash management variables were moderate.
The study further established the R2value to be 0.209. This implied that up to 20.9% of
variations in share prices could be explained by changes in liquidity and cash management
for the year 2009. 79.1% of variations in share prices were due to other factors other than
liquidity and cash management variations.

33
The table below presents summary results for Analysis of Variance of the year 2009 under
study.
Table 4. 11: ANOVAa
2009
Model Sum of Squares df Mean Square F Sig.
1
Regression 29563.256 2 14781.628 3.430 .048b
Residual 112033.891 26 4308.996
Total 141597.146 28
a. Dependent Variable: Y2009
b. Predictors: (Constant), X22009, X12009
Source: Research data NSE
Based on the results the study established that the p-value for the model was 0.048. This
implied that the entire model was significant at 5% level of significance since the p-value was
less than 0.05. Hence the regression model would be reliable to draw conclusions from.
The table below presents coefficient results obtained for the regression model for the year
2009 under study.

34
Table 4. 12: Coefficientsa
2009
Model Unstandardized Coefficients Standardized
Coefficients
t Sig.
B Std. Error Beta
1
(Constant) -1.969 27.455 -.072 .943
X12009 37.491 16.253 .453 2.307 .029
X22009 .007 .159 .009 .046 .964
a. Dependent Variable: Y2009
Source: Research data NSE
Based on the results the study established the regression model for the entire five years to be
as follows:
The liquidity coefficient X1 was found to be 37.419. This implied that a unit increase in
current asset to current liability variable would increase the share price of the company by
Ksh.37.491. The corresponding p-value was found to be 0.029. Since the coefficients p-value
was less than 0.05, this implied that liquidity was significant at 5% level of significance in
influencing variations in share prices.
The cash management coefficient X2 was found to be 0.007. This implied that an increase in
the cash conversion cycle by 1 day would cause a corresponding increase in the share price
by Ksh.0.007. The corresponding p-value was found to be 0.964. Since the p-value was
greater than 0.05, this implied that cash management was not significant at 5% level of
significance in influencing variations in share prices.

35
4.2.5 Regression Results 2008
The table below presents the model summary results for all the year 2008 for listed
companies in the Nairobi Securities exchange.
Table 4. 13: Model Summary 2008
Model R R Square Adjusted R Square Std. Error of the
Estimate
1 .387a .149 .089 63.59737
a. Predictors: (Constant), X22008, X12008 Source: Research data NSE
The study established the correlation coefficient R for all the year 2008 under study to be
0.387 implying that the strength of linear relationship between company share prices and
liquidity and cash management variables were fairly weak.
The study further established the R2value to be 0.149. This implied that up to 14.9% of
variations in share prices could be explained by changes in liquidity and cash management
for the year 2008. 85.1% of variations in share prices were due to other factors other than
liquidity and cash management variations.
The table below presents summary results for Analysis of Variance of the year 2008 under
study.

36
Table 4. 14: ANOVAa
2008
Model Sum of Squares df Mean Square F Sig.
1
Regression 19892.844 2 9946.422 2.459 .104b
Residual 113249.503 28 4044.625
Total 133142.347 30
a. Dependent Variable: Y2008
b. Predictors: (Constant), X22008, X12008
Source: Research data NSE
Based on the results the study established that the p-value for the model was 0.104. This
implied that the entire model was not significant at 5% level of significance since the p-value
was greater than 0.05. Hence the regression model would not be reliable to draw conclusions
from.
The table below presents coefficient results obtained for the regression model for the year
2008 under study.

37
Table 4. 15: Coefficientsa
2008
Model Unstandardized Coefficients Standardized
Coefficients
t Sig.
B Std. Error Beta
1
(Constant) 5.506 25.700 .214 .832
X12008 30.970 14.036 .398 2.206 .036
X22008 -.079 .100 -.141 -.784 .439
a. Dependent Variable: Y2008
Source: Research data NSE
Based on the results the study established the regression model for the year 2008 to be as
follows:
The constant coefficient of 5.506 implies that in absence of liquidity and cash management
variables the share price of a security would be Ksh.5.506. The corresponding p-value was
0.832. Since 0.832 was greater than 0.05, this implied that the constant coefficient was not
significant at 5% level of significance.
The liquidity coefficient X1 was found to be 30.970. This implied that a unit increase in
current asset to current liability variable would increase the share price of the company by
Ksh.30.970. The corresponding p-value was found to be 0.036. Since the coefficients p-value
was less than 0.05, this implied that liquidity was significant at 5% level of significance in
influencing variations in share prices.

38
The cash management coefficient X2 was found to be -0.079. This implied that an increase in
the cash conversion cycle by 1 day would cause a corresponding decrease in the share price
by Ksh.0.079. The corresponding p-value was found to be 0.439. Since the p-value was
greater than 0.05, this implied that cash management was not significant at 5% level of
significance in influencing variations in share prices.
4.2.6 Regression Results 2007
The table below presents the model summary results for the year 2007 for listed companies in
the Nairobi Securities exchange.
Table 4. 16: Model Summary
Model R R Square Adjusted R Square Std. Error of the
Estimate
1 .528a .279 .210 71.16085
a. Predictors: (Constant), X22007, X12007
Source: Research data NSE
The study established the correlation coefficient R for all the year 2007 under study to be
0.528 implying that the strength of linear relationship between company share prices and
liquidity and cash management variables were moderate.
The study further established the R2
value to be 0.279. This implied that up to 27.9% of
variations in share prices could be explained by changes in liquidity and cash management
for the year 2007. 72.1% of variations in share prices were due to other factors other than
liquidity and cash management variations.

39
The table below presents summary results for Analysis of Variance of the year 2007 under
study.
Table 4. 17: ANOVAa
2007
Model Sum of Squares df Mean Square F Sig.
1
Regression 41086.720 2 20543.360 4.057 .032b
Residual 106341.193 21 5063.866
Total 147427.912 23
a. Dependent Variable: Y2007
b. Predictors: (Constant), X22007, X12007
Source: Research data NSE
Based on the results the study established that the p-value for the model was 0.032. This
implied that the entire model was significant at 5% level of significance since the p-value was
less than 0.05. Hence the regression model would be reliable to draw conclusions from.
The table below presents coefficient results obtained for the regression model for the year
2007 under study.

40
Table 4. 18: Coefficientsa
2007
Model Unstandardized Coefficients Standardized
Coefficients
t Sig.
B Std. Error Beta
1
(Constant) 93.197 40.133 2.322 .030
X12007 -4.865 22.246 -.041 -.219 .829
X22007 -.291 .102 -.528 -2.845 .010
a. Dependent Variable: Y2007
Source: Research data NSE
Based on the results the study established the regression model for the entire five years to be
as follows:
The constant coefficient of 93.197 implies that in absence of liquidity and cash management
variables the share price of a security would be Ksh.93.197. The corresponding p-value was
0.030. Since 0.030 was less than 0.05, this implied that the constant coefficient was
significant at 5% level of significance.
The liquidity coefficient X1 was found to be -4.865. This implied that a unit increase in
current asset to current liability variable would decrease the share price of the company by
Ksh.4.865. The corresponding p-value was found to be 0.829. Since the coefficients p-value
was greater than 0.05, this implied that liquidity was not significant at 5% level of
significance in influencing variations in share prices.

41
The cash management coefficient X2 was found to be -0.291. This implied that an increase in
the cash conversion cycle by 1 day would cause a corresponding decrease in the share price
by Ksh.0.291. The corresponding p-value was found to be 0.010. Since the p-value was less
than 0.05, this implied that cash management was significant at 5% level of significance in
influencing variations in share prices.
4.3 Relationship between Liquidity and Share Prices in Various Sectors
4.3.1 Agriculture Sector
The table below presents findings for the relationship between liquidity and share prices in
the Agriculture sector.
Table 4. 19: Correlations Agriculture Sector
AgricultureSP AgricultureLIQ
AgricultureSP
Pearson Correlation 1 .630**
Sig. (2-tailed) .001
N 31 31
**. Correlation is significant at the 0.01 level (2-tailed).
Source: Research data NSE
The results established the Pearson correlation coefficient between share price and liquidity
to be 0.630 for this sector. This implied that there was a positive relationship between share
performance and liquidity. The corresponding p-value was found to be 0.001. Since it was
less than 0.05, this implied the relationship between share performance and liquidity for this
sector was significant.

42
4.3.2 Automobiles and Accessories Sector
The table below presents findings for the relationship between liquidity and share prices in
the Automobiles and Accessories Sector.
Table 4. 20: Correlations Automobiles and Accessories Sector
AutomobileSP AutomobileLIQ
AutomobileSP
Pearson Correlation 1 -.443
Sig. (2-tailed) .051
N 20 20
Source: Research data NSE
The results established the Pearson correlation coefficient between share price and liquidity
to be -0.443 for this sector. This implied that there was a negative relationship between share
performance and liquidity. The corresponding p-value was found to be 0.051. Since it was
greater than 0.05, this implied the relationship between share performance and liquidity for
this sector was not significant.
4.3.3 Commercial and Services Sector
The table below presents findings for the relationship between liquidity and share prices in
the Commercial and Services Sector.

43
Table 4. 21: Correlations Commercial and Services Sector
CommercialSP CommercialLIQ
CommercialSP
Pearson Correlation 1 .579**
Sig. (2-tailed) .001
N 33 33
**. Correlation is significant at the 0.01 level (2-tailed).
Source: Research data NSE
The results established the Pearson correlation coefficient between share price and liquidity
to be 0.579 for this sector. This implied that there was a positive relationship between share
performance and liquidity. The corresponding p-value was found to be 0.001. Since it was
less than 0.05, this implied the relationship between share performance and liquidity for this
sector was significant.
4.3.4 Construction and allied Sector
The table below presents findings for the relationship between liquidity and share prices in
the Construction and allied Sector.
Table 4. 22: Correlations Construction and allied Sector
ConstructionSP ConstructionLIQ
ConstructionSP
Pearson Correlation 1 .283
Sig. (2-tailed) .180
N 24 24
Source: Research data NSE

44
The results established the Pearson correlation coefficient between share price and liquidity
to be 0.283 for this sector. This implied that there was a positive relationship between share
performance and liquidity. The corresponding p-value was found to be 0.180. Since it was
greater than 0.05, this implied the relationship between share performance and liquidity for
this sector was not significant.
4.2.5 Energy and Petroleum Sector
The table below presents findings for the relationship between liquidity and share prices in
the Energy and Petroleum Sector.
Table 4. 23: Correlations Energy and Petroleum Sector
EnergySP EnergyLIQ
EnergySP
Pearson Correlation 1 -.302
Sig. (2-tailed) .196
N 20 20
Source: Research data NSE
The results established the Pearson correlation coefficient between share price and liquidity
to be -0.302 for this sector. This implied that there was a negative relationship between share
performance and liquidity. The corresponding p-value was found to be 0.196. Since it was
greater than 0.05, this implied the relationship between share performance and liquidity for
this sector was not significant.
45
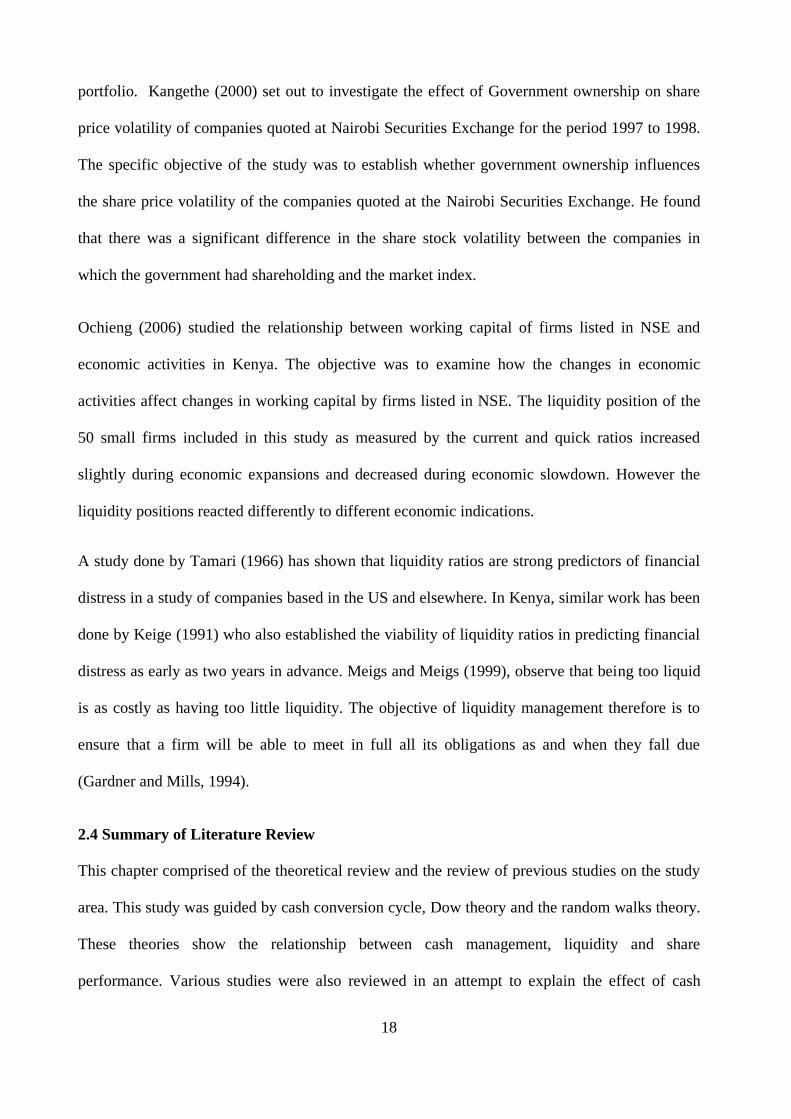
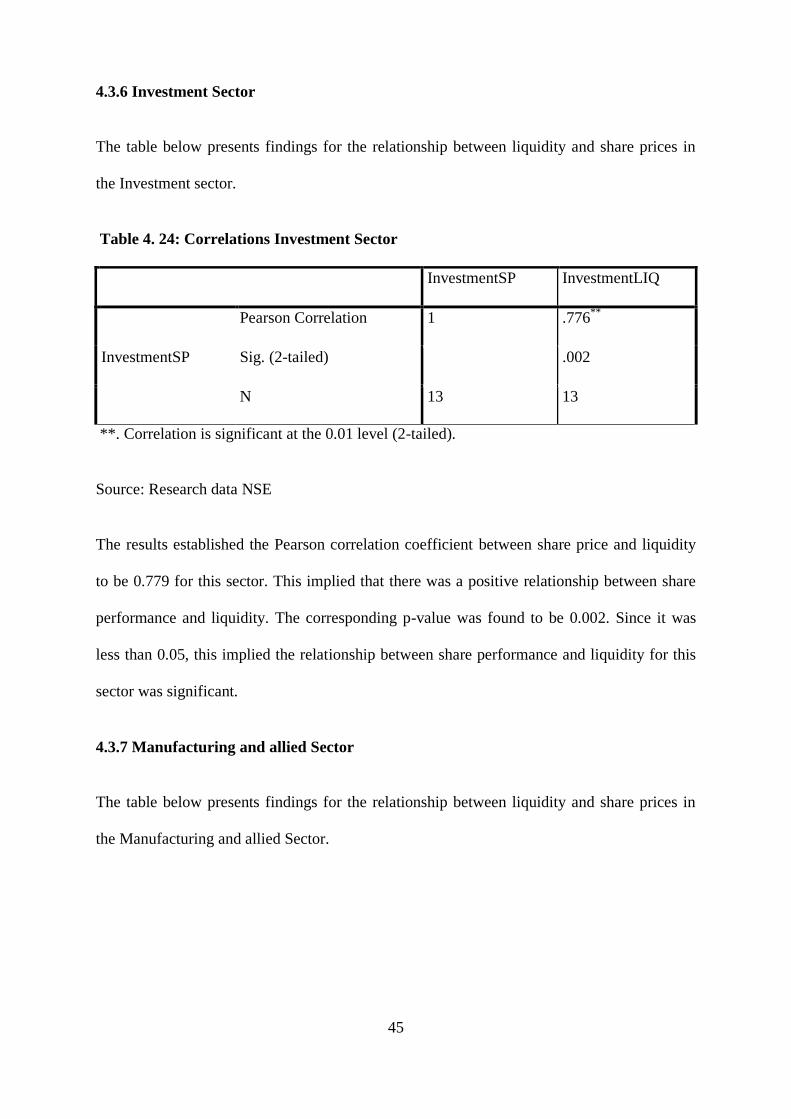
4.3.6 Investment Sector
The table below presents findings for the relationship between liquidity and share prices in
the Investment sector.
Table 4. 24: Correlations Investment Sector
InvestmentSP InvestmentLIQ
InvestmentSP
Pearson Correlation 1 .776**
Sig. (2-tailed) .002
N 13 13
**. Correlation is significant at the 0.01 level (2-tailed).
Source: Research data NSE
The results established the Pearson correlation coefficient between share price and liquidity
to be 0.779 for this sector. This implied that there was a positive relationship between share
performance and liquidity. The corresponding p-value was found to be 0.002. Since it was
less than 0.05, this implied the relationship between share performance and liquidity for this
sector was significant.
4.3.7 Manufacturing and allied Sector
The table below presents findings for the relationship between liquidity and share prices in
the Manufacturing and allied Sector.

46
Table 4. 25: Correlations Manufacturing and allied Sector
ManufacturingSP ManufacturingLIQ
ManufacturingSP
Pearson Correlation 1 -.261
Sig. (2-tailed) .253
N 21 21
Source: Research data NSE
The results established the Pearson correlation coefficient between share price and liquidity
to be -0.261 for this sector. This implied that there was a negative relationship between share
performance and liquidity. The corresponding p-value was found to be 0.253. Since it was
greater than 0.05, this implied the relationship between share performance and liquidity for
this sector was not significant.
4.3.8 Telecommunication and Technology Sector
The table below presents findings for the relationship between liquidity and share prices in
the Agriculture sector.
Table 4. 26: Correlations Telecommunication and Technology Sector
TelSP TelLIQ
TelSP
Pearson Correlation 1 .748*
Sig. (2-tailed) .021
N 9 9
*. Correlation is significant at the 0.05 level (2-tailed).
Source: Research data NSE

47
The results established the Pearson correlation coefficient between share price and liquidity
to be 0.748 for this sector. This implied that there was a positive relationship between share
performance and liquidity. The corresponding p-value was found to be 0.021. Since it was
less than 0.05, this implied the relationship between share performance and liquidity for this
sector was significant.

48
CHAPTER FIVE: SUMMARY OF FINDINGS, CONCLUSIONS AND
RECOMMENDATIONS
5.1 Introduction
This chapter presented the summary of the findings from chapter four, and also gives
conclusions and recommendations of the study based on the objective of the study which
sought to determine whether cash management and liquidity have an effect on share
performance at the Nairobi Securities Exchange.
5.2 Summary of Findings
5.2.1 Effect of Liquidity on Share Performance
As regards liquidity when examining the entire period of study, this study found that extent of
a company’s liquidity had positive influence on share performance at the Nairobi Securities
Exchange as shown in table 4.3 above. This implied that an improvement in liquidity position
had a corresponding favorable outcome on the listed company’s share performance. From
table 4.3 above, liquidity was also established to be significant at 5% level of significance.
The study further established the R2
value to be 0.042 as shown in table 4.1 above. This
implied that up to 4.2% of variations in share prices could be explained by changes in
liquidity and cash management for the entire five years. 95.8% of variations in share prices
were due to other factors other than liquidity and cash management variations. Finally, based
on table 4.2 above, the study established that the p-value for the model was 0.047. This
implied that the entire model was significant at 5% level of significance since the p-value was
less than 0.05. Hence the regression model would be reliable to draw conclusions from.
49
5.2.2 Effect of Cash Management on Share Performance
As regards cash management when examining the entire period of study as in table 4.3, this
study found that extent of a company’s cash conversion cycle had negative influence on share
performance at the Nairobi Securities Exchange. This implied that an improvement in cash
management position, that is low cash conversion cycle, had a corresponding favourable
outcome on the listed company’s share performance. However, cash management was found
not to be significant at 5% level of significance as shown in table 4.3 above. The study
further established the R2
value to be 0.042 as shown in table 4.1 above. This implied that up
to 4.2% of variations in share prices could be explained by changes in liquidity and cash
management for the entire five years. 95.8% of variations in share prices were due to other
factors other than liquidity and cash management variations. Finally, based on table 4.2
above, the study established that the p-value for the model was 0.047. This implied that the
entire model was significant at 5% level of significance since the p-value was less than 0.05.
Hence the regression model would be reliable to draw conclusions from.
5.2.3 Impact of Sector Categorization’s Liquidity on Share Performance
The findings of the study showed the following sectors to have a positive relationship
between share performance and liquidity as measured using the Pearson correlation
coefficient. Agriculture Sector as shown in table 4.19 above; commercial and Services sector
as shown in table 4.21 above; Construction and allied Sector as shown in table 4.22 above
and Telecommunication and Technology Sector as shown in table 4.26 above. The
implication of the positive relationship for these sectors was that an increase in liquidity
position caused a corresponding increase in share performance.

50
Moreover the study established a negative relationship between share price and liquidity
based on Pearson correlation coefficient for the following sectors: Automobiles and
Accessories sector as shown in table 4.20 above; Energy and Petroleum Sector as shown in
table 4.23 above; Investment Sector as shown in table 4.24 above and Manufacturing and
allied Sector as shown in table 4.25 above. The implication of the negative relationship was
that an increase in liquidity position resulted in a decrease in share performance for these
sectors.
However of all the sectors examined only four had a significant correlation between liquidity
and share performance. Namely the sectors were; Agriculture as in table 4.19 above;
Commercial and Services as in table 4.21 above; Investment as in table 4.24 above and
Telecommunication sectors as in table 4.26 above. Noteworthy, all these four sectors had a
strong positive relationship between share performance and liquidity.
5.3 Conclusions
The study concludes that liquidity had a positive significant influence on share performance.
The significance of this finding was that for companies listed at the Nairobi Securities
Exchange an improvement in liquidity position had a corresponding favorable outcome on
the company’s share performance. The study further found a significant positive correlation
between liquidity and share performance for the following four sectors: Agriculture,
Commercial and Services, Investment and Telecommunication sectors. This implied there
was a positive relationship between share performance and liquidity for the companies listed
in the Nairobi Securities Exchange. In addition, the study further concludes that an
improvement in cash management position had a corresponding favorable outcome on the

51
listed company’s share performance. However, cash management had no significant
influence on share performance for companies listed on the Nairobi Securities Exchange.
5.4 Recommendations
From the findings and conclusions, it was clear that liquidity of companies listed at the
Nairobi Securities Exchange had a significant positive influence on share performance. Since
Liquidity management is concerned with making sure the firm has exactly the right amount
of money and lines of credit available to the business at all times, this study recommends that
all companies should develop, strengthen and implement its liquidity management policies to
reflect positively on the share performance of the company. This would be achieved when a
company is able to monitor effectively its fund operations, reinvesting opportunities and is
able to meet its capital requirements and payments as and when required. In addition, a
company should monitor its liquidity position by use of financial ratios so as to apply
corrective measures as and when necessary.
5.4.1 Suggestions for further Studies
This study focused on the listed companies at the Nairobi Securities Exchange. The study
showed that the two variables liquidity and cash management influenced up to 4.6% of
variations in share performance. Further analysis of various other micro and macro –
economic variables that affect share performance could be conducted for companies listed in
the Nairobi Securities Exchange. Furthermore, the impact of Liquidity and cash management
on intrinsic value share performance could be extended to Small and Medium term
enterprises.

52
REFERENCES
Acharya V. and L.H. Pedersen (2005). Asset Pricing with Liquidity Risk, Journal, of
Financial Economics, 77: 375-410.
Admati, A. R. & Pfleiderer, P. (1988). A theory of intraday patterns: Volume and price
variability. Review of Financial Studies, 1, 3-40.
Amihud,Y. and Mendelson, H. (1986). Asset Pricing and the bid- ask Spread. Journal
of Financial Economics 17, 223-249
Amihud, Y. and Mendelson, H. (1991). Liquidity, Maturity and the Yields on U.S. Treasury
Securities. Journal of Finance 46, 1411
Amihud,Y. and Mendelson, H.(1991). Liquidity, Asset Prices and Financial Policy. Financial
Analysts Journal47, 56-66.
Amihud Y. (2002). Illiquidity and Stock Returns: Cross-section and Time-series
Effects. Journal of Financial markets 5, 31-56
Banz, R. (1981).The Relationship between Return and Market Value of Common Stock.
Journal of financial and Quantitative analysis, 421-441.
Barrett Brian et.al., (1987).“The adjustment of stock prices to completely unanticipated
events”. The Financial Review Vol.22, No. 4
Beaver, W. H.(1966).Financial Ratios as Predictors of Failure. Journal 4, 71-111.
Bernanke, B.S., and Kuttner, K.N. (2005). What Explains the Stock Market’s Reaction to
Federal Reserve Policy? Journal of Finance, June (2005), 60(3), 1221-57.
Bhushan, R. (1991). Trading Costs, Liquidity, and Asset Holdings. Review of Financial
Studies 4,343-360.
Brealey, R.A and Myers S.C. (2010). Principles of corporate Finance (4th edition). McGraw-
Hill, pages 129-173.
Chalmers, J. M. R and Kadlec, G. B. (1998). Theories of Asset Pricing: Amortized Effective
Spread as a measure of Liquidity. Journal of Financial Economics 48,159-188.
Chan, J., Jain R., Xia, Y. ( 2005). Market Segmentation, Liquidity spill over and closed end
country fund discounts.
Chen A. and Siems, T., (2002). An Empirical Analysis of the capital markets response to
cataclysmic events. Southern Methodist University.
Cootner, P. H. (ed). (1964). The Random Character of Stock Market Prices. Cambridge:
M.I.T. Press,. An excellent compilation of research on the theory of random walks
completed prior to mid-1963.

53
Fama, E. and French K. (1992). The Cross Section of Expected Stock Returns. Journal of
finance, (1992), 47, 427-465.
Fisher, I. (1930).The Theory of Interest. Macmillan. New York.
Kamanda, S. (2001), An empirical evaluation of equity portfolios held by Insurance
companies in Kenya, Unpublished MBA-Thesis, University of Nairobi.
Kangethe, P.K. (2000).Investigating the effect of Government ownership on share prices
volatility of companies quoted at the Nairobi Securities Exchange. Unpublished
MBA-Thesis, University of Nairobi.
Keige (1991).Business failure prediction using discriminate analysis. Unpublished MBA-
Thesis, University of Nairobi.
Kyle, A., (1985). Continuous Auctions and Insider Trading, "Econometrics, 53: 1315-1335.
Lamberson, M. (1985). Change in working capital of small firms in relation to changes in
economic activity. Journal of business, 10,45-50
Lazaridis I and Tryfonidis D (2006), “Relationship between Working Capital Management
and Profitability of Listed Companies in the Athens Stock Exchange”, Journal of
Financial Management and Analysis, Vol. 19, No. 1, pp. 26-35.
Meigs, R and Meigs, W.B. (1999).Accounting: The Basis of Business Decisions. McGraw-
Hill New York.
Mervin, C. L., (1942), Financing Small Corporations in Five Manufacturing Industries,
1926-1936, National Bureau of Economic Research.
Ngugi, R.W. and Njiru, R. (2005) Growth of the Nairobi Stock Exchange Primary Market,
Discussion Paper No. 47. The Kenya Institute for Public Policy Research and Analysis
Ochieng, J. (2006). Changes in working capital of firms listed at the NSE in response to
changes in Economic activity, Unpublished MBA-Thesis, University of Nairobi.
Olufemi I. F. and Olubanjo T. A., (2009). Working Capital Management and Corporate
Profitability: Evidence from Panel Data Analysis of Selected Quoted Companies in
Nigeria. Research Journal of Business Management, 3: 73-84.
Omri, A. Zayani, M.B., Loukil, N. (2000). Impact of Liquidity on Stock Returns: An
EmpiricalInvestigation of the Tunis Stock Market.
Pandey I.M. (2009), Financial Management. (8th ed.) .Vikas publishing House.
Pastor, L. and Stambaugh, R. (2003).Liquidity risk and expected stock returns. Journal of
political Economy 111, 642-685.
Richards, V.D. and Laughlin, E. J. (1980). A cash conversion cycle approach to liquidity
analysis. Finance Manage., 9: 32-38.
Rhea, R. (1932). The Dow Theory (Barron’s New York, NY).

54
Sitienei, H. (2005). Relationship between liquidity and stock ownership patterns at the NSE.
Unpublished MBA-Thesis, University of Nairobi.
Simbovo, H. (2006), “The Effect of Stock Splits and Large Stock Dividends on Liquidity:
Evidence from the Nairobi Stock Exchange”, Unpublished MBA Project, University
of Nairobi.
Soenen L A (1993), “Cash Conversion Cycle and Corporate Profitability”, Journal ofCash
Management, Vol. 13, No. 4, pp. 53-58.
Teruel P J G and Solano P M (2005), “Effects of Working Capital Management on SME
Profitability”, International Journal of Managerial Finance, Vol. 3, No. 2, pp. 164-
177.
Teruel P. J. G. and Solano P. M. (2005), “Effects of Working Capital Management on SME
Profitability”, International Journal of Managerial Finance, Vol. 3, No. 2, pp. 164-
177.
Vassalou, M., Chen. J and Zhou. L. (2005).The interrelation of Liquidity Risk, Default Risk,
and Equity Returns. Columbia University.
Waciira, W. (1999).The Relationship between Liquidity and Macro Economic Factors- An
Inter Industry Comparison. Unpublished MBA Project, University of Nairobi.

55
APPENDIX 1
LIST OF 59 COMPANIES ON THE NSE
AGRICULTURAL
1. Eaagads Ltd
2. Kapchorua Tea Co. Ltd
3. Kakuzi
4. Limuru Tea Co.Ltd
5. Rea Vipingo Plantations Ltd
6. Sasini Ltd
7. Williamson Tea Kenya Ltd
COMMERCIAL AND SERVICES
8. Express Ltd
9. Kenya Airways Ltd
10. Nation Media Group
11. Standard Group Ltd
12. TPS Eastern Africa (Serena) Ltd
13. Scangroup Ltd
14. Uchumi Supermarket Ltd
15. Hutchings Biemer Ltd
TELECOMMUNICATIONS AND
TECHNOLOGY
16. Access Kenya Group Ltd
17. Safaricom Ltd
AUTOMOBILES AND ACCESSORIES
18. Car and General (K) Ltd
19. CMC Holdings Ltd
20. Sameer Africa Ltd
21. Marshalls (E.A.)Ltd
BANKING
22. Barclays Bank Ltd
23. CFC Stanbic Holdings Ltd
24. Diamond Trust Bank Kenya Ltd
25. Housing Finance Co Ltd
26. Kenya Commercial Bank Ltd
27. National Bank of Kenya Ltd
28. NIC Bank Ltd
29. Standard Chartered Bank Ltd
30. Equity Bank Ltd
31. The Co-operative Bank of Kenya Ltd
INSURANCE
32. Jubilee Holdings Ltd
33. Pan Africa Insurance Holdings Ltd
34. Kenya Re- Insurance Corporation Ltd
35. CIC Insurance Group
36. CFC Insurance Holdings
37. British-American Investment Company
(Kenya) Ltd
INVESTMENT
38. City Trust Ltd
39. Olympia Capital Holdings Ltd
40. Centum Investment Co Ltd
41. Trans-Century Ltd
MANUFACTURING & ALLIED
42. B.O.C Kenya Lltd
43. British American Tobacco Kenya Ltd
44. Carbacid Investments Ltd
45. East African Breweries Ltd
46. Mumias Sugar Co.Ltd
47. Unga Group Ltd
48. Eveready East Africa Ltd
49. Kenya Orchads Ltd
50. A.Baumann Co Ltd
CONSTRUCTION AND ALLIED
51. Athi River Mining
52. Bamburi Cement Ltd
53. Crown Berger Ltd
54. E.A. Cables Ltd
55. E.A. Portland Cement Ltd
ENERGY AND PETROLEUM
56. KenolKobil Ltd
57. Total Kenya Ltd
58. Ken Gen Ltd
59. Kenya Power & Lightning Co.Ltd
Source NSE, 2012

56
Related Documents