THE EFFECT OF PHYSICAL STRUCTURE ON WORKING AND PERSONAL BEHAVIOR: AN INVESTIGATIVE CASE STUDY AT AN EDUCATIONAL INSTITIUTION ABSTRACT Changing business practices and global market demands are placing intense pressure for more intelligent buildings. Since employees are influenced by their physical and work place environment, the purpose of this research is to examine the effect and influence of a new ‘intelligent’ school building at a higher educational institution on working and personal behavior. A 3 part questionnaire assessed the physical condition, working behavior, and personal behavior on end users. Results indicated that the perception of the end users towards the physical structure affected both working and personal behavior . Keywords: Physical structure, intelligent building, working behavior, personal behavior. 1. INTRODUACTION For every type of organization, public or private, the office building is a fundamental resource (Gibson, 1994). It is commonly understood that an office building is a workplace which accommodates information gathering and knowledge processing activities ranging from filing of data to analyzing, decision making, and communication. In fact, office buildings are the result of the need to plan, co-ordinate and manage these activities (Aronoff and Kaplan, 1995). Although, once regarded as merely a holding area for such activities, the role of architecture and building design for organizational success is gaining recognition. According to Bottom, McGreal, & Heaney, (1997, p. 195) "Premises can play a significant role by affecting organizational productivity and supporting corporate mission". Whilst the 1980's and 1990's were dominated by rigid structures composed of dozens of cubicles and specialized departments all centralized under one roof, such attributes are no longer acceptable. Changing business practices and global market demands are placing pressure for more intelligent buildings. The demand for such buildings comes from a turbulent environment of accelerated change and uncertainty. Globalization, information technology, and blending of markets, are just few of the elements that place intense demand for intelligent buildings. Organizational concepts are changing, and the trend has moved to a more decentralized practice, with open space, and shared departments and resources. The trend has shifted from cellular offices towards open plan design (Pullen, 2000). Thus the need for intelligent buildings becomes a must. 2. LITERATURE REVIEW 2.1 Intelligent Buildings Intelligent buildings are more resilient and able to respond to the dynamic needs of its inhabitants. According to Himanen (2003) these buildings offer a higher level of integration, comfort, flexibility, and adaptability. The sophistication of such buildings is not due to their high-tech attributes only, rather, it is more related to their ability to meet the needs of their users through the proper blend of space, lighting, infrastructure, etc. In fact, the significance of investment in these buildings has gained such attention that some universities have dedicated entire curriculum to the study of intelligent building design. These studies focus on the strategic role of building design for the success of organizations. In fact, it is the unique needs of each organization that should define the attributes required by the building. With this in mind, many suggest that a collaborative committee be formed to direct and execute the construction of an intelligent building. Stakeholders of such projects not only include the building designers and organizational leaders, but also the direct end users of such a facility: the employees that move through the structure to create and develop successes for the organizations (Finch & Clements- Croome, 1997). Often times a building may not be as successful in its role as was intended. This may largely be due to a lack of consideration for the end user of the building. It should not be assumed that the designers of an office building actually understand the business process of the organization that will inhabit the building. More often than not, designers are not up to speed on the evolution of business practices. Therefore, such consideration should be taken into account continuously to ensure that

Welcome message from author
This document is posted to help you gain knowledge. Please leave a comment to let me know what you think about it! Share it to your friends and learn new things together.
Transcript

THE EFFECT OF PHYSICAL STRUCTURE ON WORKING AND PERSONAL BEHAVIOR: AN INVESTIGATIVE CASE STUDY AT AN EDUCATIONAL INSTITIUTION
ABSTRACT Changing business practices and global market demands are placing intense pressure for more intelligent buildings. Since employees are influenced by their physical and work place environment, the purpose of this research is to examine the effect and influence of a new ‘intelligent’ school building at a higher educational institution on working and personal behavior. A 3 part questionnaire assessed the physical condition, working behavior, and personal behavior on end users. Results indicated that the perception of the end users towards the physical structure affected both working and personal behavior. Keywords: Physical structure, intelligent building, working behavior, personal behavior. 1. INTRODUACTION For every type of organization, public or private, the office building is a fundamental resource (Gibson, 1994). It is commonly understood that an office building is a workplace which accommodates information gathering and knowledge processing activities ranging from filing of data to analyzing, decision making, and communication. In fact, office buildings are the result of the need to plan, co-ordinate and manage these activities (Aronoff and Kaplan, 1995). Although, once regarded as merely a holding area for such activities, the role of architecture and building design for organizational success is gaining recognition. According to Bottom, McGreal, & Heaney, (1997, p. 195) "Premises can play a significant role by affecting organizational productivity and supporting corporate mission". Whilst the 1980's and 1990's were dominated by rigid structures composed of dozens of cubicles and specialized departments all centralized under one roof, such attributes are no longer acceptable. Changing business practices and global market demands are placing pressure for more intelligent buildings. The demand for such buildings comes from a turbulent environment of accelerated change and uncertainty. Globalization, information technology, and blending of markets, are just few of the elements that place intense demand for intelligent buildings. Organizational concepts are changing, and the trend has moved to a more decentralized practice, with open space, and shared departments and resources. The trend has shifted from cellular offices towards open plan design (Pullen, 2000). Thus the need for intelligent buildings becomes a must.
2. LITERATURE REVIEW
2.1 Intelligent Buildings Intelligent buildings are more resilient and able to respond to the dynamic needs of its inhabitants. According to Himanen (2003) these buildings offer a higher level of integration, comfort, flexibility, and adaptability. The sophistication of such buildings is not due to their high-tech attributes only, rather, it is more related to their ability to meet the needs of their users through the proper blend of space, lighting, infrastructure, etc. In fact, the significance of investment in these buildings has gained such attention that some universities have dedicated entire curriculum to the study of intelligent building design. These studies focus on the strategic role of building design for the success of organizations. In fact, it is the unique needs of each organization that should define the attributes required by the building.
With this in mind, many suggest that a collaborative committee be formed to direct and execute the construction of an intelligent building. Stakeholders of such projects not only include the building designers and organizational leaders, but also the direct end users of such a facility: the employees that move through the structure to create and develop successes for the organizations (Finch & Clements-Croome, 1997). Often times a building may not be as successful in its role as was intended. This may largely be due to a lack of consideration for the end user of the building. It should not be assumed that the designers of an office building actually understand the business process of the organization that will inhabit the building. More often than not, designers are not up to speed on the evolution of business practices. Therefore, such consideration should be taken into account continuously to ensure that

progress in the building development evolves with end-user practices. In fact, Kaya (2004, p.251) insists "it is a key point that if the original design concept of the buildings dictate the ongoing activities of use, user conflict will become inevitable". 2.2 Involving the End-User of Buildings People are influenced by their physical and workplace environment. To be more receptive and supportive of building redesign, employees should believe that such changes are of more benefit to them (Kaya, 2004). In fact, the perception of occupants as customers of the creators/providers of the facility is slowly gaining momentum, and some are arguing that as such, they should be regarded as valued clients who should be treated with care. The utmost attention should be given to ensuring that the needs of the inhabitant are met, and that the required utility level is supplied by their workplace at an acceptable cost. In fact, Clements-Croome & Kaluarachchi (2000) insist that the risk of such negative behavior as reduced productivity, increased absenteeism, and rising healthcare are increased when the utility level falls below the acceptable level needed by users. According to Pinder (2003) the perception and expectations of the building’s end users determine its usefulness. Pinder identified four dimensions along which work place utilities may be measured: (1) space configuration concerns such as needed space for informal gatherings, (2) environment related variables example temperature control, (3) building appearance including interior/ exterior decoration and tidiness , and (4) building functionality such as the need for privacy. Investigations are sought to determine the significance of involving end-users in the re-design of a building. Two such case studies by Sezgin Kaya (2004), Research Fellow in Construction and Property Management, which investigated the correlation between building design and organizational life cycle in two companies revealed that, locus of control over their environment affected the employees' level of comfort towards the change. Furthermore, the outcome of one of the companies under study indicated that control and ownership over the environment not only improved the employees’ attitude towards change, but also instilled a supportive attitude to maintain and evolve the redesign decision. As such, both cases recognized the importance of employees' involvement in the redesign process. According to Kaya (2004, p 251), the following lessons could be learned from these two cases:
(1) When not involved in the design stage of buildings, the users become more reactive and critical of the building. This puts a greater burden on those managing the completed space.
(2) When the people own the space and are committed to it, they change their environment and overcome their territoriality. Therefore, as activities change, people start to change their habitat.
2.3 Deciding to Redesign The impact of work place utility on productivity can not be easily measured. While Pinder's study identified just four dimensions for measuring work place utility, refurbishment and redesign of buildings is a complex process. A main dilemma is that the structure must suit multiple user needs simultaneously. This conflict will force a choice in the building quality measuring methods: either to evaluate solely against chosen requirements for example the requirements of the investor(s) or the owner(s); or to evaluate against all identified requirements with no exception to conflicting ones (Clift, 1996). The source of the dilemma is clearly the need to choose between an option that may have no win-win situation, and an option that is biased. A survey of office renovations in the Netherlands identified four driving categories for building redesign ranked as follows: Most important perspective - Market and Financial, followed by Functional and Technical / Locational Points, with the least important awarded to Policy and Legislation issues (Vijerberg, 2001).
2.3 Measures of success of building design Many studies have been conducted to determine the success of building design. In fact, various techniques and tools for appraising the performance of such buildings have been developed to aid in

such investigations. One commonly used method is the distribution of standardized 'post-occupancy' questionnaires (Bottom et. al. 1997) to the inhabitants. These questionnaires discuss such building attributes as space, lighting, air quality, building presentation, and the overall impact of such developments on the inhabitant's productivity. For instance, the Building Quality Assessment (BQA a building appraisal computerized system) evaluates a building along nine broad categories of user requirements (Table 1 adapted from Clift, 1996, p. 23):
TABLE 1 – BQA CATEGORIES OF USER REQUIREMENTS
BQA CATEGORY DESCRIPTION 1) Presentation Appearance of the building and
impression 2) Space functionality Factors that determine operation of
spaces 3) Access and circulation Access of people and goods, security 4) Amenities Facilities or spaces for people 5) Business services Electrical services and IT 6) Working environment Environmental conditions 7) Health and safety Mandatory and other H&S issues 8) Structural Building structure and condition 9) Building management Short and long term
Works Canada developed a user satisfaction questionnaire consisting of 24 items graded along a 5 point scale ranging from 1 for "Bad" to 5 "for "Good". The end result of the questionnaire reflected satisfaction along nine parameters: air quality, spatial comfort, thermal comfort, office noise control, privacy, building noise control, lighting, ability to complete work, and overall satisfaction (Leifer, 1994). The BQA and the user satisfaction questionnaire developed by Works Canada are just two examples of the many existing tools for investigating building design success. Such instruments have been applied to a wide range of organizational settings including educational institutions such as libraries, schools, and universities. 2.4 School Buildings and student achievement
As in the relationship between office buildings and a company's success, the condition of a school building is a significant factor in the successful delivery of the Curriculum. Qualitative studies investigating the relationship between school building design and student/faculty/productivity in the UK suggested a direct relationship between student achievements, and improved building conditions (Fisher, 2000). In fact, the United Kingdom Department for Education and Skill (DfES) concluded that the most successful schools give a clear indication that the working environment is an important factor for promoting positive attitudes and achievements (DfES, 2002). Accordingly, a school building that is comfortable and attractive is likely to improve the academic performance of its students. Moreover, the faculty and staff are positively affected as changing the conditions of their work environment enhances their motivation and performance (HMSO, 1977). The discussion above does not claim any guarantee for improved overall academic attainment (grades and test scores) that may result from improving building conditions. Such a relationship is inconclusive. Further investigation using different methodologies is warranted to determine the effect of school building on overall academic achievement. The same inconclusive result existed for the relationship between overall spending and pupil performance. To resolve the dilemma and provide a more informed understanding of the relationship between school investment and student performance, Green & Turrell (2005) conducted a study that employed questionnaires and interviews with those directly involved in the education process in a selected sample of state school in UK. They results indicated that while it is difficult to quantitatively measure the relationship, most schools perceive a positive influence of investment on motivation,
behavior, and attainment of students. Statistics were overwhelming with 81% of the schools suggesting student performance improvement following refurbishment of school buildings. It was also found that such investments motivated the staff and improved their morale. 96% of the surveyed felt that building improvements positively affected the teaching staff. Further, behavior improvement is evident by reduction in staff turnover. Therefore, although there is as yet no direct link between refurbishment and quantitative improvement in overall academic attainment, the study findings illustrate that "the well-being of staff and pupils and the environment in which they teach and learn, respectively, should not be underestimated" (Green and Turrell, 2005, p. 261). 3. PURPOSE AND HYPOTHESES
Since no such studies to the researchers’ knowledge have been carried out in a Middle Eastern environment, the purpose of this research is to add to the body of knowledge by examining the effect and influence of the new Business School Building at a Lebanese University on the end users’ attitude and behavior.
H1: Overall, the end-users’ assessment of the new building will be good.
H2: The physical condition of the new building positively affects the working behavior of the end-users.
o H2a: End-users with a negative overall assessment of the new building will not experience a positive impact on their working behavior.
o H2b: End-users with a positive overall assessment of the new building will experience a positive impact on their working behavior.
H3: The physical condition of the new building positively affects the personal behavior of the end-users.
o H3a: End-users with a negative overall assessment of the new building will not experience a positive influence on their personal behavior.
o H3b: End-users with a positive overall assessment of the new building will experience a positive influence on their personal behavior.
4. METHODOLOGY
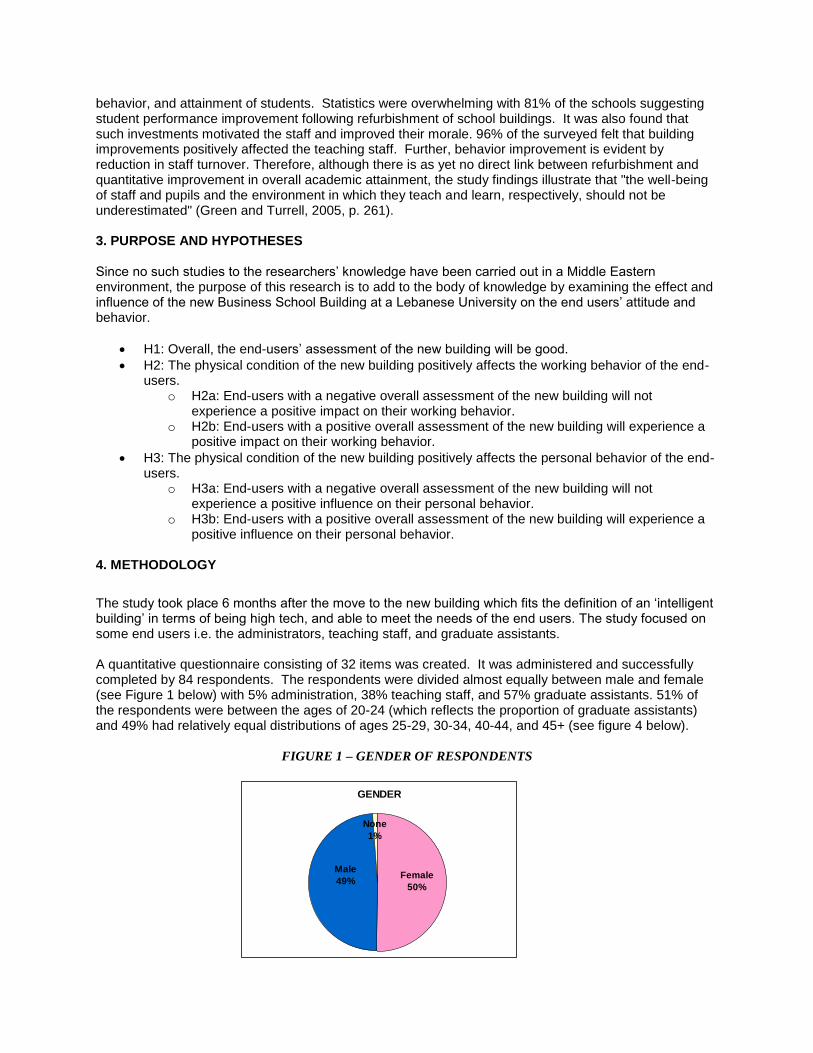
The study took place 6 months after the move to the new building which fits the definition of an ‘intelligent building’ in terms of being high tech, and able to meet the needs of the end users. The study focused on some end users i.e. the administrators, teaching staff, and graduate assistants. A quantitative questionnaire consisting of 32 items was created. It was administered and successfully completed by 84 respondents. The respondents were divided almost equally between male and female (see Figure 1 below) with 5% administration, 38% teaching staff, and 57% graduate assistants. 51% of the respondents were between the ages of 20-24 (which reflects the proportion of graduate assistants) and 49% had relatively equal distributions of ages 25-29, 30-34, 40-44, and 45+ (see figure 4 below).
FIGURE 1 – GENDER OF RESPONDENTS
GENDER
Male
49%Female
50%
None
1%

The questionnaire was divided into three sections: Physical Condition (of the new building) Working Behavior, and Personal Behavior. The first section, which represents the independent variable, measures the level of: temperature comfort, air quality, acoustics (noise), external noise pollution, classroom space, office space, level of privacy, technical infrastructure, lighting, hygiene, external physical appearance, internal physical appearance, safety level, accessibility, and movement. The second looked at working environment, work preparation, interaction among end-users, research environment, educational experience, teaching environment, and student performance. Finally, the last section focused on personal self value, self image, sense of belonging, motivation, commitment to LAU, and seriousness in the workplace. Each of the three sections followed a five-point scale. The first section ranged from 1- ‘very bad’ to 5 -‘very good’, the other two ranged from 1-strongly disagree’ to 5-‘strongly agree’.
The researchers used several softwares for analyzing the data. SPSS was used to perform: 1) an instrument reliability test, 2) correlation tests, and 3) regression analysis. Knowledge Seeker was used to test H2 and H3. Finally, Excel was used to organize the data and generate graphs and tables. 5. RESULTS 5.1 Internal Consistency Reliability
Questionnaire internal consistency reliability proved to be strong with the lowest score on the standardized item alpha of 82.99% for the Working Behavior section. The Physical Condition section achieved a score of 87.07% and the Personal Behavior section scored 92.80%. The overall instrument scoring resulted in a standardized item alpha of 94.20% (see Table 2).
TABLE 2 – INTERNAL CONSISTENCY RELIABLITY Reliability Testing
Physical Condition Min Max Mean Stdv Standardized
Item Alpha
You find the level of temperature comfort to be 0.00 4.00 2.11 1.22 0.8566
You find the level of air quality to be 0.00 4.00 2.30 1.06 0.8543
You find the acoustics (noise) in the rooms to be 0.00 4.00 1.13 1.24 0.8683
FIGURE 3– AGE OF RESPONDENTS
POSITION
7%
14%
17%
5%
57%
Professor
Assistant Professor
Instructor
Administrator
Graduate Assistant
AGE
11%
8%
7%
5%
5%
13%
51%
20-24
25-29
30-34
35-39
40-44
45-65
NONE
FIRGURE 2 – POSITIONS OF RESPONDENTS

You find protection (barrier) from external noise pollution to be 0.00 4.00 3.10 0.90 0.8516
You find the classroom space to be 0.00 4.00 3.17 0.80 0.8466
You find the office space to be 0.00 4.00 2.55 1.02 0.8473
You find the level of privacy to be 0.00 4.00 2.46 1.08 0.8542
You find the technical infrastructure to be 0.00 4.00 3.10 0.87 0.8576
You find the lighting to be 1.00 4.00 3.11 0.82 0.8462
You find the level of hygiene to be 2.00 4.00 3.30 0.71 0.8535
You find the external physical appearance of the new building to be 0.00 4.00 3.14 0.84 0.8468
You find the internal physical appearance to be 0.00 4.00 2.58 1.10 0.8456
You find the safety level to be 0.00 4.00 2.95 0.81 0.8500
You find the accessibility to be 0.00 4.00 2.52 0.98 0.8574
You find the moving through the building to be 0.00 4.00 2.07 1.17 0.8488
Overall, my assessment for the new building is 1.00 4.00 2.54 0.86 0.8362
Physical Condition(Average) 1.56 3.88 2.63 0.56 0.8707
Working Behavior Min Max Mean Stdv Standardized
Item Alpha
I find the working environment to be enhanced 0.00 4.00 2.39 0.93 0.8125
I find that work preparation is more facilitated by the new building 0.00 4.00 2.42 0.93 0.7963
I find interacting with other professors and members of the staff easier 0.00 4.00 2.38 1.05 0.8228
I find interacting with students easier 0.00 4.00 2.02 1.01 0.8344
I find the new building creates a more enhanced research environment 0.00 4.00 2.35 0.91 0.8077
I find the educational experience more interesting 0.00 4.00 2.26 0.81 0.8022
Overall I find working in the new building better than in the old building 0.00 4.00 2.35 1.10 0.7900
For Faculty Only - The new building creates a more comfortable teaching environment 0.00 4.00 2.20 0.71 0.8321
For Faculty Only - The students are demonstrating better performance 1.00 4.00 2.02 0.51 0.8373
Working Behavior(Average) 0.67 3.44 2.27 0.59 0.8299
Personal Behavior Min Max Mean Stdv Standardized
Item Alpha
I feel my personal self value has increased 0.00 4.00 2.11 0.93 0.9208
I feel my self image has increased 0.00 4.00 2.10 0.91 0.9165
I feel prouder to belong to the LAU Beirut business school 0.00 4.00 2.56 0.91 0.9189
I feel more motivated to work 0.00 4.00 2.29 1.06 0.9075
I feel more committed to the LAU Beirut business school 0.00 4.00 2.30 0.99 0.9131
I feel more serious working in the new building 0.00 4.00 2.29 0.99 0.9190
Overall, I am in favor for the new business school 0.00 4.00 2.61 1.01 0.9218
Personal Behavior(Average) 0.14 4.00 2.32 0.81 0.9280

Overall Questionnaire 0.9420
5.2 Overall Results Total Physical Assessment received an approximate scoring of 2.63 of total physical assessment. On a scale ranging from 1 for very bad to 5 for very good, this score is slightly higher than neutral. This would indicate that the respondents’ overall assessment of the new building is average. Also, both Working Behavior and Personal Behavior achieved an approximate average total assessment of 2.27 and 2.31 (see distribution below).
FIGURE 4 – PHYSICAL CONDITION DISTRIBUTION
FIGURE 5 – WORKING BEHAVIOR DISTRIBUTION
Working Behavior
1.80 1.90 2.00 2.10 2.20 2.30 2.40 2.50
1
2
3
4
5
6
7
8
9
Pa
ram
ete
rs
Average
Students Performance
Teaching Environment
Overall Assessment
Educational Experience
Research Environment
Interaction w/ Students
Interaction with Profs/Staff
Work Preparation
Working Environment
Total Work Behavior: 2.27
FIGURE 6 – PERSONAL BEHAVIOR DISTRIBUTION
Physical Condition
0.00 0.50 1.00 1.50 2.00 2.50 3.00 3.50
1
Pa
ram
ete
rs
Average
Overall AssessmentMovement Through Building
AccessibilitySafety
Internal Physical Appearance
External Physical AppearanceHygieneLighting
Technical InfrastructurePrivacy
Office SpaceClass Room SpaceExternal Noise Pollution
AcousticsAir Quality
Temperature Comfort
Total Physical Assessment: 2.63

Personal Behavior
0.00 0.50 1.00 1.50 2.00 2.50 3.00
1
2
3
4
5
6
7
Pa
ram
ate
rs
Average
Favoring New Building
Seriousness
Commitment
Motivation
Belongingness
Self Image
Self Value
Total Personal Behavior: 2.31
5.3 Correlation Analysis Using Correlation Analysis in SPSS a correlation matrix was formed. With the Physical Condition as the independent variable and the dependant variables as the Working Behavior and the Personal Behavior, a positive correlation was produced. Working Behavior scored an R of 0.5035 and Personal Behavior an R of 0.5237. This correlation proved to be significant at the 0.01 level (2-tailed). 5.4 Regression Analysis
FIGURE 7 –REGRESSION LINES – ‘BEST OF FIT
As indicated by the regression lines above, with R = 0.5035, Working Behavior is significantly and positively correlated to the physical condition. However, Working Behavior is only 25.35% explained by the physical condition. This can be logically explained by the probability that multiple factors (and not just building condition) affect working behavior in an organization. At a significance level of 0.05, the regression is satisfactory significant (F=27.84 Sig = 0) (Table 3). These findings support previous research which stated that the physical condition has a significant effect on the working behavior (see Clements-Croome & Kaluarachchi, 2000). However, it is not the sole factor; other factors such as salary, culture, stress, financial and non-financial benefits, and others affect working behavior as well.
TABLE 3 – REGRESSION ANALYSIS, PHYSICAL CONDITION & WORKING BEHAVIOR
Independent Variable: Physical Condition

Dependent Variable: Working Behavior
Model Summary
Model R
R Square
Adjusted R Square
Std. Error of the Estimate
1 0.5035 0.2535 0.2444 0.5133
Predictors: (Constant), Physical Condition
ANOVA
Model Sum of
Squares df
Mean Square
F Sig.
Regression 7.3367 1 7.3367 27.8497 0.0000
Residual 21.6020 82 0.2634
Total 28.9387 83
Predictors: (Constant), Physical Condition
Dependent Variable: Working Behavior
Coefficients
Model
Un-Std Coefficients
Std Coefficients
t Sig.
B
Std. Error
Beta
(Constant) 0.8585 0.2725 3.1502 0.0023
Physical Condition 0.5346 0.1013 0.5035 5.2773 0.0000
Physical Condition/Working Behavior
Disagree Neutral Agree
Bad 60% 40% 0%
Average 16.80% 64% 11.20%
Good 9.20% 50% 40.80%
The regression analysis demonstrates that Personal Behavior is significantly and positively correlated to the physical condition with R = 0.5237. Again, Personal Behavior is only 27.43% explained by the physical condition. However, as with Working Behavior, this can be easily explained by the influence of other factors on personal behavior in an organization. At a significance level of 0.05, the regression is satisfactory significant (F=30.98 Sig = 0) (Table 4).
TABLE 4 – REGRESSION ANALYSIS, PHYSICAL CONDITION & PERSONAL BEHAVIOR
Independent Variable: Physical Condition
Dependent Variable: Personal Behavior
Model Summary
Model R
R Square
Adjusted R Square
Std. Error of the Estimate
1 0.5237 0.2743 0.2654 0.6967
Predictors: (Constant), Physical Condition

ANOVA
Model
Sum of Squares
df Mean
Square F Sig.
Regression 15.0409 1 15.0409 30.9883 0.0000
Residual 39.8007 82 0.4854
Total 54.8416 83
Predictors: (Constant), Physical Condition
Dependent Variable: Personal Behavior
Coefficients
Model
Un-Std Coefficients
Std
Coefficients t Sig.
B
Std. Error
Beta
(Constant) 0.3046 0.3699 0.8234 0.4127
Physical Condition 0.7655 0.1375 0.5237 5.5667 0.0000
Physical Condition/Personal Behavior
Disagree Neutral Agree
Bad 60% 40% 0%
Average 22.20% 61.20% 16.60%
Good 6.80% 40.90% 52.30%
5.5 Interrelationship Analysis
FIGURE 8 – PHYSICAL CONDITION & WORKING BEHAVIOR Results using Knowledge Seeker indicate that when the end user evaluates the building as bad, 60% will disagree that the building has influenced their overall working behavior, 40% will be neutral. When the end user evaluates the building as average, 64% will express neutral overall influence of building on working behavior, while 16.8% will disagree and 11.2% will agree. Finally, when the end user evaluates the building as good, 40.8% will agree that the building has influenced their working behavior and 50% will be neutral, while 9.2% will disagree. These results indicate that the end-users who perceive the new building as bad are more strongly inclined to disagree with the influence of the physical condition on working behavior. On the other hand, when the end-users perceive the new building as good, while they will most likely agree that the physical condition has influenced their working behavior, the degree to which they will agree is not as strong as with the relationship between those who find the physical condition bad and disagree with its influence on their working behavior.
As with Working Behavior, when the end user evaluates the building as bad, 60% will disagree that the building has influenced their overall personal behavior, 40% will be neutral. When the end user evaluates the building as average, 61.2% will express neutral overall influence of building on personal behavior, while 16.6% will disagree and 22.2%
60%
40%
0%
16.80%
64%
11.20%
9.20%
50%
40.80%
0%
20%
40%
60%
80%
100%
Bad Average Good
Physical Condition
Physical Condition & Working Behavior
Agree
Neutral
Disagree

will agree. Finally, when the end user evaluates the building as good, 52.3% will agree that the building has influenced their personal behavior and 40.9% will be neutral, while 6.8% will disagree. These results indicate a relatively similar relationship between the perception of the physical condition and the influence on personal behavior. The end-users who perceive the new building as bad are more strongly inclined to disagree with the influence of the physical condition on working behavior. On the other hand, when the end-users perceive the new building as good, again they will most likely agree that the physical condition has influenced their working behavior, the degree to which they will agree is not as strong as with the relationship between those who find the physical condition bad and disagree with its influence on their working behavior. 6. CONCLUSION
With a total Physical Assessment score of 2.63, the researchers believe the first hypothesis is not supported. The respondents’ overall assessment of the new building is only slightly above average. This could be an indicator that the end-users were not involved in the decision making process of designing and developing the new building. It seems their needs were not assessed properly. This is in agreement with many researchers who have pointed out the communication gap that exists between end users and designers in the construction phase (for example see Bruhuns and Isaacs, 1992). Our analysis indicates that a significant relationship exists between the Physical Condition and both Working and Personal Behavior. However, with about R
2 of 25% and 27%, it is clear that the Physical
Condition is not the only factor that affects Working and Personal Behavior. Some of these factors may be financial and non-financial benefits, organizational culture and subcultures, stress, personal achievement, etc. These results are not surprising as it is supported by previous research. Both H2 and H3 were supported by the results. End users who had a negative overall assessment of the new building disagreed as to the influence of Physical Condition on both their Working and Personal Behavior. Those who expressed a positive overall assessment of the new building agreed that the Physical Condition influenced their Working and Personal Behavior better. However, the results also indicate that the weight of the relationship between the factors is stronger for the bad assessment as opposed to the good assessment. Sixty percent of those with a bad assessment of the building disagreed with its influence on their working and personal behavior. Of those who expressed a positive assessment of the building, only 40% felt it positively influenced their working behavior and only 52.3% felt it positively affected their personal behavior. This result challenges the importance of the role of the Building for organization success and achievement. The researchers do not doubt that the Physical Condition of an establishment plays a role in the performance and behavior of its inhabitants. The physical condition of a building is a prerequisite to basic satisfaction. However, in and of itself, it does not act as a motivator. The researchers believe this can be explained by Frederick Herzberg's Hygiene needs (Herzberg's Two-Factor Theory of Motivation). According to Herzberg, certain factors at work lead to dissatisfaction (hygiene factors) while few others lead to true motivation (motivators) (Robbins and Judge, 2007). For instance, poor salary is a dissatisfier. It can result in poor performance and poor working behavior from employees. However, improving salary in and of itself will not lead to employee motivation. It will simply reduce poor-performance. As such, salary is a hygiene factor, not a motivator. On the other hand creating opportunity for personally growth
60%
40%
0%
22.20%
61.20%
16.60%
6.80%
40.90%
52.30%
0%
20%
40%
60%
80%
100%
Bad Average Good
Physical Condition
Physical Condition & Personal Behavior
Agree
Neutral
Disagree
FIGURE 9 – PHYSICAL CONDITION

and advancement (such as developing employees, providing them with career challenges, etc) will lead to enhanced work behavior. As such, these factors are motivators. The researchers believe that the results of the study strongly suggest that the Building (Physical Structure) is a hygiene factor, not a motivator. It could be classified under Work Conditions in Herzberg's theory or be a unique category among the hygiene factors already identified by Herzberg.
7. LIMITATION & RECOMMENDATION
The most notable limitation of this study is that it excluded students and focused only on administration, instructors and graduate assistants. It is recommended that a survey of the student’s perspective be conducted to investigate their analysis of the new building and its role on working/studying and personal behavior. Also, the researchers have noticed a high correlation between Working Behavior and Personal Behavior. It is recommended that this relationship be investigated further.
More importantly, the opportunity of pre-change and post-change was unfortunately missed. A more in depth analysis may have been presented had the researchers conducted a longitudinal study and examined the working behavior and personal behavior of members of the business school when they were in the old building and then after moving to the new building. This could have presented an interesting point of comparison. Still, the researchers recommend that a follow up analysis using the same survey be administered at a later time. This will allow for an investigation of initial reaction and effect of the building compared to a more long term effect as users would have spent more time in the new facility.
Finally, it has to be noted that the survey used is not a conclusive indicator of building assessment. This shortcoming of most available building appraisal is due to the fact that such tools are fairly one dimensional. In fact, some researchers are beginning to argue that "an evaluation of a building’s total performance has to be more dynamic in nature” (Douglas, 1994, p.11). A useful performance evaluation technique should fulfill, to at least some extent, the following five criteria: (1) credible; (2) reliable; (3) clear; (4) accurate; and (5) adaptable. While many tools attempt to be clear, accurate, and adaptable, establishing diagnostic validity and reliability is a lengthy process that many tools have not yet achieved. Therefore, “at the moment, any performance evaluation method would only be an indicative rather than a conclusive measure of performance” (James Douglas, 1994).

8. REFERENCES: Aronoff, Stanely and Kaplan, Audrey, Total Workplace Performance, WDL Publications, Ottawa, 1995.
Bottom,Connel, McGreal,Stanley and Heaney,George ,“Evaluating office environments using tenant
organization perceptions, Facilities, Vol. XV (11) , 1997, 195–203.
Bruhns, Harry and Isaacs, Nigel, “The role of quality assessment in facilities management”, in Barrett,
Perry (Ed), Facilities Management Research Directions, RICS Books, London, 1992
Clements-Croome, Derek and Kaluarachchi, Yang, “Assessment and measurement of productivity” in
Clements-Croome, Derek (Ed), Creating the productive workplace, E. & F.N. Spon, London, 2000.
Clift, Micheal. “Building quality assessment (BQA) for offices”. Structural Survey
Vol. XIV (2), 1996, 22–25.
DFES. Building Bulletin 95, schools for the future, Department for Education and skills, 2002. Retrieved
from www.dfes.gov.uk
Douglas, James. "Developments in appraising the total performance of buildings", Structural
Survey, Vol. XII (6), 1994, 10-15.
Finch Edward and Clements-Croome, Derek . “University courses in intelligent buildings – new learning
approaches”, Facilities, Vol. XV (7/8), 1997, 171–176.
Fisher, Krista. A critical pedagogy of Space”. PhD Dissertation, Adelaide, the Finders University of South
Australia, 2000. :In progress.
Gibson, Virginia “How Can Local Authorities Develop a Property Strategy?” Property Management, Vol. XII (3)
1994 . Retrieved April 25.2008, from
http://www.emeraldinsight.com.ezproxy.lau.edu.lb:2048/Insight/ViewContentServlet?Filename=Published/Emerald
FullTextArticle/Articles/1130120302.html
Green Daniel and Turrell, Paul. “School Building Investment and impact on pupil performance”, Facilities, Vol.
XXIII (5/6), 2005, 253 – 261.
Himanen, Mirva . The Intelligence of Intelligent Buildings. The Feasibility of the Intelligent Building Concept in
Office Buildings, 2003. Retrieved May 22, 2008, from VTT Web site:
http://www.vtt.fi/inf/pdf/publications/2003/P492.pdf
HMSO A study of School Buildings- Report by an interdepartmental group, Department of Educaiton and
Science, Welsh office, 1977.
Kaya, Sezgin. “Relating building attributes to end user’s needs: “the owners designers- end users”
equation”, Facilities, Vol. XXII (9/10), 2004, 247-252.
Leifer, David M. and Gumbaketi, Banky. “Office environment satisfaction University premises.
Proceedings of indoor air”. The 8th International Conference on indoor air quality and climate, Edinburgh,
Scotland.London, UK: construction Research communication,1999.
Pinder, James, Price If,. Wilkinson, Sara J., and Demack, Sean. “A method for evaluating
workplace utility”, Property Management. Vol. XXI (4), 2003, 218-229.

Pullen, Wirn. “Flexibility in the workplace: Instrumental or creative? The case of the Dutch Government
Buildings Agency”, Journal of Corporate Real Estate. Vol. III (2), 2001, 121–131.
Robbins, S. P., & Judge, T. A. Organizational Behavior. New Jersey: Pearson Prentice Hall, 2007.
Vijverberg, Geert . “Renovation of offices: A survey of reasons, points of attention and obstacles in the
Netherlands”. Journal of Facilities Management. Vol. I (1), 2002, 85-95.
Related Documents