THE EFFECT OF BRAND TRUST AND BRAND IMAGE ON BRAND EQUITY WITH BRAND LOYALTY AS AN INTERVENING VARIABLE ON LE MINERALE Submitted as a Partial Fulfillment of the Requirement for Obtaining a Bachelor of Management at the Faculty of Economics and Business By: AHMAD ZAKI MUBARROK M B104173004 MANAGEMENT DOUBLE DEGREE FACULTY ECONOMIC AND BUSINESS OF UNIVERSITY OF MUHAMMADIYAH SURAKARTA 2022

Welcome message from author
This document is posted to help you gain knowledge. Please leave a comment to let me know what you think about it! Share it to your friends and learn new things together.
Transcript
THE EFFECT OF BRAND TRUST AND BRAND IMAGE
ON BRAND EQUITY WITH BRAND LOYALTY AS AN
INTERVENING VARIABLE ON LE MINERALE
Submitted as a Partial Fulfillment of the Requirement for Obtaining a Bachelor
of Management at the Faculty of Economics and Business
By:
AHMAD ZAKI MUBARROK M
B104173004
MANAGEMENT DOUBLE DEGREE
FACULTY ECONOMIC AND BUSINESS OF
UNIVERSITY OF MUHAMMADIYAH SURAKARTA
2022
i

ii
iii
1
THE EFFECT OF BRAND TRUST AND BRAND IMAGE
ON BRAND EQUITY WITH BRAND LOYALTY AS AN
INTERVENING VARIABLE ON LE MINERALE
Abstrak
Penelitian ini bertujuan untuk mengetahui sejauh mana merek (brand) Le minerale
dapat mempengaruhi segala ketertarikan konsumen terhadap merek Le minerale.
Merek merupakan ujung tombak perusahaan, walaupun harus didukung pula oleh
kualitas produk dan kualitas manajemen tetapi merek adalah cerminan dari keseluruhan
kualitas didalam perusahaan tersebut. Selama ini umumnya pemilihan kriteria brand
masih pada tataran teknis. Beberapa kriteria tersebut yaitu: pertama memorability atau
mudah diingat, kedua memiliki arti yang menyenangkan, menarik, credible, sugestif,
kaya imajinasi; ketiga protectability atau dilindungi undang-undang. Penelitian ini
menggunakan metode kuantitatif. Data dikumpulkan dengan teknik kuesioner .Teknik
pengambilan sampel menggunakan purposive sampling. Responden untuk penelitian
ini adalah konsumen Le minerale dengan jumlah responden sebanyak 151 orang.
Metode kuantitatif dengan menggunakan Structural Equation Modeling (SEM) dengan
software SmartPLS 3.0. Hasil analisis data menunjukkan bahwa Brand Image
berpengaruh positif dan signifikan terhadap Brand Equity, selanjutnya Brand Trust
berpengaruh positif dan signifikan terhadap Brand Loyalty.
Kata kunci: Brand Image, Brand Trust, Brand Loyalty, dan Brand Equity
Abstract
This research aims to find out the extent to which the Le Minere brand (brand) can
influence all consumer interest in the Le Minere brand. Brands are the cutting edge of
the company; although they must be supported by the product quality and management
quality, the brand is a reflection of the overall quality of the company's deep. During
this time, generally, the selection of brand criteria is still at a technical level. Some of
these criteria are: first memorability or easy to remember, second has a pleasant,
interesting, credible, suggestive, rich imagination meaning; third protectability or
protected by law.This research uses quantitative methods. Data is collected by
technique questionnaire. The sampling technique uses purposive sampling.
Respondents for this study were Le Minerale consumers with 151 respondents.
Quantitative method using Structural Equation Modeling (SEM) with SmartPLS 3.0
software. The results of the data analysis show that Brand Image has a positive and
significant effect on Brand Equity, henceforth Brand Trust has a positive and
significant effect on Brand Loyalty.
Keyword: Brand Image, Brand Trust, Brand Loyalty, and Brand Equity

2
1. INTRODUCTION
In the last ten years the potential market in Indonesia is still wide open, making
entrepreneurs, companies and investors compete to get great advantage in the
Indonesian market. Brands can provide great benefits for producers as well as
consumers. Brands are also able to add value to consumers. The image and belief in
the product that causes consumers to want to be associated and pleasant, so that
consumers do not hesitate to pay expensive to get a product with a certain brand.
Consumers pay higher for a product because of the attachment of a brand which is a
guarantee of the consistency of certain qualities and values that are believed to be
believed in it, without a brand, consumers feel less secure from bad possibilities beyond
expectations (Sundjoto and Hadi, 2012).
Brand image is a consumer belief in the goods to be purchased. Brand image is
the perception and trust that customers hold on specific products (Rubio et al., 2013).
Most people buy products because of a good image in society, so they will be closer to
the consumer choice. Therefore, a good brand image should be introduced to
consumers constantly to form congenital memories (Lau & Phau, 2007). Brand
impressions appearing in consumer memory are increasing along with increasing
numbers of consumers to feel the brand (Rubio et al., 2013). Also, when brand
associations are closely linked, the image of the seal formed will also be stronger (Lau
& Phau, 2007).
While, according to Sari and Widowati (2014) brand trust is consumer
willingness to believe in the brand at all costs because there is hope in their minds that
the brand will give positive results to the consumer and will lead to their loyalty.
Consumer trust in the brand is essential for companies to be able to build good relations
with the consumer and maintain consumer trust. In order for consumers to repurchase
products from companies, companies must properly introduce their products to build
brand trust in the consumer.
3
Brand loyalty is a very important concept in marketing strategy. The existence
of consumers who are loyal to the brand is very necessary for the company to survive.
Loyalty can be interpreted as a commitment initiative to make repeated purchases of
products or services that become their preferences consistently. Consumers will remain
loyal even though there are external influences from the industry, such as various
variations of marketing strategies that can lead to brand switching behaviour. Brand
loyalty indicates the existence of a bond between the customer and a particular brand,
and this is often marked by repeat purchases from customers. A strong relationship
between a customer and a brand maintains not only future business relationships but
also enhances other beneficial values such as initiatives to recommend and contribute
to the company's positive reputation (Kotler & Keller, 2016).
Brand equity add value given to the products and services (Rubio et al., 2013).
Rangkuti (2014), suggested that the concept of brand equity consists of brand
awareness, perceived quality, brand association, and brand loyalty. While the purchase
decision is the stage where consumers form an intention to buy the most preferred
product, where the consumer's decision to modify, delay, or avoid is strongly
influenced by the perceived purchase risk (Kotler & Keller, 2016).
Based on Nofriyanti, (2017) The results show that there is a significant
influence between brand trust on brand equity, brand image on brand equity, brand
trust on brand loyalty, brand image on brand loyalty, and brand loyalty on brand equity.
and research is strengthened again by Andrologi, (2014) where brand image and brand
awareness are significant to brand loyalty, then brand loyalty is accepted as a media
intervention in mediating Brand Image and Brand Awareness towards Brand Equity.
This is different from the research of Fitriani & Achmad, (2014) which showed that
brand loyalty had no effect on brand image on brand loyalty, and brand loyalty on brand
equity and this was also supported by research by Mujani, (2020) showing that brand
equity had no effect on loyalty. consumer. brand loyalty has an influence on consumer
loyalty.
4
To achieve this goal, what must be achieved is an image, consumer-brand trust,
brand loyalty and brand equity which is expected to influence consumer decisions to
buy products from the brand in question. Loyalty is a measure of the likelihood that
customers will switch to other brands. Because consumers have trusted the brand so
that the brand has an image in the eyes of consumers, which ensures that customers do
not switch to other brands because customers have found equity in the product, even if
competitors charge a lower price. Lower or of better quality.
The benefits that come when customers have strong loyalty are cost savings
because retaining existing customers is much cheaper than new customers. Loyalty
customers also get a dominant space or place in the store because retailers see brands
with high loyalty, so customers will always look for high loyalty. Every company must
strive to produce the product that consumers want with a good image and packaging.
Thus, any company must be able to understand consumer behaviour, especially those
who want practicality to use something they need, because the company's survival as
an organization that seeks to meet the needs and desires of the consumer, can develop
appropriate strategies and programs to harness existing opportunities and excel the
consumer.
Consumer trust in brands is another important factor that can build loyalty
(Aydin et al, 2015). Trust involves a person's willingness to behave in a certain way
because he believes that his partner in the transaction will give him what he expects.
This shows that if one party trusts the other party, it is possible to form positive
behavior and good intentions. Brand trust is the brand's ability to be trusted brand
reliability, which is based on band trust in recent studies has been recognized as a key
variable in long-term relationships with customers, which in turn positively affects
brand loyalty (Tan et al, 2011), Brand trust leads to higher levels of loyalty as trust
creates exchange relationships that are highly valued).
5
2. METHOD
2.1 Research design and variables
This study uses a quantitative approach method. Quantitative research is a research
method based on the philosophy of positivism, used to examine a particular population
or sample, collecting data using statistical data research instruments with the aim of
testing the applied hypothesis. This type of research is a causal study that explains
cause-and-effect relationships (Sugiyono, 2016). The variable used by the researcher
in this study is the independent variable, intervening variable, and dependent variable.
The independent variable is Brand Trust (X1) and Brand Image (X2), the intervening
variable is Brand Loyalty (Z), and the dependent variable is Brand Equity (Y).
2.2 Data and data sources
The data used in this study is primary data, where data is obtained through
questionnaires. Primary data using data sources received directly from informants
(Sugiyono, 2016). Primary data is data collected from the object of research and gained
from respondents' answers through questionnaires. In this study, the research
questionnaire distribution is done online or through Google form.
2.3 Sampling design
The method of data collection in this study was distributed by using a Google form
questionnaire. This study provides a questionnaire directly to the Le minerale
consumers. According to Siyoto, S. & Sodik., (2015) the questionnaire is a method of
sampling from a population that enables analysis of the attitudes, beliefs, behaviors,
and characteristics of several people in the organization who can be affected by the
existing system. a questionnaire is a method of sampling from a population that enables
analysis of the attitudes, beliefs, behaviors, and characteristics of several people in the
organization who can be affected by the existing system.
Respondents respond to the questionnaire by determining the level of approval
on a statement item from the questionnaire by choosing one of the available scales.
6
2.4 Data analysis methods
This study uses the Structural Equation Modeling (SEM) technique. This research uses
SEM (Structural Equation Modeling) PLS (Partial Least Square) technique with
mediating effect using SmartPLS software. This analytical technique is a combination
of two methodological disciplines, namely the econometric perspective, which focuses
on predictions, and psychometrics which can describe the concept of a model with
latent variables (variables that cannot be measured directly) but measured through its
indicators (manifest variables). SEM essentially offers the ability to perform path
analysis with latent variables (Ghozali, 2014)
3. RESULT AND DISCUSSION
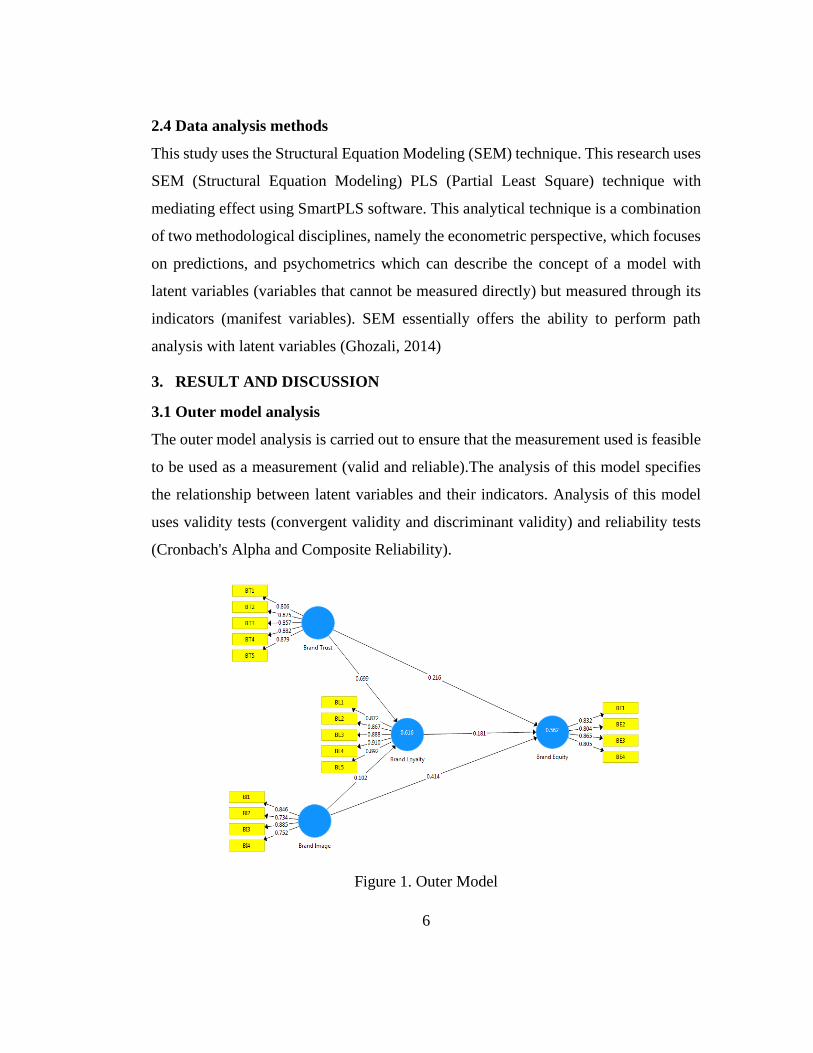
3.1 Outer model analysis
The outer model analysis is carried out to ensure that the measurement used is feasible
to be used as a measurement (valid and reliable).The analysis of this model specifies
the relationship between latent variables and their indicators. Analysis of this model
uses validity tests (convergent validity and discriminant validity) and reliability tests
(Cronbach's Alpha and Composite Reliability).
Figure 1. Outer Model
7
3.2 Inner model analysis
3.2.1 Coefficient Determination (R2)
The coefficient of determination value (R2) is expected between 0 and 1. The value of
R square below 0.33 – 0.19 is declared to have a weak value, then 0.33 – 0.67 has a
moderate/medium value, while the value of 0.67 and above has a strong value. The
following are the coefficients of determination (R2) values from this study:
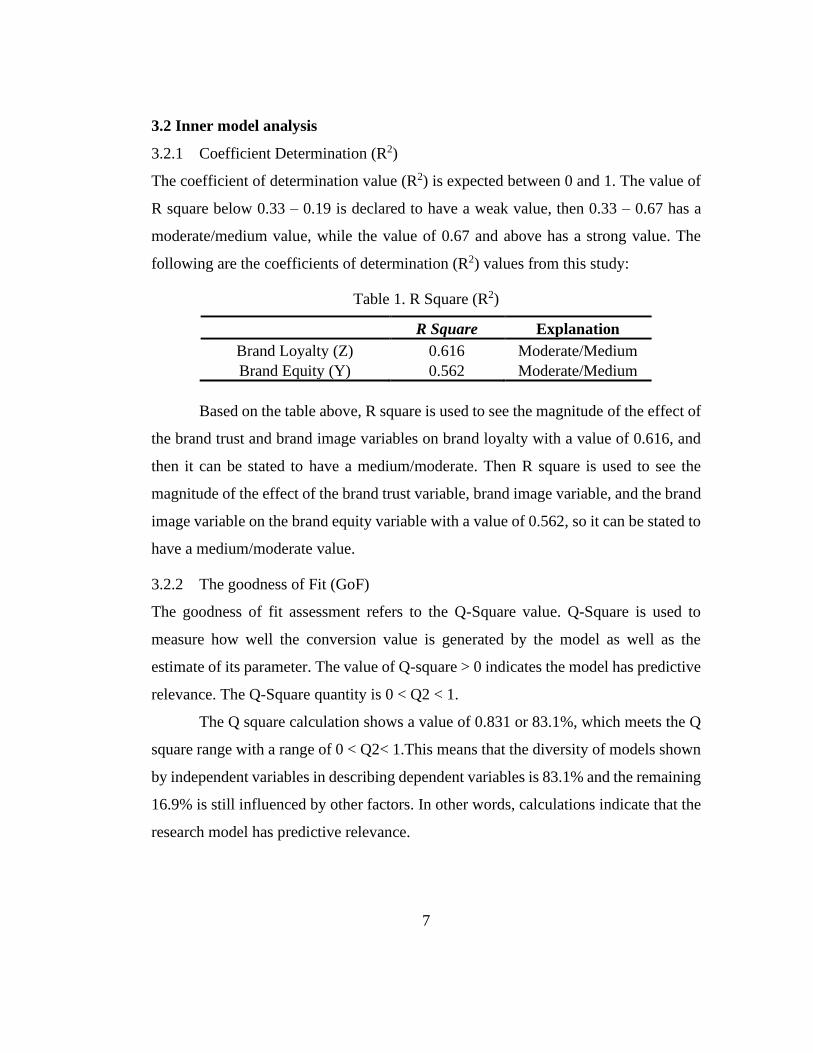
Table 1. R Square (R2)
R Square Explanation
Brand Loyalty (Z) 0.616 Moderate/Medium
Brand Equity (Y) 0.562 Moderate/Medium
Based on the table above, R square is used to see the magnitude of the effect of
the brand trust and brand image variables on brand loyalty with a value of 0.616, and
then it can be stated to have a medium/moderate. Then R square is used to see the
magnitude of the effect of the brand trust variable, brand image variable, and the brand
image variable on the brand equity variable with a value of 0.562, so it can be stated to
have a medium/moderate value.
3.2.2 The goodness of Fit (GoF)
The goodness of fit assessment refers to the Q-Square value. Q-Square is used to
measure how well the conversion value is generated by the model as well as the
estimate of its parameter. The value of Q-square > 0 indicates the model has predictive
relevance. The Q-Square quantity is 0 < Q2 < 1.
The Q square calculation shows a value of 0.831 or 83.1%, which meets the Q
square range with a range of 0 < Q2< 1.This means that the diversity of models shown
by independent variables in describing dependent variables is 83.1% and the remaining
16.9% is still influenced by other factors. In other words, calculations indicate that the
research model has predictive relevance.

8
3.3 Hypothesis testing
3.3.1 Direct effect
The criteria for this analysis is to look at the path coefficients that show the original
sample values are positive or negative. Then if the probability/significance value (P-
Value) < 0.05 (5%), then it is significant. If the P-Values > 0.05 (5%), then it is rejected.
Table 2. Direct Effect
Hypothesis Original
Sample P-Value Conclusion
Brand Image → Brand
Equity 0.414 0.000
Positive,
Significant
Brand Image → Brand
Loyalty 0.102 0.413
Positive,
Insignificant
Brand Loyalty → Brand
Equity 0.181 0.082
Positive,
Insignificant
Brand Trust → Brand
Equity 0.216 0.148
Positive,
Insignificant
Brand Trust → Brand
Loyalty 0.699 0.000
Positive,
Significant
Based on the table above, the original sample value and P-value directly
influence variables. The analysis results show the influence of Brand Image on Brand
equity with an original sample value of 0.414 and a P value of 0.000> 0.05, which is
stated to have a positive and significant influence. Then H1: Brand Image has a
significant impact on Brand Equity is accepted. In contrast, H0: Brand Image has no
significant effect on Brand Equity is rejected.
The analysis results show the influence of Brand Image on Brand Loyalty with
an original sample value of 0.102 and a P value of 0.413> 0.05, which is stated to have
a positive and significant influence. Then H3: Brand Image has a significant impact on
Brand Loyalty is rejected. In contrast, H0: Brand Image has no significant effect on
Brand Loyalty accepted.
The analysis results show the influence of brand loyalty on brand equity with
an original sample value of 0.181 and a P value of 0.082> 0.05, which is stated to have

9
a positive and significant influence. Then H5: Brand loyalty has a significant impact
on brand equity is rejected. In contrast, H0: brand loyalty has no significant effect on
brand equity accepted.
The analysis results show the influence of brand trust on brand equity with an
original sample value of 0.216 and a P value of 0.148> 0.05, which is stated to have a
positive and not significant effect. Then H2: Brand trust has a significant impact on
brand equity is rejected, while H0: Brand trust has no significant effect on brand equity
accepted.
The analysis results show the influence of brand trust on brand loyalty with an
original sample value of 0.699 and a P value of 0.000> 0.05, which is stated to have a
positive and significant influence. Then H4: Brand trust has a significant impact on
brand loyalty is accepted. In contrast, H0: brand trust has no significant effect on brand
loyalty rejected.
3.3.2 Indirect effect
The criteria for this analysis is to look at the path coefficients that show the original
sample values are positive or negative. Then if the probability/significance value (P-
Value) < 0.05 (5%), then it is significant. If the P-Values > 0.05 (5%), then it is not
significant.
Table 3. Indirect Effect
Hypothesis Original
Sample P-Value Conclusion
Brand Trust → Brand
Loyalty → Brand Equity 0.162 0.113
Positive,
Insignificant
Brand Image →Brand
Loyalty → Brand Equity 0.018 0.521
Negative,
Insignificant
Based on the table above, the analysis of the indirect effect of Brand trust on
Brand equity through Brand loyalty shows the original sample value of 0.162 and P
values of 0.113 > 0.05, which are declared to have a positive and insignificant effect.
10
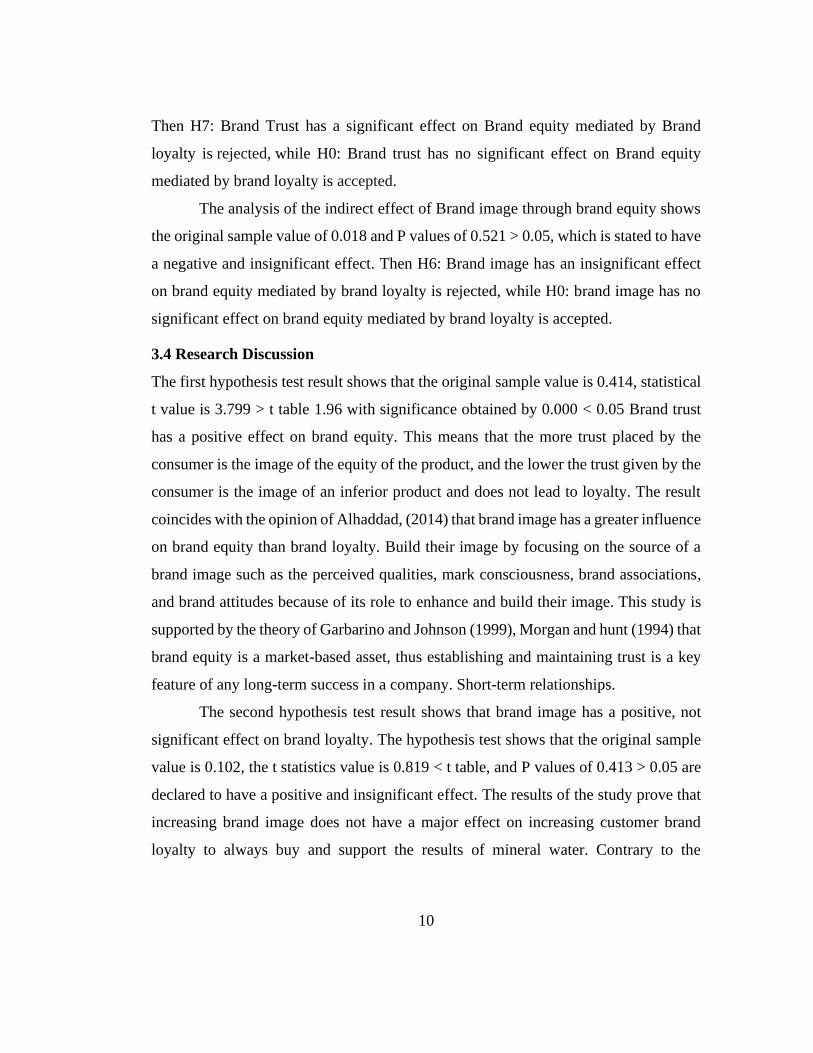
Then H7: Brand Trust has a significant effect on Brand equity mediated by Brand
loyalty is rejected, while H0: Brand trust has no significant effect on Brand equity
mediated by brand loyalty is accepted.
The analysis of the indirect effect of Brand image through brand equity shows
the original sample value of 0.018 and P values of 0.521 > 0.05, which is stated to have
a negative and insignificant effect. Then H6: Brand image has an insignificant effect
on brand equity mediated by brand loyalty is rejected, while H0: brand image has no
significant effect on brand equity mediated by brand loyalty is accepted.
3.4 Research Discussion
The first hypothesis test result shows that the original sample value is 0.414, statistical
t value is 3.799 > t table 1.96 with significance obtained by 0.000 < 0.05 Brand trust
has a positive effect on brand equity. This means that the more trust placed by the
consumer is the image of the equity of the product, and the lower the trust given by the
consumer is the image of an inferior product and does not lead to loyalty. The result
coincides with the opinion of Alhaddad, (2014) that brand image has a greater influence
on brand equity than brand loyalty. Build their image by focusing on the source of a
brand image such as the perceived qualities, mark consciousness, brand associations,
and brand attitudes because of its role to enhance and build their image. This study is
supported by the theory of Garbarino and Johnson (1999), Morgan and hunt (1994) that
brand equity is a market-based asset, thus establishing and maintaining trust is a key
feature of any long-term success in a company. Short-term relationships.
The second hypothesis test result shows that brand image has a positive, not
significant effect on brand loyalty. The hypothesis test shows that the original sample
value is 0.102, the t statistics value is 0.819 < t table, and P values of 0.413 > 0.05 are
declared to have a positive and insignificant effect. The results of the study prove that
increasing brand image does not have a major effect on increasing customer brand
loyalty to always buy and support the results of mineral water. Contrary to the

11
expectations of researchers that brand image can affect loyalty because the brand image
is a consumer's perception of a brand as a reflection of consumer loyalty.
Testing the third hypothesis shows that brand loyalty has a positive, not
significant, effect on brand equity. The hypothesis test shows the original sample value
is 0.181, and the statistical t value is 1.745 > t table 1.96, and P values of 0.082 > 0.05
are declared to have a positive and insignificant effect. When customer loyalty to a
product is high, then equity is no longer a measure or is no longer a person's concern.
The results of this study are inversely proportional to the researchers' expectations; in
another study, according to J Juliana (2019), brand loyalty pays more attention to
consumers. Second, give customers more than they expect. Lastly, build a long-term
relationship with customers by creating a loyalty program so that the effect can develop
their brand equity. So that brand loyalty affects brand equity.
Testing the fourth hypothesis shows that brand trust has a positive, not
significant effect on brand equity. The hypothesis test shows the original sample value
is 0.216, and the statistical t value is 1.450 > t table 1.96, and P values of 0.148 > 0.05
are declared to have a positive and insignificant effect.The results of this study are
inversely proportional to the researchers' expectations that brand trust is the brand's
ability to be trusted, which is based on consumer confidence that the product can fulfill
the promised value and good brand intentions based on consumer confidence that the
brand can prioritize the interests of consumers to form loyalty to consumers. This
research is also inversely proportional to the theoretical concept and the results of
Bastian, (2014) research, in which the brand trust variable affects brand loyalty.
Consumers may have expectations that the trust given reflects better equity stating that
brand equity is a relational market based asset, then building and maintaining trust is a
key characteristic of the success of any long-term relationship.
The fifth hypothesis test result shows that the original sample value is 0.699,
statistical t value is 5.867> t table 1.96 with significance obtained by 0.000<0.05. This
indicates that the first hypothesis is accepted. There is a positive and significant
12
influence among brand trust of brand loyalty. There is a positive and significant effect
of brand trust on brand loyalty. In this case, it is also in line with Tan et al., (2011)
where brand trust is a key variable in long-term customer relationships, positively
affecting brand loyalty. Brand trust leads to higher levels of loyalty because trust
creates a highly valued exchange relationship.
Testing the sixth hypothesis shows that the original sample value is 0.126, the
statistical t value is 1.589> t table 1.96 with significance obtained by 0.113 <0.05. This
indicates that the sixth hypothesis is rejected. This study contradicts the opinion of
Nofriyanti, (2017)which shows that brand trust has a positive effect on brand equity.
This means that the more trust given by consumers is a picture of product equity.
Conversely, the lower the trust given by consumers is a picture of product equity that
lacks quality and does not lead to loyalty. The results of this study are in line with the
opinion of Sutisna, (2005) which states the relationship of trust and belief in providing
trust in a product. Consumers may have expectations that the trust given reflects better
equity.
The seventh hypothesis test result shows that the original sample value is 0.018,
statistical t value is 0.642< t table 1.96 with significance obtained by 0.521 >0.05. This
indicates that the seventh hypothesis is rejected. There is a positive and insignificant
influence between the brand image on brand equity mediated by brand loyalty.This
study contradicts the opinion of (Hossien Emari, 2012)that a positive brand image will
be beneficial for the creation of consumer loyalty, trust in brands and products, and the
willingness of consumers to seek these products/services if they need them. The results
of the study state that brand image partially has a significant effect on brand loyalty.
The results of this study are also supported by the theory put forward by Hossien Emari,
(2012) which states that a different and unique brand image is the most important thing
because products are increasingly complex and the market is getting fuller, so
consumers will increase depending on image brand rather than actual brand attributes
to make purchasing decisions.
13
A customer who is very loyal to a brand will not easily switch his purchase to
another brand, no matter what happens with that brand, when customer loyalty to a
brand increases, the vulnerability of that customer group from threats and attacks by
competing brands can be reduced. Brand loyalty is the heart of brand equity. If brand
loyalty increases, the vulnerability of customer groups from competitor attacks can be
reduced.
4. CONCLUSSION
4.1 Implication of Study
Based on analysis already done, the research can be summed up as follows:
1. Brand image has a significant influence on brand equity.
2. Brand image has not significant influence on brand loyalty.
3. Brand loyalty and brand trust have no significant influence on brand equity.
4. Brand trust has a significant influence on brand loyalty.
5. Brand trust and brand image have no significant influence on brand equity mediated
by brand loyalty.
4.2 Suggestion
Some Suggestions are needed for the future and for the evaluation:
1. The study has variables studied the only brand image, brand trust, brand loyalty,
brand equity, so it is recommended to study with other variables. This is because
some variables are insignificant, and some have to be traced.
2. Future researchers are expected to obtain research data from more accurate and
realistic respondents who fit the criteria.
BIBLIOGRAPHY
Aaker in Shadat. (2009). Bilson Simamora, “ANALISIS MULTIVARIAT
PEMASARAN”, Jakarta : PT Gramedia Pustaka Utama, 2005, hal 144. 2009–
2010.
Bastian, D. A. (2014). Analisa Pengaruh Citra Merek (Brand Image) dan Kepercayaan
Merek (Brand Trust) Terhadap Loyalitas Merek (Brand Loyalty) ADES PT.

14
Ades Alfindo Putra Setia. Jurnal Manajemen Pemasaran Petra, 2(1), 1–9.
Buil, I., de Chernatony, L., & Martínez, E. (2008). A cross‐national validation of the
consumer‐based brand equity scale. Journal of Product & Brand Management,
17(6), 384–392. https://doi.org/10.1108/10610420810904121
Erviana, O. (2013). Pengruh Kualitas Pelayanan dan Kepercayaan terhadap Kepuasan
Pasien Rawat Inap di RSUD Dr. Soewondo Kendal. In Fakultas Ekonomi.
Erviana, O. (2013). Pengruh Kualitas Pelayanan dan Kepercayaan terhadap Kepuasan
Pasien Rawat Inap di RSUD Dr. Soewondo Kendal. In Fakultas Ekonomi.
Ghozali, I. (2014). Structural Equation Modeling, Metode Alternatif dengan Partial
Least Square (PLS) (Edisi 4). Badan Penerbit Universitas.
Hossien Emari. (2012). The mediatory impact of brand loyalty and brand image on
brand equity. African Journal of Business Management, 6(17), 5692–5701.
https://doi.org/10.5897/ajbm11.788
Juliandi, A. (2018). Structural equation model based partial least square SEM-PLS
Menggunakan SmartPLS. https://doi.org/10.5281/zenodo.2538001
Kazmi, A., & Mehmood, Q. S. (2016). The effect of electronic word of mouth
communication and brand image on purchase intention: A case of consumer
electronics in Haripur, Pakistan. Management Science Letters, 6, 409–508.
https://doi.org/10.5267/j.msl.2016.5.003
Khadim, R. A., Hanan, M. A., Arshad, A., Saleem, N., & Khadim, N. A. (2018).
Revisiting antecedents of brand loyalty: Impact of perceived social media
communication with brand trust and brand equity as mediators. Academy of
Strategic Management Journal, 17(1).
Kotler, & Keller. (2016). Severo Ochoa, winner of the Nobel Prize for physiology and
medicine. His life and work. In Boletin cultural e informativo - Consejo
General de Colegios Medicos de España (Vol. 22).
Rangkuti. (2014). The Influence of Brand Image and Brand Personality on Brand
Loyalty. Australian Journal of Basic and Applied Sciences, 9(7), 493–497.
Rubio, N., Oubiña, J., & Villaseñor, N. (2013). Brand awareness – brand
quality inference and consumeŕs risk perception in store brands of
food products. FOOD QUALITY AND PREFERENCE.
https://doi.org/10.1016/j.foodqual.2013.09.006
Sajjad. (2016). Methods of data collection. Method of Data Collection, 14(2), 109–110.
https://doi.org/10.1097/00006527-199406000-00014
Sugiyono. (2016). Metode Penelitian Kuantitatif Kualitatif dan R&D. Alfabeta.
Related Documents