UNCLASSIFIED The Effect of Back Pressure on the Operation of a Diesel Engine Peter Hield Maritime Platforms Division Defence Science and Technology Organisation DSTO-TR-2531 ABSTRACT The Ricardo Wave engine modelling software has been used to examine the effect of increased back pressure on a turbocharged diesel engine. Steady state and varying back pressure are considered. The results show that high back pressure has a significant adverse effect on the operation and reliability of the engine. The response to fluctuating back pressure is strongly non- linear, and depends on the amplitude and period of the fluctuations. For a constant output load, the exhaust gas temperature increases significantly with increasing back pressure, leading to reduced engine reliability. Due to the speed control strategy used on this engine, speed fluctuations are an unavoidable consequence of imposed back pressure fluctuations. RELEASE LIMITATION Approved for public release UNCLASSIFIED

Welcome message from author
This document is posted to help you gain knowledge. Please leave a comment to let me know what you think about it! Share it to your friends and learn new things together.
Transcript

UNCLASSIFIED
The Effect of Back Pressure on the Operation of a Diesel Engine
Peter Hield
Maritime Platforms Division Defence Science and Technology Organisation
DSTO-TR-2531
ABSTRACT The Ricardo Wave engine modelling software has been used to examine the effect of increased back pressure on a turbocharged diesel engine. Steady state and varying back pressure are considered. The results show that high back pressure has a significant adverse effect on the operation and reliability of the engine. The response to fluctuating back pressure is strongly non-linear, and depends on the amplitude and period of the fluctuations. For a constant output load, the exhaust gas temperature increases significantly with increasing back pressure, leading to reduced engine reliability. Due to the speed control strategy used on this engine, speed fluctuations are an unavoidable consequence of imposed back pressure fluctuations.
RELEASE LIMITATION
Approved for public release
UNCLASSIFIED
UNCLASSIFIED
Published by Maritime Platforms Division DSTO Defence Science and Technology Organisation 506 Lorimer St Fishermans Bend, Victoria 3207 Australia Telephone: (03) 9626 7000 Fax: (03) 9626 7999 © Commonwealth of Australia 2011 AR-014-968 February 2011 APPROVED FOR PUBLIC RELEASE
UNCLASSIFIED
UNCLASSIFIED
UNCLASSIFIED
The Effect of Back Pressure on the Operation of a Diesel Engine
Executive Summary Diesel engines have been used as the primary power system for submarines for almost as long as submarines have existed, and are still in common use today. The snorkel was first fitted to submarines by the Royal Netherlands Navy in 1938, allowing the diesel engine to be operated while the submarine was at periscope depth. This invention, while significantly increasing the stealth of the submarine, has profound effects on the requirements of the diesel engine, which must now overcome several metres of water pressure on the exhaust system. In addition, the back pressure on the engine is dynamic due to the waves on the water surface. If the waves become sufficiently large, they may cause the induction mast top valve to close, lowering the engine inlet pressure and starving the engine of air. Publicly available literature on the effect of back pressure on diesel engines is limited, and it seems that there has been little work on addressing the problem. This paper examines the effect of increased back pressure on a turbocharged diesel engine using the Ricardo Wave engine modelling software, to gain understanding of the problem and provide a good base for future work on methods of improving engine performance. The effects of both steady-state and varying back pressure are presented, covering a range of back pressure conditions approximately representative of those which would be encountered by a diesel engine in a snorting submarine. The main findings of the study are as follows:
As the back pressure increases, the engine must work harder to pump the gases out of the cylinder against the higher pressure. The pressure ratios across the turbocharger compressor and turbine decrease, reducing the mass flow of air through these components and thus the air available to the engine. At the same time, the fuel flow must increase to provide the extra power necessary to overcome the increased pumping losses while maintaining a constant brake power output. As a result the brake specific fuel consumption increases above that for an engine operating in atmospheric conditions.
The response of the engine to dynamic back pressure variations is strongly non-
linear, and depends on the engine speed, the load torque, the mean back pressure and the amplitude and period of the fluctuations.
The majority of the non-linear effects are due to the turbocharger. The compressor
and turbine operating points describe distorted ellipses approximately centred on the steady state operating point. This is due to the inertia of the rotor. The shapes of the orbits follow the shapes of the compressor and turbine maps, and the

UNCLASSIFIED
UNCLASSIFIED
distortion becomes increasingly pronounced as the amplitude of the fluctuations increases.
The engine speed governor responds to changes in engine speed and adjusts the
fuel flow to maintain constant speed. However, it has a finite response time, and is only able to adjust the fuel flow after a change in speed has occurred. As a result, with this engine control strategy, fluctuations in engine speed are an inevitable consequence of fluctuations in the back pressure.
The exhaust gas temperature increases significantly with increasing back pressure
due to the increased power required (to overcome the additional pumping work) and the reduced air flow. In addition, imposed back pressure fluctuations cause large exhaust temperature fluctuations, which further increases the maximum temperature and also induces thermal cycling. These effects lead to increased wear and reduced reliability, and can cause thermal failures.
Ricardo Wave provides a powerful tool for investigating the behaviour of engines
under varying back pressure conditions, and the software also has the capability to model engine control systems, allowing the development of control strategies to mitigate the effects of the varying back pressure. However, an experimental program is required to provide validation of the model before the results obtained can be relied on.
UNCLASSIFIED
UNCLASSIFIED
Author
Peter Hield Maritime Platforms Division
Peter Hield received a Master of Engineering from Imperial College, London, in 2002. He completed a PhD at the University of Melbourne, titled “An experimental and theoretical investigation of thermoacoustic instability in a turbulent premixed laboratory combustor”, graduating in 2008, and received the Dr John Patterson prize for the best thesis from the School of Engineering for this work.
He has previously worked in a variety of process industry Mechanical Engineering positions, before joining the Defence Science and Technology Organisation in February 2010. He currently works for the Propulsion and Energy Systems Group of Maritime Platforms Division, specialising in submarine diesel engines.
____________________ ________________________________________________

UNCLASSIFIED
Contents
1. INTRODUCTION............................................................................................................... 1
2. THE BACK PRESSURE ON AN UNDERWATER EXHAUST DUE TO OCEAN WAVES.................................................................................................................................. 2
3. THE ENGINE MODEL ...................................................................................................... 4
4. THE EFFECT OF STEADY STATE BACK PRESSURE ............................................... 5
5. THE RESPONSE TO A STEP CHANGE IN BACK PRESSURE ............................. 11
6. THE RESPONSE TO SINUSIODALLY VARYING BACK PRESSURE ................ 12 6.1 Baseline Case ........................................................................................................... 12 6.2 The Effect of Varying Wave Height .................................................................... 15 6.3 The Effect of Varying Wave Period..................................................................... 20
7. CONCLUSIONS................................................................................................................ 25
8. FUTURE WORK................................................................................................................ 28
9. ACKNOWLEDGEMENTS .............................................................................................. 29
10. REFERENCES .................................................................................................................... 29
UNCLASSIFIED

UNCLASSIFIED DSTO-TR-2531
1. Introduction
Diesel engines have been used as the primary power system for submarines for almost as long as submarines have existed, and are still in common use today. The snorkel was first fitted to the submarine-minelayers ‘019’ and ‘020’ by the Royal Netherlands Navy in 1938 [1], allowing the diesel engine to be operated while the submarine was at periscope depth. This invention, while significantly increasing the stealth of the submarine, has profound effects on the requirements of the diesel engine, which must now overcome several metres of water pressure on the exhaust system. In addition, this back pressure is dynamic due to the surface waves on the water. If the waves become sufficiently large, they may cause the induction mast top valve to close, lowering the engine inlet pressure and starving the engine of air [1-3]. Despite these problems, the publicly available literature on the effect of reduced inlet pressure and increased back pressure on diesel engines is limited, and it seems that there has been little work on addressing the problem. A general discussion of the issues involved can be found in [1-4], and, in particular, [1] gives a good qualitative description of the behaviour of an engine in response to increased back pressure. Buckingham and Mann [5] present the results of a steady state model of a diesel engine operating with decreased inlet pressure and increased back pressure, and although they mention that the dynamic effects are of concern, they do not present any dynamic modelling results. Marco [6] uses Ricardo’s Wave software to examine the response of a V18 submarine engine to a sinusoidal variation of the back pressure. The most comprehensive studies, involving both modelling and experiment, are presented in [7-11]. Jost [7] presents the results of some experimental validation of theoretical predictions of the performance of a turbocharged engine under dynamically varying back pressure conditions, by the engine manufacturer MTU. Swain [8], Smith and Newman [11] and Swain and Elliot [10] go further, developing a control strategy for improving engine performance by dynamically varying the turbine nozzle area in response to the back pressure variations. Both supercharging and turbocharging have been used to improve performance above that of a naturally aspirated engine. Experience has shown that supercharged engines are less susceptible to inlet and back pressure variations than turbocharged engines, but, as they draw power from the crankshaft which could otherwise be transmitted to the load, the fuel consumption is higher. In contrast, a turbocharger is powered by the exhaust gases and therefore uses energy which would otherwise be wasted, but the performance is strongly affected by pressure variations [3, 4, 7, 9, 12]. Kirkman and Hopper [3] describe the development of turbocharged engines for submarines in the UK up to 1990, including modelling and experimental testing of engines with a variety of turbochargers to determine their suitability for submarine use. Herrmann [9] describes a combined supercharged-turbocharged system designed by the manufacturer S. E. M. T. Pielstick, which he argues is the optimal arrangement for a submarine. Results from a testing program are presented, for both steady state and dynamic back pressure conditions. However, the brake specific fuel consumption (kg/kWh) reported in [9] is higher than that achieved by turbocharged engines such as that in the Collins Class submarines [4].
UNCLASSIFIED 1

UNCLASSIFIED DSTO-TR-2531
This paper examines the effect of increased back pressure on a turbocharged diesel engine using the Ricardo Wave engine modelling software, with the aim of gaining an understanding of the problem and providing a good base for future work on methods of improving performance. The back pressure on a submarine engine consists of a mean pressure due to the exhaust pipe pressure losses and the mean depth of the water, with fluctuations due to the surface waves superimposed on top. To understand the differing effects of these two pressure components, the effect of the mean pressure alone is examined first. The transient response of the engine is then examined through the application of a step change in back pressure and through the application of sinusoidal pressure fluctuations superimposed on top of a mean back pressure. The effect of varying the amplitude and period of the fluctuations is examined, covering a range of back pressure conditions approximately representative of those which would be encountered by a diesel engine in a snorting submarine. The effect of inlet pressure excursions is not examined.
2. The Back Pressure on an Underwater Exhaust Due to Ocean Waves
The back pressure on a submarine engine is due to a combination of flow losses through the long exhaust ducting, and the pressure head due to the underwater exhaust. The first component is nominally steady, although its absolute value will increase with the total gas flow through the engine and the exhaust temperature. The second consists of a mean and varying part. The mean pressure is due to the mean depth of the exhaust below the water surface, and the fluctuating part is due to the water waves, which vary in amplitude and period depending on the conditions of the sea through which the submarine is snorting. The full spectrum of sea surface motion consists of a range of irregular waves of varying heights and periods and is difficult to define. The World Meteorological Organisation (WMO) defines the Sea State Scale (see Table 1) which is commonly used; however this only specifies a range of significant wave heights, defined as the ‘double amplitude’ of the waves [13]. A simplified wave energy spectrum in common use is the Bretschneider spectrum [13],
,radsmexp 1245 BAS B
where
44
42421
s691
,sm75.172
TB
THA
and is the wave frequency in radians per second, H1 is the characteristic wave height in metres which may be taken as equivalent to the significant wave height and T is the average wave period in seconds. Table 2 gives information for sea conditions that can be anticipated for operation around Australia.
UNCLASSIFIED 2

UNCLASSIFIED DSTO-TR-2531
Table 1 The WMO sea state scale [13]
(m) Sea State Code Lower
Limit Upper Limit
Mean Description of Seaway
0 0.00 0.00 0.00 Calm (glassy) 1 0.00 0.10 0.05 Calm (rippled) 2 0.10 0.50 0.30 Smooth (wavelets) 3 0.50 1.25 0.875 Slight 4 1.25 2.50 1.875 Moderate 5 2.50 4.00 3.25 Rough 6 4.00 6.00 5.00 Very Rough 7 6.00 9.00 7.50 High 8 9.00 14.00 11.50 Very High 9 14.00 >14.00 >14.00 Phenomenal
Table 2 Sea condition data for oceans around Australia [13]
Sea State (m) Zero Crossing
Period (s)
Average Period
(s)
Modal Period
(s)
Average Wave
Length (m)
Zero Crossing Length
(m)
Wave Steepness
(deg)
2 max 0.500 5.9 6.4 8.3 64 54 1.7 3 mean 0.875 6.3 6.9 8.9 74 62 2.5 3 max 1.250 6.8 7.4 9.6 85 72 3.1 4 mean 1.875 7.3 7.9 10.3 97 83 4.1 4 max 2.500 7.9 8.6 11.1 115 97 4.6 5 mean 3.250 8.3 9.0 11.7 126 108 5.5 5 max 4.000 8.7 9.5 12.3 141 118 6.1 6 mean 5.000 9.1 9.9 12.8 153 129 7.0 6 max 6.000 9.5 10.3 13.4 166 141 7.7 7 mean 7.500 9.9 10.8 14.0 182 153 8.8 7 max 9.000 10.3 11.2 14.5 196 166 9.8 8 mean 11.500 10.6 11.5 14.9 206 175 11.8 8 max 14.00 10.9 11.9 15.4 221 185 13.6 The information in Table 2 can be used with the Bretschneider spectrum to plot the wave spectral density against the wave period for different sea states (see Figure 1). This shows the representative periods of the back pressure fluctuations the submarine engine is likely to experience. There are two further complications. The first is that sea waves are not sinusoidal, but instead tend to have sharper peaks than troughs. A trochoidal waveform has this characteristic and is often used in ship stability calculations. However trochoidal waves are difficult to manipulate mathematically and so sinusoidal waves are often assumed for simplicity [14]. The second is that, for sufficiently large waves, the submerged exhaust
UNCLASSIFIED 3

UNCLASSIFIED DSTO-TR-2531
pipe will be exposed at the wave minima, thus placing a lower limit on the back pressure experienced by the engine. In this paper, the mean back pressure will be assumed constant at 1.45 bar absolute. This value is typical of submarine operations, and is due to a combination of the pressure loss across the exhaust duct and the mean height of the water column above the exhaust outlet. The irregularity of real surface waves is sufficient to prevent the clear examination of the response of the engine to different back pressure conditions, and so, as is commonly done, the waveforms will be assumed sinusoidal and regular, with wave heights and periods within the limits defined by the sea state code and the Bretschneider spectra. This will enable the effects of varying wave parameters to be studied separately. A later study will look at the effect of wave shape and history to examine the validity of this simplification.
Figure 1 Bretschneider spectra representative of sea states 2, 4, 6 and 8. Note the different scales
on the ordinates.
3. The Engine Model
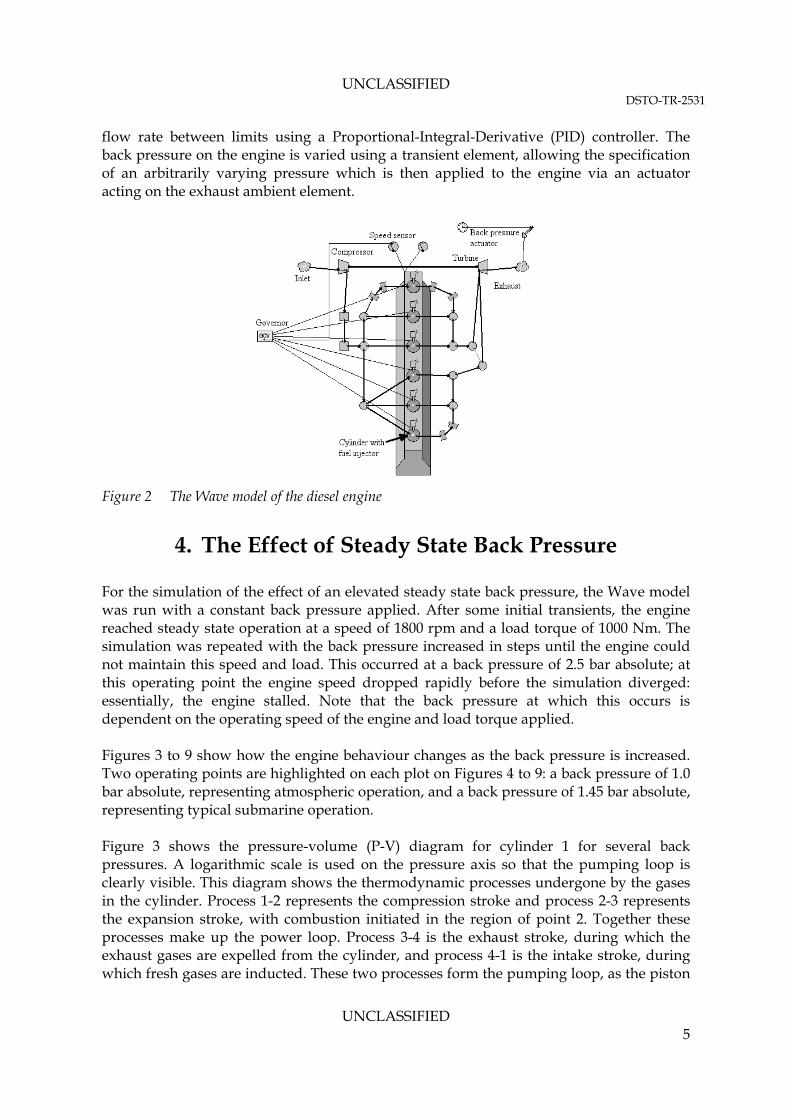
The engine modelled in this paper is an 11 litre six cylinder inline turbocharged diesel engine, simulated using the Ricardo Wave engine modelling software [15] (see Figure 2). As the aim of this paper is a general understanding of the effect of applying a back pressure to an engine, the choice of engine is not important, provided the topology is similar to that used in Australian submarines. Wave is a commercial 1D engine modelling package, capable of modelling the gas flows through an engine and its inlet and exhaust system, including a turbocharger. Combustion is simulated using the Diesel Wiebe model, which is a 1D model that relates the heat release profile to engine parameters such as the speed and the fuel and air mixture in the cylinder [15]. In order to simulate a diesel generator operating in submarine conditions, a constant load torque of 1000 Nm is applied to the engine, and the engine is operated at a constant set speed of 1800 rpm. The engine speed is regulated by a governor monitoring the engine speed and controlling the fuel
UNCLASSIFIED 4
UNCLASSIFIED DSTO-TR-2531
flow rate between limits using a Proportional-Integral-Derivative (PID) controller. The back pressure on the engine is varied using a transient element, allowing the specification of an arbitrarily varying pressure which is then applied to the engine via an actuator acting on the exhaust ambient element.
Figure 2 The Wave model of the diesel engine
4. The Effect of Steady State Back Pressure
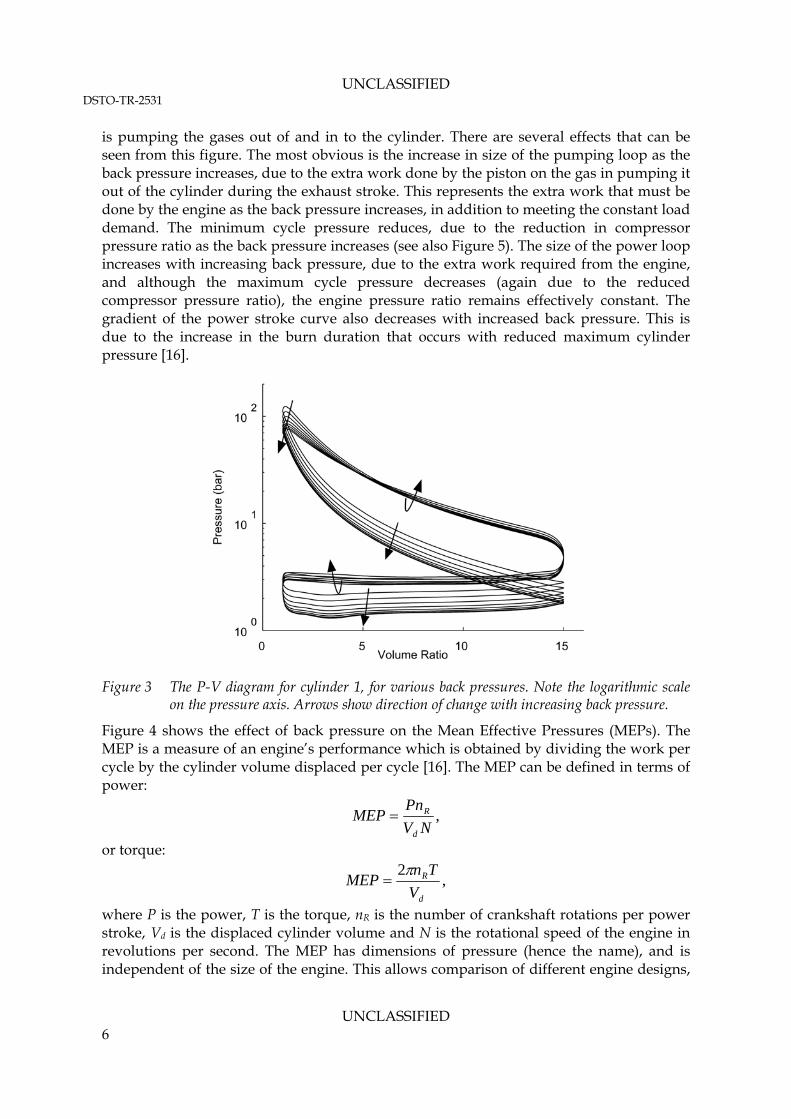
For the simulation of the effect of an elevated steady state back pressure, the Wave model was run with a constant back pressure applied. After some initial transients, the engine reached steady state operation at a speed of 1800 rpm and a load torque of 1000 Nm. The simulation was repeated with the back pressure increased in steps until the engine could not maintain this speed and load. This occurred at a back pressure of 2.5 bar absolute; at this operating point the engine speed dropped rapidly before the simulation diverged: essentially, the engine stalled. Note that the back pressure at which this occurs is dependent on the operating speed of the engine and load torque applied. Figures 3 to 9 show how the engine behaviour changes as the back pressure is increased. Two operating points are highlighted on each plot on Figures 4 to 9: a back pressure of 1.0 bar absolute, representing atmospheric operation, and a back pressure of 1.45 bar absolute, representing typical submarine operation. Figure 3 shows the pressure-volume (P-V) diagram for cylinder 1 for several back pressures. A logarithmic scale is used on the pressure axis so that the pumping loop is clearly visible. This diagram shows the thermodynamic processes undergone by the gases in the cylinder. Process 1-2 represents the compression stroke and process 2-3 represents the expansion stroke, with combustion initiated in the region of point 2. Together these processes make up the power loop. Process 3-4 is the exhaust stroke, during which the exhaust gases are expelled from the cylinder, and process 4-1 is the intake stroke, during which fresh gases are inducted. These two processes form the pumping loop, as the piston
UNCLASSIFIED 5
UNCLASSIFIED DSTO-TR-2531
is pumping the gases out of and in to the cylinder. There are several effects that can be seen from this figure. The most obvious is the increase in size of the pumping loop as the back pressure increases, due to the extra work done by the piston on the gas in pumping it out of the cylinder during the exhaust stroke. This represents the extra work that must be done by the engine as the back pressure increases, in addition to meeting the constant load demand. The minimum cycle pressure reduces, due to the reduction in compressor pressure ratio as the back pressure increases (see also Figure 5). The size of the power loop increases with increasing back pressure, due to the extra work required from the engine, and although the maximum cycle pressure decreases (again due to the reduced compressor pressure ratio), the engine pressure ratio remains effectively constant. The gradient of the power stroke curve also decreases with increased back pressure. This is due to the increase in the burn duration that occurs with reduced maximum cylinder pressure [16].
Figure 3 The P-V diagram for cylinder 1, for various back pressures. Note the logarithmic scale
on the pressure axis. Arrows show direction of change with increasing back pressure.
Figure 4 shows the effect of back pressure on the Mean Effective Pressures (MEPs). The MEP is a measure of an engine’s performance which is obtained by dividing the work per cycle by the cylinder volume displaced per cycle [16]. The MEP can be defined in terms of power:
,NV
PnMEP
d
R
or torque:
,2
d
R
V
TnMEP
where P is the power, T is the torque, nR is the number of crankshaft rotations per power stroke, Vd is the displaced cylinder volume and N is the rotational speed of the engine in revolutions per second. The MEP has dimensions of pressure (hence the name), and is independent of the size of the engine. This allows comparison of different engine designs,
UNCLASSIFIED 6

UNCLASSIFIED DSTO-TR-2531
and, as the typical brake MEP (BMEP) values are well established for the different engine types, it gives an initial estimate of the size of the engine required for a particular task [16]. Several different MEPs can be defined, depending on the point at which the power (or torque) is measured. The BMEP uses the power measured at the engine output, and it can be seen from Figure 4 that this remains constant as the back pressure increases. This is to be expected as the power demanded from the engine remains constant. The indicated MEP (IMEP) uses the power measured from the in-cylinder P-V diagram (see Figure 3), and two versions are defined: the gross IMEP, which uses the compression and expansion strokes only; and the net IMEP, which uses the total cycle. The net IMEP is obtained by adding the pumping MEP (PMEP) to the gross IMEP, and gives a measure of the power transmitted to the piston. Using the standard thermodynamic sign convention, work done by the system (in this case, the gas in the cylinder) is positive, while work done on the system is negative. The PMEP represents work done by the piston on the gas, and is therefore a negative quantity. The gross IMEP increases with increasing back pressure, reflecting the extra engine power required to overcome the increased pumping losses, shown by the increase in PMEP. The net IMEP reduces slightly, as it is the sum of the BMEP and the friction MEP (FMEP). The FMEP is modelled using a modified form of the Chen-Flyn friction correlation [15], defined as
,22FMEP 2max NLQNLCpBA CFCFCFCF
where ACF, BCF, CCF and QCF are constants, pmax is the maximum cylinder pressure, N is the engine speed and L is the stroke. The model predicts a small reduction in friction loss with increased back pressure due to the reduction in peak cylinder pressure (see Figure 3). All other the terms are independent of back pressure.
Figure 4 The brake ( ), net indicated ( ), pumping ( ), gross indicated ( ) and friction ( ) MEPs against back pressure
UNCLASSIFIED 7

UNCLASSIFIED DSTO-TR-2531
Figure 5 shows the pressures at the inlet and outlet of the compressor and turbine. The compressor inlet and turbine outlet pressures are effectively inputs to the simulation. The turbine inlet pressure initially reduces with increasing back pressure, and then increases, while the compressor outlet pressure decreases monotonically (see also the pumping loop pressures in Figure 3). However the important quantity here for both the compressor and the turbine is the pressure ratio (see also Figures 7 and 8), and this decreases monotonically in both cases. The reduced turbine pressure ratio means that less power can be extracted from the flow, and this is seen in the reduced temperature difference (see Figure 6) and reduced mass flow (see Figure 7). This then means that the power provided to the compressor is reduced, which reduces the increase in gas pressure across the compressor and further reduces the mass flow through the engine (see Figure 8). The power extracted from (given to) the gas by a turbine (compressor) is given by
,,, intouttpcompturb TTcmP
where Tt is the total (stagnation) temperature, is the mass flow rate and cp is the specific heat capacity. The minus sign arises from the thermodynamic sign convention, and ensures that the power is positive for the turbine (work is done by the gas) and that for the compressor is negative (work is done on the gas).
m
Figure 5 The pressure at the compressor inlet ( ), compressor outlet ( ), turbine inlet ( ) and turbine outlet ( ) against the back pressure
Note that the shapes of the curves in Figures 5 and 6 are strongly dependent on the positions of the operating points of the compressor and turbine, and the movement of the operating points as the back pressure changes. This is in turn dependent on the design of the turbomachinery and the (arbitrarily) chosen engine operating point. The engine (and in particular the turbocharger) used in this simulation was not optimised for submarine use, and it is likely that the results obtained could change significantly if such an optimisation
UNCLASSIFIED 8
UNCLASSIFIED DSTO-TR-2531
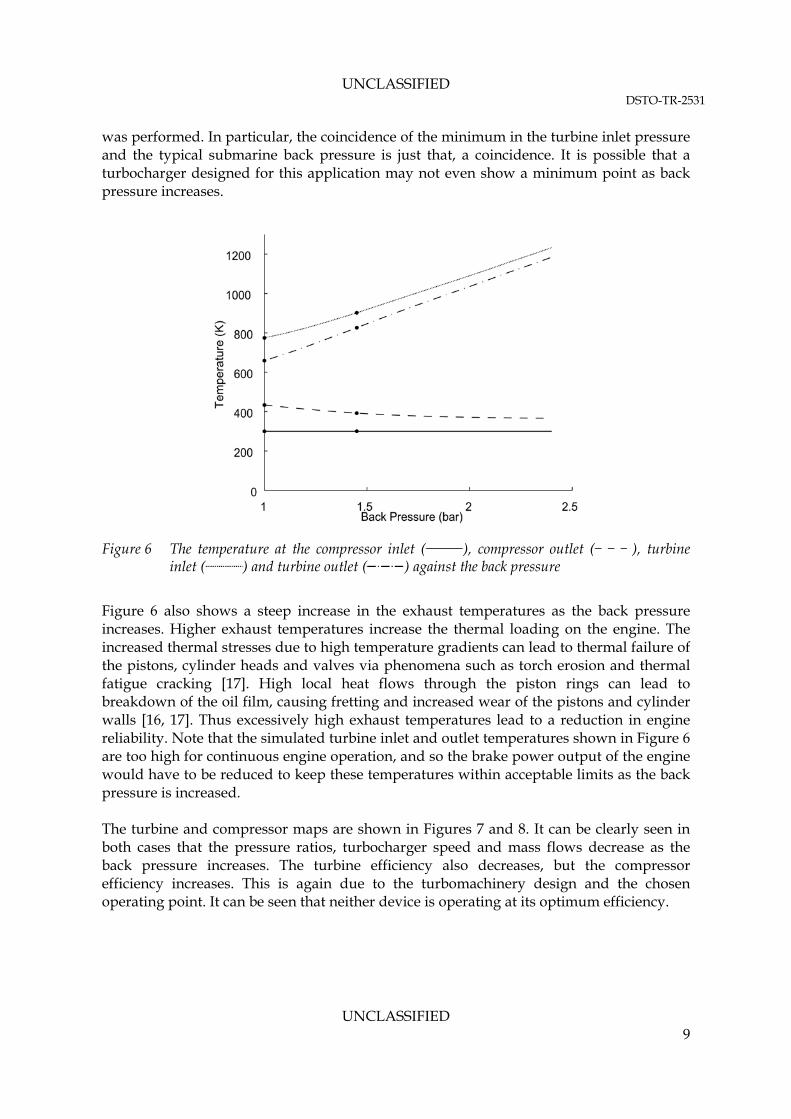
was performed. In particular, the coincidence of the minimum in the turbine inlet pressure and the typical submarine back pressure is just that, a coincidence. It is possible that a turbocharger designed for this application may not even show a minimum point as back pressure increases.
Figure 6 The temperature at the compressor inlet ( ), compressor outlet ( ), turbine inlet ( ) and turbine outlet ( ) against the back pressure
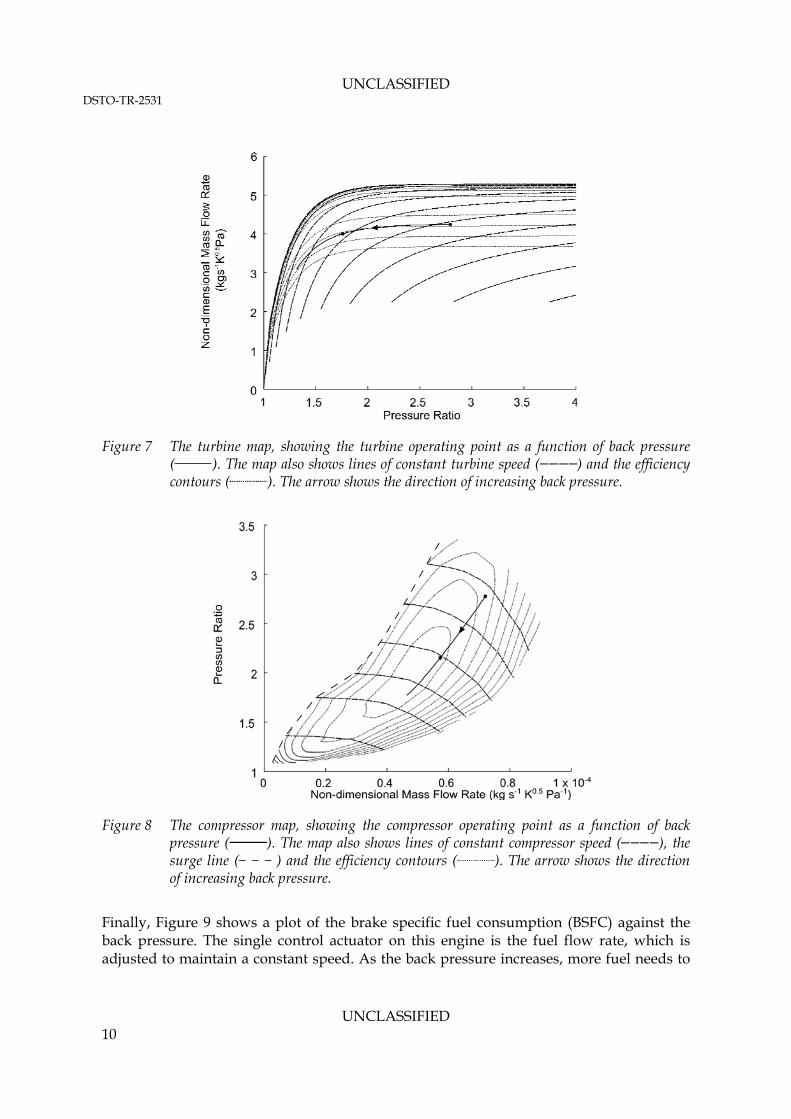
Figure 6 also shows a steep increase in the exhaust temperatures as the back pressure increases. Higher exhaust temperatures increase the thermal loading on the engine. The increased thermal stresses due to high temperature gradients can lead to thermal failure of the pistons, cylinder heads and valves via phenomena such as torch erosion and thermal fatigue cracking [17]. High local heat flows through the piston rings can lead to breakdown of the oil film, causing fretting and increased wear of the pistons and cylinder walls [16, 17]. Thus excessively high exhaust temperatures lead to a reduction in engine reliability. Note that the simulated turbine inlet and outlet temperatures shown in Figure 6 are too high for continuous engine operation, and so the brake power output of the engine would have to be reduced to keep these temperatures within acceptable limits as the back pressure is increased. The turbine and compressor maps are shown in Figures 7 and 8. It can be clearly seen in both cases that the pressure ratios, turbocharger speed and mass flows decrease as the back pressure increases. The turbine efficiency also decreases, but the compressor efficiency increases. This is again due to the turbomachinery design and the chosen operating point. It can be seen that neither device is operating at its optimum efficiency.
UNCLASSIFIED 9
UNCLASSIFIED DSTO-TR-2531
Figure 7 The turbine map, showing the turbine operating point as a function of back pressure ( ). The map also shows lines of constant turbine speed ( ) and the efficiency contours ( ). The arrow shows the direction of increasing back pressure.
Figure 8 The compressor map, showing the compressor operating point as a function of back pressure ( ). The map also shows lines of constant compressor speed ( ), the surge line ( ) and the efficiency contours ( ). The arrow shows the direction of increasing back pressure.
Finally, Figure 9 shows a plot of the brake specific fuel consumption (BSFC) against the back pressure. The single control actuator on this engine is the fuel flow rate, which is adjusted to maintain a constant speed. As the back pressure increases, more fuel needs to
UNCLASSIFIED 10

UNCLASSIFIED DSTO-TR-2531
be provided to overcome the additional pumping work. This work is not useful output, and so the BSFC must increase.
Figure 9 The BSFC as a function of back pressure
5. The Response to a Step Change in Back Pressure
This section examines the response of various engine parameters to a step change in back pressure from atmospheric to 1.45 bar absolute. Note that a turbocharged engine is a non-linear system, so the step response will be, as a minimum, dependent on the engine/turbocharger combination, the initial operating point (defined by speed, load and back pressure) and the magnitude and direction of the step change applied. The engine model was first run with a back pressure of 1 bar absolute (atmospheric conditions) until steady state operation was achieved, then a step increase of back pressure up to 1.45 bar absolute was applied and the model run until steady state operation was achieved at the new back pressure. Figure 10 shows the step change in back pressure along with the response of the engine speed, brake torque, fuel flow rate and the pressures at the compressor outlet, turbine inlet and turbine outlet. The pressure at the turbine outlet follows the exhaust back pressure with only a very slight lag, as only a short length of duct separates the two points. The turbine inlet pressure is the next to respond, increasing above its initial value, and at the same time the compressor outlet pressure decreases. These effects increase the pumping work that the engine must overcome (see Figure 3), but at this point the fuel flow is unchanged. The result is a drop in the brake torque produced by the engine, which, as the demanded load is unchanged, causes the engine to decelerate, with a delay due to the crankshaft inertia. Finally, the governor responds to the reduced engine speed and increases the fuel flow rate, causing the speed to increase. The engine
UNCLASSIFIED 11

UNCLASSIFIED DSTO-TR-2531
overshoots and then oscillates about the new operating point before settling down to steady state operation.
Figure 10 The response of the engine speed ( ), brake torque ( ), fuel flow rate ( ),
and the pressure at the compressor outlet ( ), turbine inlet ( ) and turbine outlet ( ) to a step change in the back pressure ( )
Figures 11 and 12 show the movement of the operating points on the turbine and compressor maps. The operating points move from the atmospheric back pressure steady state operating points to those for a back pressure of 1.45 bar absolute, but, due to the engine inertia, they do not follow the same paths as for increasing steady state back pressure (see also Figures 7 and 8). The operating point gets close to its final value relatively quickly, but then spirals around this point as it settles down. The effects described in this section are caused by the finite response time of the engine, due to such factors as the inertia of the moving components (pistons, connecting rods, crankshaft, turbocharger rotor), the governor speed control strategy and the interaction of the various engine components (cylinders, turbocharger and ducting). The governor attempts to maintain constant engine speed, but responds to changes in that speed, and so is only able to respond after a change in speed has occurred.
6. The Response to Sinusiodally Varying Back Pressure
6.1 Baseline Case
This section examines the response of the engine to a sinusoidally varying back pressure waveform with a wave height (peak-peak) of 1 m and a wave period of 10 s, superimposed
UNCLASSIFIED 12

UNCLASSIFIED DSTO-TR-2531
on a mean back pressure of 1.45 bar absolute. This is approximately representative of a submarine snorting in sea state 3. The results (except for those plotted on the turbocharger maps) are plotted as non-dimensional fluctuations, using the steady state value of each quantity for the non-dimensionalisation, so that
,*
g
gtg
g
tgtg
Figure 11 a) The turbine map, showing the response of the turbine operating point to a step change
in back pressure ( ), and b) zoomed in on the final operating point. The map also shows lines of constant turbine speed ( ) and the efficiency contours ( ).
UNCLASSIFIED 13

UNCLASSIFIED DSTO-TR-2531
Figure 12 a) The compressor map, showing the response of the compressor operating point to a step change in back pressure ( ), and b) zoomed in on the final operating point. The map also shows lines of constant compressor speed ( ), the surge line ( ) and the efficiency contours ( ).
where g is an arbitrary variable, and ,*g g and g are the non-dimensional, steady state and fluctuating parts of that variable respectively. The steady state value of a variable is defined as the value of that variable when the back pressure is constant at 1.45 bar absolute. The steady state value is used in place of the mean value due to the non-linear nature of the engine response causing the mean value of a given variable to vary with the amplitude of the imposed back pressure fluctuation.
UNCLASSIFIED 14

UNCLASSIFIED DSTO-TR-2531
Figure 13 shows the non-dimensional fluctuations in back pressure, engine speed, brake torque, fuel mass flow and turbine inlet temperature. The same time lags as described in Section 5 can be seen in this plot. At this back pressure condition, the response of the engine maintains a close to sinusoidal waveform. The important point to note is that the percentage variations in the fuel flow and turbine inlet temperature are significantly larger than the percentage variation in the engine speed. In particular, the maximum exhaust gas temperature is increased above the already high steady state temperature (due to the mean back pressure), further increasing the thermal loads on the engine (see Section 4) and the thermal cycling will lead to fatigue, further reducing engine reliability.
Figure 13 Non-dimensional fluctuations in back pressure ( ), engine speed ( ), brake
torque ( ), fuel mass flow ( ) and turbine inlet temperature ( ), for a mean back pressure of 1.45 bar absolute, a wave height of 1 m and a wave period of 10 s
The behaviour of the turbocharger is shown in Figures 14 and 15. The operating points of both the turbine and the compressor describe distorted ellipses, approximately centred on their steady state operating point at the mean back pressure. This shows that the mass flow through and the pressure ratio across each device are out of phase, due to the inertia of the rotor. 6.2 The Effect of Varying Wave Height
Figures 16 to 19 show the effect of varying the amplitude of the back pressure fluctuations. The wave heights used were 0.25 m, 0.5 m, 1 m, 2 m, 5 m, 8 m and 12 m, covering a range approximately representative of sea states 2 to 8. The steady state back pressure was kept constant at 1.45 bar absolute and the wave period was kept constant at 10 s.
UNCLASSIFIED 15

UNCLASSIFIED DSTO-TR-2531
Figure 14 a) The turbine map, showing the response of the turbine operating point to a
sinusoidally varying back pressure ( ), and b) zoomed in, for a mean back pressure of 1.45 bar absolute, a wave height of 1 m and a wave period of 10 s. The map also shows lines of constant turbine speed ( ) and the efficiency contours ( ).
As is expected, the effects on the engine are most severe for large amplitude back pressure fluctuations, and the results show significant departures from linear behaviour for wave heights of 2 m and above. The back pressure variations are sinusoidal, but the variations in engine speed, brake torque and fuel flow rate are not (Figure 16). The magnitude of the increase in fuel flow rate over the steady state value is approximately three times that of the decrease below the steady state value. Although the ‘half-periods’ of the back pressure and fuel flow variations remain equal as the amplitude of the back pressure fluctuations increases, those of the engine speed and brake torque do not. These parameters spend significantly longer below the steady state value than above it. (Note that for a linear
UNCLASSIFIED 16

UNCLASSIFIED DSTO-TR-2531
system, the steady state value would be equal to the mean value. It is clear from Figure 16 that this is not the case here). Further, the non-linearities vary in form with amplitude: for example, the variation in brake torque for a wave height of 2 m shows a dip at the maximum point in the cycle which is no longer present for larger wave heights, whereas the dip present at the minimum point continues to increase in size with increasing wave amplitude.
Figure 15 a) The compressor map, showing the response of the compressor operating point to a
sinusoidally varying back pressure ( ), and b) zoomed in, for a mean back pressure of 1.45 bar absolute, a wave height of 1 m and a wave period of 10 s. The map also shows lines of constant compressor speed ( ), the surge line ( ) and the efficiency contours ( ).
UNCLASSIFIED 17
UNCLASSIFIED DSTO-TR-2531
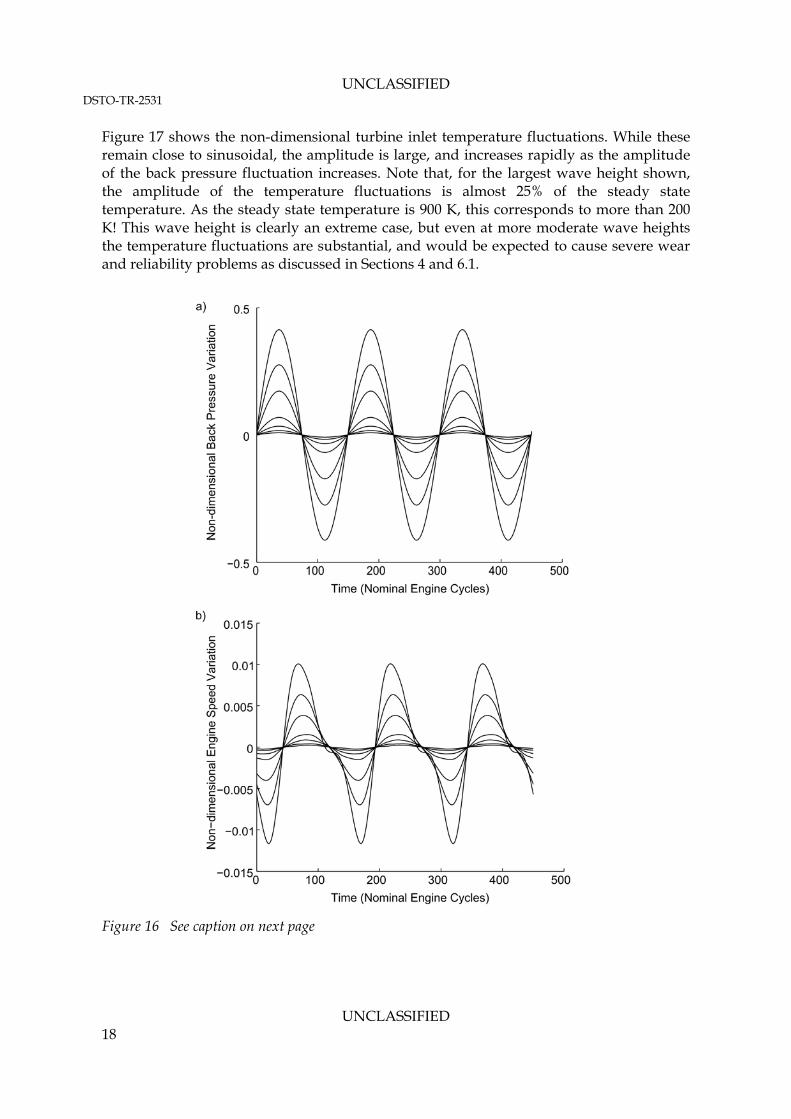
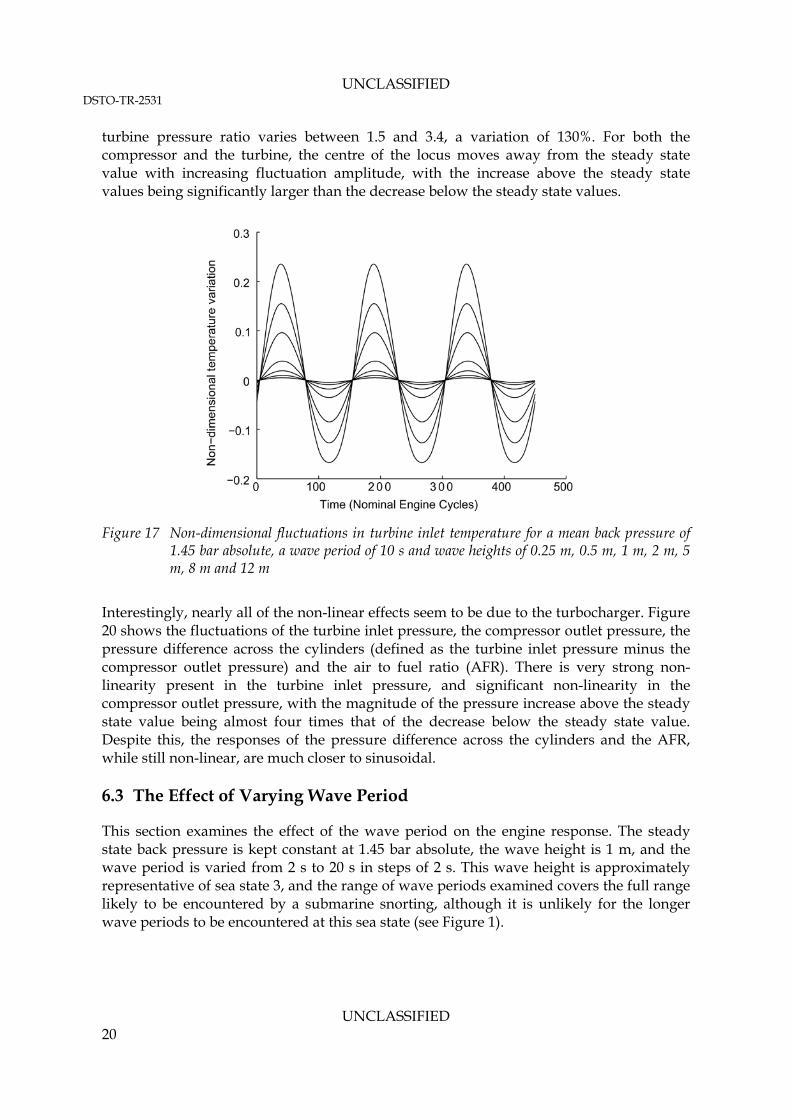
Figure 17 shows the non-dimensional turbine inlet temperature fluctuations. While these remain close to sinusoidal, the amplitude is large, and increases rapidly as the amplitude of the back pressure fluctuation increases. Note that, for the largest wave height shown, the amplitude of the temperature fluctuations is almost 25% of the steady state temperature. As the steady state temperature is 900 K, this corresponds to more than 200 K! This wave height is clearly an extreme case, but even at more moderate wave heights the temperature fluctuations are substantial, and would be expected to cause severe wear and reliability problems as discussed in Sections 4 and 6.1.
Figure 16 See caption on next page
UNCLASSIFIED 18

UNCLASSIFIED DSTO-TR-2531
Figure 16 Non-dimensional fluctuations in a) back pressure, b) engine speed, c) brake torque and
d) fuel mass flow, for a mean back pressure of 1.45 bar absolute, a wave period of 10 s and wave heights of 0.25 m, 0.5 m, 1 m, 2 m, 5 m, 8 m and 12 m
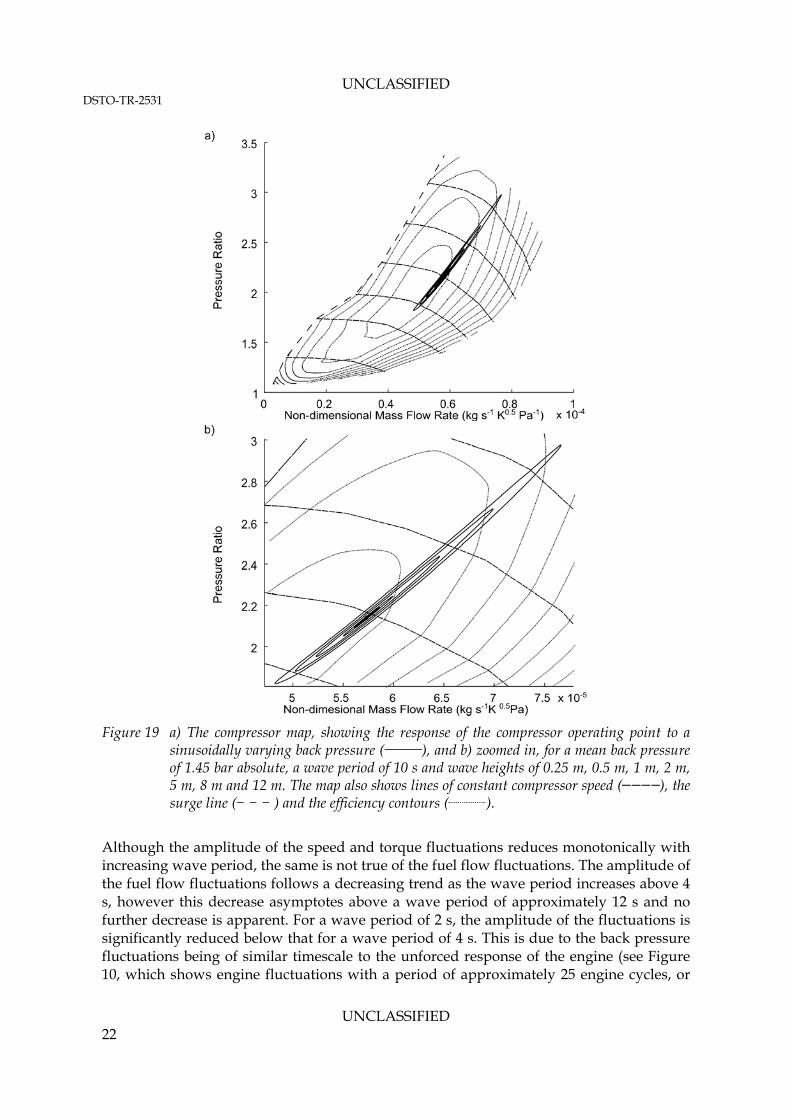
The locus of the operating point on the turbine map is shown in Figure 18. As the amplitude of the back pressure variation increases, the locus retains its elliptical shape, but the ellipse increases in size and becomes increasingly distorted to follow the shape of the turbine map. The behaviour of the operating point locus on the compressor map is similar (see Figure 19), but the distortion is less pronounced. The variation in the operating point throughout the cycle is significant: the turbocharger speed varies between just below 80,000 rpm to above 110,000 rpm for a wave height of 12 m (the steady state value is approximately 90,000 rpm), a variation of almost 50% from minimum to maximum. The
UNCLASSIFIED 19
UNCLASSIFIED DSTO-TR-2531
turbine pressure ratio varies between 1.5 and 3.4, a variation of 130%. For both the compressor and the turbine, the centre of the locus moves away from the steady state value with increasing fluctuation amplitude, with the increase above the steady state values being significantly larger than the decrease below the steady state values.
Figure 17 Non-dimensional fluctuations in turbine inlet temperature for a mean back pressure of
1.45 bar absolute, a wave period of 10 s and wave heights of 0.25 m, 0.5 m, 1 m, 2 m, 5 m, 8 m and 12 m
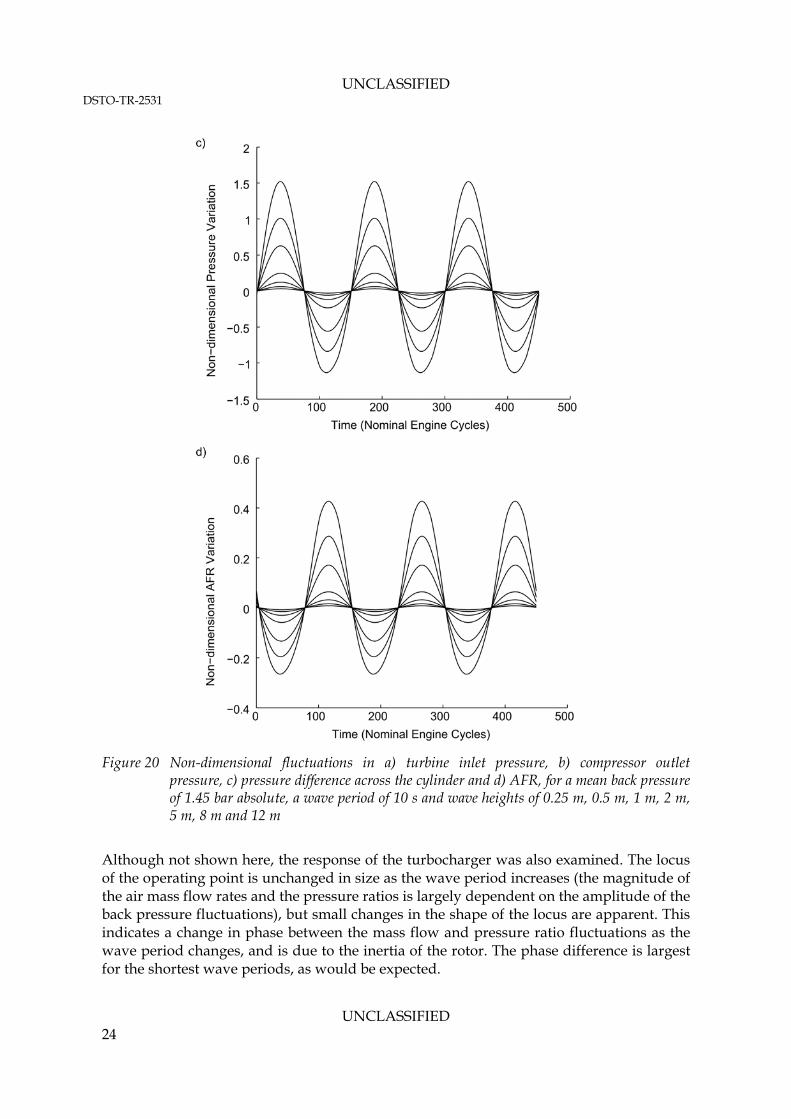
Interestingly, nearly all of the non-linear effects seem to be due to the turbocharger. Figure 20 shows the fluctuations of the turbine inlet pressure, the compressor outlet pressure, the pressure difference across the cylinders (defined as the turbine inlet pressure minus the compressor outlet pressure) and the air to fuel ratio (AFR). There is very strong non-linearity present in the turbine inlet pressure, and significant non-linearity in the compressor outlet pressure, with the magnitude of the pressure increase above the steady state value being almost four times that of the decrease below the steady state value. Despite this, the responses of the pressure difference across the cylinders and the AFR, while still non-linear, are much closer to sinusoidal. 6.3 The Effect of Varying Wave Period
This section examines the effect of the wave period on the engine response. The steady state back pressure is kept constant at 1.45 bar absolute, the wave height is 1 m, and the wave period is varied from 2 s to 20 s in steps of 2 s. This wave height is approximately representative of sea state 3, and the range of wave periods examined covers the full range likely to be encountered by a submarine snorting, although it is unlikely for the longer wave periods to be encountered at this sea state (see Figure 1).
UNCLASSIFIED 20

UNCLASSIFIED DSTO-TR-2531
Figure 18 a) The turbine map, showing the response of the turbine operating point to a
sinusoidally varying back pressure ( ), and b) zoomed in, for a mean back pressure of 1.45 bar absolute, a wave period of 10 s and wave heights of 0.25 m, 0.5 m, 1 m, 2 m, 5 m, 8 m and 12 m. The map also shows lines of constant turbine speed ( ) and the efficiency contours ( ).
For this situation, it is expected that the shorter wave periods will be the most problematic for the engine, as this is where the greatest rate of change of the back pressure will occur. That this is correct is clear from Figure 21, but the effects are not simple. The engine speed fluctuations have the largest magnitude at the shortest wave period, however the shape of those is closest to sinusoidal at the shortest wave period. As the wave period increases, the magnitude of the fluctuations decreases, but significant departures from linear behaviour become apparent. The same is true of the torque fluctuations.
UNCLASSIFIED 21
UNCLASSIFIED DSTO-TR-2531
Figure 19 a) The compressor map, showing the response of the compressor operating point to a
sinusoidally varying back pressure ( ), and b) zoomed in, for a mean back pressure of 1.45 bar absolute, a wave period of 10 s and wave heights of 0.25 m, 0.5 m, 1 m, 2 m, 5 m, 8 m and 12 m. The map also shows lines of constant compressor speed ( ), the surge line ( ) and the efficiency contours ( ).
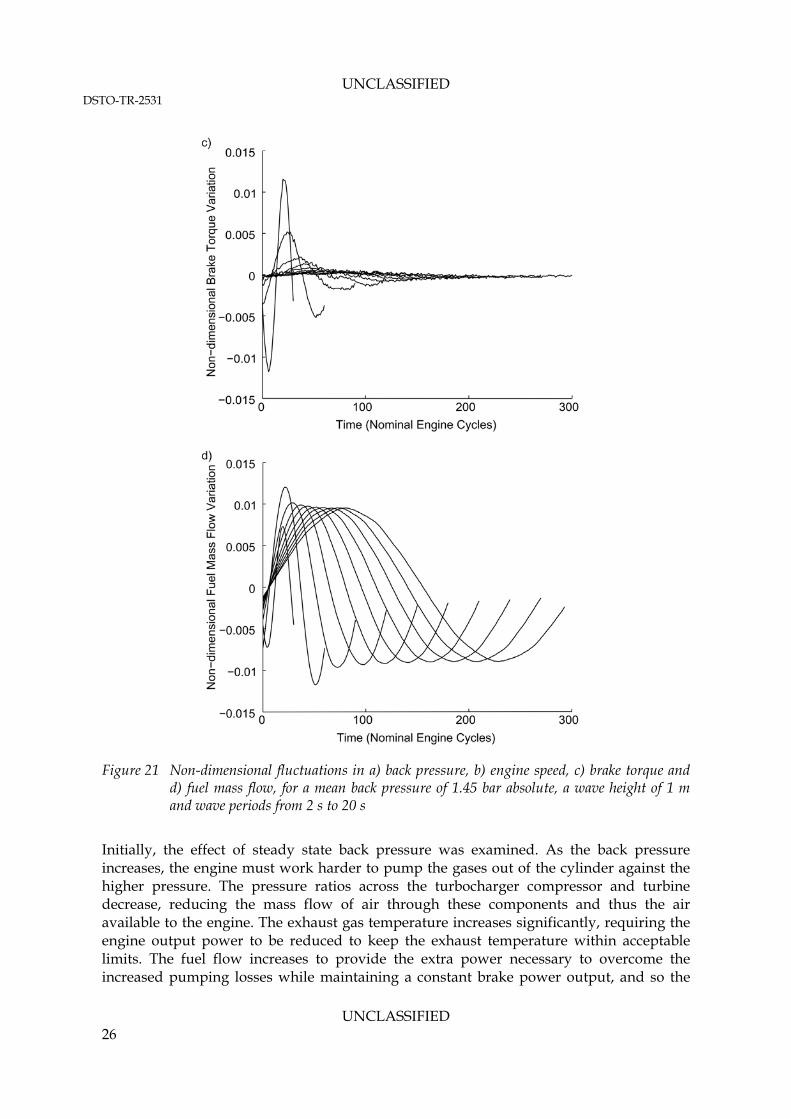
Although the amplitude of the speed and torque fluctuations reduces monotonically with increasing wave period, the same is not true of the fuel flow fluctuations. The amplitude of the fuel flow fluctuations follows a decreasing trend as the wave period increases above 4 s, however this decrease asymptotes above a wave period of approximately 12 s and no further decrease is apparent. For a wave period of 2 s, the amplitude of the fluctuations is significantly reduced below that for a wave period of 4 s. This is due to the back pressure fluctuations being of similar timescale to the unforced response of the engine (see Figure 10, which shows engine fluctuations with a period of approximately 25 engine cycles, or
UNCLASSIFIED 22

UNCLASSIFIED DSTO-TR-2531
1.7 s, in response to a step change in back pressure), and this effect will contribute to the large amplitude of the torque fluctuations at this wave period.
Figure 20 See caption on next page
UNCLASSIFIED 23
UNCLASSIFIED DSTO-TR-2531
Figure 20 Non-dimensional fluctuations in a) turbine inlet pressure, b) compressor outlet
pressure, c) pressure difference across the cylinder and d) AFR, for a mean back pressure of 1.45 bar absolute, a wave period of 10 s and wave heights of 0.25 m, 0.5 m, 1 m, 2 m, 5 m, 8 m and 12 m
Although not shown here, the response of the turbocharger was also examined. The locus of the operating point is unchanged in size as the wave period increases (the magnitude of the air mass flow rates and the pressure ratios is largely dependent on the amplitude of the back pressure fluctuations), but small changes in the shape of the locus are apparent. This indicates a change in phase between the mass flow and pressure ratio fluctuations as the wave period changes, and is due to the inertia of the rotor. The phase difference is largest for the shortest wave periods, as would be expected.
UNCLASSIFIED 24

UNCLASSIFIED DSTO-TR-2531
Figure 21 See caption on next page
7. Conclusions
This report has examined the effect of applying a varying back pressure to a turbocharged diesel engine with constant demanded load, using the Ricardo Wave engine modelling software. The varying back pressure applied to the engine is approximately representative of that which would be encountered by a diesel engine in a snorting submarine.
UNCLASSIFIED 25
UNCLASSIFIED DSTO-TR-2531
Figure 21 Non-dimensional fluctuations in a) back pressure, b) engine speed, c) brake torque and
d) fuel mass flow, for a mean back pressure of 1.45 bar absolute, a wave height of 1 m and wave periods from 2 s to 20 s
Initially, the effect of steady state back pressure was examined. As the back pressure increases, the engine must work harder to pump the gases out of the cylinder against the higher pressure. The pressure ratios across the turbocharger compressor and turbine decrease, reducing the mass flow of air through these components and thus the air available to the engine. The exhaust gas temperature increases significantly, requiring the engine output power to be reduced to keep the exhaust temperature within acceptable limits. The fuel flow increases to provide the extra power necessary to overcome the increased pumping losses while maintaining a constant brake power output, and so the
UNCLASSIFIED 26

UNCLASSIFIED DSTO-TR-2531
brake specific fuel consumption increases. These results are consistent with the qualitative description of the effects of back pressure given in [1]. In order to observe the time lags present in the system, the engine response to a step increase in back pressure was examined. It is noted that the engine is a non-linear system, so the results presented in this section are not universally applicable; however the engine response clearly shows the chain of cause and effect. The increase in back pressure immediately reduces the pressure ratio across the turbine causing it to slow down and reduce the mass flow and pressure of the air provided to the cylinders by the compressor, while at the same time increasing the pumping losses. This reduces the brake torque output of the engine, and so, as the demanded load remains constant, the engine decelerates. Finally, the governor responds to the decrease in engine speed and increases the fuel flow rate to compensate. This increases the speed, but the engine overshoots and then oscillates about the new operating point before settling down to steady state operation. Finally, the response of the engine to sinusiodally varying back pressure was examined. The operating point chosen as a baseline was a steady state back pressure of 1.45 bar absolute with a varying back pressure equivalent to a wave height (peak-to-peak) of 1 m with a wave period of 10 s imposed on top. This is approximately equivalent to the back pressure on an engine in a submarine snorting at sea state 3. At this operating point, the response of most parameters is very close to linear, but some non-linearity is present in the locus of the turbocharger operating points. These describe distorted ellipses approximately centred on the steady state operating point. The effect of varying the amplitude of the back pressure fluctuations was examined, and significant non-linearity is apparent in the engine response once the wave height increases above 2 m. Further, the non-linearities vary with the amplitude, as departures from sinusoidal behaviour apparent at some wave heights are no longer present at larger wave heights. The loci described by the turbocharger operating points increase in size and become increasingly distorted, following the overall shape of the maps. These increases are most apparent in the positive half of the cycle (increased pressure ratio and mass flow): the steady state operating point is increasingly further away from the centre of the orbit, towards the negative extreme. Varying the wave period had similar but less extreme effects. Reducing the wave period increased the amplitude of the fluctuations in the response of most of the engine parameters, but for wave periods below 4 s the fuel flow fluctuation amplitude was reduced, most likely due to the finite response time of the speed governor. Increasing the wave period reduced the amplitude of the fluctuations in engine speed and brake torque, but increased the deviation from linear behaviour. Increasing the wave period above approximate 12 s had no further effect on the amplitude of the fuel flow fluctuations. The engine has a speed governor, which attempts to maintain constant engine speed by varying the fuel flow. However, as the governor responds to changes in speed and has a finite response time, it is only able to adjust the fuel flow after a change in speed has
UNCLASSIFIED 27

UNCLASSIFIED DSTO-TR-2531
occurred. As a result, with this engine control strategy, fluctuations in engine speed are an inevitable consequence of fluctuations in the back pressure. Finally, an important point to note is that the exhaust gas temperature increases significantly with increasing back pressure due to the increased power required (to overcome the additional pumping work) and the reduced air flow. In addition, imposed back pressure fluctuations cause large exhaust temperature fluctuations, which further increases the maximum temperature and also induces thermal cycling. These effects lead to increased wear and reduced reliability, and can cause thermal failures. The results show that the engine response to varying back pressure is strongly non-linear, and is dependent on the engine operating point as well as the amplitude and period of the back pressure fluctuations. Wave provides a powerful tool for investigating the behaviour of engines under varying back pressure conditions, as it allows the examination of all engine parameters under arbitrarily applied conditions. Wave also has the capability to model engine control systems, allowing the development of control strategies to mitigate the effects of the varying back pressure. However, an experimental program is required to provide validation of the model before the results obtained can be fully relied on.
8. Future Work
This paper has examined the effects of applying an increased and varying back pressure to a diesel engine. The back pressure applied is approximately representative of that found in submarine diesel engine operation. The engine model used in the simulations was not optimised for submarine operation, and no attempt was made to adjust any of the engine parameters. There is a large amount of future work required to fully understand the problem and to investigate possible methods of improving the performance of turbocharged submarine diesel engines. Possible futures studies include:
The inclusion of a more realistic load model. Experimental validation of the engine behaviour described in this paper. A numerical and experimental investigation of the effect of inlet pressure
excursions, which occur when the sea surface waves become large enough to shut the snort induction mast valve.
An examination of the timescales of the different engine components, with the aim of identifying those components that have timescales of the same order of magnitude as the back pressure fluctuations. This would also allow the conclusions from modelling similar to that in this paper to be extended to engines of different sizes.
Numerical and experimental investigations of the effect of the engine parameters, and their effect on the engine performance under variable back pressure conditions. These parameters include:
o Inlet valve timing, open duration and lift profile, o Exhaust valve timing, open duration and lift profile,
UNCLASSIFIED 28

UNCLASSIFIED DSTO-TR-2531
o Valve overlap, o Injection timing, o Injection profile, o Turbocharger matching, and o Manifold sizing.
Numerical and experimental investigations of methods for improving the performance of the engine under variable back pressure conditions. Possible methods include:
o Optimisation of the governor PID gains, with the aim of reducing the amplitude of the exhaust temperature fluctuations,
o Load control to vary the load as a function of back pressure, o Turbocharger wastegate control, o Turbocharger inlet nozzle control, o Variable valve timing, and o Variable injection timing.
Numerical and experimental investigation of control strategies for handling inlet pressure excursions.
9. Acknowledgements
The author would like to acknowledge the assistance of Owen Tregenza in the preparation of the figures for this paper.
10. References
1. van den Pol, E. Aspects of Submarines, Part IV: The Submarine and the Diesel Engine. 2. van den Pol, E. (1987) The Simulation of the Dynamic Pressure Variations Inside
Snorkeling Submarines. 3. Kirkman, E. T. F. and Hopper, R. A. (1990) Turbocharging for Submarines - A Special
case. In: International Conference on Turbochargers and Turbocharging, IMechE 4. Goodwin, G., McGrath, J. and Bowden, D. (2008) Performance of Turbocharged Diesel
Engines in Ocean-Going Submarines. In: Pacific 2008, International Maritime Conference, Sydney, IMarEST
5. Buckingham, J. and Mann, J. (2010) Multi-Engine Submarine Power Supplies: The Operating Case. In: Pacific 2010, Sydney
6. Marco, J. (2006) Using One Dimensional CFD Techniques to Model the Performance of a Power Plant. In: Pacific 2006, International Maritime Conference, Sydney, IMarEST
7. Jost, V. M. W. (1983) Exhaust Gas Turbocharged Submarine Engines. In: International Symposium on Naval Ships,
8. Swain, E. (1994) Turbocharging the Submarine Diesel Engine. Mechatronics 4 (4) 349-367
UNCLASSIFIED 29

UNCLASSIFIED DSTO-TR-2531
UNCLASSIFIED 30
9. Herrmann, R. (2001) Combined Supercharging System: The Best Fit for Submarines. In: Proceedings of the 2001 Spring Technical Conference of the ASME Internal Combustion Engine Division, Philadelphia, ASME
10. Swain, E. and Elliot, C. (1994) Controlling a Variable-Geometry Turbine Nozzle on a Turbocharger Fitted to a Diesel Engine in a Submarine Environment. In: International Conference on Turbochargers and Turbocharging, IMechE
11. Smith, T. M. and Newman, M. J. (1994) A Variable Geometry Turbocharger for a Submarine Diesel Engine. In: International Conference on Turbochargers and Turbocharging, IMechE
12. Zimmerman, S. (1997) Submarine Technology for the 21st Century. Arlington, Pasha Publications
13. Australia. Department of Defence (2003) DEF (AUST) 5000 ADF Material Requiement Set, Volume 3, Part 4 - Seakeeping. Canberra, RAN
14. Tupper, E. C. (2004) Introduction to Naval Architecture. Oxford, Elsevier 15. Ricardo (2010) Wave 8.2 Help System 16. Heywood, J. B. (1988) Internal Combustion Engine Fundamentals. Singapore, McGraw-
Hill 17. Challen, B. and Baranescu, R. (1999) Diesel Engine Reference Book. 2nd ed. Bath,
Butterworth-Heinemann

Page classification: UNCLASSIFIED
DEFENCE SCIENCE AND TECHNOLOGY ORGANISATION
DOCUMENT CONTROL DATA 1. PRIVACY MARKING/CAVEAT (OF DOCUMENT)
2. TITLE The Effect of Back Pressure on the Operation of a Diesel Engine
3. SECURITY CLASSIFICATION (FOR UNCLASSIFIED REPORTS THAT ARE LIMITED RELEASE USE (L) NEXT TO DOCUMENT CLASSIFICATION) Document (U) Title (U) Abstract (U)
4. AUTHOR(S) Peter Hield
5. CORPORATE AUTHOR DSTO Defence Science and Technology Organisation 506 Lorimer St Fishermans Bend Victoria 3207 Australia
6a. DSTO NUMBER DSTO-TR-2531
6b. AR NUMBER AR-014-968
6c. TYPE OF REPORT Technical Report
7. DOCUMENT DATE February 2011
8. FILE NUMBER 2011/1005601/1
9. TASK NUMBER NAV07/119
10. TASK SPONSOR DGSM
11. NO. OF PAGES 30
12. NO. OF REFERENCES 17
13. DSTO Publications Repository http://dspace.dsto.defence.gov.au/dspace/
14. RELEASE AUTHORITY Chief, Maritime Platforms Division
15. SECONDARY RELEASE STATEMENT OF THIS DOCUMENT
Approved for public release OVERSEAS ENQUIRIES OUTSIDE STATED LIMITATIONS SHOULD BE REFERRED THROUGH DOCUMENT EXCHANGE, PO BOX 1500, EDINBURGH, SA 5111 16. DELIBERATE ANNOUNCEMENT No Limitations 17. CITATION IN OTHER DOCUMENTS Yes 18. DSTO RESEARCH LIBRARY THESAURUS http://web-vic.dsto.defence.gov.au/workareas/library/resources/dsto_thesaurus.shtml Diesel Engines, Submarine Engines, Pressure, Propulsion Systems 19. ABSTRACT The Ricardo Wave engine modelling software has been used to examine the effect of increased back pressure on a turbocharged diesel engine. Steady state and varying back pressure are considered. The results show that high back pressure has a significant adverse effect on the operation of the engine. The response to fluctuating back pressure is strongly non-linear, and depends on the amplitude and period of the fluctuations. For a constant output load, the exhaust gas temperature increases significantly with increasing back pressure, leading to reduced engine reliability. Due to the speed control strategy used on this engine, speed fluctuations are an unavoidable consequence of imposed back pressure fluctuations.
Page classification: UNCLASSIFIED
Related Documents