SYSTEMATIC REVIEW The effect of anaemia and abnormalities of erythrocyte indices on HbA 1c analysis: a systematic review Emma English 1 & Iskandar Idris 1 & Georgina Smith 1 & Ketan Dhatariya 2 & Eric S. Kilpatrick 3 & W. Garry John 4 Received: 7 January 2015 /Accepted: 2 April 2015 /Published online: 21 May 2015 # Springer-Verlag Berlin Heidelberg 2015 Abstract Aims/hypothesis The use of HbA 1c for the diagnosis of diabe- tes is now widely advocated despite caveats to its use. Anaemia is cited as a major confounder to this use; however, the effect of erythrocyte indices and to what degree anaemia influences HbA 1c levels is not known. Methods A systematic electronic database search of MEDLINE, EMBASE, the Cumulative Index to Nursing & Allied Health Literature (CINAHL) and the Cochrane Library was conducted for relevant articles published between January 1990 and May 2014. Included studies had at least one mea- surement of HbA 1c and glucose, and a least one index of haematinic deficiency, involving non-pregnant adults, not known to have diabetes. Results A total of 12 articles from 544 were included. The majority of studies focused on iron deficiency anaemia (IDA) and, in general, demonstrated that the presence of iron deficiency with or without anaemia led to an increase in HbA 1c values compared with controls, with no concomitant rise in glucose indices. Data on the effects of other indices of erythrocyte abnormalities on HbA 1c are limited but show a possible decrease in HbA 1c values with non-iron deficiency forms of anaemia. Conclusions/interpretation HbA 1c is likely to be affected by iron deficiency and IDA with a spurious increase in HbA 1c values; conversely, non-IDA may lead to a decreased HbA 1c value. This may lead to confusion when diagnosing diabetes using HbA 1c . This review clearly identifies the need for more evidence, especially in identifying the types and degrees of anaemia likely to have significant impact on the reliability of HbA 1c . Keywords Anaemia . Diabetes . HbA 1c . Iron deficiency . Systematic review Abbreviations CINAHL Cumulative Index to Nursing & Allied Health Literature FPG Fasting plasma glucose IDA Iron deficiency anaemia IFCC International Federation for Clinical Chemistry and Laboratory Medicine MCH Mean corpuscular haemoglobin MCHC Mean corpuscular haemoglobin concentration MCV Mean corpuscular volume NHANES National Health and Nutrition Examination Survey PCV Packed cell volume RDW Red cell distribution width SIGN Scottish Intercollegiate Guidelines Network TSAT Transferrin saturation Electronic supplementary material The online version of this article (doi:10.1007/s00125-015-3599-3) contains peer-reviewed but unedited supplementary material, which is available to authorised users. * Emma English [email protected] 1 School of Medicine, University of Nottingham, Derby DE22 3DT, UK 2 Elsie Bertram Diabetes Centre, Norfolk and Norwich University Hospitals NHS Foundation Trust, Norwich, UK 3 Department of Clinical Biochemistry, Hull Royal Infirmary, Hull, UK 4 Department of Clinical Biochemistry, Norfolk and Norwich University Hospitals NHS Foundation Trust, Norwich, UK Diabetologia (2015) 58:1409–1421 DOI 10.1007/s00125-015-3599-3

Welcome message from author
This document is posted to help you gain knowledge. Please leave a comment to let me know what you think about it! Share it to your friends and learn new things together.
Transcript

SYSTEMATIC REVIEW
The effect of anaemia and abnormalities of erythrocyte indiceson HbA1c analysis: a systematic review
Emma English1& Iskandar Idris1 & Georgina Smith1
& Ketan Dhatariya2 &
Eric S. Kilpatrick3& W. Garry John4
Received: 7 January 2015 /Accepted: 2 April 2015 /Published online: 21 May 2015# Springer-Verlag Berlin Heidelberg 2015
AbstractAims/hypothesis The use of HbA1c for the diagnosis of diabe-tes is now widely advocated despite caveats to its use.Anaemia is cited as a major confounder to this use; however,the effect of erythrocyte indices and to what degree anaemiainfluences HbA1c levels is not known.Methods A systematic electronic database search ofMEDLINE, EMBASE, the Cumulative Index to Nursing &Allied Health Literature (CINAHL) and the Cochrane Librarywas conducted for relevant articles published between January1990 and May 2014. Included studies had at least one mea-surement of HbA1c and glucose, and a least one index ofhaematinic deficiency, involving non-pregnant adults, notknown to have diabetes.Results A total of 12 articles from 544 were included. Themajority of studies focused on iron deficiency anaemia(IDA) and, in general, demonstrated that the presence of irondeficiency with or without anaemia led to an increase inHbA1c values compared with controls, with no concomitant
rise in glucose indices. Data on the effects of other indices oferythrocyte abnormalities on HbA1c are limited but show apossible decrease in HbA1c values with non-iron deficiencyforms of anaemia.Conclusions/interpretation HbA1c is likely to be affected byiron deficiency and IDA with a spurious increase in HbA1c
values; conversely, non-IDA may lead to a decreased HbA1c
value. This may lead to confusion when diagnosing diabetesusing HbA1c. This review clearly identifies the need for moreevidence, especially in identifying the types and degrees ofanaemia likely to have significant impact on the reliability ofHbA1c.
Keywords Anaemia . Diabetes . HbA1c. Iron deficiency .
Systematic review
AbbreviationsCINAHL Cumulative Index to Nursing & Allied Health
LiteratureFPG Fasting plasma glucoseIDA Iron deficiency anaemiaIFCC International Federation for Clinical Chemistry
and Laboratory MedicineMCH Mean corpuscular haemoglobinMCHC Mean corpuscular haemoglobin concentrationMCV Mean corpuscular volumeNHANES National Health and Nutrition Examination
SurveyPCV Packed cell volumeRDW Red cell distribution widthSIGN Scottish Intercollegiate Guidelines NetworkTSAT Transferrin saturation
Electronic supplementary material The online version of this article(doi:10.1007/s00125-015-3599-3) contains peer-reviewed but uneditedsupplementary material, which is available to authorised users.
* Emma [email protected]
1 School of Medicine, University of Nottingham,Derby DE22 3DT, UK
2 Elsie Bertram Diabetes Centre, Norfolk and Norwich UniversityHospitals NHS Foundation Trust, Norwich, UK
3 Department of Clinical Biochemistry, Hull Royal Infirmary,Hull, UK
4 Department of Clinical Biochemistry, Norfolk and NorwichUniversity Hospitals NHS Foundation Trust, Norwich, UK
Diabetologia (2015) 58:1409–1421DOI 10.1007/s00125-015-3599-3
Introduction
The traditional role of HbA1c analysis has been for assessingglycaemic control in patients with diabetes. The results of sem-inal studies [1, 2] demonstrated that early, intensive glycaemiccontrol could significantly reduce the risk of a range ofdiabetes-related complications, and permitted the establish-ment of precise HbA1c target values for treatment goals [3].
More recently, there has been a move towards the use ofHbA1c for the diagnosis of type 2 diabetes. The WHO and theADA have both advocated the use of HbA1c for diagnosingtype 2 diabetes, at a value of 6.5% (48 mmol/mol) [4, 5].
Further to the recommendations of the WHO, the UK is-sued an expert position statement on the application of theserecommendations in clinical practice in the UK [6]. One keyfactor thought to be a confounder in the use of HbA1c is analtered erythrocyte lifespan, in particular due to anaemia. TheWHO defines anaemia in adults as 120 g/l Hb in non-pregnantwomen and 130 g/l in men [7]. It is widely purported thathaemolytic anaemia can lead to decreased HbA1c values dueto reduced erythrocyte lifespan, and iron deficiency anaemia(IDA) may result in increased HbA1c values due to an elon-gation of the erythrocyte lifespan. However, it is not known towhat degree alterations in erythrocyte indices affect HbA1c
values especially around the diagnostic cut point of 6.5%(48 mmol/mol) or the degree of abnormality severity requiredto result in a significant change. With approximately 29% ofnon-pregnant women worldwide having anaemia in 2011 [8],this translates to a significant number of people where the useof HbA1c for diagnosis of diabetes may be precluded.
Since the publication of the recommendations, there hasbeen a demand for clarity on this topic. The key questionsasked are: ‘At what level of anaemia should I not use HbA1c
for diagnosis?’ and ‘Should I routinely screen patients foranaemia when using HbA1c for diagnosis and if so, what testshould I use?’
This systematic review aims to address the above ques-tions by assessing the available evidence on the impact ofabnormalities of erythrocyte indices and anaemia, onHbA1c levels around the diagnostic cut off point of 6.5%(48 mmol/mol).
Methods
This systematic review is registered on Prospero (registrationno. CRD42013005251). Approval of an ethics committee wasnot required.
Study identification
An electronic database search for relevant articles publishedbetween January 1990 and May 2014 was conducted using
the following databases: MEDLINE, EMBASE, CumulativeIndex to Nursing & Allied Health Literature (CINAHL) andThe Cochrane Library.
The search was carried out using a combination of key-words and MESH terms or EMtree terms depending on theparticular database (see Electronic Supplementary Material[ESM] Methods for details).
In general, the search strategy consisted of: (1) HbA1c/glycated haemoglobin; (2) iron deficiency; (3) folate, B12deficiency; and (4) anaemia.
Study selection
Results from all searches were combined and duplicateswere removed. Two investigators (EE and GS) evaluatedthe title and abstract of each reference identified by thesearch. Inclusion criteria are fully detailed in Table 1;for inclusion, all studies required at least one HbA1c
value with fasting plasma glucose (FPG) or OGTTvalues and erythrocyte and/or iron indices measured.This was to ensure that any changes in HbA1c valuewere due to changes in the erythrocytes and not dueto changes in glycaemia. Any that were clearly irrele-vant were removed and the full texts of remaining arti-cles were retrieved. Upon further scrutiny of the fulltexts, those that did not meet the inclusion criteria weresubsequently excluded. The reference lists of includedarticles were reviewed in order to identify any furtherarticles of relevance to the subject area, and that metthe inclusion criteria.
Data extraction
Two investigators extracted the results from each articleusing a data extraction form based on the pre-defined studyinclusion criteria (Table 1). Any disagreement regardingstudy selection was resolved by means of consensus, involv-ing a third investigator, according to a-priori agreed criteria.The main categories extracted included: author, year, title,study overview, patient characteristics, definition of diabetes,definition of anaemia and key conclusions, as detailed inTable 2 and ESM Table 2.
Quality assessment of included articles
The methodological quality of each study was indepen-dently rated by two investigators (EE and GS—who werenot blinded to author, journal or institution) according tothe Scottish Intercollegiate Guidelines Network (SIGN)criteria [9]. Quality assessment was not used as an exclu-sion criterion, though articles conducted to high standardsin minimising the risk of confounding were noted (ESMTable 1).
1410 Diabetologia (2015) 58:1409–1421

Data analysis
Variation within study designs, and heterogeneity of results,meant that the data was unsuitable for meta-analysis. Instead, the existing analyses described in the includedarticles were extracted and reported in a systematic format,as a narrative synthesis of the main outcomes and results ofeach study. In line with current recommendations [10, 11], theHbA1c units in the main text have been converted to SI unitsusing the master equation.
Results
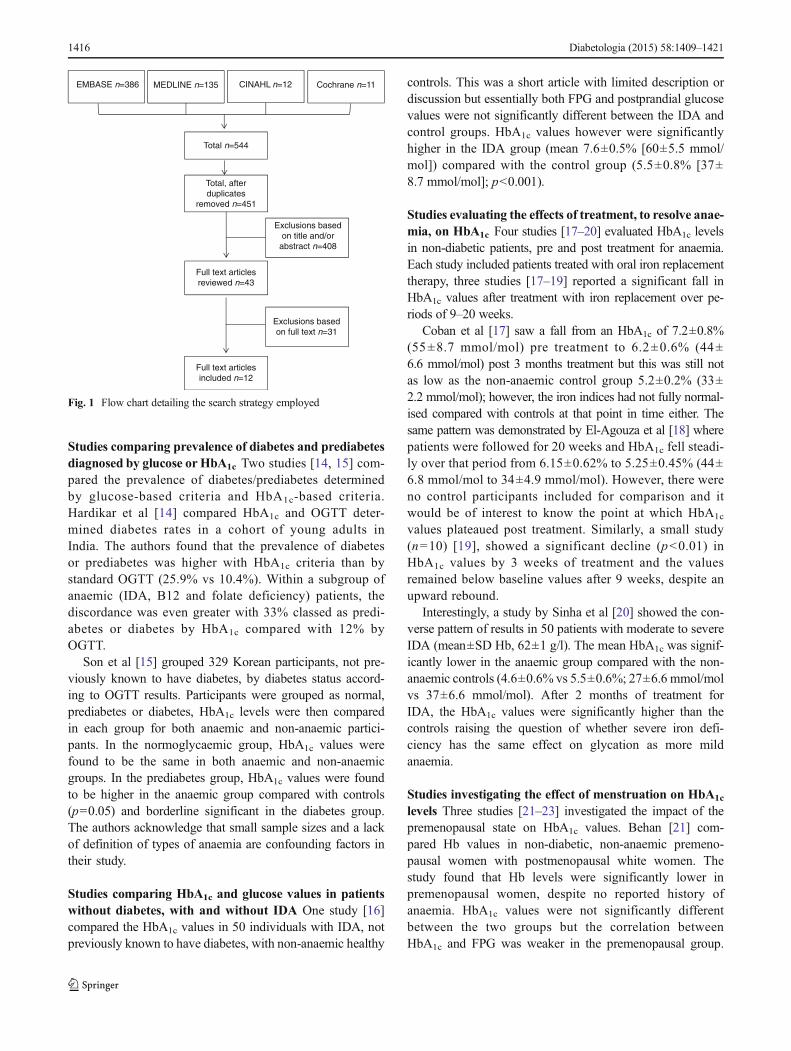
The electronic database searches identified 451 potentiallyrelevant, unique articles. Titles/abstracts of the 451 articleswere reviewed and 408 were excluded based on evaluationof the title and/or abstract. The remaining 43 full text articleswere reviewed, 31 were excluded upon further reading. Theresidual 12 were approved and quality assessed using theSIGN criteria. The main reasons for exclusion were irrelevantor incomplete data when compared with the inclusion criteria.No additional articles were identified through review of thereference lists (see Fig. 1 for flow chart).
Narrative analysis of included studies
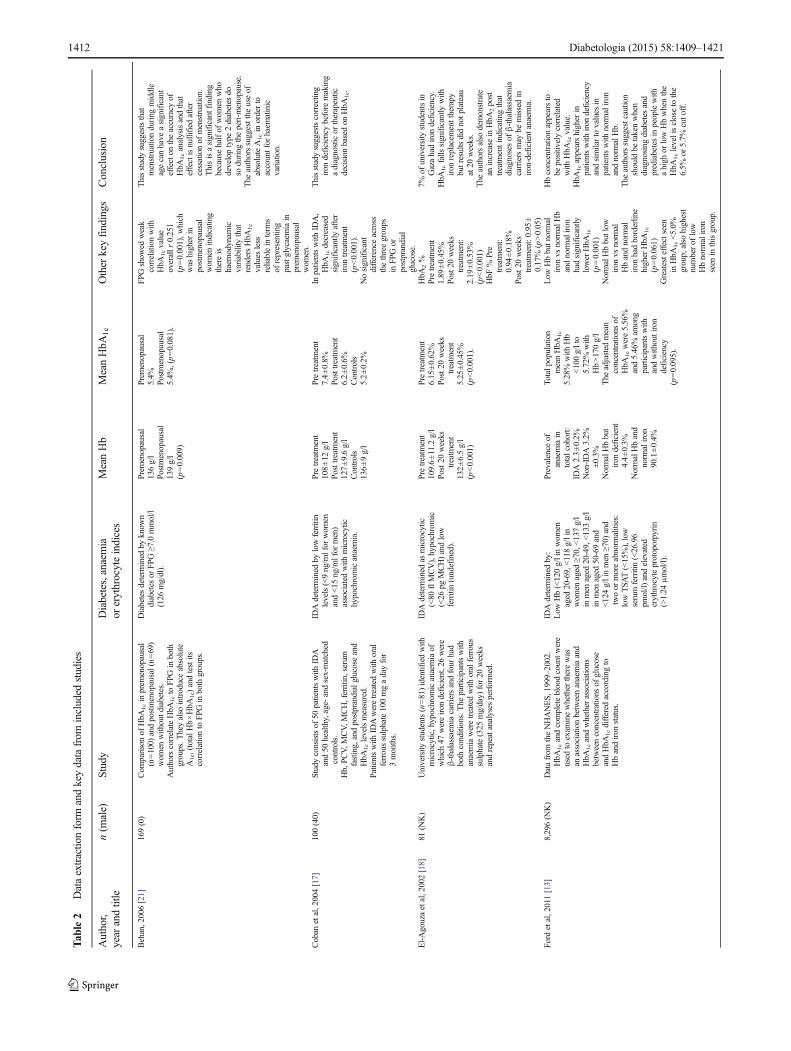
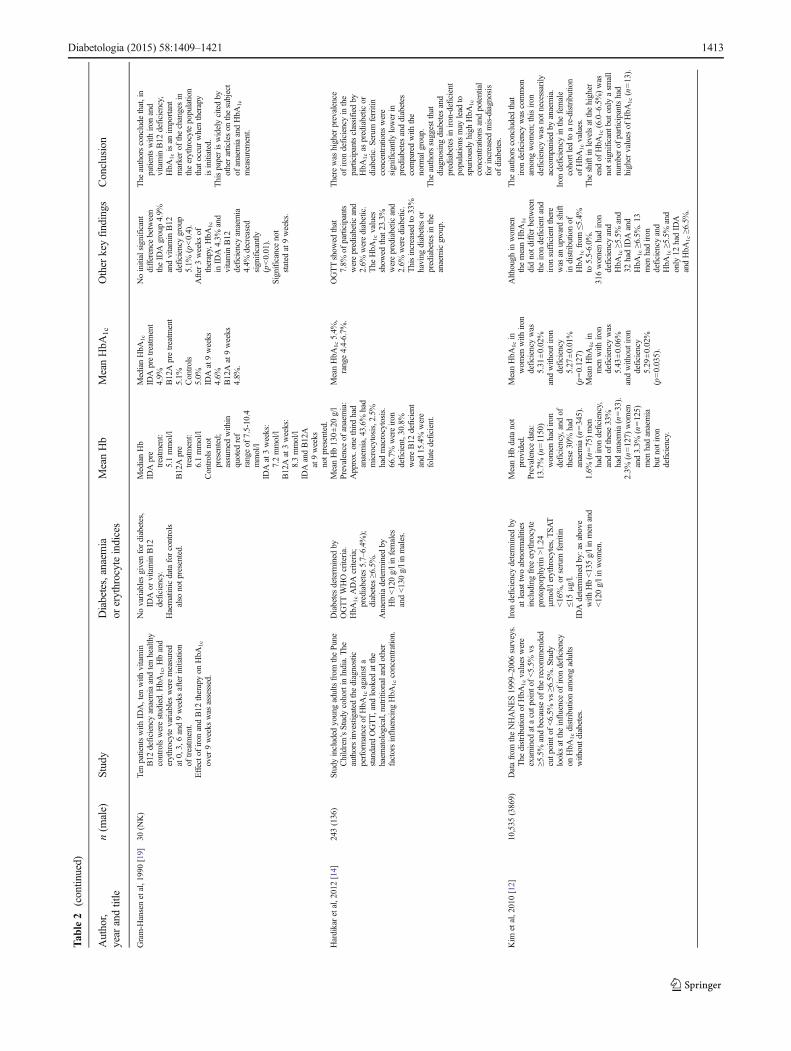
Cross-sectional studies in patients with and withoutdiabetes Kim et al [12] investigated the influence of irondeficiency on HbA1c distribution among adults who werenot known to have diabetes, over 7 years of the NationalHealth and Nutrition Examination Survey (NHANES). Ofthe 6,666 female participants, 13.7% had iron deficiency and
30% of these had IDA. A much lower proportion of males(1.6%) had iron deficiency and 33% of these had IDA. WhenHbA1c values in women were adjusted for age and ethnicity,the difference between iron deficient and non-iron deficientbecame significant (5.33% vs 5.27% [35 mmol/mol vs34 mmol/mol], p=0.002). The authors found that iron defi-ciency in women of reproductive age was associated with ashift in HbA1c from <5.5% to 5.5–6.0% (<37 mmol/mol to37–42 mmol/mol), although no association was found athigher levels, possibly owing to the lower number of partici-pants in those groups. After adjusting for age and ethnicity, theauthors concluded that HbA1c was higher in iron-deficientindividuals and was likely to result in an upward shift ofHbA1c distributions.
Ford et al [13] evaluated 1999–2002 NHANES data sets butincluded analysis of both IDA and non-IDA in participants bothwith and without diabetes. They found that non-diabetic partic-ipants with low Hb but normal iron levels had lower HbA1c
values (5.16% [33 mmol/mol]) than those with normal Hb andnormal iron levels (5.31% [35 mmol/mol], p<0.001). In con-trast, those with normal Hb but low iron values had borderlinehigher HbA1c values than normal participants (5.39% [35mmol/mol], p=0.061). In addition, in all participants without diabetes,the HbA1c values increased with increasing Hb levels rangingfrom a mean HbA1c of 5.18% (33 mmol/mol) at Hb <100 g/lthrough to 5.50% (37mmol/mol) with Hb >170 g/l. The authorsadvocate caution when interpreting HbA1c values near diagnos-tic cut points when Hb levels are high or low. The study waslimited by low numbers of iron deficiency and/or anaemia casesand few severe cases but the authors suggest that the likelyimpact of haemoglobin concentration on HbA1c values was anapproximate change of HbA1c 0.2% (2.2 mmol/mol), betweenthe extremes of Hb levels.
Table 1 Inclusion criteria for the systematic review
Inclusion criteria Description
Population All non-pregnant adults (≥18 years), without known diabetes (HbA1c should not be used for diagnosis of diabetes in childrenor pregnancy). Participants should have at least one measurement of HbA1c and measure of glucose, as well as at least oneindex of anaemia or haematinic deficiency. A range of definitions of anaemia were used in the studies detailed in thisreview, with some basing the diagnosis on Hb levels and others refining this further based on indices such as MCV, MCH,ferritin and TSAT levels.
Intervention The use of HbA1c for the diagnosis of diabetes or comparison of HbA1c in participants with and without anaemia or otherabnormalities of erythrocyte indices.
Comparisons HbA1c values ideally will be compared with FPG or OGTTs and values compared between participants with and without anaemiaor erythrocyte indices abnormalities. Whilst some studies may include glucose values, others only report that all participantshad values below a set point.
Outcomes Changes in HbA1c values, compared with glucose indices, with decreased haemoglobin concentration. Changes in HbA1c,compared with glucose indices, with other erythrocyte indices.
Study design Cohort studies evaluating the association between HbA1c levels and anaemia or other erythrocyte indices with or without anaemiawere included. Case report, case–control, case series studies, letters and commentaries were excluded.
Search limits Adults (aged ≥18 years); English language; humans; publication year 1990–current. HbA1c was not widely used in routine clinicalpractice and methods showed very high inter and intra-laboratory variation prior to 1990. Identification of grey literatureincluding unpublished data, conference reports and presentations was not attempted.
Diabetologia (2015) 58:1409–1421 1411
Tab
le2
Dataextractio
nform
andkeydatafrom
included
studies
Author,
year
andtitle
n(m
ale)
Study
Diabetes,anaemia
orerythrocyteindices
MeanHb
MeanHbA
1c
Other
keyfindings
Conclusion
Behan,2006[21]
169(0)
Com
parisonof
HbA
1cin
prem
enopausal
(n=100)
andpostmenopausal(n=69)
wom
enwithoutd
iabetes.
AuthorscorrelateHbA
1cto
FPG
inboth
groups.T
heyalso
introduceabsolute
A1c,(totalH
b×HbA
1c)andtestits
correlationto
FPGin
both
groups.
Diabetesdeterm
ined
byknow
ndiabetes
orFP
G≥7
.0mmol/l
(126
mg/dl).
Prem
enopausal
136g/l
Postmenopausal
139g/l
(p=0.009)
Prem
enopausal
5.4%
Postmenopausal
5.4%
,(p=0.081).
FPGshow
edweak
correlationwith
HbA
1cvalue
overallr
0.251
(p=0.001),w
hich
was
higherin
postmenopausal
wom
enindicating
thereis
haem
odynam
icvariability
that
rendersHbA
1c
values
less
reliablein
term
sof
representing
pastglycaemiain
prem
enopausal
wom
en.
Thisstudysuggeststhat
menstruationduring
middle
agecanhave
asignificant
effecton
theaccuracy
ofHbA
1canalysisandthat
effectisnullified
after
cessationof
menstruation.
Thisisasignificantfinding
becausehalfof
wom
enwho
developtype
2diabetes
doso
during
theperi-m
enopause.
The
authorssuggestthe
useof
absoluteA1cin
orderto
accountfor
haem
atinic
variation.
Coban
etal,2004[17]
100(40)
Studyconsistsof
50patientswith
IDA
and50
healthy,age-andsex-matched
controls.
Hb,PC
V,M
CV,M
CH,ferritin,serum
fasting,andpostprandialglucoseand
HbA
1clevelsmeasured.
Patientswith
IDAweretreatedwith
oral
ferroussulphate100mgadayfor
3months.
IDAdeterm
ined
bylowferritin
levels(<9ng/m
lfor
wom
enand<15
ng/m
lfor
men)
associated
with
microcytic
hypochromicanaemia.
Pretreatm
ent
108±12
g/l
Posttreatm
ent
127±9.6g/l
Controls
136±9g/l
Pretreatm
ent
7.4±0.8%
Posttreatm
ent
6.2±0.6%
Controls
5.2±0.2%
Inpatientswith
IDA,
HbA
1cdecreased
significantly
after
iron
treatm
ent
(p<0.001).
Nosignificant
difference
across
thethreegroups
inFP
Gor
postprandial
glucose.
Thisstudysuggestscorrecting
iron
deficiency
beforemaking
adiagnosticor
therapeutic
decision
basedon
HbA
1c.
El-Agouzaetal,2002[18]
81(N
K)
University
students(n=81)identifiedwith
microcytic,hypochrom
icanaemiaof
which
47wereiron
deficient,26
were
β-thalassaemiacarriersandfour
had
both
conditions.The
participantswith
anaemiaweretreatedwith
oralferrous
sulphate(325
mg/day)
for20
weeks
andrepeatanalyses
performed.
IDAdeterm
ined
asmicrocytic
(<80
flMCV),hypochromic
(<26
pgMCH)andlow
ferritin(undefined).
Pretreatm
ent
109.6±11.2g/l
Post20
weeks
treatment
132±6.5g/l
(p<0.001)
Pretreatm
ent
6.15
±0.62%
Post20
weeks
treatm
ent
5.25
±0.45%
(p<0.001).
HbA
2%
Pretreatm
ent
1.89
±0.45%
Post20
weeks
treatm
ent:
2.19
±0.53%
(p<0.001)
HbF
%Pre
treatm
ent:
0.94
±0.18%
Post20
weeks
treatm
ent:0.95
±0.17%
(p>0.05)
7%of
university
studentsin
Gazahadiron
deficiency.
HbA
1cfalls
significantly
with
iron
replacem
enttherapy
butresultsdidnotp
lateau
at20
weeks.
The
authorsalso
demonstrate
anincrease
inHbA
2post
treatm
entindicatingthat
diagnosesof
β-thalassaemia
carriersmay
bemissedin
iron-deficient
anaemia.
Ford
etal,2011[13]
8,296(N
K)
Datafrom
theNHANES,
1999–2002.
HbA
1candcompletebloodcountw
ere
used
toexam
inewhethertherewas
anassociationbetweenanaemiaand
HbA
1candwhetherassociations
betweenconcentrations
ofglucose
andHbA
1cdiffered
accordingto
Hbandiron
status.
IDAdeterm
ined
by:
Low
Hb(<120g/linwom
enaged
20-69,<118g/lin
wom
enaged
≥70,<137g/l
inmen
aged
20-49,<133g/l
inmen
aged
50-69and
<124g/linmen
≥70)
and
twoor
moreabnorm
alities:
lowTSA
T(<15%),low
serum
ferritin(<26.96
pmol/l)
andelevated
erythrocyteprotoporpyrin
(>1.24
μmol/l).
Prevalence
ofanaemiain
totalcohort:
IDA2.3±0.2%
Non-IDA3.2%
±0.3%
NormalHbbut
iron
deficient
4.4±0.3%
NormalHband
norm
aliron
90.1±0.4%
Totalp
opulation
meanHbA
1c
5.28%
with
Hb
<100g/lto
5.72%
with
Hb>170g/l
The
adjusted
mean
concentrations
ofHbA
1cwere5.56%
and5.46%
among
participantswith
andwithoutiron
deficiency
(p=0.095).
Low
Hbbutn
ormal
iron
vsnorm
alHb
andnorm
aliron
hadsignificantly
lowerHbA
1c
(p=0.001)
NormalHbbutlow
iron
vsnorm
alHbandnorm
aliron
hadborderline
higherHbA
1c
(p=0.061)
Greatesteffectseen
inHbA
1c<5.0%
group;
also
highest
numberof
low
Hbnorm
aliron
seen
inthisgroup.
Hbconcentrationappearsto
bepositivelycorrelated
with
HbA
1cvalue.
HbA
1cappearshigherin
patientswith
iron
deficiency
andsimilarto
values
inpatientswith
norm
aliron
andnorm
alHb.
The
authorssuggestcaution
should
betakenwhen
diagnosing
diabetes
and
prediabetesin
peoplewith
ahigh
orlowHbwhenthe
HbA
1cleveliscloseto
the
6.5%
or5.7%
cuto
ff.
1412 Diabetologia (2015) 58:1409–1421
Tab
le2
(contin
ued)
Author,
year
andtitle
n(m
ale)
Study
Diabetes,anaemia
orerythrocyteindices
MeanHb
MeanHbA
1c
Other
keyfindings
Conclusion
Gram-H
ansenetal,1990[19]
30(N
K)
Tenpatientswith
IDA,ten
with
vitamin
B12
deficiency
anaemiaandtenhealthy
controlswerestudied.HbA
1c,Hband
erythrocytevariablesweremeasured
at0,3,6and9weeks
afterinitiation
oftreatm
ent.
Effecto
firon
andB12
therapyon
HbA
1c
over9weeks
was
assessed.
Novariablesgivenfordiabetes,
IDAor
vitamin
B12
deficiency.
Haematinicdataforcontrols
also
notp
resented.
MedianHb
IDApre
treatm
ent:
5.1mmol/l
B12Apre
treatm
ent:
6.1mmol/l
Controlsnot
presented;
assumed
within
quoted
ref
rangeof
7.5-10.4
mmol/l
IDAat3weeks:
7.2mmol/l
B12Aat3weeks:
8.3mmol/l
IDAandB12A
at9weeks
notp
resented.
MedianHbA
1c
IDApretreatm
ent
4.9%
B12Apretreatment
5.1%
Controls
5.0%
IDAat9weeks
4.6%
B12Aat9weeks
4.8%
.
Noinitialsignificant
difference
between
theID
Agroup4.9%
andvitamin
B12
deficiency
group
5.1%
(p<0.4).
After3weeks
oftherapy,HbA
1c
inID
A4.3%
and
vitamin
B12
deficiency
anaemia
4.4%
decreased
significantly
(p<0.01).
Significance
not
stated
at9weeks.
The
authorsconclude
that,in
patientswith
iron
and
vitamin
B12
deficiency,
HbA
1cisan
important
markerof
thechangesin
theerythrocytepopulation
thatoccurwhentherapy
isinitiated.
Thispaperiswidelycitedby
otherarticleson
thesubject
ofanaemiaandHbA
1c
measurement.
Hardikaretal,2012[14]
243(136)
Studyincluded
youngadultsfrom
thePu
neChildren’sStudycohortin
India.The
authorsinvestigated
thediagnostic
performance
ofHbA
1cagainsta
standard
OGTT,
andlooked
atthe
haem
atological,nutritionaland
other
factorsinfluencingHbA
1cconcentration.
Diabetesdeterm
ined
byOGTTWHOcriteria.
HbA
1cADAcriteria;
prediabetes5.7–6.4%
);diabetes
≥6.5%.
Anaem
iadeterm
ined
byHb<120g/linfemales
and<130g/linmales.
MeanHb130±20
g/l
Prevalence
ofanaemia:
Approx.onethirdhad
anaemia,43.6%
had
microcytosis,2.5%
hadmacrocytosis.
66.7%
wereiron
deficient,30.8%
wereB12
deficient
and15.4%
were
folatedeficient.
MeanHbA
1c5.4%
,range4.4-6.7%
.OGTTshow
edthat
7.8%
ofparticipants
wereprediabetic
and
2.6%
werediabetic.
The
HbA
1cvalues
show
edthat23.3%
wereprediabetic
and
2.6%
werediabetic.
Thisincreasedto
33%
having
diabetes
orprediabetesin
the
anaemicgroup.
Therewas
higherprevalence
ofiron
deficiency
inthe
participantsclassified
byHbA
1cas
prediabetic
ordiabetic.S
erum
ferritin
concentrations
were
significantly
lowerin
prediabetesanddiabetes
comparedwith
the
norm
algroup.
The
authorssuggestthat
diagnosing
diabetes
and
prediabetesin
iron-deficient
populatio
nsmay
lead
tospuriously
high
HbA
1c
concentrations
andpotential
forincreasedmis-diagnosis
ofdiabetes.
Kim
etal,2010[12]
10,535
(3869)
Datafrom
theNHANES1999–2006surveys.
The
distributionof
HbA
1cvalues
were
exam
ined
atacutp
ointof
<5.5%
vs≥5
.5%
andbecauseof
therecommended
cutp
oint
of<6.5%
vs≥6
.5%.S
tudy
looksattheinfluenceof
iron
deficiency
onHbA
1cdistributionam
ongadults
withoutd
iabetes.
Iron
deficiency
determ
ined
byatleasttwoabnorm
alities
includingfree
erythrocyte
protoporphyrin
>1.24
μmol/lerythrocytes,T
SAT
<16%,orserum
ferritin
≤15μg/l.
IDAdeterm
ined
by:asabove
with
Hb<135g/linmen
and
<120g/linwom
en.
MeanHbdatanot
provided.
Prevalence
data:
13.7%
(n=1150)
wom
enhadiron
deficiency,and
ofthese30%
had
anaemia(n=345).
1.6%
(n=75)men
hadiron
deficiency,
andof
these33%
hadanaemia(n=33).
2.3%
(n=127)
wom
enand3.3%
(n=125)
men
hadanaemia
butn
otiron
deficiency.
MeanHbA
1cin
wom
enwith
iron
deficiency
was
5.31
±0.02%
andwithoutiron
deficiency
5.27
±0.01%
(p=0.127)
MeanHbA
1cin
men
with
iron
deficiency
was
5.43
±0.06%
andwithoutiron
deficiency
5.29
±0.02%
(p=0.035).
Although
inwom
enthemeanHbA
1c
didnotd
ifferbetween
theiron
deficientand
iron
sufficient
there
was
anupwardshift
indistributionof
HbA
1cfrom
≤5.4%
to5.5-6.0%
.316wom
enhadiron
deficiency
and
HbA
1c≥5
.5%
and
32hadID
Aand
HbA
1c≥6
.5%.13
men
hadiron
deficiency
and
HbA
1c≥5
.5%
and
only
12hadID
AandHbA
1c≥6
.5%.
The
authorsconcludedthat
iron
deficiency
was
common
amongwom
en;thisiron
deficiency
was
notn
ecessarily
accompanied
byanaemia.
Iron
deficiency
inthefemale
cohortledto
are-distribution
ofHbA
1cvalues.
The
shiftinlevelsatthehigher
endof
HbA
1c(6.0–6.5%)was
notsignificant
buto
nlyasm
all
numberof
participantshad
highervalues
ofHbA
1c(n=13).
Diabetologia (2015) 58:1409–1421 1413
Tab
le2
(contin
ued)
Author,
year
andtitle
n(m
ale)
Study
Diabetes,anaemia
orerythrocyteindices
MeanHb
MeanHbA
1c
Other
keyfindings
Conclusion
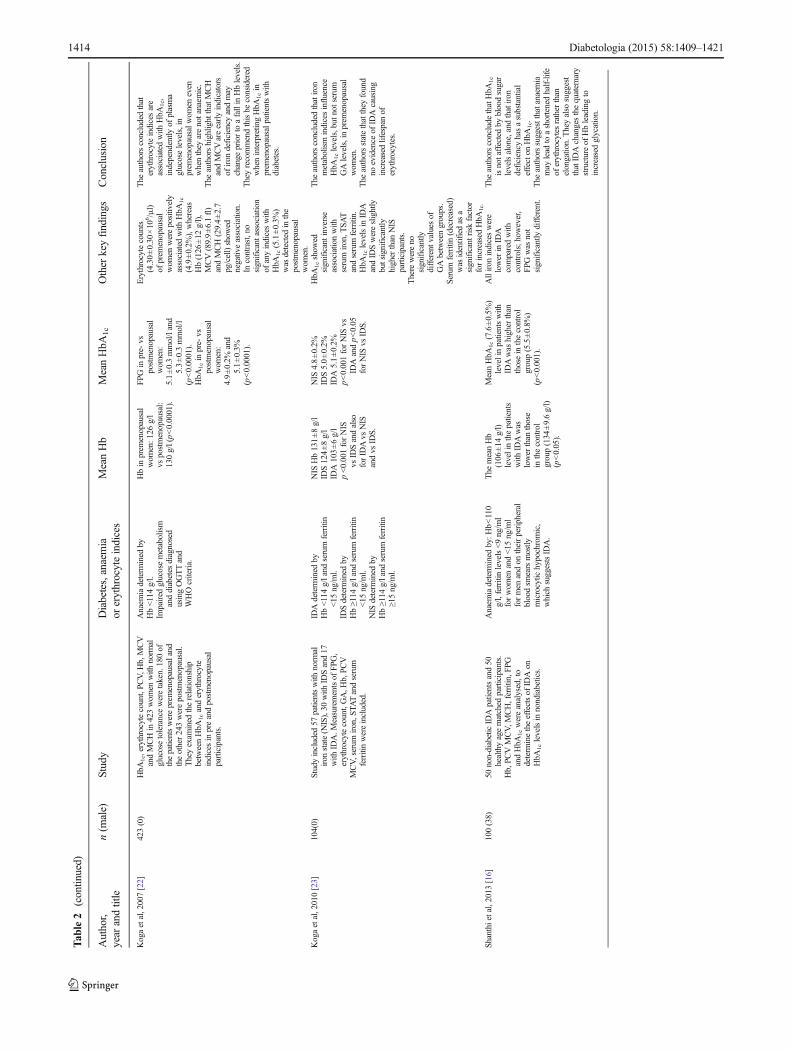
Kogaetal,2007[22]
423(0)
HbA
1c,erythrocytecount,PCV,H
b,MCV
andMCHin
423wom
enwith
norm
alglucosetoleranceweretaken.180of
thepatientswereprem
enopausaland
theother243werepostmenopausal.
Theyexam
ined
therelationship
betweenHbA
1canderythrocyte
indicesin
preandpostmenopausal
participants.
Anaem
iadeterm
ined
byHb<114g/l.
Impaired
glucosemetabolism
anddiabetes
diagnosed
usingOGTTand
WHOcriteria.
Hbin
prem
enopausal
wom
en:1
26g/l
vspostmenopausal:
130g/l(p<0.0001).
FPGin
pre-vs
postmenopausal
wom
en:
5.1±0.3mmol/land
5.3±0.3mmol/l
(p<0.0001).
HbA
1cin
pre-vs
postmenopausal
wom
en:
4.9±0.2%
and
5.1±0.3%
(p<0.0001).
Erythrocytecounts
(4.30±0.30
×10
6 /μl)
ofprem
enopausal
wom
enwerepositively
associated
with
HbA
1c
(4.9±0.2%
),whereas
Hb(126
±12
g/l),
MCV(89.9±6.1fl)
andMCH(29.4±2.7
pg/cell)show
ednegativeassociation.
Incontrast,no
significantassociation
ofanyindiceswith
HbA
1c(5.1±0.3%
)was
detected
inthe
postmenopausal
wom
en.
The
authorsconcludedthat
erythrocyteindicesare
associated
with
HbA
1c,
independently
ofplasma
glucoselevels,in
prem
enopausalw
omen
even
whenthey
arenotanaem
ic.
The
authorshighlight
thatMCH
andMCVareearlyindicators
ofiron
deficiency
andmay
change
priorto
afallin
Hblevels.
Theyrecommendthisbe
considered
wheninterpretingHbA
1cin
prem
enopausalp
atientswith
diabetes.
Kogaetal,2010[23]
104(0)
Studyincluded
57patientswith
norm
aliron
state(N
IS),30
with
IDSand17
with
IDA.M
easurementsof
FPG,
erythrocytecount,GA,H
b,PCV
MCV,serum
iron,S
TATandserum
ferritinwereincluded.
IDAdeterm
ined
byHb<114g/land
serum
ferritin
<15
ng/m
l.ID
Sdeterm
ined
byHb≥114
g/land
serum
ferritin
<15
ng/m
l.NIS
determ
ined
byHb≥114
g/land
serum
ferritin
≥15ng/m
l.
NIS
Hb131±8g/l
IDS124±8g/l
IDA103±6g/l
p<0.001forNIS
vsID
Sandalso
forID
Avs
NIS
andvs
IDS.
NIS
4.8±0.2%
IDS5.0±0.2%
IDA5.1±0.2%
p<0.001forNIS
vsID
Aandp<0.05
forNIS
vsID
S.
HbA
1cshow
edsignificantinverse
associationwith
serum
iron,T
SAT
andserum
ferritin.
HbA
1clevelsin
IDA
andID
Swereslightly
butsignificantly
higherthan
NIS
participants.
Therewereno
significantly
differentv
aluesof
GAbetweengroups.
Serum
ferritin(decreased)
was
identifiedas
asignificantriskfactor
forincreasedHbA
1c.
The
authorsconcludedthatiron
metabolism
indicesinfluence
HbA
1clevels,but
notserum
GAlevels,inprem
enopausal
wom
en.
The
authorsstatethatthey
found
noevidence
ofID
Acausing
increasedlifespanof
erythrocytes.
Shanthietal,2013
[16]
100(38)
50non-diabeticID
Apatientsand50
healthyagematched
participants.
Hb,PC
VMCV,M
CH,ferritin,F
PGandHbA
1cwereanalysed,to
determ
inetheeffectsof
IDAon
HbA
1clevelsin
nondiabetics.
Anaem
iadeterm
ined
by:H
b<110
g/l,ferritinlevels<9ng/m
lforwom
enand<15
ng/m
lformen
andon
theirperipheral
bloodsm
earsmostly
microcytic
hypochromic,
which
suggestsID
A.
The
meanHb
(106
±14
g/l)
levelinthepatients
with
IDAwas
lowerthan
those
inthecontrol
group(134
±9.6g/l)
(p<0.05).
MeanHbA
1c(7.6±0.5%
)levelinpatientswith
IDAwas
higherthan
thosein
thecontrol
group(5.5±0.8%
)(p<0.001).
Alliron
indiceswere
lowerin
IDA
comparedwith
controls;h
owever,
FPG
was
not
significantly
different.
The
authorsconclude
thatHbA
1c
isnotaffectedby
bloodsugar
levelsalone,andthatiron
deficiency
hasasubstantial
effecton
HbA
1c.
The
authorssuggestthatanaem
iamay
lead
toashortenedhalf-life
oferythrocytes
ratherthan
elongation.Theyalso
suggest
thatID
Achangesthequaternary
structureof
Hbleadingto
increasedglycation.
1414 Diabetologia (2015) 58:1409–1421
Tab
le2
(contin
ued)
Author,
year
andtitle
n(m
ale)
Study
Diabetes,anaemia
orerythrocyteindices
MeanHb
MeanHbA
1c
Other
keyfindings
Conclusion
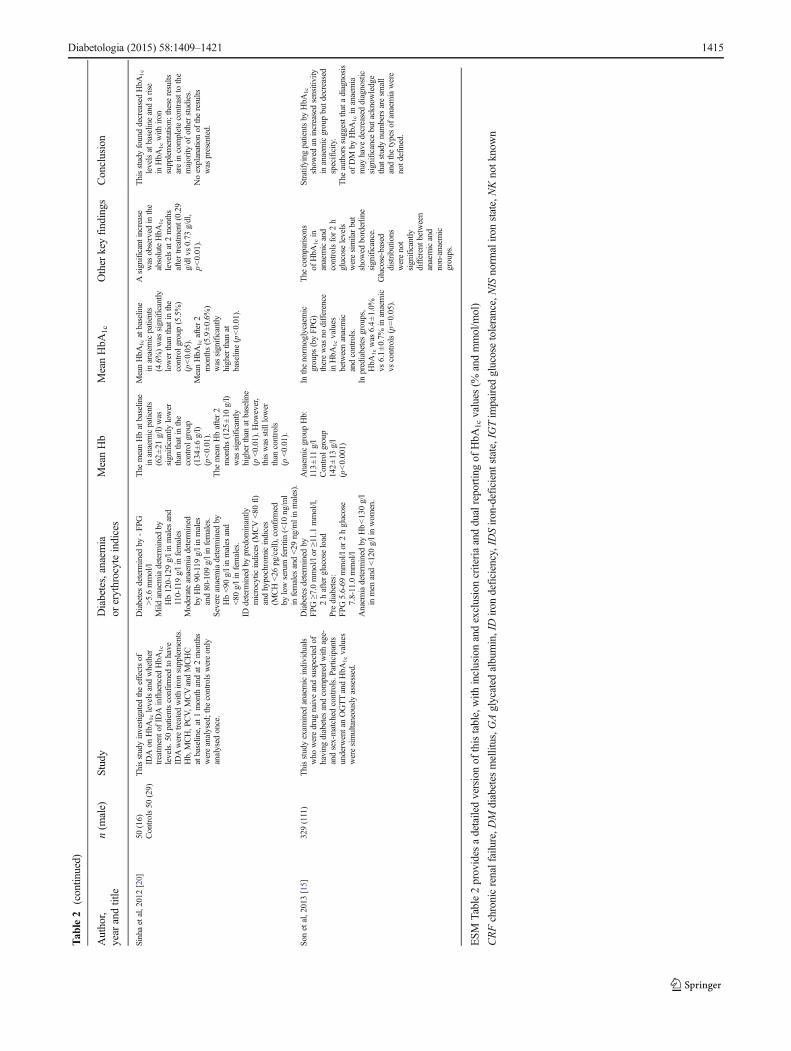
Sinhaetal,2012[20]
50(16)
Controls50
(29)
Thisstudyinvestigated
theeffectsof
IDAon
HbA
1clevelsandwhether
treatm
ento
fID
Ainfluenced
HbA
1c
levels.50patientsconfirmed
tohave
IDAweretreatedwith
iron
supplements.
Hb,MCH,P
CV,M
CVandMCHC
atbaseline,at1month
andat2months
wereanalysed;the
controlswereonly
analysed
once.
Diabetesdeterm
ined
by-FP
G>5.6mmol/l
Mild
anaemiadeterm
ined
byHb120-129g/linmales
and
110-119g/linfemales
Moderateanaemiadeterm
ined
byHb90-119
g/linmales
and80-109
g/linfemales.
Severeanaemiadeterm
ined
byHb<90
g/linmales
and
<80
g/linfemales.
IDdeterm
ined
bypredom
inantly
microcytic
indices(M
CV<80
fl)
andhypochromicindices
(MCH<26
pg/cell),confirm
edby
lowserum
ferritin(<10
ng/m
lin
females
and<29
ng/m
linmales).
The
meanHbatbaseline
inanaemicpatients
(62±21
g/l)was
significantly
lower
than
thatin
the
controlg
roup
(134
±6g/l)
(p<0.01).
The
meanHbafter2
months(125
±10
g/l)
was
significantly
higherthan
atbaseline
(p<0.01).How
ever,
thiswas
still
lower
than
controls
(p<0.01).
MeanHbA
1catbaseline
inanaemicpatients
(4.6%)was
significantly
lowerthan
thatin
the
controlg
roup
(5.5%)
(p<0.05).
MeanHbA
1cafter2
months(5.9±0.6%
)was
significantly
higherthan
atbaseline(p<0.01).
Asignificantincrease
was
observed
inthe
absoluteHbA
1c
levelsat2months
aftertreatm
ent(0.29
g/dl
vs0.73
g/dl,
p<0.01).
ThisstudyfounddecreasedHbA
1c
levelsatbaselineandarise
inHbA
1cwith
iron
supplementation;
theseresults
arein
completecontrastto
the
majority
ofotherstudies.
Noexplanationof
theresults
was
presented.
Sonetal,2013[15]
329(111)
Thisstudyexam
ined
anaemicindividuals
who
weredrug
naiveandsuspectedof
having
diabetes
andcomparedwith
age-
andsex-matched
controls.P
articipants
underw
entanOGTTandHbA
1cvalues
weresimultaneouslyassessed.
Diabetesdeterm
ined
byFPG
≥7.0mmol/lor
≥11.1mmol/l,
2hafterglucoseload
Prediabetes:
FPG
5.6-69
mmol/lor
2hglucose
7.8-11.0mmol/l
Anaem
iadeterm
ined
byHb<130g/l
inmen
and<120g/linwom
en.
Anaem
icgroupHb:
113±11
g/l
Control
group
142±13
g/l
(p<0.001)
Inthenorm
oglycaem
icgroups
(byFPG
)therewas
nodifference
inHbA
1cvalues
betweenanaemic
andcontrols.
Inprediabetesgroups,
HbA
1cwas
6.4±1.0%
vs6.1±0.7%
inanaemic
vscontrols(p=0.05).
The
comparisons
ofHbA
1cin
anaemicand
controlsfor2h
glucoselevels
weresimilarbut
show
edborderline
significance.
Glucose-based
distributions
werenot
significantly
differentb
etween
anaemicand
non-anaemic
groups.
Stratifying
patientsby
HbA
1c
show
edan
increasedsensitivity
inanaemicgroupbutd
ecreased
specificity.
The
authorssuggestthata
diagnosis
ofDM
byHbA
1cin
anaemia
may
have
decreaseddiagnostic
significance
butacknowledge
thatstudynumbersaresm
all
andthetypesof
anaemiawere
notd
efined.
ESM
Table2provides
adetailedversionof
thistable,with
inclusionandexclusioncriteriaanddualreportingof
HbA
1cvalues
(%andmmol/m
ol)
CRFchronicrenalfailure,D
Mdiabetes
mellitus,G
Aglycated
albumin,IDiron
deficiency,IDSiron-deficient
state,IG
Tim
paired
glucosetolerance,NIS
norm
aliron
state,NKnotk
nown
Diabetologia (2015) 58:1409–1421 1415
Studies comparing prevalence of diabetes and prediabetesdiagnosed by glucose or HbA1c Two studies [14, 15] com-pared the prevalence of diabetes/prediabetes determinedby glucose-based criteria and HbA1c-based criteria.Hardikar et al [14] compared HbA1c and OGTT deter-mined diabetes rates in a cohort of young adults inIndia. The authors found that the prevalence of diabetesor prediabetes was higher with HbA1c criteria than bystandard OGTT (25.9% vs 10.4%). Within a subgroup ofanaemic (IDA, B12 and folate deficiency) patients, thediscordance was even greater with 33% classed as predi-abetes or diabetes by HbA1c compared with 12% byOGTT.
Son et al [15] grouped 329 Korean participants, not pre-viously known to have diabetes, by diabetes status accord-ing to OGTT results. Participants were grouped as normal,prediabetes or diabetes, HbA1c levels were then comparedin each group for both anaemic and non-anaemic partici-pants. In the normoglycaemic group, HbA1c values werefound to be the same in both anaemic and non-anaemicgroups. In the prediabetes group, HbA1c values were foundto be higher in the anaemic group compared with controls(p=0.05) and borderline significant in the diabetes group.The authors acknowledge that small sample sizes and a lackof definition of types of anaemia are confounding factors intheir study.
Studies comparing HbA1c and glucose values in patientswithout diabetes, with and without IDA One study [16]compared the HbA1c values in 50 individuals with IDA, notpreviously known to have diabetes, with non-anaemic healthy
controls. This was a short article with limited description ordiscussion but essentially both FPG and postprandial glucosevalues were not significantly different between the IDA andcontrol groups. HbA1c values however were significantlyhigher in the IDA group (mean 7.6±0.5% [60±5.5 mmol/mol]) compared with the control group (5.5±0.8% [37±8.7 mmol/mol]; p<0.001).
Studies evaluating the effects of treatment, to resolve anae-mia, on HbA1c Four studies [17–20] evaluated HbA1c levelsin non-diabetic patients, pre and post treatment for anaemia.Each study included patients treated with oral iron replacementtherapy, three studies [17–19] reported a significant fall inHbA1c values after treatment with iron replacement over pe-riods of 9–20 weeks.
Coban et al [17] saw a fall from an HbA1c of 7.2±0.8%(55±8.7 mmol/mol) pre treatment to 6.2±0.6% (44±6.6 mmol/mol) post 3 months treatment but this was still notas low as the non-anaemic control group 5.2±0.2% (33±2.2 mmol/mol); however, the iron indices had not fully normal-ised compared with controls at that point in time either. Thesame pattern was demonstrated by El-Agouza et al [18] wherepatients were followed for 20 weeks and HbA1c fell steadi-ly over that period from 6.15±0.62% to 5.25±0.45% (44±6.8 mmol/mol to 34±4.9 mmol/mol). However, there wereno control participants included for comparison and itwould be of interest to know the point at which HbA1c
values plateaued post treatment. Similarly, a small study(n=10) [19], showed a significant decline (p<0.01) inHbA1c values by 3 weeks of treatment and the valuesremained below baseline values after 9 weeks, despite anupward rebound.
Interestingly, a study by Sinha et al [20] showed the con-verse pattern of results in 50 patients with moderate to severeIDA (mean±SD Hb, 62±1 g/l). The mean HbA1c was signif-icantly lower in the anaemic group compared with the non-anaemic controls (4.6±0.6% vs 5.5±0.6%; 27±6.6 mmol/molvs 37±6.6 mmol/mol). After 2 months of treatment forIDA, the HbA1c values were significantly higher than thecontrols raising the question of whether severe iron defi-ciency has the same effect on glycation as more mildanaemia.
Studies investigating the effect of menstruation on HbA1c
levels Three studies [21–23] investigated the impact of thepremenopausal state on HbA1c values. Behan [21] com-pared Hb values in non-diabetic, non-anaemic premeno-pausal women with postmenopausal white women. Thestudy found that Hb levels were significantly lower inpremenopausal women, despite no reported history ofanaemia. HbA1c values were not significantly differentbetween the two groups but the correlation betweenHbA1c and FPG was weaker in the premenopausal group.
EMBASE n=386 MEDLINE n=135 CINAHL n=12 Cochrane n=11
Total n=544
Total, after duplicates
removed n=451
Full text articles reviewed n=43
Exclusions based on title and/or
abstract n=408
Full text articles included n=12
Exclusions based on full text n=31
Fig. 1 Flow chart detailing the search strategy employed
1416 Diabetologia (2015) 58:1409–1421

The author suggests that the varying effects of menstrua-tion on iron metabolism could lead to less reliable HbA1c
and FPG correlations.Koga [22, 23] and colleagues also looked at the effect of the
menopause on HbA1c values. The initial study identified a sig-nificant difference in HbA1c levels between pre- and postmen-opausal women (4.9±0.2% vs 5.1±0.3% [30±2.2 mmol/molvs 32±2.2 mmol/mol] p<0.0001). In premenopausal women,mean corpuscular haemoglobin (MCH) and mean corpuscularvolume (MCV) were inversely correlated with HbA1c but thisassociation was not significant in postmenopausal women. Theauthors suggest that every 1 pg decrease in MCH correlatedwith a 0.03% (0.3 mmol/mol) increase in HbA1c value and thaterythrocyte indices influence HbA1c values in premenopausalwomen in the absence of overt anaemia. Koga et al [23] alsolooked at the effect of iron deficiency and IDA compared withiron sufficiency on HbA1c and glycated albumin values in pre-menopausal women. Iron deficiency and IDAwere both asso-ciated with a significant increase in HbA1c levels with ironmetabolism indices being significantly negatively associatedwith HbA1c. This association was not present in glycated albu-min levels across the three iron status groups, essentially indi-cating that iron metabolism rather than glycaemic changes in-fluence changes in HbA1c in premenopausal women.
Studies evaluating erythrocyte indices andmarkers of ironstatus All studies were reviewed for data on erythrocyte indi-ces and markers of iron status as these provide further insightinto which adjunct tests may support the use of HbA1c fordiagnosis. Data extracted are detailed in Table 3.Combinations of the following indices were measured: Hb,packed cell volume (PCV), MCV, MCH, MCH concentration(MCHC), ferritin, transferrin saturation (TSAT), reticulocytes,red cell distribution width (RDW) and erythrocyte protopor-phyrin. Some studies only used the values to identify or excludepatients with iron deficiency or anaemia whereas others corre-lated changes in erythrocyte indices with changes in HbA1c
value. Of the studies that focused on IDA, three studies com-pared values pre and post treatment with iron replacement andtwo compared values in patients with anaemia against controlparticipants. All studies demonstrated an increase in MCVandMCHwith treatment or higher levels in controls compared withanaemia patients. Two studies [14, 22] demonstrated an inversecorrelation between HbA1c and Hb, MCV and MCH levels.Overall, the data indicate that iron deficiency, demonstratedby low Hb, low MCV and low MCH, is associated with in-creased HbA1c levels both with and without overt anaemia. Inaddition, normal MCV and MCH with low Hb would not beassociated with increased HbA1c levels but rather a decrease invalues.
Ferritin was measured in nine studies [12–14, 16–18, 20,21, 23]. Of these, most showed an increase in ferritin levelspost treatment for anaemia and also showed that ferritin levels
were lower in iron-deficient participants compared with con-trols. Three studies [14, 16, 23] showed that ferritin was anegative predictor of HbA1c and one study [13] showed asmall but significant positive correlation between HbA1c andferritin. Generally, ferritin was utilised as a marker of irondeficiency rather than analysed as an independent predictorof HbA1c values; where the latter was done, the results weremixed.
Discussion
Does anaemia affect HbA1c?
Generally, the studies investigating the effect of anaemia andabnormalities of erythrocyte indices on HbA1c analysis arelimited to small sample groups and two studies that bothanalysed the same large cross-sectional population study. Itis apparent that IDA can have a significant impact on HbA1c
values with most studies suggesting a spuriously high HbA1c
in IDA compared with other markers of glycaemia. The ex-ception to this is the study by Sinha et al [20], which foundlow values of HbA1c in severe cases of IDA that increasedwith iron replacement therapy. The authors did not discusswhy their data conflicts with other studies but it may be dueto the severity of anaemia as the participants in this study hadlow mean Hb levels (62 g/l); the duration of anaemia was notgiven. Together, these data support the hypothesis that irondeficiency per se may cause elevated HbA1c values, irrespec-tive of anaemia.
Limited data indicate that non-IDAs also affect HbA1c
values to a varying degree [13, 14, 19]. Ford et al [13] showedthat in patients without diabetes, with low Hb but normal ironlevels had significantly lower HbA1c values than those withnormal iron and normal Hb (see Table 2). The difference be-tween the non-IDA and control values was greater than wasobserved between IDA and iron deficiency values and con-trols, suggesting that HbA1c may be spuriously elevated iniron deficiency and spuriously depressed in non-IDAs.Ideally, any further studies would separate out iron deficiencyand non-iron deficiency cases prior to analysis as there is thepotential to null the data by combing the two pathologies inone evaluation.
Hardikar et al [14] investigated a population where of thosewith anaemia 30.8% had vitamin B12 deficiency, 15% hadfolate deficiency and 30% had multiple nutrient deficiencies.In multivariate analysis, B12 and folate were not significantlyrelated to HbA1c levels but this may be due to the small sam-ple size analysed. Where mixed nutrient deficiencies are ob-served, the combination of pathologies will lead to variableand unpredictable effects on HbA1c levels depending on therelative degree of each nutrient deficiency.
Diabetologia (2015) 58:1409–1421 1417

Tab
le3
Correlatio
nsof
erythrocyteindicesandmarkersof
iron
status
with
HbA
1c
Study
Erythrocyteindicesmeasured
Mainobservations
Conclusions
Notes
Behan,2006[21]
Hb,MCVandRDW
Hbsignificantly
lower
inprem
enopausalw
omen,
nodifference
forMCVandRDW
Noconclusionsdraw
nregarding
erythrocyteindices.
WhilstH
bwas
lower,noneof
thepatients
hadlowferritin,toruleoutirondeficiency.
Coban
etal,2004[17]
Hb,PCV,M
CV,M
CH,ferritin
Hb,PCV,M
CV,M
CHandferritin↓intheID
Agroupcomparedwith
controls.P
osttreatment
nosignificantd
ifferences
betweengroups.
Treatmentw
ithiron
appearsto
norm
alisetheerythrocyteindices
alongwith
areductionin
HbA
1c
values
at3months.
Erythrocyteindicesused
todemonstrate
norm
alisationin
patientswith
anaemia.
RDW
values
may
have
assisted
inassessingtheheterogeneity
ofthe
erythrocytepopulatio
n.
El-Agouzaetal,2002[18]
Hb,ferritin,PCV,M
CV,M
CH,
MCHC,R
DW
Participantshadmicrocytic,m
icrochromic
indices—
notallhad↓ferritinlevels—notallID
.Postironreplacem
entin51
iron-deficient
participants—allindices
significantly
increased
except
MCHC(smalld
ecrease).
Treatmentw
ithiron
appearsto
norm
alisetheerythrocyteindices
alongwith
areductionin
HbA
1c
values.
Erythrocyteindicesused
todemonstratenorm
alisationof
iron
status.
RDW
meanwas
significantly
higher
than
thenorm
alrangepretreatm
entand
even
higher
posttreatm
entshowingavery
mixed
celltype
profile
at20
weeks
oftreatm
ent.Thiswould
indicatethat
erythrocyteindicesmay
notstabiliseeven
at20
weeks.
Ford
etal,2011[13]
Hb,PCV,M
CV,M
CH,M
CHC,
ferritin,TSA
TPearsoncorrelations:
HbA
1c↑asferritin↑
HbA
1c↑as
MCHandMCV↓
Not
asexpected
intheface
ofID
A:
↓Ferritin
,MCHandMCVwould
beexpected
with
↑HbA
1c.
MCVandMCHmay
bebettermarkers
forID
andID
Athan
ferritin.
Gram-Hansenetal,1990[19]
Hb,MCV,reticulocytes
Hb↑andMCV↑,HbA
1c↓w
ithiron
replacem
ent
Hb↑,MCV↓andHbA
1c↓with
B12
replacem
ent
MCVused
todifferentiatebetween
IDAandnon-ID
A.
Verylim
itedstudyandduratio
nof
follo
w-up.
Hardikaretal,2012[14]
Hb,PCV,M
CV,M
CH,M
CHC,
ferritin
Hb,MCV,M
CH,M
CHCnegativ
elycorrelated
with
HbA
1c
Markersof
microchromicanaemia
wereassociated
with
increased
HbA
1cvalues
inpeoplewho
were
norm
alby
OGTT.
MCVdidnotshowasignificantchange
inpreandposttreatm
entg
roups,
despite
negativ
ecorrelations
toHbA
1c.
Kim
etal,2010[12]
Erythrocyteprotoporphyrin,
ferritin,TSA
TIndicesmeasuredbuto
nlyused
toidentifyID
ANonecanbe
draw
n.
Kogaetal,2007[22]
RBC,H
b,PC
V,M
CH,M
CV
Hb,MCH,M
CVhadastatistically
significant
negativ
ecorrelationwith
HbA
1cin
prem
enopausalw
omen
only
↓Hb,MCH,M
CVassociated
with
↑HbA
1c,indicatesID
assessed
byMCHandMCV,correlates
to↑H
bA1cwith
nochange
inglucoselevels.
Nohistoryof
diabetes
oranaemiaincohort.
Kogaetal,2010[23]
Iron,ferritin
,TSAT
Serum
iron,T
SATandlogferritininversely
associated
with
HbA
1c
Low
iron
indicesassociated
with
↑HbA
1c.
MCHandPC
Vmeasuredanddecreased
with
IDAbutn
otcorrelated
toHbA
1c.
Shanthietal,2013
[16]
Hb,PCV,M
CV,M
CH,F
erritin
All↓in
IDAgroup,HbA
1c↑inthisgroup
Statisticalsignificance
isunclear.
Verypoorly
describedresults.
Sinhaetal,2012[20]
Ferritin
↓Hband↓ferritin
associated
with
↓HbA
1c,
allincreased
with
iron
replacem
enttherapy
HbA
1cappear
tocorrelatewith
Hb
andferritin.
MCV,M
CH,H
bused
todifferentiatetype
ofanaemiabutv
aluesnotreported.
Sonetal,2013[15]
Hb,MCV,M
CH,
Hb,MCVandMCHall↓
in‘anaem
ic’group
definedonly
byHb
Nocorrelations
madeto
HbA
1c.
Nodifferentiatio
nbetweentypesof
anaemiain
thestudyalthough
mean
MCVandMCHsuggestp
redominantly
IDA.
ID,irondeficiency
1418 Diabetologia (2015) 58:1409–1421

To what degree do abnormalities of erythrocyte indicesaffect HbA1c values?
The two evaluations of the cross-sectional NHANES datashowed that having iron deficiency or IDA increased the oddsof having an HbA1c value shift upwards from <5.5%(<37 mmol/mol) to 5.5–5.9% (37–41 mmol/mol) [12, 13].Hardikar et al [14] demonstrated that markers ofmicrochromic anaemia were associated with increasedHbA1c values and also more patients diagnosed with predia-betes or diabetes by HbA1c compared with glucose indices. Inpatients with non-IDA, there was a marked shift downwardsin apparent distribution of HbA1c results [13]. Son et al [15]demonstrated that IDA in the patients with prediabetes definedby glucose levels had a mean HbA1c of 6.4% vs 6.1%(46 mmol/mol vs 43 mmol/mol) in controls; this is sufficientto re-categorise some patients from prediabetes to diabetes inthe anaemic group.
Other studies which looked more specifically at HbA1c
levels in patients with or without anaemia showed differencesof up to 2.1% (23 mmol/mol) HbA1c increase with IDA [16]and studies measuring HbA1c pre and post treatment for anae-mia showed changes as large as −1.2% (−13 mmol/mol)HbA1c post treatment [17].
What does this mean on a wider scale?
Recent data has shown a surge in the incidence and prevalenceof young onset obesity, many of whom are premenopausalfemales, at increased risk of iron deficiency. There has beena concomitant increase in HbA1c values in these participantsconsidered at high risk of diabetes, owing to factors such asobesity [24]. Data from England shows that the prevalence ofprediabetes rose from 11.6% in 2003 to 35.3% in 2011 [25]and in view of the rising prevalence of obesity, we wouldanticipate to identify a larger proportion of patients, withhigher HbA1c values. If the estimated upward shift in HbA1c
values seen with iron deficiency is combined with the appar-ent increased prevalence of prediabetes, it may result in asignificant number of patients where the combination of thetwo will be sufficient to shift HbA1c values to move from adiagnosis of prediabetes to diabetes.
Clinical use and relevance
One of the main questions still to answer is how to apply thisinformation to everyday clinical practice. In addition to pub-lished guidance [4–6], we suggest the following:
1. During monitoring of people with diabetes, when glucoseand HbA1c are discordant, consider abnormalities oferythrocyte indices.
2. When HbA1c is normal/elevated but Hb is low, do notassume that HbA1c is falsely elevated—check eryth-rocyte indices, in particular MCV and MCH; if low,consider iron deficiency by TSAT or ferritin. If MCVand MCH are not low then consider other forms ofanaemia—HbA1c may be falsely decreased in thesecases.
3. Iron deficiency, as well as IDA, may be sufficient to causea change in HbA1c values; this is highly relevant in wom-en of childbearing age.
4. If abnormalities of erythrocyte indices or anaemia areidentified, consider correction of the abnormality beforeusing HbA1c for diagnosis or monitoring. The studies in-cluded in this review suggest that it may take up to6 months after treatment is initiated to normalise erythro-cyte indices. RDW will provide an additional indicator ofnormalisation of the erythrocyte population and erythro-cyte lifespan.
Ferritin as a marker of iron status is useful if it is low butwould not rule out iron deficiency if it was found to be normalor elevated as ferritin is an acute phase reactant and inflam-mation may mask a true low ferritin. Raj and Rajan [26] in-vestigated 86 patients with type 2 diabetes mellitus and dem-onstrated that serum ferritin positively correlated with HbA1c
and was increased with increasing duration of disease, indi-cating that poor glycaemic control can contribute to elevatedferritin levels independent of iron status. In situations ofincreased inflammation, alternative measures of iron statussuch as TSAT or total iron binding capacity should beconsidered.
Changes in erythrocyte lifespan even with normalhaematological indices can affect HbA1c values [27],therefore, it is important to show that the erythrocytepopulation is stable after treatment for abnormalities be-fore using HbA1c. Erythrocyte indices including RDWmay assist with this.
Further research questions
Although it is clear that anaemia may influence HbA1c
results, further studies to identify the roles of erythrocyteindices as appropriate adjunct analyses to identify patientswhere this is an issue, are needed. Future studies shouldconsider the effect of erythrocyte indices rather than anae-mia alone. In particular, studies should aim to includesufficient participants to differentiate between the effectsof the type and severity of erythrocyte abnormalities/anaemia on HbA1c values. This may be achieved througha combination of population based studies and interventionstudies where changes in HbA1c values are assessed inrelation to therapy for erythrocyte abnormalities andanaemias.
Diabetologia (2015) 58:1409–1421 1419

Strengths and limitations of this study
This review is limited to a selection of small study groups andtwo separate analyses of the NHANES survey data from over-lapping time periods. The conclusions drawn are limited by alack of robust evidence from a significant number of the in-cluded studies. The quality analysis of the included studies hashighlighted shortfalls and confounders in most of the cases,which would need to be addressed in future studies—in par-ticular, a lack of power to confer significance on many of thefindings.
Notes on standardisation of HbA1c methods
International standardisation of HbA1c was achieved in 2002[28–30]. An International HbA1c Consensus Committee wasformed which agreed that HbA1c values should be reportedin both SI units (mmol/mol) and converted to % units viathe master equations established by the InternationalFederation for Clinical Chemistry and Laboratory Medicine(IFCC) and designated comparison methods [10, 11]. Allstudies reported in this review either stated that they werealigned to the NGSP or did not state any performance infor-mation for the HbA1c analysis. In light of this, even if therewas sufficient data for meta-analysis, it is likely that a lackof standardisation of results would be a major confounder.Any further studies should endeavour to ensure that allHbA1c measurements are performed in alignment with theIFCC and clear quality data should be provided in thereports.
Conclusion
It is clear from the limited number of studies, many with lowparticipant numbers, that the subject of anaemia and HbA1c
warrants further investigation. Generally, the studies describeddemonstrate that abnormalities of erythrocyte indices are aconsiderable confounder in the analysis of HbA1c and thereis currently insufficient data to fully inform clinicians andscientists on how to address this in clinical practice.However, we have made some suggestions to facilitate itsuse whilst clarity is awaited.
The key questions that are still to be answered are whetheranaemia and erythrocyte abnormalities will have a significantimpact on the diagnosis of diabetes using HbA1c in the generalpopulation—something that is now widely performed.
Acknowledgements We would like to thank R. Curtis (LibraryServices, University of Nottingham, Nottingham, UK) for her helpand guidance in constructing the database searches.
Funding This research received no specific grant from any fundingagency in the public, commercial or not-for-profit sectors.
Duality of interest statement The authors declare that there is no du-ality of interest associated with this manuscript.
Contribution statement All of the authors listed have made a substan-tial contribution to the production of this article. EE, II, KD, EK andWGJall contributed to the concept of the work; EE, GS and II designed the datacollection; EE andGS collected and analysed the data. All authors revisedthe manuscript critically for important intellectual content and approvedthe final version to be submitted/published. EE drafted the manuscript.EE is the guarantor of this work.
References
1. The Diabetes Control and Complications Trial Research Group(1993) The effect of intensive treatment of diabetes on the devel-opment and progression of long-term complications in insulin-dependent diabetes mellitus. N Engl J Med 329:977–986
2. UK Prospective Diabetes Study (UKPDS) Group (1998) Intensiveblood-glucose control with sulphonylureas or insulin comparedwith conventional treatment and risk of complications in patientswith type 2 diabetes (UKPDS 33). Lancet 352:837–853
3. Inzucchi SE, Bergenstal RM, Buse JB et al (2012) Management ofhyperglycemia in type 2 diabetes: a patient-centered approach: po-sition statement of the American Diabetes Association (ADA) andthe European Association for the Study of Diabetes (EASD).Diabetes Care 35:1364–1379
4. World Health Organization (2011) Use of glycated haemoglobin(HbA1c) in the diagnosis of diabetes mellitus (abbreviated reportof a WHO consultation)
5. AmericanDiabetes Association (2013) Standards ofmedical care indiabetes–2013. Diabetes Care 36(Suppl 1):S11–S66
6. John WG (2012) Use of HbA1c in the diagnosis of diabetesmellitus in the UK. The implementation of World HealthOrganization guidance 2011. Diabet Med 29:1350–1357
7. United Nations Children’s Fund, United Nations University, WorldHealth Organization (2001) Iron deficiency anaemia assessment,prevention, and control: a guide for programme managers.Available from www.who.int/nutrition/publications/en/ida_assessment_prevention_control.pdf
8. Stevens GA, Finucane MM, De-Regil LM et al (2013) Global,regional, and national trends in haemoglobin concentration andprevalence of total and severe anaemia in children and pregnantand non-pregnant women for 1995-2011: a systematic analysis ofpopulation-representative data. Lancet Glob Health 1:e16–25
9. Lowe G, Twaddle S (2005) The Scottish Intercollegiate GuidelinesNetwork (SIGN): an update. Scot Med J 50:51–52
10. Consensus Committee (2007) Consensus statement on the world-wide standardization of the hemoglobin A1C measurement: theAmerican Diabetes Association, European Association for theStudy of Diabetes, International Federation of Clinical Chemistryand Laboratory Medicine, and the International DiabetesFederation. Diabetes Care 30:2399–2400
11. Hanas R, John G, International Hb ACC (2010) 2010 consensusstatement on the worldwide standardization of the hemoglobin A1cmeasurement. Clin Chem 56:1362–1364
12. Kim C, Bullard KM, HermanWH, Beckles GL (2010) Associationbetween iron deficiency and A1C Levels among adults withoutdiabetes in the National Health and Nutrition ExaminationSurvey, 1999–2006. Diabetes Care 33:780–785
13. Ford ES, Cowie CC, Li C, Handelsman Y, Bloomgarden ZT (2011)Iron-deficiency anemia, non-iron-deficiency anemia and HbA1camong adults in the US. J Diabetes 3:67–73
1420 Diabetologia (2015) 58:1409–1421

14. Hardikar PS, Joshi SM, Bhat DS et al (2012) Spuriously high prev-alence of prediabetes diagnosed by HbA(1c) in young Indians part-ly explained by hematological factors and iron deficiency anemia.Diabetes Care 35:797–802
15. Son JI, Rhee SY, Woo JT et al (2013) Hemoglobin A1c may be aninadequate diagnostic tool for diabetes mellitus in anemic subjects.Diabetes Metab J 37:343–348
16. Shanthi B, Revathy C, Manjula Devi AJ, Subhashree (2013) Effectof iron deficiency on glycation of haemoglobin in nondiabetics.J Clin Diagn Res 7:15–17
17. Coban E, Ozdogan M, Timuragaoglu A (2004) Effect of iron defi-ciency anemia on the levels of hemoglobin A1c in nondiabeticpatients. Acta Haematol 112:126–128
18. El-Agouza I, Abu Shahla A, Sirdah M (2002) The effect of irondeficiency anaemia on the levels of haemoglobin subtypes: possibleconsequences for clinical diagnosis. Clin Lab Haematol 24:285–289
19. Gram-Hansen P, Eriksen J, Mourits-Andersen T, Olesen L (1990)Glycosylated haemoglobin (HbA1c) in iron- and vitaminB12 deficiency. J Intern Med 227:133–136
20. Sinha N, Mishra TK, Singh T, Gupta N (2012) Effect of iron defi-ciency anemia on hemoglobin A1c levels. Ann Lab Med 32:17–22
21. Behan KJ (2006) Cessation of menstruation improves the correla-tion of FPG to hemoglobin A1c in Caucasian women. Clin Lab Sci19:225–230
22. Koga M, Morita S, Saito H, Mukai M, Kasayama S (2007)Association of erythrocyte indices with glycated haemoglobin inpre-menopausal women. Diabet Med 24:843–847
23. Koga M, Saito H, Mukai M, Matsumoto S, Kasayama S (2010)Influence of iron metabolism indices on glycated haemoglobinbut not glycated albumin levels in premenopausal women.Acta Diabetol 47(Suppl 1):S65–S69
24. Selvin E, Parrinello CM, Sacks DB, Coresh J (2014) Trends inprevalence and control of diabetes in the United States, 1988–1994 and 1999–2010. Ann Intern Med 160:517–525
25. Mainous AG 3rd, Tanner RJ, Baker R, Zayas CE, Harle CA (2014)Prevalence of prediabetes in England from 2003 to 2011: popula-tion-based, cross-sectional study. BMJ Open 4:e005002
26. Raj S, Rajan GV (2013) Correlation between elevated serumferritin and HbA1c in type 2 diabetes mellitus. Int J Res Med Sci 1:12–15
27. Cohen RM, Franco RS, Khera PK et al (2008) Red cell life spanheterogeneity in hematologically normal people is sufficient to alterHbA1c. Blood 112:4284–4291
28. Hoelzel W, Weykamp C, Jeppsson JO et al (2004) IFCC refer-ence system for measurement of hemoglobin A1c in humanblood and the national standardization schemes in the UnitedStates, Japan, and Sweden: a method-comparison study. Clin Chem50:166–174
29. Jeppsson JO, Kobold U, Barr J et al (2002) Approved IFCCreference method for the measurement of HbA(1c) in humanblood. Clin Chem Lab Med 40:78–89
30. Weykamp C, John WG, Mosca A et al (2008) The IFCCReference Measurement System for HbA1c: a 6-year prog-ress report. Clin Chem 54:240–248
Diabetologia (2015) 58:1409–1421 1421
Related Documents