16/09/2002 The Effect of Alternative World Fertility Scenarios on the World Interest Rate, Net International Capital Flows and Living Standards Ross S. Guest Griffith University Australia Ian M. McDonald The University of Melbourne Australia ABSTRACT This paper applies a multi-region Ramsey model to the question of the impact of alternative fertility scenarios on the world interest rate, net international capital flows and living standards. The world economy is divided into nine regions consisting of the eight regions in the United Nations long run demographic projections (1998 Revision) plus Japan as a separate region. Age-specific consumption demands and age-specific labour productivity levels are applied. The model is simulated for the low, medium and high fertility scenarios as projected for all regions by the United Nations. Population ageing in five of the nine regions – Japan, Europe, North America, China and Oceania - over the next few decades causes a fall in the world interest rate, which is greater the lower the fertility scenario. The size of net international capital flows is smaller for the low fertility scenario and higher for the high fertility scenario. This is due to the different effect on optimal saving of a change in the world interest rate for borrowing and lending regions. For lending regions the income effect is positive but for borrowing regions it is negative. This causes lending regions to reduce their lending, and borrowing regions to reduce their borrowing, in response to lower fertility; the result is smaller current account deficits and surpluses. Higher fertility results in bigger current account deficits and surpluses. Lower fertility results in an initial boost in living standards followed by reduced living standards later on. Borrowing regions are better off, in terms of living standards, than lending regions following a lower fertility shock.

Welcome message from author
This document is posted to help you gain knowledge. Please leave a comment to let me know what you think about it! Share it to your friends and learn new things together.
Transcript

16/09/2002
The Effect of Alternative World Fertility Scenarios on the World Interest Rate,Net International Capital Flows and Living Standards
Ross S. GuestGriffith University
Australia
Ian M. McDonaldThe University of Melbourne
Australia
ABSTRACT
This paper applies a multi-region Ramsey model to the question of the impact ofalternative fertility scenarios on the world interest rate, net international capital flowsand living standards. The world economy is divided into nine regions consisting of theeight regions in the United Nations long run demographic projections (1998 Revision)plus Japan as a separate region. Age-specific consumption demands and age-specificlabour productivity levels are applied. The model is simulated for the low, medium andhigh fertility scenarios as projected for all regions by the United Nations. Populationageing in five of the nine regions – Japan, Europe, North America, China and Oceania- over the next few decades causes a fall in the world interest rate, which is greater thelower the fertility scenario. The size of net international capital flows is smaller for thelow fertility scenario and higher for the high fertility scenario. This is due to thedifferent effect on optimal saving of a change in the world interest rate for borrowingand lending regions. For lending regions the income effect is positive but forborrowing regions it is negative. This causes lending regions to reduce their lending,and borrowing regions to reduce their borrowing, in response to lower fertility; theresult is smaller current account deficits and surpluses. Higher fertility results in biggercurrent account deficits and surpluses. Lower fertility results in an initial boost inliving standards followed by reduced living standards later on. Borrowing regions arebetter off, in terms of living standards, than lending regions following a lower fertilityshock.

1
1. Introduction
There is currently, in OECD countries in particular, a vigorous debate about the role
that policy makers can, and ought to, play in influencing the fertility rate. Public
concern is widespread that lower fertility rates imply lower living standards, yet the
theoretical and empirical evidence is ambiguous. The transition to lower population
growth yields a short term dividend for living standards in the form of lower youth
dependency and lower capital widening requirements. This dividend is offset later on
by higher old age dependency. For a discussion along with simulation results see Weil,
1999; Elmendorf and Sheiner, 2000; and Guest and McDonald, 2002.
These models are, however, single region models. In a multi-regional
framework the effect on living standards depends on the effects of lower fertility rates
on net international capital flows, through the effect on saving and investment flows,
which in turn alters world interest rates. The effect of changing world interest rates on
living standards differs for borrowing and lending regions. For borrowers the income
effect is negative while for lenders it is positive.
This paper quantifies the impact of alternative fertility rates on international
capital flows, world interest rates and living standards by simulating a multi-regional
Ramsey model. The model incorporates the changing demographic structure implied
by UN population projections for the 21st century under three different fertility
assumptions – low, medium and high.
There are several classes of multi-regional macroeconomic models that can be
used to analyse the macroeconomic implications of population ageing. The model in
this paper belongs to the class of multi-regional Cass-Ramsey-Solow models. This is a
single good model. Although generations are not overlapping in this framework,
heterogeneity of workers and consumers is captured by weighting for age-specific

2
productivity and consumption needs, respectively. Other examples of this class of
models is the OECD model in Borsch-Supan (1996) and the two region open economy
model in Cutler et al. (1990). A variation on this approach is the international
overlapping generations models of Turner et al. (1998) using the OECD’s Minilink
model, the models of the Ingenue Team (2001) and Fougere, M. and Merette, M.
(1999), and the macroeconometric model of Masson and Tryon (1990). A third and
newer class of models is the multi-good general equilibrium models such as the G-
cubed model (McKibbin and Wilcoxen, 1995). However, we were unable to find any
specific applications of this class of models to the impact of population ageing.
2. Demographic projections
In this model, the world economy is divided into nine regions consisting of the eight
regions in the United Nations (2000) long run demographic projections plus Japan as a
separate region. The nine regions are: Africa, Asia (excluding China, India and Japan),
China, Europe, India, Japan, Latin America, North America and Oceania. This is a
larger number of regions than has been adopted in other models listed above. We
choose for comparison the low, medium and high fertility scenarios in the United
Nations projections (up to 2150). The medium scenario assumes that fertility in all
major areas stabilizes at replacement level around 2050; the low scenario assumes that
fertility is half a child lower than in the medium scenario; and the high scenario
assumes that fertility is half a child higher than in the medium scenario. For each of
these population scenarios, employment projections by age and sex are calculated from
the International Labour Organisation (ILO, 2001) database: Key Indicators of the
Labour Market (KILM). These data provide labour force and population by age group
and sex for each country in the world for the latest year – typically 1999 or 2000. From

3
these data the aggregate labour force participation rates (LFPR) for each of the nine
regions, by age group, are calculated. These age and sex-specific LFPRs are assumed
to be the age-specific employment to population (L/N) ratios. Employment projections
for each region are calculated by assuming that the age-specific L/N ratios (for both
sexes) converge toward those of North America according to the following formula:
( ) ( ) ( )( )
γ
=
−−
aj
NAa
ajaj NL
NLNLNL
,1,1, (1)
where j is the year from 2001 to 2150, NA is North America, a is the age group, γ is the
convergence parameter set equal to 0.025.
Following Cutler et al. (1990) and Elmendorf and Sheiner (2000) the
employment and population numbers are weighted to account for, respectively, age-
specific differences in labour productivity and consumption needs. The age-
productivity relation in Miles (1999) is adopted, where the productivity weight is a
quadratic function of age: 0.05age – 0.0006age2 . The consumption weights are those
applied in Cutler et al (1990); that is 0.72 for 0-19 year olds, 1.0 for 20-64 year olds
and 1.27 for over 64 year olds. Both productivity weights and consumption weights are
non-gender specific.
The aggregate weighted L/N ratio for each region is the support ratio (Cutler et
al., 1990). A decrease in the support ratio implies a diminished capacity to meet a
given level of consumption needs per capita. An increase in the support ratio implies
the opposite. Chart 1 plots the support ratios for the nine regions. The three regions
that face imminent steep declines in their support ratios are Japan, Europe, China and
North America. The first three of these are large net lenders to the rest of the world and
it will be seen below that it is optimal for this to continue in the next few decades. This

4
will enable them to build up wealth to provide for their reduced capacity to meet future
consumption needs.
3. The model
The simulations are based on a multi-region Ramsey model of optimal saving, with
heterogeneous workers and consumers, habit formation in consumption, and a vintage
production function.1 A social planner maximises, for each region, a social welfare
function (see Table 1 for a list of variable names).
( ) ( ))1(
1
)1(
1 11
1
11
1
1
ψρω
βρ
ψβ
−+
+
−+
−=
−−
=
−−
−
−∑hh
j h
hh
j
j
j
j
jj N
WN
P
C
P
CNV j=1,..,h (2)
where C0 is exogenous and equal to actual consumption for the region. Equation (2) is
maximised subject to the evolution of foreign debt
hjYrDCID jjjjjj ,..,1)1(1 =−+++= − (3)
the vintage production function,
hjLLIAYY jjjjjj ,..,2))1(()1( 11111 =−−+−= −
−−−−αα δδ (4)
and the definition of terminal wealth
∑=
−−+−=−=h
j
jhj
hhhhh IKKwhereDKW
10 )1()1( δδ (6)
∑∑==
9
1,
9
1,
iji
iji I = S j=1,..,h (7)
The social welfare function (2) includes a reference level of consumption, Cj-1,
which captures habit formation where the “memory” in habit-formation lasts for only

5
one period. Fuhrer (2000) finds empirical evidence to support such a low degree of
persistence in habit formation, using aggregate consumption data for the U.S. over the
period 1966 to 1995.
The world interest rate is determined such that world investment equals world
saving, condition (7). However, the path of the world interest is exogenous to the
social planner for each region, which implies that no region has market power in the
world capital market and that indebted regions do not face risk premia on their
borrowings. This assumption ensures that the solution is a global optimum.
The initial value of total factor productivity, A, in production function (4) is
calibrated for all regions such that optimal investment is equal to actual investment in
the initial year. Thereafter, total factor productivity growth is exogenous and constant
at 1% per annum for all regions. This implies two things – first, that there is no
influence of ageing on technical progress and, second, that there is no convergence of
labour productivity among the nine regions. On the effect of ageing on technical
progress both the theoretical and empirical evidence is ambiguous, as discussed by
Cutler et al. (1990, p. 38). On the one hand slower population growth makes
innovation less profitable by reducing the gains from economies of scale through the
spreading of fixed costs; and a smaller youth share of the population may reduce
innovation through a loss of “dynamism”. Also, in endogenous growth models with
human capital, the effect of ageing on productivity growth is ambiguous. In the model
in Steinman et al. (1998) lower population growth results in less human capital
accumulation and therefore a lower growth rate of labour productivity. On the other
hand, the model in Fougere and Merrete (1998) shows that ageing will increase human
capital formation, through tax effects. Furthermore, slower labour force growth implies
1 The rationale for adopting a vintage production function in simulating the impact of population ageing,

6
a higher relative price of labour and therefore greater incentive to innovate through
capital investment. Also, diseconomies of higher population growth, through
congestion for example, can reduce labour productivity growth. The empirical
evidence on the effect of fertility on labour productivity is relatively scarce - see for
example Galor et al. (1997), Ahituv (2001) and Hondroyiannis and Papapetrou (1999)
- and somewhat conflicting. Hence the assumption here of zero net effect of ageing on
total factor productivity growth seems to be a reasonable starting point.
With respect to the zero convergence assumption, Barro and Salai-Martin
(1995, p.26) report that the hypothesis of absolute convergence – where poor countries
catch-up with rich countries in their GDP per capita, without allowing for any control
variables – has received mixed empirical support.2 Nevertheless, most multi-regional
macroeconomic models adopt some form of productivity convergence. Using the
OECDs multi-regional “Minilink” model, Turner et al (1998) assume slow
convergence in the rates of technical progress of their five world regions, as distinct
from convergence in their productivity levels. The Ingenue Team (2001) assume
extremely slow convergence in levels of productivity – the gap between rich and poor
countries appears to close by about 20% over 100 years. Dynamic intertemporal
general equilibrium models, such as the G-Cubed Model, also typically incorporate
some form of technology catch-up (McKibbin, 1999). In this paper, zero convergence
in total factor productivity is assumed because, in our initial simulations, we found that
all but a very small rate of convergence tended to swamp the effects of differences in
fertility rates that we were attempting to isolate. As a result of this, and the uncertainty
is discussed in Guest and McDonald, 2002(a) (available from the authors).2 The hypothesis of conditional convergence, which controls for various characteristics of economies,has received stronger empirical support. However, even the testing of this weaker hypothesis faces someserious econometric problems. See Durlauf and Quah in Taylor and Woodford eds. (1999) for acomprehensive discussion of the theory and empirical tests of convergence hypotheses.

7
in the empirical literature about productivity convergence, we felt that zero
convergence was a reasonable assumption for our purposes.
The parameter ω is set such that the ratio of terminal wealth to consumption is
equal to the actual ratio of wealth to consumption in 2000. This prevents a rundown of
wealth in the simulations. The simulation length, h, is equal to 150 years which is
length of the United Nations demographic projections and also long enough that
optimal values in the first 100 years – the period of interest - would not be changed
significantly by increasing h. The rate of time preference, ρ, is set equal to 0.025 for
each region, which is approximately the rate such that in a steady state the share of
consumption in output approaches a constant value.
Table 1. Definition of variablesj year of the planning period that runs from 1 to hi region , from 1 to 9Y real GDPC aggregate consumptionW wealth=capital stock plus overseas assetsI aggregate investmentD overseas debtK capital stockr world interest rateδ rate of depreciation (5%)ρ rate of time preference (2.5%)β reciprocal of intertemporal elasticity of substitution (2.0)ω weight attached to bequest of terminal wealth in the social welfare functionL aggregate employment in relative efficiency unitsh terminal period of the maximisation problem (150 years)N populationP population in effective personsA efficiency parameter – the initial value is set such that the optimal level of
investment is equal to the actual level of investment. Thereafter A grows at1% p.a.
National accounts data for the initial year are from IMF International Financial
Statistics Yearbook (2000). The capital stock to GDP ratio is assumed to be unchanged

8
from their latest values available from the Penn World Tables (Summers and Heston,
1993).
4. The world rate of interest and net international capital flows
Figure 2 shows the impact of the future patterns of demographic change on the world
rate of interest. The base case is the medium fertility scenario. Under all fertility
scenarios, the world interest rate falls. The regions that face imminent population
ageing and hence falls in their support ratios – Japan, Europe, China, North America
and Oceania – find it optimal to increase saving and reduce investment. Higher saving
allows these regions to smooth consumption and therefore smooth the burden of
ageing over time. At the same time their lower employment growth reduces both the
marginal product of new capital and capital widening requirements, implying lower
optimal investment to output ratios. The relative size of the regions facing these forces
puts downward pressure on the world interest rate. The lower is the fertility rate the
greater are these forces, and hence the bigger the drop in the world interest rate.
The effect of alternative fertility scenarios on net international capital flows
works through the effects on investment, saving and hence current account balances.
The direction of these effects is ambiguous in a model in which the world interest rate
is endogenous. As noted above, lower fertility reduces the optimal investment ratio.
However, this is a first round effect. There is a second round effect that works in the
opposite direction, increasing investment through the lower world interest rates that
result from lower fertility. Our simulations show that these effects approximately
cancel out for at least several decades after which the negative employment dominates.
This is illustrated in Figure 3. There are minor differences in the magnitude of these
effects between regions.

9
The effect of lower fertility on saving is also ambiguous. The higher saving
described above arising from lower fertility is also a first round effect only. A second
round effect occurs through the effect on saving of a changing world interest rate. Here
the effect is different for borrowing and lending regions. Lending regions face a
positive income effect (lower income) and a negative substitution effect from the lower
interest rate that results from lower fertility. Both of these effects tend to lower saving
in response to lower fertility and therefore work in the opposite direction to the first
round effect on saving. Simulation showed that the second round effect dominates the
first round effect for lending regions leading to lower saving. See Figure 3. Hence
lending regions face an initial small increase in investment and a larger decrease in
saving. The result is lower current account surpluses for lending regions as a result of
lower fertility. The opposite occurs for higher fertility. That is, the higher interest rate
leads to higher saving and an initial small fall in investment – the net result being an
increase in the current account surpluses for lending regions.
For borrowing regions, the second round effect on saving is different to that for
lending regions as shown in Figure 3. The sign of the income effect is negative for
borrowing regions because they gain income from lower interest rates. Hence the
income and substitution effects work in the opposite direction on saving. The net of the
income and substitution effects is small enough that the first round effect on saving
dominates the second round effect of the lower interest rate. The result is higher saving
for borrowing regions in response to lower fertility. Combining with the small initial
effect on investment – and large negative effect later on - the outcome is a reduction in
current account deficits for borrowing regions. Again, higher fertility has the opposite
effect – an increase in current account deficits for borrowing regions.

10
To summarise, lower fertility leads to lower current account surpluses for
lending regions and lower current account deficits for borrowing regions. Hence net
international capital flows are lower under the lower fertility scenario. The opposite
occurs for higher fertility – an increase in net international capital flows. This is
illustrated in Figure 4 which shows the size of net international capital flows for the
three alternative fertility scenarios over the next 100 years.
5. Living standards
Living standards are defined as aggregate consumption per effective person, C/P. In
considering the impact of fertility scenarios on living standards the analysis above
suggests the need to distinguish between borrowing and lending regions. In addition,
we compare the case where the whole world experiences lower fertility with the case
where only one region experiences lower fertility.
The effects of population ageing on optimal consumption are discussed in
(Elmendorf and Sheiner, 2000). The new steady state level of consumption in response
to an ageing shock is lower as a result of the net of two effects: the dependency effect
and the “Solow” effect. Higher overall dependency (the combination of youth and old
age dependency) implies fewer workers per person which lowers consumption
possibilities. The Solow effect refers to the gains from the lower capital widening
requirements that come with lower employment growth. The path to this lower level of
consumption is determined by the changes in the return to saving during the
demographic transition. In the closed economy this is determined by the effect of
changes in the capital labour ratio on the marginal product of capital. In the open
economy it is determined by changes in the interest rate at which the economy borrows
and lends from overseas.

11
Within an overall scenario of population ageing, the effect of lower fertility on
living standards in a single economy Ramsey model has been simulated by Guest and
McDonald (2002b, 2002c).3 They show that, in the case where the interest rate is
constant, lower fertility is likely to result in an improvement in living standards
throughout the planning period. The reason is that there are two consumption
dividends that accrue as soon as fertility drops. These are the dividend from lower
youth dependency and from lower capital widening requirements. These are eventually
offset by higher old age dependency. The net effect is a gain which can be smoothed
out over the planning period resulting in higher living standards throughout. Where the
interest rate is endogenous the result is somewhat different in that optimal
consumption is initially higher, but subsequently lower, under lower fertility (Guest
and McDonald, 2002c). However, for a range of reasonable discount rates and
parameter values there remains a small net discounted gain from lower fertility.
The difference in the effect of the fertility rate on living standards between the
endogenous and exogenous world interest rate models arises through the second round
effects of a change in the interest rate on the return to saving and on the cost of capital.
Two cases are simulated here. One where a different rate of fertility is experienced by
all regions in the world and another case where only one region experiences a different
fertility scenario. The latter case is described as the “own region” effect of lower
fertility. The own region effect is much smaller because the effect on the world interest
rate is much smaller.
Figure 5 illustrates the effect of fertility on living standards for both a
representative lending region (Europe) and a representative borrowing region (Africa).
Taking the lending region first, lower fertility results in an initial rise in living
3 The first reference assumes a constant exogenous interest rate and the second reference allows for a

12
standards as consumption is brought forward by the lower interest rate. This implies
lower consumption later, which is reinforced by the income effect of lower interest
rates (implying lower income). The outcome is much lower living standards later in the
planning period. The reverse story applies in the case of higher fertility. The higher
interest rate causes consumption to be postponed early on, relative to the base case, but
the effect of higher income enjoyed by the lending country eventually allows for
higher living standards.
For the borrowing country, the pattern is somewhat different. For lower
fertility, the initial rise in living standards as consumption is brought forward is
reinforced by the income effect of lower interest rates (implying higher income) which
allows higher living standards. Hence the initial rise in living standards is higher and
there is no subsequent fall in living standards for the borrowing country. By the same
token, the borrowing country suffers lower income from higher world interest rates
under higher fertility. Hence living standards are lower under the high fertility
scenario. The own region effect remains relatively small for both the borrowing and
the lending country.
Table 1 shows, for each of the 9 regions, the average annual loss in living
standards between the year 2000 and 2100 from experiencing lower fertility
throughout that time period. The average losses are all less than 0.15% which can be
considered to be very small.
Table 1. The effect on living standards of lower fertilityAverage annual % loss
Japan 0.09Europe 0.12
North America 0.06Oceania 0.07
Asia 0.02China 0.14
risk premium in the interest rate.

13
Africa -0.01India 0.06
Latin America 0.06
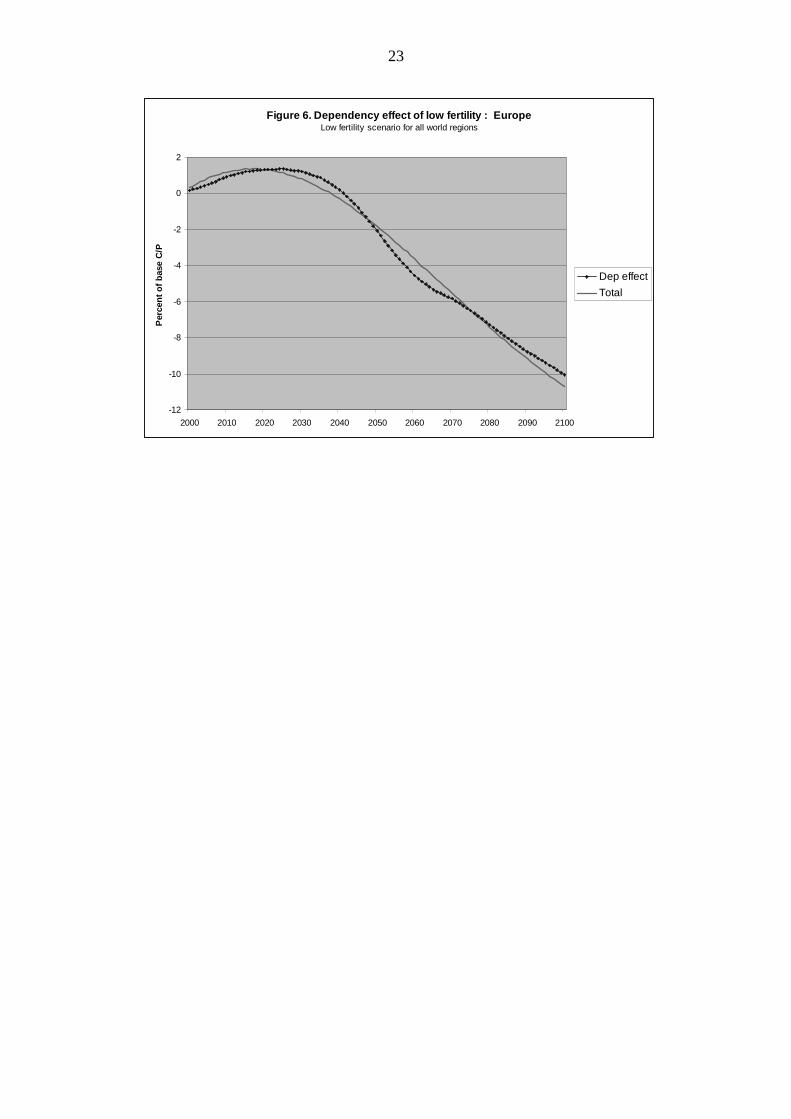
Finally, we found that the effect of alternative fertility scenarios on living
standards is almost entirely accounted for by the dependency effect. This is illustrated
in Figure 6 for the case where Europe, as an example, faces a lower fertility scenario.
The gap between the total effect and the dependency effect represents the net of two
effects described above – the Solow effect and the capital intensity effect. These
effects are clearly dominated by the dependency effect which is itself the net of a youth
dependency effect and an old age dependency effect.
6. Conclusion
From the simulations of a global model of optimal consumption, investment and
saving in this paper, three major conclusions stand out. First, the lower the fertility rate
the lower the world rate of interest. This is due to both lower demand for new capital
implied by slower employment growth, and higher saving implied by smoothing of the
reduced consumption possibilities. To equilibrate the world capital market, the equality
of world saving with world investment requires a lower equilibrium rate of interest.
Second, lower fertility tends to reduce the size of international capital flows. Lending
regions lend less and borrowing regions borrow less. This is largely due to the fact that
the income effects of lower interest rates are of opposite sign for borrowers and
lenders. Third, lower fertility reduces the average growth in living standards over time.
This loss is greater for lenders as a result of the lower income that they earn on
overseas assets as a result of lower interest rates.

14
There are several simplifying assumptions that have been adopted in this
analysis in order to quarantine the effect of fertility on the outcomes. For example, all
regions experience in the 21st century the same rate of growth of total factor
productivity and there are no risk premia faced by borrowers. These assumptions
could - perhaps ought - to be relaxed in future work.

15
APPENDIX
The first order conditions for the maximisation problem for each region, described byequations (2) to (6) are:
h 1jkk j
h
VC
(1 r )VC
−
=
∂∂ = +∂
∂
∏ for j=1,..,h-1 (A1)
j 1
k 1j h
j k 1k 1
j
dY 1
dI (1 )
(1 r )
+
−
+ −=ττ=
= − δ +
∑ ∏
for j=1,…,h-1 (A2)
The terminal first order condition is
hh W
V =
C
V
∂∂
∂∂
(A3)

16
References
Ahituv, A. (2001), “Be Fruitful or Multiply: On the Interplay Between Fertility and
Economic Development”, Journal of Population Economics, 14, 51-71.
Barro, R. and Sala-I-Martin, X. (1995), “Economic Growth”, McGraw-Hill, New
York.
Borsch-Supan, A. (1996), “The Impact of Population Ageing on Savings, Investment
and Growth in the OECD Area”, in “Future Global Capital Shortages”, OECD,
Paris, 103-142
Cutler, D.M., Poterba, J.M., Sheiner, L.M. and Summers, L.H. (1990) "An Aging
Society: Opportunity or Challenge?" Brookings Papers on Economic Activity,
(1), pp.1-74.
Elmendorf, D.W. and Sheiner, L.M. (2000), “Should America Save for its Old Age?
Fiscal Policy, Population Ageing and National Saving”, Journal of Economic
Perspectives, 14, 3, 57-74.
Fougere, M. and Merette, M. (1998), “Population Ageing, Intergenerational Equity and
Growth: Analysis with an Endogenous Growth, Overlapping Generations
Model”, International Conference on Using Dynamic Computable General
Equilibrium Models for Policy Analysis, Denmark, June 14-17
Fougere, M., and Merette, M. (1999) “Population ageing and economic growth in
seven OECD countries”. Economic Modelling, 16, 411-27.
Fuhrer, J.C. (2000), “Habit Formation in Consumption and Its Implications for
Monetary-Policy Models”, The American Economic Review, 90, 3, 367-390
Galor, O. and Hyoungsoo, Z. (1997), “Fertility, Income Distribution, and Economic
Growth: Theory and Cross-Country Evidence”, Japan and the World Economy,
9, 197-229

17
Guest, R. and McDonald, I.M., (2002a), “Vintage Versus Homogeneous Capital in
Simulations of Population Ageing: Does it Matter”, mimeo.
Guest, R. and McDonald, I.M., (2002b), “Would a Decrease in Fertility be a Threat to
Living Standards in Australia”, Australian Economic Review, 35, 1, 29-44
Guest, R. and McDonald, I.M., (2002c), “Population Ageing, Capital mobility and
Optimal Saving”, seminar paper presented at Queensland University of
Technology, August, 2002.
Hondroyiannis, G. and Papapetrou, E. (1999), “Fertility Choice and Economic
Growth: Empirical Evidence from the U.S.”, I.A.E.R., 5, 1, 108-120.
International Labour Organisation (ILO)(2001), “Key Indicators of the Labour Market
2001-2002”, ILO, Geneva.
International Monetary Fund (IMF) (2000), “Internationial Financial Statistics
Yearbook 2000”, IMF, Washington DC.
Masson, P.R. and Tryon, R.W. (1990), “Macroeconomic Effects of Projected
Population Ageing in Industrial Countries”, IMF Staff Papers, 37, 3.
McKibbin, W. and Wilcoxen, P. (1995), “The Theoretical and Empirical Structure of
the G-Cubed Model”, Brookings Discussion Paper in International Economics,
#118, The Brookings Institution, Washington DC.
McKibbin, W. (1999), “Forecasting the World Economy Using Dynamic Intertemporal
General Equilibrium Multi-Country Models”, Brookings Discussion Paper in
International Economics, #145, The Brookings Institution, Washington DC.
Miles, D., (1999) “Modelling the impact of demographic change on the economy”
Economic Journal, 109, pp.1-36.
Steinman, G., Prskawetz, A. and Feichtinger, G. (1998), “A Model of Escape From the
Malthusian Trap”, Journal of Population Economics, 11, 535-550

18
Summers, L.H. and Heston, A. (1993), “Penn World Tables”, available at
http://www.pwt.econ.upenn.edu/
Turner, D., Giorno, C. DeSerres, A., Vourch, A. and Richardson, P. (1998), “The
Macroeconomic Implications of Ageing in a Global Context”, OECD
Economic Department Working Papers, 193.
Taylor, J. B. and Woodford, M. (Eds.) (1999), “Handbook of Macroeconomics
Volume 1A”, Elsevier, Amsterdam.
United Nations (2000), “Long Range World Population Projections. Based on the 1998
Revision”, United Nations, New York 2001.
Weil, D. (1999), “Why has fertility Fallen Below Replacement in Industrial Nations,
and Will it Last?”, American Economic Review, 89, 2, 251-255.

19
Figure 1. Support ratios - 2000 to 2150. Base fertility.
Ageing regions
0.35
0.4
0.45
0.5
0.55
0.6
2000 2020 2040 2060 2080 2100 2120 2140
China
Japan
Europe
North America
Oceania
Other regions
0.35
0.4
0.45
0.5
0.55
0.6
2000 2020 2040 2060 2080 2100 2120 2140
Africa
Rest of Asia
India
Latin America
Figure 2. World Interest rate - 2000 to 2100
0.03
0.035
0.04
0.045
0.05
0.055
0.06
0.065
0.07
2000 2020 2040 2060 2080 2100
high
base
low

20
Figure 3. Saving, investment and current account balances
S/Y lending regions, % of world GDP
5
7
9
11
13
15
2000 2020 2040 2060 2080 2100
Base
Low
S/Y borrowing regions, % of world GDP
468
10121416182022
2000 2020 2040 2060 2080 2100
Base
Low
I/Ylending regions, % of world GDP
4
5
6
7
8
9
10
11
2000 2020 2040 2060 2080 2100
Base
Low
I/Yborrowing regions, % of world GDP
81012141618202224
2000 2020 2040 2060 2080 2100
Base
Low
CAB/Y lending regions, % of world GDP
0
1
2
3
4
5
2000 2020 2040 2060 2080 2100
Base
Low
CAB/Y borrowing regions, % of world GDP
-4
-3
-2
-1
0
1
2000 2020 2040 2060 2080 2100
Low
Base

21
Figure 4. Size of net international capital flows for
alternative fertility scenariosCalculated as the sum of the absolute value of CABs as a ratio to w orld
GDP
0
0.02
0.04
0.06
0.08
0.1
2000 2010 2020 2030 2040 2050 2060 2070 2080 2090 2100
High
Base
Low

22
Figure 5. Impact of fertility rate on living standards for a LENDING region : EUROPE
85
90
95
100
105
110
2000 2010 2020 2030 2040 2050 2060 2070 2080 2090 2100
C/P
[low
/bas
e]*1
00
Eur-low;ROW-low
Eur-low;ROW-base
Eur-high;ROW-base
Eur-high;ROW-high
Impact of fertility rate on living standards for a BORROWING region : AFRICA
85
90
95
100
105
110
2000 2010 2020 2030 2040 2050 2060 2070 2080 2090 2100
C/P
[lo
w/b
ase]
*100
Afr-low;ROW-low
Afr-low;ROW-base
Afr-high;ROW-high
Afr-high;ROW-base
23
Figure 6. Dependency effect of low fertility : EuropeLow fertility scenario for all world regions
-12
-10
-8
-6
-4
-2
0
2
2000 2010 2020 2030 2040 2050 2060 2070 2080 2090 2100
Per
cen
t o
f b
ase
C/P
Dep effect
Total
Related Documents