The effect of Aircraft Ageing on Maintenance and related Operating Costs 12 September 2013

Welcome message from author
This document is posted to help you gain knowledge. Please leave a comment to let me know what you think about it! Share it to your friends and learn new things together.
Transcript

The effect of Aircraft Ageing on Maintenance and related
Operating Costs
12 September 2013

Copyright – TBE International Limited 2013
Aircraft
Trading
and
Lease
Management
Support
Physical
Maintenance
Management
and
Commercial
Support
Business
Planning
and
Advisory
Services
‘Master Class’
Training
Seminars
Start-up Planning
and implementation
Economic
Analysis
Business
Improvement
Aero-political
Advisory Services
Maintenance
Management
PBH Agreement
Negotiation
Lease Return
Lease Mgt
Asset ‘Health
Check’ Services
Lease/Sale/Purch
ase Services
Asset Valuations
Structured
knowledge transfer
Project based
learning
lean/6-sigma
mentoring
Our Services
Our People
•Airline Executives
•Airline Senior Managers
•Six Sigma Black Belts
•Professional Engineers
•Accountants
•Licensed Engineers
Who are we?
TBE international Limited (“TBE”) is a boutique Hong Kong based consulting and contracting
company incorporated in February 2007, specialising in Aviation and Aviation associated management
and advisory services.
2

Copyright – TBE International Limited 2013
1. Why is understanding aircraft ageing important?
2. Drivers of aircraft ageing
3. Ageing and Direct Maintenance Cost
4. Ageing and Maintenance Influenced Costs
5. Ageing and Indirect Maintenance Costs
1. Summary
Agenda
This presentation focuses on a complex topic and is intended as an
overview rather than a detailed description of the aircraft ageing topic
3

Copyright – TBE International Limited 2013 4
Why understand the Ageing Effect?
Airlines • Understand future maintenance costs
• Understand future hull requirements
• Plan for inventory requirements
• Plan fleet renewal programmes
MROs • Understand future labour requirements
• Understand market demand
• Facilities planning
Firstly….…. because its interesting!
• But understanding aircraft ageing has a more practical use
• Aircraft ageing can be considered the single most important maintenance cost variable
Copyright – TBE International Limited 2013
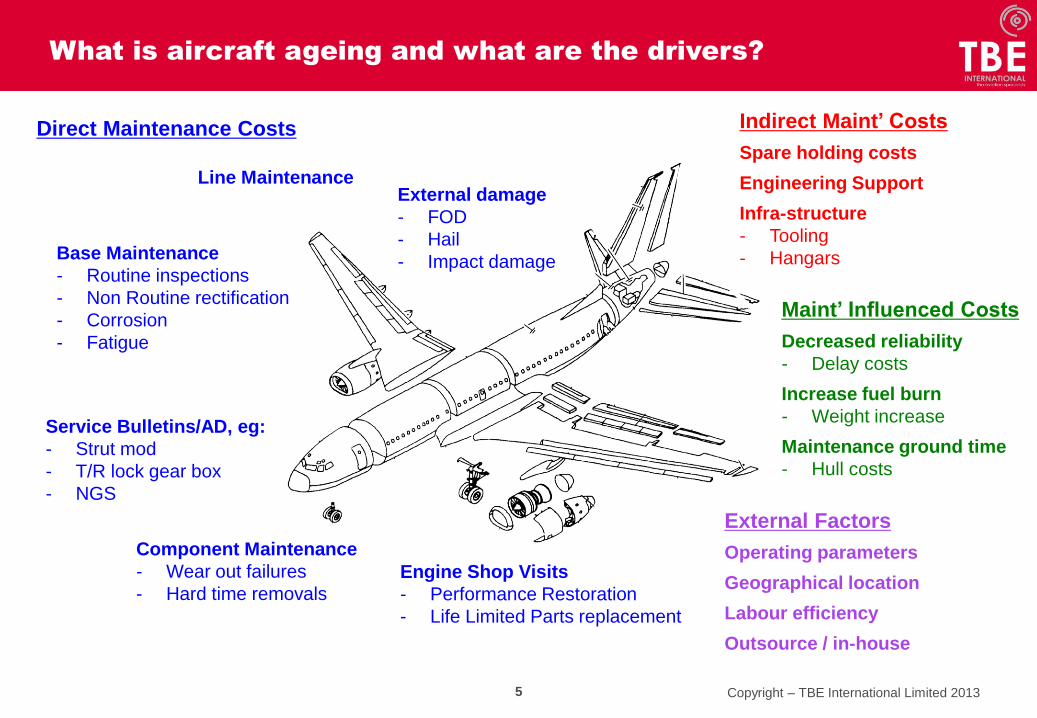
What is aircraft ageing and what are the drivers?
Service Bulletins/AD, eg:
- Strut mod
- T/R lock gear box
- NGS
5
Engine Shop Visits
- Performance Restoration
- Life Limited Parts replacement
External damage
- FOD
- Hail
- Impact damage
Component Maintenance
- Wear out failures
- Hard time removals
Line Maintenance
Base Maintenance
- Routine inspections
- Non Routine rectification
- Corrosion
- Fatigue
Maint’ Influenced Costs
Decreased reliability
- Delay costs
Increase fuel burn
- Weight increase
Maintenance ground time
- Hull costs
Direct Maintenance Costs
External Factors
Operating parameters
Geographical location
Labour efficiency
Outsource / in-house
Indirect Maint’ Costs
Spare holding costs
Engineering Support
Infra-structure
- Tooling
- Hangars

Copyright – TBE International Limited 2013
We will focus on these costs and their
influence on other elements
Aircraft Ageing Driver Tree
Operating
Costs
Associated
With
Aircraft
Ageing
6
Non Routine
factor
Routine
Maintenance
Maintenance
Influenced
Costs
Indirect
Maintenance
Costs
Infra-structure
(Tooling etc)
Engineering
Spares
Delay / Reliability
induced Costs
Fuel burn
Aircraft Hull / Maintenance
Ground time
Direct
Maintenance
Costs
On Aircraft
Line Maint
A/C Base
Maint
Off Aircraft
Component
Engine
Modifications
BER/Scrap
Routine wear out
Performance
Restoration
LLP / Hardtime
removals
External
Factors
- Operating
parameters
- Geographical
location
- Labour
efficiency
- Outsource /
in-house

Copyright – TBE International Limited 2013
OEM Ageing Curve
7
0
0.2
0.4
0.6
0.8
1
1.2
1.4
1.6
1.8
2
1 2 3 4 5 6 7 8 9 10 11 12 13 14 15 16 17 18 19 20 21 22 23 24 25 26 27 28 29 30
Ma
turi
ty / A
ge
ing
Fac
tor
Airframe Age
Pre-MSG3 MSG3 Millenium
• Most people have seen the typical OEM ageing curve
Can this be used equally for all the aircraft operating cost elements?
Source: Boeing

Copyright – TBE International Limited 2013
Direct Maintenance Costs
8
To understand how Direct Maintenance Costs are affected by ageing, consider
some real world examples…..

Copyright – TBE International Limited 2013 9
On Aircraft Maintenance
• For all On Aircraft Maintenance the major cost driver is labour …… so to simplify this presentation we will only consider Labour but in any full analysis material
should also be modeled.
• To conduct any meaning full analysis the data needs to be normalised, so we need to
introduce some concepts
Non Routine Maintenance:
• To understand how the amount of Non Routine changes with aircraft age
Actual Routine Labour Hours of the event
Actual Non Routine Labour Hours of the event For each event, Non Routine Maintenance Factor =

Copyright – TBE International Limited 2013
• First consider Non Routine Maintenance….. Its more interesting!
• Consider an actual example for a fleet of B744 aircraft…..
NR increases at ~ 4% per year
Easy right?
0
0.2
0.4
0.6
0.8
1
1.2
1.4
1.6
1.8
2
0 1 2 3 4 5 6 7 8 9 10 11 12 13 14 15 16 17 18 19 20 21
NR
/R F
ac
tor
Aircraft Age
NR/R Factor
0
0.2
0.4
0.6
0.8
1
1.2
1.4
1.6
1.8
2
0 1 2 3 4 5 6 7 8 9 10 11 12 13 14 15 16 17 18 19 20 21
NR
/R F
ac
tor
Aircraft Age
4A Check C Check D Check
A different picture if check type
is considered!
0
0.2
0.4
0.6
0.8
1
1.2
1.4
1.6
1.8
2
0 1 2 3 4 5 6 7 8 9 10 11 12 13 14 15 16 17 18 19 20 21
NR
/R F
ac
tor
Aircraft Age
4A Check C Check D Check
A checks do not show any increased NR findings with age 0
0.2
0.4
0.6
0.8
1
1.2
1.4
1.6
1.8
2
0 1 2 3 4 5 6 7 8 9 10 11 12 13 14 15 16 17 18 19 20 21
NR
/R F
ac
tor
Aircraft Age
4A Check C Check D Check
A checks do not show any increased NR findings with age
• C checks show the typical
ageing ‘bump’
• But 2 different rates of
Increase of NR findings
10
On Aircraft Maintenance – Non Routine Maintenance
0
0.2
0.4
0.6
0.8
1
1.2
1.4
1.6
1.8
2
0 1 2 3 4 5 6 7 8 9 10 11 12 13 14 15 16 17 18 19 20 21
NR
/R F
ac
tor
Aircraft Age
4A Check C Check D Check
A checks do not show any increased NR findings with age
• C checks show the typical
ageing ‘bump’
• But 2 different rates of
Increase of NR findings • The rate of NR findings increase at the same rate
for D checks and C checks (~4.2% - 5% / year)
• Magnitude of NR for each 1 hour of R is different
between C and D checks (due access and level
of inspection)

Copyright – TBE International Limited 2013
0
0.2
0.4
0.6
0.8
1
1.2
1.4
1.6
1.8
2
0 1 2 3 4 5 6 7 8 9 10 11 12 13 14 15 16 17 18 19 20 21
Ro
uti
ne
La
bo
ur
Ma
turi
ty F
ac
tor
Aircraft Age
4A Check C Check D Check
0
0.2
0.4
0.6
0.8
1
1.2
1.4
1.6
1.8
2
0 1 2 3 4 5 6 7 8 9 10 11 12 13 14 15 16 17 18 19 20 21
Ro
uti
ne
La
bo
ur
Ma
turi
ty F
ac
tor
Aircraft Age
4A Check C Check D Check
A checks do not show any increased routine findings with age
0
0.2
0.4
0.6
0.8
1
1.2
1.4
1.6
1.8
2
0 1 2 3 4 5 6 7 8 9 10 11 12 13 14 15 16 17 18 19 20 21
Ro
uti
ne
La
bo
ur
Ma
turi
ty F
ac
tor
Aircraft Age
4A Check C Check D Check
• C checks show the typical
ageing ‘bump’
A checks do not show any increased routine findings with age
0
0.2
0.4
0.6
0.8
1
1.2
1.4
1.6
1.8
2
0 1 2 3 4 5 6 7 8 9 10 11 12 13 14 15 16 17 18 19 20 21
Ro
uti
ne
La
bo
ur
Ma
turi
ty F
ac
tor
Aircraft Age
4A Check C Check D Check
A checks do not show any increased routine findings with age
• C checks show the typical
ageing ‘bump’
• The rate of Routine increase is the same for D
checks and C checks (~1.5% / year) but from
a different base
11
On Aircraft Maintenance – Routine Maintenance
• Consider the same fleet of B744 aircraft…..

Copyright – TBE International Limited 2013 12
On Aircraft Maintenance – Routine and Non Routine
• Putting together the Routine and Non Routine elements…..
0
0.2
0.4
0.6
0.8
1
1.2
1.4
1.6
1.8
2
2.2
0 1 2 3 4 5 6 7 8 9 10 11 12 13 14 15 16 17 18 19 20 21
R+
NR
La
bo
ur
Ag
ein
g /
Ma
turi
ty F
ac
tor
Aircraft Age
4A Check C Check D Check
A checks do not show any ageing effect
C and D checks exhibit an ageing effect of
~4.5% per year after maturity
Maturity at
5-10 years

Copyright – TBE International Limited 2013 13
Component Maintenance
• Component maintenance can be looked at via 2 mechanisms:
1. The number of removals or MBTUR/hard-time limit of each component
2. The cost of repair of each component when removed
• Follow the process
1. Consider the MBTUR of each rotable / repairable component fitted
2. Consider the Quantity per Aircraft (QPA) fitted
This will give the quantity of removals per year
3. Dissect removals into 1st, 2nd, 3rd etc removals
4. Apply a cost to each removal type
This will give the cost ageing curve for the aircraft

Copyright – TBE International Limited 2013
0%
10%
20%
30%
40%
50%
60%
70%
80%
90%
100%
0
20
40
60
80
100
120
140
160
180
200
0
50,0
00
100,
000
150,
000
200,
000
250,
000
300,
000
350,
000
400,
000
450,
000
500,
000
550,
000
600,
000
650,
000
700,
000
750,
000
800,
000
850,
000
900,
000
950,
000
1,00
0,00
0
Cu
mu
lati
ove Q
ty C
om
po
ne
nts
(%
)
Qty
Co
mp
on
en
ts (
Fre
qu
en
cy)
MBTUR
Cum Components Qty Components
The aircraft has ~ 1,000 Rotable and
Repairable components fitted with a
CMM and CLP > $5000
Component Maintenance, cont’
• Consider an example of an A330
• Operating at a utilisation of 4000 FH p.a, 8 FH/FC
14
A/C TSN after 25 years =
100,000 FH
• Now apply the QPA to obtain the quantity of removals

Copyright – TBE International Limited 2013 15
Component Maintenance, cont’
• This is only an arisings measure, now dissect the type of arisings
“Mature”
at 4-6 yrs
0
50
100
150
200
250
300
350
0 1 2 3 4 5 6 7 8 9 10 11 12 13 14 15 16 17 18 19 20 21 22 23 24 25
Co
mp
on
en
t R
em
ov
als
pe
r Y
ear
Aircraft Age
Avg increase in removals of
~0.2% per year
= effectively “flat”
Warranty
Period

Copyright – TBE International Limited 2013
0
50
100
150
200
250
300
350
1 2 3 4 5 6 7 8 9 10 11 12 13 14 15 16 17 18 19 20 21 22 23 24 25
Co
mp
on
en
t R
em
ova
ls p
er
Yea
r
Aircraft Age
5+ Removal 4th Removal 3rd Removal 2nd Removal 1st Removal
16
Component Maintenance, cont’
• Look at the ‘type’ of removals….
~150 of the annual removals
will be very low MBTUR
items eg: wheels, filters etc
• Why is this important? • The 1st removal is a lower cost than subs removals, ie: repair cost increases with age
Proportion of 1st / 2nd etc removals
decreases as the aircraft ages
• Now apply the different cost per event

Copyright – TBE International Limited 2013
0.6
0.7
0.8
0.9
1
1.1
1.2
1.3
0 1 2 3 4 5 6 7 8 9 10 11 12 13 14 15 16 17 18 19 20 21 22 23 24 25
Co
mp
on
en
t A
ge
ing
/ M
atu
rity
Fac
tor
Aircraft Age
Avg increase in costs after maturity
is ~0.4% - 0.5% per year
Warranty
Period
17
Component Maintenance, cont’
• Putting together the quantity of events and the relative cost per event a component cost
ageing curve can be developed

Copyright – TBE International Limited 2013 18
Engine Maintenance
• Analysing engine ageing can be difficult as internal component deterioration is only
financially relised once the engine as a ‘system’ is unserviceable
• This is further compounded by different on-wing and in-shop inspection limits
• A component (eg: blade) which is serviceable on-wing can be unserviceable if exposed in
the shop
• To observe the effect of ageing use a process similar to that used for component
maintenance
• Split Activity – engine SVs, module exposure and LLP replacement
• Apply Price – increase in scrap rates as individual components age

Copyright – TBE International Limited 2013 19
Engine Maintenance, cont’
• Consider a fleet of CFM56-7 engines
• Operating at a rating of 24,000lbs, 3.0 EFH/EFC and 8% T/O derate
0
1
2
3
4
5
6
0 1 2 3 4 5 6 7 8 9 10 11 12 13 14 15 16 17 18 19 20 21
US
D,M
illio
ns
Aircraft/Engine Age (Years)
Core Refurb LPT Refurb LLP Replacement
Avg TOW
10,500cyc
Avg TOW
9,500cyc
Avg TOW
8,000cyc
Core Engine
LLP Limit
Booster/LPT
LLP Limit
Pull fwd to
align with SV

Copyright – TBE International Limited 2013 20
Engine Maintenance, cont’
• Consider a different view…..
0
0.5
1
1.5
2
2.5
3
0 1 2 3 4 5 6 7 8 9 10 11 12 13 14 15 16 17 18 19 20 21
US
D,M
illio
ns
Aircraft/Engine Age (Years)
Core Refurb Booster/LPT Refurb LLP Replacement
• Core Refurb costs increase
over time due to increased
scrap/repair costs
• LLPs generally do not
exhibit ‘ageing’ as cost is
driven by a regulatory limit
• Booster/LPT refurb costs
would also exhibit
‘ageing’ effects if
projected out far enough

Copyright – TBE International Limited 2013
0
0.2
0.4
0.6
0.8
1
1.2
1.4
0 1 2 3 4 5 6 7 8 9 10 11 12 13 14 15 16 17 18 19 20 21
Ag
ein
g / M
atu
rity
Fa
cto
r (U
SD
/EF
C)
Aircraft/Engine Age (Years)
Core Booster/LPT LLP Total
21
Engine Maintenance, cont’
• Looking at a cost per EFC
The steps represent the
ageing effect

Copyright – TBE International Limited 2013 22
Modifications
• We haven’t addressed modifications in any of the previous examples
• Modifications can be classified in 2 categories:
1. Safety
• ADs and mandatory SBs
• Risk reduction modifications
• Ageing aircraft modifications
2. Economic
• Any non safety modification should have
some form of economic break even for the
airline
• Not necessarily from maintenance cost
• These increase with age
• But can affect young aircraft
• Aircraft type specific or ‘global’
• The magnitude of modifications
will increase with age
• These should ‘pay back’ within
a specific time hurdle
• The key is to have a structured and robust modification evaluation process
within the airline

Copyright – TBE International Limited 2013
Maintenance Influenced Costs
23
To understand how Maintenance Influenced Costs are affected by ageing, consider
some real world examples…..

Copyright – TBE International Limited 2013 24
• Generally, maintenance ground time is proportional to labour hours spent on the aircraft
• So it follows that a similar curve to the airframe labour ageing curve also applies to
ground time
Effect of Ground time
0
0.2
0.4
0.6
0.8
1
1.2
1.4
1.6
1.8
2
2.2
0 1 2 3 4 5 6 7 8 9 10 11 12 13 14 15 16 17 18 19 20 21
R+
NR
La
bo
ur
Ag
ein
g /
Ma
turi
ty F
ac
tor
Aircraft Age
4A Check C Check D Check
Potential
120%
increase in
TAT in the
first 6 years
Potential 30% increase in
TAT in 7 years after
maturity
Variability increases as age
increases effecting turn time

Copyright – TBE International Limited 2013 25
1 3 5 7 9 11 13 15 17 19 21 23 25 27 29 1 3 5 7 9 11 13 15 17 19 21 23 25 27 29 31 2 4 6 8 10 12 14 16 18 20 22 24 26 28 30 1 3 5 7 9 11
1 2 3 4 5 6 7 8 9 10 11 12 13 14 15 16 17 18
SeptemberJune July August
98% 98% 98% 98% 98%98% 98% 98% 98% 98% 98%98% 98% 98% 98% 98% 98%
GREEN = check yield <98%, ORANGE = check yield 98-99%, RED = check yield 100%
1 2 3 4 5 6 8 9 10 12 13 14 16
7 11 15 100%
99%
100%
99% 99% 100%
100%
99%98% 98% 98% 99% 99% 100% 99% 100%
With an extension of 2 days in TAT (6 to 8 days => 33% increase)
1 2 3 5 7 9 11 13 15 17 19
4 6 8 10 12 14 16 18 20 95%
96%96%
97% 96% 96% 96% 95%98% 97% 97%
98% 98% 98%98% 98% 97% 97% 97% 96%
This generally turns into 2 lines of maintenance
Effect of Ground time, cont’
• This only considers a single check type – obviously this will be compounded for every
D check cycle due to the addtional turn time associated with a D check
• Consider a maintenance planning scenario – simplified for illustration:
• A single line of maintenance, 6 day TAT, 18 month maint interval and 98% interval utilisation

Copyright – TBE International Limited 2013 26
Ground Time can be viewed in economic terms as:
1.Revenue Potential of Aircraft, but only count it if this is ‘real’ • The measure is actual revenue $
2. Hull Cost, this is always ‘real’ if a hull can be saved/deferred
• The measure is the ownership cost of hull (lease costs etc)
Effect of Ground time, cont’
• When considering ground time in an economic sense it is effectively the opportunity cost
of an aircraft
• The opportunity cost relates to: • The revenue making potential of the aircraft if it were in service
• The value of an extra hull
• Consider the dry lease rates of: • B738/A320 = US$180K-300K per mth (US$2.2M-3.6M p.a.)
• A330 = US$490K-790K per mth (US$5.9M-9.5M p.a.)
• B773ER = US$1M-1.2M per mth (US$13-14M p.a.)

Copyright – TBE International Limited 2013
Management Strategy or
there is no age related DR decrease?
27
Dispatch Reliability
• There are some issues when looking at long term Dispatch Reliability trends
1. The airplane can fly multiple mission types throughout its life
2. Schedule constraints vary over time
3. Availability of ‘spare’ hulls in network is an issue
4. Availability of spares to recover the aircraft
• But, there is a general ‘feeling’ that Dispatch Reliability decreases with aircraft age
• But by how much, if at all?
• Although, consider that many airlines operate ‘older’ fleets quite successfully where
dispatch reliability is critical
• Delta
• UPS / Fedex
Dispatch Reliability can be significantly affected by External Factors

Copyright – TBE International Limited 2013 28
Dispatch Reliability, cont’
93%
94%
95%
96%
97%
98%
99%
100%
0 1 2 3 4 5 6 7 8 9 10 11 12 13 14 15 16 17 18 19 20 21
Dis
patc
h R
eli
ab
ilit
y <
15m
in
Aircraft Age
Avg Dispatch Reliability / Qtr
• Consider a long haul fleet which has which has been operating a similar route structure
for its life….
Poor EIS experience,
resulting in an OEM
working group
Mature ‘stable’ region
~ up to 2nd D check
Ageing region where
variability increases and DR
decreases ~0.1% per year
• Recall that Line Maintenance labour didn’t exhibit ageing but dispatch reliability seems to
decrease…… in this case it was due to unique failures on the line rather than volume of work

Copyright – TBE International Limited 2013
In-Direct Maintenance Costs
29
• In-direct Maintenance costs do have a link to Direct Maintenance costs changes and can
be considered ‘Direct Maintenance Support Costs’
Spare holding costs
- Inventory acquisition and mgt
- Warehousing
- Obsolescence
Engineering Support
- Repair schemes
- Maintenance system content / hosting
- SB/AD review
Infra-structure
- Hangar costs
- Tooling
DMC Ageing Link
Component Ageing
- MBTUR
- Repair TAT
Airframe Ageing
- Routine elements
- Non routine elements
Airframe Ageing
- Routine elements
- Non routine elements

Copyright – TBE International Limited 2013
No visible labour impact, but
reliability is impacted (see reliability)
Linked to ground time, non routine
factors
Both Routine and Non Routine
exhibit ageing effects (see graph)
Event / MBTUR and subsequent
repair cost driven
Costs are event driven, large impact
of external factors
Increases due to weight, non-flush
repairs, panel warping
Generally proportional to labour
increase + ‘unusual defects’
Dispatch reliability decreases with
age, unique defects
Linked to ground time, non routine
factors
Linked to MBTUR, repair TAT and
non routine
Putting it all together….
Operating
Costs
Associated
With
Aircraft
Ageing
Spares
Infra-structure
(Tooling etc)
Engineering
Fuel
Delay / Reliability
induced Costs
Aircraft Hull / Maintenance
Ground time
Line Maintenance
Base Maintenance
Component Maintenance
Engine Maintenance
30
Maintenance
Influenced
Costs
Indirect
Maintenance
Costs
Direct
Maintenance
Costs

Copyright – TBE International Limited 2013 31
Summary
• If conducting an ageing analysis for fleet renewal purposes don’t forget to
include the ‘Maintenance Influenced Costs’
• These can have a significant effect (sometime more than Direct Maintenance)
• This IS NOT an exact science, all aircraft age differently, there is no one rule,
consider • Aircraft type
• Your operating parameters
• Your geographical location
• Labour efficiency
• Insource/outsource
• There are multiple ageing mechanisms and each are different
• There are commercial management strategies to limit / manage
exposure of ageing • But that will be a topic for another day !

Copyright – TBE International Limited 2013
32 TBE…Capability through people…
Thank You!

Copyright – TBE International Limited 2013 33
For further information please contact:
Tom Bemstein
TBE International Limited
Level 19, Two International Finance Centre.
8 Finance Street,
Central. Hong Kong.
Phone: +852 3101 7286
Fax: +852 3101 7287
Email: [email protected]
or
[email protected] (direct)
Related Documents