1 The Effect of Advertising on Consumer Buying Behavior: The case of Nifas Silk Paints Factory By Asnake Meshesha Addis Ababa University School of Commerce Department of Marketing Management Masters Program - Marketing Management Addis Ababa June, 2018

Welcome message from author
This document is posted to help you gain knowledge. Please leave a comment to let me know what you think about it! Share it to your friends and learn new things together.
Transcript
1
The Effect of Advertising on Consumer Buying Behavior:
The case of Nifas Silk Paints Factory
By
Asnake Meshesha
Addis Ababa University
School of Commerce
Department of Marketing Management
Masters Program - Marketing Management
Addis Ababa
June, 2018
2
The Effect of Advertising on Consumer Buying Behavior:
The case of Nifas Silk Paints Factory
Advisor
Dr. Mesfin Workneh
A Project Proposal Submitted to the Addis Ababa University School
of Commerce - in Partial fulfillment of the requirements for the
Master of Arts Degree in Marketing Management
Addis Ababa
June, 2018

3
ADDIS ABABA UNIVERSITY
SCHOOL OF COMMERCE GRADUATE STUDIES
MA PROGRAM
The Effect of Advertising on Consumer Buying Behavior:
The case of Nifas Silk Paints Factory
By: Asnake Meshesha
Approval Board Committee
Advisor: Dr. Mesfin
Signature: _____________________Date: __________________
External Examiner: Dr. Workineh
Signature: _____________________Date: _____________________
Internal Examiner: Dr. Getie
Signature ______________________ Date: ___________________
4
Statement of Certification
This is to certify that Asnake Meshesha has carried out his research work on the topic entitled:
The Effect of Advertisement on Consumers Buying Behavior (The Case of Nifas Silk Paints
Factory). The work is original in nature and is suitable for submission for the award of Masters
Degree in Marketing Management.
______________________________
Advisor: Dr. Mesfin Workneh
Date: _______________________

5
Declaration
I, Asnake Meshesha , declare that this research paper entitled “The Effect of Advertising on
Consumers Buying Behavior (The case of Nifas Silk Paints Factory)” is my original work and
has not been used by others for any other requirements in any other university and all sources of
information in the study has been appropriately acknowledged.
____________________
Asnake Meshesha
Date____________

i
Acknowledgements
First of all I would like to thank the almighty God who gave the strength, patience, guidance in
my life. Next my most sincere and deepest thanks goes to, my advisor Dr. Mesfin Workneh, for
his unreserved and timely support in checking and giving constructive suggestion. Finally I
would like to thank my family for giving me support and encouragement throughout the school
year.
ii
Table of Contents
Content Page
Acknowledgement. i
Table of Content ii
List of Tables v
List of Figures vi
Acronyms vii
Abstracts viii
CHAPTER ONE: INTRODUCTION……….……………………….…………………… 1
1.1. Background of the study…………………………….…………………….…..……1
1.2. Statement of the problem……………………………………..………….……..….4
1.3. Research Questions……...………………………………………..………......…...6
1.3.1. The Main Research Question…................................................................6
1.3.2. Sub-Research Question …………………………………………………………....6
1.4. Aim and Objectives of the study…………………….………………......….......6
1.4.1. Aim of the study………………………………………………………………6
1.4.2. Objectives of the study………………………………………………………6
1.5. Significance of the study…………………………………..…….…….……………7
1.6. Scope of the study………………………….………………………………….….….7
1.7. Limitation of the study…………………………………………………..…..….... 8
1.8. Definition of Terms………………………………………..…………….…….…….8
1.9. Organization of the study……………………….…………………..…….……….9
CHAPTER TWO: REVIEW OF RELATED LITERATURE…………………….................10
2.1. Theoretical Frame work……………………………………………………………...10
2.2. Models of Advertisement……………………………………….………………....…11
iii
2.2.1. AIDA Model……………………………………..………………….…..…….……...11
2.2.2. Foote, Cone and Belding (FCB) Mode…................................................13
2.3. Concept of Consumers Buying Behavior ……………….…………...…….…...15
2.4. Models of Consumer Behavior………………………………….……………..…..16
2.5. Advertisement Media ……………………………………………….…………..…...16
2.5.1. Print Media Advertising……………………….……………….………….………16
2.5.2. Electronic or Broadcast Media Advertising ……………………………….....26
2.6. The Influence of Ad. Media on consumers buying behavior…………………17
2.6.1. Influence of Television AD on Consumers Buying Behavior………………17
2.6.2. Influence of Newspaper AD on Consumers Buying Behavior…………….18
2.6.3. Influence of Radio AD on Consumers Buying Behavior……….……..……19
2.7 AD Characteristics and Consumers Buying Behavior…………………………20
2.7.1. Relationship between Impressive AD and Consumers Buying
Behavior…………………………………………………………………………20
2.7.2. Relationship between simple to understand AD and Consumers Buying
Behavior…………………………………………………………………….…………21
2.7.3. Relationship between A. Grabbing AD and Consumers Buying
Behavior……………………………………………………………..……………..22
2.7.4. Relationship between Memorable AD and Consumers Buying
Behavior…………………………………..……………………………………….23
2.7.5. Relationship between Creative AD and Consumers Buying
Behavior……………………………………………….…………………………..24
2.7.6. Relationship between Honest AD and Consumers Buying
Behavior…………………….…………………………………….……………24
2.8. Research Gap……………………………………………………...…………………..25
2.9. Conceptual Frame Work………………………………………....………….………26
CHAPTER THREE: RESEARCH METHODOLOGY…………………….…….…….28
3.1. Research Approach …………………………………….…………………….….…..28
3.2. Research Design……………………………………………………….………………29
3.3. Data types and Data sources……………………………………………………….30
iv
3.4. Population of the study……………………………………………………….……..30
3.5. Sampling Procedure……………………………………………………….….……...30
3.5.1. Sample Size…………………………………………………..……………….……..32
3.5.2. Sampling Technique………………………………………………………………..32
3.6. Data Collection Instrument ……………………………………..………….……..32
3.7. Data Collection Procedure ……………………………..………………………..…32
3.8. Data Analysis ………………………………………………………………………….33
3.8.1. Descriptive Statistics ……………………………….…………………..…………33
3.8.2. Correlation …………………………………………………………………..………33
3.8.3. Multiple Linear Regressions………………………………………………………33
3.9. Ethical Consideration ………………………………………………………...……..35
CHAPTER FOUR: RESULTS AND DISCUSSION…………………………..………36
Introduction……………………………………..……………………………………………36
4.1. Response Rate…………………………………………………..……….…………….36
4.2. Characteristics of the respondents……………………………….……………….36
4.3. Result and Discussion…………………………………..………………....………..39
4.3.1. Result of the Descriptive Statistics…………………………………….……….39
4.3.1.1. Media of Advertisement, which influence Consumers Buying
Behavior…………………………………………………………………..………39
4.3.1.2. Trend of Consumers purchasing after Advertisement……………………40
4.3.1.3. Trend of recommending NSP Products by Consumers………..…………40
4.3.2. Reliability of the data………………………………………………………………41
4.3.3. Results of the Correlation Analysis…………………..…………………….…..41
4.3.4. Correlation Matrix…………………………………………………………………..41
4.3.5. Hypothesis testing…………………………………………..……………………..43
4.3.6. Preliminary test results……………………………………………………………45
4.3.6.1. Normality…………………………………………….…………………….………45
4.3.6.2. Linearity………………………………………………………………………….…46
4.3.6.3. Homoscedasticity…………………………………………………………………46
4.3.6.4. Independent of Residuals………………………………………………………47
v
4.3.6.5. Multicollinearity……………………………………………………..……………47
4.3.6.6. Overall Model Fit of the Regression Model………………………….………48
4.3.6.7. Model Summary…………………………………………………………..………48
4.3.6.8. Beta Coefficient……………………………………………………………………49
4.3.7. Result of the Regression Analysis………………………………………….……50
4.3.8.Discussion…………………………………………………………………….………52
CHAPTER FIVE……………………………………….…………………………..……………….56
SUMMARY, CONCLUSIONS, RECOMMENDATIONS
& IMPLICATIONS FOR FUTURE RESEARCH………………………………..……….56
5.1. Summary of the Findings……………………………………….………...............56
5.2. Conclusions………………………………..…………………..………………………57
5.3. Recommendations……………………………………………………….……………58
5.4. Implication for future research…………………………………………….………59
References
Appendix
vi
List of Tables
Table 1 Age of the respondents………………………………...………..……………..36
Table 2 Sex of the respondents …………………………………..………..…………..37
Table 3 Educational level of the respondents……………………………………..…37
Table 4 Income of the respondents…………………………..………….…………….38
Table 5 Marital status of the respondents…………………………..…..…..………38
Table 6 Reliability of variables………………………………………..…………..…….41
Table 7 Correlation Matrix………………………………………………….……………42
Table 8 Descriptive Statistics of Normality………………………………………..…45
Table 9: Multicollinearity Test by Computing Tolerance Values and Variance
Inflation Factor (VIF)…………………………………….………………47
Table 10: (ANOVA) Overall Model Fit of the Regression Model……………………48
Table 11: Result of Multiple Regressions (Model Summary)………………………48
Table 12: Regression Coefficient of Independent Variables…………………….….49
Table 13: Result of Multiple Regressions…………………………………….…..……51
Table 14: Summary Result of the Regression Analysis………..………………….55
vii
List of figures
Figure 1 Advertisement Model (AIDA/ DAGMAR)………...……..…………...…..…13
Figure 2 Advertisement Model (FCB)……………………………….…..….……….….13
Figure 3 Conceptual Framework…………………………………………….……………………27
Figure 4 Media of Advertisement, which influence NSP’s Consumers Buying
Behavior………………………………………………..………………….….39
Figure 5 Trend of Consumers purchasing after Advertisement…………..………40
Figure 6 Trend of recommending NSP Products by Consumers………..….…….40
Figure 7 Scatter Plot for Linearity and Homoscedasticity…………………..…..…46
viii
ABBREVIATIONS AND ACRONYMS
AD: Advertisement
IAD: Impressive Advertisement
SUA: Simple to Understand Advertisement
AGA: Attention Grabbing Advertisement
MAD: Memorable Advertisement
CAD: Creative Advertisement
HAD: Honest Advertisement
CBB: Consumer Buying Behavior
NPA: Newspaper Advertisement
RAD: Radio Advertisement
TVA: Television Advertisement
NSPF: Nifas Silk Paints Factory
SPSS: Statistical Package for Social Sciences
FCB: Foote, Cone and Belding
ix
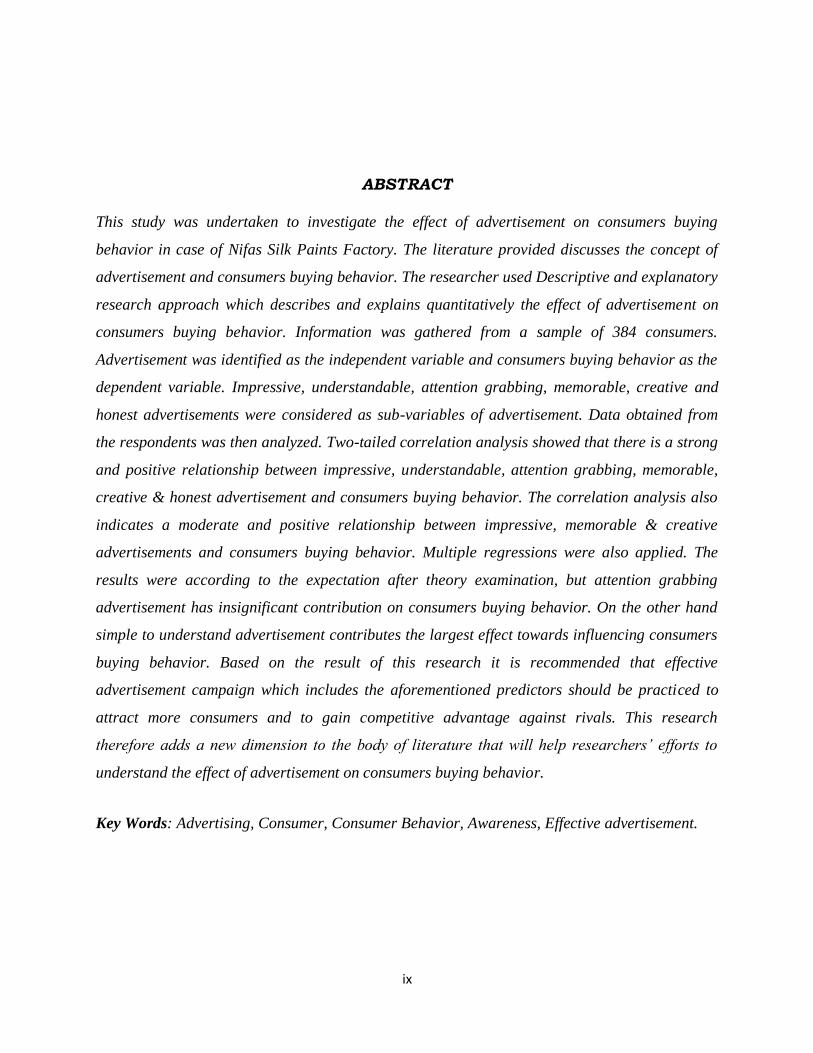
ABSTRACT
This study was undertaken to investigate the effect of advertisement on consumers buying
behavior in case of Nifas Silk Paints Factory. The literature provided discusses the concept of
advertisement and consumers buying behavior. The researcher used Descriptive and explanatory
research approach which describes and explains quantitatively the effect of advertisement on
consumers buying behavior. Information was gathered from a sample of 384 consumers.
Advertisement was identified as the independent variable and consumers buying behavior as the
dependent variable. Impressive, understandable, attention grabbing, memorable, creative and
honest advertisements were considered as sub-variables of advertisement. Data obtained from
the respondents was then analyzed. Two-tailed correlation analysis showed that there is a strong
and positive relationship between impressive, understandable, attention grabbing, memorable,
creative & honest advertisement and consumers buying behavior. The correlation analysis also
indicates a moderate and positive relationship between impressive, memorable & creative
advertisements and consumers buying behavior. Multiple regressions were also applied. The
results were according to the expectation after theory examination, but attention grabbing
advertisement has insignificant contribution on consumers buying behavior. On the other hand
simple to understand advertisement contributes the largest effect towards influencing consumers
buying behavior. Based on the result of this research it is recommended that effective
advertisement campaign which includes the aforementioned predictors should be practiced to
attract more consumers and to gain competitive advantage against rivals. This research
therefore adds a new dimension to the body of literature that will help researchers’ efforts to
understand the effect of advertisement on consumers buying behavior.
Key Words: Advertising, Consumer, Consumer Behavior, Awareness, Effective advertisement.
1
CHAPTER ONE: INTRODUCTION
This is an introductory chapter. It lays the foundation of the study. It highlights the relevance of
advertisement based on its effect on consumers buying behavior by taking in to consideration
NSPFs‟ advertisement campaign and practices. It provides background of the study, statement of
the research problem, research objectives, research questions, significance of the study, scope
and limitation of the study, definition of terms and the organization of the study.
1.1 Background of the study
Today‟s world is more turbulent, chaotic and challenging than ever before (Kanter, 1995). It is
not enough for a business to have good and quality products or services sold at appealing prices.
To generate sales and profits, the benefits of products have to be communicated to consumers via
different channels. In marketing, this is commonly known as promotion. A business‟ total
marketing communication program is called the promotional mix and consists of a combination
of advertising, personal selling, sales promotion, public relation and direct marketing (Kotler,
2012).The organization has to deliver the message about the product to its consumers through
well-organized marketing strategy. Of all the marketing tools, advertisement is an effective way
to influence the mind of viewers and gives viewers‟ exposure towards a particular product or
service (Katke, 2007).
Advertising is a component of promotional mix, which is used to create awareness about
products and services for influencing purchase decisions. Marketers use these types of tools for
communication Purposes. Nowadays, advertising has become one of the crucial commercial
activities in the competitive globalized business environment.
According to Arens (2005), advertising is a form of communication intended to convince an
audience (viewers, readers or listeners) to purchase or take some action upon products,
information or services.
The American Marketing Association has defined consumer behavior as, “the dynamic
interaction of affect and cognition, behavior and the environment by which human beings
2
conduct the exchange aspects of their lives.” Peter (1995) expressed consumer behavior as,
“…..the actions and decision processes of people who purchase goods and services for personal
consumption. According to Morris (1998), consumer behavior has two aspects: the final
purchase activity which is visible to us and the decision process which may involve the
interaction of a number of complex variables not visible to us. As a matter of fact, purchase
behavior is the end result of a long process of consumer decision-making (Duffy, 2005).
According to Folkes (1984), the term consumer is used for both personal consumers and
organizational consumers and represents two different kinds of consuming entities.
In these classifications, the goods are bought for final use by those referred to as “end users” or
“ultimate consumers.” The other category of consumer is the organizational consumer, which
includes profit-focused or not for profit organizations (NGOs). Government agencies and
institutions (such as local or state government, schools, hospitals and etc.) buy products,
equipment and services needed for running these organizations. Manufacturing firms buy raw
materials to produce and sell their own goods. They buy advertising services to communicate
with their customers (Webster, 1992).
Advertisement has become one of the most crucial commercial activities in the modern
globalized and digitalized environment. Companies allocate large part of their budget to execute
and run advertisements to communicate information about their services and products.
Companies hope that consumers will purchase their products as a result of advertisements, which
deliver messages about a certain brand and products. McDaniel (1998) stated that the best
prophet for purchase is advertising. Technologies advance rapidly day by day, contributing to the
constant renewal of and changes in broadcasting forms. Among those forms, advertising media is
widely used. Advertisements are a kind of persuasive communication that offers product
information to every consumer via institutions in charge of production or supply. In a complete
study of marketing and promotional activities, advertising usually plays the most important role
(Arens, 1996).
3
Advertisement can be done through different media. The most widely used are print medium
(newspapers, magazines and brochures), outdoor medium (billboards and events) and broadcast
medium (television, radio and internet) (Bearden, 1999).
The main aim of advertising is to impact on buying behavior. However, this impact about brand
is changed and strengthened frequently by peoples‟ memories. Memories about the brand consist
of those associations that are related to brand name in the consumer mind. These brand
cognitions influence consideration, evaluation, and finally purchases (Romaniuk and Sharp,
2004).
The advertising has a foremost and vital effect on purchasing behavior of consumers. If an advert
is effective enough to impress, the viewer will be more willing to pay attention to it and is less
likely to avoid the advert the next time it is shown (Biel, 1990); therefore it will get more
exposure, because of the positive first impression. This awarded attention creates an opportunity
to facilitate consumer involvement, increasing the ability to motivate and affect behavior (Gary,
1999). Furthermore, the increased repetition of viewing the ad, due to impression, enhances the
salience of the advert in memory (Ehrenberg, 1974).
The country has been in building boom for some time now tall buildings, including Real Estate is
rising in many places especially in the capital city, Addis Ababa. Recently Addis Ababa was
recognized as one of the top 10 destination cities in the world that tourists are interested to visit.
Due to this reason demand for different items and the purchasing power of the citizens is
increasing. Consequently different types of firms are competing to obtain their target customers‟
attention. Accordingly, most of the firms use advertisement as an important marketing tool to
survive in this competitive environment. One of these firms is NSPF. NSPF manufactures and
markets paints. The company‟s products include paints, varnishes, and lacquer.
Paints industry is mainly categorized as decorative/ architectural paints and industrial paints
sectors. Decorative paints are used mainly for painting interior and exterior of houses, office
buildings, and factories. Industrial paints include automotive paints, marine paints, protective
paints and special purpose coatings. On the ground of rapidly increasing demand for the
decorative paints in consequence of increase in building, shelter and other governmental and
4
private constructions, the decorative paints industry is competitively growing today. On account
of this preferable situation, the Nifas Silk Paint Factory focuses to offer user friendly and
environmental friendly decorative paints.
The current study focuses on the characteristics of advertisement being practiced in NSPF that
has an effect on consumers buying behavior. At the end of the research, the results will suggest
the best mix of advertisement package, the basic and details of consumers buying behavior, the
ability on how the managerial employees of the organization attract and influence their
consumers. Furthermore, this study will assess the effect of advertising on consumers buying
behavior in case of NSPF.
1.2 Statement of the Problem
In today‟s competitive and volatile environment all marketers including paint manufacturing
companies communicate with their target markets through advertising (Mittal & Pachauri, 2013).
According to Mittal and Pachauri (2013), the way of their communication and the information
contained in the advertising is not strong enough and pertinent enough to attract the attention of
the consumers. Since the information is too weak or too irrelevant, the advertising has no chance
of having an effect on consumers‟ buying behavior of their products or services.
Advertising must be consistent enough so that it will be accepted and bring an effect on
consumers‟ buying behavior when judged against information previously processed and held in
long – term storage (Schultz & Tannenbaum, 1988).
According to Geisler (1987), the consumer is more likely to associate with advertisements of
those brands, which have emotional values and messages. This is so because, positive emotional
appeals provide a strong brand cue and stimulate category-based processing. If the categorization
process is successful, then the effect and beliefs associated with this category in memory are
transferred to the object itself (Stone, 1982).
According to Beccera and Gupta (1999), advertising is also part of the total cost of a firm,
although it is different compare to production cost and selling cost. Nonetheless, advertising cost
is taken as part of the selling and distribution expenses, which implies that it increases the cost of
5
production of the firm in modern business. In addition, if advertising escalates production cost
why and how are firms still engaging in this practice? These issues will be analyzed and
investigated in this research.
Advertising is costly; often its effects are uncertain, and sometimes it takes a while before it
makes any impact on consumers‟ buying behavior. It is for these reasons that many companies
think it appropriate, occasionally to reduce expenditures on advertising or to entirely eliminate it.
On the other hand, some companies sometimes consider it unnecessary to advertise when their
brands are already enjoying great success without advertisement. Such behavior implicitly fails
to consider the fact that advertising is not just a current expense or mere exercise but an
investment.
As companies are spending large amount of investment on the advertisement because they want
to keep their product at the top of the customer‟s mind. Advertisement has proven to be a
successful tool for the communication but companies are still in the confusion that what kind of
ingredients should be there and how do these advertisements will help to change the consumer
buying behavior.
Several related studies have been conducted on this area but most of studies concentrated on
advertisements in general. Farashah (2011) researched on the impact of advertisement in
manufacturing company, Kumar (2003) researched on the role of advertising in consumer
decision making, while Raju (2002) researched on the impact of advertisement on consumer
behavior. Moreover, the above studies focused on different organizations but none got to deal
with the effect of advertisement on consumers buying behavior in case of Nifas Silk Paints
factory. The paint Industry and market is an essential market because we all identify with it. All
buildings we find shelter in have paint without and within them hence it is necessary to shed
light on this market.
Hence, the proposed study is attempted to address the knowledge gap by describing advertising
characteristics (Impressive, Simple to Understand, Attention Grabbing, Memorable, Creative and
Honest) which have an effect on consumers buying behavior in case of Nifas Silk Paints Factory
(NSPF).
6
1.3. Research Questions
1.3.1. The main Research Question
Does Advertising affect consumer buying decision?
1.3.2. Sub-Research Questions
1. Which advertisement media has more influence on consumers buying behavior?
2. Do advertising characteristics have direct relationship with consumers buying behavior?
3. How do advertising characteristics affect consumers buying behavior?
1.4. Aim and Objectives of the study
1.4.1. Aim of the study
This research employed statistical techniques such as Descriptive Statistics, Correlation and
Multiple Regression to investigate the effect of advertising on consumer purchase behavior in
case of NSPF. The research would perform surveys in order to obtain needed information to
attain the objectives of the study. Furthermore, this study would assess relevant literature review
on the same topic.
1.4.2. Objectives of the study
Essentially, this research aspires to study the topic through reviewing related articles and also by
getting the perceptions of knowledgeable individuals regarding the topic through surveys. These
individuals are the consumers/customers of products and services offered by NSPF.
The major objective of this study is to observe and determine the effect of advertising on
consumer buying behavior. Moreover, this study focuses on the following specific objectives.
1. To find out which advertisement media has more influence on consumers buying
behavior.
2. To ascertain the direct relationship between advertising characteristics and consumers
buying behavior: and
3. To investigate how advertising characteristics affect consumers buying behavior.
7
1.5. Significance of the study
This research attempted to identify its significance to: The Company, Academics and the
Researcher.
This study would describe the effect of advertisement variables that influence the buying
decision of NSPF consumers. Understanding of variables such as whether the advertisement is
Impressive, Simple to Understand, Attention Grabbing, Memorable, Creative, Honest by the
target customers would help further understanding, how these variables affect the decision
making of consumers. It would help NSPF marketing department to better reposition its
advertising strategy, to capture the target market and to boost sales over times. The study is
expected to improve the advertising and promotional strategies of the investigated organization
by providing practical information about core advertisement issues. The findings of this study
will contribute and complement the already existing knowledge and literature on the relationship
between advertisement and consumers buying behavior.
To academics therefore, this work would provide a basis for further research works. To further
achieve this, relevant and authentic references will be cited.
The researcher is an advertising practitioner; hence, embarking on this work will increase his
knowledge of effective media planning. Above all, this study will be requirements in partial
fulfillment of Master of Arts Degree in marketing management, AAU School of Commerce.
1.6. Scope of the study
Advertising effectiveness has been researched by numerous methods in the past, mainly focusing
on recognition, recall, opinion, brand-awareness, associations and ratings e.g. Lucas and Britt
(1963). However, this study considers the following advertising characteristics as a measure of
effect on consumers buying behavior: namely advertisement being Impressive, Simple to
Understand, Attention Grabbing, Memorable, Creative and Honest.
As it is mentioned earlier there are different types of media for delivering advertisement
messages, however, the current study focuses mainly on TV, Newspaper and Radio
8
advertisements. Currently, the users of NSPFs product distributed throughout the country, but
this study only targets those buyers with in Addis Ababa.
The methodology of this study used descriptive and explanatory research approach of one
particular area. These designs were selected because it would have an advantage of producing
good amount of responses from a wide range of people. This approach would provide a
meaningful and accurate picture of events and seek to explain people‟s perception and behavior
on the basis of the data to be collected.
1.7. Limitations of the study
The study used convenient and purposive sampling. In convenient sampling technique the
sample selection process continuous until the required sample size would be reached. It involves
selecting randomly those cases that are easiest to obtain the required sample (Zikmund, 2003).
The commitment of respondents to carefully read and give their genuine responses to the
questionnaires will seriously limit the outcome of the research. Availability of relevant reading
materials in the course of conducting the research is also another limitation of this study.
The researcher would overcome the above stated limitations through his strong commitment by
devoting time and efforts. The researcher prepared the questionnaire which is simple to read and
understand by using simple words to all respondents.
1.8. Definition of Terms
Advertising
Any paid form of non-personal communication about an organization, product, service or idea by
an identified sponsor (Belch, 2012).
Consumer
According to Schifman (2010), a consumer is a person who identifies a need or desire, makes a
purchase, and/ or desire, makes a purchase, and/or disposes of the product.
9
Consumer Behavior
The processes involved when individuals or groups select, purchase, use or dispose of products,
services, ideas or experiences to satisfy needs and desires (Maria, 2008).
Awareness
According to Ashcroft and Hoey (2001) awareness is the cognitive stage to attract customers and
is the first step of communication process.
Effective advertisement
Effective advertisement is described as a paid form of communicating a message which is
persuasive, informative, and creative designed to influence purchasing behavior or thought
patterns and meets the goals that it set out to do Colley (1984).
1.9. Organization of the study
This study attempted to analyze the advertisement practice being carried out at NSPF that has an
effect on consumers buying behavior. Accordingly, it is organized in five chapters. The first
chapter introduces the background of the study, definition of terms, statements of the problem,
basic research questions, objectives, significance, delimitation, limitations and organization of
chapters. The second chapter addresses the detail review of theoretical and empirical literatures
on concept of advertisement and its effect on consumers buying behavior. It also explains the
theories and concepts available on advertising styles & consumer behavior. The third chapter
presents the methodology used in the study. The fourth chapter comprises the detail analysis and
discussion of the data to be collected for the study. The fifth chapter includes summary of
findings, conclusions, recommendations and implications for future research.
10
CHAPTER TWO: REVIEW OF RELATED LITERATURE
Introduction
In order to answer the research questions several steps were taken. One of these steps is
reviewing relevant concepts and theories about advertisement and consumers buying behavior.
Hence, this chapter reviews literatures on this topic. This will be organized under three major
themes, theoretical framework on the topic, empirical evidence on the topic and observed
research gap. At the end of this chapter the conceptual framework and hypotheses for the study
will be presented.
2.1. Theoretical Framework
In the early 20th
century, psychologists Walter D. Scott and John B. Watson contributed Applied
Psychological theory to the field of advertising. Scott asserted that “Man has been called the
reasoning animal but he could with greater truthfulness be called the creature of suggestion. He
is reasonable, but he is to a greater extent suggestible” (Benjamin & Baker, p. 119-120). He
demonstrated this through his advertising technique of a direct command to the consumer. The
former chair at Johns Hopkins University, John B. Watson was a highly recognized psychologist
in the 1920s. After leaving the field of academia he turned his attention towards advertising
where he implemented the concepts of behaviorism into advertising. This focused on appealing
to the basic emotions of the consumer: love, hate, and fear. This type of advertising proved to be
extremely effective as it suited the changing social context which led to heavy influence of future
advertising strategy and cemented the place of psychology in advertising.
In the late 19th
century the advertising agency of N.W. Ayer & Son was instituted. Ayer and Son
offered to plan, create and carry out full package of advertisement for its customers. By 1900 the
advertising agency had become the focal point of creative planning and advertising was firmly
established as a profession. Around the same time, in France, Charles-Louis Havas diversified
the services of his news agency, to include advertisement brokerage, making it the first French
group to organize. At first, agencies were brokers for advertisement space in newspapers. N. W.
11
Ayer & Son was the first full-service agency to assume responsibility for advertising content.
N.W. Ayer opened in 1869, and was located in Philadelphia USA (Brassington, 2001).
2.2. Models of Advertisement
Though there are several models of advertisements just two models are reviewed in detail for the
purpose of this study.
2.2.1. AIDA Model
The AIDA model produces a detailed illustration about the entire procedure of how advertising
effects consumer behaviour and the purchase decisions. It is an acronym, which consists of the
factors of attention, interest, desire and action, all of them relevant to the relationship between
consumer behavior and advertising. The first element, that is attention, describes the stage in
which the brand manages to gain the attention of the consumer through the advertisement that
he/she has come into contact with. Organizations creating attention, interest, desire, and
attraction of their products in the market using appropriate channels of communication to reach
the mass market are thus stimulating demand of existing and new products in the market. They
all have three general stages in common, even though the amount or names of sub-stages might
differ: cognitive stage (what the receiver knows or perceives), affective stage (receiver's feelings
or affective level), behavioral stage (consumer's action) (Aaker and Joachimsthaler, 2000).
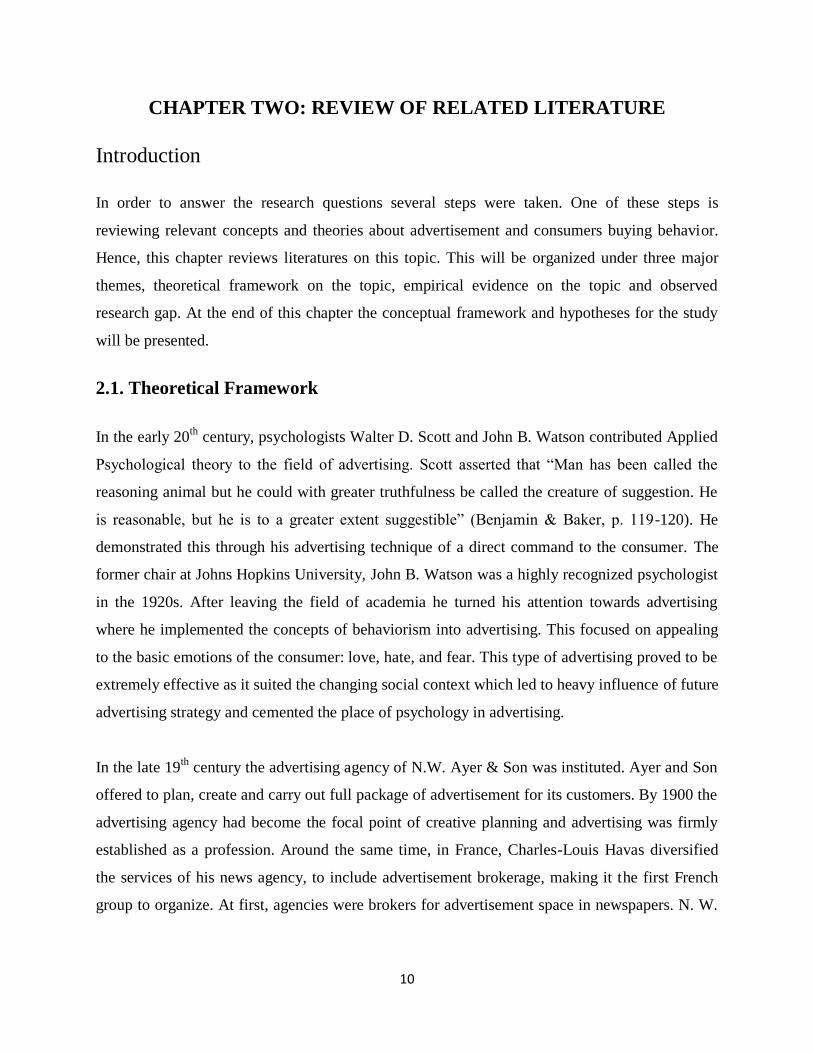
According to Colley (1984) one of the earliest models was AIDA: (Attention, Interest, Desire
and Action). This model is also called DAGMAR, an abbreviation for designing goals for
measured results. This model will be designed under four interrelated stages of communication:
awareness, comprehension, conviction and action. Colley said that this model describes a
learning process by which consumers‟ progress through a series of predetermined functions to
complete the purchasing process. The model assumes that a purchase will only be made when all
the steps have been completed. The authors contend that the model is dynamic where each single
step in the sequence depends upon the preceding step. The steps of hierarchy of AIDA Model are
as follow:
12
Awareness
It is the first step of hierarchy of AIDA model, where people get awareness about products. At
this stage, advertisers introduce their products, services and information about the usage of
products. Initially, advertisers create awareness about products in their target market and its
benefits to use (Baca et al., 2005). According to Ashcroft and Hoey (2001) awareness is the
cognitive stage to attract customers and is the first step of communication process.
Interest
Advertisement of a product or service is run with the aim to create interest among target viewers
because creating interest is the priority of advertisers (Rowley, 1998; Broeckelmann, 2010).
Continues buying of a particular product shows consumers‟ interest (Ghirvu, 2013).
Pharmaceutical companies, for example, often invest to create products interest in target market
with aggressive sales force which attempts to motivate customers for further query (Baca, 2005).
Desire
It is the third step of hierarchy of AIDA model that deals with the aspiration of target customers
to buy a product or service. From advertising view point, desire is said to be the intense level of
wanting a product. Creating desire is the precedence of advertisers, where they explain the
features and benefits of their products that how much value you have here (Richardson, 2013).
At this level, advertisers try to give greater exposure of a product to the customers (Rowley,
1998).
Action
At the fourth level of hierarchy of AIDA model action on the part of a customer is taken i.e.
actually purchasing a product or service. At this stage, customers are ready to pay for the
products to fulfill their intense desire for a particular product or services. A number of incentives
offered may persuade a customer to take action (purchase). For example discounted prices often
entice customers to take action i.e. buy something (Rawal, 2013). As mentioned by Ashcroft and
Hoey (2001) action is the behavior stage involving actual purchasing. According to Hoyer and
Macinnis (2009) effective advertising creates positive feelings that lead to actual purchase of
advertised products.
13
Figure 1: Advertisement Model (AIDA/ DAGMAR) Source: Colley and Russell H. (1984).
Defining Advertising Goals for Measured Advertising Results, New York:
Association for National Advertisers
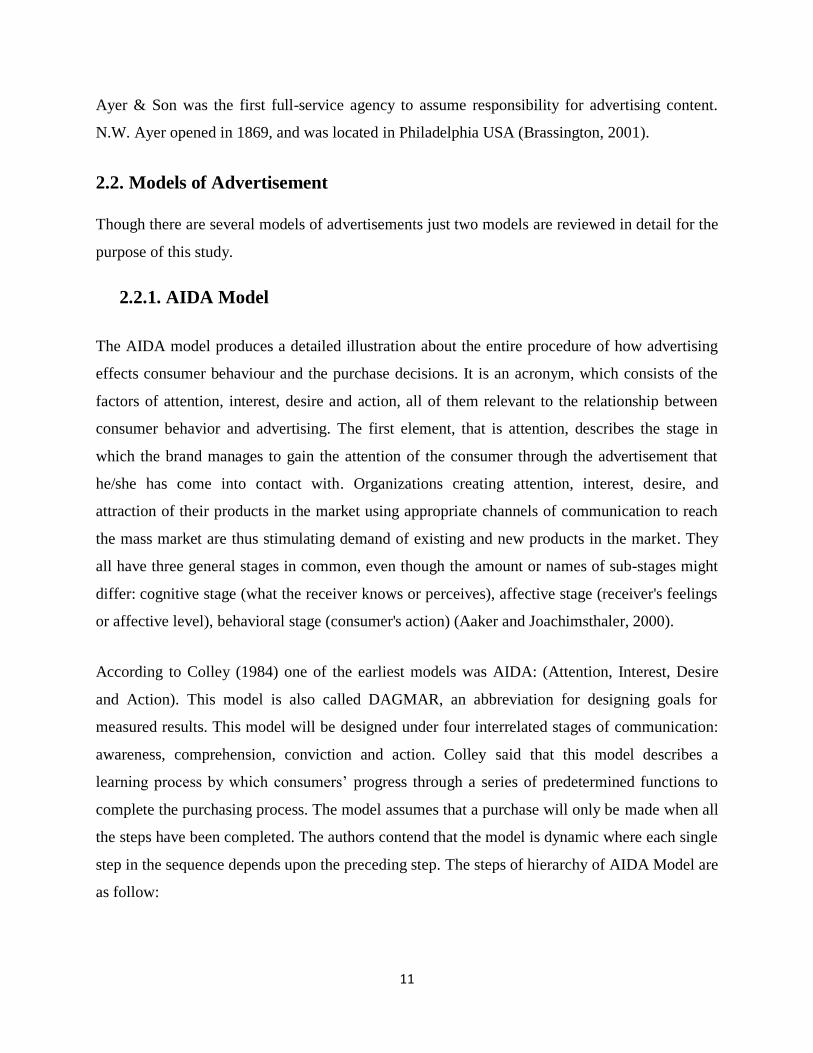
2.2.2. Foote, Cone and Belding (FCB) Model
A paper by Richard Vaughn (1980) researched the other advertising model, FCB, an acronym for
Foote, Cone and Belding. This model is a strategy matrix, suggesting that advertising works
differently depending on the product involved. Vaughn‟s work allows advertisers to select the
communication method based on the type of product or service they are advertising, and the
attitudes that consumers are likely to have towards the product. He suggests: “Not all advertising
functions in the same way, sometimes communication of key information and salient emotion
will be needed to get a sale. At other times, consumers will need one, but not both; and often, a
purchase may occur with little or no information and emotion. The purpose of strategy planning
is to identify the information, emotion or action leverage for a particular product, build the
appropriate advertising model and then execute it.
Figure 2: Advertisement Model (FCB) Source: Richard Vaughn (1980). How Advertising
Works: A Planning Model. Journal of Advertising Research, 20 (5), 27 – 33
Awareness Comprehension Conviction Action
(Purchase)
Thinking Feeling
High Involvement
Low Involvement
1. Informative
Learn-Feel-Do
2. Affective
Feel-Learn-Do
3. Habit Forming
Do-Learn-Feel
4. Self-Satisfaction
Do-Feel-Learn
14
The matrix divides advertising strategy into two attributes based on thinking versus feeling and
low involvement versus high involvement. Vaughn points out “this suggests there are purchase
decisions where thinking is most involved and others where feeling dominated; there are
situations that require more involvement and those that require less.”The FCB model is powerful
because it accommodates different versions of the learn-feel-do succession and proposes
different advertising strategies for each of the four quadrants. Now let us take the quadrants
separately and summarize them as follows:
Quadrant 1- High Involvement/ Thinking Informative
This quadrant implies that a large amount of information is necessary because of the importance
of the product. Many major purchases qualify, (cars, homes and electronic equipments), and
these are likely to include almost any product which needs to convey what it is, its function,
price and availability. The basic strategy model is to adopt the Learn-Feel- Do sequence where
information is designed to build attitudinal acceptance and subsequent purchase. Vaughn (1980)
says, “Consumers may be thought of as thinkers. Creatively, specific information and
demonstration are possibilities. Long copy format and reflective, involving media may be
necessary to get through with key points of consumer interest.” Accordingly, NSPF consumers
fall in this quadrant, since purchasing paint products requires the possession of detailed
information and product awareness.
Quadrant 2- High involvement / Feeling (Affective)
This product decision has high involvement but requires less specific information; therefore an
attitude or feeling towards the product is more important. This is a psychological model, because
the importance of the product is connected to the consumers‟ self-esteem. Perfume, expensive
watches and sports cars are product examples that might fall into this quadrant. The advertising
strategy requires emotional involvement on the part of the consumers so that they become
connected with the product being advertised and subsequently become “feelers”. Therefore, the
proposed model is Feel-Learn-Do. Vaughn (1980) submits “Creatively, execution impact is a
possible goal, while media considerations suggest dramatic print exposure or “image” broadcast
specials.”
15
Quadrant 3- Low involvement / Thinking (Doer)
Products in this category (including many common household items such as razors, insect
repellant and household cleaners) involve little thought and a tendency to form buying habits for
convenience. The hierarchy model is a Do-Learn-Feel pattern suggesting that simply inducing
trial (through coupons or samples) can often generate subsequent purchases more efficiently than
“undifferentiating copy points”, leading in turn to increased brand loyalty. According to Vaughn
(1980), the most effective creative strategy is to stimulate a reminder for the product.
Quadrant 4-Low involvement / Feeling (Self - Satisfaction)
This product decision is emotional but requires little involvement, and is reserved for those
products that satisfy personal taste (for example, cigarettes, candy, beer or snack food). This is a
Do-Feel-Learn model where imagery and quick satisfaction are involved, and the consumer is
considered a reactor whose interest will be hard to hold. Vaughn (1980) argues that the creative
objective is to get attention with some sort of consistency and suitable methods may include
billboards, point-of-sale or newspaper advertising.
2.3. Concept of Consumers Buying Behavior
According to Zaltman (2003), marketing researchers involved in studying the buying behavior of
consumers soon appreciated the fact that though there were many similarities, consumers were
not all alike. There were those who used products currently in style while many consumers did
not like using “me too” types of products and showed a preference for highly differentiated
products that they felt met their special needs and reflected their personalities and lifestyles.
These findings led to the development of the market segmentation concept, which required
dividing the total heterogeneous but potential market into relatively smaller homogenous groups
or segments for which they could design a particular marketing mix. They also used positioning
techniques and developed promotional programs to vary the image of their products, so that they
were perceived as a better way to satisfying the specific needs of certain segments of consumers
(Bearden, 1999).
16
2.4. Models of Consumer Behavior
There are also various consumers‟ models which help us in the understanding of consumer
behavior. According to Berkman (1986), there are two types of consumers‟ model.
Traditional Models: Economic, Learning, Psychological and Sociological.
Contemporary Models: Howarth Sheth, Engel-Blackwell-Kollat and Nicosia. Since the
modes are very broad, few of them will be reviewed in this study based on their relevance
to the study.
2.5. Advertisement Media
Morden (1991) holds that the medias for advertisement can be classified into the following four
categories: namely print; electronic or broadcast; outdoor and others media advertising. Based on
their relevance to the study, few of them will be reviewed in this research.
2.5.1. Print Media Advertising
The print media consists of Newspapers, Magazines, Journals, Handbills and etc. No newspaper
or, journal, today, can survive without advertisement revenue. Print media advertising, even
today, is the most popular form; and revenue derived by mass media from advertising has,
therefore, been progressively increasing year after year. Print media appeals only to the sense of
sight, i.e. eyes.
2.5.2. Electronic or Broadcast Media Advertising
Electronic or Broadcast Media consists of Radio, Television, Motion Pictures, Video and
Internet. The radio is audio in nature, attracting only to the sense of sound (ears). Radio
advertising is more effective in rural areas, as compared to urban regions. Television, as an
advertising medium, is more attractive and effective because it is an audio-visual medium
appealing to both the senses of sight sound (eyes and ears). Different methods, such as, spot
announcements; sponsored programs and etc. are used for broadcasting advertising messages.
However, broadcasting media are very expensive form of advertising. Advertising is also
undertaken via movies, video and internet.
17
2.6. The Influence of Ad. Media on Consumers Buying Behavior
Muhammad (2014) conducted a study on the impact of consumer perception and advertisement
on consumer buying behavior. The study was conducted in Pakistan. 150 questionnaires were
distributed to randomly sampled respondents. The study found out that advertisement had strong
positive impact on consumer buying behavior. It was also found that quality advertisement and
positive perception can really play virtual role in improving consumer buying behavior.
Niazi (2011) studied on the effective of advertising and its influence on consumer buying
behavior. The study was conducted in Pakistan. The methodology used was quantitative
technique. 200 questionnaires were distributed and probability sampling was used in a sample for
data collection. The findings of the study revealed that there is huge relationship between
advertisement and consumer buying behavior. It also established the relationship between
environmental response and consumer buying behaviors. According to the study, consumers are
buying products which they see in advertisement more than emotionally.
2.6.1. Influence of Television AD on Consumers Buying Behavior
Katke (2007) conducted a case study to find the impact of television advertising on child health
and family spending. A result shows that advertisements change the direct habit and lead to
violent behavior of children. It creates a stress on the parents and hits the family budget. The
study has revealed the positive co-relationship between time spent with television but the adverse
effect on children and family.
Bishnoil and Sharma (2009) in their study aimed to find the background of the consumer and TV
advertising influences the buying behavior. Teenagers from both the genders from on urban and
rural were used for study. Taking gender, age, education, annual income as determinants,
ANOVA, percentage analysis, means counts were analyzed to conclude that rural teenagers
prefer advertisements than their urban people. The urban teenagers watch the advertisements of
the products they believe are useful and good. Advertisements influence on male purchase
behavior than female consumers.
18
Yousaf and Shehzad (2013) studied the effect and influence of TV commercials over illiterate
and literate people of Pakistan. Findings shows that illiterate spend more than 2hrs per day of TV
commercials and literate watch less than 2hrs per day. With regard to content watching 70% of
literates prefer content in TV commercials and 68% of illiterates likes content. It is found that
illiterates are behaviorally influenced whereas literates are psychologically influenced. Not all
the literates believe in the message conveyed in the advertisements are true so they don‟t try all
products listed in TV. But illiterates believe in the content and try to buy those products.
Television advertising is most effective means of communication. This is because it has an
audio-visual impact (Stone, 1982). With catchy slogans, song and dance sequences, famous
personalities exhibiting products, TV advertising has a lasting impact. With the varieties of
channels and programmers, advertisers have a lot of choice to select the channel and time to
advertise. With regional channels coming up, any person even illiterates can watch the
advertisements and understand them by seeing and hearing. Arshad (2014) studied on the impact
of effective advertising on consumer behavior. The study was conducted in seven cities in
Pakistan. It used probability sampling of 300 respondents. The study found that TV advertising is
more persuasive than other advert to convince customer to buy product because it shows and
makes perception to consumer.
2.6.2. Influence of Newspaper AD on Consumers Buying Behavior.
Bansal and Gupta (2014) studied on the impact of newspaper advertisement on consumer
behavior. The study selected a sample 1017 advertisements from different English newspapers
which appeared recently in 6 weeks. The study found that many advertising in newspapers were
informational and they were perfect in convincing consumer to buy store products.
Print media is a very commonly used medium of advertising by businessman. It includes
advertising through newspaper, magazines, journals and the like and it is also called press
advertising. Newspapers are included in paper print out which are published in English or
Kiswahili. These are the sources of news, opinions and current events (Mc Quails, 2005). In
addition, Newspapers are also a very common medium of advertising.
19
The advertiser communicates his or her message through newspaper which reaches to millions of
people. According to Stone (1982), the advantages of newspaper stem from having wide
circulation and a single advertisement in the newspaper can quickly reach to a large number of
people. The cost of advertising is relatively low because of wide publication. Generally,
newspapers are published daily. Thus, the same advertisement can be repeated frequently and
remind a reader every day. The matter of advertisement can be given to newspaper at a very
short notice.
2.6.3. Influence of Radio AD on Consumers Buying Behavior
The creative strategies used in radio commercials are different and advertising firms adjust their
communication strategies in response to the specific needs of different consumers. The Central
Place theory advocates that products with higher price and lower buying frequency influence
positively the perception of consumer on the promotional communication of stores delivered
through the radio programs and outdoor advertising (Hubbard, 1978; Yadav, 1994). The
perception of radio as an intimate medium of communication during the non-availability of
visual media profoundly affects the way people consider listening to radio programs including
commercials, perform information analysis, and make applied decisions. The localized
commercials on radio keep consumers also aware about the market movements (Sauls and Greer,
2007). Radio advertisements influence listeners on all days of the week and at the time of work.
The positioning of advertisements on radio is precise and well-targeted to consumer segments
which drive higher response among listeners (Verhoef, 2000). Advertisements on radio target
audiences along age, gender and ethnic lines and mobilize excitement and gender sensitivity as
persuasive techniques to promote products and services during working hours with the view that
access to commercial information is a “new cool-tier" of the entertainment industry (Van Guijel,
2008).
Consumer products companies use radio for campaigns more than television, as precision and
effectiveness of message is possible by more meticulously targeted radio advertisements than
broadcast over the visual media (Overby and Barth, 2006). In developing countries the radio
advertisements enhance the pleasure of entertainment as well as serve as source of current
20
market information. It is observed that short-term effect of radio advertisement towards store-
level promotions and store choice is significant, though choice is mainly driven by loyalty.
2.7. AD Characteristics and Consumers Buying Behavior
In this sub section the researcher will review the relationship between advertisement and
consumers buying behavior. As per the above sections of literature, one can understand the
strong relationship between advertisement and consumers buying behavior. The advertising has a
foremost and vital effect on purchasing behavior of consumers. If an advert is effective enough
to impress, the viewer will be more willing to pay attention to it and is less likely to avoid the
advert the next time it is shown (Biel, 1990); therefore it will get more exposure, because of the
positive first impression.
2.7.1. Relationship between Impressive AD and Consumers Buying Behavior
According to Prabakaran (2012), buying begins in the mind. If you don‟t impress the buyer‟s
mind, you won‟t capture his or her money. He concluded that the primary task of advertisement
is to distinguish the product advertised, attract the customer‟s attention and impress them to buy
the product. Impressive advertisement creates demand. It makes customer aware of the price and
attributes of the product leading to greater sales. Such kind of advertisement brings customers
and sellers together. Moreover, it also persuades and informs the masses. This information can
be about the product features, style, value, price and availability. In addition to this, impressive
advertising bring attitudinal changes in the minds of the consumer. His or her emotions are
torched and played with the feelings of likes and dislikes towards the object and this leads to
action (i.e. purchase).
Clave (2014) associated the satisfaction levels of those newspapers readers who said they give
attention to print news content and print advertising with several active purchase decisions taken
by them. A discriminate analysis executed with the data collected allows for the conclusion that
people who were inspired to purchase after reading local newspapers and paying attention to
print ads were motivated mainly by the impressiveness and attractiveness of the deal offered in
the ad, the level of influence exerted by the newspaper where the ad is run, and the level of the
quality of information provided by the news outlet. Therefore, this study will provide robust
21
evidence of the strong relationship between impressive and attractive advertisement and its
commercial role towards influencing consumers purchase intent.
Therefore, the following alternative (a) hypotheses pertain to this study:
Ha1: There is a positive and statistically significant relationship between impressive
advertisement and consumers buying behavior.
2.7.2. Relationship between Understandable AD and Consumers Buying Behavior
Advertisement should not be complex. The more complex the advertisement is, the more
difficult will be the advertisement to understand and remind & vice versa. Adeolu (2005)
recommend firms should develop more effective advertising campaign that attracts consumer‟s
attention and capture their interest. At this stage the company‟s advertising messages should be
simple to understand and interpret. The simplicity of the advertisement leads to impart the
information to the consumers so that they are well informed and can make a good choice. The
advertisement should be conveyed in such a way that, knowledge about product specification,
features, quality and function should comprise briefly. For this study the researcher followed and
analyzed different kinds of advertisement on Medias. For example, the advertisement of Coca -
Cola was very creative as well as simple to understand. I hope the readers of this paper could
agree with this.
Wang (2002) brought some implications to various stakeholders in Malaysia. The implications
can be divided into two categories: theoretical and managerial implications. In terms of
theoretical implication, the research re-affirms the notion that the determinants of consumers‟
attitude towards advertising can be applied in a highly regulated media environment. In terms of
managerial implication, the findings do provide some insights and feedback for administrators of
media industry in drafting various advertising strategies on how to increase the favorable
consumers‟ attitude towards advertising. As part of the efforts to create favorable consumers‟
attitude, some strategies proposed which includes: First of all checking the sources of
advertisement are credible, trustworthy and believable; Second keeping the advertising message
informative, customer oriented, simple to understand and up to date; Third integrating the
elements of fun, excitement, surprises, creativity and pleasure in the advertisement messages and
lastly emphasizing the concept of „made in Malaysia‟ to evoke the feeling of partnership in
22
helping the nation grow economically building positive image. In my opinion the last strategy
should be scale up in our country especially to those import and export business firms. Since our
attitude to “Made in Ethiopia” is very poor.
Therefore, the following alternative (a) hypotheses will pertain to this study:
Ha2: There is a positive and statistically significant relationship between understandable
advertisement and consumers buying behavior.
2.7.3. Relationship between A. Grabbing AD and Consumers Buying Behavior
According to Gary (1999) “humans are visual animals.” He also further stated that our vision is
the sense we rely on most. This kind of biological scenario is not accident, rather it has
developed over tens of thousands of generations. Our eyes are attracted to pictures far more than
to words.
Prabakaran (2012) sated that people like advertisement of the products and believe that the
quality of the product is as good as expected from the advertisement. This study suggests that the
promotional strategy through television advertisement is made a significant and positive impact
on consumers buying behavior. TV advertisement has enhanced their involvement in purchase
and experiment with different or new products.
According Adeolu (2005), many consumers did not buy whatever is available or affordable. If a
product is good value for its price, it will command brand loyalty. However, advertising helps in
projecting product quality, affordability and value before the consumers. Moreover, the authors
recommend the following important points. First, research continuously into quality
improvement that will make consumers enjoy good value for money paid to purchase the brand.
Second, develop more effective advertising campaign that attracts consumer‟s attention and
capture their interest. At this stage the company‟s advertising messages should be simple to
understand and memorable. The messages must be strong and creative enough to attract and
build brand preferences, encourage switching to the company‟s brand by changing the perception
of the consumers of rival brands the product.
Therefore, the following alternative (a) hypotheses will pertain to this study:
23
Ha3: There is a positive and statistically significant relationship between attention grabbing
advertisement and consumers buying behavior.
2.7.4. Relationship between Memorable AD and Consumers Buying Behavior
Dholakia (2001) suggested that, in order to be effective, an advertisement has to be memorable
for the viewer. If the viewer does not remember the ad after viewing it, the company sponsoring
the ad is simply wasting time and money. With an effective advertisement, the viewer should be
able to clearly recall what happened during the course of the ad, and more importantly, which
product is being advertised. That recall is the trademark of an effective advertisement.
Advertisements need to stick in the brains of customers. Brassington and Pettitt (2001)
recommend to firms about how ad should be memorable: “you want customers to remember your
ads so they remember your business. Strive to create extraordinary pieces for your marketing so
you stand out from other, similar companies”.
Memory phenomena have long occupied a central place in thinking about the process and effects
of advertising. The various hierarchies of effects models that have been proposed to represent the
mental stages consumers pass through in response to advertising all acknowledge the role of
memory (Ray, 1973).
According to R. Kahn (2011), when the sales volume of any product increases, it is because the
consumer is aware and believes about the product's value and this point is accomplished through
efficient advertisement about product. Metha (2000) also indicated when a company participates
in generic advertising programs; it has a significant impact on firm‟s market performance.
Therefore, the following alternative (a) hypotheses will pertain to this study:
Ha4: There is a positive and statistically significant relationship between memorable
advertisement and consumers buying behavior.
24
2.7.5. Relationship between Creative AD and Consumers Buying Behavior
According to Poona Sharma (2012), there should be an element of creativity in an advertisement.
This creativity is to create something new, unique, extremely attractive and appealing to the
consumers. In fact, advertising itself is a creative process. Creative advertisement leads to
innovation. It encourages innovation and new product development and reduces the risk of the
product becoming obsolete. With more innovation there are more sales which offset the cost of
innovation. Innovation leads to more sales and business expands. More employment is generated
and the people become more prosperous and their standards of living improve. An effective ad
will inform the consumer about the product or service you have to offer, but that advertisement
also need to be creative so that it can capture attention. Capturing the attention of the consumer is
essential for an effective ad, and the more creative you can make that ad the more effective it can
be.
Therefore, the following alternative (a) hypotheses will pertain to this study:
Ha5: There is a positive and statistically significant relationship between creative advertisement
and consumers buying behavior.
2.7.6. Relationship between Honest AD and Consumers Buying Behavior
According to Schulz (1990), trust is a state of certainty, “a middle state between knowing and
not-knowing”. M. Bansal and S. Gupta (2014) on their Global Journal of Finance and
Management focused on the impact of informational content within the newspaper on consumer
behavior. The impact of newspaper advertisement assessed from the fact that advertisements
with more trusted (honest) content were found to influence more customers than advertisements
with biased informational content. The impact of logical informational content and its probability
of being liked by a consumer were greatest especially for electronics and durable goods. The
amount of information present was found to be independent of the size of the advertisement.
Thus, it can be understood that commercials of different products employ different advertisement
strategy to motivate their customers and such a data can be helpful in obtaining its impact on the
customers not only for newspaper advertisement but for all other forms of advertisements.
25
Therefore, the following alternative (a) hypotheses will pertain to this study:
Ha6: There is a positive and statistically significant relationship between honest advertisement
and consumers buying behavior.
2.8. Research Gap
After observing such relevant studies, it can be concluded that many researchers examined and
studied different aspects of advertising and its effect on consumer‟s buying behavior. However,
there are some considerable contradiction among the previous works and theories of science.
Many researchers have studied their work in their own contextual scenarios. This study
emphasizes on the consumer‟s behavior of growing cities like Addis Ababa by considering
NSPF.
Most of the previous works agree advertisement is a must and should be a continuous activity. It
boost market share in addition to the profit maximization. Some of the scholars indicate the
effect of advertisement on its implications to managerial activities and they tried also to propose
strategies that create favorable consumers attitude.
Now based on the above literature review, the following research gap is observed. Based on the
category of consumers, there are two types of consumers, namely individual and organizational
consumers. But most of the studies consider only individual consumers. As it is mentioned
earlier there are different types of media for delivering advertisement messages, however, they
failed to mention the main features of advertisement that have more effect on consumers buying
behavior.
Moreover, the other drawback is being conducted with few independent variables. Unlike these
studies, the current study will use the previous studies as a bench mark. Since the studies will not
free of flaws, the researcher of this study attempts to include facts and theories which eliminate
the above mentioned flaws.
26
2.9. Conceptual Frame Work
Moskal and Leydens (2000) states that conceptual framework is a written or visual presentation
that explains either graphically or in narrative form. Reichel and Ramey (1987) added that a
conceptual framework is a set of broad ideas and principles taken from relevant fields of enquiry
and used to structure a subsequent presentation sometimes a conceptual framework is referred to
as a theoretical framework.
It is a type of intermediate theory that attempts to connect to all aspects of inquiry such as
problem definition, objectives, literature review, methodology, data collection and analysis.
Conceptual framework can act like a map that gives coherence to empirical inquiry. Because
conceptual framework is potentially so close to empirical inquiry, it takes different forms
depending upon the research question or problem.
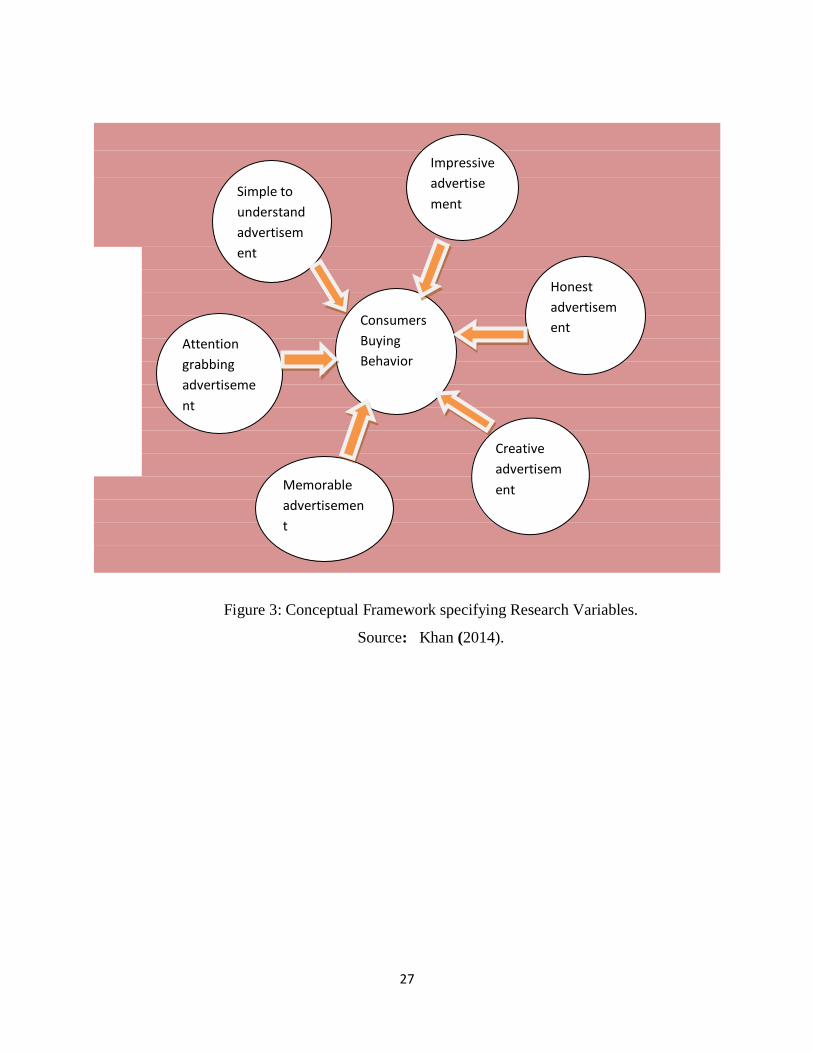
In this study, a framework is developed to conceptualize the interrelation between a dependent
variable and six independent variables. Assessment of the elements/variables of the conceptual
framework will assist to understand the phenomenon because assessment of each
element/variable will provide an answer to specific research questions developed above. The
elements/variables considered in this conceptual framework are dependent and independent
variables.
27
Figure 3: Conceptual Framework specifying Research Variables.
Source: Khan (2014).
Consumers
Buying
Behavior
Creative
advertisem
ent
Honest
advertisem
ent
Impressive
advertise
ment Simple to
understand
advertisem
ent
Attention
grabbing
advertiseme
nt
Memorable
advertisemen
t
28
CHAPTER THREE: RESEARCH METHODOLOGY
Introduction
This chapter deals with the methodology of the study where the research approach, the research
type, sample and sampling techniques, source of data collection, data collection instruments,
reliability & validity of the study and the method of data analysis are discussed.
3.1. Research Approach
The research can be classified in to two research approaches. These are qualitative research and
quantitative research.
Qualitative research involves studies that do not attempt to quantify their results through
statistical summary or analysis. It seeks to describe various aspects about behavior and other
factors in the social sciences and humanities. In this kinds of research data are often in the form
of descriptions, not numbers. It typically involves in-depth interviews, group discussions, and
observations without formal measurement.
Quantitative research is the systematic and scientific investigation of quantitative properties and
phenomena and relationships. The objective of quantitative research is to develop and employ
mathematical models, theories and hypotheses pertaining to natural phenomena. It usually starts
with a theory or a general statement proposing a general relationship between variables.
Quantitative researchers favor methods such as surveys and experiments, and will attempt to test
hypotheses or statements with a view to infer from the particular to the general.
Therefore the researcher chose quantitative research to describe the effect of advertising on
consumers buying behavior by collecting quantitative data from consumers of the NSPs. In
addition the effect of the independent variables (AD characteristics) on the dependent variable
consumers buying behavior is quantitatively measured by this study.
29
3.2. Research Design
Research design forms the blue-print or maps that details how the researcher collect data that is
relevant to address the research questions. It is a general blue-print for the collection,
measurement and analysis of data, with the central goal of solving the research problem. It
includes the outline of what the research did, from writing the hypothesis and its operational
application to final analysis of data (Creswell & Clark, 2007).
The research can be classified in to three as descriptive, explanatory and exploratory. Descriptive
research sets out to describe & to interpret what is. It aims to describe the state of affairs as it
exists. It is concerned with conditions or relationships that exist, practices that prevail, beliefs,
points of view or attitudes that are held, processes or that are developing. The major purpose of
descriptive research is describing the state of affairs as it exists at present.
Explanatory research is conducted when we encounter an issue that is already known and have a
description of it, we might begin to wonder why things are the way they are. The desire to know
“why”, to explain, is the purpose of explanatory research. The researcher goes beyond merely
describing the characteristics, to analyze and explain why and how something is happening. Thus
explanatory research aims to understand phenomena by discovering and measuring casual
relations among them.
Exploratory research is conducted when there are few or no earlier studies to which references
can be made for information. It provides insights into and comprehension of an issue or situation
for more rigorous investigation later. Exploratory research is a type of research conducted
because a problem has not been clearly defined. Its purpose is to gain background information
and better understand and clarify a problem.
This researcher collects data on the effect of advertisement on consumers buying behavior. So
the researcher used descriptive research for his purpose. In addition the researcher will analyze
the casual relations between the dependent variable (consumers buying behavior) and the
independent variables AD characteristics using correlation and regression, which makes the
research explanatory. Therefore this study is both descriptive and explanatory.
30
3.3. Data types and Data sources
The main source for this study will be primary data source. Primary data will be sourced through
customer survey. As the researcher intends to investigate the effect of advertisement on
consumers buying behavior, the primary data will be collected from primary sources via
questionnaires.
3.4. Population of the study
Population refers to the entire group of people, events or things of interest that the researcher
wishes to investigate (Sekaran, 2005). A study population can be defined as the entire collection
of cases or units about which the researcher wishes to draw conclusions. One of the major steps
in formulating a research design is to define the population according to the objectives of the
study. The population of interest for this research is all consumers of Nifas Silk Paint Factory‟s
products in Addis Ababa. The number of population is infinite. Therefore, the study will use
non-probability sampling approach particularly purposive and convenient sampling techniques
because non –probability sampling approach enables the researcher to get some idea of the
population and characteristics of the problem using well informed member in a short time.
3.5. Sampling procedure
Sampling design applied for the research is two level sampling. Initially Purposive sampling is
used to select sales outlets of Nifas Silk Paint Factory based on the size of the sales outlets and
their level of business activities. The reason behind such sampling design is to get higher number
of consumers in a single place within short period of time, since the type of consumers across all
sales outlets are assumed to be homogenous (no segmentation geographically or at sales outlet
level).
Accordingly: Merkato, CMC, Saris, Mexico, Summit, Gojam Berenda, Akaki, Jemo, sales
outlets are selected using purposive sampling. Then convenience sampling is used to select
sample respondents from selected sales outlets by way of approaching consumers by visiting the
sales outlets with the help of salesperson.
31
3.5.1. Sample Size
Sampling is the process of using a small or parts of a larger population to make conclusions
about the whole population. Sampling is one of the components of research design. Jankowicz
(1995) defines sampling as the deliberate choice of a number of people; the sample provides data
from which to draw conclusions about some larger group, the population, whom these people
represent. This enables the research to be conducted economically feasible to use part of the
population and also within the limited time frame.
In light of this, the sampling technique used to select samples from the given population was
convenient sampling. In this technique the sample selection process is continued until the
required sample size has been reached. It involves selecting randomly those cases that are easiest
to obtain the required sample (Zikmund, 2003).
Since the population of the study is infinite, the following formula is used to determine the
appropriate sample size.
n= z2 *p *q
e2
Source: (Kothari, 2004)
Where n= sample size
z=the value of standard value of a given confidence level
P= sample proportion
q=1-p
e=acceptable error so in this case we set
e= 0.05, z=1.96
p= 0.5 q= 0.5 and we get
n= (1.96)2(0.5) (0.5)
(0.05)
n= 0.9604 = 384.16
0.0025
n= 384
32
3.5.2. Sampling Technique
The sampling design that will be employed for this study is a non-probability sampling. A non-
probability sampling provides with an information-rich case study in which it enables to explore
the research question and gain theoretical insight (Saunders, Lewis &Thornhil 2009). The
sampling technique used to select samples from the given population was purposive &
convenient sampling.
3.6. Data Collection Instrument
In order to gather firsthand data, questionnaire was prepared and administered based on the
review of related literature important to the subject of the study. Based on which this study
prepared questionnaires as a tool to collect data.Thus, questionnaires are designed to focus on the
effect of advertisement on consumers buying behavior.
The questionnaire comprises a 5 point Likert scale of 1 - 5 where, 1 shows high level of
disagreement and 5 shows high level of agreement. The respondents will be instructed during the
administration of the questions by the researcher to mark the most suitable answer. Respondents
are also required to answer intelligently and expeditiously as possible.
3.7. Data Collection Procedure
The study employs questionnaires as a tool for data collection. The questionnaires were delivered
to the consumers of the Nifas Silk Paints.
The questionnaires are composed of four sections. The first section contains questionnaire items
used to collect personal profile of respondents, the second section contains questionnaire items
used to collect the data related to general knowledge of respondents and the third and fourth
section on five point Likert scale to assess the effect of advertisement on consumers buying
behavior.
33
3.8. Data Analysis
The purpose of analysis is to build up a sort of empirical model where relationships are carefully
brought out so that some meaningful inferences can be drawn Zikmund (2003). It will be
necessary to employ statistical techniques such as Descriptive statistics, Correlation and Multiple
Regression to analyze the data due to the quantitative nature of the study.
Data will be inserted in to SPSS version 20. The inserted data will be cleaned for errors and
inconsistencies and finally analyzed. Data obtained from the study were presented in text, tables
and figures.
3.8.1. Descriptive Statistics
To provide descriptive information for the consumer profile and characteristics, frequencies will
be used. According to Andy Field (2006), frequencies refer to the number of times various
subcategories of acertain phenomenon occurs, from which the percentage and the cumulative
percentage of their occurrence can be easily obtained.
3.8.2. Correlation
In a research project that includes several variables, it is important to know how one variable is
related to another. This will help to see the nature, direction and significance of the bivariate
relationships of the variables used in the study (Field, 2006). Moreover he stated that a person
correlation matrix will provide this information that is it will indicate the direction, strength and
significance of the bivariate relationships of all the variables in the study. Thus correlation
analysis will be employed to attain the relationships, to test the hypotheses and consequently to
answer research question.
3.8.3. Multiple Linear Regressions
According to Sekaran (2000), the square of multiple R, R-square or R2 as it is commonly known,
is the amount of variance explained in the dependent variable by the predictors. Such analysis,
where more than one predictor is jointly regressed against the criterion variable, is known as
multiple regression analysis. When the R-square value, the F statistic, and its significant level are
34
known, we can interpret the results. Multiple regression analysis was also used to examine the
predictive power of each of the independent variables for the overall consumers buying
behaviors (dependent variable).
The overall model of this study was the multiple linear regressions model which is presented
below.
Y= α+β1IAD+β2SUD+β3AGA+β4MAD+β5CAD+β6HAD+e
Where
Y = the dependent variable to be predicted
α = Y axis intercept (the constant)
β = slope of the independent variables (IAD, SUD, AGA, MAD, CAD, HAD)
IAD, SUD, AGA, MAD, CAD, HAD= independent variables used to predict the dependent
variable
e= the error number
Where,
CB is Consumers Buying Behavior
AGAD is Attention Grabbing Advertisement
CAD is Creative Advertisement
HAD is Honest Advertisement
IAD is Impressive Advertisement
MAD is Memorable Advertisement and
SUD is Simple to Understand Advertisement
35
3.9. Ethical Consideration
The data gathered will be used solely to understand the effect of advertising on consumers
buying behavior. Furthermore, the researcher is solely responsible for conducting the whole
research process and shall abide all the policies regarding the organization as well as the
university. The will not be transferrable for any means in person or organization. The research is
being done according to the guidelines, rules and regulations of the university. The four stages of
ethics in doing research are followed by the way of a good design, modes of data collection,
analysis of data and for proper dissemination. Prior objectives and motive of the research will be
intimated. There shall be no misinterpretation or misuse of the data collected from the
organization.
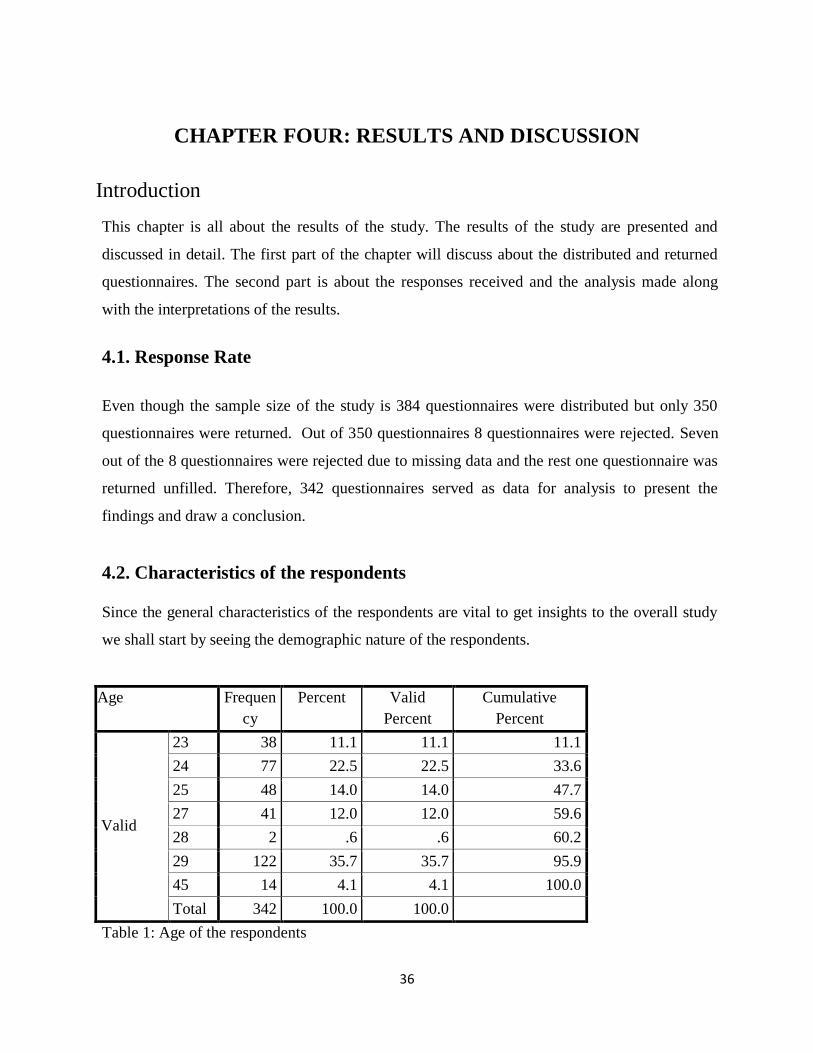
36
CHAPTER FOUR: RESULTS AND DISCUSSION
Introduction
This chapter is all about the results of the study. The results of the study are presented and
discussed in detail. The first part of the chapter will discuss about the distributed and returned
questionnaires. The second part is about the responses received and the analysis made along
with the interpretations of the results.
4.1. Response Rate
Even though the sample size of the study is 384 questionnaires were distributed but only 350
questionnaires were returned. Out of 350 questionnaires 8 questionnaires were rejected. Seven
out of the 8 questionnaires were rejected due to missing data and the rest one questionnaire was
returned unfilled. Therefore, 342 questionnaires served as data for analysis to present the
findings and draw a conclusion.
4.2. Characteristics of the respondents
Since the general characteristics of the respondents are vital to get insights to the overall study
we shall start by seeing the demographic nature of the respondents.
Age Frequen
cy
Percent Valid
Percent
Cumulative
Percent
Valid
23 38 11.1 11.1 11.1
24 77 22.5 22.5 33.6
25 48 14.0 14.0 47.7
27 41 12.0 12.0 59.6
28 2 .6 .6 60.2
29 122 35.7 35.7 95.9
45 14 4.1 4.1 100.0
Total 342 100.0 100.0
Table 1: Age of the respondents
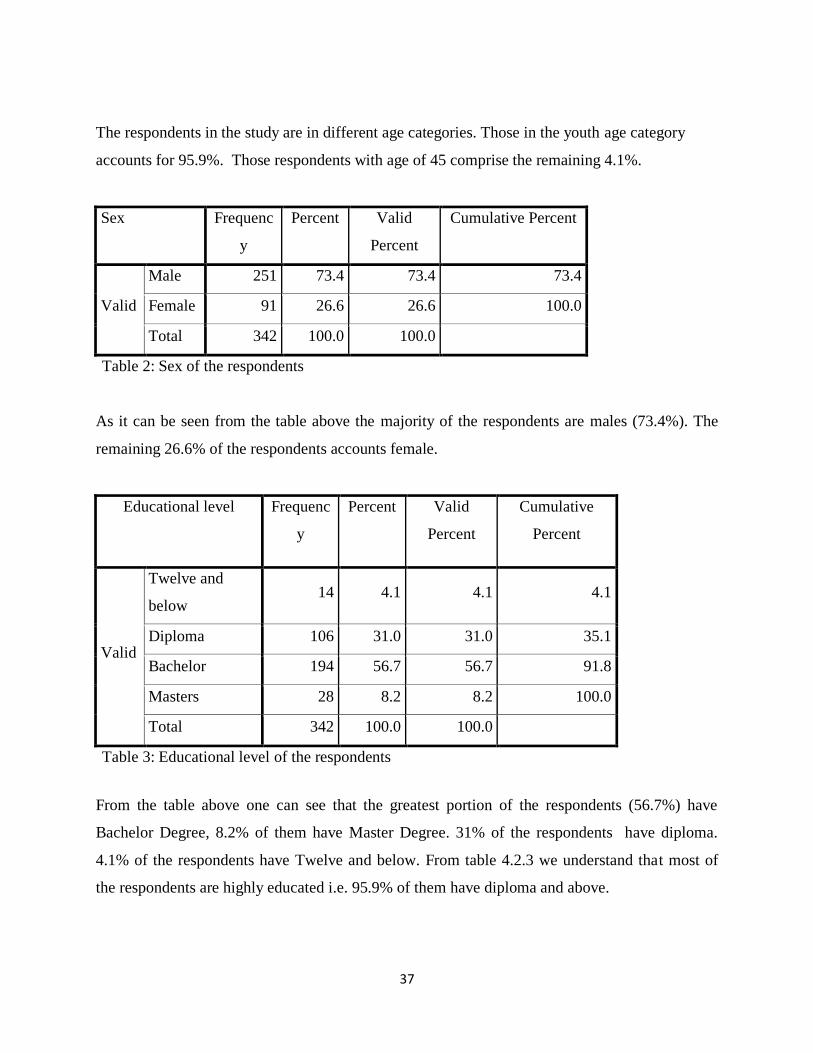
37
The respondents in the study are in different age categories. Those in the youth age category
accounts for 95.9%. Those respondents with age of 45 comprise the remaining 4.1%.
Sex Frequenc
y
Percent Valid
Percent
Cumulative Percent
Valid
Male 251 73.4 73.4 73.4
Female 91 26.6 26.6 100.0
Total 342 100.0 100.0
Table 2: Sex of the respondents
As it can be seen from the table above the majority of the respondents are males (73.4%). The
remaining 26.6% of the respondents accounts female.
Educational level Frequenc
y
Percent Valid
Percent
Cumulative
Percent
Valid
Twelve and
below 14 4.1 4.1 4.1
Diploma 106 31.0 31.0 35.1
Bachelor 194 56.7 56.7 91.8
Masters 28 8.2 8.2 100.0
Total 342 100.0 100.0
Table 3: Educational level of the respondents
From the table above one can see that the greatest portion of the respondents (56.7%) have
Bachelor Degree, 8.2% of them have Master Degree. 31% of the respondents have diploma.
4.1% of the respondents have Twelve and below. From table 4.2.3 we understand that most of
the respondents are highly educated i.e. 95.9% of them have diploma and above.
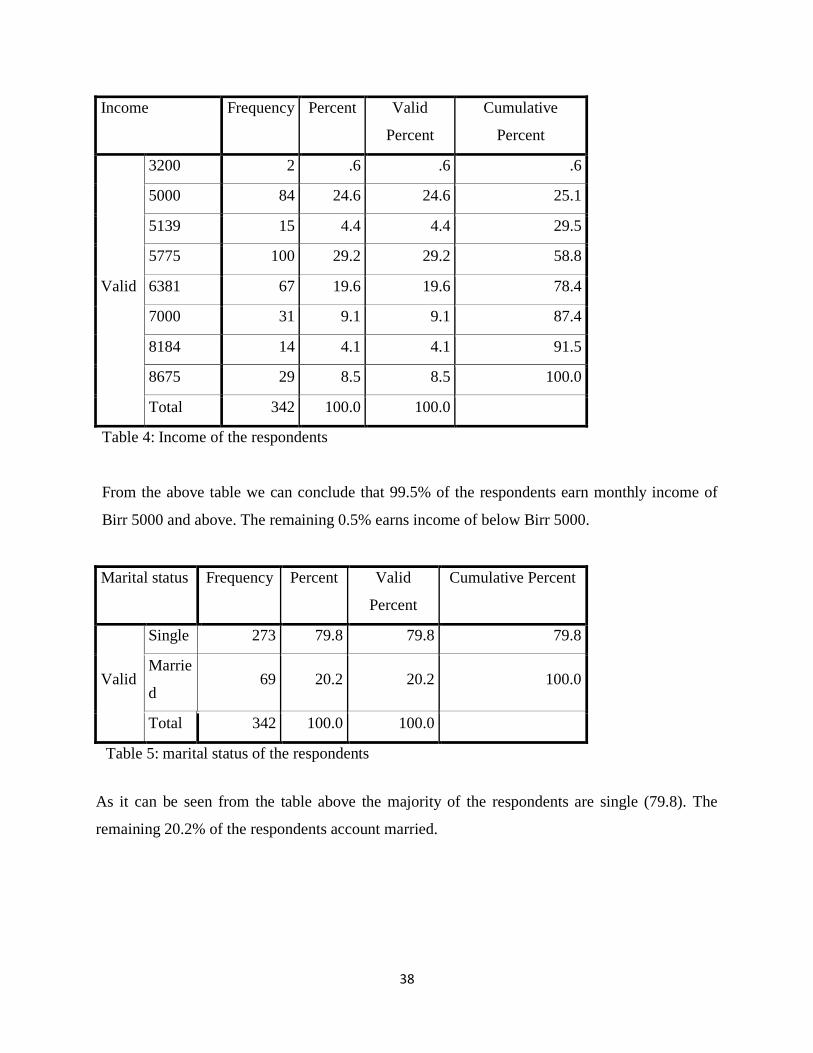
38
Income Frequency Percent Valid
Percent
Cumulative
Percent
Valid
3200 2 .6 .6 .6
5000 84 24.6 24.6 25.1
5139 15 4.4 4.4 29.5
5775 100 29.2 29.2 58.8
6381 67 19.6 19.6 78.4
7000 31 9.1 9.1 87.4
8184 14 4.1 4.1 91.5
8675 29 8.5 8.5 100.0
Total 342 100.0 100.0
Table 4: Income of the respondents
From the above table we can conclude that 99.5% of the respondents earn monthly income of
Birr 5000 and above. The remaining 0.5% earns income of below Birr 5000.
Marital status Frequency Percent Valid
Percent
Cumulative Percent
Valid
Single 273 79.8 79.8 79.8
Marrie
d 69 20.2 20.2 100.0
Total 342 100.0 100.0
Table 5: marital status of the respondents
As it can be seen from the table above the majority of the respondents are single (79.8). The
remaining 20.2% of the respondents account married.
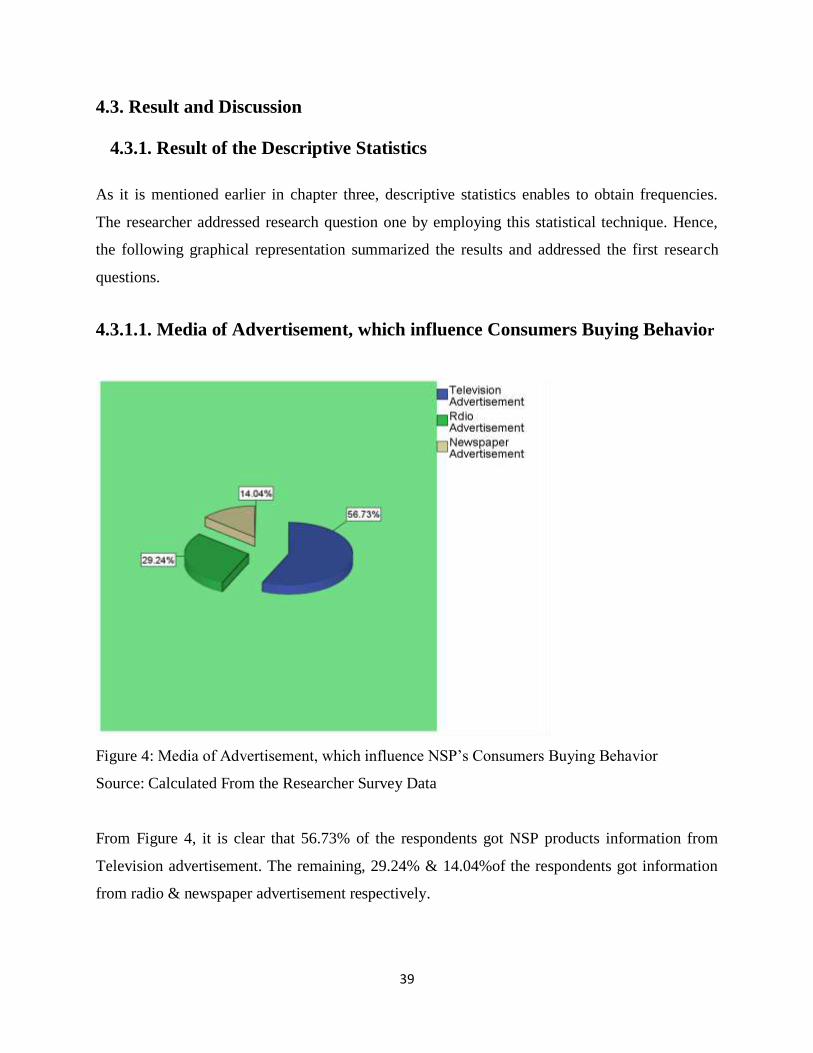
39
4.3. Result and Discussion
4.3.1. Result of the Descriptive Statistics
As it is mentioned earlier in chapter three, descriptive statistics enables to obtain frequencies.
The researcher addressed research question one by employing this statistical technique. Hence,
the following graphical representation summarized the results and addressed the first research
questions.
4.3.1.1. Media of Advertisement, which influence Consumers Buying Behavior
Figure 4: Media of Advertisement, which influence NSP‟s Consumers Buying Behavior
Source: Calculated From the Researcher Survey Data
From Figure 4, it is clear that 56.73% of the respondents got NSP products information from
Television advertisement. The remaining, 29.24% & 14.04%of the respondents got information
from radio & newspaper advertisement respectively.
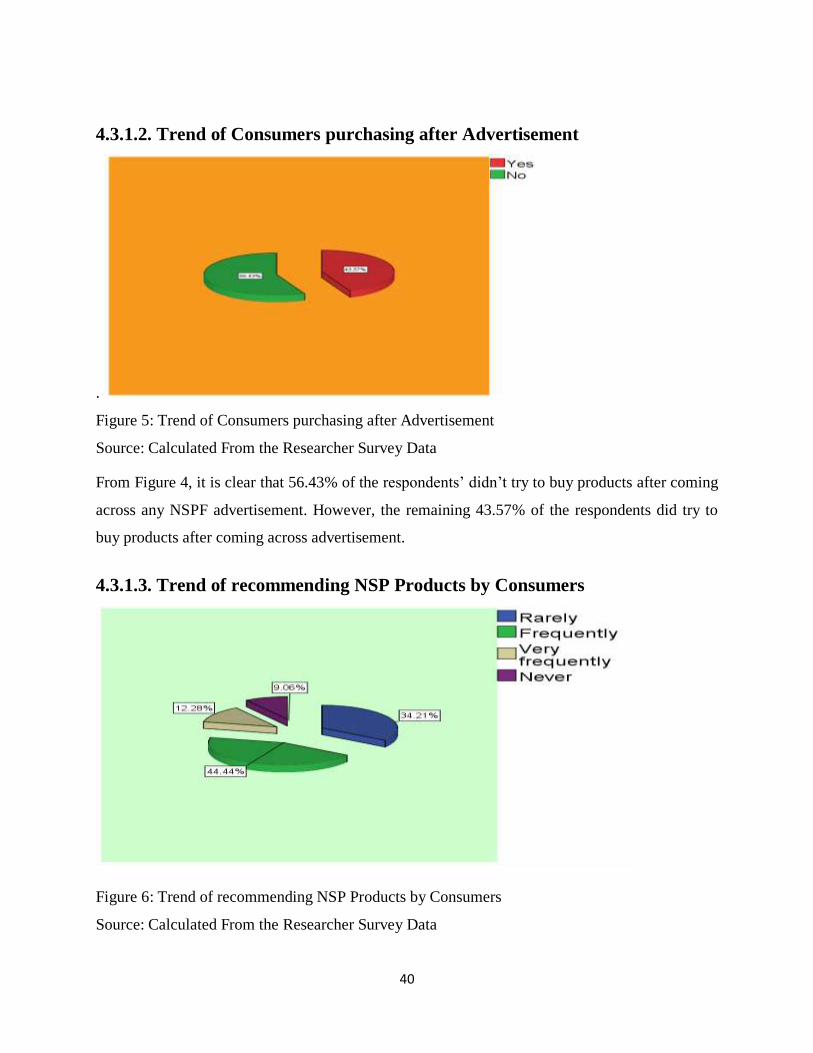
40
4.3.1.2. Trend of Consumers purchasing after Advertisement
.
Figure 5: Trend of Consumers purchasing after Advertisement
Source: Calculated From the Researcher Survey Data
From Figure 4, it is clear that 56.43% of the respondents‟ didn‟t try to buy products after coming
across any NSPF advertisement. However, the remaining 43.57% of the respondents did try to
buy products after coming across advertisement.
4.3.1.3. Trend of recommending NSP Products by Consumers
Figure 6: Trend of recommending NSP Products by Consumers
Source: Calculated From the Researcher Survey Data
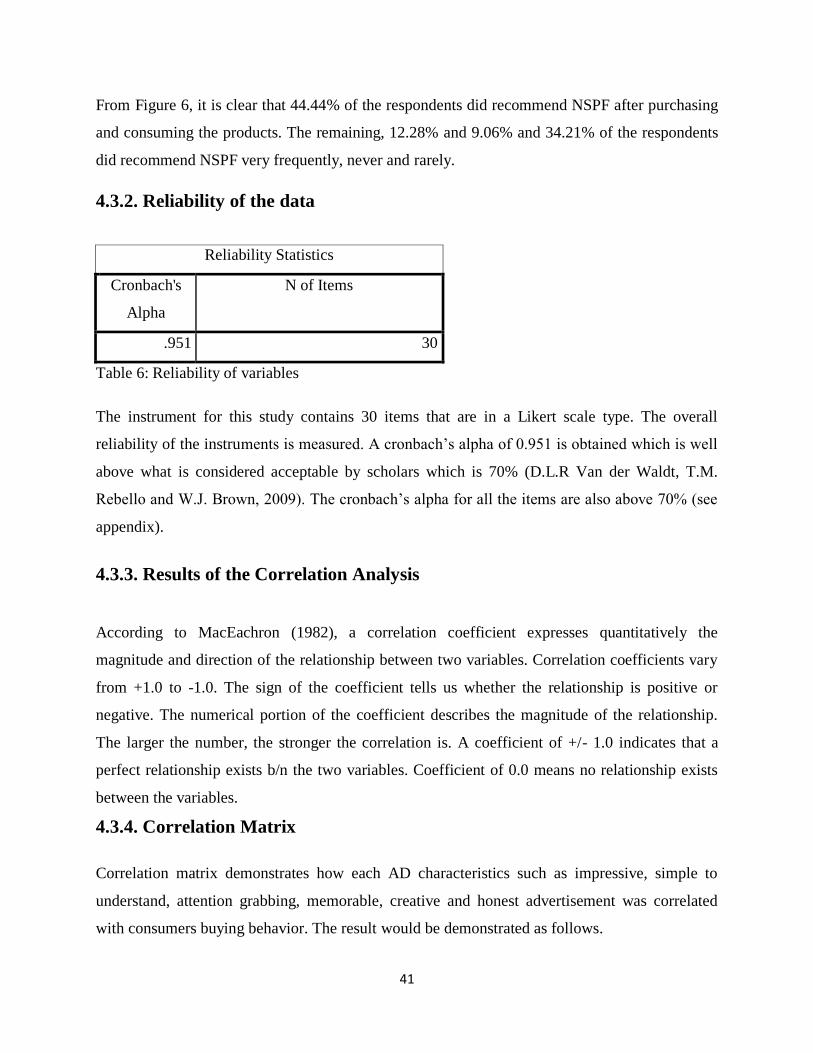
41
From Figure 6, it is clear that 44.44% of the respondents did recommend NSPF after purchasing
and consuming the products. The remaining, 12.28% and 9.06% and 34.21% of the respondents
did recommend NSPF very frequently, never and rarely.
4.3.2. Reliability of the data
Reliability Statistics
Cronbach's
Alpha
N of Items
.951 30
Table 6: Reliability of variables
The instrument for this study contains 30 items that are in a Likert scale type. The overall
reliability of the instruments is measured. A cronbach‟s alpha of 0.951 is obtained which is well
above what is considered acceptable by scholars which is 70% (D.L.R Van der Waldt, T.M.
Rebello and W.J. Brown, 2009). The cronbach‟s alpha for all the items are also above 70% (see
appendix).
4.3.3. Results of the Correlation Analysis
According to MacEachron (1982), a correlation coefficient expresses quantitatively the
magnitude and direction of the relationship between two variables. Correlation coefficients vary
from +1.0 to -1.0. The sign of the coefficient tells us whether the relationship is positive or
negative. The numerical portion of the coefficient describes the magnitude of the relationship.
The larger the number, the stronger the correlation is. A coefficient of +/- 1.0 indicates that a
perfect relationship exists b/n the two variables. Coefficient of 0.0 means no relationship exists
between the variables.
4.3.4. Correlation Matrix
Correlation matrix demonstrates how each AD characteristics such as impressive, simple to
understand, attention grabbing, memorable, creative and honest advertisement was correlated
with consumers buying behavior. The result would be demonstrated as follows.
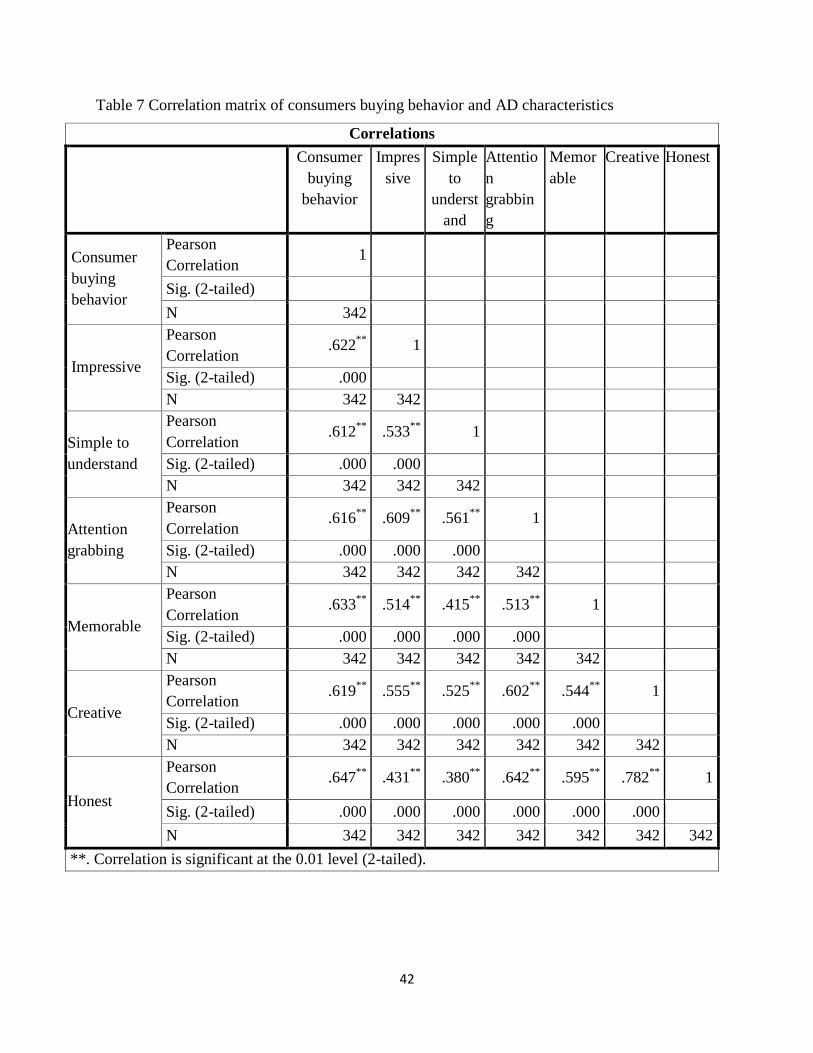
42
Table 7 Correlation matrix of consumers buying behavior and AD characteristics
Correlations
Consumer
buying
behavior
Impres
sive
Simple
to
underst
and
Attentio
n
grabbin
g
Memor
able
Creative Honest
Consumer
buying
behavior
Pearson
Correlation 1
Sig. (2-tailed)
N 342
Impressive
Pearson
Correlation .622
** 1
Sig. (2-tailed) .000
N 342 342
Simple to
understand
Pearson
Correlation .612
** .533
** 1
Sig. (2-tailed) .000 .000
N 342 342 342
Attention
grabbing
Pearson
Correlation .616
** .609
** .561
** 1
Sig. (2-tailed) .000 .000 .000
N 342 342 342 342
Memorable
Pearson
Correlation .633
** .514
** .415
** .513
** 1
Sig. (2-tailed) .000 .000 .000 .000
N 342 342 342 342 342
Creative
Pearson
Correlation .619
** .555
** .525
** .602
** .544
** 1
Sig. (2-tailed) .000 .000 .000 .000 .000
N 342 342 342 342 342 342
Honest
Pearson
Correlation .647
** .431
** .380
** .642
** .595
** .782
** 1
Sig. (2-tailed) .000 .000 .000 .000 .000 .000
N 342 342 342 342 342 342 342
**. Correlation is significant at the 0.01 level (2-tailed).
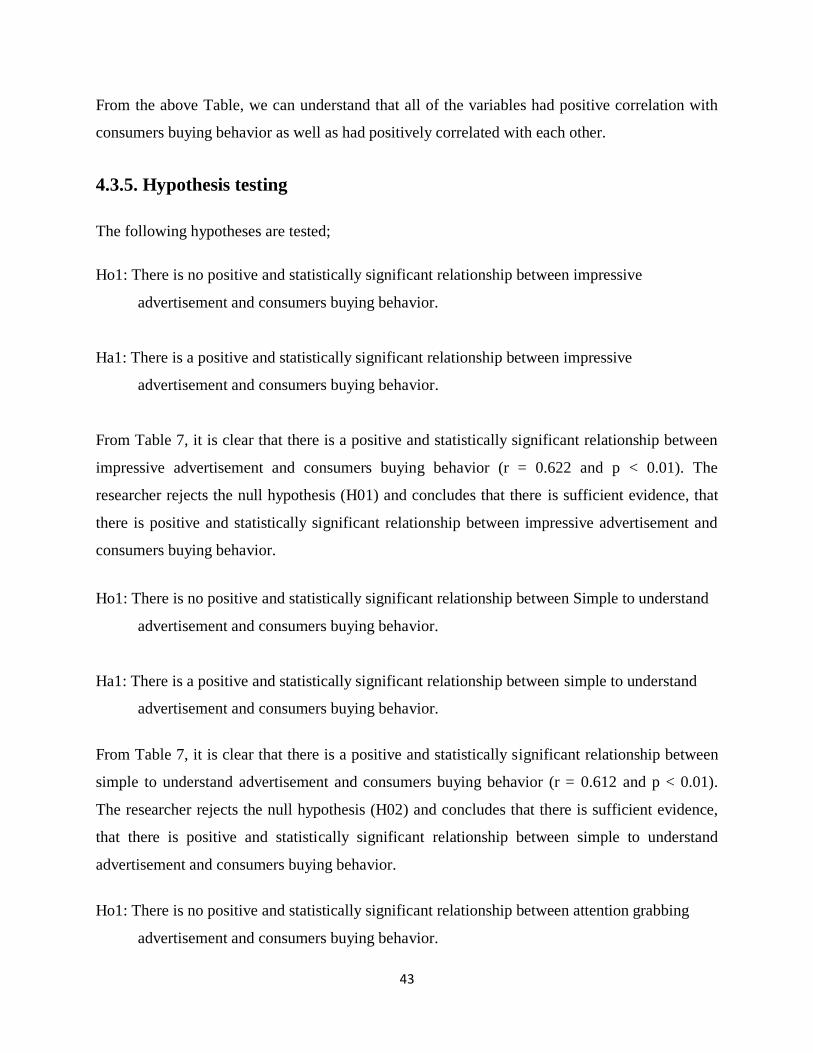
43
From the above Table, we can understand that all of the variables had positive correlation with
consumers buying behavior as well as had positively correlated with each other.
4.3.5. Hypothesis testing
The following hypotheses are tested;
Ho1: There is no positive and statistically significant relationship between impressive
advertisement and consumers buying behavior.
Ha1: There is a positive and statistically significant relationship between impressive
advertisement and consumers buying behavior.
From Table 7, it is clear that there is a positive and statistically significant relationship between
impressive advertisement and consumers buying behavior (r = 0.622 and p < 0.01). The
researcher rejects the null hypothesis (H01) and concludes that there is sufficient evidence, that
there is positive and statistically significant relationship between impressive advertisement and
consumers buying behavior.
Ho1: There is no positive and statistically significant relationship between Simple to understand
advertisement and consumers buying behavior.
Ha1: There is a positive and statistically significant relationship between simple to understand
advertisement and consumers buying behavior.
From Table 7, it is clear that there is a positive and statistically significant relationship between
simple to understand advertisement and consumers buying behavior (r = 0.612 and p < 0.01).
The researcher rejects the null hypothesis (H02) and concludes that there is sufficient evidence,
that there is positive and statistically significant relationship between simple to understand
advertisement and consumers buying behavior.
Ho1: There is no positive and statistically significant relationship between attention grabbing
advertisement and consumers buying behavior.
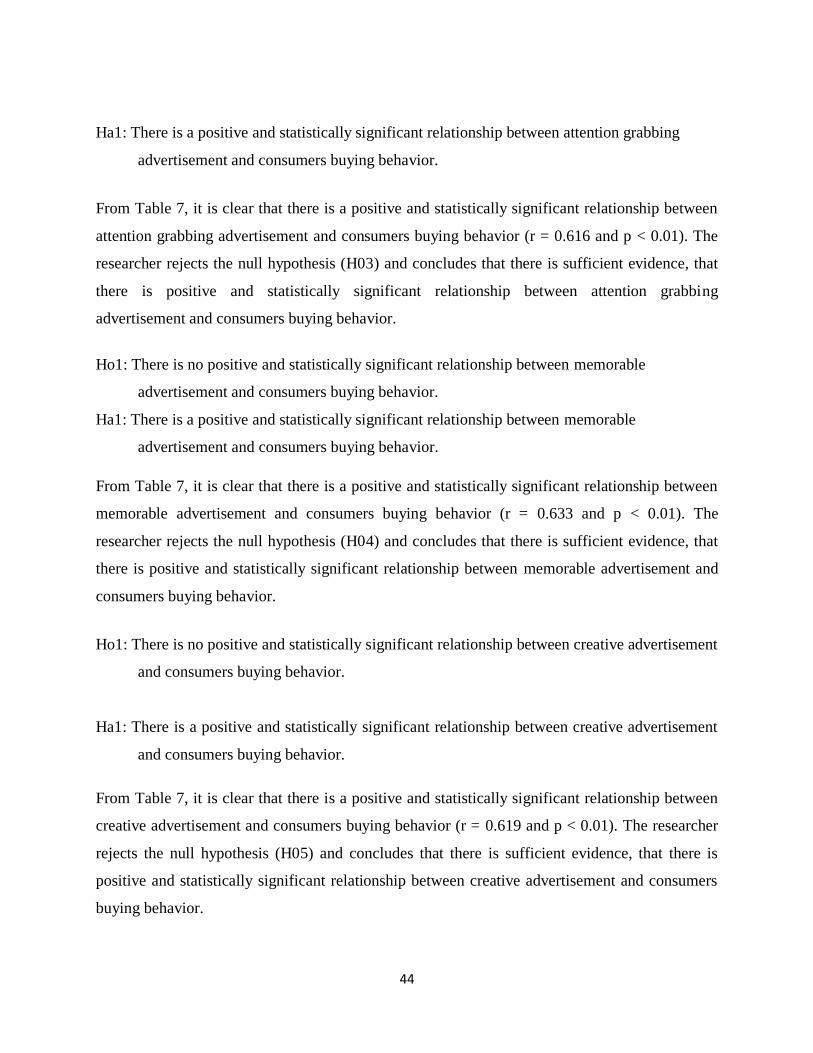
44
Ha1: There is a positive and statistically significant relationship between attention grabbing
advertisement and consumers buying behavior.
From Table 7, it is clear that there is a positive and statistically significant relationship between
attention grabbing advertisement and consumers buying behavior (r = 0.616 and p < 0.01). The
researcher rejects the null hypothesis (H03) and concludes that there is sufficient evidence, that
there is positive and statistically significant relationship between attention grabbing
advertisement and consumers buying behavior.
Ho1: There is no positive and statistically significant relationship between memorable
advertisement and consumers buying behavior.
Ha1: There is a positive and statistically significant relationship between memorable
advertisement and consumers buying behavior.
From Table 7, it is clear that there is a positive and statistically significant relationship between
memorable advertisement and consumers buying behavior (r = 0.633 and p < 0.01). The
researcher rejects the null hypothesis (H04) and concludes that there is sufficient evidence, that
there is positive and statistically significant relationship between memorable advertisement and
consumers buying behavior.
Ho1: There is no positive and statistically significant relationship between creative advertisement
and consumers buying behavior.
Ha1: There is a positive and statistically significant relationship between creative advertisement
and consumers buying behavior.
From Table 7, it is clear that there is a positive and statistically significant relationship between
creative advertisement and consumers buying behavior (r = 0.619 and p < 0.01). The researcher
rejects the null hypothesis (H05) and concludes that there is sufficient evidence, that there is
positive and statistically significant relationship between creative advertisement and consumers
buying behavior.
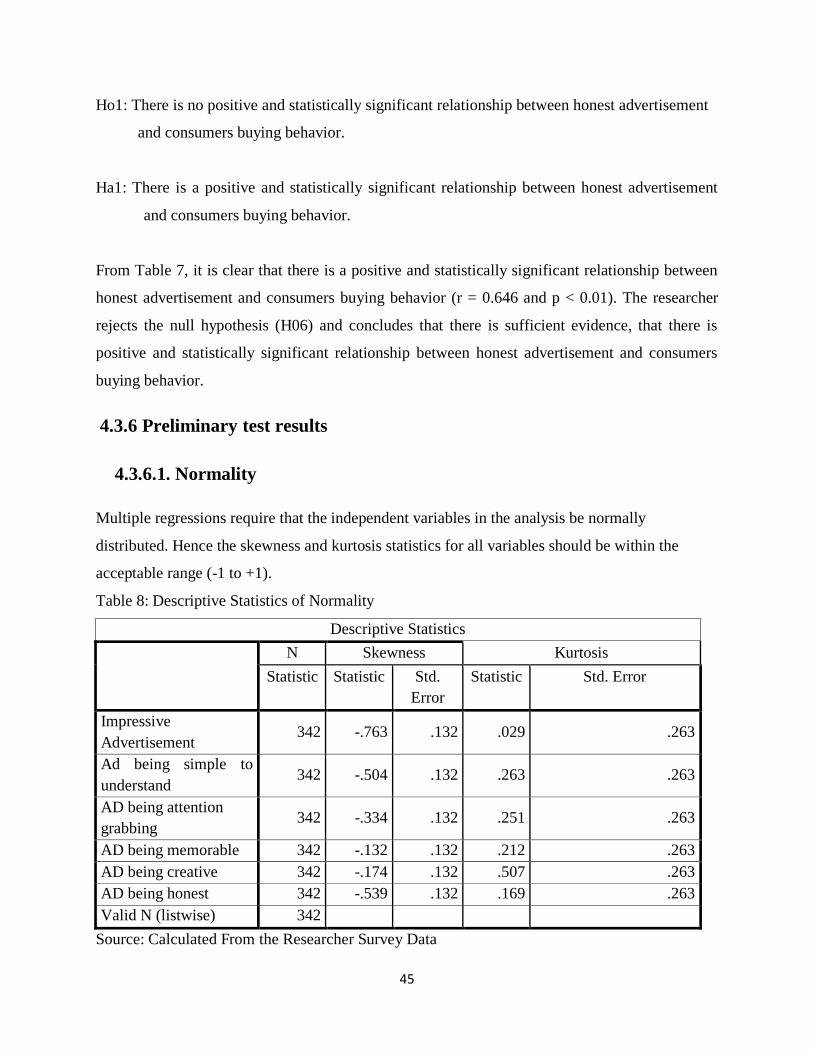
45
Ho1: There is no positive and statistically significant relationship between honest advertisement
and consumers buying behavior.
Ha1: There is a positive and statistically significant relationship between honest advertisement
and consumers buying behavior.
From Table 7, it is clear that there is a positive and statistically significant relationship between
honest advertisement and consumers buying behavior (r = 0.646 and p < 0.01). The researcher
rejects the null hypothesis (H06) and concludes that there is sufficient evidence, that there is
positive and statistically significant relationship between honest advertisement and consumers
buying behavior.
4.3.6 Preliminary test results
4.3.6.1. Normality
Multiple regressions require that the independent variables in the analysis be normally
distributed. Hence the skewness and kurtosis statistics for all variables should be within the
acceptable range (-1 to +1).
Table 8: Descriptive Statistics of Normality
Descriptive Statistics
N Skewness Kurtosis
Statistic Statistic Std.
Error
Statistic Std. Error
Impressive
Advertisement 342 -.763 .132 .029 .263
Ad being simple to
understand 342 -.504 .132 .263 .263
AD being attention
grabbing 342 -.334 .132 .251 .263
AD being memorable 342 -.132 .132 .212 .263
AD being creative 342 -.174 .132 .507 .263
AD being honest 342 -.539 .132 .169 .263
Valid N (listwise) 342
Source: Calculated From the Researcher Survey Data
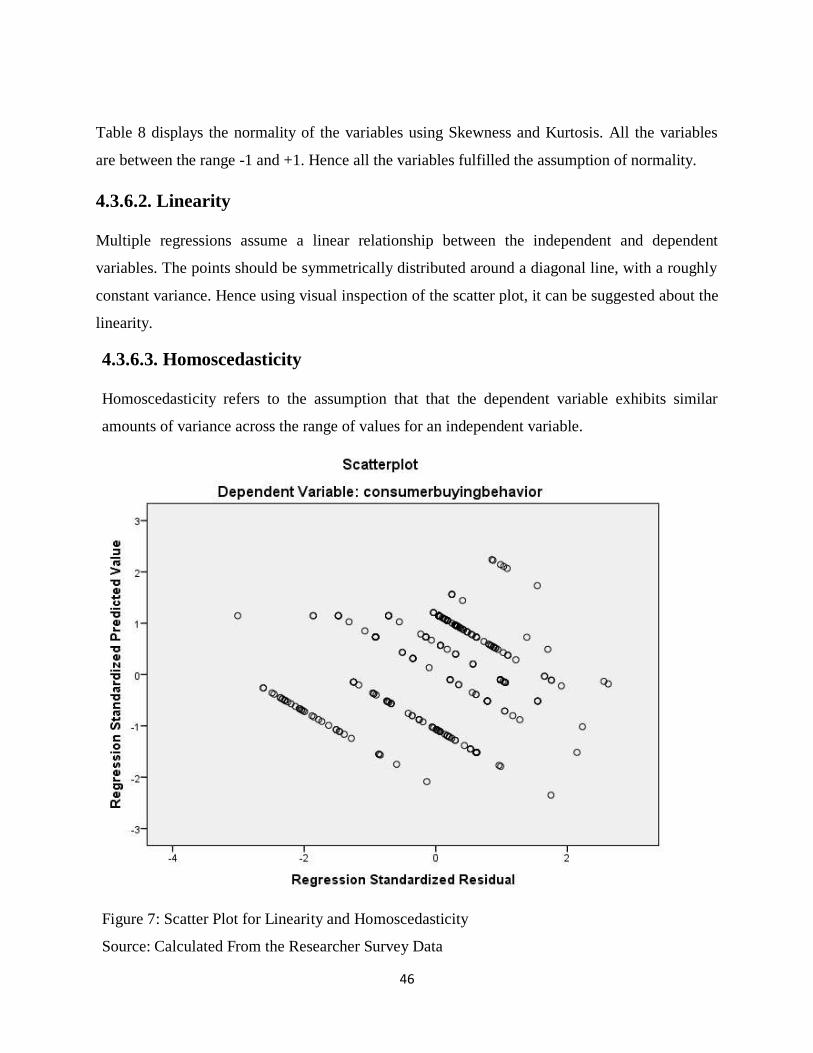
46
Table 8 displays the normality of the variables using Skewness and Kurtosis. All the variables
are between the range -1 and +1. Hence all the variables fulfilled the assumption of normality.
4.3.6.2. Linearity
Multiple regressions assume a linear relationship between the independent and dependent
variables. The points should be symmetrically distributed around a diagonal line, with a roughly
constant variance. Hence using visual inspection of the scatter plot, it can be suggested about the
linearity.
4.3.6.3. Homoscedasticity
Homoscedasticity refers to the assumption that that the dependent variable exhibits similar
amounts of variance across the range of values for an independent variable.
Figure 7: Scatter Plot for Linearity and Homoscedasticity
Source: Calculated From the Researcher Survey Data
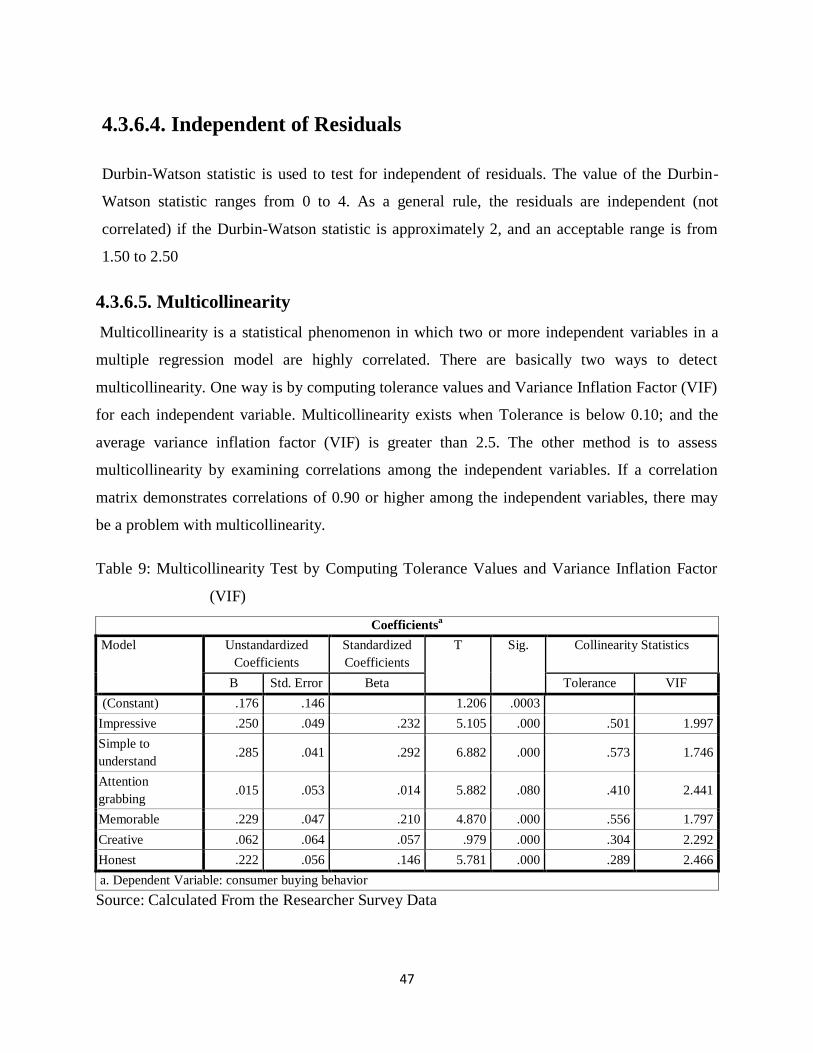
47
4.3.6.4. Independent of Residuals
Durbin-Watson statistic is used to test for independent of residuals. The value of the Durbin-
Watson statistic ranges from 0 to 4. As a general rule, the residuals are independent (not
correlated) if the Durbin-Watson statistic is approximately 2, and an acceptable range is from
1.50 to 2.50
4.3.6.5. Multicollinearity
Multicollinearity is a statistical phenomenon in which two or more independent variables in a
multiple regression model are highly correlated. There are basically two ways to detect
multicollinearity. One way is by computing tolerance values and Variance Inflation Factor (VIF)
for each independent variable. Multicollinearity exists when Tolerance is below 0.10; and the
average variance inflation factor (VIF) is greater than 2.5. The other method is to assess
multicollinearity by examining correlations among the independent variables. If a correlation
matrix demonstrates correlations of 0.90 or higher among the independent variables, there may
be a problem with multicollinearity.
Table 9: Multicollinearity Test by Computing Tolerance Values and Variance Inflation Factor
(VIF)
Coefficientsa
Model Unstandardized
Coefficients
Standardized
Coefficients
T Sig. Collinearity Statistics
B Std. Error Beta Tolerance VIF
1
(Constant) .176 .146 1.206 .0003
Impressive .250 .049 .232 5.105 .000 .501 1.997
Simple to
understand .285 .041 .292 6.882 .000 .573 1.746
Attention
grabbing .015 .053 .014 5.882 .080 .410 2.441
Memorable .229 .047 .210 4.870 .000 .556 1.797
Creative .062 .064 .057 .979 .000 .304 2.292
Honest .222 .056 .146 5.781 .000 .289 2.466
a. Dependent Variable: consumer buying behavior
Source: Calculated From the Researcher Survey Data
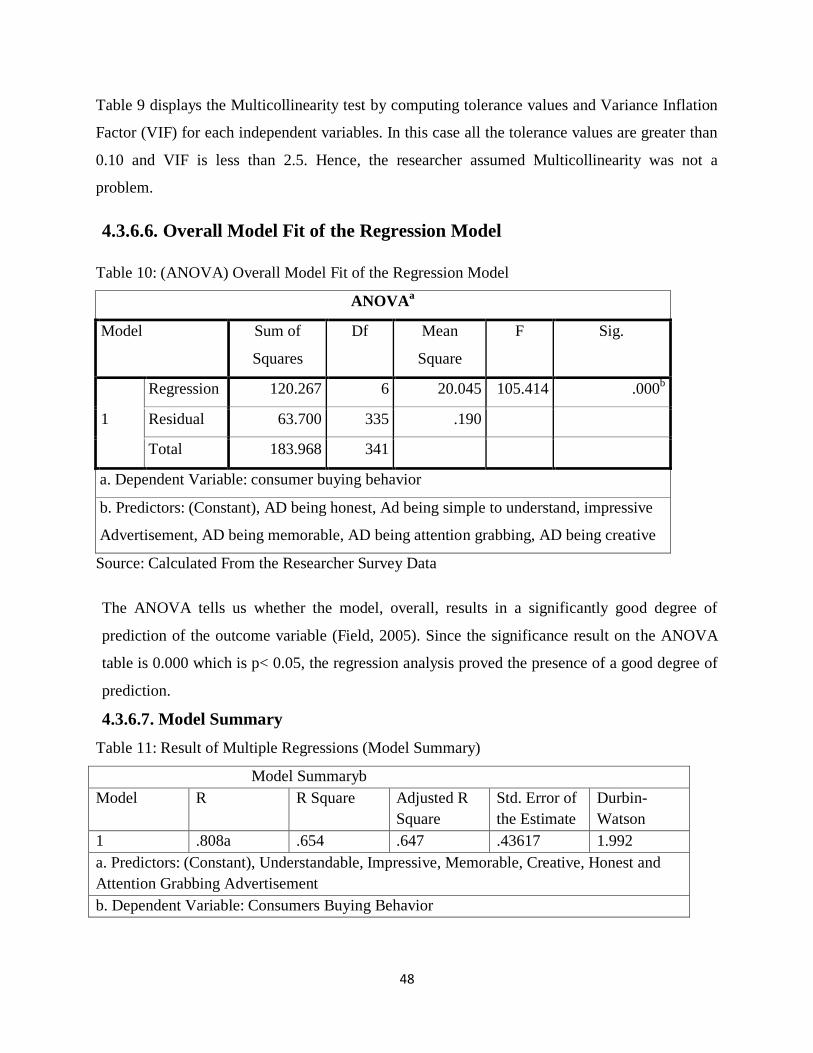
48
Table 9 displays the Multicollinearity test by computing tolerance values and Variance Inflation
Factor (VIF) for each independent variables. In this case all the tolerance values are greater than
0.10 and VIF is less than 2.5. Hence, the researcher assumed Multicollinearity was not a
problem.
4.3.6.6. Overall Model Fit of the Regression Model
Table 10: (ANOVA) Overall Model Fit of the Regression Model
ANOVAa
Model Sum of
Squares
Df Mean
Square
F Sig.
1
Regression 120.267 6 20.045 105.414 .000b
Residual 63.700 335 .190
Total 183.968 341
a. Dependent Variable: consumer buying behavior
b. Predictors: (Constant), AD being honest, Ad being simple to understand, impressive
Advertisement, AD being memorable, AD being attention grabbing, AD being creative
Source: Calculated From the Researcher Survey Data
The ANOVA tells us whether the model, overall, results in a significantly good degree of
prediction of the outcome variable (Field, 2005). Since the significance result on the ANOVA
table is 0.000 which is p< 0.05, the regression analysis proved the presence of a good degree of
prediction.
4.3.6.7. Model Summary
Table 11: Result of Multiple Regressions (Model Summary)
Model Summaryb
Model R R Square Adjusted R
Square
Std. Error of
the Estimate
Durbin-
Watson
1 .808a .654 .647 .43617 1.992
a. Predictors: (Constant), Understandable, Impressive, Memorable, Creative, Honest and
Attention Grabbing Advertisement
b. Dependent Variable: Consumers Buying Behavior
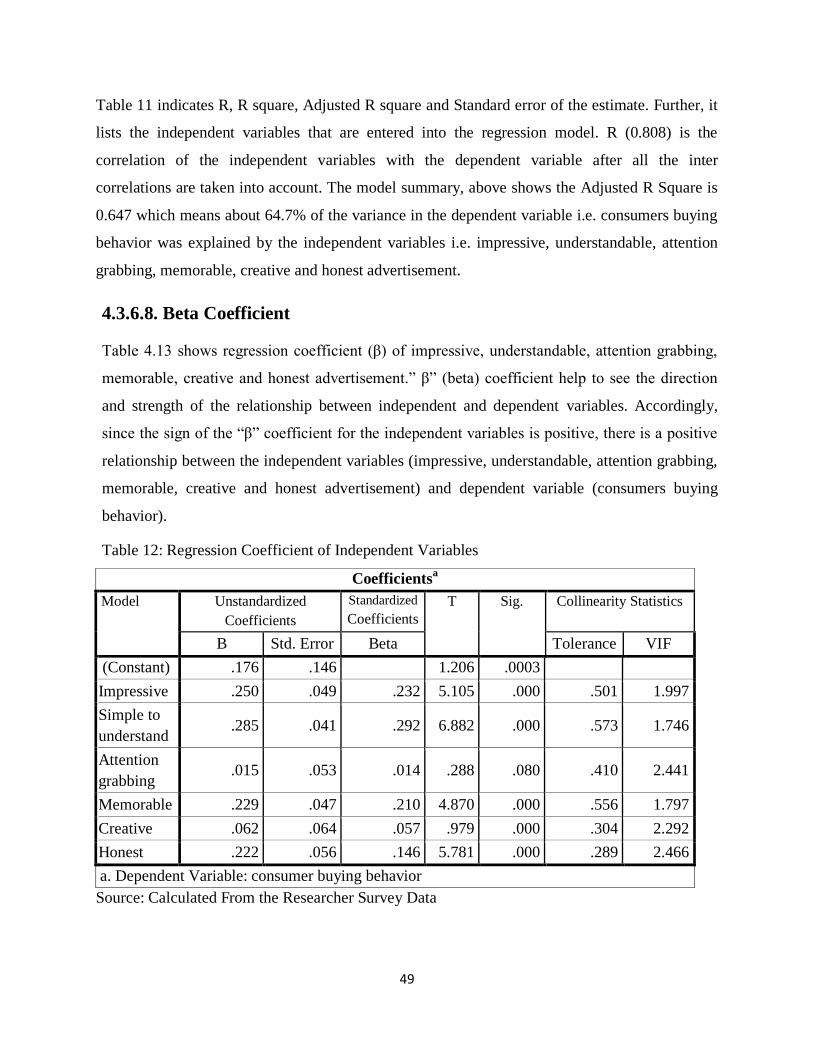
49
Table 11 indicates R, R square, Adjusted R square and Standard error of the estimate. Further, it
lists the independent variables that are entered into the regression model. R (0.808) is the
correlation of the independent variables with the dependent variable after all the inter
correlations are taken into account. The model summary, above shows the Adjusted R Square is
0.647 which means about 64.7% of the variance in the dependent variable i.e. consumers buying
behavior was explained by the independent variables i.e. impressive, understandable, attention
grabbing, memorable, creative and honest advertisement.
4.3.6.8. Beta Coefficient
Table 4.13 shows regression coefficient (β) of impressive, understandable, attention grabbing,
memorable, creative and honest advertisement.” β” (beta) coefficient help to see the direction
and strength of the relationship between independent and dependent variables. Accordingly,
since the sign of the “β” coefficient for the independent variables is positive, there is a positive
relationship between the independent variables (impressive, understandable, attention grabbing,
memorable, creative and honest advertisement) and dependent variable (consumers buying
behavior).
Table 12: Regression Coefficient of Independent Variables
Coefficientsa
Model Unstandardized
Coefficients
Standardized
Coefficients
T Sig. Collinearity Statistics
B Std. Error Beta Tolerance VIF
1
(Constant) .176 .146 1.206 .0003
Impressive .250 .049 .232 5.105 .000 .501 1.997
Simple to
understand .285 .041 .292 6.882 .000 .573 1.746
Attention
grabbing .015 .053 .014 .288 .080 .410 2.441
Memorable .229 .047 .210 4.870 .000 .556 1.797
Creative .062 .064 .057 .979 .000 .304 2.292
Honest .222 .056 .146 5.781 .000 .289 2.466
a. Dependent Variable: consumer buying behavior
Source: Calculated From the Researcher Survey Data
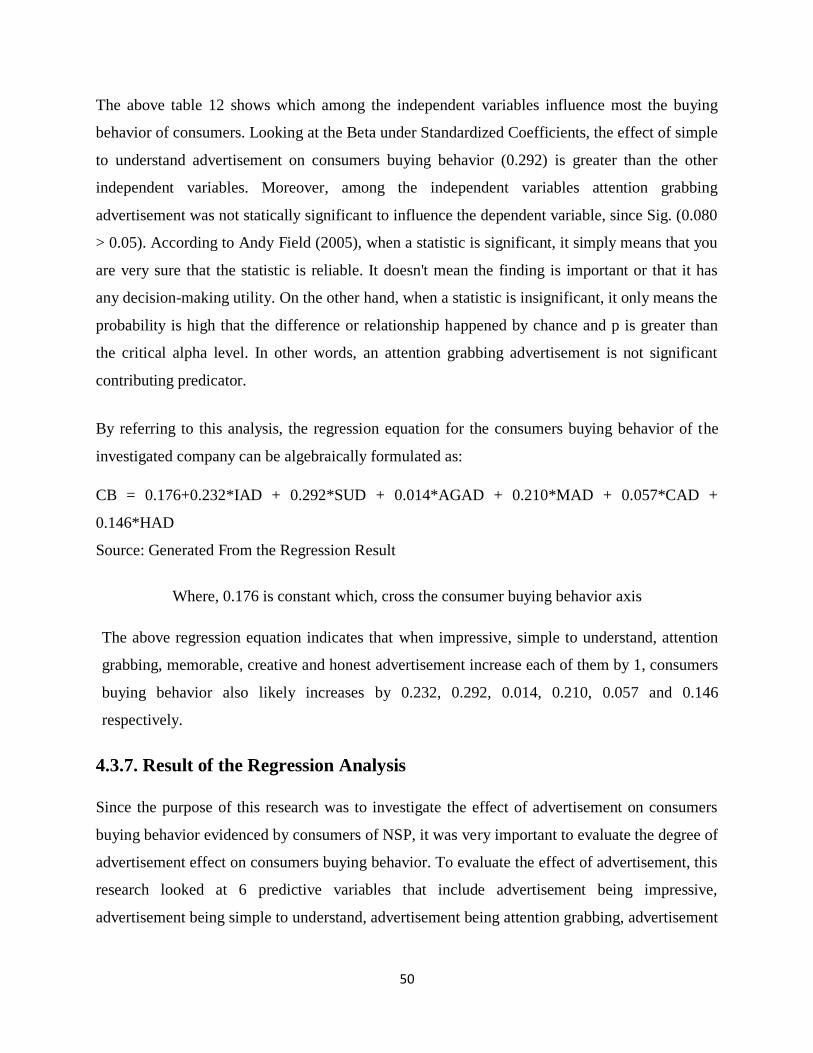
50
The above table 12 shows which among the independent variables influence most the buying
behavior of consumers. Looking at the Beta under Standardized Coefficients, the effect of simple
to understand advertisement on consumers buying behavior (0.292) is greater than the other
independent variables. Moreover, among the independent variables attention grabbing
advertisement was not statically significant to influence the dependent variable, since Sig. (0.080
> 0.05). According to Andy Field (2005), when a statistic is significant, it simply means that you
are very sure that the statistic is reliable. It doesn't mean the finding is important or that it has
any decision-making utility. On the other hand, when a statistic is insignificant, it only means the
probability is high that the difference or relationship happened by chance and p is greater than
the critical alpha level. In other words, an attention grabbing advertisement is not significant
contributing predicator.
By referring to this analysis, the regression equation for the consumers buying behavior of the
investigated company can be algebraically formulated as:
CB = 0.176+0.232*IAD + 0.292*SUD + 0.014*AGAD + 0.210*MAD + 0.057*CAD +
0.146*HAD
Source: Generated From the Regression Result
Where, 0.176 is constant which, cross the consumer buying behavior axis
The above regression equation indicates that when impressive, simple to understand, attention
grabbing, memorable, creative and honest advertisement increase each of them by 1, consumers
buying behavior also likely increases by 0.232, 0.292, 0.014, 0.210, 0.057 and 0.146
respectively.
4.3.7. Result of the Regression Analysis
Since the purpose of this research was to investigate the effect of advertisement on consumers
buying behavior evidenced by consumers of NSP, it was very important to evaluate the degree of
advertisement effect on consumers buying behavior. To evaluate the effect of advertisement, this
research looked at 6 predictive variables that include advertisement being impressive,
advertisement being simple to understand, advertisement being attention grabbing, advertisement
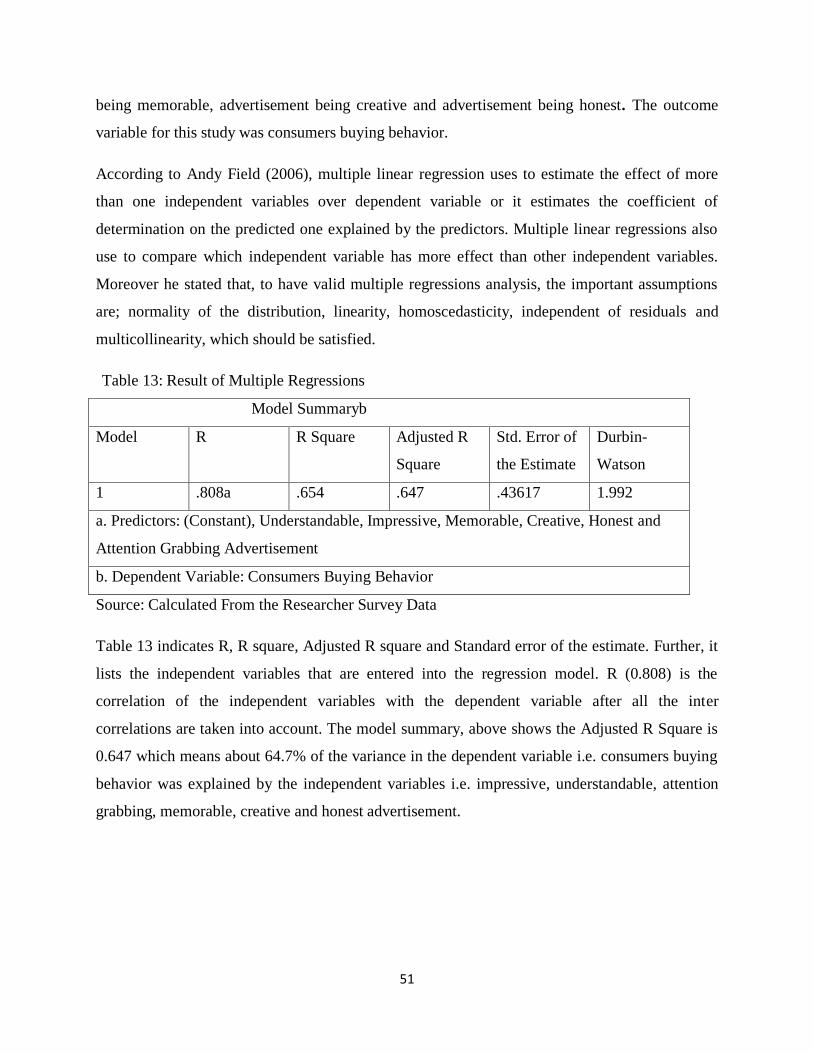
51
being memorable, advertisement being creative and advertisement being honest. The outcome
variable for this study was consumers buying behavior.
According to Andy Field (2006), multiple linear regression uses to estimate the effect of more
than one independent variables over dependent variable or it estimates the coefficient of
determination on the predicted one explained by the predictors. Multiple linear regressions also
use to compare which independent variable has more effect than other independent variables.
Moreover he stated that, to have valid multiple regressions analysis, the important assumptions
are; normality of the distribution, linearity, homoscedasticity, independent of residuals and
multicollinearity, which should be satisfied.
Table 13: Result of Multiple Regressions
Model Summaryb
Model R R Square Adjusted R
Square
Std. Error of
the Estimate
Durbin-
Watson
1 .808a .654 .647 .43617 1.992
a. Predictors: (Constant), Understandable, Impressive, Memorable, Creative, Honest and
Attention Grabbing Advertisement
b. Dependent Variable: Consumers Buying Behavior
Source: Calculated From the Researcher Survey Data
Table 13 indicates R, R square, Adjusted R square and Standard error of the estimate. Further, it
lists the independent variables that are entered into the regression model. R (0.808) is the
correlation of the independent variables with the dependent variable after all the inter
correlations are taken into account. The model summary, above shows the Adjusted R Square is
0.647 which means about 64.7% of the variance in the dependent variable i.e. consumers buying
behavior was explained by the independent variables i.e. impressive, understandable, attention
grabbing, memorable, creative and honest advertisement.
52
4.3.8. Discussion
According to the respondents, most of NSPF consumers recommend after purchase of paint
products. Due to this scenario, the existing consumers of NSPF recommend other new
customers to purchase the products. Television advertisement was the most preferred
advertisement channel by the most of the respondents; this was because manufacturing related
companies (including paint manufacturers) advertised their products and tenders on Television.
Thus, this reality created additional room for product comparison and to participate on the
tenders.
The results of correlation analysis suggested that the relationship of the six independent
variables with consumers buying behavior were strong and positive. There was a positive and
strong relationship between impressive, understandable, attention grabbing, memorable,
creative & honest advertisement and consumers buying behavior. This suggested that effective
advertisement characteristics which involve impressiveness, simplicity, eye catching, easy to
recall, creative and trusted is positively related to consumers buying decision. As per the
hypotheses tests, among the predictors impressive (r = 0.622, p < 0.01) memorable (r = 0.633, p
< 0.01) and creative (r = 0.619, p < 0.01) simple to understand (r = 0.612, p < 0.01) honest (r =
0.647, p < 0.01) attention grabbing (r = 0.616, p < 0.01) advertisement have a strong
relationship with consumers buying behavior.
Other researchers have also found similar results and hence the researcher compared the above
results by providing empirical evidences to each relationship.
H. M. Arshad (2014) found a strong relationship between (sensory) impressive advertisement
and consumers buying behavior (r = 0.690 and p < 0.05). In a study undertaken by V.
Prabakaran (2012), under the title “Impact of Advertisement on Consumers Behavior” it was
found positive relationship between impressive advertisement (calculated value 46 > table value
36.4) and consumers buying behavior. Z. U. Abideen and S. Saleem (2009) conduct a study
under the title “Effective Advertising and its influence on Consumers Buying Behavior” and
they found strong association between impressive advertisement and consumers buying
behavior (p < 0.05 but the “r” value was not stated).
53
Halkias (2013) analyzed the relationship between ability to recall (memorable) the advertisement
and consumers purchasing behavior using ANOVA and reported significant relationship (F =
24.13 and p < 0.001). Moreover they indicated developing effective advertising communication
has been traditionally regarded as an important function to increase consumers‟ purchasing
motivation. Huang (2011) reported strong relationship with (r = 0.520 and p < 0.01). Anand
(2000) analyzed effective recalling (memorize) of advertisement has significant effect on
sparking buying intentions (F = 22.26 and p < 0.001)
Empirical literature on relationship between creative advertisement and consumer buying
behavior is very limited and practitioners should emphasis on this issue. However, V. Prabakaran
(2012) found positive relationship between advertisement being creative (calculated value 66 >
table value 36.4) and consumers buying behavior.
Huang (2011) reported strong relationship with (r = 0.715 and p < 0.01). V. Prabakaran (2012)
found positive relationship between advertisement being honest (calculated value 44 > table
value 36.4) and consumers buying behavior. K. P. Saemundsson (2012) reported moderate
relationship (r = 0.513 and p < 0.001).
Also Long – Yi Lin (2011) reported attention grabbing advertising has a significantly positive
correlation with consumers buying intentions (p = 0.029 < 0.05). Moreover, he also reported
another perspective of relationship, he found advertising spokespersons have a positive effect on
advertising attitudes (p = 0.037 < 0.05). Huang (2011) reported moderate relationship with (r =
0.567 and p < 0.01). V. Prabakaran (2012) reported similar result with synonym variable. That
was advertisement being eye catching (calculated value 47 > table value 36.4) have positive
relationship with consumers buying behavior. H. M. Arshad (2014) also found a strong
relationship between (arousal) attention grabbing advertisement and consumers buying behavior
(r = 0.689 and p < 0.05).
D. Prasanna Kumar and K. Venkateswara Raju (2013) found a significant relationship between
ability of the AD in conveying the intended message (i.e. simple to understand) and its ability to
change the opinion and prejudice of the respondent about a product or service. V. Prabakaran
(2012) reported advertisement being understandable (calculated value 50 > table value 36.4)
have positive relationship with consumers buying behavior.
54
As per the correlation analysis, it has been discussed that the results of this study were similar
with the previous literatures. Thus, due to the positive relationship between the six predictor
variables and consumers buying behavior, any advertisement campaign of NSPF shall consider
these relationships. Having now discussed the results of the research and commented on the
relation with respect to empirical evidence, it is necessary to discuss the result of multiple
regression analysis to get further insight.
As it was mentioned earlier, multiple regression analysis was carried out to explain which
predictor variable most affects the dependent variable and to formulate the research model.
Among the six independent variables, simple to understand advertisement affects consumers
buying behavior more than the other independent variables, due to β = 0.292. The least and
insignificant contributor variable was attention grabbing with β = 0.014. And on the model
summary of the regression result, it was stated that (R = 0.808) is the correlation of the
independent variables with the dependent variable after all the inter correlations were taken into
account. Adjusted R Square was 0.647 which means about 64.7% of the variance in the
dependent variable i.e. consumers buying behavior was explained by the independent variables.
The following table is a representation of the degree of influence towards consumers buying
behavior.
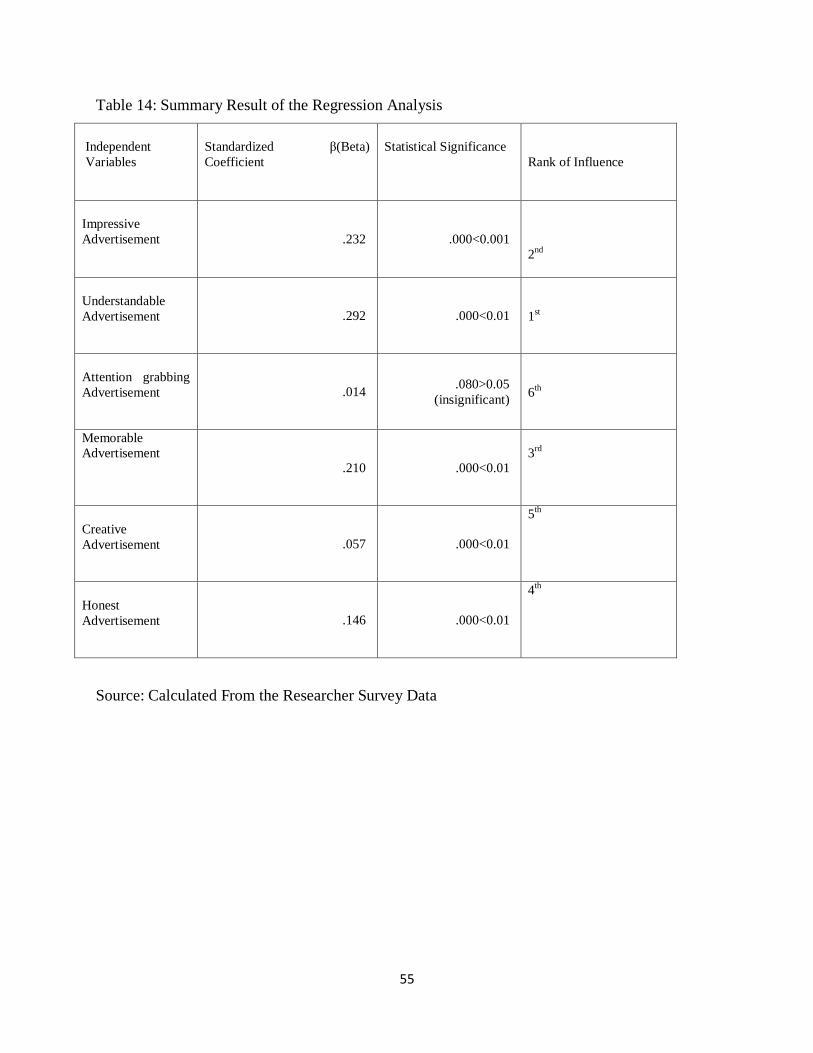
55
Table 14: Summary Result of the Regression Analysis
Independent
Variables
Standardized β(Beta)
Coefficient
Statistical Significance
Rank of Influence
Impressive
Advertisement .232 .000<0.001
2nd
Understandable
Advertisement
.292 .000<0.01
1st
Attention grabbing
Advertisement
.014 .080>0.05
(insignificant)
6th
Memorable
Advertisement .210 .000<0.01
3rd
Creative
Advertisement
.057 .000<0.01
5th
Honest
Advertisement .146 .000<0.01
4th
Source: Calculated From the Researcher Survey Data
56
CHAPTER FIVE
SUMMARY, CONCLUSIONS, RECOMMENDATIONS
& IMPLICATIONS FOR FUTURE RESEARCH
This chapter presents Summary of the findings, conclusions and recommendations by addressing
research questions: “Which advertisement media has more influence on consumer buying
behavior?”; “Do advertising characteristics have direct relationship with consumers buying
behavior?” How do advertising characteristics affect consumers buying behavior?
5.1. Summary of the Findings
From the analysis and discussion, the researcher presented the following major findings.
Based on the descriptive analysis of the study, the company has potential consumers
since most of them (99.5%) the respondents income is Birr 5000 and above per month.
However, majority of the respondents (56.43%) didn‟t try to buy products after coming
across any NSPFs advertisement. Furthermore, among the respondents (56.73%) were
influenced by television advertisement of NSPF.
The correlation matrix indicates that the selected AD characteristics: “impressive, simple
to understand, attention grabbing, memorable, creative and honest” were positively and
strongly correlated with consumers buying behavior with 95% confidence interval &
<0.01 p-value 2tailed, by scoring a Pearson Correlation Coefficient “R-value” of
0.622**, 0.612**, 0.616**, 0.633**, 0.619** &. 0.647**.
The highest strong coefficient of correlation in this research between selected AD
characteristics and consumers buying behavior is 0.647. In this case relatively honest
advertisement had a highest strong relationship with consumers buying behavior (r =
0.647, n = 342, p < 0.01) than the other five independent variables.
The last major finding of the regression analysis result is, all selected independent
variables (impressive, simple to understand, attention grabbing, memorable, creative and
honest) contribute to statistically significant level at (p-value < 0.001) except attention
grabbing advertisement (0.080>0.05) which is insignificant.
57
The score of the coefficient correlation determination (R2) is 0.647 which indicate, 64.7%
of the variability of overall consumers buying behavior was explained by the six
independent variables.
5.2. Conclusions
The purpose of this study was to investigate the effect of advertising on consumers buying
behavior. To achieve the purpose of the study three basic research questions were proposed to
investigate the effect of advertising on consumers buying behavior and to answer the stated basic
questions.
From the findings of the study it can be concluded that:
The entire research objective for this study was attained; the general objective of this
study was to examine the effect of advertising on consumers buying behavior: The case
of Nifas Silk Paints Factory. All selected AD characteristics except attention grabbing
have significant effect on consumers buying behavior.
Correlation analysis was conducted to analyze the relationships between variables; the
correlation matrix revealed that all coefficients of correlations independent variables were
positively and strongly correlated with the dependent variable.
Based on the correlation analysis all alternative hypotheses generated for this study is
accepted and the entire null hypothesis rejected.
The quantitative result shows that most of consumers are influenced by television
advertisements. This indicates that Television advertisement was the first choice by most
of the respondents.
From the regression result, it can be concluded that simple to understand AD had
contributed the largest effect on consumers buying behavior. This finding was also
compared with empirical evidences to get additional insight. The evidence presents
except attention grabbing AD, the other five predictors contributed significant effect on
consumers buying behavior.
58
5.3. Recommendations
Based on the finding and conclusion of the study the following recommendations are forwarded.
Television has more power to influence than other media. Advert which is displayed in
television can be remembered easily and fast because people see and hear the advert. The
study recommends that advertisers should use television adverts well and the message
should be supported well by visual so as to gain new customers, create brand loyalty and
persuade well.
To consider and give due attention to all the six predictors of advertisement when taking
action to influence more consumers but more attention should be given to simple to
understand and impressive advertisements. As the multiple regression result of this study
indicated, effect of those factors motivating consumers‟ buying behavior is more than the
remaining four advertisement features. Thus by campaigning simple to understand and
impressive advertisements, NSPF can attract more consumers in addition to the exiting
consumers.
As per the results of the study, most of the consumers got attached by television
advertisement. Radio and newspaper advertisements of NSPF didn‟t get enough attention
by consumers. This may be a result of lack of enough information and ineffectiveness of
the advertisements messages through these Medias regarding the products. Advertisement
effectiveness is the joint responsibility of the advertiser and the advertising agency.
Regular and consistent up-to-date training on the product information should be given to
the advertising agencies, which work with NSPF, so that they will have the current
knowledge and skills to handle the adverts and to make the adverts more attention
grabbing, impressive, honest, memorable and creative.
Compromise must be discarded for advert to be successful, hence, the need to employ the
services of core professionals for the purpose of proper planning and execution of the
advert rather than use quacks in order to cut cost.
Advertising should be seen as an investment into the future of products and not to be
evaluated by its immediate returns.
59
5.4. Implication for future research
The consumers buying behavior of coefficient of determination R2 is 0.647, which
implies that there is quite significant explanatory power and also 64.7% variation on
dependent variable is caused by independent variables and the remaining 35.3% is
because of other unknown variables. Therefore depending on this statement still there is a
room for other studies to conduct. Therefore other variables which could affect
consumers buying behavior of NSPF is a potential area for further study.
Finally, other researchers have to do more studies on these advertisement features which
increase AD effectiveness in order to see how these features look like in different
organizations in the country and to understand more on the contribution of these factors
towards motivating consumers buying behavior. As far as the samples are concerned,
possible enlargement of the sample of the study in other branches would be highly
desirable. In this regard, similar studies at other companies that used advertisements
widely would seem appropriate. Based on the regression analysis, attention grabbing
advertisement was not statistically significant predictor on affecting consumers buying
behavior, thus other researchers could work on this statistical phenomenon with different
research techniques and approaches.
60
REFERENCES
Aaker and David A. (1978). The Social and Economic Effects of Advertising in Consumerism:
The Search for the Consumer Interest, 3rd
edition, New York: Sage Publication Inc.
Arens, Williams F. (1996). Contemporary Advertising. USA: Richard D. Irwin, A. Times Mirror
Higher Education Group Inc. Company.
Arshad, H. M., et al. (2014). Impact of Effective Advertising on Consumer Buying Behavior: A
Study of Mobile Phone Purchasers in Pakistan. Journal of Basic and Applie , 4(3), 224-
231.
Barney J.B. and M. H. Hansen (1994). Trustworthiness as a Source of Competitive Advantage.
Strategic Management Journal, 15 (3), 175-190.
Bearden W. O. (1999). Handbook of Marketing Scales: Multi-Item Measures For Marketing &
Consumer Behavior Research. London: Sage Publications, Inc.
Beccera, M. and A. K. Gupta (1999). Trust within the Organization: Integrating the Trust
Literature with Agency Theory and Transaction Cost Economics. Public Administration
Quarterly, 177-203.
Belch, G. & Belch, M. (2012). Advertising and Promotion: An Integrated Marketing
Communications Perspective. New York: McGraw-Hill/Irwin.
Biel, AL & Bridgewater, CA (1990). Attributes of Likeable Television Commercials. Journal of
Advertising Research, 30 (3), 38–44.
Bishnoi and Sharma, (2009). The Impact of TV Advertising on Buying Behaviour: A
Comparative Study of Urban and Rural Teenagers. JK Journal of Management &
Technology, ISSN 0975–0924: 1(1) Number 1 (2009), 65–76.
Blackwell, R. & Minaard, P.W., (2000). Consumer Behavior. South-Western College Pub,
England.
Colley and Russell H. (1984). Defining Advertising Goals for Measured Advertising Results.
New York: Association for National Advertisers.
Ehrenberg (1974). Repetitive Advertising and the Consumer. Journal of Advertising Research,
14, 25-34.
Folkes V. S. (1984). Consumer Reactions to Product Failure: An Attributional Approach. Journal
of Consumer Research, 10 (4), 398–409.
61
Gary Austin Witt (1999). High Impact: How You Can Create Advertising That Sells! Arizona:
Marketing Psychology group. Inc.
Katke, K., (2007). “The Impact of Television Advertising on child health & family spending
international marketing conference on Marketing & Society”.http://www.academia.edu.
(Retrieved on dated 10th
April 2009)
Keller K. L. & Kotler P. (2012). Marketing Management. New Jersey: Pearson Edu., Inc.
Kothari, C.M. (2004): Research Methodology. Methods and Techniques. New Delhi: New Age
International (P) Limited.
Kumar, R., (2005). Research Methodology: A Step by Step Guide for Beginners. London: SAGE
Publication Ltd.
Laurie S. & Mortimer K. (2011). A Communication-Based Marketing Model for Managing
Relationships. Journal of Marketing Management, 5(3), 332 - 356.
Lucas D. B. & Britt S. H. (1963). Measuring Advertising Effectiveness. UK: McGraw-Hill
Education.
Maria Josephine W., T. Devasenathipathi and Parameswaran S. (2008). Customers‟ Attitude
towards Advertisement with Special Reference to Airtel and Hutch Brand. Journal of
Consumer Behavior. 3(2), 7 – 16.
Matin Khan (2006). Consumer Behavior and Advertising Management. New Delhi: New Age
International Limited Publishers.
Metha A. (2000). Advertising Attitudes and Advertising Effectiveness. Journal of Advertising
Research, 40 (6), 67-72.
M. Bansal and S. Gupta (2014). Impact of Newspaper Advertisement on Consumer Behavior:
Global Journal of Finance and Management. 6(2), 669 - 674.
McDaniel C., and R. Gates (1998). Marketing Research Essentials. 2nd
edition. Cincinnati, oh:
Southwestern College Publishing.
Morden A.R. (1991). Elements of Marketing. London: D.P. Publication Ltd.
Moskal, B.M. & Leydens, J.A., (2000). “Scoring Rubric Development. Validity and reliability.
Practical Assessment”, Research and Evaluation, 7(10) pp. 67-75.
Muhammad, B. A., & Alkubise, M. (2012). “How online advertisement does affect consumer
purchasing”. European Journal of Business and Management, 4(7), pp. 208-218.
62
Nianzi (2011) “Effective Advertising and Its Influence on Consumer Buying Behavior through
Information”. Management and Business Review. Vol.4, No. 3 pp. 114-119
Overby, L. M. and Barth, J. 2006. Radio advertising in American political campaigns: The
persistence, importance, and effects of narrowcasting. American Politics Research, 34:
451-478.
Prasanna, Kumar, D. & K. Venkateswara Raju (2013). Role of Advertising in Consumer Decision
Making. Journal of Business & Management, 14(4), 37-45.
Peter D. Bennett (1995). Dictionary of Marketing Terms. Chicago: McGraw Hill.
P. Clave (2014). Identifying the Relevant Factors Effectiveness. In Newspaper Advertising
Journal of Marketing, 17 (4), 1114 - 1134.
R. Khan S. R. Kamble and Rita Khatri (2011). Advertising Course, Institute of distance and open
learning, university of Mumbai.
Romaniuk, J. & Sharp. B., (2004). “Conceptualizing & Measuring Brandi Salience”. Marketing
Theory articles, 4(4), pp. 327-342.
Sauls, S. J. and Greer, D. (2007). Radio and Localism: Has the FCC Dropped the Ball? Journal
of Radio & Audio Media, 14: 37-48.
Sekaran, U. (2003), Research Methods for Business: A Skill Building Approach, 4th
Ed. New
York: John Wiley & Sons.
Schultz D. E. (1990). Strategic Advertising Campaigns. 3rd
edition. Lincolnwood, IL: NTC
Business Books.
Schifman L. G., Kanuk L. L. and Wisenblit J. (2010). Consumer Behavior. 10th
edition,
NewYork: Pearson Inc.
Solomon M., Bamossy G., Askegaard S. and Hogg M. K. (2010). Consumer Behavior. A
European Perspective. Harlow: Pearson Education.
Stone M. A., (1982). Marketing Research. Great Britain: Macdonald and Evans Ltd.
Van, G. S., Speelman, D., and Geeraerts, D. 2008. Style shifting in commercials. Journal of
Pragmatics, 40: 205-226
Vaughn, Richard (1980). How Advertising Works: A Planning Model. Journal of Advertising
Research, 20(5), 27 - 33.
Verhoef, P. C.; Hoekstra, J. C. and van Aalst, M. 2000. The effectiveness of direct response
radio commercials, European Journal of Marketing, 34: 143-155
63
Webster F. E. and Wind Y. (1992). Organizational Buying Behavior. Englewood Cliffs NJ:
Prentice Hall.
Wells W. (1997). Measuring Advertising Effectiveness. New edition. US: Lawrence Erlbaum
Associates Inc.
Yousaf and Shehzad, (2013). Effects of Television Commercials on the Literate and Illiterate
People of Pakistan (A Case Study of Gujarat City). Open access scientific reports: 2 (1).
Zaltman G. (2003). How Customers Think: Essential Insights Into The Mind of The Market.
Boston: Harvard Business School Press.
Zaltman G. (2003). How Customers Think: Essential Insights Into The Mind of The Market.
Boston: Harvard Business School Press.
Zikmund W.G. (2003). Business Research Methods, 7th
edition, Fort Worht: Dryden Press.
Mittal, S. and Pachauri, K.K. (2013) ‘An Analysis of Promotional Tools & Techniques Adopted
For Paint Manufacturing Company’, Journal of Business Management & Social
Sciences Research (JBM&SSR) Volume 2, ISSN No: 2319‐5614, No.2, Available at:
www.borjournals.com, /Accessed 16/12/2013/.
Schultz, E.D. and Tannenbaum, I. S. (1988) „Essentials of Advertising Strategy’, 2nd
ed. National
Text Books Company, West Touhy Avenue. USA
Maria Alina Jurca, (2013), Comparative Study Of Advertising Creativity –Traditional Versus
Ambient, Babeș-Bolyai University, Cluj-Napoca, Faculty Of Economics And Business
Administration

64
Addis Ababa University
School of Commerce
Department of Marketing Management
Masters Program
A survey Questionnaire to be filled by consumers of Nifas Silk Paints
Dear Respondent,
My name is Asnake Meshesha. I am a student in the post graduate program of the Addis Ababa
University. I am conducting a research on the topic: The Effect of Advertisement on Consumers
Buying Behavior in case of Nifas Silk Paint Factory, to fulfill the partial requirements for the
Master of Arts degree in Marketing Management. This questionnaire is, therefore, designed to
collect firsthand information/data on the topic under caption. Since the information acquired is
for academic purposes the anonymity of the respondent is guaranteed. Hence, it is not necessary
to write your name on the questionnaire. This is, therefore, to kindly request you to take a few
minutes to fill out the questionnaire as genuinely and completely as possible.
Instructions:
Please describe your personal views of the following statements as objectively as you can, by
entering in the block a tick “√” that best reflects your views.
I remain grateful to you for your kind cooperation.
AsnakeMeshesha ([email protected])
Addis Ababa
May, 2018
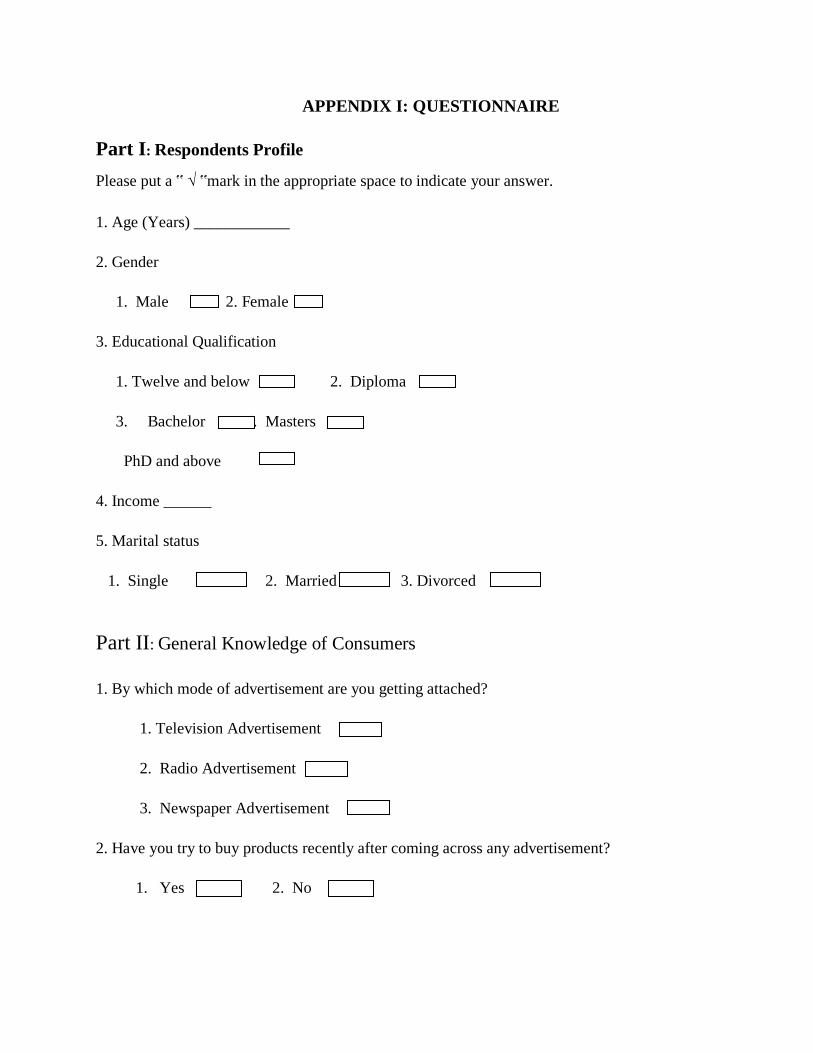
65
APPENDIX I: QUESTIONNAIRE
Part I: Respondents Profile
Please put a ‟ √ ‟mark in the appropriate space to indicate your answer.
1. Age (Years) ____________
2. Gender
1. Male 2. Female
3. Educational Qualification
1. Twelve and below 2. Diploma
3. Bachelor 4. Masters
PhD and above
4. Income ______
5. Marital status
1. Single 2. Married 3. Divorced
Part II: General Knowledge of Consumers
1. By which mode of advertisement are you getting attached?
1. Television Advertisement
2. Radio Advertisement
3. Newspaper Advertisement
2. Have you try to buy products recently after coming across any advertisement?
1. Yes 2. No
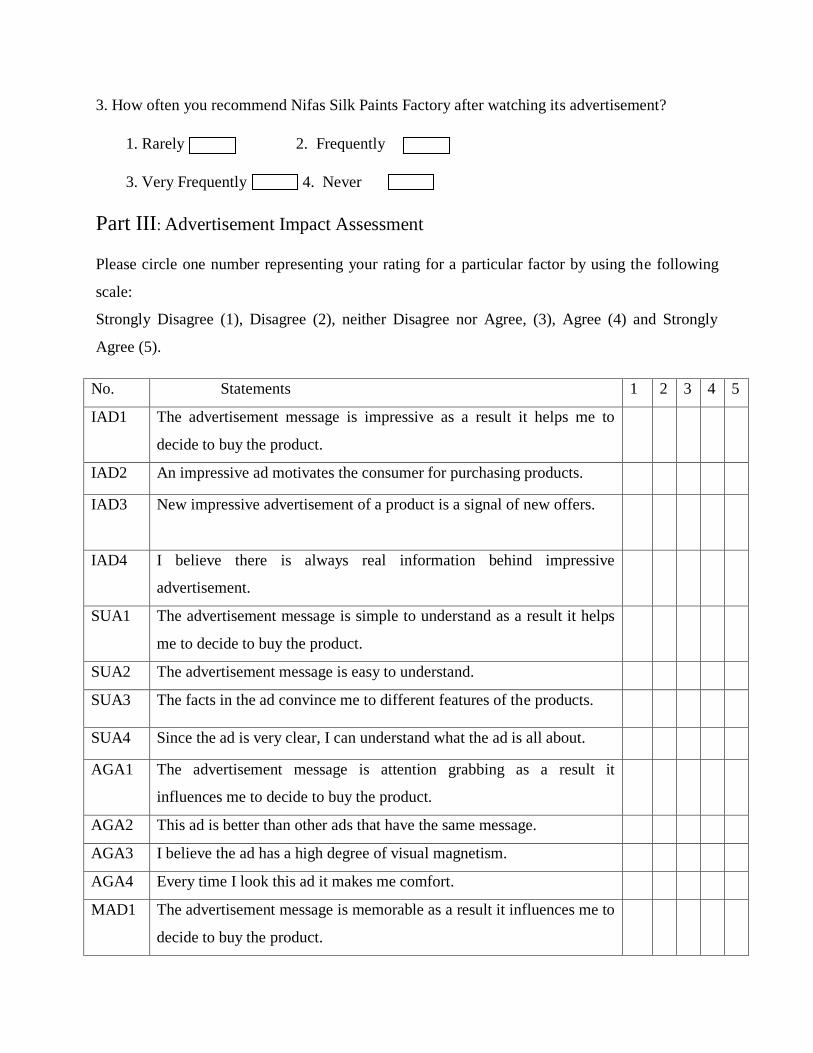
66
3. How often you recommend Nifas Silk Paints Factory after watching its advertisement?
1. Rarely 2. Frequently
3. Very Frequently 4. Never
Part III: Advertisement Impact Assessment
Please circle one number representing your rating for a particular factor by using the following
scale:
Strongly Disagree (1), Disagree (2), neither Disagree nor Agree, (3), Agree (4) and Strongly
Agree (5).
No. Statements 1 2 3 4 5
IAD1
The advertisement message is impressive as a result it helps me to
decide to buy the product.
IAD2 An impressive ad motivates the consumer for purchasing products.
IAD3
New impressive advertisement of a product is a signal of new offers.
IAD4 I believe there is always real information behind impressive
advertisement.
SUA1
The advertisement message is simple to understand as a result it helps
me to decide to buy the product.
SUA2 The advertisement message is easy to understand.
SUA3 The facts in the ad convince me to different features of the products.
SUA4 Since the ad is very clear, I can understand what the ad is all about.
AGA1 The advertisement message is attention grabbing as a result it
influences me to decide to buy the product.
AGA2 This ad is better than other ads that have the same message.
AGA3 I believe the ad has a high degree of visual magnetism.
AGA4 Every time I look this ad it makes me comfort.
MAD1
The advertisement message is memorable as a result it influences me to
decide to buy the product.
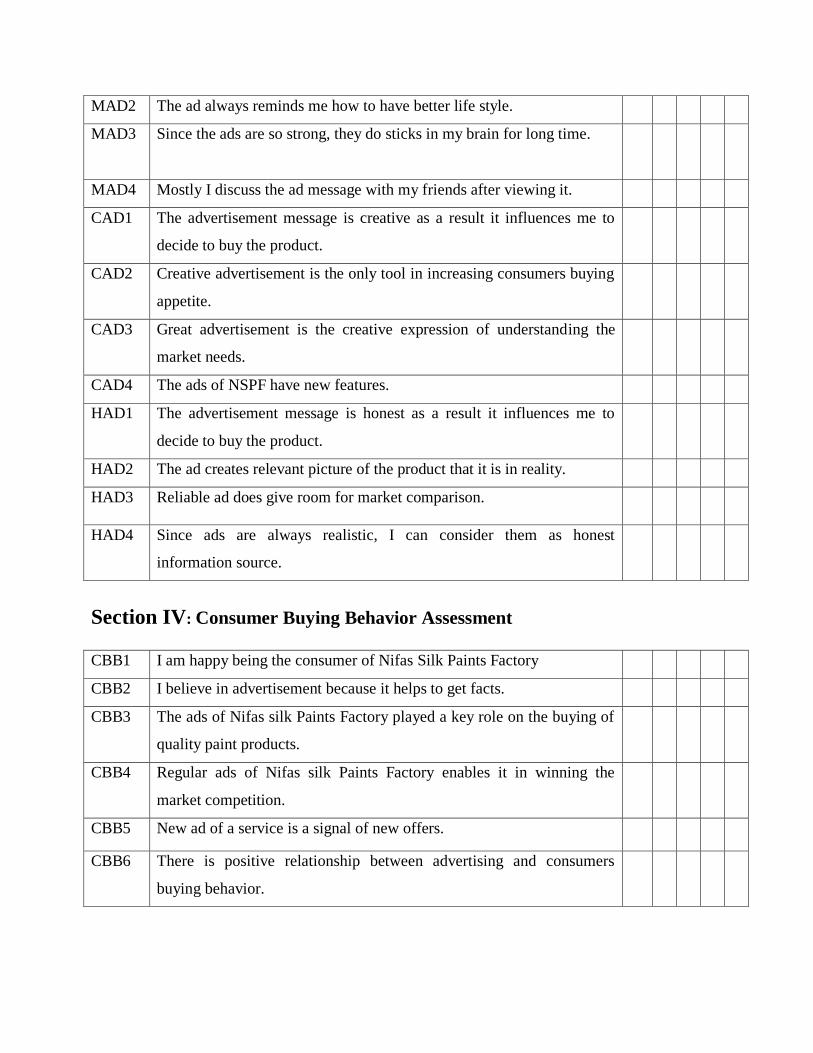
67
MAD2 The ad always reminds me how to have better life style.
MAD3
Since the ads are so strong, they do sticks in my brain for long time.
MAD4 Mostly I discuss the ad message with my friends after viewing it.
CAD1
The advertisement message is creative as a result it influences me to
decide to buy the product.
CAD2 Creative advertisement is the only tool in increasing consumers buying
appetite.
CAD3
Great advertisement is the creative expression of understanding the
market needs.
CAD4 The ads of NSPF have new features.
HAD1
The advertisement message is honest as a result it influences me to
decide to buy the product.
HAD2 The ad creates relevant picture of the product that it is in reality.
HAD3 Reliable ad does give room for market comparison.
HAD4 Since ads are always realistic, I can consider them as honest
information source.
Section IV: Consumer Buying Behavior Assessment
CBB1 I am happy being the consumer of Nifas Silk Paints Factory
CBB2 I believe in advertisement because it helps to get facts.
CBB3
The ads of Nifas silk Paints Factory played a key role on the buying of
quality paint products.
CBB4 Regular ads of Nifas silk Paints Factory enables it in winning the
market competition.
CBB5 New ad of a service is a signal of new offers.
CBB6 There is positive relationship between advertising and consumers
buying behavior.

68
APPENDIX II: RELIABILITY TESTS RESULTS
Reliability Statistics
Cronbach's Alpha N of Items
.951 30
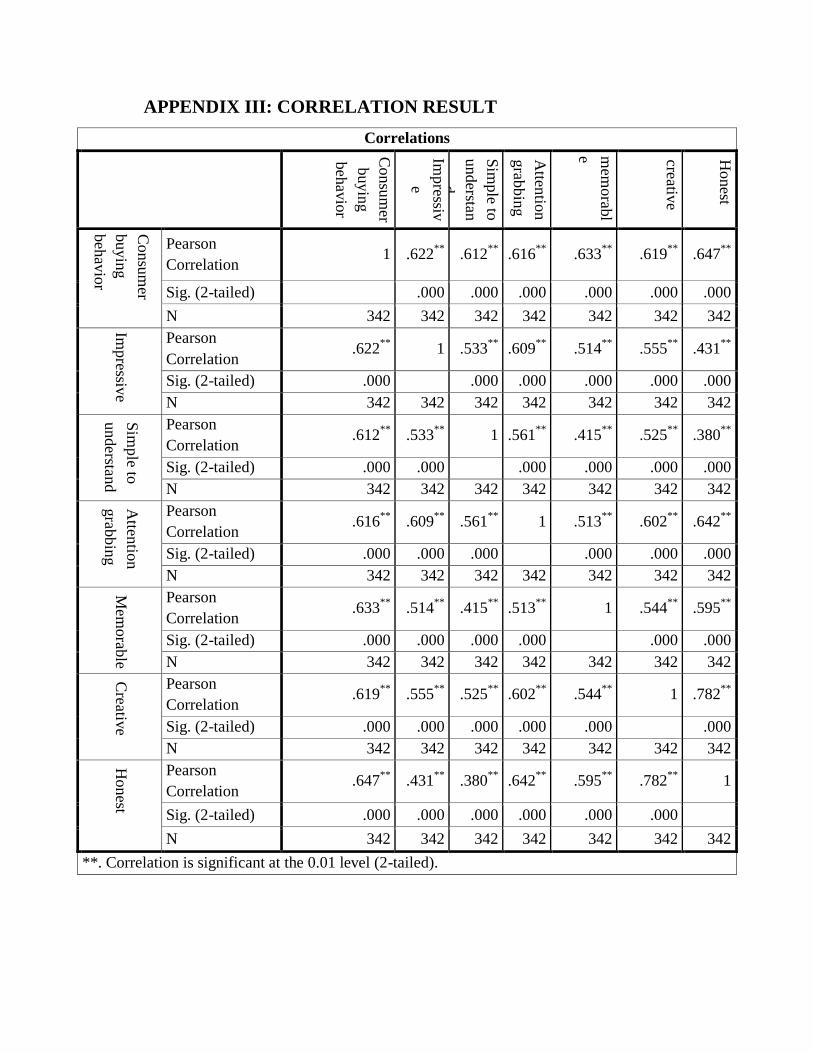
69
APPENDIX III: CORRELATION RESULT
Correlations
Consu
mer
buyin
g
beh
avio
r
Impressiv
e
Sim
ple to
understan
d
Atten
tion
grab
bin
g
mem
orab
l
e creative
Honest
Consu
mer
buyin
g
beh
avio
r
Pearson
Correlation 1 .622
** .612
** .616
** .633
** .619
** .647
**
Sig. (2-tailed) .000 .000 .000 .000 .000 .000
N 342 342 342 342 342 342 342
Impressiv
e
Pearson
Correlation .622
** 1 .533
** .609
** .514
** .555
** .431
**
Sig. (2-tailed) .000 .000 .000 .000 .000 .000
N 342 342 342 342 342 342 342
Sim
ple to
understan
d
Pearson
Correlation .612
** .533
** 1 .561
** .415
** .525
** .380
**
Sig. (2-tailed) .000 .000 .000 .000 .000 .000
N 342 342 342 342 342 342 342
Atten
tion
grab
bin
g
Pearson
Correlation .616
** .609
** .561
** 1 .513
** .602
** .642
**
Sig. (2-tailed) .000 .000 .000 .000 .000 .000
N 342 342 342 342 342 342 342
Mem
orab
le
Pearson
Correlation .633
** .514
** .415
** .513
** 1 .544
** .595
**
Sig. (2-tailed) .000 .000 .000 .000 .000 .000
N 342 342 342 342 342 342 342
Creativ
e Pearson
Correlation .619
** .555
** .525
** .602
** .544
** 1 .782
**
Sig. (2-tailed) .000 .000 .000 .000 .000 .000
N 342 342 342 342 342 342 342
Honest
Pearson
Correlation .647
** .431
** .380
** .642
** .595
** .782
** 1
Sig. (2-tailed) .000 .000 .000 .000 .000 .000
N 342 342 342 342 342 342 342
**. Correlation is significant at the 0.01 level (2-tailed).
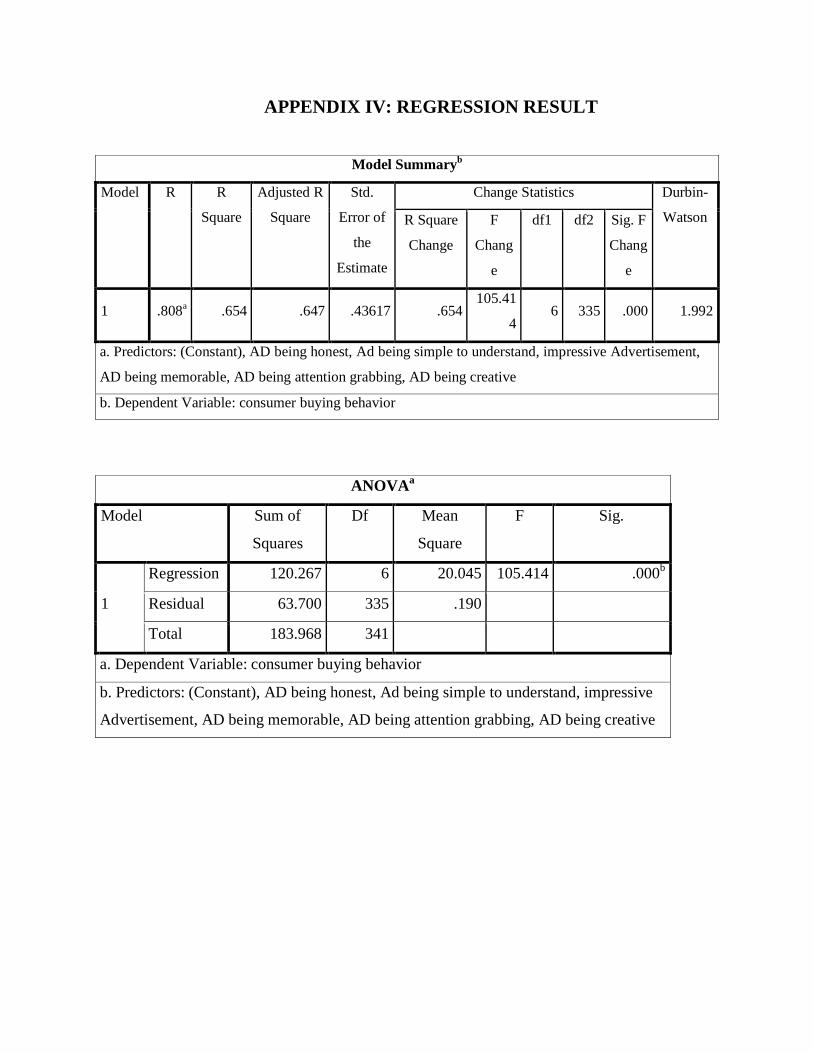
70
APPENDIX IV: REGRESSION RESULT
Model Summaryb
Model R R
Square
Adjusted R
Square
Std.
Error of
the
Estimate
Change Statistics Durbin-
Watson R Square
Change
F
Chang
e
df1 df2 Sig. F
Chang
e
1 .808a .654 .647 .43617 .654
105.41
4 6 335 .000 1.992
a. Predictors: (Constant), AD being honest, Ad being simple to understand, impressive Advertisement,
AD being memorable, AD being attention grabbing, AD being creative
b. Dependent Variable: consumer buying behavior
ANOVAa
Model Sum of
Squares
Df Mean
Square
F Sig.
1
Regression 120.267 6 20.045 105.414 .000b
Residual 63.700 335 .190
Total 183.968 341
a. Dependent Variable: consumer buying behavior
b. Predictors: (Constant), AD being honest, Ad being simple to understand, impressive
Advertisement, AD being memorable, AD being attention grabbing, AD being creative
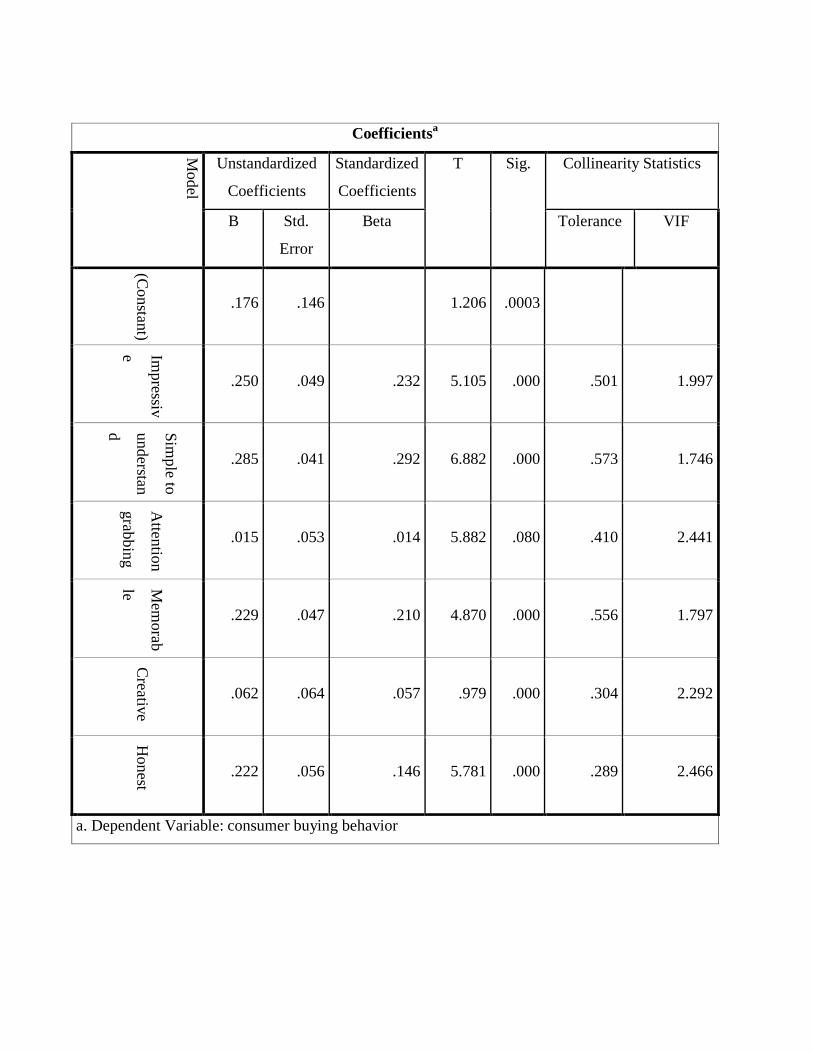
71
Coefficientsa
Model
Unstandardized
Coefficients
Standardized
Coefficients
T Sig. Collinearity Statistics
B Std.
Error
Beta Tolerance VIF
1
(Constan
t)
.176 .146
1.206 .0003
Impressiv
e
.250 .049 .232 5.105 .000 .501 1.997
Sim
ple to
understan
d
.285 .041 .292 6.882 .000 .573 1.746
Atten
tion
grab
bin
g
.015 .053 .014 5.882 .080 .410 2.441
Mem
orab
le
.229 .047 .210 4.870 .000 .556 1.797
Creativ
e
.062 .064 .057 .979 .000 .304 2.292
Honest
.222 .056 .146 5.781 .000 .289 2.466
a. Dependent Variable: consumer buying behavior

72
Related Documents