The Effect of Abortion Legalization on Fertility, Marriage, and Long-term Outcomes for Women Libertad González* Universitat Pompeu Fabra and Barcelona GSE Sergi Jiménez-Martín Universitat Pompeu Fabra, Barcelona GSE and FEDEA Natalia Nollenberger IE Business School-IE University Judit Vall Castello Universitat de Barcelona, IEB & CRES-UPF May 2018 Abstract: We evaluate the short- and long-term effects for women of access to legal, subsidized abortion, by exploiting the Spanish legalization of abortion in 1985. We find robust evidence that the legalization led to an immediate decrease in the number of births to women aged 21 and younger. This effect was driven by provinces with a higher supply of abortion services. Young women affected by the reform were also less likely to marry. We also find that the affected cohorts of women achieved higher educational attainment, and reported higher life satisfaction 15 years after the reform. Keywords: Abortion, fertility, education, labor market outcomes, satisfaction JEL codes: J12, J13, I21, C21 * Corresponding author ([email protected] ). We are grateful to seminar participants at UPF, Brunel University, UNU-MERIT at Maastricht University, XLI Simposio de la Asociación Española de Economía and at the Centre for Demographic Studies at UAB. All have provided very constructive comments and suggestions on earlier versions of this paper. We also thank the Spanish Ministry of Economy grant ECO2014-52238-R for its financial support.

Welcome message from author
This document is posted to help you gain knowledge. Please leave a comment to let me know what you think about it! Share it to your friends and learn new things together.
Transcript

The Effect of Abortion Legalization on Fertility,
Marriage, and Long-term Outcomes for Women
Libertad González* Universitat Pompeu Fabra and Barcelona GSE
Sergi Jiménez-Martín Universitat Pompeu Fabra, Barcelona GSE and FEDEA
Natalia Nollenberger IE Business School-IE University
Judit Vall Castello Universitat de Barcelona, IEB & CRES-UPF
May 2018
Abstract: We evaluate the short- and long-term effects for women of access to legal,
subsidized abortion, by exploiting the Spanish legalization of abortion in 1985. We find
robust evidence that the legalization led to an immediate decrease in the number of
births to women aged 21 and younger. This effect was driven by provinces with a
higher supply of abortion services. Young women affected by the reform were also less
likely to marry. We also find that the affected cohorts of women achieved higher
educational attainment, and reported higher life satisfaction 15 years after the reform.
Keywords: Abortion, fertility, education, labor market outcomes, satisfaction
JEL codes: J12, J13, I21, C21
* Corresponding author ([email protected]).
We are grateful to seminar participants at UPF, Brunel University, UNU-MERIT at
Maastricht University, XLI Simposio de la Asociación Española de Economía and at the
Centre for Demographic Studies at UAB. All have provided very constructive
comments and suggestions on earlier versions of this paper. We also thank the Spanish
Ministry of Economy grant ECO2014-52238-R for its financial support.

1
1. Introduction
Most countries in the world allow abortion in order to save a woman’s life. However,
only 30% of all countries permit access to abortion on request, and 35% of them require
economic or social reasons to grant access to abortion (UN World Abortion Policies
2013). Between 1996 and 2011, several countries reformed their legal regulation of
abortion, some to liberalize and others to restrict access to abortion.
Access to abortion has been subject to debate in many countries. The literature on
the impacts of abortion legalization laws has focused either on the short-term effects on
fertility, or on the short and long-term effects on children born after a given reform. In
this paper, we focus on the short- and long-term effects on women, exploiting the
liberalization of abortion in Spain in 1985. We first estimate the effects of abortion
legalization on fertility and marriage behavior in the short term, and then we study
impacts on long-term outcomes, including completed fertility, educational attainment,
and labor market outcomes of the cohorts of women exposed to the reform.
A number of previous papers have used US restrictions to abortion access at the
state level as a natural experiment to analyze the short-term effects of abortion
legalization on fertility behavior. These papers typically use changes across US states
on Medicaid abortion funding restrictions (Levine et al. 1996, Klerman 1999), on
parental consent laws (Haas-Wilson 1996), or on the geographical distance to abortion
providers, either alone (Joyce et al. 2013, Cunningham et al 2017) or combined the
other two changes (Kane and Staiger 1996). Most of those papers conclude that access
to abortion reduces fertility. The effects are generally concentrated among teens and
poorer women (Bailey and Lindo 2017).
Of particular interest for our identification strategy are Joyce et al. (2013) and
Cunningham et al (2017). Joyce et al. (2013) use the two supply shocks following early

2
legalization of abortion in New York and then national legalization to identify the effect
of distance to a legal abortion provider on both abortion and birth rates. They find that
abortion rates fell by 12 percent for every hundred miles a woman lived from the state.
They also find a positive and robust association between distance to the nearest abortion
provider and teen birth rates. Cunningham et al (2017) evaluate the effect of abortion-
clinic closures on abortion using a recent Texas reform. They find a substantial, non-
linear, effect of distance on abortion rates. However, the final effect on birth rates is
unclear.
Similar reductions in fertility rates are found for a policy change in Romania in
1989, which lifted a ban that restricted access to abortions (Pop-Eleches 2010). A recent
paper by Clarke and Mühlrad (2016) estimates the impact of a free abortion program
introduced in Mexico City in 2007 on fertility and maternal mortality. They report that
access to legal and safe abortion resulted in decreased fertility as well as lower rates of
maternal mortality. Antón et al. (2016) exploit a unique administrative register of births
in Uruguay that distinguish between planned and unplanned pregnancies to estimate the
effect of an abortion reform on the quantity and quality of births in the short run. They
find an 8% decline in the number of births from unplanned pregnancies, and an increase
in the average quality of births in terms of more intensive prenatal care and a lower
fraction of single mothers.
A second strand of the literature has used major changes in abortion legislation
laws to analyze the impact of abortion on the characteristics of the cohort of affected
children, such as education, employment, poverty or crime rates. Ananat et al. (2009),
Gruber at al. (1999) and Donohue and Levitt (2001) use the Roe vs. Wade case that
legalized abortion in the United States in 1973, while Pop-Eleches (2006) uses an
abortion ban introduced in Romania in 1966. For the US, the evidence suggests

3
important selection effects: children born after the reform are less likely to be part of a
household receiving welfare, a single-parent household, or a poor household (Ananat et
al. 2009, Gruber et al. 1999). Donahue and Levitt (2001) also find that crime rates
significantly decrease for the cohorts of affected children.
Currie et al. (1996) exploit the introduction of restrictions on Medicaid funding
for abortion and the differential implementation of this restriction across US states on
infant health outcomes. They find only weak support for the hypothesis that funding
restrictions reduce average birth weight, and are unable to detect any effect on the
probability of low birth weight. They also find some evidence that abortion restrictions
may be endogenous, so that the estimated effects may reflect omitted characteristics of
the states.
Pop-Eleches (2006) shows that the introduction of an abortion ban in Romania led
to an increase in the educational and labor market achievements of children born just
after the policy change. This result can be explained by an increase in the proportion of
urban, more educated women having children (who were more likely to have abortions
before the introduction of the reform). He also reports that, conditional on family
background, children born after the abortion ban performed worse in terms of
schooling.
David (2006) compares mothers whose request for termination of an unwanted
pregnancy was denied twice, with others who did not request an abortion (matched
control group) in Czechoslovakia. He follows the children of unwanted and wanted
pregnancies at later ages in life, and compares the psychosocial and mental wellbeing of
the two groups of individuals. He finds that the group of unwanted children were more
likely to become psychiatric patients.

4
Thus, the literature on the effects of abortion laws consistently reports sizeable
reductions in fertility rates (mainly in the short-term) for the affected women, as well as
important composition effects for the cohorts of children born after the reforms (as
compared to the cohorts born before). However, little is known about the long-term
impacts for women who were exposed to stricter vs. more lenient abortion laws.
Women facing different abortion policies may see their long-run family, educational,
and employment prospects affected.
An extensive literature for the US has evaluated the effects of the introduction of
the contraceptive pill, showing that having more control over fertility decisions allowed
women to delay marriage and first birth, and increased women's human capital
accumulation, labor force participation, wages, and occupational diversity (see for
example Goldin and Katz, 2002; Bailey, 2006, 2010 and 2012). Myers (2017) suggests
that these effects may be explained by the liberalization of abortion rather than the
introduction of the pill.
In Spain, abortion was legalized in 1985 (under specific circumstances). In order
to identify the effects of interest, we exploit the fact that the actual provision of abortion
services (in public and private health centers) was staggered over time across Spanish
geography, so that during the initial years after the reform, some women would have
had easier access to abortion services, depending on their municipality of residence.
Our identification strategy thus relies on comparing cohorts of women who were
different ages at the time of the reform, living in areas where abortion clinics started
operating at different points in time. Younger women living in an area with a nearby
abortion clinic that started operating shortly after the reform are considered more
“exposed” to the legalization of abortion, as compared to women who were older (and

5
thus were only affected during part of their fertile life) and/or living very far from an
abortion clinic in the years after the reform.1
The timing of the actual provision of abortions services at the local level may
have been driven in part by underlying demand factors. We deal with this concern in
two ways. First, we test for parallel trends in fertility before the introduction of the
reform. Second, we control explicitly for demand factors, such as religiosity, interacted
with the reform, so that we are left with variation driven by idiosyncratic variation in
the supply of abortion services at the local level.
We first use Spanish birth-certificate data to study short-term reproductive
outcomes. We find robust evidence that the reform led to an immediate drop in the
number of births, especially to younger women. We find that the effects are larger in
areas in which an abortion clinic was available and/or the distance to a clinic was
smaller (as in Cunningham et al, 2017). We then follow the same empirical strategy and
use marriage registry data to evaluate whether the legalization had an immediate effect
on marriages. Our results show that the number of marriages also dropped for young
women in areas with a stronger supply of abortion clinics.
Since women who were very young when abortion was legalized were able to
postpone fertility, we then evaluate whether this translated into completed fertility,
educational attainment, and labor market outcomes 20 years later. Using data from birth
registries as well as Census data, we find that the affected cohorts have lower completed
(accumulated) fertility at younger ages, that disappears as they get older. Furthermore,
using data from the Spanish Labor Force Survey and the European Community
1 Our results are unlikely to be affected by the liberalization of the pill in Spain (in
1978). First, there is anecdotal evidence that the use of the pill was quite extended since
1965, when gynecologists were authorized to prescribe it for “menstrual irregularities”.
Thus, all the cohorts of women included in our analysis would have been exposed to the
pill when they were young. In addition, the correlation between the use of the pill and
the supply of clinics across Spanish regions was low.

6
Household Panel, we find evidence that the affected cohorts achieved higher
educational attainment and had higher levels of life satisfaction 20 years after the legal
reform. We do not find long-term effects on employment rates.
The paper is organized as follows. In the next section we briefly describe the 1985
legalization of abortion in Spain. In section 3 we evaluate the short-term effects on
fertility and marriage. Section 4 presents the results on long-term outcomes, and section
5 concludes.
2. The legalization of abortion in Spain
Abortion was banned in Spain until 1985. In October 1982, the Socialist Party won the
national election with a large majority, and in January 1983 the Health Minister
announced that abortion would be legalized. A draft of the law was approved in the
national Parliament in October. However, in December 1983 the law was challenged by
a number of conservative legislators, and sent to court with the argument that it was
unconstitutional. In April 1985, the High Court upheld the charges. However, the
government announced that they would make some minor changes to the writing of the
law in order to make it constitutional. In late May 1985, the new draft was approved in
parliament. The law was finally passed in July, and became effective in August 1985.
The organic law 9/1985 amended the Spanish Criminal Code, and since then
abortions are allowed under certain circumstances. Specifically, since August 1985
abortions were allowed when: 1) there is serious risk to the physical or mental health of
the pregnant woman, 2) the woman became pregnant as a result of rape, provided that
the abortion is performed within the first 12 weeks of gestation and the rape has been
reported; or 3) there is risk of malformations or defects, physical or mental, in the fetus,
provided that the interruption is done within the first 22 weeks of gestation. In the first
and third cases, a medical report was required to certify compliance with the conditions

7
laid down by law. In the three cases, abortion was not punishable if undertaken by a
doctor, or under their supervision, in a medical establishment approved for abortions,
whether public or private, with the express consent of the woman.
In practice, about 98% of all abortions reported between 1986 and 2010 were filed
under “risk to the health of the mother”. Many of those cases argued risks to the
mother’s mental health, as confirmed by a psychologist, and this was easy to argue for
unwanted pregnancies.
Figure 1 shows the annual number of registered abortions, as reported by the
Spanish Ministry of Health. By 1992, one out of every 10 pregnancies was terminated
legally (45,000 annual registered abortions, for under 400,000 live births). By 2010, it
was 1 out of every 5 pregnancies. In 2010, a new law was passed which decriminalized
the practice of abortion during the first 14 weeks of the pregnancy, without the need for
any special circumstance to concur.
3. Short-term effects of access to abortion
3.1. Fertility and marriage effects
Empirical strategy
We first study the effects of abortion legalization on the reproductive outcomes of
women. The abortion law was implemented in August 1985. Abortions taking place in
and after August 1985 would have led to fewer births a few months later.2 To make sure
2 The abortion data (which start in 1992) show that, in every year since 1992, more than
95% of all registered abortions take place before week 17 of the pregnancy. The birth-
certificate data for 1986 show that about 95% of all births take place after week 35 of
the pregnancy. The first registered legal abortions took place on August 9, 1985. An
abortion that took place on August 9, 1985 at weeks 7-16 of pregnancy would have led
to a birth on weeks 36-42 of the pregnancy, i.e. the birth would have taken place
between late December, 1985, and early April, 1986. Thus, our first “post” month in the
birth data is December 1985. Of course, the most common scenario for an August 9,
1985 abortion would be: the abortion taking place on weeks 7-8, which would have led
to a birth on weeks 39-40, i.e. in March of 1986.

8
that we are able to capture all abortions occurring after the law (even those at unusually
late stages of the pregnancy), we analyze the time series of births over time, and we
look for a break around December 1985, controlling for seasonality.
To this end, we use micro-data on all births taking place monthly in Spain,
provided by the Spanish National Statistical Institute, and estimate the following
equation:
(1)
where Births is the number of births (or the natural log) in month t, and Post is a binary
indicator taking the value one in all months starting in December 1985, and zero
otherwise. Month is the month of birth. It is normalized to 0 for December 1985 and
thus takes values -1 for November 1985, 1 for January 1986, etc. We also include a
quadratic trend in month, and a set of calendar month dummies (m).
In our main specification, we include 36 months pre- and post- the
implementation of the 1985 abortion law, so that our sample contains 72 months,
starting in December 1982 and ending in December 1988. We also use alternative
windows, including either 24 or 30 months pre- and post-reform.
Any drop in (early) fertility may have led to a reduction in the number of (early)
marriages. We test this hypothesis using marriage-certificate data, and compare the total
number of marriages before and after the reform. We estimate equation (1) using the
monthly number of marriages as a dependent variable. Note that in this case, the post-
reform period starts immediately after the law was implemented, in August 1985.
We first estimate the overall impact of the reform in the time series, and then we
exploit the regional variation in the intensity of exposure to the reform. The impact of
abortion legalization was unequal across the Spanish territory, mainly due to the
different availability of abortion clinics. By 1988, all clinics that practiced at least one

9
(legal) abortion in a year had to report it to the Ministry of Health, who, in turn,
publishes the list of clinics annually. Using these annual reports, we construct a panel of
abortion clinics across municipalities and over time, which allows us to construct an
indicator of the number of clinics per 100,000 inhabitants for each of the 52 provinces
in Spain over time.
Figure 2 shows the regional variation in the supply of abortion clinics across
Spanish provinces in 1989.3 There are large geographical differences: in 10 provinces,
there were 0.3-0.6 clinics per 100,000 inhabitants, while 24 out of 50 provinces had no
clinics reporting abortions in 1989.
We also use three alternative measures of access to abortion services: an indicator
of the province having at least one clinic practicing abortions in 1989, the absolute
number of clinics, and the distance to the nearest province with at least one clinic.
We then estimate a specification that interacts our post-reform variable with our
measures of the supply of abortion services:
(2)
where Y is either births or marriages, Supply is our measure of access to abortion
services, and denote province and year fixed-effects, and is a time varying error
term.
Short-term fertility effects
First, we evaluate the short-term impact of the liberalization of abortion on fertility at
the national level. Figure 3 shows the evolution of the total annual number of first births
in Spain for three age groups (younger than 18, between 18 and 25, and older than 25),
between 1982 and 1988. While the number of births has a decreasing trend over this
3 The Ministry of Health started to collect this information in 1988. However, the
information for that year is incomplete (for example, there is no information for the
whole region of Catalonia). Therefore, we use the first year of complete information,
1989.

10
period (especially for the two younger groups), we observe a large drop in the number
of first births immediately after the reform among women younger than 18, suggesting
that the reform mainly affected teen fertility. A similar pattern is observed for all births
(Figure 4).
We estimate equation (1) using birth-certificate data at the monthly level. We use
three alternative proxies of fertility: the number of births, the number of births in logs,
and the rate of births per 1,000 women. Table 1 displays the coefficient ß1, which
captures the effect of the 1985 change in the abortion law on these alternative measures
of fertility. We find (first row) that the legalization of abortion led to an immediate
decrease in the monthly number of births, of about 2 log-points, or 0.07 monthly births
per 1,000 women.4
We then split births by quartiles of age of the mother (second panel of Table 1),
and find a significant reduction in the number of births for all ages, except for 27- to 30-
year-old women. Births decreased by almost 3 log-points for mothers aged 23 or
younger, while the reduction was 3.4 log-points for mothers in the age bracket 24-26,
and 2.5 log-points for women 31 and older.
Appendix Table A1 shows that the results in Table 1 are robust to alternative
windows (such as 24 or 30 months around the reform), especially the drop in births
among the younger women. Appendix Table A2 shows the results for each single age
separately. The impact of the policy is larger and more significant for women younger
than 21, as can be seen graphically in Figure 5. Thus, we conclude that the legalization
of abortion reduced fertility, especially among women who were under age 21 at the
time of the reform (that is, those who were born after 1964).
4 Before the legalization, the average number of births per month was 39,400, while the
monthly birth rate per 1,000 women was 4.9.

11
We next introduce regional heterogeneity. Figure 6 shows an index (1985:100) of
the annual number of births, splitting the population into two groups: provinces without
abortion clinics in 1989, and provinces with at least one clinic that practiced abortions
in 1989. Panel A displays the results for all ages. While fertility shows the same
decreasing trend in both groups of provinces before the reform, the decrease is more
pronounced in provinces with a higher supply of abortion services after the reform. This
pattern is also observed when we look at women younger than 21 (Panel B).
We then estimate equation (2) at the province-month level, interacting the post
dummy with an indicator for the potential supply of abortion services. In our main
specification, we use the number of clinics per 100,000 inhabitants in the province.
Results are displayed in Table 2. The odd columns show the results when including
province fixed-effects and the post-reform indicator. We again capture a significant
decrease in the number of births at the province level after the reform. The even
columns show the results when adding the interaction between the post dummy and the
number of clinics per 100,000 inhabitants in the province. Regions with a higher supply
of abortion clinics experienced a more pronounced drop in short-term fertility. When we
split the births by age of the mother (second panel of Table 2), we find that the results
are mainly driven by younger mothers.
In Table 3 we present some evidence on fertility effects by socio-economic status.
Spanish birth records do not provide information on the education level of the mother in
the 1980’s, but we do have information on their occupation. We classify occupations
into high- and low-skilled. High-skilled occupations include professionals and
technicians; managers and directors; and administrative or similar jobs. Given that a
high proportion of women were not participating in the labor market, we combine
information on both the mother and the father, and divide the sample into three groups:

12
both parents in high-skilled occupations; only one in high-skilled occupations, and both
in low-skilled occupations. The results suggest that the legalization of abortion affected
the (short-term) fertility of the most disadvantaged group of women.
Appendix Table A3 shows that our main results remain when we use alternative
measures of treatment intensity. In Panel A we divide the sample into two groups
according to whether there was at least one clinic that practiced abortions in the
province in 1989. Regions with at least one clinic experienced a drop in the monthly
number of births of 2 log-points, while there is no significant effect on short-term
fertility in provinces without clinics. In Panel B, we interact the post-reform indicator
variable with the distance to the nearest province with at least one clinic that practiced
abortions in 1989. We find that the larger the distance, the lower the drop in fertility.
Finally, in Panel C we use the absolute number of clinics, and find again that the drop is
higher in provinces with a larger number of clinics practicing abortions, although the
estimates are less precise. Our preferred specification is the one interacting the post
reform variable with the number of clinics per 100,000 inhabitants, as it exploits more
variation across provinces while taking into account the size of each province.
In sum, we find that the drop in the number of births as a result of the abortion
reform was stronger in provinces with a higher treatment intensity (as measured by the
density of abortion clinics), as well as for young women and those in low-skilled
occupation families.
We interpret the number of abortion clinics per 100,000 inhabitants as a measure
of the supply of abortion services. However, the supply of clinics could be driven by
demand factors, such that higher underlying demand for abortion services could be
driving clinic availability, and thus the supply of clinics would be endogenous. In order
to test for this possibility, we gathered information on some of the most relevant

13
demand factors. In order to take into account cultural and religious factors (since the
Catholic church bans abortion), we collected information on religiosity by region from
the 1985 Fertility Survey.5 As a direct measure of underlying demand, we calculate the
fraction of teenage births before abortion legalization in each province.
Appendix figures A1-A3 show the regional distribution of the percentage of births
to women aged 18 or younger in 1984, the percentage of births to unmarried women
aged 21 or younger in 1984, and the percentage of adults who declare being practicing
Catholics in 1984, by province. Visually, there is not much apparent overlap across
these different indicators. We then re-run our fertility specifications (as in equation (2)),
additionally controlling for the birth rates to young women in 1984 (and its interaction
with the post indicator) and the percentage of practicing Catholics in 1985 (and its
interaction with the post indicator). Table A4 shows that our baseline results remain
strongly statistically significant even after controlling for these demand-driven
(potentially competing) explanatory factors.6 We thus conclude that our results are
driven by the supply of abortion services.
Short-term marriage effects
The drop in early fertility may have led to a reduction in the number of early marriages.
We use marriage-certificate data, and compare the total number of marriages before and
5 The 1985 Fertility Survey (FS) is carried out by the Spanish National Statistical
Institute to women 15 to 49. The sample included 8,782 observations. The survey asked
women about their place of residence and their religiosity. Regarding the second, the
answers are grouped into: non-believer, non-practicing Catholic, practicing Catholic,
another religion, and do not know/do not answer. We calculate the fraction of women
who were practicing Catholic by province in 1985. Answers are missing for 7 provinces
(Avila, Guadalajara, Huelva, Lleida, Segovia, Soria and Teruel) due to lack of enough
sample size. To estimate the religiosity of these missing provinces, we follow the
multiple imputation methodology suggested by Rubin (1987), and regress the fraction
of practicing Catholic at the province-level on other indicators (fraction of left-wing
voters in 1980, birth rates of young women in 1984).
6 Our baseline results remain also statistically significant when controlling for the
province-level proportion of women who reported that they have taken and/or were
currently taking the pill (1985 Fertility Survey).

14
after the reform. Figure 7 shows an index (1985=100) for the annual number of
marriages of women between 17 and 22 by age, 5 years before and after the reform.
Similar to the decreasing trend in fertility, the annual number of marriages was
decreasing over time, but visual inspection does not suggest any change in this trend
after the abortion legalization. If anything, there may have been a decrease in the
number of marriages among 17-year-olds.
We then estimate equation (1) over the number of marriages (or the natural log, or
the number of marriages per 1,000 women) in month t. The results are displayed in
Table 4. Essentially all of the coefficients are positive and statistically insignificant. We
find no evidence of a significant decline in the number of marriages following abortion
legalization. Table A5 shows the results separately by age of the mother. We find a
decline in marriages among women aged 20 and younger, but none of the coefficients
are statistically significant.
In Table 5 we present the results of estimating equation (2) for marriages, i.e.
exploiting the regional heterogeneity in the supply of abortion services. We find
evidence of a significant drop in the number of marriages among women aged 21 and
younger, in provinces with a larger supply of abortion services. This is consistent with
the strong drop in fertility among younger women.
Thus, we find that the legalization of abortion led to a fall in fertility among
women of all ages in provinces with more clinics providing abortion services, while we
find a significant drop in marriages only among younger women.
3.2. Labor market and education effects
If women who were very young when abortion was legalized were able to postpone
fertility and/or avoid teen births, this could have had short-term effects on women’s
schooling and/or labor supply decisions.

15
In order to investigate this question, we focus on women born between 1958 and
1971 (inclusive), who were between 14 and 27 at the time of the reform. Following the
results of the previous sections, that show a stronger reduction in fertility for women
aged 21 or younger at the time of the reform (see Appendix Table A2), we define as
“treated” women who were born in 1965 or later, so that they were 21 or younger at the
time of the reform, and we look at their education and employment outcomes right after
the implementation of the reform (years 1986-1990).
We estimate the following specification:
, (3)
where C is the pivotal cohort of 1965, and we include a linear pre-reform and post-
reform trend. The variable Treated takes value 1 for all treated cohorts (1965 to 1971),
and this variable is interacted with the supply of abortion services (abortion clinics per
100,000 inhabitants). We also include province and year fixed effects. Education and
labor market outcomes are measured in 1986-90, i.e. during the 5 years immediately
following abortion legalization.
We thus explore the short-term effects of the abortion legalization on education
and labor market outcomes for the most affected women. As outcome variables, we use
three dummy variables indicating being in the labor force, working, and being in full-
time education.
We use data from the Spanish Labor Force Survey (EPA) for the years 1986-
1990. The EPA is a rotating quarterly survey carried out by the Spanish National
Statistical Institute. Sample size is about 64,000 households per quarter, including
approximately 150,000 adult individuals. The EPA provides fairly detailed information
on labor force status, education, and family background variables. The reference period

16
for most questions is the week before the interview. We use the second interview of
each year in order to minimize the probability of having repeated observations of the
same individual.
The relevant women are aged between 28-32 (the oldest cohort, 1958) and 16-19 (the
youngest cohort, 1971) at the time of the interview. The cohort of 1971 is not available
in the 1986 survey, as they are only 15 and the survey is administered to people 16 and
older. Note that age at the time of the interview is indirectly controlled for, since it
equals the year of the survey minus the year of birth, which are both included in the
regression.
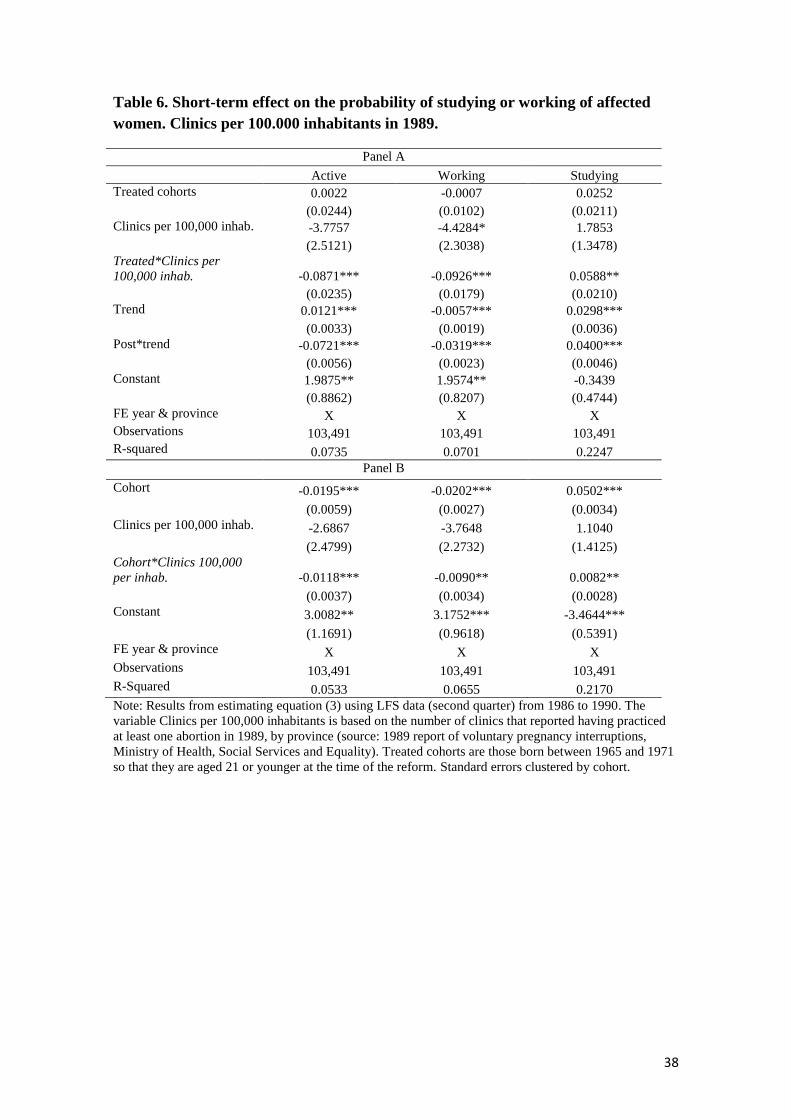
Table 6 reports the results of these regressions (Panel A). Women who were
younger (aged 21 or less) when abortion was legalized in regions with more supply of
abortion services were more likely to be in full-time education, and less likely to be
working, compared to the control group. Panel B includes cohort as a continuous
variable instead of the “Treated” dummy, and the results are confirmed. Access to
abortion seems to have allowed young women to stay in full-time education longer.
4. Long-term effects
4.1. Completed fertility
In this section, we evaluate whether the short-term fertility effects persisted, leading to
the affected women having fewer children throughout their lifetime. That is, we study
whether the cohorts of young women who were able to avoid unwanted births early in
life after the abortion liberalization simply postponed those births to later in life, versus
their completed fertility falling. To do this, we estimate equation (3) over the
accumulated number of children born per woman, for cohorts of women by province, at
different ages (18, 21, 34, and 44).

17
To calculate the accumulated number of children born per woman by cohort, we
pool the total number of births (from birth certificates) from 1975 to 2015, and calculate
the cumulative number of births by cohort and province. We focus on the cohorts born
between 1958 and 1971. Women who were born in 1965-71 were between 14 and 20
years old in 1985, and between 44 and 50 in 2015. Women who were born in 1958-64
were 17 or younger in 1975, between 21 and 27 years old in 1985, and between 51 and
57 in 2015. The cumulative number of births by cohort and province is then divided by
the size of the cohort, to get the average number of children born per woman in a cohort
and province, at the different ages.
Ideally, we would like to have information about the size of each cohort by
province of residence and year. Unfortunately, this information is not available, so we
approximate the size of each cohort of women by province by looking at the number of
women living in each province in 1981, by age. This information comes from the (pre-
reform) 1981 Population and Housing Census. One limitation of this approach is that
the 1981 Census does not provide information about the year of birth of each woman,
only their age. So to calculate the size of each cohort we assign each woman to a cohort
according to their age at the time were the Census was carried out. Another and more
important limitation is that we are not considering migration across provinces after
1981.7 To evaluate to what extent this fact is biasing our results we carried out the same
analysis approximating the size of each cohort by province with the (post-reform) 1991
Population and Housing Census.
Table 7 reports the results when we use the 1981 Census to approximate the size
of each cohort. Columns 1 to 4 show the results from estimating equation (3) for the
7 According to the 2011 Population and Housing Census, between 21 and 27 percent of
women born between 1958 and 1971 were living in a province different from where
they were born. These figures are similar 10 years before, suggesting that they tended to
migrate at earlier ages.

18
average number of children born per woman, by cohort and province, by ages 18, 21,
34, and 44, respectively. The specification in Panel A groups the cohorts more affected
by the abortion legalization (those born between 1965-1971), and compares the average
number of births for women in these cohorts with the closer but less affected cohort
group (women born between 1958 and 1964). We compare the fertility behavior of
these two cohort groups of women in different provinces according to the number of
clinics that practiced abortions in 1989 (per 100,000 inhabitants). Consistent with our
previous results, we find that the most affected cohorts tend to have fewer children at
earlier ages, and that the effect is larger the greater the supply of abortion services in
each province.
Specifically, our findings suggest that even after controlling for a linear trend,
women born between 1965 and 1971 tend to have 0.005 fewer births on average by age
18, compared with women born between 1964 and 1958 (a drop of 8 percent). The
difference increases to 0.046 when we interact the cohort indicator variable with our
indicator of supply of abortions, meaning that an increase in one standard deviation
(0.15) in the number of clinics per 100,000 inhabitants leads to a drop of 11 percent in
the average number of births by age 18.8 Note that even when the estimated coefficient
of the interaction between the cohort indicator variable and the supply of abortions
increases as the age of the mother increases, given that the accumulated number of
births per women at older ages is greater, the relative drop in fertility decreases. By age
21, an increase of one standard deviation in the number of clinics per 100,000
inhabitants leads to a drop of 7 percent in the number of births among the most affected
8 This was calculated as the estimated coefficient (0.046) times one standard deviation
in the number of clinics per 100,000 inhabitants (0.15) divided by the average number
of births at 18 years old to the less affected cohort (0.063).

19
cohorts. The same figure decreases to 2 percent by age 34, and becomes only 1 percent
and not statistically significant by age 44.9
In Panel B we split the affected cohort in three groups (1969-71, 1967-68 and
1966-65). First, comparing across cohorts shows that the younger the women (at the
time of the reform), the greater the drop in fertility. We find no effect on completed
fertility (by age 44) for the oldest affected cohorts, with the coefficient on the
interaction very close to zero. We do find a significant drop (at 90%) in the completed
fertility for the cohort born between 1967 and 1968 (who were about 18-19 years old in
1985).
In Panel C we estimate an alternative specification, which controls for the
woman’s year of birth (variable Cohort) continuously, as well as its interaction with the
number of clinics per 100,000 inhabitants. Again, we find a significant effect of the
legalization of abortion on fertility by age 34, but the coefficient turns insignificant at
44, suggesting a small effect on completed fertility.
Finally, we find very similar results when using the 1991 Census instead of the
1981 Census to estimate the size of each cohort by province: a drop in early fertility, but
no significant effects on completed fertility measured at 44 years old. In summary, our
findings suggest that the effect of the abortion legalization on early fertility did not
translate into a significant decline in completed fertility.
4.2. Labor market outcomes
The positive short-term effects of the abortion reform, in terms of increasing full-time
education for affected young women, may or may not be persistent over time. If the
increase in educational involvement of affected women is maintained, there could be
9 The accumulated average number of births per women at 21, 34 and 44 years old to the less affected
cohort (64-58) is 0.25, 1.4 and 1.6 respectively.

20
beneficial labor market effects in the long-term. We investigate this hypothesis using
data from the Spanish Labor Force Survey for years 2000 to 2007 (i.e. between 15 and
22 years after the reform). As before, we use the second interview of each year, and
select women born between 1958 and 1971 (inclusive), so that they were 14-27 at the
time of the reform. These cohorts of women are between 42-49 (the oldest cohort) and
29-36 (the youngest one) at the time of the interviews. Again, we define as treated
women who were born in 1965 or later, so that they were 21 or younger at the time of
the reform, and we look at their outcomes at the ages of 35-42. We deliberately exclude
the years of the great recession from the sample (2008 onwards). We use the same
specification than in the previous section, but focus now on the long-term effects of the
reform on educational achievement, labor market outcomes and marriage.
We focus on the highest educational degree obtained, and create four dummy
variables for: high school dropouts (not having completed high school), high school
graduates, vocational education degree, and college degree.
Table 8 shows the main results. The coefficients on the interaction of interest in
Panel A suggest that treated women from regions with more abortion clinics in 1989
were significantly less likely to drop out from high school, and thus more likely to have
a high school or a vocational degree. Thus, the evidence suggests that legalizing
abortion had long-term effects on educational attainment for young women.
In terms of labor market outcomes (Panel B), we use indicators for being in the
labor force (active), and employed. We also look at the probability of being married and
divorced. We find that affected women in regions with more abortion clinics were not
significantly more likely to participate in the labor market or work, although the

21
coefficient has the expected sign.10
Similarly, the coefficient for marriage is negative
but insignificant, and the effect on divorce is negative and significant.
We conclude that the legalization of abortion increased the educational attainment
of women with better access to abortion services, although this improvement in
educational levels did not translate into better labor market outcomes in the long-run, at
least in terms of employment.
4.3 Life satisfaction
The last question we address is whether our previous findings, namely, the fact that
after abortion liberalization more women were able to avoid unwanted births at an early
age, and increased their educational attainment, translated into higher levels of well-
being among the affected cohorts. To test this, we use the Spanish sample of the 2000
European Community Household Panel, which included some questions about
subjective well-being.
Specifically, the survey asks about the degree of satisfaction with regards to work,
economic situation, housing conditions, and time devoted to leisure. Answers range
from 1 to 6, where 1 means “very dissatisfied” and 6 “fully satisfied”. We estimate
equation (3) using as a dependent variable the degree of satisfaction in each dimension
as well as a synthetic index, which is the first component of a Principal Component
Analysis based on the degree of satisfaction in the four dimensions. In 2000 the
youngest cohort in our sample (women born in 1971) is 29 years old, while the oldest
(1958 cohort) is 42 years old, meaning that we are evaluating their degree of satisfaction
in their 30’s. One important limitation of these data is that regional information is only
10
We ran the same model with different years included in the sample; in particular, we
have used years 2009-2017, and also 2014-2017. With both datasets the results are the
same as the ones reported here: we find significant increases in high school graduation
and vocational education, but no impacts on labour market outcomes. We conclude that
these results are stable and robust to the inclusion/exclusion of specific calendar years.

22
available at a more aggregated level, so we can exploit the variation across only 17
regions. We restrict our sample to native women who live in the same region where
they were born, or who migrated to that region before 1985. The sample size is almost
3,940 observations.
Table 9 displays the results. We find that the cohorts of women more affected by the
abortion liberalization seem to be more satisfied with their housing conditions and with
the time devoted to leisure. However, we find no significant effect on long-run
satisfaction with work and economic conditions. Our synthetic index (column 5) also
suggests that women affected by the reform enjoy greater subjective well-being.
5. Conclusions
We started by documenting that the reform that legalized abortion in Spain in 1985 led
to an immediate drop in the number of births, especially to very young women. Women
who were under 21 at the time of the legalization of abortion were less likely to have a
child while very young, compared with women born in earlier cohorts.
We then evaluate whether the legalization of abortion had an immediate effect on
marriages. We compare the monthly records of marriages before and after the policy
change, and report a decrease in the number of marriages for the same age group of
women after the reform, although the effect is not statistically significant.
We then explore the heterogeneity in the impact of the reform across Spanish
regions. We expect that the impact should be stronger in regions with a higher supply of
abortion services at the time of the reform. We find that the drop in the number of births
and marriages was significantly stronger for young women in regions with a higher
supply of abortion clinics in the early years after the reform. We use these regional
differences to explore the long-term effects of the abortion legalization.

23
Taking into account that women who were very young when abortion was
legalized were able to postpone fertility, and the regional differences on the impact of
the reform, we then evaluate whether these initial effects translated into lower
completed fertility, higher educational attainment, better labor market outcomes, and
higher life satisfaction in the long-term. To this end, we use data from birth registries,
the Spanish Labour Force Survey, and the European Community Household Panel.
We find that the fertility decline at younger ages disappears as the affected cohorts
get older, so that the abortion law seems not to have had a significant effect on
completed fertility. As regards educational and labor outcomes, we find evidence that
affected cohorts were more likely to graduate from high school or obtain a vocational
degree. We find no effect on employment rates in the long-term. And finally, more
affected women report higher life satisfaction.
Overall, our results suggest that legalizing abortion in Spain allowed young
women to delay fertility and marriage and remain in full-time education, resulting in
higher life satisfaction 15 years down the line.

24
References
Ananat, E.O., Gruber, J., Levine, P.B., Staiger, D. 2009. “Abortion and Selection”. The
Review of Economics and Statistics, 91 (1): 124.136.
Antón, JI; Ferrer, Z; Triunfo, P. 2016. "The impact of Abortion Legalisation on Birth
Outcomes in Uruguay". Forthcoming in Health Economics.
Bailey, M. J. and Lindo, J.M. 2017. "Access and Use of Contraception and Its Effects
on Women's Outcomes" in the U.S. in L. Argys, S. Averett, S. Hoffman (eds.),
Forthcoming, Oxford Handbook of Women and the Economy.
Bailey, M. J. (2010). "Momma's Got the Pill": How Anthony Comstock and Griswold v.
Connecticut Shaped US Childbearing”. American Economic Review, 100(1):98-129.
Bailey, M. J. (2006). “More power to the pill: the impact of contraceptive freedom on
women's life cycle labor supply”. The Quarterly Journal of Economics 121 (1):289-320.
Clark, D., Mühlrad, H. 2016. “The impact of abortion legalization on fertility and
maternal mortality: New evidence from Mexico”. Mimeo.
Cunningham, S., Lindo, J.M., Myers, C. and Schlosser, A. 2017. "How Far Is Too Far?
New Evidence on Abortion Clinic Closures, Access, and Abortions", NBER WP 23366.
Currie, J., Nixon, L., Cole, N. 1996. “Restrictions on Medicaid funding of abortion:
Effects on birth weight and pregnancy resolutions”. Journal of Human Resources, 31:
159-188.
David, H.P. 2006. “Born unwanted, 35 years later: The Prague study”. Reproductive
Health Matters, 14 (27): 181-190.
Donohue, J., Levitt, S.D. 2001. “The impact of legalized abortion on crime”. The
Quarterly Journal of Economics, 116 (2).
Goldin, C. and Katz, L. F. (2002). The Power of the Pill: Oral Contraceptives and
Women's Career and Marriage Decisions. Journal of Political Economy, 110(4):730-
770.
Gruber, J., Levine, P., Staiger, D. 1999. “Abortion legalization and child living
circumstances: Who is the “marginal child”?. The Quarterly Journal of Economics, 114
(1): 263-291.

25
Haas-Wilson, D. 1996. “The impact of state abortion restrictions on minors’ demand for
abortions”. Journal of Human Resources, 140-158.
Kane, T.J., Staiger, D. 1996. “Teen motherhood and abortion access”. The Quarterly
Journal of Economics, 111 (2): 467-506.
Klerman, J.A. 1999. “US abortion policy and fertility”. The American Economic
Review, 89 (2); 261-264.
Levine, P.B., Trainor, A.B., Zimmerman, D.J. 1996. “The effect of Medicaid abortion
funding restrictions on abortions, pregnancies and births”. Journal of Health
Economics, 15 (5): 555-578.
Myers, C. 2017. "The Power of Abortion Policy: Re-examining the effects of young
women's access to reproductive control" Forthcoming at the Journal of Political
Economy.
Pop-Eleches, C. 2006. “The Impact of an abortion ban on socioeconomic outcomes of
children: evidence from Romania”. Journal of Political Economy, 114 (4); 744-773.
Pop-Eleches, C. 2010. “The supply of birth control. Methods, education and fertility.
Evidence from Romania”. The Journal of Human Resources, 45 (4): 971-997.
Rubin, D. C. 1976. “Inference and missing data”. Biometrika 63: 581–592.

26
Tables and Figures
Figure 1. Annual number of registered abortions, Spain 1985-2015
Source: Spanish National Statistical Institute from 1988 onwards.
0
20000
40000
60000
80000
100000
120000
1985 1987 1989 1991 1993 1995 1997 1999 2001 2003 2005 2007 2009 2011 2013 2015

27
Figure 2. Number of clinics that practiced abortions in 1989 per 100,000
inhabitants, by province
Notes: Authors’ calculations based on data from the 1989 report of voluntary pregnancy interruptions
from the Spanish Ministry of Health, Social Services and Equality and province-level population from the
Spanish National Statistical Institute.

28
Figure 3. Annual number of first births by age of the mother (1985: 100).
Source: Birth-certificate data, Spanish National Statistical Institute.
80
85
90
95
100
105
110
115
120
1982 1983 1984 1985 1986 1987 1988
<=18 Total >=25

29
Figure 4. Annual number of births by age of the mother (1985: 100).
Source: Birth-certificate data, Spanish National Statistical Institute.
40
50
60
70
80
90
100
110
120
130
140
80 81 82 83 84 85 86 87 88 89 90
<18 18-25 >25

30
Figure 5. Effect of abortion legalization on births (in logs) by age of the mother
Note: Results from estimating equation 1 over the monthly number of births in logs. We plot the
coefficient of the post-reform indicator variable (see Appendix Table A.2 for details).
* denote statistically significant effects.

31
Figure 6. The effect of the supply of clinics in the number of births.
Panel A. All ages, province with vs. without clinics in 1989
Panel B. Younger than 21, provinces with vs. without clinics in 1989
Source: Birth-certificate data, Spanish National Statistical Institute and data of clinics that practiced
abortions in 1989 from the Spanish Ministry of Health.

32
Figure 7. Annual number of marriages by age, Spain 1980-90 (1985:100)
Source: Marriage-certificate data, Spanish National Statistical Institute.

33
Table 1. Short-term fertility effects, overall and by age group
Births Births in logs Births per 1000 women
(1) (2) (3) (4) (5) (6)
All -706.257* -706.257* -0.019* -0.019** -0.074 -0.074*
(382.231) (360.428) (0.010) (0.010) (0.049) (0.044)
By quartiles of mother’s age:
Q1: 23 and younger -247.111** -247.111*** -0.029*** -0.029*** -0.091** -0.091***
(106.270) (88.707) (0.010) (0.009) (0.038) (0.031)
Q2: 24-26 y.o. -288.972*** -288.972*** -0.034*** -0.034*** -0.205* -0.205*
(100.930) (101.526) (0.012) (0.012) (0.114) (0.112)
Q3: 27-30 y.o. 72.847 72.847 0.007 0.007 -0.012 -0.012
(111.004) (106.870) (0.011) (0.011) (0.102) (0.095)
Q4: 31 and older -243.021* -243.021** -0.025* -0.025** -0.052 -0.052
(128.438) (118.158) (0.013) (0.012) (0.040) (0.036)
N (number of
months)
72 72 72 72 72 72
Linear trend in
months
Y Y Y Y Y Y
Quadratic trend in
months
Y Y Y
Calendar month
dummies
Y Y Y Y Y Y
Notes: Results from estimating equation (1) using monthly births records. The table displays the coefficient of
the variable Post, which takes the value 1 from December 1985 onwards and 0 otherwise. We include 36
months pre- and post- December 1985, so that our sample contains 72 months starting in December 1982 and
finishing in December 1988. Robust standard errors in parentheses, *** p<0.01, ** p<0.05, * p<0.1.

34
Table 2. Short-term fertility effects by region according to clinic availability,
overall and by age group
Births Births in logs Births per 1000 women
(1) (2) (3) (4) (5) (6)
Post -13.887** 14.043* -0.0112** 0.0013 -0.0299 0.0282
(6.803) (8.307) (0.0055) (0.0086) (0.0232) (0.0357)
Post x Clinics per
100,000 inhab -212.594*** -0.0947** -0.4416**
(51.990) (0.0399) (0.1680)
By mother’s age
21 and younger
Post -5.813*** 1.547 -0.0599*** -0.0444** -0.0802*** -0.0258
(1.202) (1.651) (0.0156) (0.0183) (0.0160) (0.0237)
Post x Clinics per
100,000 inhab -56.026*** -0.1182 -0.4141***
(14.703) (0.0788) (0.1300)
Older 21
Post -8.074 12.496* -0.0042 0.0075 0.0093 0.0062
(5.938) (7.344) (0.0059) (0.0089) (0.0366) (0.0533)
Post x Clinics per
100,000 inhab -156.568*** -0.0885** 0.0233
(39.498) (0.0404) (0.2224)
N (months x provinces) 3600 3600 3600 3600 3600 3600
Linear trend in months Y Y Y Y Y Y
Quadratic trend in
months Y Y Y Y Y Y
Calendar month
dummies Y Y Y Y Y
Y
Province fixed-effects Y Y Y Y Y Y
Notes: Results from estimating equation (2) using births records by month and province. The variable Post takes
the value 1 from Dec 1985 onwards and 0 otherwise. The variable Clinics per 100,000 inhabitants is based on the
number of clinics that reported having practiced at least one abortion in 1989, by province (source: 1989 report of
voluntary pregnancy interruptions, Ministry of Health, Social Services and Equality). Standard errors clustered at
province level (50 clusters). *** p<0.01, ** p<0.05, * p<0.1.

35
Table 3. Short-term fertility effects by region and mother/father occupation
Births Births in logs Births per 1000 women
(1) (2) (3)
Both in high-skilled occupations
Post -3.014** -0.0487 -0.0057
(1.386) (0.0416) (0.0066)
PostxClinics per 100,000 inhab. 11.638* 0.2040 0.0292
(6.522) (0.1356) (0.0214)
One in high-skilled occupation
Post -2.835 0.0243 0.0140
(3.791) (0.0245) (0.0125)
PostxClinics per 100,000 inhab. -13.604 -0.0677 -0.0481
(10.300) (0.1129) (0.0541)
Both in low-skilled occupations
Post 19.892** 0.0014 0.0199
(7.924) (0.0107) (0.0361)
PostxClinics per 100,000 inhab. -210.628*** -0.1177** -0.4228**
(57.748) (0.0451) (0.1813)
N (months x provinces) 3,600 3,600 3,600
Linear trend in months Y Y Y
Quadratic trend in months Y Y Y
Calendar month dummies Y Y Y
Province fixed-effects Y Y Y
Notes: Results from estimating equation (2) using births records by month and province. The variable
Post takes the value 1 from Dec 1985 onwards and 0 otherwise. The variable Clinics per 100,000
inhabitants is based on the number of clinics that reported having practiced at least one abortion in
1989, by province (source: 1989 report of voluntary pregnancy interruptions, Ministry of Health,
Social Services and Equality). High-skilled occupations are Professionals and Technicians; Managers
and Directors; Administrative and similar staff. Standard errors clustered at province level (50
clusters). *** p<0.01, ** p<0.05, * p<0.1

36
Table 4: Short term effect on the number of marriages, overall and by age group
Dependent
variable:
Marriages Marriages in logs Marriages per 1000
women
(1) (2) (3) (4) (5) (6)
All 107.458 107.458 0.007 0.007 0.008 0.008
[724.609] [711.899] [0.039] [0.038] [0.046] [0.045]
By group of mother’s ages:
Q1: 23 and younger 50.097 50.097 0.001 0.001 0.014 0.014
[389.770] [385.236] [0.040] [0.039] [0.122] [0.121]
Q2: 24-26 y.o. 65.486 65.486 0.023 0.023 0.111 0.111
[216.439] [216.736] [0.039] [0.040] [0.239] [0.236]
Q3: 27-30 y.o. 32.049 32.049 0.011 0.011 -0.000 -0.000
[249.371] [246.525] [0.040] [0.040] [0.218] [0.217]
Q4: 31 and older 23.458 23.458 0.012 0.012 0.003 0.003
[209.172] [201.223] [0.036] [0.035] [0.019] [0.018]
N (number of
months)
72 72 72 72 72 72
Linear trend in
months
Y Y Y Y Y Y
Quadratic trend in
months
Y Y Y
Calendar month
dummies
Y Y Y Y Y Y
Notes: Results from estimating equation (1) using monthly marriage records. The table displays the coefficient
of the variable Post, which takes the value 1 from August 1985 onwards and 0 otherwise. We include 36
months pre- and post- August 1985, so that our sample contains 72 months starting in August 1982 and
finishing in August 1988. Robust standard errors in parentheses, *** p<0.01, ** p<0.05, * p<0.1

37
Table 5: Short term effect on the number of marriages by region according to
clinics availability, overall and by age group
Marriages Marriages in logs Marriages per 1000
women
Post 2.6224 4.8043 -0.0022 0.0167 0.0241 0.0621*
(4.1615) (9.3417) (0.0106) (0.0234) (0.0164) (0.0355)
Post x Clinics per
100.000 inhab -16.6083 -0.1444 -0.2891
(54.2228) (0.1841) (0.2315)
By mother’s age
21 and younger
Post -1.2353 7.1950** -0.0189 0.0031 -0.0199 0.0316
(1.2000) (3.2437) (0.0163) (0.0296) (0.0214) (0.0383)
Post x Clinics per
100.000 inhab -64.1683*** -0.1670 -0.3923*
(22.3905) (0.2028) (0.2193)
Older 21
Post 3.8576 -2.3907 0.0074 0.0201 0.0521** 0.0693*
(3.4086) (8.3701) (0.0115) (0.0250) (0.0196) (0.0402)
Post x Clinics per
100.000 inhab 47.5601 -0.0967 -0.1306
(48.2927) (0.1898) (0.2651)
N (months x provinces) 3600 3600 3600 3600 3600 3600
Linear trend in months Y Y Y Y Y Y
Quadratic trend in
months Y Y Y Y Y Y
Calendar month
dummies Y Y Y Y Y
Y
Province fixed-effects Y Y Y Y Y Y
Notes: Results from estimating equation (2) using births records by month and province. The variable Post
takes the value 1 from August 1985 onwards and 0 otherwise. The variable Clinics per 100,000 inhabitants
is based on the number of clinics that reported having practiced at least one abortion in 1989, by province
(source: 1989 report of voluntary pregnancy interruptions, Ministry of Health, Social Services and
Equality). Standard errors clustered at province level (50 clusters). *** p<0.01, ** p<0.05, * p<0.1.
38
Table 6. Short-term effect on the probability of studying or working of affected
women. Clinics per 100.000 inhabitants in 1989.
Panel A
Active Working Studying
Treated cohorts 0.0022 -0.0007 0.0252
(0.0244) (0.0102) (0.0211)
Clinics per 100,000 inhab. -3.7757 -4.4284* 1.7853
(2.5121) (2.3038) (1.3478)
Treated*Clinics per
100,000 inhab. -0.0871*** -0.0926*** 0.0588**
(0.0235) (0.0179) (0.0210)
Trend 0.0121*** -0.0057*** 0.0298***
(0.0033) (0.0019) (0.0036)
Post*trend -0.0721*** -0.0319*** 0.0400***
(0.0056) (0.0023) (0.0046)
Constant 1.9875** 1.9574** -0.3439
(0.8862) (0.8207) (0.4744)
FE year & province X X X
Observations 103,491 103,491 103,491
R-squared 0.0735 0.0701 0.2247
Panel B
Cohort -0.0195*** -0.0202*** 0.0502***
(0.0059) (0.0027) (0.0034)
Clinics per 100,000 inhab. -2.6867 -3.7648 1.1040
(2.4799) (2.2732) (1.4125)
Cohort*Clinics 100,000
per inhab. -0.0118*** -0.0090** 0.0082**
(0.0037) (0.0034) (0.0028)
Constant 3.0082** 3.1752*** -3.4644***
(1.1691) (0.9618) (0.5391)
FE year & province X X X
Observations 103,491 103,491 103,491
R-Squared 0.0533 0.0655 0.2170
Note: Results from estimating equation (3) using LFS data (second quarter) from 1986 to 1990. The
variable Clinics per 100,000 inhabitants is based on the number of clinics that reported having practiced
at least one abortion in 1989, by province (source: 1989 report of voluntary pregnancy interruptions,
Ministry of Health, Social Services and Equality). Treated cohorts are those born between 1965 and 1971
so that they are aged 21 or younger at the time of the reform. Standard errors clustered by cohort.

39
Table 7. Effects of abortion legalization on completed fertility
(1) (2) (3) (4)
At 18 At 21 At 34 At 44
Panel A
Treated Cohorts -0.0049*** 0.0087* -0.0015 -0.0157
(0.0018) (0.0048) (0.0127) (0.0152)
Treated x Clinics per
100,000 inhab -0.0463*** -0.1249*** -0.1430** -0.1068
(0.0120) (0.0336) (0.0687) (0.0814)
Linear trend 0.0005* -0.0152*** -0.0523*** -0.0405***
(0.0003) (0.0010) (0.0033) (0.0039)
Post x Linear trend -0.0031*** 0.0046*** 0.0242*** 0.0318***
(0.0004) (0.0008) (0.0037) (0.0042)
Panel B
Cohorts 1969-71 -0.0156*** 0.0327*** 0.1080*** 0.1264***
(0.0028) (0.0066) (0.0243) (0.0277)
Cohorts 1967-68 -0.0106*** 0.0202*** 0.0546*** 0.0511**
(0.0022) (0.0054) (0.0186) (0.0219)
Cohorts 1965-66 -0.0067*** 0.0032 -0.0121 -0.0244*
(0.0017) (0.0043) (0.0124) (0.0144)
Cohorts 1969-71 x Clinics
per 100,000 inhab -0.0561*** -0.1492*** -0.1707** -0.1364
(0.0148) (0.0401) (0.0835) (0.1025)
Cohorts 1967-68 x Clinics
per 100,000 inhab -0.0447*** -0.1289*** -0.1972** -0.1689*
(0.0116) (0.0321) (0.0741) (0.0858)
Cohorts 1965-66 x Clinics
per 100,000 inhab -0.0333*** -0.0843*** -0.0472 -0.0028
(0.0094) (0.0280) (0.0515) (0.0594)
Linear trend 0.0001 -0.0149*** -0.0505*** -0.0379***
(0.0003) (0.0010) (0.0030) (0.0037)
Panel C
Cohort -0.0013*** -0.0117*** -0.0413*** -0.0278***
(0.0003) (0.0009) (0.0025) (0.0032)
Cohort x Clinics per
100,000 inhab -0.0062*** -0.0174*** -0.0180* -0.0130
(0.0015) (0.0045) (0.0096) (0.0116)
Province FE Y Y Y Y
Observations 700 700 700 700
Notes: Results from estimating equation (3) over the average number of births per woman to a
cohort and province at 18 years old (Column 1), 21 years old (Column 2), and so on. The
average number of births per woman to a cohort and province was calculated as the total
number of births by cohort and province (based on birth records between 1975 and 2015)
divided by the size of the cohort by province in 1981 (based on female population by age and
province in 1981, source: 1981 Population and Housing Census). Sample: 1958-1971 cohorts.
Treated cohorts are those born between 1965 and 1971 so that they are aged 21 or younger at
the time of the reform. Robust standard errors clustered at province level (50 clusters) in
parentheses. *** p<0.01, ** p<0.05, * p<0.1.

40
Table 8. Long-term effects of abortion legalization on educational attainment
Panel A: Educational attainment
HS dropout High school Vocational College
Treated Cohorts 0.0293*** -0.0108*** -0.0120 -0.0064
(0.0095) (0.0034) (0.0094) (0.0051)
Clinics per 100,000
inhabs. -8.1021*** -2.6705* 12.6244*** -1.8517
(1.4936) (1.3649) (1.0606) (1.2382)
Treated*Clinics per
100,000 inhabs. -0.0536** 0.0362*** 0.0375** -0.0201
(0.0213) (0.0105) (0.0133) (0.0117)
Trend -0.0189*** 0.0020** 0.0117*** 0.0052***
(0.0013) (0.0008) (0.0016) (0.0005)
Post*Trend 0.0043** -0.0035*** -0.0083*** 0.0075***
(0.0018) (0.0010) (0.0017) (0.0015)
Constant 3.2826*** 1.0717** -4.2922*** 0.9379*
(0.5402) (0.4940) (0.3862) (0.4466)
FE year & Province X X X X
Observations 136,339 136,339 136,339 136,339
R-squared 0.0520 0.0088 0.0212 0.0234
Panel B: Labor market and marital status effects
Active Employed Married Divorced
Treated cohorts -0.0264** -0.0267** 0.0141 0.0052
(0.0092) (0.0091) (0.0134) (0.0033)
Clinics per 100,000
inhab 6.2541*** 4.7731*** -6.7515*** 0.7582
(0.9950) (0.7559) (1.0716) (0.7600)
Treated*Clinics per
100,000 inhabs 0.0184 0.0236 -0.0275 -0.0194*
(0.0192) (0.0210) (0.0217) (0.0102)
Trend 0.0090*** 0.0064*** -0.0040*** -0.0016**
(0.0010) (0.0009) (0.0009) (0.0005)
Post*Trend 0.0021 0.0020 -0.0246*** -0.0024***
(0.0019) (0.0017) (0.0037) (0.0006)
Constant -1.5219*** -1.1017*** 3.1906*** -0.2405
(0.3570) (0.2682) (0.3830) (0.2749)
FE year & Province X X X X
Observations 136,339 136,339 136,339 136,339
R-squared 0.0268 0.0403 0.0313 0.0124
Note: Results from estimating equation (3) using LFS data (second quarter) from 2000 to 2007. The
variable Clinics per 100,000 inhabitants is based on the number of clinics that reported having practiced
at least one abortion in 1989, by province (source: 1989 report of voluntary pregnancy interruptions,
Ministry of Health, Social Services and Equality). Treated cohorts are those born between 1965 and 1971
so that they are aged 21 or younger at the time of the reform. Standard errors clustered by cohort.

41
Table 9. Long-term effects of abortion legalization on life satisfaction
Satisfaction
with job
Satisfaction
with
economic
status
Satisfaction
with housing
Satisfaction
with leisure
time
PCA (first
component)
(1) (2) (3) (4) (5)
Treated Cohorts -0.0571 -0.0319 -0.0897 -0.0536 -0.0870
(0.0894) (0.0902) (0.0674) (0.0866) (0.0788)
Treated x Clinics
per 100,000 inhab. 0.2718 -0.0412 0.1380** 0.2356*** 0.2167*
(0.1580) (0.1277) (0.0551) (0.0552) (0.1085)
Linear trend 0.0085 0.0117 0.0070 0.0020 0.0120
(0.0156) (0.0144) (0.0106) (0.0208) (0.0137)
Post x Linear trend -0.0257 -0.0347 -0.0022 -0.0027 -0.0277
(0.0335) (0.0211) (0.0166) (0.0234) (0.0255)
Regional FE X X X X X
Observations 3,939 3,935 3,935 3,937 3,934
R-squared 0.0248 0.0247 0.0345 0.0180 0.0350
Notes: Results from estimating equation (3) based on the 2000 wave of the ECHP. The dependent
variables “Satisfaction with…” in columns 1 to 4 range from 1 to 6, where 1 means “Unsatisfied” and
6 “Fully satisfied”. In column 5, the dependent variable is the first component of a Principal
Component Analysis using the variables in columns 1 to 4. Sample: women who live in the same
region where they born or migrate to that region before 1985, cohorts 1958-1971. Treated cohorts are
those born between 1965 and 1971 so that they are aged 21 or younger at the time of the reform. The
maximum regional desegregation of these data is at Comunidad Autónoma level, so standard errors are
clustered at that level (17 clusters). *** p<0.01, ** p<0.05, * p<0.1

42
Appendix
Table A1. Effect of abortion legalization on the number of births. Alternative
windows
Births Births in logs Births per 100,000
women
(1) (2) (3) (4) (5) (6)
A. Window: 24 months
All -561.917 -561.917 -0.015 -0.015 -0.060 -0.060
(483.168) (471.093) (0.013) (0.013) (0.060) (0.058)
By quartiles of mother’s
age:
Q1: 23 and younger -243.292** -243.292** -0.027** -0.027** -0.088** -0.088**
(118.834) (112.291) (0.012) (0.012) (0.042) (0.039)
Q2: 24-26 y.o. -95.083 -95.083 -0.010 -0.010 -0.072 -0.072 (131.141) (134.186) (0.016) (0.016) (0.147) (0.148)
Q3: 27-30 y.o. -16.667 -16.667 -0.001 -0.001 -0.019 -0.019 (132.271) (129.909) (0.013) (0.013) (0.120) (0.117)
Q4: 31 and older -206.875 -206.875 -0.021 -0.021 -0.048 -0.048
(166.955) (158.965) (0.017) (0.016) (0.051) (0.048)
B. Window: 30 months All -670.944 -670.944* -0.018* -0.018* -0.070 -0.070 (405.894) (375.779) (0.010) (0.010) (0.052) (0.046)
By quartiles of mother’s
age:
Q1: 23 and younger -266.528** -266.528*** -0.031*** -0.031*** -0.098** -0.098*** (111.309) (89.401) (0.010) (0.009) (0.039) (0.031)
Q2: 24-26 y.o. -242.111** -242.111** -0.029** -0.029** -0.175 -0.175 (109.180) (111.340) (0.013) (0.013) (0.126) (0.122)
Q3: 27-30 y.o. 19.583 19.583 0.002 0.002 -0.041 -0.041
(115.179) (109.314) (0.012) (0.011) (0.109) (0.100)
Q4: 31 and older -181.889 -181.889 -0.019 -0.019 -0.034 -0.034
(129.726) (118.560) (0.013) (0.012) (0.040) (0.036)
Linear trend in months Y Y Y Y Y Y Quadratic trend in
months
Y Y Y Calendar month
dummies
Y Y Y Y Y Y
Notes: Results from estimating equation 1 using monthly births records. The table displays the coefficient of the
variable Post, which takes the value 1 from December 1985 onwards and 0 otherwise. In panel A, we include 24
months pre- and post- December 1985, so that our sample contains 48 months starting in December 1983 and
finishing in December 1987. In panel B, we include 30 months pre- and pot-December 1985, so that our sample
contains 60 months starting in June 1982 and finishing in June 1988. Robust standard errors in parentheses, ***
p<0.01, ** p<0.05, * p<0.1.

43
Table A2. Effect of abortion legalization on the number of births, by mother’s age.
Births Births in logs Births per 1000 women
(1) (2) (3) (4) (5) (6)
Younger 16 -15.090*** -15.090*** -0.198*** -0.198*** -0.049*** -0.049***
(5.591) (4.876) (0.063) (0.056) (0.017) (0.015) 16 y.o. -31.465*** -31.465*** -0.163*** -0.163*** -0.104*** -0.104***
(6.814) (6.877) (0.035) (0.035) (0.022) (0.022) 17 y.o. -50.604*** -50.604*** -0.122*** -0.122*** -0.145*** -0.145***
(11.509) (11.503) (0.029) (0.029) (0.037) (0.036) 18 y.o. -23.368** -23.368** -0.037** -0.037** -0.059* -0.059 (11.303) (11.649) (0.017) (0.017) (0.035) (0.035) 19 y.o. -14.708 -14.708 -0.015 -0.015 -0.047 -0.047 (14.794) (14.922) (0.014) (0.015) (0.047) (0.046) 20 y.o. -121.250*** -121.250*** -0.098*** -0.098*** -0.280*** -0.280*** (22.970) (22.200) (0.017) (0.017) (0.083) (0.070) 21 y.o. -34.479 -34.479 -0.021 -0.021 -0.087 -0.087 (25.654) (25.702) (0.017) (0.017) (0.087) (0.080) 22 y.o. 48.083 48.083 0.024 0.024 -0.043 -0.043 (34.674) (31.211) (0.018) (0.017) (0.121) (0.100) 23 y.o. -4.229 -4.229 -0.007 -0.007 -0.081 -0.081 (46.244) (31.325) (0.018) (0.014) (0.132) (0.104) 24 y.o. -118.938*** -118.938*** -0.049*** -0.049*** -0.152 -0.152 (41.967) (37.923) (0.016) (0.015) (0.133) (0.122) 25 y.o. -100.340*** -100.340*** -0.036*** -0.036*** -0.221 -0.221* (36.419) (36.979) (0.013) (0.013) (0.133) (0.123) 26 y.o. -69.694 -69.694 -0.022 -0.022 -0.282 -0.282 (60.941) (54.376) (0.021) (0.019) (0.179) (0.179) 27 y.o. -67.375 -67.375* -0.024 -0.024* -0.157 -0.157 (43.434) (37.201) (0.015) (0.013) (0.124) (0.125) 28 y.o. 70.944** 70.944** 0.027** 0.027** 0.117 0.117 (28.970) (29.179) (0.011) (0.011) (0.114) (0.102) 29 y.o. 45.632 45.632 0.019 0.019 -0.029 -0.029 (44.978) (40.001) (0.019) (0.017) (0.156) (0.143) 30 y.o. 23.646 23.646 0.012 0.012 0.047 0.047 (49.893) (37.752) (0.023) (0.017) (0.160) (0.149) 31 y.o. -52.361 -52.361 -0.028 -0.028 -0.111 -0.111 (39.332) (33.529) (0.022) (0.019) (0.138) (0.133) 32 y.o. -103.118*** -103.118*** -0.068*** -0.068*** -0.251** -0.251** (23.929) (23.828) (0.016) (0.016) (0.097) (0.096) 33 y.o. 38.160 38.160 0.030 0.030 0.026 0.026 (24.757) (24.613) (0.019) (0.019) (0.099) (0.098) 34 y.o. 45.333 45.333* 0.039 0.039* -0.033 -0.033 (29.774) (24.871) (0.027) (0.023) (0.103) (0.103) 35+ y.o. -29.035 -29.035 -0.035 -0.035* 0.010 0.010 (25.952) (18.319) (0.027) (0.020) (0.074) (0.068)
N (number
of months)
72 72 72 72 72 72 Linear trend
in months
Y Y Y Y Y Y Quadratic
trend in
months
Y Y Y Calendar
month
dummies
Y Y Y Y Y Y
Notes: Results from estimating equation 1 using monthly births records. The table displays the
coefficient of the variable Post, which takes the value 1 from December 1985 onwards and 0 otherwise.
We include 36 months pre- and post- December 1985, so that our sample contains 72 months starting in
December 1982 and finishing in December 1988. Robust standard errors in parentheses, *** p<0.01, **
p<0.05, * p<0.1.

44
Table A3. Short-term fertility effects by region and clinic availability. Alternative
measure of clinic availability (births in logs)
All 21 and younger Older than 21
A. Dividing the sample according to whether
there was at least one clinic that practiced
abortions in 1989 in province p
Post (provinces with no clinics) -0.0001 -0.0362 0.0052
(0.0097) (0.0289) (0.0105)
Post (provinces with at least one clinic) -0.0206*** -0.0801*** -0.0121*
(0.0055) (0.0146) (0.0060)
B. Using distance to the nearest province with at
least one clinic
Post -0.0257*** -0.0778*** -0.0177**
(0.0068) (0.0179) (0.0074)
Post x Distance 0.0003*** 0.0004* 0.0003***
(0.0001) (0.0002) (0.0001)
C. Using the absolute number of clinics
Post -0.0093 -0.0524*** -0.0030
(0.0080) (0.0173) (0.0083)
Post x N. of clinics -0.0013 -0.0053* -0.0008
(0.0028) (0.0031) (0.0028)
N (months x provinces) 3,600 3,600 3,600
Linear trend in months Y Y Y
Quadratic trend in months Y Y Y
Calendar month dummies Y Y Y
Province fixed-effects Y Y Y
Notes: Results from estimating equation (2) using births records by month and province. The
variable Post takes the value 1 from Dec 1985 onwards and 0 otherwise. In panel A, we divide the
sample into two groups according to whether there was at least one clinic that practiced abortions in
1989 in province p or not. In panel B, the variable Distance is the distance (in km) to the nearest
province with at least one clinic that practiced abortions in 1989. In panel C, the variable Nclinics is
the absolute number of clinics that practiced abortions in 1989 in province p. Standard errors
clustered at province level (50 clusters). *** p<0.01, ** p<0.05, * p<0.1.

45
Table A4. Short-term fertility effects by region and clinic availability, controlling
for demand factors
Births Births in logs Births per 1000 women
A. Baseline
Post 14.043* 0.0013 0.0282
(8.307) (0.0086) (0.0357)
Post x Clinics per 100,000 inhab -212.594*** -0.0947** -0.4416**
(51.990) (0.0399) (0.1680)
B. Controling for birth rates among young women
Post 16.603 -0.0199 0.2101***
(24.713) (0.0166) (0.0673)
Post x Clinics per 100,000 inhab. -210.986*** -0.1081*** -0.3274*
(57.406) (0.0389) (0.1678)
Post x Births<18 -256.651 2.1295 -18.2416***
(2,362.010) (1.3761) (5.7185)
Post 56.192** -0.0177 0.2389***
(23.114) (0.0195) (0.0756)
Post x Clinics per 100,000 inhab. -191.533*** -0.1042*** -0.3363**
(58.418) (0.0383) (0.1539)
Post x Births<21,unmarried -8,597.430* 3.8697 -42.9897***
(5,030.632) (3.4079) (11.8854)
C. Controling for religiosity
Post -79.191 0.0465 -0.1458
(55.868) (0.0308) (0.1242)
Post x Clinics per 100,000 inhab. -145.595** -0.1273*** -0.3166*
(59.166) (0.0406) (0.1617)
Post x Fraction of Practicing Catholics 133.690* -0.0649 0.2494
(76.239) (0.0442) (0.1843)
N (months x provinces) 3,600 3,600 3,600
Linear trend in months Y Y Y
Quadratic trend in months Y Y Y
Calendar month dummies Y Y Y
Province fixed-effects Y Y Y
Notes: Results from estimating equation (2) using births records by month and province. The variable
Post takes the value 1 from Dec 1985 onwards and 0 otherwise. Standard errors clustered at province
level (50 clusters). *** p<0.01, ** p<0.05, * p<0.1

46
Table A5. Effect of abortion legalization on the number of marriages, by mother’s
age.
Dep. variable: Marriages Marriages in logs Marriages per 1000 women
(1) (2) (3) (4) (5) (6)
Younger 16 -8.403 -8.403 -0.146 -0.146 -0.014 -0.014
[7.884] [6.185] [0.087] [0.076] [0.012] [0.010] 16 y.o. -9.097 -9.097 -0.051 -0.051 -0.030 -0.030 [8.766] [8.696] [0.044] [0.044] [0.027] [0.027] 17 y.o. -14.687 -14.687 -0.026 -0.026 -0.034 -0.034 [21.001] [21.018] [0.048] [0.048] [0.066] [0.065] 18 y.o. -4.653 -4.653 -0.006 -0.006 -0.009 -0.009 [32.265] [31.957] [0.041] [0.041] [0.100] [0.099] 19 y.o. -12.549 -12.549 -0.006 -0.006 -0.010 -0.010 [48.403] [48.076] [0.043] [0.043] [0.153] [0.149] 20 y.o. -46.153 -46.153 -0.043 -0.043 -0.074 -0.074 [62.650] [62.426] [0.045] [0.045] [0.202] [0.193] 21 y.o. 70.604 70.604 0.043 0.043 0.151 0.151 [77.304] [77.981] [0.043] [0.043] [0.248] [0.247] 22 y.o. 76.889 76.889 0.039 0.039 0.103 0.103 [77.035] [75.129] [0.042] [0.040] [0.244] [0.239] 23 y.o. -1.854 -1.854 -0.008 -0.008 0.058 0.058 [94.208] [90.743] [0.045] [0.042] [0.292] [0.288] 24 y.o. -1.868 -1.868 0.004 0.004 0.124 0.124
[88.821] [88.698] [0.042] [0.042] [0.290] [0.290]
25 y.o. 35.771 35.771 0.045 0.045 0.128 0.128
[74.430] [74.584] [0.040] [0.041] [0.249] [0.245] 26 y.o. 31.583 31.583 0.023 0.023 0.097 0.097
[59.614] [59.980] [0.041] [0.042] [0.198] [0.196] 27 y.o. 12.750 12.750 0.024 0.024 0.038 0.038
[47.046] [46.263] [0.045] [0.045] [0.159] [0.154] 28 y.o. 22.785 22.785 0.075 0.075 0.053 0.053 [29.989] [28.812] [0.041] [0.041] [0.101] [0.097] 29 y.o. 8.181 8.181 0.038 0.038 0.018 0.018 [24.766] [21.702] [0.049] [0.046] [0.082] [0.075] 30 y.o. 5.639 5.639 0.067 0.067 0.033 0.033 [16.198] [12.686] [0.050] [0.041] [0.053] [0.046] 31 y.o. -6.090 -6.090 -0.006 -0.006 -0.004 -0.004
[11.160] [10.420] [0.044] [0.043] [0.041] [0.039] 32 y.o. -1.167 -1.167 -0.002 -0.002 0.001 0.001 [9.646] [9.763] [0.064] [0.064] [0.038] [0.038] 33 y.o. 11.882 11.882 0.113
* 0.113
* 0.032 0.032
[6.911] [6.734] [0.054] [0.054] [0.028] [0.028] 34 y.o. 5.340 5.340 0.055 0.055 0.017 0.017 [5.990] [5.644] [0.057] [0.054] [0.023] [0.023] 35 y.o. 1.076 1.076 0.022 0.022 0.024 0.024 [5.484] [5.418] [0.061] [0.061] [0.022] [0.022]
N (number of
months)
72 72 72 72 72 72 Linear trend in
months
Y Y Y Y Y Y Quadratic trend
in months
Y Y Y Calendar month
dummies
Y Y Y Y Y Y
Notes: The table displays the coefficient of the variable Post, which takes the value 1 from Dec 1985
onwards and 0 otherwise.

47
Figure A1. Province variation in birth rates to women 18 and younger in 1984.
Notes: Authors’ calculations based on birth-certificate data and female population data in 1984 (Source:
Spanish National Statistical Institute). Birth rates to women 18 and younger in 1984 are defined as the
number of births of mothers aged 18 or less per province in 1984 divided by female population of 15-19
years old per province.
Figure A2. Province variation in birth rates to unmarried women 21 or younger in
1984.
Notes: Authors’ calculations based on birth-certificate data and female population data in 1984 (Source:
Spanish National Statistical Institute). Birth rates to unmarried women 21 and younger in 1984 are
defined as the number of births of unmarried mothers aged 21 or less per province in 1984 divided by
female population of 15-19 years old per province.

48
Figure A3. Province variation in the fraction of women aged between 15-49
practicing Catholics in 1985
Source: 1985 Fertility Survey microdata, Spanish National Statistical Institute. Practicing catholic are
those who actually practice the religion, for example, going to Mass every Sunday. Answers from the
1985 FS are missing for 7 provinces (Avila, Guadalajara, Huelva, Lleida, Segovia, Soria and Teruel) due
to lack of enough sample size to be representative of the population of interest. To estimate the religiosity
of these missing provinces we follow the multiple imputation methodology suggested by Rubin (1987)
and regress the catholic practicing rate by province on a group of other indicators for the same or around
years.
Related Documents