Discussion Paper No. 0140 Adelaide University Adelaide 5005 Australia The Economics of Protecting Tiger Populations: Linking Household Behaviour to Poaching and Prey Depletion Richard Damania Randy Stringer K. Ullas Karanth Brad Stith November 2001

Welcome message from author
This document is posted to help you gain knowledge. Please leave a comment to let me know what you think about it! Share it to your friends and learn new things together.
Transcript
Discussion Paper No. 0140
Adelaide University
Adelaide 5005 Australia
The Economics of Protecting Tiger Populations: Linking Household Behaviour to Poaching
and Prey Depletion
Richard Damania Randy Stringer
K. Ullas Karanth Brad Stith
November 2001

CENTRE FOR INTERNATIONAL ECONOMIC STUDIES
The Centre was established in 1989 by the Economics Department of the Adelaide University to strengthen teaching and research in the field of international economics and closely related disciplines. Its specific objectives are:
• to promote individual and group research by scholars within and outside the Adelaide University
• to strengthen undergraduate and post-graduate education in this field
• to provide shorter training programs in Australia and elsewhere
• to conduct seminars, workshops and conferences for academics and for the wider community
• to publish and promote research results
• to provide specialised consulting services
• to improve public understanding of international economic issues, especially among policy makers and shapers
Both theoretical and empirical, policy-oriented studies are emphasised, with a particular focus on developments within, or of relevance to, the Asia-Pacific region. The Centre’s Director is Professor Kym Anderson ([email protected]) and Deputy Director is Dr Randy Stringer ([email protected]) Further details and a list of publications are available from: Executive Assistant CIES School of Economics Adelaide University SA 5005 AUSTRALIA Telephone: (+61 8) 8303 5672 Facsimile: (+61 8) 8223 1460 Email: [email protected] Most publications can be downloaded from our Home page: http://www.adelaide.edu.au/cies/ ISSN 1444-4534 series, electronic publication
CIES DISCUSSION PAPER 0140
The Economics of Protecting Tiger Populations: Linking Household Behaviour to Poaching
and Prey Depletion
Richard Damania Randy Stringer
K. Ullas Karanth Brad Stith
Centre for International Economic Studies and School of Economics University of Adelaide
November 2001
The Economics of Protecting Tiger Populations:
Linking Household Behaviour to Poaching and Prey
Depletion*
Richard Damania1
Randy Stringer1
K. Ullas Karanth2
Brad Stith3
ABSTRACT The tiger (Panthera tigris) is classified as endangered (IUCN, 2000). The population of wild tigers continues to decline, despite substantial conservation investments by governments and international agencies. This paper presents a formal economic analysis of the two most imminent threats to the survival of wild tigers: poaching of wild tigers and hunting their prey. A model is developed to examine the interactions between wild tigers and farm households living in and around tiger habitats. The analysis extends the most recent model of tiger demography to incorporate predator-prey interactions and explores the sensitivity of tiger populations to key economic parameters. To our knowledge this is the first formal investigation into the economic causes of declining tiger populations. It is hoped that the analysis may contribute to the policy debate on how best to protect one of the world’s most endangered wild cats. 1 School of Economics, University of Adelaide, Adelaide 5001, Australia. Email [email protected] and [email protected] 2. Wildlife Conservation Society, International Programs, Bronx, New-York - 10460. Email [email protected] 3. U.S. Geological Survey, Florida Caribbean Science Center, Sirenia Project, 412 NE 16th Ave.; Rm 250 Gainesville, FL 32601. Email [email protected] *The authors appreciate gratefully the assistance, comments and suggestions from Kym Anderson, Edward Barbier, Erwin Bulte, Anthony Cheshire, Jon D. Harford, John Hatch and Suraj Saigal. Information provided by the Wildlife Trust of India is also gratefully acknowledged. The usual disclaimers apply.
I. Introduction
The earth’s remaining wild tiger (Panthera tigris) populations continue to shrink and
fragment under ever increasing human-related pressures. Over time, human activities
have reduced tiger habitats by more than 90 per cent. Moreover, tigers live in only a
small fraction of the potential habitat. Recent studies estimate that wild tigers inhabit less
than 5 per cent of the 1.5 million km2 of forest habitat available (Karanth, 2001). The
most widely cited published census suggests that between 4,000 - 7,700 tigers may live in
the wild (Jackson, 1993). Estimating tiger populations is exceedingly difficult, hence
these figures are generally considered to be unreliable and overly optimistic (Karanth,
1987; Jackson, 1993). At present, more tigers may exist in captivity than in the wild
(IUCN, 2001).
The evidence to date indicates that wild tiger populations continue declining despite
substantial conservation efforts by international agencies, local conservation groups and
governments, (Seidensticker et al, 1999). The IUCN identifies tigers in all the range
countries as endangered and the signatories to CITES have placed a ban on all
international trade in live tigers and tiger parts.
Tigers need extensive areas to hunt and breed thus protecting wild populations and
sustaining their habitats present wildlife managers with a set of complex and daunting
tasks. For instance, tigers are large-bodied, obligate carnivores and readily come into
conflict with humans by killing livestock and occasionally people. Population numbers
are sensitive to the depletion of a prey base which often competes with domestic
livestock for the same food sources. The role tigers play as a top predator is vital to
regulating and perpetuating ecological processes and systems (Terborgh, 1999, Sunquist
et al 1999). If either predator or prey numbers decline, entire ecological communities
may become unstable with more and more species being gradually lost.
A further difficulty for conservation efforts is that wild tigers occur only in Asia, where
the high incidence of rural poverty, large numbers of livestock and high levels of human
population density and growth, speed forest degradation. Unlike much of Africa and
Latin America, the vast majority of forests in Asia have already been converted to other
land uses. In countries like India, forest boundaries appear to have stabilized and the
major conservation management problem is most often related to how communities use
forest resources within national parks, protected areas and public forests (Wells, 1992,
Ghimire, 1994; Nepal and Weber, 1995, Studsrod and Wegge, 1995; Gunatilake, 1998;
Gunatilake and Chakravorty, 2000; Kumar, et al, 2000, Lele, 2000).
The proximate causes for the persistent decline of wild tiger populations are many.
Pressures vary regionally and change over time. Among the numerous forces threatening
the tiger's survival include poaching, prey depletion and habitat fragmentation due to land
clearing, livestock grazing, weed infestations, fuelwood and fodder extraction, smuggling
for the illegal timber trade, and intrusive infrastructure (World Bank, 1996; Siedensticker
et al, 1999). What the relative contributions of these forces are to declining tiger
populations and how they interact are less well understood (Karanth and Stith, 1999).
Tiger poaching is considered to be the most imminent threat to survival of the species in
the short run. In the early 1990s, wildlife authorities observed a dramatic escalation in the
scale of poaching with tigers being killed to satisfy the burgeoning demand for tiger
bones and organs for traditional Oriental medicine (Meacham, 1997).
The biological consequences of declining tiger populations through poaching and prey
depletion have been examined in careful detail (Karanth and Stith, 1999; Kenney et al,
1995). However, no formal analysis has examined the fundamental economic causes
driving wild tigers to extinction. This paper argues that a clearer understanding of how
biological factors interact with economic forces is crucial for guiding policy choices
aimed at sustaining viable habitats and reversing the decline in wild tiger populations.
The work presented here represents a first attempt to integrate economic incentives into a
predator-prey model of tiger biology.
The paper is organized as follows. Section II provides a brief description of the
background to the problem. Section III outlines the basic model which describes the
behaviour of subsistence farmers and poachers and their interaction with tigers and their
prey. Section IV presents a stage based demographic model of tiger population growth
dynamics. Section V outlines the simulation results of various alternative scenarios, while
Section VI concludes the paper.
II. Background to the Problem
The tiger once had the widest geographical distribution of any big cat, stretching across
Asia from Java, through India, to Siberia and eastern Turkey (Siedensticker et al, 1999).
Hunting and habitat erosion have exterminated tigers through much of their previous
range. Most habitats are now completely isolated from each other and contain less than
30 animals (Siedensticker et al, 1999). Tigers feed predominately on large ungulates
(hoofed mammals such as deer and wild cattle), occasionally capturing smaller prey.
They cannot survive if a habitat does not support sufficient densities of large ungulates.
To meet its nutritional needs, a tiger must feed on a large ungulate approximately once
every eight to ten days. Field studies suggest that an adult tiger requires a minimum of
3,000 kg of meat per annum to survive (Schaller, 1967). A breeding tigress may need
twice that amount. Like other big cats, tigers succeed in capturing only 10 to 20 per cent
of the available prey, suggesting that approximately 500 ungulates are required to support
one tiger in the wild (Karanth, 1998).
Tigers are also solitary animals, requiring vast forest areas of reasonable quality in which
to roam, hunt and breed. Conserving wild populations therefore requires protecting the
quality of their habitat as well as their prey. Factors influencing tiger densities vary in
different regions. In relatively prey-rich forests such as India’s Nagarahol, Kanha and
Bandhavgar National Parks, densities can exceed 10 tigers per 100 km2 (Karanth and
Nichols, 2000). In contrast, tiger densities in Siberia are considerably lower, since prey is
less abundant and more widely dispersed. The central message emerging from the
biological studies is that where habitats are undisturbed and prey is plentiful, tigers
survive and may even endure limited poaching pressures.
The forests that tigers inhabit, however, provide a wide range of economic, social and
environmental benefits. These benefits contribute greatly to human welfare, but they are
valued differently by different people and different groups. Local, national and
international interests in tigers and their habitats also differ greatly across landscapes. To
government policymakers, tiger habitats are often seen only for their ability to generate
income, employment, revenue and foreign exchange when converted to agriculture,
timber, mines or other development-oriented activities including irrigation projects. To a
small proportion of the humans living in and around the forests, tiger body parts yield
substantially greater income than do live tigers roaming free. To many of the small scale
agricultural producers, tigers and their prey are viewed as pests.
Numerous studies document both the crop damage caused by large, grazing ungulates
(Sekhar, 1988; Karanth, 1991, World Bank, 1996). On the other hand, little information is
available about two of the most imminent threats to the survival of wild tigers: the
poaching of tigers and the poaching of their prey. Recent investigations suggest that the
trade in tiger parts is controlled by criminal cartels, involved in a host of other illegal
activities. In contrast, tiger poaching is undertaken by locals who have an intimate
knowledge of the forests. Poachers are often paid a meager $15-20 for a tiger body, while
the traders may secure in excess of $20,000 for an adult male tiger body (Nowell, 2000;
WPSI, 2001).
National governments tend to influence control over the choice of forest benefits. When
traditional rights and access shift in ways that adversely impact local communities,
households may have little incentive to use natural resources, and in particular protect
animals, in a sustainable way (Barbier, 1992; Panayotou, 1993; Gunatilake, 1994, 1998;
Tisdell, 1995; Shyamsundar and Kramer, 1996, World Bank, 1996). For this reason,
providing greater access and use of tiger habitats is often argued as the appropriate
response to meet conservation objectives (Saberwal, 1993; Kothari et al, 1995).
India has had a relatively successful history of tiger protection and is thought to possess
the largest number of wild tigers of any of the range states (IUCN, 2001). Its response to
declining tiger populations has focused on establishing reserves.1 Although the most
appropriate policy measures needed to halt or reverse declining tiger populations on these
reserves are still contested, the overall management approach has recently shifted towards
a participatory style known as Joint Forestry Management (JFM). Through sharing
products, responsibilities, and decision making authority, JFM approaches seek to
provide local communities with incentives to protect the forest resources that provide the
bases of their income and future welfare.
While some argue that JFM should also be extended to wildlife protected areas (Kothari
et al, 1995), other studies raise important concerns about the appropriateness of JFM-
style conservation and protection efforts (Gunatilake, 1998). For instance, Barrett and
Arcese (1995, 1998) question the assumptions linking local communities and sustainable
forest resource use across diverse geographic conditions and economic situations.
Simpson (1995) suggests the need for greater experimentation with direct-payment for
conservation efforts, rather than funding untested participatory projects based on raising
the value of forest products in ways that may fail to deliver improved conservation
outcomes. This view finds support in Gunatilake’s (1998) analysis of Sri Lanka which
provides evidence that policies aimed at reducing dependency on forest based resources
can be a much more effective way to protect forests than policies aimed at using forest
resources. Examples include increasing non-farm and non-forestry employment,
improving access to education, and enhancing agricultural productivity.
The model and simulations presented here examine how the tiger’s biological needs
interact with economics incentives facing households living in and around these habitats.
The analysis aims to contribute to the policy debate about how best to protect tiger
populations.
III. The Model
1 The programme to protect tigers termed Project Tiger was introduced in 1973.
Most of India’s tiger habitats are in parks and protected areas that also support various
forms of land uses, including agriculture, livestock grazing and fuelwood collection
(Mishra, 1997; Sekhar, 1998). The interspersion of humans in and around these parks
leads inevitably to conflicts over resource use (Schultz and Skonhoft, 1996).
Accordingly, we consider two motives for hunting prey species. The first is when the
large ungulates cause damage to crops in adjoining agricultural areas, termed the
‘nuisance effect’ by Marks (1984). The second motive arises from the incentive of
subsistence producers to hunt ungulates as a supplementary food source. In contrast, tiger
poaching is carried out under open access conditions and the incentive to hunt tigers is
driven entirely by the demand for tiger products.
The context for this model is a wild tiger population in an insular forest patch surrounded
by agricultural land --a typical characteristic of tiger reserves on the Indian subcontinent.
We extend the most recent model of tiger population dynamics developed by Karanth and
Stith (1999), to include predator-prey interactions. To isolate the economic causes of prey
depletion from those of tiger poaching, the model distinguishes between two types of
agents: subsistence farmers who hunt tiger prey and individuals who poach tigers2. We
begin by describing the activities of tiger poachers.
The Tiger Poacher’s Problem:
As noted earlier, organised crime cartels control the trade in tiger parts while local
individuals poach tigers. There are assumed to be a large number of such potential
poachers, hence poaching is treated as an open access activity. The payoff function to the
representative poacher is given by:
Π =(s - θp Ωp)HT –wp Lp (1a)
2 Tigers that stray into agricultural lands and prey upon domestic livestock are often killed by farmers. While this issue is clearly important we do not consider such "nuisance" killing of tigers for two reasons. Firstly, such kills appear to be concentrated on animals that stray outside reserves, while our attention is mainly focused upon the condition of animals with home ranges within a reserve. However, the main reason we have neglected this problem is that in the absence of sufficient data there appears to be no obvious manner in which to parameterize the extent of nuisance killing in the simulations presented in Section V. This suggests that our results may underestimate the true impacts of tiger poaching.
where s is the poacher’s remuneration for each tiger killed, θp is the probability of a tiger
poacher being apprehended and convicted, Ωp is the penalty for poaching a tiger, HT is
the harvest of tigers, Lp is the effort expended on poaching and wp is the cost per unit of
effort.
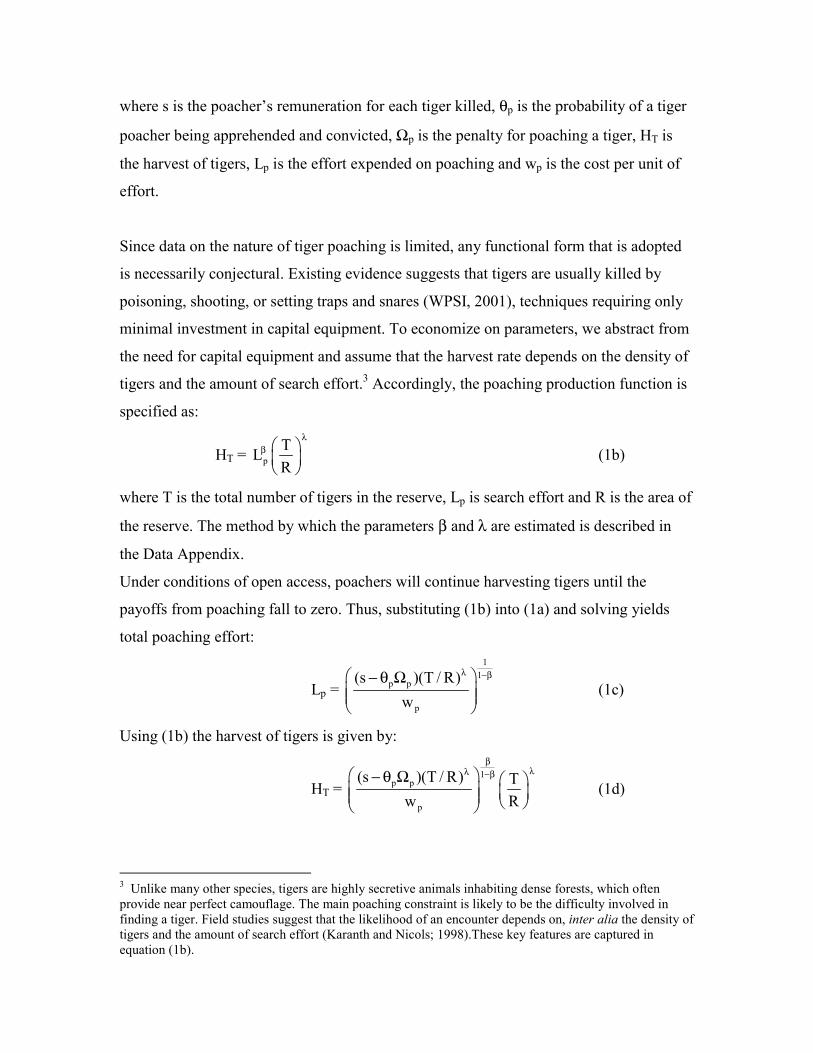
Since data on the nature of tiger poaching is limited, any functional form that is adopted
is necessarily conjectural. Existing evidence suggests that tigers are usually killed by
poisoning, shooting, or setting traps and snares (WPSI, 2001), techniques requiring only
minimal investment in capital equipment. To economize on parameters, we abstract from
the need for capital equipment and assume that the harvest rate depends on the density of
tigers and the amount of search effort.3 Accordingly, the poaching production function is
specified as:
HT = pTLR
λβ
(1b)
where T is the total number of tigers in the reserve, Lp is search effort and R is the area of
the reserve. The method by which the parameters β and λ are estimated is described in
the Data Appendix.
Under conditions of open access, poachers will continue harvesting tigers until the
payoffs from poaching fall to zero. Thus, substituting (1b) into (1a) and solving yields
total poaching effort:
Lp =
11
p p
p
(s )(T / R)w
λ −β − θ Ω
(1c)
Using (1b) the harvest of tigers is given by:
HT = 1
p p
p
(s )(T / R) Tw R
βλλ −β − θ Ω
(1d)
3 Unlike many other species, tigers are highly secretive animals inhabiting dense forests, which often provide near perfect camouflage. The main poaching constraint is likely to be the difficulty involved in finding a tiger. Field studies suggest that the likelihood of an encounter depends on, inter alia the density of tigers and the amount of search effort (Karanth and Nicols; 1998).These key features are captured in equation (1b).
Subsistence Farmers
As noted earlier, it is supposed that the reserve is surrounded by agricultural land. The
production and consumption units are households engaged in three kinds of activities:
agricultural production, off-farm work and hunting tiger prey. Income from agricultural
production and off-farm work is used to purchase food and other commodities.
Households hunt prey animals as a supplementary source of food and to protect crops
from damage.4 Since very little is known about the nature of poaching, we adopt
functional forms with parsimonious data requirements. There are assumed to be N
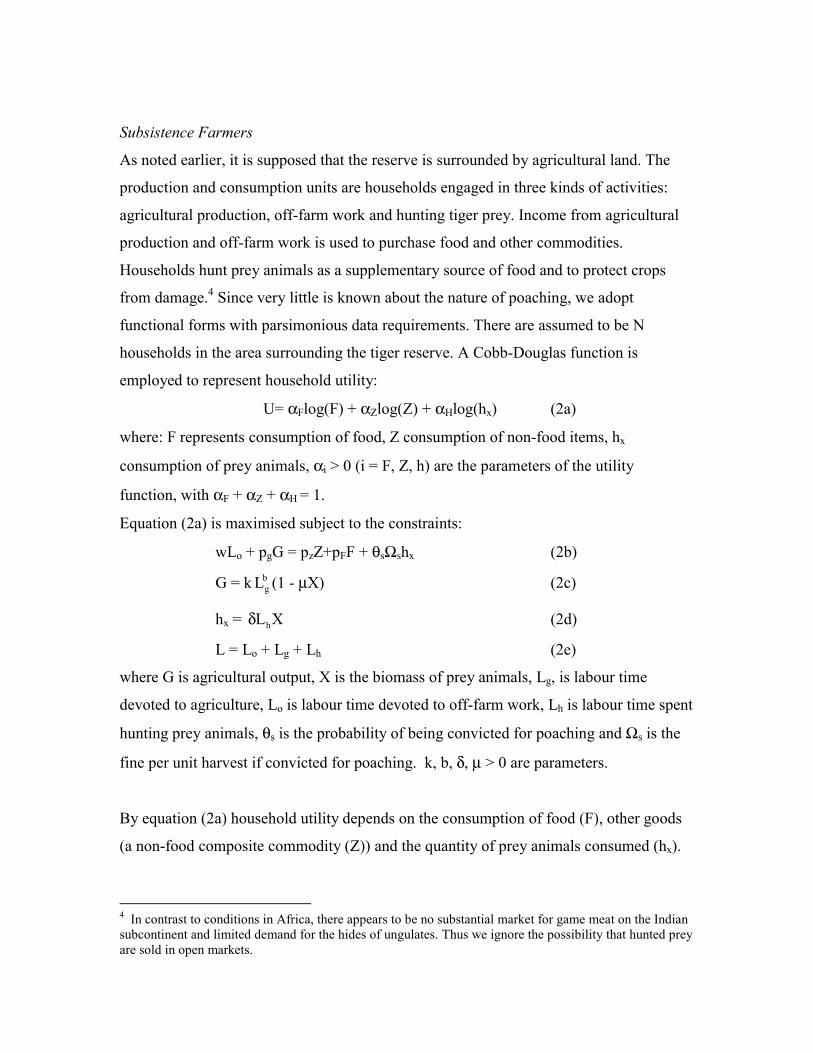
households in the area surrounding the tiger reserve. A Cobb-Douglas function is
employed to represent household utility:
U= αFlog(F) + αZlog(Z) + αHlog(hx) (2a)
where: F represents consumption of food, Z consumption of non-food items, hx
consumption of prey animals, αi > 0 (i = F, Z, h) are the parameters of the utility
function, with αF + αZ + αH = 1.
Equation (2a) is maximised subject to the constraints:
wLo + pgG = pzZ+pFF + θsΩshx (2b)
G = k bgL (1 - µX) (2c)
hx = hL Xδ (2d)
L = Lo + Lg + Lh (2e)
where G is agricultural output, X is the biomass of prey animals, Lg, is labour time
devoted to agriculture, Lo is labour time devoted to off-farm work, Lh is labour time spent
hunting prey animals, θs is the probability of being convicted for poaching and Ωs is the
fine per unit harvest if convicted for poaching. k, b, δ, µ > 0 are parameters.
By equation (2a) household utility depends on the consumption of food (F), other goods
(a non-food composite commodity (Z)) and the quantity of prey animals consumed (hx).
4 In contrast to conditions in Africa, there appears to be no substantial market for game meat on the Indian subcontinent and limited demand for the hides of ungulates. Thus we ignore the possibility that hunted prey are sold in open markets.
Equation (2b) is the household budget constraint. Food and other goods are purchased at
given prices pz and pF respectively. These purchases are financed by: (i) the sale of
agricultural produce (G) which is sold at a price pg and (ii) off farm labour (Lo) which is
remunerated at a wage rate of w (equation (2b)). Finally, since poaching is illegal, the
household may incur an expected penalty θsΩshx; where θs is the probability of detection
and conviction, Ωs is the fine per prey animal poached.
Equation (2c) describes the agricultural production function. Following empirical studies
on subsistence farming in India, agricultural production (G) is assumed to depend upon
labour inputs (Lg), where b is the elasticity and k a constant (Deninger and Biswanger,
1998, Saha, 1994). The production function also takes into account the damage to crops
by grazing and trampling wild prey. This is given by µX, where X is the biomass of prey
animals and µ is the damage coefficient.
Equation (2d) describes the prey harvest production function. In the absence of data on
poaching of ungulate-prey in tiger habitats, we adopt a functional form that has been used
in African studies of ungulate hunting (Bulte and van Kooten, 2000). Thus, the harvest of
herbivores (hx) is a function of labour inputs (Lh) and the population of ungulate prey (X),
with unit elasticities with respect to labour inputs and prey populations.
Equation (2e) is the time allocation constraint which requires that labour time devoted to
off-farm work (Lo), agriculture (Lg), and hunting (LH) must equal the fixed endowment of
time (L) available to the household. Leisure is not included as a choice variable as
household survey data in potential tiger habitats in Nepal suggest that opportunities for
consumption of leisure are limited in such poor rural households (Bluffstone, 1995;
Cooke, 1998).5
5 Note also that since the analysis focuses on subsistence households with limited incomes, we ignore the possibility that households may hire labour. In the absence of adequate data, we also ignore several components of agricultural household behaviour including: production and use of livestock (which may be preyed upon by tigers); different types of farm output; consumption of part of the farm output and the use of other non-labour inputs (eg. fertilizers).
The utility maximisation problem is based on the notion that households take the time
path of exogenous variables, such as the stock of herbivores (X), as given. This reflects
the fact that there are assumed to be many such households who have no property rights
in wild animals. Hence, they have little incentive to take account of the future
consequences of their current actions. Formally, this implies that households solve a
static optimisation problem. Thus, for brevity, time notation is suppressed in the above
equations.6
Of particular interest in this context is the solution for hunting prey animals . Solving the
utility maximisation problem in equations (2a) – (2e), yields the following solutions for
the allocation of prey hunting effort in each household:
( ( ) )( )
H g gx
s s
w L L P Gh
w Xα
θ− +
=+ Ω
(3a)
where 1/( 1)
(1 )
−
= −
b
gg
wLbp k Xµ
(3b)
Substituting (3a) and (3b) in (2d) and aggregating over the N households, gives the total
level of hunting:
=x xH N h Xδ (3c)
Observe that since the hunted animals are consumed rather than sold, the price of hunting
is determined by the opportunity cost of time, which is defined by the wage rate. Hence,
an increase in the wage rate has conflicting income and substitution effects on hunting
levels (ie, ∂Hx/∂w > (<) 0) and the eventual impact of higher wages depends on the
relative parameters of the model. On the other hand, an increase in the price of
agricultural goods, unambiguously increases hunting levels (∂Hx/∂pg > 0). Intuitively, as
agricultural production becomes more profitable, this increases the incentive to protect
crops from damage by wild animals. Similarly, as expected, a reduction in the expected
6 It is perhaps worth noting paranthetically that such myopic behaviour has also been observed on communally held tribal lands where users own property rights to forest resources (Karanth and Madhusudan, 1997)
fine (θsΩs), or an increase in the level of crop damage (µ), both lead to higher levels of
prey poaching (ie, ∂Hx/∂(θsΩs) < 0, ∂Hx/∂µ > 0).
Having described the factors determining the poaching of tigers and their prey, we now
outline a model of tiger biology.
IV. Tiger Biology
The use of a single equation to model population dynamics is often considered
inappropriate for large predators that exhibit complex patterns of behaviour and face
different mortality rates over various stages in their life cycle (eg, see Burgman et al
1993). Accordingly, the existing literature describes tiger population dynamics using
stage based stochastic models. In this paper, we follow this convention and extend the
most recent model of tiger demography by Karanth and Stith (1999) to incorporate
predator-prey interactions.
The Karanth-Stith model identifies tigers of both sexes, in four distinct demographic
stages: cubs (younger than one year), juveniles (one to two years), transients (tigers older
than two years in search of a home range) and adults (breeding tigers with a home range).
In the absence of human pressures, mortality rates at each stage of the life cycle depend
on intrinsic survival rates, which incorporate deaths from natural factors such as disease
and intraspecific competition. For expositional ease, we begin by describing the dynamics
of tiger populations when prey are plentiful and there is no poaching.
The number of cubs that survive in any year is determined by the birth rate of breeding
females and the survival rate of cubs:
c c aft 1 tT bT+ = σ (4a)
where subscripts denote time periods: ct 1T + is the number of surviving cubs in period t+1;
σc is the survival rate of cubs; b is the birth rate per breeding adult female; and aftT is the
number of breeding adult females. Following Karanth and Stith (1999), we assume an
equal sex ratio at birth and mean litter size of three. The birth rate is treated as a Poison
variable to capture demographic stochasticity.
The surviving cubs move to the juvenile stage in the following period. The number of
juveniles who survive is:
js js cst 1 tT T+ = σ (s= m, f) (4b)
where jst 1T + is the number of surviving juvenile males (m) and females (f) in period t+1,
σjs (s = m,f) is the intrinsic survival rate of juvenile males (m) and females (f).
At two years, the surviving juveniles become transients. Transients are defined as adult
tigers in search of home territories in which to hunt and breed. If a vacant home range is
available, a transient immediately occupies the territory and is classified as a breeding
adult. Let Ks (s =m, f) denote the maximum number of territories available for adults of
gender s = m, f. Let astT be the number of surviving adults of gender s = m, f with
existing home ranges. Then the number of vacant territories available for the transients to
occupy is given by:
s s ast 1 tV Max(0,K T )+ = − (s=m,f) (4c)
The number of transients in period (t+1) is defined by: (i) the number of transients who
survive from the previous period, (ii) juveniles who progress to the transient stage, (iii)
minus the transients who find home ranges and thus exit to the breeding adult stage:
s s js js s st 1 t 1 t t 1T ( T T ) Vτ τ τ+ − += σ σ + − (s = m,f) (4d)
where st 1Tτ+ is the number of surviving transients in period t+1, στs is the survival rate of
transients of gender s = m, f.
Finally, the number of breeding adults is given by the existing number of surviving adults
and the new recruits to the category of breeding adult:
as as as st 1 t t 1T ( T V )+ += σ + (4e)
where σas is the survival rate of adults of gender s = m, f. The total population of non-cub
tigers is defined to include the sum of juveniles, transients and adults, of both sexes.
The model thus far assumes that prey are plentiful. The only constraints on population
growth are the intrinsic survival rates and the amount of territory available to establish
home ranges (ie, Ks). If prey depletion lowers tiger-hunting success rates, it will lead to
greater mortality. We therefore extend the model to take account of the impact of prey
availability on tiger population growth.
Data on the intrinsic growth rates of individual prey species and the effects of browse and
forage competition between species in tiger habitats is unavailable. Hence we adopt a
simple approach and model the combined biomass of all prey species using a logistic
equation of the form:
Xt+1 - Xt = Xtr(1 - Xt/ X ) – Hxt - Ψt (5)
where Xt is the prey biomass at time t, r is the intrinsic growth rate, X is the prey
carrying capacity of the forest, Hxt is the human harvest of the prey biomass defined in
equation (3c) and Ψt is the harvest of the prey by tigers which is described below.
Field studies suggest that on average a tiger requires approximately 3,000 kg of prey per
year to survive (Karanth, 1988). We therefore define the minimum food intake of a tiger
as M = 3,000kg. Field observations also reveal that tigers succeed in capturing between
10 per cent - 20 per cent of the available prey biomass in their home ranges (Schaller,
1967; Sunquist, 1981; Johnsingh, 1983). In the presence of competing predators such as
wild dogs (Cuon alpinus) and leopards (Panthera pardus) in these habitats, a predation
rate of 10 per cent is deemed more appropriate (Karanth, 1988)). Thus, the predation rate
is defined as ρ = 0.10. It follows that the maximum number of tigers that can be sustained
with a prey base of Xt is: ρXt/M. Accordingly, the prey biomass consumed by tigers is
given by:
Ψt = MTt if ρXt > MTt (6a)
Ψt = ρXt otherwise
where Tt is the total number of tigers in period t, M is the minimum food intake and ρ is
the predation rate.
Thus, when prey are plentiful (ie, ρXt > MTt), each tiger is able to meet its nutritional
needs and successfully captures M kg of prey per annum, hence Ψt = MTt. On the other
hand, if there is insufficient prey to meet the needs of the total population, the level of
predation is at its maximum level Ψt= ρXt.
A shortage of prey could have two effects on tiger survival prospects. First, prey
depletion is likely to depress survival rates across all demographic stages. Second, a
shortage of prey may also lower the carrying capacity of the habitat and thus lead to an
expansion in the home ranges of breeding adults. In the absence of data on the effects of
prey depletion across demographic groups, we follow Karanth and Stith and assume that
prey depletion effects: (i) only the carrying capacity of the habitat and (ii) the survival
rates of cubs. Thus, under conditions of prey depletion the survival rates of cubs and the
carrying capacity are depressed by a prey depletion factor which is defined as:
t t
t 1 tt t
t
1 if X MT 0X if X MT 0
MT+
ρ − ≥δ = ρ ρ − <
(6b)
It is acknowledged that the neglect of prey depletion effects on the survival rates across
other demographic categories is unsatisfactory. This approach can therefore be expected
to underestimate the true impact of prey depletion if survival rates are depressed more
generally across all demographic stages. However, refinements of the model must await
further research on this issue.
Turning next to the effects of poaching. Poachers target juveniles, transients and adults.
The number of tigers killed at each stage is assumed to be proportional to the existing
distribution of tigers across the various demographic stages. Thus, define κis as the
proportion of male or female tigers at stage i (i = j, τ, a). Then the number of tigers
poached at stage i (i = j, τ, a) is defined as:
is isHt 1 TtT H+ = κ (6c)
where HTt is the total harvest of tigers as determined in equation (1d), is
is t
t
TT
κ =
is the
proportion of tigers at stage i (i = j, τ, a), istT = number of tigers at stage i and Tt is the
total population of tigers. The number of tigers at each stage is thus lowered by the
amount defined in equation (6c).
V. Simulation Results
We now combine the economic models of behaviour (equations (1d) and (3c)) and tiger
population growth (equations (4a) - (6c)) to determine the time paths of tiger stocks under
alternative scenarios. For given parameters, the level of poaching emerges from the
optimising decisions of farmers and poachers. This in turn effects tiger stock levels.
Model parameters are varied to determine the sensitivity of tiger population levels to
changes in economic circumstances. The parameters for the basic tiger population model
(equations (4a) – (4e)) are from Karanth and Stith (1999), and are based on field research
in India and Nepal. Behavioral data for subsistence farmers and poachers are drawn from
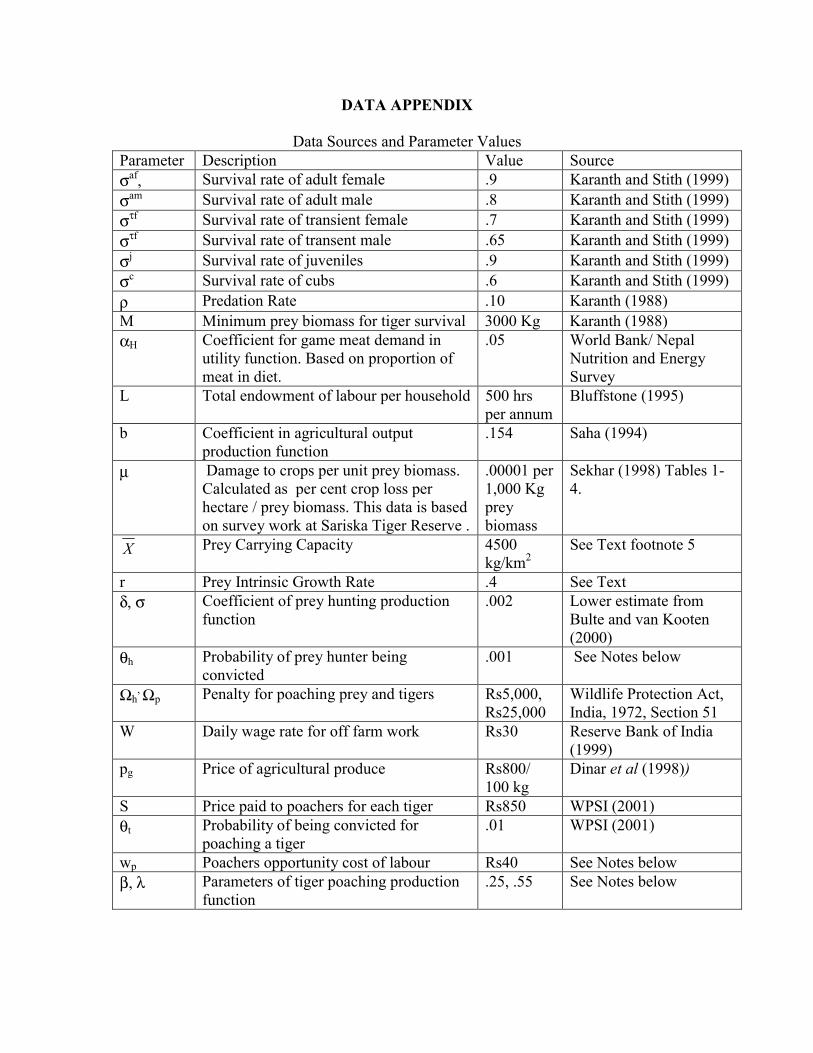
a variety of sources. The Appendix details the sources of information, assumptions,
estimation methods and parameter values.
The benchmark simulation draws on parameter estimates based on the best available data
for those regions with reasonably healthy tiger populations (eg, Kanha and Bandipur
Tiger Reserves in India). The habitat is assumed to comprise an area of approximately
1,000 km2 with a prey carrying capacity of 4,500kg/km2.7 It is supposed that when prey
are plentiful (ρXt > MTt), the undisturbed habitat can sustain Kf = 24 breeding adult
females and Km = 12 adult males (Karanth and Stith, 1999; Kenney et al, 1995). In the
base case, poachers are assumed to receive Rs 850 for each tiger killed, face a fine of Rs
25,000 and a 1 per cent probability of conviction (WPSI, 2001, Wildlife Protection Act,
India, 1975).8
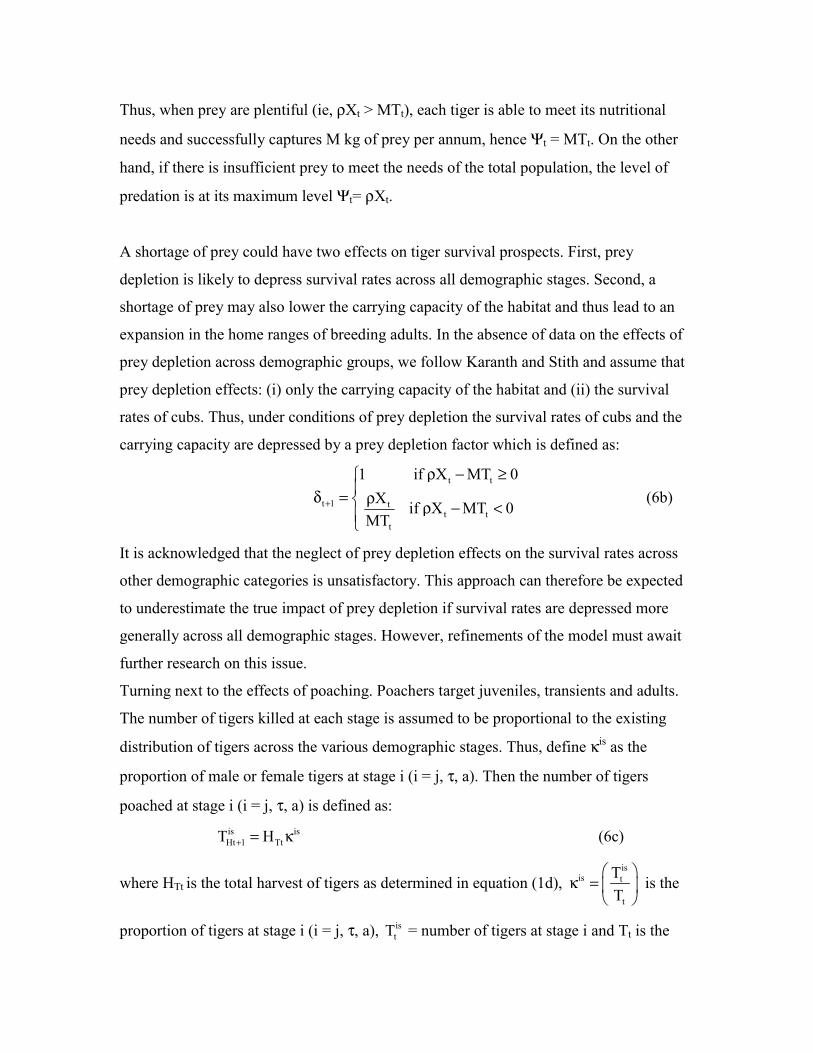
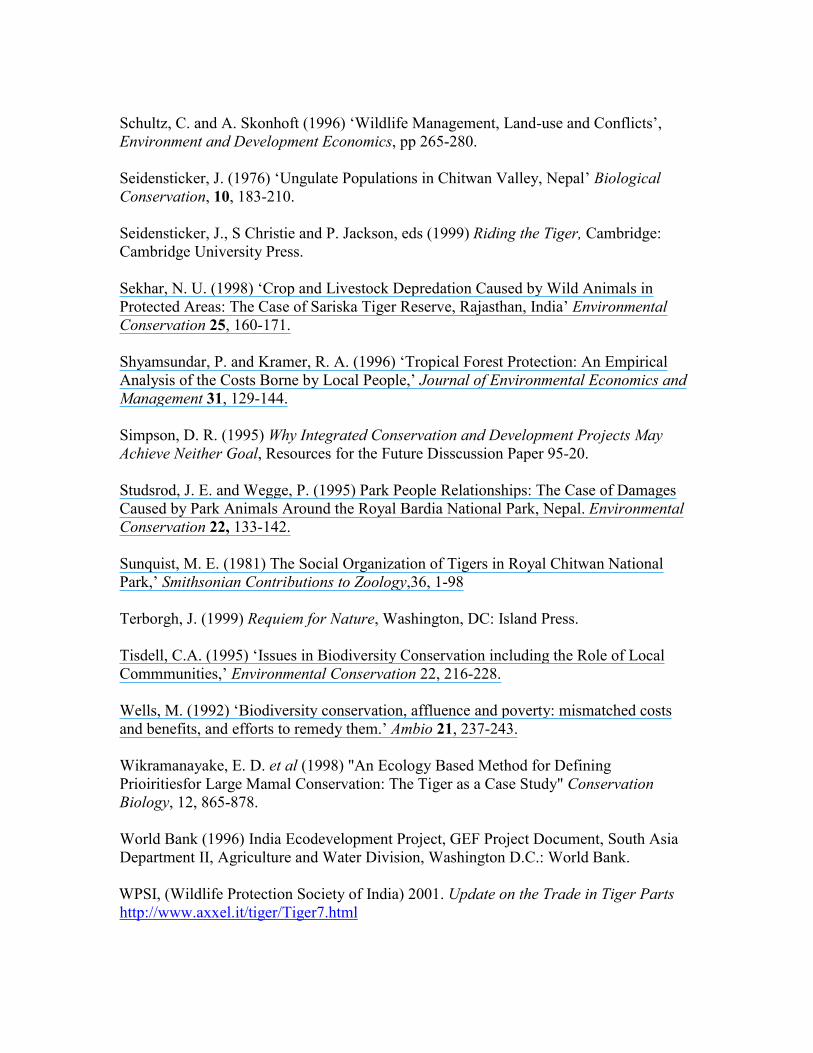
Curve A in Figure 1 shows the tiger population trajectory in the absence of tiger poaching
and prey depletion. The population achieves a stable equilibrium at 87 adult and juvenile
7 The estimates of prey biomass in prime areas with tiger densities of between 10-12 per 100km2 is derived from data in Karanth and Nicols (2000). It is useful to note that this estimate is also consistent with earlier studies conducted using less advanced techniques. For instance Johnsingh (1983) estimates a prey density of 3,382 kg/km2 in Bandipur reserve and a predation rate of 30 per cent, suggesting a possible carrying capacity of 3,382(1+30 per cent) = 4,397 kg/km2.
tigers, suggesting a density of 9 tigers/100 km2. This outcome approximates population
levels in the fragmented, yet relatively healthy habitats found in India and Nepal. Curve
B simulates the effects of tiger poaching when the parameters are at the base case levels.
The population declines to a stable 62 adult and juvenile tigers, with poachers harvesting
6 animals per year (approximately 10 per cent of the population). Curve C simulates the
effects of a 10 per cent increase in the price per tiger killed (Rs 925). The population
declines moderately and stabilises at 58 tigers, with 7 tigers harvested each year
(approximately 12 per cent of the population).
The simulation presented in Curve D shows the effects of a 20 per cent increase in the
price paid to poachers for a tiger body. When the price is increased to Rs 1,020, the
population collapses within 50 years. This result is consistent with Karanth and Stith's
(1999) simulations and related evidence that hunting of large felids can lead to sudden
extinction when it exceeds a certain threshold level (Martin and de Meulanaer, 1988;
Bailey, 1993). More significantly, this finding suggests that a relatively small increase in
the payoffs to poaching (from Rs 925 to Rs 1,020) can drive a stable population to
extinction in a relatively short time period. The impact of poaching may thus be
discontinuous and prone to induce collapses in population. This appears to be an example
of the unstable equilibria frequently encountered in discrete time predator-prey models,
when the predator population is at low levels (May, 1978, Freedman, 1979).
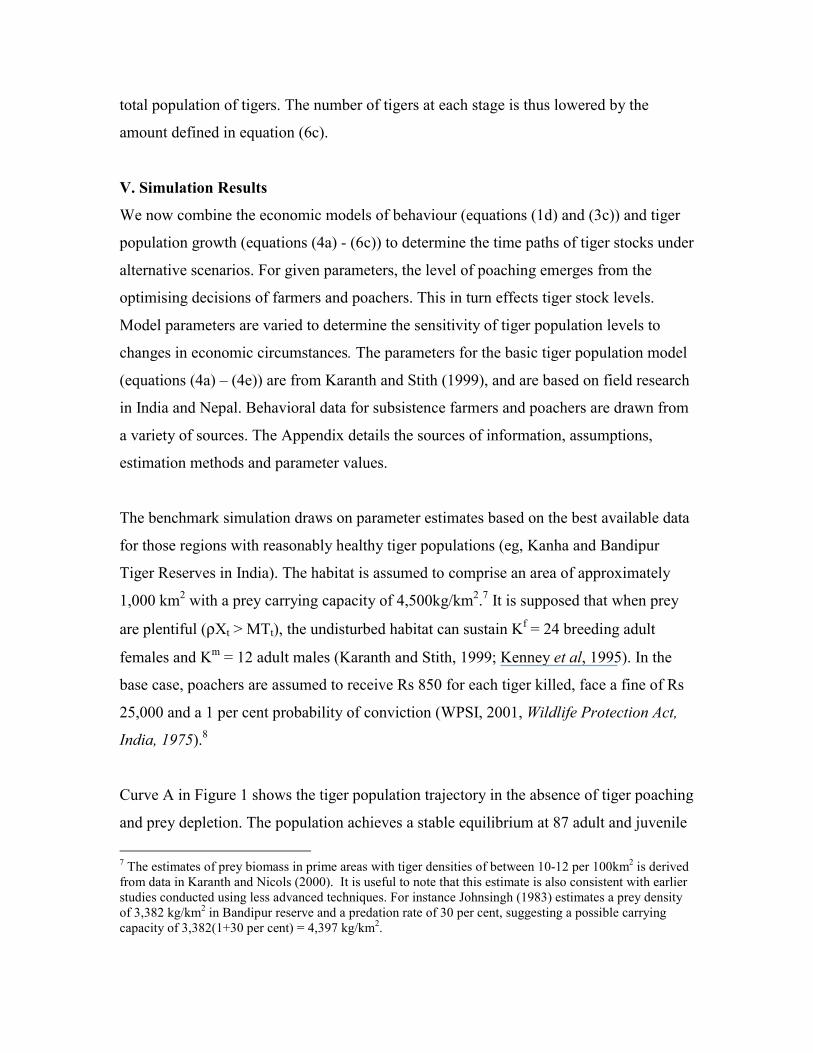
Figure 2 presents the wild tiger population trajectories when the poaching parameters are
held at levels in the basic model and farmers hunt tiger prey. Curve A shows a stable
population of 62 tigers when the farm population is 450 households; the off-farm wage is
Rs 30 per day; and the price for agricultural produce at Rs 8.5/kg. When the number of
farm households are increased by 25 per cent (from 450 to 563) and off-farm wage and
agricultural production prices are held at base levels, tiger are extinct in less than 50 years
(Curve B). Higher human populations increase the demand for ungulates as a
supplementary food source and magnify crop damage level as more land is converted to
8 The assumption of a 1 per cent conviction rate is a clear overestimate of the true conviction probabilities, our base case results thus underestimate the most likely consequence of poaching (WPSI 2001).
agriculture. Greater hunting leads to a shrinking prey base and hence a decline in the tiger
population. The model simulations further highlight how sensitive tiger populations are to
agricultural income. Even when the number of farm households are reduced to 500, if
agricultural prices are increased by 20 percent, tiger populations are eliminated in less
than 30 years (Curve C).
On the other hand a 20 per cent decline in agricultural prices (pg = Rs 640) leads to
recovery of the population.9 The lower payoff from agricultural production reduces the
monetary value of prey-induced crop damage and thus incentives to hunt decline. This
result highlights the impact of direct and indirect agricultural subsidies on the
environment. More significantly, the responsiveness of prey depletion to agricultural
prices, suggests that the withdrawal of agricultural subsidies may generate rapid and
substantial improvements in habitat quality. We also considered the effects of a 100 per
cent increase in the fine for hunting as well as a 100 per cent increase in the probability of
conviction: neither had an impact on tiger populations.
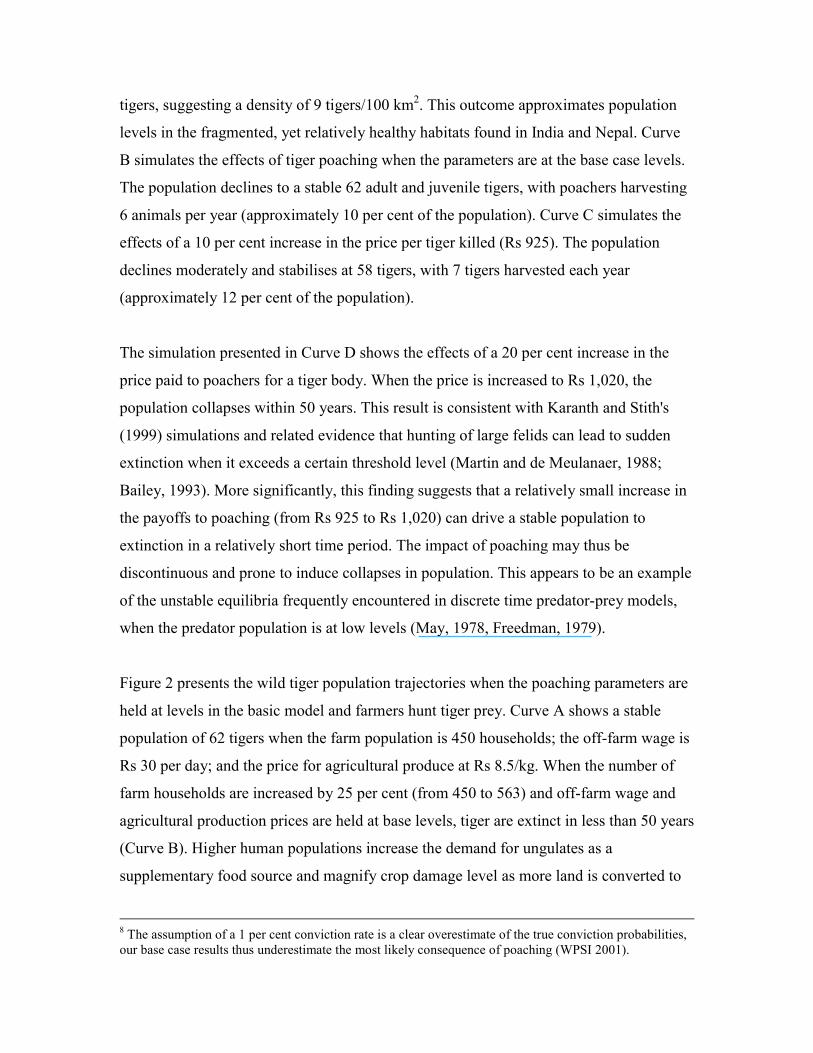
Figure 3 presents simulations for the combined effects of a high return to poaching (s=
Rs1,020), a moderately higher farm household population of 500, with all other
parameters held at base levels. In this case the tiger population becomes extinct within 40
years (Curve A). If the probability of convicting poachers is then increased by 50 per
cent, the population lasts another decade, declining to zero in just less than 50 years
(Curve B). However, in Curve C the higher return to poaching and increase in the number
of farm households are offset when poaching costs increase by 30 per cent (wp = Rs 52).
Curve C displays a tiger population reaching 60 animals within a decade.
We considered numerous other scenarios for the case with high returns to poaching (s=
Rs1,020) and a moderately higher farm household population of 500. Notable amongst
these were the findings that either a 50 per cent increase in the probability of hunters
being convicted or a 50 per cent decline in agricultural prices had no impact on the
eventual outcome – both leading to extinction within 40 years.
9 The simulation almost coincides with Curve A and is therefore not shown.
These results may have important policy implications. When prey depletion lowers
growth rates, recovery of the population appears to necessitate controls over the level of
poaching. Our results indicate that anti-poaching policies should be directed at increasing
the opportunity costs of poaching activities. In practical terms, this might involve more
frequent and intensive patrols and other related policies that require greater avoidance by
poachers, thus rendering poaching more difficult, which would increase the opportunity
costs of poaching. The provision of alternative sources of employment would also
increase the opportunity costs of poaching, so long as it does not induce further migration
into the area.
This outcome is also suggestive of the reasons why tigers thrive in some prey abundant
regions and not in others. In areas where the opportunity cost of poaching is high, due to
either effective patrols (eg, Kanha, Bandhavgar, Nagarahole), or difficult terrain
(Sunderbans), tigers have survived in reasonable numbers. In more accessible regions, no
tigers are to be found, despite the existence of suitable habitats (Wikramanayake et al,
1998).
VI. Conclusions
This paper extends the existing biological literature on tiger populations by linking a
stochastic demographic model of tiger population with household behaviour that
endogenises two key threats to tiger populations: poaching tigers and poaching their prey.
Alternative scenarios simulate the impact of the number of households, agricultural
income, wage income, and poaching intensity of tigers and their prey. The results
highlight the sensitivity, fragility, and instability of tiger populations to these key
economic parameters. Most notable is the finding that the level of human population is
the most potent threat to the tiger’s prey base and that the effects of large population
conurbations are difficult to reverse with the economic instruments considered in this
paper.
The sensitivity of the tiger population to poaching incentives is a second important
concern. Tiger populations appear to exhibit threshold responses to increases in prey-
poaching intensity. When prey levels are depleted, a relatively small increase in the
payoffs to poaching may trigger extinction. Thus, the control of poaching in prey-
depleted environments remains a matter of critical concern. This result suggests the need
for more intensive policing and prosecution. In practice, this may be difficult to achieve,
for it would require major institutional and judicial reform accompanied by substantial
investment in the judiciary.
The modelling results suggest that an alternative and potentially more effective way to
reduce poaching is to increase the opportunity cost of poaching: a relatively small
increase in the opportunity cost of poaching is sufficient. Policies such as the provision of
alternative employment and off-farm income, accompanied by controls on forest access,
would have the desired effect of reducing the incidence of poaching.
The modelling results also raise questions about conservation efforts and forest
management strategies that emphasise forest resource use of any kind in and around tiger
habitats, including JFM. Alternative rural development strategies are needed that promote
off-farm employment, non-forest dependent commercial activities and eliminate private
and public infrastructure investments in, around or near tiger habitats. A formidable, yet
urgently needed task given that about two-thirds of India’s total forest cover is in the
tribal districts, and the incidence of poverty among the tribal people is more than 50
percent (Kumar et al, 2000).
It should be emphasised that these results are tentative, not definitive. Lack of data and
information on key economic and biological factors means that the model’s parameters
are based on imprecise estimates. To guard against exaggerating the threat of extinction
we adopted conservative assumptions. For instance, the probability of convicting
poachers is assumed to be considerably higher than the available data suggests. Similarly,
we use the upper bound of estimates for ungulate intrinsic growth rate and the lower
bound of estimates for the returns to agriculture. Moreover, while prey depletion can be
expected to effect survival prospects across all age classes, the model conservatively
assumes that it has no impact on juvenile or transient tigers, but only depresses cub
survival rates and the adult carrying capacity.
Finally it is important to note that this paper ignores a number of other important threats
to the tiger. Key amongst these is the unrelenting erosion of habitats and forest corridors
connecting tiger reserves. Many tiger reserves are threatened with plans for major
development projects including mines, roads and dams (World Bank, 1996). The reserves
face further pressures from the steady extraction of resources for timber, fuelwood,
fodder and livestock grazing, all of which are factors closely linked to human population
growth. Thus, the effects of habitat erosion remains an area in need of urgent research.
DATA APPENDIX
Data Sources and Parameter Values Parameter Description Value Source σaf, Survival rate of adult female .9 Karanth and Stith (1999) σam Survival rate of adult male .8 Karanth and Stith (1999) στf Survival rate of transient female .7 Karanth and Stith (1999) στf Survival rate of transent male .65 Karanth and Stith (1999) σj Survival rate of juveniles .9 Karanth and Stith (1999) σc Survival rate of cubs .6 Karanth and Stith (1999) ρ Predation Rate .10 Karanth (1988) M Minimum prey biomass for tiger survival 3000 Kg Karanth (1988) αH Coefficient for game meat demand in
utility function. Based on proportion of meat in diet.
.05 World Bank/ Nepal Nutrition and Energy Survey
L Total endowment of labour per household 500 hrs per annum
Bluffstone (1995)
b Coefficient in agricultural output production function
.154 Saha (1994)
µ Damage to crops per unit prey biomass. Calculated as per cent crop loss per hectare / prey biomass. This data is based on survey work at Sariska Tiger Reserve .
.00001 per 1,000 Kg prey biomass
Sekhar (1998) Tables 1-4.
X Prey Carrying Capacity 4500 kg/km2
See Text footnote 5
r Prey Intrinsic Growth Rate .4 See Text δ, σ Coefficient of prey hunting production
function .002 Lower estimate from
Bulte and van Kooten (2000)
θh Probability of prey hunter being convicted
.001 See Notes below
Ωh, Ωp Penalty for poaching prey and tigers Rs5,000,
Rs25,000 Wildlife Protection Act, India, 1972, Section 51
W Daily wage rate for off farm work Rs30 Reserve Bank of India (1999)
pg Price of agricultural produce Rs800/ 100 kg
Dinar et al (1998))
S Price paid to poachers for each tiger Rs850 WPSI (2001) θt Probability of being convicted for
poaching a tiger .01 WPSI (2001)
wp Poachers opportunity cost of labour Rs40 See Notes below β, λ Parameters of tiger poaching production
function .25, .55 See Notes below
Notes 1. Coefficients for the poaching production functions: There are no studies on, nor is there data available on tiger poaching. We therefore seek to infer poaching production parameters using indirect proxies. One of the more sophisticated methods used to estimate tiger densities relies on a technique known as “camera capture”. Cameras are positioned to enclose a given quadrant or transect within which all passing animals are photographed. The calculated population is based on the assumption that the number of tigers photographed depends on the (unknown) density and the level of effort (ie, number of nights the cameras are used). Many of the poaching techniques are “passive” and involve laying a snare or trap in areas where tigers are thought to reside. In the absence of any other information we assume that that the main constraint on poaching is the difficulty involved in finding a tiger. It is supposed that the likelihood of a tiger being caught in a snare or trap is analogous to that of capturing a tiger with a camera in the area being sampled. Thus the probability of poaching is assumed to depend on the density of tigers and the number of days that a trap has been laid. We use information from the camera capture studies to proxy the poaching technology parameters. Using data from 5 available studies in (Nagarahole (Karanth, 1995), Nagarahole, Pench, Kanha, Kaziranga (Karanth and Nichols, 2000)), we regress the number of tigers captured by cameras against camera effort and tiger density to obtain the coefficients of the poaching production function: HT = .55 log(Effort) + .25 log (Density) (R2 = .93, F = 44.5, SE of regression =.209) The parameters for poaching effort and density effects are based on these regression estimates. It is acknowledged that these estimates are at best only broadly indicative and likely to be biased. Moreover, it is difficult to determine the direction of the bias. If bait is more (less) efficient at capturing tigers than cameras, we will have underestimated (overestimated) the coefficient on effort and also biased the estimate of density. This is, however, the best available information. The parameters used for the probability of detecting and convicting poachers are arbitrary. The Wildlife Trust of India (www. Wildlifetrustofindia.org) has recorded only two convictions for tiger poaching which suggests that the rate of conviction for poaching tigers may be lower than .01 (WPSI 2001). It is likely that the parameters used in this paper substantially overestimate the true probability of conviction. There is no published data on the conviction rates for poaching prey animals, though it is deemed to be lower than that for tiger poaching (Wildlife Trust of India, pers. comm.). 2. Off farm wages and the Opportunity Cost of Poaching Average rural wages in India vary from Rs 40 per day in some states (eg Haryana which has no tiger reserve) to Rs 22 in other states (eg Assam and Madhya Pradesh with tiger populations) (Reserve Bank of India, 1999)). We take the midpoint of this range and assume that the off-farm wage rate is Rs 30 and that the opportunity cost of poaching may be somewhat higher at Rs 40. This is likely to be an overestimate of the true opportunity cost of poor forest dwellers.

3. The Prey Intrinsic growth rate
Field data obtained by Karanth at Nagarahole suggests the following intrinsic growth rates for the major prey species: chital (Axis axis) 32 per cent, gaur (Bos gaurus) 43 per cent, wild pig (Sus scrofa) 150 per cent. The aggregate prey growth rate weighted by estimated prey densities (see Karanth and Nicols, 2000) yields an intrinsic growth rate of approximately r= 0.4.
References
Bailey, T. N. (1995) The African Leopard New York, Columbia University Press. Barbier, E.B. (1992) ‘Community-Based Development in Africa’, in Barbier and Swanson, eds., Economics for the Wilds, Washington D C: Island Press. Barrett, C. B. and P. Arcese (1995) ‘Are Integrated Conservation Development Projects Sustainagble? On The Coneservation of Large Mammals in Sub-Saharan Africa,’ World Development, 23(7) 1073-84. Barrett, C. B. and P. Arcese (1998) ‘Wildlife Harvesting in Integrated Conservation and Development Projects: Linkinh Harvest to Household Demand, Agricultural Production and Environmental Shocks in the Serengeti’ Land Economics 74, 449-465. Bluffstone, R. A. (1995) ‘The Effect of Labor Market Performance on Deforestation in Developing Countries under Open Access: An Example from Rural Nepal’ Journal of Environmental Economics and Management, 29: 42-63. Bulte, E. and van Kooten (2000) " : African Wildlife Policy: Protecting Wildlife Herbivores on Private Game Ranches" European-Review-of-Agricultural-Economics; 27(2), 227-44.. Burgman, M. A., S. Ferson and H. R, Akcakaya (1993) Risk Assessment in Conservation Biology, Chapman Hall: London. Deininger, K. and H. Binswanger (1998) The Evolution of the World Bank's Land Policy, Washington D.C.: World Bank. Dinar, A, R. Mendelsohn, R. Ericson, J. Parikh, A Sanghi, K. Kumar (1998) Measuring the Impact of Climate Change on Indian Agriculture, World Bank Technical Paper 402. Eisenberg, J. F. and J. Seidensticker (1976) ‘Ungulates in South Asia: A Consideration of Biomass for Selected Habitats’ Biological Conservation, 10: 294-304. Freedman, H. I. (1979) Deterministic Mathematical Models in Population Ecology, Marcel Dekker Inc, New York. Ghimire, K. B. (1994) ‘Parks; and People: Livelihood Issues in National Parks Manggement In Thailand And Madagascar’. Development and Change 25, 195-229. Gunatilake H. M. and U. Chakravorty (2000) ‘Forest Resource Extraction by Local Communities: A Comparative Dynamic Analysis.’ Nota Di Lavoro 41.2000, Milano: Fondazione Eni Enrico Mattei.
Gunatilake, H. M. (1994) ‘An Economic Impact Assessment of the Proposed Conservation Programme on Peripheral Communities of the Knuckles National Wilderness Area of Sri Lanka,’ Journal of Sustainable Forestry 2, 1-12. Gunatilake, H. M. (1998) ‘The Role fo Rural Development in Protecting Tropical Rainforests: Evidence from Sri Lanka’, Journal of Environmental Management 53, 273-292. IUCN ( 2000) 2000 IUCN Red List of Threatened Species IUCN ( 2001) Cat Specialist Group web page http://lynx.uio.no/catfolk/. Jackson, P. (1993) ‘The Status of the Tiger in 1993,’ Report to the CITES Animals Committee, August 1993. Reproduced in Cat News 19: 5-11. Bougy-Villars, Switzerland Johnsingh, A. J. T. (1983) ‘Large Mamallian Prey-Predators,’in Bandipur’ Journal of the Bombay Natural History Society, 80, 1-57. Karanth, K. U. 1988. Population structure, density and biomass of large herbivores in a south Indian tropical forest. M. S. thesis. University of Florida, Gainesville. Karanth K. U. 2001. Tigers. Colin Baxter Photography, Scotland, UK, pages 132. Karanth, K. U. and M. Sunquist (1995) ‘Prey Selection by Tiger, Leopard and Dhole in Tropical Forests,’ Journal of Animal Ecology, 64: 439-450. Karanth K. U. and Nichols J. D. 1998. ‘Estimating tiger densities in India from camera trap data using photographic captures and recaptures’,. Ecology 79 (8): 2852-2862. Karanth, K.U. and B. M. Stith (1999) ‘Prey Depletion as a Critical Determinant of Tiger Population Viability’. in J. Seidensticker, S Christie and P. Jackson eds, Riding the Tiger, Cambridge: Cambridge University Press. Karanth, K. and J. D. Nichols, 2000. Ecological Status and Conservation of Tigers in India. Final Report to Division of International Conservation. Washington DC: US Fish and Wildlife Service. Kenney, J. J., L.D. Smith, A.M. Starfield, and C.W. McDougal (1995) ‘The Long Term Effect of Tiger Poaching on Population Viability,’ Conservation Biology, 9, pp 1127-1133. Kothari, A, S. Suri, N. Singh (1995) “People and Protected Areas: Rethinking Conservation in India” Ecologist, 25, 188-194. Kumar, N. N. Saxena, Y. Alagh and K. Mitra (2000) India Alleviating Poverty through Forest Development, OED Evaluation Country Case Study Series, Washington D. C.: World Bank.
Lele, U., N. Kumar, S. Arif Husain, A. Zazueta, and L. Kelly (2000) The World Bank Forest Strategy: Striking the Right Balance, Washington D.C.:World Bank Madhusudan M. D. and Karanth K. U. 2000. Hunting for an answer: Local hunters and large mammal conservation in India. In J. G. Robinson and E. L. Bennett (editors), Hunting for sustainability in tropical forests. Columbia University Press (Pages 339-355), New York. Marks, S.A. (1984) The Imperial Lion: Human Dimensions of Wildlife Management in Africa, Boulder: Westview Press. Martin R. B. and de Meulanaer, T (1988) Survey Status of the Leopard (Panthera pardus) in Sub Saharan Africa, CITES, Laussane, Switzerland. May, R (1978) Stability and Complexity in Model Ecosystems, Princeton University Press, Princeton. Meachem, C. J. (1997) How the Tiger Lost its Stripes, Harcourt Brace &Company, New York. Mishra, C. (1997) ‘Livestck depredation by large carnivores in the Indian trans – Himalaya: Conflict Perceptions and Conservation Implications’, Environmental Conservation 24, 338-343. Nepal, S. K. and K. E. Weber (1995) ‘Managing resources and resolving conflicts: National Parks and Local People.’ International Journal of Sustainable Development and World Ecology 2, 11-25. Nowell, K., 2000. Far from a Cure: The Tiger Trade Revisted. Cambridge: Traffic Report Nowell, K. and P. Jackson (1996) Wild Cats, Status Survey and Conservation Action Plan, Cambridge: IUCN Publications Services Unit. Panayotou T. (1993) Green Markets The Economics of Sustainable Development, San Francisco: ICS Press. Reserve Bank of India (1999) Handbook of Statistics on the Indian Economy. Mumbai: Reserve Bank of India Saberwal, V. K. (1996) “Pastoral Politics”, Conservation Biology, 10, 741-749. Saha, A. (1994) ‘A two-season agricultural household model of output and price uncertainty’, Journal of Development Economics, Vol. 45, pp 245-269. Schaller, G. B. (1967) The Deer and the Tiger, Chicago: Chicago University Press.
Schultz, C. and A. Skonhoft (1996) ‘Wildlife Management, Land-use and Conflicts’, Environment and Development Economics, pp 265-280. Seidensticker, J. (1976) ‘Ungulate Populations in Chitwan Valley, Nepal’ Biological Conservation, 10, 183-210. Seidensticker, J., S Christie and P. Jackson, eds (1999) Riding the Tiger, Cambridge: Cambridge University Press. Sekhar, N. U. (1998) ‘Crop and Livestock Depredation Caused by Wild Animals in Protected Areas: The Case of Sariska Tiger Reserve, Rajasthan, India’ Environmental Conservation 25, 160-171. Shyamsundar, P. and Kramer, R. A. (1996) ‘Tropical Forest Protection: An Empirical Analysis of the Costs Borne by Local People,’ Journal of Environmental Economics and Management 31, 129-144. Simpson, D. R. (1995) Why Integrated Conservation and Development Projects May Achieve Neither Goal, Resources for the Future Disscussion Paper 95-20. Studsrod, J. E. and Wegge, P. (1995) Park People Relationships: The Case of Damages Caused by Park Animals Around the Royal Bardia National Park, Nepal. Environmental Conservation 22, 133-142. Sunquist, M. E. (1981) The Social Organization of Tigers in Royal Chitwan National Park,’ Smithsonian Contributions to Zoology,36, 1-98 Terborgh, J. (1999) Requiem for Nature, Washington, DC: Island Press. Tisdell, C.A. (1995) ‘Issues in Biodiversity Conservation including the Role of Local Commmunities,’ Environmental Conservation 22, 216-228. Wells, M. (1992) ‘Biodiversity conservation, affluence and poverty: mismatched costs and benefits, and efforts to remedy them.’ Ambio 21, 237-243. Wikramanayake, E. D. et al (1998) "An Ecology Based Method for Defining Prioiritiesfor Large Mamal Conservation: The Tiger as a Case Study" Conservation Biology, 12, 865-878. World Bank (1996) India Ecodevelopment Project, GEF Project Document, South Asia Department II, Agriculture and Water Division, Washington D.C.: World Bank. WPSI, (Wildlife Protection Society of India) 2001. Update on the Trade in Tiger Parts http://www.axxel.it/tiger/Tiger7.html
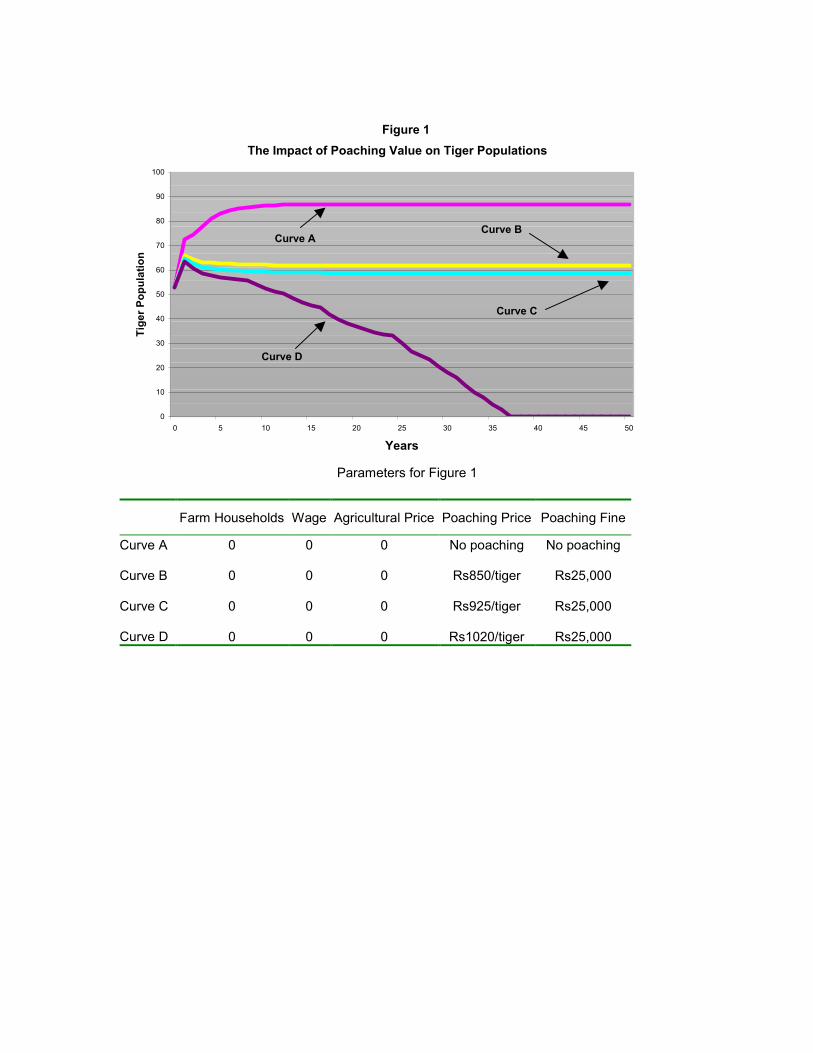
Figure 1
0
10
20
30
40
50
60
70
80
90
100
0 5 10 15 20 25 30 35 40 45 50
Years
Tige
r Pop
ulat
ion
Curve ACurve B
Curve C
Curve D
The Impact of Poaching Value on Tiger Populations
Parameters for Figure 1
Farm Households Wage Agricultural Price Poaching Price Poaching Fine
Curve A 0 0 0 No poaching No poaching Curve B 0 0 0 Rs850/tiger Rs25,000 Curve C 0 0 0 Rs925/tiger Rs25,000 Curve D 0 0 0 Rs1020/tiger Rs25,000
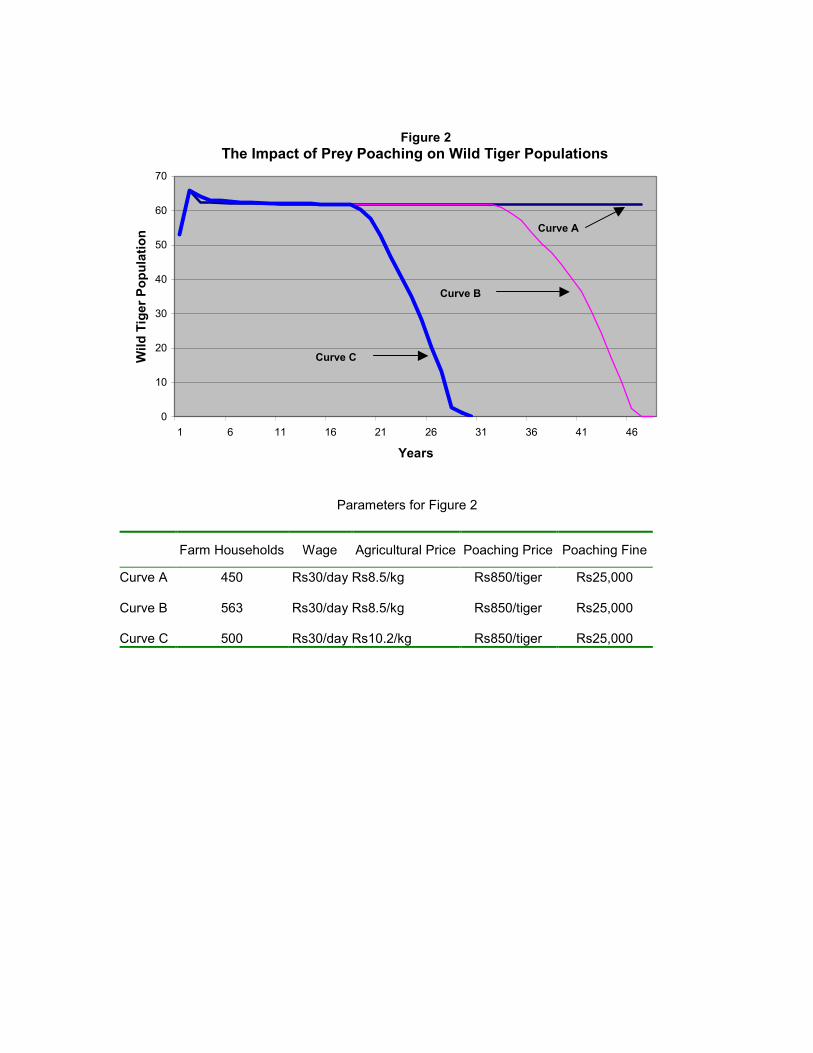
Figure 2
0
10
20
30
40
50
60
70
1 6 11 16 21 26 31 36 41 46
Years
Wild
Tig
er P
opul
atio
n
Curve C
Curve B
Curve A
The Impact of Prey Poaching on Wild Tiger Populations
Parameters for Figure 2
Farm Households Wage Agricultural Price Poaching Price Poaching Fine
Curve A 450 Rs30/day Rs8.5/kg Rs850/tiger Rs25,000 Curve B 563 Rs30/day Rs8.5/kg Rs850/tiger Rs25,000 Curve C 500 Rs30/day Rs10.2/kg Rs850/tiger Rs25,000
Figure 3
0
10
20
30
40
50
60
70
1 6 11 16 21 26 31 36 41 46 51Years
Wild
Tig
er P
opul
atio
n
The Impact of Human Population Levels and Poaching Value on Tiger Populations
Curve A Curve B
Curve C
Parameters for Figure 3
Farm Households Wage Agricultural
Price Poaching
Price Poaching
Fine
Probability Conviction
Poachers Opportunity
Cost
Curve A 500 Rs30/day Rs8/kg Rs1020r Rs25,000
0.01
Rs40
Curve B 500 Rs30/day Rs8/kg Rs1020r Rs25,000
0.02
Rs40
Curve C 500 Rs30/day Rs8/kg Rs1020 Rs25,000
0.01
Rs52

CIES DISCUSSION PAPER SERIES The CIES Discussion Paper series provides a means of circulating promptly papers of interest to the research and policy communities and written by staff and visitors associated with the Centre for International Economic Studies (CIES) at the Adelaide University. Its purpose is to stimulate discussion of issues of contemporary policy relevance among non-economists as well as economists. To that end the papers are non-technical in nature and more widely accessible than papers published in specialist academic journals and books. (Prior to April 1999 this was called the CIES Policy Discussion Paper series. Since then the former CIES Seminar Paper series has been merged with this series.) Copies of CIES Policy Discussion Papers may be downloaded from our Web site at http://www.adelaide.edu.au/cies/ or are available by contacting the Executive Assistant, CIES, School of Economics, Adelaide University, SA 5005 AUSTRALIA. Tel: (+61 8) 8303 5672, Fax: (+61 8) 8223 1460, Email: [email protected]. Single copies are free on request; the cost to institutions is US$5.00 overseas or A$5.50 (incl. GST) in Australia each including postage and handling. For a full list of CIES publications, visit our Web site at http://www.adelaide.edu.au/cies/ or write, email or fax to the above address for our List of Publications by CIES Researchers, 1989 to 1999 plus updates. 0140 Damania, Richard , Randy Stringer, K. Ullas Karanth, and Brad Stith, “The
Economics of Protecting Tiger Populations: Linking Household Behaviour to Poaching and Prey Depletion”, November 2001.
0139 Damania, Richard and Erwin H. Bulte, “The Economics of Captive Breeding and Endangered Species Conservation”, October 2001.
0138 James, Jennifer S and Julian M Alston, “Taxes and Quality: A Market-Level Analysis”, October 2001.
0137 Rajan, Ramkishen, “Adopting an appropriate exchange rate regime: fixed or floating?”, October 2001. (Paper prepared for Malaysian Economic Outlook 2001, organized by the Malaysian Institute for Economic Research, Kuala Lumpur, Malaysia).
0136 Anderson, Kym, Dimarana, Betina, Francois, Joseph, Hertel, Tom, Hoekman, Bernard, and Martin, Will, “The Cost of Rich (and Poor) Country Protection to Developing Countries”, September 2001. (Forthcoming in Journal of African Economies 2002.)
0135 Rajan, Ramkishen and Chung-Hua Shen, “Are Crisis-Devaluations contractionary?”, September 2001.
0134 Shapiro, Perry and Petchey, Jeffrey “Internationally Mobile Factors of Production and Economic Policy in an Integrated Regional Union of States”, August 2001.
0133 Rajan, Ramkishen and Graham Bird, Still the Weakest Link: the Domestic Financial System and Post-1998 Recovery in East Asia”, July 2001. (Since published in Development Policy Review, 19 (3), pp.355-66, 2001
0132 Rajan, Ramkishen and Bird, Graham, “Banks, Maturity Mismatches and Liquidity Crises: a Simple Model” July 2001
Crises: a Simple Model”, July 2001. 0131 Montreevat, Sakulrat and Rajan, Ramkishen, “Financial Crisis, Bank
Restructuring and Foreign Bank Entry: an Analytic Case Study of Thailand”, June 2001.
0130 Francois, Joseph F. “Factor Mobility, Economic Integration and the Location of Industry”, June 2001.
0129 Francois, Joseph F. “Flexible Estimation and Inference Within General Equilibrium Systems”, June 2001.
0128 Rajan, Ramkishen S., "Revisiting the Case for a Tobin Tax Post Asian Crisis: a Financial Safeguard or Financial Bonanza?" June 2001. (Paper prepared for presentation at a United Nations Meeting on Resource Mobilisation for Development, New York, June 25-26, 2001.)
0127 Rajan, Ramkishen S. and Graham Bird, "Regional Arrangements for Providing Liquidity in a Financial Crisis: Developments in Asia", June 2001.
0126 Anderson, Kym and Shunli Yao, "China, GMOs, and World Trade in Agricultural and Textile Products", June 2001. (Paper prepared for the Fourth Annual Conference on Global Economic Analysis, Purdue University, West Lafayette 27-29 June 2001.)
0125 Anderson, Kym, "The Globalization (and Regionalization) of Wine", June 2001. (Paper for the National Academies Forum’s Symposium on Food and Drink in Australia: Where Are We Today? Adelaide, 5-6 July 2001.) (Forthcoming in Australian Agribusiness Review 2002.)
0124 Rajan, Ramkishen S., "On the Road to Recovery? International Capital Flows and Domestic Financial Reforms in East Asia", May 2001.
0123 Chunlai, Chen, and Christopher Findlay., "Patterns of Domestic Grain Flows and Regional Comparative Advantage in Grain Production in China", April 2001.
0122 Rajan, Ramkishen S., Rahul Sen and Reza Siregar, "Singapore and the New Regionalism: Bilateral Economic Relations with Japan and the US", May 2001.
0121 Anderson, Kym, Glyn Wittwer and Nick Berger, "A Model of the World Wine Market", May 2001. (Forthcoming in Economic Modelling, 2002)
0120 Barnes, Michelle, and Shiguang Ma, "Market Efficiency or not? The Behaviour of China’s Stock Prices in Response to the Announcement of Bonus Issues," April 2001.
0119 Ma, Shiguang, and Michelle Barnes, "Are China’s Stock Markets Really Weak-form Efficient?" April 2001.
0118 Stringer, Randy, "How Important are the 'Non-traditional' Economic Roles Agriculture in Development?" April 2001.
0117 Bird, Graham, and Ramkishen S. Rajan, "Economic Globalization: How Far and How Much Further?" April 2001. (Since published in World Economics, 2 (3), pp.1-18, 2001.)
0116 Damania, Richard, "Environmental Controls with Corrupt Bureaucrats," April 2001. 0115 Whitley, John, "The Gains and Losses from Agricultural Concentration," April 2001. 0114 Damania, Richard, and E. Barbier, "Lobbying, Trade and Renewable Resource
Harvesting," April 2001.
Related Documents