The Economics of Counterfeiting ∗ Elena Quercioli † Economics Department Tulane University Lones Smith ‡ Economics Department University of Michigan January 10, 2009 Abstract This paper develops a new tractable strategic theory of counterfeiting as a competition between good and bad guys. There is free entry of bad guys, who choose whether and what note to counterfeit, and what quality to produce. Good guys select a costly verification effort. Along with the quality, this effort fixes the chance of finding counterfeits, and induces a collateral “hot potato” passing game among good guys — seeking to avoid counterfeits passed around. We find a unique equilibrium of the entwined counterfeiting and verifying games. With log-concave verification costs, counterfeiters producer better quality at higher notes, but verifiers try sufficiently harder that the verification rate still rises. We prove that the unobserved counterfeiting rate is hill-shaped in the note, vanishing at extremes. We also deduce comparative statics in legal costs and the technology. We find that the very stochastic nature of counterfeiting limits its social cost. Our theory applies to fixed-value counterfeits, like checks, money orders, or money. Focusing on counterfeit money, we assemble a unique data set from the U.S. Secret Service. We identify key time series and cross-sectional patterns, and explain them: (1) the ratio of all counterfeit money (seized or passed) to passed money rises in the note, but less than proportionately; (2) the passed-circulation ratio rises in the note, and is very small at $1 notes; (3) the vast majority of counterfeit money used to be seized before circulation, but now most passes into circulation; and (4) the share of passed money found by Federal Reserve Banks generally falls in the note, as does the ratio of the internal FRB passed rate to the economy-wide average. Our theory explains how to estimate from data both the street price of counterfeit notes and the small costs of verifying counterfeit notes. * This paper has taken a long journey from our 2005 manuscript “Counterfeit $$$” that made re- strictive functional form assumptions and assumed a fixed quality of money. We have profited from the insights, data, and broad institutional knowledge about counterfeiting of Ruth Judson (Federal Reserve), John Mackenzie (counterfeit specialist, Bank of Canada), Lorelei Pagano (former Special Agent, Se- cret Service), Antti Heinonen (European Central Bank, Counterfeit Deterrence Chairman), and Charles Bruce (Director, National Check Fraud Center). We have also benefited from seminar feedback at I.G.I.E.R. at Bocconi, the 2006 Bonn Matching Conference, the 2006 SED in Vancouver, the Workshop on Money at the Federal Reserve Bank of Cleveland, Tulane, Michigan, the Bank of Canada, the 2007 NBER-NSF GE conference at Northwestern, the 2008 Midwest Theory Conference in Columbus, and especially the modeling insights of Pierre Duguay (Deputy Governor, Bank of Canada). † [email protected] and www.tulane.edu/∼elenaq ‡ [email protected] and www.umich.edu/∼lones. Lones thanks the NSF for funding (grant 0550014).

Welcome message from author
This document is posted to help you gain knowledge. Please leave a comment to let me know what you think about it! Share it to your friends and learn new things together.
Transcript

The Economics of Counterfeiting∗
Elena Quercioli†
Economics Department
Tulane University
Lones Smith‡
Economics Department
University of Michigan
January 10, 2009
Abstract
This paper develops a new tractable strategic theory of counterfeiting as acompetition between good and bad guys. There is free entry ofbad guys, whochoose whether and what note to counterfeit, and what quality to produce. Goodguys select a costly verification effort. Along with the quality, this effort fixesthe chance of finding counterfeits, and induces a collateral“hot potato” passinggame among good guys — seeking to avoid counterfeits passed around. We finda unique equilibrium of the entwined counterfeiting and verifying games. Withlog-concave verification costs, counterfeiters producer better quality at highernotes, but verifiers try sufficiently harder that the verification rate still rises. Weprove that the unobserved counterfeiting rate is hill-shaped in the note, vanishingat extremes. We also deduce comparative statics in legal costs and the technology.We find that the very stochastic nature of counterfeiting limits its social cost.
Our theory applies to fixed-value counterfeits, like checks, money orders, ormoney. Focusing on counterfeit money, we assemble a unique data set from theU.S. Secret Service. We identify key time series and cross-sectional patterns, andexplain them:(1) the ratio of all counterfeit money (seizedor passed) to passedmoney rises in the note, but less than proportionately;(2) the passed-circulationratio rises in the note, and is very small at $1 notes;(3) the vast majority ofcounterfeit money used to beseizedbefore circulation, but now most passes intocirculation; and(4) the share of passed money found by Federal Reserve Banksgenerally falls in the note, as does the ratio of the internalFRB passed rate to theeconomy-wide average. Our theory explains how to estimate from data both thestreet price of counterfeit notes and the small costs of verifying counterfeit notes.
∗This paper has taken a long journey from our 2005 manuscript “Counterfeit $$$” that made re-strictive functional form assumptions and assumed a fixed quality of money. We have profited from theinsights, data, and broad institutional knowledge about counterfeiting of Ruth Judson (Federal Reserve),John Mackenzie (counterfeit specialist, Bank of Canada), Lorelei Pagano (former Special Agent, Se-cret Service), Antti Heinonen (European Central Bank, Counterfeit Deterrence Chairman), and CharlesBruce (Director, National Check Fraud Center). We have alsobenefited from seminar feedback atI.G.I.E.R. at Bocconi, the 2006 Bonn Matching Conference, the 2006 SED in Vancouver, the Workshopon Money at the Federal Reserve Bank of Cleveland, Tulane, Michigan, the Bank of Canada, the 2007NBER-NSF GE conference at Northwestern, the 2008 Midwest Theory Conference in Columbus, andespecially the modeling insights of Pierre Duguay (Deputy Governor, Bank of Canada).
†[email protected] and www.tulane.edu/∼elenaq‡[email protected] and www.umich.edu/∼lones. Lonesthanks the NSF for funding (grant 0550014).

1 Introduction
Counterfeiting is a major economic problem, called “the world’s fastest growing crime
wave” Phillips (2005). And specifically, the counterfeiting of stated value financial
documents like money, checks, or money orders, is both centuries-oldanda large and
growing economic problem. Domestic losses from check fraud, for instance, may have
exceeded $20 billion in 2003. This scourge has risen greatlyfrom years earlier with
with growth of internet-circulated Nigerian scams.1 Counterfeit money is much less
common but still quite costly: The counterfeiting rate of the U.S. dollar is about one
per 10,000 notes, with the direct cost to the domestic publicamounting to $61 million
in fiscal year 2007, which is up 66% from 2003. The indirect counterfeiting costs for
money are much greater, forcing a U.S. currency re-design every 7–10 years. As well,
many costs are borne by the public in checking the authenticity of their currency.
When we writecounterfeitmoney (or checks), we have in mind two manifestations
of it. Seizedmoney is confiscated before it enters circulation or is passed. Passed
money is found at a later stage, and leads to losses by the public. We have gathered
an original data set mostly from the Secret Service on seizedand passed money over
time and across denominations. In the USA, all passed counterfeit currency must be
handed over to the Secret Service, and so very good data is available (in principle).
We develop a simple and tractable equilibrium theory of counterfeiting that also
explains the data on counterfeit money. The key stylized facts of counterfeit money in
the USA are best expressed in terms of two measures — thecounterfeit-passed ratio
(seized plus passed over passed) and thepassed rate(passed over circulation):
#1. The counterfeit-passed ratio rises, but less than proportionately with the note.
#2. The passed rate is small for low notes, greatly rises, andlevels off or drops.
#3. Since the 1970s, the counterfeit-passed ratio has drammatically fallen about 90%.
#4. The fraction of counterfeit notes found by Federal Reserve Banks falls in the note.
We build a strategic model of the struggle between “bad guys”who may counterfeit
and “good guys” who must transact (a continuum of each). In this large game, we allow
a single variable decision margin for each side, and a free entry choice by bad guys.
Good guys expend efforts screening out passed counterfeit money handed them;
more effort yields stochastically better scrutiny. In the world of counterfeit goods with
no middlemen, only bad guys pass on the fake merchandise. Butwith counterfeit
money or counterfeit goods resold, a much larger collateralgame emerges: Good guys
unwittingly pass on the counterfeit goods or money they acquire in an anonymous
1Data here is sketchy. This estimate owes to a widely-cited Nilson Report (www.nilsonreport.com).
1

random matching exchange economy. This becomes a game of strategic complements
(i.e. it issupermodular), since the more others verify, the more one should do likewise
to protect oneself. We think this simple “hot-potato” game is novel in monetary theory.
Bad guys supply counterfeits. Their choice variables are whether and what value
to counterfeit, and if so, whatquality to produce. A counterfeit with twice the quality
costs twice as much to catch with any given probability — theverification rate. With
this cardinal notion of quality, vigilance efforts equal quality times an increasing and
convex verification cost function. This prism through whichgood guys efforts and
bad guys quality translate into a verification rate is at the core of our theory. Better
verification in turn depresses thepassing fractionof counterfeits into circulation by
bad guys, and raises thediscovery rateof passed money by good guys.
Equilibrium in our game can be recursively computed in two stages. Incentives in
the counterfeit entry game pin down the quality and verification effort; meanwhile, the
equilibrium effort in the passing game fixes the counterfeiting rate. No counterfeiting
equilibrium exists at low but strictly positive value notesor goods, since it cannot pay
for the expected legal costs even if all counterfeits certainly pass. Strictly above this
threshold, we establish a unique Nash equilibrium of our model (Theorem 1).
Near the least value counterfeit, verification effort and counterfeit quality vanish.
But counterfeiters have proportionately so much more to gain as the value rises. So
counterfeit quality swamps verification effort in this limit, and verification vanishes
(Theorem 2); the marginal verification cost vanishes too. Inthe hot potato game,
this cost margin is the product of the counterfeiting rate, the counterfeit value and the
discovery rate. Thus, the counterfeiting rate vanishes at low notes, and so too does the
passed rate — its product with the discovery rate. So the passed rate vanishes at the
least value counterfeits — the first part of stylized fact #2 (Corollary 6-a).
The paper revolves around the unfolding clash between verification effort and
counterfeit quality either as the stakes amplify, or other features of the counterfeit-
ing game change, like legal, production, or verification costs. Suppose the note value
rises. The verification effort then rises (Theorem 3) — for ifnot, counterfeiting would
prove more profitable at higher values. In a key result (Theorem 4), we prove that if the
verification cost function is log-concave, then the counterfeit quality rises in the value.
We document this conclusion, and then show that this explains stylized fact #1. The
reason is that greater counterfeit quality costs more at higher notes, raising expected
revenues too (Corollary 2), i.e. the passing fraction timesthe counterfeit value rises
in the counterfeit value. Since the counterfeit-passed ratio is inverse to the passing
fraction, it then cannot rise 1-for-1 with the counterfeit value (Corollary 3).
2

For the next major result (Theorem 5), we determine that verifiers eventually win
out in the battle with counterfeiters. While quality rises in the counterfeit value, effort
rises so much faster that the resulting verification rate steadily increases. Our only
proviso is that the counterfeit cost elasticity does not fall in quality — as is true of
most standard cost functions. The measured passing fraction falls in the counterfeit
value, and the counterfeit-passed ratio accordingly rises(Corollary 2 and Corollary 3).
While the counterfeiting rate is the fake fraction of the circulation, it is not merely
a statistical yardstick: In fact, this risk measure equilibrates the passing game played
by verifiers, just as prices clear markets. We also prove thatthe counterfeiting rate is
approximately the ratio of verification costs and unit counterfeiting costs. Not only
does the counterfeiting rate vanish at low notes, it also does so at very high notes
— since quality explodes in the counterfeit value (Theorem 6). We then bound the
counterfeiting rate, and deduce a rough hill-shape in termsof the counterfeit value
(Theorem 7). We illustrate this and all findings in a worked example. Scaling it by
the discovery chance yields the observed passed rate; this rate shares hill-shape, thus
explaining the second half of stylized fact #2 (Corollary 6-b).
We next turn to a welfare analysis of the costs of counterfeiting, since we can easily
quantify costs to counterfeiters and verifiers. We quantifythese social costs, and show
that they are bounded below the counterfeit value. We argue that this exception to
Tullock’s Theorem owes to the stochastic nature of counterfeiting (Theorem 8).
Our large game is sufficiently tractable that we can easily analyze the thrust and
parry of the competition between good and bad guys. We show that if technological
progress occurs in counterfeiting, then verifiers try harder in equilibrium, and also
counterfeit quality rises. With “neutral progress”, the equilibrium verification rate is
unchanged but the counterfeiting rate falls if the progresswas “quality-augmenting”, in
an intuitive sense that we define (Theorem 9). Turning to our other comparative static,
Theorem 10 discovers a perverse effect of greater legal costs, crowding out verifier
effort, reducing the verification rate. This underscores that the Treasury or producers
of counterfeited goods should be more concerned about how readily checked are the
money or goods rather than how steep are the legal penalties.
We show that Theorem 9 helps explain stylized fact #3. Most counterfeit money
used to be seized, while now the reverse holds. This owes to a technological transfor-
mation in counterfeiting, first with office copiers in the 1980s and then digital means
(computers with ink jet printers) in the 1990s (Corollary 4). Theorem 9 also captures
the classic cat-and-mouse game between counterfeiter and originator: Easier verifica-
tion is tantamount to neutral technological regress; therefore, effort and quality equally
3

fall, verification is unchanged, and the counterfeiting rate falls Corollary 1.
Our model also admits expressions for several economicallymeaningful variables.
For example, the street price of counterfeit notes (19) can be approximated using the
counterfeit-passed ratio. This owes to equilibrium behavior by bad guys. The implied
prices agree with typical estimates and anecdotal evidence. Meanwhile, equilibrium
behavior by good guys in the passing game affords a glimpse into currency verifi-
cation costs incurred by the public. Marginal verification costs equal the passed rate
times the denomination, and so amount to at most 1/4 cent for the $100 bill! Our mi-
croeconomics foundation may be more aptly thought of “nano-economics”. That such
small verification costs explain the data testifies to the power of even slight incentives.
The passed rate reflects the incentives of individuals as they notice counterfeit
money. The paper ends with a reverse test for the paper, focusing on money that
verifiers miss, and is ultimately caught by Federal Reserve Banks (FRB). For instance,
the FRB actually finds a majority of $1 passed notes, and theirshare of passed money
falls in the denomination, except for the $100 note (stylized fact #4). We then argue
that this reflects two features of our theory — that the more valuable notes are both
better quality and better verified by the public. Also, the internal FRB counterfeiting
rate is likewise a decreasing ratio of the overall passed rate, until the $100 note. We
argue in Corollary 8 and Corollary 9 and that both facts owe tothe rising verification
rate, and behavior in the hot potato passing game.
RELATIONSHIP TO THE L ITERATURE. Despite how common and time-eternal a
problem it is, counterfeit money has been very much a blackbox to economists. To be
sure, the published literature is very small. There are somepurely theoretical papers
inspired by the classic money matching model of Kiyotaki andWright (1989) and the
more closely-related Williamson and Wright (1994). Aside from the subject matter,
our link to this literature is minimal: Ours is partial equilibrium behaviorial model,
while these are general equilibrium papers seeking to pricethe counterfeits. None
aspires to explain data, or could explain the current data, as we argue in the paper.
Since they assume fixed signals of the authenticity of money,they share neither our
main novel strategic core nor our conclusions about the counterfeiting rate, and passed
and seized money. In Green and Weber (1996), only governmentagents can descry
the counterfeit notes, whose stock is assumed exogenous, unlike here. Williamson
(2002) admits counterfeits of private bank notes that are discovered with fixed chance;
counterfeiting does not occur in most of his equilibria. Recognition of counterfeits is
also stochastic and exogenous in Nosal and Wallace (2007), who find no counterfeiting
in equilibrium with a high enough cost of counterfeit. By contrast, in our model,
4
counterfeit quality is endogenous, and a high enough note must be counterfeited.
For a key point of comparison, the papers cited above assume that transactors get
a free signal of the money qualityafter acquiring it. We instead posit that individuals
verify when it can affect choice, namely when handed it. Thisis important, producing
the strategic complements hot potato game. It also agrees with how most individuals
behave: At the moment we acquire money, we check it; otherwise, it lives in our wallet.
We lay out the model in§2. Innocent verifiers care about the behavior of each
other when they acquire money that is surely passed on, but perhaps not for checks.
For definiteness, we then use the language of counterfeit money. In §3, we establish
equilibrium existence, and then illustrate it in a fully solved example using geometric
verification and counterfeit quality cost functions. All theorems in sections 3–5 apply
equally to both counterfeits. We then focus exclusively on counterfeit money, and show
how our model explains the behavior of seized money in§6, and of passed money in§7.
We conclude in§8 with a different data set from the Federal Reserve Banks. Technical
proofs are deferred to the appendix, and intuitively explained in the text.
2 The Model
We will construct a dynamic discrete time model in which a continuum of notes of
denomination∆ transact once per “period” — where the time period is specificto ∆.
Counterfeiting for each∆ plays out as a separate game, and we take the denominations
as given. Our data will come from the U.S. dollar denominations $1, $5, . . . , $100.
We will focus on the story and language of counterfeit money,since the theory we
develop is largely applicable without change to counterfeit goods. We identify where
these changes occur. In particular,∆ is the sales value of the good to be counterfeited.
There are two types of maximizing risk neutral agents: a continuum of bad guys
(counterfeiters) and good guys (transactors). Everyone therefore acts competitively,
believing he is unable to affect the actions of anyone else. Counterfeiters choose
whether to enter, and if so, they select the quality of money to produce and distribute,
and then are eventually jailed. There is an infinitely elastic supply of counterfeiters
with free entry; each earns zero profits, taking account of the legal penalty (“crime
does not pay”). Each piece of money changes hands in chance pairwise transactions
from bad guy to good guy, or from good guy to good guy. Counterfeiters who transact
are indistinguishable from good guys. Good guys choose an effort level to examine
notes that they are handed. Some unknowingly acquire counterfeit currency and some
do not. We ignore payoff discounting, since any note acquired is soon spent.
5
2.1 The Hot Potato Game
If an innocent individual attempts to spend “hot” money, andthis is noticed, then it
becomes worthless — since knowingly passing on counterfeitcurrency is illegal.2 We
simply assume that this extra crime of “uttering” is not done.
Faced with this prospect, individuals choose how carefullyto check the authenticity
of any moneybeforethey accept it.Verificationis a stochastic endeavor that transpires
note by note — as more valuable notes will command closer scrutiny. We write the
verificationrate (or intensity) as the chancev ∈ [0, 1] that one correctly identifies a
given note as counterfeit. We assume real notes are never mistaken for counterfeit.
Verification costs are smooth, increasing and strictly convex in the verification
rate v. We write them asqχ(v), whereq > 0 will soon be interpreted as quality.
We assume thatχ′(0) = 0, with χ′(v) > 0 andχ′′(v) > 0 whenv > 0.3
Each period, innocent transactors either go to the bank (unlike counterfeiters) or
meet a random verifier for transactions. These events are notchoices, and occur with
fixed chancesβ and1−β, respectively. Banks have verifying machines or capable staff
who can better spot counterfeit money than individuals, butstill imperfectly. Write
their verification intensity asα ∈ (0, 1). Indeed, from $5–10 million of passed money
hits the Federal Reserve yearly, missed by banks (see Table 7). All told, any counterfeit
money is found in a transaction with thediscovery rateρ(v) = αβ + (1 − β)v > 0.
Assume that a fractionκ of all ∆ notes tendered in transaction is counterfeit, with
an average verification ratev. As notes are spent upon acquisition, transactors choose
their intensityv to minimize losses from counterfeit money and verification efforts:
κ(1 − v)ρ(v)∆ + qχ(v) (1)
A verifier incurs a loss in the triple event that(i) he is handed a counterfeit note,(ii)
his verifying efforts miss this fact,and (iii) the next transaction catches it. These are
independent events with respective chancesκ, 1 − v, andρ(v).
This is a doublysupermodular game: One’s verification intensityv is a strategic
complementto the average intensityv and the counterfeiting rateκ. The incentive
to verify money that one acquires is stronger the more intensely others check their
notes, or the more prevalent counterfeit money is. Thus, theverification best response
function v rises inv andκ. Supermodular games in economics may have multiple
2Title 18, Section 472 of the U.S. Criminal Code3Weak convexity in this case is remarkably without loss of generality. For one can always secure an
(expected) verification chance ofv at cost(χ(v − ε) + χ(v + ε))/2 instead by flipping fair coin, andverifying at ratesv − ε or v + ε. In other words, we must haveχ(v) ≤ (χ(v − ε) + χ(v + ε))/2.
6

ranked equilibria, but here there is a unique symmetric Nashequilibrium.
The second order condition for minimizing (1) is met given strictly convex costsχ.
Agents must choose a common verification intensityv = v in the verification game.
There are no asymmetric equilibria. Sinceβα > 0, the corner solution is not optimal.
Whenκ > 0, all verifiers will choose the same effort level, inducing the same positive
verification ratev, becauseχ′(0) = 0. Substituting this into the first order condition
yields the equilibrium equation that the marginal costs andbenefits of effort coincide.
qχ′(v) = κρ(v)∆ (2)
The counterfeiting rateκ acts like a market-clearing price, quantifying the risk.
From the supermodular structure, the marginal benefit on theleft side of (2) linearly
rises both inκ and inv. This yields an economic expression for the counterfeitingrate:
κ =qχ′(v)
ρ(v)∆=
marginal verification costdiscovery rate× denomination
(3)
The right side is a quotient of two increasing functions ofv: Marginal verification
costs rise inv by convexity, and while marginal verification gains rise linearly inv. In
the later equilibrium, the counterfeiting rate will equilibrate both factors.
Finally, we address counterfeit checks. Since they are not resold, the discovery
rateρ(v) might not appear in (1), and thus in the first order conditions(2)–(3).
2.2 Currency Verification and Counterfeit Quality
Among the many decisions made by counterfeiters, we center our theory on the quality
choice. Better quality notes look and feel more authentic, and so pass more readily.4
This singular focus is motivated by the concerns of law enforcement and bank officials,
and the fact that it affords a parsimonious theory that explains the key facts.
We now introduce a specific cardinal meaning for the quality of counterfeit notes
turning on how it impairs verification. Verification ratev ∈ [0, 1] for a qualityq > 0
note costs efforte = qχ(v): Doubling the quality requires twice the effort to produce
the same verification intensity. There is another economic motivation for this key
functional form. Counterfeiters and verifiers have strategically opposed preferences
over the verification rate. Verifiers do not know the quality of any note, even if they can
4The European Central bank has adopted the catch phrase “feel-look-tilt” in its ad campaign for thesecurity features of the Euro, where tilt refers to the hologram image.
7
infer its equilibrium level.5 So their choice variable is notv but instead the efforte, and
this choices depend on their expected costs (1). Thus, it makes most economic sense
that counterfeiters have a convex cost over quality, which linearly increases these costs.
Write the verification rate as the induced functionv = V (e, q) of effort and quality.
We have the useful inverse relationsV (qχ(v), q) ≡ v and qχ(V (e, q))) ≡ e, and
so V (e, q) = χ−1(e/q). Sincev is a probability, we further defineV (e, q) = 1 if
e > qχ(1). Thus, at any effort levele, verification is perfect for low enough quality.
If we differentiate the identityqχ(V (e, q)) ≡ e, then we discoverqχ′Vq + χ ≡ 0
andqχ′Ve≡1. Further differentiating reveals thatqχ′Vee + qχ′′V 2e ≡0. Summarizing:
Lemma 1 (Verification Function) Fix the verification efforte > 0 and counterfeit
note qualityq>0 so thatv=V (e, q)<1. Verification intensity rises ine and falls inq:
(a) Verification rises in effort, with slopeVe(e, q) = 1/qχ′(v) > 0.
(b) Verification falls in quality, with slopeVq(e, q) = −χ(v)/qχ′(v) < 0.
(c) Marginal returns to verification effort fall:q2Vee(e, q) = −χ′′(v)/(χ′(v))3 < 0.
Greater counterfeit quality harms verification,Vq < 0, this damage intuitively
should obey the law of diminishing returns. Differentiating the identityqχ′Vq +χ ≡ 0:
q2Vqq =χ
χ′+
(
χ
χ′
)2 (
χ′
χ−
χ′′
χ′
)
Diminishing returns to greater quality necessarily ariseswhen this is always positive —
which is only necessary for verification costsχ log-concave in the ratev: (log χ)′′ ≤ 0,
and thus(χ′/χ)′ ≤ 0, or χ′′/χ′ ≤ χ′/χ. This discipline on the cost convexity is
natural since quality and verification costs interact multiplicatively. We maintain this
log-concavity assumption throughout the paper.It is critical, but not too restrictive —
for instance, it merely precludes any verification cost thatare more convex than the
exponential function; geometric costsχ(v) = λvr with any exponentr>1 work.6
Lemma 2 (Verification with Log-concavity) The marginal returns to quality fall,
or Vqq > 0, while quality and effort are strategic substitutes in the verification rate:
q2Veq =χ
(χ′)2
(
χ′′
χ′−
χ′
χ
)
≤ 0 (4)
5In principle, equilibrium quality could be random, in whichcase we interpretq as the mean quality.6Log-concavity is a standard assumption for probability densities (see Burdett (1996) or
Bagnoli and Bergstrom (2005)). Our application to cost functions likeχ may well be novel.
8

2.3 Verification and the Passing Fraction
A counterfeiter produces an illegal good, which may beseizedprior to passing it onto
the public. Police may either uncover the counterfeit note “factory” or catch the crook
in the act of transporting the money. We summarize the hurdles of passing notes by the
equilibrium passing fraction0 < f ≤ 1. This is the chance that any given note passes,
or in our continuum model, the share of production that the counterfeiter passes.
This paper turns on the role of individual verification efforts in preventing counter-
feit money. Such efforts intuitively facilitate police seizures, by providing clues into
ongoing counterfeit operations. So we assume that police seize a fraction0<s(v)<1
of counterfeit money production. The passing fraction reflects seizure and verification
viaf(v) = (1−s(v))(1−v). Loosely, the notes must pass through two filters — police
then the first verifier. Passing is thus choked off with perfect verification (f(1) = 0),
and some passing occurs when no one verifies (f(0) = 1 − s(0) > 0). We assume
that the resulting passing fraction continuously falls in verification (f ′(v) < 0). Since
1 − v>f(v), a “good guy” passes a counterfeit note more often than a “badguy”.
If seizures were a fixed fractions of production, then a unit elasticity off(v) =
(1− s)(1− v) would arise:E1−v(f) = 1. If verifier activity enhances police seizures,7
then this elasticity exceeds one.We assume for simplicity a constant passing elasticity:
Υ ≡ E1−v(f) = −(1 − v)f ′(v)/f(v) ∈ [1, 2) (5)
This implies thatf(v) = f(0)(1 − v)Υ. Notice thatthe constant elasticity passing
fraction is strictly log-concave,since(log f)′ = f ′/f = −Υ/(1 − v) falls in v.
2.4 The Counterfeiter’s Problem
While counterfeiting of money or goods is a dynamic process,we project it to a static
optimization. We consider legal, production, and distribution costs.
Firstly, a counterfeiter may be caught: The present value ofthe punishment loss is
ℓ > 0. Next, a counterfeiter incurs a fixed cost for the human and physical capital, and
a small marginal cost of production. Given the increasing returns, the optimization of
the counterfeiter might not imply a finite expected quantity.8 But the distribution costs
7On its web page, the Secret Service also advises anyone receiving suspected counterfeit money:“Do not return it to the passer. Delay the passer if possible.Observe the passer’s description.”
8 “If a counterfeiter goes out there and, you know, prints a million dollars, he’s going to get caughtright away because when you flood the market with that much fake currency, the Secret Service is goingto be all over you very quickly. They will find out where it’s coming from.” — interview with JasonKersten, author of Kersten (2005) [All Things Considered, July 23, 2005].
9
are surely convex in quantity, since each passing attempt incurs the risk of discovery.
While we address endogenous counterfeit quantity in§6.3, we pursue a more focused
theory centered on the quality choice. We assume that counterfeiters choose an optimal
quality q for producing theexpected quantityx > 0 of counterfeit money. The cost
c(q) is increasing and convex, withc′, c′′ > 0 and continuous, andc′(q) unbounded as
q → ∞. Theproducer surplusof qualityqc′(q)− c(q) is initially zero, and then rising.
A counterfeiter cares about his quality, and how carefully his notes are scrutinized.
Counterfeiters do not attempt to pass their money at a bank, and so face a verification
intensityv = V (e, q). The expected revenues for qualityq of note∆ aref(v)x∆,
while their costs arec(q) + ℓ. Given free entry, expected profits vanish:
Π(q, e, ∆) ≡ ∆xf(V (e, q)) − c(q) − ℓ = 0 (6)
Better quality simultaneously raises the passing fractionand the counterfeiters’ costs.
Provided there is any counterfeiting, the optimal qualityq is positive and finite
because the returns to greater quality are bounded, givenf ≤ 1. Also, zero quality
yields perfect verificationv = 1, and precludes all passing. Since the profit function
is smooth and strictly concave in quality by Lemma 2 andf ′ < 0 < f ′′, first order
conditions define a unique counterfeiter’s quality optimization:
Πq(q, e, ∆) ≡ ∆xf ′(V (e, q))Vq(e, q) − c′(q) = 0 (7)
3 Counterfeiting Equilibrium
3.1 Existence and Uniqueness
Our model consists of enmeshed hot-potato and counterfeiting games pitted in a “large
game” — i.e. a game with a continuum of players (initiated by Schmeidler (1973)).
Since quality and verification effort are unobserved, this dynamic Bayesian game can
be solved using Nash equilibrium. For as we have seen in§2.1, there is a unique
optimal verification rate for any expected quality. This in turn implies a unique effort.
Also, we will argue that the optimal quality is unique given effort. In summary, for a
fixed denomination∆, a symmetricequilibriumwill be a triple(q, e, κ), such that:
(a) Counterfeiters’ qualityq > 0 maximizes profitsΠ(q, e, ∆), and so (7) holds.
(b) Verifiers’ effort e > 0 ensures that counterfeiters earn no profits, so (6) holds.
10

(c) The counterfeiting rate isκ ∈ (0, 1), so that each verifier’s efforte = qχ(v)
solves the optimization (1) for the qualityq and the verification ratev.
For any quality and verification effortq, e > 0, equilibrium obtains in the hot-potato
game of§2.1 for a unique counterfeiting rateκ > 0 in (3). This recursive structure
allows us to solve for thecounterfeiting equilibrium(q, e) in isolation first. Thatκ < 1
is mathematically immaterial in the verifier’s optimization (1), but is needed for any
economic sense. In Theorem 7, we will derive sufficient conditions for this bound.
The two nonlinear equations (6) and (7) in two unknowns have aunique solution
if the note is high enough: For the counterfeiter must pay a fixed legal costℓ > 0
irrespective of the note that he counterfeits, since he is eventually caught. So only
high enough notes are counterfeited. For greater notes, verification effort is needed to
preclude counterfeiting profits, and positive quality precludes perfect verification.
Theorem 1 (Existence and Uniqueness)For any∆ > ∆ ≡ ℓ/(xf(0)), there exists
a unique counterfeiting equilibrium(q, e); it is differentiable in∆, and the verification
rate, effort, quality are positive. No counterfeiting equilibrium exists for∆ ≤ ∆.
Absent verification, counterfeiting is profitable, and counterfeit money circulates.
But then verification has positive marginal benefits, and zero marginal costsχ′(0)=0.
With perfect verification, counterfeiters lose money. So0 < v < 1, as assumed in (2).
To see nonexistence: At any∆ < ∆, it is impossible to satisfy zero profits, since
c(q)+ ℓ ≥ ℓ = ∆xf(0) > ∆xf(v) wheneverq, v ≥ 0. If ∆ = ∆, zero profits requires
that quality vanish. But then perfect verification is achievable at arbitrarily small cost,
and this forces negative profits. The paper henceforth assumes a denomination∆>∆.
3.2 An Illustrative Example of a Counterfeiting Equilibriu m
Geometric cost functions verification and quality production result in an example fully
solvable in closed form. So assumeχ(v) = vB and c(q) = qA, whereA, B > 1.
Clearly, both cost functions are convex andχ is log-concave. Let us reformulate the
first order condition (7) for quality instead in(q, v)-space, substituting from Lemma 1:
qc′(q) = −∆xf ′(v)χ(v)
χ′(v)(8)
Simply assume that the police do not diminish the passing chance, so thatΥ = 1 and
thusf(v) = 1 − v. The zero profit equation (6) and revised quality FOC (8) are then:
∆x(1 − v) − qA − ℓ = 0 and AqA − ∆xv/B = 0
11
2Quality
1
Effort
0.2 0.4 0.6 0.8Verification
1
Effort or Quality
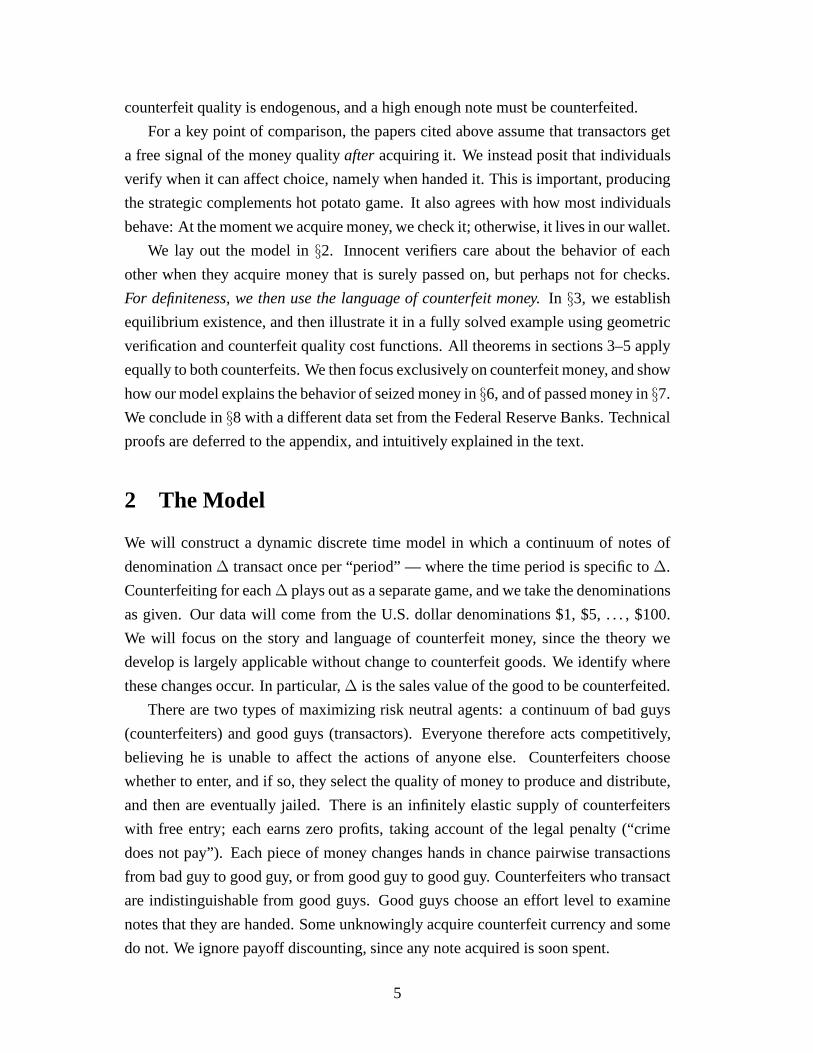
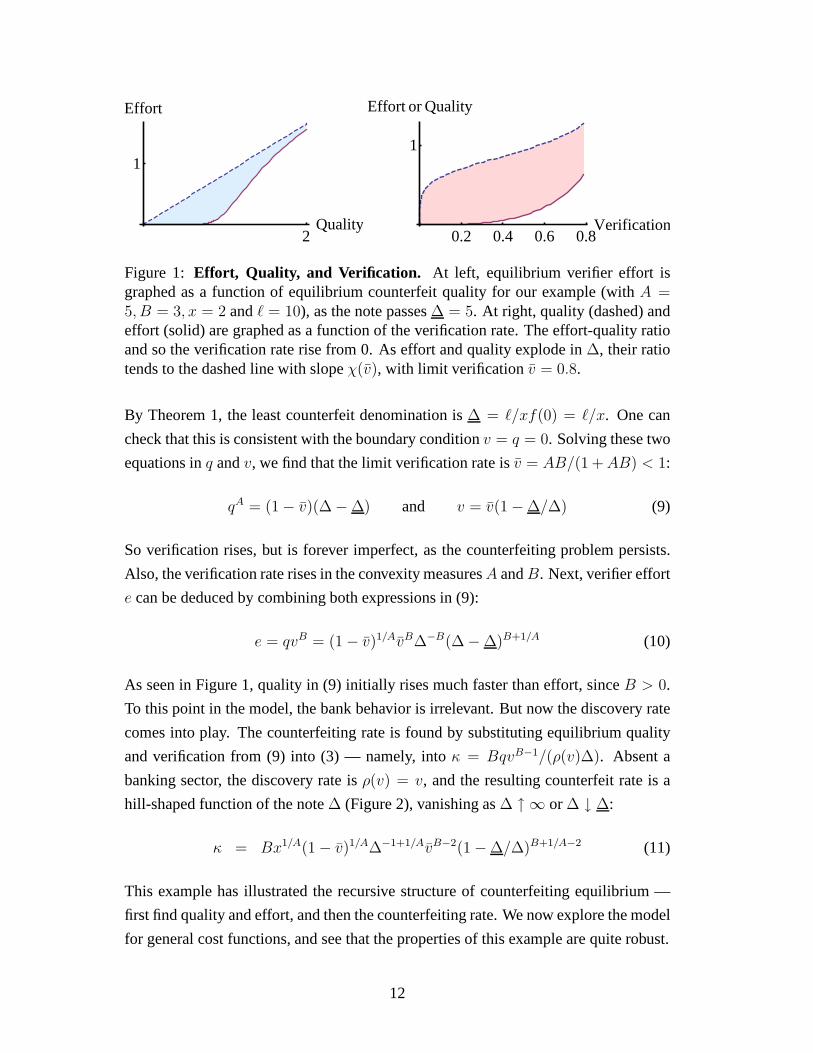
Figure 1: Effort, Quality, and Verification. At left, equilibrium verifier effort isgraphed as a function of equilibrium counterfeit quality for our example (withA =5, B = 3, x = 2 andℓ = 10), as the note passes∆ = 5. At right, quality (dashed) andeffort (solid) are graphed as a function of the verification rate. The effort-quality ratioand so the verification rate rise from 0. As effort and qualityexplode in∆, their ratiotends to the dashed line with slopeχ(v), with limit verification v = 0.8.
By Theorem 1, the least counterfeit denomination is∆ = ℓ/xf(0) = ℓ/x. One can
check that this is consistent with the boundary conditionv = q = 0. Solving these two
equations inq andv, we find that the limit verification rate isv = AB/(1 + AB) < 1:
qA = (1 − v)(∆ − ∆) and v = v(1 − ∆/∆) (9)
So verification rises, but is forever imperfect, as the counterfeiting problem persists.
Also, the verification rate rises in the convexity measuresA andB. Next, verifier effort
e can be deduced by combining both expressions in (9):
e = qvB = (1 − v)1/AvB∆−B(∆ − ∆)B+1/A (10)
As seen in Figure 1, quality in (9) initially rises much faster than effort, sinceB > 0.
To this point in the model, the bank behavior is irrelevant. But now the discovery rate
comes into play. The counterfeiting rate is found by substituting equilibrium quality
and verification from (9) into (3) — namely, intoκ = BqvB−1/(ρ(v)∆). Absent a
banking sector, the discovery rate isρ(v) = v, and the resulting counterfeit rate is a
hill-shaped function of the note∆ (Figure 2), vanishing as∆ ↑ ∞ or ∆ ↓ ∆:
κ = Bx1/A(1 − v)1/A∆−1+1/AvB−2(1 − ∆/∆)B+1/A−2 (11)
This example has illustrated the recursive structure of counterfeiting equilibrium —
first find quality and effort, and then the counterfeiting rate. We now explore the model
for general cost functions, and see that the properties of this example are quite robust.
12
20 40 60 80 100Note
0.20.40.60.8
Verification
20 40 60 80 100Note
0.020.040.060.080.100.12
Counterfeiting and Passed Rates
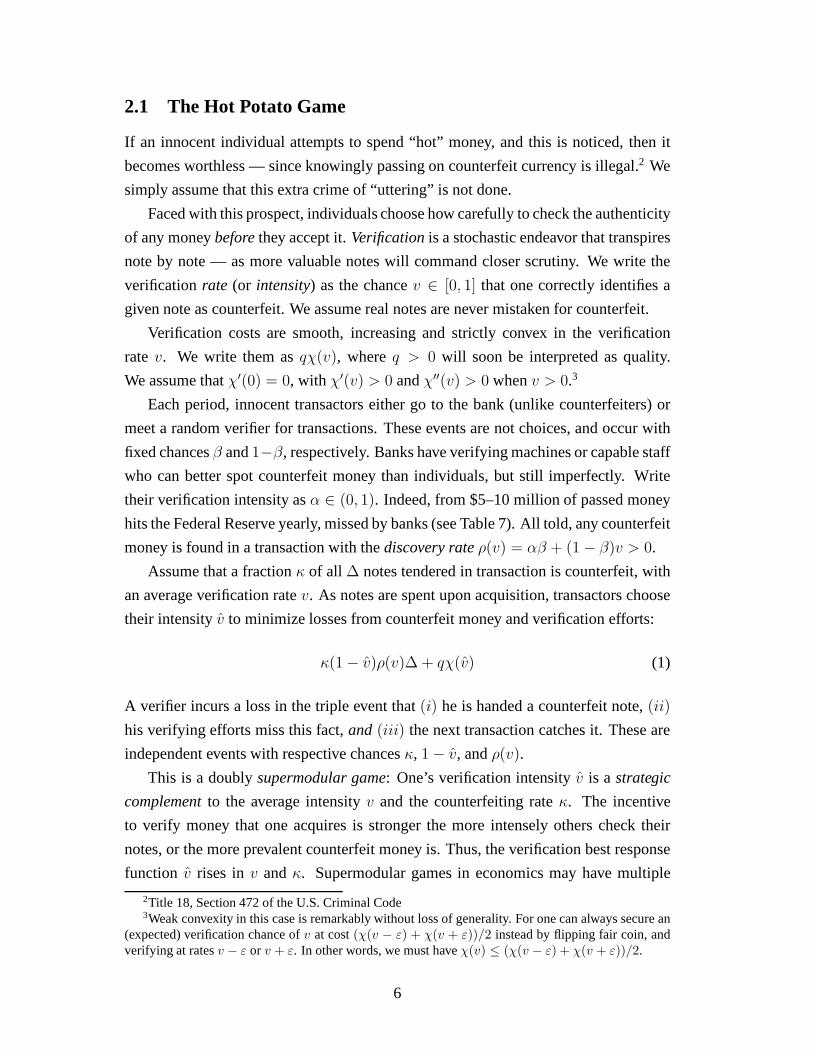
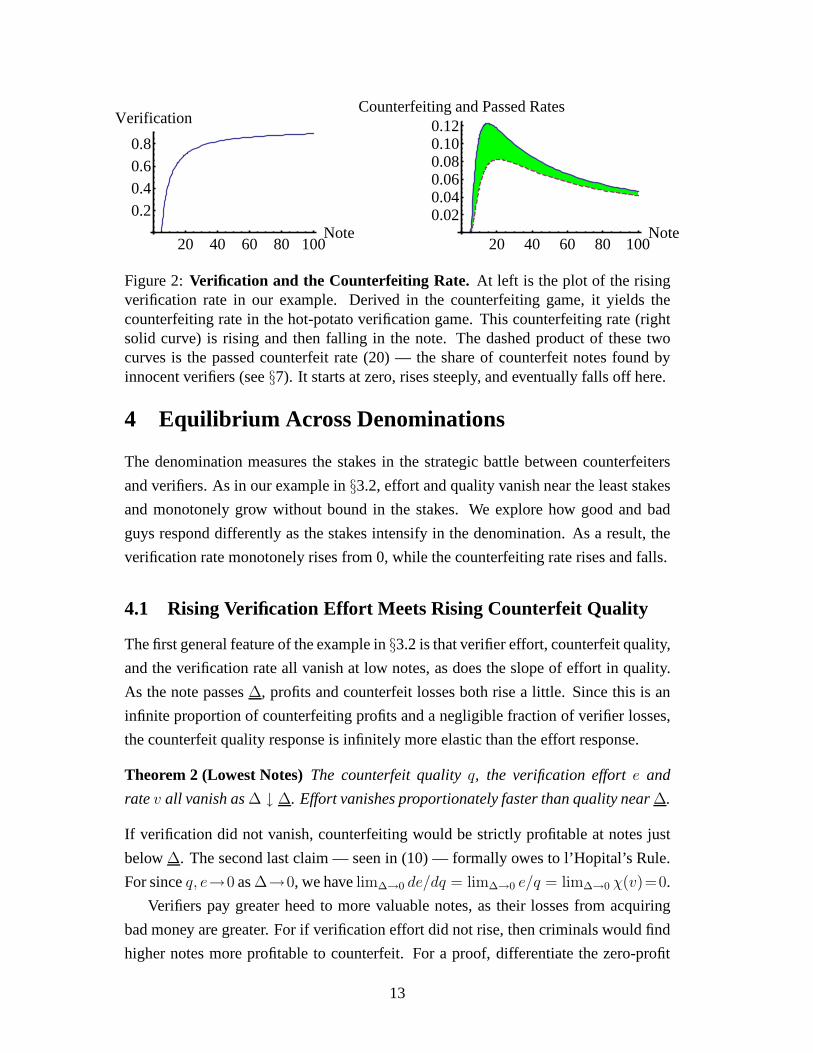
Figure 2:Verification and the Counterfeiting Rate. At left is the plot of the risingverification rate in our example. Derived in the counterfeiting game, it yields thecounterfeiting rate in the hot-potato verification game. This counterfeiting rate (rightsolid curve) is rising and then falling in the note. The dashed product of these twocurves is the passed counterfeit rate (20) — the share of counterfeit notes found byinnocent verifiers (see§7). It starts at zero, rises steeply, and eventually falls off here.
4 Equilibrium Across Denominations
The denomination measures the stakes in the strategic battle between counterfeiters
and verifiers. As in our example in§3.2, effort and quality vanish near the least stakes
and monotonely grow without bound in the stakes. We explore how good and bad
guys respond differently as the stakes intensify in the denomination. As a result, the
verification rate monotonely rises from 0, while the counterfeiting rate rises and falls.
4.1 Rising Verification Effort Meets Rising Counterfeit Quality
The first general feature of the example in§3.2 is that verifier effort, counterfeit quality,
and the verification rate all vanish at low notes, as does the slope of effort in quality.
As the note passes∆, profits and counterfeit losses both rise a little. Since this is an
infinite proportion of counterfeiting profits and a negligible fraction of verifier losses,
the counterfeit quality response is infinitely more elasticthan the effort response.
Theorem 2 (Lowest Notes)The counterfeit qualityq, the verification efforte and
ratev all vanish as∆ ↓ ∆. Effort vanishes proportionately faster than quality near∆.
If verification did not vanish, counterfeiting would be strictly profitable at notes just
below∆. The second last claim — seen in (10) — formally owes to l’Hopital’s Rule.
For sinceq, e→0 as∆→0, we havelim∆→0 de/dq = lim∆→0 e/q = lim∆→0 χ(v)=0.
Verifiers pay greater heed to more valuable notes, as their losses from acquiring
bad money are greater. For if verification effort did not rise, then criminals would find
higher notes more profitable to counterfeit. For a proof, differentiate the zero-profit
13

identity (6) in∆ to getΠq q + Πee + Π∆ = 0. SinceΠq = 0 in equilibrium by (7), and
Πe = ∆f ′Ve < 0 < f = Π∆, a positive effort slopee > 0 follows from:
∆f ′Vee + f = 0 (12)
Theorem 3 (Effort) Verification efforte rises in the note∆.
Next, a higher note pushes up the marginal gain to quality forcounterfeiters, while
greater effort pushes it down by (4). The net effect is unclear. But from the log-concave
verification cost functionχ and passing fractionf , we can deduce that quality rises.
Theorem 4 (Quality) Counterfeit qualityq rises in the note∆.
Just as the effort comparative static is driven by incentives in the entry game by bad
guys, the quality comparative static turns on incentives inthe hot-potato game.
Loosely, log-concavity precludes local “near jumps” of an increasing function, like
the verification costχ, and local “near flats” of a decreasing fraction, like the passing
function f .9 If the note just rises “a little”, then so does the verification effort e =
qχ(v), by Theorem 3. To sustain zero profits (6), the passing fractionf(v) must fall “a
little”. If f is not log-concave, thenv could rise “a lot”, and soχ(v) could rise “a lot”
too. Alternatively, ifχ is not log-concave, thenχ(v) could rise “a lot” even ifv only
rises “a little”. Either way, the qualityq = e/χ(v) could fall.
4.2 The Rising Verification Rate
Theorem 3 and Theorem 4 predict an intensifying duel betweenverification efforts
and counterfeit quality as the denomination rises. The verification rate rises when
effort e ≡ qχ(v) rises proportionately more than qualityq. While a verifier may study
a $100 note with greater care than a $5 note, the $100 passes more readily if its quality
is sufficiently higher. Or quality could improve sufficiently faster than effort so that
the verification rate falls. For general cost functions, we prove that this occurs.
Our insight into the verification rate comes by relating it toquality. So motivated,
we eliminate the note∆ from the zero profit and optimal quality conditions (6)–(7):
qc′(q)
c(q) + ℓ=
−f ′(v)
f(v)
χ(v)
χ′(v)(13)
9Since log-concavity saysχ(v + e)χ(v − e) ≤ χ(v)2 for all e > 0, the ratioχ(v + e)/χ(v) cannotexceedχ(v)/χ(v − e) > 1, which rules out “steep rises” inχ. Just as well, sincef(v)/f(v − e) < 1 isan upper bound onf(v + e)/f(v), the decreasing functionf cannot have a “near flat”.
14

Sincef(v) = f(0)(1−v)Υ andχ is log-concave, the right side of (13) rises inv. When
q is so small that legal costs exceed producer surplus from quality, or ℓ > qc′(q)−c(q),
the ratioq/(c(q) + ℓ) rises inq, and so does the left side of (13). Since quality rises
in the note∆ by Theorem 4, so does verificationv. For larger qualitiesq, if qc′/c is
nondecreasing, then the left side of (13) rises inq, asc(q)/(c(q) + ℓ) does.A fortiori,
Theorem 5 (Verification) (a) The verification rate rises at low enough notes∆ > ∆.
(b) If the cost elasticityqc′/c weakly rises inq, the verification rate rises in the note.
(c) The verification of any denomination∆ > ∆ is at most1 − (∆/∆)1/Υ.
The appendix proves part(c). The cost elasticityqc′/c is constant for geometric costs,
like c(q) = qA in the example in§3.2, and increasing for exponential costs, such as
c(q) = eq. For economic insight into its role, let the denomination∆ rise. Then the
marginal benefit of quality rises too. If the cost elasticityfell, then marginal costs
might flatten, and quality thereby rise so much that verification drops.
Theorem 5 also asserts that the verification rate is bounded strictly below one at
each fixed note∆. It is silent on whether the verification rate rises to 1. It need not:
The verification rate in the example in§3.2 is uniformly bounded below one across all
notes, and we have no reason to disbelieve this possibility from our evidence in§6.
Theorem 6 (Highest Notes)Both efforte and qualityq explode as the note∆ ↑ ∞.
These explosions occurred in the example in§3.2. In light of Theorem 5 ande =
qχ(v), it suffices thatq → ∞. Re-write the zero profit condition (6) in(q, v)-space:
∆xf(v) − c(q) − ℓ = 0 (14)
Absent a quality explosion, verification shoots to 1 too fastfor optimality. Namely,
∆(1−v)Υ is bounded in (14), whereas optimality entails∆(1−v)Υ−1 bounded in (8).
4.3 A Hill-Shaped Bound for the Unobserved Counterfeiting Rate
With free entry by counterfeiters, the counterfeiting rateis a free variable in our model.
While a function of the quantity of counterfeit notes, this unobserved fraction acts as a
price — the risk level that clears the verification effort andcounterfeit quality market.
We now bound the counterfeiting rate using primitives. Justas in the example
in §3.2, we prove that the counterfeiting rate vanishes at the least and highest notes.
First, examining equation (3),κ → 0 near the least counterfeit note∆ since quality
and the verification rate vanish, while∆ ≥ ∆ > 0 and the discovery rateρ ≥ αβ > 0.
15
To see why counterfeiting disappears at high notes, eliminate∆ from (3) using the
first order condition (7), and simplify it with Lemma 1 andf(v) = (1−s(0))(1−v)Υ:
κ =qχ′(v)
ρ(v)
xf ′(v)Vq(e, q)
c′(q)= (1 − s(0))Υ(1 − v)Υ−1 xχ(v)
ρ(v)c′(q)(15)
Sinceρ(v) ≥ αβ andχ(v) ≤ χ(1) < ∞, if Υ = 1 (no police),the counterfeiting rate
is a ratio of verification costs and marginal costs of quality. By Theorem 6, quality
explodes in the note, and thus so does its marginal costc′(q). Thenκ → 0 by (15).
We next globally bound the counterfeiting rate. This bound rises if counterfeiting
is easier — lower legal costsℓ, seizure rates(0), or counterfeit cost parameterc0, or
a higher production levelx. It falls when verification is more effective — a higher
banking verification rateβα, or a lower perfect verification marginal costχ′(1).
Theorem 7 (Counterfeiting) (a) The counterfeiting rate vanishes as∆↓∆ or ∆↑∞.
(b) Given a geometric boundc′(q) ≥ c0qη for c0 > 0 andη > 0, the counterfeiting
rate is bounded by:
κ <x(1 − s(0))χ′(1)
αβ(c0ℓη)1/(η+1)(16)
While counterfeiting never disappears, it can spiral out ofcontrol if it is cheap.
Completing the existence theorem for a counterfeiting equilibrium, we assume that the
upper bound (16) is less than one, and so the counterfeiting rate is less than one.
4.4 The Social Costs of Counterfeiting and Tullock’s Bound
A passed counterfeit note incurs one counterfeiting cost, but many verification costs
until discovery. The counterfeiting rate (3) balances costs in the battle between good
and bad guys. Multiplying equation (15) byq/xq/x
yields an approximate reformulation:
κ ≈ (1 − police seizure rate) ·unit verification costsunit production costs
(17)
This sheds a unique light on the development of fiat currency —i.e. non-commodity
money whose face value exceeds its intrinsic cost. This required technologies that
could produce documents whose counterfeits could be descried at an effort cost far
below their unit production cost. If not, counterfeiting would have spun out of control.
This suggests a quick consistency test of the model, that thestochastic struggle for
the∆ note should incur expected social costs of at most∆, as Tullock (1967) predicts:
16
Parties to a transfer/theft ofD dollars should be collectively willing to spend up toD
to affect the transfer/theft. We now uncover a novel limitation on this insight:
Theorem 8 (Social Costs)The average costs of counterfeiting a∆ note are at most
(1−v)∆, and the average total costs of verifying a circulating∆ note are at mostκv∆.
Owing to the stochastic nature of the discovery process, total counterfeiting expenses
(apart from law enforcement) have a ceiling(1− v + κv)∆, bounded below Tullock’s
∆ upper bound. The maximum social costs arelower when prevention effortsv are
greater. The proof also reveals that more effective counterfeitinginterdiction curiously
lessens criminal production costs of counterfeiting: Counterfeiting costs are farther
from the upper bound(1 − v)∆ the greater is the police seizure rates(v).
5 Counterfeiting as Technology or Legal Costs Change
To explain why counterfeiting costs have so greatly fallen (§6.2), we now develop a
model of technological progress. LetQ(q, t) denote quality “cost units”, so that quality
q costsc(Q(q, t)) given the technologyt. ThenQt < 0 for a cost-lowering technology,
while Qq > 0 since higher quality costs more. For the separable caseQ(q, t) = q/t,
the cost of any quality levelq falls from c(q) to c(q/t) as technology rises tot > 1
from 1. We call thisneutral technological progress, as it treats all quality levels alike.
Technology might better reduce the cost of higher quality levels, so that the ratio of
quality cost units falls:Q(q2, t)/Q(q1, t) is weakly decreasing int, for q2 > q1. Such
quality-augmenting technological progresssoon explains the data in§6.2. Conversely,
quality-reducingtechnological progress better raises higher quality cost levels.
Theorem 9 (Technology)(a) Verification effort rises for any technological progress.
(b) If the cost elasticityqc′/c weakly rises, quality rises with technological progress.
(c) The verification rate falls (rises) for quality-augmenting(quality-reducing) progress.
(d) The verification rate is constant and counterfeiting rate rises for neutral progress.
Proofs of (a)–(c) are in Appendix A.8. For part (d), considerneutral progress. Quality
rises, verification is unchanged, and so the counterfeitingrate in expression (3) rises.
We have no tractable analytic example of globally quality-reducing or augment-
ing technological progress. In the geometric family,Q(q, t) = q1/t yields quality-
augmenting technology improvement int iff q > 1. This reduces to a parameterized
cost functionc(q) = qA/t in our example in§3.2. The equilibrium quality in (9) rises
17

in t for q > 1, and falls forq > 1, while the verification rate in (9) always falls int.
Finally, the counterfeiting rate (11) rises int at low notes, and then falls for high notes.
Theorem 9 sheds light on the so-called “cat and mouse” natureof the real world
competition between counterfeiters and governments. Improved monetary security
mimics technological regress by counterfeiters, raising counterfeiting costs. Verifiers
relax their vigilance and quality falls by parts(a), (b). By part(c), effort falls so much
that the verification rate falls when the security effects “quality-reducing regress” —
namely, disproportionately inflating costs of mimicking the low cost security features.
An excellent application of this principle occurred in Canada. As color was introduced
on each note in the 1970s, the counterfeiting rate almost vanished for a couple years.
The flip side of counterfeiting progress is easier verification. Both changes are
captured in the Bureau of Printing and Engraving’s motto forthe new currency is
“Safer. Smarter. More Secure.” It boasts that the money is “harder to fake and easier to
check”. Yet making a currency harder to counterfeit or easier to verify are intuitively
similar. We now exploit a joint homogeneity of degree one, and find when they are
equivalent: A security featureuniformly halving verification costs is the same as a
neutrally less efficient technology with larger cost quality units2q in lieu of q.10
Corollary 1 (Easier Verification) If the cost functionχ falls toγχ, whereγ < 1, then
effort and quality fall, the verification rate is unchanged,and the counterfeit rate falls.
Unlike when a currency is more costly to counterfeit, if it ismoreuniformly readily
verified, then effort is not crowded out so much that verification falls.
Consider another government policy intervention. If it raises the legal punishment
for counterfeiting, then the least notes can no longer be profitably counterfeited. But
among those notes that are still counterfeited, verification effort drops. This crowding
out from government intervention is so strong that the verification rate falls.
Theorem 10 (Legal Costs)Assume a weakly rising cost elasticityqc′/c.
(a) As legal costs rise, the least counterfeit note rises, and effort and verification fall.
(b) Absent police, and so with unit passing elasticityΥ = 1, quality falls in legal costs.
(c) If Υ > 1, then quality falls for the lowest notes, and rises for the highest notes.
(d) If χ′(v)/v rises inv, then the counterfeiting rate falls in legal costs if quality does.
In the example in§3.2 with passing elasticityΥ = 1, the least counterfeit note∆ = ℓ/x
rises in the legal costsℓ, the counterfeit quality and verification rate (9) fall, andthe
counterfeit rate (3) falls with sufficiently convex verification costB > 2.
10Changing the verification cost function toχ = 1
2χ is equivalent changing the counterfeiting cost
function toc(q) = c(2q) in terms of the new quality unitsq = q/2, so thatc(q) ≡ c(q).
18

6 Evidence from Seized Counterfeiting Money
Our model is testable, and admits expressions for the levelsof both seized and passed
counterfeit money. We first explore consequences of the counterfeit entry game.
6.1 The Counterfeit-Passed Ratio Across Denominations
Sincef ′(v) < 0, the passing fraction falls in the note, by Theorem 5. If quality were
fixed, then to ensure zero profits in (6), the equilibrium passing fraction would scale
by one-half as the note doubled from $5 to $10 or $10 to $20. Itselasticity in∆
would then be−1. But Theorem 4 proves that endogenous quality optimally rises in
the note. This eats into profits as the note rises. So the passing fraction falls less than
proportionately in∆, and its elasticity exceeds−1. Together, Theorems 4–5 yield:
Corollary 2 (Passing Fraction) The passing fraction∆-elasticity isE∆(f)∈(−1, 0).
Counterfeit money is eventually eitherseizedfrom the criminals by police or the
first verifiers, orpassedonto the public, and later lost by an unwitting individual.
Call these levelsS[∆] andP [∆]. For simplicity, we pursue a steady-state analysis
and do comparative statics and dynamics using a comparison of steady-states. Since
these approaches give similar ordinal implications, the costly generality is not needed.
The valuesS[∆] andP [∆] obey two steady-state conditions. First, thecounterfeit
valueof seized plus passed moneyC[∆] = S[∆]+P [∆] equals the value of counterfeit
money leaving circulation. Second, passed money circulating is constant: To wit, the
outflow of passed money from circulation equals the inflow of new counterfeit money
passing into circulation. We assume that counterfeiters attempt to pass all production,
so that seized money represents failed passed money.11 The inflow of passed money
then equals the passing fraction times the counterfeit production. Immediately, we get:
P [∆] = f(v[∆]) · (production value) = f(v[∆]) · C[∆] (18)
The importance of thecounterfeit-passed ratioC[∆]/P [∆] is apparent. It inherits the
passing fraction properties from Corollary 2, offering easy testable implications.
Corollary 3 (Counterfeit-Passed Ratio) The counterfeit-passed ratio rises in the note
∆, with elasticity
0 < E∆(C/P ) = −E∆(f) < 1
11This is an overestimate because some money might be seized before any passing attempt, perhapsfound in the counterfeiter’s possession or after he is followed back to his lair. So to make sense of ourdata application below, we assume that this overestimate does not vary in the denomination.
19

($100, 2.2)
($50, 2.1)
($20, 1.8)
($10, 1.5)($5, 1.3)
Log Denomination
Lo
g (
1+
Sei
zed
/Pas
sed
)
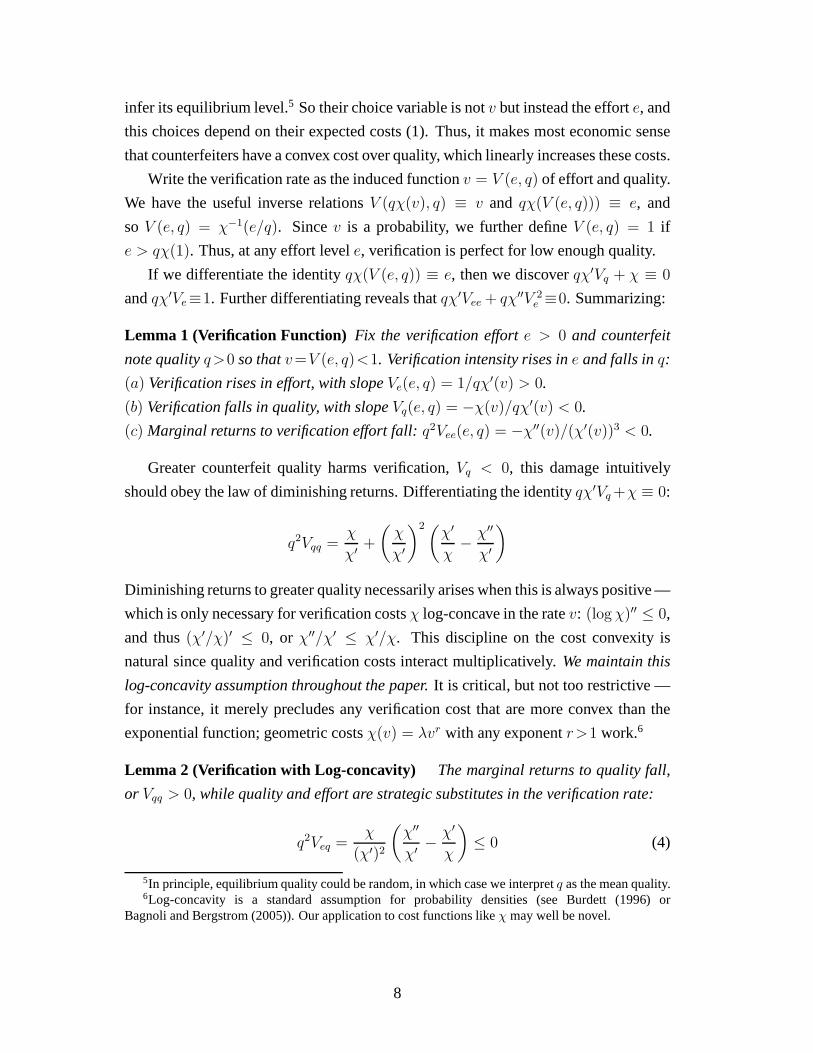
Figure 3: USA Counterfeit Over Passed, Across Denominations.These are thecounterfeit-passed ratios, averaged over 1995–2007, for non-Colombian counter-feits in the USA. Clearly, they rise in∆. The sample includes almost ten millionpassed notes, and about half as many seized notes. Data points are labeled by pairs(∆, C(∆)/P (∆)). So for every passed $5 note, 0.33 have been seized on average. Forthis log-log graph, slopes are elasticities — positive and below one. We do not havedata for this time span for the $1 note; it averages 0.23 for the years 1998 and 2005–7.
This explains our result in Figure 3 (described in Appendix B) that the counterfeit-
passed ratio has risen in the denomination in the USA 1995–2007 (as well as separately
for 1995–99 and 2000–04). This trend also holds in Canada over the span 1980–2005
for all six paper denominations.12 Corollary 3 alsocorrectly predicts that the slopes in
this log-log diagram (i.e. elasticities) are not only positive but also less than 1.
This analysis sheds light on the criminal marketplace. If producers sell to middle-
men, then legal costs are borne by both parties, and average costs overstate the “street
price” of counterfeit notes: Our two expressions for the passing fraction (6) and (18)
from theory and data yield a simple upper bound on these prices:13
street price≤ average costs=c(q[∆]) + ℓ
∆x= f(v[∆]) =
passedseized+ passed
(19)
12For Canada, from 1980-2005, the counterfeit-passed ratiosare respectively 0.095, 0.145, 0.161,0.184, 0.202, and 3.054 over the notes $5, $10, $20, $50, $100, and $1000. Production of the $1000note was discontinued in 2000 to counter money laundering and organized crime.
13We thank Pierre Duguay for this insight; he said the predicted street prices are realistic. In onerecent American case, a Mexican counterfeiting ring discovered this year sold counterfeit $100 notes at18% of face value to distributors, who then resold the counterfeit notes for 25–40% of face value. Themoney was transported across the border by women couriers, carrying the money.
20

0
1
2
3
4
5
6
7
1964 1969 1974 1979 1984 1989 1994 1999 2004
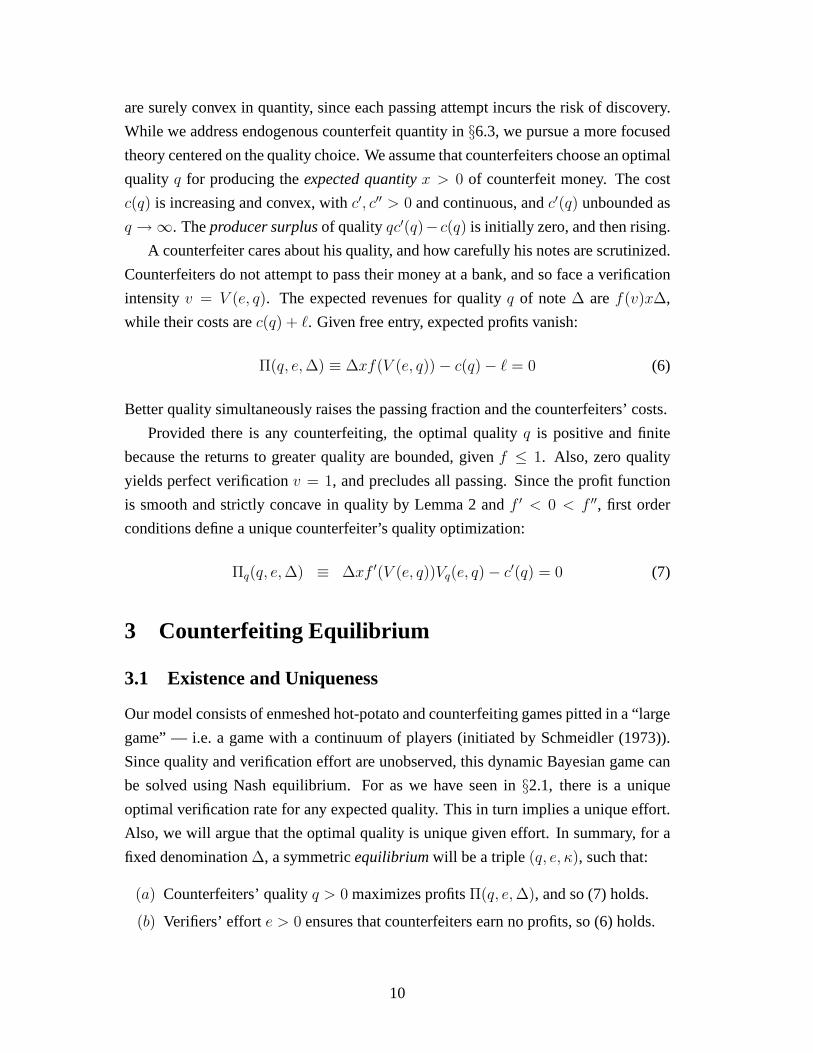
Figure 4:USA Passed and Seized, 1964–2007.The units here are per thousand dollarsof circulation across all denominations. The dashed line represents seizures, and thesolid line passed money. From 1970–85, the vast majority of counterfeit money (about90%) was seized. The reverse holds (about 20%) for 2000–2007. Two down-spikes in1986 and 1996 roughly correspond to the years of technological shifts.
The implied US street price ceilings can be computed from Figure 3, to get $3.37,
$5.95, $9.30, $19.20, $35.70, respectively. Testing this awaits data.
As an aside, if the counterfeit-passed ratio varies across denominations, then so
must the verification rate, by Corollary 3. This empirical regularity is incompatible
with a constant verification rate. It cannot be stochastic but exogenous, as in any paper
that presumes verifiers observe a fixed authenticity signal —like Williamson (2002).
6.2 The Falling Counterfeit-Passed Ratio Over Time
There has been a sea change in the seized and passed time series since 1980. For the
longest time, seized vastly exceeded passed counterfeit money, as seen in Figure 4.
But starting in 1986, and accelerating in 1995, the counterfeit-passed ratio began to
tumble. Tables have turned: By far, most counterfeit money now is passed,14 and the
passing fraction has risen roughly from 10% to 80%. Our theory explains this change.
Appendix B documents two technological revolutions in counterfeiting during this
time span: In the 1980’s, photocopiers became a tool of choice by counterfeiters. Next
14The Annual Reports of the USSS supplied earlier data, and theSecret Service itself gave us morerecent data. Seized is a more volatile series, as seen in Figure 4, as it owes to random, maybe large,counterfeiting discoveries, and is also contemporaneous counterfeit money. By contrast, passed moneyis twice averaged: It has been found by thousands of individuals, and may have long been circulating.
21
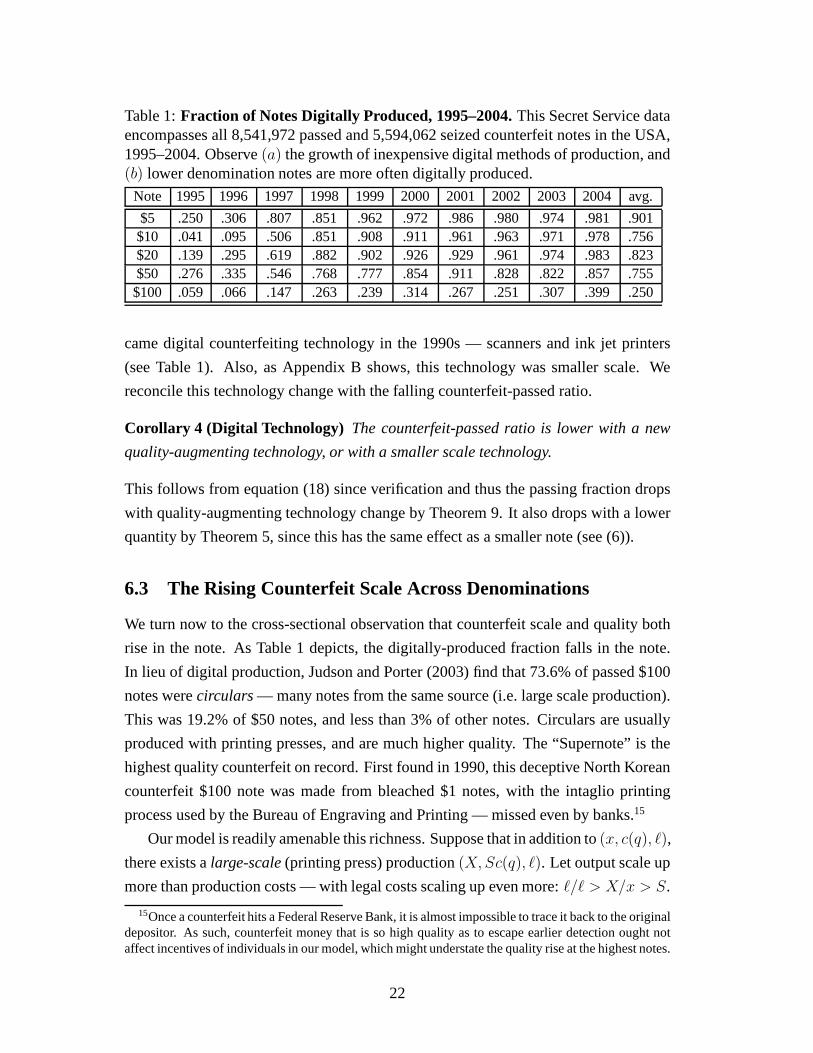
Table 1:Fraction of Notes Digitally Produced, 1995–2004.This Secret Service dataencompasses all 8,541,972 passed and 5,594,062 seized counterfeit notes in the USA,1995–2004. Observe(a) the growth of inexpensive digital methods of production, and(b) lower denomination notes are more often digitally produced.
Note 1995 1996 1997 1998 1999 2000 2001 2002 2003 2004 avg.
$5 .250 .306 .807 .851 .962 .972 .986 .980 .974 .981 .901$10 .041 .095 .506 .851 .908 .911 .961 .963 .971 .978 .756$20 .139 .295 .619 .882 .902 .926 .929 .961 .974 .983 .823$50 .276 .335 .546 .768 .777 .854 .911 .828 .822 .857 .755$100 .059 .066 .147 .263 .239 .314 .267 .251 .307 .399 .250
came digital counterfeiting technology in the 1990s — scanners and ink jet printers
(see Table 1). Also, as Appendix B shows, this technology wassmaller scale. We
reconcile this technology change with the falling counterfeit-passed ratio.
Corollary 4 (Digital Technology) The counterfeit-passed ratio is lower with a new
quality-augmenting technology, or with a smaller scale technology.
This follows from equation (18) since verification and thus the passing fraction drops
with quality-augmenting technology change by Theorem 9. Italso drops with a lower
quantity by Theorem 5, since this has the same effect as a smaller note (see (6)).
6.3 The Rising Counterfeit Scale Across Denominations
We turn now to the cross-sectional observation that counterfeit scale and quality both
rise in the note. As Table 1 depicts, the digitally-producedfraction falls in the note.
In lieu of digital production, Judson and Porter (2003) find that 73.6% of passed $100
notes werecirculars— many notes from the same source (i.e. large scale production).
This was 19.2% of $50 notes, and less than 3% of other notes. Circulars are usually
produced with printing presses, and are much higher quality. The “Supernote” is the
highest quality counterfeit on record. First found in 1990,this deceptive North Korean
counterfeit $100 note was made from bleached $1 notes, with the intaglio printing
process used by the Bureau of Engraving and Printing — missedeven by banks.15
Our model is readily amenable this richness. Suppose that inaddition to(x, c(q), ℓ),
there exists alarge-scale(printing press) production(X, Sc(q), ℓ). Let output scale up
more than production costs — with legal costs scaling up evenmore:ℓ/ℓ > X/x > S.
15Once a counterfeit hits a Federal Reserve Bank, it is almost impossible to trace it back to the originaldepositor. As such, counterfeit money that is so high quality as to escape earlier detection ought notaffect incentives of individuals in our model, which might understate the quality rise at the highest notes.
22
For the chance of being found out rises more than proportionately with output (see
footnote 8). This inequality ensures that neither technology is globally preferred. Since
quantity and denomination are complements in profits, we getpart(a) below:
Corollary 5 (Scale) (a) Counterfeiters use large scale production for the highest notes.
(b) Counterfeit quality jumps up when switching to the larger scale.
We twice apply our theory for part(b): First, legal costs rise moving from(x, c(q), ℓ)
to (x, c(q), ℓ/S), asℓ/S > ℓ. By Theorem 10, quality rises at least at the highest
notes. Next, shifting to(X/S, c(q), ℓ/S) yields the same quality as(X, Sc(q), ℓ).
SinceX/S > x, this amounts to a higher note, and quality further rises by Theorem 4.
This corollary is silent about how the verification rate changes at the jump. Higher
legal costs push down verification at the jump, while a highercurrency lifts it up. In
other words, verification falls if the legal cost scale up much more than the output does.
7 Evidence from Passed Counterfeit Money
7.1 Passed Counterfeit Rates Across Denominations
We turn to passed counterfeit money, fleshing out implications of the hot potato game.
Figure 5 plots at the left the average fractionp[∆] of passed $1 notes for 1990–1996,
and of the $5, $10, $20, $50, $100 notes for 1990–2004. These ratios per million have
averaged1.96, 19.46, 71.21, 72.03, 49.94, 81.43, respectively. See Appendix B.16
The total supply of counterfeit and genuine∆ notes hasvalueM [∆] > 0; we
treat this as invariant to the supply of counterfeit notes. Recall that the valueP [∆]
of passed money of denomination∆ is the discovery rateρ[∆] times the circulating
counterfeit moneyκ[∆]M [∆]. Thepassed ratep[∆] ≡ P [∆]/M [∆] is the fraction of
all circulating∆-notes per period that are discovered. Then we have from equation (3):
p[∆] = ρ[∆]κ[∆] =q[∆]χ′(v[∆])
∆=
marginal verification costdenomination
(20)
The implied verification costs in (20) are easily measured by∆p[∆]. These are quite
miniscule even for the highest notes. The passed rate is at most 1 per 10,000annually.
Suppose the $100 note transacts at least four times per year.Then the passed ratep[∆]
is at most 1 in 40,000, and marginal verification costs are at most $100/40,000, orone
16The common claim that the most counterfeited note domestically on an annualized basis is the $20is false over our time span. Accounting for the higher velocity of the $20, on a per-transaction basis (therelevant measure for decision-making), the $100 note is unambiguously the most counterfeited note.
23

($100, 81)
($50, 50)($20, 72)
($10,71)
($5, 19)
($1, 2) Log Denomination
Lo
g (
P/M
)
(5!,3.5)
(10!,10)
(20!,64) (50!,82)
(100!,78)
(200!,162)
(500!,13)
Lo
g (
P/M
)
Log Denomination
Figure 5:Passed Over Circulation, Dollar and Euro.At left are the average ratios ofpassed domestic counterfeit notes to the (June) circulation of the $1 note for 1990-96,1998, 2005–7, and the $5, $10, $20, $50, $100 notes for 1990–2007, all scaled by106.At right is the Euro data. The data points are labeled by the pairs (∆, P (∆)/M(∆)).
quarter penny per note. Yet such tiny verification costs drive our theory. Surprisingly,
incentives explain behavior even when costs are very small.
Since quality and verification vanish as∆ tends down to∆ > 0 by Theorem 2, the
marginal verification cost in (20) vanishes as∆ ↓ ∆ > 0. Without appealing to the
elasticity or log-concavity assumptions, Theorem 2 and equation (20) at once imply:
Corollary 6 (Passed Money)(a) The passed ratep[∆] vanishes as the note∆ ↓ ∆.
(b) The passed-ratep[∆] drops for very large notes under Theorem 7’s assumptions.
Corollary 6(a) obtains practically without caveat, and is strongly predictive of the
data. For instance, the counterfeiting rate (11) in our example in §3.2 yields a passed
rate p = ρ(v)κ proportional to∆−1+1/A(1 − ∆/∆)B+1/A−1. This vanishes for∆
near∆, given anyB > 1. Corollary 6(b) predicts a falling passed rate at theoretically
high enough notes, but this is not apparent in the US dollar data. Yet the Euro offers
two higher value notes; the passed rate clearly drops at the 500 Euro note in Figure 5.
The counterfeiting rateκ[∆] is unobserved, and the passed-ratep[∆] = ρ[∆]κ[∆]
is its observable manifestation. While the passed rate is animperfect proxy for the
counterfeit rate, the Secret Service and the Federal Reserve may treat them as synony-
mous. Since the discovery rateρ(v[∆]) rises in the note,p[∆] is an increasing multiple
of κ[∆]. So its peak must occur at a higher note, as seen in Figure 2. Also,the passed
rate will increasingly understate the actual counterfeiting problem at low notes.
Our theory assumes that notes trade hands once per “period”.Unlike with the
counterfeit-passed ratio, the passed rate is a flow over a stock, which skews theper
transactionmeaning. Yet the velocity is intuitively falling in the note.17 The higher the
17Lower denomination notes wear out faster, surely due to a higher velocity. Longevity estimates by
24
note, fewer transaction opportunities a year represents. Interpreting annualized passed
data in this light, the relevant “per transaction passed rate” rises from $50 to $100
note, and might always rise in the denomination. Yet this falling velocity surely cannot
account for the more than twelve-fold drop in the passed rateat the 500 Euro note.
7.2 The Stable Passed Rate Over Time
We see in Figure 4 that while the seized levels have dramatically fallen, passed money
rates have proven quite stable through time. Our theory makes sense of this. The
conflict between quality and verification effort induces thequality and verification rate
variables to co-move. Quality-augmenting technological changes raises counterfeit
quality and lessens the verification rate (Theorem 9). Likewise as legal costs change,
quality and the verification rate move in opposition for mostnotes (Theorem 10).
The passed rate is also perfectly buffered to changes in banking verification rates.
The counterfeit rateκ explicitly depends in (3) on the banking verification rateα and
banking chanceβ, while the passed ratep in (20) does not. So if banks more effectively
verify, then the counterfeit rate falls while the passed rate is constant. While there is
less circulating counterfeit money with greaterα or β, it is found at a faster rate. On
balance, these effects exactly cancel, and the verificationrate only indirectly affects
the passed counterfeit money through the marginal verification cost.
8 Evidence from Passed Money in the Banking System
We turn to the last piece of evidence for our costly stochastic verification story, this
one solely applicable to money. The banking sector offers a reverse test of the model
— for unlike how passed money is found, counterfeit money hitting bankshas missed
earlier detection. Ideally, this data would reflect just ourbehavioral assumptions of
verifiers, and not of banks. While not quite possible, the evidence is still compelling.
We have maintained (bank model #1) that banks find counterfeit notes at a fixed
rateα ∈ (0, 1). The equilibrium discovery rateρ[∆] = βα + (1 − β)v[∆] thus rises
in the note. Since we assume that counterfeiters do not attempt to pass their money
in a bank, this simple model of bank behavior is moot for equilibrium predictions of
the effort, quality, and verification rate (as seen in our example in §3.2). While the
counterfeiting rate expression reflects the discovery rate, the passed rate does not.
the Federal Reserve Bank of NY [www.newyorkfed.org/aboutthefed/fedpoint/fed01.html] are 1.8, 1.3,1.5, 2, 4.6, and 7.4 months, respectively, for $1,. . . ,$100.Observe the disproportionate upward jumpfrom $20 to $50 and then from $50 to $100. FRB (2003) has close longevity estimates.
25

0.00
0.10
0.20
0.30
0.40
0.50
0.60
0.70
$1 $5 $10 $20 $50 $100
FR
B P
assed
Note
s S
hare
Figure 6:FRB Share of Passed Notes.The bars are the fractions of all passed notesacross denominations found by Federal Reserve Banks in 1998, 2002, and 2005.
Two other parsimonious models of bank behavior might betterapply for all notes.
Since we argued that counterfeit money produced by large scale printing presses occurs
at high notes and has a distinctly better quality by Corollary 5, we could just posit
a lower fixed bank discovery rateα < α for these higher notes (bank model #2).
Alternatively, we could build more closely on our verification model (bank model #3):
Here, we venture the same verification cost function for banks as verifiers — it costs
effort qχ(α) to check a qualityq note with intensityα — but that banks verify all notes
with equal diligence — spending the same effortb = qχ(α) per note.18 In this case,
unlike bank model #2, the bank verification rate always fallsin ∆ due to the rising
counterfeit quality, but again drops discontinuously if quality jumps.
Commercial banks transfer damaged or unneeded notes to the Federal Reserve
Banks (FRB). The FRB found 21% of all passed counterfeits in 2002, but a much
larger portion of the low denomination notes.A priori, this reverse monotonicity might
seem surprising since the lowest notes are easiest for verifiers to catch. This anomaly
offers more support for our model, and is fleshed out more fully in Figure 6.19
18Bank tellers told us that they were neither encouraged nor incentivized to treat different notesdifferently. They simply go by the feel of the note, and skip its other security features. That banks aresurely more effective verifiers is then captured by assuminga large enough parameterb.
19See Table 6.1 in Treasury (2000), Table 6.3 in Treasury (2003), and Table 5 in Judson and Porter(2003).
26
To begin with, observe that intuitively, the fractionφ[∆] of notes that banks transfer
to the FRB each period should fall in∆, since longevity rises in the denomination. We
first consider banks, for which we lack data, but have less couched predictions.
Corollary 7 (Bank Passed Note Share)Assume the transfer rateφ does not fall too
fast in∆. Then the fraction of passed∆ notes found by banks falls in∆ in bank models
#1–#3. The bank share falls less, or rises more the faster transfer rateφ drops.
To see this, observe that a bank finds a passed note when(i) it is fake (chanceκ), and
(ii) the last verifier prior to the bank missed it (chance1− v), and then(iii) deposited
it in the bank (chanceβ), and then(iv) the bank finds it (chanceα). Conditional on(i),
events(ii)–(iv) are independent. So the reciprocal bank share of passed notes is:
1
µ[∆]=
passed notes found by verifiers, commercial banks, or an FRBpassed notes found by commercial banks
=κv + κ(1 − v)βα + κ(1 − v)β(1 − α)φ
κ(1 − v)βα=
v
(1 − v)βα+ 1 +
(1 − α)φ
α
The nonconstant terms are (resp.) increasing and falling due toφ. All told, the bank
shareµ[∆] of passed notes falls in∆ if the transfer chanceφ[∆] does not fall too fast.
Corollary 8 (FRB Passed Notes Share)Assume the transfer rateφ does not fall too
fast in∆. Then the fraction of all passed∆ notes found by an FRB falls under bank
model #1; under bank models #2 and #3, it can rise when qualityrises fast enough.
The logic for this result builds on the last. An FRB finds a passed note when events
(i)–(iii) hold, and then(iv)′ the bank misses the counterfeit (chance1 − α), and(v)
transfers it to an FRB (chanceφ). Unlike with commercial banks, the counterfeit buck
stops at an FRB, and it is surely found. The reciprocal of theFRB shareσ[∆] is then:
1
σ[∆]=
κv + κ(1 − v)βα + κ(1 − v)β(1 − α)φ
κ(1 − v)β(1 − α)φ=
v
(1 − v)β(1 − α)φ+
α
(1 − α)φ+1
Write the first two terms as the product of two factors: The first factor1/φ is rising.
Under bank model #1, the second factor is an increasing term plus a constant, and thus
the product is increasing. Under bank models #2 and #3, the second factor can decrease
fast enough to swamp the first term: In bank model #2,α drops down, and so greater
quality depresses the bank discovery rateα more thanv rises, and both terms can drop.
In bank model #3,α can continuously drop if quality quickly rises in the note.
This corollary makes sense of the data in Figure 6. At low denominations, notes are
mostly made digitally, quality rises slowly, and the FRB share is falling. In this range,
27
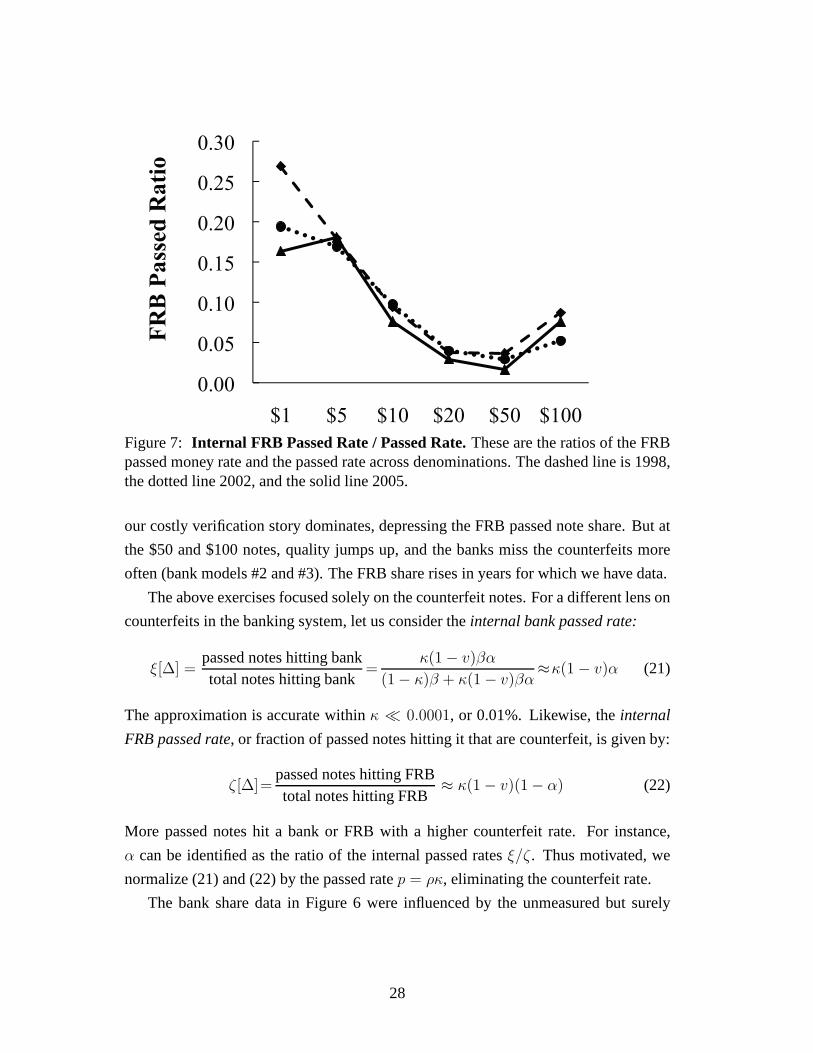
0.00
0.05
0.10
0.15
0.20
0.25
0.30
$1 $5 $10 $20 $50 $100
FR
B P
assed
Rati
o
Figure 7: Internal FRB Passed Rate / Passed Rate.These are the ratios of the FRBpassed money rate and the passed rate across denominations.The dashed line is 1998,the dotted line 2002, and the solid line 2005.
our costly verification story dominates, depressing the FRBpassed note share. But at
the $50 and $100 notes, quality jumps up, and the banks miss the counterfeits more
often (bank models #2 and #3). The FRB share rises in years forwhich we have data.
The above exercises focused solely on the counterfeit notes. For a different lens on
counterfeits in the banking system, let us consider theinternal bank passed rate:
ξ[∆] =passed notes hitting banktotal notes hitting bank
=κ(1 − v)βα
(1 − κ)β + κ(1 − v)βα≈κ(1 − v)α (21)
The approximation is accurate withinκ ≪ 0.0001, or 0.01%. Likewise, theinternal
FRB passed rate, or fraction of passed notes hitting it that are counterfeit, is given by:
ζ [∆]=passed notes hitting FRBtotal notes hitting FRB
≈ κ(1 − v)(1 − α) (22)
More passed notes hit a bank or FRB with a higher counterfeit rate. For instance,
α can be identified as the ratio of the internal passed ratesξ/ζ. Thus motivated, we
normalize (21) and (22) by the passed ratep = ρκ, eliminating the counterfeit rate.
The bank share data in Figure 6 were influenced by the unmeasured but surely
28
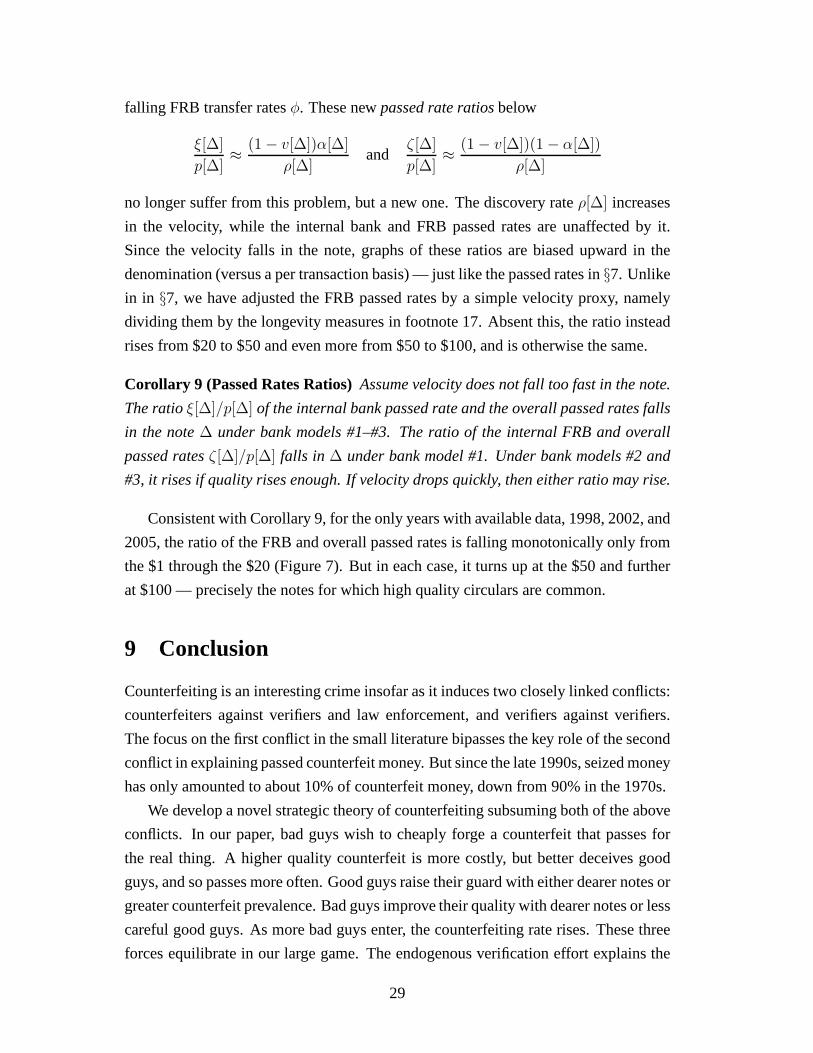
falling FRB transfer ratesφ. These newpassed rate ratiosbelow
ξ[∆]
p[∆]≈
(1 − v[∆])α[∆]
ρ[∆]and
ζ [∆]
p[∆]≈
(1 − v[∆])(1 − α[∆])
ρ[∆]
no longer suffer from this problem, but a new one. The discovery rateρ[∆] increases
in the velocity, while the internal bank and FRB passed ratesare unaffected by it.
Since the velocity falls in the note, graphs of these ratios are biased upward in the
denomination (versus a per transaction basis) — just like the passed rates in§7. Unlike
in in §7, we have adjusted the FRB passed rates by a simple velocity proxy, namely
dividing them by the longevity measures in footnote 17. Absent this, the ratio instead
rises from $20 to $50 and even more from $50 to $100, and is otherwise the same.
Corollary 9 (Passed Rates Ratios)Assume velocity does not fall too fast in the note.
The ratioξ[∆]/p[∆] of the internal bank passed rate and the overall passed ratesfalls
in the note∆ under bank models #1–#3. The ratio of the internal FRB and overall
passed ratesζ [∆]/p[∆] falls in ∆ under bank model #1. Under bank models #2 and
#3, it rises if quality rises enough. If velocity drops quickly, then either ratio may rise.
Consistent with Corollary 9, for the only years with available data, 1998, 2002, and
2005, the ratio of the FRB and overall passed rates is fallingmonotonically only from
the $1 through the $20 (Figure 7). But in each case, it turns upat the $50 and further
at $100 — precisely the notes for which high quality circulars are common.
9 Conclusion
Counterfeiting is an interesting crime insofar as it induces two closely linked conflicts:
counterfeiters against verifiers and law enforcement, and verifiers against verifiers.
The focus on the first conflict in the small literature bipasses the key role of the second
conflict in explaining passed counterfeit money. But since the late 1990s, seized money
has only amounted to about 10% of counterfeit money, down from 90% in the 1970s.
We develop a novel strategic theory of counterfeiting subsuming both of the above
conflicts. In our paper, bad guys wish to cheaply forge a counterfeit that passes for
the real thing. A higher quality counterfeit is more costly,but better deceives good
guys, and so passes more often. Good guys raise their guard with either dearer notes or
greater counterfeit prevalence. Bad guys improve their quality with dearer notes or less
careful good guys. As more bad guys enter, the counterfeiting rate rises. These three
forces equilibrate in our large game. The endogenous verification effort explains the
29

rising counterfeit-passed ratio at low denominations, while variable quality counterfeit
production justifies why this rise eventually tapers off. The model can capture changes
in law enforcement, counterfeiting technology, or verification ease. It can explain a
new set of stylized facts about counterfeiting across denominations that we identify.
On the normative side, we uncover a novel limit on the welfarelosses of counter-
feiting. We also predict that the unobserved counterfeiting rate is hill-shaped. We shed
new light on the development of fiat currency — i.e. whose facevalue greatly exceeds
its intrinsic cost: Since the counterfeiting rate is the ratio of verification to production
costs, fiat currency required easily verified characteristics not easily reproduced.
The discovery chance of counterfeits depends on the verifiers’ effort and counter-
feit quality. Endogenous verification is a new assumption inthis literature. Among the
many possible functional forms for the verification rate, wehave found an especially
tractable one. Making a log-concavity assumption (possibly new for cost functions),
we can rationalize the cross-sectional and time series properties of passed and seized
money. This verification function should be useful in understanding counterfeit goods,
or other economic settings where a conflict of wills determines a monitoring chance.
The passing game is a new use of supermodular games in monetary economics.20
Finally, we return to the literature. The existing general equilibrium literature lets
the price of money equilibrate the model. This is also done inthe best papers on
counterfeit goods Gene and Shapiro (1988). Our point of departure is thus to replace
a priced asset with a new decision margin — individuals can continuously adjust their
verification effort. We feel that a fixed value of notes is a good approximation for
the USA now we examine where counterfeit notes are extremelyrare. It agrees with
the common observation that higher denominations may be declined if verification is
too hard (“No $100 bills accepted”), but are almost never discounted.21 Endogenizing
the price of money cannot explain thecurrentvariation in seized or passed counterfeit
levels across notes, since we have argued that one needs a variable varification effort.
Not surprisingly, there has been no attempt by the existing literature to match the data.
One could imagine a general equilibrium setting — combiningour insights and
this literature — yielding a model where notes are both verified and discounted.22 That
model would best capture runaway counterfeiting during saythe Confederacy. It would
also help understand counterfeit goods, where the face value price is endogenous.
20Diamond (1982) developed a search-matching macroeconomics model that is supermodular in theproduction costs. Our monetary model is supermodular in a pairwise effort choice. Diamond studiesmultiple equilibria, while ours is nested with an entry gamethat forces a unique equilibrium.
21Notes a hardly ever discounteddomestically. Older $50 and $100 bills may be declined abroad.22Our FOIA to the Secret Service asking for data on passed moneyin the banking sector was ignored.
30

A Appendix: Omitted Proofs
A.1 Existence and Uniqueness: Proof of Theorem 1
The existence proof proceeds in(q, v) space, and the uniqueness proof in(e, q) space.
STEP 1: EXISTENCE FOR∆ > ∆. Assume∆ > ∆. We exhibit a solution to the zero
profit equation (6) and revised quality FOC (8). Sincef ′ < 0 < c′, the zero profits
condition (14) implicitly defines a continuous and decreasing functionq = Q0(v). We
must haveQ0(0) > 0, becausec(Q0(0)) = ∆xf(0) − ℓ > 0. Since∆xf(0) > ℓ
andf(1) = 0, we may choosev < 1 so that∆xf(v) = ℓ. ThenQ0(v) → 0 as
v → v. By the Implicit Function Theorem (IFT), becauseqc′(q) is strictly increasing,
the quality FOC (8) implicitly defines a differentiable function q = Q1(v). Since the
limit vχ′(v)/χ(v) exists and is positive asv → 0, both sides of (8) vanish, and so
Q1(0) = 0. Easily, (8) is positive atv = v, and thusQ1(v) > 0. GivenQ1(0) = 0 <
Q0(0) andQ1(v) > 0 = Q0(v), the Intermediate Value Theorem yieldsv ∈ (0, v)
with Q0(v) = Q1(v). But then0 < v < 1 and0<q =Q1(v)=Q0(v)<∞. Soκ > 0
by (2). Finally, sinceQ0(v), Q1(v) are differentiable in∆, so isq[∆] andv[∆]. (This
conclusion would also have followed by applying the IFT on the system (6) and (8).)
STEP 2: UNIQUENESS. To see uniqueness, we return to(q, e) space. Assume two
solutions(q1, e1) and(q2, e2). Thenq1 6= q2, for if q1 = q2 thene1 = e2, since profits
fall in effort. WLOG, letq1 < q2. Consider the line integral of profitsΠ(q, e, ∆) from
(q1, e1) to (q2, e2) along the smooth curveH = {(q, e) : Πq(q, e, ∆) = 0, q1 ≤ q ≤ q2}
where quality is optimal. SinceΠe < 0, we arrive at the contradiction:
0 − 0 = Π(q2, e2, ∆) − Π(q1, e1, ∆) =
∫
H
(Πq, Πe) · (dq, de) =
∫ e2
e1
Πede > 0 �
A.2 Initial Quality, Effort, and Verification: Proof of Theo rem 2
By continuity of (6) and (7), the limits as∆ ↓ ∆ of e andq, and sov, exist.
STEP 1: QUALITY . If any limit q = limn→∞ q[∆n] > 0, thenΠ(q, v, ∆) = ∆f(v) −
c(q) − ℓ ≤ ∆f(0) − ℓ < 0. But negative profits near∆ = ∆ is impossible. Soq = 0.
STEP 2: EFFORT. If any limit e = limn→∞ e[∆n] > 0, thenχ(v[∆]) = e[∆]/q[∆]
must explode as∆ ↓ ∆. This is impossible becauselog χ is concave.
STEP 3: VERIFICATION. If any limit v = limn→∞ v[∆n] > 0, where∆n ↓ ∆, then
limn→∞
Πq(q[∆n], e[∆n], ∆n) = Υf(v)
1 − v·
χ(v)
vχ′(v)· ∆ · lim
n→∞
v[∆n]
q[∆n]− c′(0)
31

by the quality FOC (8). Sinceq[∆] → 0 as∆ ↓ ∆ by Step 2, andc′(0) < ∞ by cost
convexity, it is impossible thatΠq(q[∆n], e[∆n], ∆n) = 0 at all∆n. Hence,v = 0. �
A.3 Quality Rises in the Denomination: Proof of Theorem 4
Claim 1 (Strict SOC) The second order condition at an optimum is strict:Πqq < 0.
A strict second order condition is consistent with uniqueness proven in Theorem 1.
PROOF OFCLAIM : The SOC for maximizingΠ(q, e, ∆) is locally necessary:
Πqq = ∆xf ′Vqq + ∆xf ′′V 2q − c′′ ≤ 0 (23)
The total derivative of the quality first order condition (7)is:
0 = Πqq q + Πqee + Πq∆ (24)
For a contradiction, assumeΠqq = 0. Then (12) and (24) are linearly dependent. Since
Πqe = ∆ (f ′Vqe + f ′′VeVq) andΠq∆ = f ′Vq, this and Lemmas 1 and 2 give:
f ′Vqe + f ′′VeVq
f ′Vq
=f ′Ve
f⇒ 0 <
Vqe
Vq
=
(
f ′
f−
f ′′
f ′
)
Ve
This is a contradiction, forVe > 0 andf ′/f < f ′′/f ′ by strict log-concavity off . �
PROOF OFTHEOREM 4: SinceΠqq < 0, q > 0 follows from (24) ifΠqee + Πq∆ > 0:
0 < ∆ (f ′Vqe + f ′′VeVq) e + f ′Vq = −q (f ′Vqe + f ′′VeVq) fχ′/f ′ + f ′Vq
=
(
fχ
χ′
(
χ′
χ−
χ′′
χ′
)
+f ′′f
f ′
χ
χ′− f ′
χ
χ′
)
1
q
This is positive, since by strict log-concavity off and log-concavity ofχ, we have
(
−f ′
f
χ
χ′
)′
=f ′′
f ′−
f ′
f+
χ′
χ−
χ′′
χ′> 0 (25)
A.4 Verification Bound in the Denomination: Proof of Theorem5
Differentiating the zero profit condition (14) in∆,
c′q = ∆xf ′v + xf (26)
32

Integrate (26) usingq≥0, the boundary conditionv[∆]=0, and the definition (5) ofΥ:
Υ
1 − vv ≤ 1/∆ ⇒ −Υ log(1−v[∆]) ≤ log(∆/∆) ⇒ 1−v[∆] ≥
(
∆
∆
)1/Υ
EXPLICIT FORMULA FORMULA FOR v. Differentiating the first order condition (8)
in ∆,
(qc′′ + c′)q + ∆xf ′χ
χ′
(
f ′′
f ′+
χ′
χ−
χ′′
χ′
)
v = −xf ′χ
χ′
Substituting forq from the differentiated zero profit condition (26), we discover
(∆f ′v + f)(qc′′ + c′)/c′ + ∆f ′χ
χ′
(
f ′′
f ′+
χ′
χ−
χ′′
χ′
)
v = −f ′χ
χ′
Multiplying by −χ′/(fχ), using−f ′(v)/f(v) = Υ/(1 − v), and regrouping terms:
∆Υ
1 − vv =
f ′
f+ (qc′′/c′ + 1)χ′
χ
f ′
f+ χ′
χ(qc′′/c′ + 1) +
(
f ′′
f ′− f ′
f+ χ′
χ− χ′′
χ′
) (27)
In light of inequality (25),v > 0 if the above numerator is positive. This obtains iff
qc′′/c′ > −χ
χ′
(
χ′
χ+
f ′
f
)
= −ℓ − [qc′(q) − c(q)]
∆xf(28)
where the last term is (6) minusq times (7). This is positive when producer surplus
qc′(q) − c(q) < ℓ. Then (28) holds for allℓ > 0, since(qc′/c)′ ≥ 0 for all q implies:
ℓ >q[(c′)2 − cc′′] − cc′
c′ + qc′′=
−c2
c′ + qc′′
(
qc′
c
)′
A.5 Proof that Quality Explodes: Proof of Theorem 6
Sincec(q) ≥ 0, we have∆xf(0)(1 − v)Υ ≥ ℓ, and so by the FOC (8),
qc′(q) = Υ∆x(1 − v)Υ−1 χ(v)
χ′(v)≥ Υ∆x
(
ℓ
∆xf(0)
)1−1/Υχ(v)
χ′(v)= O(∆1/Υ)
χ(v)
χ′(v)
Sincev increases in∆ by Theorem 5, andχ(v)/χ′(v) is nondecreasing by log-concavity
of χ, the right side explodes as∆ ↑ ∞. Thusqc′′(q) ↑ ∞, and so qualityq → ∞. �
33

A.6 The Counterfeiting Rate Across Notes: Proof of Theorem 7
Substituting the formula forc′(q) from (13) into counterfeiting rate (3), we find:
κ(v) = xf(0)(1 − v)Υχ′(v)
ρ(v)
q
c(q) + ℓ≤
xf(0)χ′(1)
αβc′(q)
whereq = q minimizes(c(q)+ ℓ)/q, i.e., with producer surplusqc′(q)− c(q) = ℓ. But
if c′(q) ≥ c0qη for all q, then producer surplusℓ is at mostηc0q
η+1/(η + 1), and so:
κ(v) ≤xf(0)χ′(1)
αβc0
(
ηc0
ℓ(η + 1)
)η/(η+1)
<xf(0)χ′(1)
αβ(c0ℓη)1/(η+1)
A.7 Social Costs of Counterfeiting: Proof of Theorem 8
Since counterfeiters earn zero profits (6) in equilibrium, andf(v) = (1−s(v))(1−v) ≤
1 − v, the average costs of counterfeiting a∆ note are at most(1 − v)∆:
Π = 0 ⇒ [xc(q) + ℓ]/x = f(v)∆ ≤ (1 − v)∆
Next, since verifiers weakly prefer to choosev to no verification, the loss-reduction
benefits of verifying exceed the verification costs in (1). Soκ(v)vρ(v)∆ ≥ qχ(v). Let
T (v) be the expected number of verifications of a circulating counterfeit note. Then
the expected total verifying costs until a circulating counterfeit∆ note is found are:
qχ(v)T (v) = qχ(v)/ρ(v) ≤ κ(v)v∆
whereT (v) = 1/ρ(v), since it is the mean of a geometric random variable.23�
A.8 Technological Change: Proof of Theorem 9
PART I: Fix ∆. Abusing notation, write profits asΠ(q, e, τ), whereτ = 1/t. Denote
total derivatives inτ of any equilibrium variablez by z. Note that all derivatives int
have the opposite sign of those inτ that we find below. We start at the knife-edge case
of barely quality-reducing technological progress where costs have the formc(τq).
Assumeτ = 1. Profits are higher with a better technology, sinceΠτ = −qc′(τq) < 0.
STEP 1: EFFORT. Differentiate the zero profit conditionΠ(q, e, τ) ≡ 0 in τ to get
Πq q + Πee + Πτ = 0. But Πq = 0 by the quality FOC (7), and thuse=−Πτ/Πe < 0.
23If we asked this question for an ex ante counterfeit note, then the expected number of verificationswould be slightly greater, since we assume that counterfeiters do not try to pass their note in a bank.
34
STEP 2: QUALITY . Substitute thee expression into the derivative ofΠq ≡ 0 in τ :
Πqq
Πτq = −
Πqe
Πτe −
Πqτ
Πτ=
Πqe
Πe−
Πqτ
Πτ(29)
If τ = 1, thenΠqτ = −c′(q) − qc′′(q), and soΠqτ/Πτ = 1/q + c′′(q)/c′(q). Using
Πqe = ∆[f ′Veq + f ′′VeVq] andΠe = ∆f ′Ve, and then Lemmas 1 and 2, we discover
Πqq
Πτq =
Veq
Ve+ Vq
f ′′
f ′−
(
1
q+
c′′
c′
)
= Vq
(
f ′′
f ′−
f ′
f+
χ′
χ−
χ′′
χ′
)
+ Vqf ′
f−
(
1
q+
c′′
c′
)
(30)
Dividing this byVq < 0 yields the positive denominator of (27). SinceΠqq < 0 by
Claim 1, andΠτ = −qc′ < 0, we haveq < 0. So quality rises in the parametert.
STEP 3: VERIFICATION. Sinceχ(v) = e/q, the verification slopev shares the sign of
qe − eq. Substitutinge = −Πτ/Πe andq from (29),v shares the sign of
−q2
(
Πqq
Πe
)
+ eq
(
Πqe
Πe−
Πqτ
Πτ
)
sinceΠqq, Πτ < 0. Substituting from (23) and (24) forΠqq andΠqe, v has the sign of:
−q2[∆xf ′Vqq + ∆xf ′′(Vq)
2 − c′′(q)]
x∆f ′Ve+eqVq
(
f ′′
f ′+
χ′
χ−
χ′′
χ′
)
−e
(
1 +qc′′
c′
)
(31)
Sincec′ = ∆xf ′Vq, the terms inc′′ cancel, and what remains vanishes. Sov = 0.
PART II: QUALITY -REDUCING OR QUALITY-AUGMENTING PROGRESS. Define the
functionQ(q, τ) ≡ Q(q, 1/τ). Consider the cost function familyc(Q(q, τ)). At τ =
1, strictly quality-reducing technological progress obeysQqτ/Qτ < Qq/Q = 1/q,
sinceQ(q, 1) ≡ q impliesQq(q, 1) = 1. As in Step 1,e = −Πτ/Πe < 0, since
Πτ = −c′(q)Qτ < 0. The proof thatv = 0 using (31) withQ(q, τ) = qτ now yields
v > 0 since:Πqτ
Πτ=
c′(q)Qqτ + c′′(q)Qτ
c′(q)Qτ<
1
q+
c′′(q)
c′(q)
If effort rises and verification falls in the parametert, then quality must have risen.
Verification falls with quality-augmenting progress by analogy, while the proof in
Step 2 that quality rises is more clearly true. �
35
A.9 Changing Legal Costs: Proof of Theorem 10
Abusing notation, write profits asΠ(q, e, ℓ), and the derivative inℓ of a variablez asz.
STEP 1: EFFORT. Differentiate the zero profit conditionΠ(q, e, ℓ) ≡ 0 in ℓ to get
Πee + Πℓ = 0. Soe = 1/Πe < 0 asΠℓ = −1.
STEP 2: THE LEAST NOTE ∆. Effort vanishes approaching the least counterfeit
note∆, and cannot drop further. To continue to earn zero profits,∆ must rise.
STEP 3: THE VERIFICATION RATE. We modify the proof of Theorem 5. If we
differentiate the zero profit conditionΠ(q, qχ(v), ∆) = ∆f(v)− c(q)− ℓ = 0 in ℓ, we
getc′q = ∆f ′v − 1. Differentiating this identity once more inℓ yields
(qc′′ + c′)q + ∆f ′χ
χ′
(
f ′′
f ′+
χ′
χ−
χ′′
χ′
)
v = 0 (32)
Substitutingq = (∆f ′v − 1)/c′ as in Step 2 of Appendix A.4:
∆f ′(v)v =(qc′′/c′ + 1)χ′
χ
f ′
f+ χ′
χ(qc′′/c′ + 1) +
(
f ′′
f ′− f ′
f+ χ′
χ− χ′′
χ′
)
We proved after (27) that the denominator is positive, and sov < 0.
STEP 4: QUALITY . If Υ = 1, thenf ′′ = 0, andq andv share the same negative sign,
by (32): If Υ > 1, thenf ′′/f ′ = (1−Υ)/(1− v) < 0 explodes nearv = 1. The factor
on v in (27) is then negative at largev < 1 (it explodes to−∞ asv ↑ 1), and positive
at smallv > 0, since theχ difference explodes. Soq > 0 at large notes. �
B Appendix: Discussion of Data
Our analysis has been graphical, as our claims about slopes are trivially statistically
significant, given the massive numbers of notes (in the thousands). We have done
pooledt-tests as well, but have excluded these, since allt statistics exceeded 5.
1. Data on Seized Money: Figure 3.
The Secret Service has given us data for 1995–2004 on Columbian counterfeits
(family C-8094) passed and seized domestically by denomination, as well as an aggre-
gate across all notes, including foreign and domestic passed and seized. Also, we have
data for 2005–2007 that specifically separates foreign and domestic originated passed
and seized. For 1995–2004, we have excised the Columbian counterfeit data — which
are the largest portion of foreign counterfeits (especially for the $100 note). But the
36
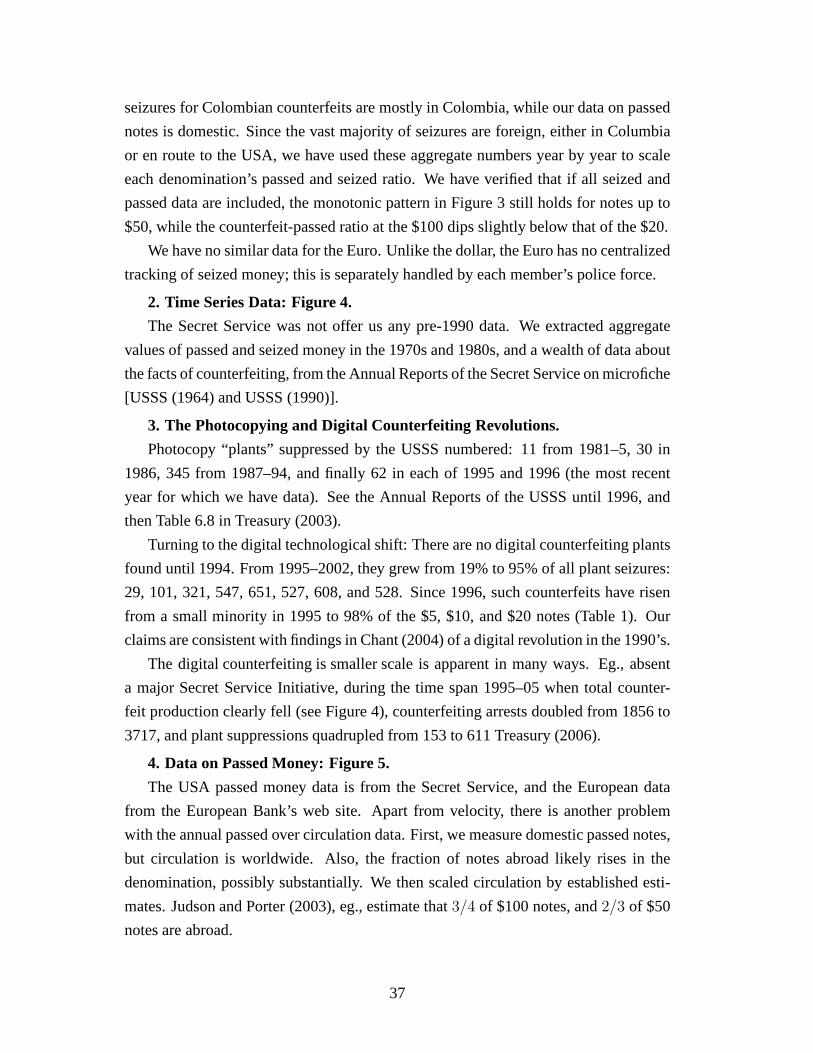
seizures for Colombian counterfeits are mostly in Colombia, while our data on passed
notes is domestic. Since the vast majority of seizures are foreign, either in Columbia
or en route to the USA, we have used these aggregate numbers year by year to scale
each denomination’s passed and seized ratio. We have verified that if all seized and
passed data are included, the monotonic pattern in Figure 3 still holds for notes up to
$50, while the counterfeit-passed ratio at the $100 dips slightly below that of the $20.
We have no similar data for the Euro. Unlike the dollar, the Euro has no centralized
tracking of seized money; this is separately handled by eachmember’s police force.
2. Time Series Data: Figure 4.
The Secret Service was not offer us any pre-1990 data. We extracted aggregate
values of passed and seized money in the 1970s and 1980s, and awealth of data about
the facts of counterfeiting, from the Annual Reports of the Secret Service on microfiche
[USSS (1964) and USSS (1990)].
3. The Photocopying and Digital Counterfeiting Revolutions.
Photocopy “plants” suppressed by the USSS numbered: 11 from1981–5, 30 in
1986, 345 from 1987–94, and finally 62 in each of 1995 and 1996 (the most recent
year for which we have data). See the Annual Reports of the USSS until 1996, and
then Table 6.8 in Treasury (2003).
Turning to the digital technological shift: There are no digital counterfeiting plants
found until 1994. From 1995–2002, they grew from 19% to 95% ofall plant seizures:
29, 101, 321, 547, 651, 527, 608, and 528. Since 1996, such counterfeits have risen
from a small minority in 1995 to 98% of the $5, $10, and $20 notes (Table 1). Our
claims are consistent with findings in Chant (2004) of a digital revolution in the 1990’s.
The digital counterfeiting is smaller scale is apparent in many ways. Eg., absent
a major Secret Service Initiative, during the time span 1995–05 when total counter-
feit production clearly fell (see Figure 4), counterfeiting arrests doubled from 1856 to
3717, and plant suppressions quadrupled from 153 to 611 Treasury (2006).
4. Data on Passed Money: Figure 5.
The USA passed money data is from the Secret Service, and the European data
from the European Bank’s web site. Apart from velocity, there is another problem
with the annual passed over circulation data. First, we measure domestic passed notes,
but circulation is worldwide. Also, the fraction of notes abroad likely rises in the
denomination, possibly substantially. We then scaled circulation by established esti-
mates. Judson and Porter (2003), eg., estimate that3/4 of $100 notes, and2/3 of $50
notes are abroad.
37
References
BAGNOLI , M., AND T. BERGSTROM(2005): “Log-concave Probability and its Appli-
cations,”Economic Theory, 26, 445–446.
BURDETT, K. (1996): “Truncated Means and Variances,”Economics Letters, 52(3),
263–267.
CHANT, J. (2004): “Canadian Experience with Counterfeiting,”Bank of Canada Re-
view, pp. 41–54.
DIAMOND , P. (1982): “Aggregate Demand Management in Search Equilibrium,”
Journal of Political Economy, 90, 881–894.
FRB (2003): “Lifespan of U.S. Currency and Analysis of an Alternate Substrate,”
unpublished Federal Reserve Board report.
GENE, G., AND C. SHAPIRO (1988): “Counterfeit-Product Trade,”The American
Economic Review, 78(1), 59–75.
GREEN, E., AND W. WEBER (1996): “Will the New $100 Bill Decrease Counterfeit-
ing?,” Federal Reserve Bank of Minneapolis Quarterly Review, 20(3), 3–10.
JUDSON, R., AND R. PORTER (2003): “Estimating the Worldwide Volume of Coun-
terfeit U.S. Currency: Data and Extrapolation,” Finance and Economics Discussion
Series.
K IYOTAKI , N., AND R. WRIGHT (1989): “On Money as a Medium of Exchange,”The
Journal of Political Economy, 97(4), 927–954.
NOSAL, E., AND N. WALLACE (2007): “A Model of (the Threat of) Counterfeiting,”
Journal of Monetary Economics, 54(4), 994–1001.
PHILLIPS, T. (2005):Knockoff: The Deadly Trade in Counterfeit Goods. Kogan Page
Limited, London.
SCHMEIDLER, D. (1973): “Equilibrium Points of Non-atomic Games,”Journal of
Statistical Physics, 7, 295–301.
TREASURY (2000): The Use and Counterfeiting of United States Currency Abroad,
Part 1. United States Treasury Department with Advanced Counterfeit Deterrence
Steering Committee, U.S. Government Printing Office.
38
(2003): The Use and Counterfeiting of United States Currency Abroad, Part
2. United States Treasury Department with the Advanced Counterfeit Deterrence
Steering Committee, U.S. Government Printing Office.
(2006): The Use and Counterfeiting of United States Currency Abroad, Part
3. United States Treasury Department with the Advanced Counterfeit Deterrence
Steering Committee, U.S. Government Printing Office.
TULLOCK , G. (1967): “The Welfare Costs of Tariffs, Monopolies and Theft,” Western
Economic Journal, 5, 224–232.
USSS (1964): “Annual Statistical Report, United States Secret Service,” Microfiche
ASI 8464-2.
(1990): “Investigative Activity Report, United States Secret Service,” Mi-
crofiche ASI 8464-1.
WILLIAMSON , S. (2002): “Private Money and Counterfeiting,”Federal Reserve Bank
of Richmond Economic Quarterly, 88(3), 37–57.
WILLIAMSON , S., AND R. WRIGHT (1994): “Barter and Monetary Exchange Under
Private Information,”American Economic Review, 84, 104–123.
39
Related Documents