The Economic Significance of the Australian Logistics Industry CONSULTING

Welcome message from author
This document is posted to help you gain knowledge. Please leave a comment to let me know what you think about it! Share it to your friends and learn new things together.
Transcript
The Economic Significance of the Australian Logistics Industry
C O N S U L T I N G
ACIL Allen Consulting Pty Ltd ABN 68 102 652 148
Level Fifteen, 127 Creek Street Brisbane QLD 4000 Australia T+61 7 3009 8700 F+61 7 3009 8799
Level Two, 33 Ainslie Place Canberra ACT 2600 Australia T+61 2 6103 8200 F+61 2 6103 8233
Level Nine, 60 Collins Street Melbourne VIC 3000 Australia T+61 3 8650 6000 F+61 3 9654 6363
Level One, 50 Pitt Street Sydney NSW 2000 Australia T+61 2 8272 5100 F+61 2 9247 2455
Suite C2 Centa Building, 118 Railway Street West Perth WA 6005 Australia T+61 8 9449 9600 F+61 8 9322 3955
acilallen.com.au
© ACIL Allen Consulting 2014
Australian Logistics Council
PO Box 20 DEAKIN WEST ACT 2600 17b National Press Club Building, 16 National Circuit, Barton, ACT, 2600 P: +61 2 6273 0755 F: +61 2 6273 3073
austlogistics.com.au
The Economic Significance of the Australian Logistics Industry i
C O N S U L T I N G
Executive summaryKey Findings
• Logistics is an end-to-end supply chain activity which is not well-represented by the system of national accounts.
• Australia’s Logistics industry was estimated to account for 8.6 per cent of GDP, adding $131.6 billion to Australia’s economy in 2013.
• The Logistics industry is estimated to employ 1.2 million people.
• In 2011–12 BITRE estimated that the domestic freight task totalled almost 600 billion tonne kilometres —equivalent to about 26,000 tonne kilometres of freight moved for every person in Australia.
• An increase in Logistics total factor productivity of 1% is estimated to increase GDP by $2 billion.
• Many issues currently affecting Logistics will impact the industry’s future productivity.
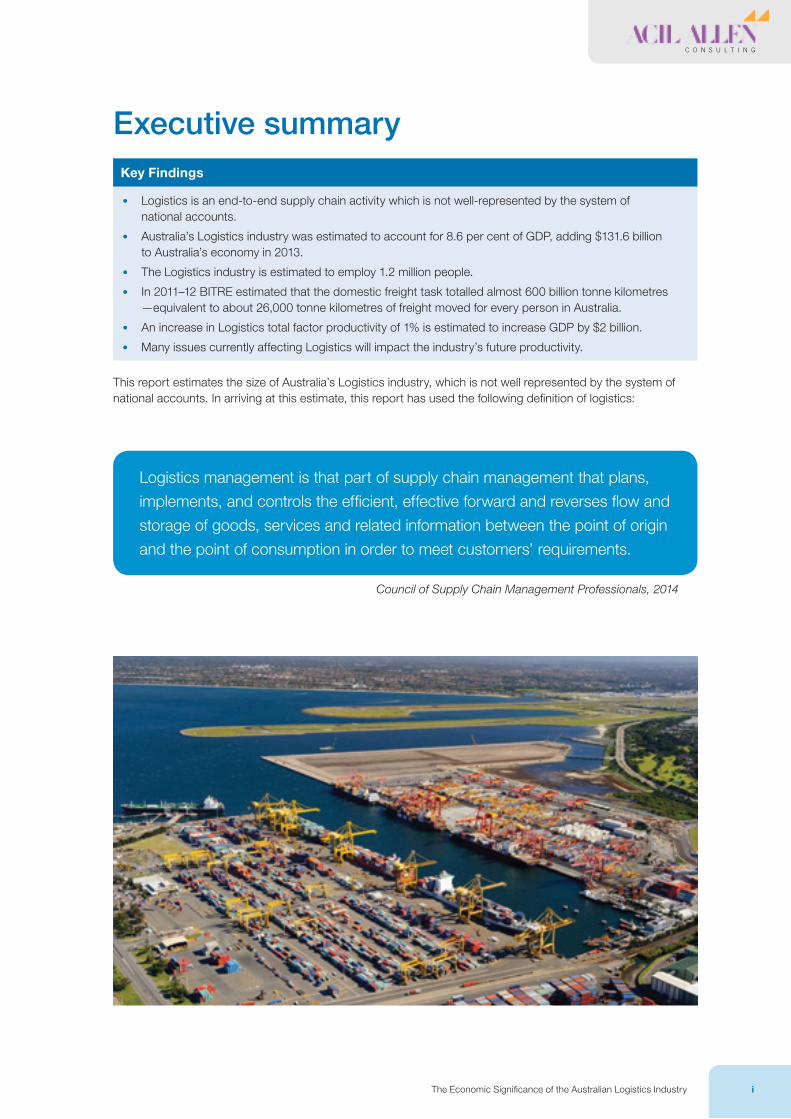
This report estimates the size of Australia’s Logistics industry, which is not well represented by the system of national accounts. In arriving at this estimate, this report has used the following definition of logistics:
Logistics management is that part of supply chain management that plans,
implements, and controls the efficient, effective forward and reverses flow and
storage of goods, services and related information between the point of origin
and the point of consumption in order to meet customers’ requirements.
Council of Supply Chain Management Professionals, 2014
Australian Logistics Council
PO Box 20 DEAKIN WEST ACT 2600 17b National Press Club Building, 16 National Circuit, Barton, ACT, 2600 P: +61 2 6273 0755 F: +61 2 6273 3073
austlogistics.com.au
ii
The efficiency of Australia’s Logistics industry is vital to the nation’s productivity and wellbeing. Measures of the economic significance of transport are reported by the Australian Bureau of Statistics but they significantly understate the expenditure on Logistics because they do not record these services when they are undertaken by firms on their own account and they fail to capture logistics activities not directly related to the movement of physical goods.
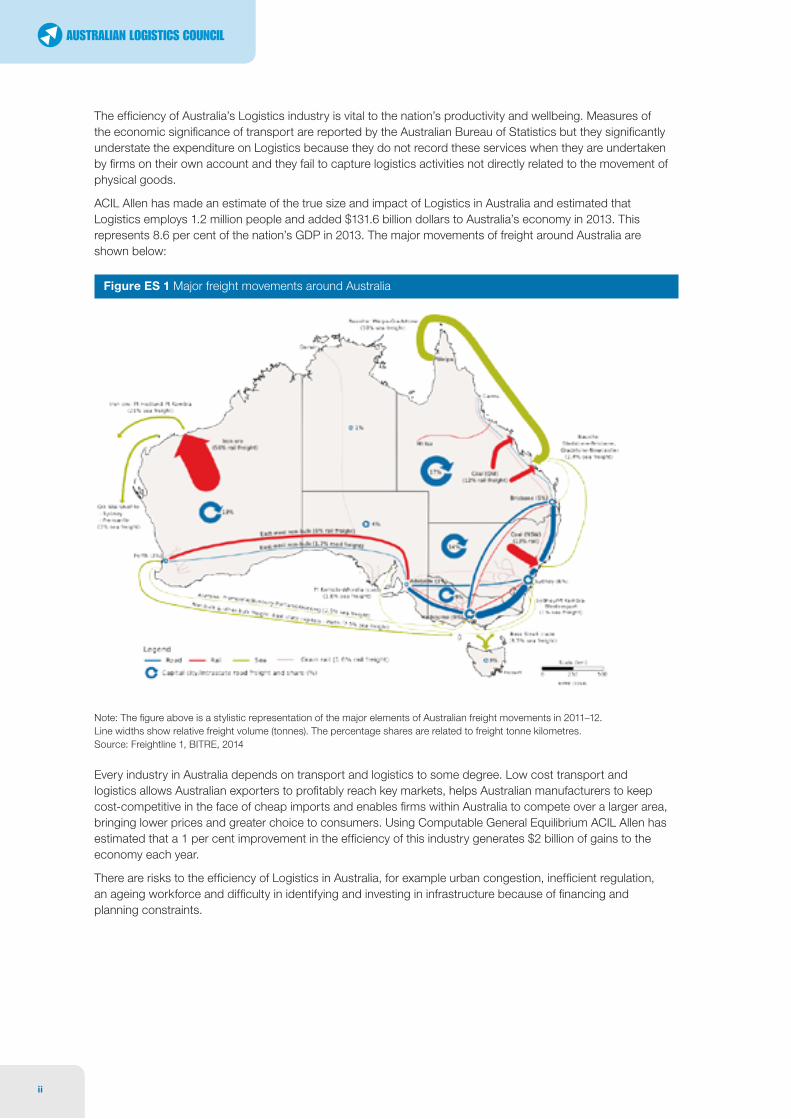
ACIL Allen has made an estimate of the true size and impact of Logistics in Australia and estimated that Logistics employs 1.2 million people and added $131.6 billion dollars to Australia’s economy in 2013. This represents 8.6 per cent of the nation’s GDP in 2013. The major movements of freight around Australia are shown below:
Figure ES 1 Major freight movements around Australia
1
3
Where does freight move in Australia
The Australian freight task is diverse, and encompasses the movement of bulk export commodities, such as iron ore, coal, liquefied natural gas (LNG) and grains, the transport of imported motor vehicles, machinery and other manufactured goods, and the transport of finished products for household consumption through distribution centres to retail outlets. Figure 2 provides a stylistic representation of the major elements of Australian freight movements in 2011–12. Several of the more notable aspects of the freight task are described below.
Figure 2: Major freight flows in Australia, 2011–12
Note: Line widths show relative freight volume (tonnes). Share estimates related to freight tonne kilometres. Source: ABS (2013), ARA (2013), BITRE (2010b, 2013a, 2013b) and BITRE estimates.
Rail freight
Rail is dominated by transport of bulk freight over longer distances and plays a significant role in transporting grains, rice, cotton and sugar for processing and/or export:
• Iron ore and coal together account for over 80 per cent (in tonne kilometre terms) of all rail freight.
• Grains, sugar, fertilisers and other bulk products account for a further 8 per cent of all rail freight.
• Non-bulk rail freight, which comprises around 8 per cent of total rail freight, is most significant on the long Eastern states–Perth corridor, where it accounts for the majority of intercapital origin–destination non-bulk freight, and the Melbourne–Brisbane corridor, where it has roughly about 30 per cent share of intercapital non-bulk freight. On other corridors, rail carries a much smaller share of intercapital non-bulk freight.
Note: The figure above is a stylistic representation of the major elements of Australian freight movements in 2011–12. Line widths show relative freight volume (tonnes). The percentage shares are related to freight tonne kilometres.Source: Freightline 1, BITRE, 2014
Every industry in Australia depends on transport and logistics to some degree. Low cost transport and logistics allows Australian exporters to profitably reach key markets, helps Australian manufacturers to keep cost-competitive in the face of cheap imports and enables firms within Australia to compete over a larger area, bringing lower prices and greater choice to consumers. Using Computable General Equilibrium ACIL Allen has estimated that a 1 per cent improvement in the efficiency of this industry generates $2 billion of gains to the economy each year.
There are risks to the efficiency of Logistics in Australia, for example urban congestion, inefficient regulation, an ageing workforce and difficulty in identifying and investing in infrastructure because of financing and planning constraints.

The Economic Significance of the Australian Logistics Industry iii
C O N S U L T I N G
List of AbbreviationsABARE Australian Bureau of Agriculture and Resource Economics
ABS Australian Bureau of Statistics
ALC Australian Logistics Council
ARTC Australian Rail Track Corporation
BITRE Bureau of Infrastructure, Transport and Regional Economics
BREE Bureau of Resource and Energy Economics
GDP Gross Domestic Product, a measure of economic activity
GVA Gross Value Added, the revenue from an activity less the cost of intermediate inputs
Mtpa Million tonnes per annum
Ntk Net tonne kilometre
TEU Twenty Foot Equivalent Container (a standard measure)

The Economic Significance of the Australian Logistics Industry v
C O N S U L T I N G
ContentsExecutive summary ...................................................................................................................................................................................................i
List of Abbreviations ............................................................................................................................................................................................ iii
1. Introduction ............................................................................................................................................................................................................1
2. The Australian transport task ......................................................................................................................................................3
2.1 Rail freight ....................................................................................................................................................................................................................... 5
2.2 Road freight ................................................................................................................................................................................................................... 6
2.3 Air freight.......................................................................................................................................................................................................................... 8
2.4 Sea freight ....................................................................................................................................................................................................................... 8
2.5 Warehousing and postal services ........................................................................................................................................................... 9
3. Modelling the impact of the Logistics industry ..............................................................................................11
4. Current issues in Logistics ............................................................................................................................................................17
4.1.1 Harmonising regulation and reducing bureaucracy .......................................................................................................17
4.1.2 Securing adequate investment in infrastructure ...............................................................................................................18
4.1.3 Identifying and then efficiently delivering key infrastructure projects ...............................................................19
4.1.4 Adopting whole-of supply chain planning..............................................................................................................................19
4.1.5 A desire to make greater use of railways ................................................................................................................................19
4.1.6 High productivity vehicle access and charging ................................................................................................................ 20
4.1.7 Establishing a network of efficient intermodal facilities .............................................................................................. 20
4.1.8 Giving freight a voice in urban planning .................................................................................................................................. 20
Appendix A: Estimating the size of the Logistics industry ....................................................................... 21
Appendix B: The Tasman Global model .................................................................................................................................35
vi
List of figures
Figure 1 Australian freight volumes by transport mode, FY2006 to FY2012 .................................................................. 3
Figure 2 Major freight flows in Australia, FY2012 ................................................................................................................................... 4
Figure 3 Historical and projected freight task, FY1972 to FY2040 .......................................................................................... 4
Figure 4 Australian rail network ............................................................................................................................................................................ 5
Figure 5 Allocation of road freight by area served ................................................................................................................................ 7
Figure 6 Inter-regional road freight task, FY2001. ................................................................................................................................. 7
Figure 7 Australian port-related freight by volume, FY2012 .......................................................................................................... 8
Figure 8 Australian port-related freight by value, FY2012 ............................................................................................................... 9
Figure 9 Change in real output by broad industry, relative to the reference case:- +1 per cent scenario ............................................................................................................................................................................13
Figure 10 Change in employment by occupation (1-digit ANZSCO), FTE jobs:- +1 per cent scenario ......14
Figure 11 Change in employment by occupation (3-digit ANZSCO), FTE jobs:- +1 per cent scenario ......15
Figure A1 Summary of our methodology ...................................................................................................................................................... 25
Figure A2 Size of the true transport industry .............................................................................................................................................30
Figure A3 Logistics costs as a percentage of GDP for selected countries ....................................................................... 33
List of tables
Table 1 Projected macroeconomic impacts of change in Logistics industry factor productivity, relative to the reference case ..........................................................................................................................................................12
Table 2 Decomposition of the projected change in Australian real GDP and real income under +1 per cent factor productivity, relative to the reference case .............................................................13
Table A1 Floor and ceiling cost proposal for the Pilbara Infrastructure ............................................................................. 28
Table A2 Estimated floor and ceiling costs of Pilbara Railways ................................................................................................ 29
Table A3 Domestic road transport of goods in the EU (1995,1985) ...................................................................................... 32
Table B1 Industries in the Tasman Global database ......................................................................................................................... 36
The Economic Significance of the Australian Logistics Industry 1
C O N S U L T I N G
1. IntroductionKey Finding 1
• Logistics involves more than just transport of goods, it is an end-to-end supply chain process.
• Australia’s system of national accounts does not capture all the logistics activities undertaken.
• The efficiency of logistics is important to Australia’s productivity because the industry affects all of Australia’s other industries.
• Efficient logistics costs enable competition over larger areas, crucial for the export performance of key industries, and for competitive domestic industries.
Australia’s system of national accounts measures the economic impact of a industry called Transport, Portal and Warehousing which includes transport, postal services, warehousing and other transport support services offered to customers across all industries in Australia.
By only recording transport services offered to third parties (called ‘Hire and Reward’ services) the national accounts miss a significant amount of freight transport that is carried out by companies on their own account (so called ‘ancillary transport’) and which is allocated in the national accounts to the primary industry of those companies.
Even including ancillary transport leaves an industry definition that is very narrow and misses many of the logistics activities that must be undertaken to bring goods to customers. There are many possible definitions of logistics, but a definition which has been adopted for this analysis is:
Logistics management is that part of supply chain management that plans,
implements, and controls the efficient, effective forward and reverses flow and
storage of goods, services and related information between the point of origin
and the point of consumption in order to meet customers’ requirements.
Council of Supply Chain Management Professionals, 2014
Under this definition there are clearly many more tasks to logistics than the transport task. The Transport, Postal and Warehousing industry definition fails to capture these logistics activities except the physical movement and storage of goods.
The logistics industry encompasses the transport industry (including ancillary transport) to define and quantify the Australian Logistics (Logistics) industry and capture the economic activity undertaken by firms across Australia in managing and operating their supply chains. This definition represents the costs of Logistics borne by Australian industries and represents the overall significance of the true Logistics industry.
The Logistics industry affects every industry. Australia is a large country and one which is geographically isolated from many key international markets. The efficient movement of goods and information along the supply chains of Australian companies is central to Australia’s ability to compete in international markets, and to compete with imports to the domestic market. Efficient logistics allow suppliers to compete across a larger distance, enabling greater competition within the country and resulting in benefits to consumers.
‘Productivity’ is what goods and services an economic actor (business, government, state, nation, etc.) receives for what it ‘puts in’, in terms of labour, capital and other factors of production. Productivity growth is a critical element in delivering an enhanced standard of living, meeting environmental obligations and coping with population growth. In the decade to 2011 Australia’s productivity growth stagnated, averaging below one per cent per annum over the 9 years to 2010/11. This means that over that time period economic growth was mostly generated from increases in population and labour participation, and Australia’s increasing wealth was

2
driven largely by a favourable movement in the nation’s terms of trade. In the past two years productivity has been double the average over the preceding nine years with economic conditions leading to a period or relative restraint in wage claims, however this performance cannot be guaranteed to continue.
Logistics is a critical element in the productivity of the nation. The true Logistics industry is estimated to represent 8.6 per cent of the nation’s Gross Domestic Product, it is a significant cost in Australia’s bulk export trades, and Australia’s significant import of manufactured goods means that efficient supply chains from ports to customers are essential for ensuring that consumers of imported goods are receiving the goods at the lowest possible prices.
There are challenges to the efficiency of the Logistics industry. Fuel prices remain high, regulatory burdens to the industry have increased and state and national regimes overlap, as do the scopes of different regulatory agencies, creating costly duplication and confusion. Urban congestion is slowing the nation’s roads and hindering pick up and delivery activities for all modes of transport. Urban encroachment is hindering planning approvals and development of necessary infrastructure, including: railways, roads, airports, port expansions and intermodal facilities.
The Australian Logistics Council’s focus is to improve the productivity, efficiency and safety of the freight logistics industry. It has commissioned this report from ACIL Allen Consulting (ACIL Allen) to develop an estimate of the size of the ‘true’ Logistics industry, which combines the Hire and Reward and Ancillary transport operations and estimates the scale of supporting logistics activities. Details of ACIL Allen’s calculations are contained in Appendix A.

The Economic Significance of the Australian Logistics Industry 3
C O N S U L T I N G
2. The Australian transport taskKey Finding 2
• In 2011–12 BITRE estimates that the domestic freight task totalled almost 600 billion tonne kilometres —equivalent to about 26,000 tonne kilometres of freight moved for every person in Australia.
• Australia’s freight task is projected to increase by 80 per cent between 2010 and 2030 with this rate of growth seeing freight triple by 2050.
• By volume rail freight has grown largely as a result of increasing bulk exports.
• On a number of intercapital and regional corridors road freight have increased their share of the freight task.
• Higher productivity road freight vehicles will have an important role in road accommodating this freight growth.
• Rail freight supported by improved rail infrastructure, can also play an important role in accommodating this freight growth
• Access to ports will be critical to ensure projected growth of bulk exports and imports can move efficiently to their destinations.
ACIL Allen estimates that the Logistics industry directly contributed $111.5 billion to Australia’s GDP in 2010, or if using the same GDP share, $131.6 billion in 2013. What does this value mean in terms of the movement of goods around Australia?
A common measure of freight task, particularly for the movement of bulk goods, is net tonne kilometres (‘ntk’), one net tonne kilometre is the equivalent to one tonne of freight moved one kilometre. In 2011–12 BITRE estimates that the domestic freight task totalled almost 600 billion tonne kilometres—equivalent to about 26,000 tonne kilometres of freight moved for every person in Australia.
The figure below shows the growth of freight in Australia over time, and shows the increasing dominance of bulk freight movements on rail as Australia supplied an increasingly large share of the world export market.
Figure 1 Australian freight volumes by transport mode, FY2006 to FY2012
A C I L A L L E N C O N S U L T I N G
4 ECONOMIC SIGNIFICANCE OF THE AUSTRALIAN LOGISTICS INDUSTRY
Figure 1 Australian freight volumes by transport mode, FY2006 to FY2012
Source: Freightline 1, BITRE, May 2014
The significant freight movements by volume are related to bulk ore movements:
— Iron ore exports from the Pilbara — Coal exports from Newcastle or Hay Point — Coal exports, bauxite imports, cement and alumina exports from Gladstone. The geography of Australia’s freight task is illustrated in Figure 2 below:
Source: Freightline 1, BITRE, May 2014
The significant freight movements by volume are related to bulk ore movements:
• Iron ore exports from the Pilbara
• Coal exports from Newcastle or Hay Point
• Coal exports, bauxite imports, cement and alumina exports from Gladstone. The geography of Australia’s freight task is illustrated in Figure 2 below:

4
Figure 2 Major freight flows in Australia, FY2012
1
3
Where does freight move in Australia
The Australian freight task is diverse, and encompasses the movement of bulk export commodities, such as iron ore, coal, liquefied natural gas (LNG) and grains, the transport of imported motor vehicles, machinery and other manufactured goods, and the transport of finished products for household consumption through distribution centres to retail outlets. Figure 2 provides a stylistic representation of the major elements of Australian freight movements in 2011–12. Several of the more notable aspects of the freight task are described below.
Figure 2: Major freight flows in Australia, 2011–12
Note: Line widths show relative freight volume (tonnes). Share estimates related to freight tonne kilometres. Source: ABS (2013), ARA (2013), BITRE (2010b, 2013a, 2013b) and BITRE estimates.
Rail freight
Rail is dominated by transport of bulk freight over longer distances and plays a significant role in transporting grains, rice, cotton and sugar for processing and/or export:
• Iron ore and coal together account for over 80 per cent (in tonne kilometre terms) of all rail freight.
• Grains, sugar, fertilisers and other bulk products account for a further 8 per cent of all rail freight.
• Non-bulk rail freight, which comprises around 8 per cent of total rail freight, is most significant on the long Eastern states–Perth corridor, where it accounts for the majority of intercapital origin–destination non-bulk freight, and the Melbourne–Brisbane corridor, where it has roughly about 30 per cent share of intercapital non-bulk freight. On other corridors, rail carries a much smaller share of intercapital non-bulk freight.
Note: The figure above is a stylistic representation of the major elements of Australian freight movements in 2011–12. Line widths show relative freight volume (tonnes). The percentage shares are related to freight tonne kilometres.Source: Freightline 1, BITRE, May 2014
Australia’s freight task is projected to increase by 80 per cent between 2010 and 2030, with the BITRE’s latest projections shown below:
Figure 3 Historical and projected freight task, FY1972 to FY2040
A C I L A L L E N C O N S U L T I N G
6 ECONOMIC SIGNIFICANCE OF THE AUSTRALIAN LOGISTICS INDUSTRY
Figure 3 Historical and projected freight task, FY1972 to FY2040
Source: Freightline 1, BITRE, May 2014.
The expected growth in road and rail freight are expected to put significant pressure on key rail corridors and many road networks which will also have to contend with increasing urban congestion related to growth of passenger vehicles and trips.
2.1 Rail freight Industry studies estimate that across Australia 929 million tonnes were transported on rail in 20121, BITRE estimates2 that 290.6 billion Ntks of bulk goods were moved in 2012 which would imply the average loaded haul was 313 kilometres.
There are estimated to be over 40,000 kilometres of railways across Australia, as shown in Figure 4 below.
1 Freight on Rail, ARA, 2013 2 Freightliner 1, BITRE, May 2014.
Source: Freightline 1, BITRE, May 2014.

The Economic Significance of the Australian Logistics Industry 5
C O N S U L T I N G
The expected growth in road and rail freight are expected to put significant pressure on key rail corridors and many road networks which will also have to contend with increasing urban congestion related to growth of passenger vehicles and trips.
2.1 Rail freight
Industry studies estimate that across Australia 929 million tonnes were transported on rail in 20121, BITRE estimates2 that 290.6 billion Ntks of bulk goods were moved in 2012 which would imply the average loaded haul was 313 kilometres.
There are estimated to be over 40,000 kilometres of railways across Australia, as shown in Figure 4 below.
Figure 4 Australian rail network
A C I L A L L E N C O N S U L T I N G
7 ECONOMIC SIGNIFICANCE OF THE AUSTRALIAN LOGISTICS INDUSTRY
Figure 4 Australian rail network
Source: ARA, 2004
The recent resurgence in rail freight is driven by the movement of bulk ores and continued growth of long haul freight to Perth. Rail has been losing mode share to road freight over the past decade on shorter hauls such as Melbourne-Sydney and Sydney-Brisbane.
The Pilbara railways are the most productive in the world with almost 3,000 kilometres of rail and capacity in excess of 600 Mtpa.
ARTC manages over 8,500 kilometres of Australia’s interstate track, as well as the Hunter Valley Network. It is currently in discussions with Queensland Rail (QR) over government plans to transfer the management of up to 7,000 kilometres of QR’s track. Brookfield rail owns the interstate track from Kalgoorlie to Perth as well as other track in Western Australia. Asciano, Aurizon and SCT are the main train operators operating intercapital container services. Over 70 per cent (up to 90 per cent) of the contestable container freight between Sydney/Melbourne and Perth is moved by rail.
The Adelaide-Darwin railway line commenced operations in 2004, the line from Alice Springs to Darwin. Its 1,420 kilometres of rail was sold to Genesee and Wyoming Australia (GWA) in 2010. It is estimated that GWA currently serves 90-95 per cent of the contestable
Source: ARA, 2004
The recent resurgence in rail freight is driven by the movement of bulk ores and continued growth of long haul freight to Perth. Rail has been losing mode share to road freight over the past decade on shorter hauls such as Melbourne-Sydney and Sydney-Brisbane.
The Pilbara railways are the most productive in the world with almost 3,000 kilometres of rail and capacity in excess of 600 Mtpa.
ARTC manages over 8,500 kilometres of Australia’s interstate track, as well as the Hunter Valley Network. It is currently in discussions with Queensland Rail (QR) over government plans to transfer the management of up to 7,000 kilometres of QR’s track. Brookfield Rail owns the interstate track from Kalgoorlie to Perth as well as other track in Western Australia. Asciano, Aurizon and SCT are the main train operators operating intercapital container services. Over 70 per cent (up to 90 per cent) of the contestable container freight between Sydney/Melbourne and Perth is moved by rail.
1 Freight on Rail, ARA, 2013.
2 Freightliner 1, BITRE, May 2014.

6
The Adelaide-Darwin railway line commenced operations in 2004, with the completion of the line from Alice Springs to Darwin. Its 1,420 kilometres of rail was sold to Genesee and Wyoming Australia (GWA) in 2010. It is estimated that GWA currently serves 90–95 per cent of the contestable container market between Adelaide and Darwin—this is carried on 6 services per week3. Significant growth is occurring as a result of mineral and ore mine developments within 300 kilometres of the two termini of the line at Adelaide and Darwin.
Significant investments are also being made in urban and short haul rail services, with supply chain infrastructure investments in port and intermodal terminals by companies such as Qube Logistics, which also operates short haul rail services.
The Australian Government has also made a commitment to the inland freight railway between Melbourne and Brisbane by committing $300 million to ARTC to undertake pre-construction activities such as detailed corridor planning, environmental assessments, community consultation and land acquisition. The inland railway would reduce transit times between the two cities, improve rail connectivity for rural businesses along its length and would enable the operation of longer and higher productivity freight trains on the corridor. It would also provide an improved crossing of the Toowoomba Range and would link to the Port of Brisbane via Acacia Ridge, reducing supply chain costs. Furthermore, the railway would create additional rail capacity on the Melbourne-Sydney and Sydney-Brisbane corridors, which could be used in satisfying the growing freight task on those corridors.
2.2 Road freight
Australia’s road freight task has continued to grow with little moderation by competing modes. Over 95 per cent of Australia’s road freight is carried in heavy vehicles weighing 4.5 tonnes or more. The B-Double is the most significant heavy vehicle combination accounting for 40 per cent of all freight movement4. This is significant given that B-Doubles operate on a restricted road network.
Advances in vehicle technology have allowed freight to be moved on Australia’s roads for a relatively low unit cost. The adoption of heavy vehicle reforms should open the door to more high productivity vehicle combinations such as B-Triples, which will allow road to maintain its growth without a matching increase in the numbers of trucks on the roads. Congestion and fuel costs remain key issues for road freight, as does the potential for staff shortages as the current workforce ages. Reform of road investment and heavy vehicle charging also present opportunities and risks for road freight.
The freight task undertaken on road (measured in Ntks) is split as shown in Figure 5 below:
3 Genesee & Wyoming Services, GWA Australia webpage, http://www.gwrr.com/operations/railroads/australia/genesee_wyoming_australia/gwa_services, accessed 13 June 2014.
4 That is, including urban freight.
The Economic Significance of the Australian Logistics Industry 7
C O N S U L T I N G
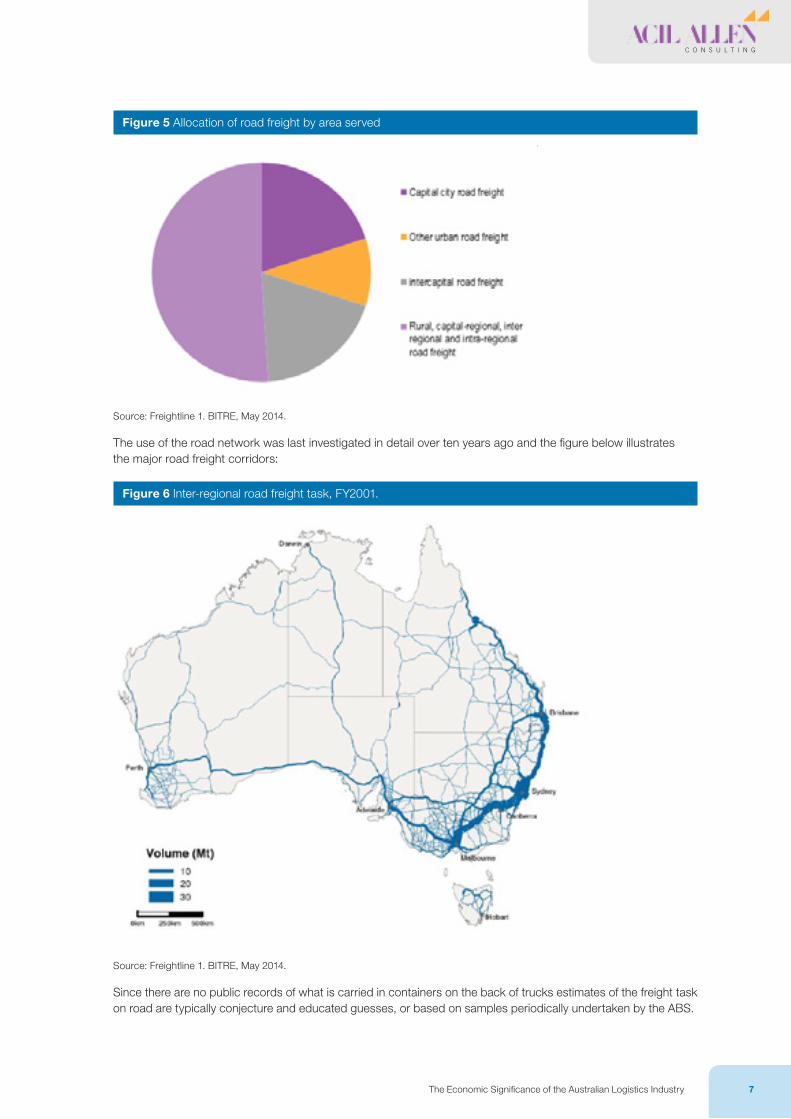
Figure 5 Allocation of road freight by area served
9 ECONOMIC SIGNIFICANCE OF THE AUSTRALIAN LOGISTICS INDUSTRY
A C I L A L L E N C O N S U L T I N G
Figure 5 Allocation of road freight by area served
›Source: Freightline 1. BITRE, May 2014 The use of the road network was last investigated in detail over ten years ago and the figure below illustrates the major road freight corridors:
Source: Freightline 1. BITRE, May 2014.
The use of the road network was last investigated in detail over ten years ago and the figure below illustrates the major road freight corridors:
Figure 6 Inter-regional road freight task, FY2001.
1
4
Road freight
While rail carries a larger volume of freight overall, road transport is the main mode of transport for the majority of commodities produced and/or consumed in Australia. Among the notable facts about road freight in Australia:
• Road freight in capital cities accounted for over one fifth of total road freight in Australia 2011–12, with road freight in other urban areas outside capital cities comprising a further 10 per cent. Intercapital road freight accounts for an approximately 18–19 per cent of total road freight movements. The remaining, approximately 50 per cent, comprises freight transported between capital cities and regional areas and other inter- and intrastate freight.
• Over 95 per cent of Australia’s road freight is carried in heavy vehicles (i.e. vehicles weighing 4.5 tonnes or more). Articulated trucks2 accounted for around 78 per cent and heavy rigid trucks approximately 18 per cent of total road freight, and these shares are little changed over the last decade or so (ABS 2013).
• B-double heavy vehicle combinations are now the most significant road freight vehicle combination, accounting for around 40 per cent of total road freight in 2011–12.
• Notwithstanding their contribution to the freight task, however, freight vehicles account for less than 10 per cent of total road use—light vehicles account for approximately 92 per cent of vehicles on the road.
Figure 3 illustrates where road freight moves across the road network, showing road freight volumes across the non-urban transport network in 2000–01—the last time a comprehensive survey of regional road freight movements was undertaken across Australia. The figure highlights the significance of road freight volumes on the National Land Transport Network, and particularly on the Hume Highway (between Sydney and Melbourne), Pacific Highway (Sydney–Brisbane) and Newell Highway (Melbourne–Brisbane). Freight volumes across the National Land Transport Network accounted for approximately 25 per cent of all road freight in 2000-01. The ABS is undertaking a survey of regional road freight movements in 2013–14, which will provide updated estimates of regional road freight movements across Australia.
Figure 3: Inter-regional road freight task, 2000–01
Source: ABS (2002) and BITRE estimates.
2. Articulated trucks are trucks comprising a prime mover towing one or more trailers attached by a turntable.
Source: Freightline 1. BITRE, May 2014.
Since there are no public records of what is carried in containers on the back of trucks estimates of the freight task on road are typically conjecture and educated guesses, or based on samples periodically undertaken by the ABS.
8
2.3 Air freight
Air freight is a small element of Australia’s overall task, suited to moving high-value and time-critical goods such as parcels and seafood. BITRE estimates that in 2012 only 0.3 billion Ntks was carried by air, this is less than 0.1 per cent of Australia’s total freight task. Airports often have nearby freight precincts to handle parcels and competition with passenger vehicles accessing airports can lead to significant congestion issues.
2.4 Sea freight
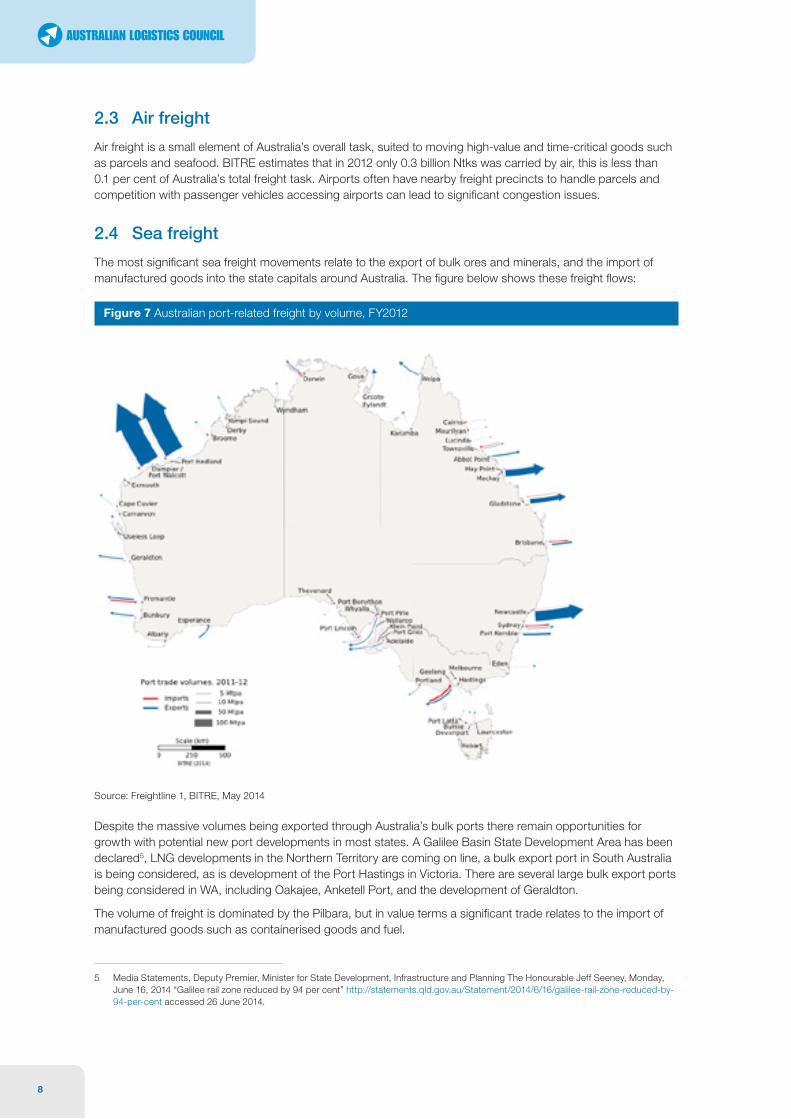
The most significant sea freight movements relate to the export of bulk ores and minerals, and the import of manufactured goods into the state capitals around Australia. The figure below shows these freight flows:
Figure 7 Australian port-related freight by volume, FY2012
1
5
Sea freight
Shipping and ports are an important interface with the land freight task, transporting Australian-made goods and raw materials between major domestic centres and gateways for international trade.
• Coastal shipping is responsible for around 17 per cent of total domestic freight movements (measured in mass distance terms) and comprises 10 per cent of total freight volumes through Australian ports. Bulk commodities, such as aluminium ores, iron ore and petroleum, account for over 70 per cent of domestic coastal shipping movements—transport of bauxite between Weipa and Gladstone (in Queensland) and iron ore from the Pilbara to Port Kembla alone accounted for 30 per cent and 20 per cent, respectively, of total domestic sea freight. Eastern states–Perth and Bass Strait shipping together account for over 18 per cent of total coastal shipping movements (see Figure 2).
• In 2011–12, the volumes of merchandise imports and exports totalled approximately 1110 million tonnes—exports of 1014 million tonnes and imports of 99 million tonnes—with a total trade value of $A528 billion free on board (FOB)—exports: $264.2 billion and imports $264.4 billion.
• By volume, the major iron ore and coal exporting ports—Port Hedland, Dampier, Cape Lambert, Newcastle, Hay Point and Gladstone—are the largest Australian ports, accounting for around 80 per cent of total merchandise exports volumes—521 Mt iron ore and 316 Mt coal—in 2011–12 (ABS 2012). (Figure 4 illustrates merchandise trade volumes through Australian ports in 2011–12, for ports exceeding 50,000 tonnes of imports or exports in 2011–12.)
Figure 4: Australian port-related trade, by volume, 2011–12
Notes: The figure shows the total volume of all port-specific import and export trade flows exceeding 50,000 tonnes in 2011–12. Not
shown here are the volume of exports from off-shore oil and gas terminals in WA and NT. Source: ABS (2012) and BITRE estimates.
Source: Freightline 1, BITRE, May 2014
Despite the massive volumes being exported through Australia’s bulk ports there remain opportunities for growth with potential new port developments in most states. A Galilee Basin State Development Area has been declared5, LNG developments in the Northern Territory are coming on line, a bulk export port in South Australia is being considered, as is development of the Port Hastings in Victoria. There are several large bulk export ports being considered in WA, including Oakajee, Anketell Port, and the development of Geraldton.
The volume of freight is dominated by the Pilbara, but in value terms a significant trade relates to the import of manufactured goods such as containerised goods and fuel.
5 Media Statements, Deputy Premier, Minister for State Development, Infrastructure and Planning The Honourable Jeff Seeney, Monday, June 16, 2014 “Galilee rail zone reduced by 94 per cent” http://statements.qld.gov.au/Statement/2014/6/16/galilee-rail-zone-reduced-by-94-per-cent accessed 26 June 2014.
The Economic Significance of the Australian Logistics Industry 9
C O N S U L T I N G
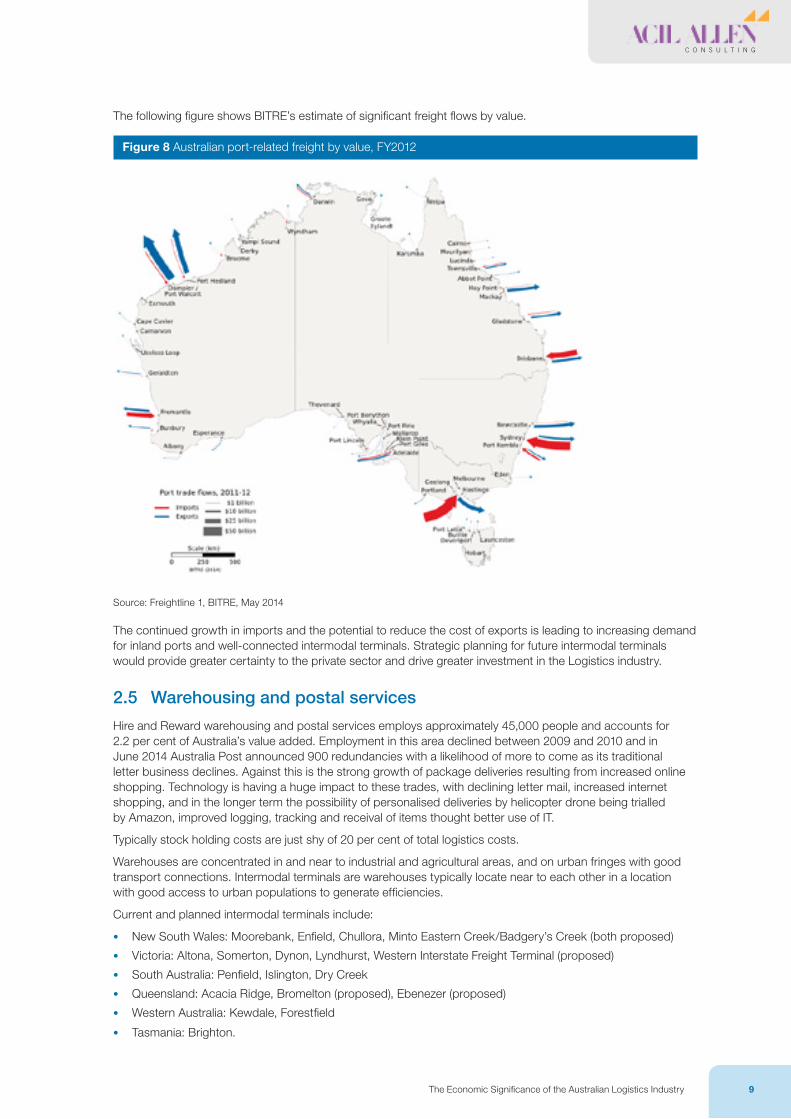
The following figure shows BITRE’s estimate of significant freight flows by value.
Figure 8 Australian port-related freight by value, FY2012
1
6
Figure 5: Australian port-related trade flows, by value, 2011–12
Notes: The figure shows the total value of all port-specific import and export trade flows exceeding $50 million in 2011–12. Not shown
here are the value of exports from off-shore oil and gas terminals in WA and NT. Source: ABS (2012) and BITRE estimates.
• Capital city ports—Sydney, Melbourne, Brisbane and Fremantle—number among the next five largest ports (after the bulk coal and iron ore ports) by total trade volume.
• By contrast, capital city ports—Sydney, Melbourne, Brisbane and Fremantle—are among the five largest Australian ports by value of merchandise trade in 2011–12, due to their importance as major import gateways. (Figure 5 illustrates the value of merchandise trade through Australian ports in 2011–12, for ports exceeding $50 million of imports or exports in 2011–12.) Melbourne is the largest merchandise import port, by value, and Sydney the second largest.
Air freight
Air freight is more suited to low density and/or high value commodities, such as newspapers, parcels, perishable/short-lived products, precious metals and gemstones, and generally comprises only a small share of freight volumes:
• For example, domestic air freight, accounts for less than 0.01 per cent of total domestic freight movements, with the majority comprising newspapers, parcels and other light goods transported between capital cities in either dedicated freighters or in freight holds of regular passenger service aircraft.
• International air freight also represents less than 0.1 per cent of Australia’s total merchandise trade, by volume, but makes up over 21 per cent of total trade by value (17 per cent of total exports and 26 per
Source: Freightline 1, BITRE, May 2014
The continued growth in imports and the potential to reduce the cost of exports is leading to increasing demand for inland ports and well-connected intermodal terminals. Strategic planning for future intermodal terminals would provide greater certainty to the private sector and drive greater investment in the Logistics industry.
2.5 Warehousing and postal services
Hire and Reward warehousing and postal services employs approximately 45,000 people and accounts for 2.2 per cent of Australia’s value added. Employment in this area declined between 2009 and 2010 and in June 2014 Australia Post announced 900 redundancies with a likelihood of more to come as its traditional letter business declines. Against this is the strong growth of package deliveries resulting from increased online shopping. Technology is having a huge impact to these trades, with declining letter mail, increased internet shopping, and in the longer term the possibility of personalised deliveries by helicopter drone being trialled by Amazon, improved logging, tracking and receival of items thought better use of IT.
Typically stock holding costs are just shy of 20 per cent of total logistics costs.
Warehouses are concentrated in and near to industrial and agricultural areas, and on urban fringes with good transport connections. Intermodal terminals are warehouses typically locate near to each other in a location with good access to urban populations to generate efficiencies.
Current and planned intermodal terminals include:
• New South Wales: Moorebank, Enfield, Chullora, Minto Eastern Creek/Badgery’s Creek (both proposed)
• Victoria: Altona, Somerton, Dynon, Lyndhurst, Western Interstate Freight Terminal (proposed)
• South Australia: Penfield, Islington, Dry Creek
• Queensland: Acacia Ridge, Bromelton (proposed), Ebenezer (proposed)
• Western Australia: Kewdale, Forestfield
• Tasmania: Brighton.

The Economic Significance of the Australian Logistics Industry 11
C O N S U L T I N G
3. Modelling the impact of the Logistics industry
Key Finding 3
• The Logistics industry is strongly connected with many industries with forestry, manufacturing, construction, wholesale and retail trades and processed food being the most intensive users.
• Efficient Logistics enable competition over a greater area, allowing our key export industries to compete for international markets, and domestic industries to be more competitive.
• There are estimated to be 1.2 million people employed in Logistics activities.
• Logistics accounted for $131.6 billion of value added to Australia’s economy in 2013, this is estimated to be 8.6 per cent of GDP.
• A 1 percent increase in the productivity of Logistics adds $2 billion to Australia’s GDP.
ACIL Allen has estimated the size of the economic value added by the Logistics industry to be $131.6 billion based on the ABS estimate of 2013 GDP6. ACIL Allen also estimates that there are approximately 595,000 employees engaged in the freight transport task, and almost as many people involved in other logistics activities in organisations (a further 406,000) employees.
These estimates of the true size of the Australian Logistics industry have been incorporated into the ACIL Allen’s computable general equilibrium (CGE) model of the Australian and world economy, Tasman Global, through a complete revision of the underlying input-output tables.
To show the linkages and importance of the Logistics industry to the Australian economy, two hypothetical scenarios have been modelled where there is a ±1 per cent factor productivity improvement across all Logistics activities in FY2015. In other words, there is a change in the average productivity of labour and capital that, all else equal, allows the same amount of labour and capital to change real output of the Logistics industry by ±1 per cent.
The change in productivity impacts on the cost of supplying Logistics services by affecting their requirement for scarce labour and capital resources per unit of output. The productivity change also affects all other industries in the economy both directly through their use of Logistics services and indirectly through their use of scarce labour and capital.
A key issue when estimating the economic impact is determining how the labour market will clear.7 For this analysis, the supply of labour has been assumed to be the same as the reference case with real wages adjusting to clear the labour market. This is a conservative assumption as in reality changes in the demand for labour can be met in various ways including changes in participation rates and/or average hours worked and by changes in the unemployment rate. For comparison, the sensitivity of the projected impacts have been presented by using the standard Tasman Global labour market framework which allows moderate changes in participation rates in response to the changes in real wages paid to workers.
Table 1 presents the projected macroeconomic impacts associated with a ±1 per cent factor productivity improvement across all Logistics activities in FY2015 under the alternative labour market closures.
6 The details of ACIL Allen’s calculation are contained in Appendix A on page 21.
7 As with other CGE models, the standard assumption within Tasman Global is that all markets clear (i.e. demand equals supply) at the start and end of each time period, including the labour market. CGE models place explicit limits on the availability of factors and the nature of the constraints can greatly change the magnitude and nature of the results. In contrast, most other tools used to assess economic impacts, including I-O multiplier analysis, do not place constraints on the availability of factors. Consequently, non-CGE methods tend to overestimate the impacts of a project or policy.
12
Table 1 Projected macroeconomic impacts of change in Logistics industry factor productivity, relative to the reference case
Real GDP Real income Employment
2014 A$m 2014 A$m FTE jobs
-1% Standard Tasman Global labour market –2,289 –1,918 –3,719
-1% Fixed labour supply –1,995 –1,631 0
+1% Fixed labour supply 1,957 1,600 0
+1% Standard Tasman Global labour market 2,246 1,882 3,639
Source: ACIL Allen
All else equal, it is projected that a 1 per cent change in factor productivity of the Logistics industry will change Australian real GDP by $2 billion (Table 1). With a moderately flexible labour market (i.e. under the standard Tasman Global labour market assumptions), it is projected that a 1 per cent change in factor productivity of the Logistics industry will change Australian real GDP by $2.2 billion.
Real GDP is a measure of the economic output of the Australian economy. An alternative macroeconomic measure is real income. Real income is a measure of the ability to purchase goods and services, adjusted for inflation. A rise in real income indicates a rise in the capacity for current consumption, but also an increased ability to accumulate wealth in the form of financial and other assets. In global CGE models such as Tasman Global, the change in real income is equivalent to the change in consumer welfare using the equivalent variation measure of welfare change resulting from exogenous shocks. Hence, it is valid to say that the projected change in real income (from Tasman Global) is also the projected change in consumer welfare.
All else equal, it is projected that a 1 per cent change in factor productivity of the Logistics industry will change Australian real income by:
• $1.6 billion if labour supply is fixed to the reference case levels
• $1.9 billion with a moderately flexible labour market (i.e. under the standard Tasman Global assumptions).
Table 2 provides a decomposition of the projected change in real GDP and real income. The factor productivity improvement in the Logistics industry is projected to flow through to other industries resulting in an increase in net exports. It also benefits the cost to consumers of imported goods which also increase. As shown, the difference between real GDP and real income is a result of a fall in Australia’s terms of trade associated with a depreciation of the real exchange rate. This is to be expected, as the cost reduction across the Australian economy associated with the Logistics productivity improvement results in a decline in our cost of exports which is what improves their competitiveness in the world market. Essentially a portion of the productivity benefits accrue to foreign consumers of Australian goods and services.

The Economic Significance of the Australian Logistics Industry 13
C O N S U L T I N G
Table 2 Decomposition of the projected change in Australian real GDP and real income under +1 per cent factor productivity, relative to the reference case
Fixed labour supplyStandard Tasman Global
labour market
A$m A$m
Private consumption 945 1,081
Government consumption 168 234
Investment 538 617
Net foreign trade 307 314
Real exports 871 956
Contribution of imports –565 –641
Real GDP 1,957 2,246
Terms of trade –353 –361
Net income transfers –4 –4
Real income 1,600 1,882
Source: ACIL Allen
Noting that the results are largely symmetric for a +1 per cent or a -1 per cent factor productivity change the results presented in the rest of this section will just focus on the projected changes under a 1 per cent increase in the average factor productivity of the Logistics industry under the assumption that labour supply is fixed to the reference case levels.
Figure 9 presents the projected change in real industry output by industry, while Figure 10 and Figure 11 present the projected change in employment by occupation.
Figure 9 Change in real output by broad industry, relative to the reference case:- +1 per cent scenario
16 ECONOMIC SIGNIFICANCE OF THE AUSTRALIAN LOGISTICS INDUSTRY
A C I L A L L E N C O N S U L T I N G
Fixed labour supply Standard Tasman Global labour market
A$m A$m Private consumption 945 1,081 Government consumption 168 234 Investment 538 617 Net foreign trade 307 314 Real exports 871 956 Contribution of imports –565 –641 Real GDP 1,957 2,246 Terms of trade –353 –361 Net income transfers –4 –4 Real income 1,600 1,882
Table 2 Decomposition of the projected change in Australian real GDP and real income under +1 per cent factor productivity, relative to the reference case
Source: ACIL Allen
Noting that the results are largely symmetric for a +1 per cent or a -1 per cent factor productivity change the results presented in the rest of this section will just focus on the projected changes under a 1 per cent increase in the average factor productivity of the Logistics industry under the assumption that labour supply is fixed to the reference case levels.
Figure 9 presents the projected change in real industry output by industry, while Figure 10 and Figure 11 present the projected change in employment by occupation.
Figure 9 Change in real output by broad industry, relative to the reference case:- +1 per cent scenario
0.30 0.25 0.20 0.15 0.10 0.05
%
Note: Other services exclude the Logistics industry. Source: ACIL Allen
The first thing to note from Figure 9 is that a rise in the productivity of the Logistics industry has positive implications for all other industries of the Australian economy. Based on the
Note: Other services exclude the Logistics industry. Source: ACIL Allen
14
The first thing to note from Figure 9 is that a rise in the productivity of the Logistics industry has positive implications for all other industries of the Australian economy. Based on the recalibrated database and model, the forestry industry benefits the most followed by manufacturing and non-government services.
In analysing these results it is important to remember that this is reflecting the importance of the cost of Logistics (or competition for people of certain occupations) on the current production cost of other industries and the ability of these other industries to increase output by passing on any cost savings. It is not a complete measure of the importance of an efficient or reliable Logistics service as it exists but of the benefit of changes in marginal cost.
Indeed it could be argued that a substantial part of Australia’s economic activity exists only because of the ability to trade via the use of Logistics services; that is, they are a key part of enabling trade and economic activity.
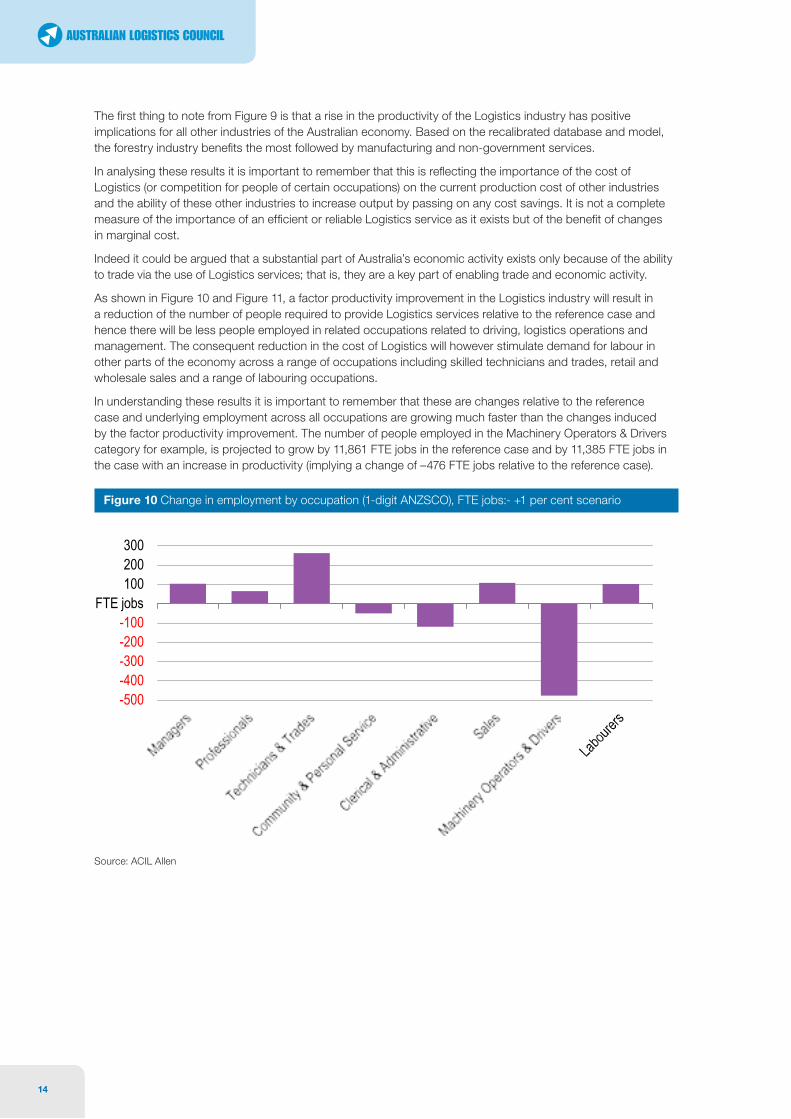
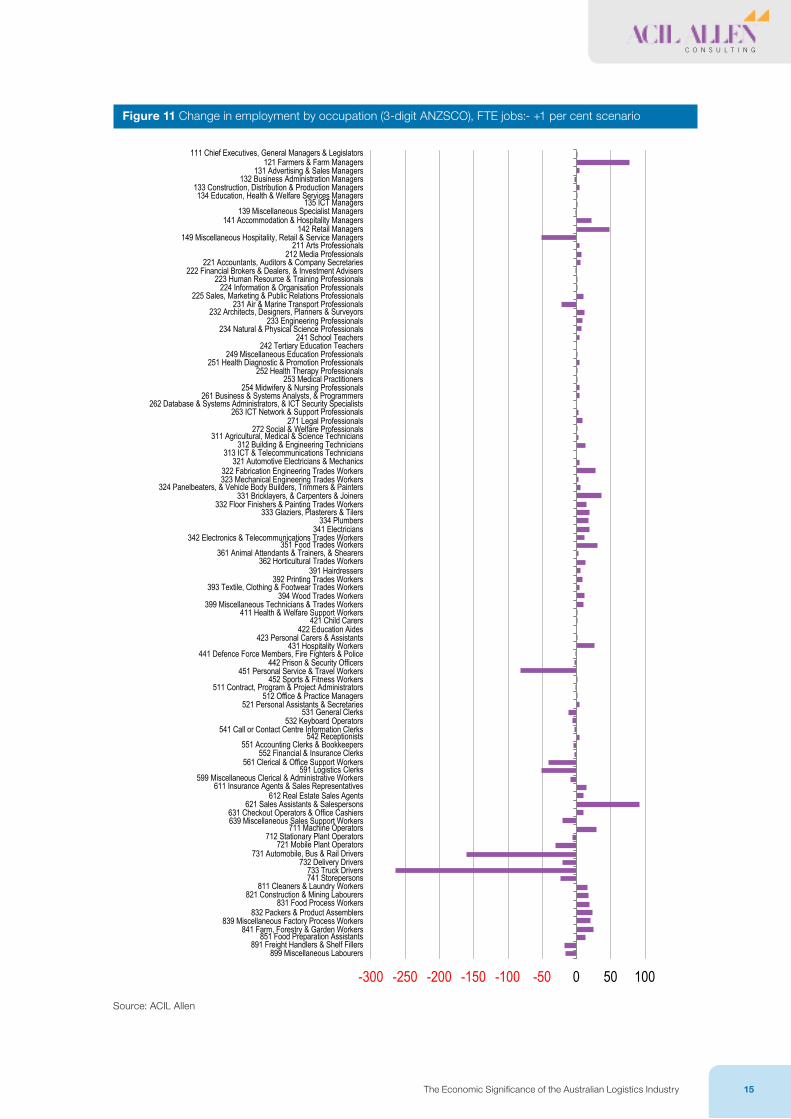
As shown in Figure 10 and Figure 11, a factor productivity improvement in the Logistics industry will result in a reduction of the number of people required to provide Logistics services relative to the reference case and hence there will be less people employed in related occupations related to driving, logistics operations and management. The consequent reduction in the cost of Logistics will however stimulate demand for labour in other parts of the economy across a range of occupations including skilled technicians and trades, retail and wholesale sales and a range of labouring occupations.
In understanding these results it is important to remember that these are changes relative to the reference case and underlying employment across all occupations are growing much faster than the changes induced by the factor productivity improvement. The number of people employed in the Machinery Operators & Drivers category for example, is projected to grow by 11,861 FTE jobs in the reference case and by 11,385 FTE jobs in the case with an increase in productivity (implying a change of –476 FTE jobs relative to the reference case).
Figure 10 Change in employment by occupation (1-digit ANZSCO), FTE jobs:- +1 per cent scenario
17 ECONOMIC SIGNIFICANCE OF THE AUSTRALIAN LOGISTICS INDUSTRY
A C I L A L L E N C O N S U L T I N G
recalibrated database and model, the forestry industry benefits the most followed by manufacturing and non-government services.
In analysing these results it is important to remember that this is reflecting the importance of the cost of Logistics (or competition for people of certain occupations) on the current production cost of other industries and the ability of these other industries to increase output by passing on any cost savings. It is not a complete measure of the importance of an efficient or reliable Logistics service as it exists but of the benefit of changes in marginal cost.
Indeed it could be argued that a substantial part of Australia’s economic activity exists only because of the ability to trade via the use of Logistics services; that is, they are a key part of enabling trade and economic activity.
As shown in Figure 10 and Figure 11, a factor productivity improvement in the Logistics industry will result in a reduction of the number of people required to provide Logistics services relative to the reference case and hence there will be less people employed in related occupations related to driving, logistics operations and management. The consequent reduction in the cost of Logistics will however stimulate demand for labour in other parts of the economy across a range of occupations including skilled technicians and trades, retail and wholesale sales and a range of labouring occupations.
In understanding these results it is important to remember that these are changes relative to the reference case and underlying employment across all occupations are growing much faster than the changes induced by the factor productivity improvement. The number of people employed in the Machinery Operators & Drivers category for example, is projected to grow by 11,861 FTE jobs in the reference case and by 11,385 FTE jobs in the case with an increase in productivity (implying a change of –476 FTE jobs relative to the reference case).
Figure 10 Change in employment by occupation (1-digit ANZSCO), FTE jobs:- +1 per cent scenario
300 200 100
FTE jobs -100 -200 -300 -400 -500
Source: ACIL Allen Source: ACIL Allen
The Economic Significance of the Australian Logistics Industry 15
C O N S U L T I N G
Figure 11 Change in employment by occupation (3-digit ANZSCO), FTE jobs:- +1 per cent scenario
18 ECONOMIC SIGNIFICANCE OF THE AUSTRALIAN LOGISTICS INDUSTRY
A C I L A L L E N C O N S U L T I N G
Figure 11 Change in employment by occupation (3-digit ANZSCO), FTE jobs:- +1 per cent scenario
111 Chief Executives, General Managers & Legislators 121 Farmers & Farm Managers
131 Advertising & Sales Managers 132 Business Administration Managers
133 Construction, Distribution & Production Managers 134 Education, Health & Welfare Services Managers
135 ICT Managers 139 Miscellaneous Specialist Managers
141 Accommodation & Hospitality Managers 142 Retail Managers
149 Miscellaneous Hospitality, Retail & Service Managers 211 Arts Professionals
212 Media Professionals 221 Accountants, Auditors & Company Secretaries
222 Financial Brokers & Dealers, & Investment Advisers 223 Human Resource & Training Professionals
224 Information & Organisation Professionals 225 Sales, Marketing & Public Relations Professionals
231 Air & Marine Transport Professionals 232 Architects, Designers, Planners & Surveyors
233 Engineering Professionals 234 Natural & Physical Science Professionals
241 School Teachers 242 Tertiary Education Teachers
249 Miscellaneous Education Professionals 251 Health Diagnostic & Promotion Professionals
252 Health Therapy Professionals 253 Medical Practitioners
254 Midwifery & Nursing Professionals 261 Business & Systems Analysts, & Programmers
262 Database & Systems Administrators, & ICT Security Specialists 263 ICT Network & Support Professionals
271 Legal Professionals 272 Social & Welfare Professionals
311 Agricultural, Medical & Science Technicians 312 Building & Engineering Technicians
313 ICT & Telecommunications Technicians 321 Automotive Electricians & Mechanics
322 Fabrication Engineering Trades Workers 323 Mechanical Engineering Trades Workers
324 Panelbeaters, & Vehicle Body Builders, Trimmers & Painters 331 Bricklayers, & Carpenters & Joiners
332 Floor Finishers & Painting Trades Workers 333 Glaziers, Plasterers & Tilers
334 Plumbers 341 Electricians
342 Electronics & Telecommunications Trades Workers 351 Food Trades Workers
361 Animal Attendants & Trainers, & Shearers 362 Horticultural Trades Workers
391 Hairdressers 392 Printing Trades Workers
393 Textile, Clothing & Footwear Trades Workers 394 Wood Trades Workers
399 Miscellaneous Technicians & Trades Workers 411 Health & Welfare Support Workers
421 Child Carers 422 Education Aides
423 Personal Carers & Assistants 431 Hospitality Workers
441 Defence Force Members, Fire Fighters & Police 442 Prison & Security Officers
451 Personal Service & Travel Workers 452 Sports & Fitness Workers
511 Contract, Program & Project Administrators 512 Office & Practice Managers
521 Personal Assistants & Secretaries 531 General Clerks
532 Keyboard Operators 541 Call or Contact Centre Information Clerks
542 Receptionists 551 Accounting Clerks & Bookkeepers
552 Financial & Insurance Clerks 561 Clerical & Office Support Workers
591 Logistics Clerks 599 Miscellaneous Clerical & Administrative Workers
611 Insurance Agents & Sales Representatives 612 Real Estate Sales Agents
621 Sales Assistants & Salespersons 631 Checkout Operators & Office Cashiers 639 Miscellaneous Sales Support Workers
711 Machine Operators 712 Stationary Plant Operators
721 Mobile Plant Operators 731 Automobile, Bus & Rail Drivers
732 Delivery Drivers 733 Truck Drivers 741 Storepersons
811 Cleaners & Laundry Workers 821 Construction & Mining Labourers
831 Food Process Workers 832 Packers & Product Assemblers
839 Miscellaneous Factory Process Workers 841 Farm, Forestry & Garden Workers
851 Food Preparation Assistants 891 Freight Handlers & Shelf Fillers
899 Miscellaneous Labourers
-300 -250 -200 -150 -100 -50 0 50 100
Source: ACIL Allen Source: ACIL Allen

The Economic Significance of the Australian Logistics Industry 17
C O N S U L T I N G
4. Current issues in LogisticsKey Finding 4
• The Logistics industry is affected by many regulations, some of which overlap and generate inefficiencies.
• In recent years there have been many strategies which affect the movement of freight.
• Greater certainty on planning for freight would stimulate private sector investment in freight infrastructure.
• In many planning debates freight does not have a voice which results in the provision of inefficient infrastructure and a loss of productivity.
• Despite strategies and plans which seek to address this, there is yet to be a clear whole-of-supply chain focus on strategic corridors.
The Logistics industry is affected by regulations, national policies and strategies, regional planning and development policies, separate state and regional transport strategies, as well as a growing requirement for adequate and appropriate investment in infrastructure which is heavily influenced by government policy.
In the past year a number of national and state transport and freight strategies have been released:
• December 2013—Moving Freight (A strategy for more efficient freight movement), Queensland Department of Transport and Main Roads
• December 2013—Final Report of the Freight Logistics Coordination Team, Tasmania
• November 2013—NSW Freight and Ports Strategy, Transport for NSW
• October 2013—Building a Stronger South Australia, The integrated transport and land use plan, Government of South Australia
• August 2013—Victoria—The Freight State (Victorian Freight and Logistics Plan), by the Victorian Department of Transport
• May 2013—National Land and Freight Strategy—A Place For Freight, by the Standing Council on Transport and Infrastructure
• May 2013—Western Australian Regional Freight Network Transport Plan by the Western Australia Department of Transport
• 2013—2014–2018 Strategic Plan, Northern Territory Department of Transport
Each of these strategy documents recognises the needs of Logistics, and to differing degrees they recognise the problems that are evident, namely the need for:
1. Harmonising regulation and legislation and reducing red tape
2. Securing adequate funding for infrastructure, and investment reform
3. Identifying and then efficiently delivering key infrastructure projects
4. Adopting whole-of supply chain planning
5. A desire to make greater use of railways
6. High productivity vehicle access and charging
7. Establishing a network of efficient intermodal facilities
8. Giving freight a voice in urban planning.
This chapter addresses the current state of the industry in relation to these issues:
4.1.1 Harmonising regulation and reducing bureaucracy
Bureaucracy costs money and can stifle innovation, in the Logistics industry it can also lead to better safety outcomes or better information for decision making. However, duplicated or inconsistent regulation is always wasteful.
The Road Safety Remuneration Act established the Road Safety Remuneration Tribunal which has powers to hand down orders (RSROs) that prevail over all other laws, including the recent Heavy Vehicle National Law (HVNL). The Road Safety Tribunal and the HVNL have considerable overlap in their scope and the obligations

18
imposed under these instruments have significant cost impacts. For example, contractual arrangements, safety and operating systems, training programs and internal policies (such as drug and alcohol policies, safe driving plans and driver contracts) must be updated to reflect the obligations imposed by the RSRO.
The Office of the National Rail Safety Regulatory has been established and commenced operations on 20 January 2013 with the responsibility for regulatory oversight of rail safety law in the jurisdictions of South Australia, New South Wales, Tasmania, and the Northern Territory. Victoria joined in May 2014, 16 months after8 the Office commenced operations and WA and Queensland still need to pass mirror rail safety laws otherwise existing rail safety regulation requirements will remain in place for rail operators that operate within those states. ARTC is currently in discussions with Queensland Rail (QR) over government plans to transfer the management of up to 7,000 kilometres of QR’s track, which may assist with harmonisation.
Other areas of inefficient regulation are Australia-specific design standards or safety standards that restrict the import of standard freight (prime mover or locomotive) models which already meet stringent American or European tests.
Action needs to be taken to ensure that regulatory bodies do not have overlapping scope, that they cannot issue binding orders that contradict each other or impose significant costs.
4.1.2 Securing adequate investment in infrastructure
The costs of congestion to Australia have been estimated to escalate to more than $20 billion per annum by 20209, the private costs of which will be disproportionately borne by the logistics industry. Greater investment in infrastructure is required to alleviate this increasing cost.
Government finances are typically constrained and are insufficient to finance the optimal investment in infrastructure. The Productivity Commission draft report into Public Infrastructure10 identified the following recommendations:
Draft finding 5.1
There is no shortage of private sector capital that could potentially be
deployed to finance public infrastructure in Australia. Private capital markets
will finance most projects at the ‘right price’.
Draft finding 6.1
Where project selection decisions are consistent with recommendations
made in this report, there is additional capacity for the Australian and State
and Territory Governments to finance public infrastructure from their own
balance sheets through the issue of sovereign debt and/or through tax.
Public Infrastructure, Draft Inquiry Report, Productivity Commission, 2014.
Each state and the Australian Government needs to determine its appetite for public private partnerships. Capital markets have shown an appetite for infrastructure assets with stable profits and a clear business case. The recent sale price of $1.75 billion (16 times earnings) for the Port of Newcastle and valuation of more than $6.2 Billion for the Port of Brisbane highlight this.
8 Victoria joins on 19 May 2014.
9 Estimating urban traffic and congestion cost trends for Australian cities, Working Paper 71, BITRE, June 2007.
10 The final report was not available at the time of publication of this report. It was released to the Government on 27 May 2014 and a final publication date was not announced at the time of this publication.

The Economic Significance of the Australian Logistics Industry 19
C O N S U L T I N G
4.1.3 Identifying and then efficiently delivering key infrastructure projects
Current infrastructure planning and strategy processes are tied to politics, this leads to poor project selection and uncertainty on the part of businesses. For this reason Infrastructure Australia and Infrastructure NSW were set up to provide advice independent of the political cycle.
The recently released draft report of the Productivity Commission’s Public Inquiry into Public Infrastructure (13 March 2014) clearly stated the case for a comprehensive overhaul of processes in the assessment and development of public infrastructure projects and demonstrated that:
• There are numerous examples of poor value for money arising from inadequate project selection.
• Without reform, more spending will simply increase the cost to users, taxpayers, the community generally, and the provision of wasteful infrastructure.
Drawing on the Productivity Commission again:
Draft finding 7.1
Institutional and governance arrangements for the provision and delivery
of much of Australia’s public infrastructure are deficient and are a major
contributor to poor outcomes.
When long-term investment decisions are subject to uncertainty based on short-term political cycles then businesses cannot make long-term investment plans without taking on additional risk. This leads to under-investment compared to the lower risk option.
For a project to generate maximum return on investment, it needs to be the best solution to an identified problem. If this is demonstrated by a sound business case this will assist in attracting funding and will provide industry with greater certainty about the criterion that are being used to evaluate investment options.
In general (and supported by the Productivity Commission Draft Report) there should always be a public cost-benefit analysis before public money is committed to projects.
4.1.4 Adopting whole-of supply chain planning
The recent strategy papers recognise a need for multimodal networks and some recent strategies combined modes (for example Transport for NSW’s Freight and Ports Strategy)
Prior planning tended to focus on individual modes rather than supply chains leading to outcomes such as the National Road Freight Network ending 5.5 kilometres from the entrance to Port Kembla.
Planning decisions will need to be taken with a view to the overall movement of freight and requirements of cities to avoid, for example, local planning decisions stalling the development of a well-situated intermodal terminal that is needed for wider community benefits.
4.1.5 A desire to make greater use of railways
With Australia’s freight projected to double by 2030 and to nearly triple by 2050 there is a clear impetus for freight to be moved on railways—a mode of transport that can move large volumes of freight without affecting road capacity.
Most strategic plans pay lip service to a desire to see more freight moving on rail, often this is expressed as a target for rail mode share of port traffic. However, the establishment of targets does little to lead to a meaningful change in behaviour. A number of reports, including the Productivity Commission’s draft report on public infrastructure, have recommended fundamental changes to how heavy vehicles and passenger vehicles are charged for road use.
Short haul rail suffers from a lack of scale economies and significant pick-up and delivery (PUD) costs. To overcome this industry participants are focussing on supply chain investments to reduce PUD costs and improve integration. As the haulage distance increases rail freight’s cost competitiveness improves, particularly on corridors which allow the use of long trains, double stacked if possible. Smaller port shuttles can be viable if they are able to continually shuttle between the port and an efficient intermodal terminal—however, this requires significant rail capacity which may be lacking, particularly where there is interaction with passenger services.

20
4.1.6 High productivity vehicle access and charging
Currently, vehicles with a gross vehicle mass of more than 4.5 tonnes are subject to a common charging regime in all jurisdictions except Western Australia and the Northern Territory. A pay as you go approach is used to calculate the level of costs to recover and charges are imposed as a fixed annual registration charge that varies by vehicle type and a road user charge administered through diesel excise arrangements. Around 40 per cent of revenue is raised from registration fees, with the balance from the RUC.
A 2006 study of road and rail freight infrastructure pricing by the Productivity Commission11 found that inefficient road use was occurring because charges were based on costs averaged across the road network and for given vehicle classes. The Commission also found that there were inefficiencies in road provision due to a disconnect between the revenue raised and spending decisions of road providers.
The Heavy Vehicle Charging and Investment Reform project has been studying the ways in which freight vehicles could be equitably charged for road use. With the establishment of Higher Mass Limits in NSW there is scope for the use of heavier, more productive vehicles, but also of aligning road user charges with the economic costs imposed and matching revenues earned to the route and paying the road manager for the use of that asset.
4.1.7 Establishing a network of efficient intermodal facilities
Intermodal terminals are critical to boosting productivity and efficiency in the freight logistics industry. Without intermodal terminals various state and national aspirations concerning the movement of goods by rail cannot be fulfilled: terminal capacity, location and efficiency directly impact on the efficiency of rail freight.
Section 2 above detailed how Australia’s national freight task has continued to increase at a pace faster than GDP. For this to be sustainable an efficient network of well-located and optimally designed intermodal terminals will be needed. Current and planned intermodal terminals include:
• New South Wales: Moorebank, Enfield, Chullora, Minto Eastern Creek/Badgery’s Creek (both proposed)
• Victoria: Altona, Somerton, Dynon, Lyndhurst, Western Interstate Freight Terminal (proposed)
• South Australia: Penfield, Islington, Dry Creek
• Queensland: Acacia Ridge, Bromelton (proposed), Ebenezer (proposed)
• Western Australia: Kewdale, Forestfield
• Tasmania: Brighton.
4.1.8 Giving freight a voice in urban planning
Finally, each of the strategies made reference to the need to plan for freight, and to “give freight space”. This links with many of the earlier comments about picking the right projects and viewing things from a network point of view.
For example, the National Land Freight Strategy identified long term precinct and corridor protection as one of the most significant issues across all modes of transport and one that requires a national approach to provide a long term focus on this issue.
Failure to protect corridors can result in the most efficient route being unavailable as a result of urban encroachment and requiring sub-optimal routes being used or expensive alternatives (such as tunnels) being developed.
The State planning documents which followed the National Ports Strategy and the National Land Freight Strategy generally showed a commitment towards integrating infrastructure needs with other planning demands, debates about planning rarely feature due consideration of freight’s needs. For example, with respect to the Planning Bill introduced into the NSW Parliament in 2013 the word ‘freight’ was not mentioned in the legislation nor did freight’s concerns feature in the debate at all.
Without some statutory mechanism for ensuring that freight’s needs are heard in planning debates the failure to protect corridors will continue, and sub-optimal infrastructure will be delivered. The Logistics industry will suffer decreases in its efficiency, costing the nation billions of dollars each year.
11 Productivity Commission 2006, Road and Rail Freight Infrastructure Pricing, Report, no. 41, Canberra, December.

The Economic Significance of the Australian Logistics Industry 21
C O N S U L T I N G
Appendix A: Estimating the size of the Logistics industryHow large is the Logistics industry in Australia? How does it link to businesses across the nation and what are the consequences of regulation, policies and decisions which affect its productivity?
The answers to these questions are not well known and this poses problems for policy makers as the information upon which they base their decisions is incomplete.
First we must define Logistics, and the definition adopted throughout this report is:
Logistics management is that part of supply chain management that plans,
implements, and controls the efficient, effective forward and reverses flow and
storage of goods, services and related information between the point of origin
and the point of consumption in order to meet customers’ requirements.
Council of Supply Chain Management Professionals, 2014
The system of national accounts maintained by the Australian Bureau of Statistics (ABS) reports expenditure, value added and employment data for an industry division called “Transport, Postal and Warehousing” (also known as ‘Division I’). Within this division passenger and freight movements by road, rail, air, water and pipeline are recorded, as are the expenditures on postal services and warehousing.
Division I only records the value of activities undertaken by firms on behalf of customers—the so called ‘Hire and Reward’ industry. Under this definition the Transport, Postal and Warehousing industry accounted for 4.78 per cent of Australia’s GDP in 2012.
A more complete picture of transport activities in the economy should also include activities undertaken on businesses’ own-account (so-called ‘ancillary transport’), as well as final demand for various transport related goods and services such as transport equipment.
Ancillary transport is undertaken by firms whose core businesses are to produce, manufacture or assemble goods, or to deliver services. Ancillary transport is not separately identified by the ABS national accounts, instead it is recorded under the industry classifications relevant to the core businesses. Similarly, a significant amount of warehousing and other logistics activities are undertaken not by third party logistics suppliers, but on businesses’ own account.
As a result of the system of national accounts, the Logistics industry is underrepresented in the national accounts because ancillary transport and its supporting services are not included. Decision makers may be misled if they are informed by a view of the industry that only reflects Hire and Reward activities.
A.1 Defining Logistics
The system of national accounts maintained by the ABS uses a standard industrial classification (‘ANZSIC’) whereby Hire and Reward transport activities are classified to Division I—Transport, Postal and Warehousing, which includes transport activities by different modes and their support services. Included in this Division are:
• Road transport (freight and passenger)
• Rail transport (freight and passenger)
• Water transport (freight and passenger)
• Air and space transport (freight and passenger)
The Economic Significance of the Australian Logistics Industry 23
C O N S U L T I N G
• Other transport
− Scenic and sightseeing transport
− Pipeline and other transport
• Postal and courier pick-up and delivery services
• Transport support services
− Water transport support services
− Airport operations and other air transport support services
− Other transport support services
• Warehousing and storage services.
ACIL Allen has adjusted this definition of the industry by separating passenger and freight services in Division I and stripping out water transport, pipelines and airlines (for which the ABS does not separate out freight and passenger uses, making it difficult to analyse), to define the logistics industry as being focussed on the movement and storage of physical freight on land and associated support services12.
This definition is different from the previous analysis of the size of the Logistics industry, undertaken by Apelbaum Consulting in 2007:
“The production processes (including inventory), materials and other inputs
(procurement), transport, storage, product support, reverse flows and
disposal. Specifically, transport and logistics activities include warehousing,
inventory management, processing, labelling, kitting, order management,
planning and processing, line haul (road, rail, sea, air and pipelines), regional
consolidation, distribution centre activities, courier route trade, local and
regional distribution, customer service and call centre activities.”
Contribution of Freight and logistics to the Economy—Dispelling The Myths, Apelbaum Consulting, 2007
ABS data on the Transport, Postal and Warehousing industry only record the activities undertaken by firms on behalf of customers—the so called “Hire and Reward” industry. Under this definition Division I accounted for 4.8 per cent of the Australian Gross Domestic Product in the year to June 2013, adding 73.2 billion dollars of value to the Australian economy.
Over time Division I’s share of the national economy has increased, from 4.15 per cent 30 years ago to 4.8 per cent in the latest financial year. Increased outsourcing of Logistics, a boom in online purchasing, increases in coal exports and increases in passenger road and air movements have contributed to this growth.
A review of Census data from 2011 shows that Division I industries employed 4.8 per cent of all employees —consistent with their contribution to GDP.
A more complete picture of transport activities in the economy would also include activities undertaken on own-account (so-called ‘ancillary transport’), as well as final demand for various transport related goods and services. This limitation was raised by the ABS in an Information Paper titled A Future Australian Transport Satellite Account: ABS Views published in 2011.
12 Those activities which have been stripped out for the purposes of defining Logistics can be recombined at a later stage when we discuss a re-estimated Transport, Postal and Warehousing industry including ancillary transport and supporting activities.
24
A.2 Creating a Transport Satellite Account
In its paper the ABS identified the same issues as raised by ALC—that transport on its own account is not accurately recorded and that the purchase of supplies and support services to the transport industry are not captured by the System of National Accounts. The ABS proposed three methods for estimating a more complete transport ‘Satellite Account’.
a) Indirectly, by a “volume” based measure. This approach estimates the total transport related inputs used by the non-transportation industry (plus a share of non-transport related inputs such as accounting services) and allocates this by industry and mode using number of trucks/buses/trains/planes etc. This approach also uses ratios from the for-hire industry to allocate non-transport related inputs and value added inputs by industry and mode. The United States’ Transport Satellite Account uses this approach.
b) Indirectly, by using wages and salaries by industry by transport mode from the Census/Labour Force Survey, focussing on occupations that vary by mode. From this information the ratio of total operating expenses to occupational wages could be calculated by transport mode. The wages are regarded as an indicator of operating expenses in the sense that if these wages and their ratio to operating expenses are known for the for-hire industry, then the operating expenses can be calculated for the non-transportation industry. That is, operating expenses for every mode in the production of own-account transport services can be calculated by multiplying the for-hire mode specific ratio by the industry specific wage estimate.
c) Direct collection/ratio estimation: this approach is similar to approach (a) in that own-account transport output could be measured as the sum of input costs plus depreciation and return to capital. The difference is that some of the own-account transport costs are directly collected by mode and industry as much as possible. In Australia’s case, this direct collection would be via utilising more detailed statistics on transport industry and activity in the years such data is collected in the Economic Activity Survey (which may be at best every five years). It should be noted, non-transport related inputs used in the provision of these services (e.g. accounting services) and Gross Operating Surplus could not be collected and would have to be derived.
A.3 Our approach
ACIL Allen has adopted the second method recommended by the ABS—that is, using Census and Labour Force Survey data to determine the number of drivers and other logistics workers and to estimate the size of the ancillary sector from these data. This is the most cost-effective method, requiring the least primary data collection.
These data were then adjusted to separately identify different elements of Division I, for example, different modes of transport and to separate passenger activity from freight activity. An estimate was made of the number of drivers employed in ancillary transport and this was grossed-up to include estimates of the support staff involved in ancillary transport.
Using the ABS Census and data for Division I an estimate was made of the average economic value added per employee. This was assumed constant, and was used to estimate and carve out the economic effects of ancillary transport in each industry and to reallocate this to the Transport Satellite Account. Further adjustments were made to reflect ancillary rail activities undertaken by BHP Billiton, Rio Tinto and Fortescue Metals Group (FMG) in the Pilbara.
An estimate was also made to capture the extent of all logistics activities in firms—not just the physical transport task but also encompassing planning, coordination, receival and storage activities undertaken within firms.
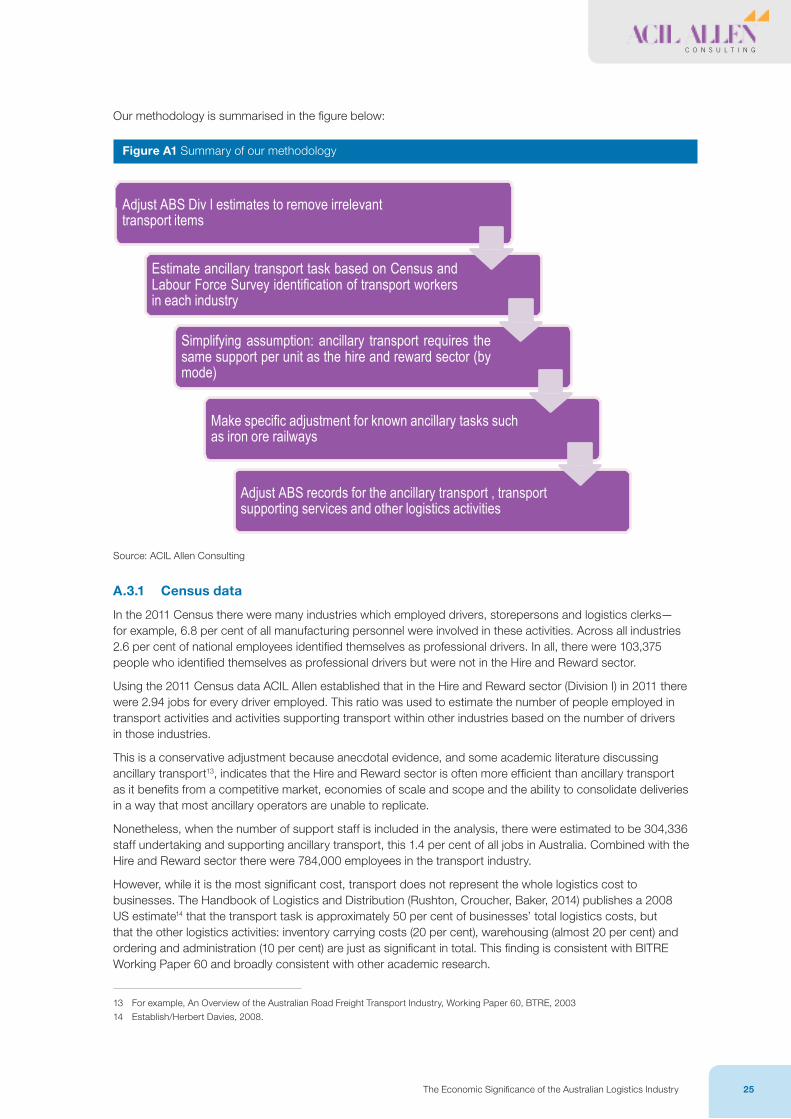
The Economic Significance of the Australian Logistics Industry 25
C O N S U L T I N G
Our methodology is summarised in the figure below:
Figure A1 Summary of our methodology
A C I L A L L E N C O N S U L T I N G
13 For example, An Overview of the Australian Road Freight Transport Industry, Working Paper 60, BTRE, 2003
27 ECONOMIC SIGNIFICANCE OF THE AUSTRALIAN LOGISTICS INDUSTRY
An estimate was also made to capture the extent of all logistics activities in firms – not just the physical transport task but also encompassing planning, coordination, receival and storage activities undertaken within firms.
Our methodology is summarised in the figure below:
Figure A1 Summary of our methodology
Adjust ABS Div I estimates to remove irrelevant transport items
Estimate ancillary transport task based on Census and Labour Force Survey identification of transport workers in each industry
Simplifying assumption: ancillary transport requires the same support per unit as the hire and reward sector (by mode)
Make specific adjustment for known ancillary tasks such as iron ore railways
Adjust ABS records for the ancillary transport , transport supporting services and other logistics activities
Source: ACIL Allen Consulting
A.3.1 Census data
In the 2011 Census there were many industries which employed drivers, storepersons and logistics clerks – for example, 6.8 per cent of all manufacturing personnel were involved in these activities. Across all industries 2.6 per cent of national employees identified themselves as professional drivers. In all, there were 103,375 people who identified themselves as professional drivers but were not in the Hire and Reward sector.
Using the 2011 Census data ACIL Allen established that in the Hire and Reward sector (Division I) in 2011 there were 2.94 jobs for every driver employed. This ratio was used to estimate the number of people employed in transport activities and activities supporting transport within other industries based on the number of drivers in those industries.
This is a conservative adjustment because anecdotal evidence, and some academic literature discussing ancillary transport13, indicates that the Hire and Reward sector is often more efficient than ancillary transport as it benefits from a competitive market, economies of scale and scope and the ability to consolidate deliveries in a way that most ancillary operators are unable to replicate.
Nonetheless, when the number of support staff is included in the analysis, there were estimated to be 304,336 staff undertaking and supporting ancillary transport, this 1.4 per
Source: ACIL Allen Consulting
A.3.1 Census data
In the 2011 Census there were many industries which employed drivers, storepersons and logistics clerks—for example, 6.8 per cent of all manufacturing personnel were involved in these activities. Across all industries 2.6 per cent of national employees identified themselves as professional drivers. In all, there were 103,375 people who identified themselves as professional drivers but were not in the Hire and Reward sector.
Using the 2011 Census data ACIL Allen established that in the Hire and Reward sector (Division I) in 2011 there were 2.94 jobs for every driver employed. This ratio was used to estimate the number of people employed in transport activities and activities supporting transport within other industries based on the number of drivers in those industries.
This is a conservative adjustment because anecdotal evidence, and some academic literature discussing ancillary transport13, indicates that the Hire and Reward sector is often more efficient than ancillary transport as it benefits from a competitive market, economies of scale and scope and the ability to consolidate deliveries in a way that most ancillary operators are unable to replicate.
Nonetheless, when the number of support staff is included in the analysis, there were estimated to be 304,336 staff undertaking and supporting ancillary transport, this 1.4 per cent of all jobs in Australia. Combined with the Hire and Reward sector there were 784,000 employees in the transport industry.
However, while it is the most significant cost, transport does not represent the whole logistics cost to businesses. The Handbook of Logistics and Distribution (Rushton, Croucher, Baker, 2014) publishes a 2008 US estimate14 that the transport task is approximately 50 per cent of businesses’ total logistics costs, but that the other logistics activities: inventory carrying costs (20 per cent), warehousing (almost 20 per cent) and ordering and administration (10 per cent) are just as significant in total. This finding is consistent with BITRE Working Paper 60 and broadly consistent with other academic research.
13 For example, An Overview of the Australian Road Freight Transport Industry, Working Paper 60, BTRE, 2003
14 Establish/Herbert Davies, 2008.

The Economic Significance of the Australian Logistics Industry 27
C O N S U L T I N G
A further adjustment was therefore made to gross-up the number of staff engaged in transport activities to reflect the number of staff engaged in Logistics activities. When this adjustment was made the number of employees in Logistics was estimated to be 1.2 million persons.
A.3.2 ABS National Accounts
The ABS estimates that in the year to June 2013 the Hire and Reward transport sector (Division I) added $73.5 billion dollars to the Australian economy. Because employment data are derived from the 2011 Census ACIL Allen has used the ABS estimates for gross value added in 2011 in deriving relationships between employment and gross value added in Division I.
There were 479,180 workers employed in the industry in 2011 which corresponded with estimated gross value added of $68.2 billion in 2011 prices, and this indicates that the value added per employee was $132,545. If this seems high one must note that the transport industry is relatively capital intensive, with individual truck drivers responsible for equipment worth hundreds of thousands of dollars, and train drivers responsible for assets worth millions of dollars. Capital intensive industries typically have high value added per employee and lower rates of value added per unit of capital.
A.3.3 ABS input-output tables
The ABS publishes detailed information about the supply and use of products in the Australian economy, and the structure of and inter–relationships between Australian industries in what are called input-output tables. The latest release was in September 2013 and contained records for the 2009–10 financial year.
For each industry the ABS has collated the details of the products which were purchased by those industries in producing their outputs—for example mining companies tend to purchase significant amounts of construction services, 3rd party exploration and mining support services, as well as machinery and fuel. Mining companies also employ labour and capital goods in producing their output.
A key feature of input-output tables is that the use of goods and services (including intermediate uses, final demand and exports) is matched by the supply of goods and services (including those purchased domestically or imported, or manufactured using capital and labour). Input-output tables use data which are slightly different from the measures of GDP quoted above—for 2010 Division I’s share of GDP is estimated to be 5.0 per cent in the input-output tables and 4.76 in the relevant National Accounts. This difference is not considered material to the analysis.
These input-output tables are an important step in ACIL Allen’s determination of the impact of reclassifying ancillary transport from the industries to a Transport Satellite Account. By using the value added per employee estimated from Division I ACIL Allen made an estimate of the added value that ancillary transport has generated in other industries.
From the input-output tables ACIL Allen was able to determine the typical mix of purchased inputs, labour and capital for each dollar of value added in Division I. This allowed ACIL Allen to make an estimate of the resources that would be used by the ancillary transport task in each industry. An adjustment was then made to remove these ancillary transport activities (labour, capital and intermediate purchases) from their originating industries and to move them to the Transport Satellite Account.
The approach undertaken here is quite a simple one and a more detailed study could be undertaken to further refine it. The ABS has drafted an information paper on Transport Satellite Accounts15 which outlined many aspects which would be required for robust accounting. Further work should focus on the key estimates which have a material impact on our estimates. These are:
• Whether ancillary transport resource use is well-approximated by Hire and Reward transport
• The number of staff engaged in ancillary transport activities, determined by:
− The initial estimate of drivers
− The ratio of support staff to drivers
• The gross value added per employee, as this is used to reallocate value added from industries to the Transport Satellite Account.
15 5269.0.55.001—Information Paper: A Future Australian Transport Satellite Account: ABS Views, 2011

28
A.3.4 Specific adjustment—ancillary rail
A further adjustment was made to the input-output tables. BHP Billiton, Rio Tinto and FMG operate private railways in the Pilbara. A vast quantity of iron ore is transported on those railways to bulk ports at Port Hedland, Dampier and Port Walcott/Cape Lambert16. These railways are ancillary to the iron ore mining undertaken by these companies, and it is appropriate to remove the value added and the resources used in generating that value added from the mining industry and to transfer them to the Transport Satellite Account.
Unfortunately there is little information in the public domain about the cost of these railways. One source is related to the ongoing activities surrounding the declaration of The Pilbara Infrastructure, the railway operated by FMG. This is a railway of approximately 283 kilometres length, with designed capacity of 80 million tonnes per annum.
The floor and ceiling costs to be used in pricing determinations are still subject to determination by relevant courts and regulatory processes but submissions have been made by The Pilbara Infrastructure (public submission, 13 July 2013) and by the WA Economic Regulation Authority (Economic Regulation Authority, Review of Floor and Ceiling Cost Proposal of the Pilbara Infrastructure Pty Ltd., PricewaterhouseCoopers, February 2011).
The magnitude of difference between the two floor cost estimates is notable:
Table A1 Floor and ceiling cost proposal for the Pilbara Infrastructure
Floor Ceiling
$ million per annum $ million per annum
Cost—TPI proposal $203.0 $230.9
Cost—PwC recalculation $24.1 $173.0
Source: Public Submission on The Pilbara Infrastructure Pty Ltd’s Floor and Ceiling Costs (The Pilbara Infrastructure, 13 July 2013) and Economic Regulation Authority, Review of Floor and Ceiling Cost Proposal of the Pilbara Infrastructure Pty Ltd., PricewaterhouseCoopers, February 2011
ACIL Allen has determined to use the ceiling cost estimated by PwC as the basis for estimating the cost of rail capacity across the Pilbara. On the assumption that the Pilbara Infrastructure is 283 kilometres long and offers 80 million tonnes per annum of capacity it has an estimated capacity of 22.6 billion net tonne kilometres per annum.
Dividing the estimated annual ceiling cost of $173 million per annum by 22.6 billion net tonne kilometres gives an estimated cost of capacity of $7,651 per million net tonne kilometres (‘MNtk’) of capacity per annum. The floor cost calculated in a similar manner is $1,067 per million net tonne kilometres of capacity per annum.
The estimated length of railways operated by BHP Billiton and Rio Tinto are shown below, and an estimate is made of the annual floor and ceiling costs of their operations if they have the same average cost as the Pilbara Infrastructure was estimated to have in 2011.
16 A review of websites from BHP Billiton, Rio Tinto and Fortescue Metals Group indicates a combined capacity of 513 million tonnes per annum in 2014 with potential to upgrade this as needed. The Bureau of Resources, Energy Economics estimates that in 2011 Western Australia exported approximately 474 million tonnes of iron ore.
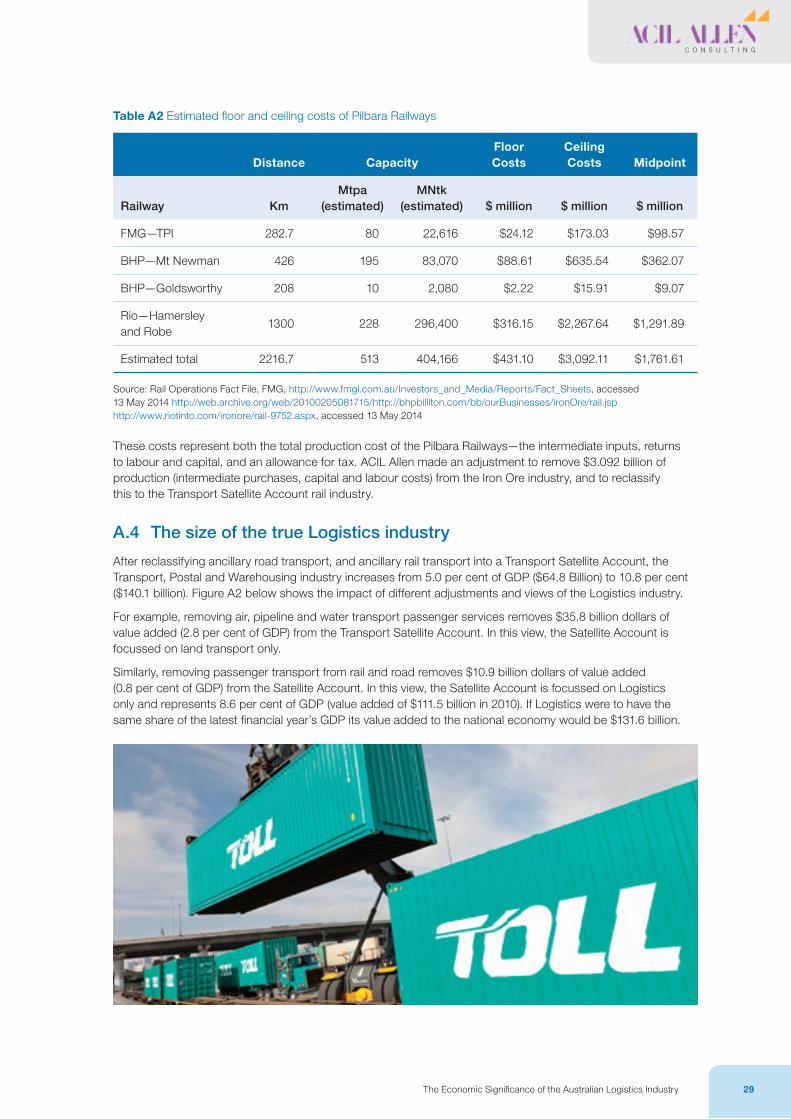
The Economic Significance of the Australian Logistics Industry 29
C O N S U L T I N G
Table A2 Estimated floor and ceiling costs of Pilbara Railways
Distance CapacityFloor Costs
Ceiling Costs Midpoint
Railway KmMtpa
(estimated)MNtk
(estimated) $ million $ million $ million
FMG—TPI 282.7 80 22,616 $24.12 $173.03 $98.57
BHP—Mt Newman 426 195 83,070 $88.61 $635.54 $362.07
BHP—Goldsworthy 208 10 2,080 $2.22 $15.91 $9.07
Rio—Hamersley and Robe
1300 228 296,400 $316.15 $2,267.64 $1,291.89
Estimated total 2216.7 513 404,166 $431.10 $3,092.11 $1,761.61
Source: Rail Operations Fact File, FMG, http://www.fmgl.com.au/Investors_and_Media/Reports/Fact_Sheets, accessed 13 May 2014 http://web.archive.org/web/20100205081715/http://bhpbilliton.com/bb/ourBusinesses/ironOre/rail.jsp http://www.riotinto.com/ironore/rail-9752.aspx, accessed 13 May 2014
These costs represent both the total production cost of the Pilbara Railways—the intermediate inputs, returns to labour and capital, and an allowance for tax. ACIL Allen made an adjustment to remove $3.092 billion of production (intermediate purchases, capital and labour costs) from the Iron Ore industry, and to reclassify this to the Transport Satellite Account rail industry.
A.4 The size of the true Logistics industry
After reclassifying ancillary road transport, and ancillary rail transport into a Transport Satellite Account, the Transport, Postal and Warehousing industry increases from 5.0 per cent of GDP ($64.8 Billion) to 10.8 per cent ($140.1 billion). Figure A2 below shows the impact of different adjustments and views of the Logistics industry.
For example, removing air, pipeline and water transport passenger services removes $35.8 billion dollars of value added (2.8 per cent of GDP) from the Transport Satellite Account. In this view, the Satellite Account is focussed on land transport only.
Similarly, removing passenger transport from rail and road removes $10.9 billion dollars of value added (0.8 per cent of GDP) from the Satellite Account. In this view, the Satellite Account is focussed on Logistics only and represents 8.6 per cent of GDP (value added of $111.5 billion in 2010). If Logistics were to have the same share of the latest financial year’s GDP its value added to the national economy would be $131.6 billion.

30
Figure A2 Size of the true transport industry
A C I L A L L E N C O N S U L T I N G
31 ECONOMIC SIGNIFICANCE OF THE AUSTRALIAN LOGISTICS INDUSTRY
Gro
ss V
alue
Add
ed ($
Bn,
20
11)
Shar
e of
G
DP
For example, removing air, pipeline and water transport passenger services removes $35.8 billion dollars of value added (2.8 per cent of GDP) from the Transport Satellite Account. In this view, the Satellite Account is focussed on land transport only.
Similarly, removing passenger transport from rail and road removes $10.9 billion dollars of value added (0.8 per cent of GDP) from the Satellite Account. In this view, the Satellite Account is focussed on Logistics only and represents 8.6 per cent of GDP (value added of $111.5 billion in 2010). If Logistics were to have the same share of the latest financial year’s GDP its value added to the national economy would be $131.6 billion.
Figure A2 Size of the true transport industry
$160
$140
$120
$100
$80
$60
$40
$20
$0
Source: ACIL Allen Consulting
12%
10%
8%
6%
4%
2%
0%
A.4.1 How our estimates compare to other transport satellite
accounts
International evidence on satellite accounts
Transport satellite accounts are maintained in Canada, the US and France. Other countries periodically make assessment of the role of ancillary transport to fill the gap in their annual data collection. The transport satellite accounts regularly maintained are used for different purposes in these countries and so are constructed under different systems. This makes comparison difficult.
One of the first transport satellite accounts was constructed for the United States. As a satellite to the 1992 input-output tables, the primary purpose was to provide a systematic and consistent framework and data set for conducting analytical studies of the role of
Source: ACIL Allen Consulting
A.4.1 How our estimates compare to other transport satellite accounts
International evidence on satellite accounts
Transport satellite accounts are maintained in Canada, the US and France. Other countries periodically make assessment of the role of ancillary transport to fill the gap in their annual data collection. The transport satellite accounts regularly maintained are used for different purposes in these countries and so are constructed under different systems. This makes comparison difficult.
One of the first transport satellite accounts was constructed for the United States. As a satellite to the 1992 input-output tables, the primary purpose was to provide a systematic and consistent framework and data set for conducting analytical studies of the role of transportation in the economy on both an industry and commodity basis. The latest (1997) US Transport Satellite Account showed that:
...all transportation services (all for-hire and in-house modes) contributed
about $367.8 billion of value-added in 1997. Of this $367.8 billion, for-hire
air, rail, truck, and water transportation generated $152.2 billion, or about
1.8 percent of all GDP. In-house transportation activities for these same
four modes (air, rail, truck, and water transportation) generated $122.7 billion
of value-added in 1997, or 1.5 percent of total GDP.
U.S. Department of Transportation, Research and Innovative Technology Administration, Bureau of Transportation Statistics,
Transportation Satellite Accounts: A Look at Transportation’s Role in the Economy, Washington, DC: 2011. PP 31

The Economic Significance of the Australian Logistics Industry 31
C O N S U L T I N G
While the headline number may indicate that transport’s role in the economy represented in 3.3 per cent of GDP (because this includes air and water, but focuses only on transport not logistics more generally, the equivalent number calculated by ACIL Allen is 8.0 per cent) one must understand that the American economy is fundamentally different from Australia’s with a lower proportion of economic activity related to moving physical items.
The takeaway fact from this US analysis is that the inclusion of ancillary transport increased the value added of the transport industry by 83.3 per cent. An equivalent increase to Australia’s 4.8 per cent for Division I (ABS, 2013) would indicate that transport’s role in the economy should be 8.8 per cent. As discussed in the previous paragraph the equivalent number in ACIL Allen’s estimate is 8.0 per cent.
In 2000 Canada estimated that hire and reward transportation services accounted for 3.7 per cent of Canada’s economic output and when own-account services are included the economic importance of transportation rose to 6.3 per cent, an increase of 70 per cent. This would suggest an uplift of Australia’s 4.8 per cent (ABS 2013) to 8.2 per cent (ACIL Allen equivalent statistic is 8.0 per cent).
In France, TrSA were constructed for 1992, 1996 and 1998 (INSEE, undated). French studies present current spending and capital spending for each mode of transport. They expand the traditional production boundary by taking also into account the social costs of transport (externalities) and furthermore by considering also private purchase and use of cars as part of the accounts (INSEE, 1996). As a result the French studies are difficult to compare to this analysis.
In Belgium, the transport satellite accounts have been drawn up since 1995 and are updated every five years to correspond with the nation’s input-output tables. To a large extent the Belgian methodology follows the methodology applied in France (Hoornaert et. al., 2009).
In Italy, the first transport satellite account was done for the benchmark year 1992. It focused on the calculation of the own-account transport and mainly on road transport (Putignano and Montella, 1993).
Estimates of ancillary transport
The share of the total transport task (in tonnes) which is accounted for by ancillary transport has been in decline globally since at least 1985. This is because third-party logistics firms have increasingly offered greater economies of scale and other efficiencies on longer hauls and increased market share as a result.
ACIL Allen estimated that 39 per cent of drivers (both passenger and freight) are employed in the Hire and Reward industry, with the remaining drivers providing ancillary transport services. This is consistent with the trend shown in Table A3 below, which would see tonnes moved by ancillary transport to continue to have declined below 40 per cent.

32
Table A3 Domestic road transport of goods in the EU (1995,1985)
1985 1995
Total domestic
road transport
Own account
transport
Own account
share
Total domestic
road transport
Own account
transport
Own account
share
Million tonnes
Million tonnes %
Million tonnes
Million tonnes %
Germany 2,213.7 1,293.5 58.4 3,150.0 1,510.0 47.9
France 1197.9 789.1 65.9 1,324.1 694.7 52.5
Italy (1986) 841.0 351.6 41.8 1,080.1 527.1 48.8
Netherlands 338.7 128.5 37.9 391.8 108.2 27.6
Belgium 265.4 150.7 58.8 349.2 149.4 42.8
Luxemburg 11.1 10.2 91.9 28.4 22.7 79.9
United Kingdom 1407.0 646.0 45.9 1,658.4 649.9 39.2
Ireland (1993) 89.7 67.5 75.2 80.6 40.1 49.8
Denmark 199.9 65.0 32.5 176.0 47.0 29.7
Greece 158.4 79.5 50.2 179.3 81.3 45.3
Spain (1986) 913.3 244.6 26.8 588.2 145.1 24.7
Portugal (1987) 190.6 155.6 81.6 263.2 217.0 82.4
Austria (1993) 177.7 98.2 55.3
Finland 349.1 70.5 20.2
Sweden 343.2 52.1 15.2
EU 7,826.7 3,981.8 50.9 10,139.3 4,413.3 43.5
Source: Reported in Report Of The Hundred And Fifth Round Table On Transport Economics on the following topic: Road Freight Transport For Own Account In Europe, Economic Research Centre, November 1999, Paris.
A more recent study from France17 indicated that the overall volume of own account transport has remained stable in France since 1994 at around 800 million tonnes per year but own account transport’s share of road transport tonnage has fallen from 49% in 1994 to 39% in 2006.
As discussed in the pervious section, Canadian own-account transport increased transport’s value added by 70 per cent in 2000 estimates, and the USA estimate increased by 83% once own-account transport was included.
17 The Changing Role Of Own Account Haulage: Evidence From French Shipper Surveys, Cécilia Cruz, Michèle Guilbault, Elisabeth Gouvernal, INRETS-SPLOT (French National Institute for Transport and Safety Research—Productive systems, logistics and transport organization), Association for European Transport and contributors, 2008.
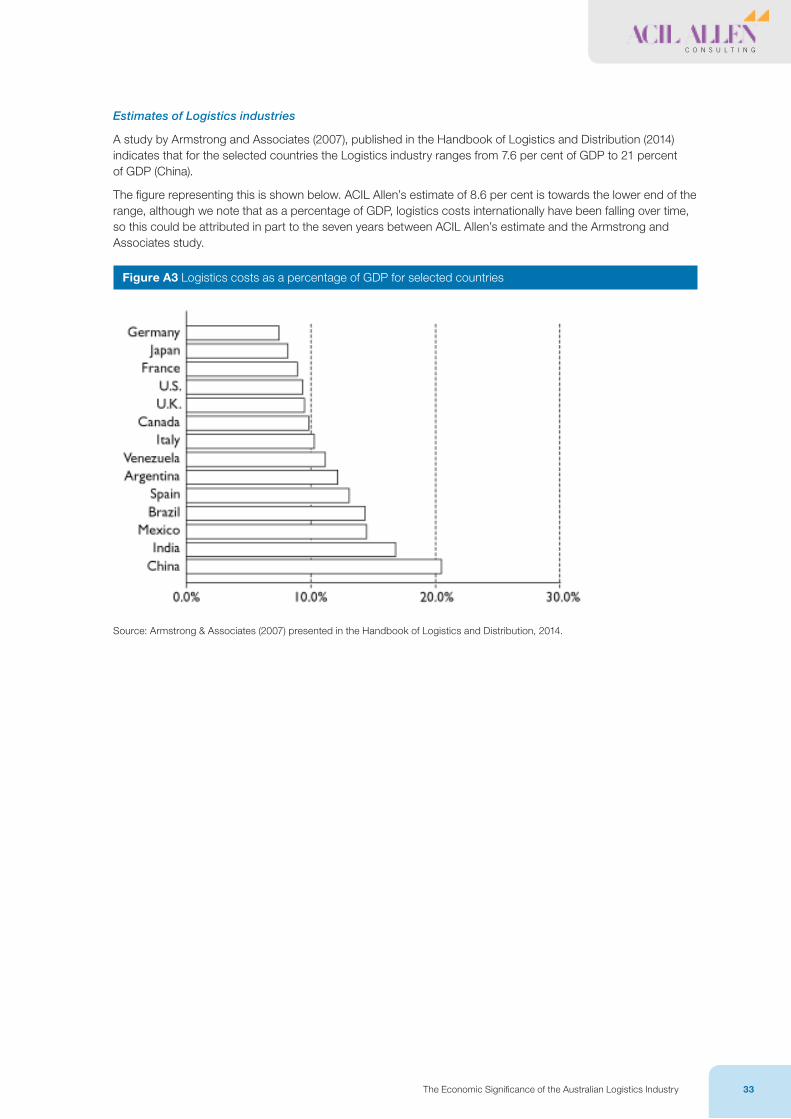
The Economic Significance of the Australian Logistics Industry 33
C O N S U L T I N G
Estimates of Logistics industries
A study by Armstrong and Associates (2007), published in the Handbook of Logistics and Distribution (2014) indicates that for the selected countries the Logistics industry ranges from 7.6 per cent of GDP to 21 percent of GDP (China).
The figure representing this is shown below. ACIL Allen’s estimate of 8.6 per cent is towards the lower end of the range, although we note that as a percentage of GDP, logistics costs internationally have been falling over time, so this could be attributed in part to the seven years between ACIL Allen’s estimate and the Armstrong and Associates study.
Figure A3 Logistics costs as a percentage of GDP for selected countries
A C I L A L L E N C O N S U L T I N G
34 ECONOMIC SIGNIFICANCE OF THE AUSTRALIAN LOGISTICS INDUSTRY
Figure A3 Logistics costs as a percentage of GDP for selected countries
Source: Armstrong & Associates (2007) presented in the Handbook of Logistics and Distribution, 2014. Source: Armstrong & Associates (2007) presented in the Handbook of Logistics and Distribution, 2014.
The Economic Significance of the Australian Logistics Industry 35
C O N S U L T I N G
Appendix B: The Tasman Global modelACIL Allen’s computable general equilibrium model Tasman Global is a powerful tool for undertaking economic impact analysis at the regional, state, national and global level.
There are various types of economic models and modelling techniques. Many of these are based on partial equilibrium analysis that usually considers a single market. However, in economic analysis, linkages between markets and how these linkages develop and change over time can be critical. Tasman Global has been developed to meet this need.
Tasman Global is an analytical tool that can capture these linkages on a regional, state, national and global scale. Tasman Global is a large-scale computable general equilibrium model which is designed to account for all industries within an economy and all economies across the world. ACIL Allen uses this modelling platform to undertake industry, project, scenario and policy analyses. The model is able to analyse issues at the industry, global, national, state and regional levels and to determine the impacts of various economic changes on production, consumption and trade at the macroeconomic and industry levels.
A Dynamic model
Tasman Global is a model that estimates relationships between variables at different points in time. This is in contrast to comparative static models, which compare two equilibriums (one before a policy change and one following). A dynamic model such as Tasman Global is beneficial when analysing issues where both the timing of and the adjustment path that economies follow are relevant in the analysis.
In applications of the Tasman Global model, a reference case simulation forms a “business- as-usual” basis with which to compare the results of various simulations. The reference case provides projections of growth in the absence of the changes to be examined. The impact of the change to be examined is then simulated and the results interpreted as deviations from the reference case.
The database
A key advantage of Tasman Global is the level of detail in the database underpinning the model. The database is derived from the latest Global Trade Analysis Project (GTAP) database which was released in 2008. This database is a fully documented, publicly available global data base which contains complete bilateral trade information, transport and protection linkages among regions for all GTAP commodities.
The GTAP model was constructed at the Centre for Global Trade Analysis at Purdue University in the United States. It is the most up-to-date, detailed database of its type in the world.
Tasman Global builds on the GTAP model’s equation structure and database by adding five important features: dynamics (including detailed population and labour market dynamics), detailed technology representation within key industries (such as transport, telecommunications, electricity generation and iron and steel production), the ability to repatriate labour and capital income, a detailed emissions accounting abatement framework and explicit representation of the states and territories of Australia.
Nominally the Tasman Global database divides the world economy into 120 regions although in reality the regions are frequently disaggregated further.
The GTAP database also contains a wealth of industrial detail (Table B1). The foundation of this information is the input-output tables that underpin the database. The input-output tables account for the distribution of industry production to satisfy industry and final demands. Industry demands, so-called intermediate usage, are the demands from each industry for inputs. For example, petroleum is an input into road and rail transport. In other words, the transport industry uses petroleum as an intermediate input. Final demands are those made by households, governments, investors and foreigners (export demand). These final demands, as the name suggests, represent the demand for finished goods and services. To continue the example, transported goods are used by households—their consumption is a final demand.
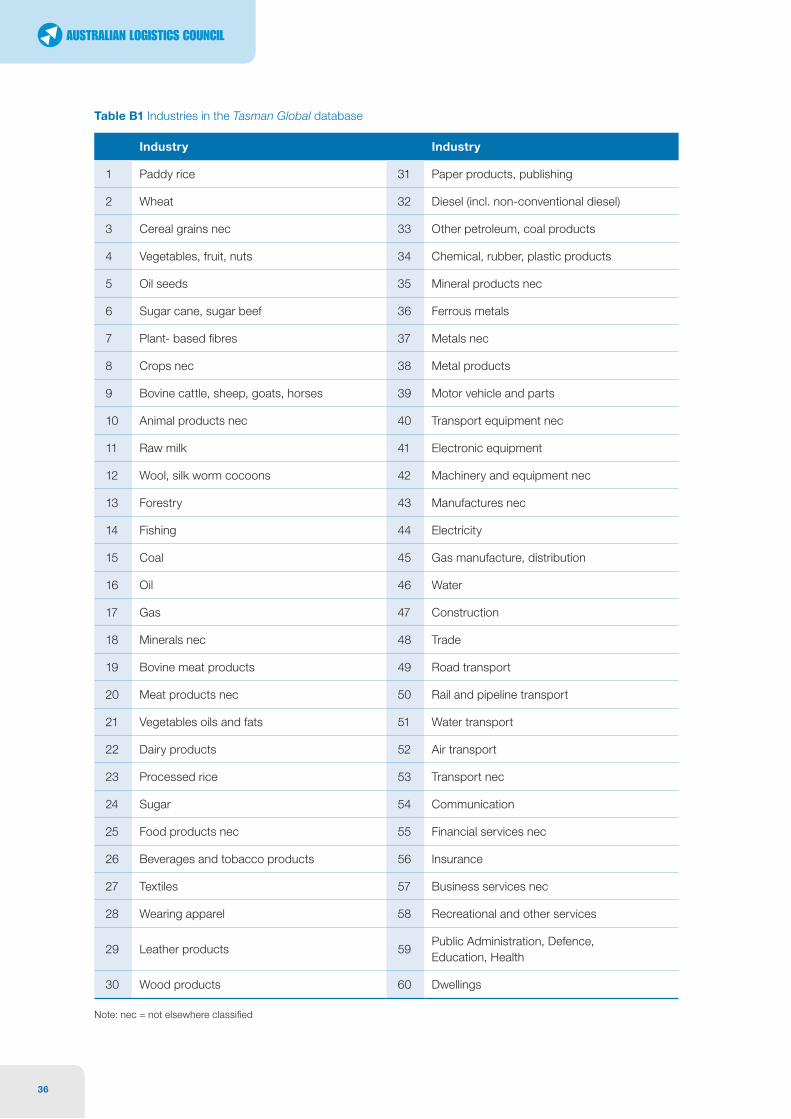
36
Table B1 Industries in the Tasman Global database
Industry Industry
1 Paddy rice 31 Paper products, publishing
2 Wheat 32 Diesel (incl. non-conventional diesel)
3 Cereal grains nec 33 Other petroleum, coal products
4 Vegetables, fruit, nuts 34 Chemical, rubber, plastic products
5 Oil seeds 35 Mineral products nec
6 Sugar cane, sugar beef 36 Ferrous metals
7 Plant- based fibres 37 Metals nec
8 Crops nec 38 Metal products
9 Bovine cattle, sheep, goats, horses 39 Motor vehicle and parts
10 Animal products nec 40 Transport equipment nec
11 Raw milk 41 Electronic equipment
12 Wool, silk worm cocoons 42 Machinery and equipment nec
13 Forestry 43 Manufactures nec
14 Fishing 44 Electricity
15 Coal 45 Gas manufacture, distribution
16 Oil 46 Water
17 Gas 47 Construction
18 Minerals nec 48 Trade
19 Bovine meat products 49 Road transport
20 Meat products nec 50 Rail and pipeline transport
21 Vegetables oils and fats 51 Water transport
22 Dairy products 52 Air transport
23 Processed rice 53 Transport nec
24 Sugar 54 Communication
25 Food products nec 55 Financial services nec
26 Beverages and tobacco products 56 Insurance
27 Textiles 57 Business services nec
28 Wearing apparel 58 Recreational and other services
29 Leather products 59Public Administration, Defence, Education, Health
30 Wood products 60 Dwellings
Note: nec = not elsewhere classified

The Economic Significance of the Australian Logistics Industry 37
C O N S U L T I N G
The other key feature of the database is that the cost structure of each industry is also represented in detail. Each industry purchases intermediate inputs (from domestic and imported sources) primary factors (labour, capital, land and natural resources) as well as paying taxes or receiving subsidies.
Factors of production
Capital, land, labour and natural resources are the four primary factors of production. The capital stock in each region (country or group of countries) accumulates through investment (less depreciation) in each period. Land is used only in agriculture industries and is fixed in each region. Tasman Global explicitly models natural resource inputs as a industry specific factor of production in resource based industries (coal mining, oil and gas extraction, other mining, forestry and fishing).
Detailed energy industry
Tasman Global contains a detailed representation of the energy industry, particularly in relation to the interstate (trade in electricity and gas) and international linkages across the regions represented. To allow for more detailed electricity industry analysis, and to aid in linkages to bottom-up models such as ACIL Allen’s GasMark and PowerMark models electricity generation is separated from transmission and distribution in the model. In addition, the electricity industry in the model employs a ‘technology bundle’ approach that separately identifies different electricity generation technologies (brown coal, black coal, oil, gas, hydro, nuclear and other renewables).
B.1.1 Model results
Tasman Global solves equations covering industry sales and consumption, private consumption, government consumption, investment and trade. The model therefore produces detailed microeconomic results, such as:
• output by industry
• employment by industry
• industry imports and exports.
Tasman Global also produces a full range of macroeconomic results, for each Australian state and the rest of the World including:
• total economic output
• total employment
• gross national product (GNP)
• gross domestic product (GDP)
• gross state product (GSP)
• private consumption
• public consumption
• investment
• imports
• exports.
The model can also produce details of greenhouse gas emissions, measured in thousand tonnes of CO2 equivalent per annum.
All of these results (and more) are produced on a year-by-year basis. Frequently a 20 year projection is produced; however, this can be altered to fit the needs of the particular economic impact assessment being undertaken.


Australian Logistics Council
PO Box 20 DEAKIN WEST ACT 2600 17b National Press Club Building, 16 National Circuit, Barton, ACT, 2600 P: +61 2 6273 0755 F: +61 2 6273 3073
austlogistics.com.au
C O N S U L T I N G
Related Documents