The Economic Outlook for the U.S. and Arizona For Presentation at the: Arizona City/County Management Association Meetings July 26, 2012 Presented by Ronald J. Gunderson Professor of Economics Northern Arizona University

The Economic Outlook for the U.S. and Arizona For Presentation at the: Arizona City/County Management Association Meetings July 26, 2012 Presented by Ronald.
Dec 24, 2015
Welcome message from author
This document is posted to help you gain knowledge. Please leave a comment to let me know what you think about it! Share it to your friends and learn new things together.
Transcript
The Economic Outlook for the U.S. and ArizonaFor Presentation at the:Arizona City/County Management Association Meetings
July 26, 2012
Presented by
Ronald J. GundersonProfessor of EconomicsNorthern Arizona University

An economic forecaster is like a cross-eyed javelin thrower; he doesn’t win many accuracy contests, but he keeps the crowd’s attention.
--Anonymous

Manufacturing Drops for 1st time in 3 years – July 3, 2012 Headline
Institute for Supply Management Report Production & exports of manufactured goods
declined along with the number of new orders The decline comes as:
U.S. employers have cut back on hiring Consumers have become more cautious Europe is entering a recession Manufacturing in China is also slowing
3
Source: Institute for Supply Management, In: The Arizona Republic July 3, 2012
Manufacturing Decline – cont’d
“This is not good”
--Dan Greenhaus, Chief Economic Strategist at BTIG Brokerage
4

5
Our Current Dilemma
Technically, we have been out of recession since June 2009,but most people don’t believe it and many are worse off today than 3 years ago
6

So, why do we feel so badly?
Unemployment is still much higher than usual for this portion of the recovery in the business cycle
The political scene has led to gridlock in government Workers’ share of income has fallen to historic lows Uncertainty in global markets (Europe & China) is
causing some investors to postpone decisions Demand and Supply in the housing sector have not
found a stable equilibrium in many locations
7

Analysis of Recession
What is different about this cycle? Although recession technically ended three years
ago, we didn’t bounce back in terms of:
Rapid increase in GDP Large decline in unemployment Increase in personal income and spending
Why not?
8
A potential issue may be: The Decline of the Middle Class More and more attention is being paid to this topic
in the past couple years
“Workers’ wages and benefits make up 57.5 percent of the economy, an all-time low.”
“Until the mid-2000s, that figure had been remarkably stable – about 64 percent through boom and bust alike
9
Source: Paul Wiseman, Associate Press, in The Arizona Republic. July 2, 2011
Increasing Income Inequality
The Gini Index is a measure of income inequality that can range from 0 to 1. The latest Gini Coefficient in U.S. is .468 The coefficient has increased by 20% over the past
4 decades. The U.S. number is similar to the Philippines and
Mexico!
Zero indicates everyone gets the same income One indicates all the income is received by just one person
Source: As Middle Class Shrinks, P&G Aims High and Low. The Wall Street Journal, September 12, 2011.
10

Worldwide GINI Coefficients
11

Why is this a problem?
John Hobson – English economist (wrote in 1902) The poor didn’t have enough money to buy goods The rich couldn’t consume enough Countries looked to external markets (Imperialism) Multinationals then and now do the same thing Investment in foreign markets is profitable Imperialism leads to:
High unemployment in the home country Increase in social unrest Increases in inequality of income and wealth
12
The Price of InequalityJoseph Stiglitz , 2012
The numbers show that the American Dream is a myth.
There is less equality of opportunity in the U.S. today than there is in Europe, or in any advanced industrial country.
This is one of the reasons for the high and rising level of inequality today.
In the 2009-2010 recovery period, the top 1% of the income earners received 93% of the income growth.
13
Joseph E. Stiglitz, The Price of Inequality

The Price of InequalityJoseph Stiglitz , 2012
Inequality, which causes a lack of opportunity in education and potential jobs, leads to lower growth and less efficiency because increasing numbers of people are not being fully utilized (unemployed or underemployed) and the value of those resources is lost forever.
14
Joseph E. Stiglitz, The Price of Inequality
The Price of InequalityJoseph Stiglitz , 2012
At the same time the rich, who require fewer public services, are afraid that a strong government might try and redistribute wealth, so they apply pressure to the Congress or legislatures to reduce taxes or cut government spending.
This, in turn, leads to even less expenditure for education, health care, physical infrastructure, etc. and in the process further reduces the potential for growth.
15
Joseph E. Stiglitz, The Price of Inequality, & commentary by Aaron Task, host of The Daily Ticker.

The Price of InequalityJoseph Stiglitz , 2012
“Stiglitz believes inequality of wealth and opportunity are hurting the overall economy by limiting competition, promoting cronyism and keeping those at the bottom from reaching their potential.”
Stiglitz says: “Income inequality is ultimately detrimental to those at the top too…..we’ve created an economy that is not in accord with the principles of the free market.”
16
Aaron Task, host of The Daily Ticker. June 2012

The Price of InequalityJoseph Stiglitz , 2012
Stiglitz believes the U.S. could reverse this trend, and he recommends “improving education and nutrition for those at the bottom of society, and eliminating ‘corporate welfare’ and other policies which ‘create wealth’ but not economic growth.”
Brazil has done this to reduce income inequality, but (I ask) how likely is this in the U.S. today?
17
Aaron Task, host of The Daily Ticker. June 2012

Coming Apart -The State of White America
1960-2010 -- Charles Murray (2012)
American ‘civic culture’ is dying as the country evolves into a two-class society
The few ‘elites’ live in a totally different culture than the rest of society and they don’t have any clue how most people live
18
Source: Summary by Aaron Task. Daily Ticker, May 3, 2012.

Coming Apart Charles Murray - 2012
The new role for “class” in our culture wouldn’t mean so much except that it is this narrow elite who control almost everything Political system Financial system Media & information streams Access to education
Murray concludes …….We are coming apart
19

Coming Apart -The State of White America
1960-2010 -- Charles Murray (2012)
Ernest Hemingway may have said that “the difference between the rich and everyone else is that the rich have more money”
But today, it’s more than money – it is an entirely different culture and way of life……..
20
Coming Apart Charles Murray - 2012
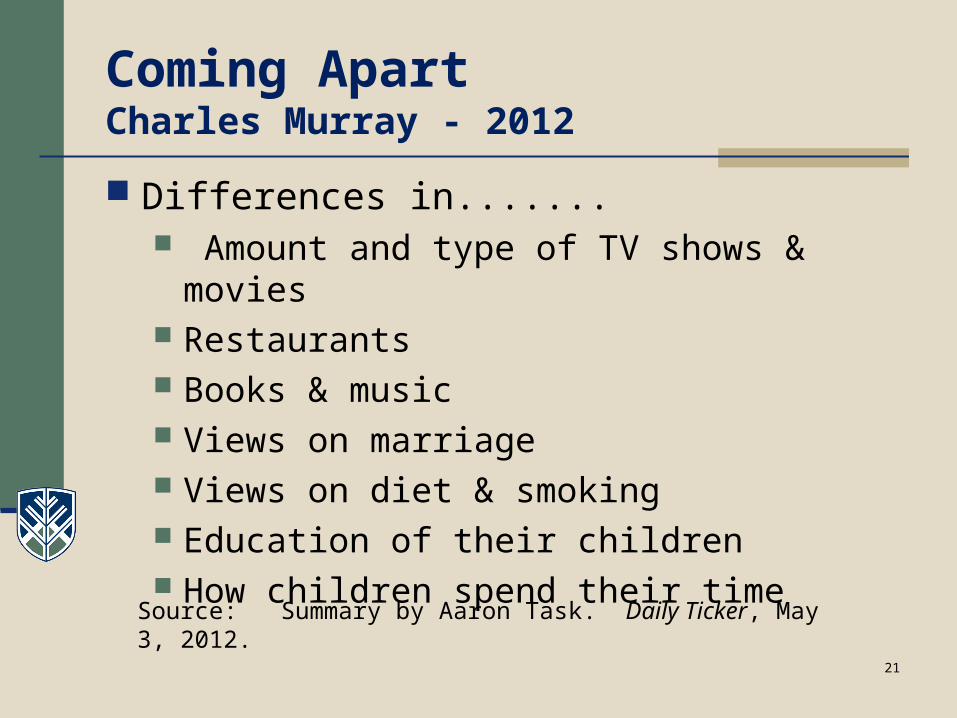
Differences in....... Amount and type of TV shows & movies Restaurants Books & music Views on marriage Views on diet & smoking Education of their children How children spend their time
21
Source: Summary by Aaron Task. Daily Ticker, May 3, 2012.
Coming Apart Charles Murray - 2012
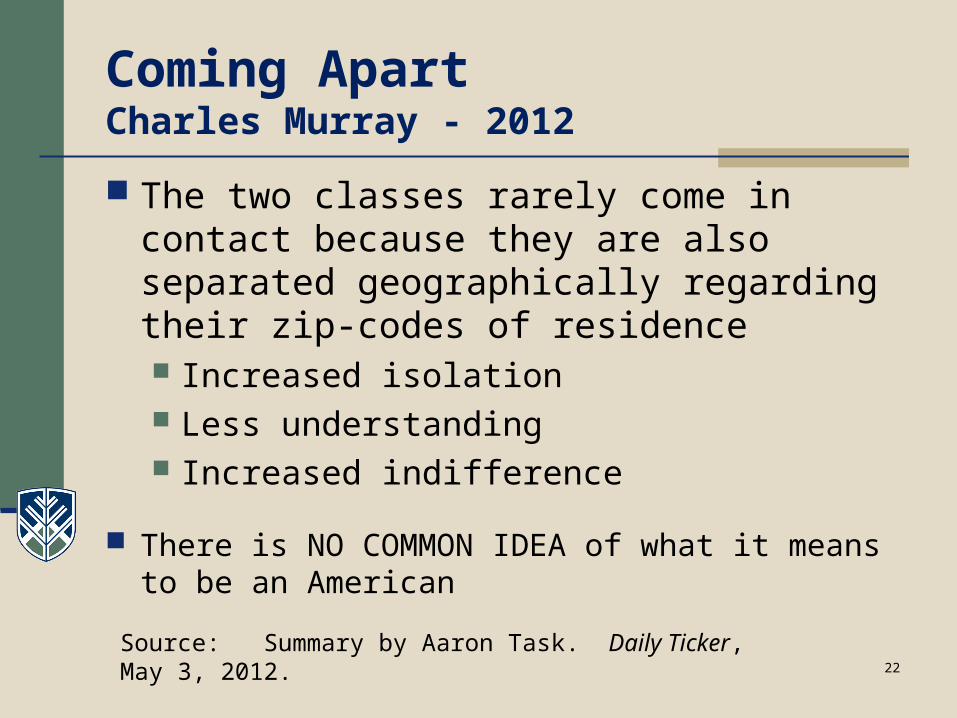
The two classes rarely come in contact because they are also separated geographically regarding their zip-codes of residence Increased isolation Less understanding Increased indifference
There is NO COMMON IDEA of what it means to be an American
22
Source: Summary by Aaron Task. Daily Ticker, May 3, 2012.

Coming Apart Charles Murray - 2012
Historically, class has not been a part of the American culture
Today, there’s “an awful lot of people very comfortable thinking they are the upper class”
They think, “why should I associate with those bozos?”
A culture of separate classes is new to America
23
Source: Summary by Aaron Task. Daily Ticker, May 3, 2012.

The Movie: Avalon (1990)
“Avalon was not just a place; it was a time.”
Could the 60 years in the Post-WWII period have been a time – a period in history that was unique
and one that won’t be repeated?
24

Is there a way out?
Maybe not! We may just be ‘pushing on a string’
The potential exists for a “lost decade” or even several “lost decades” before the economy finds a new normal.......and the old normal may never return.
25

What about today’s tools?
Traditional expansionary tools aren’t working…. Monetary Policy
Interest rates are already low “Animal Spirits” have not been kindled
Investment is low because uncertainty is high
What can be gained by lowering interest rates if businesses don’t wish to borrow?
26

What about today’s tools?(continued)
Fiscal Policy Another stimulus plan would increase demand by
increasing the level of potential spending, but it won’t happen:
Going further into debt seems risky Raising taxes to fund it is just too unpopular Printing money would be inflationary
Government could reduce taxes again but: Public services and infrastructure are already lagging Lower taxes won’t generate more spending if people pay
down debt or increase savings instead of buy more goods
27

What Needs to Occur to End the Lingering Effects of Recession? Reduce Uncertainty….
Congress has to assume much of the blame. They need to work together in order to build confidence
Housing has to return as a strong and stable sector, but without the rise in speculative pricing
Credit needs to be made available to the middle class which is currently not happening
Problems in Europe need to be resolved And, people need to believe all of this can happen
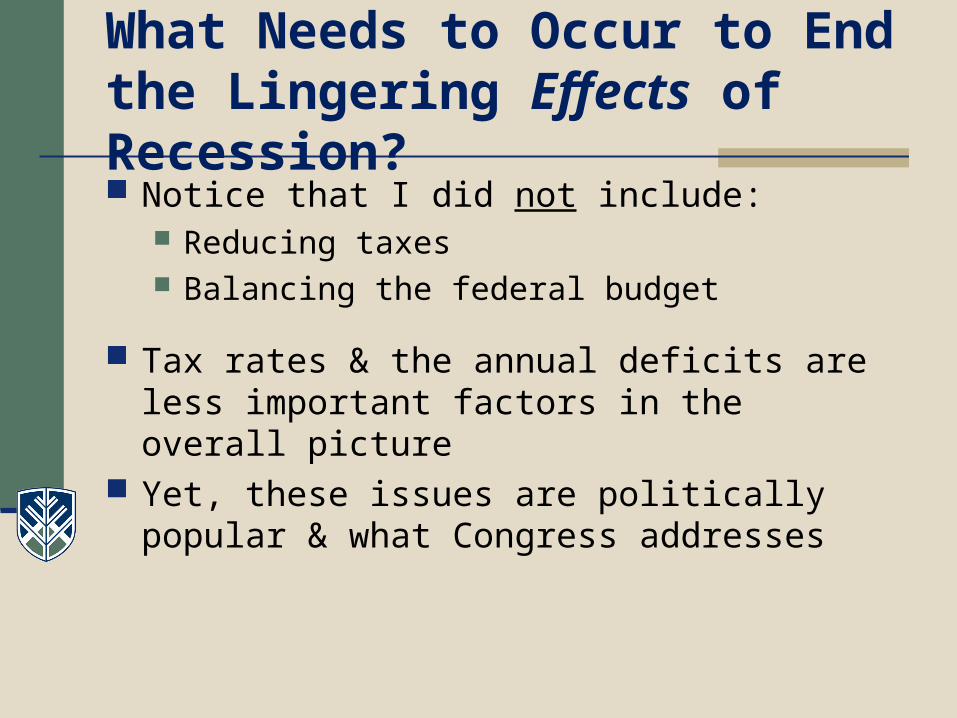
What Needs to Occur to End the Lingering Effects of Recession? Notice that I did not include:
Reducing taxes Balancing the federal budget
Tax rates & the annual deficits are less important factors in the overall picture
Yet, these issues are politically popular & what Congress addresses
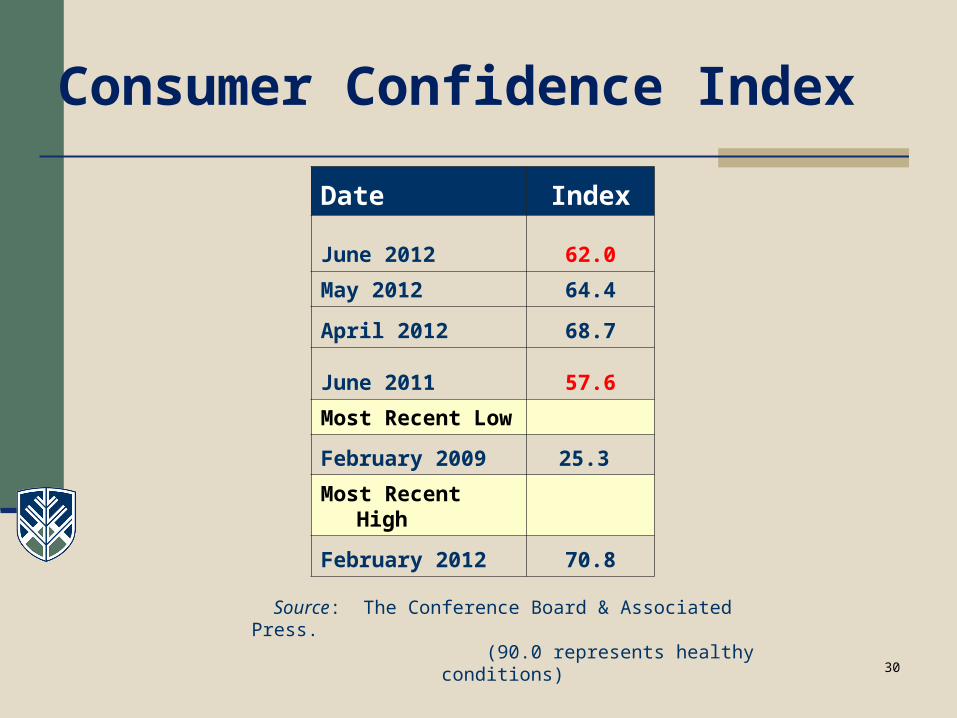
Consumer Confidence Index
Date Index
June 2012 62.0
May 2012 64.4
April 2012 68.7
June 2011 57.6
Most Recent Low
February 2009 25.3
Most Recent High
February 2012 70.8
Source: The Conference Board & Associated Press. (90.0 represents healthy conditions)
30

My Forecast for the U.S.
The U.S. will not return to a healthier state so long as there is: Anti-government sentiment that government is the
enemy & doesn’t create jobs Anti-Federal Reserve sentiment Worsening distribution of wealth & income An unwillingness to work together in Congress
A double-dip recession is possible – particularly if the ‘fiscal cliff’ coming on January 1st is not addressed
State & Local Governments
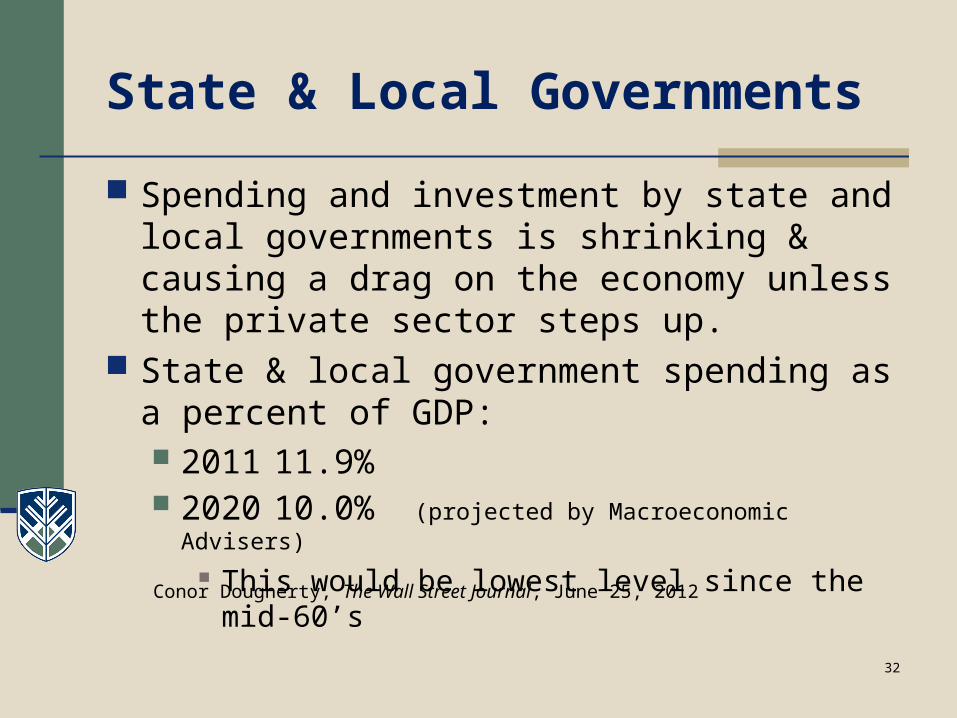
Spending and investment by state and local governments is shrinking & causing a drag on the economy unless the private sector steps up.
State & local government spending as a percent of GDP: 2011 11.9% 2020 10.0% (projected by Macroeconomic Advisers)
This would be lowest level since the mid-60’s
32
Conor Dougherty, The Wall Street Journal, June 25, 2012

State Outlook
Where is Arizona headed in view of the national situation?
33

Economic Strength Rankings Policom Corporation
Source: Economic Strength Rankings – 2012 Policom Corporation. www.policom.com 34
Policom.com – William (Bill) Fruth Metropolitan Areas: 366 areas w/50,000+ Micropolitan Areas: 576 areas w/10,000 +
In Arizona: 6 Metro areas with 7 counties 5 Micro areas with 6 counties Only Apache & La Paz are in neither group
Economic Strength Rankings Policom Corporation
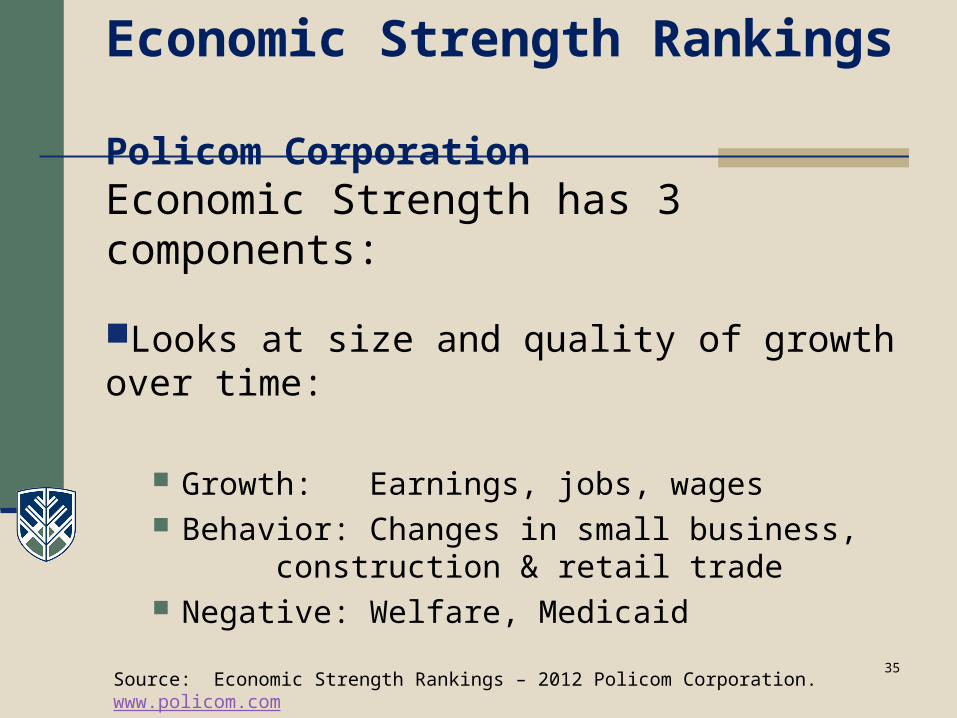
Source: Economic Strength Rankings – 2012 Policom Corporation. www.policom.com 35
Economic Strength has 3 components:
Looks at size and quality of growth over time:
Growth: Earnings, jobs, wages Behavior: Changes in small business,
construction & retail trade Negative: Welfare, Medicaid

Metropolitan Strength Rankings County or Multi-County Ranking out of 366
Source: Economic Strength Rankings – 2012 Policom Corporation. www.policom.com 36
Metropolitan Areas 2012 2010 2008 2006
Flagstaff(Coconino)
203 187 214 158
Lake Havasu-Kingman(Mohave)
330 217 176 182
Phoenix-Mesa-Glendale (Maricopa & Pinal)
36 16 6 8
Prescott(Yavapai)
333 248 215 285
Tucson(Pima)
218 158 120 87
Yuma(Yuma)
260 271 310 278

Micropolitan Strength Rankings County or Multi-County Ranking out of 576
Source: Economic Strength Rankings – 2012 Policom Corporation. www.policom.com 37
Micropolitan Areas 2012 2010 2008 2006
Nogales(Santa Cruz)
181 161 275 205
Payson(Gila)
462 378 418 432
Safford (Graham & Greenlee)
351 220 310 443
Show Low(Navajo)
338 326 317 n/a
Sierra Vista – Douglas(Cochise)
80 38 97 90

Arizona Annual Net Migration
Year Net Migration from Outside Arizona
2005 147,000
2006 139,500
2007 100,100
2008 37,400
2009 (31,800)
2010 (31,900)
2011 (1,700)
38
Arizona’s Economy, Economic and Business Research Center. Eller College of ManagementMarch 2012.

General Fund Revenues (11 mo’s)
Arizona General Fund Revenues ($ in Millions)
YTD FY 2012 Collections: $ 7,989.3 Difference From Budget Forecast $ 60.2 Difference From FY 2011 $ 602.4
Percent Difference from FY 2011 + 6.0%
39
Joint Legislative Budget Committee, Monthly Fiscal Highlights, June 2012

Individual Income Tax (11 mo’s)
Individual Income Tax ($ in Millions)
YTD FY 2012 Collections: $ 2,757.8 Difference From Budget Forecast $ 32.8 Difference From FY 2011 $ 206.7
Percent Difference from FY 2011 + 8.1%
40
Joint Legislative Budget Committee, Monthly Fiscal Highlights, June 2012

Sales Tax Collections(11 mo’s)
Arizona Sales Tax Collections ($ in Millions)
YTD FY 2012 Collections: $ 3,347.8 Percent Difference from FY 2011
Overall +5.3% Restaurant & Bars 7.7% Contracting 7.4% Retail 5.7% Utilities 1.1%
41Joint Legislative Budget Committee, Monthly Fiscal Highlights, June 2012

Average Weekly Hours Worked(Statewide)
42
Arizona Department of Administration. Current Employment Statistics, Various Issues.

Average Hourly Earnings in $$(Statewide)
43
Arizona Department of Administration. Current Employment Statistics, Various Issues

Projected 2011-2013 Job Gains by Sector (in thousands)
44
Source: Arizona Department of Administration, Employment Forecast, May 4, 2012

County Hotel Occupancy Rates 2012/2011 YTD
45
Smith Travel Research in Arizona Office of Tourism; May 2012

Projected Retail Sales for 2013 based on the month the projection was made in 2012
46Western Blue Chip Forecasts Made in 2012. ASU W.P. Carey School of Business

Projected Employment Growth for 2013 based on the month the projection was made in 2012
47Western Blue Chip Forecasts Made in 2012. ASU W.P. Carey School of Business

Projected Single Family Housing Permits for 2013 based on the month the projection was made in 2012
48Western Blue Chip Forecasts Made in 2012. ASU W.P. Carey School of Business
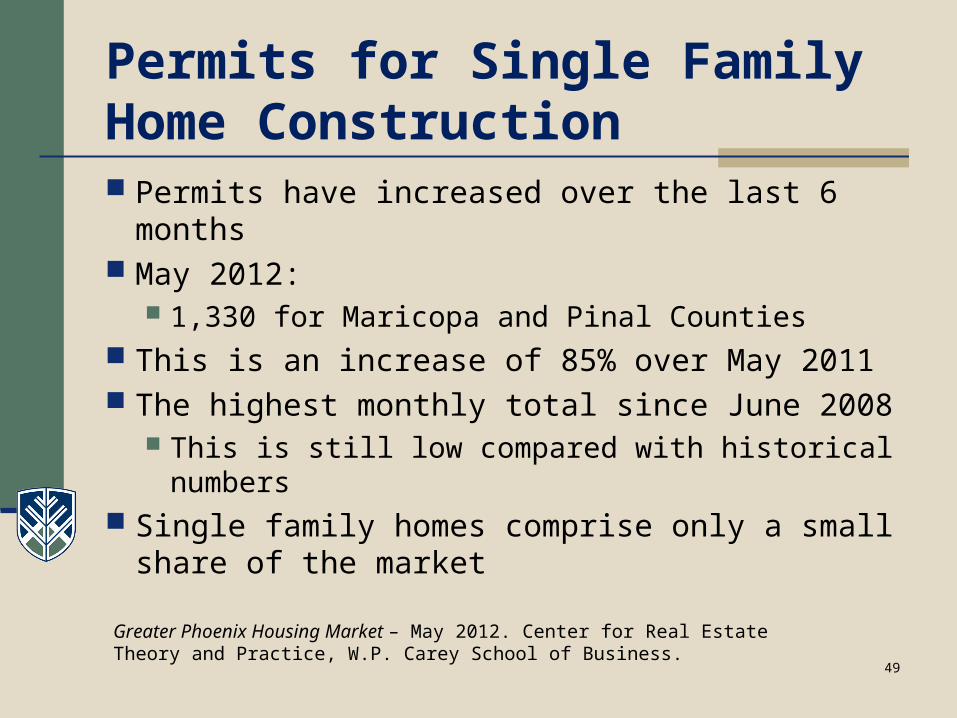
Permits for Single Family Home Construction Permits have increased over the last 6 months May 2012:
1,330 for Maricopa and Pinal Counties This is an increase of 85% over May 2011 The highest monthly total since June 2008
This is still low compared with historical numbers Single family homes comprise only a small share
of the market
49
Greater Phoenix Housing Market – May 2012. Center for Real Estate Theory and Practice, W.P. Carey School of Business.

National New Home Sales(May 2012 data reflect the annual rate that would occur)
50Source: National Association of Homebuilders - www.nahb.org

National Existing Home Sales(May 2012 data reflect the annual rate that would occur)
51
Source: National Association of Homebuilders - www.nahb.org

Projected Change in Personal Income by State
52Western Blue Chip Forecasts Made in July, 2012. ASU W.P. Carey School of Business

Projected Change in Employment by State
53Western Blue Chip Forecasts Made in July, 2012. ASU W.P. Carey School of Business

Looking Ahead
The national economy plays a significant role in the health of the state economy – and there is little chance of any pickup nationally until after the election.
At the same time, internal forces appear to have turned around in some sectors within the state which will have the impact of pulling Arizona ahead of the national average with respect to short-term growth.
54
Related Documents