A Report Prepared for the California League of Food Processors The Economic Impact of Food and Beverage Processing in California and Its Cities and Counties January 2015 Report Prepared by: Richard J. Sexton, Josué Medellín-Azuara, and Tina L. Saitone

Welcome message from author
This document is posted to help you gain knowledge. Please leave a comment to let me know what you think about it! Share it to your friends and learn new things together.
Transcript

A R e p o r t P r e p a r e d f o r t h e C a l i f o r n i a L e a g u e o f F o o d P r o c e s s o r s
The Economic Impact of Food and Beverage Processing in California and Its
Cities and Counties
January 2015
Report Prepared by:
R i c h a r d J . S e x t o n , J o s u é M e d e l l í n - A z u a r a , a n d
T i n a L . S a i t o n e

i
Richard J. Sexton is Professor and Chair of the Department of Agricultural and Resource Economics at the University of California, Davis. Josué Medellín-Azuara is a research scientist in the Civil and Environmental Engineering Department at the University of California, Davis. Tina L. Saitone is a project economist in the Department of Agricultural and Resource Economics. Brief Bios for all three researchers are included as Section 6 to this report. Funding for this study was provided by the California League of Food Processors.

ii
Executive Summary
California’s food and beverage processing sector is responsible for acquiring the bounty of agricultural produces grown on California’s farms and ranches and converting it to the food and beverage products demanded by consumers worldwide. This study represents a comprehensive evaluation of the economic impact of the food and beverage processing industries on the California economy and the economies of key counties and metropolitan areas in State.
Food and beverage processing is California’s third largest manufacturing sector, following computers and electronics and chemicals, and thus represents a key engine driving the California economy and an indispensible complement to California’s agricultural production sector. Key economic impacts for California’s food and beverage processors for 2012 are as follows:
Food and beverage processing in California accounts directly for $25.2
billion in value added and 198,000 jobs. The remainder of its impact is comprised of multiplier effects created as the economic activity generated by California’s food and beverage processors reverberates through the local and regional economies, building additional income and employment for the businesses that supply them inputs, and for commercial enterprises generally, as income earned is spent on a multitude of products and services in the local or regional economy.
We estimated these impacts using the highly regarded Impact Analysis for Planning (IMPLAN) model. On average, across all food and beverage processing sectors and statewide, we estimate that each dollar of value added in food and beverage processing generates $3.25 dollars in additional economic activity, once multiplier impacts are included. Each additional job in food and beverage processing generates 3.84 jobs in total. Food and beverage processing is also a key contributor to funding state and local governments in California. We estimate that each million dollars in output created directly or indirectly by the sector generates nearly $100,000 in additional Federal taxes and nearly $78,000 in additional state and local taxes.
Milk production is California’s largest agricultural industry and also its leading food processing industry. Dairy processing accounted directly for $3.37 billion in value added in 2012. Once the multiplier impacts are included, the total economic impact of dairy processing in California is $15.6 billion. Over 139,000 California jobs can be traced directly or indirectly to the dairy-processing sector. Wineries represent California’s second-leading food and beverage processing sector, accounting for
§ $25.2 billion in direct value-added § $56.7 billion in additional value-added
through indirect and induced impacts § $82 billion of total value added
§ 198,000 direct full- and part-time jobs § 562,000 jobs through indirect and
induced activity § 760,000 total jobs
§ $220 billion in total value output
§ $10.5 billion in Federal tax revenue § $8.2 billion in State/local tax revenue

iii
$3.65 billion in direct value added and an additional $7.4 billion in value added through multiplier impacts in 2012. California wineries were directly or indirectly responsible for just over 100,000 jobs in 2012.
Rounding out the top five California food and beverage processing industries for 2012 in terms of value-added were baking (comprised of bread and bakery product manufacturing; cookie, cracker, and pasta manufacturing; and tortilla manufacturing); fruit and vegetable canning, pickling, and drying; and soft drink and ice manufacturing. These sectors were responsible for $2.64 billion, $2.22 billion, and $1.72 billion in direct valued-added activity, respectively, in 2012. The baking sector accounted directly or indirectly for more than 89,000 jobs, the fruit and vegetable canning, pickling, and drying sector was responsible for another 73,000 jobs, and total employment due to the soft drink and ice-manufacturing sector was about 58,000 jobs.
Food and beverage processing is a key driver of county and metropolitan area economies in many parts of California, most notably its Central Valley, where the sector contributes nearly $20 billion in value added to the regional economy and
nearly 205,000 jobs. The largest relative impact of food and beverage processing is in Colusa County, where the sector is responsibly for nearly half (48%) of all jobs. Food and beverage processing is responsible for 20% or more of all jobs in Kings, Merced, and Stanislaus Counties. The comparable story can be told for many metropolitan areas in California, where food and beverage processing is directly or indirectly responsible for a third or more of total employment in cities such as Williams, Corning, and Turlock. Food and beverage processing accounts for 28% of total employment in Tulare, and, even in the large and diversified city of Fresno, food and beverage processing is responsible for 14% of total employment—nearly 27,000 jobs.
The results from this study can be valuable input into understanding the impacts of legislation, regulations, and other policies that impact the food and beverage industries in California and for assessing the benefits derived from new economic activity in the sector. Estimates of primary impacts on value added of such actions can be readily extended to capture overall impacts on employment, value added, output, and tax revenues using the multipliers reported in the study.

iv
Table of Contents
List of Figures ..................................................................................................................... v List of Tables ..................................................................................................................... vi
1 Introduction ................................................................................................................. 1 2 Methodology ................................................................................................................ 1
2.1 Multiplier Impacts .............................................................................................................. 1 2.2 Scope of Analysis ............................................................................................................... 2
3 Economic Impact of Food and Beverage Processing in California ........................ 3 3.1 Economic Impact by Select CA Counties .......................................................................... 4 3.2 Economic Impact in Selected Metropolitan Areas ............................................................ 5 3.3 Contribution of Food and Beverage Processing to Tax Revenues ..................................... 6
4 Conclusion ................................................................................................................... 7 5 Figures and Tables ...................................................................................................... 8
6 Investigator Bios ........................................................................................................ 25

v
List of Figures
Figure 1. Geographic Areas Analyzed ................................................................................ 8
Figure 2. Top 10 Food and Beverage Processing Sectors by Value Added ....................... 9
Figure 3. Top 10 Food and Beverage Processing Sectors by Employment ........................ 9
Figure 4. Top 10 Food and Beverage Processing Sectors by Sector Output .................... 10
Figure 5. Top Processing/Manufacturing Industries in California ................................... 10
Figure 6. Top 10 Food and Beverage Processing Counties by Value Added ................... 11
Figure 7. Top 10 Food and Beverage Processing Counties by Employment ................... 11
Figure 8. Fraction of Employment in Food and Beverage Processing by County .......... 12
Figure 9. Top 10 Food and Beverage Processing Counties by Sector Output .................. 13

vi
List of Tables
Table 1. Geographic Coverage of Each Impact Analysis Performed ............................... 14
Table 2. Value Added by Sector ....................................................................................... 15
Table 3. Employment by Sector ........................................................................................ 16
Table 4. Output by Sector ................................................................................................. 17
Table 5. Value Added by County and Region .................................................................. 18
Table 6. Employment by County and Region ................................................................... 19
Table 7. Output by County and Region ............................................................................ 20
Table 8. Value Added by Metropolitan Area .................................................................... 21
Table 9. Employment by Metropolitan Area .................................................................... 22
Table 10. Output by Metropolitan Area ............................................................................ 23
Table 11. County and State Tax Impacts .......................................................................... 24

1
1 Introduction
Many Californians are aware that our state is the nation’s leading producer of agricultural products. In 2012 California’s farms and ranches accounted for $42.6 billion in output. California produced 15% of the nation’s total value of crop production and 7.1% of the value of livestock and livestock products. Milk production is the State’s largest agricultural industry, with production valued at $6.90 billion in 2012, followed by grapes at $4.45 billion, and almonds at $4.35 billion. Nursery plants with $3.54 billion in value and cattle and calves at $3.30 billion rounded out the top five.1
Californians, however, are probably less familiar with the state’s vitally important food and beverage processing sector, which is responsible for acquiring the bounty produced on California’s farms and ranches and converting it to the food, beverage, and fiber products demanded by consumers worldwide. Our study quantifies the economic impact of this integral component of California’s economy. Food and beverage processing is California’s third largest manufacturing sector, following computers and electronics and chemicals, and California’s total of 3,421 food manufacturing establishments is the largest in the nation.2 We find that for 2012 California’s food 1 California Department of Food and Agriculture. 2012. “California Agricultural Production Statistics.” Available at: http://www.cdfa.ca.gov/statistics/, accessed 12/20/14. 2 United States Census Bureau. 2012. County Business Patterns, Industry Code Comparison 311, Food Manufacturing. Available at: http://www.census.gov/econ/cbp/index.html, accessed 11/15/14.
and beverage processors accounted for $82 billion of value added and 760,000 full- and part-time jobs. We estimate the total value of output generated directly or indirectly by the food and beverage processors in 2012 at $220 billion.3
2 Methodology The study seeks to isolate the economic value added by the food and beverage processing sectors in California. We derived value added as the value of the products produced by the food and beverage sector, less the cost of inputs used in producing those products. By deducting input costs, we avoid double counting the economic impact of agricultural production and are able to focus solely on the processing sector.
2.1 Multiplier Impacts
A key part of any impact study is estimating the secondary or multiplier impacts from economic activity. These impacts occur as the value added from the primary economic activity, food and beverage processing in our case, reverberates through the local and regional economies, creating additional income and employment for the businesses that supply inputs to the primary activity, and for commercial enterprises generally, as income earned is spent on a multitude of products and services in the local or regional economy.
We estimated secondary impacts derived from the primary activities of the food processing industry using regional and interregional input-output models.
3 The impacts reported in this study exclude the production of foods for animals.
2
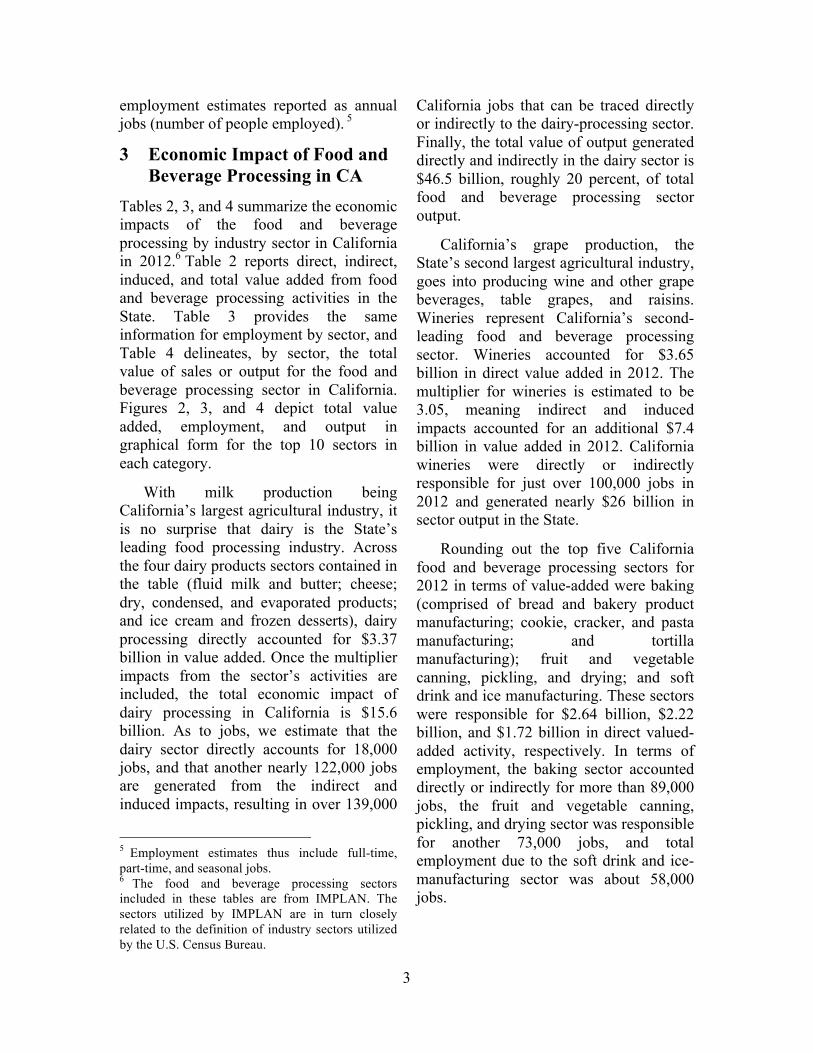
The validity of this approach is well established, with a history dating back to the Nobel Prize winning work of Leontief.4 Input-output models provide a snapshot of a state or regional economy by tracing relationships among commercial sectors, as well as government, households, and the rest of the world.
Input-output models provide measures of the multiplier or spillover effects attributable to a primary economic activity. These spillover impacts are broken down into two main categories: indirect and induced effects. Indirect effects are changes in local inter-industry spending transmitted through economic linkages among the different sectors of the economy. For example, a food processor who contracts with local businesses to provide containers and packing materials or to ship farm products to the plant and finished products to markets creates income and value added for those enterprises.
Induced effects are the result of spending household incomes generated from the sectors directly and indirectly affected by the primary economic activity. Thus businesses, such as retail shops and service providers, that may seem quite disconnected to food and beverage processing, benefit from the presence of these enterprises in the local economy through the income they generate that is then spent in their establishments.
The magnitudes of both indirect and induced impacts are determined by the degree to which income “leaks” from the local economy by being spent outside its boundary. Naturally, the larger and more economically developed the area of consideration, the smaller is the rate at 4 Leontief, W. 1941. The Structure of the American Economy, 1919-1939. Oxford University Press: Oxford, UK.
which economic activity leaks beyond its boundary. Thus, multiplier impacts will be greater when we are considering California as a whole, than when we are examining individual counties or metropolitan regions within a county.
We utilized the Impact Analysis for Planning (IMPLAN) model to estimate the multiplier impacts generated by the food and beverage processing industry in California. The IMPLAN model is one of the most widely used and respected models for regional economic analysis, and it is utilized extensively in economics, planning, and engineering studies to estimate the full economic impacts of injections or withdrawals of economic activity from regions of interest. Several Federal agencies utilize the IMPLAN model including the Army Corps of Engineers, Forest Service, and Department of Transportation. The IMPLAN model has also been utilized by key California state agencies including the Department of Water Resources and the Water Resources Control Board.
2.2 Scope of Analysis
We estimated direct, indirect, and induced impacts of the food and beverage processing sector for (i) the entire state of California, (ii) California’s Central Valley and Southern California regions, (iii) key food and beverage processing counties within the State, and (iv) selected metropolitan areas (MAs) within California. Table 1 details the regions, MAs, and counties included in the study. Figure 1 provides a map delineating the cities and MAs analyzed in this study. All measures of impact reported in this study are annual estimates for 2012 (the most recent year for which full information is available), with all impact measures reported in nominal U.S. dollars and all
3
employment estimates reported as annual jobs (number of people employed). 5
3 Economic Impact of Food and Beverage Processing in CA
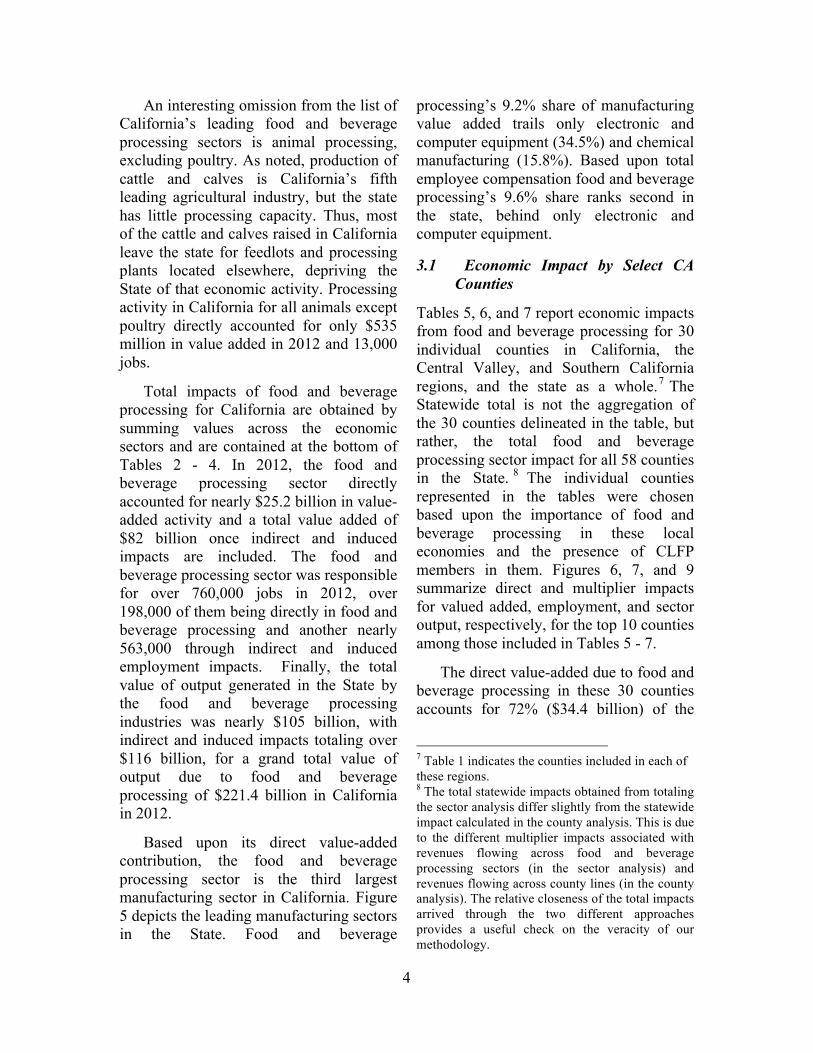
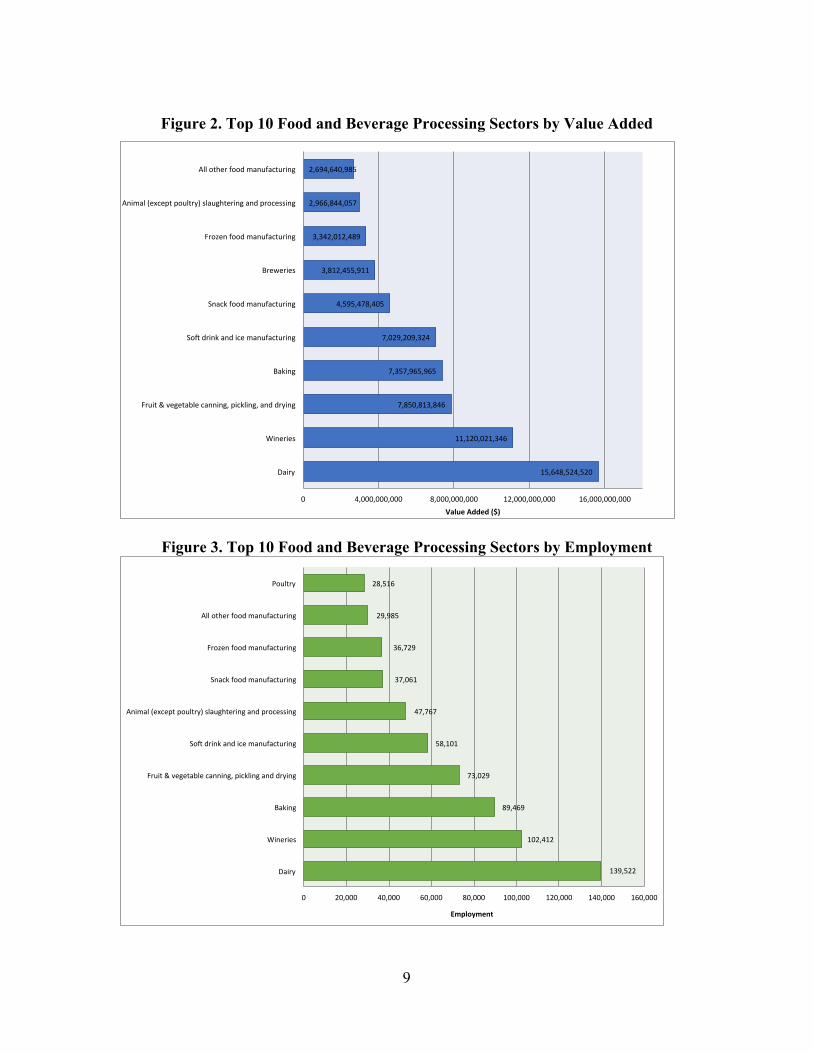
Tables 2, 3, and 4 summarize the economic impacts of the food and beverage processing by industry sector in California in 2012.6 Table 2 reports direct, indirect, induced, and total value added from food and beverage processing activities in the State. Table 3 provides the same information for employment by sector, and Table 4 delineates, by sector, the total value of sales or output for the food and beverage processing sector in California. Figures 2, 3, and 4 depict total value added, employment, and output in graphical form for the top 10 sectors in each category.
With milk production being California’s largest agricultural industry, it is no surprise that dairy is the State’s leading food processing industry. Across the four dairy products sectors contained in the table (fluid milk and butter; cheese; dry, condensed, and evaporated products; and ice cream and frozen desserts), dairy processing directly accounted for $3.37 billion in value added. Once the multiplier impacts from the sector’s activities are included, the total economic impact of dairy processing in California is $15.6 billion. As to jobs, we estimate that the dairy sector directly accounts for 18,000 jobs, and that another nearly 122,000 jobs are generated from the indirect and induced impacts, resulting in over 139,000
5 Employment estimates thus include full-time, part-time, and seasonal jobs. 6 The food and beverage processing sectors included in these tables are from IMPLAN. The sectors utilized by IMPLAN are in turn closely related to the definition of industry sectors utilized by the U.S. Census Bureau.
California jobs that can be traced directly or indirectly to the dairy-processing sector. Finally, the total value of output generated directly and indirectly in the dairy sector is $46.5 billion, roughly 20 percent, of total food and beverage processing sector output.
California’s grape production, the State’s second largest agricultural industry, goes into producing wine and other grape beverages, table grapes, and raisins. Wineries represent California’s second-leading food and beverage processing sector. Wineries accounted for $3.65 billion in direct value added in 2012. The multiplier for wineries is estimated to be 3.05, meaning indirect and induced impacts accounted for an additional $7.4 billion in value added in 2012. California wineries were directly or indirectly responsible for just over 100,000 jobs in 2012 and generated nearly $26 billion in sector output in the State.
Rounding out the top five California food and beverage processing sectors for 2012 in terms of value-added were baking (comprised of bread and bakery product manufacturing; cookie, cracker, and pasta manufacturing; and tortilla manufacturing); fruit and vegetable canning, pickling, and drying; and soft drink and ice manufacturing. These sectors were responsible for $2.64 billion, $2.22 billion, and $1.72 billion in direct valued-added activity, respectively. In terms of employment, the baking sector accounted directly or indirectly for more than 89,000 jobs, the fruit and vegetable canning, pickling, and drying sector was responsible for another 73,000 jobs, and total employment due to the soft drink and ice-manufacturing sector was about 58,000 jobs.
4
An interesting omission from the list of California’s leading food and beverage processing sectors is animal processing, excluding poultry. As noted, production of cattle and calves is California’s fifth leading agricultural industry, but the state has little processing capacity. Thus, most of the cattle and calves raised in California leave the state for feedlots and processing plants located elsewhere, depriving the State of that economic activity. Processing activity in California for all animals except poultry directly accounted for only $535 million in value added in 2012 and 13,000 jobs.
Total impacts of food and beverage processing for California are obtained by summing values across the economic sectors and are contained at the bottom of Tables 2 - 4. In 2012, the food and beverage processing sector directly accounted for nearly $25.2 billion in value-added activity and a total value added of $82 billion once indirect and induced impacts are included. The food and beverage processing sector was responsible for over 760,000 jobs in 2012, over 198,000 of them being directly in food and beverage processing and another nearly 563,000 through indirect and induced employment impacts. Finally, the total value of output generated in the State by the food and beverage processing industries was nearly $105 billion, with indirect and induced impacts totaling over $116 billion, for a grand total value of output due to food and beverage processing of $221.4 billion in California in 2012.
Based upon its direct value-added contribution, the food and beverage processing sector is the third largest manufacturing sector in California. Figure 5 depicts the leading manufacturing sectors in the State. Food and beverage
processing’s 9.2% share of manufacturing value added trails only electronic and computer equipment (34.5%) and chemical manufacturing (15.8%). Based upon total employee compensation food and beverage processing’s 9.6% share ranks second in the state, behind only electronic and computer equipment.
3.1 Economic Impact by Select CA Counties
Tables 5, 6, and 7 report economic impacts from food and beverage processing for 30 individual counties in California, the Central Valley, and Southern California regions, and the state as a whole.7 The Statewide total is not the aggregation of the 30 counties delineated in the table, but rather, the total food and beverage processing sector impact for all 58 counties in the State. 8 The individual counties represented in the tables were chosen based upon the importance of food and beverage processing in these local economies and the presence of CLFP members in them. Figures 6, 7, and 9 summarize direct and multiplier impacts for valued added, employment, and sector output, respectively, for the top 10 counties among those included in Tables 5 - 7.
The direct value-added due to food and beverage processing in these 30 counties accounts for 72% ($34.4 billion) of the
7 Table 1 indicates the counties included in each of these regions. 8 The total statewide impacts obtained from totaling the sector analysis differ slightly from the statewide impact calculated in the county analysis. This is due to the different multiplier impacts associated with revenues flowing across food and beverage processing sectors (in the sector analysis) and revenues flowing across county lines (in the county analysis). The relative closeness of the total impacts arrived through the two different approaches provides a useful check on the veracity of our methodology.

5
Statewide total, with Los Angeles County individually accounting for 24% of the State’s direct value added. These 30 counties are responsible for 86% of direct food and beverage processing sector jobs in the State.9
Among the 30 counties included in Tables 5 - 7, Stanislaus County is second in terms of total value-added activity, employment, and sector output. Stanislaus accounted for nearly $1.3 billion in direct value-added economic activity in 2012. Its multiplier was estimated to be 1.87, meaning indirect and induced impacts accounted for another more than $1 billion in value added output. Food and beverage processing in Stanislaus County was responsible for nearly 25,000 total jobs in 2012 and generated more than $8.6 billion in sector output.
Rounding out the top five food and beverage processing counties included in the study in terms of direct value-added economic activity are Orange ($1.13 billion), Sonoma ($1.05 billion), and Fresno ($967 million). Food and beverage processing in Fresno County was directly and indirectly responsible for over 24,500 jobs; the comparable number for Sonoma County is 21,700 jobs. Alameda County, responsible for about 20,700 jobs, replaces Orange County in the top five based on the employment metric.
Column 6 in Table 6 contains the total number of jobs in each county as reported by the U.S. Census Bureau in its County Business Patterns publication. Column 7 reports the percentage of jobs due directly
9 Because most of the counties included in our analysis are relatively rural, their multiplier impacts are less than those for more urban counties. Thus, the share of total impacts, including indirect and induced effects, for this group of counties is somewhat lower.
or indirectly to the food and beverage processing sector. Here we see vividly the importance of food and beverage processing to the economies of many California counties, particularly those that are most rural and which were hit hardest by the prolonged economic downturn and have also been impacted most by California’s drought.
The largest relative impact of food and beverage processing is in Colusa County, where the sector is responsibly for nearly half (48%) of all jobs in the County. Food and beverage processing is responsible for 20% or more of all jobs in Kings, Merced, and Stanislaus Counties. Figure 8 provides a color-coded map based upon the percentage of total employment in the county that is directly or indirectly due to the food and beverage processing sector. The greatest impacts on a percentage basis are in rural counties and counties in the Central Valley. The importance of food and beverage processing to the Central Valley is also affirmed in the regional aggregation of impacts provided in Tables 6, 7, and 9. The processing sector contributes nearly $20 billion in value added to the Central Valley economy and nearly 205,000 jobs. The impacts of food and beverage processing on the Southern California economy are rather comparable—nearly $28 billion in total value added and 267,000 jobs.
3.2 Economic Impact in Selected Metropolitan Areas
We also analyzed the impact of food and beverage processing in 20 metropolitan areas. IMPLAN does not provide models of city economies. However, some information is provided at the zip-code level of aggregation. Thus, we defined the metropolitan area (MA) for each city included in the study as the geographic

6
area encompassed by zip codes either wholly or partially included within a city’s legal boundary. This approach has the advantage of enabling us to capture impacts of many food and beverage processing facilities that may be located just outside a city’s boundary, but that, nonetheless, contribute importantly to the city’s economy.10
Tables 8, 9, and 10 contain results of the MA analysis for value added, employment, and total output, respectively. Comparisons across the MAs included in the study makes little sense because the analysis was done for relatively large cities, such as Fresno (pop. 494, 465), and much smaller cities and towns, such as Corning (pop. 7,663) and Huron (pop. 6,754).
A more helpful comparison is employment generated directly or indirectly by the food and beverage processing sector relative to total employment in the MA. Column 6 in Table 9 contains 2012 annual average employment for each MA as reported by the California Employment Development Department, and column 7 provides the percentage of employment due to food and beverage processing. 11 From this comparison, we see the importance of the food and beverage processing sector to
10 We caution that this analysis at the MA level is less precise than the analysis done for the entire State and for the counties due to the less detail being provided by IMPLAN at the zip-code level. In addition food and beverage processing activities that are near a city’s boundary but are located in zip codes not included within the boundary will be excluded, even though they may represent a major source of jobs and income for residents of the city. 11 Note that the employment numbers reported by the California Employment Development Department pertain to the city per se based upon its official boundary, whereas the employment numbers for food and beverage processing follow the zip code definition noted in the text.
many California communities. The sector is directly or indirectly responsible for a third or more of total employment in Williams, Corning, and Turlock. Food and beverage processing accounts for 28% of total employment in Tulare, and, even in the large and rather diversified city of Fresno, food and beverage processing is responsible for 14% of total employment—nearly 27,000 jobs.
3.3 Contribution of Food and Beverage Processing to Tax Revenues
California’s food and beverage processing sector is also an important contributor to tax revenues at all levels of government. Table 11 provides estimates of tax revenues generated by food and beverage processors in each of the 30 counties included in the study and for the entire state.12 The results are presented as total tax revenues generated per million dollars of direct output in the food and beverage processing sector. The tax revenues in the table account for the taxes generated from direct, indirect, and induced impacts. 13 This presentation is convenient for policy analysis because any policies that will impact sales in the food and beverage processing sector, either positively or negatively, can be readily converted into impacts on tax revenues.14
12 We are unable to estimate tax revenues from food and beverage processing at the metropolitan area level of aggregation. 13 Federal taxes include social insurance taxes, corporate profits tax, personal income tax, and excise taxes and duties. State and local taxes include personal income taxes, corporate profits tax, motor vehicle taxes, revenue from licenses and fees, property taxes, sales and excise taxes, and social insurance taxes. 14 In this regard the tax impacts contained in Table 11 are conservative because they represent averages. Marginal impacts are certain to be larger due to the progressive nature of both the Federal and State income taxes.

7
We see that Statewide each million dollars in output by the sector generates nearly $100,000 in additional Federal taxes and nearly $78,000 in additional state and local taxes. Applying these numbers to the value of output contained in table 7, column 2, we see that Statewide the sector is responsible, directly or indirectly, for $10.5 in Federal tax revenues and 8.2 billion in State and local tax revenues.
Results vary for the individual counties based upon a number of factors, including types of food and beverage processors located in the county, structure of taxation at the local level, and income distribution within the population base. The greatest impact on Federal tax revenues per million dollars in output is in Sonoma County, with nearly $136,000 in tax revenues generated. The greatest impacts on State and local tax revenues occur in San Luis Obispo and Santa Barbara Counties, where a million dollars in output generates nearly $100,000 in State and local tax revenues.
4 Conclusion This study represents a comprehensive evaluation of the economic impact of the food and beverage processing industries on the California economy and the economies of key counties and metropolitan areas in California. The study demonstrates the value of the food and beverage processing sector as a key engine of the California economy and as an indispensible complement to California’s agricultural production sector. In 2012 California’s food and beverage processors contributed directly or indirectly, through multiplier
impacts, $82 billion of value added and 760,000 jobs to the California economy. Food and beverage processing is a key driver of many county and metropolitan-area economies, in several instances accounting for a quarter of more of total employment in these jurisdictions.
This study can be a valuable asset for evaluating the impacts of legislation, regulations, and other policies that impact the food and beverage industries in California and for assessing the benefits derived from new economic activity in the sector. Estimates of primary impacts on value added of such actions can be readily extended to capture overall impacts on employment, value added, and output using the multipliers reported here.
At the time of this writing, December 2014, the study is as up-to-date as possible, given the unavoidable lags in reporting data. If food and beverage production and demand growth trends continue, as we expect they will, the impacts of the sector on value added, output, and employment reported here will soon understate the sector’s true impacts. However, the multiplier values included in this report reflect the underlying fundamentals of the state and local economies analyzed in the study and should be relatively stable over time. Thus, it will be possible for future analysts to update this work by applying the multipliers to current information on the value of production in the different jurisdictions and industrial sectors included in this study.

8
5 Figures and Tables
Figure 1. Geographic Areas Analyzed
9
Figure 2. Top 10 Food and Beverage Processing Sectors by Value Added
Figure 3. Top 10 Food and Beverage Processing Sectors by Employment
15,648,524,520)
11,120,021,346)
7,850,813,846)
7,357,965,965)
7,029,209,324)
4,595,478,405)
3,812,455,911)
3,342,012,489)
2,966,844,057)
2,694,640,985)
0) 4,000,000,000) 8,000,000,000) 12,000,000,000) 16,000,000,000)
Dairy)
Wineries)
Fruit)&)vegetable)canning,)pickling,)and)drying)
Baking)
SoE)drink)and)ice)manufacturing)
Snack)food)manufacturing)
Breweries)
Frozen)food)manufacturing)
Animal)(except)poultry))slaughtering)and)processing)
All)other)food)manufacturing)
Value&Added&($)&
139,522'
102,412'
89,469'
73,029'
58,101'
47,767'
37,061'
36,729'
29,985'
28,516'
0' 20,000' 40,000' 60,000' 80,000' 100,000' 120,000' 140,000' 160,000'
Dairy'
Wineries'
Baking'
Fruit'&'vegetable'canning,'pickling'and'drying'
SoE'drink'and'ice'manufacturing'
Animal'(except'poultry)'slaughtering'and'processing'
Snack'food'manufacturing'
Frozen'food'manufacturing'
All'other'food'manufacturing'
Poultry'
Employment*

10
Figure 4. Top 10 Food and Beverage Processing Sectors by Sector Output
Figure 5. Top Processing/Manufacturing Industries in California
46,503,584,192+
25,799,375,969+
20,783,731,849+
20,651,574,685+
17,446,029,935+
11,680,495,262+
10,724,762,974+
8,854,899,171+
8,149,715,205+
7,828,231,936+
0+ 10,000,000,000+ 20,000,000,000+ 30,000,000,000+ 40,000,000,000+ 50,000,000,000+
Dairy+
Wineries+
Fruit+&+vegetable+canning,+pickling+and+drying+
SoD+drink+and+ice+manufacturing+
Baking+
Snack+food+manufacturing+
Animal+(except+poultry)+slaughtering+and+processing+
Frozen+food+manufacturing+
Poultry+processing+
Breweries+
Sector'Ouput'($)'
Computer)&)Electronics)34%)
Chemical)Manufacturing)16%)
Food,)Beverage,)and)Tobacco)
9%)
TransportaCon)Equipment)
7%)
Fabricated)Metal)ProducCon)
6%)
Miscellaneous)Mfg.)5%)
Petroleum)&)Coal)ProducCon)5%)
Machinery)Mfg.)5%)
All)Other)13%)

11
Figure 6. Top 10 Food and Beverage Processing Counties by Value Added
Figure 7. Top 10 Food and Beverage Processing Counties by Employment
!11,586,920,826!!
!2,355,482,937!!
!2,104,684,574!!
!2,017,475,707!!
!1,980,746,068!!
!1,906,379,207!!
!1,343,416,333!!
!1,328,661,558!!
!1,098,735,382!!
!1,098,319,397!!
!-!!!! !2,000,000,000!! !4,000,000,000!! !6,000,000,000!! !8,000,000,000!! !10,000,000,000!! !12,000,000,000!! !14,000,000,000!!
Los!Angeles!
Stanislaus!
Sonoma!
Alameda!
Orange!
Fresno!
San!Joaquin!!
San!Diego!
Sacramento!
San!Bernardino!
Value&Added&($)&
!103,340!!
!24,922!!
!24,577!!
!21,756!!
!20,696!!
!17,543!!
!14,870!!
!13,633!!
!12,389!!
!12,034!!
!-!!!! !20,000!! !40,000!! !60,000!! !80,000!! !100,000!! !120,000!!
Los!Angeles!
Stanislaus!
Fresno!
Sonoma!
Alameda!
Orange!
San!Joaquin!
San!Diego!
San!Bernardino!
Tulare!
Employment*

12
Figure 8. Fraction of Employment in Food and Beverage Processing by County

13
Figure 9. Top 10 Food and Beverage Processing Counties by Sector Output
!33,617,811,580!!
!8,645,117,852!!
!7,801,956,188!!
!6,536,827,999!!
!6,198,487,809!!
!6,099,855,412!!
!5,840,750,918!!
!5,049,671,374!!
!4,958,682,189!!
!4,053,676,036!!
!-!!!! !5,000,000,000!! !10,000,000,000!!!15,000,000,000!!!20,000,000,000!!!25,000,000,000!!!30,000,000,000!!!35,000,000,000!!!40,000,000,000!!
Los!Angeles!
Stanislaus!
Fresno!
Alameda!
Sonoma!
San!Bernardino!
Orange!
Tulare!
San!Joaquin!
Kings!
Sector'Output'($)'

14
Table 1. Geographic Coverage of Each Impact Analysis Performed
Analysis for: Geographic Coverage Method
Statewide 58 California Counties Aggregation of all counties
Counties (30) Alameda, Butte, Colusa, Fresno, Glenn, Imperial, Kern, Kings, Los Angeles, Madera, Merced, Monterey, Orange, Riverside, Sacramento, San Benito, San Bernardino, San Diego, San Joaquin , San Luis Obispo, Santa Barbara, Santa Cruz, Solano, Sonoma, Stanislaus, Sutter, Tulare, Ventura, Yolo, and Yuba
Individual counties
Regions (2) Central Valley: Butte, Colusa, Fresno, Glenn, Kern, Kings, Madera, Merced, Sacramento, San Benito, San Joaquin, Stanislaus, Sutter, Tulare, Yolo, and Yuba
Southern California: Imperial, Los Angeles, Orange, Riverside, San Bernardino, San Diego, Santa Barbara, and Ventura
Aggregation of specific counties
Metropolitan Areas (MAs) (20)
Bakersfield, City of Industry, Corning, Fresno, Huron, Lodi, Los Banos, Merced, Modesto, Oakdale, Oroville, Oxnard, Stockton, Tulare, Turlock, Ventura, Watsonville, Williams, Woodland, and Yuba City
A MA is comprised of all zip codes wholly or partially included in the city boundary

Sector Direct Indirect Induced Total MultiplierFlour milling and malt manufacturing 297,430 790,768 338,535 1,426,734 4.80Wet corn milling 58,968 169,337 71,345 299,650 5.08Soybean and other oilseed processing 58,121 166,822 81,246 306,189 5.27Fats and oils refining and blending 334,200 707,620 250,526 1,292,347 3.87Breakfast cereal manufacturing 200,621 118,198 72,900 391,719 1.95Sugar cane mills and refining 111,925 268,198 136,286 516,408 4.61Beet sugar manufacturing 15,264 34,938 17,218 67,420 4.42Chocolate and confectionery manufacturing from cacao beans 160,162 323,458 163,604 647,223 4.04Confectionery manufacturing from purchased chocolate 284,590 272,714 164,177 721,481 2.54Nonchocolate confectionery manufacturing 176,333 256,766 138,859 571,959 3.24Frozen food manufacturing 972,450 1,460,846 908,717 3,342,012 3.44Fruit and vegetable canning, pickling, and drying 2,220,905 3,726,972 1,902,937 7,850,814 3.53Fluid milk and butter manufacturing 2,312,040 4,935,992 1,833,058 9,081,090 3.93Cheese manufacturing 648,127 3,124,760 1,116,586 4,889,473 7.54Dry, condensed, and evaporated dairy product manufacturing 148,346 447,044 178,915 774,305 5.22Ice cream and frozen dessert manufacturing 257,093 418,428 228,136 903,656 3.51Animal (except poultry) slaughtering, rendering, and processing 535,129 1,589,124 842,591 2,966,844 5.54Poultry processing 717,824 1,267,400 676,910 2,662,135 3.71Seafood product preparation and packaging 68,791 121,188 73,163 263,143 3.83Bread and bakery product manufacturing 1,673,560 1,645,785 1,274,654 4,594,000 2.75Cookie, cracker, and pasta manufacturing 455,112 679,739 359,042 1,493,893 3.28Tortilla manufacturing 511,661 431,368 327,044 1,270,073 2.48Snack food manufacturing 1,701,458 1,916,252 977,768 4,595,478 2.70Coffee and tea manufacturing 271,383 672,465 322,333 1,266,180 4.67Flavoring syrup and concentrate manufacturing 1,415,387 598,554 228,639 2,242,581 1.58Seasoning and dressing manufacturing 442,154 921,740 475,253 1,839,147 4.16All other food manufacturing 778,410 1,216,618 699,613 2,694,641 3.46Soft drink and ice manufacturing 1,720,053 3,570,442 1,738,715 7,029,209 4.09Breweries 2,123,427 1,108,675 580,353 3,812,456 1.80Wineries 3,648,947 4,446,960 3,024,114 11,120,021 3.05Distilleries 912,396 81,042 43,453 1,036,892 1.14Total 25,232,267 37,490,214 19,246,691 81,969,173 3.25
Table 2. Food & Beverage Processing Value Added by Sector (thousands of dollars)
15

Sector Direct Indirect Induced Total MultiplierFlour milling and malt manufacturing 2,008 8,302 3,849 14,159 7.05Wet corn milling 254 1,853 811 2,918 11.50Soybean and other oilseed processing 572 1,616 924 3,112 5.44Fats and oils refining and blending 710 5,958 2,848 9,517 13.40Breakfast cereal manufacturing 631 1,105 829 2,564 4.07Sugar cane mills and refining 808 3,191 1,550 5,548 6.87Beet sugar manufacturing 151 508 196 855 5.67Chocolate and confectionery manufacturing from cacao beans 1,101 2,944 1,861 5,905 5.36Confectionery manufacturing from purchased chocolate 2,395 2,370 1,866 6,632 2.77Nonchocolate confectionery manufacturing 1,839 2,213 1,579 5,630 3.06Frozen food manufacturing 12,324 14,071 10,334 36,729 2.98Fruit and vegetable canning, pickling, and drying 19,702 31,685 21,641 73,029 3.71Fluid milk and butter manufacturing 8,072 45,864 20,850 74,785 9.27Cheese manufacturing 6,183 29,928 12,700 48,811 7.89Dry, condensed, and evaporated dairy product manufacturing 1,036 4,058 2,035 7,128 6.88Ice cream and frozen dessert manufacturing 2,605 3,599 2,594 8,797 3.38Animal (except poultry) slaughtering, rendering, and processing 13,079 25,107 9,582 47,767 3.65Poultry processing 8,976 11,841 7,699 28,516 3.18Seafood product preparation and packaging 1,237 1,277 832 3,346 2.71Bread and bakery product manufacturing 28,635 16,622 14,489 59,746 2.09Cookie, cracker, and pasta manufacturing 5,032 6,059 4,082 15,173 3.02Tortilla manufacturing 6,689 4,144 3,717 14,550 2.18Snack food manufacturing 8,518 17,422 11,121 37,061 4.35Coffee and tea manufacturing 1,800 6,145 3,669 11,614 6.45Flavoring syrup and concentrate manufacturing 1,154 4,423 2,601 8,178 7.09Seasoning and dressing manufacturing 4,165 7,896 5,404 17,465 4.19All other food manufacturing 10,468 11,559 7,957 29,985 2.86Soft drink and ice manufacturing 13,557 24,766 19,778 58,101 4.29Breweries 3,827 8,882 6,601 19,310 5.05Wineries 30,441 37,576 34,396 102,412 3.36Distilleries 358 637 494 1,488 4.16Total 198,326 343,619 218,888 760,833 3.84
Table 3. Food & Beverage Processing Employment by Sector (number of full- and part-time jobs)
16

Sector Direct Indirect Induced Total MultiplierFlour milling and malt manufacturing 2,575,887 1,447,061 552,034 4,574,982 1.78Wet corn milling 594,906 319,688 116,341 1,030,935 1.73Soybean and other oilseed processing 1,151,090 342,611 132,486 1,626,187 1.41Fats and oils refining and blending 3,133,327 2,329,581 408,520 5,871,428 1.87Breakfast cereal manufacturing 495,323 258,442 118,872 872,638 1.76Sugar cane mills and refining 819,790 623,627 222,235 1,665,652 2.03Beet sugar manufacturing 105,668 68,971 28,077 202,717 1.92Chocolate and confectionery manufacturing from cacao beans 932,762 730,932 266,785 1,930,479 2.07Confectionery manufacturing from purchased chocolate 877,914 607,144 267,710 1,752,769 2.00Nonchocolate confectionery manufacturing 757,201 546,006 226,427 1,529,635 2.02Frozen food manufacturing 4,114,893 3,258,188 1,481,818 8,854,899 2.15Fruit and vegetable canning, pickling, and drying 9,730,820 7,949,838 3,103,074 20,783,732 2.14Fluid milk and butter manufacturing 10,380,922 11,890,428 2,989,154 25,260,505 2.43Cheese manufacturing 6,036,492 8,662,836 1,820,808 16,520,137 2.74Dry, condensed, and evaporated dairy product manufacturing 961,623 1,105,973 291,752 2,359,348 2.45Ice cream and frozen dessert manufacturing 1,012,279 979,309 372,006 2,363,594 2.33Animal (except poultry) slaughtering, rendering, and processing 4,244,186 5,106,589 1,373,988 10,724,763 2.53Poultry processing 3,830,357 3,215,534 1,103,824 8,149,715 2.13Seafood product preparation and packaging 439,764 208,062 119,304 767,130 1.74Bread and bakery product manufacturing 5,000,682 3,297,094 2,078,473 10,376,249 2.07Cookie, cracker, and pasta manufacturing 2,002,897 1,550,179 585,466 4,138,542 2.07Tortilla manufacturing 1,490,277 907,680 533,282 2,931,239 1.97Snack food manufacturing 5,926,102 4,159,956 1,594,438 11,680,495 1.97Coffee and tea manufacturing 1,501,674 1,214,148 525,657 3,241,479 2.16Flavoring syrup and concentrate manufacturing 2,887,081 1,240,734 372,842 4,500,656 1.56Seasoning and dressing manufacturing 2,449,512 2,088,578 774,974 5,313,063 2.17All other food manufacturing 3,258,407 2,400,601 1,140,852 6,799,860 2.09Soft drink and ice manufacturing 10,359,595 7,456,667 2,835,313 20,651,575 1.99Breweries 4,532,918 2,348,941 946,373 7,828,232 1.73Wineries 12,201,193 8,666,803 4,931,380 25,799,376 2.11Distilleries 1,107,479 139,679 70,858 1,318,016 1.19Total 104,913,022 85,121,881 31,385,124 221,420,027 2.11
Table 4. Food & Beverage Processing Output by Sector (thousands of dollars)
17

County Direct Indirect Induced Total MultiplierAlameda 877,097 700,900 439,479 2,017,476 2.30Butte* 188,632 130,934 61,888 381,454 2.02Colusa* 67,035 63,700 15,395 146,130 2.18Fresno* 967,685 536,945 401,749 1,906,379 1.97Glenn* 13,071 14,394 3,209 30,675 2.35Imperial~ 82,817 56,052 22,424 161,293 1.95Kern* 483,405 242,100 140,648 866,153 1.79Kings* 347,577 251,439 90,796 689,812 1.98Los Angeles~ 6,085,688 3,313,278 2,187,955 11,586,921 1.90Madera* 48,460 13,523 9,401 71,384 1.47Merced* 403,797 214,762 111,888 730,447 1.81Monterey 290,951 121,159 90,233 502,343 1.73Orange County~ 1,125,840 504,086 350,820 1,980,746 1.76Riverside~ 354,527 131,205 101,590 587,322 1.66Sacramento* 592,753 321,597 184,386 1,098,735 1.85San Benito* 67,995 14,222 9,134 91,351 1.34San Bernardino~ 693,931 220,551 183,838 1,098,319 1.58San Diego~ 619,630 436,790 272,242 1,328,662 2.14San Joaquin* 682,654 402,501 258,261 1,343,416 1.97San Luis Obispo 202,673 98,897 62,510 364,080 1.80Santa Barbara~ 237,736 88,242 67,603 393,582 1.66Santa Cruz 116,566 84,512 44,336 245,415 2.11Solano 266,296 105,301 70,435 442,032 1.66Sonoma 1,048,163 648,488 408,033 2,104,685 2.01Stanislaus* 1,259,509 622,451 473,523 2,355,483 1.87Sutter* 71,316 51,359 27,840 150,516 2.11Tulare* 528,591 354,948 138,656 1,022,194 1.93Ventura~ 161,235 69,185 55,441 285,861 1.77Yolo* 173,228 176,598 62,925 412,751 2.38Yuba* 4,663 2,964 1,055 8,682 1.86
Central Valley (*) 7,746,123 8,495,301 3,483,906 19,725,330 2.55Southern California (~) 10,387,169 11,687,242 6,749,446 28,823,856 2.77
Statewide 25,232,267 35,789,514 18,927,011 79,948,792 3.17
Table 5. Food & Beverage Processing Value Added by County and Region (thousands of dollars)
18

County Direct Indirect Induced Total Total Employmenta % F&B MultiplierAlameda 9,971 5,992 4,733 20,696 587,140 4% 2.08Butte* 1,345 2,016 839 4,201 53,701 8% 3.12Colusa* 850 839 188 1,878 3,906 48% 2.21Fresno* 13,798 5,907 4,873 24,577 234,997 10% 1.78Glenn* 193 196 39 427 4,571 9% 2.22Imperial~ 1,847 666 305 2,818 30,146 9% 1.53Kern* 5,926 2,615 1,730 10,271 189,978 5% 1.73Kings* 4,051 2,479 1,127 7,657 23,303 33% 1.89Los Angeles~ 46,587 30,678 26,075 103,340 3,661,816 3% 2.22Madera* 611 170 111 892 24,789 4% 1.46Merced* 5,241 2,428 1,385 9,054 40,720 22% 1.73Monterey 3,214 1,308 1,047 5,569 99,143 6% 1.73Orange County~ 8,904 4,582 4,058 17,543 1,349,188 1% 1.97Riverside~ 3,288 1,620 1,289 6,197 477,065 1% 1.88Sacramento* 4,491 3,501 2,227 10,219 406,240 3% 2.28San Benito* 887 202 108 1,197 9,476 13% 1.35San Bernardino~ 7,015 3,030 2,344 12,389 520,686 2% 1.77San Diego~ 6,418 4,072 3,143 13,633 1,157,453 1% 2.12San Joaquin* 7,329 4,438 3,104 14,870 162,644 9% 2.03San Luis Obispo 2,052 1,111 758 3,921 83,834 5% 1.91Santa Barbara~ 2,020 1,106 870 3,997 134,241 3% 1.98Santa Cruz 1,401 1,031 558 2,989 68,500 4% 2.13Solano 2,111 1,162 836 4,109 99,866 4% 1.95Sonoma 9,477 7,351 4,928 21,756 147,777 15% 2.30Stanislaus* 11,918 7,190 5,814 24,922 125,773 20% 2.09Sutter* 846 798 372 2,016 19,153 11% 2.38Tulare* 6,022 4,161 1,852 12,034 87,055 14% 2.00Ventura~ 1,383 695 653 2,731 240,958 1% 1.98Yolo* 1,656 2,380 734 4,770 59,880 8% 2.88Yuba* 57 48 11 117 8,706 1% 2.04
Central Valley (*) 66,138 93,666 44,825 204,628 3.09Southern California (~) 77,763 109,847 79,433 267,043 3.43
Statewide 198,326 337,687 215,163 751,176 12,952,818 6% 3.79
Table 6. Food & Beverage Processing Employment by County and Region (number of full- and part-time jobs)
a United States Census Bureau, County Business Patterns, Total Employment by County, available at: http://www.census.gov/econ/cbp/.
19

County Direct Indirect Induced Total MultiplierAlameda 4,715,321 1,187,293 634,214 6,536,828 1.39Butte* 1,054,802 272,643 94,141 1,421,585 1.35Colusa* 742,847 144,320 23,716 910,883 1.23Fresno* 6,251,231 965,144 585,582 7,801,956 1.25Glenn* 138,150 37,246 4,875 180,272 1.30Imperial~ 730,875 156,965 33,804 921,644 1.26Kern* 2,980,705 412,364 206,821 3,599,890 1.21Kings* 3,196,974 714,677 142,025 4,053,676 1.27Los Angeles~ 24,151,071 6,038,579 3,428,161 33,617,812 1.39Madera* 325,149 25,404 13,808 364,362 1.12Merced* 2,883,481 440,030 165,726 3,489,237 1.21Monterey 1,316,992 211,663 128,544 1,657,199 1.26Orange County~ 4,505,764 807,743 527,244 5,840,751 1.30Riverside~ 1,826,474 229,875 149,057 2,205,406 1.21Sacramento* 2,455,909 578,222 280,759 3,314,890 1.35San Benito* 394,163 32,695 19,340 446,197 1.13San Bernardino~ 5,388,502 446,963 264,390 6,099,855 1.13San Diego~ 2,885,049 743,564 404,837 4,033,450 1.40San Joaquin* 3,855,105 723,963 379,614 4,958,682 1.29San Luis Obispo 864,109 190,500 93,509 1,148,118 1.33Santa Barbara~ 831,713 156,477 102,362 1,090,551 1.31Santa Cruz 656,145 152,020 65,901 874,066 1.33Solano 1,307,019 200,451 104,551 1,612,021 1.23Sonoma 4,257,947 1,333,841 606,700 6,198,488 1.46Stanislaus* 6,716,159 1,235,240 693,719 8,645,118 1.29Sutter* 446,447 98,636 41,524 586,606 1.31Tulare* 3,978,654 863,130 207,888 5,049,671 1.27Ventura~ 780,022 110,179 80,346 970,546 1.24Yolo* 1,324,426 331,965 92,744 1,749,135 1.32Yuba* 31,152 6,019 1,568 38,739 1.24
Central Valley (*) 37,001,639 21,198,062 5,605,444 63,805,145 1.72Southern California (~) 41,601,348 25,105,847 10,959,433 77,666,628 1.87
Statewide 104,913,022 80,706,322 30,822,041 216,441,385 2.06
Table 7. Food & Beverage Processing Sector Output by County and Region (thousands of dollars)
20

City/MA Direct Indirect Induced Total MultiplierBakersfield 232,507 348,514 154,137 735,158 3.16City of Industry 893,331 867,606 397,771 2,158,709 2.42Corning 28,743 22,603 5,050 56,395 1.96Fresno 593,137 1,041,460 487,990 2,122,587 3.58Huron 4,043 2,065 550 6,659 1.65Lodi 221,069 129,997 78,715 429,781 1.94Los Banos 80,999 30,163 13,717 124,880 1.54Merced 15,642 23,868 9,943 49,453 3.16Modesto 679,548 381,639 228,678 1,289,865 1.90Oakdale 43,546 38,742 14,885 97,172 2.23Oroville 9,032 6,564 2,465 18,062 2.00Oxnard 127,735 86,787 57,903 272,425 2.13Stockton 307,879 329,208 145,467 782,555 2.54Tulare 220,563 302,100 77,716 600,379 2.72Turlock 322,173 315,980 136,469 774,622 2.40Ventura 66,466 32,416 27,062 125,945 1.89Watsonville 65,211 57,712 25,644 148,567 2.28Williams 25,031 11,526 3,348 39,905 1.59Woodland 95,144 80,217 25,700 201,061 2.11Yuba City 72,704 61,272 32,660 166,635 2.29
Table 8. Food & Beverage Processing Value Added by Metropolitan Area (thousands of dollars)
21

City/MA Direct Indirect Induced Total Employmenta % F&B MultiplierBakersfield 3,557 3,869 1,870 9,296 150,900 6% 2.61City of Industry 6,586 7,419 4,159 18,164 NA NA 2.76Corning 373 445 59 877 2,450 36% 2.35Fresno 9,365 11,630 5,990 26,985 199,000 14% 2.88Huron 53 26 4 83 2,400 3% 1.57Lodi 2,028 1,494 976 4,498 28,100 16% 2.22Los Banos 639 361 174 1,174 11,400 10% 1.84Merced 278 105 51 434 27,400 2% 1.56Modesto 5,198 4,579 3,096 12,873 89,400 14% 2.48Oakdale 503 465 159 1,127 7,700 15% 2.24Oroville 127 85 30 243 4,500 5% 1.91Oxnard 1,134 886 665 2,684 80,900 3% 2.37Stockton 2,957 3,611 1,729 8,297 102,900 8% 2.81Tulare 1,770 3,049 989 5,808 20,700 28% 3.28Turlock 3,314 3,521 1,645 8,479 25,700 33% 2.56Ventura 471 380 315 1,166 57,400 2% 2.47Watsonville 826 734 286 1,846 18,200 10% 2.24Williams 419 121 42 582 1,420 41% 1.39Woodland 763 893 313 1,970 25,100 8% 2.58Yuba City 856 776 422 2,054 16,100 13% 2.40
Table 9. Food & Beverage Processing Employment by Metropolitan Area (number of full- and part-time jobs)
a Data from the California Employment Development Department, Labor Force and Unemployment Rates for Cities and Census Designated Areas, 2012 Annual Average, available at: http://www.labormarketinfo.edd.ca.gov/CES/Labor_Force_Unemployment_Data_for_Cities_and_Census_Areas.html#CCD
22

City/MA Direct Indirect Induced Total MultiplierBakersfield 1,413,313 798,441 243,977 2,455,731 1.74City of Industry 4,549,074 1,957,843 615,982 7,122,899 1.57Corning 275,016 57,636 7,745 340,397 1.24Fresno 4,163,985 2,579,576 772,195 7,515,755 1.80Huron 26,472 5,364 758 32,593 1.23Lodi 922,592 282,256 120,007 1,324,856 1.44Los Banos 372,934 83,941 21,123 477,999 1.28Merced 108,683 60,054 15,362 184,099 1.69Modesto 2,597,247 852,308 355,782 3,805,337 1.47Oakdale 259,827 93,894 22,203 375,923 1.45Oroville 60,632 15,937 3,751 80,320 1.32Oxnard 611,501 153,063 87,123 851,687 1.39Stockton 1,899,300 671,768 220,157 2,791,225 1.47Tulare 1,845,011 961,626 127,587 2,934,224 1.59Turlock 1,860,880 908,763 216,012 2,985,655 1.60Ventura 284,830 54,934 40,370 380,135 1.33Watsonville 383,991 104,844 37,680 526,515 1.37Williams 218,580 24,285 5,029 247,893 1.13Woodland 622,296 149,244 39,597 811,138 1.30Yuba City 450,528 117,839 49,204 617,570 1.37
Table 10. Food & Beverage Processing Sector Output by Metropolitan Area (thousands of dollars)
23

County Federal State and LocalAlameda 60,993 43,800Butte 47,124 83,433Colusa 26,804 22,209Fresno 42,258 29,554Glenn 28,079 16,474Imperial 31,027 21,427Kern 40,046 22,465Kings 26,406 17,293Los Angeles 62,350 51,651Madera 29,066 36,085Merced 34,764 21,881Monterey 52,968 52,691Orange 58,444 35,270Riverside 42,570 56,557Sacramento 53,299 38,556San Benito 30,936 29,270San Bernadino 27,378 15,118San Diego 61,185 71,277San Joaquin 48,915 42,467San Louis Obispo 60,355 98,561Santa Barbara 60,268 98,554Santa Cruz 51,209 40,033Solano 45,049 59,359Sonoma 135,550 51,071Stanislaus 49,068 40,846Sutter 47,205 27,194Tulare 33,580 20,404Ventura 52,663 34,713Yolo 38,055 32,342Yuba 30,912 29,353California Totala 99,783 77,940
Table 11. County and State Tax Impacts (per million dollars of direct Sector Output)
a California total is the statewide impact, therefore the sum of the counties in the table does not equal the state total.
24

25
6 Investigator Bios
Richard J. Sexton is a Professor and Chair in the Department of Agricultural and Resource Economics at the University of California, Davis. Sexton previously served as President of the Agricultural and Applied Economics Association (AAEA), Department chair at Davis from 1994-1998, Director of the Giannini Foundation of Agricultural Economics from 2000-03, and co-editor of the American Journal of Agricultural Economics (AJAE) from 1998-2000. Professor Sexton teaches and conducts research on a wide range of issues pertaining to marketing of agricultural products. He is an expert on production and marketing of California agricultural products, with particular focus on produce commodities and tree fruit and nut crops. His research has been published in a broad range of journals including Agricultural Economics, American Journal of Agricultural Economics, American Economic Review, European Economic Review, Journal of Agricultural and Resource Economics, Journal of Environmental Economics and Management, Journal of Industrial Economics, Journal of Regulatory Economics, Land Economics, Rand Journal of Economics, and Review of Industrial Organization. Sexton’s research has been recognized with awards from the AAEA, European Economics Association, and Western Agricultural Economics Association. He is a 2004 Fellow of the AAEA.
Josué Medellin-Azuara is a Research Fellow in the Department of Civil and Environmental Engineering at the University of California, Davis. He holds a M.S. degree in Agricultural & Resource Economics and a Ph.D. degree in Ecology, both from UC Davis. He works currently in the Delta Solutions Program of the Center for Watershed Sciences at UC Davis. Dr. Medellin-Azuara is an expert in modeling agricultural production and water use in California and in the application of the SWAP and IMPLAN models. His research has been published in several scientific journals including Climate Change, Water Resources Research, Journal of Hydrology, and Journal of Environmental Management.
Tina L. Saitone is a Project Economist in the Department of Agricultural and Resource Economics at the University of California, Davis. Dr. Saitone conducts research on a broad range of topics in agricultural economics including food quality and safety, industrial organization, agricultural marketing, and antitrust. Tina has published papers in academic journals including the American Journal of Agricultural Economics, Canadian Journal of Agricultural Economics, Journal of Agricultural and Resource Economics, Annual Review of Resource Economics, Journal of Industrial Organization Education, and Journal of Rural Cooperation. Dr. Saitone has taught courses at the University of California, Davis and Sonoma State University in business and antitrust regulation, microeconomics, and environmental economics.
Related Documents