THE ECONOMIC BENEFITS OF PUBLIC INFRASTRUCTURE SPENDING IN ONTARIO Prepared for: Ministry of Economic Development and Growth Ministry of Finance Ministry of Infrastructure Hearst Block, 900 Bay Street Toronto, ON M7A 2E1 Prepared by: The Centre for Spatial Economics 336 Bronte Street South, Unit 221 Milton, ON L9T 7W6 March 2017

Welcome message from author
This document is posted to help you gain knowledge. Please leave a comment to let me know what you think about it! Share it to your friends and learn new things together.
Transcript
THE ECONOMIC BENEFITS OF PUBLIC INFRASTRUCTURE
SPENDING IN ONTARIO
Prepared for:
Ministry of Economic Development and Growth
Ministry of Finance
Ministry of Infrastructure
Hearst Block, 900 Bay Street
Toronto, ON M7A 2E1
Prepared by:
The Centre for Spatial Economics
336 Bronte Street South, Unit 221
Milton, ON L9T 7W6
March 2017
Table of Contents
Executive Summary ....................................................................................................................................... 1
Ontario’s 10-year Infrastructure Spending Plan ........................................................................................... 3
Economic Theory: Linking Public Infrastructure and Economic Performance .......................................... 4
Methodology and Assumptions .................................................................................................................... 7
Benefits to Private Industry ...................................................................................................................... 7
A Scenario-based Approach to Modeling Uncertainty ............................................................................. 8
Results: Total Economic Impact .................................................................................................................... 9
Dynamic Impacts ..................................................................................................................................... 15
Industry Impacts ..................................................................................................................................... 16
Economic Multipliers and Return on Investment ................................................................................... 18
Short-run Multipliers........................................................................................................................... 18
Long-run Return on Investment .......................................................................................................... 19
Results in Relation to Other Studies ....................................................................................................... 20
Other Benefits from Public Infrastructure .................................................................................................. 23
Summary and Observations ........................................................................................................................ 24
References .................................................................................................................................................. 26
Appendix A: Contribution of Public Capital at the Industry Level .............................................................. 28
Appendix B: C4SE Provincial Economic Modeling System ........................................................................... 30

About this Study
This report was prepared for the Ontario Ministry of Economic Development and Growth, the Ontario
Ministry of Infrastructure, and the Ontario Ministry of Finance by The Centre for Spatial Economics
(C4SE). The Ministry of Economic Development and Growth along with the Ministries of Finance,
Infrastructure and the Treasury Board Secretariat share responsibility for implementing and assessing
the Province of Ontario’s 10-year infrastructure plan presented in Budget 2016.
The analysis estimates the economic benefits of the Province’s 10-year infrastructure plan using the
C4SE’s provincial economic modeling system. Results are presented in terms of the plan’s impacts upon
GDP, employment, government revenues and deficits over time. Spending multipliers and return on
investment statistics are generated to provide summary measures of the benefits to Ontario residents
and taxpayers. The results demonstrate the benefits of public funding for infrastructure where public
capital can play an important role in contributing to investment-led economic expansions, and
improving the productivity and competitiveness of private businesses in Ontario.
The report was conducted by Robin Somerville, Director, of the Centre for Spatial Economics (C4SE). The
C4SE monitors, analyzes and forecasts economic and demographic change throughout Canada at
virtually all levels of geography. It also prepares customized studies on the economic, industrial and
community impacts of various fiscal and other policy changes, and develops customized impact and
projection models for in-house client use. The C4SE provides economic models, analysis and forecasts to
nine provincial and territorial governments across Canada. For more information please go to
www.c4se.com.
Acknowledgements
The author would like to acknowledge and thank the staff of the Ontario Ministries of Economic
Development and Growth, Finance, Infrastructure and Transportation for their advice and feedback
given during the writing process. Their input contributed to both the scope and quality of the paper. The
author would also like to thank Wulong Gu and Ryan Macdonald of Statistics Canada for their insight
into the contribution of public capital to productivity growth in Canada. The author, of course, assumes
full responsibility for any shortcomings.
The Economic Benefits of Public Infrastructure Spending in Ontario
1
Executive Summary
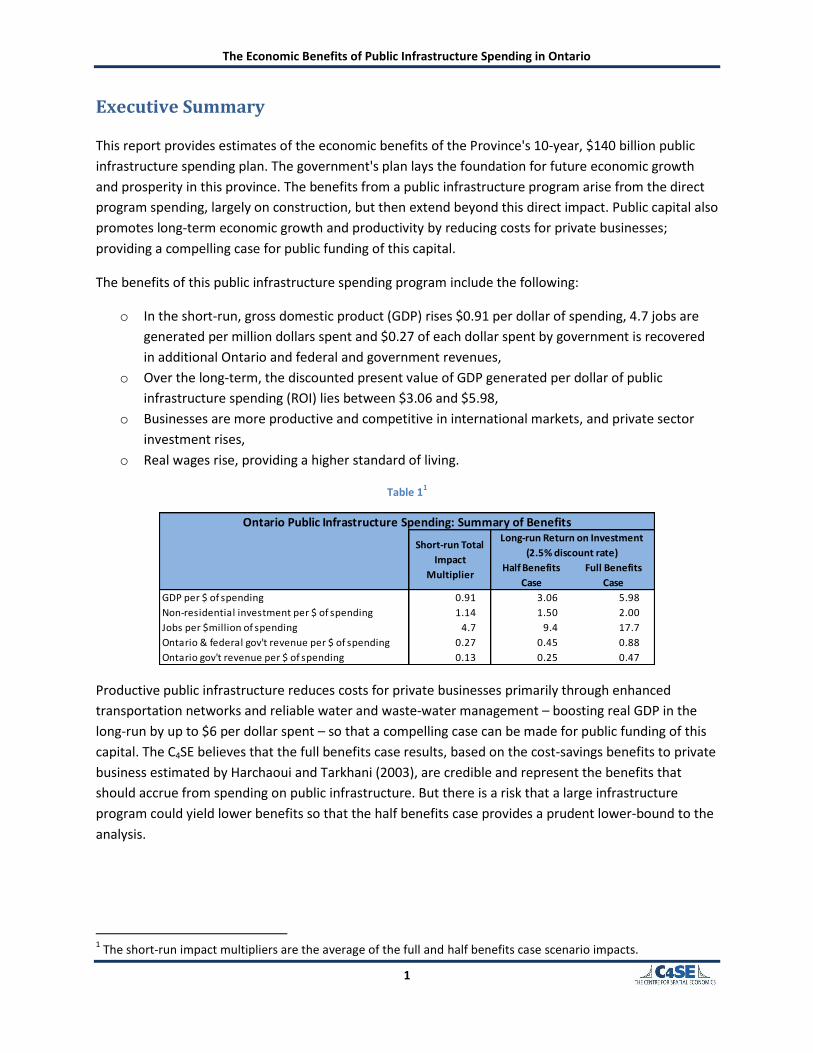
This report provides estimates of the economic benefits of the Province's 10-year, $140 billion public
infrastructure spending plan. The government's plan lays the foundation for future economic growth
and prosperity in this province. The benefits from a public infrastructure program arise from the direct
program spending, largely on construction, but then extend beyond this direct impact. Public capital also
promotes long-term economic growth and productivity by reducing costs for private businesses;
providing a compelling case for public funding of this capital.
The benefits of this public infrastructure spending program include the following:
o In the short-run, gross domestic product (GDP) rises $0.91 per dollar of spending, 4.7 jobs are
generated per million dollars spent and $0.27 of each dollar spent by government is recovered
in additional Ontario and federal and government revenues,
o Over the long-term, the discounted present value of GDP generated per dollar of public
infrastructure spending (ROI) lies between $3.06 and $5.98,
o Businesses are more productive and competitive in international markets, and private sector
investment rises,
o Real wages rise, providing a higher standard of living.
Table 11
Productive public infrastructure reduces costs for private businesses primarily through enhanced
transportation networks and reliable water and waste-water management – boosting real GDP in the
long-run by up to $6 per dollar spent – so that a compelling case can be made for public funding of this
capital. The C4SE believes that the full benefits case results, based on the cost-savings benefits to private
business estimated by Harchaoui and Tarkhani (2003), are credible and represent the benefits that
should accrue from spending on public infrastructure. But there is a risk that a large infrastructure
program could yield lower benefits so that the half benefits case provides a prudent lower-bound to the
analysis.
1 The short-run impact multipliers are the average of the full and half benefits case scenario impacts.
Half Benefits
Case
Full Benefits
Case
GDP per $ of spending 0.91 3.06 5.98
Non-residential investment per $ of spending 1.14 1.50 2.00
Jobs per $million of spending 4.7 9.4 17.7
Ontario & federal gov't revenue per $ of spending 0.27 0.45 0.88
Ontario gov't revenue per $ of spending 0.13 0.25 0.47
Ontario Public Infrastructure Spending: Summary of BenefitsLong-run Return on Investment
(2.5% discount rate)Short-run Total
Impact
Multiplier
The Economic Benefits of Public Infrastructure Spending in Ontario
2
Study Methodology
The analysis consists of three scenarios constructed using the C4SE’s provincial economic modeling system which is
a multi-region, multi-sector, dynamic stochastic general equilibrium model of Canada and its provinces. The
baseline scenario is set as a counterfactual and assumes that the Ontario government does not invest in the ten-
year infrastructure plan. This baseline scenario is the benchmark against which each of the other scenarios is
compared. The other two scenarios reflect the same short-term direct economic activity arising from the
Province’s 10-year, $140 billion public infrastructure spending program but have differing long-term impacts. The
long-term impacts from the half and full benefits case scenarios assume respectively that the new public
infrastructure provides either half or all of the cost-savings benefits to private business estimated by the research
of Harchaoui and Tarkhani (2003).
The increase in public capital can also help achieve something else that has eluded policy makers in
Canada over the last few years: gains in private sector investment spending. A public infrastructure
program boosts private investment in both the near and long-term and can, therefore, play an
important role in contributing to an investment-led economic expansion.
The results reported in this study are somewhat conservative relative to previous reports that have
assessed the benefits of public infrastructure spending in Ontario but are generous when compared
against analysis conducted in the US for infrastructure spending in that country. Like other reports, this
study only quantifies some of the possible benefits from spending on public infrastructure. The benefits
are limited to those from the actual or direct spending and the long-term benefits to business in terms
of reduced costs from the public capital. But public spending on these assets is also required to achieve
other social objectives that have not been captured or quantified in this analysis. These benefits include
those to households from lower transportation and congestion costs, improved business networking
opportunities, reductions in pollution and greenhouse gases, and societal gains from education, health
care and other public assets.
In closing, this study also provides a cautionary tale for policy analysts. The costs of neglecting our public
infrastructure are not zero. As noted by Infrastructure Canada (2011), allowing our public infrastructure
to continue to decay imposes costs of at least equal but opposite consequence to the benefits estimated
in this study. The competitiveness of private businesses in Ontario is tied to the quality of our public
assets, especially given the shortfall of infrastructure investment in previous decades. Therefore, a
significant and sustained public infrastructure spending initiative is required if households and
businesses are to continue to enjoy a high standard of living.
The Economic Benefits of Public Infrastructure Spending in Ontario
3
Ontario’s 10-year Infrastructure Spending Plan
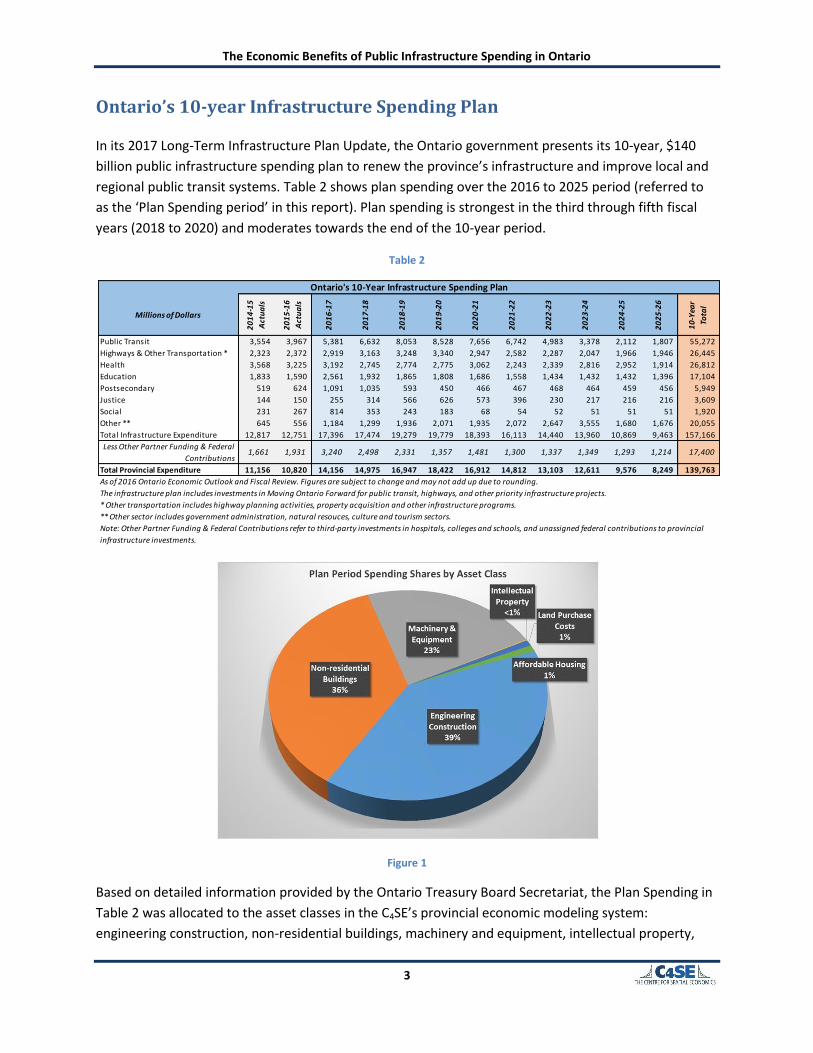
In its 2017 Long-Term Infrastructure Plan Update, the Ontario government presents its 10-year, $140
billion public infrastructure spending plan to renew the province’s infrastructure and improve local and
regional public transit systems. Table 2 shows plan spending over the 2016 to 2025 period (referred to
as the ‘Plan Spending period’ in this report). Plan spending is strongest in the third through fifth fiscal
years (2018 to 2020) and moderates towards the end of the 10-year period.
Table 2
Figure 1
Based on detailed information provided by the Ontario Treasury Board Secretariat, the Plan Spending in
Table 2 was allocated to the asset classes in the C4SE’s provincial economic modeling system:
engineering construction, non-residential buildings, machinery and equipment, intellectual property,
Millions of Dollars
20
14
-15
Act
ua
ls
20
15
-16
Act
ua
ls
20
16
-17
20
17
-18
20
18
-19
20
19
-20
20
20
-21
20
21
-22
20
22
-23
20
23
-24
20
24
-25
20
25
-26
10
-Yea
r
Tota
l
Public Transit 3,554 3,967 5,381 6,632 8,053 8,528 7,656 6,742 4,983 3,378 2,112 1,807 55,272
Highways & Other Transportation * 2,323 2,372 2,919 3,163 3,248 3,340 2,947 2,582 2,287 2,047 1,966 1,946 26,445
Health 3,568 3,225 3,192 2,745 2,774 2,775 3,062 2,243 2,339 2,816 2,952 1,914 26,812
Education 1,833 1,590 2,561 1,932 1,865 1,808 1,686 1,558 1,434 1,432 1,432 1,396 17,104
Postsecondary 519 624 1,091 1,035 593 450 466 467 468 464 459 456 5,949
Justice 144 150 255 314 566 626 573 396 230 217 216 216 3,609
Social 231 267 814 353 243 183 68 54 52 51 51 51 1,920
Other ** 645 556 1,184 1,299 1,936 2,071 1,935 2,072 2,647 3,555 1,680 1,676 20,055
Total Infrastructure Expenditure 12,817 12,751 17,396 17,474 19,279 19,779 18,393 16,113 14,440 13,960 10,869 9,463 157,166
Less Other Partner Funding & Federal
Contributions 1,661 1,931 3,240 2,498 2,331 1,357 1,481 1,300 1,337 1,349 1,293 1,214 17,400
Total Provincial Expenditure 11,156 10,820 14,156 14,975 16,947 18,422 16,912 14,812 13,103 12,611 9,576 8,249 139,763
As of 2016 Ontario Economic Outlook and Fiscal Review. Figures are subject to change and may not add up due to rounding.
The infrastructure plan includes investments in Moving Ontario Forward for public transit, highways, and other priority infrastructure projects.
* Other transportation includes highway planning activities, property acquisition and other infrastructure programs.
** Other sector includes government administration, natural resouces, culture and tourism sectors.
Ontario's 10-Year Infrastructure Spending Plan
Note: Other Partner Funding & Federal Contributions refer to third-party investments in hospitals, colleges and schools, and unassigned federal contributions to provincial
infrastructure investments.

The Economic Benefits of Public Infrastructure Spending in Ontario
4
affordable housing and land purchase costs.2 Figure 1 shows that 40% of all spending is allocated to
engineering infrastructure, followed by 36% for non-residential buildings and 23% for machinery and
equipment. Spending on other infrastructure assets is under 2% of the total.
Economic Theory: Linking Public Infrastructure and Economic Performance
Economic studies over the last twenty-five years have consistently found a positive link between public
infrastructure and productivity. While there are many critics of public spending that argue that it
provides no benefits to society with media reports often citing examples of public infrastructure projects
that provide little or no benefit to business or to the public these examples are, however, the exception.
Public capital, consisting of roads, bridges, sewer systems and water treatment facilities among other
public infrastructure assets, constitutes a vital input for private sector production. Nonetheless, its
impact on business sector productivity growth or total economy gross domestic product (GDP) is difficult
to measure. Public capital in North America tends to be publicly owned so no markets exist for its
output. There are no close substitutes for public capital in the private sector, thus making it infeasible to
use private sector information as a proxy for the public sector. As a result, estimates of public capital’s
impact are not easily obtained.
In 1989, David Aschauer (1989) used production function estimates to ignite a debate about the role of
public capital in private production, and its role in the productivity slowdown in the United States during
the 1970s. Wylie (1996) adopted the approach taken by Aschauer to estimate the elasticity of public
capital in Canada. Using a production function, and Canadian aggregate data from 1946 to 1991, he finds
that government capital has a positive elasticity so that investing in public capital raises productivity and
boosts economic growth. Wylie concludes by arguing that his results support the finding for the United
States that public capital plays an important role in business sector output and productivity growth. For
a variety of reasons, there have been many critics of these econometric studies. For example, the
criticisms range from failing to account for non-stationarity in the data, to omitted variable bias and
simultaneity bias. In addition, the magnitudes of the coefficient estimates – the benefits – are
improbably large.
More recent empirical work replaces the production function with its dual: the cost function.3 Nadiri and
Mamuneas (1994) used the cost function approach to investigate the impact of public capital on the cost
structure of US industries and obtained smaller, more credible, estimates of the benefits from public
capital. Harchaoui and Tarkhani (2003) apply a similar approach to Nadiri and Mamuneas (1994) using
Canadian data.
2 While budgets are predicated on spending in nominal dollars, economic analysis recognizes that the value of
future spending will be eroded by inflation. Restating the spending from Table 2 in terms of the value of a dollar spent in 2015 reduces the cumulative ten year spending total to $130 billion. 3 In a production function, firms produce their output using various inputs (capital, labour, materials, etc.) so as to
maximize their profits. A cost function has firms minimizing the cost of inputs to produce their output. The cost function is referred to as the dual of the production function because the two approaches yield the same outcome in terms of inputs and outputs.

The Economic Benefits of Public Infrastructure Spending in Ontario
5
Finally, an alternative non-parametric approach to productivity analysis is taken by Baldwin, Gu and
Macdonald (2010) based on a growth accounting framework. It focuses on private sector inputs and
outputs. Inputs that are difficult to measure or include, such as public capital, are folded into estimates
of multifactor productivity (MFP). Critics of earlier studies that adopted this approach say that it is
unclear how large an effect public capital has on productivity growth or whether the impact varies over
time. The more recent research by Baldwin, Gu and Macdonald (2010), however, specifically
incorporates public capital using the benefits estimated by Harchaoui and Tarkhani (2003) and others
(Macdonald 2008).
Harchaoui and Tarkhani (2003) estimate the effects of public capital on business sector production costs,
level of output, demand for labour, capital, and intermediate goods using Canadian data for 37
industries for the period 1961-2000 using a translog cost function. The authors found that an increase in
public capital has an initial, direct productivity effect: it reduces the cost of producing a given level of
output in almost all industries. This cost-reducing ‘productivity effect’ of public capital varies in
magnitude across industries (see Appendix A for a table reproducing their results) with the largest
benefits accruing to the transportation, wholesale, retail and other utility sectors. The economic impact
of public capital on the various industries is not limited to the direct productivity effect. Cost reductions
permit products to be sold at lower prices which can be expected to lead to higher sales and output
growth. The authors refer to this as the ‘output effect’ of public capital.
The cost-reducing and output-expanding impacts of public capital affect the business sector’s demand
for labour, capital and intermediate inputs. The initial productivity effect of an increase in public capital
results in a reduction in the demand for labour and intermediate inputs, but an increase in the demand
for private capital in all industries. When industry production levels increase due to the ‘output effect’ of
public capital, the change in the demand for labour and intermediate inputs is reduced while the
demand for private capital increases. Thus, the 'output effect' of public capital reinforces the ‘crowding
in’ of private capital formation so that public capital can be seen as having an important role in
contributing to investment-led economic expansions, and implying that public capital is a complement
to private capital.4
This paper uses the findings from Harchaoui and Tarkhani (2003) to estimate the economic benefits of
the province's 10-year public infrastructure spending program using the C4SE’s provincial economic
modeling system.5 The next sections discuss the study methodology and assumptions, followed by the
results. Results are presented in terms of impacts upon GDP, employment, government revenues and
fiscal balances over time. Spending multipliers and return on investment statistics are generated to
4 Critics of public spending contend that it can act as a substitute for private spending thus ‘crowding out’ private
spending and reducing the overall impact of public spending. The ‘crowding in’ of private spending is the reverse of this phenomenon where private sector spending rises through the multiplier effect of public spending. 5 Harchaoui and Tarkhani's (2003) results were used rather than those from Macdonald's (2008) more recent cost
function estimation because their data allowed for the estimation of translog cost functions while limitations in Macdonald's data restricted him to a Cobb-Douglas approach. As a result, the estimated industry cost elasticities with respect to public capital - while similar in aggregate to those obtained by Harchaoui and Tarkhani - exhibited greater overall variability across industries.

The Economic Benefits of Public Infrastructure Spending in Ontario
6
provide summary measures of the results. The paper concludes with some observations based on the
results.
The Economic Benefits of Public Infrastructure Spending in Ontario
7
Methodology and Assumptions
This section reviews the methodology and assumptions required to assess the benefits of public
infrastructure spending in Ontario. The benefits of a public infrastructure program arise from the direct
program spending and beyond, with public capital promoting economic growth and productivity.
Benefits to Private Industry
The private industry cost-savings elasticities estimated by Harchaoui and Tarkhani (2003) are used to
reduce production costs by business sector in the C4SE’s provincial economic modeling system. A table
of their elasticities of costs with respect to public capital by business sector is reproduced in Appendix A.
The Province’s infrastructure spending plan raises the stock of public infrastructure capital in Ontario6 by
59% above the levels in the baseline scenario in 2025. Without additional renewal spending after the
Plan Spending period, the stock of public infrastructure would return to its baseline levels. Based on
government estimates, average spending of $2.6 billion a year (measured in 2015 reference year dollars)
is required to maintain the service levels of the new capital added during the Plan Spending period.7 This
study, therefore, assumes sustained provincial spending of that amount for the Post-plan period.
Harchaoui and Tarkhani’s (2003) research focused on the cost-savings benefits of engineering capital.
Ontario’s Plan spending raises the stock of public sector engineering capital in the province by 58% in
2025. Ontario’s infrastructure plan includes significant spending on local and regional public transit
systems. Spending on machinery and equipment will boost the stock of public capital in the public
transit sector by 144% over baseline levels in 2025. Spending on machinery and equipment for public
transit is included as a benefit to private industry because of the widely acknowledged impact of
transportation congestion on business costs. Enhanced public transit will lower commute times and
reduce transportation costs, and help alleviate congestion which will benefit private businesses in
Ontario. Including public transit machinery and equipment spending with public engineering (including
that for public transit) yields an overall 59% increase in the stock of public capital which is used to
determine private sector benefits: a 59% increase in the stock of public capital will reduce production
costs by industry by 59 times the estimated cost elasticity.8
Spending on infrastructure projects takes time to complete and then further time before businesses can
realize cost-savings from its benefits. To reflect this delay, the impact on industry costs is partially
6 The stock of public infrastructure in Ontario used in this calculation includes public capital from all levels of
government as well as public health care and education. 7 This $2.6 billion annual average Post-plan expenditure is calculated using the historical average rate of renewal
spending as a share of the current replacement value of Ontario's existing public capital stock, multiplied by the additional public capital stock during the Province's 2016 to 2025 infrastructure plan spending period. 8 Statistics Canada does not publish data that distinguishes between new and renewal capital spending. It is,
therefore, not possible to empirically determine whether the private or social benefits from spending on new or spending to renew existing public infrastructure differ. Harchaoui and Tarkhani's (2003) findings are based on the historical mix in new and renewal spending; so this mix is reflected in the results in this paper. While it is possible that the private or social benefits from spending on new public capital exceed those from renewing existing capital, it should also be remembered that failure to renew existing public capital will lead to its eventual loss and the loss of the productive services it provides to the economy (Infrastructure Canada 2011).
The Economic Benefits of Public Infrastructure Spending in Ontario
8
introduced into the C4SE's model in the second year following the initial infrastructure spending with the
cost-savings benefits continuing to accrue for another eight years before the benefits from that initial
year’s infrastructure spending are fully realized. The cost-savings benefits for Plan Spending in
subsequent years is similarly accrued over time. As a result, the cost-savings benefits from Plan Period
Spending continue to rise into the Post-plan period as the benefits from earlier year’s spending is
realized.
Finally, it is important to note that the use of public capital by one industry is assumed not to preclude
or reduce the value of its use by any other industry.9
A Scenario-based Approach to Modeling Uncertainty
The private industry cost-savings elasticities estimated by Harchaoui and Tarkhani (2003) are considered
plausible by many economists. Their work corrects the methodological concerns of earlier studies and
produces elasticities that are significantly smaller than those from earlier empirical studies. There is still,
however, debate and uncertainty over the precise level of cost-savings benefit conferred to private
industry from public capital.
Uncertainty is addressed through a set of scenarios. The first scenario, referred to as the baseline
scenario, does not include any public infrastructure spending. This is the benchmark against which each
of the other shock scenarios is compared. A pair of scenarios are provided to evaluate the range of
benefits of lower industry costs: the full benefits case and the half benefits case. 10 The half benefits
case scenario halves Harchaoui and Tarkhani’s (2003) business industry cost elasticities and reflects the
possibility that such a large spending program, while addressing many vital infrastructure needs, may
also include a number of projects of lower economic necessity or value. Economists refer to this
phenomenon as 'diminishing marginal return on investment.' The full benefits case is based on the full
value of the estimated cost elasticities.11
9 This study assumes that current government spending (excluding debt service charges) is not directly affected by
infrastructure spending. For example, improvements or additions to the stock of institutional buildings are assumed to either replace decommissioned buildings or to meet anticipated increases in demand arising from changes in population. As a result, employment in public administration, public education or health care rises - or falls - based on changes in provincial population-based needs and not in direct response to the construction of new facilities. 10
A third shock scenario is the zero benefits case which assumes that public infrastructure provides no benefit to private business. The results from this scenario are an extreme case and do not represent a likely outcome; so they are not shown in this report. 11
Harchaoui and Tarkhani's (2003) estimated elasticities reflect the full historical portfolio of infrastructure projects: successful or otherwise. It is, however, possible that the cost-savings benefits could exceed those reported in the full benefits case if Plan spending is devoted to more productive assets.
The Economic Benefits of Public Infrastructure Spending in Ontario
9
Results: Total Economic Impact
This section of the report presents the total economic impact of the public infrastructure spending
program described in the previous section. The analysis is conducted using the C4SE’s provincial
economic modeling system which is a multi-region, multi-sector, dynamic stochastic general equilibrium
model of Canada and its provinces.12
The analysis consists of three scenarios. The baseline scenario does not include Ontario's public
infrastructure plan spending and is the benchmark against which each of the other scenarios is
compared. The other two scenarios reflect changes in economic activity arising from the provincial
infrastructure spending program. The two shock scenarios are the half and full benefits cases which
assume respectively that the new public infrastructure provides either half or all the cost-savings
benefits to private business estimated by Harchaoui and Tarkhani (2003).
Table 3
The results are conducted under the assumption that ongoing provincial public renewal spending in the
Post-plan period is sufficient to maintain the service levels of infrastructure attained in 2025 at the end
of the 10-year Plan Spending period. This spending ensures that the boost to competitiveness for
businesses in the province from the initial investment in infrastructure does not diminish over time.
Without this Post-plan spending, the stock of public capital affecting business sector costs would decline
— as would their estimated cost-savings benefits. Incorporating a permanent Post-plan level of public
renewal spending has fiscal implications over the long term, but it also provides a perspective of the
long-run benefits arising from a new, stable, higher level of public infrastructure in the province.
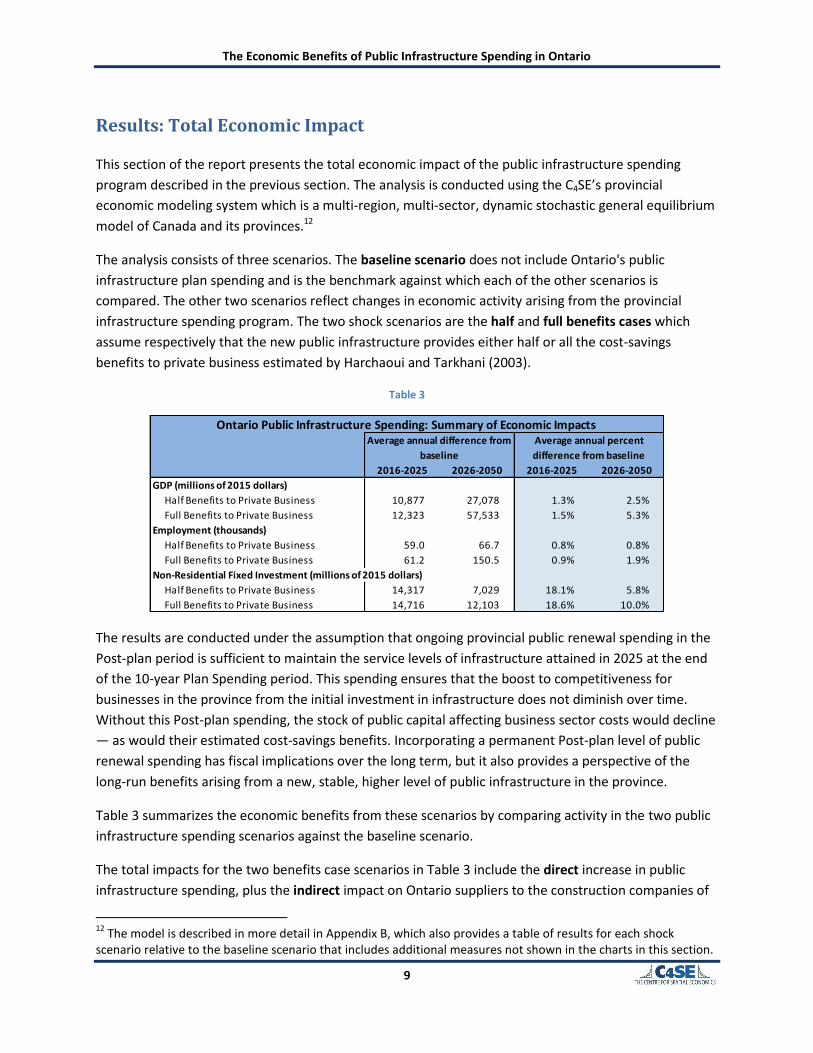
Table 3 summarizes the economic benefits from these scenarios by comparing activity in the two public
infrastructure spending scenarios against the baseline scenario.
The total impacts for the two benefits case scenarios in Table 3 include the direct increase in public
infrastructure spending, plus the indirect impact on Ontario suppliers to the construction companies of
12
The model is described in more detail in Appendix B, which also provides a table of results for each shock scenario relative to the baseline scenario that includes additional measures not shown in the charts in this section.
2016-2025 2026-2050 2016-2025 2026-2050
GDP (millions of 2015 dollars)
Half Benefits to Private Business 10,877 27,078 1.3% 2.5%
Full Benefits to Private Business 12,323 57,533 1.5% 5.3%
Employment (thousands)
Half Benefits to Private Business 59.0 66.7 0.8% 0.8%
Full Benefits to Private Business 61.2 150.5 0.9% 1.9%
Non-Residential Fixed Investment (millions of 2015 dollars)
Half Benefits to Private Business 14,317 7,029 18.1% 5.8%
Full Benefits to Private Business 14,716 12,103 18.6% 10.0%
Ontario Public Infrastructure Spending: Summary of Economic ImpactsAverage annual difference from
baseline
Average annual percent
difference from baseline
The Economic Benefits of Public Infrastructure Spending in Ontario
10
everything from office supplies to construction equipment used in the construction process, plus the
induced impacts. Induced impacts include the impact on the economy from employees (at the direct
and indirect level of impact) spending their incomes, and then the income that process generates being
re-spent by its recipients. The provincial economic modeling system also considers changes in business
investment spending arising from the shifts in the economy, changes in wages, prices, interest and
exchange rates, and changes in population as people move based on prevailing economic conditions.
These factors combine to ensure that the total impact is, in the long-run, larger than the direct increase
in spending.
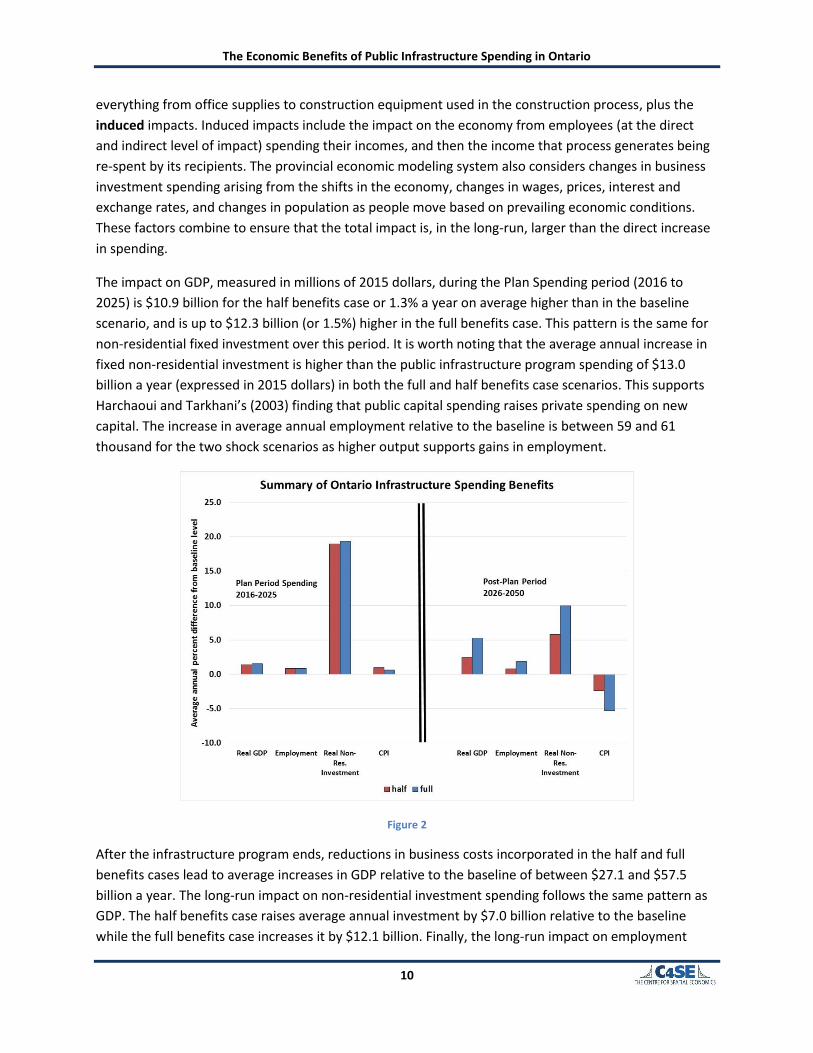
The impact on GDP, measured in millions of 2015 dollars, during the Plan Spending period (2016 to
2025) is $10.9 billion for the half benefits case or 1.3% a year on average higher than in the baseline
scenario, and is up to $12.3 billion (or 1.5%) higher in the full benefits case. This pattern is the same for
non-residential fixed investment over this period. It is worth noting that the average annual increase in
fixed non-residential investment is higher than the public infrastructure program spending of $13.0
billion a year (expressed in 2015 dollars) in both the full and half benefits case scenarios. This supports
Harchaoui and Tarkhani’s (2003) finding that public capital spending raises private spending on new
capital. The increase in average annual employment relative to the baseline is between 59 and 61
thousand for the two shock scenarios as higher output supports gains in employment.
Figure 2
After the infrastructure program ends, reductions in business costs incorporated in the half and full
benefits cases lead to average increases in GDP relative to the baseline of between $27.1 and $57.5
billion a year. The long-run impact on non-residential investment spending follows the same pattern as
GDP. The half benefits case raises average annual investment by $7.0 billion relative to the baseline
while the full benefits case increases it by $12.1 billion. Finally, the long-run impact on employment
The Economic Benefits of Public Infrastructure Spending in Ontario
11
varies between an average annual increase in jobs of 67,000 and 150,000 as higher economic activity
raises the demand for labour relative to the baseline.
Figure 2 to Figure 6 provide a summary of the impacts on select key economic measures for each
scenario relative to the baseline over the Plan Period Spending phase and over the 2026-2050 long-run
period.
Figure 2 illustrates the percent difference from the baseline levels for GDP, employment and non-
residential fixed investment from Table 3. It also includes the impact on the level of the consumer price
index (CPI) relative to the baseline.13 In the Plan Period Spending phase, the CPI is slightly higher than
the baseline in the shocks, but lower industry costs from higher productivity feed through to moderate
the increase in the CPI in the full benefits case. The difference in CPI impacts across shock scenarios
becomes more pronounced over the long-run as the benefits from lower industry costs reduce prices
throughout the economy.
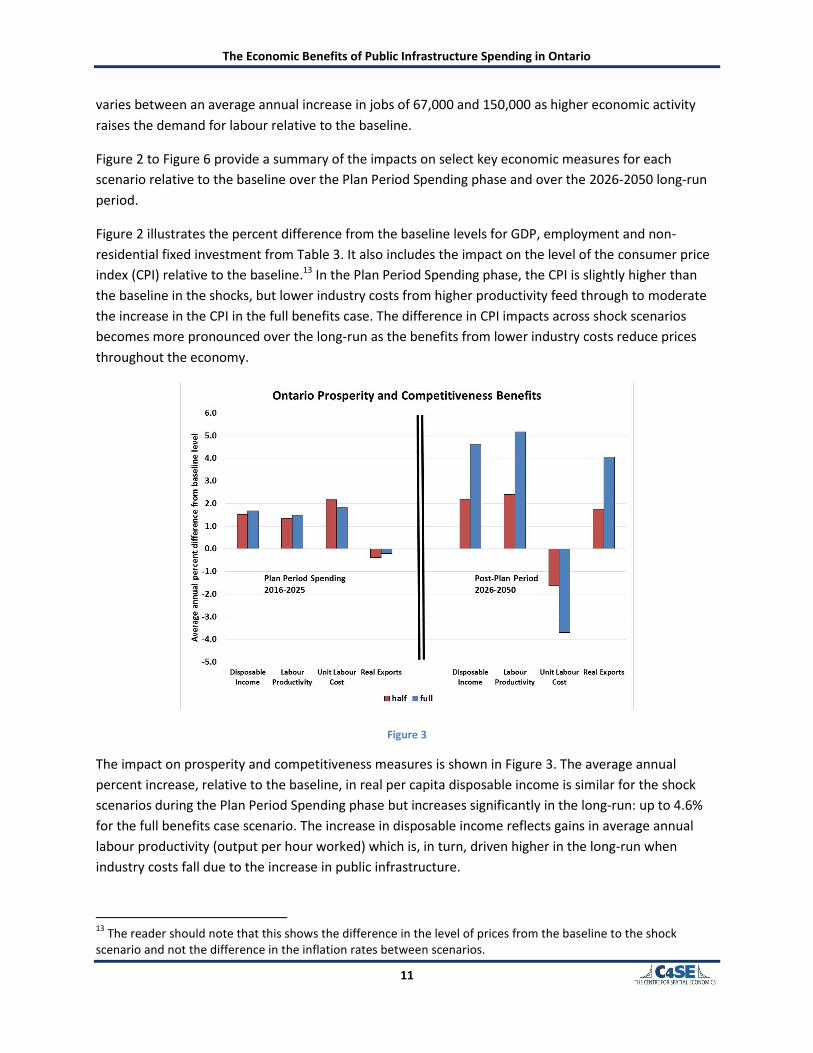
Figure 3
The impact on prosperity and competitiveness measures is shown in Figure 3. The average annual
percent increase, relative to the baseline, in real per capita disposable income is similar for the shock
scenarios during the Plan Period Spending phase but increases significantly in the long-run: up to 4.6%
for the full benefits case scenario. The increase in disposable income reflects gains in average annual
labour productivity (output per hour worked) which is, in turn, driven higher in the long-run when
industry costs fall due to the increase in public infrastructure.
13
The reader should note that this shows the difference in the level of prices from the baseline to the shock scenario and not the difference in the inflation rates between scenarios.
The Economic Benefits of Public Infrastructure Spending in Ontario
12
Unit labour costs measure the value of labour, in nominal dollars, required to produce a unit of real
output and are often used to assess competitiveness. Higher unit labour costs make it harder for goods
and services produced in a region to compete against imports from other regions or to find export
opportunities in those markets. Increased economic activity and higher employment push wages up
during the Plan Period Spending phase which raises unit labour costs in both shock scenarios. The
increase in unit labour costs is higher for the half benefits case than for the full benefits case as less of
the cost-savings benefits from public infrastructure are realized by private business. Reductions in
industry costs have a significant impact on unit labour costs over the long-run due to lower nominal
wages and increased productivity.
Shifts in competitiveness influence both exports and imports. Higher unit labour costs cause real exports
to fall and real imports to rise, relative to the baseline, during the Plan Period Spending phase. The
reverse is true in the long-run as real exports rise for both the full and half benefits case scenarios.
Imports rise, relative to the baseline, in both the short and long-term for both scenarios, driven higher
by increased economic activity in Ontario.
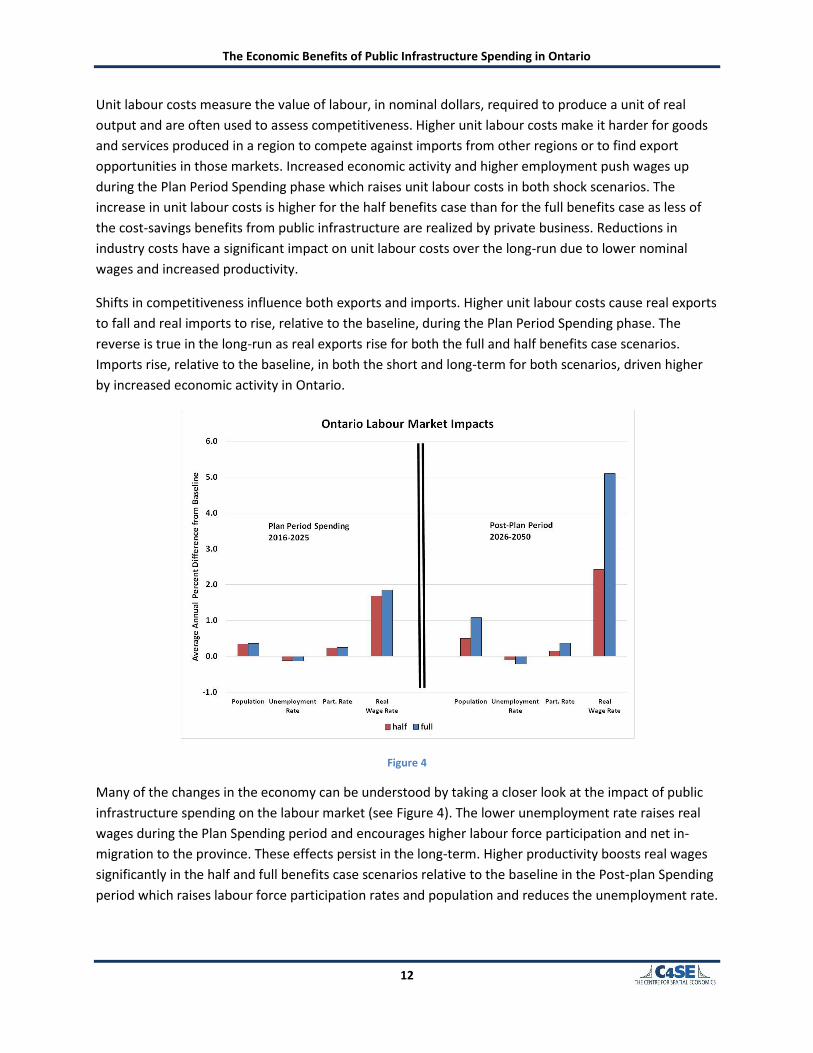
Figure 4
Many of the changes in the economy can be understood by taking a closer look at the impact of public
infrastructure spending on the labour market (see Figure 4). The lower unemployment rate raises real
wages during the Plan Spending period and encourages higher labour force participation and net in-
migration to the province. These effects persist in the long-term. Higher productivity boosts real wages
significantly in the half and full benefits case scenarios relative to the baseline in the Post-plan Spending
period which raises labour force participation rates and population and reduces the unemployment rate.
The Economic Benefits of Public Infrastructure Spending in Ontario
13
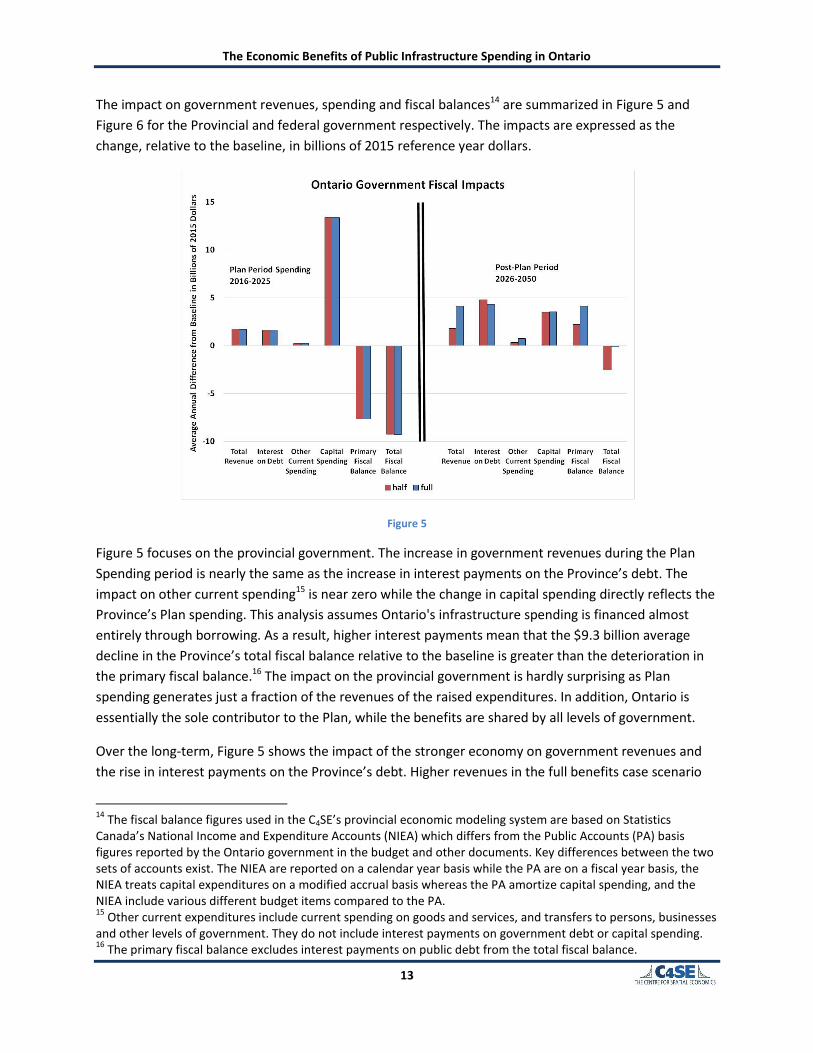
The impact on government revenues, spending and fiscal balances14 are summarized in Figure 5 and
Figure 6 for the Provincial and federal government respectively. The impacts are expressed as the
change, relative to the baseline, in billions of 2015 reference year dollars.
Figure 5
Figure 5 focuses on the provincial government. The increase in government revenues during the Plan
Spending period is nearly the same as the increase in interest payments on the Province’s debt. The
impact on other current spending15 is near zero while the change in capital spending directly reflects the
Province’s Plan spending. This analysis assumes Ontario's infrastructure spending is financed almost
entirely through borrowing. As a result, higher interest payments mean that the $9.3 billion average
decline in the Province’s total fiscal balance relative to the baseline is greater than the deterioration in
the primary fiscal balance.16 The impact on the provincial government is hardly surprising as Plan
spending generates just a fraction of the revenues of the raised expenditures. In addition, Ontario is
essentially the sole contributor to the Plan, while the benefits are shared by all levels of government.
Over the long-term, Figure 5 shows the impact of the stronger economy on government revenues and
the rise in interest payments on the Province’s debt. Higher revenues in the full benefits case scenario
14
The fiscal balance figures used in the C4SE’s provincial economic modeling system are based on Statistics Canada’s National Income and Expenditure Accounts (NIEA) which differs from the Public Accounts (PA) basis figures reported by the Ontario government in the budget and other documents. Key differences between the two sets of accounts exist. The NIEA are reported on a calendar year basis while the PA are on a fiscal year basis, the NIEA treats capital expenditures on a modified accrual basis whereas the PA amortize capital spending, and the NIEA include various different budget items compared to the PA. 15
Other current expenditures include current spending on goods and services, and transfers to persons, businesses and other levels of government. They do not include interest payments on government debt or capital spending. 16
The primary fiscal balance excludes interest payments on public debt from the total fiscal balance.
The Economic Benefits of Public Infrastructure Spending in Ontario
14
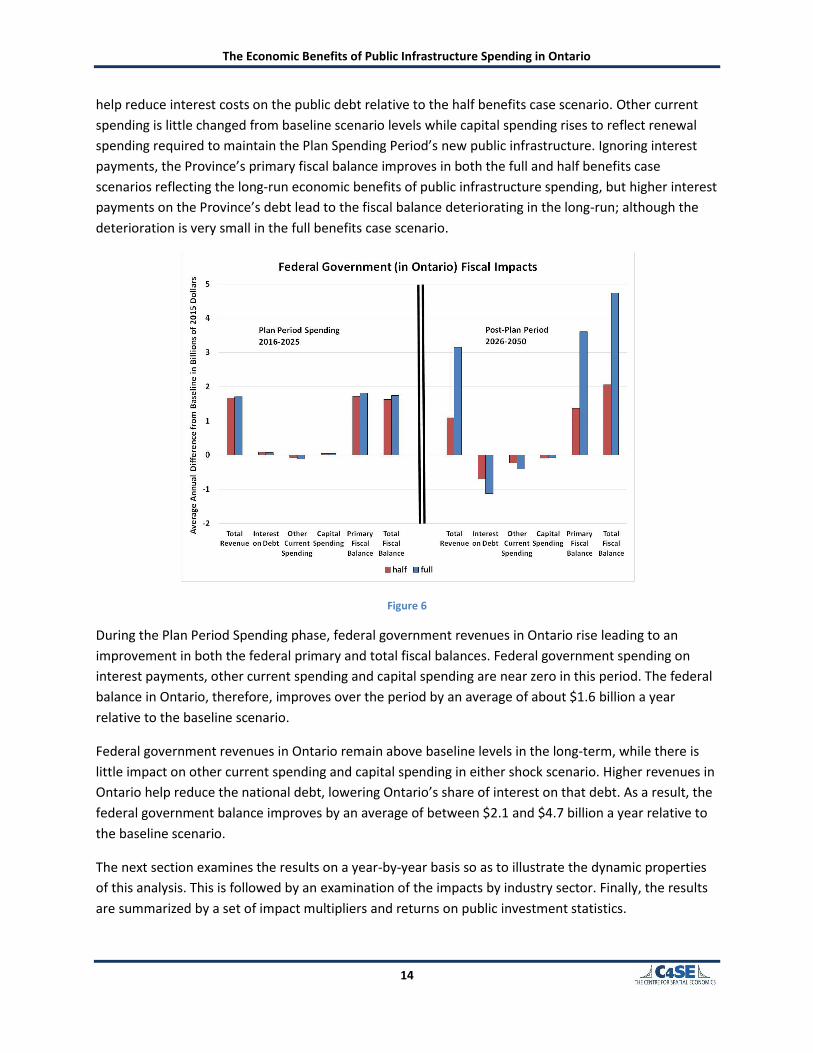
help reduce interest costs on the public debt relative to the half benefits case scenario. Other current
spending is little changed from baseline scenario levels while capital spending rises to reflect renewal
spending required to maintain the Plan Spending Period’s new public infrastructure. Ignoring interest
payments, the Province’s primary fiscal balance improves in both the full and half benefits case
scenarios reflecting the long-run economic benefits of public infrastructure spending, but higher interest
payments on the Province’s debt lead to the fiscal balance deteriorating in the long-run; although the
deterioration is very small in the full benefits case scenario.
Figure 6
During the Plan Period Spending phase, federal government revenues in Ontario rise leading to an
improvement in both the federal primary and total fiscal balances. Federal government spending on
interest payments, other current spending and capital spending are near zero in this period. The federal
balance in Ontario, therefore, improves over the period by an average of about $1.6 billion a year
relative to the baseline scenario.
Federal government revenues in Ontario remain above baseline levels in the long-term, while there is
little impact on other current spending and capital spending in either shock scenario. Higher revenues in
Ontario help reduce the national debt, lowering Ontario’s share of interest on that debt. As a result, the
federal government balance improves by an average of between $2.1 and $4.7 billion a year relative to
the baseline scenario.
The next section examines the results on a year-by-year basis so as to illustrate the dynamic properties
of this analysis. This is followed by an examination of the impacts by industry sector. Finally, the results
are summarized by a set of impact multipliers and returns on public investment statistics.
The Economic Benefits of Public Infrastructure Spending in Ontario
15
Dynamic Impacts
For ease of exposition, most of the results of the analysis in previous sections have been presented
either in terms of the impacts over the Plan Spending period, or as an average of the Post-plan long-
term impacts. The C4SE's provincial economic modeling system does, however, produce results for each
year of the analysis. The annual results are presented in this section to show the dynamic evolution of
the economy in response to the increase in infrastructure investment spending and also to help
illustrate different ways of interpreting impact analysis.
Figure 7
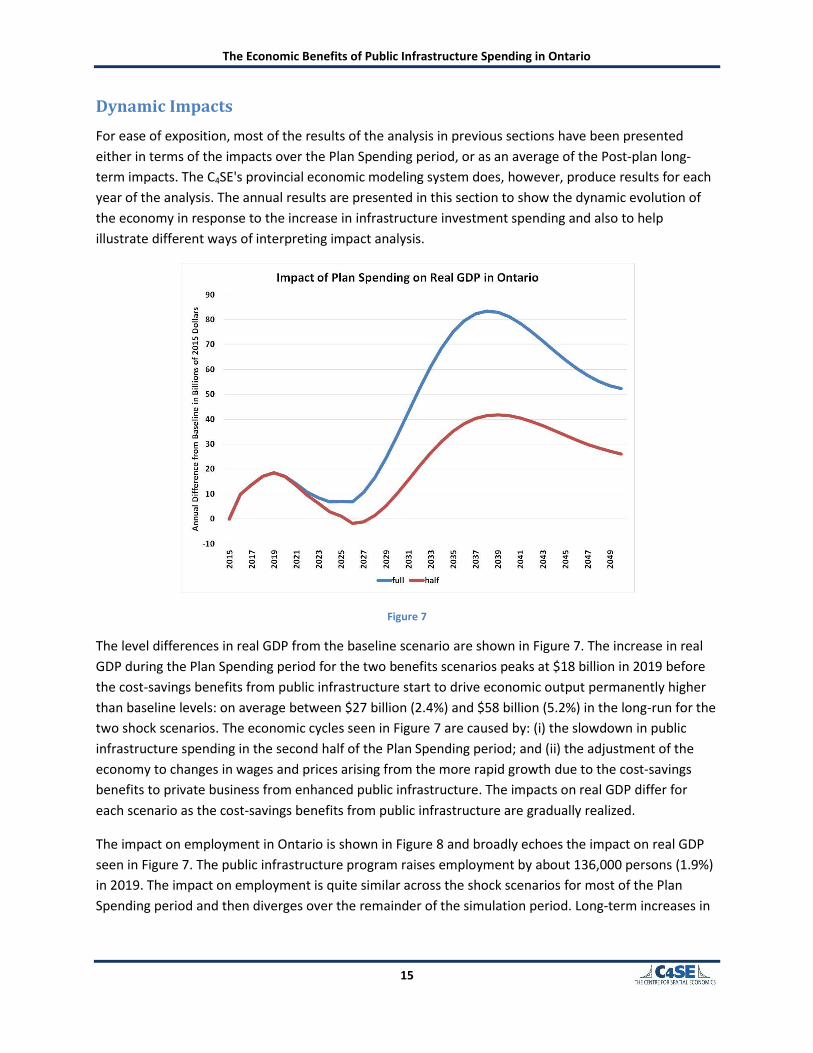
The level differences in real GDP from the baseline scenario are shown in Figure 7. The increase in real
GDP during the Plan Spending period for the two benefits scenarios peaks at $18 billion in 2019 before
the cost-savings benefits from public infrastructure start to drive economic output permanently higher
than baseline levels: on average between $27 billion (2.4%) and $58 billion (5.2%) in the long-run for the
two shock scenarios. The economic cycles seen in Figure 7 are caused by: (i) the slowdown in public
infrastructure spending in the second half of the Plan Spending period; and (ii) the adjustment of the
economy to changes in wages and prices arising from the more rapid growth due to the cost-savings
benefits to private business from enhanced public infrastructure. The impacts on real GDP differ for
each scenario as the cost-savings benefits from public infrastructure are gradually realized.
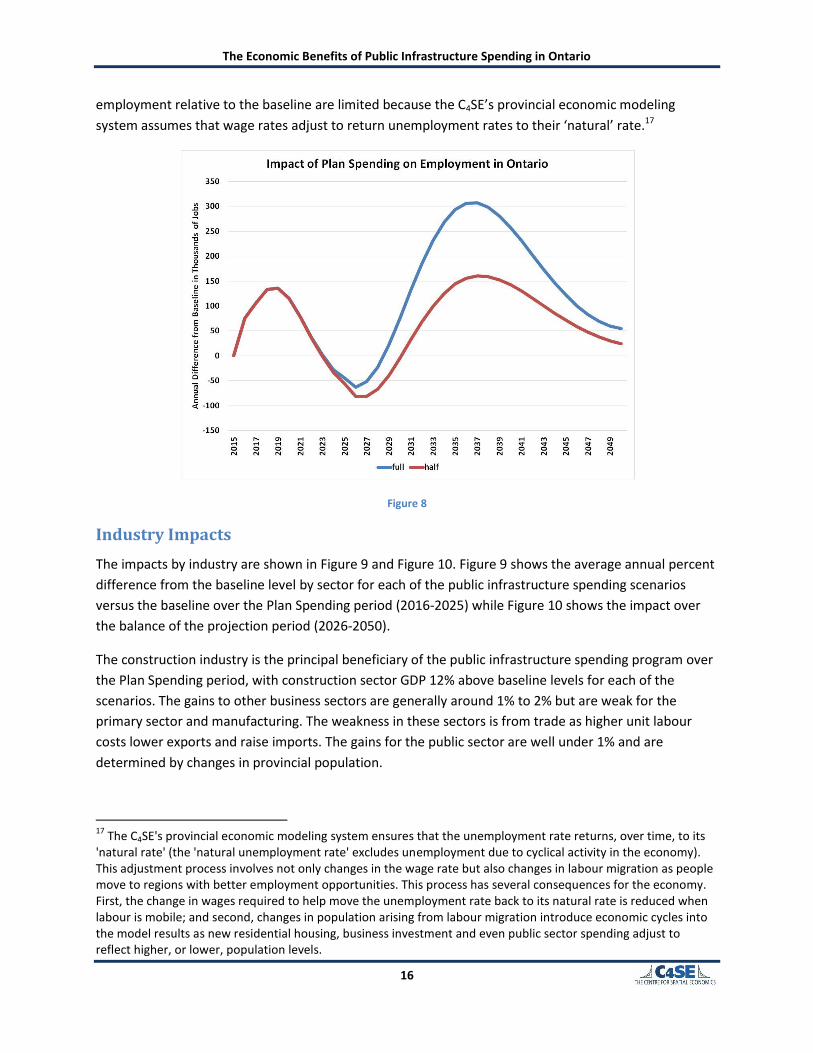
The impact on employment in Ontario is shown in Figure 8 and broadly echoes the impact on real GDP
seen in Figure 7. The public infrastructure program raises employment by about 136,000 persons (1.9%)
in 2019. The impact on employment is quite similar across the shock scenarios for most of the Plan
Spending period and then diverges over the remainder of the simulation period. Long-term increases in
The Economic Benefits of Public Infrastructure Spending in Ontario
16
employment relative to the baseline are limited because the C4SE’s provincial economic modeling
system assumes that wage rates adjust to return unemployment rates to their ‘natural’ rate.17
Figure 8
Industry Impacts
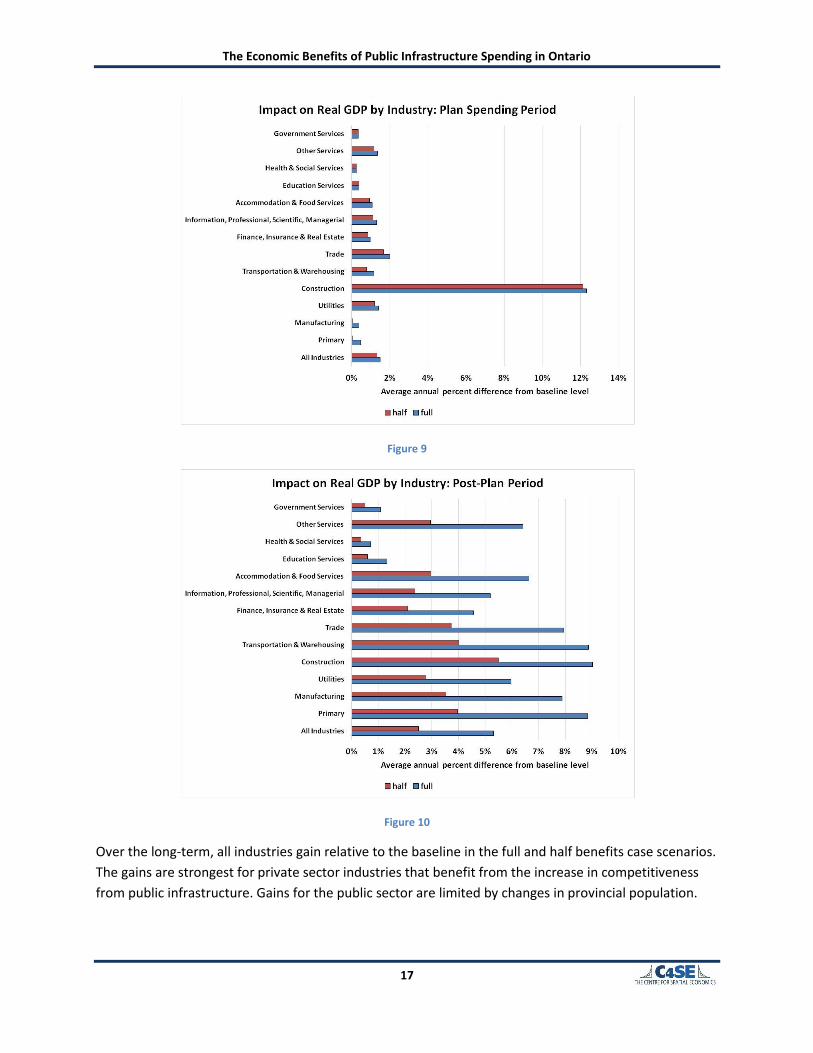
The impacts by industry are shown in Figure 9 and Figure 10. Figure 9 shows the average annual percent
difference from the baseline level by sector for each of the public infrastructure spending scenarios
versus the baseline over the Plan Spending period (2016-2025) while Figure 10 shows the impact over
the balance of the projection period (2026-2050).
The construction industry is the principal beneficiary of the public infrastructure spending program over
the Plan Spending period, with construction sector GDP 12% above baseline levels for each of the
scenarios. The gains to other business sectors are generally around 1% to 2% but are weak for the
primary sector and manufacturing. The weakness in these sectors is from trade as higher unit labour
costs lower exports and raise imports. The gains for the public sector are well under 1% and are
determined by changes in provincial population.
17
The C4SE's provincial economic modeling system ensures that the unemployment rate returns, over time, to its 'natural rate' (the 'natural unemployment rate' excludes unemployment due to cyclical activity in the economy). This adjustment process involves not only changes in the wage rate but also changes in labour migration as people move to regions with better employment opportunities. This process has several consequences for the economy. First, the change in wages required to help move the unemployment rate back to its natural rate is reduced when labour is mobile; and second, changes in population arising from labour migration introduce economic cycles into the model results as new residential housing, business investment and even public sector spending adjust to reflect higher, or lower, population levels.
The Economic Benefits of Public Infrastructure Spending in Ontario
17
Figure 9
Figure 10
Over the long-term, all industries gain relative to the baseline in the full and half benefits case scenarios.
The gains are strongest for private sector industries that benefit from the increase in competitiveness
from public infrastructure. Gains for the public sector are limited by changes in provincial population.
The Economic Benefits of Public Infrastructure Spending in Ontario
18
Economic Multipliers and Return on Investment
Economic multipliers and return on investment measures are often used to summarize the economic
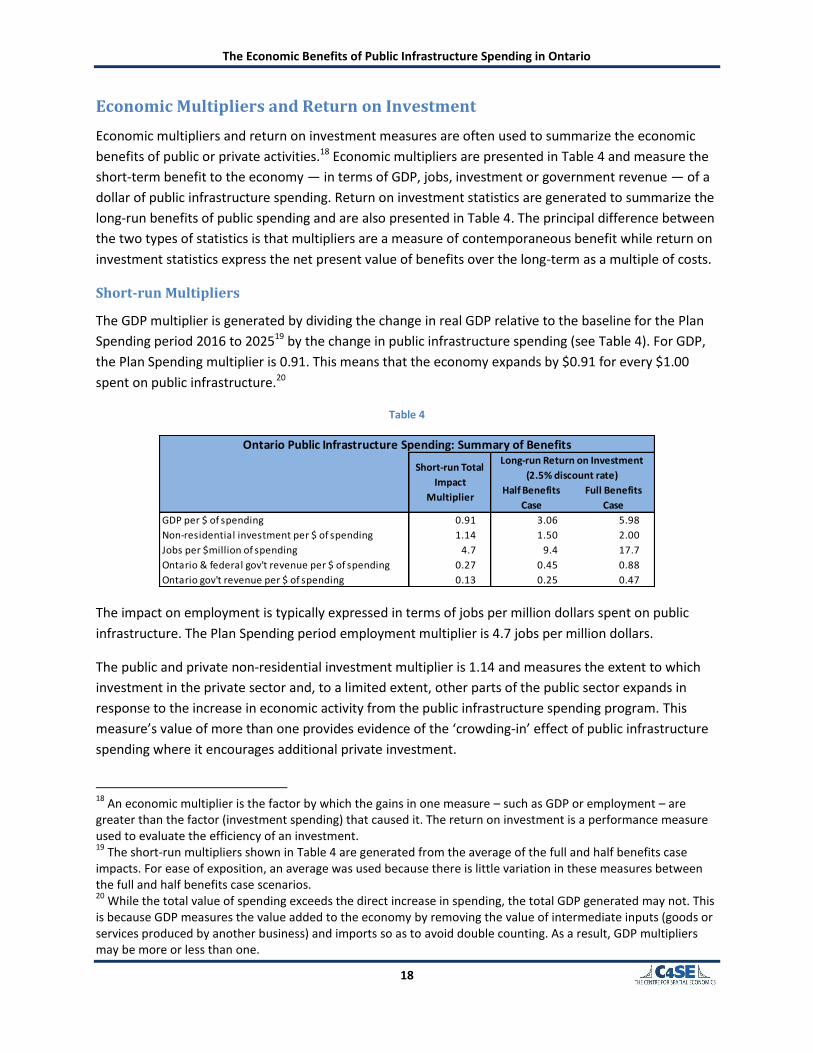
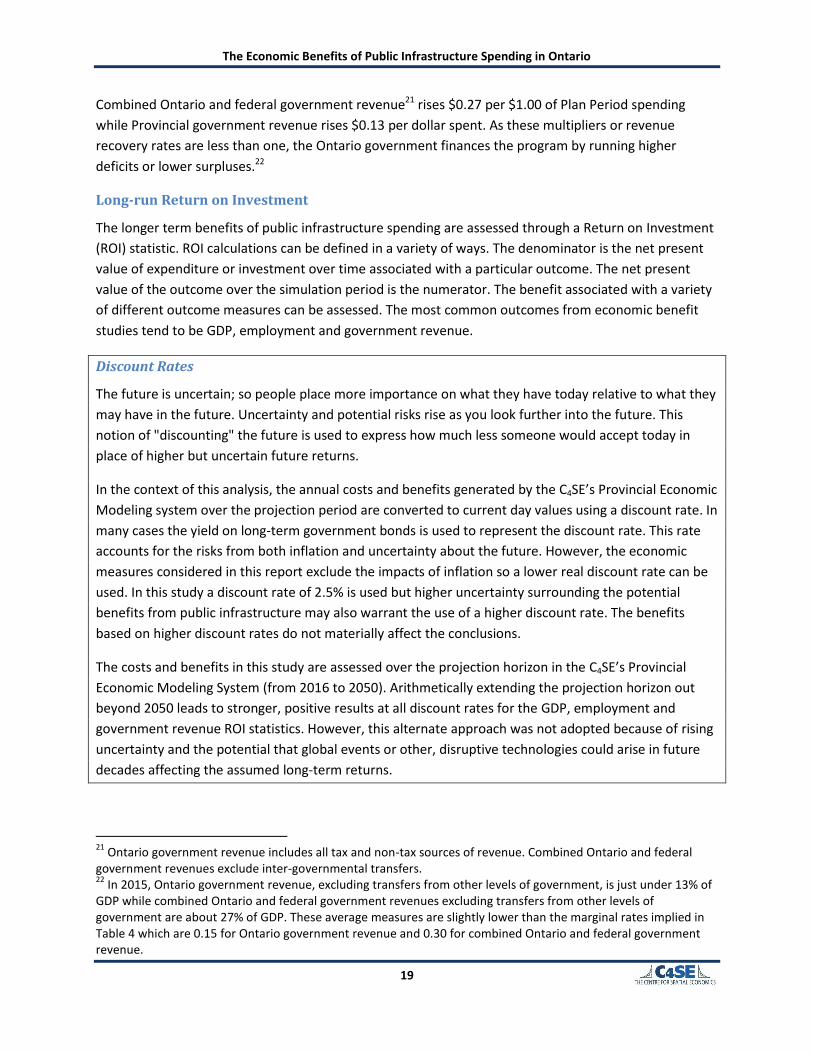
benefits of public or private activities.18 Economic multipliers are presented in Table 4 and measure the
short-term benefit to the economy — in terms of GDP, jobs, investment or government revenue — of a
dollar of public infrastructure spending. Return on investment statistics are generated to summarize the
long-run benefits of public spending and are also presented in Table 4. The principal difference between
the two types of statistics is that multipliers are a measure of contemporaneous benefit while return on
investment statistics express the net present value of benefits over the long-term as a multiple of costs.
Short-run Multipliers
The GDP multiplier is generated by dividing the change in real GDP relative to the baseline for the Plan
Spending period 2016 to 202519 by the change in public infrastructure spending (see Table 4). For GDP,
the Plan Spending multiplier is 0.91. This means that the economy expands by $0.91 for every $1.00
spent on public infrastructure.20
Table 4
The impact on employment is typically expressed in terms of jobs per million dollars spent on public
infrastructure. The Plan Spending period employment multiplier is 4.7 jobs per million dollars.
The public and private non-residential investment multiplier is 1.14 and measures the extent to which
investment in the private sector and, to a limited extent, other parts of the public sector expands in
response to the increase in economic activity from the public infrastructure spending program. This
measure’s value of more than one provides evidence of the ‘crowding-in’ effect of public infrastructure
spending where it encourages additional private investment.
18
An economic multiplier is the factor by which the gains in one measure – such as GDP or employment – are greater than the factor (investment spending) that caused it. The return on investment is a performance measure used to evaluate the efficiency of an investment. 19
The short-run multipliers shown in Table 4 are generated from the average of the full and half benefits case impacts. For ease of exposition, an average was used because there is little variation in these measures between the full and half benefits case scenarios. 20
While the total value of spending exceeds the direct increase in spending, the total GDP generated may not. This is because GDP measures the value added to the economy by removing the value of intermediate inputs (goods or services produced by another business) and imports so as to avoid double counting. As a result, GDP multipliers may be more or less than one.
Half Benefits
Case
Full Benefits
Case
GDP per $ of spending 0.91 3.06 5.98
Non-residential investment per $ of spending 1.14 1.50 2.00
Jobs per $million of spending 4.7 9.4 17.7
Ontario & federal gov't revenue per $ of spending 0.27 0.45 0.88
Ontario gov't revenue per $ of spending 0.13 0.25 0.47
Ontario Public Infrastructure Spending: Summary of BenefitsLong-run Return on Investment
(2.5% discount rate)Short-run Total
Impact
Multiplier
The Economic Benefits of Public Infrastructure Spending in Ontario
19
Combined Ontario and federal government revenue21 rises $0.27 per $1.00 of Plan Period spending
while Provincial government revenue rises $0.13 per dollar spent. As these multipliers or revenue
recovery rates are less than one, the Ontario government finances the program by running higher
deficits or lower surpluses.22
Long-run Return on Investment
The longer term benefits of public infrastructure spending are assessed through a Return on Investment
(ROI) statistic. ROI calculations can be defined in a variety of ways. The denominator is the net present
value of expenditure or investment over time associated with a particular outcome. The net present
value of the outcome over the simulation period is the numerator. The benefit associated with a variety
of different outcome measures can be assessed. The most common outcomes from economic benefit
studies tend to be GDP, employment and government revenue.
Discount Rates
The future is uncertain; so people place more importance on what they have today relative to what they
may have in the future. Uncertainty and potential risks rise as you look further into the future. This
notion of "discounting" the future is used to express how much less someone would accept today in
place of higher but uncertain future returns.
In the context of this analysis, the annual costs and benefits generated by the C4SE’s Provincial Economic
Modeling system over the projection period are converted to current day values using a discount rate. In
many cases the yield on long-term government bonds is used to represent the discount rate. This rate
accounts for the risks from both inflation and uncertainty about the future. However, the economic
measures considered in this report exclude the impacts of inflation so a lower real discount rate can be
used. In this study a discount rate of 2.5% is used but higher uncertainty surrounding the potential
benefits from public infrastructure may also warrant the use of a higher discount rate. The benefits
based on higher discount rates do not materially affect the conclusions.
The costs and benefits in this study are assessed over the projection horizon in the C4SE’s Provincial
Economic Modeling System (from 2016 to 2050). Arithmetically extending the projection horizon out
beyond 2050 leads to stronger, positive results at all discount rates for the GDP, employment and
government revenue ROI statistics. However, this alternate approach was not adopted because of rising
uncertainty and the potential that global events or other, disruptive technologies could arise in future
decades affecting the assumed long-term returns.
21
Ontario government revenue includes all tax and non-tax sources of revenue. Combined Ontario and federal government revenues exclude inter-governmental transfers. 22
In 2015, Ontario government revenue, excluding transfers from other levels of government, is just under 13% of GDP while combined Ontario and federal government revenues excluding transfers from other levels of government are about 27% of GDP. These average measures are slightly lower than the marginal rates implied in Table 4 which are 0.15 for Ontario government revenue and 0.30 for combined Ontario and federal government revenue.
The Economic Benefits of Public Infrastructure Spending in Ontario
20
The ROI statistics in this study show the net benefit to society from the public infrastructure spending
program. The first ROI statistic shows the discounted value of GDP, measured in 2015 dollars, per dollar
of funding (also expressed in 2015 dollars). The second statistic shows the discounted number of jobs
per million dollars of spending. The final ROI statistics shows the number of dollars of additional federal
(in Ontario) or combined provincial government revenue, expressed in 2015 dollars, per dollar spent.
Table 4 shows the ROI statistics associated with the full and half benefits public infrastructure spending
scenarios. The analysis reveals that:
o The overall ROI is expressed in terms of discounted GDP divided by discounted spending to build
and maintain the new public infrastructure. Discounting future costs and benefits by 2.5% yields
a ROI of between $3.06 and $5.98 per dollar of spending for the half and full benefits cases
respectively.
o A ROI can also be expressed in terms of jobs generated per $1 million of spending to build and
maintain new public infrastructure. The full benefits case generates 18 jobs per $1 million of
funding at a 2.5% discount rate but this falls to 9 jobs for the half benefits case.
o The return on public investment is expressed in terms of discounted government revenues
divided by discounted Plan and Post-plan spending to build and maintain the new public
infrastructure. Discounting future revenues and spending by 2.5% yields a combined Ontario
and federal government revenue ROI of $0.88 per dollar of spending and $0.47 of Ontario
government revenue per dollar of spending for the full benefits case. The ROI falls to $0.45 for
combined government revenue and $0.25 for provincial government revenue for the half
benefits case at a 2.5% discount rate.
A public infrastructure program does not ‘pay for itself’. Over the long-term, the Ontario government
will collect between $0.25 and $0.47 in revenue for every dollar it spends. When the revenue from the
federal government is included, it comes closer with between $0.45 and $0.88 in revenue collected for
every dollar spent by the Provincial government. The public infrastructure spending does, however,
stimulate private sector investment and generate significant increases in the province’s GDP and
productivity.
Results in Relation to Other Studies
As noted earlier, this study is not the first to estimate the economic benefits of public infrastructure
spending in Ontario. This section compares the results from this analysis with those published by the
Broadbent Institute (2015), two reports by the Conference Board of Canada (2010, 2013), the Canadian
Centre for Economic Analysis (2015) and, for an international perspective, one by the US Congressional
Budget Office (2016).
The C4SE’s study for the Broadbent Institute (2015) estimated the construction phase (short-term) GDP
multiplier for Ontario to be 1.15 with estimates for the other provinces ranging from 0.54 to 1.77. The
Conference Board of Canada (2010, 2013) estimated the short-term GDP multiplier to be 1.11 in a 2010
study and 1.14 in a 2013 study. The current estimate of 0.91 is within the range of possible multipliers
for the range of assets included in the Province’s infrastructure spending plan.
The Economic Benefits of Public Infrastructure Spending in Ontario
21
There are three basic reasons for the differences in estimated short-run multipliers: differences in model
history and forecast data (i.e. the economic environment), differences in model design, and differences
in program design including differences in asset mix, program duration and total spending. All three play
a role in the differences between the current results and those from the Broadbent Institute and the
Conference Board of Canada studies.
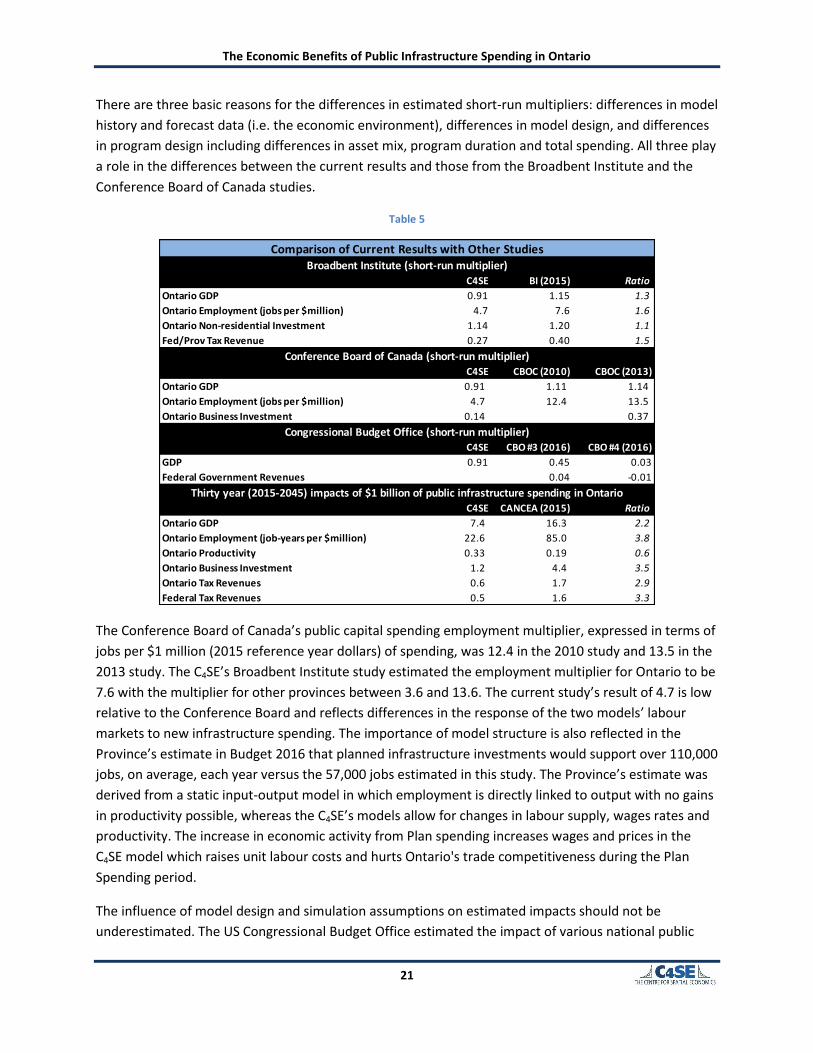
Table 5
The Conference Board of Canada’s public capital spending employment multiplier, expressed in terms of
jobs per $1 million (2015 reference year dollars) of spending, was 12.4 in the 2010 study and 13.5 in the
2013 study. The C4SE’s Broadbent Institute study estimated the employment multiplier for Ontario to be
7.6 with the multiplier for other provinces between 3.6 and 13.6. The current study’s result of 4.7 is low
relative to the Conference Board and reflects differences in the response of the two models’ labour
markets to new infrastructure spending. The importance of model structure is also reflected in the
Province’s estimate in Budget 2016 that planned infrastructure investments would support over 110,000
jobs, on average, each year versus the 57,000 jobs estimated in this study. The Province’s estimate was
derived from a static input-output model in which employment is directly linked to output with no gains
in productivity possible, whereas the C4SE’s models allow for changes in labour supply, wages rates and
productivity. The increase in economic activity from Plan spending increases wages and prices in the
C4SE model which raises unit labour costs and hurts Ontario's trade competitiveness during the Plan
Spending period.
The influence of model design and simulation assumptions on estimated impacts should not be
underestimated. The US Congressional Budget Office estimated the impact of various national public
C4SE BI (2015) Ratio
Ontario GDP 0.91 1.15 1.3
Ontario Employment (jobs per $million) 4.7 7.6 1.6
Ontario Non-residential Investment 1.14 1.20 1.1
Fed/Prov Tax Revenue 0.27 0.40 1.5
C4SE CBOC (2010) CBOC (2013)
Ontario GDP 0.91 1.11 1.14
Ontario Employment (jobs per $million) 4.7 12.4 13.5
Ontario Business Investment 0.14 0.37
C4SE CBO #3 (2016) CBO #4 (2016)
GDP 0.91 0.45 0.03
Federal Government Revenues 0.04 -0.01
C4SE CANCEA (2015) Ratio
Ontario GDP 7.4 16.3 2.2
Ontario Employment (job-years per $million) 22.6 85.0 3.8
Ontario Productivity 0.33 0.19 0.6
Ontario Business Investment 1.2 4.4 3.5
Ontario Tax Revenues 0.6 1.7 2.9
Federal Tax Revenues 0.5 1.6 3.3
Thirty year (2015-2045) impacts of $1 billion of public infrastructure spending in Ontario
Conference Board of Canada (short-run multiplier)
Congressional Budget Office (short-run multiplier)
Broadbent Institute (short-run multiplier)
Comparison of Current Results with Other Studies
The Economic Benefits of Public Infrastructure Spending in Ontario
22
infrastructure spending programs. Their analysis of deficit-financed infrastructure spending programs
yielded short-term GDP impact multipliers of between 0.03 and 0.45 compared to 0.91 in the current
study. In their model, public spending ‘crowds out’ a significant portion of private spending in the
economy.
The long-term impact of Ontario’s current infrastructure plan was also estimated by the Canadian
Centre for Economic Analysis (CANCEA 2015) using an agent-based modeling system. They reported a
$16.3 billion dollar increase in provincial GDP for each billion dollars of infrastructure spending over 30
years and remarked that this outcome results in ‘sticker shock’ when compared with other models. The
full benefits case scenario in this report yields an increase of up to $7.4 billion dollars of provincial GDP
per billion dollars of infrastructure spending over a similar period.
CANCEA’s model led to an increase in employment of 85,000 person-years per billion dollars of spending
compared to 23,000 from the full benefits case scenario over 30 years in the current study. CANCEA’s
increase in GDP and employment encourages business investment to rise $4.4 billion and Ontario’s
government revenues to grow $1.7 billion over 30 years compared to $1.2 billion and $0.6 billion
respectively from the full benefits case scenario.
Unfortunately, the range of economic impact results from public infrastructure spending remains
relatively large and open to debate. The C4SE believes that the current results are reasonable and
plausible, and while they may be conservative they are based on a comprehensive analysis of the
specific spending included in the Provincial infrastructure spending plan including information that was
not available to other researchers.

The Economic Benefits of Public Infrastructure Spending in Ontario
23
Other Benefits from Public Infrastructure
The analysis presented in this report represents only part of the benefits to the economy and society at
large thought to flow from public infrastructure. In particular, we have focused on the competitiveness
benefits to private industry from basic public infrastructure. These benefits were generated from Plan
Spending on engineering construction and transit-related spending on machinery and equipment. This,
however, excludes any benefits arising from: (i) externalities23 from this spending affecting other
sectors; or (ii) externalities from public spending on non-residential buildings, machinery and equipment
and intellectual property. While economic theory suggests that these other benefits exist, there is no
research available to help quantify their contribution to the economy.
Engineering construction and spending on transit-related machinery and equipment will confer benefits
to other sectors of the economy. For example, households will benefit from better transportation
networks. While there is extensive research examining links between transportation, the value of time
and the costs of congestion, pollution and greenhouse gas emissions, there are no reliable estimates of
the benefit of public spending. Transportation networks are also believed to boost productivity by
promoting the agglomeration or clustering of firms and skilled labour in an urban area. Better
transportation networks may also, however, encourage urban sprawl, leading to higher air pollution and
greenhouse gas emissions. The analysis in this paper captures some of these agglomeration benefits
through the cost-savings benefits to industry arising from enhanced transportation networks.
The benefits from a more educated labour force, better health care outcomes, more effective law
enforcement and fire protection are just some of the outcomes that can arise from public spending on
non-residential buildings and other assets to support the delivery of education, health and other public
services. These benefits could raise the supply of labour by allowing more people to stay at work or to
join the labour force which could further enhance productivity. There are, however, no reliable
estimates linking public infrastructure spending to these benefits.
There are also benefits that arise from public housing, public community centres, libraries, parks and
public spaces that enhance our quality of life. Quantifying these benefits, however, remains elusive for
an economic impact analysis.
23
In economics, an externality is a cost or benefit borne by one party that arises as a result of the actions of another party.
The Economic Benefits of Public Infrastructure Spending in Ontario
24
Summary and Observations
Ontario's 10-year public infrastructure spending plan can lay the foundation for future growth and
prosperity in this province. Productive public infrastructure reduces costs for private businesses;
providing a compelling case for public funding of this capital. The C4SE believes that the full benefits case
results, based on the cost elasticity estimates from Harchaoui and Tarkhani (2003), are credible and
represent the benefits that should accrue from spending on public infrastructure. But there is a risk that
a large infrastructure program could yield lower benefits, so that the half benefits case provides a
prudent lower-bound to the analysis.
The short-run economic benefits include a GDP multiplier of 0.91, 4.7 jobs generated per million dollars
spent, and $0.27 of government revenue recovered per dollar spent. Over the long-run, the return on
investment to GDP from spending on public capital, assuming a 2.5% discount rate, lies between 3.0 and
6.0 for the half and full benefits case scenarios. This means that every dollar invested in infrastructure
results in an increase of up to $6 in real GDP over the long-term. This result can justify the Province's 10-
year public infrastructure spending plan and still remains high when higher discount rates are assumed.
Total government revenue recovered is between $0.45 and $0.88 and provincial government revenue is
between $0.25 and $0.47 for the half and full benefits case scenarios helping to mitigate the long-run
fiscal impact.
Some critics may note that the long-run increase in employment of between 9 and 18 jobs generated
per million dollars spent on public capital is low and that the money would be better spent on other
priorities — or not spent at all. This result arises, in part, from the design of the C4SE's provincial
economic modeling system where changes in wage rates and migration force the unemployment rate to
adjust towards its natural rate over time.24 While employment gains may be limited, businesses are
more productive and competitive and workers earn higher real wages: up between 2.4% and 5.1% in the
Post-plan period on average in the half and full benefits case scenarios relative to the baseline.
The increase in public capital can also help achieve something else that has eluded policy makers in
Canada over the last few years: gains in private sector investment spending. A public infrastructure
program boosts private investment in both the near and long-term and can, therefore, play an
important role in contributing to an investment-led economic expansion.
In summary, the benefits of a public infrastructure spending program include:
o Higher private sector investment,
o A more productive economy, and
o A higher standard of living.
24
The natural rate of unemployment is the rate of unemployment that would exist without changes in the rate due to the economic cycle. It includes both structural (unemployment caused by forces other than the business cycle) and frictional (unemployment to facilitate job hunting) unemployment. The natural rate was not adjusted in this analysis to reflect potential benefits from public infrastructure spending because of a lack of research to help quantify an appropriate reduction. It should be noted, however, that the labour force participation rate rose in both the shock scenarios, relative to the baseline, as people were encouraged to work by higher real wage rates.
The Economic Benefits of Public Infrastructure Spending in Ontario
25
Although this study reports that significant economic benefits can be realized from the Province's public
infrastructure plan, spending on these assets is also required to achieve other social objectives that have
not been captured or quantified in this analysis. These benefits include those to households from lower
transportation congestion costs, improved business networking opportunities, reductions in pollution
and greenhouse gases, and societal gains from education, health care and other public assets.
In closing, this study also provides a cautionary tale for policy analysts. The costs of neglecting our public
infrastructure are not zero. As noted by Infrastructure Canada (2011), allowing our public infrastructure
to continue to decay imposes costs of at least equal but opposite consequence to the benefits estimated
in this study. The competitiveness of private businesses in Ontario are tied to the quality of our public
assets, especially given the shortfall of infrastructure investment in previous decades. Therefore, a
significant and sustained public infrastructure spending initiative is required if households and
businesses are to continue to enjoy a high standard of living.
The Economic Benefits of Public Infrastructure Spending in Ontario
26
References
Aschauer, D.A. 1989. “Is Public Expenditure Productive?” Journal of Monetary Economics 23(2): 177–
200.
Baldwin, J., W. Gu, and R. Macdonald. 2010. “Integrated Productivity Accounts: Contributions to the
Measurement of Capital.” The Canadian Productivity Review Catalogue no. 15-206-X, no. 027,
Economic Analysis Division. Ottawa: Statistics Canada.
Baldwin, J., H. Liu, and M. Tanguay. 2015. "An Update on Depreciation Rates for the Canadian
Productivity Accounts." The Canadian Productivity Review Catalogue no. 15-206-X, no. 039,
Economic Analysis Division. Ottawa: Statistics Canada.
Canadian Centre for Economic Analysis. 2015. "Investing in Ontario's Public Infrastructure: A Prosperity
at Risk Perspective with an Analysis of the Greater Toronto and Hamilton Area." Vaughan,
Ontario: Residential Civil Construction Alliance of Ontario.
Centre for Spatial Economics, The. 2015. "The Economic Benefits of Public Infrastructure Spending in
Canada." Ottawa: Broadbent Institute.
Conference Board of Canada, The. 2010. "The Economic Impact of Public Infrastructure in Ontario."
Ottawa: Conference Board of Canada.
Conference Board of Canada, The. 2013. "The Economic Impact of Ontario's Investment Program."
Ottawa: Conference Board of Canada.
Congressional Budget Office. 2016. "The Macroeconomic and Budgetary Effects of Federal Investment."
Washington, D.C: Congress of the United States.
Harchaoui, T.M., and F. Tarkhani. 2003. “Public Capital and its Contribution to the Productivity
Performance of the Canadian Business Sector.” Economic Analysis Research Paper Series
Catalogue no. 11F0027MIE, no. 017, Micro-Economic Analysis Division. Ottawa: Statistics
Canada.
Infrastructure Canada. 2011. “Building Canada Plan.” Ottawa: Infrastructure Canada. Retrieved June 9,
2015 from http://www.infrastructure.gc.ca/prog/doc/booklet-livret03-eng.html.
Macdonald, R. 2008. "An Examination of Public Capital's Role in Production." Economic Analysis
Research Paper Series Catalogue no. 11F0027M, no. 050, Micro-Economic Analysis Division.
Ottawa: Statistics Canada.
Nadiri, M.I., and T.P. Mamuneas. 1994. “Infrastructure and Public R&D Investments, and the Growth of
Factor Productivity in US Manufacturing Industries.” NBER Working Paper Series, W.P. #4845.
Ontario Ministry of Finance. 2016. "Jobs for Today and Tomorrow: 2016 Ontario Budget." Toronto:
Government of Ontario.

The Economic Benefits of Public Infrastructure Spending in Ontario
27
Ontario Ministry of Infrastructure. 2017. "2017 Infrastructure Update." Toronto: Government of
Ontario.
Wylie, P.J. 1996. “Infrastructure and Economic Growth, 1946–1991.” Canadian Journal of Economics,
XXIX, Special Issue, S350-S355.
The Economic Benefits of Public Infrastructure Spending in Ontario
28
Appendix A: Contribution of Public Capital at the Industry Level
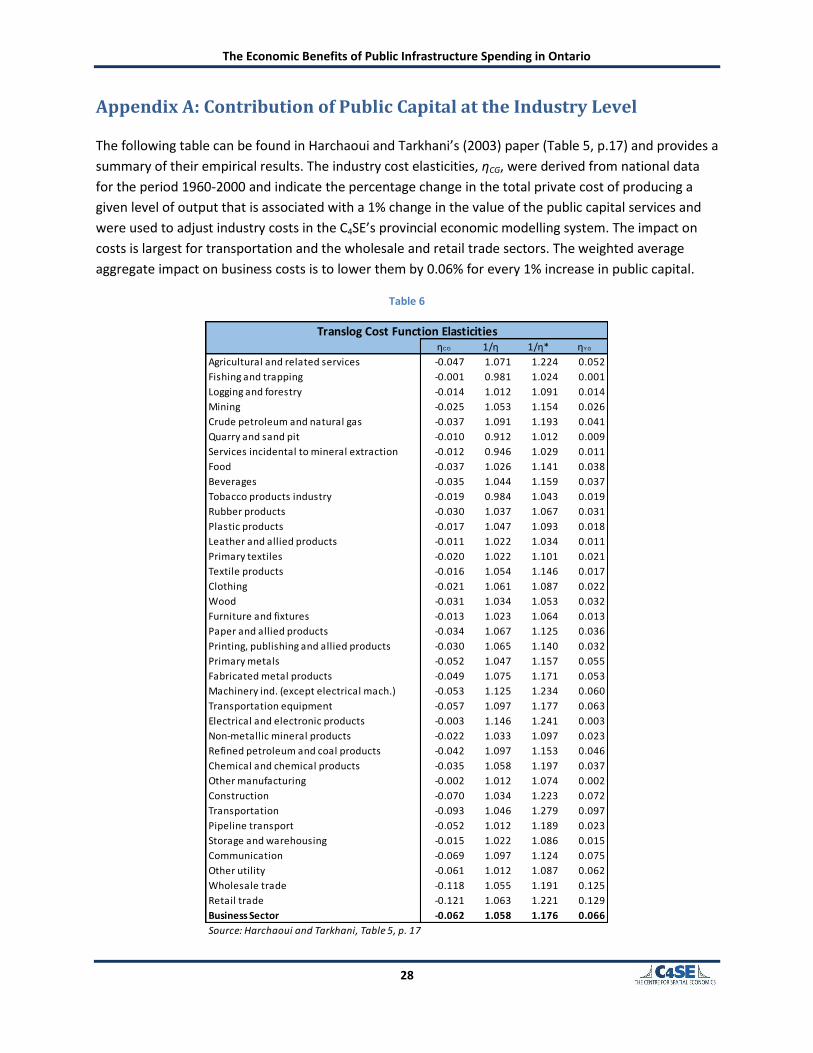
The following table can be found in Harchaoui and Tarkhani’s (2003) paper (Table 5, p.17) and provides a
summary of their empirical results. The industry cost elasticities, ηCG, were derived from national data
for the period 1960-2000 and indicate the percentage change in the total private cost of producing a
given level of output that is associated with a 1% change in the value of the public capital services and
were used to adjust industry costs in the C4SE’s provincial economic modelling system. The impact on
costs is largest for transportation and the wholesale and retail trade sectors. The weighted average
aggregate impact on business costs is to lower them by 0.06% for every 1% increase in public capital.
Table 6
ηCG 1/η 1/η* ηYG
Agricultural and related services -0.047 1.071 1.224 0.052
Fishing and trapping -0.001 0.981 1.024 0.001
Logging and forestry -0.014 1.012 1.091 0.014
Mining -0.025 1.053 1.154 0.026
Crude petroleum and natural gas -0.037 1.091 1.193 0.041
Quarry and sand pit -0.010 0.912 1.012 0.009
Services incidental to mineral extraction -0.012 0.946 1.029 0.011
Food -0.037 1.026 1.141 0.038
Beverages -0.035 1.044 1.159 0.037
Tobacco products industry -0.019 0.984 1.043 0.019
Rubber products -0.030 1.037 1.067 0.031
Plastic products -0.017 1.047 1.093 0.018
Leather and allied products -0.011 1.022 1.034 0.011
Primary textiles -0.020 1.022 1.101 0.021
Textile products -0.016 1.054 1.146 0.017
Clothing -0.021 1.061 1.087 0.022
Wood -0.031 1.034 1.053 0.032
Furniture and fixtures -0.013 1.023 1.064 0.013
Paper and allied products -0.034 1.067 1.125 0.036
Printing, publishing and allied products -0.030 1.065 1.140 0.032
Primary metals -0.052 1.047 1.157 0.055
Fabricated metal products -0.049 1.075 1.171 0.053
Machinery ind. (except electrical mach.) -0.053 1.125 1.234 0.060
Transportation equipment -0.057 1.097 1.177 0.063
Electrical and electronic products -0.003 1.146 1.241 0.003
Non-metallic mineral products -0.022 1.033 1.097 0.023
Refined petroleum and coal products -0.042 1.097 1.153 0.046
Chemical and chemical products -0.035 1.058 1.197 0.037
Other manufacturing -0.002 1.012 1.074 0.002
Construction -0.070 1.034 1.223 0.072
Transportation -0.093 1.046 1.279 0.097
Pipeline transport -0.052 1.012 1.189 0.023
Storage and warehousing -0.015 1.022 1.086 0.015
Communication -0.069 1.097 1.124 0.075
Other utility -0.061 1.012 1.087 0.062
Wholesale trade -0.118 1.055 1.191 0.125
Retail trade -0.121 1.063 1.221 0.129
Business Sector -0.062 1.058 1.176 0.066
Source: Harchaoui and Tarkhani, Table 5, p. 17
Translog Cost Function Elasticities

The Economic Benefits of Public Infrastructure Spending in Ontario
29
Note: ηCG is the private cost elasticity with respect to private capital; 1/η is the internal return to scale,
or the effect on output of a 1% increase in all inputs (private capital, labour and materials) except public
capital; 1/η* is the overall return to scale, or the effect on output of a 1% increase in all inputs including
public capital; ηYG is the marginal productivity of public capital, or the effect on output of a 1% increase
in public capital holding other inputs constant.

The Economic Benefits of Public Infrastructure Spending in Ontario
30
Appendix B: C4SE Provincial Economic Modeling System
The C4SE’s Provincial Modeling System is a dynamic, multi-sector, regional economic model of the
country. It includes a bottom-up set of macroeconomic models for the provinces, the territories and the
rest of the world with a national model that links economic activity in one region with activity in the
other regions through trade. The provincial models include detailed income and expenditure categories
and demographic and labour market information. The purpose of the modeling system is to produce
medium- to long-term projections of the provincial economies and conduct simulation studies that
require industry and demographic detail.
The multi-sector model, which incorporates the purchasing patterns from the current input-output
tables, captures the impact on the supply chain in terms of both output and employment. While this is
also a feature of static input-output models, the C4SE's Provincial Modeling System also captures the
impact on supplier’s investment decisions that occur as a result of the change in economic activity.
The model produces impacts on employment, labour income, value added output, productivity,
investment and exports for at least fourteen industry sectors (see list below). It also produces the
impacts on government revenue by level of government and source of revenue. The dynamic nature of
the model, however, makes it more challenging to develop a single summary measure that provides a
“rule-of-thumb” result. The need for such a measure is satisfied by generating an average impact over
several years of the simulation or, when appropriate, a Return on Investment statistic.
C4SE Model – Industry Sectors
Agriculture
Other Primary (detail varies by province)
Manufacturing (detail varies by province)
Construction
Utilities
Transportation & Warehousing
Wholesale & Retail Trade
Finance, Insurance & Real Estate
Professional, Scientific & Management Services
Accommodation & Food
Health Services
Other Services
Education Services
Government Services
The model incorporates policy responses to economic developments. In terms of monetary policy, the
Bank of Canada adjusts interest rates using a Taylor Rule reaction function that responds to inflation
relative to its target rate and the unemployment rate relative to the natural rate of unemployment. The
exchange rate reacts to Canada-US interest rate differentials and changes in the purchasing power parity
value of the dollar. In terms of fiscal policy, government spending is, for many categories, a function of
population, while government revenue reacts to changes in the tax base.
The following sections provide the reader with more information on the structure of the individual
provincial models and the national model that unites the provincial and territorial models.

The Economic Benefits of Public Infrastructure Spending in Ontario
31
Provincial Models
The provincial and territorial models are very similar in structure – the parameters in each model differ
to reflect differences in the economic experience of each region.
The provincial models are similar in nature to a general equilibrium model, but full product and factor
substitution is not implemented. At present, substitution is restricted to the energy products and value-
added. For purposes of manageability there is only one wage rate and one set of cost of capital
measures – construction and equipment – in the model. Changes in these measures of labour and
capital costs cause labour and capital intensities to change across all sectors of the economy.
The model's economy is organized into four broad sectors. Firms employ capital and labour to produce a
profit-maximizing output under a Cobb-Douglas constant-returns-to-scale technology. Households
consume the domestic and foreign products and supply labour under the assumption of utility
maximization. Governments purchase the domestic and foreign products and produce output.
Foreigners purchase the domestic product and supply the foreign product.
There are two main markets in the model. These markets correspond to the domestic and foreign
products and the labour market. Each of these markets is concerned with the determination of
demands, supplies, and prices. Like most sub-national models, the Ontario model assumes that most
prices are set in national markets. The presence of the national model in the system means that interest
rates, exchange rates and the price of some goods and services are affected by changes in economic
activity in Ontario and the rest of the country.
In sub-national economies, the movement of labour is a key factor in the adjustment of the local
economy to changes in economic conditions. The C4SE’s model allows net migration – and therefore the
total population – to adjust over time to reflect changes in economic conditions. If the economy and
employment is growing, then the demand for labour rises and net migration rises. This feature is an
important consideration when examining economic impacts over one or more decades.
National Model
The design of the national model is what makes the C4SE’s system unique. The national block adds up
the economic activity across the country and uses this information to help determine prices, interest
rates, exchange rates and the rest-of-country external demand for goods and services – all factors that
are exogenous to the other provincial modelling systems.
To see why this is important, consider an increase in one province’s economy. This raises that province’s
demand for imports. In this system each of the other provinces sees an increase in demand for their
exports to that province which, in turn, raises their own economies. The increase in economic activity
will put upward pressure prices, interest rates and the exchange rate. The entire national economy,
therefore, adjusts over time to the initial shock.
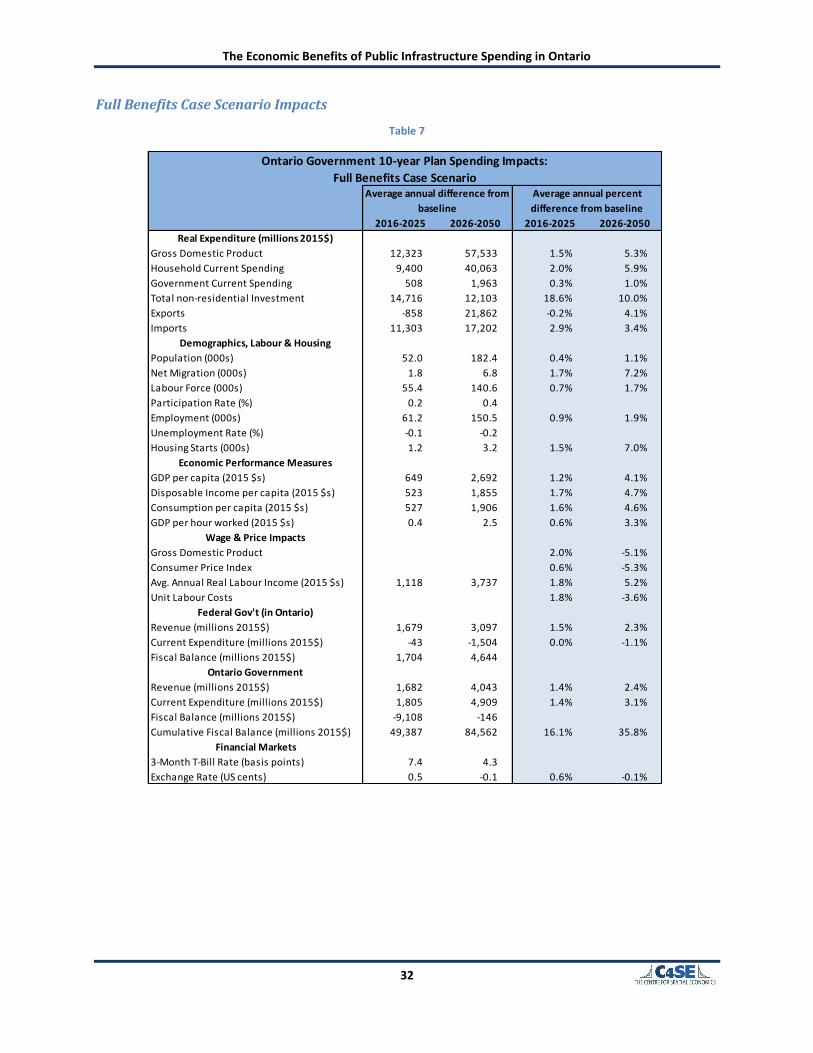
The Economic Benefits of Public Infrastructure Spending in Ontario
32
Full Benefits Case Scenario Impacts
Table 7
2016-2025 2026-2050 2016-2025 2026-2050
Real Expenditure (millions 2015$)
Gross Domestic Product 12,323 57,533 1.5% 5.3%
Household Current Spending 9,400 40,063 2.0% 5.9%
Government Current Spending 508 1,963 0.3% 1.0%
Total non-residential Investment 14,716 12,103 18.6% 10.0%
Exports -858 21,862 -0.2% 4.1%
Imports 11,303 17,202 2.9% 3.4%
Demographics, Labour & Housing
Population (000s) 52.0 182.4 0.4% 1.1%
Net Migration (000s) 1.8 6.8 1.7% 7.2%
Labour Force (000s) 55.4 140.6 0.7% 1.7%
Participation Rate (%) 0.2 0.4
Employment (000s) 61.2 150.5 0.9% 1.9%
Unemployment Rate (%) -0.1 -0.2
Housing Starts (000s) 1.2 3.2 1.5% 7.0%
Economic Performance Measures
GDP per capita (2015 $s) 649 2,692 1.2% 4.1%
Disposable Income per capita (2015 $s) 523 1,855 1.7% 4.7%
Consumption per capita (2015 $s) 527 1,906 1.6% 4.6%
GDP per hour worked (2015 $s) 0.4 2.5 0.6% 3.3%
Wage & Price Impacts
Gross Domestic Product 2.0% -5.1%
Consumer Price Index 0.6% -5.3%
Avg. Annual Real Labour Income (2015 $s) 1,118 3,737 1.8% 5.2%
Unit Labour Costs 1.8% -3.6%
Federal Gov't (in Ontario)
Revenue (millions 2015$) 1,679 3,097 1.5% 2.3%
Current Expenditure (millions 2015$) -43 -1,504 0.0% -1.1%
Fiscal Balance (millions 2015$) 1,704 4,644
Ontario Government
Revenue (millions 2015$) 1,682 4,043 1.4% 2.4%
Current Expenditure (millions 2015$) 1,805 4,909 1.4% 3.1%
Fiscal Balance (millions 2015$) -9,108 -146
Cumulative Fiscal Balance (millions 2015$) 49,387 84,562 16.1% 35.8%
Financial Markets
3-Month T-Bill Rate (basis points) 7.4 4.3
Exchange Rate (US cents) 0.5 -0.1 0.6% -0.1%
Average annual difference from
baseline
Average annual percent
difference from baseline
Ontario Government 10-year Plan Spending Impacts:
Full Benefits Case Scenario
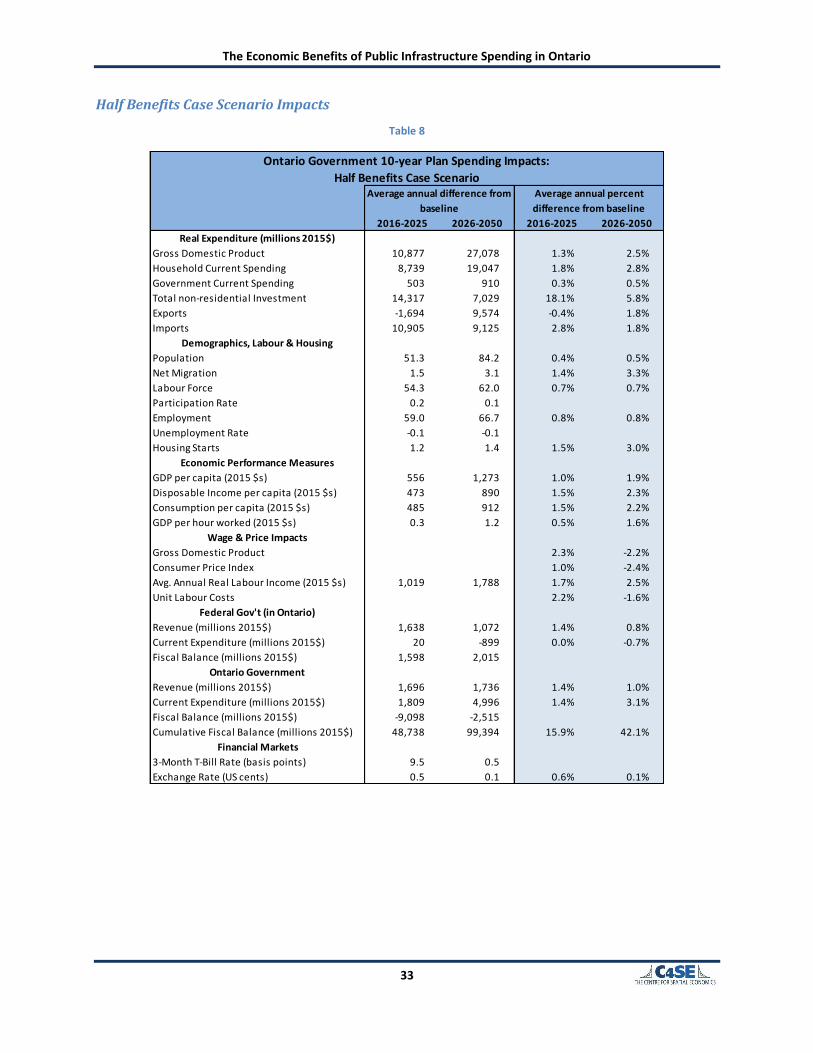
The Economic Benefits of Public Infrastructure Spending in Ontario
33
Half Benefits Case Scenario Impacts
Table 8
2016-2025 2026-2050 2016-2025 2026-2050
Real Expenditure (millions 2015$)
Gross Domestic Product 10,877 27,078 1.3% 2.5%
Household Current Spending 8,739 19,047 1.8% 2.8%
Government Current Spending 503 910 0.3% 0.5%
Total non-residential Investment 14,317 7,029 18.1% 5.8%
Exports -1,694 9,574 -0.4% 1.8%
Imports 10,905 9,125 2.8% 1.8%
Demographics, Labour & Housing
Population 51.3 84.2 0.4% 0.5%
Net Migration 1.5 3.1 1.4% 3.3%
Labour Force 54.3 62.0 0.7% 0.7%
Participation Rate 0.2 0.1
Employment 59.0 66.7 0.8% 0.8%
Unemployment Rate -0.1 -0.1
Housing Starts 1.2 1.4 1.5% 3.0%
Economic Performance Measures
GDP per capita (2015 $s) 556 1,273 1.0% 1.9%
Disposable Income per capita (2015 $s) 473 890 1.5% 2.3%
Consumption per capita (2015 $s) 485 912 1.5% 2.2%
GDP per hour worked (2015 $s) 0.3 1.2 0.5% 1.6%
Wage & Price Impacts
Gross Domestic Product 2.3% -2.2%
Consumer Price Index 1.0% -2.4%
Avg. Annual Real Labour Income (2015 $s) 1,019 1,788 1.7% 2.5%
Unit Labour Costs 2.2% -1.6%
Federal Gov't (in Ontario)
Revenue (millions 2015$) 1,638 1,072 1.4% 0.8%
Current Expenditure (millions 2015$) 20 -899 0.0% -0.7%
Fiscal Balance (millions 2015$) 1,598 2,015
Ontario Government
Revenue (millions 2015$) 1,696 1,736 1.4% 1.0%
Current Expenditure (millions 2015$) 1,809 4,996 1.4% 3.1%
Fiscal Balance (millions 2015$) -9,098 -2,515
Cumulative Fiscal Balance (millions 2015$) 48,738 99,394 15.9% 42.1%
Financial Markets
3-Month T-Bill Rate (basis points) 9.5 0.5
Exchange Rate (US cents) 0.5 0.1 0.6% 0.1%
Ontario Government 10-year Plan Spending Impacts:
Half Benefits Case ScenarioAverage annual difference from
baseline
Average annual percent
difference from baseline
Related Documents