The East Greenland Spill Jet as an important component of the Atlantic Meridional Overturning Circulation Wilken-Jon von Appen 1 *, Inga M. Koszalka 2 , Robert S. Pickart 3 , Thomas W. N. Haine 2 , Dana Mastropole 4 , Marcello G. Magaldi 2, 5 , Héðinn Valdimarsson 6 , James Girton 7 , Kerstin Jochumsen 8 , Gerd Krahmann 9 June 3, 2014 resubmitted to Deep Sea Research I *Corresponding author: Wilken-Jon von Appen, Am Handelshafen 12, 27570 Bremerhaven, Germany. Phone: +49-471-4831-2903. E-mail: [email protected] 1 Alfred Wegener Institute, Helmholtz Centre for Polar and Marine Research, Bremerhaven, Germany 2 Department of Earth and Planetary Sciences, Johns Hopkins University, Baltimore, Maryland, USA 3 Department of Physical Oceanography, Woods Hole Oceanographic Institution, Woods Hole, Mas- sachusetts, USA 4 MIT-WHOI Joint Program in Oceanography, Cambridge/Woods Hole, Massachusetts, USA 5 Institute of Marine Sciences, National Research Council, Lerici, La Spezia, Italy 6 Marine Research Institute, Reykjavík, Iceland 7 Applied Physics Laboratory, University of Washington, Seattle, Washington, USA 8 Institute of Oceanography, University of Hamburg, Hamburg, Germany 9 GEOMAR, Helmholtz Centre for Ocean Research, Kiel, Germany 1

Welcome message from author
This document is posted to help you gain knowledge. Please leave a comment to let me know what you think about it! Share it to your friends and learn new things together.
Transcript
The East Greenland Spill Jet as an important component of theAtlantic Meridional Overturning Circulation
Wilken-Jon von Appen1*, Inga M. Koszalka2, Robert S. Pickart3, Thomas W. N. Haine2,
Dana Mastropole4, Marcello G. Magaldi2,5, Héðinn Valdimarsson6, James Girton7, Kerstin
Jochumsen8, Gerd Krahmann9
June 3, 2014
resubmitted to Deep Sea Research I
*Corresponding author: Wilken-Jon von Appen, Am Handelshafen 12, 27570 Bremerhaven,
Germany. Phone: +49-471-4831-2903. E-mail: [email protected]
1Alfred Wegener Institute, Helmholtz Centre for Polar and Marine Research, Bremerhaven, Germany2Department of Earth and Planetary Sciences, Johns Hopkins University, Baltimore, Maryland, USA3Department of Physical Oceanography, Woods Hole Oceanographic Institution, Woods Hole, Mas-
sachusetts, USA4MIT-WHOI Joint Program in Oceanography, Cambridge/Woods Hole, Massachusetts, USA5Institute of Marine Sciences, National Research Council, Lerici, La Spezia, Italy6Marine Research Institute, Reykjavík, Iceland7Applied Physics Laboratory, University of Washington, Seattle, Washington, USA8Institute of Oceanography, University of Hamburg, Hamburg, Germany9GEOMAR, Helmholtz Centre for Ocean Research, Kiel, Germany
1

Abstract
The recently discovered East Greenland Spill Jet is a bottom-intensified current on the upper
continental slope south of Denmark Strait, transporting intermediate density water equa-
torward. Until now the Spill Jet has only been observed with limited summertime measure-
ments from ships. Here we present the first year-round mooring observations demonstrating
that the current is a ubiquitous feature with a volume transport similar to the well-known
plume of Denmark Strait overflow water farther downslope. Using reverse particle track-
ing in a high-resolution numerical model, we investigate the upstream sources feeding the
Spill Jet. Three main pathways are identified: particles flowing directly into the Spill Jet
from the Denmark Strait sill; particles progressing southward on the East Greenland shelf
that subsequently spill over the shelfbreak into the current; and ambient water from the
Irminger Sea that gets entrained into the flow. The two Spill Jet pathways emanating from
Denmark Strait are newly resolved, and long-term hydrographic data from the strait verifies
that dense water is present far onto the Greenland shelf. Additional measurements near the
southern tip of Greenland suggest that the Spill Jet ultimately merges with the deep portion
of the shelfbreak current, originally thought to be a lateral circulation associated with the
sub-polar gyre. Our study thus reveals a previously unrecognized significant component of
the Atlantic Meridional Overturning Circulation that needs to be considered to understand
fully the ocean’s role in climate.
Keywords: East Greenland Spill Jet, Denmark Strait Overflow Water, Atlantic
Meridional Overturning Circulation, Shelf Basin Interaction
1. Introduction1
Strong air-sea heat exchange in the Nordic Seas leads to the formation of dense water2
which is exported to the Atlantic Ocean through the Faroe Bank Channel and the Den-3
mark Strait. These overflows form the headwaters of the Deep Western Boundary Current4
Preprint submitted to Deep Sea Research I June 3, 2014

(DWBC) (Dickson and Brown, 1994), which constitutes the abyssal limb of the Atlantic5
Meridional Overturning Circulation (AMOC). The largest and densest overflow plume em-6
anates from Denmark Strait and entrains ambient water from the Irminger Sea. During this7
process energetic cyclones are formed that rapidly propagate with the overflow water south-8
ward along the East Greenland continental slope (Spall and Price, 1998; Käse et al., 2003;9
von Appen et al., 2014). Recently, a narrow current transporting intermediate density water10
equatorward was discovered inshore of the Denmark Strait overflow plume. This feature was11
termed the East Greenland Spill Jet (hereafter referred to simply as the Spill Jet), owing12
to the hypothesis that its formation is associated with dense water spilling off the shelf and13
forming a gravity current south of Denmark Strait (Pickart et al., 2005). Model simulations14
and subsequent observations support this hypothesis (Magaldi et al., 2011; Harden et al.,15
2014).16
[Figure 1 about here.]17
To date the Spill Jet has only been observed from a small number of quasi-synoptic ship-18
board velocity sections, all of them occupied during the summer months near 65◦N (labeled19
the “Spill Jet section”, Figure 1). From these limited data it has been suggested that the Spill20
Jet is located on the upper slope and transports between 3–7 Sv (1 Sv = 106 m3/s) equator-21
ward (Brearley et al., 2012). For the most part, its density is lighter than 27.8 kg/m3 (all22
densities in this paper are potential densities referenced to the surface), which is commonly23
taken as the upper limit of Denmark Strait overflow water (DSOW). However, hydrographic24
measurements (Rudels et al., 1999; Macrander et al., 2005; Brearley et al., 2012; Falina et al.,25
2012) and numerical simulations (Koszalka et al., 2013) suggest that dense water cascading26
off the shelf south of Denmark Strait can at times contribute to the deeper DSOW plume.27
Basic questions thus remain about the existence and importance of the Spill Jet and its28
relation to the circulation of the North Atlantic Ocean (Figure 1). After describing the data29
3
and methods employed in the study, we demonstrate the ubiquity of the Spill Jet, investigate30
its formation region and mechanisms, and close with an assessment of its contribution to31
the AMOC.32
2. Data and methods33
2.1. Mooring array34
Seven moorings were deployed along the Spill Jet section (named consecutively from35
“EG1” on the shelf in 248 m at 65◦30.0’N 33◦8.8’W to “EG7” on the slope in 1585 m at36
65◦7.3’N 32◦41.1’W, Figure 1) from 4 Sep 2007 – 4 Oct 2008 (von Appen et al., 2014).37
The moorings contained conductivity-temperature-depth (CTD) moored profilers operating38
between the bottom and ≈100 m depth. On the outer three moorings (EG5–7) the profilers39
included an acoustic current meter. Acoustic Doppler current profilers (ADCPs) measured40
velocity on all moorings between ≈100 m and the surface, and also between ≈100 m and the41
bottom on the inner four moorings (EG1–4). Some of the moored profilers stopped working42
prematurely, but the mean section is robust (see von Appen, 2012).43
The dominant signal in the mooring records was the passage of Denmark Strait Overflow44
Water (DSOW) cyclones every few days. These features contain lenses of dense overflow45
water on the bottom with a strong azimuthal flow in the water column above (von Appen46
et al., 2014). We identified the DSOW cyclone passages based on a set of criteria involv-47
ing their velocity signal (translational and azimuthal), their density signature (presence of48
anomalously dense water), and mooring motion (the strong flow near the centers of the49
cyclones resulted in mooring blow-down). It was found that the influence of the cyclones50
extended less than 18 hours before and after their centers passed by the array. In order to51
isolate the Spill Jet signature, we identified the time periods when cyclones were present52
and excluded them from consideration. The mean potential density section in the absence53
of cyclones (≈ 35% of the record) was computed using a Laplacian spline interpolator with54
4

tension (Pickart and Smethie, 1998). Thermal wind was used to provide the geostrophic55
shear which was referenced to the mean cyclone-free along-slope velocities at the moorings56
(in the middle of the water column, the velocity records are complete enough to calculate57
the means). This absolute geostrophic velocity was then gridded with the same spline in-58
terpolator. The standard error of the Spill Jet transport is estimated using an integral time59
scale of several hours (von Appen et al., 2014). At least 25 independent realizations went60
into the Spill Jet quantification and most locations are defined by many more realizations.61
Dividing the standard deviation by the square root of the minimum number of degrees of62
freedom gives a standard error of <0.7 Sv. Instrument errors, assumed uncorrelated across63
the array, add <0.1 Sv uncertainty (Nikolopoulos et al., 2009).64
2.2. Hydrographic sections65
We use a collection of 109 CTD sections occupied between 1990 and 2012 along the66
“Látrabjarg section” (66◦46.0’N 29◦45.8’W to 65◦29.1’N 25◦35.9’W) across Denmark Strait67
(Figure 1). A detailed list of the individual occupations at the Látrabjarg section is given68
in Table 1. Not all occupations cover the entire section, but a sensitivity test indicated that69
this does not qualitatively change the mean. Each section was interpolated onto a standard70
grid with the same horizontal and vertical resolution (2.5 km and 10 m, respectively) using71
a Laplacian spline interpolator with tension (Pickart and Smethie, 1998). We also use a72
collection of 36 CTD sections in the vicinity of the WOCE A1E/AR7E line (marked as73
“Cape Farewell section” in Figure 1) occupied between 1991 and 2007. These sections are74
detailed in Table 1 of Våge et al. (2011). The absolute geostrophic velocity at the Cape75
Farewell section was referenced using AVISO absolute sea surface height data, the accuracy76
of which was assessed using available shipboard ADCP data (see Våge et al., 2011).77
[Table 1 about here.]78
5

2.3. Numerical circulation model79
A hydrostatic version of the Massachusetts Institute of Technology general circulation80
model (MITgcm) is used. The configuration has a horizontal grid spacing of 2 km and81
210 levels in the vertical (grid cell height ranging from 2 m at the surface to 15 m at depths82
greater than 100 m). There are three open boundaries (69.8◦N, 10.2◦W, and 60.3◦N); the83
western boundary is closed at the east coast of Greenland. The boundary conditions for84
hydrography and velocity are obtained from the 1/12◦ resolution North-Atlantic non-tidal85
experiment of the Hybrid Coordinate Ocean Model (HYCOM) (Chassignet et al., 2009).86
No-slip conditions are applied to all material boundaries. The NCEP reanalysis (Kalnay87
et al., 1996) provides the atmospheric forcing. The simulation spans the summer of 200388
(1 July – 15 Oct). The model uses partial bottom cells and a rescaled height coordinate89
(Adcroft and Campin, 2004) to accurately simulate the boundary current on the continental90
slope in the Irminger Basin. It also features a nonlinear free surface, a flow-dependent Leith91
biharmonic viscosity, a third-order advection scheme with zero explicit diffusivity for tracers,92
and vertical mixing using the K-profile parameterization (Large et al., 1994).93
2.4. Lagrangian particle model94
Lagrangian particles are deployed in the numerical circulation model at the Spill Jet95
section and their trajectories are simulated offline using the three-dimensional velocity fields96
from the model (see Koszalka et al., 2013, for a detailed validation of this method). The97
code uses a trapezoidal solver with a 2nd-order predictor and 3rd-order corrector scheme.98
At boundaries, the normal velocity component of the particle vanishes and the particle99
slides freely. At each time step, the velocity is linearly interpolated to the particle positions.100
The time series of temperature and salinity along the trajectories are obtained by linear101
interpolation at each time step. Previous use of this trajectory scheme has resulted in102
favorable comparisons to observations (Koszalka et al., 2013).103
6

3. The ubiquitous East Greenland Spill Jet104
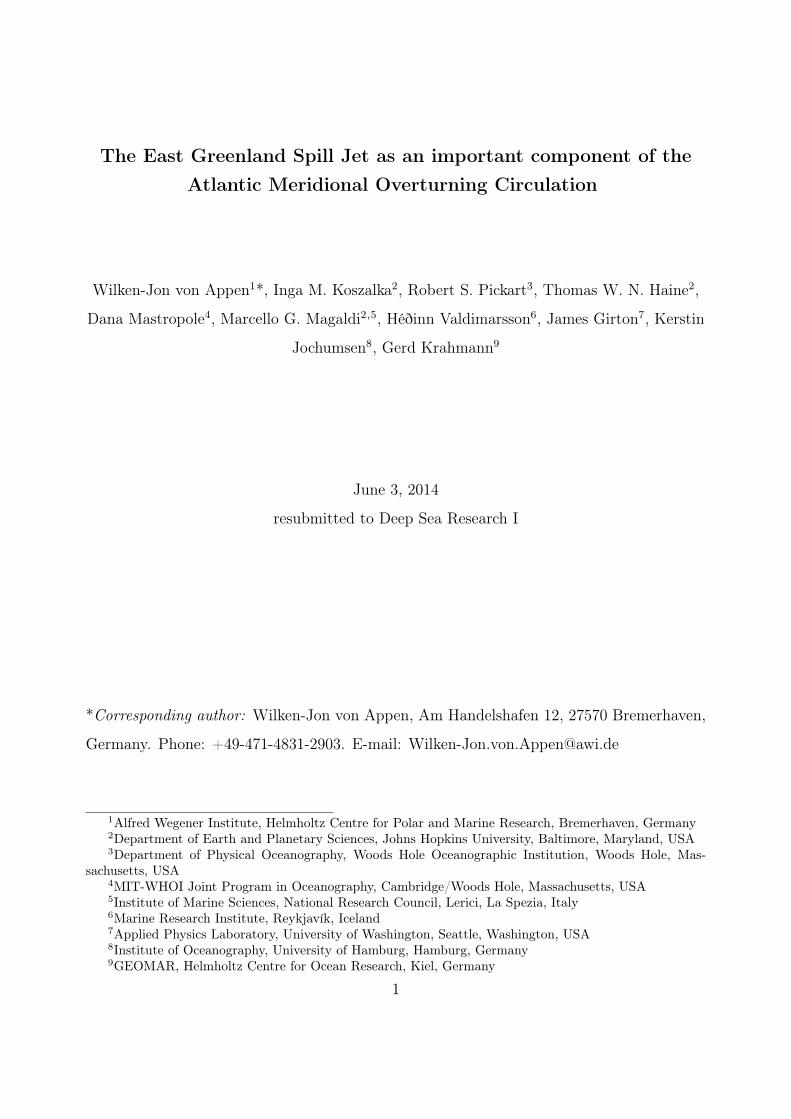
In the absence of the DSOW cyclones, the Spill Jet is clearly revealed in the composite105
mean absolute geostrophic velocity section (Figure 2a; the absolute geostrophic velocity is106
qualitatively the same as the direct velocity measurements where they exist). This is the107
first robust, long-term evidence of the Spill Jet and firmly establishes it as a ubiquitous108
feature of the circulation south of Denmark Strait. The mooring observations were also109
averaged over shorter time periods and no discernible seasonal differences were found, which110
is similar to the lack of seasonality in DSOW cyclone properties observed at the same111
location (von Appen et al., 2014). The isopycnals in the year-long mean section are banked112
strongly upwards toward the slope and the associated thermal wind shear results in a strong,113
bottom-intensified flow reaching 0.45 m/s at 700 m depth. For the present study we define114
the Spill Jet as the deep flow within 28 km of the shelfbreak (offshore of this distance, the115
velocities are very small) in the density range 27.6–27.8 kg/m3 (Figure 2a). The choice of116
the upper isopycnal distinguishes the Spill Jet from the warm and salty shallow flow of the117
East Greenland / Irminger Current (EGC/IC), while the lower isopycnal separates the Spill118
Jet from the DWBC that transports DSOW. We note that this density range is within the119
southward flowing component of the AMOC (Holliday et al., 2009; Lherminier et al., 2010;120
Sarafanov et al., 2012).121
[Figure 2 about here.]122
As noted earlier, there is evidence that dense water from the shelf can sometimes feed the123
upper part of the DWBC, and our mean section is consistent with this as well (the offshore,124
deepest part of the velocity signal is denser than 27.8, Figure 2a). Hence it is difficult to125
define the boundary between the Spill Jet and the DWBC unambiguously. However, the126
bulk of the DSOW at the Spill Jet section is located seaward of the 1200 m isobath and127
coincides with a clear (distinct) velocity signal of the DWBC (Dickson and Brown, 1994;128
7

Brearley et al., 2012; Koszalka et al., 2013). Thus, using the 27.8 isopycnal for the lower limit129
of the Spill Jet allows us to distinguish it from the deep plume of overflow water emanating130
from Denmark Strait. With these bounds, we estimate the mean transport of the Spill Jet as131
the sum of the calculated along-slope absolute geostrophic velocities as shown in Figure 2a.132
It is 3.3±0.7 Sv of intermediate-density water flowing equatorward. This value is in the133
lower range of previous synoptic estimates (Brearley et al., 2012), but it is two-thirds as134
large as the transport (≈5 Sv) of the DWBC at this latitude (Dickson and Brown, 1994).135
We note that even when DSOW cyclones are present, an average background flow exists136
that is consistent in magnitude and structure with the Spill Jet in Figure 2a (von Appen137
et al., 2014; Magaldi et al., 2011). As such, we assume that the above transport estimate138
applies to the year-long record.139
The regional numerical model employed here has been used previously to study the East140
Greenland boundary current system in summer 2003 (Magaldi et al., 2011; Koszalka et al.,141
2013). The earlier studies demonstrated that the model’s deep circulation both from a142
Eulerian and Lagrangian perspective is realistic, and its hydrographic properties agree with143
shipboard observations from summer 2003. In the present study this same simulation is144
used to investigate aspects of the Spill Jet that cannot be addressed with the mooring data.145
Note that we are not attempting to simulate the precise conditions measured by the array146
deployed from 2007–2008. Rather, we aim to shed light on the physical processes and basic147
circulation. The model-data comparisons below thus focus on the general characteristics148
and statistics of the flow, seeking qualitative agreement.149
Consistent with our mooring records, the flow along the continental slope in the model150
south of the strait is dominated by the passage of DSOW cyclones (Magaldi et al., 2011).151
To isolate the signal of the Spill Jet in the model, we therefore implemented the same152
procedure for identifying cyclones and constructed the corresponding composite mean section153
of absolute geostrophic velocity in the absence of these features (Figure 2b). The Spill Jet154
8

is clearly captured by the model. In light of the fact that the observations span a full year155
and the model covers only three months (during a different year), the qualitative agreement156
between the two mean sections is impressive. In both cases the Spill Jet is bottom intensified,157
with its core on the upper continental slope, and the isopycnals are banked strongly upwards158
toward the shelfbreak. As in the observations, the velocity core in the model is comprised159
of water that is lighter than DSOW. The flow in the model is, however, generally faster160
than the mooring observations. Choosing the same isopycnal range of 27.6–27.8 for the161
model Spill Jet results in a transport roughly a factor of two larger than the observations.162
Possible reasons for this difference, such as interannual variability in the Denmark Strait163
overflow, variability in the wind stress associated with different phases of the North Atlantic164
Oscillation, and the influence of the model boundary conditions, were investigated. However,165
none of these can explain the difference in the Spill Jet transport between the data and the166
model.167
4. Formation of the Spill Jet168
The traditional view of the DSOW is that it flows through the deepest part of the169
Denmark Strait sill and forms a plume that descends the continental slope and feeds the170
DWBC (Smith, 1975; Price and O’Neil Baringer, 1994). Our long-term measurements of171
the Spill Jet advecting intermediate density water to the south—inshore of the overflow172
plume—thus begs the question: What is the origin of this water (which at times can be173
denser than 27.8)? The flow through Denmark Strait is known to be highly turbulent and174
energetic on timescales of a few days (Macrander et al., 2005; Haine, 2010; Jochumsen et al.,175
2012). This makes it difficult to characterize the flow and the water masses in the strait using176
synoptic shipboard sections, and no mooring arrays have been deployed across the entire177
strait. In order to smooth out the mesoscale variability, we gathered all known shipboard178
hydrographic sections near the sill and constructed a mean transect across the strait. The179
9

mean section along the Látrabjarg section (Figure 3), consists of 109 crossings occupied in180
all seasons spanning the time period 1990–2012.181
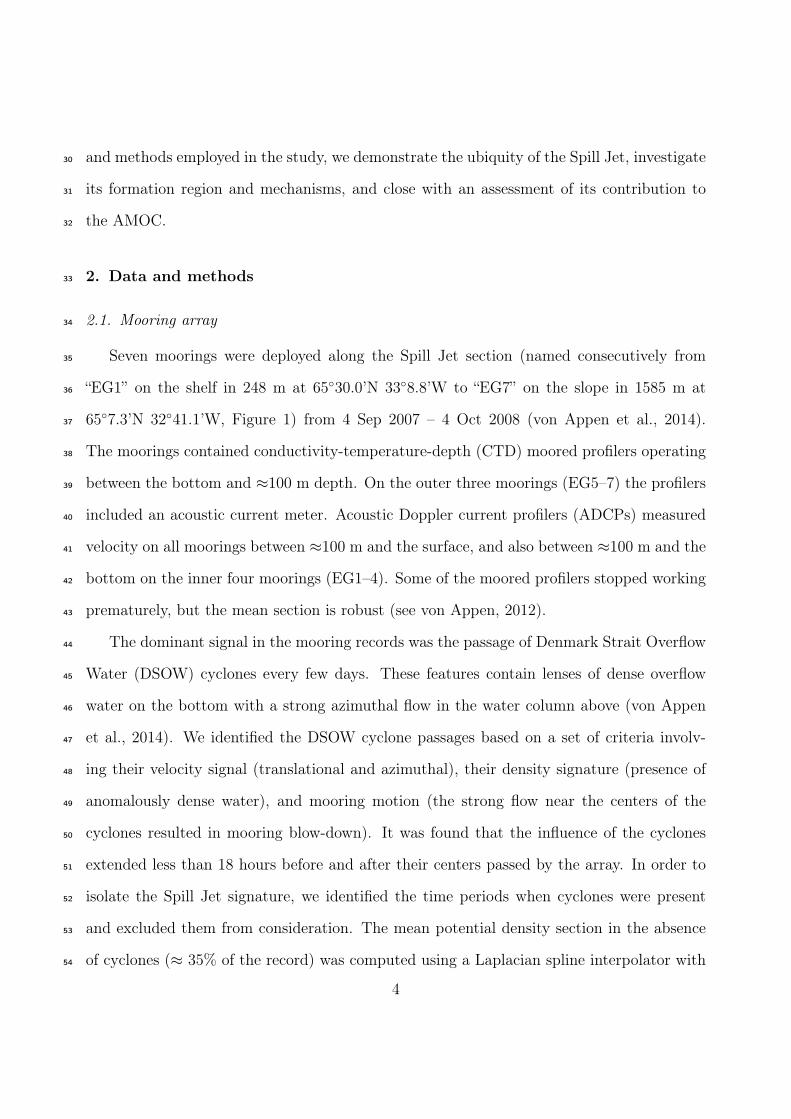
[Figure 3 about here.]182
The presence of the dense DSOW is clearly seen in the mean section, banked against the183
western side of the deepest part of the Denmark Strait sill (Figure 3). The strong isopycnal184
tilt implies increased southward speed of the overflow water with depth at this location.185
These aspects of the DSOW are not particularly surprising. However, while DSOW has186
previously been observed on the shelf in individual synoptic transects (Macrander et al., 2005;187
Jochumsen et al., 2012), our mean hydrographic section (Figure 3) robustly demonstrates188
the presence of dense water >27.8 far onto the East Greenland shelf in a layer roughly189
100 m thick (even the 27.9 isopycnal is found shoreward of the shelfbreak). Dense water190
on the shelf was seen in all sections that extended far onto the shelf (Figure 3). Since the191
seasonal cycle of temperature and density in the dense water of Denmark Strait is small192
(0.09◦C and 0.007 kg/m3, respectively; Jochumsen et al., 2012), possible seasonal biases in193
the CTD occupations on the East Greenland shelf do not change this picture significantly.194
This implies that some of the water in the DSOW density range exiting the Nordic Seas195
west of Iceland does not feed the traditional plume of overflow water stemming from the sill.196
In light of the evidence noted above regarding off-shelf transport of dense water south of197
Denmark Strait, one then wonders if the dense water on the shelf in the Látrabjarg section198
contributes to the Spill Jet.199
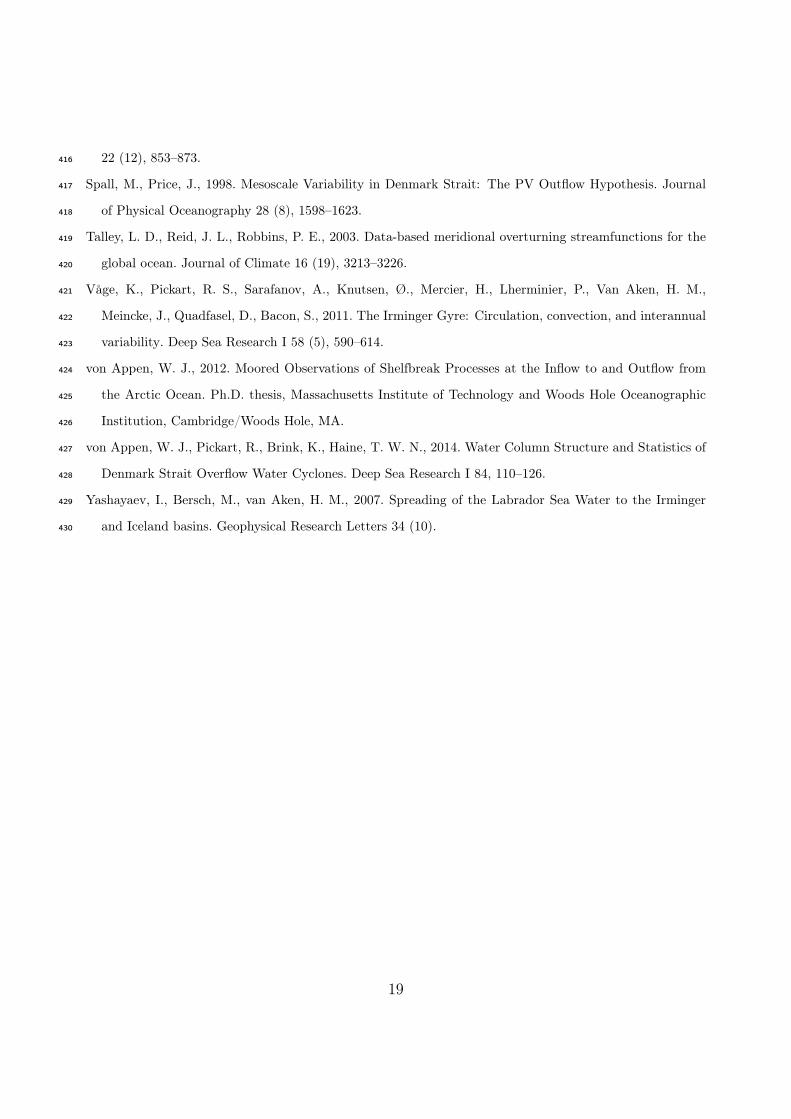
[Figure 4 about here.]200
[Figure 5 about here.]201
To investigate this, particles were released at the Spill Jet section in the numerical202
model and tracked backwards in time. Previous studies (Magaldi et al., 2011; Koszalka203
10

et al., 2013), in conjunction with the favorable model/data comparison of the Spill Jet in204
Figure 2, give us confidence that the model accurately represents the physical processes in205
the Irminger Sea and can be used to investigate the formation pathways of the Spill Jet. The206
numerical particles were deployed within the current (Figure 4) at times mid-way between207
the passage of consecutive DSOW cyclones. We use the seven independent deployment208
times between 10 Sep and the end of the simulation (15 Oct). In total, 1157 particles were209
released and tracked backwards in time until the particle either left the model domain or210
until the beginning of the model run (resulting in a tracking duration up to 71 days). The211
results do not change qualitatively after 20 days of tracking duration, demonstrating that the212
duration of our simulation is sufficient. Supplementary Movie 1 shows a three dimensional213
view of the particles moving through the model domain, and Figure 5 shows the locations214
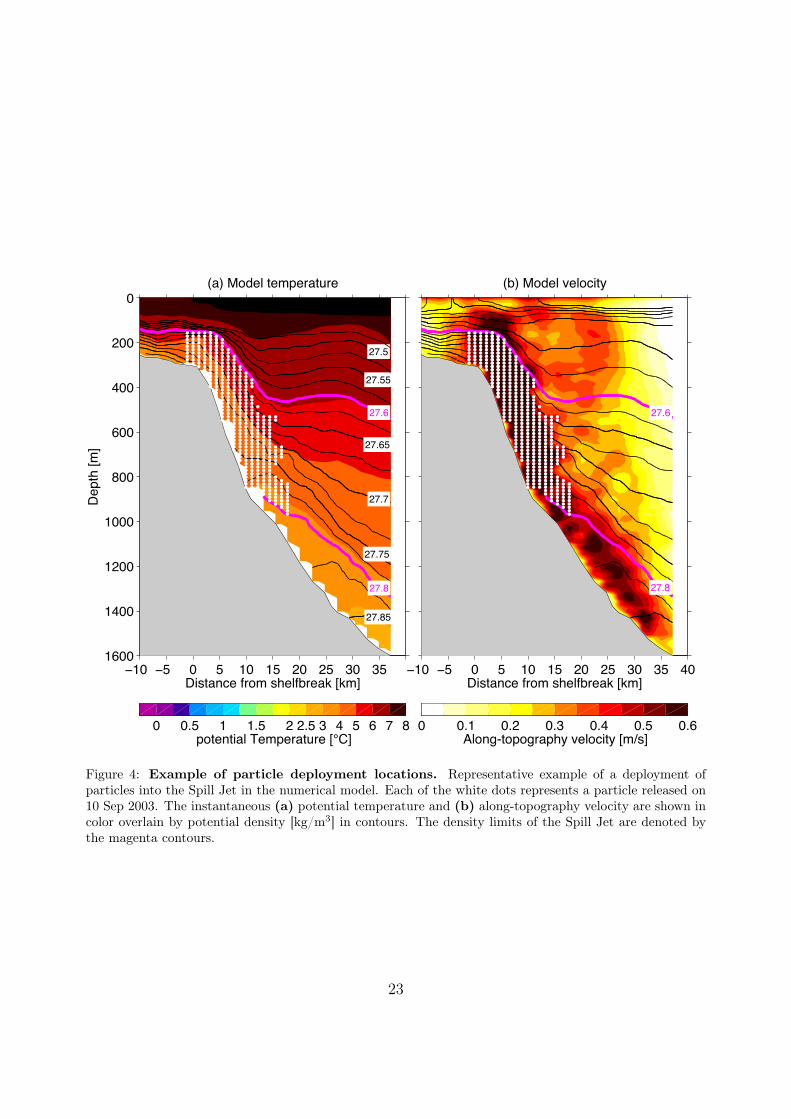
of the particles ten days prior to arriving at the Spill Jet section. In general, three main215
pathways contributing to the Spill Jet became apparent, which are highlighted in Figure 6216
as “pathway groups”. Blue particles cross the Látrabjarg section through the deepest part217
of the Denmark Strait sill (>350 m bottom depth, indicated by the yellow line segment in218
Figure 6) and never visit the East Greenland shelf. This is called the SILL-DIRECT group.219
Green particles spend time on the Greenland shelf and begin the simulation either upstream220
of the Látrabjarg section or downstream of it on the shelf. This is the EG SHELF group.221
Lastly, red particles start in the Irminger Basin and cross the zonal section indicated in222
Figure 6. This is the IRMINGER BASIN group. The trajectories of three typical particles223
from each of these groups are shown in Figure 7.224
[Figure 6 about here.]225
[Figure 7 about here.]226
The main conclusions from the reverse particle tracking are summarized in Figure 8.227
About 11% of the particles (the SILL-DIRECT group) follow a direct pathway along the228
11

continental slope from the deepest part of Denmark Strait to the Spill Jet section (Figure 8a),229
taking a median time of 8 days to travel the 280 km distance. These particles begin their230
trajectories in the Iceland Sea northeast of Denmark Strait, entering the strait along either231
the Iceland slope or the Greenland slope. Their density is reduced from >28 in the vicinity232
of the strait to values around 27.7 near 65◦N (Figure 8b). This pathway group indicates233
that the Spill Jet contains water that is in the traditional DSOW density range at the234
Denmark Strait sill. Hence, a portion of this water does not participate in the deep plume235
that descends the continental slope immediately south of the strait, but instead feeds the236
Spill Jet higher on the slope.237
[Figure 8 about here.]238
Approximately 19% of the particles (the EG SHELF group) begin the simulation on239
the East Greenland shelf and/or north of the Látrabjarg section and at some point cascade240
off the shelf into the Spill Jet. The residence time on the shelf varies from days to weeks,241
and about 15% of these particles spend the entire simulation on the shelf prior to spilling242
near 65◦N (Figure 8a). A complex flow pattern on the shelf is evident in Figure 6, with243
many particles circulating around the deep Kangerdlugssuaq Trough. The off-shelf spilling244
pathway revealed by these particles supports recent observational (Harden et al., 2014) and245
numerical (Magaldi et al., 2011; Koszalka et al., 2013) results, and is consistent with the246
presence of dense water on the shelf in our mean Látrabjarg hydrographic section (Figure 3).247
However, the EG SHELF particle group also indicates that some of the dense water passing248
through the deepest part of Denmark Strait undergoes excursions onto the shelf downstream249
of the sill, and subsequently cascades back off the shelf at some later time into the Spill Jet.250
Most of the EG SHELF particles become less dense as they enter the Spill Jet (Figure 8b),251
but a small portion becomes heavier, presumably by mixing with dense water from the direct252
slope pathway noted above.253
12

Finally, the numerical model suggests that the majority of the water in the Spill Jet,254
about 70%, originates from the Irminger Basin (the IRMINGER BASIN group, Figure 8a).255
This underscores the importance of entrainment in setting the transport and final water256
properties of the Spill Jet. However, while water from the Irminger Basin makes up the257
majority of the volume in the Spill Jet, the other two origin groups provide the excess den-258
sity required for the dynamical processes leading to the formation of the Spill Jet. This259
is consistent with previous studies (e.g. Pickart et al., 2005; Falina et al., 2012) that em-260
phasized the importance of the dense water sources without exploring the sources of the261
entrained water in detail. It is also consistent with observations indicating that the Spill262
Jet is characterized by low Richardson numbers indicative of strong mixing (Brearley et al.,263
2012). According to the model, the density of the IRMINGER BASIN particles increases264
on average by 0.1 kg/m3 as they enter the Spill Jet (Figure 8b). The IRMINGER BASIN265
particles originate from the warm, salty Irminger Current along the northwest flank of the266
Reykjanes Ridge in water depths less than 2200 m (Figure 6) at a depth horizon of approx-267
imately 750 m (not shown). The stratification and temperature-salinity properties in this268
region are distinct from the interior Irminger Sea (Pickart et al., 2003, 2005), which is partly269
filled with weakly stratified Labrador Sea Water (LSW) formed by open ocean convection270
(Pickart et al., 2003; Yashayaev et al., 2007). Consequently, we conclude that appreciable271
amounts of LSW are not entrained into the Spill Jet.272
5. Fate of the Spill Jet and its role in the large-scale circulation273
The observations and modeling presented here of a ubiquitous Spill Jet on the upper274
continental slope south of Denmark Strait have quantified a new component of the boundary275
current system of the northern Irminger Sea. An obvious next question is, what is the fate of276
the >3 Sv of intermediate density water transported southward by the Spill Jet and hence277
how does the Spill Jet fit into the regional circulation of the Irminger Sea? To address278
13

this, we make use of the previously constructed mean hydrographic/velocity section of 36279
shipboard crossings of the boundary current system near Cape Farewell, Greenland (Våge280
et al., 2011) (Figure 1). We note that the DSOW cyclones do not reach this latitude (Våge281
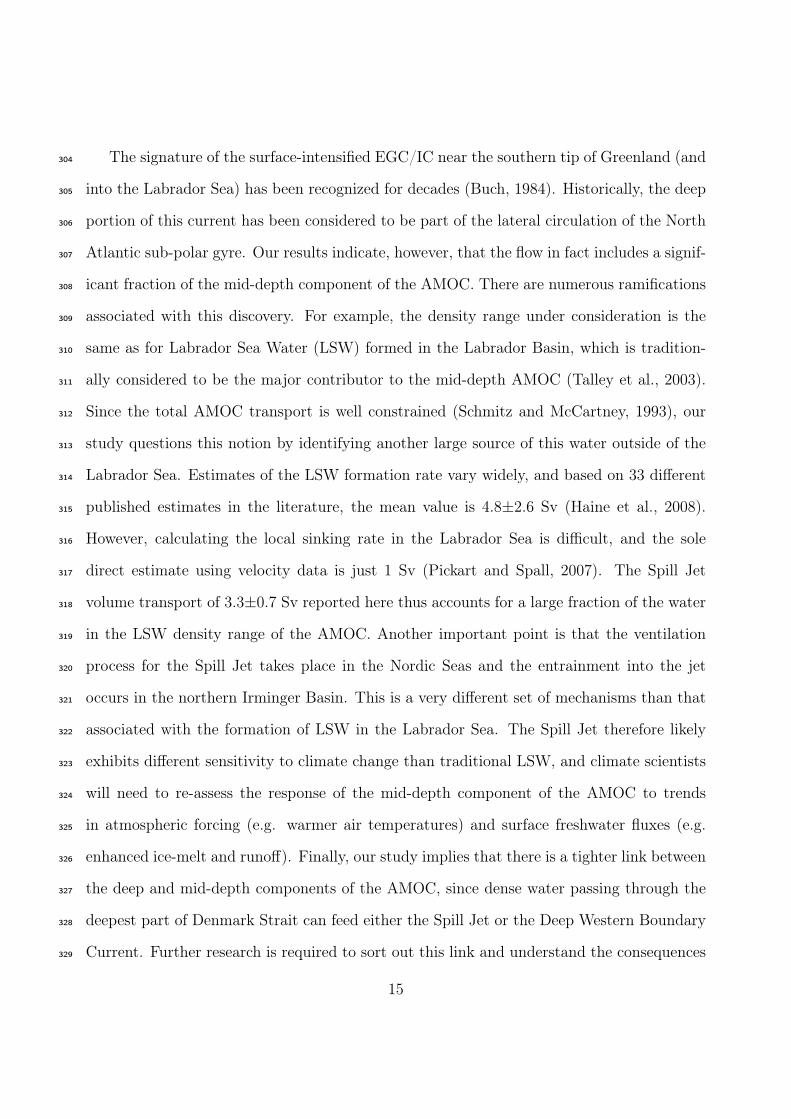
et al., 2011; Daniault et al., 2011). The mean velocity at Cape Farewell shows no evidence282
of the bottom-intensified Spill Jet observed upstream (Figure 9). Instead, one sees the well-283
known surface-intensified EGC/IC seaward of the shelfbreak, and the top portion of the284
traditional DSOW in the DWBC (which extends deeper and farther offshore, and is only285
partly visible in Figure 9). It has been argued previously that the mixing between the cold,286
fresh water spilling off the shelf south of Denmark Strait and the warm, salty water in the287
Irminger Basin leads to double diffusive salt fingering (Brearley et al., 2012). This erodes the288
cross-slope temperature gradient of the Spill Jet more effectively than the salinity gradient.289
As a consequence, the isopycnal slope of the Spill Jet should reverse as the current progresses290
southward, resulting in weaker flow with depth as seen in Figure 9.291
[Figure 9 about here.]292
We expect that the boundary current system does not reduce its volume transport pro-293
gressing downstream. However, distinguishing the Spill Jet from the other flow components294
becomes more difficult. With this in mind, we compute the volume transport at the Cape295
Farewell section within the density range 27.65–27.8. As before, the lower isopycnal is the296
top of the DSOW. The upper isopycnal is chosen to exclude the warm and salty shallow core297
of the EGC/IC. There is, however, no obvious way to choose the offshore limit of the Spill298
Jet. Instead, we ask what is the lateral bound if the Spill Jet transport of 3.3 Sv remains the299
same south of 65◦N (based on synoptic sections, Pickart et al. (2005) concluded that further300
entrainment is minimal south of the Spill Jet section). In this case, the offshore boundary301
is located at 32 km (Figure 9). This is essentially what we would expect; that is, the Spill302
Jet occupies the inshore side of the deep equatorward-flowing jet at Cape Farewell.303
14
The signature of the surface-intensified EGC/IC near the southern tip of Greenland (and304
into the Labrador Sea) has been recognized for decades (Buch, 1984). Historically, the deep305
portion of this current has been considered to be part of the lateral circulation of the North306
Atlantic sub-polar gyre. Our results indicate, however, that the flow in fact includes a signif-307
icant fraction of the mid-depth component of the AMOC. There are numerous ramifications308
associated with this discovery. For example, the density range under consideration is the309
same as for Labrador Sea Water (LSW) formed in the Labrador Basin, which is tradition-310
ally considered to be the major contributor to the mid-depth AMOC (Talley et al., 2003).311
Since the total AMOC transport is well constrained (Schmitz and McCartney, 1993), our312
study questions this notion by identifying another large source of this water outside of the313
Labrador Sea. Estimates of the LSW formation rate vary widely, and based on 33 different314
published estimates in the literature, the mean value is 4.8±2.6 Sv (Haine et al., 2008).315
However, calculating the local sinking rate in the Labrador Sea is difficult, and the sole316
direct estimate using velocity data is just 1 Sv (Pickart and Spall, 2007). The Spill Jet317
volume transport of 3.3±0.7 Sv reported here thus accounts for a large fraction of the water318
in the LSW density range of the AMOC. Another important point is that the ventilation319
process for the Spill Jet takes place in the Nordic Seas and the entrainment into the jet320
occurs in the northern Irminger Basin. This is a very different set of mechanisms than that321
associated with the formation of LSW in the Labrador Sea. The Spill Jet therefore likely322
exhibits different sensitivity to climate change than traditional LSW, and climate scientists323
will need to re-assess the response of the mid-depth component of the AMOC to trends324
in atmospheric forcing (e.g. warmer air temperatures) and surface freshwater fluxes (e.g.325
enhanced ice-melt and runoff). Finally, our study implies that there is a tighter link between326
the deep and mid-depth components of the AMOC, since dense water passing through the327
deepest part of Denmark Strait can feed either the Spill Jet or the Deep Western Boundary328
Current. Further research is required to sort out this link and understand the consequences329
15

in light of global warming.330
Appendix A: Caption for the supplementary movie331
Movie 1: Animation of numerical Lagrangian particles released at the Spill332
Jet section and tracked backwards in time. The particles are colored according to the333
pathway groups. The Spill Jet section, the Latrabjarg section, and the Irminger Basin line334
are indicated in yellow. The locations of the particle deployments at the Spill Jet section are335
shown in black. The 350 m isobath and the coastline are drawn in black. The resolution of336
the bathymetry in the model is higher than shown in the animation. Note that the speed of337
the animation doubles at -10 days (it is 1.25 days model time per 1 second animation time338
for the period 0 days to -10 days and 2.5 days model time per 1 second animation time for339
the period -10 days to -71 days).340
Acknowledgements341
We thank the many individuals who helped collect and process the hydrographic data342
from the Denmark Strait, including Detlef Quadfasel, Torsten Kanzow, Bert Rudels, Rolf343
Käse, and Tom Sanford. Kjetil Våge shared the mean Cape Farewell sections for the344
analysis. Support for this study was provided by the U.S. National Science Foundation345
(OCE-0726640, OCI-1088849, OCI-0904338), the German Federal Ministry of Education346
and Research (0F0651 D), and the Italian Ministry of University and Research through the347
RITMARE Flagship Project.348
References349
Adcroft, A., Campin, J.-M., 2004. Rescaled height coordinates for accurate representation of free-surface350
flows in ocean circulation models. Ocean Modelling 7 (3), 269–284.351
Brearley, J., Pickart, R., Valdimarsson, H., Jónsson, S., Schmitt, R., Haine, T. W. N., 2012. The East352
Greenland Boundary Current System South of Denmark Strait. Deep Sea Research I 63 (1), 1–19.353
16

Buch, E., 1984. Variations in temperature and salinity of West Greenland waters, 1970–82. NAFO Science354
Council Studies 7, 39–44.355
Chassignet, E. P., Hurlburt, H. E., Metzger, E. J., Smedstad, O. M., Cummings, J. A., Halliwell, G. R.,356
Bleck, R., Baraille, R., Wallcraft, A. J., Lozano, C., et al., 2009. US GODAE: Global Ocean Prediction357
with the HYbrid Coordinate Ocean Model (HYCOM). Oceanography 22 (2), 64–76.358
Daniault, N., Lherminier, P., Mercier, H., 2011. Circulation and Transport at the Southeast Tip of Green-359
land. Journal of Physical Oceanography 41, 437–457.360
Dickson, R., Brown, J., 1994. The Production of North Atlantic Deep Water: Sources, Rates, and Pathways.361
Journal of Geophysical Research 99 (C6), 12319–12341.362
Falina, A., Sarafanov, A., Mercier, H., Lherminier, P., Sokov, A., Daniault, N., 2012. On the cascading of363
dense shelf waters in the Irminger Sea. Journal of Physical Oceanography 42 (12), 2254–2267.364
Haine, T. W. N., 2010. High-Frequency Fluctuations in Denmark Strait Transport. Geophysical Research365
Letters 37 (14), L14601.366
Haine, T. W. N., Böning, C., Brandt, P., Fischer, J., Funk, A., Kieke, D., Kvaleberg, E., Rhein, M., Visbeck,367
M., 2008. North Atlantic Deep Water Formation in the Labrador Sea, Recirculation through the Subpolar368
Gyre, and Discharge to the Subtropics. Chapter 27 in Arctic-Subarctic Ocean Fluxes: Defining the Role369
of the Northern Seas in Climate. Springer, 653–701.370
Harden, B., Pickart, R., Renfrew, I. A., 2014. Offshore Transport of Dense Water from the East Greenland371
Shelf. Journal of Physical Oceanography 44 (1), 229–245.372
Holliday, N., Bacon, S., Allen, J., McDonagh, E., 2009. Circulation and transport in the western boundary373
currents at Cape Farewell, Greenland. Journal of Physical Oceanography 39 (8), 1854–1870.374
Jochumsen, K., Quadfasel, D., Valdimarsson, H., Jónsson, S., 2012. Variability of the Denmark Strait375
Overflow: Moored Time Series from 1996–2011. Journal of Geophysical Research 117 (C12).376
Kalnay, E., Kanamitsu, M., Kistler, R., Collins, W., Deaven, D., Gandin, L., Iredell, M., Saha, S., White,377
G., Woollen, J., et al., 1996. The NCEP/NCAR 40-year Reanalysis Project. Bulletin of the American378
Meteorological Society 77 (3), 437–471.379
Käse, R., Girton, J., Sanford, T., 2003. Structure and Variability of the Denmark Strait Overflow: Model380
and Observations. Journal of Geophysical Research 108 (C6), 3181.381
Koszalka, I., Haine, T. W. N., Magaldi, M., 2013. Fates and travel times of Denmark Strait Overflow Water382
in the Irminger Basin. Journal of Physical Oceanography 43 (12), 2611–2628.383
Large, W. G., McWilliams, J. C., Doney, S. C., 1994. Oceanic vertical mixing: A review and a model with384
17

a nonlocal boundary layer parameterization. Reviews of Geophysics 32 (4), 363–403.385
Lherminier, P., Mercier, H., Huck, T., Gourcuff, C., Perez, F. F., Morin, P., Sarafanov, A., Falina, A., 2010.386
The Atlantic Meridional Overturning Circulation and the subpolar gyre observed at the A25-OVIDE387
section in June 2002 and 2004. Deep Sea Research I 57 (11), 1374–1391.388
Macrander, A., Send, U., Valdimarsson, H., Jónsson, S., Käse, R., 2005. Interannual Changes in the Overflow389
from the Nordic Seas into the Atlantic Ocean through Denmark Strait. Geophysical Research Letters390
32 (6), L06606.391
Magaldi, M., Haine, T. W. N., Pickart, R., 2011. On the Nature and Variability of the East Greenland Spill392
Jet: A Case Study in Summer 2003. Journal of Physical Oceanography 41 (12), 2307–2327.393
Nikolopoulos, A., Pickart, R., Fratantoni, P., Shimada, K., Torres, D., Jones, E., 2009. The Western Arctic394
Boundary Current at 152◦W: Structure, Variability, and Transport. Deep Sea Research II 56 (17), 1164395
– 1181.396
Pickart, R., Smethie, W., 1998. Temporal evolution of the deep western boundary current where it enters397
the sub-tropical domain. Deep-Sea Research I 45 (7), 1053–1083.398
Pickart, R., Spall, M., 2007. Impact of Labrador Sea Convection on the North Atlantic Meridional Over-399
turning Circulation. Journal of Physical Oceanography 37 (9), 2207–2227.400
Pickart, R., Straneo, F., Moore, G., 2003. Is Labrador Sea Water Formed in the Irminger Basin? Deep-Sea401
Research Part I 50 (1), 23–52.402
Pickart, R., Torres, D., Fratantoni, P., 2005. The East Greenland Spill Jet. Journal of Physical Oceanography403
35 (6), 1037–1053.404
Price, J., O’Neil Baringer, M., 1994. Outflows and Deep Water Production by Marginal Seas. Progress in405
Oceanography 33 (3), 161–200.406
Rudels, B., Eriksson, P., Grönvall, H., Hietala, R., Launiainen, J., 1999. Hydrographic Observations in Den-407
mark Strait in Fall 1997, and their Implications for the Entrainment into the Overflow Plume. Geophysical408
Research Letters 26 (9), 1325–1328.409
Sarafanov, A., Falina, A., Mercier, H., Sokov, A., Lherminier, P., Gourcuff, C., Gladyshev, S., Gaillard, F.,410
Daniault, N., 2012. Mean full-depth summer circulation and transports at the northern periphery of the411
Atlantic Ocean in the 2000s. Journal of Geophysical Research 117 (C1).412
Schmitz, W. J., McCartney, M. S., 1993. On the North Atlantic Circulation. Reviews of Geophysics 31 (1),413
29–49.414
Smith, P., 1975. A streamtube model for bottom boundary currents in the ocean. Deep Sea Research I415
18
22 (12), 853–873.416
Spall, M., Price, J., 1998. Mesoscale Variability in Denmark Strait: The PV Outflow Hypothesis. Journal417
of Physical Oceanography 28 (8), 1598–1623.418
Talley, L. D., Reid, J. L., Robbins, P. E., 2003. Data-based meridional overturning streamfunctions for the419
global ocean. Journal of Climate 16 (19), 3213–3226.420
Våge, K., Pickart, R. S., Sarafanov, A., Knutsen, Ø., Mercier, H., Lherminier, P., Van Aken, H. M.,421
Meincke, J., Quadfasel, D., Bacon, S., 2011. The Irminger Gyre: Circulation, convection, and interannual422
variability. Deep Sea Research I 58 (5), 590–614.423
von Appen, W. J., 2012. Moored Observations of Shelfbreak Processes at the Inflow to and Outflow from424
the Arctic Ocean. Ph.D. thesis, Massachusetts Institute of Technology and Woods Hole Oceanographic425
Institution, Cambridge/Woods Hole, MA.426
von Appen, W. J., Pickart, R., Brink, K., Haine, T. W. N., 2014. Water Column Structure and Statistics of427
Denmark Strait Overflow Water Cyclones. Deep Sea Research I 84, 110–126.428
Yashayaev, I., Bersch, M., van Aken, H. M., 2007. Spreading of the Labrador Sea Water to the Irminger429
and Iceland basins. Geophysical Research Letters 34 (10).430
19

500m
350m
1000m
2000
m
3000m
68°N
66°
64°
62°
60°
58°45°W 40° 35° 30° 25° 20°
Greenland D e n ma r k
S t r a i tKG Trough
Iceland
DenseEGC
LátrabjargSection
Spill jetSection
Cape FarewellSection
Dense IC
Dens
eEG
C/IC
Spill jet
ISOW
DWBC
NIJ
DSO
Figure 1: Schematic of the dense water pathways in the Irminger Sea. This roughly corresponds towaters with density >27.6 kg/m3. The abbreviations are as follows: EGC = East Greenland Current, NIJ= North Icelandic Jet, DSO = Denmark Strait Overflow, IC = Irminger Current, ISOW = Iceland ScotlandOverflow Water, DWBC = Deep Western Boundary Current, and KG Trough = Kangerdlugssuaq Trough.Note that the less dense surface circulation of the IC, the EGC, and the East Greenland Coastal Current isnot shown.
20

−10 −5 0 5 10 15 20 25 30 35
0
200
400
600
800
1000
1200
1400
1600
Distance from shelfbreak [km]
Dep
th [m
]
(a) Mooring observations
27.85
27.75
27.7
27.65
27.55
27.5
27.8
27.6
0.2
0 0.05 0.1 0.15 0.2 0.25 0.3 0.35 0.4 0.45 0.5 0.55 0.6Along-topography velocity [m/s]
−10 −5 0 5 10 15 20 25 30 35 40Distance from shelfbreak [km]
(b) Numerical model
27.85
27.75
27.7
27.65
27.5
27.427.227
27.6
27.8
0.4
Figure 2: Mean hydrography and velocity at the Spill Jet section. The means are constructed atthe times when DSOW cyclones are absent. The equatorward absolute geostrophic velocity is shown incolor and the blue contour and is overlain by potential density [kg/m3] in black contours. (a) is from themooring observations and (b) is from the numerical model. The Spill Jet is defined as the flow within28 km of the shelfbreak (vertical black lines) in the density range 27.6–27.8 (magenta isopycnals). Theabsolute geostrophic velocity is referenced to the measured velocities and model velocities, respectively (anexample of modeled along topography velocity is shown in Figure 4b). The locations of the moorings aremarked by inverted black triangles.
21

−0.25 0 0.25 0.5 0.75 1 1.25 1.5 1.75 2 2.5 3 4 5 6 7 8pot. Temperature [°C]
−125 −100 −75 −50 −25 0 25 50 75 100 125
0
100
200
300
400
500
600660
Distance from Denmark Strait sill [km]
Dep
th [m
]
(b) Mean CTD hydrography
28
27.9
27.7
27.6
27.527.427.227
27.8East Greenlandshelf
Icelandshelf
020406080
100
(a) Number of CTD occupations
shelfbreak
shelfbreak
Figure 3: Mean hydrography at the Látrabjarg section. The number of CTD occupations that themean hydrography across Denmark Strait is based on is indicated in (a) and the mean is shown in (b). Thepotential temperature is shown in color and is overlain by potential density [kg/m3] in contours. The 27.8isopycnal, indicating the top of the DSOW layer, is highlighted in magenta.
22
0 0.5 1 1.5 2 2.5 3 4 5 6 7 8potential Temperature [°C]
−10 −5 0 5 10 15 20 25 30 35
0
200
400
600
800
1000
1200
1400
1600
Distance from shelfbreak [km]
Dep
th [m
]
(a) Model temperature
27.85
27.75
27.7
27.65
27.55
27.5
27.6
27.8
0 0.1 0.2 0.3 0.4 0.5 0.6Along-topography velocity [m/s]
−10 −5 0 5 10 15 20 25 30 35 40Distance from shelfbreak [km]
(b) Model velocity
27.8
27.6
Figure 4: Example of particle deployment locations. Representative example of a deployment ofparticles into the Spill Jet in the numerical model. Each of the white dots represents a particle released on10 Sep 2003. The instantaneous (a) potential temperature and (b) along-topography velocity are shown incolor overlain by potential density [kg/m3] in contours. The density limits of the Spill Jet are denoted bythe magenta contours.
23

Figure 5: 3D view of the model particles ten days prior to arriving at the Spill Jet section.The particles are colored according to the pathway groups. The Spill Jet section, the Látrabjarg section,and the Irminger Basin line are indicated in yellow. The locations of the particle deployments at the SpillJet section are shown in black. The 350 m isobath and the coastline are drawn in black. The resolution ofthe bathymetry in the model is higher than shown in the figure. See also Movie 1 which spans the entiresimulation.
24
40°W 38°W 36°W 34°W 32°W 30°W 28°W 26°W 24°W
63°N
64°N
65°N
66°N
67°N
68°N
69°N
400m600m2200m60
0m
KG
Irminger Basin line
Sill
0% >33% of IRMINGERBASIN particles
0% >33% of EG SHELFparticles
0% >33% of SILL−DIRECTparticles
Figure 6: Pathways of numerical particles feeding the Spill Jet. Pixels (0.1◦ of latitude by 0.2◦ oflongitude) are colored by the percentage of particles of the pathway groups that visited the pixel during thesimulation. The red channel of each pixel ranges from white when no IRMINGER BASIN particles visitedthe pixel to red when 33% or more of all IRMINGER BASIN particles visited the pixel. The green channelcorresponds to the East Greenland SHELF pathways. The SILL-DIRECT pathway, from the DenmarkStrait sill to the Spill Jet section, is shown by the blue channel. Black pixels were visited by many particlesfrom all pathway groups.
25

40°W 38°W 36°W 34°W 32°W 30°W 28°W 26°W 24°W
63°N
64°N
65°N
66°N
67°N
68°N
69°N
400m600m2200m60
0m
KG
Sill
IRMINGER BASIN particlesEG SHELF particlesSILL−DIRECT particles
Figure 7: Typical numerical particle trajectories. Three particles from each of the groups were sub-jectively selected to show typical trajectories of the different pathway groups.
26

0%
10%
20%
30%
40%
50%
60%
never 0−10 10−70days days
always
(a) Residence time on shelf
Fra
ctio
n of
all
part
icle
s
IRMINGERBASIN
IRMINGERBASIN
SILL−DIRECT
EG SHELF
EG SHELF
0%
4%
8%
12%
16%F
ract
ion
of a
ll pa
rtic
les
27.3
27.4
27.5
27.6
27.7
27.8
27.9
28.0
28.1
(b) pot. Density [kg/m3]
Spill Jetdensityrange
IRMINGERBASIN
SIL
L−D
IRE
CT
EG SHELF
Figure 8: Statistics of the numerical particles. (a) Fraction of all particles as a function of theirresidence time on the East Greenland shelf and their pathway group. (b) Fraction of all particles as afunction of their potential density at the beginning of the simulation and their pathway group. The densityrange of the Spill Jet (27.6–27.8) is denoted by the dashed lines.
27

0 0.05 0.1 0.15 0.2 0.25 0.3 0.35Along-topography velocity [m/s]
−20 −10 0 10 20 30 40 50 60 70
0
200
400
600
800
1000
1200
1400
1600
1800
2000
Distance from shelfbreak [km]
Dep
th [m
]
36 CTD sections
27.85
27.75
27.7
27.627.527.427.227
27.8
27.65
0.2
0.2
Figure 9: Mean hydrography and velocity at the Cape Farewell section. The means are based on36 CTD sections. The equatorward absolute geostrophic velocity is shown in color and the blue contourand is overlain by potential density [kg/m3] in black contours. The Spill Jet contribution is defined asthe flow within 32 km of the shelfbreak (vertical black lines) in the density range 27.65–27.8 (magentaisopycnals). The absolute geostrophic velocity is referenced to shipboard ADCP data and AVISO absolutesea surface height.
28

Table 1: List of hydrographic transects along the Látrabjarg section. The abbreviations of the shipnames and their countries are given in (a) and the individual cruises contributing to the mean Látrabjargsection are given in (b).
(a)Abbrev. Ship name Country
A Árni Friðriksson IcelandAR Aranda FinlandB Bjarni Sæmundsson IcelandD Discovery United KingdomJR James Clark Ross United KingdomKN Knorr United StatesM Meteor GermanyMSM Maria S. Merian GermanyP Poseidon GermanyPS Polarstern Germany
(b)Date Cruise Date Cruise Date Cruise
Mar 1990 B-03-1990 May 1998 B-06-1998 Nov 2005 B-13-2005Aug 1990 B-13-1990 Aug 1998 A-09-1998 Feb 2006 B-02-2006Nov 1990 B-17-1990 Sep 1998 B-09-1998 May 2006 B-04-2006Feb 1991 B-03-1991 Sep 1998 P-244 Sep 2006 D-311May 1991 B-07-1991 Sep 1998 P-244 Nov 2006 A-11-2006Sep 1991 A-12-1991 Sep 1998 P-244 Feb 2007 B-03-2007Nov 1991 B-14-1991 Oct 1998 PS-52 May 2007 B-08-2007Feb 1992 B-02-1992 Nov 1998 B-12-1998 Jul 2007 MSM-05-4May 1992 B-07-1992 Feb 1999 B-02-1999 Aug 2007 B-11-2007Sep 1992 A-08-1992 May 1999 B-07-1999 Nov 2007 A-14-2007Sep 1992 B-14-1992 Aug 1999 A-10-1999 Feb 2008 A-01-2008Oct 1992 B-16-1992 Sep 1999 B-13-1999 May 2008 B-08-2008Feb 1993 B-02-1993 Nov 1999 B-16-1999 Aug 2008 A-11-2008May 1993 B-07-1993 Feb 2000 B-02-2000 Oct 2008 KN-194Aug 1993 A-14-1993 May 2000 B-06-2000 Nov 2008 A-13-2008Sep 1993 B-11-1993 Aug 2000 B-10-2000 Feb 2009 B-01-2009Oct 1993 B-14-1993 Nov 2000 B-14-2000 May 2009 B-05-2009Feb 1994 B-03-1994 Feb 2001 B-02-2001 Jun 2009 MSM-12-1May 1994 B-08-1994 May 2001 B-06-2001 Aug 2009 B-10-2009Sep 1994 B-14-1994 Aug 2001 B-10-2001 Nov 2009 A-14-2009Oct 1994 B-17-1994 Nov 2001 B-14-2001 Feb 2010 B-04-2010Mar 1995 B-03-1995 May 2002 B-05-2002 May 2010 B-08-2010May 1995 B-07-1995 Aug 2002 B-09-2002 Jul 2010 M-82-1Aug 1995 A-11-1995 Sep 2002 P-294 Aug 2010 B-12-2010Sep 1995 B-14-1995 Nov 2002 A-10-2002 Feb 2011 B-01-2011Nov 1995 B-17-1995 Feb 2003 A-02-2003 May 2011 B-04-2011Feb 1996 B-03-1996 May 2003 A-09-2003 Aug 2011 M-85-2Aug 1996 A-11-1996 Aug 2003 B-03-2003 Aug 2011 KN-203Oct 1996 A-14-1996 Sep 2003 P-303 Dec 2011 B-10-2011Feb 1997 B-03-1997 Nov 2003 B-10-2003 Feb 2012 B-02-2012May 1997 B-06-1997 Feb 2004 B-01-2004 May 2012 B-05-2012Aug 1997 A-14-1997 May 2004 B-05-2004 Jun 2012 MSM-21-1bAug 1997 AR-34 Nov 2004 B-15-2004 Jul 2012 JR-267Sep 1997 AR-34 Feb 2005 B-02-2005 Aug 2012 P-437Sep 1997 B-10-1997 May 2005 B-06-2005 Aug 2012 B-09-2012Nov 1997 B-15-1997 Aug 2005 A-09-2005Feb 1998 B-02-1998 Aug 2005 P-327 29
Related Documents