The Earthquake Machine Lite: Activity 2 of 2 Developing arguments about earthquake occurrence v1.2 Michael Hubenthal – [email protected] Time: Approximately ~135 minutes Suggested Grade Level(s): 9 th to 10 th Grade Earth Science 5E Phase: This activity is designed as the Explain phase of the 5E-Model; following the Explore phase activity Earthquake Machine Lite Activity 1 of 2: Redefining Earthquakes (available on-line at http://www.iris.edu/edu/lessons.htm ). The two activities complement each other by first, providing students with the opportunity to learn about the advantages and limitations of the Earthquake Machine model while discovering the causes of earthquakes and then extending their understanding about earthquake generation, occurrence, and prediction through the collection and interpretation of data. Guiding Questions: 1. How frequently do earthquakes occur? 2. Are all earthquakes large events? 3. How frequently do large events occur? 4. Can earthquakes be predicted? 5. How does the Earthquake Machine model compare to global data? 6. How do scientists strive for objectivity in their results? Content Objectives (Students will be able to): 1. Explain earthquakes as a part of the natural Earth System 2. Describe the global trends for earthquake occurrence and size. 3. Interpret a Gutenberg Richter plot (Frequency vs Magnitude) 4. Critically analyze data generated by the Earthquake Machine and use the data to develop a position 5. Describe the importance of sharing science results with peers in the science process. Table of Contents

The Earthquake Machine Lite - IRIS Consortium · Web viewThe Earthquake Machine Lite: Activity 2 of 2 Developing arguments about earthquake occurrence v1.2 Michael Hubenthal – [email protected]
May 15, 2018
Welcome message from author
This document is posted to help you gain knowledge. Please leave a comment to let me know what you think about it! Share it to your friends and learn new things together.
Transcript
The Earthquake Machine Lite: Activity 2 of 2 Developing arguments about earthquake occurrence v1.2 Michael Hubenthal – [email protected]
Time: Approximately ~135 minutes Suggested Grade Level(s): 9th to 10th Grade Earth Science
5E Phase: This activity is designed as the Explain phase of the 5E-Model; following the Explore phase activity Earthquake Machine Lite Activity 1 of 2: Redefining Earthquakes (available on-line at http://www.iris.edu/edu/lessons.htm). The two activities complement each other by first, providing students with the opportunity to learn about the advantages and limitations of the Earthquake Machine model while discovering the causes of earthquakes and then extending their understanding about earthquake generation, occurrence, and prediction through the collection and interpretation of data.
Guiding Questions:1. How frequently do earthquakes occur?2. Are all earthquakes large events?3. How frequently do large events occur?4. Can earthquakes be predicted?5. How does the Earthquake Machine model compare to global data?6. How do scientists strive for objectivity in their results?
Content Objectives (Students will be able to):1. Explain earthquakes as a part of the natural Earth System2. Describe the global trends for earthquake occurrence and size.3. Interpret a Gutenberg Richter plot (Frequency vs Magnitude)4. Critically analyze data generated by the Earthquake Machine and use the data to develop a
position5. Describe the importance of sharing science results with peers in the science process.
Table of Contents
Section Page NumberMaterials List 2Quick Summary 2Teacher Instructions – Open 2Teacher Instructions – Prior Knowledge 3Teacher Instructions – Explore/Explain 4Teacher Instructions - Reflect 5Teacher Instructions - Apply 7Appendix A: Scoring Rubric For Student Presentations 9Appendix B: Homework 10Appendix B: Homework Answer Guide 12Appendix C: Teacher Background Discussion 13
Appendix D: Alignment with Standards 14Appendix E: References and Acknowledgements 15
Earthquake Machine Lite – Activity 2 of 2 Page 2
Materials List Class set of Earthquake Machine Set-ups (see Activity 1 of 2: Redefining an Earthquake for how
to construct: available online at http://www.iris.edu/edu/lessons.htm) Video Projector Computer EQMachineActivity2.ppt (available online at http://www.iris.edu/edu/lessons.htm) Overhead 2 blank transparencies per group Overhead Pens
Lesson Description: Quick Summary
OPERA Time (min)Open 15 Show the “mystery box” slide on the screen as students come into
class. Students should individually develop a hypothesis for how many beads are in the box
Prior knowledge 10 Distribute the materials for groups of 3-4 to assemble the EQMachine Lite at their lab benches.
Explore/Explain 45 Part I - Establishing the concept of Magnitude. Part II - The ultimate goal of this section of the activity is for students to develop an argument either for or against a given statement and support their argument with data they collect using the Earthquake Machine Lite.
Reflect 45 Allow each group approximately 3 minutes to present their argument and supporting data to the rest of the class (following the model of a scientific conference).
Apply 20 Lead a discussion with students to place the Earthquake Machine model in a context of the real world. This is further supported with the homework.
Lesson Description: Teacher Instructions ( w/ Potential Questioning Sequences )
Please see Appendix C for a full Teacher Background discussion
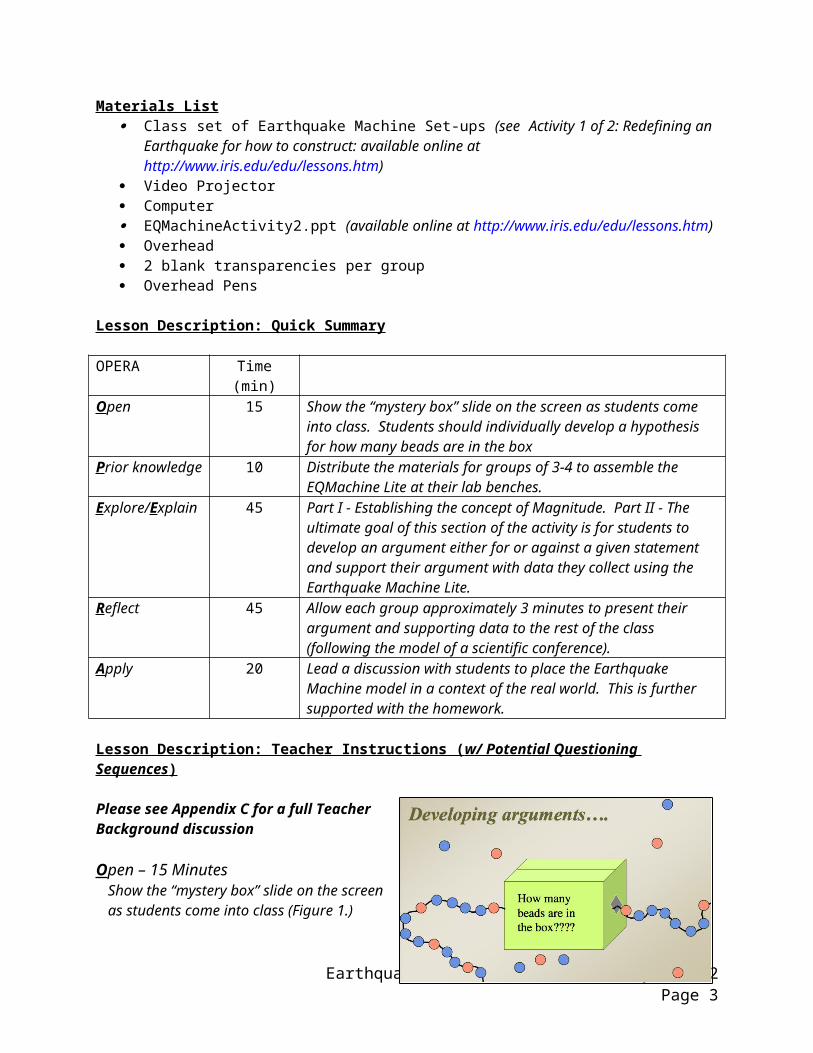
Open – 15 MinutesShow the “mystery box” slide on the screen as students come into class (Figure 1.)Students should individually develop a hypothesis for how many beads are in the box before beginning the questioning sequence below.
Open Question AnswerKnowledge SLIDE 3 What is mean by the word
“argument” in this case?A reason put forward in support of a point of view.
Earthquake Machine Lite – Activity 2 of 2 Page 3
Figure 1: The “mystery box” is a useful illustration to guide students as they begin to develop and analyze logical arguments.
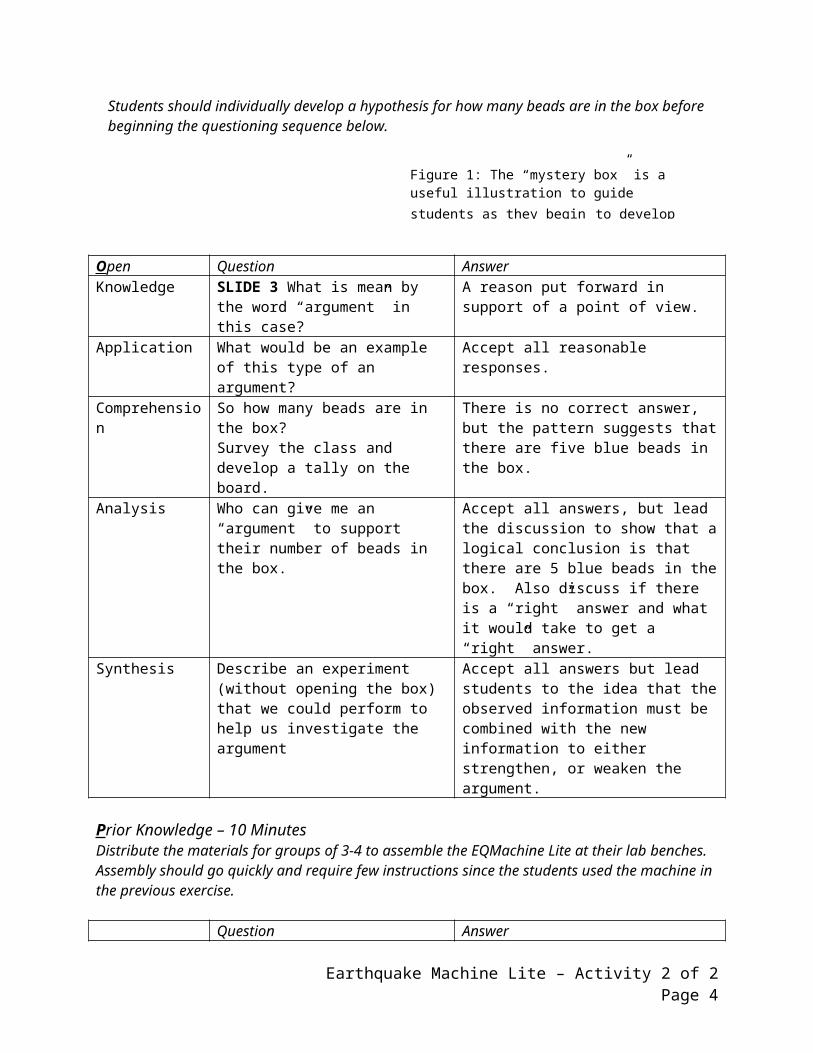
Application What would be an example of this type of an argument?
Accept all reasonable responses.
Comprehension So how many beads are in the box?Survey the class and develop a tally on the board.
There is no correct answer, but the pattern suggests that there are five blue beads in the box.
Analysis Who can give me an “argument” to support their number of beads in the box.
Accept all answers, but lead the discussion to show that a logical conclusion is that there are 5 blue beads in the box. Also discuss if there is a “right” answer and what it would take to get a “right” answer.
Synthesis Describe an experiment (without opening the box) that we could perform to help us investigate the argument
Accept all answers but lead students to the idea that the observed information must be combined with the new information to either strengthen, or weaken the argument.
Prior Knowledge – 10 MinutesDistribute the materials for groups of 3-4 to assemble the EQMachine Lite at their lab benches. Assembly should go quickly and require few instructions since the students used the machine in the previous exercise.
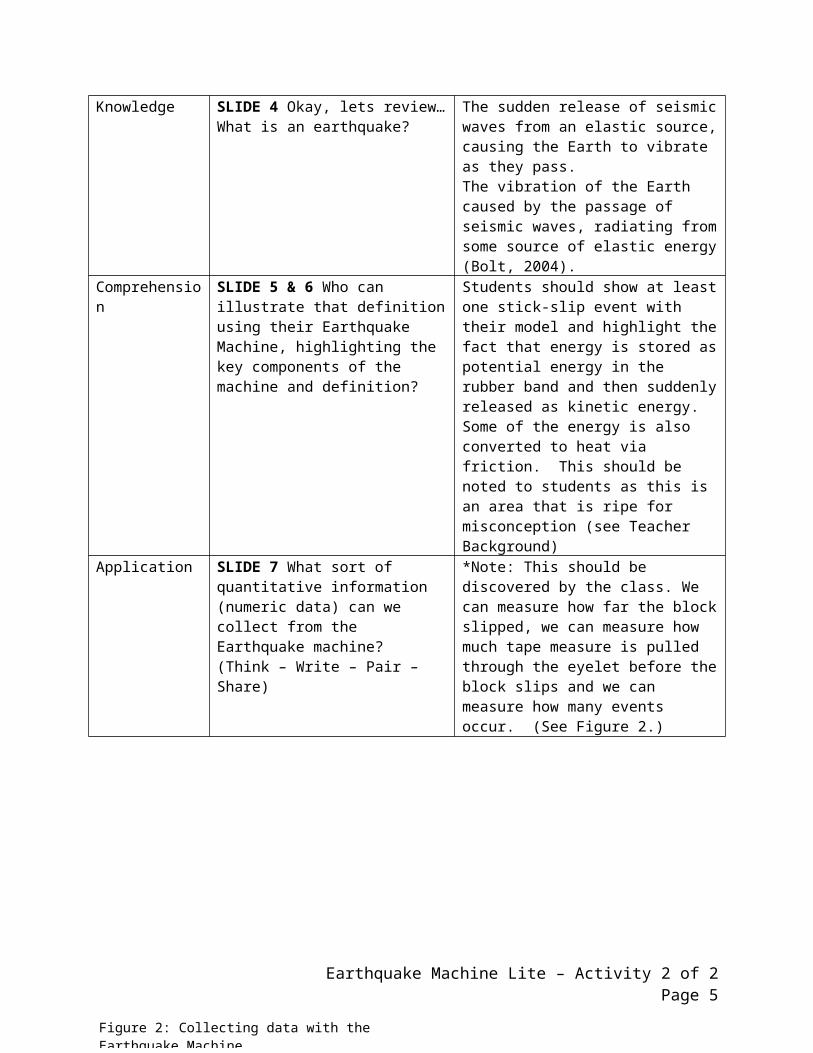
Question AnswerKnowledge SLIDE 4 Okay, lets review… What is
an earthquake?The sudden release of seismic waves from an elastic source, causing the Earth to vibrate as they pass. The vibration of the Earth caused by the passage of seismic waves, radiating from some source of elastic energy (Bolt, 2004).
Comprehension SLIDE 5 & 6 Who can illustrate that definition using their Earthquake Machine, highlighting the key components of the machine and definition?
Students should show at least one stick-slip event with their model and highlight the fact that energy is stored as potential energy in the rubber band and then suddenly released as kinetic energy. Some of the energy is also converted to heat via friction. This should be noted to students as this is an area that is ripe for misconception (see Teacher Background)
Application SLIDE 7 What sort of quantitative information (numeric data) can we collect from the Earthquake machine? (Think – Write – Pair – Share)
*Note: This should be discovered by the class. We can measure how far the block slipped, we can measure how much tape measure is pulled through the eyelet before the block slips and we can measure how many events occur. (See Figure 2.)
Earthquake Machine Lite – Activity 2 of 2 Page 4
Figure 2: Collecting data with the Earthquake Machine
Explore/Explain – 45 MinutesThe goal of this section of the activity is for students to develop an argument either for or against a given statement and support their argument with data they collect using the Earthquake Machine Lite.
SLIDE 8
Count-off the sets of students gathered at each earthquake machine set-up as either A or B. When finished, approximately half the class will be Group A, and the other half will be Group B. Each set of students should be given a slip of paper with a statement on it that corresponds to their group letter; Group A “There are always long periods of quiet between earthquakes,” Group B “Most earthquakes are huge, deadly, and destructive events.” Instruct students to review the statement, determine which parameters, discussed previously, they think they will need to measure using the earthquake machine in order to test the statement. Students should have approximately 30 minutes to collect their data (a minimum of 30 data points is recommended for best results), leaving approximately 15 minutes for them to prepare a 3-minute presentation of their argument and data to the class. This presentation must include either a graph or a data table. To help them present their data, overhead transparencies and markers should be made available.
\*Note: The group statements have be selected to reflect not only the geophysical content that can be explored with the Earthquake Machine, but also to provide an opportunity to prepare students to analyze vocabulary. Both statements include strong, qualifying words or phrases and the implications of such statements should be discussed with students.
Earthquake Machine Lite – Activity 2 of 2 Page 5
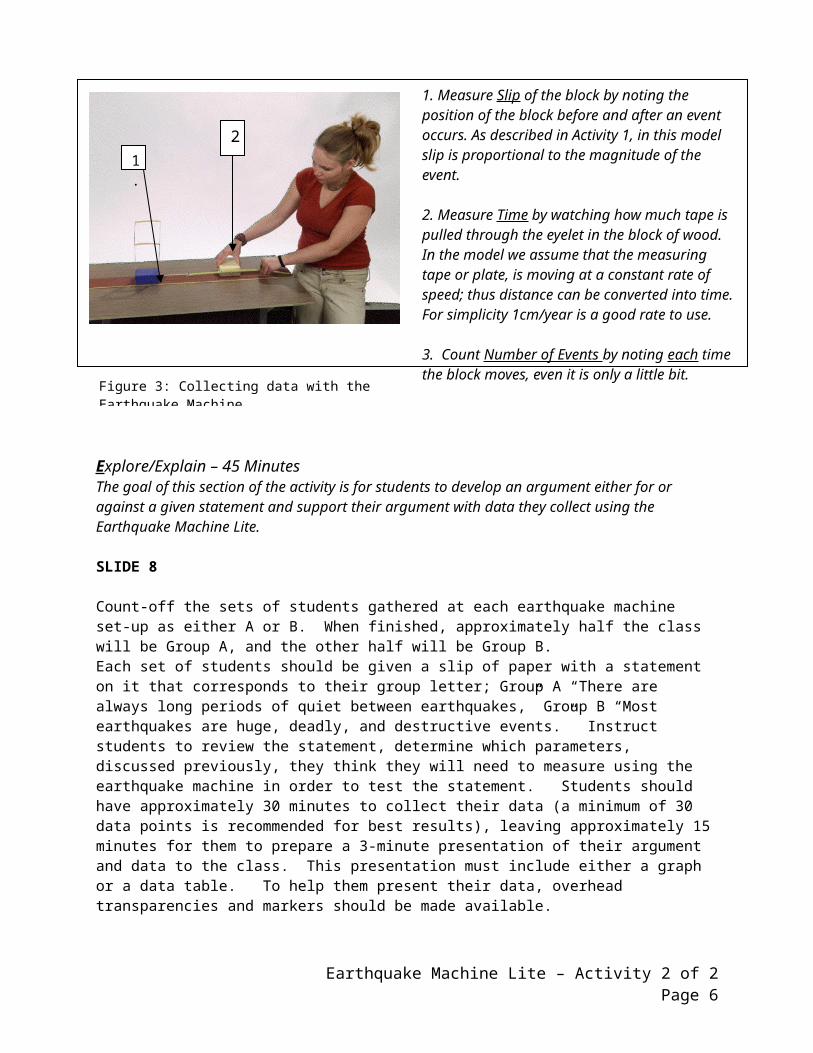
Figure 3: Collecting data with the Earthquake Machine
1.
2
1. Measure Slip of the block by noting the position of the block before and after an event occurs. As described in Activity 1, in this model slip is proportional to the magnitude of the event.
2. Measure Time by watching how much tape is pulled through the eyelet in the block of wood. In the model we assume that the measuring tape or plate, is moving at a constant rate of speed; thus distance can be converted into time. For simplicity 1cm/year is a good rate to use.
3. Count Number of Events by noting each time the block moves, even it is only a little bit.
Reflect – 35 MinutesAllow each group approximately 3 minutes to present their argument and supporting data to the rest of the class (following the model of a scientific conference).
Following this report, allow 2 minutes for the audience to ask questions regarding the presentation. All arguments should be accepted but it should be emphasized that the data must support the argument. A scoring rubric for student presentations is available in Appendix A. Modification - If an additional group leader is available, the class can be divided so that Group A is presenting to the rest of Group A while Group B presents only to Group B. The time saved by having the groups presenting simultaneously can be used to develop a group consensus and then giving a summary presentation to the members of the alternate group.
*Note: This is an opportunity for working with students to enhance the skills and tact necessary for giving and accepting critical analysis. The process of science as the collection of empirical data, development of logical argument and skeptical review should also be highlighted.
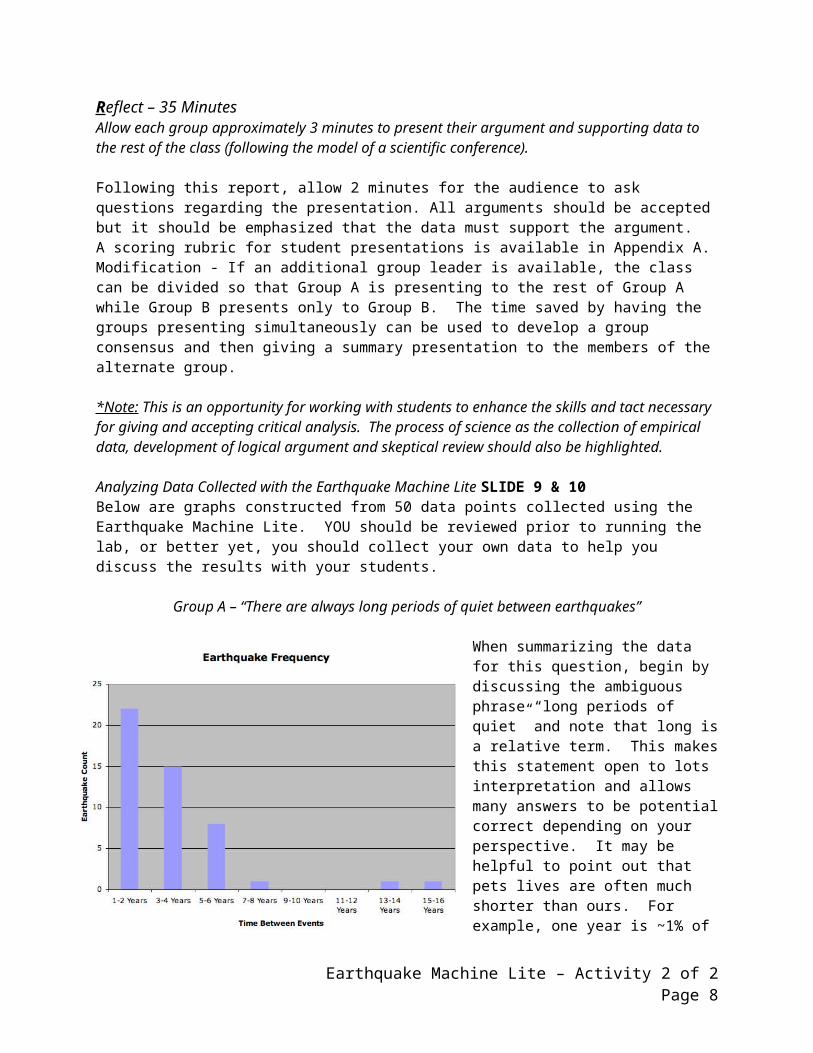
Analyzing Data Collected with the Earthquake Machine Lite SLIDE 9 & 10Below are graphs constructed from 50 data points collected using the Earthquake Machine Lite. YOU should be reviewed prior to running the lab, or better yet, you should collect your own data to help you discuss the results with your students.
Group A – “There are always long periods of quiet between earthquakes”
When summarizing the data for this question, begin by discussing the ambiguous phrase “long periods of quiet” and note that long is a relative term. This makes this statement open to lots interpretation and allows many answers to be potential correct depending on your perspective. It may be helpful to point out that pets lives are often much shorter than ours. For example, one year is ~1% of our lives (assuming 80 years), but for a dog that lives to be 10, this is 10% of its life.
When we look at the data generated from the earthquake machine (Figure 3) to examine this statement, we see a clear trend that suggests that for the majority of the events, a relatively small period of time passes between events. In fact it is rather rare that a longer period of 13+ years should pass without another event.
Earthquake Machine Lite – Activity 2 of 2 Page 6
Figure 4: Like global earthquakes, the majority of student-generated earthquakes occur with a relatively short time interval between events.

Group B “Most earthquakes are huge, deadly, and destructive events.”
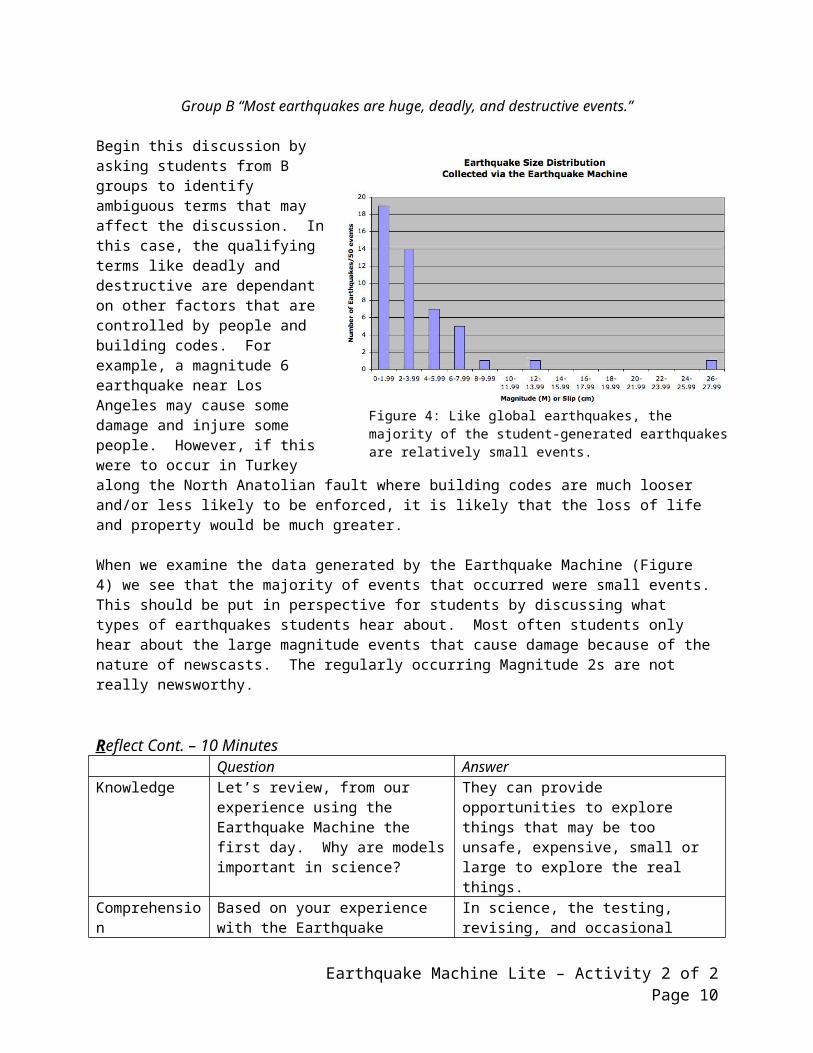
Begin this discussion by asking students from B groups to identify ambiguous terms that may affect the discussion. In this case, the qualifying terms like deadly and destructive are dependant on other factors that are controlled by people and building codes. For example, a magnitude 6 earthquake near Los Angeles may cause some damage and injure some people. However, if this were to occur in Turkey along the North Anatolian fault where building codes are much looser and/or less likely to be enforced, it is likely that the loss of life and property would be much greater.
When we examine the data generated by the Earthquake Machine (Figure 4) we see that the majority of events that occurred were small events. This should be put in perspective for students by discussing what types of earthquakes students hear about. Most often students only hear about the large magnitude events that cause damage because of the nature of newscasts. The regularly occurring Magnitude 2s are not really newsworthy.
Reflect Cont. – 10 MinutesQuestion Answer
Knowledge Let’s review, from our experience using the Earthquake Machine the first day. Why are models important in science?
They can provide opportunities to explore things that may be too unsafe, expensive, small or large to explore the real things.
Comprehension Based on your experience with the Earthquake Machine model and our exploration of the definition for an earthquake, explain how new scientific knowledge is generated and monitored?
In science, the testing, revising, and occasional discarding of theories, new and old, never ends. This ongoing process leads to an increasingly better understanding of how things work in the world but not to absolute truth.
Application Now after conducting additional experiments using the model and sharing your results with your peers, describe why, as a scientist it is important to attend scientific conferences?
Accept all answers but lead students to consider the role of sharing and analyzing results with other knowledgeable colleagues. Possible answers include1. You provide a level of skeptical review for others.2. You may receive a skeptical review of your own work that may point out possible bias.3. You may encounter new or related ideas
Earthquake Machine Lite – Activity 2 of 2 Page 7
Figure 4: Like global earthquakes, the majority of the student-generated earthquakes are relatively small events.
from others working on similar projects that could constructively add to your work thus building knowledge.4. You could encounter new or related ideas from others that contradicts your work but still stimulates new ideas.
Synthesis What happens if several groups disagree? What determines whose argument is correct?
Generally, the strongest, most logical argument as determined by the community should be correct, but it is possible that both or neither could be correct as new information about the subject is learned.
Synthesis What if the data supports each group’s argument, where else could there be a difference between the two groups?
Looking only at the data is not enough. The way in which the data was generated must also be considered. What were the methods each group used, were there places where they cut corners, used incorrect assumptions, or made errors?
Synthesis How might the sharing of results have been different if the rest of the group had never used the earthquake machine?
Lead students to see that in that situation the group presenting could easily be considered “experts” because they had used the machine, but that does not put them above skeptical review. Nor does it mean that the audience can’t provide meaningful critical analysis of the argument.
Apply – 20 MinutesLead a discussion with students to place the Earthquake Machine model in a context of the real world. This is further supported with the homework (Appendix B).
Question AnswerKnowledge Now that you have had lots of
experience using the Earthquake Machine, which simulated the real earth, is there anyone ready to begin predicting earthquakes?
Answers will vary
Comprehension SLIDE 11 If you were going to receive a “prediction” on TV or the internet, like you do for weather, what information would we need or want to know?
Accept all responses, but the three aspects to earthquake prediction are size, location and time.
Application Would it be adequate for me to predict that there will be an earthquake tomorrow in California?
This would be a pretty safe bet. The prediction is missing a level of specificity in the location, time and the size of the event.
Analysis What would the implications of a prediction like this be on the state and residences of California?
Discuss the difficulties and logistics of evacuations, the cost associated with them, and the implications of an evacuation for an event that never occurs (public trust)
Earthquake Machine Lite – Activity 2 of 2 Page 8
Analysis What if I improved my prediction to say there will be a Magnitude 2 earthquake, tomorrow morning on the Parkfield segment of the San Andreas fault? Hint: think of your model.
There are more specifics given in terms of location and time, however students should realize from their earthquake machine that Magnitude 2 events happen several times per week! To boot, a Magnitude 2 event is not likely to cause much if any damage at all.
Synthesis Thus, we really would like to be able to predict the large events that occur less frequently. Based on your experience with the Earthquake Machine, can we make such predictions? You may want to review your data to support your answer.
Think – Write – Pair – Share.
See the discussion below*
Synthesis Design an experiment using the earthquake machine that could collect the necessary information to test their theory
Homework.
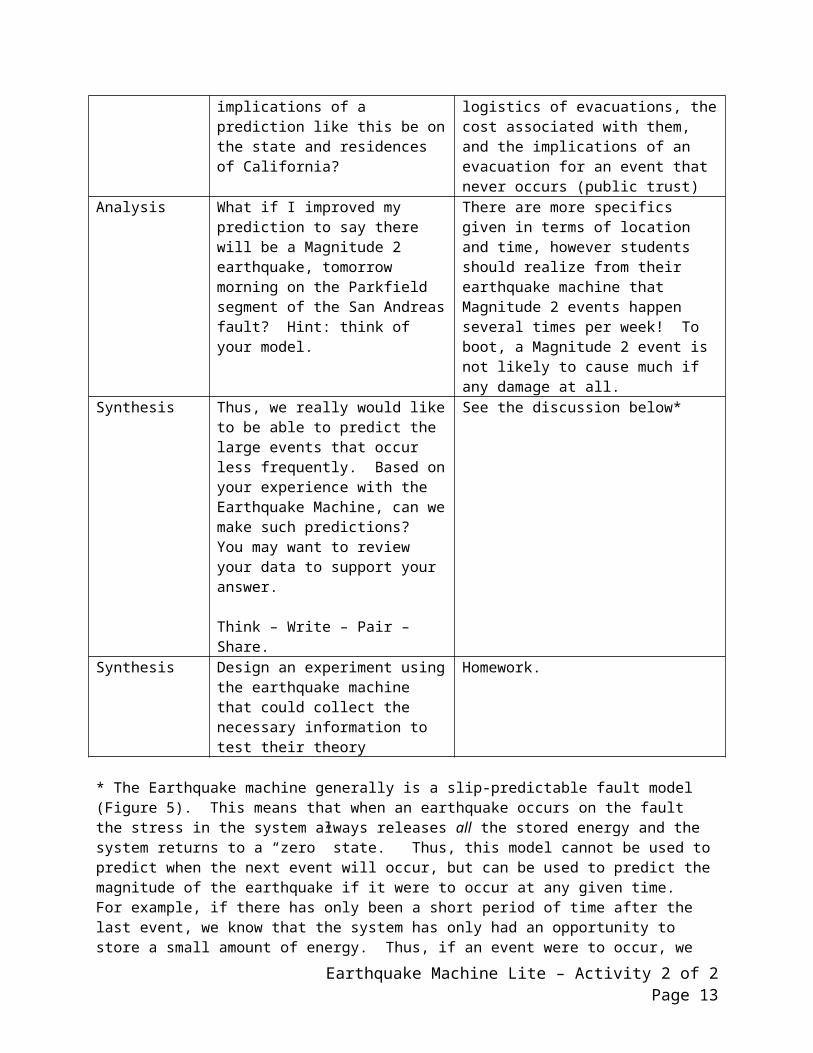
* The Earthquake machine generally is a slip-predictable fault model (Figure 5). This means that when an earthquake occurs on the fault the stress in the system always releases all the stored energy and the system returns to a “zero” state. Thus, this model cannot be used to predict when the next event will occur, but can be used to predict the magnitude of the earthquake if it were to occur at any given time. For example, if there has only been a short period of time after the last event, we know that the system has only had an opportunity to store a small amount of energy. Thus, if an event were to occur, we could predict just before it slipped that it would be a relatively small event. However, if a long period of time has passed since the last earthquake, we know that the system has stored a substantial amount of energy and could predict that if an event were to occur at that time, it would be a large magnitude event. Students are likely to infer this from their experience with the model but are not likely to have collected adequate data to support this theory. It is EXTREMELY important to emphasize to students that most faults DON’T behave this way, and remind students that the model is a simplification of reality. Thus, a fault may behave in a slip-predictable way for a while, and then behave in a different way. A key reason for this is that in the model the fault area is fixed, whereas on a real fault the fault area can vary from earthquake to earthquake. For more detailed discussion of this please see http://tremor.nmt.edu/activities/stick-slip/canpredict.htm
Apply – HomeworkTo help students compare the model and reality, assign students to complete the Student Worksheet, Appendix B for homework.
Earthquake Machine Lite – Activity 2 of 2 Page 9
Time
Stress
Earthquakes
Figure 5: In a slip-predictable model the systems stress always returns to the same level following an event.
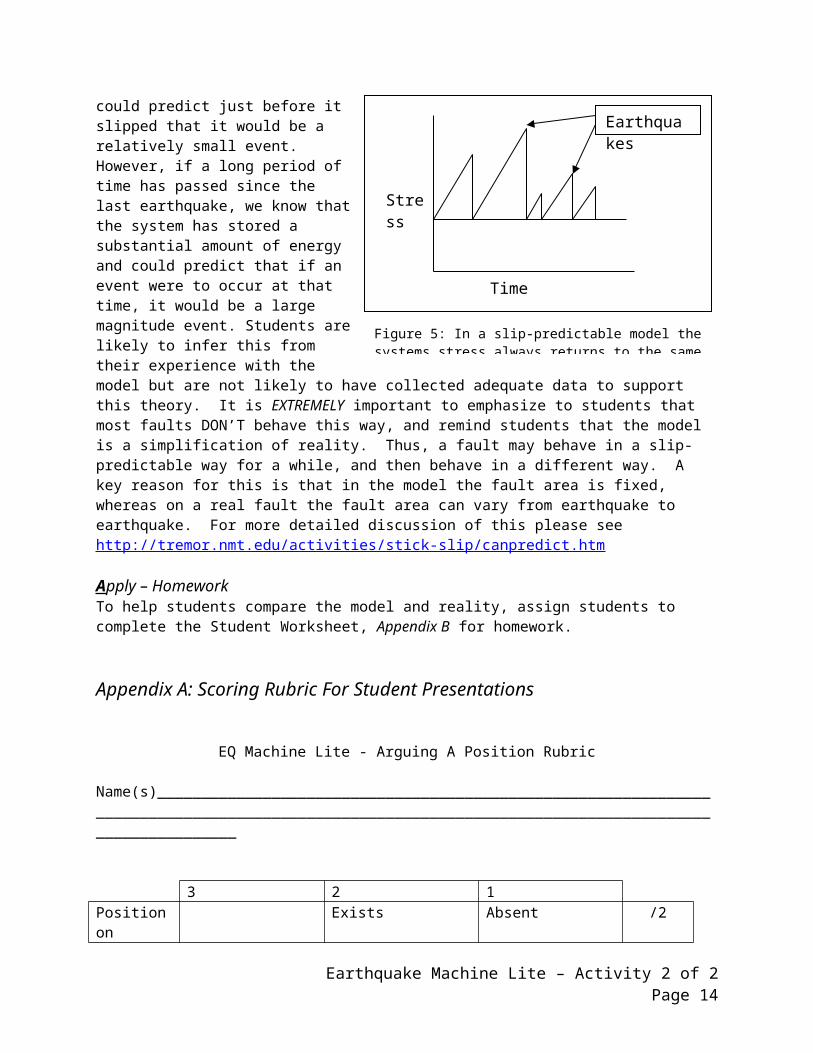
Appendix A: Scoring Rubric For Student Presentations
EQ Machine Lite - Arguing A Position Rubric
Name(s)_____________________________________________________________________________________________________________________________________________________
3 2 1Position on Statement
Exists Absent /2
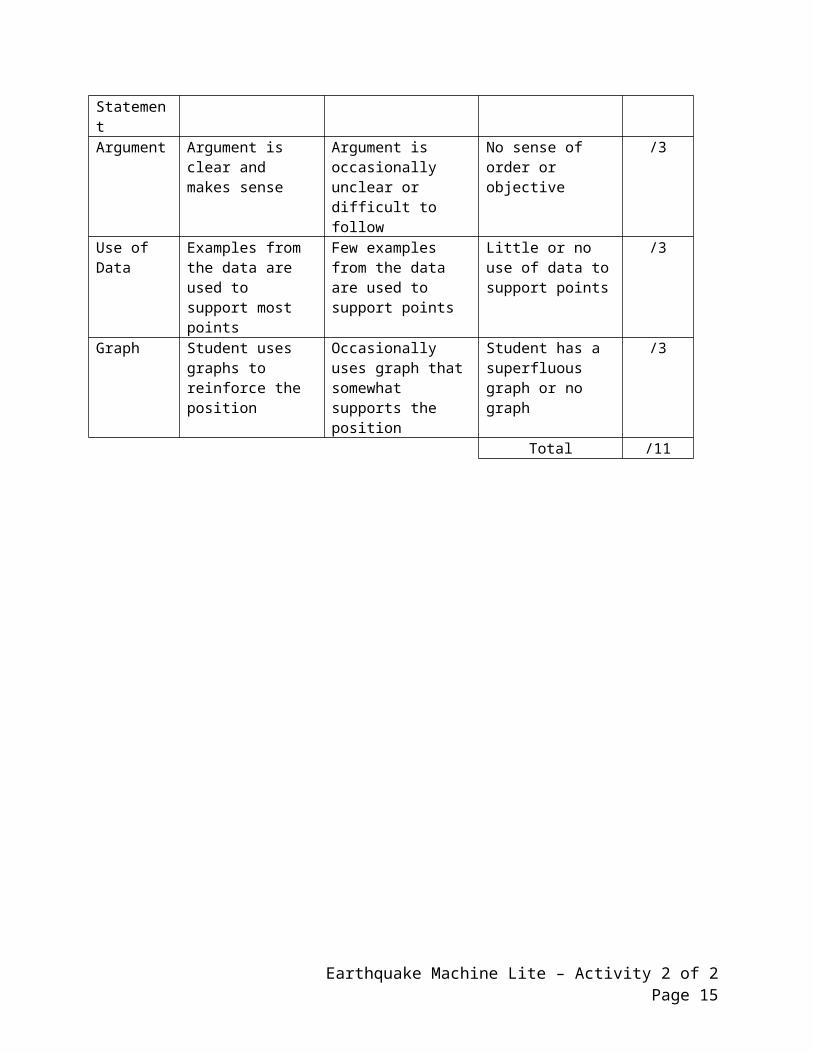
Argument Argument is clear and makes sense
Argument is occasionally unclear or difficult to follow
No sense of order or objective
/3
Use of Data Examples from the data are used to support most points
Few examples from the data are used to support points
Little or no use of data to support points
/3
Graph Student uses graphs to reinforce the position
Occasionally uses graph that somewhat supports the position
Student has a superfluous graph or no graph
/3
Total /11
Earthquake Machine Lite – Activity 2 of 2 Page 10
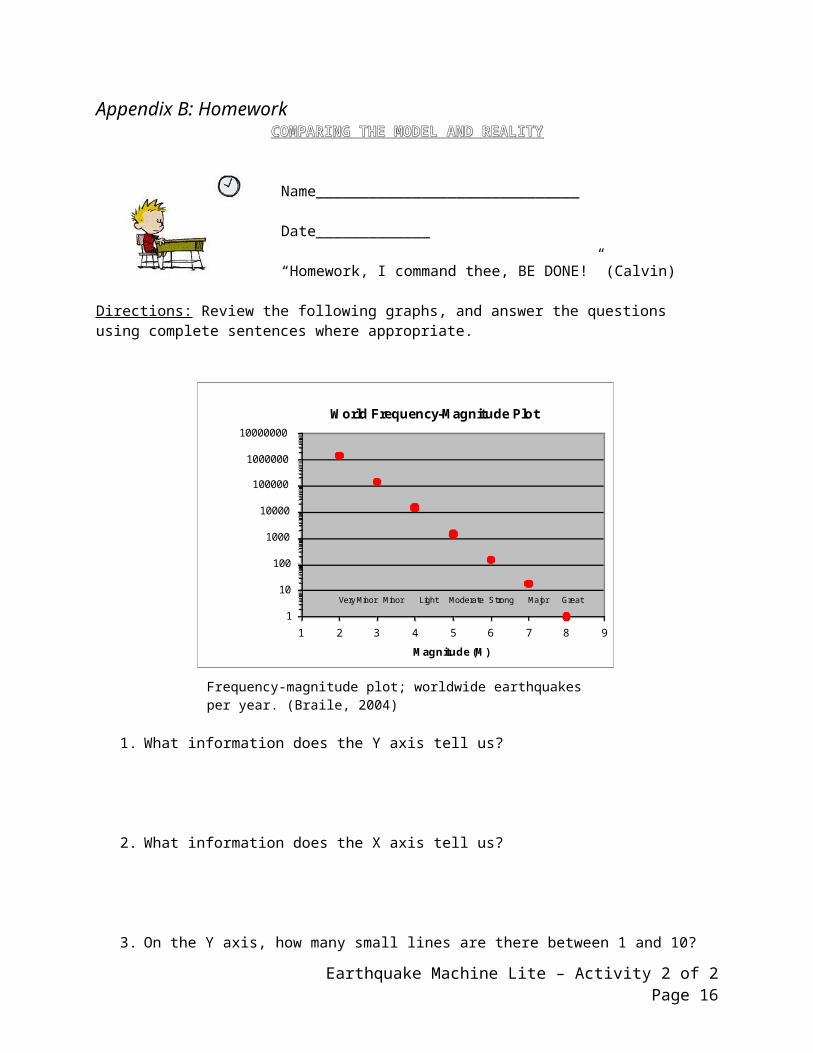
Appendix B: Homework COMPARING THE MODEL AND REALITYCOMPARING THE MODEL AND REALITY
Name______________________________
Date_____________
“Homework, I command thee, BE DONE!” (Calvin)
Directions: Review the following graphs, and answer the questions using complete sentences where appropriate.
World Frequency-Magnitude Plot
1
10
100
1000
10000
100000
1000000
10000000
1 2 3 4 5 6 7 8 9
Magnitude (M)
Number of Earthquakes per Year Greater Than or Equal to M Very Minor Minor Light Moderate Strong Major Great
1. What information does the Y axis tell us?
2. What information does the X axis tell us?
3. On the Y axis, how many small lines are there between 1 and 10?
4. On the Y axis, how many small lines are there between 10,000 and 100,000?
Earthquake Machine Lite – Activity 2 of 2 Page 11
Frequency-magnitude plot; worldwide earthquakes per year. (Braile, 2004)
5. With regard to question number 4 above, what is the value of each of the small lines?
6. What is the value of the small lines between 100 and 1000 on the Y axis?
7. According to the graph above, approximately how many Magnitude 8 earthquakes occur each year?
8. Approximately how many Magnitude 3 earthquakes occur each year?
9. Keeping your responses to questions #5 and #6 in mind, what would be the next major line on the Y axis below the X,Y intercept?
10. If you were to extrapolate the graph by extending the slope of the line off the bottom of the graph, approximately how frequently would you expect a Magnitude 9 Earthquake to occur?
11. Is the global data shown in the graph above like or unlike the data we collected from the Earthquake Machine model? How? Give specifics.
12. Bonus! By now you have noticed that this graph has a special Y-axis, what is the name of graphs with one special axis like this?
Earthquake Machine Lite – Activity 2 of 2 Page 12
Homework Answer Guide 1. What information does the Y axis tell us?
a. A: The Y axis tells us the number of earthquakes of that occur yearly
2. What information does the X axis tell us?a. A: The X axis tells us the magnitude of the events.
3. On the Y axis, how many small lines are there between 1 and 10?a. A: There are eight small lines between 1 and 10 on the Y axis.
4. On the Y axis, how many small lines are there between 10,000 and 100,000?a. A: There are eight small lines between 10,000 and 100,000 on the Y axis.
5. With regard to question number 4 above, what is the value of each of the small lines?a. A: Each small line is equal to 10,000 earthquakes per year.
6. What is the value of the small lines between 100 and 1000 on the Y axis?a. A: Each small line is equal to 100 earthquakes per year.
7. According to the graph above, approximately how many Magnitude 8 earthquakes occur each year?
a. A: One Magnitude 8 earthquake should occur annually
8. Approximately how many Magnitude 3 earthquakes occur each year?a. A: Between 100,000 and 200,000 Magnitude 3 earthquakes should occur each year.
9. Keeping your responses to questions #5 and #6 in mind, what would be the next major line on the Y axis below the X,Y intercept?
a. A: The next major line on the graph below the X,Y intercept on the graph should be 0.1 earthquakes per year.
10. If you were to extrapolate the graph by extending the slope of the line off the bottom of the graph, approximately how frequently would you expect a Magnitude 9 Earthquake to occur?
a. A: One would expect 0.1 Magnitude 9 earthquakes to occur each year, or one every ten years.
11. Is the global data shown in the graph above like or unlike the data we collected from the Earthquake Machine model? How? Give specifics.
a. A: The data from the earthquake machine is quite similar to the global data set. Using the earthquake machine we saw that we had a variety of different sized events occur, but there were significantly more small events than large ones. The same thing happens globally as shown by the graph. There are many, many more small events than large ones.
12. Bonus! By now you have noticed that this graph has a special Y-axis, what is the name of graphs with one special axis like this?
a. A: Semi-Log Plots
Earthquake Machine Lite – Activity 2 of 2 Page 13
Appendix C: Teacher Background
While exposing students to the occurrence rates, frequency of various sized events, inter-event periodicity, and predictability of earthquakes on a global scale is a major content focus of this activity*, another major emphasis is developing students’ understandings about and experience with the process of science. Throughout this three period lab, there are numerous opportunities for students to analyze arguments, collect empirical data while testing an argument, and participating in the peer review process. By the time students reach high school most have some understanding of the process of science. For example, they believe that scientific knowledge changes over time, however they typically think these changes occur mainly in terms of learning new facts and this occur mostly as the result of the invention of improved technology for observation and measurement. What they, as well as their younger peers do not tend to recognize is that changed theories sometimes suggest new observations or reinterpretation of previous observations (Aikenhead, 1987; Lederman & O'Malley, 1990; Waterman, 1983). Therefore hypothetical questioning, such as the sequence described in the Reflect phase of this lab, can help students stretch their understanding of the process of science to include some aspects they may not have directly experienced in the laboratory. Additionally, some research indicates that it is difficult for middle-school students to understand the development of scientific knowledge through the interaction between theory and observation (Carey et al., 1989). In the exercise, students do not directly explore the concept of earthquake prediction, however, encouraging students to construct their own theories about earthquake prediction based on their formal and informal observations can reinforce this relationship. Asking students to consider how they would test their theory for the ability or inability to predict earthquakes further emphasizes the concept.
This lab also presents opportunities to help students develop a bettering understanding of who scientists are and how scientists interact with one another. Students of all ages portray scientists as brilliant, dedicated, and essential to the world, however, when asked about science as a career, they respond with a negative image of scientific work and scientists. They see scientific work as dull and rarely rewarding, and scientists as bearded, balding, working alone in the laboratory, isolated and lonely (Fort & Varney, 1989; Mead & Metraux, 1957; Newton & Newton, 1992). Throughout this laboratory, the student-as-scientist concept should be emphasized, especially since this lab, unlike many the students have experience with, does not have a correct solution that must be reached. Rather students are scientists exploring ideas, examining their data for trends and developing limited arguments based on that data. As discussed below, there are certain trends that students should see as they work with the Earthquake Machine. Thus, for this exercise, “wrong” solutions are replaced with faulty logic, and poor data collection techniques; the things that can plague a scientist. Also, the simulated scientific conference aspect of the lab allows students to actually experience the exciting and stimulating nature of the scientific community, to become experts on an aspect of earthquakes, and participate in the types of dialogue that creates new scientific knowledge.
*Note: The majority of the discussion of the model and the science of the activity is in Teacher Background Part I which is contained in Activity 1 of 2: Redefining an Earthquake (available online at http://www.iris.edu/edu/lessons.htm). Additional information regarding the comparison of data collected via the earthquake machine and global earthquake data is contained in the Reflect portion of the activity below, and a discussion of the model’s predictability can be found in the Apply section.
Earthquake Machine Lite – Activity 2 of 2 Page 14
Appendix D: Alignment with Standards (AAAS Benchmarks)
Reinforces: By the end of the 8th grade, students should know that:A. The Scientific World ViewScientific knowledge is subject to modification as new information challenges prevailing theories and as a new theory leads to looking at old observations in a new way.
C. Processes that Shape the EarthThe interior of the earth is hot. Heat flow and movement of material within the earth cause earthquakes and volcanic eruptions and create mountains and ocean basins. Gas and dust from large volcanoes can change the atmosphere.
E. Energy Transformations - Energy cannot be created or destroyed, but only changed from one form into another.Whenever the amount of energy in one place or form diminishes, the amount in other places or forms increases by the same amount.
Supports the development of: By the end of the 12th grade, students should know that:A. The Scientific World ViewNo matter how well one theory fits observations, a new theory might fit them just as well or better, or might fit a wider range of observations. In science, the testing, revising, and occasional discarding of theories, new and old, never ends. This ongoing process leads to an increasingly better understanding of how things work in the world but not to absolute truth. Evidence for the value of this approach is given by the improving ability of scientists to offer reliable explanations and make accurate predictions.
B. Scientific InquiryScientists in any one research group tend to see things alike, so even groups of scientists may have trouble being entirely objective about their methods and findings. For that reason, scientific teams are expected to seek out the possible sources of bias in the design of their investigations and in their data analysis. Checking each other's results and explanations helps, but that is no guarantee against bias.
C. Processes that Shape the EarthThe solid crust of the earth-including both the continents and the ocean basins-consists of separate plates that ride on a denser, hot, gradually deformable layer of the earth. The crust sections move very slowly, pressing against one another in some places, pulling apart in other places. Ocean-floor plates may slide under continental plates, sinking deep into the earth. The surface layers of these plates may fold, forming mountain ranges.
E. Energy Transformations - Transformations of energy usually produce some energy in the form of heat, which spreads around by radiation or conduction into cooler places. Although just as much total energy remains, its being spread out more evenly means less can be done with it.
Earthquake Machine Lite – Activity 2 of 2 Page 15
Appendix E: References and Acknowledgements
Aikenhead, G.S. (1987). High school graduates' beliefs about science-technology-society III. Characteristics and limitations of scientific knowledge. Science Education, 71, 459-487.
American Association for the Advancement of Science. (1993) Benchmarks for Science Literacy. Accessed online 3/10/05 at http://www.project2061.org/tools/benchol/bolintro.htm
Braile, Larry. (2004) How Often Do Earthquakes Appear on the Seismograph? Accessed online 7/18/06 at http://web.ics.purdue.edu/~braile/edumod/as1lessons/HowOften/HowOften.htm
Bolt, Bruce, Earthquakes, (5th Edition), W.H. Freeman and Company, New York, 378pp., 2004.
Carey, S., Evans, R., Honda, M., Jay, E., & Unger, C. (1989). An experiment is when you try it and see if it works: A study of grade 7 students' understanding of the construction of scientific knowledge. International Journal of Science Education, 11, 514-529.
Fort, D., & Varney, H. (1989). How students see scientists: Mostly male, mostly white, and mostly benevolent. Science and Children, 26(8), 8-13.
Hall-Wallace, M. (1998). Can Earthquakes Be Predicted? Journal of Geoscience Education, 46, 439-449.
Lederman, N., & O'Malley, M. (1990). Students' per-ceptions of the tentativeness in science: Development, use, and sources of change. Science Education, 74, 225-239.
Mead, M., & Metraux, R. (1957). Image of the scientist among high-school students: A pilot study. Science, 26, 384-390.
Newton, D., & Newton, L. (1992). Young children's perceptions of science and the scientist. International Journal of Science Education, 14, 331-348.
Waterman, M. (1983). Alternative conceptions of the tentative nature of scientific knowledge. In J. Novak (Ed.), Proceedings of the international seminar misconceptions in science and mathematics (pp. 282-291). Ithaca, NY: Cornell University.
Many thanks to Larry Braile (Prudue University) & John Lahr (Retired USGS) for their help in refining & testing the Earthquake Machine Lite model, as well as their input to the design of the EQ Machine Lite Activities.
Earthquake Machine Lite – Activity 2 of 2 Page 16
Related Documents