The Early View of “Global Journal of Management and Business Research” In case of any minor updation/modification/correction, kindly inform within 3 working days after you have received this. Kindly note, the Research papers may be removed, added, or altered according to the final status. Early View

Welcome message from author
This document is posted to help you gain knowledge. Please leave a comment to let me know what you think about it! Share it to your friends and learn new things together.
Transcript

The Early View of
“Global Journal of Management and Business Research”
In case of any minor updation/modification/correction, kindly inform within
3 working days after you have received this.
Kindly note, the Research papers may be removed, added, or altered according to the final status.
Early V
iew
i. Copyright Notice ii. Editorial Board Members iii. Chief Author and Dean iv. Table of Contents v. From the Chief Editor’s Desk vi. Research and Review Papers
1. Selection of Suppliers through Different Multi-Criteria Decision Making
Techniques.1-11 2. Effectiveness of Microfinance Banks in Alleviating Poverty in Kwara State
Nigeria.13-20 Marketing and Distribution Channel of Processed Fish in Adamawa State,
Nigeria.21-26 4. The Psychometric Impacts of Karasek’s Demands and Control Scale on
Employees’ Job Dissatisfaction.27-41
Clinical Trials: A Branding Opportunity? 43-49 Contributory Pension Scheme, Workers Commitment, Retention and Attitude
towards Retirement in The Nigerian Civil Service 51-59 Comparative Loan Performance In Banks And Micro-Credit Institutions Nigeria: A Case Study Of Ondo State.61-68
8. Celebrity Endorsement And Its Impact On Sales: A Research Analysis
Carried Out In India.69-84 9. Reward System And Its Impact On Employee Motivation In Commercial Bank
Of Sri Lanka Plc, In Jaffna District.85-92 10. Diversité Genre dans le Conseil d’Administration et Performance des
Entreprises Tunisiennes Cotées.93-101
vii. Auxiliary Memberships viii. Process of Submission of Research Paper ix. Preferred Author Guidelines x. Index
Contents of the Volume
3.
5.6.
7.
Early V
iew

Selection of Suppliers through Different Multi-Criteria Decision Making Techniques
Sanjoy Kumar Paul1, Ripon Kumar Chakraborty2, Md. Salahuddin Ayuby3
Abstract : The main objective of the paper is to provide different multi-criteria decision making approach and to clarify the similarities and dissimilarities, advantages and disadvantages of the method in order to select the better supplier selection approach. An important problem in decision analysis is the evaluation of the difference between two or more different rankings for a set of alternatives. Since a qualified supplier is a key element and a good resource for a buyer in reducing such costs, evaluation and selection of the potential suppliers has become an important component of supply chain management. In this paper some multi-criteria decision making techniques such as Linear weighted method, Categorical method, Fuzzy approach, Analytical Hierarchical process (AHP)are discussed with example. The aim of this article is to understand the strategic operating decision area of the supplier selection process and to aid decision makers with varying degrees of importance to reach consensus in rating alternative suppliers. Keywords : Supplier selection, multiple criteria decision making, analytical Hierarchy, Fuzzy decision matrix.
I. INTRODUCTION
here has been an evolution in the role and structure of the purchasing function through the nineties. The purchasing function has gained great
importance in the supply chain management due to factors such as globalization, increased value added in supply, and accelerated technological change. Supplier selection and evaluation is the process of finding the suppliers being able to provide the buyer with the right quality products and/or services at the right price, at the right quantities and at the right time. Evaluation and selection of suppliers is a typical multiple criteria decision making (MCDM) problem involving multiple criteria that can be both qualitative and quantitative. A key and perhaps the most important process of the purchasing function is the efficient selection of suppliers, objective of the supplier selection process is to reduce risk and maximize the total value for the buyer
About :
Department of Industrial and Production Engineering
Bangladesh University of Engineering and Technology, Dhaka –
1000, Bangladesh,Corresponding email: [email protected]
and it involves considering a series of
strategic
variables.The explicit consideration of multiple, conflicting objectives in a decision model has made the
area of multiple criteria decision-making (MCDM) very challenging. Suppliers are considered the best intangible assets of any organization.
Suppliers have varied strengths and weaknesses that require careful assessment before order placement. It can be argued that it is extremely difficult for any one supplier to excel in all dimensions of performance. Suppliers have to satisfy minimum overall performance standards, but one of the scheme’s objectives is to improve these continually. So selection of suppliers is the most important decision problem in today’s competitive business environment. Abratt (1986) analyzed the buying process and identifies and determines the relative importance of the factors influencing supplier selection. Avery (1999) identified factors affecting MRO supplier selection. Sharland et al. (2003) examined the impact of cycle time on supplier selection. Lin
et al.
(2005) identified the factors affecting the supply chain quality management. Gonzalez
et al.
(2004)
looks at the variables and their relative importance in supplier selection from quality, cost and productivity perspectives. Humphreys et al. (2003) developed a decision support tool which should help companies to integrate environmental criteria into their supplier selection process. Yan and Wei (2002) used supplier selection criteria as an example to apply a proposed compromise weighting in a group decision making environment. Svensson (2004) investigated the models of supplier segmentation and supplier selection criteria. Kannan and Tan (2002) described an empirical study of the importance of supplier selection and assessment criteria of American manufacturing companies for items to be used in products already in production. Lee et al. (2001) proposes a methodology which identifies the managerial criteria using information derived from the supplier selection processes and makes use of them in the supplier management
process.
Pearson and Ellram (1995)
examined and explore the differences in decision criteria used for supplier selection in small and large organizations. Verma and Pullman (1998) examined the differences in weights assigned to decision criteria in
actual choice of suppliers and perceived importance of decision criteria before selecting the suppliers. Dulmin and Mininno (2003) given the financial importance and
T
1
Globa
l Jo
urna
l of M
anag
emen
t an
d Bu
sine
ss R
esea
rch
Volum
e XI Issu
e IvvvvV
Version
I
March
201
1
©2011 Global Journals Inc. (US)
the multi-objective nature of supplier selection decision and an effort is made to highlight those aspects that are
Early V
iew
crucial to process qualitative and quantitative performance measures. In this paper, the contribution of a multi-criteria decision aid method (PROMETHEE/GAIA) to such problems is investigated, together with how to allow for a simultaneous change of the weights (importance of performance criteria),
generating results that can be easily analyzed statistically, performing an innovative sensitivity analysis. In this paper, different multi-criteria making techniques have been discussed and compared to select the best suppliers.
.
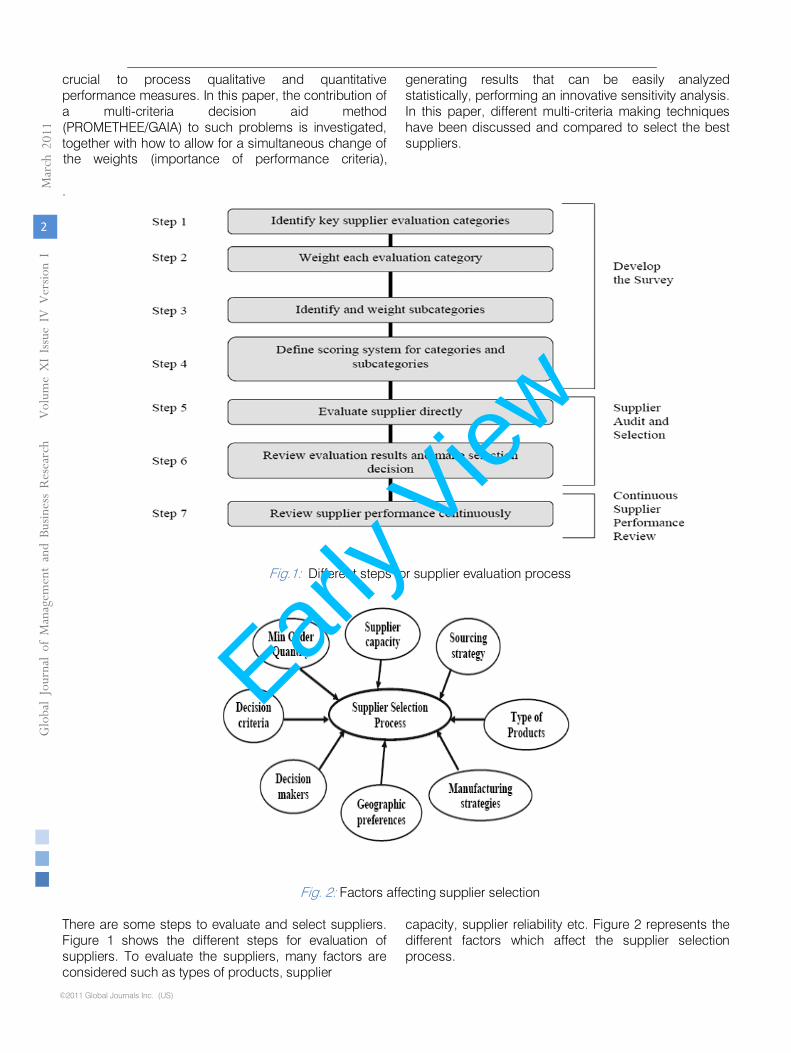
Fig.1: Different steps for supplier evaluation process
Fig. 2: Factors affecting supplier selection There are some steps to evaluate and select suppliers. Figure 1 shows the different steps for evaluation of suppliers. To evaluate the suppliers, many factors are considered such as types of products, supplier
capacity, supplier reliability etc. Figure 2 represents the different factors which affect the supplier selection process.
Selection of Suppliers through Different Multi-Criteria Decision Making Techniques
2
March
201
1 Gl oba
l Jo
urna
l of M
anag
emen
tan
d Bu
sine
ss R
esea
rch
Volum
e XI Issu
e IV
Ver
sion
I
©2011 Global Journals Inc. (US)
Early V
iew
II. DIFFERENT MULTI-CRITERIA TECHNIQUES
There are some multi-criteria techniques which are widely used to evaluate the suppliers. These techniques are:
Linear weighted point Categorical method Analytical Hierarchical Process (AHP) A Fuzzy Approach for Supplier
Evaluation & Selection Outranking methods Multi-Attribute Utility Technique (MAUT) Judgmental modeling Interpretive Structural Modeling
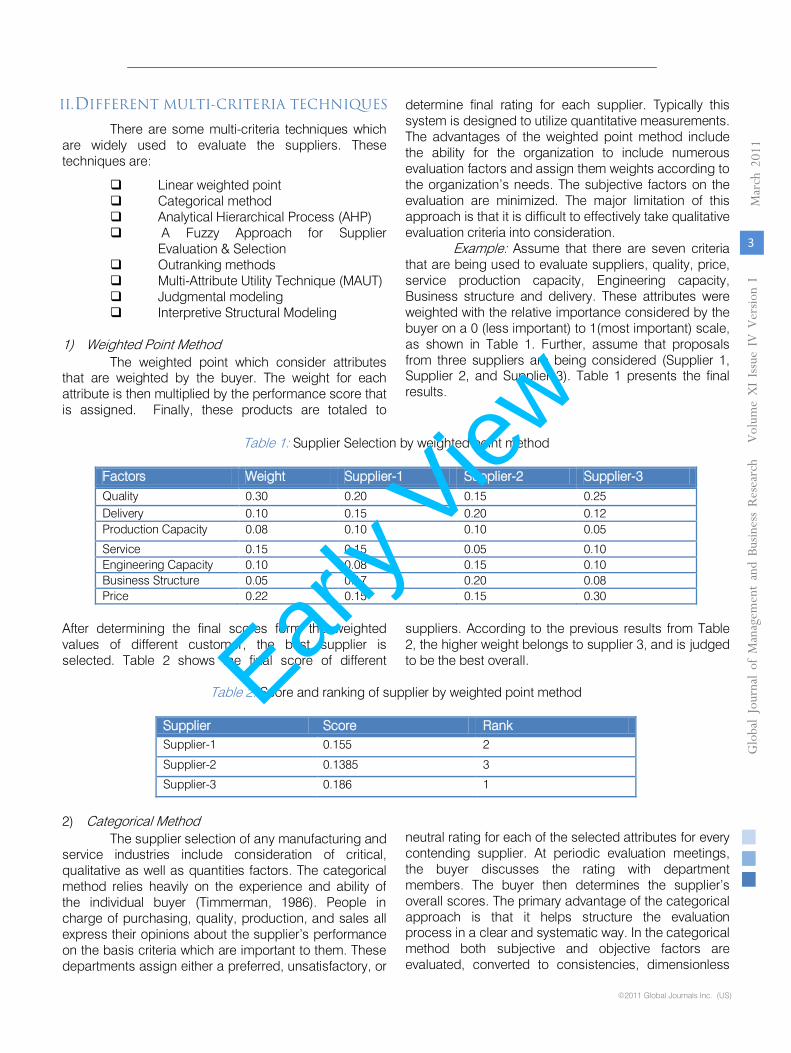
1) Weighted Point Method
The weighted point which consider attributes that are weighted by the buyer. The weight for each attribute is then multiplied by the performance score that is assigned. Finally, these products are totaled to
determine final rating for each supplier. Typically this
system is designed to utilize quantitative measurements.
The advantages of the weighted point method include the ability for the organization to include numerous evaluation factors and assign them weights according to the organization’s needs. The subjective factors on the evaluation are minimized. The major limitation of this approach is that it is difficult to effectively take qualitative evaluation criteria into consideration.
Example: Assume that there are seven criteria
that are being used to evaluate suppliers, quality, price, service production capacity, Engineering capacity, Business structure and delivery. These attributes were weighted with the relative importance considered by the buyer on a 0 (less important) to 1(most important) scale, as shown in Table
1. Further, assume that proposals
from three suppliers are being considered (Supplier 1, Supplier 2, and Supplier 3). Table 1 presents the final results.
Table 1: Supplier Selection by weighted point method
Factors Weight Supplier-1 Supplier-2 Supplier-3 Quality 0.30 0.20 0.15 0.25 Delivery 0.10 0.15 0.20 0.12 Production Capacity 0.08 0.10 0.10 0.05
Service 0.15 0.15 0.05 0.10 Engineering Capacity 0.10 0.08 0.15 0.10 Business Structure 0.05 0.17 0.20 0.08 Price 0.22 0.15 0.15 0.30
After determining the final scores form the weighted values of different customer, the best supplier is selected. Table 2 shows the final score of different
suppliers. According to the previous results from Table 2, the higher weight belongs to supplier 3, and is judged to be the best overall.
Table 2: Score and ranking of supplier by weighted point method
Supplier Score Rank Supplier-1 0.155 2
Supplier-2 0.1385 3
Supplier-3 0.186 1
2) Categorical Method
The supplier selection of any manufacturing and service industries include consideration of critical, qualitative as well as quantities factors. The categorical method relies heavily on the experience and ability of the individual buyer (Timmerman, 1986). People in charge of purchasing, quality, production, and sales all express their opinions about the supplier’s performance on the basis criteria which are important to them. These departments assign either a preferred, unsatisfactory, or
neutral rating for each of the selected attributes for every contending supplier. At periodic evaluation meetings, the buyer discusses the rating with department members. The buyer then determines the supplier’s overall scores. The primary advantage of the categorical approach is that it helps structure the evaluation process in a clear and systematic way. In the categorical method both subjective and objective factors are evaluated, converted to consistencies, dimensionless
Selection of Suppliers through Different Multi-Criteria Decision Making Techniques
3
Globa
l Jo
urna
l of M
anag
emen
t an
d Bu
sine
ss R
esea
rch
Volum
e XI Issu
e IvvvvV
Version
I
March
201
1
©2011 Global Journals Inc. (US)
Early V
iew

indices and then combined with the critical measure to yield the performance measure of a supplier. The eight-step procedures are given as follows.
1. Critical factors, objective factors, and subjective factors are defined Critical factors If a presence of a factor precludes a supplier from further consideration, regardless the other factor that might be exist, then the factor is known as critical factor. The critical factor either must or must not be present in a supplier for further consideration. For example if price is considered as critical factor, a supplier whose product price exceeds a certain level can be eliminated and not be considered further. Objective factors Objective factor are those which can be evaluated in monetary terms price of the purchased materials, its quality and cost of transportation from buyer sites. Subjective factors
Subjective factor are those factors which are difficult to quantify but are important enough in the decision making process to warrant there consideration. Example: the prestige of supplier, their after sale service and flexibility. 2. Critical factor measures are evaluated
Cp= 1 if price of the materials, components, and services is less than or equal to the maximum price affordable and Cp =0 otherwise, Cd= 1 if delivery of the materials, and services is within acceptable Interval of the planned due date and Cd = 0 otherwise, Cq =1 if quality of the materials, components, and services meets the purchasing organizations standards and Cq = 0 otherwise.
Critical Factor Measure, CFM=Cp×Cd×Cq 3. Objective factor measures are evaluated CPm =Purchase price offered by the supplier CPm =Cp×Q Where, Cp=Unit price of 1 unit of the product and Q=Economic order quantity CQm =Quality cost associate with items purchased by the supplier. CQm =Cq×Q×P Where, Cq=Opportunity cost of 1 unit of manufactured product that does not meet the quality standard of the organization and P=Percentage defective. CDm=Cost associated with delays in delivery if purchase is made from supplier.
CDm =Q(Cs×T ++Cc×T--) Where, Cs=Stock out cost per unit per day for late delivery.
CT=Carrying cost per unit per day for early delivery. T+=Expected Lateness of order purchased (days) T--=Expected Earliness of order purchased (days) CTm =Transportation cost of the purchased item. CTm =CT×W×d Where, CT=Cost of transportation per ton per mile. W=Weight of the economic order quantity
d =Distance from the buyer to supplier in mile.
4. Subjective factor weights are determined The subjective factor weight is a measure of the relative importance of the subjective factor in the selection of decision and is determine using the preference theory and AHP approach.
5. Supplier weight is determined To determine the supplier weight, the relative desirability of each supplier with respect to the each subjective factor is determined.
6. Subjective factor measures are evaluated Subjective factor measure (SFM) is obtained by the AHP approach.
7. Objective factor decision weight is determined Objective factor measure (OFM), Total cost of objective measure, Cm=CP+ CQ+ CD+ Ct
8. Supplier performance measures are calculated Supplier performance measure (SPM) =CFM(X×OFM+ (1-X) ×SFM)
Where X is the relative importance of objective factor in decision making
Some special characteristics of categorical method are: It is also inexpensive and requires a minimum of performance data. Vendors with composite high or low ratings are noted, and future supply decisions are influenced by them It is also inexpensive and requires a minimum of performance data It relies heavily on the experience and ability of the individual buyer
3) A Fuzzy Approach For Supplier Evaluation &
Selection During recent years, how to determine suitable
suppliers in the supply chain has become a key strategic consideration. However, the nature of these decisions usually is complex and unstructured. In general, many quantitative and qualitative factors such
Selection of Suppliers through Different Multi-Criteria Decision Making Techniques
4
March
201
1 Gl oba
l Jo
urna
l of M
anag
emen
tan
d Bu
sine
ss R
esea
rch
Volum
e XI Issu
e IV
Ver
sion
I
©2011 Global Journals Inc. (US)
Early V
iew
as quality, price, and flexibility and delivery performance must be considered to determine suitable suppliers. In this method, linguistic values are used to assess the ratings and weights for these factors. These linguistic ratings can be expressed in trapezoidal or triangular fuzzy numbers. Since human judgments including preferences are often vague and cannot estimate his preference with an exact numerical value. A more realistic approach may be to use linguistic assessments instead of numerical values. In other words, the ratings and weights of the criteria in the problem are assessed by means of linguistic variables We can convert the decision matrix into a fuzzy decision matrix and construct a weighted-normalized fuzzy decision matrix once the decision-makers’ fuzzy ratings have been pooled. The fuzzy positive ideal solution (FPIS) is defined and the fuzzy negative ideal solution (FNIS). And then, a vertex method is applied in this method to calculate the distance between two fuzzy ratings. Using
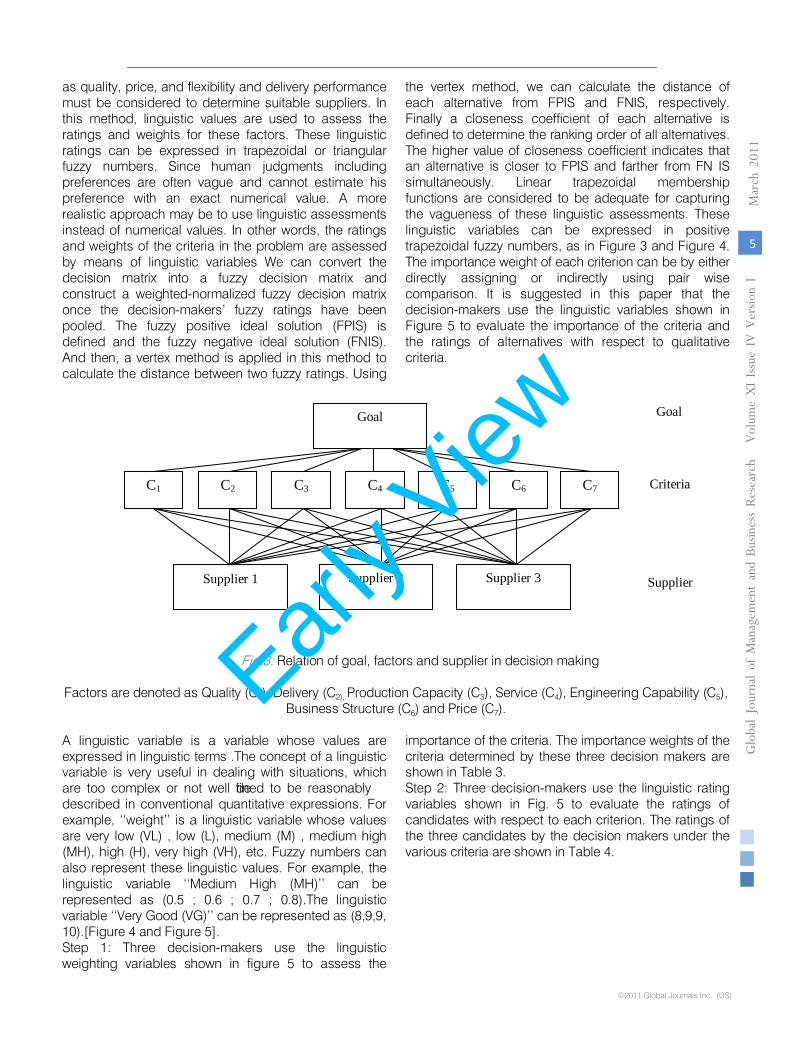
the vertex method, we can calculate the distance of each alternative from FPIS and FNIS, respectively. Finally a closeness coefficient of each alternative is defined to determine the ranking order of all alternatives. The higher value of closeness coefficient indicates that an alternative is closer to FPIS and farther from FN IS simultaneously. Linear trapezoidal membership functions are considered to be adequate for capturing the vagueness of these linguistic assessments. These linguistic variables can be expressed in positive trapezoidal fuzzy numbers, as in Figure 3 and Figure 4. The importance weight of each criterion can be by either directly assigning or indirectly using pair wise comparison. It is suggested in this paper that the decision-makers use the linguistic variables shown in Figure 5 to evaluate the importance of the criteria and the ratings of alternatives with respect to qualitative criteria.
Fig.3: Relation of goal, factors and supplier in decision making
Factors are denoted as Quality (C1), Delivery (C2), Production Capacity (C3), Service (C4), Engineering Capability (C5),
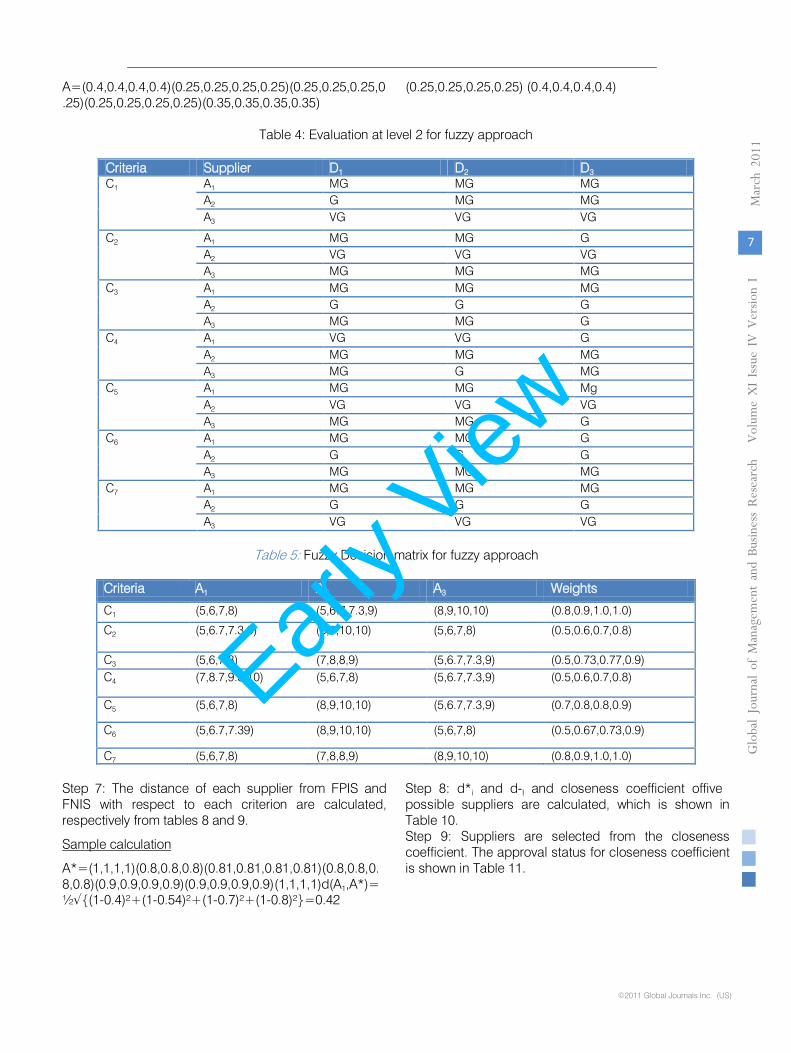
Business Structure (C6) and Price (C7). A linguistic variable is a variable whose values are expressed in linguistic terms .The concept of a linguistic variable is very useful in dealing with situations, which are too complex or not well defined to be reasonably described in conventional quantitative expressions. For example, ‘‘weight’’ is a linguistic variable whose values are very low (VL) , low (L), medium (M) , medium high (MH), high (H), very high (VH), etc. Fuzzy numbers can also represent these linguistic values. For example, the linguistic variable ‘‘Medium High (MH)’’ can be represented as (0.5 ; 0.6 ; 0.7 ; 0.8).The linguistic variable ‘‘Very Good (VG)’’ can be represented as (8,9,9, 10).[Figure 4 and Figure 5]. Step 1: Three decision-makers use the linguistic weighting variables shown in figure 5 to assess the
importance of the criteria. The importance weights of the criteria determined by these three decision makers are shown in Table 3. Step 2: Three decision-makers use the linguistic rating variables shown in Fig. 5 to evaluate the ratings of candidates with respect to each criterion. The ratings of the three candidates by the decision makers under the various criteria are shown in Table 4.
Goal
Criteria
Supplier
Goal
C1
C2 C3 C4 C5 C6 C7
Supplier 1 Supplier 2
Supplier 3
Selection of Suppliers through Different Multi-Criteria Decision Making Techniques
5
Globa
l Jo
urna
l of M
anag
emen
t an
d Bu
sine
ss R
esea
rch
Volum
e XI Issu
e IvvvvV
Version
I
March
201
1
©2011 Global Journals Inc. (US)
Early V
iew
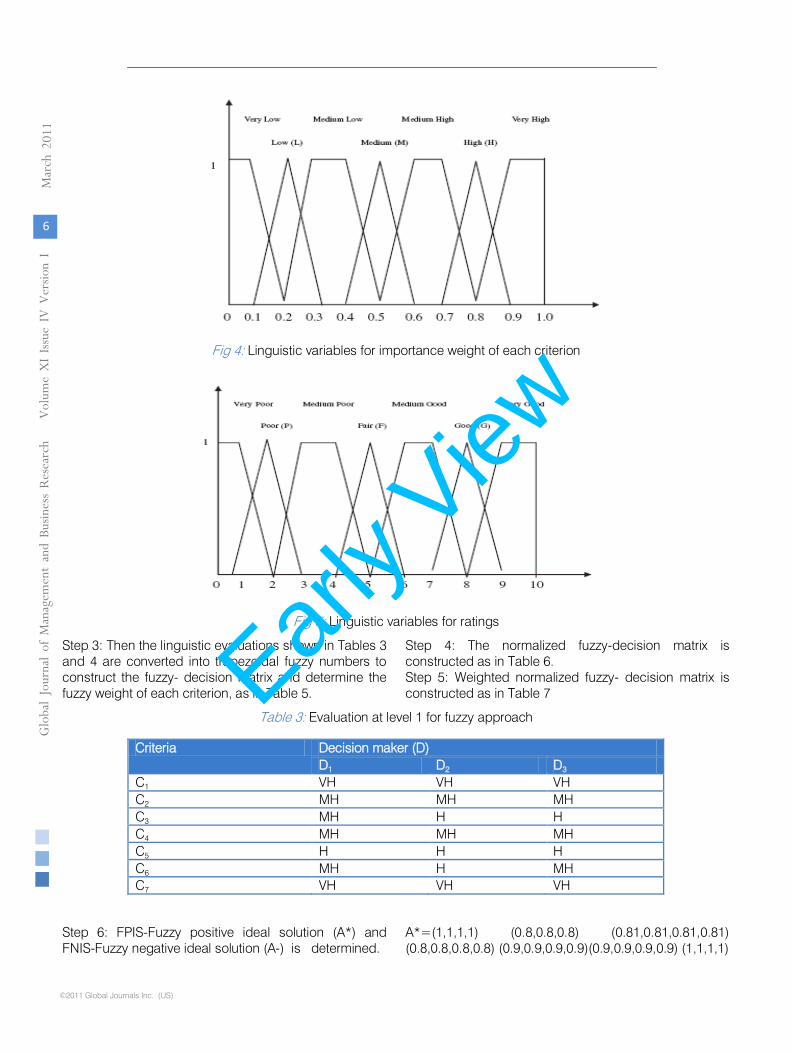
Fig 4: Linguistic variables for importance weight of each criterion
Fig 5: Linguistic variables for ratings
Step 3: Then the linguistic evaluations shown in Tables 3 and 4 are converted into trapezoidal fuzzy numbers to construct the fuzzy- decision matrix and determine the fuzzy weight of each criterion, as in Table 5.
Step 4: The normalized fuzzy-decision matrix is constructed as in Table 6. Step 5: Weighted normalized fuzzy- decision matrix is constructed as in Table 7
Table 3: Evaluation at level 1 for fuzzy approach
Step 6: FPIS-Fuzzy positive ideal solution (A*) and FNIS-Fuzzy negative ideal solution (A-) is determined.
A*=(1,1,1,1) (0.8,0.8,0.8) (0.81,0.81,0.81,0.81) (0.8,0.8,0.8,0.8) (0.9,0.9,0.9,0.9)(0.9,0.9,0.9,0.9) (1,1,1,1)
Criteria Decision maker (D) D1 D2 D3
C1 VH VH VH C2 MH MH MH C3 MH H H C4 MH MH MH C5 H H H C6 MH H MH C7 VH VH VH
Selection of Suppliers through Different Multi-Criteria Decision Making Techniques
6
March
201
1 Gl oba
l Jo
urna
l of M
anag
emen
tan
d Bu
sine
ss R
esea
rch
Volum
e XI Issu
e IV
Ver
sion
I
©2011 Global Journals Inc. (US)
Early V
iew
A=(0.4,0.4,0.4,0.4)(0.25,0.25,0.25,0.25)(0.25,0.25,0.25,0.25)(0.25,0.25,0.25,0.25)(0.35,0.35,0.35,0.35)
(0.25,0.25,0.25,0.25) (0.4,0.4,0.4,0.4)
Table 4: Evaluation at level 2 for fuzzy approach
Criteria Supplier D1 D2 D3 C1 A1 MG MG MG
A2 G MG MG A3 VG VG VG
C2 A1 MG MG G A2 VG VG VG A3 MG MG MG
C3 A1 MG MG MG A2 G G G A3 MG MG G
C4 A1 VG VG G A2 MG MG MG A3 MG G MG
C5
A1 MG MG Mg A2 VG VG VG A3 MG MG G
C6 A1 MG MG G A2 G G G A3 MG MG MG
C7 A1 MG MG MG A2 G G G A3 VG VG VG
Table 5: Fuzzy Decision matrix for fuzzy approach
Criteria A1 A2 A3 Weights
C1 (5,6,7,8) (5,6.7,7.3,9) (8,9,10,10) (0.8,0.9,1.0,1.0)
C2 (5,6.7,7.3,9) (8,9,10,10) (5,6,7,8) (0.5,0.6,0.7,0.8)
C3 (5,6,7,8) (7,8,8,9) (5,6.7,7.3,9) (0.5,0.73,0.77,0.9) C4 (7,8.7,9.3,10) (5,6,7,8) (5,6.7,7.3,9) (0.5,0.6,0.7,0.8)
C5 (5,6,7,8) (8,9,10,10) (5,6.7,7.3,9) (0.7,0.8,0.8,0.9)
C6 (5,6.7,7.39) (8,9,10,10) (5,6,7,8) (0.5,0.67,0.73,0.9)
C7 (5,6,7,8) (7,8,8,9) (8,9,10,10) (0.8,0.9,1.0,1.0) Step 7: The distance of each supplier from FPIS and FNIS with respect to each criterion are calculated, respectively from tables 8 and 9.
A*=(1,1,1,1)(0.8,0.8,0.8)(0.81,0.81,0.81,0.81)(0.8,0.8,0.8,0.8)(0.9,0.9,0.9,0.9)(0.9,0.9,0.9,0.9)(1,1,1,1)d(A1,A*)=½√{(1-0.4)²+(1-0.54)²+(1-0.7)²+(1-0.8)²}=0.42
Step 8: d*i and d-I and closeness coefficient of five possible suppliers are calculated, which is shown in Table 10. Step 9: Suppliers are selected from the closeness coefficient. The approval status for closeness coefficient is shown in Table 11.
Sample calculation
Selection of Suppliers through Different Multi-Criteria Decision Making Techniques
7
Globa
l Jo
urna
l of M
anag
emen
t an
d Bu
sine
ss R
esea
rch
Volum
e XI Issu
e IvvvvV
Version
I
March
201
1
©2011 Global Journals Inc. (US)
Early V
iew

Table 6: Normalized Fuzzy Decision matrix for fuzzy approach
Criteria A1 A2 A3 C1 (0.5,0.6,0.7,0.8) (0.5,0.67,0.73,0.9) (0.8,0.9,1.0,1.0) C2 (0.5,0.67,0.73,0.9) (0.8,0.9,1,1) (0.5,0.6,0.7,0.8)
C3 (0.5,0.6,0.7,0.8) (0.7,0.8,0.8,0.9) (0.5,0.67,0.73,0.9)
C4 (0.7,0.87,0.93,1) (0.5,0.6,0.7,0.8) (0.5,0.67,0.73,0.9)
C5 (0.5,0.6,0.7,0.8) (0.8,0.9,1.0,1.0) (0.5,0.67,0.73,0.9)
C6 (0.5,0.67,0.73,0.9) (0.8,0.9,1.0,1.0) (0.5,0.6,0.7,0.8)
C7 (0.5,0.6,0.7,0.8) (0.7,0.8,0.8,0.9) (0.8,0.9,1.0,1.0)
Table 7: Weighted normalized Fuzzy decision matrix for fuzzy approach
Criteria A1 A2 A3 C1 (0.4,0.54,0.7,0.8) (0.4,0.60.73,0.9) (0.64,0.81,1.0,1.0) C2 (0.25,0.4,0.51,0.72) (0.4,0.54,0.7,0.8) (0.25,0.36,0.49,0.64) C3 (0.25,0.44,0.54,0.72) (0.35,0.58,0.62,0.81) (0.25,0.49,0.56,0.81) C4 (0.35,0.52,0.65,0.8) (0.25,0.36,0.49,0.64) (0.25,0.4,0.51,0.72)
C5 (0.35,0.48,0.56,0.72) (0.56,0.72,0.8,0.9) (0.35,0.54,0.58,0.81) C6 (0.25,0.45,0.53,0.81) (0.4,0.60.73,0.9) (0.25,0.4,0.51,0.72)
C7 (0.4,0.54,0.7,0.8) (0.56,0.72,0.8,0.9) (0.64,0.81,1.0,1.0)
Table 8: Distance between Ai (1, 2, 3) and A* for fuzzy approach
Distance C1 C2 C3 C4 C5 C6 C7 d(A 1 ,A*) 0.42 0.37 0.36 0.27 0.4 0.44 0.42 d(A 2 ,A*) 0.39 0.24 0.27 0.39 0.2 0.30 0.28 d(A 3 ,A*) 0.2 0.39 0.35 0.37 0.37 0.46 0.2
Table 9: Distance between A*i (1, 2, 3) and A-i (1, 2, 3) for fuzzy approach
Distance C1 C2 C3 C4 C5 C6 C7 d(A 1 ,A*) 0.26 0.28 0.29 0.37 0.22 0.33 0.26 d(A 2 ,A*) 0.32 0.39 0.38 0.24 0.41 0.47 0.37 d(A 3 ,A*) 0.49 0.24 0.34 0.28 0.27 0.28 0.49
Table 10: Computation of d*i, d-i, Closeness coefficient CCi for fuzzy approach
Supplier d*i d-i d*i+ d-I CC=d-i /(d*i+ d-I ) A1 2.68 2.01 4.69 0.43 A2 2.07 2.58 4.65 0.56 A3 2.34 2.39 4.73 0.51
Table 11: Approval Status for Closeness Coefficient (CCi) for fuzzy approach
Closeness coefficient (CCi) Assessment status
CCi є [0,0.2] Do not recommend CCi є [0.2,0.4] Recommend with high risk CCi є [0.4,0.6] Recommend with low risk CCi є [0.6,0.8] Approved
CCi є [0.8,1.0] Approved and preferred
Selection of Suppliers through Different Multi-Criteria Decision Making Techniques
8
March
201
1 Globa
l Jo
urna
l of M
anag
emen
tan
d Bu
sine
ss R
esea
rch
Volum
e XI Issu
e IV
Ver
sion
I
©2011 Global Journals Inc. (US)
Early V
iew
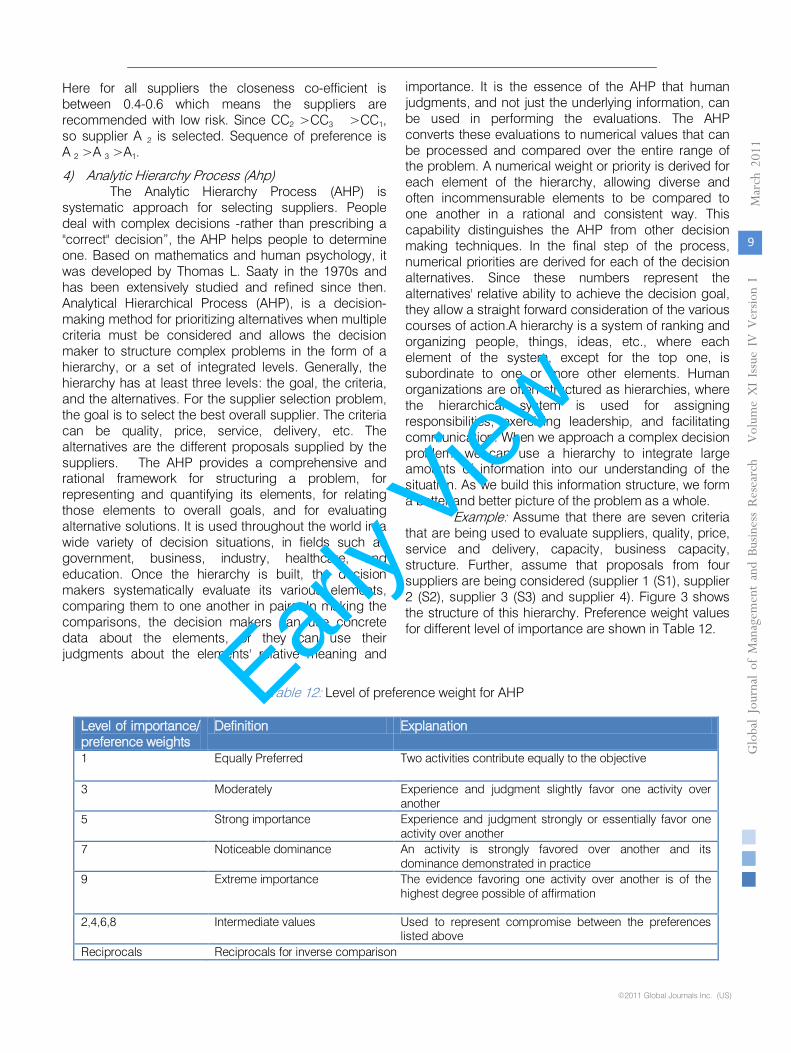
Here for all suppliers the closeness co-efficient is between 0.4-0.6 which means the suppliers are recommended with low risk. Since CC2 >CC3 >CC1, so supplier A 2 is selected. Sequence of preference is A 2 >A 3 >A1. 4) Analytic Hierarchy Process (Ahp)
The Analytic Hierarchy Process (AHP) is systematic approach for selecting suppliers. People deal with complex decisions -rather than prescribing a "correct" decision”, the AHP helps people to determine one. Based on mathematics and human psychology, it was developed by Thomas L. Saaty in the 1970s and has been extensively studied and refined since then. Analytical Hierarchical Process (AHP), is a decision-making method for prioritizing alternatives when multiple criteria must be considered and allows the decision maker to structure complex problems in the form of a hierarchy, or a set of integrated levels. Generally, the hierarchy has at least three levels: the goal, the criteria, and the alternatives. For the supplier selection problem, the goal is to select the best overall supplier. The criteria can be quality, price, service, delivery, etc. The alternatives are the different proposals supplied by the suppliers. The AHP provides a comprehensive and rational framework for structuring a problem, for representing and quantifying its elements, for relating those elements to overall goals, and for evaluating alternative solutions. It is used throughout the world in a wide variety of decision situations, in fields such as government, business, industry, healthcare, and education. Once the hierarchy is built, the decision makers systematically evaluate its various elements, comparing them to one another in pairs. In making the comparisons, the decision makers can use concrete data about the elements, or they can use their judgments about the elements' relative meaning and
importance. It is the essence of the AHP that human judgments, and not just the underlying information, can be used in performing the evaluations. The AHP converts these evaluations to numerical values that can be processed and compared over the entire range of the problem. A numerical weight or priority is derived for each element of the hierarchy, allowing diverse and often incommensurable elements to be compared to one another in a rational and consistent way. This capability distinguishes the AHP from other decision making techniques. In the final step of the process, numerical priorities are derived for each of the decision alternatives. Since these numbers represent the alternatives' relative ability to achieve the decision goal, they allow a straight forward consideration of the various courses of action.A hierarchy is a system of ranking and organizing people, things, ideas, etc., where each element of the system, except for the top one, is subordinate to one or more other elements. Human organizations are often structured as hierarchies, where the hierarchical system is used for assigning responsibilities, exercising leadership, and facilitating communication. When we approach a complex decision problem, we can use a hierarchy to integrate large amounts of information into our understanding of the situation. As we build this information structure, we form a better and better picture of the problem as a whole. Example: Assume that there are seven criteria that are being used to evaluate suppliers, quality, price, service and delivery, capacity, business capacity, structure. Further, assume that proposals from four suppliers are being considered (supplier 1 (S1), supplier 2 (S2), supplier 3 (S3) and supplier 4). Figure 3 shows the structure of this hierarchy. Preference weight values for different level of importance are shown in Table 12.
Table 12: Level of preference weight for AHP
Level of importance/ preference weights
Definition Explanation
1 Equally Preferred Two activities contribute equally to the objective
3 Moderately Experience and judgment slightly favor one activity over another
5 Strong importance Experience and judgment strongly or essentially favor one activity over another
7 Noticeable dominance An activity is strongly favored over another and its dominance demonstrated in practice
9 Extreme importance The evidence favoring one activity over another is of the highest degree possible of affirmation
2,4,6,8 Intermediate values Used to represent compromise between the preferences listed above
Reciprocals Reciprocals for inverse comparison
Selection of Suppliers through Different Multi-Criteria Decision Making Techniques
9
Globa
l Jo
urna
l of M
anag
emen
t an
d Bu
sine
ss R
esea
rch
Volum
e XI Issu
e IvvvvV
Version
I
March
201
1
©2011 Global Journals Inc. (US)
Early V
iew
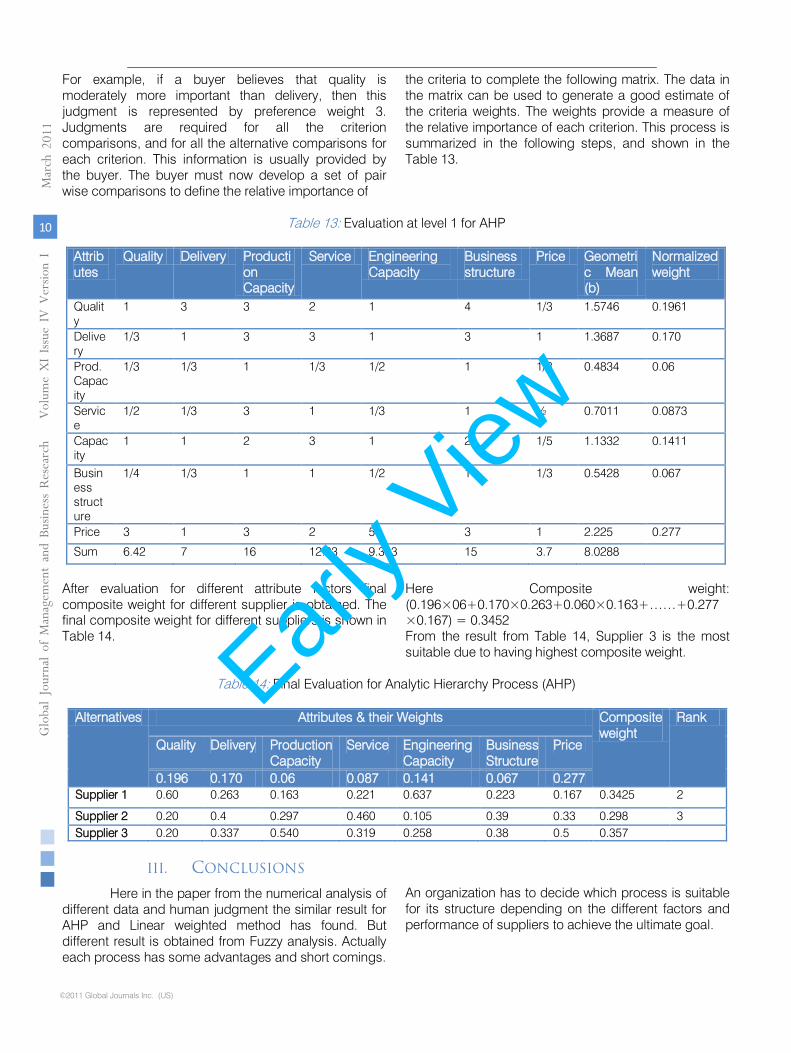
For example, if a buyer believes that quality is moderately more important than delivery, then this judgment is represented by preference weight 3. Judgments are required for all the criterion comparisons, and for all the alternative comparisons for each criterion. This information is usually provided by the buyer. The buyer must now develop a set of pair wise comparisons to define the relative importance of
the criteria to complete the following matrix. The data in the matrix can be used to generate a good estimate of the criteria weights. The weights provide a measure of the relative importance of each criterion. This process is summarized in the following steps, and shown in the Table 13.
Table 13: Evaluation at level 1 for AHP
Attributes
Quality Delivery Production Capacity
Service Engineering Capacity
Business structure
Price Geometric Mean (b)
Normalized weight
Quality
1 3 3 2 1 4 1/3 1.5746 0.1961
Delivery
1/3 1 3 3 1 3 1 1.3687 0.170
Prod. Capacity
1/3 1/3 1 1/3 1/2 1 1/3 0.4834 0.06
Service
1/2 1/3 3 1 1/3 1 ½ 0.7011 0.0873
Capacity
1 1 2 3 1 2 1/5 1.1332 0.1411
Business structure
1/4 1/3 1 1 1/2 1 1/3 0.5428 0.067
Price 3 1 3 2 5 3 1 2.225 0.277
Sum 6.42 7 16 12.33 9.333 15 3.7 8.0288
After evaluation for different attribute factors final composite weight for different supplier is obtained. The final composite weight for different suppliers is shown in Table 14.
Here Composite weight: (0.196×06+0.170×0.263+0.060×0.163+……+0.277×0.167) = 0.3452 From the result from Table 14, Supplier 3 is the most suitable due to having highest composite weight.
Table 14: Final Evaluation for Analytic Hierarchy Process (AHP)
Alternatives Attributes & their Weights Composite
weight Rank
Quality Delivery Production Capacity
Service Engineering Capacity
Business Structure
Price
0.196 0.170 0.06 0.087 0.141 0.067 0.277 Supplier 1 0.60 0.263 0.163 0.221 0.637 0.223 0.167 0.3425 2
Supplier 2 0.20 0.4 0.297 0.460 0.105 0.39 0.33 0.298 3 Supplier 3 0.20 0.337 0.540 0.319 0.258 0.38 0.5 0.357 1
III. CONCLUSIONS
Here in the paper from the numerical analysis of different data and human judgment the similar result for AHP and Linear weighted method has found. But different result is obtained from Fuzzy analysis. Actually each process has some advantages and short comings.
An organization has to decide which process is suitable for its structure depending on the different factors and performance of suppliers to achieve the ultimate goal.
Selection of Suppliers through Different Multi-Criteria Decision Making Techniques
10
March
201
1 Gl oba
l Jo
urna
l of M
anag
emen
tan
d Bu
sine
ss R
esea
rch
Volum
e XI Issu
e IV
Ver
sion
I
©2011 Global Journals Inc. (US)
Early V
iew
References Références Referencias
1) Abratt, R., (1986), Industrial buying in high-tech markets, Industrial Marketing Management, 15(4): pp.293-298.
2) Avery, S. (1999), Parts availability crucial to MRO supplier selection, Purchasing, 126(1): pp. 107-108.
3) Dulmin, R. and Mininno, V. (2003), Supplier selection using a multi-criteria decision aid method, Journal of Purchasing and Supply Management, 9(4) pp. 177-187.
4) Gonzalez, M. E., Quesada, G. and Monge, C. A. M. (2004), Determining the importance of the supplier selection process in manufacturing: a case study, International Journal of Physical Distribution & Logistics Management, 34(6): pp. 492-504.
5) Humphreys, P. K., Wong, Y. K. and Chan, F. T. S. (2003), Integrating environmental criteria into the supplier selection process, Journal of Materials Processing Technology, 138(1-3): pp. 349-356.
6) Lee, E.-K., Ha, S. and Kim, S.-K. (2001), Supplier Selection and Management System Considering Relationships in Supply Chain Management, IEEE Transactions on Engineering Management, 47(4): pp. 307-318.
7) Lin, C., Chow, W. S., Madu, C. N., Kuei, C.-H. and Yu, P. P. (2005) , A structural equation model of supply chain quality management and organizational performance, International Journal of Production Economics, 96(3): pp. 355-365.
8) Kannan, V. R. and Tan, K. C. (2002), Supplier selection and assessment: Their impact on business performance, Journal of Supply Chain Management: A Global Review of Purchasing and Supply, 38(4): pp. 11-21.
9) Pearson, J. M. and Ellram, L. M. (1995), Supplier selection and evaluation in small versus large electronics firms, Journal of Small Business Management, 33(4): pp. 53-65.
10) Sharland, A., Eltantawy, R. A. and Giunipero, L. C. (2003), The impact of cycle time on supplier selection and subsequent performance outcomes, Journal of Supply Chain Management: A Global Review of Purchasing and Supply, 39(3)
11) Svensson, G. (2004), Supplier segmentation in the automotive industry: A dyadic approach of a managerial model, International Journal of Physical Distribution & Logistics Management, 34(1/2): pp. 12-38.
12) Verma, R. and Pullman, M. E. (1998), An Analysis of the Supplier Selection Process,
OMEGA- International Journal of Management Science, 26(6): pp. 739-750.
13) Yan, H. and Wei, Q. (2002), Determining compromise weights for group decision making, Journal of the Operational Research Society, 53(6): pp. 680-687.
Selection of Suppliers through Different Multi-Criteria Decision Making Techniques
11
Globa
l Jo
urna
l of M
anag
emen
t an
d Bu
sine
ss R
esea
rch
Volum
e XI Issu
e IvvvvV
Version
I
March
201
1
©2011 Global Journals Inc. (US)
Early V
iew

©2011 Global Journals Inc. (US)
This page is intentionally left blank
12
March
201
1 Gl oba
l Jo
urna
l of M
anag
emen
tan
d Bu
sine
ss R
esea
rch
Volum
e XI Issu
e IV
Ver
sion
I
©2011 Global Journals Inc. (US)
Early V
iew
Effectiveness of Microfinance Banks in Alleviating Poverty in Kwara State Nigeria
By Yahaya, K. A, Osemene, O. F. and Abdulraheem, A.
Abstract : Microfinance banks supply loans, savings and other financial services to the poor and low income population on a sustainable basis and help in the alleviation of poverty. This article therefore examines the effectiveness of microfinance banks in alleviation of poverty in Kwara state Nigeria. The data collected were analyzed through the use of t-test and Analysis of Variance (ANOVA). From the research findings, results revealed that microfinance has significant role to play in the economy, as it helps reduce poverty by providing financial services to the active poor, help in generating employment and also provide small loans to grow small businesses. It is therefore recommended that regulatory and other statutory bodies should monitor the interest rate on loans and advances to make it accessible to micro-clients that is the economically active poor. Government should make available necessary infrastructural facilities that will help increase the output of micro entrepreneurs. Also, Microfinance policy should further be publicized so that members of low income groups will be aware of what microfinance institutions have to offer them and how they can obtain financial services to grow their small businesses.
Keywords : Microfinance banks, Alleviating, Poverty, Active poor, Nigeria.
I. INTRODUCTION
he impact of microfinance in the economic growth and development of a state can not be overemphasized. The concept of microfinance is
not new. Savings and credit groups that have operated for centuries include the "susus" of Ghana, "chit funds" in India, "tandas" in Mexico, "arisan" in Indonesia, “Ajo” in Nigeria, "cheetu" in Sri Lanka, "tontines" in West Africa, and "pasanaku" in Bolivia, as well as numerous savings clubs and burial societies found all over the world (Archives 2006). Formal credit and savings institutions for the poor have also been around for decades, providing customers who were traditionally neglected by commercial banks a way to obtain financial services through cooperatives and development finance institutions CGAP (2006). Microfinance is about providing financial services to the poor who are not served by the conventional formal financial institutions (e.g. commercial banks). It is about extending the frontiers of financial service provision. The provision of
About : Department of Accounting and Finance, Faculty of Business and Social Sciences, University of Ilorin, Ilorin, Nigeria.
such financial services requires innovative delivery channels and methodologies. Bruno, Squire and Ravallion (1995) indicated that there are ample evidences that policies designed to foster economic growth significantly reduce poverty but that policies aimed significantly at alleviating poverty are important. For example, program that provide credit and build human capital try to eliminate the causes of poverty; it is therefore relative to the establishment of microfinance banks a strategy for poverty alleviation in kwara state. According to Muktar (2009) credit has been recognized as an essential tool for promoting small and medium enterprises (SMEs). Over the years, several traditional microfinance institutions, such as self help groups, esusu, and rotating savings and credit associations (ROSCA) have been set up to provide credit to both the rural and urban dweller in kwara state. When the civilian administration came into office on 29th of May 1999, it paid attention to poverty reduction. This was based on the fact that robust economic growth cannot be achieved without putting in place well focused program to reduce poverty through empowering the people by increasing their access to factor of production, especially credit. During the regime preceding this administration, the World Bank tried to focus on poverty reduction in Nigeria. The study not only profile poverty but also established qualitatively the trend of poverty encroachment to development from 1980-1996. The study showed that poverty level in Nigeria has been extremely high with about two- third of the population living below the poverty line in 1996. In absolute figures however, the population in poverty continued to rise over the sixteen year period (i.e. 1980-1996). The estimated number rose from 18 million in 1980 to 35 million in 1985 to 39 million in 1992 and 67 million in 1996 and by the end of 1999, estimated number of poor rose to 74.2 million (CBN economic and financial review vol 39 no 4) this high level of poverty is an indication that point out the need to improve the output of democratic governance and this output is expected to have an impact on the poverty level. Several efforts and programs have been made in the past by Nigerian Government to cater for this sector, but have proved ineffective. Nigeria is the seventh world largest exporter of oil, yet ranks 158 out of
T
13
Globa
l Jo
urna
l of M
anag
emen
t an
d Bu
sine
ss R
esea
rch
Volum
e XI Issu
e IvvvvV
Version
I
March
201
1
©2011 Global Journals Inc. (US)
Early V
iew
©2011 Global Journals Inc. (US)
the 188 countries of the world in terms of quality of life (UNDP, 2007). The latest Human Development Programme indicates that 70.8 per cent and 92.4 per cent of Nigerian population live below US$1 (N117) and US$2 (N234) a day respectively (UNDP, 2007). Available statistics indicate that poverty has become endemic in Nigeria and is on the increase. Nkamnebe (2008) stated that in Nigeria poverty increased from 18 million people in 1980, to 35 million people in 1985; 39 million people in 1992; 67 people in 1996; and 74 million people in 1999. At present, about two-third of the Nigeria’s population (about 150 million) are poor. All these support the ranking of Nigeria among the world’s least developed nations of the world (UNDP, 2007). Statistically in Nigeria, the formal financial system such as commercial banks provide services to about 35% of the economically active population, while the remaining 65% (over 80 million people) who carry on micro, small and medium scale enterprises (MSMEs) and who are generally regarded as the engine of growth for the economy remain unserved, they are excluded from access to financial services (CBN 2005) and (Bamisile 2006). The government of kwara state have also in past initiated a number of publicly financed micro/rural credit program targeted at the poor to enhance the flow financial services to rural areas, example of such program are Agricultural Credit Guarantee Scheme (ACGs) Rural banking program and sectoral allocation of credit. Other institutional arrangement include the establishment of Nigerian Agricultural Cooperative and Rural development Bank (NACRDB) the national directorate of employment (NDE) to mention a few with the mandate of providing financial services to alleviate poverty. This concern has bought the need to focus attention on the microfinance banks as an existing pragmatic scheme capable of having the desired goal of poverty alleviation in the Nigerian society and as well as contributing significantly to the economic development of the country.
II. OBJECTIVES OF THE STUDY
The objectives of the study include: i. to examine the poverty situation in Kwara State,
Nigeria. ii. to investigate the activities of microfinance
banks in Kwara State Nigeria. iii. to examines the effectiveness of microfinance
banks in the alleviating of poverty in Kwara state, Nigeria.
iv. provide suggestions on how to solve the problems as a step towards enhancing the economic status of members, thereby serving to reduce the rate of poverty alleviation among them.
III. RESEARCH QUESTIONS
In order to pursue the objective of the study, the following research questions were formulated namely:
1. Do microfinance banks assist in promoting financial success of their customers?
2. Do microfinance banks provide loans to start small scale businesses?
3. Do microfinance banks help in the alleviation of poverty in Kwara State, Nigeria?
Hypotheses were thereby formulated and stated in the null form as stated below:
Ho1: There is no significant difference in the effectiveness of microfinance banks in the alleviating of poverty in Kwara state based on location. Ho2: There is no significant difference in effectiveness of microfinance banks in the alleviating of poverty in Kwara state based on based on information technology operation.
IV. LITERATURE REVIEW
History and Definition of Microfinance In the 1800s, credit union was developed by Friedrich Wilhelm Raiffeisen and his supporters to assist the rural population to break out of their dependence on moneylenders and to improve their welfare. From 1870, the unions expanded rapidly over a large sector of the Rhine Province and other regions of the German States. The cooperative movement quickly spread to other countries in Europe and North America, and eventually, supported by the cooperative movement in developed countries and donors. In Indonesia, the Indonesian People's Credit Banks (BPR) or The Bank Perkreditan Rakyat opened in 1895. The BPR became the largest microfinance system in Indonesia with close to 9,000 units. In the early 1900s, various adaptations of these models began to appear in parts of rural Latin America. While the goal of such rural finance interventions was usually defined in terms of modernizing the agricultural sector, they usually had two specific objectives: increased commercialization of the rural sector, by mobilizing "idle" savings and increasing investment through credit, and reducing oppressive feudal relations that were enforced through indebtedness. In most cases, these new banks for the poor were not owned by the poor themselves, as they had been in Europe, but by government agencies or private banks. Over the years, these institutions became inefficient and at times, abusive. Between the 1950s and 1970s, governments and donors focused on providing agricultural credit to small and marginal farmers, in hopes of raising productivity and incomes. These efforts to expand access to agricultural credit emphasized supply-led
Effectiveness of Microfinance Banks in Alleviating Poverty in Kwara State Nigeria
14
March
201
1 Gl oba
l Jo
urna
l of M
anag
emen
tan
d Bu
sine
ss R
esea
rch
Volum
e XI Issu
e IV
Ver
sion
I
Early V
iew
government interventions in the form of targeted credit through state-owned development finance institutions, or farmers' cooperatives in some cases, that received concessional loans and on-lent to customers at below-market interest rates. These subsidized schemes were rarely successful. Rural development banks suffered massive erosion of their capital base due to subsidized lending rates and poor repayment discipline and the funds did not always reach the poor, often ending up concentrated in the hands of better-off farmers. Meanwhile, starting in the 1970s, experimental programs in Bangladesh, Brazil, and a few other countries extended tiny loans to groups of poor women to invest in micro-businesses. This type of micro-enterprise credit was based on solidarity group lending in which every member of a group guaranteed the repayment of all members. These "micro-enterprise lending" programs had an almost exclusive focus on credit for income generating activities (in some cases accompanied by forced savings schemes) targeting very poor (often women) borrowers. According to Ledger wood (2002) the term microfinance refers to the provision of financial services to low income client including self employed. Integrated Microfinance Bank (IMFB 2007) was of the opinion that microfinance is the supply of loans, savings and other basic financial services to the poor. Everyone needs a diverse range of financial instruments to run their business, build asset, stabilize consumption and shield themselves against risks. Financial services needed by the poor include working capital loans, consumer credit, savings pension insurance and money transfer services. Jamil (2008) opined that microfinance is the entire flexible structures and processes by which financial services are delivered to micro entrepreneurs as well as the poor and low income population on a sustainable basis. It recognized poor and micro entrepreneur who are excluded or denied accesses to financial services on account of their inability to provide tangible assets as collateral for credits facilities. Microfinance can be seen as a supply of loans, savings and other financial services to the poor. It is the practice of delivering those services in a sustainable manner so that poor households will have access to financial services so that they can build sustainable micro enterprise. While micro enterprise is a business that is independently owned and operated by its owners and does not meet certain standards of size which in most cases operated as informal business. Central bank of Nigeria guidelines (2005) defined microfinance as providing the economically active poor and low income households with financial services such credit to help them engage in income generating activities to expand or grow their small businesses, savings, micro leasing, micro insurance and payment transfer. According to Johnson and Rogaly (1999) very small deposits and loans are referred together as microfinance. Also Rutherford
(2000) stated that access to microfinance is very important because it enables the poor to create, own and accumulate asset and smooth consumption. Microfinance involves the provision of credit, savings, repositories, and financial services to low income earners or poor households to create or expand their economy and to improve their standard of living, (Olaitan 2001).The similarity among all the definitions above is that microfinance is about the provision of financial services to the poor, low-income earners and people operating small business in order for them to improve their standard of living.
V. DEFINITION AND POVERTY STRATEGIES
Schubert (1994) saw poverty as either absolute or relative or both. Absolute poverty being that which could be applied at all time in all societies, such as, the level of income necessary for bare subsistence, while relative poverty relates to the living standards of the poor to the standards that prevail elsewhere in the society in which they live. In Nigeria, various efforts were made by the government, non-governmental organizations and individuals to alleviate poverty in the country. According to Ogwumike (2001) poverty alleviation measures implemented so far in Nigeria focuses more attention on economic growth, basic needs and rural development strategies. The economic growth approach focuses attention on rapid economic growth as measured by the rate of growth in real per capital Gross Domestic Product (GDP) or per capital national income, price stability and declining unemployment among others, which are to be attained through proper harmonization of monetary and fiscal policies. The basic need approach focuses attention on the basic necessities of life such as food, health care, education, shelter, clothing, transport, water and sanitation, which could enable the poor live a decent life, where rural development approach focuses attention on the total emancipation and empowerment of the rural sector. Ogwumike (2001) further grouped the strategies for poverty reduction in Nigeria into three eras – the pre–Structural Adjustment Programme (SAP) era, the Structural Adjustment Programme (SAP) era and the democratic era. In the pre-SAP era, the measures that were predominant were the Operation Feed the Nation, the River Basin Development Authorities, the Agricultural Development Programmes, the Agricultural Credit Guarantee Scheme, the Rural Electrification Scheme and the Green Revolution. In the SAP era the following poverty alleviation measures were introduced; the Directorate for Food, Roads and Rural Infrastructures, the National Directorate of Employment, the Better Life Programme, the Peoples’ Bank, the Community Banks, the Family Support Programme and the Family
Effectiveness of Microfinance Banks in Alleviating Poverty in Kwara State Nigeria
15
Globa
l Jo
urna
l of M
anag
emen
t an
d Bu
sine
ss R
esea
rch
Volum
e XI Issu
e IvvvvV
Version
I
March
201
1
©2011 Global Journals Inc. (US)
Early V
iew
©2011 Global Journals Inc. (US)
Economic Advancement Programme. The democratic era witnessed the introduction of the Poverty Alleviation Programme (PAP) designed to provide employment to 200,000 people all over the country (Yusuf, Ijaiya and Ijaiya 2009).
VI. Microfinance Model for Poverty Alleviation in Kwara State
Looking at the conceptual dimension of wealth and the transfer through Government fiscal operations, one will want to agree that in the current dispensation that country can realistically afford to adopt a model of transfer from the rich through the government fiscal operation and deliberate fiscal allocation to the poor to implement programs that will alleviate poverty. Nigeria must pursue a progressive microfinance model. The program must be such that will assist the totality of the need of those groups that will participate. The credit must facilitate production (economic activities), consumption (hunger etc), social/welfare (health and education etc). The program must be such that can serve as a seed capital to provide fund for the development of promising ideas or products including the development of prototype. There are many school leavers with promising ideas and handicraft workers who need one small seed capital to move out of poverty. The program must be such that can finance expansion of commercially viable/successful business in order that the operator will not sink back into poverty. Consequently microfinance model for kwara state should be such that would have linked the institutional frame work coupled with fiscal support for effectiveness.
There would be flow of revenue to the program and credit service required of the program. The services must ensure the following (CBN 2001)
• Operations are concentrated in the rural areas and focus on the micro enterprises.
• Ensure working capital loans, as regard credit most micro entrepreneurs need working capital loans
• Do not include restrictions concerning the use loans, allow for guarantee that match their capacities such as personal guarantees and peer pressure
However, in implementing the strategy through the new institution, it would be quite instructive to utilize the results of the poverty assessment in order to establish priorities for financing. First identify the region with level of poverty and organize them into cohesive group, to determine what transfer program you can adopt. This region would form pilot project with adequate supervisory, monitoring and evaluation terms for replicating in other regions more importantly is the need to have financial regulatory authority to be part of the team for effectiveness and for completeness
considering the current dispensation of universal banking (CBN 2001 economic and financial review)
VII. Effectiveness and Contributions of Microfinance Banks
Thomas Dichter admits that microfinance can help the poor smooth consumption over periods of cyclical downturns or unexpected crises. This positive role of microfinance should not be dismissed altogether. If this consumption smoothing means parents can send their children to school, or buy essential medications, and maintain nutritional in-takes of their children then microfinance is likely to have positive long-term impacts on productivity. Dasgupta (1995) noted that at low levels of nutrition and health care, increase in current consumption improves future labour productivity: if nothing else, morbidity is reduced. For example, Pitt and Rozenweig (1985) observed from Indonesian data that an increase in the consumption of fish, fruit, or vegetables by 10 percent reduces the chances of illness there by 9, 3 and 6 percent respectively. Microfinance, thus, fulfils an important safety-net task, especially in countries where there is no state-sponsored social security system. In difficult times, the poor can first turn to family and neighbours. But in a situation of generalized poverty or economy-wide crisis, the poor will have to go to money lenders or to the employer/landlord for whom she or he works. If microfinance institutions (MFIs) extend lending to the very poor in these circumstances then they can help break the power and hold of such creditors who operate in the inter-locking credit and factor markets. Although high, the interest rates charged by the MFIs are lower than the rates charged by informal creditors (Chowdhury 2009). • Microfinance is a way of reducing poverty: accessing
small amount of credit at a reasonable interest rate gives the economically active poor an opportunity to set up their own business. Many studies have shown that poor people are trustworthy with the repayment of loans.
• Microfinance is established to provide financial services to the economically active poor and low income earners to help them engage in income generating activities or expand their small business.
• Microfinance banks help in providing services that sustain entrepreneurs in their self employment and also assist in generating employment.
• A noticeable economic growth cannot be achieved without putting in place well focused programs to reduce poverty through empowering the people by increasing their access to microfinance which is aimed at providing credit to the economically active poor.
Effectiveness of Microfinance Banks in Alleviating Poverty in Kwara State Nigeria
16
March
201
1 Gl oba
l Jo
urna
l of M
anag
emen
tan
d Bu
sine
ss R
esea
rch
Volum
e XI Issu
e IV
Ver
sion
I
Early V
iew
• There are main features that distinguish microfinance banks from other types of banks, which are smallness of loans advanced and or savings collected, the absence of asset based collateral and simplicity of operations.
• Microfinance banks are also established to replace the community banks because of the weak capital base of the community banks coupled with weak institutional capacity.
• Efforts ranging from traditional, governmental, non-governmental, formal and informal have over the years been directed at the development of sustainable microfinance in Kwara State but due to one problem or the other, these efforts have been futile and have led to the establishment of microfinance banks.
VIII. Methodology
1) Data Source Both secondary and primary data were used in generating information on the effectiveness of microfinance banks in alleviating poverty as expressed by their customers in Kwara State, Nigeria. A questionnaire was designed title “Questionnaire on the Effectiveness of Microfinance Banks in Alleviating Poverty in Kwara State (QEMBAPKS)”. Descriptive survey was adopted for the study. Survey method was chosen because of its inherent advantages over other research methods (Adewumi, 1981).
2) Sampling Method A stratified sampling method was used in the selection of the customers that expressed their viewed on the effectiveness microfinance banks in alleviating poverty in Kwara state, Nigeria. In order to have unbiased selection of samples, the study area was divided into 16 sample units based on the various local government area in Kwara state, Nigeria. The population of the study comprises 80 microfinance institutions (MFIs) in the 3 Senatorial Districts of the study area, which consists of 16 Local Government Areas (LGAs). Five (5) registered MFIs were purposefully selected from each of the 16 LGAs, making a total of 80 registered MFIs. Four hundred and twenty questionnaire (420) were randomly distributed to customers of these selected microfinance institutions in the three senatorial districts as follows, namely: North (126), Central (168) and South (126). Kwara Central has the highest concentration of MFIs therefore having more customers. This is probably due to the fact that it is more urban and the availability of better infrastructural facilities. However, only four hundred (400) questionnaire properly filled and used for analysis. Respondents were asked to respond to the questions contained in the questionnaire by indicating level of relevance of the implicated variables on a 4-point scale. Data generated from the survey were analyzed using descriptive and inferential statistics such
as percentage, mean, standard deviation, t- test statistics and Analysis of Variance (ANOVA) at 0.05 alpha level.
Effectiveness of Microfinance Banks in Alleviating Poverty in Kwara State Nigeria
17
Globa
l Jo
urna
l of M
anag
emen
t an
d Bu
sine
ss R
esea
rch
Volum
e XI Issu
e IvvvvV
Version
I
March
201
1
©2011 Global Journals Inc. (US)
Early V
iew

©2011 Global Journals Inc. (US)
IX. RESULTS
Table 1: Distribution of MFIs based on Location and operational IT technique
Source: Field Survey (2010)
Table 2: Mean, Standard deviation and T-test comparing the respondents view on an evaluation of microfinance as a strategy for poverty reduction based on gender.
Variable Frequency Percentage X SD DF T-cal T-tab
Male 168 42% 61.857 5.266 398 1.07
1.005
Female 232 58% 62.621 5.102
Source: Field Survey, 2010
Table 2 presents a comparative data on respondents view on the impact of Microfinance as a strategy for poverty reduction in Kwara State. The table shows that the calculated value of 1.07 and critical t-value of 1.05 at 0.05 level of significance.Therefore there is a significant
impact on the study since the calculated t-value is greater than the tabulated t-value. Therefore the null hypothesis (Ho) is rejected and the alternative (Hi) is accepted in evaluating Microfinance as a strategy for poverty reduction as influenced by gender.
Table 3: Mean, sum of Squares and ANOVA values comparing respondents view on the impact Microfinance on the
growth of small businesses as influenced by educational qualification. Source: Field survey, 2010.
Table 3 presents data on the respondents view on the impact of microfinance on the growth of small businesses in Kwara State. The table shows t-value of 1.1963 and a critical f value of 2.56. There is no significant difference in the study since the tabulated F value is greater than the calculated F value, the null
hypothesis (Ho) which states that there is no significant difference on the impact of microfinance on the growth of small businesses as influenced by educational qualification is accepted, while the alternative hypothesis is rejected.
Variables Frequency Percentage Location
Rural 160 40%
Urban 240 60%
Operational IT technique
Manual operation 260 65%
Partial IT operation 140 35%
Fully IT operation
Variable Sum of squares X DF Cal t-value Tab t-value
Between groups 93.4000 31.1333 40 1.1963
2.56 Within groups 1197.1000 26.0239 360
Total 1290.5000 400
Effectiveness of Microfinance Banks in Alleviating Poverty in Kwara State Nigeria
18
March
201
1 Gl oba
l Jo
urna
l of M
anag
emen
tan
d Bu
sine
ss R
esea
rch
Volum
e XI Issu
e IV
Ver
sion
I
Early V
iew
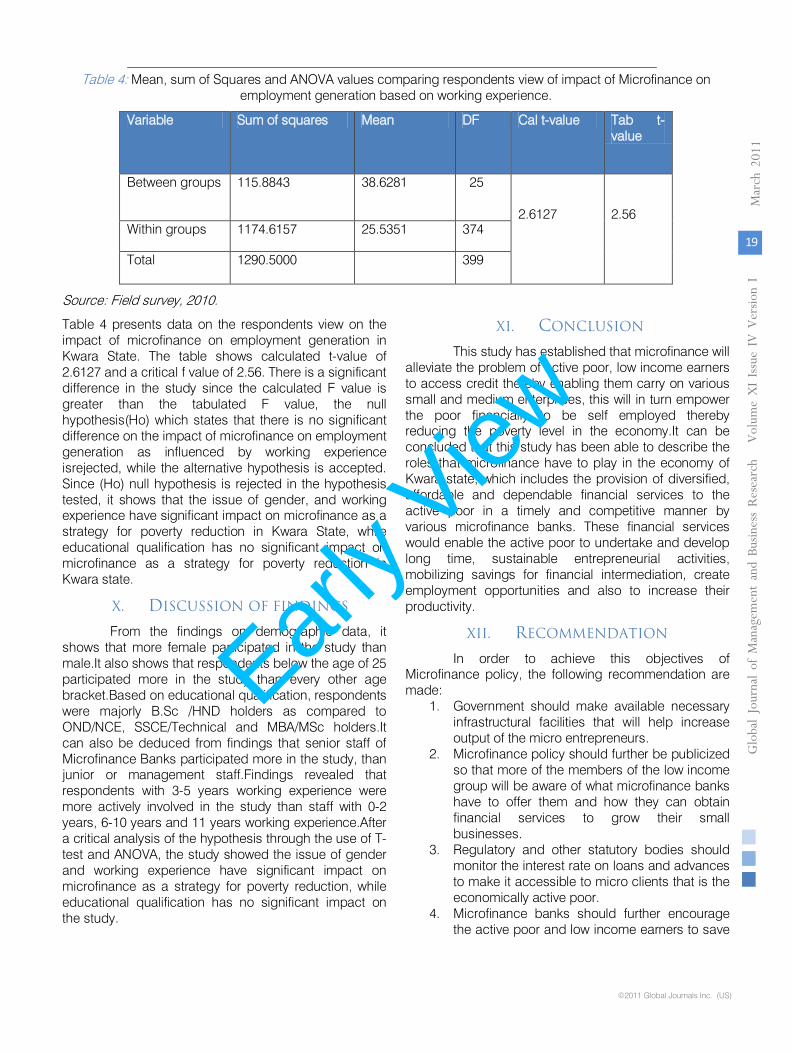
Table 4: Mean, sum of Squares and ANOVA values comparing respondents view of impact of Microfinance on employment generation based on working experience.
Variable Sum of squares Mean DF Cal t-value Tab t-value
Between groups 115.8843 38.6281 25 2.6127
2.56
Within groups 1174.6157 25.5351 374
Total 1290.5000 399
Source: Field survey, 2010.
Table 4 presents data on the respondents view on the impact of microfinance on employment generation in Kwara State. The table shows calculated t-value of 2.6127 and a critical f value of 2.56. There is a significant difference in the study since the calculated F value is greater than the tabulated F value, the null hypothesis(Ho) which states that there is no significant difference on the impact of microfinance on employment generation as influenced by working experience isrejected, while the alternative hypothesis is accepted. Since (Ho) null hypothesis is rejected in the hypothesis tested, it shows that the issue of gender, and working experience have significant impact on microfinance as a strategy for poverty reduction in Kwara State, while educational qualification has no significant impact on microfinance as a strategy for poverty reduction in Kwara state.
X. DISCUSSION OF FINDINGS
From the findings on demographic data, it shows that more female participated in the study than male.It also shows that respondents below the age of 25 participated more in the study than every other age bracket.Based on educational qualification, respondents were majorly B.Sc /HND holders as compared to OND/NCE, SSCE/Technical and MBA/MSc holders.It can also be deduced from findings that senior staff of Microfinance Banks participated more in the study, than junior or management staff.Findings revealed that respondents with 3-5 years working experience were more actively involved in the study than staff with 0-2 years, 6-10 years and 11 years working experience.After a critical analysis of the hypothesis through the use of T-test and ANOVA, the study showed the issue of gender and working experience have significant impact on microfinance as a strategy for poverty reduction, while educational qualification has no significant impact on the study.
XI.
CONCLUSION
This study has established that microfinance will alleviate the problem of active poor, low income earners to access credit thereby enabling them carry on various small and medium enterprises, this will in turn empower the poor financially to be self employed thereby reducing the poverty level in the economy.It can be concluded that this study has been able to describe the roles that microfinance have to play in the economy of Kwara state, which includes the provision of diversified, affordable and dependable financial services to the active poor in a timely and competitive manner by various microfinance banks. These financial services would enable the active poor to undertake and develop long time, sustainable entrepreneurial activities, mobilizing savings for financial intermediation, create employment opportunities and also to increase their productivity.
XII.
RECOMMENDATION
In order to achieve this objectives of Microfinance policy, the following recommendation are made:
1.
Government should make available necessary infrastructural facilities that will help increase output of the micro entrepreneurs.
2.
Microfinance policy should further be publicized so that more of the members of the low income group will be aware of what microfinance banks have to offer them and how they can obtain financial services to grow their small businesses.
3.
Regulatory and other statutory bodies should monitor the interest rate on loans and advances to make it accessible to micro clients that is the economically active poor.
4.
Microfinance banks should further encourage the active poor and low income earners to save
Effectiveness of Microfinance Banks in Alleviating Poverty in Kwara State Nigeria
19
Globa
l Jo
urna
l of M
anag
emen
t an
d Bu
sine
ss R
esea
rch
Volum
e XI Issu
e IvvvvV
Version
I
March
201
1
©2011 Global Journals Inc. (US)
Early V
iew

©2011 Global Journals Inc. (US)
more, thereby giving them enough cash to lend out as loans.
5. Since Microfinance banks give loans without requiring asset based collateral, they should ensure that customers are monitored in the utilization of the loans obtained by them in order to pay back the loan as at when due.
References Références Referencias
1. Jamil, B. (2008). Microfinance as a tool for poverty alleviation in Nigeria. Paper presented at sensitization workshop on Microfinance Banks in Kano State.
2. Akanji, O. O. (2002) Microfinance as a strategy for poverty reduction.CBN Economic and Financial Review Volume 39, Number 4.
3. Bamisile, A. (2006) Developing a Long Term Sustainable Microfinance Sector in Nigeria, speech delivered in Washington D.C. USA.
4. Besley, T (1996) Political Economy of Alleviating Poverty, Theory and .Institutions.
5.
Bruno. M, Squire. L, & Ravillion .M, (1995)
Equity and Growth in
Developing Countries. Old and New Perspectives. Policy Research Working Paper 1563. World Bank Washington D.C., USA.
6.
Central Bank of Nigeria (2001) Economic and Financial Review Volume 39, Number
4.
7.
Central Bank of Nigeria (2008) Guidelines and procedures for the establishment of Microfinance Banks in Nigeria.
8.
Integrated Microfinance Bank of Nigeria (2007) http://www.imfb-bank.com
9.
Johnson ,S & Rogaly B (1999) Microfinance and poverty Reduction, Oxfan Publication.
10.
Muktar, M (2009) Department of Economics, Bayero University Kano PMB 3011 Kano-
Nigeria.
11.
Yusuf, Ijaiya and Ijaiya (2009)
12.
World Bank (2000-2001) World Development Report Attacking Poverty.
Effectiveness of Microfinance Banks in Alleviating Poverty in Kwara State Nigeria
20
March
201
1 Gl oba
l Jo
urna
l of M
anag
emen
tan
d Bu
sine
ss R
esea
rch
Volum
e XI Issu
e IV
Ver
sion
I
Early V
iew
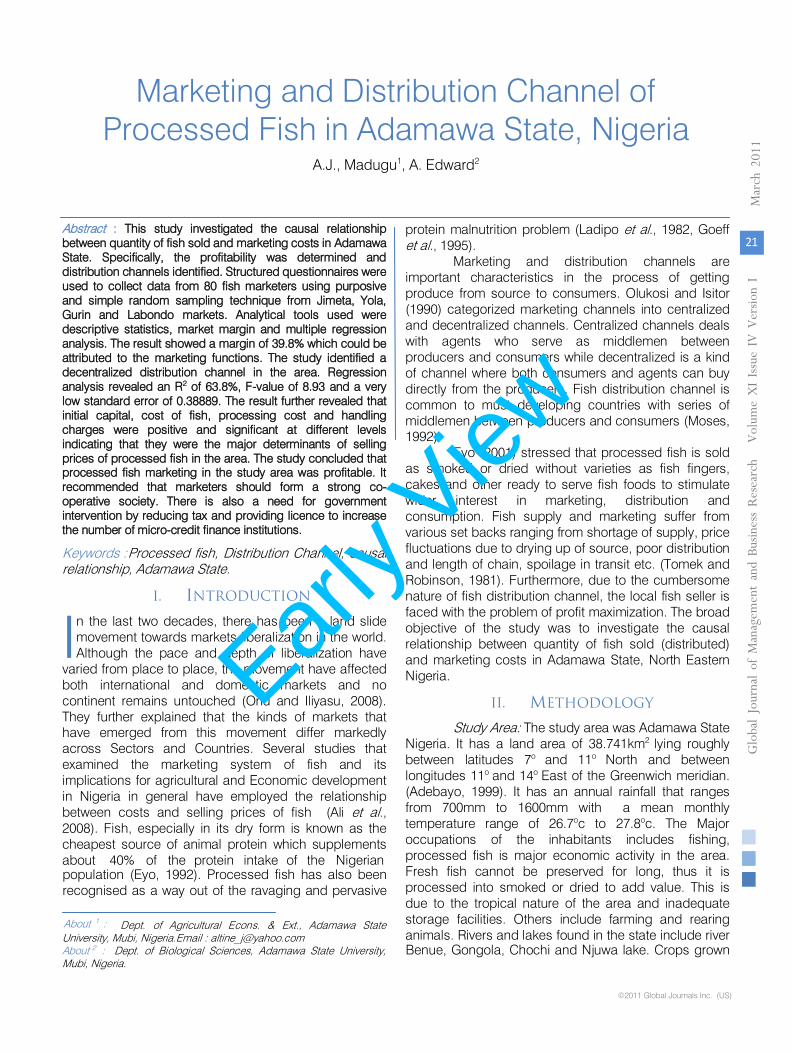
Marketing and Distribution Channel of Processed Fish in Adamawa State, Nigeria
A.J., Madugu1, A. Edward2
Abstract : This study investigated the causal relationship between quantity of fish sold and marketing costs in Adamawa State. Specifically, the profitability was determined and distribution channels identified. Structured questionnaires were used to collect data from 80 fish marketers using purposive and simple random sampling technique from Jimeta, Yola, Gurin and Labondo markets. Analytical tools used were descriptive statistics, market margin and multiple regression analysis. The result showed a margin of 39.8% which could be attributed to the marketing functions. The study identified a decentralized distribution channel in the area. Regression analysis revealed an R2 of 63.8%, F-value of 8.93 and a very low standard error of 0.38889. The result further revealed that initial capital, cost of fish, processing cost and handling charges were positive and significant at different levels indicating that they were the major determinants of selling prices of processed fish in the area. The study concluded that processed fish marketing in the study area was profitable. It recommended that marketers should form a strong co-operative society. There is also a need for government intervention by reducing tax and providing licence to increase the number of micro-credit finance institutions.
Keywords : Processed fish, Distribution Channel, causal relationship, Adamawa State.
I. INTRODUCTION
n the last two decades, there has been a land slide movement towards markets liberalization in the world. Although the pace and depth of liberalization have
varied from place to place, the movement have affected both international and domestic markets and no continent remains untouched (Onu and Iliyasu, 2008). They further explained that the kinds of markets that have emerged from this movement differ markedly across Sectors and Countries. Several studies that examined the marketing system of fish and its implications for agricultural and Economic development in Nigeria in general have employed the relationship between costs and selling prices of fish (Ali et al., 2008). Fish, especially in its dry form is known as the cheapest source of animal protein which supplements about 40% of the protein intake of the Nigerian
Dept. of Agricultural Econs. & Ext., Adamawa State
University, Mubi, Nigeria.Email : [email protected]
Dept. of Biological Sciences, Adamawa State University,
Mubi, Nigeria.
population (Eyo, 1992). Processed fish has also been recognised as a way out of the ravaging and pervasive
protein malnutrition problem (Ladipo et al., 1982, Goeff et al., 1995).
Marketing and
distribution channels are important characteristics in the process of getting produce from source to consumers. Olukosi and Isitor (1990) categorized marketing channels into centralized and decentralized channels. Centralized channels deals with agents who serve as middlemen between producers and consumers while decentralized is a kind of channel where both consumers and agents can buy directly from the producers. Fish distribution channel is common to must developing countries with series of middlemen between producers and consumers (Moses, 1992).
Eyo (2001) stressed that processed fish is sold as smoked or dried without varieties as fish fingers, cakes and other ready to serve fish foods to stimulate wider interest in marketing, distribution and consumption. Fish supply and marketing suffer from various set backs ranging from shortage of supply, price fluctuations due to drying up of source, poor distribution and length of chain, spoilage in transit etc. (Tomek and Robinson, 1981). Furthermore, due to the
cumbersome nature of fish distribution channel, the local fish seller is faced with the problem of profit maximization.
The broad objective of the study was to investigate the causal relationship between quantity of fish sold (distributed) and marketing costs in Adamawa State, North Eastern Nigeria.
II.
METHODOLOGY
Study Area:
The study area was Adamawa State Nigeria. It has a land area of 38.741km2 lying roughly between latitudes 7o and 11o North and between longitudes 11o and 14o East of the Greenwich meridian. (Adebayo, 1999). It has an annual rainfall that ranges from 700mm to 1600mm with a mean monthly temperature range of 26.7oc to 27.8oc. The Major occupations of the inhabitants includes fishing, processed fish is major economic activity in the area. Fresh fish cannot be preserved for long, thus it is processed into smoked or dried to add value. This is due to the tropical nature of the area and inadequate storage facilities. Others include farming and rearing animals. Rivers and lakes found in the state
include river
I
21
Globa
l Jo
urna
l of M
anag
emen
t an
d Bu
sine
ss R
esea
rch
Volum
e XI Issu
e IvvvvV
Version
I
March
201
1
©2011 Global Journals Inc. (US)
About 1 :
About 2 : Benue, Gongola, Chochi and Njuwa lake. Crops grown
Early V
iew
©2011 Global Journals Inc. (US)
are maize, sorghum and cassava while others are cotton groundnuts and sugarcane (Sajo and Kadams, 1999).
III.
DATA COLLECTION AND SAMPLING
PROCEDURE
Purposive and simple random sampling
techniques were used. Four markets were selected being the major fish markets in the area. 80 fish processors and marketers were randomly selected using a sampling frame from the four markets in a ratio proportional to market size i.e. 30 in Jimeta market, 20 in Yola market and 15 each in Labondo and Gurin markets. Data for the study were collected through structured questionnaires administered to fish processors and marketers while secondary data were obtained through journals, books, seminar series, newspapers etc. primary data collected includes socio-economic variables, prices, costs and returns, sales and problems associated with processed fish marketing.
IV.
ANALYTICAL TECHNIQUES
* The socio-economic characteristics and
problems associated with processed fish marketing were analysed using descriptive statistics such as frequencies, percentages and charts.
* Multiple Regression using the ordinary least square (OLS) regression technique was used to determine the effect of marketing cost on the selling price of processed fish (smoke and dried) in the state. The model was specified as follows:-
Y=f (X1, X2----X10) Where Y=quantity of processed fish distributed in
kg/month
X1= Initial Capital investment
X2= Cost of fish/kg in (N) X3= Processing cost/kg in (N)
X4= Packaging cost/kg in (N) X5= Handling charges/kg (N) X6= Storage Cost (N)
X7= Transportation cost/kg (N) X8= Produce tax/kg in (N)
X9= Market Union tax (N) X10= Local Government tax (N)
Ui= Error term Bi= Coefficient of Independent variables to be
estimated. A priori, the coefficients of the independent variables
were expected to be positive and have significant relationship with the dependent variable, indicating effect of marketing cost on selling price.
* Marketing Channel:
Marketing channel was identified using the participants and the route through which
processed fish was transferred from producers to consumers and a distribution channel was drawn.
* Market Margin Analysis:
Market margin if not perfect and static is also measure of market performance (Olukosi and Isitor, 1990). This is the ratio that determines the gap between producers and consumers price. It is expressed as:-
MM
=
CPSP
x 100%
Where, MM = Market Margin, SP = Selling Price and CP = Cost Price
V.
RESULTS AND DISCUSSION
Socio-economic Characteristics of Marketers:
The Socio-economic characteristics of marketers which include age, gender, family size and years of experience are presented in Table 1. Data showed that marketers between the ages 31-40 have the highest percentage (46.25%) followed by those above 40 years (28.75%) and between ages 21-30 years (15%). It can be concluded that, most of the marketers are in their economic active years.
The table further reveals that male respondents comprise of (50%) and the same goes for the female. This means that both males and females participate equally in marketing of processed fish. Females are therefore not left out in fish marketing. A similar study in Benue State found about 90% women participation in fish marketing. (Lawal and Idega, 2004). This is further supported by Williams and Awoyemi (1998) who observed that women in small-scale riverine fishing villages also perform other types of income earning activities to supplement the household income, such income sources were
earned through sales of fisheries products and social services in fish distribution and marketing.The data illustrated that marketers with family size that range between 1-10 persons have the highest percentage (71.25%) followed by those that have persons
ranging between 11-20 (18.75%). This implies that the lower the number of family dependant on marketers the better the market performance because less time is spent on family issues and more on marketing. Only about 3.75% of the respondents have above 20 persons while 6.25% have no dependants in their households.Marketers with experience of about 11-20 years and 21-30 years constituted about 30% and 28.75% of the total respectively. This is substantiated by the findings of Ali et al., (2008) who observed that marketing experience is important in determining the profit levels of marketers, the more the experience, the more marketers understand the marketing system, condition, trends, prices etc. The data illustrated that
Marketing and Distribution Channel of Processed Fish in Adamawa State, Nigeria
22
March
201
1 Gl oba
l Jo
urna
l of M
anag
emen
tan
d Bu
sine
ss R
esea
rch
Volum
e XI Issu
e IV
Ver
sion
I
majority of the marketers had some formal education. 55.0%, 35.0% and 6.25% had primary, secondary and
Early V
iew
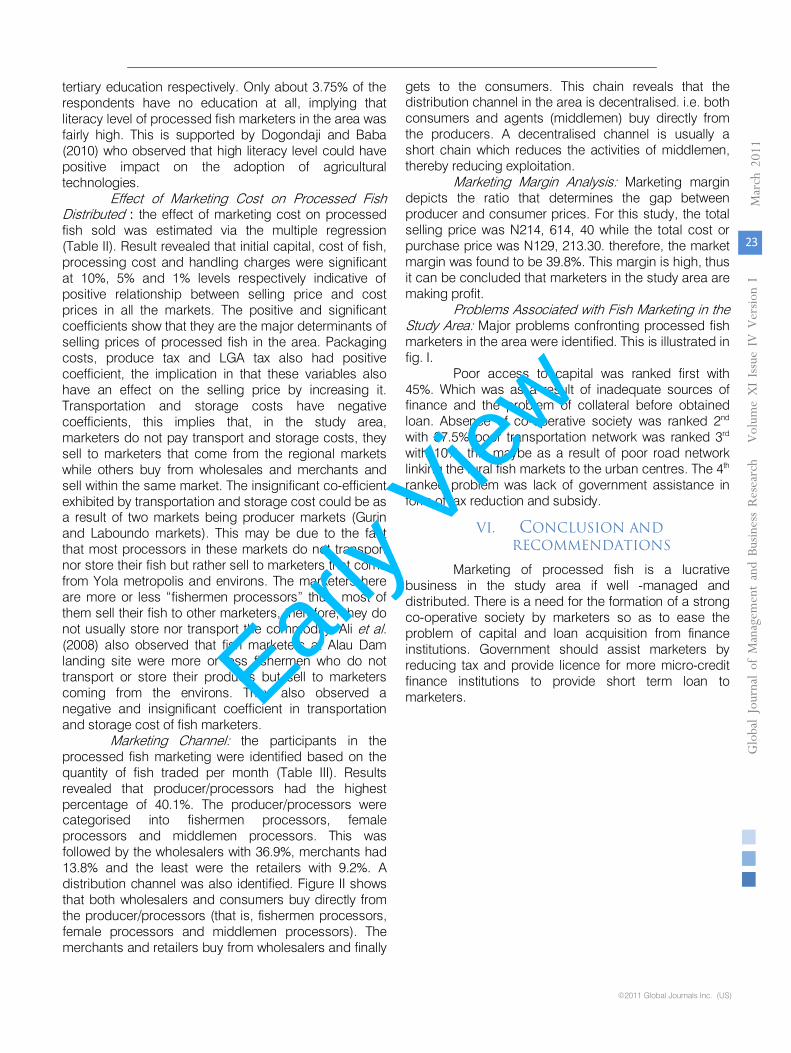
tertiary education respectively. Only about 3.75% of the respondents have no education at all, implying that literacy level of processed fish marketers in the area was fairly high. This is supported by Dogondaji and Baba (2010) who observed that high literacy level could have positive impact on the adoption of agricultural technologies.
Effect of Marketing Cost on Processed Fish
Distributed
:
the effect of marketing cost on processed fish sold was estimated via the multiple regression (Table II). Result revealed that initial capital, cost of fish, processing cost and handling charges were significant at 10%, 5% and 1% levels respectively indicative of positive relationship between selling price and cost prices in all the markets. The positive and significant coefficients show that they are the major determinants of selling prices of processed fish in the area. Packaging costs, produce tax and LGA tax also had positive coefficient, the implication in that these variables also have an effect on the selling price by increasing it.
Transportation and storage costs have negative coefficients, this implies that, in the study area, marketers do not pay transport and storage costs, they sell to marketers that come from the regional markets while others buy from wholesales and merchants and sell within the same market. The insignificant co-efficient exhibited by transportation and storage cost could be as a result of two markets being producer markets (Gurin and Laboundo markets). This may be due to the fact that most processors in these markets do not transport nor store their fish but rather sell to marketers that come from Yola metropolis and environs. The marketers here are more or less “fishermen processors” thus, most of them sell their fish to other marketers, therefore, they do not usually store nor transport the commodity. Ali et al. (2008) also observed that fish marketers at Alau Dam landing site were more or less fishermen who do not transport or store their products but sell to marketers coming from the environs. They also observed a negative and insignificant coefficient in transportation and storage cost of fish marketers.
Marketing Channel:
the participants in the processed fish marketing were identified based on the quantity of fish traded per month (Table III). Results revealed that producer/processors had the highest percentage of 40.1%. The producer/processors were categorised into fishermen processors, female processors and middlemen processors. This was followed by the wholesalers with 36.9%, merchants had 13.8% and the least were the retailers with 9.2%.
A distribution channel was also identified. Figure II shows that both wholesalers and consumers buy directly from the producer/processors (that is, fishermen processors, female processors and middlemen processors). The merchants and retailers buy from wholesalers and finally
gets to the consumers. This chain reveals that the distribution channel in the area is decentralised. i.e. both consumers and agents (middlemen) buy directly from the producers. A decentralised channel is usually a short chain which reduces the activities of middlemen, thereby reducing exploitation.
Marketing Margin Analysis:
Marketing margin depicts the ratio that determines the gap between producer and consumer prices. For this study, the total selling price was N214, 614, 40 while the total cost or purchase price was N129, 213.30. therefore, the market margin was found to be 39.8%. This margin is high, thus it can
be concluded that marketers in the study area are making profit.
Problems Associated with Fish Marketing in the Study Area:
Major problems confronting processed fish marketers in the area were identified. This is illustrated in fig. I.
Poor access to capital was ranked first with 45%. Which was as a result of inadequate sources of finance and the problem of collateral before obtained loan. Absence of co-operative society was ranked 2nd
with 37.5% poor transportation network was ranked 3rd
with 10%, this maybe as a result of poor road network linking the rural fish markets to the urban centres. The 4th
ranked problem was lack of government assistance in form of tax reduction and subsidy.
VI.
CONCLUSION AND RECOMMENDATIONS
Marketing of processed fish is a lucrative business in the study area if well -managed and distributed. There is a need for the formation of a strong co-operative society by marketers so as to ease the problem of capital and loan acquisition from finance institutions. Government should assist marketers by reducing tax and provide licence for more micro-credit finance institutions to provide short term loan to marketers.
Marketing and Distribution Channel of Processed Fish in Adamawa State, Nigeria
23
Globa
l Jo
urna
l of M
anag
emen
t an
d Bu
sine
ss R
esea
rch
Volum
e XI Issu
e IvvvvV
Version
I
March
201
1
©2011 Global Journals Inc. (US)
Early V
iew
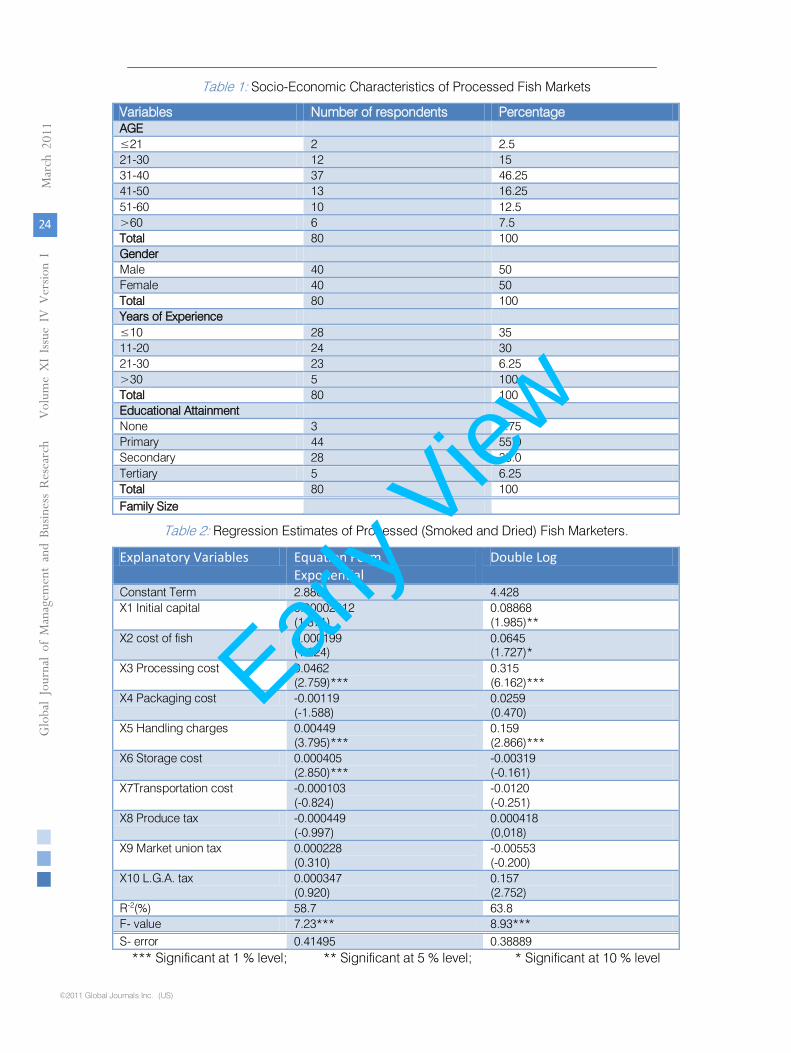
©2011 Global Journals Inc. (US)
Table 1: Socio-Economic Characteristics of Processed Fish Markets
Variables Number of respondents Percentage AGE ≤21 2 2.5 21-30 12 15 31-40 37 46.25 41-50 13 16.25 51-60 10 12.5 >60 6 7.5 Total 80 100 Gender Male 40 50 Female 40 50 Total 80 100 Years of Experience ≤10 28 35 11-20 24 30 21-30 23 6.25 >30 5 100 Total 80 100 Educational Attainment None 3 3.75 Primary 44 55.0 Secondary 28 35.0 Tertiary 5 6.25 Total 80 100 Family Size
Table 2: Regression Estimates of Processed (Smoked and Dried) Fish Marketers.
Explanatory Variables Equation Form Exponential
Double Log
Constant Term 2.880 4.428 X1 Initial capital 0.00002812
(1.371) 0.08868 (1.985)**
X2 cost of fish 0.000199 (1.224)
0.0645 (1.727)*
X3 Processing cost 0.0462 (2.759)***
0.315 (6.162)***
X4 Packaging cost -0.00119 (-1.588)
0.0259 (0.470)
X5 Handling charges 0.00449 (3.795)***
0.159 (2.866)***
X6 Storage cost 0.000405 (2.850)***
-0.00319 (-0.161)
X7Transportation cost -0.000103 (-0.824)
-0.0120 (-0.251)
X8 Produce tax -0.000449 (-0.997)
0.000418 (0,018)
X9 Market union tax 0.000228 (0.310)
-0.00553 (-0.200)
X10 L.G.A. tax 0.000347 (0.920)
0.157 (2.752)
R-2(%) 58.7 63.8 F- value 7.23*** 8.93*** S- error 0.41495 0.38889
*** Significant at 1 % level; ** Significant at 5 % level; * Significant at 10 % level
Marketing and Distribution Channel of Processed Fish in Adamawa State, Nigeria
24
March
201
1 Gl oba
l Jo
urna
l of M
anag
emen
tan
d Bu
sine
ss R
esea
rch
Volum
e XI Issu
e IV
Ver
sion
I
Early V
iew
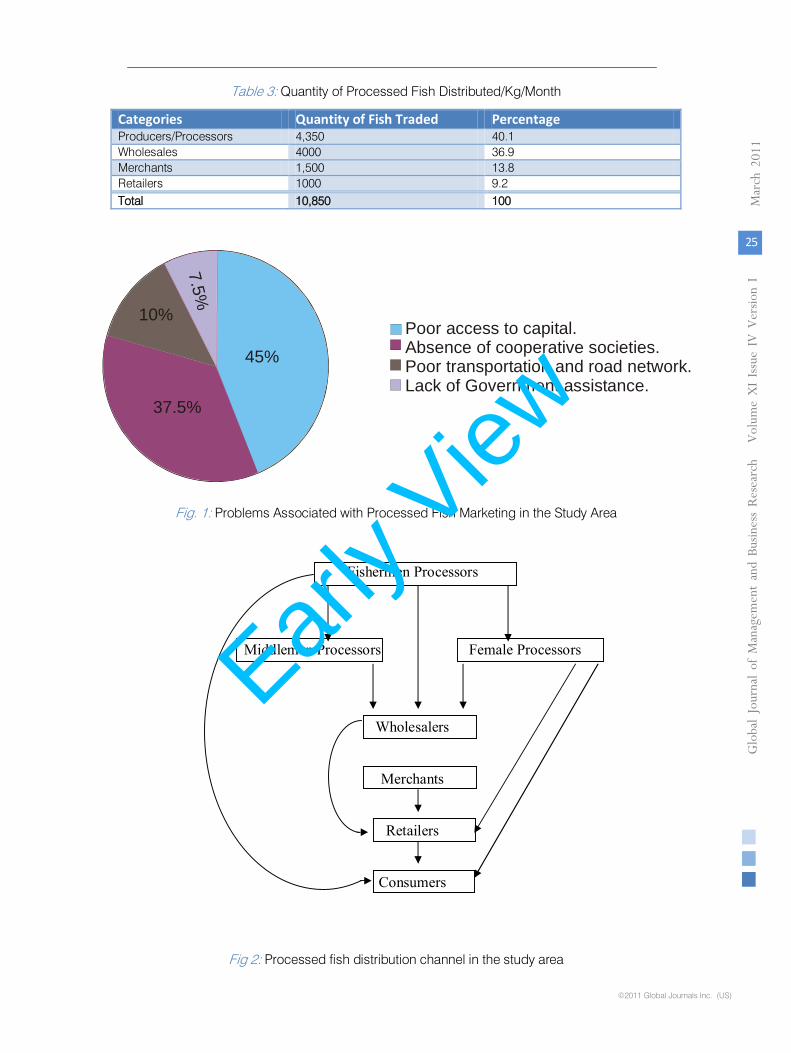
Table 3: Quantity of Processed Fish Distributed/Kg/Month
Categories Quantity of Fish Traded Percentage Producers/Processors 4,350 40.1 Wholesales 4000 36.9 Merchants 1,500 13.8 Retailers 1000 9.2 Total 10,850 100
Fig. 1: Problems Associated with Processed Fish Marketing in the Study Area
Fig 2: Processed fish distribution channel in the study area
45%
37.5%
10%
7.5%
Poor access to capital.Absence of cooperative societies.Poor transportation and road network.Lack of Government assistance.
Marketing and Distribution Channel of Processed Fish in Adamawa State, Nigeria
25
Globa
l Jo
urna
l of M
anag
emen
t an
d Bu
sine
ss R
esea
rch
Volum
e XI Issu
e IvvvvV
Version
I
March
201
1
©2011 Global Journals Inc. (US)
Fishermen Processors
Middlemen Processors Female Processors
Wholesalers
Merchants
Retailers
Consumers
Early V
iew
©2011 Global Journals Inc. (US)
References Références Referencias
1) Adebayo A.A. (1999): Climate II, Rainfall. In Adebayo, A.A. and Tukur, A.L. (eds). Adamawa State in Maps, Paraclete publishers, Yola, Nigeria. 23-26.
2) Ali, E. A, H.I.M., Gaya and T.N. Jampada (2008): Economic Analysis of fresh fish marketing in Maiduguri Gamboru Market and Kachallari Alau Dam landing site of Northeastern Nigeria. J. Agri. Soc. Sci. 4:23-6
3) Dongondaji, S. D and K.M. Baba (2010): Income distribution in large scale irrigation projects: A case study of Dry season rice farmers at the Bakolori irrigation project, Zamfara state, Nigeria. Proceedings of the 24th Annual National Conference of the Farm Management of Nigeria held at the Adamawa State University, Mubi 11th- 14th October, 2010
4) Eyo, A.A. (1992): Fish Handling, preservation and processing. A paper presented at the improve management for Agricultural training at Federal college of Freshwater fisheries Technology. New Bussa on 22nd Sept and 23rd Oct. 1992
5) Eyo, A.A. (2001): Fish processing technology in the tropics. University of Ilorin press, Nigeria.
6) Goeff, A. and Bennet, C.J. (1995): Fish mammies and tuna conglomerates: Private sector fish processing and marketing in Ghana. In Steven, J. and John, M. (eds.), Marketing Africa’s high-value Foods. 375-416
7) Ladipo, O.O. and Fabiyi, Y.L. (1982): An Analysis of fish marketing and distribution in Kwara state of Nigeria. Proceedings of the 3rd Annual Conference of Fisheries Society of Nigeria, FISCON, 40-46
8) Lawal, W.L and Idega, E.O. (2004): Analysis of fish marketing in Benue State. Proceedings of the 2004 Annual Conference of the National Association of Agricultural Economists (NAAE) held at ABU Zaria, nov 3rd -5th, 2004
9) Moses, B. S. (1992). Introduction to tropical fisheries 2nd edition. 1-125.
10) Olukosi, J.O. and Isitor, S.U. (1990). An introduction to Agricultural marketing and price: principles and applications. Living books series GU publications Abuja. 115
11) Onu, J.I. and Iliyasu, H.A. (2008): An Economic Analysis of the Food Grain Market in Adamawa state, Nigeria. World Journal of Agricultural Science 4(5): 617- 622.
12) Sajo, A.A. and Kadams, A.M. (1999): Food and cash crops. In Adebayo A.A and Tukur A.L (eds), Adamawa State in Maps. Paraclete publishers, Yola. 37-40.
13) Tomek, W.G and Robinson, L. (1981). Agricultural product prices, 2nd edition. Ihaca, New York, U.S.A cornel University press.
14) Williams, S.B. and Awoyemi, B. (1998). Fish as a Prime Mover of the Economic life of women in a fishing community. Proceedings of the IIFET Held in Tromso, Norway, July 1998. 286-92.
Marketing and Distribution Channel of Processed Fish in Adamawa State, Nigeria
26
March
201
1 Gl oba
l Jo
urna
l of M
anag
emen
tan
d Bu
sine
ss R
esea
rch
Volum
e XI Issu
e IV
Ver
sion
I
Early V
iew
The Psychometric Impacts of Karasek’s Demands and Control Scale on Employees’ Job
Dissatisfaction Dr. Saif-ur-Rehman1,Muhammad Asif Khan2, Zia-Ullah3
Abstract : Objective: The aim of this study was to provide the reliability and validity of job factors and to analyze its association with Demands-Control Model and job dissatisfaction in two time cross-sectional study of DISCOs of WAPDA. Methods: Two times self-reported cross-sectional surveys were conducted, the study samples consisting of 420 respondents at T1 and 388 respondents at T2. Results: Appropriate internal consistencies of the four scales: demands, control, job satisfaction and social supports, were obtained. Zero-order correlation and linear and multiple regressions analysis replicated the theoretically assumed structure of the job factors and job satisfaction construct in men and women collectively. Evidence of criterion validity was obtained from cross-correlations of the scales and from their linear and multiple regression analysis. Finally, all four measures were associated with a highly significant ratio of job dissatisfaction (JD), and the effect was strongest for the JD ratio as predicted by fundamental theory of Karasek. Conclusion: We examine how users who are assimilating job factors into their work experience the level of work related demands in their jobs, the level of autonomy/ control they have over their work, and how these relate to outcomes, such as job dissatisfaction and well-being. Based on the results of this study the four quadrant version of the DCM, questionnaire is considered a reliable and valid instrument for measuring psychosocial pressure at work environment. These outcomes and measures are applicable to all services and manufacturing industries.
Keywords : Work overload; Work control; Organizational support; Job dissatisfaction; Demands-control-support model.
I. INTRODUCTION he Job Demand-Control (JDC) Model was
introduced by the sociologist Karasek (1979), who drew attention upon two research directions of life,
namely the job dissatisfaction directions (e.g., Caplan, Cobb, French, van Harrison, & Pineau, 1976; Kahn, 1981) and the job redesign convention (e.g., Hackman & Oldham, 1980). In both research studies, attempts were made to relate psychosocial job characteristics to employee health. The job dissatisfaction tradition
About 1
: Dean Department of M.Com.PGCC Islamabad (Pakistan).
[email protected] About 2 :
Assistant ProfessorSZABIST Islamabad Campus, Pakistan.
About 3 : Institute of Administrative Sciences University of The Punjab-
Lahore (Pakistan).
focused on “stressors” at work, such as high workload, work pace, role conflict, and role ambiguity (e.g., French & Kahn, 1962). The job redesign tradition focused mainly on job control, as it’s primarily aim was to inform the (re)design of jobs in order to increase the effectiveness, motivation, satisfaction, and performance at workplace. According to Karasek (1979), the relations between job demands placed on the discretion available to the employee to decide how to meet these job demands (i.e., job requirements) contributes importantly to the prediction of job satisfaction and active learning.
In this model, psychological job demands refer to a task’s mental workload and the mental alertness or arousal needed to carry job under the given circumstances (Karasek & Theorell, 1990). Job control or decision latitude is a compound of the employee’s autonomy to make decisions on the job and the extent of skills used by the employee on the job (skill discretion: Karasek, 1989). Theoretically, in the JDC model an interaction effect has been described as a joint effect of job demands and decision latitude (Karasek, 1989). Two perspectives, also known as the dissatisfaction and buffer theory (van der Doef & Maes, 1998, 1999), can be distinguished. According to the first perspective, the most adverse performance effects are expected in a high demands – low control work situation. The second perspective proclaims that (high) control can act as a buffer and thus minimize the potentially negative impact of high demands on employee’s performance. While these perspectives are not mutually exclusive, they have different statistical implications. But the first perspective implies that the nature of the interaction is additive, the second perspective assumes an interaction over and above the main effects. Originally, Karasek (1979) found an interactive effect between job demand and job control. However, a decade later Karasek (1989) stated that: “for the Demand-Control Model, the existence of a multiplications interaction term is not the primary issue” (p. 144). Opinions differ on this matter, as can be seen in the diversity of operationalizations of demand-control interactions in empirical research (e.g., Landsbergis & Theorell, 2000).
T
27
Globa
l Jo
urna
l of M
anag
emen
t an
d Bu
sine
ss R
esea
rch
Volum
e XI Issu
e IvvvvV
Version
I
March
201
1
©2011 Global Journals Inc. (US)
Early V
iew
©2011 Global Journals Inc. (US)
Karasek 1979; Karasek & Theorell, 1990 extended his three-dimensional job demands control support (JDCS) model that focuses on three job characteristics: job demands (stressors), job control (decision lattitude) and social support (colleagues + supervisors) at workplace. De Jonge & Kompier, (1997) pointed out the theory of JDCS model is based on two central assumptions: the first one is psychological dissatisfactions or dissatisfaction which results particularly in work characterized by high job demands in combination with low job control and low social support, the second one standard work performance will occur in work characterized by high job demands, high job control and high social support.A number of studies have experienced the JDCS model in nursing (Landsbergis 1988, de Jonge & Landeweerd 1993, de Jonge 1995). The outcomes of these research studies normally point out that job control or autonomy seems predominantly to be associated to job satisfaction and productivity, whereas job demands and social support seem particularly to be associated with health complaints and absenteeism (Ab Landeweerd, 2004).Therefore, Karasek’s (1979) job demands–job control model has been an powerful theoretical base for various studies of job dissatisfaction (e.g. Cooper, 2000; Van Yperen and Hagedoorn, 2003). The hypothetical argument necessary in this model is that individual physiological dissatisfaction results from the interactive effects of one’s job demands and the amount of job control available at workplace. Particularly, Karasek’s theory posits that in order to minimize physiological dissatisfaction, job demands should be coordinate to job control so that where ever job demands are high, job control should match the requirement. High job control enables participants to handle the job demands by developing appropriate behavioral response patterns to improve the job performance.
Accumulated evidences indicate that a large amount of research on the job demands–job control model has focused on the job of nurses (Fox et al., 1993; Schaubboeck and Merritt, 2003) and production workers in manufacturing industry (e.g. Wall et al., 1996). Some research studies have supported the proposed interaction effect of three variables (e.g. Fox et al., 1993), and others have demonstrated no such effect on job dissatisfaction (e.g. Landsbergis, 1988). Similarly, some researchers in this area have developed a contingency approach by investigating the extent to which the job demands–job control connection is moderated by individual-level characteristics such as locus of job control and social support. In addition, research on Karasek’s model has largely focused on job demands such as workload and work pace (Fox et al., 1993; Van Yperen and Hagedoorn, 2003). Moreover, there have been a few studies that have applied the job demands–job control model to the social nature of work
job demands, that is, job challenges arising from managing interdependencies with other people in the workplace (S. S. Wong et al., 2007).Karasek and Theorell (1990) stated that their three models take up important position between two large bodies of literature, which associated with job dissatisfaction and to job description. The significant determinants of job dissatisfaction and active learning are the amount of decision latitude structured into job description. Karasek’s highlighting leading to objective job characteristics as determinants of job dissatisfaction stands in predominantly sharp contrast to Lazarus and Folkman’s (1984) whose point of view on the worker’s judgment and locus of job control, and Caplan et al. (1975), and other members of the Michigan school’s approaches on the fit between the job and the worker’s capabilities or values of job. Siegrist (2000) noted that Karasek’s models have not been accurately adjusted in providing a necessary corrective to these earlier ideas. In doing so, he advocated a clear picture for achieving the high levels of worker productivity, on the one hand, and high levels of worker independence, support and personal development, on the other side.
Nelson & Simmons, (2003) stated that Karasek’s ideas have concerned with interest relates to their fundamental positive human values or standards. In this way his ideas are well-matched with, and may even have contributed to the current popularity of, the constructive psychology movement of working force. In spite of these constructive ideas, the theory is normally documented as being over or under simplified. Karasek’s theory highlighted a few variance in job dissatisfaction by variables (Schreurs & Taris, 1998), mostly as it includes few predictors or mediators and moderators, at the same time as trying to clarify many outcomes associated factors. Karasek and Theorell (1990) protected the simplicity of the theory by suggesting that this is “essential for practical interdisciplinary applications and for the first stages of scientific research” (p. 56-57) (for a new researcher). They admitted that the effects of job demands and job control upon strain can be reduced to minimum level by adding a large number of other predictor variables to the equation job dissatisfaction.
Bradley, (2004) pointed out that before attempting to draw conclusions concerning the extent to which the models have been supported empirically, there is need to an agreement as to what constitutes a appropriate and acceptable test of the main hypotheses. Because of that there is lack of precision and consistency in Karasek’s written work. Operationalised job demands broadly to include such stressors as role ambiguity or responsibility for others are faced into an overall evaluation of empirical status of Karasek’s model. There should be studies of use separate outcomes such as job performance and life
The Psychometric Impacts of Karasek’s Demands and Control Scale on Employees’ Job Dissatisfaction
28
March
201
1 Gl oba
l Jo
urna
l of M
anag
emen
tan
d Bu
sine
ss R
esea
rch
Volum
e XI Issu
e IV
Ver
sion
I
Early V
iew
satisfaction be considered genuine tests of the theory. Model should be statistical job controls enough the negative affectivity and duration of work experience. Furthermore, model is basically tested by evidence of additive (e.g., job demands + job control + support) effects, but is it necessary also to test for and find interactive (job demands x job control x support) effects (Bradley, 2004)? After reviewing accumulated research evidence, Van der Doef and Maes (1999) drew conclusions that “the literature gives considerable support for the dissatisfaction hypotheses, but support for the moderating influence of job control and social support is less consistent with each other” (p. 86) Bradley, (2004) further stated that if insufficient tests of the hypotheses are excluded, and those studies that meet at least minimum criteria are weighted in proportion to the quality of the methods used, it may be included on the ground that: (a) firstly, empirical support for the independent effects of job demands, job control and social support upon dissatisfaction is strong, (b) secondly, support for the additive effects of these three variables on dissatisfaction is mixed at various different combinations, (c) thirdly, support for the two-way interactions on dissatisfaction is relatively weak, (d) fourthly, support for the three-way interaction (job demands x job control x support) on dissatisfaction is, at best, marginal, but most promising in relation to the prediction of somatic complaints, (e) fifthly, support for the active-learning hypothesis is quite strong in respect of the role played by job control, but the evidence is weak and indirect concerning further contributions made to active learning by job demands and the job demands x job control interaction, and (f) finally, support for the extended personality-environmental model is limited. Therefore, it is cleared to greater extend that Karasek’s fundamental theory is based on sound footing and supportive of empirical studies. On the other hand, a critic (Sauter, 1989) has claimed that the practical implications of what are often quite small effects; Frese (1985) has noted that the effects may be considerable for the extreme in the inhabitants. According to the above views of authors, authentication of Karasek’s hypothesis mostly came from studies of large blue-collar samples that used cross-sectional designs of specific descriptive jobs. Social support for Karasek’s models also vary with the type of statistical analyses performed with other variables.
II. HYPOTHESES
According to the objectives of our study we predicted the following six hypotheses: H1-Job demands are positively associated with job dissatisfaction; H2-Job control is negatively associated with job dissatisfaction; H3-Social support is negatively related to job
dissatisfaction; H4- Job control and social supports moderate the relationship between demands and job dissatisfaction. H5-The additive effects of job demands and job control predicts levels of job dissatisfaction better than does either main effect alone. H6- The additive effect of job demands, job control and job social supports predict levels of job dissatisfaction better than does either main effect alone.
III. RESEARCH METHOD
Participants and Procedure This two time cross-sectional study is based on
data obtained from two random samples consisting of nine distribution companies (DISCOs) of WAPDA working in all part of country (Pakistan) except Karachi region. Employees’ Statistical Reckoning (2007-8) personnel records were used to select a simple random sample of 1000 working as regular employees in DISCOs. The target population was all those having graduate and post-graduate qualifications working on the various positions at BPS-9 to BPS-17. All other positions were excluded. Finally, it is noted that there was no structured, planned intervention in both studies. No natural and minor organizational changes took place, which had to do with some organizational renewal and personnel changes between the two waves. The 1000 selected employees were delivered personally a copy of the research materials both at T1 & T2. Questionnaires were returned by 401 at T1 and 388 at T2 of these employees with nine month time gap, and all of these were usable. The response rate s was 40% at T1 and 38% at T2. Demographics at T1 showed that 95% of the sample was male, and mean age was 26.0 years (SD = 7.1, range 24–45). Mean working time in current organization was 10 years (SD = 8.33). Demographic characteristics of the respondents in the second study showed that the ages ranged from 25–48 years (M = 29, SD = 10.8).Most respondents were male: 98%, and mean working time was 11 years (SD = 6).
IV. MEASUREMENT JOB FACTORS
The items measuring demands, control and social support developed for use in Study 1 and study 2 were subjected to correlation and regression analyses. On the basis of these analyses, 16 of the original total demands and total control, and 8 of social support items, measuring four different job factor domains were selected for use in Study 1 and 2.
1) Job Demands Job demands were measured by using a sub-
dimension of Karasek et al.’s (1985) Job Content Survey and Bradley (2004). This dimension consists of 16 items scored on a 5-point Likert scale. Job demands were further divided into sub-set of four main groups
The Psychometric Impacts of Karasek’s Demands and Control Scale on Employees’ Job Dissatisfaction
29
Globa
l Jo
urna
l of M
anag
emen
t an
d Bu
sine
ss R
esea
rch
Volum
e XI Issu
e IvvvvV
Version
I
March
201
1
©2011 Global Journals Inc. (US)
Early V
iew
©2011 Global Journals Inc. (US)
[Qualitative Demands (Questionnaires A1, A7, A11, A13), Employees Demands (Questionnaires A4, A14, A15, A16), Workload Demands (Questionnaires A2, A3, A6, A12) and Conflicts Demands (Questionnaires A5, A8, A9, A10); see Appendix E-1]. Respondents are asked to rate their present job on a 5-point Likert scale ranging from 1= completely false to 5= completely true. The reliability and validity of the measure are available elsewhere (Karasek et al., 1985). Internal reliability for this scale with the current sample was a =0.81 (Daryl B. O’Connor et al. 2000). Cammann et al., (1983) reported the coeffieient of reliability of 0.65, and Bradley (2004) reported a reliability of 0.746 and weighted reliability of 0.939. The reliability coefficients produced by this research for total job demands subscales consisted of [alpha] T1 =0.94 and T2= 0.90.
2) Job Control We used Ganster’s (1989) validated measure
of job control. Ganster’s original scale had 22 items, each asking the subject how much control they possessed over the various facets of their work. We reduced the scale to 16 items, removing those items that were not applicable to the employees in our sample; these included questions about control over job demands. The control-scale consisted of two dimensions; skills discretion and decision authority. Skills discretion was measured by four items (“keep learning new things”, “job requires skill”, “job requires creativity”, “repetitive work”, control over the physical conditions of one’s work station, or control over the ability to decorate or personalize the work area. Decision authority was measured by some items (“have freedom to make decisions”, “can choose how to perform work”), with Cronbach’s alpha of .70. Scores on the items were averaged to provide an aggregate index of the amount of control perceived they had over their job, a high score indicates greater perceived control. All the items were scaled on a five-point Likert scale, ranging from 1 = have virtually no control to 5 = have complete control. Job control were further divided into sub-set of four main groups [Qualitative control (Questionnaires B1, B7, B11, B13), Employees control (Questionnaires B4, B14, B15, B16), Workload control (Questionnaires B2, B3, B6, B12) and Conflicts control (Questionnaires B5, B8, B9, B10); [see Appendix E-1]. Ganster (1989) reported internal reliability for this scale of also 0.85 and Bradley (2004) reported a reliability of 0.824 and weighted reliability of 0.947. The reliability coefficients produced by this research for total job control subscales consisted of [alpha] T1 =0.95 and T2= 0.94.
3) Social Support Social Support was measured using Bradley,
(2004), Caplan, Cobb, French, Van Harrison, and Pinneau's (1975) Social Support Scale and revised social support scale. This measure includes two
subscales: social support from supervisor (Questionnaire D1 to D4) and social support (E1 to E4) from work colleagues (see Appendix E-1). The measure asks the respondents to identify the extent to which four items of support are received from each of these two sources. Example items include: How much do your department administration staffs go out of their way to make life easier for you? And how much do your colleagues go out of their way to make easier for you? The participants responded on a five-point Likert scale where 1 = not at all to 5 = very much. High scores indicate high levels of social support. The measures' internal consistency was tested with Cronbach's alpha statistic. The reliability coefficients produced by this research for the two social support subscales consisted of [alpha] = T1 0.89 and T2 0.88 (supervisor) and [alpha] = T1 0.93 and T2 0.92 (colleagues). The Cronbach a estimate of reliability for the non commissioned officers support scale was 0.87 whereas Bradley, (2004) reported reliability of 0.887 (supervisor) and 0.903 (colleague). Caplan et al. report reliability coefficients of 0.83 for the supervisor support and 0.73 for the colleague support scales. Internal consistency reported by subsequent researchers is typically in excess of 0.70, and often approximates 0.90.
4) Job Dissatisfaction Employee’s job satisfaction was measured by
a four-item scale from Caplan et al. (1975), as adapted by McLaney & Hurrell (1988) and Bradley (2004). Items deemed inappropriate were excluded and appropriate items were included to extend the scale to 11 items. Each item is scored on a 5-point scale from 1 (strongly disagree) to 5 (strongly agree). Items included statements about the satisfaction with hours of work, rate of pay, opportunities to use one’s abilities, and promotional policies. The items on this scale (see Appendix E-1 from C1 to C11) are similar to those measuring the same construct within Karasek’s (1985) Job Content Questionnaire. Chay (1993), Sargent and Terry (1998), Sauter et al. (1983) and others have used this scale or modifications of it. Caplan et al. reported a reliability coefficient for their version of 0.85, McLaney and Hurrell reported a coefficient of 0.83, and Bradley (2004) reported a reliability coefficient of 0.899. Reliability and validity data is reported by Warr et al. (1979) of 0.83. The reliability coefficients produced by this research for total job dissatisfaction scale consisted of [alpha] T1 =0.84 and T2= 0.83.
V. Statistical Treatment
Pearson correlations were computed to assess zero-order relationships between the variables. In addition, moderator and mediation models were used to test the hypothesized relationship between demand, control and support, and the outcome measures
The Psychometric Impacts of Karasek’s Demands and Control Scale on Employees’ Job Dissatisfaction
30
March
201
1 Gl oba
l Jo
urna
l of M
anag
emen
tan
d Bu
sine
ss R
esea
rch
Volum
e XI Issu
e IV
Ver
sion
I
Early V
iew
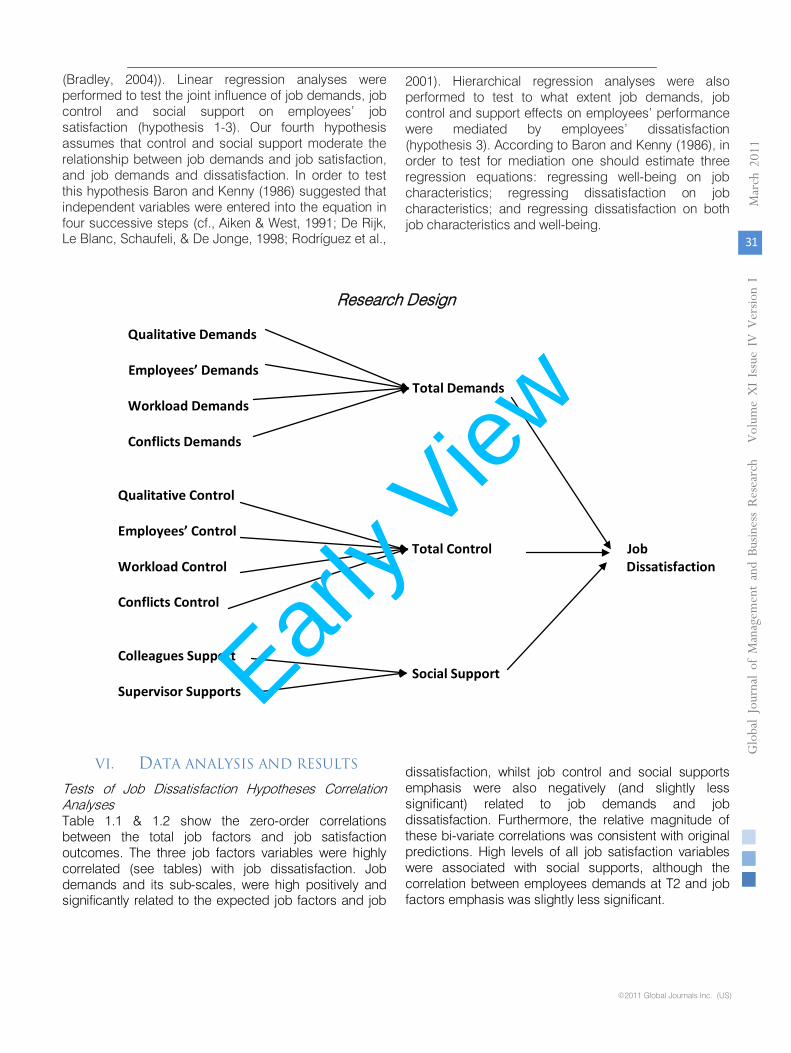
(Bradley, 2004)). Linear regression analyses were performed to test the joint influence of job demands, job control and social support on employees’ job satisfaction (hypothesis 1-3). Our fourth hypothesis assumes that control and social support moderate the relationship between job demands and job satisfaction, and job demands and dissatisfaction. In order to test this hypothesis Baron and Kenny (1986) suggested that independent variables were entered into the equation in four successive steps (cf., Aiken & West, 1991; De Rijk, Le Blanc, Schaufeli, & De Jonge, 1998; Rodríguez et al.,
2001). Hierarchical regression analyses were also performed to test to what extent job demands, job control and support effects on employees’ performance were mediated by employees’ dissatisfaction (hypothesis 3). According to Baron and Kenny (1986), in order to test for mediation one should estimate three regression equations: regressing well-being on job characteristics; regressing dissatisfaction on job characteristics; and regressing dissatisfaction on both job characteristics and well-being.
Research Design
Qualitative Demands Employees’ Demands Total Demands Workload Demands Conflicts Demands Qualitative Control Employees’ Control Total Control Job Workload Control Dissatisfaction Conflicts Control Colleagues Support Social Support Supervisor Supports
VI. DATA ANALYSIS AND RESULTS Tests of Job Dissatisfaction Hypotheses Correlation Analyses Table 1.1 & 1.2 show the zero-order correlations between the total job factors and job satisfaction outcomes. The three job factors variables were highly correlated (see tables) with job dissatisfaction. Job demands and its sub-scales, were high positively and significantly related to the expected job factors and job
dissatisfaction, whilst job control and social supports emphasis were also negatively (and slightly less significant) related to job demands and job dissatisfaction. Furthermore, the relative magnitude of
these bi-variate correlations was consistent with original predictions. High levels of all job satisfaction variables were associated with social supports, although the correlation between employees demands at T2 and job factors emphasis was slightly less
significant.
The Psychometric Impacts of Karasek’s Demands and Control Scale on Employees’ Job Dissatisfaction
31
Globa
l Jo
urna
l of M
anag
emen
t an
d Bu
sine
ss R
esea
rch
Volum
e XI Issu
e IvvvvV
Version
I
March
201
1
©2011 Global Journals Inc. (US)
Early V
iew

©2011 Global Journals Inc. (US)
Table 1.1 : Correlation Matrix (N=402)
TIME 1 Time Variables
S. No.
Job Factors 1 2 3 4 5 6 7 8 9 10 11 12 13 14
1 Qualitative Demands 1 2 Employees Demands .75 1 3 Workload Demands .85 .80 1 4 Conflicts Demands .82 .74 .85 1 5 Total Demands .93 .86 .95 .93 1 6 Qualitative Control -.68 -.64 -.70 -.68 -.73 1 7 Employees Control -.63 -.60 -.68 -.66 -.70 .84 1 8 Workload Control -.70 -.66 -.73 -.69 -.76 86 .85 1 9 Conflicts Control -.61 -.58 -.67 -.63 -.68 .80 81 .85 1 10 Total Control -.70 -.66 -.75 -.71 -.77 .93 .93 .96 .92 1 11 Colleagues support -.75 -.64 -.77 -.74 -.80 .69 .64 .69 .64 .71 1
12 Supervisor support -.79 -.68 -.79 -.76 .83 .72 .66 .71 .66 .73 .88 1
13 Social supports -.78 -.77 -.80 -.77 .82 .72 .65 .72 .64 .98 .96 90 1
14 Job dissatisfaction .80 .68 .81 .80 .85 -.73 -.68 -.73 -.69 -.76 -.83 -.87 -.86 1
Table 1.2 : Correlation Matrix (N = 388)
TIME 2
Time Variables S. No.
Job Factors 1 2 3 4 5 6 7 8 9 10 11 12 13 14
1 Qualitative Demands
1
2 Employees Demands
.38 1
3 Workload Demands
.84 .37 1
4 Conflicts Demands .80 .39 .85 1 5 Total Demands .92 .56 .94 .92 1 6 Qualitative Control -.67 -.37 -.69 -.69 -.73 1 7 Employees Control -.61 -.31 -.65 -.63 .67 .80 1 8 Workload Control -.64 -.37 -.69 -.66 .71 .86 .80 1 9 Conflicts Control -.59 -.30 -.63 -.60 .64 .80 .73 82 1 10 Total Control -.68 -.37 -.72 -.70 -.74 .94 .90 .94 .90 1 11 Colleagues
support -.57 -.26 -.58 -.54 -.59 .49 .43 .48 .45 .50 1
12 Supervisor support
-.79 -.36 -.80 -.75 -.82 .69 .60 .66 .62 .72 .62 1
13 Social supports -.63 -.24 -.62 -.58 -.64 -.45 .41 .44 .45 .46 .65 .77 1
14 Job dissatisfaction .81 .35 .84 .81 .85 -.75 -.68 -.72 -.68 -.77 -.66 -.86 -.67 1
The Psychometric Impacts of Karasek’s Demands and Control Scale on Employees’ Job Dissatisfaction
32
March
201
1 Globa
l Jo
urna
l of M
anag
emen
tan
d Bu
sine
ss R
esea
rch
Volum
e XI Issu
e IV
Ver
sion
I
Early V
iew
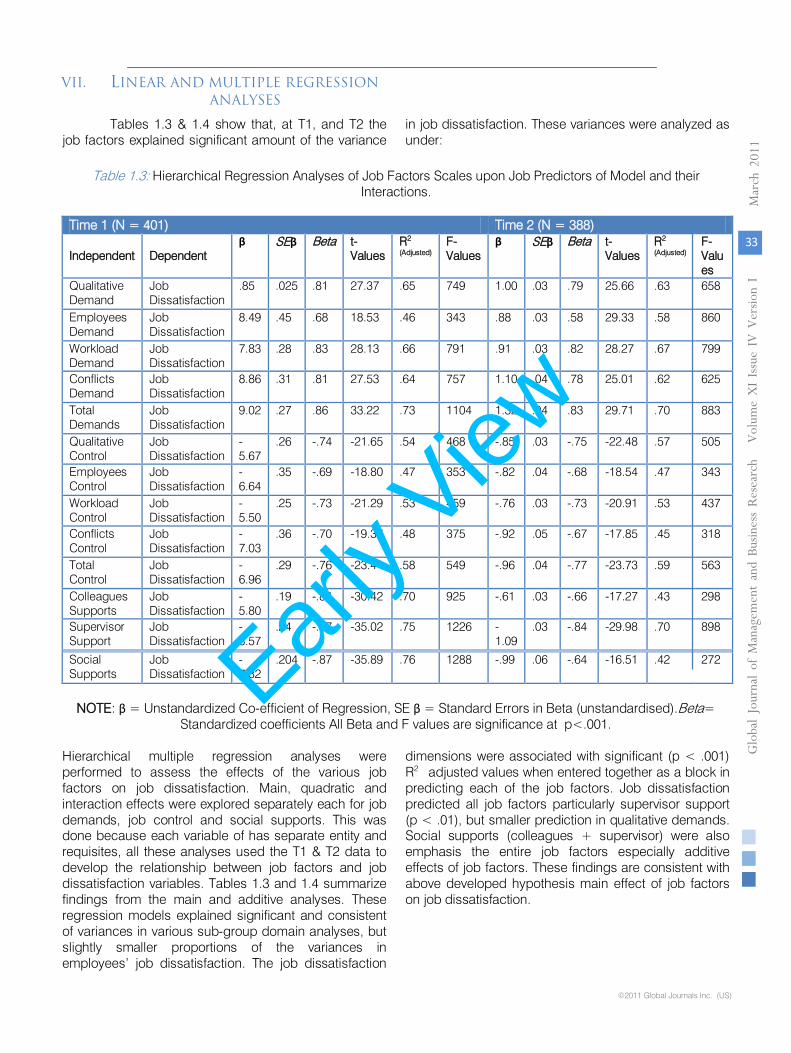
VII. LINEAR AND MULTIPLE REGRESSION ANALYSES
Tables 1.3 & 1.4 show that, at T1, and T2 the job factors explained significant amount of the variance
in job dissatisfaction. These variances were analyzed as under:
Table 1.3: Hierarchical Regression Analyses of Job Factors Scales upon Job Predictors of Model and their
Interactions. Time 1 (N = 401) Time 2 (N = 388) Independent
Dependent
β SEβ Beta t-Values
R2
(Adjusted) F-Values
β SEβ Beta t-Values
R2
(Adjusted) F-Values
Qualitative Demand
Job Dissatisfaction
.85 .025 .81 27.37 .65 749 1.00 .03 .79 25.66 .63 658
Employees Demand
Job Dissatisfaction
8.49 .45 .68 18.53 .46 343 .88 .03 .58 29.33 .58 860
Workload Demand
Job Dissatisfaction
7.83 .28 .83 28.13 .66 791 .91 .03 .82 28.27 .67 799
Conflicts Demand
Job Dissatisfaction
8.86 .31 .81 27.53 .64 757 1.10 .04 .78 25.01 .62 625
Total Demands
Job Dissatisfaction
9.02 .27 .86 33.22 .73 1104 1.32 .04 .83 29.71 .70 883
Qualitative Control
Job Dissatisfaction
-5.67
.26 -.74 -21.65 .54 468 -.85 .03 -.75 -22.48 .57 505
Employees Control
Job Dissatisfaction
-6.64
.35 -.69 -18.80 .47 353 -.82 .04 -.68 -18.54 .47 343
Workload Control
Job Dissatisfaction
-5.50
.25 -.73 -21.29 .53 459 -.76 .03 -.73 -20.91 .53 437
Conflicts Control
Job Dissatisfaction
-7.03
.36 -.70 -19.37 .48 375 -.92 .05 -.67 -17.85 .45 318
Total Control
Job Dissatisfaction
-6.96
.29 -.76 -23.44 .58 549 -.96 .04 -.77 -23.73 .59 563
Colleagues Supports
Job Dissatisfaction
-5.80
.19 -.84 -30.42 .70 925 -.61 .03 -.66 -17.27 .43 298
Supervisor Support
Job Dissatisfaction
-8.57
.24 -.87 -35.02 .75 1226 -1.09
.03 -.84 -29.98 .70 898
Social Supports
Job Dissatisfaction
-7.32
.204 -.87 -35.89 .76 1288 -.99 .06 -.64 -16.51 .42 272
NOTE: β = Unstandardized Co-efficient of Regression, SE β = Standard Errors in Beta (unstandardised).Beta=
Standardized coefficients All Beta and F values are significance at p<.001. Hierarchical multiple regression analyses were performed to assess the effects of the various job factors on job dissatisfaction. Main, quadratic and interaction effects were explored separately each for job demands, job control and social supports. This was done because each variable of has separate entity and requisites, all these analyses used the T1 & T2 data to develop the relationship between job factors and job dissatisfaction variables. Tables 1.3 and 1.4 summarize findings from the main and additive analyses. These regression models explained significant and consistent of variances in various sub-group domain analyses, but slightly smaller proportions of the variances in employees’ job dissatisfaction. The job dissatisfaction
dimensions were associated with significant (p < .001) R2 adjusted values when entered together as a block in predicting each of the job factors. Job dissatisfaction predicted all job factors particularly supervisor support (p < .01), but smaller prediction in qualitative demands. Social supports (colleagues + supervisor) were also emphasis the entire job factors especially additive effects of job factors. These findings are consistent with above developed hypothesis main effect of job factors on job dissatisfaction.
The Psychometric Impacts of Karasek’s Demands and Control Scale on Employees’ Job Dissatisfaction
33
Globa
l Jo
urna
l of M
anag
emen
t an
d Bu
sine
ss R
esea
rch
Volum
e XI Issu
e IvvvvV
Version
I
March
201
1
©2011 Global Journals Inc. (US)
Early V
iew
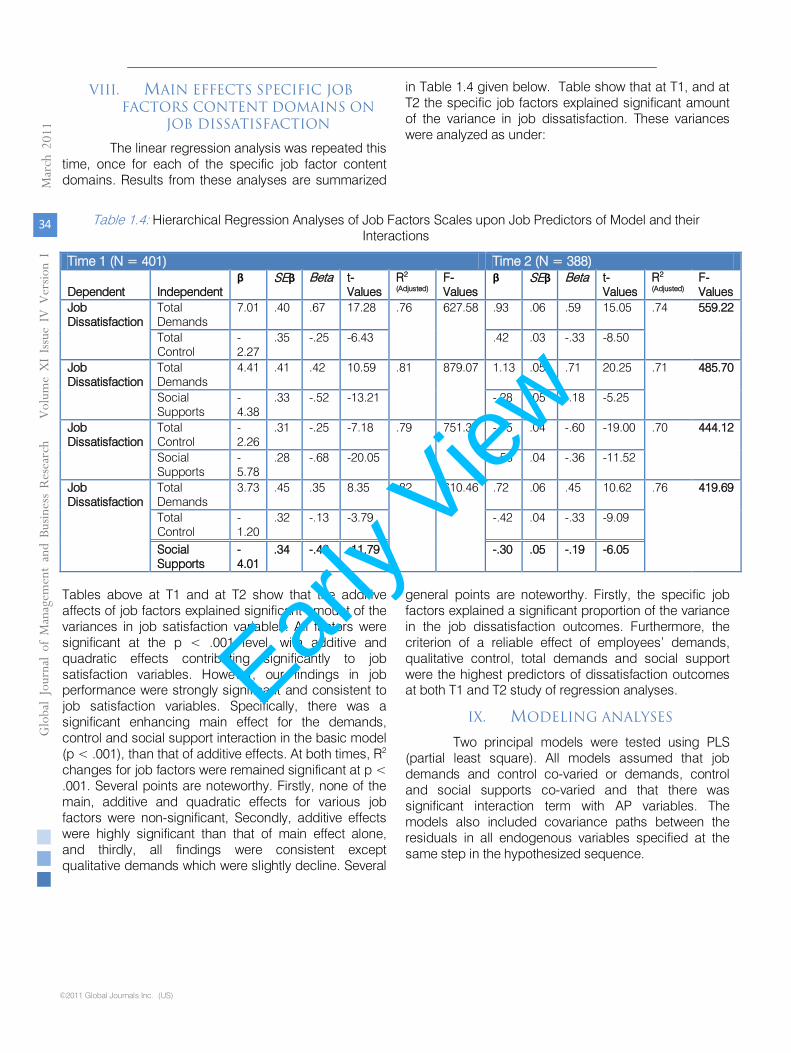
©2011 Global Journals Inc. (US)
VIII. MAIN EFFECTS SPECIFIC JOB FACTORS CONTENT DOMAINS ON
JOB DISSATISFACTION
The linear regression analysis was repeated this time, once for each of the specific job factor content domains. Results from these analyses are summarized
in Table 1.4 given below. Table show that at T1, and at T2 the specific job factors explained significant amount of the variance in job dissatisfaction. These variances were analyzed as under:
Table 1.4: Hierarchical Regression Analyses of Job Factors Scales upon Job Predictors of Model and their Interactions
Time 1 (N = 401) Time 2 (N = 388) Dependent
Independent
β SEβ Beta t-Values
R2
(Adjusted) F-Values
β SEβ Beta t-Values
R2
(Adjusted) F-Values
Job Dissatisfaction
Total Demands
7.01 .40 .67 17.28 .76 627.58 .93 .06 .59 15.05 .74 559.22
Total Control
-2.27
.35 -.25 -6.43 .42 .03 -.33 -8.50
Job Dissatisfaction
Total Demands
4.41 .41 .42 10.59 .81 879.07 1.13 .05 .71 20.25 .71 485.70
Social Supports
-4.38
.33 -.52 -13.21 -.28 .05 -.18 -5.25
Job Dissatisfaction
Total Control
-2.26
.31 -.25 -7.18 .79 751.37 -.75 .04 -.60 -19.00 .70 444.12
Social Supports
-5.78
.28 -.68 -20.05 -.56 .04 -.36 -11.52
Job Dissatisfaction
Total Demands
3.73 .45 .35 8.35 .82 610.46 .72 .06 .45 10.62 .76 419.69
Total Control
-1.20
.32 -.13 -3.79 -.42 .04 -.33 -9.09
Social Supports
-4.01
.34 -.48 -11.79 -.30 .05 -.19 -6.05
Tables above at T1 and at T2 show that the additive affects of job factors explained significant amount of the variances in job satisfaction variables. All factors were significant at the p < .001 level, with additive and quadratic effects contributing significantly to job satisfaction variables. However, our findings in job performance were strongly significant and consistent to job satisfaction variables. Specifically, there was a significant enhancing main effect for the demands, control and social support interaction in the basic model (p < .001), than that of additive effects. At both times, R2 changes for job factors were remained significant at p < .001. Several points are noteworthy. Firstly, none of the main, additive and quadratic effects for various job factors were non-significant, Secondly, additive effects were highly significant than that of main effect alone, and thirdly, all findings were consistent except qualitative demands which were slightly decline. Several
general points are noteworthy. Firstly, the specific job factors explained a significant proportion of the variance in the job dissatisfaction outcomes. Furthermore, the criterion of a reliable effect of employees’ demands, qualitative control, total demands and social support were the highest predictors of dissatisfaction outcomes at both T1 and T2 study of regression analyses.
IX. MODELING ANALYSES
Two principal models were tested using PLS (partial least square). All models assumed that job demands and control co-varied or demands, control and social supports co-varied and that there was significant interaction term with AP variables. The models also included covariance paths between the residuals in all endogenous variables specified at the same step in the hypothesized sequence.
The Psychometric Impacts of Karasek’s Demands and Control Scale on Employees’ Job Dissatisfaction
34
March
201
1 Gl oba
l Jo
urna
l of M
anag
emen
tan
d Bu
sine
ss R
esea
rch
Volum
e XI Issu
e IV
Ver
sion
I
Early V
iew
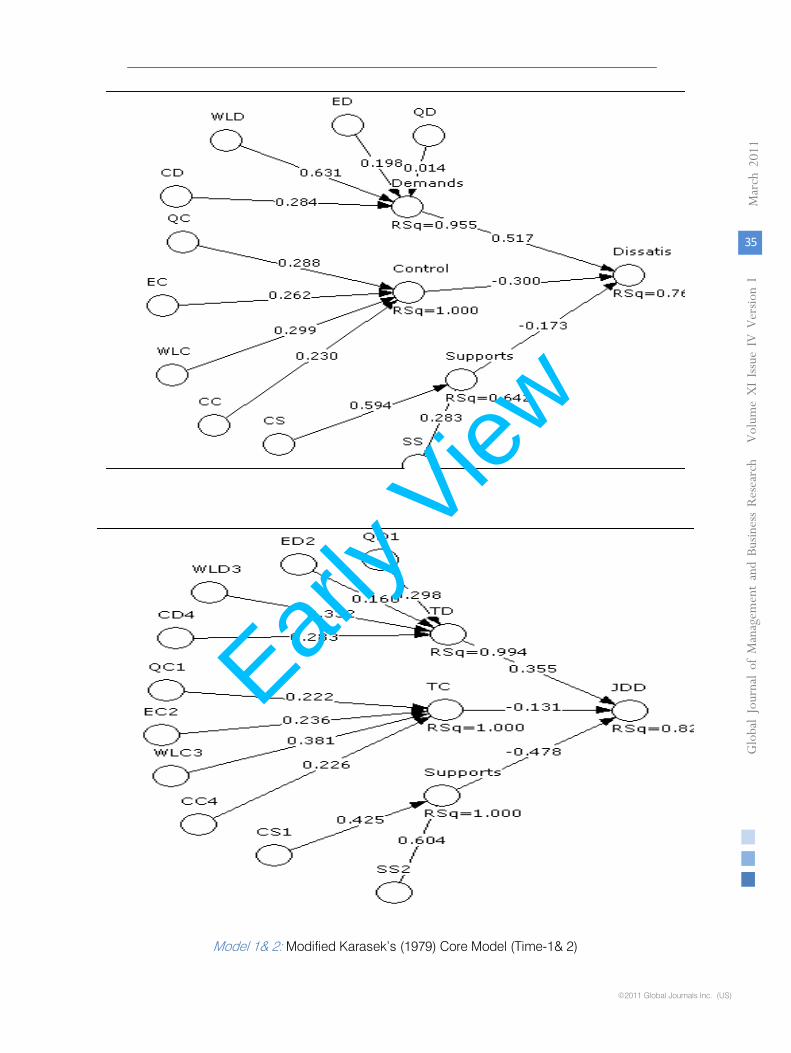
Model 1& 2: Modified Karasek’s (1979) Core Model (Time-1& 2)
The Psychometric Impacts of Karasek’s Demands and Control Scale on Employees’ Job Dissatisfaction
35
Globa
l Jo
urna
l of M
anag
emen
t an
d Bu
sine
ss R
esea
rch
Volum
e XI Issu
e IvvvvV
Version
I
March
201
1
©2011 Global Journals Inc. (US)
Early V
iew

©2011 Global Journals Inc. (US)
X. SUMMARY OF MAIN FINDINGS
This section summarizes findings relevant to the immediate outcomes of dissatisfaction hypotheses.
Hypothesis 1 Main Effects of Demands on Job Dissatisfaction Findings from total demands and specific factors domains provide impressive support for the predicted effect of job demands on dissatisfaction. The effects were consistent across job domains and dissatisfaction outcomes. Mostly strong effects were found for all demands scales on job dissatisfaction except qualitative demands scale. Therefore, hypothesis 1 was confirmed.
Hypothesis 2 Main Effects of Job Control on Job Dissatisfaction Most findings were supported the predicted effects of control on job dissatisfaction. The strongest relationships as compare to others were (a) additive effect of total demands + social support (b) total demands + total control + social support on job dissatisfaction, and (c) conflicts control on on job dissatisfaction. Regression analyses indicated that control over issues in the conflicts domain was a more reliable predictor of dissatisfaction than was control in other job domains.
Hypothesis 3 Main effects of Social Support on Job Dissatisfaction There was significant support for this hypothesis from the ANOVAs and linear regression analyses. However, the ANOVAs and the regression analyses both indicated that supervisor support explains significant amounts of unique variance in job dissatisfaction. On the other hand, colleagues support was also significant but slightly lower than supervisory support. The social support (supervisory support and colleagues support) was remained significant on all job factors, particularly, on job dissatisfaction.
Hypothesis 4 Additive Effects of Demands and Control on Job Dissatisfaction This hypothesis was supported using various angles of correlation and regression analysis. Findings were supported through additive and interactive analysis that job demands and job control explained significant amounts of variance in job dissatisfaction outcomes better than main effect alone. Furthermore, total demands and sub-scales (particularly employee’s demands) for this effect was strongest as compare to total control domains when the outcomes job dissatisfaction.
Hypothesis 5 Additive Effects of Demands and Social Support on Job Dissatisfaction The demands - support additive hypothesis (Table 1.4)) reported highly significant prediction than any other
combination of job factors. This hypothesis was strongly confirmed in correlation as well as multiple regression analyses. The effects of the two additive terms - involving supervisory support and colleague support - varied with type of dissatisfaction.
Hypothesis 6 Additive Effects of Control and Social Support on Job Dissatisfaction Findings were much cleared relation to this hypothesis. In the regression analyses, the effect of control + social support predicts the job dissatisfaction better than the main effect alone. This difference between the two studies of control + social support at T1 & T2 was remained nearly same variance. Multiple regression analyses indicated that total control and social support was more reliable predictor of dissatisfaction than was sub-scales of total except in models that included control as a mediating variable.
Hypothesis 9 Additive Effects of Demands, Control and Social Support on Job Dissatisfaction This hypothesis received more support than did any of the other interaction hypotheses. Because of that in the multiple regression analyses, the total demands + total control + social support interaction were predicted job dissatisfaction significantly at T1, at T2. This hypothesis received some special support from the regression analyses, and from the cross-sectional one-way ANOVAs. Support was also obtained from evidence that entry of all three job factors as predictors in study 1 & 2 multiple regression analyses yielded significant increases in explained variance at each step in several of the dissatisfaction outcomes. Evidence of this kind was stronger for hypothesis (demands + control + supervisory support) than for hypothesis carried dual or main effect alone.
XI. DISCUSSION ON MAIN FINDINGS REGARDING DISSATISFACTION
HYPOTHESES
Consistent with the prior researches and our Study 1 findings, demands, Control and social support had significant effects on dissatisfaction. Significant effects were typically associated with job demands and social support than with job control. The T1 job factors on T2 dissatisfaction have not been reported due to the greater instability and non-significance results. Significant findings were obtained for the hypothesized additive effect of demands and control, thus confirming Karasek’s (1979, p. 287) outcomes that “dissatisfaction results not from a single aspect of the work factors, but from the joint effects” of demands and control. Whilst similar additive effects have been reported in past researches and T1, the current findings were noteworthy for their consistency, especially given the relatively high correlations between corresponding measures of demands and control (see Table 1.1 & 1.2). The total
The Psychometric Impacts of Karasek’s Demands and Control Scale on Employees’ Job Dissatisfaction
36
March
201
1 Gl oba
l Jo
urna
l of M
anag
emen
tan
d Bu
sine
ss R
esea
rch
Volum
e XI Issu
e IV
Ver
sion
I
Early V
iew
proportion of variance in dissatisfaction explained by these two job factors was high enough (typically 70-95%). Furthermore, high or low level of correlation may be contributed through many variables potentially associated to dissatisfaction outcomes; it may be unrealistic to expect proportions of explained variance to be much higher than this (Semner et al., 1996 & Bradley, 2004). Karasek’s original model is commonly interpreted as predicting a demands + control interaction upon dissatisfaction outcomes. Most of the past researchers reported their findings in (a) male or mixed sex, blue-collar samples, (b) cross-sectional designs, and (c) congruent and occupation-specific self-report measures of the job characteristics. In the current study, considerable support for the interaction hypothesis was obtained. Somewhat interestingly, in the light of T1 & T2 findings, evidence of the buffering effects of control was stronger in the study 2 than in the T1 analyses. The extent to which control buffered the effects of demands was shown too consistent across job domains and dissatisfaction outcomes. The qualitative demands, workload demands and workload control interaction term were particularly successful in predicting job dissatisfaction in those models that included stressors as a mediating variable, suggesting that interaction effects on dissatisfaction stronger than other two outcomes. Several researchers (e.g., Burke & Greenglass, 1995; Pomaki, 2001; Sheffield et al., 1994; Bradley, 2004) have found that social support does not correlate highly with dissatisfaction in samples of white collar employees. On the other hand, researchers such as Alloway and Bebbington (1987), Payne and Jones (1987) and Buunk and Peeters (1994), have concluded that significant findings occur significantly but not frequently than would be expected. Both studies (T1 & T2) included separate measures of supervisor and colleague support (scales of Caplan et al., 1975), both used cross-sectional designs with an nine-month time lag and both tested the buffering hypothesis using continuous interaction terms within the models and reported significant of interaction of social support. Bradley, (2004) reported in his cross-sectional correlations between social support and dissatisfaction in the region of -.20. Despite this modest mean, their bi-variate correlation, several main effects for social support were significant in the multivariate analyses. Similar analyses were found in our study I & II support from supervisors was a strong (negative) predictor of all three outcomes of job dissatisfaction, whilst support from colleagues was lower in study 1 highly predictive of job outcomes in study 2. Thus, Kahn and Byosiere (1992), Mitchell et al. (1982), and some others have indicated that the stressor x support interaction may hold only for particular combinations of job factors not all types of support and specific outcomes of job dissatisfaction. The demands + support, and control + support, hypotheses were strongly supported by the
current findings. The mean R2 adjusted associated with the control + social support prediction was .81 at T1, and .71 at T2. Indeed, the findings are more consistent with an additive than with main or independent effects with the model of the effects of demands and support upon dissatisfaction. Two possible exceptions to this general pattern of non-significant effects were the interactions between (a) colleagues support and employees’ demands at T1, and (b) colleague support and all stressors at T2. These significant effects provided support to hypothesis but buffering effects are most pronounced when the type of support offered to meet the particular needs of the person who is experiencing dissatisfaction. According to this “dissatisfaction- matching concept” hypothesis, well-targeted and specific types of support are of much more use to those experiencing dissatisfaction than to those who are not, and hence the beneficial effects of such support varies between employees depending on their requirements and circumstances available at work environment. In the current context, it makes sense that qualitative demands, employees issues and workload were rendered less stressful by the provision of supervisor support (since supervisors generally have responsibility over such matters and have power to bring certain changes), whilst the impact of colleagues support may not alleviated or minimized the pressure of dissatisfaction (due to lack of decision latitude), who may be more likely than supervisors to provide empathy, opportunities for emotional release, and practical assistance in this domain. Consistent with past research, the present findings suggested that control + colleague support impacted more strongly on dissatisfaction than on any other dissatisfaction outcomes, whilst control + supervisor support had strong effects on both dissatisfaction and other outcomes of dissatisfaction. Therefore, evidence is accumulating in support of the views that the two job factors of control and social support operate in supplementary, rather than substitutive, ways to counteract all or at least some kinds of dissatisfaction. Whilst some studies were made for the additive effects of control and social support, the current research provides sufficient grounds to support a claim of an interactive effect of these two job factors on dissatisfaction. Given the current findings, there may be value in future researchers examining the impact of the control + social support interaction on this criterion. If replicated, the finding may have implications for reducing levels of staff turnover in an organization. This chapter reported findings from multiple regression analyses of several versions of two principal models and two additional models of the relationships between job factors and dissatisfaction. Findings from these analyses suggested that model choice depended upon the relative importance attached to goodness-of-fit and parsimony and also in consideration of work
The Psychometric Impacts of Karasek’s Demands and Control Scale on Employees’ Job Dissatisfaction
37
Globa
l Jo
urna
l of M
anag
emen
t an
d Bu
sine
ss R
esea
rch
Volum
e XI Issu
e IvvvvV
Version
I
March
201
1
©2011 Global Journals Inc. (US)
Early V
iew
©2011 Global Journals Inc. (US)
environment. Model 1, (both T1 & T2) which specified direct effects from all job factors to all dissatisfaction outcomes yielded the best set of fit statistics, although greater parsimony was achieved by models that included mediating variables such as stressors and/or immediate dissatisfaction outcomes. Both models explained similar amounts of variance in the dissatisfaction outcomes. The direct effects version of model 1tended to provide a better fit than did the corresponding hypothesized versions, a finding that is consistent with the evidence that the best compilation fit was provided by model 1 and model 2. Regression analyses significantly confirmed the hypothesized role of job demands in mediating the relationships between the job factors and job dissatisfaction. Finally, it was concluded that the findings from this study provide quite strong evidence of the additive effects of demands, control and social support upon self-reports of dissatisfaction, and more modest evidence of main effects of these three job factors. Terms representing the interactions between the job factors accounted for considerable variance in all seven measures of dissatisfaction. Given the number of tests conducted and the significant effects generally obtained, it seems reasonable to conclude that Study 2 provides qualified support to some level for Karasek’s (1979; Karasek & Theorell, 1990) main and additive effects models of job dissatisfaction.
XII. RECOMMENDATIONS FOR WAPDA MANAGEMENT
Focus of this study is on the following points, which are of great significance and are helpful to researchers and managers in future in energy sector (power wing of WAPDA) of Pakistan 1. This research study remained focused on individual
employees in understanding the factors/stressors that influence whether someone working very hard feeling is stressed out, or whether they are feeling motivated, excited and committed or free of any organizational job dissatisfaction. Our research outcomes (T1 and T2) reported clearly that most of the employees are feeling significant amount of job dissatisfaction due to promotional policies and low salaries structure, poor training programs, low fringe benefits as compare to other commercial organizations of Pakistan like Oil & Gas Development Company and Atomic Energy Commission of Pakistan.
2. Minimizing job dissatisfaction, through the study of job redesign in light of variety of intra- organizational stressors (qualitative demands, employees’ demands and conflicts demands), giving employees control and power to make job-related decisions, the flexibility to organize their work in the way they find
optimal and the authority to make improvements on how their job is done effectively.
3. This study enables managers (of WAPDA) to understand the sources of job dissatisfaction and make decisions how to improve the employee job satisfaction, performance and job description in consideration of our analysis of Demand Control Support Model.
4. These studies (T1 & T2) communicate clearly the significant effect of social support on immediate and remote outcomes of strain in the work environment of WAPDA. Supervisors can know how to provide guidance; support and to organize the level of job demands, on the worker’s decision- making latitude, and on the quality of social support available from management and co-workers.
5. This study’s reports (four subscales of each job demands, control and dissatisfaction; two subscale of social support) give recommendations to organization if the time and financial resources you invest in restructuring the recruitment policies (development of Human Resource Department), promotional policies, salaries structures, fringe benefits (in consideration of real wages) and training employees will pay huge dividends in reducing employees’ job stress, job dissatisfaction, increasing productivity and minimizing turnover of competent and productive employees. Study also reports that training programs most likely to be successful in which workers played key roles in work restructuring and work reorganization.
6. Finally, it is suggested that re-structuring and other necessary reforms at WAPDA must be designed to boost efficiency, foster good corporate governance, cut off costs, and make these entities truly commercially viable enterprises. Because the operating costs and line losses of DISCOS are too high and it was necessary to undertake a comprehensive re-structuring program and split DISCOS into smaller companies and privatize them.
REFERENCES RÉFÉRENCES REFERENCIAS
1) Alloway, R., & Bebbington, P. (1987). The buffer theory of social support-a review of the literature. Psychological Medicine, 17, 91-108.
2) Aiken, L. S., & West, S. G. (1991). Multiple regression: Testing and interpreting interactions.Newbury Park: Sage.
3) Baron, R. M., & Kenny, D. A. (1986). The moderator-mediator variable distinction in socialpsychological research: Conceptual, strategic, and statistical considerations. Journal ofPersonality and Social Psychology, 51, 1173-1182.
4) Bradley, G. (2004). A Test of Demands-Control- Support Model. Job Strain and healthywork.
The Psychometric Impacts of Karasek’s Demands and Control Scale on Employees’ Job Dissatisfaction
38
March
201
1 Globa
l Jo
urna
l of M
anag
emen
tan
d Bu
sine
ss R
esea
rch
Volum
e XI Issu
e IV
Ver
sion
I
Early V
iew
Journal of Applied Psychology: Griffith University, Australia.
5) Burke, R. J. (1993). Organizational-level interventions to reduce occupational stressors.Work and Stress, 7, 77-87.
6) Buunk & Peeters, (1994). Stress at work, social support and companionship: Towards anevent-contingent recording approach. Work and Stress, 8, 177-190.
7) Byrne, B. M. (1993). Burnout Inventory: Testing for factorial validity and invariance across the employees. Journal of Occupational and Organizational Psychology, 66, 197-212.
8) Campbell, D. T., & Fiske, D. W. (1959). Convergent and discriminant validation by the multi-trait multi-method matrix. Psychological Bulletin, 56, 81-105.
9) Connor, P. R., & Clarke, V. A. (1990). Determinants of teacher stress. Australian Journal ofEducation, 34, 41-51.
10) Cummins, R. (1989). Locus of control and social support: Clarifiers of the relationshipBetween job stress and job satisfaction, Journal of Applied Social Psychology, 19, 772-788.
11) Caplan, R., Cobb, S., & French, J., Van Harrison, R., & Pinneau, S., (1975). Job demands and worker health. Washington D. C.: Institute for Social Research,University of Michigan/ National Institute of Occupational Safety and Health.
12) Chay, Y. (1993). Social support, individual differences and well-being: A study of smallbusiness entrepreneurs and employees. Journal of Occupational and OrganizationalPsychology, 66, 285-302.
13) Cooper, C. L. (1998). Theories of organizational stress. Oxford: Oxford University Press.
14) Cooper, C. L., & Bramwell, R. S. (1992). A comparative analysis of occupational stress inmanagerial and shopfloor workers in the brewing industry: Mental health, job satisfaction and sickness. Work and Dissatisfaction, 6, 127-138.
15) Cronbach, L. J. (1951). Coefficient alpha and the internal structure of tests. Psychometrika, 16, 297-334.
16) Cummins, R. (1989). Locus of control and social support: Clarifiers of the relationship between sjob stress and job satisfaction, Journal of Applied Social Psychology, 19, 772-788.
17) de Jonge, J., & Kompier, M. A. J. (1997). A critical examination of the demand-control-supportmodel from a work psychological perspective. International Journal of StressManagement, 4, 235-258.
18) de Rijk, Le Blanc, P. M., Schaufeli, W., & de Jonge, J. (1998). Active coping andneed for control as moderators of the job demand-control model: Effects on burnout.Journal of Occupational and Organizational Psychology, 71, 1-18.
19) Folkman, (1984). Personal control and stress and coping processes. Journal of Personality and Social Psychology, 46, 839-852.
20) Fox, Dwyer, D., & Ganster (1993). Effects of stressful job demands and controlof physiological and attitudinal outcomes in a hospital setting. Academy of Management Journal, 36, 289-318.
21) French, J. R. P., & Kahn, R. L. (1962). A programmatic approach to studying the industrialenvironment and mental health. Journal of Social Issues, 18, 1-47.
22) Frese & Zapf, D. (1988). Methodological issues in the study of work stress: Coping and consequences of stress at work (pp. 375-411). Objective versus subjective measurement of work stress and the question of longitudinal studies. Chichester: Wiley.
23) Ganster, D.C., Fox, M.L., & Dwyer, D.J. (1989 & 2001). Explaining employees’ health care costs: A prospective examination of stressful job demands, personal control, and physiological reactivity. Journal of Applied Psychology, 86, 954–964.
24) Greenberger, D., Strasser, S., Cummings, & Dunham, R. (1989). The impact of personal control on performance and satisfaction. Organizational Behavior, 43, 29-51.
25) Greenglass, E., Burke, R., & Konarski, R. (1997). The impact of social support on thedevelopment of burnout in employees: Work and job Stress, 11, 267-278.
26) Hakanen, J., Schaufeli, W., & Bakker, A. (2002, July). Testing a model of engagement andburnout among Finnish teachers. Paper presented at the Twenty-Fifth International Congress of Applied Psychology, Singapore.
27) Hackman, J. R., & Oldham, G. R. (1980). Development of the Job Diagnostic Survey. Journal of Applied Psychology, 60, 159-170.
28) Karasek, R. (1981). Job socialization and job strain: The implications of two related psychosocial mechanisms for job re-design. In B. Gardell, & G. Johansson,Working life (pp. 75-94). Chichester: Wiley.
29) Karasek, R. (1985). Job Content Questionnaire. Department of Industrial and Systems Engineering, University of Los Angeles, California.
30) Karasek, R. & Theorell T. (1990). Healthy work: Stress, productivity, and the reconstruction Of
The Psychometric Impacts of Karasek’s Demands and Control Scale on Employees’ Job Dissatisfaction
39
Globa
l Jo
urna
l of M
anag
emen
t an
d Bu
sine
ss R
esea
rch
Volum
e XI Issu
e IvvvvV
Version
I
March
201
1
©2011 Global Journals Inc. (US)
Early V
iew
©2011 Global Journals Inc. (US)
working life. New York: Basic Books. 31) Kahn, R. L., & Byosiere, P. (1992).
Dissatisfaction in organizations. In M. D. Dunette, & L. M. Hough (Eds.), Handbook of industrial and organizational psychology (2nd ed.) (pp. 571-650).Palo Alto, California: Consulting Psychologists Press.
32) Landsbergis, P. A., Schnall, P. L., Deitz, D., Friedman, R., & Pickering, T. (1992). The patterning of psychological attributes and distress by “job strain” and social support in asample of working men. Journal of Behavioral Medicine, 15, 379-405.
33) Lazarus, R. S., & Folkman, S. (1984). Stress, appraisal and coping. New York: Springer.
34) Likert, R. (1967). The human organization. New York: McGraw-Hill.
35) McLaney, M., & Hurrell, J. (1988). Control, stress and job satisfaction in Canadian nurses.Work and Stress, 2, 217-224.
36) Mitchell, R.., Billings, A., & Moos, R. (1982). Social support and well-being: Implications for prevention programs. Journal of Primary Prevention, 3, 77-98.
37) Nelson, D. L., & Sutton, C. (1990). Chronic work stress and coping: A longitudinal study and suggested new directions. Academy of Management Journal, 33, 859-869.
38) Rodriguez, I., Bravo, M. J., Peiro, J. M., & Schaufeli, W. (2001). The Demands-Control-Support model, locus of control and job satisfaction: A longitudinal study. Work and Stress, 15, 97-114.
39) Payne, R., & Fletcher, B. (1983). Job demands, support and constraints as predictors of psychological strain among organizational employees. Journal of Vocational Behavior,10, 213-229.
40) Sargent, L., & Terry, D. (2000). The moderating role of social support in Karasek’s job strain model. Work and Stress, 14, 245-261.
41) Sauter, S. & Cooper, C. (1989). Job control and worker health. Chichester: Wiley.
42) Schaubroeck, J., & Ganster, D. (1991). The role of negative affectivity in work-related stress.
43) Schonfeld, I. (2000). An updated look at depressive symptoms and job satisfaction in first-year employees. Journal of Occupational and Organizational Psychology, 73,363-371.
44) Schreurs, P, & Taris, T. (1998). Construct validity of the demand-control model: Work and Stress, 12, 66-84.
45) Selye, H. (1956). The stress of life. New York: McGraw-Hill.
46) Semner, N. (2003). Job stress interventions and
organization of work. In J. C. Quick, & L.E. Tetrick, Handbook of occupational health psychology (pp. 325-353).Washington, DC: American Psychological Association.
47) Siegrist, J. (1996). Adverse health effects of high-effort/low-reward conditions. Journal of Occupational Health Psychology, 1, 27-41.
48) Siegrist, J. (2001). A theory of occupational stress. In Dunham, J., Stress in the workplace:Past, present and future (pp. 52-66). London: Whurr Publishers.
49) Theorell, T., & Karasek, R. (1996). Current issues relating to psychosocial job strain andcardiovascular disease research. Journal of Occupational Health Psychology, 1, 9-26.
50) Van der Doef, M., & Maes, S. (1999). The job demand-control model and psychological well-being:. Work and Stress, 13, 87-114.
51) Van Harrison, R., Moss, G., Dielman, T., Horvarth, W., & Harlan, W. (1987). Person-environment fit, Type A behavior, and work strain: The complexity of theprocess. Work stress:Health care systems in the work place. New York.
52) Van Yperen, N., & Sijders, T. (2000). A multilevel analysis of the demands-control model: Is stress at work determined by factors at the group or individual level? Journalof Occupational Health Psychology, 5, 182-190.
53) Wall, T., Jackson, P., Mullarkey, S., & Parker, S. (1996). The demands-control model of job strain: A more specific test. Journal of Occupational and Organizational Psychology, 69, 153-166.
54) Warr, P. (1994). A conceptual framework for the study of work and mental health. Work and Stress, 8, 84-97.
55) Wong, S. (2004). ‘Distal and local group learning: performance trade-offs and tension: Organization Science, 15, 645–56.
The Psychometric Impacts of Karasek’s Demands and Control Scale on Employees’ Job Dissatisfaction
40
March
201
1 Gl oba
l Jo
urna
l of M
anag
emen
tan
d Bu
sine
ss R
esea
rch
Volum
e XI Issu
e IV
Ver
sion
I
Early V
iew
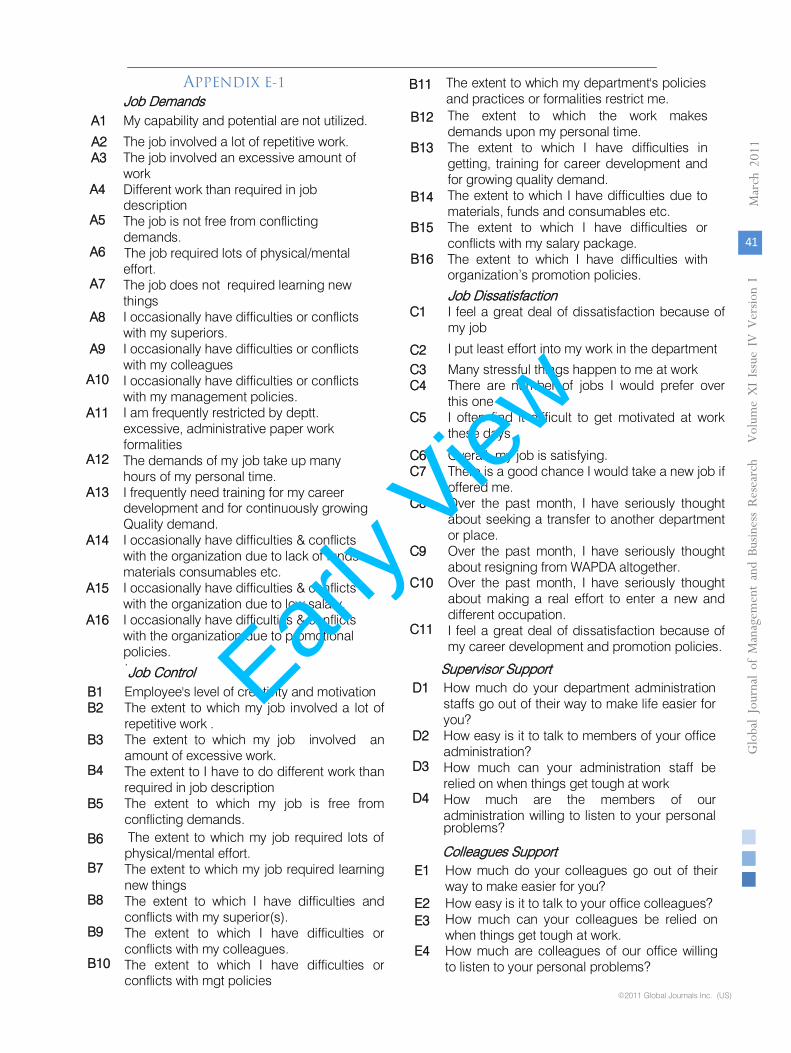
APPENDIX E-1
.Job Control
B1
Employee's level of creativity and motivation
B2
The extent to which my job involved a lot of repetitive work .
B3
The extent to which my job involved an amount of excessive work.
B4
The extent to I have to do different work than required in job description
B5
The extent to which my job is free from conflicting demands.
B6
The extent to which my job required lots of physical/mental effort.
B7
The extent to which my job required learning new things
B8
The extent to which I have difficulties and conflicts with my superior(s).
B9
The extent to which I have difficulties or conflicts with my colleagues.
B10
The extent to which I have difficulties or conflicts with mgt policies
B11
The extent to which my department's policies and practices or formalities restrict me.
B12
The extent to which the work makes demands upon my personal time.
B13 The extent to which I have difficulties in getting, training for career development and for growing quality
demand.
B14
The extent to which I have difficulties due to materials, funds and consumables etc.
B15
The extent to which I have difficulties or conflicts with my salary package.
B16
The extent to which I have difficulties with organization’s promotion policies.
Job Dissatisfaction
C1
I feel a great deal of dissatisfaction because of my job
C2
I put least effort into my work in the department
C3
Many stressful things happen to me at work
C4
There are number of jobs I would prefer over this one
C5
I often find it difficult to get motivated at work these days
C6
Overall, my job is satisfying.
C7
There is a good chance I would take a new job if offered me.
C8 Over the past month, I have seriously thought about seeking a transfer to another department or place.
C9
Over the past month, I have seriously thought about resigning from WAPDA altogether.
C10 Over the past month, I have seriously thought about making a real effort to enter a new and different occupation.
C11
I feel a great deal of
dissatisfaction because of my career development and promotion policies.
Supervisor Support
D1 How much do your department administration staffs go out of their way to make life easier for you?
D2
How easy is it to talk to members of your office administration?
D3
How much can your administration staff be relied on when things get tough at work
D4 How much are the members of our administration willing to listen to your personal problems?
Colleagues Support
E1 How much do your colleagues go out of their way to make easier for you?
E2
How easy is it to talk to your office colleagues?
E3 How much can your colleagues be relied on when things get tough at work.
E4 How much are colleagues of our office willing
to listen to your personal problems?
The Psychometric Impacts of Karasek’s Demands and Control Scale on Employees’ Job Dissatisfaction
41
Globa
l Jo
urna
l of M
anag
emen
t an
d Bu
sine
ss R
esea
rch
Volum
e XI Issu
e IvvvvV
Version
I
March
201
1
©2011 Global Journals Inc. (US)
Job DemandsA1 My capability and potential are not utilized.
A2 The job involved a lot of repetitive work.A3 The job involved an excessive amount of
workA4 Different work than required in job
descriptionA5 The job is not free from conflicting
demands.A6 The job required lots of physical/mental
effort.A7 The job does not required learning new
thingsA8 I occasionally have difficulties or conflicts
with my superiors.A9 I occasionally have difficulties or conflicts
with my colleaguesA10 I occasionally have difficulties or conflicts
with my management policies.A11 I am frequently restricted by deptt.
excessive, administrative paper work formalities
A12 The demands of my job take up many hours of my personal time.
A13 I frequently need training for my career development and for continuously growing Quality demand.
A14 I occasionally have difficulties & conflicts with the organization due to lack of funds materials consumables etc.
A15 I occasionally have difficulties & conflicts with the organization due to low salary.
A16 I occasionally have difficulties & conflicts with the organization due to promotional policies. Earl
y View

©2011 Global Journals Inc. (US)
This page is intentionally left blank
©2011 Global Journals Inc. (US)
42
March
201
1 Gl oba
l Jo
urna
l of M
anag
emen
tan
d Bu
sine
ss R
esea
rch
Volum
e XI Issu
e IV
Ver
sion
I
Early V
iew
Clinical Trials: A Branding Opportunity?
Dr T. S. Sorensen1 , Dr. Lynn L. K. Lim2, Professor Dr. T. C. Melewar3
Abstract
: The marketing of prescription medicines is constrained by restrictions on promotion, product complexity and short lifecycles. Pharmaceutical companies face major communication challenges to ensure Health Care Professionals (HCP) are knowledgeable about their licensed medicinal products. Branding overcomes some communication limitations of prescription medicine marketing and Opinion Leaders are viewed as effective communicators of evidence based brand value to the HCP. Through structured qualitative interviews, we examined how the clinical trial process supports branding and how this process might be modified to optimize such a benefit. Trial participation
was seen to be an effective way of giving HCP the insight and knowledge to become Opinion Leaders.
I
INTRODUCTION
n the pharmaceutical industry, branding is complicated by short product life cycles, the complexity of products and the limitations imposed by
regulatory authorities on communication of only the officially sanctioned basic evidence-based benefits of the drug. Patent restrictions, the constant risk of redundancy due to development and license of superior competitors means that product life cycles are short.The drug as a product is unique and complex in that its full properties are rarely known at the time of
license. This may be related to long-term benefits of the drug and safety data that may take years of use or additional studies to identify. There may also be benefits in relation to other diseases or patient populations, which hitherto have not been contemplated or studied. There is in addition a recognized information overload on HCP. This means that they increasingly rely on peers and industry for education and guidance.
About 1:
PhD MBA Researcher, Warwick Business School, University of Warwick, Coventry CV4 7AL, United Kingdom Telephone: +44 (0) 2476 523 523
About 2:
Ph.D, Reader in Business and Marketing, School of Business and Social Sciences, Roehampton University, 80 Roehampton Lane, London SW15 5SL, United Kingdom Telephone: +44 (0) 208 392 3358
About 3:
Corresponding Author
PhD, Professor of Marketing and Strategy, Brunel Business School, Brunel University Office 052 Elliott Jaques Building Uxbridge, Middlesex UB8 3PH Telephone: +44 (0) 1895265859
The
customers need not just to be medically qualified but increasingly require additional training to gain an understanding of the products to ensure optimal and evidence based use. The market for prescription drugs is restricted in many ways. The products (medicines) are
worthless without a license to sell and promote them for use in a specifically designated patient population. The selling of medicines to the prescribing physician is additionally unusual as physicians are not the
end-users and beneficiaries of the product. Moreover, advertising directly to the patient is not permitted in Europe. One communication tool available is branding. In most industries, branding plays an important role in conveying product benefits to the customer via symbols or names which trigger positive associations, sometimes rational and sometimes irrational. In addition to the complexity of the products, the role of branding in the pharmaceutical industry has particular complications due to the reasons described above.Clinical trials are required by local and international health authorities to assess the safety and efficacy of investigational products (unlicensed medicines) for approval for use in designated patient populations. Though clinical trials
and brand effect have been published by academic scholars (Branthwaite and Cooper, 1981; Urde, 1994; McAdam and Barron, 2002), clinical trials and branding literature has been concentrated in general medical and pharmaceutical journals (Delagneau, 2004; Miles, 2005; Radulescu, 2005). The research addresses (1) how the clinical trial process itself supports branding and (2) to identify how this process might be modified to optimize such a benefit. The study was conducted using qualitative interviews with key senior management of a leading biomedicines company. This paper will concentrate on prescription drugs
in the EU, since prescription medicines contribute around 90% of global pharmaceuticals revenue (Blacket and Harrison, 2001) and direct to consumer advertising regulation differs in EU from the US.
I
43
Globa
l Jo
urna
l of M
anag
emen
t an
d Bu
sine
ss R
esea
rch
Volum
e XI Issu
e IvvvvV
Version
I
March
201
1
©2011 Global Journals Inc. (US)
II BACKGROUND AND REVIEW
A. The Pharmaceutical IndustryTwo key developments have contributed to the
current state of the modern pharmaceutical industry. First, technological and scientific advancements have enabled a boom in the discovery and production of drugs. Second, escalating concern over the role of pharmaceutical company responsibilities and the safety of medicines in their production and use has generated an increasingly restrictive regulatory environment. Both developments have, undoubtedly, improved the safety and efficacy of medicines used on patients, but they
Early V
iew
©2011 Global Journals Inc. (US)
programmes have become larger than ever due to increasing demands of licensing agencies for safety and efficacy data. The marketing mix, often used to facilitate meaningful measurement of marketing efforts and their worth, continues to be one of the predominant marketing theories in pharmaceutical and medical marketing (McCarthy, 1960; Stibel and Kapoor, 2002; James, 2004; Kolter, Armstrong, Saunders and Wong, 2005). The brand of a product triggers specific responses in the minds of the customer (e.g. aspiration, expressive and imaginative) (Kolter et al, 2005). A product is made in a factory while a brand is sold in a shop. Brands have core customers who remain loyal even after occasional (redundant) problems. Brands usually build on quality products and theoretically, they are very difficult to imitate. Often viewed as part of the product, ―brand is also a part of communication strategy and in fact serves as a useful integrative force bringing product policy and communication closer (Shapiro, 1985). Van Waterschoot and Van den Bulte (1992) recognize that promotion is not a sole preserve of communication, and but also includes persuasion. For analysis of the value of clinical trials to the customer, this study employed the Van Waterschoot and Van de Bulte (1992) model, which incorporates many of the criticisms identified in the original McCarthy model (McCarthy, 1960) while retaining a simplicity which makes it ideal for this type of analysis. Kotler‘s et al (2005) perception of product levels and the incorporation of branding were included in the analysis. Alongside these models, this study
also employed the relationship marketing concept because of the interactive process of a clinical trial and the importance of relationship to healthcare marketing (Gronroos, 1994; English, 2000; MacStravic, 2000; Moller and Halinen, 2000; Wright and Lundstrom, 2004). Logistics is noted as an important part of the process but it has little direct effect on the clinical trial outcome, so we
do not discuss this in detail.
B.
Brand And Communication
Brand and communication provide the level of benefit that is suggested or believed by a customer either to exist or felt to be imminent in the future, including faith and trust. Nevertheless, these elements are not necessarily being delivered to the customer. Despite being a data orientated and evidence-based industry, physicians are still customers who are as prone to perceived benefits as other consumers are. Brand is also about feelings, a relationship with the drug and the company behind it. Brand is not an easily imitable differentiator because relationships are experiences and experiences are unique. In an industry that produces products that could potentially harm patients, the use of such emotional communication with physicians can raise some ethical
questions. Physicians in the 21st century are faced with a daunting challenge of keeping
abreast with medical advances. There is an enormous volume of scientific information in medical journals (almost 4,000 titles) making it impossible for practitioners to keep up with all research, even in specialties. Medical education programs are therefore essential to help practitioners stay on top of the literature. Whether the education sponsor is a pharmaceutical firm or an academic source, each has the same goal of enhancing the practice of evidence based medicine within designated labels. In the pharmaceutical industry, major means of mass communication are through journals, conferences and local hospital educational forums which are the natural communication channels used by the medical community. Local medical communities have small cadres of readily identifiable physicians who are influential in facilitating new learning and adoption of advances. Hence, clinicians respond to new clinical interventions by seeking information and opinions from peers and opinion leaders rather than necessarily assessing the scientific merits by themselves (Dumovic and Vries, 2004). Opinion leaders are perceived as technically competent, authoritative, independent, dedicated and esteemed members of a local group. The communication of evidence based on-label information from companies plays an important role in patient care. During one study in the United Kingdom, general practitioners were asked to cite the most important sources of information for drugs and 42% referred to pharmaceutical industry education and 36% referred to hospital consultant recommendations (Dumovic and de Vries, 2004, Wright and Lundstrom, 2004). Publicity communication ensures that third parties have a positive
and informed view of the product and company. Third parties increasingly have a greater influence over industry via press, pressure groups and politicians. The public and press, due to its associations with profiteering from illness, often see the pharmaceutical industry in a negative light. Patients are becoming
44
March
201
1 Gl oba
l Jo
urna
l of M
anag
emen
tan
d Bu
sine
ss R
esea
rch
Volum
e XI Issu
e IV
Ver
sion
IClinical Trials: A Branding Opportunity?
have also increased cost of development. Clinical trial
increasingly organized as pressure groups that exert force on companies, which can have a negative effect on business. They can also pressure governments torelease funds for treatment, which can have a positive effect on business. Some marketing guides to the pharmaceutical industry make a particular point in this aspect of the industry by adding patients and politics to the marketing mix.
Early V
iew
C.
Pharmaceutical Branding
Thomas Beecham is accredited with
one of the first pharmaceutical branding exercises when he affiliated his own name with an effective new laxative in 1842 in order to make it stand out from a plethora of other products on the pharmacists’ shelves (Anderson and Homan, 2002). For pharmaceutical manufacturers, the traditional sources of value creation have laid in successful research and development. Blacket and Harrison (2001) indicate that the industry continues to maintain various conventional supply-driven characteristics overlaid with government paternalism. One symptom of this is the observation that mergers and acquisitions in the pharmaceutical industry take place to acquire pipelines but not brands. The pharmaceutical companies are conspicuously absent from inter-brand leagues. Corstjens and Carpenter (2000) argue that as there is increasing competition between drugs, none of the top ten selling pharmaceuticals have been judged by the FDA to offer “important therapeutic gains over existing therapies” and so that pharmaceutical industry should take a lesson from the fast-moving consumer goods industry. Consumer goods manufacturers have responded to product proliferation and falling margins by building strong brand identities. For consumer goods, efforts are made to build and preserve brands and present changes as “improvements and refinements”. Moss and Schuiling (2004) believe that the pharmaceutical industry have not realized that they manage Brands not just productsThe industry has to remind itself that customers stock, dispense, prescribe, buy and use brands, not products (James, 2004). The brand is an integral part of the benefit process central to the business of customer satisfaction and to build and retain customer loyalty. People have a deep emotional connection to their health. Brands add a greater sense of purpose to the treatment experience, as brands are trusted and are something in which the patient or physician puts their faith. Therefore, there may be a need for the pharmaceutical industry to invest in long-term corporate and product brands (Corstjens and Carpenter, 2000; Moss and Schuiling, 2004). Stibel and Kapoor (2002) point out that only Pfizer and Johnson & Johnson have managed to make products and corporate brands benefit each other. Schroff (2003) argues that as the pharmaceutical industry currently maintains a bad image, hence, corporate branding is unlikely to be beneficial. He argues that few consumers would be able to identify the pharmaceutical company that has the best record on reporting safety to authorities and a physician will rarely be asked by a patient about the maker of a drug. Nevertheless, corporate branding may help a drug representative gain access to physicians.
III
THE STUDY AND FINDINGS
This research was conducted via structured qualitative interviews with seven key senior managers of a leading biomedicine company in Europe. The seven interviewees held positions as Vice Presidents (Interviewee 4 and 5), Executive Director (Interviewee 7), Senior Director (Interviewee 2), Director (Interviewee 6), Associate Director (Interviewee 1) and Senior Manager (Interviewee 3) of Global Marketing, Medical Affairs, and Research. During the primary research, there was no attempt to quantify data but it was utilized as an attempt to trigger opinions on specific subjects. The questions were identical in content and order, since a standard script was utilized. Prior to the interview, all participants were given a PowerPoint presentation, which provided background and definitions, and guided the participants through the interview questions. All interviews were recorded and then transcribed.
A.
Importance of Product Branding
The literature has previously highlighted the debate on the value of product branding for pharmaceutical products. Examples of product brand value statements were put before the interviewees for this project and all agreed with the statements. Interviewees 1, 2, 3, 4 and 7 strongly agreed with the value of product branding of pharmaceuticals.
“You have to appeal to [doctors] not only as scientists but
as consumers … we sometimes shy away from the emotional elements because we think they just want the facts, I think its a balance.” (Interviewee 4) “[I could] not think of anything more emotional than ones health.” (Interviewee 7)
Interviewees suggested that it is not possible to separate fact from emotion when selling medicines but emphasis was made on the trust aspect of medicine branding. After all, doctors are also consumers in their private lives. Although it was highlighted that branding is only possible if you are not misleading the customer (Interviewee 6). Branding is considered less important if there is no competition but is a very effective way to reduce barriers to entry (Interviewee 3). It was also highlighted that brands can be positive as well as negative (Interviewee 1).
B.
Importance of Corporate Branding
Wright and Lundstrom (2004) identify three values of a sales representative, with which a physician forms an overall impression. These values include a representative‘s characteristics, ethics and perception of
45
Globa
l Jo
urna
l of M
anag
emen
t an
d Bu
sine
ss R
esea
rch
Volum
e XI Issu
e IvvvvV
Version
I
March
201
1
©2011 Global Journals Inc. (US)
Clinical Trials: A Branding Opportunity?
the pharmaceutical corporation he or she represents. Hence, corporate image and branding could be seen as important competitive tools for medicines. Interviewees were asked if they thought that corporate branding was important.
Early V
iew

©2011 Global Journals Inc. (US)
“Pharmaceutical companies have done very little or nothing over the years to identify themselves either corporately or pharmaceutically by product although that has changed in the last decade or so with drug to consumer advertising, certainly in the US. Instead of creating our own image and how we want to be perceived we have let [the media] do this for us and that’s the worst thing that can ever happen” (Interviewee 4). ―I like to think that people looking at us from the outside think “That guy‘s from [the company], that‘s the ethical company that tells me about problems before I read about it in the news.’ If people think good things about our company because they know what we are about then that obviously makes our products more attractive and powerful… it‘s all about honesty”
(Interviewee 7).
In summary, it was agreed that the corporate brand is seen as a way to encapsulate the companies’ ethical position which is good for all of its products. It was additionally pointed out that to have a good reputation a corporation will also enhances relationships with opinion leaders (Interviewee 3).
C.
Importance of Opinion Leaders as Communicators of Brand
As discussed, opinion leaders work with pharmaceutical companies to communicate information about drugs and are specifically sought out by peers for advice. Since doctors are unable to stay on top of the medical literature, they rely on well-informed peers
to guide them. Interviewees were introduced to the concept that opinion leaders are in fact in many ways communicators of brand value. This notion was accepted.
“Ultimately [with] third party people … [such] testimonial has high value. A trusted personality conveys trust on to the product.”
(Interviewee 7). “Opinion leaders are huge… their reputation and their credentials and their credibility in the medical community … they are the most important people to have on your side.”(Interviewee 4). “I agree that opinion leaders convey features of brand but positively and negatively, it‘s about trust and how data gets interpreted.”
(Interviewee 5).
However some interviewees did raise caution on the value of opinion leaders, pointing out that they often try to advocate several products (Interviewees 1 and 3). In summary, it was felt that opinion leaders are sought out for assurance. Although this may take the form of hard clinical data, it also involves trust and faith in their opinion. These intangible features reflect the value that brands seek to communicate. It can be concluded from this that opinion leaders are human manifestations of brand value with the limitation that in a competitive environment they might represent several companies and will therefore seek to maintain these relationships by remaining as impartial as possible.
D.
The Process of Clinical Trials Supports Corporate Brand Value
Prior to approval, a potential drug is known as an investigational agent and no product branding is used, After approval the drugs brand name is more widely known but never used in the context of a clinical study so as not to promote off-label usage.Both corporate and product brands may benefit from both the processes and the outputs of a study. It exposes the opinion leaders or future opinion leaders to regular contact with both the investigational agent (future drug) and the company. This achieves familiarity under perceived safer conditions of an ethically approved clinical trial and also allows a quality relationship to
develop with the people behind the product. Knowing the people behind the drug on a personal basis is preferable to building a relationship with a faceless pharmaceutical company. The interviewees comment on the above:
“It‘s a chance for a physician to see inside a company … they get a good view as to the kinds of people that we hire, the kinds of philosophies that we live by, the ethics … the scientific credentials of [employees]”
(Interviewee 4). ―”You need to have an important question to ask … if you
are doing a trial with an important endpoint and important healthcare question, being involved with it brings people up to speed. [Doctors in a trial] become from neutral to very passionate to what [the investigational agent] and [the company] are about.”
(Interviewee 7) “[The brand value lies] much more in the innovation of the questions you ask. [Future] product branding has a significant value if it has been built on strong clinical data. I do not believe that corporate brand value translates into competitive advantage for a product. Customers use a product due to the product, not the company. Corporate branding can have a negative value if the company has been associated with something negative, eg a safety scandal. Positive corporate branding may help the launch in new products”
(Interviewee 5) “[The] clinical trial is the best opportunity for a bad or very good first impression”
(Interviewee 2). “We are judged on whether we are performing cutting edge science or not”
(Interviewee 5)
In summary, the interviewees generally agreed that there are clear corporate branding opportunities, which can be created by encouraging physicians to participate in clinical trials and by being exposed to the clinical trail process. This view supports Dumovic and
46
March
201
1 Gl oba
l Jo
urna
l of M
anag
emen
tan
d Bu
sine
ss R
esea
rch
Volum
e XI Issu
e IV
Ver
sion
IClinical Trials: A Branding Opportunity?
de Vries (2004) suggestion about clinical researchers‘ suitability as Opinion Leaders.
E. Execution of Clinical StudiesSince the opportunity for opinion leader
development has been identified in the literature, interviewees were asked whether all investigators should be supported to develop into opinion leaders and if so,
Early V
iew
are current organizational structures appropriate for this to take place in their company. Typically clinical studies are out-licensed to Contract Research Organisations (CROs) to take on the operational task of executing the research and the staff members of the company are not necessarily in touch with the study itself. When the interviewees were questioned on the dilemma of being in contact with the actual study to support the corporate brand versus the practicality of running the study via a CRO, the following responses were obtained:
“The main contact I think that should be [the company] to ensure full branding value … however for the monitoring I do not see the need to have that done by a [the
company] person” (Interviewee 3) “[Taking on trial operations is] not practical. You can still realize the brand value without being connected at every step” (Interviewee 4).
“CROs are agents of us. Companies do need to take an active role. A company that
hires a good CROs that acts as a third party that is known for quality is a good reflection on the company … But at the end of the day we are [the company] not [the CRO]”
(Interviewee 7). “I think companies will always care more about their customers than
imported vendors”
(Interviewee 6). “It is critical that Marketing, Clinical Operations and Medical Affairs are aligned to build and execute strategy. Each group adds value to opinion leader‘s development” (Interviewee 5).
Relationship marketing literature stipulates that all parts of an organization must embrace the conversation with the customer (Gronroos, 1994; English, 2000; MacStravic, 2000; Moller and Halinen, 2000). Therefore, if full responsibility of the clinical study process is not practical, the company may benefit from closer liaisons between the departments in the company. Blacket & Harrison (2001) and Redmond (2001) suggest that the commercial team of a company must be involved with the clinical team to position the vision of branding from the early phase of the products life cycle. Interviewees suggested:
“Internally we should communicate optimally about who is doing what with which opinion leaders … but not everyone needs to know everything. Medical Affairs and Marketing should work very closely together … medical education is really a marketing tool”
(Interviewee 3).
“If we do not have a process in place on how Medical Affairs, Marketing and Clinical Operations should engage … we will fail”(Interviewee 1) “The opinion leaders have many needs and no one can serve all those needs. It really takes a highly unified team … to service the needs of the customer. It is a combination of Marketing, Medical Affairs and Clinical Operations working as a unified consolidated team leveraging every resource that they can that delivers the highest value to the customer”
(Interviewee 4) “Everybody needs to made aware and wear the [company] cap... to external
people we are all the one and the same. You want to encourage everyone, as appropriate for their role, to work with [opinion leaders] to appropriately direct their questions and queries in a prompt fashion … everybody bears this burden. I think in industry sometimes opportunities are lost because they are not really seeing their role as supporting what the company as a whole is doing but have a very silo‘ed approach”
(Interviewee 7). “Why don‘t [companies engage in customer relations]? –
Marketing drugs is immensely complex. The reasons companies do not have joint customers relation strategies [between departments] is that it is too complicated, people simply do not have the time to build customer relations”
(Interviewee 2)
There is thus a clear sentiment of the need for relationship marketing, coupled with a realistic acceptance that perfection may not be attainable due to resource practicalities.
IV
CONCLUSIONS
In the pharmaceutical industry, the corporate brand supports the product brand. Product branding of medicines is generally seen as an important aspect of communication. Opinion leaders personify brand values and augment the communication mix at all levels.
Interviewees in this study accepted the role of the opinion leader as a communicator and as an important aspect of brand value. So the opinion leader is a key medium to transmit intangible faith in the product and they can do this at all levels of the communication mix: personal, mass and publicity. This faith must be based on evidence-based fact and not generate any perceptions that would encourage use beyond the label. Branding as a concept is thought to be ethical as long as its messages do not deviate from the evidence. Product brand equity is generally felt to be built on the initiation of good scientific questions. Corporate branding is thought to be supportive of the product brand and help communicate the trust that is needed to sell the products. Corporate brand equity is built by activities that generate respect for the company. The outputs of clinical studies in this respect are three-fold. Firstly, the registration studies form the foundation of the product brand (no promotion can be undertaken until this data has been officially sanctioned). Secondly, non
-
registration studies, if scientifically sound and addressing unmet needs can also be significant contributors to brand equity –
but must not be used to promote off-label use. There is a natural progression from the registration studies, where the brand is
47
Globa
l Jo
urna
l of M
anag
emen
t an
d Bu
sine
ss R
esea
rch
Volum
e XI Issu
e IvvvvV
Version
I
March
201
1
©2011 Global Journals Inc. (US)
Clinical Trials: A Branding Opportunity?
established, to post registration studies where non-licensing trials can continue to deliver significant brand value. Thirdly, negative outcome studies are not necessarily detrimental to the brand as long as it is not very unexpected. The corporate brand can indeed even
Early V
iew
©2011 Global Journals Inc. (US)
continue to be built from a negative outcome of a study that has been conducted in a rigorous scientific fashion and communicated openly. The process of a clinical study as far as the participating physician is concerned should be a highly positive experience and builds a close relationship between the physician with both the product and the company. The value that an opinion leader conveys as a communicator at all levels can in many ways be compared to the features that brands themselves seek to convey to its audience: faith, trust and value. It is therefore concluded that the physicians participating in clinical trials are good candidates for opinion leader development. A negative study outcome does not necessarily harm a product brand but a negative study experience will. Physicians with a negative impression of the company may convey this through peers and other communication forms and as a result harm the product brand.
V
LIMITATIONS OF THIS STUDY AND
FUTURE STUDY RECOMMENDED
This paper is only based on a small number of interviews. Ideally, the target of the brand messages should also have been questioned. A larger study could include customer surveys on the influence of clinical study participation on brand values. It is difficult to generalize across therapeutic indications as the benefit-risk considerations made by physicians differ and as such the influence of brands may vary. The nature and size of clinical studies also varies greatly across different medical disciplines. A clear extension of this study could include an analysis of the types of clinical studies required for different phases of the product life cycles. The registration studies establish the brand, but it would be interesting to explore whether there are different strategies of brand building through clinical studies that might be pursued at different stages of the life cycle. Included in this could be the consideration of patent extension strategies.
Important Note
This is a theoretical exercise and it must be noted that all promotion of pharmaceutical products must be within the product labels and branding cannot claim or suggest benefits beyond these. The results presented are within the scope of theory and do not represent the business practice of authors,
interviewees or affiliated organisations, past, present or future. This paper does not condone off-
or pre-label promotion, direct or perceived. All medicinal promotion should always be evidence-based, ethical and on label.
ACKNOWLEDGEMENTS
M.D. Fraga MPhil MBA for excellent consultation on the study design
1. Anderson S. and Homan P. (2002), Best for me, best for you: a history of Beecham‘s Pills 1842-1998, The Pharmaceutical Journal, Vol. 269(December), pp.921-924.
2. Blacket T. and Harrison T. (2001), Branding medicine: use and future potential of branding in pharmaceutical markets, International Journal of Marketing, Vol. 2 No.1, pp. 33-49.
3. Branthwaite A. and Cooper P. (1981), Analgesic effects of branding in treatment of headaches, British Medical Journal (Clinical Research), Vol. 282 No. 6276, pp. 1576-8.
4. Chicco G. and Chandler R. (2002), Integrated communications: reaching in and out. Pharmaceutical Executive, Vol. 22 No.11, pp. 132-133.
5. Corstjens M. and Carpenter M. (2000), From managing pills to brands, Harvard Business Review, March-April, pp. 20-21.
6. Delagneau B. (2004), One world, one voice, Pharmaceutical Executive, Vol. 24 No. 7, pp. 76.
7. Dumovic P. and de Vries C. (2004), A review of pharmaceutical industry-sponsored medical education: ten key recommendations for stakeholders, International Journal of Medical Marketing, Vol. 4 No. 2, pp.143-153.
8. English J. (2000), The four Ps of marketing are dead, Marketing Health Services, Vol. 20 No. 2, pp. 20-3.
9. Gronroos C. Q. V. (1994), Marketing? Towards a relationship marketing paradigm, Journal of Marketing Management, Vol. 10, pp. 347-60.
10. Hoarse J. (2003), A dose of brand medicine, Brand Strategy, August, pp. 29.
11. James B. (2004), An Introduction to Pharmaceutical Marketing, London: PJB Publications.
12. Kotler P, Armstrong G, Saunders J, Wong V. (2005), Principles of Marketing: European Edition 4th European edition, Financial Times Press: Prentice Hall.
13. MacStravic S. (2000), The death of the four ―Ps: a premature obituary, Marketing Health Services, Vol. 20 No.4, pp. 16-20.
14. McAdam R. and Barron N. (2002), ―The role of quality management in pharmaceutical development: clinical trials analysis, International Journal of Health Care Quality Assurance, Vol. 15 No. 2, pp. 106-123.
15. McCarthy E. J. (1960), Basic Marketing: A Managerial Approach, Homewood, IL:Irwin
48
March
201
1 Gl oba
l Jo
urna
l of M
anag
emen
tan
d Bu
sine
ss R
esea
rch
Volum
e XI Issu
e IV
Ver
sion
IClinical Trials: A Branding Opportunity?
Early V
iew

16. Miles B. (2005) Value today for drugs tomorrow, Pharmaceutical Executive, October, pp. 38.
17. Moller K. and Halinen A. (2000), ―Relationship marketing theory: its roots and direction, Journal of Marketing Management, Vol. 16, pp. 26-54.
18. Moss G. and Schuiling I. (2004), A brand logic for pharma? A possible strategy based on FMCG experience, International Journal of Medical Marketing, Vol. 4 No. 1, pp. 55-62.
19. Radulescu G. (2005), Branding is vital when outsourcing clinical trials- investigator loyalty depends on recognition, Canadian Pharmaceutical Marketing, April, pp. 31-32.
20. Redmond C. (2001), Branding: Change and Challenge, Pharmaceutical Executive, Part 9, pp. 58-67.
21. Schroff K. (2003), Why pharma branding doesn‘t work, Pharmaceutical Executive, Vol. 23 No. 10, pp. 50-8.
22. Shapiro B. P. (1985), Rejuvenating the marketing mix, Harvard Business Review, Vol. 63 No. 5, pp. 28-34.
23. Stibel G. and Kapoor G. (2002), Commentary: Brand the company, Pharmaceutical Executive, May 1, pp. 132-133.
24. The Economist (2003), Business: As potent as its moniker- branding medicine, The Economist, Vol. 366 No.8397, pp. 65.
25. Urde M. (1994), Brand orientation: a strategy for survival, Journal of Consumer Marketing, Vol. 11 No. 3, pp. 18-32.
26. Van Waterschoot W. and Van den Bulte C. (1992), The 4P classification of the marketing mix revisited, Journal of Marketing, Vol. 56, October, pp. 83-93.
27. Wright R. F. and Lundstrom W. J. (2004), Physicians‘ perceptions of pharmaceutical sales representatives: a model for analyzing the customer relationship, International Journal of Medical Marketing, Vol. 4, No. 1, pp. 29-38.
49
Globa
l Jo
urna
l of M
anag
emen
t an
d Bu
sine
ss R
esea
rch
Volum
e XI Issu
e IvvvvV
Version
I
March
201
1
©2011 Global Journals Inc. (US)
Clinical Trials: A Branding Opportunity?
Early V
iew

©2011 Global Journals Inc. (US)
This page is intentionally left blank
50
March
201
1 Gl oba
l Jo
urna
l of M
anag
emen
tan
d Bu
sine
ss R
esea
rch
Volum
e XI Issu
e IV
Ver
sion
I
Early V
iew
Contributory Pension Scheme, Workers Commitment, Retention and Attitude towards
Retirement in The Nigerian Civil ServiceAgba, A. M. Ogaboh (PhD)1 and Nwosu, U. W.2
Abstract :
This study seeks to evaluate the impact of contributing pension scheme (CPS) on workers commitment, retention and attitude towards retirement in the Nigerian Civil Service. The study drew respondents from the federal and state civil service in Calabar Metropolis. Five hundred and forty eight participants were purposively selected from the University of Calabar, Cross River University of Technology and Governor’s Office Calabar. The study elucidated data from respondents using four point Likert scale questionnaire. Data obtained were analyzed using Pearson product moment correction (r). Findings revealed that contributive pension scheme significantly affects workers commitment to work, retention and attitude towards retirement. The study recommends among others that strict measures be put in place by government to ensure the effective monitoring and implementation of the provisions of the 2004 Pension Reform Act.
Keywords :
Contributory Pension, Retirement, Workers
Attitude, Commitment, Retention.
I.
INTRODUCTION
ife after retirement is one of the dreaded periods of most workers in Nigeria. The fears of facing the future after retirement “creates an ambiance of
disturb’ among employees’ (Editorial, 2009:1). Retirement is seen by workers as a transition that could lead to psychological, physiological and economic problem (Ogunbameru & Bamiwuye, 2004). The provoking thoughts of facing uncertain future after retirement by workers is responsible for most bureaucratic corruption (Agba, Ikoh, Ushie & Agba, 2008); and could also be responsible for low commitment to work by employees and service ineffectiveness of vital institutions in Nigeria.
The
extended family system, the lack of adequate social welfare for the aged (Awiosika, 2009), huge deficit, arbitrary
increase in salaries/wages, poor administration
About 1
: Lecturer,
Department of sociology, University of Calabar,
Calabar, Nigeria Dr. Agba, A.M. Ogaboh, Department of Sociology, University of Calabar, P.M.B. 1115, Calabar. Nigeria. E-mail: [email protected]
Phone: +234 080 72727272
About 2: Lecturer
IPPA, University of Calabar, Calabar, Nigeria.
of retirement benefits informed the Pension Reform Act of 2004 by the Obasenjo led administration (Aderinokun & Adoba, 2004, National Pension Commission, 2008). The reform is contributory in nature with the intent of ensuring that every person who has worked in either the public or private sectors receives his or her retirement benefit as in when due. The reform was to serve as social welfare scheme for the aged, by ensuring that workers save to cater for their livelihood during old age (National Pension Commission, 2005; Sule, 2009).
Six years after the establishment of the new pension act, there is still speculation among Nigerians about the success of the scheme. Whether the new pension act will be able to address the many problems associated with retirement schemes in the past. Specifically, some have asked whether the Contributory Pension Act of 2004 would be able to address the problems of corruption, poor administration of pension fund, embezzlement, inadequate build-up of pension fund, poor monitoring, evaluation and supervision of pension fund that usually characterized pension schemes in Nigeria. Consequently, workers often ask whether they would ever have financial security after retirement. What is the fate of their children and other household after retirement? Does life after retirement means signing bond with poverty? These questions among others occupied the minds of workers in Nigeria and could be responsible for workers negative attitude towards retirement, low commitment to work as well as high labour turnover. This study is therefore set to investigate the impact of the
Pension Reform Act of
2004 on workers commitment, turnover, and attitude towards retirement.
II.
STUDY AREA
This study is carried out in Calabar Metropolis, Cross River State, Nigeria. Calabar is located at the extreme end of South-Eastern Nigeria and lies between latitude 040, 58 North of the equator and Longitude 080, 58 East of the Greenwich Meridian (Agba, Ikoh & Ashibi, 2010). Calabar metropolis lies within a tropical region with well marked rainy and dry seasons. The wet season
L
51
Globa
l Jo
urna
l of M
anag
emen
t an
d Bu
sine
ss R
esea
rch
Volum
e XI Issu
e IvvvvV
Version
I
March
201
1
©2011 Global Journals Inc. (US)
starts from May to October while the dry season starts from November to April.
Early V
iew
Calabar is historically the settlement of the Efiks, Quas and Efuts (Effiong-Fuller, 1996). Calabar Metropolis is the Capital of Cross River State. For administrative governance, Calabar is divided into two local government areas viz: Calabar Municipality and Calabar South Local Government Area. Calabar Metropolis is a cosmopolitan society with a mixed bag of people from different cultural backgrounds. The city has an estimated population of 328,877 and a density of 980 persons per square kilometer (National Population Commission, 2006). Calabar metropolis is the economic nerves of Cross River State. It is a seaport and airport town; and a home of federal and state governments’ ministries, departments and parastatals. This study elicits data from employees in these government establishments.
III.
LITERATURE REVIEW
1)
Pension Schemes In Nigeria
Pension schemes are social security maintenance plan for workers after their disengagement as employees through retirement (Ilesami, 2006). The exact origin of pension scheme in Nigeria is debatable; however the history of pension in Nigeria could be traced to the prolong battle between workers and employers of labour. The victory of employees over employers marked the privilege of receiving gratuity and pension in Nigeria (Sule & Ezugwu, 2009:50). Pension here entails money paid at regular bases by government or any establishment to someone who is officially considered retired from active service after serving for a
stipulated time usually minimum of ten years and maximum of thirty five years.
The Pension Ordinance of 1951 was the first ever legislative act on pension in the public sector in Nigeria. Nine years later (that is in 1961), the National Provident Fund (NPF) was established to address pension issues in the private sector. This was followed by the Pension Act No.102 of 1979 and the Armed Forces Pension Act No.103 of 1979. In 1987, the police and other government agencies pension scheme was established under
Pension Act No.75 of 1987; in the same year, Local Government Staff Pension Board (LGSPB) was established to cater for pension matters among local government employees (Sule & Ezugwu, 2006). However, in the private sector, pension reforms were slow and marginal since 1961. It was only in 1993 that a pragmatic step was made by government to address the many problems of pension in the private sector. In this regard, government established the National Social Insurance Trust Fund (NSITF) in 1993, to cater for
pension issues in the private sector.
The general characteristics of the Nigerian Pension Scheme before 2004 reform were non-contributory and bedeviled by many impediments. The
large number of pensioners and mismanagement of pension funds impose heavy burden on government and the private sector. According to Buhari (2003), the public pension debt as in 2003 was over one trillion naira. The cumulative effect of the debt is that, government was unable to service pensions of retirees, as a result, pensioners could not pay children school fees, cater for their health and other necessities of life. This precarious situation necessitated the enactment of the Pension Reform Act of 2004. 2) Contributory Pension Scheme of 2004
The 2004 Pension Reform Act is a paradigm shift from the 1979 Pension Act. Under the new scheme, employers and employees alike are to contribute 7.5 percent of employees’ monthly emolument which include basic salary, housing and transport allowance. However, military personnel are to contribute 2.5 percent while the Federal Government contributes 12.5 percent of the employees’ monthly emolument (Pension Reform Act, 2004). The scheme covers the private sector with five or more employees. The only exceptions are public employees who have three years or less to retire with effect from the date of enactment of the Pension Act being 30th
June 2004 (National Pension Commission, 2004). The employer may elect under the 2004 Pension Act to bear the full burden of the pension by contributing not less than 15 percent of the employees’ monthly emolument. The objective of the new pension scheme include among others to ensure that every employee in the private and public sectors receives his/her benefits as and when due; to establish a uniform rules, regulations, standards and laws for the administration, management and payment of pension funds in the country. The scheme was also established to assist employees by ensuring that they save to cater for life after retirement. More so, the scheme was to address the huge unsustainable pension deficit estimated at about two trillion naira which characterized the former Pay-As-You-Go (PAYG) Pension Scheme. According to Aminu (2004), the contributory pension scheme would address the pension deficit of the past in Nigeria; that the scheme as of July, 2010, has an asset of 1.7 trillion naira (11.3 billion dollars) across the country. The contributory pension scheme is expected to have multiplier effect on workers attitude towards retirement, commitment to duty, and labour retention as well as attitude towards corruption especially in the civil or public service. This is because the uncertainty of receiving pension and gratuity after retirement was largely responsible for high labour turnover in the civil service. WHO (2007), posits that, poor remuneration, delay in payment of fridge benefits and poor condition of service among others are jointly responsible for the
52
March
201
1 Gl oba
l Jo
urna
l of M
anag
emen
tan
d Bu
sine
ss R
esea
rch
Volum
e XI Issu
e IV
Ver
sion
I
©2011 Global Journals Inc. (US)
Contributory Pension Scheme, Workers Commitment, Retention and Attitude towards Retirement in The Nigerian Civil Service
exodus of medical personnel from Nigeria to the United
Early V
iew
States of America and the United Kingdom.
3)
Pension Scheme and Employees Commitment
Workers commitment to organizational goals
has received wide attention by scholars (Steer, 1977). Workers commitment here entails the level of job involvement (Lodahl & Kejners, 1965). It includes internal work motivation (Hackman & Oldham, 1978) and the willingness of an employee to invest personal effort for the sake of the organization (Agba, Nkpoyen & Ushie, 2010). It involves attitudes or orientation towards organizational goals or objectives (Hall & Schneider, 1972). Commitment is positive and consistent attitude towards organizational goal that are produced by exchange consideration.Workers commitment is a function of many variables including, characteristics of job situation, the work environment, leadership style and career development (Salanick, 1977; Agba, Nkoyen & Ushie, 2010; Ushie, Agba, Agba & Chime, 2010; Ushie, Agba, Agba & Best, 2010). Employees’ commitment could also be influenced by the level of job involvement or the responsibilities of the worker (Lodahl & Kejners, 1965).
Commitment is also tied to how well an employee is motivated. Motivation here entails the process of influencing employees’ behaviour towards the attainment of organizational goal (Dhameji & Dhameji, 2009). Motivation includes meeting the psychological, financial and emotional needs of workers. Pension is part of motivation and could help attain the psychological and emotional needs of workers, because it assures them of life after retirement. A good pension scheme could determine the level of
workers commitment as well as influence whether an employee will do his/her work properly. According to Sule & Ezugwu (2009), good pension guarantees employee’s comfort and commitment to the organization during his/her active years.
4)
Pension and Workers Retention
There is a significant positive relationship between pension and workers turnover/retention. According to Becton, Wysocki & Kepner, 2009, staff retention refers to the necessary measure put in place by management of an organization to encourage workers to remain in the establishment for a maximum period of time. Ushie (2000) and Agba (2007) posit that in Nigeria rather than providing the means by which workers could be retain, employees are continually deprived of their psychological needs.
Delay in payment of salaries and fridge benefits to workers even after retirement has negative behavioral consequences among employees in Nigeria (Agba, 2007). This also is responsible for low morale among workers and workers ineffectiveness in most organizations
(Ushie, Agba, Agba & Best, 2010).
According to Onyene (2001), workers attitude to work
and the goal attainment of any organization is tied to various degrees on staff motivation and retention. Agba and Ushie (2010)) observed that workers in the hospitality industry in Nigeria are always moving to where good condition of service exists and where their future is protected after retirement. They observed a linear relationship between salary, payment of benefits, promotion, career development, worker-hours and
labour turnovers in Cross River State, Nigeria. Similarly, Akingbade (2006), posit that there is high labour turnover in the medical sector in Nigeria and that the movement of medical personnel especially to USA and UK is not unconnected with payment of benefits including retirement benefits.
5) Pension Scheme and Workers Attitude towards
Retirement The absence of good pension scheme in the
past was largely responsible for the psychological, physiological and economic problems among retirees in Nigeria. It is expected that retirees receives certain benefits such as gratuity and pension. Gratuity here is the worker’s entitlement as soon as he/she makes exit from active service; while pension is the regular payment to a retiree until his or her last days on earth. Most often gratuities and pension are not paid as and when due; consequently retirees cannot afford school fees for their children, pay house rents or take care of other necessities of life (Global Action on Aging, 2006). The provoking thought of facing life after retirement creates psychological and emotional abnormally among workers especially those who are approaching retirement age (Ogunbameru & Ramiwuye, 2004). While retirement remains luxury in developed countries in Nigeria workers are always afraid of financial insecurity after retirement. The social insecurity makes retirement unattractive to workers in Nigeria (Jonathan, 2009). Workers who are in the payroll of government cannot fend for themselves, not to talk of when they are retired. The fear of uncertainty after retirement is also responsible for age falsification among civil servants in Nigeria. Retirement in Nigeria also goes with social isolation and poverty; consequently retirees even at very old age look for employment or jobs to maintain themselves. This scenario shows that the meager amount received by pensioners before the introduction of the contributory pension scheme was grossly inadequate to sustain a retiree and his/her family.
II. THEORETICAL CONSIDERATION
This study adopted two schools of thoughts to explain the antecedences and attributes of pension schemes in Nigeria as well as workers attitude towards work and retirement. The first is the non-contributory
53
Globa
l Jo
urna
l of M
anag
emen
t an
d Bu
sine
ss R
esea
rch
Volum
e XI Issu
e IvvvvV
Version
I
March
201
1
©2011 Global Journals Inc. (US)
Contributory Pension Scheme, Workers Commitment, Retention and Attitude towards Retirement in The Nigerian Civil Service
Early V
iew
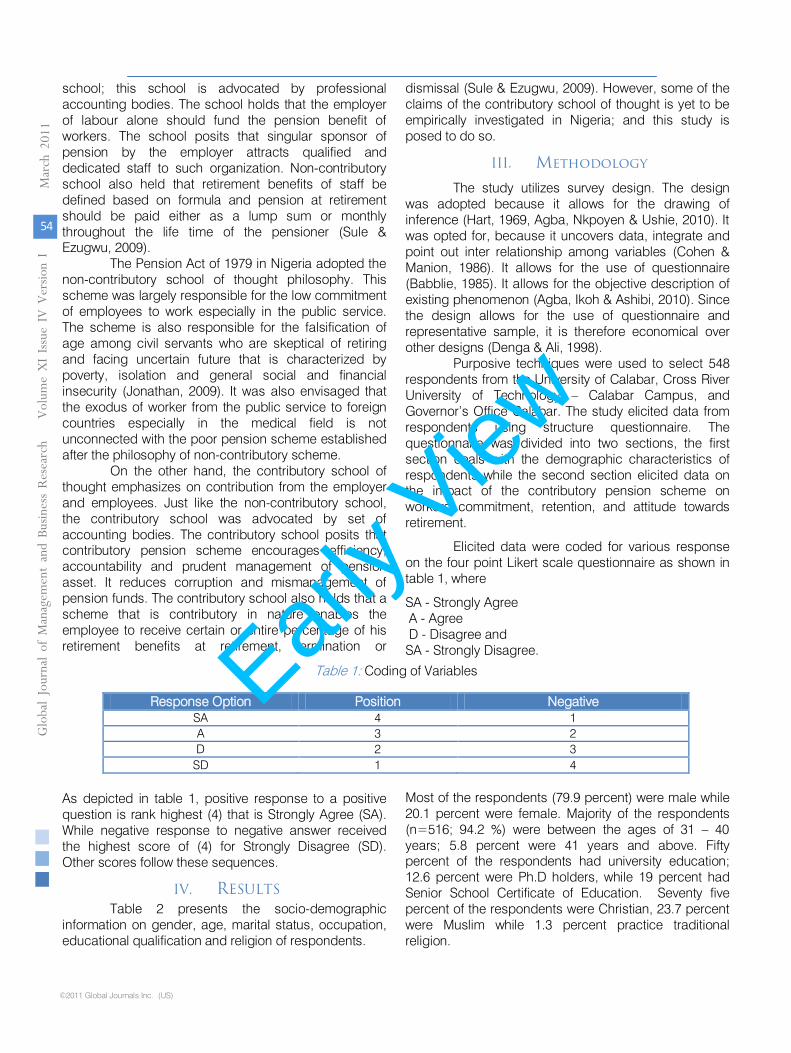
school; this school is advocated by professional accounting bodies. The school holds that the employer of labour alone should fund the pension benefit of workers. The school posits that singular sponsor of pension by the employer attracts qualified and dedicated staff to such organization. Non-contributory school also held that retirement benefits of staff be defined based on formula and pension at retirement should be paid either as a lump sum or monthly throughout the life time of the pensioner (Sule & Ezugwu, 2009).
The Pension Act of 1979 in Nigeria adopted the non-contributory school of thought philosophy. This scheme was largely responsible for the low commitment of employees to work especially in the public service. The scheme is also responsible for the falsification of age among civil servants who are skeptical of retiring and facing uncertain future that is characterized by poverty, isolation and general social and financial insecurity (Jonathan, 2009). It was also envisaged that the exodus of worker from the public service to foreign countries especially in the medical field is not unconnected with the poor pension scheme established after the philosophy of non-contributory scheme.
On the other hand, the contributory school of thought emphasizes on contribution from the employer and employees. Just like the non-contributory school, the contributory school was advocated by set of accounting bodies. The contributory school posits that contributory pension scheme encourages efficiency, accountability and prudent management of pension asset. It reduces corruption and mismanagement of pension funds. The contributory school also holds that a scheme that is contributory in nature enables the employee to receive certain or entire percentage of his retirement benefits at retirement, termination or
dismissal (Sule & Ezugwu, 2009). However, some of the claims of the contributory school of thought is yet to be empirically investigated in Nigeria; and this study is posed to do so.
III. Methodology
The study utilizes survey design. The design was adopted because it allows for the drawing of inference (Hart, 1969, Agba, Nkpoyen & Ushie, 2010). It was opted for, because it uncovers data, integrate and point out inter relationship among variables (Cohen & Manion, 1986). It allows for the use of questionnaire (Babblie, 1985). It allows for the objective description of existing phenomenon (Agba, Ikoh & Ashibi, 2010). Since the design allows for the use of questionnaire and representative sample, it is therefore economical over other designs (Denga & Ali, 1998).
Purposive techniques were used to select 548 respondents from the University of Calabar, Cross River University of Technology –
Calabar Campus, and
Governor’s Office Calabar. The study elicited data from respondents using structure questionnaire. The questionnaire was divided into two sections, the first section deals with the demographic characteristics of respondents while the second section elicited data on the impact of the contributory pension scheme on workers commitment, retention, and attitude towards retirement.
Elicited data were coded for various response
on the four point Likert scale questionnaire as shown in table 1, where
SA - Strongly Agree
A -
Agree
D -
Disagree and
SA - Strongly Disagree.
Table 1: Coding of Variables
Response Option
Position
Negative
SA
4
1
A
3
2
D
2
3
SD
1
4
As depicted in table 1, positive response to a positive question is rank highest (4) that is Strongly Agree (SA). While negative response to negative answer received the highest score of (4) for Strongly Disagree (SD). Other scores follow these sequences.
IV. RESULTS Table 2 presents the socio-demographic
information on gender, age, marital status, occupation, educational qualification and religion of respondents.
Most of the respondents (79.9 percent) were male while 20.1 percent were female. Majority of the respondents (n=516; 94.2 %) were between the ages of 31 –
40
years; 5.8 percent were 41 years and above. Fifty percent of the respondents had university education; 12.6 percent were Ph.D holders, while 19 percent had Senior School Certificate of Education. Seventy five percent of the respondents were Christian, 23.7 percent were Muslim while 1.3 percent practice traditional religion.
54
March
201
1 Globa
l Jo
urna
l of M
anag
emen
tan
d Bu
sine
ss R
esea
rch
Volum
e XI Issu
e IV
Ver
sion
I
©2011 Global Journals Inc. (US)
Contributory Pension Scheme, Workers Commitment, Retention and Attitude towards Retirement in The Nigerian Civil Service
Early V
iew
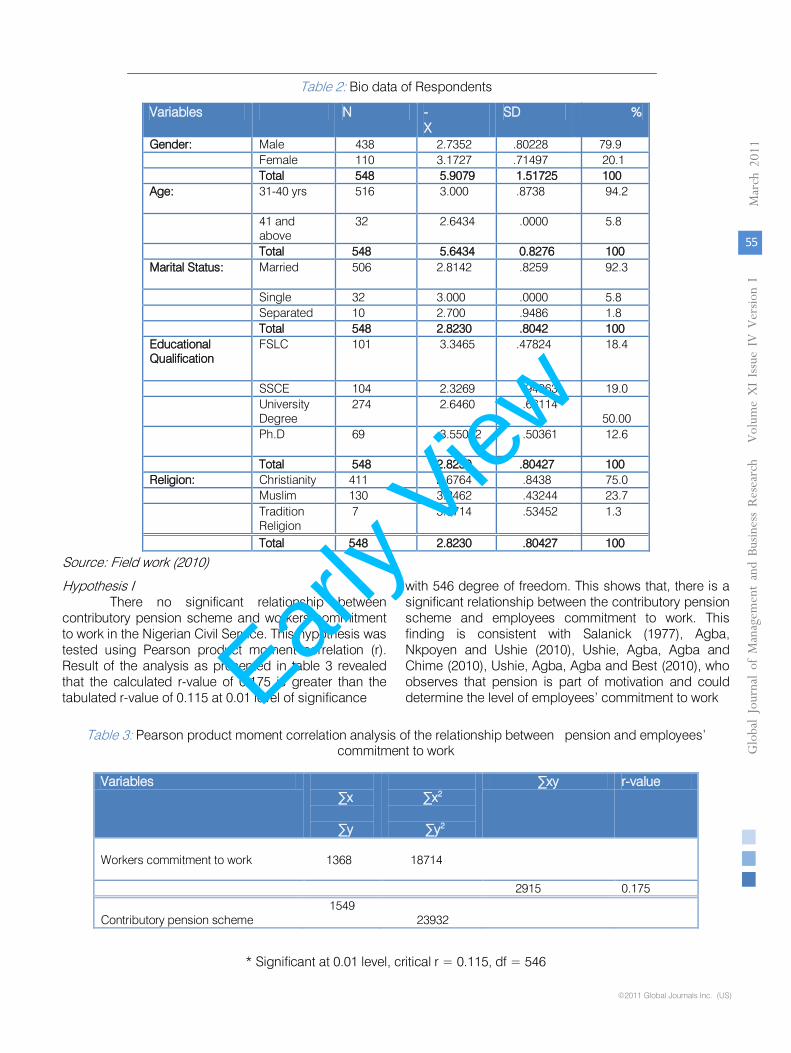
Table 2: Bio data of Respondents
Variables N - X
SD %
Gender: Male 438 2.7352 .80228 79.9 Female 110 3.1727 .71497 20.1 Total 548 5.9079 1.51725 100 Age:
31-40 yrs 516 3.000 .8738 94.2
41 and above
32 2.6434 .0000 5.8
Total 548 5.6434 0.8276 100 Marital Status:
Married 506 2.8142 .8259 92.3
Single 32 3.000 .0000 5.8 Separated 10 2.700 .9486 1.8 Total 548 2.8230 .8042 100 Educational Qualification
FSLC 101 3.3465 .47824
18.4
SSCE 104 2.3269 .94963 19.0 University
Degree 274 2.6460 .68114
50.00
Ph.D 69 3.55072
.50361
12.6
Total 548 2.8230 .80427 100 Religion: Christianity 411 2.6764 .8438 75.0 Muslim 130 3.2462 .43244 23.7 Tradition
Religion 7 3.5714 .53452
1.3
Total 548 2.8230 .80427 100
Source: Field work (2010)
Hypothesis I There no significant relationship between
contributory pension scheme and workers commitment to work in the Nigerian Civil Service. This hypothesis was tested using Pearson product moment correlation (r). Result of the analysis as presented in table 3 revealed that the calculated r-value of 0.175 is greater than the tabulated r-value of 0.115 at 0.01 level of significance
with 546 degree of freedom. This shows that, there is a significant relationship between the contributory pension scheme and employees commitment to work. This finding is consistent with Salanick (1977), Agba, Nkpoyen and Ushie (2010), Ushie, Agba, Agba and Chime (2010), Ushie, Agba, Agba and Best (2010), who observes that pension is part of motivation and could determine the level of employees’ commitment to work
Table 3: Pearson product moment correlation analysis of the relationship between pension and employees’ commitment to work
Variables ∑x
∑y
∑x2
∑y2
∑xy r-value
Workers commitment to work
1368
18714
2915 0.175
Contributory pension scheme
1549 23932
* Significant at 0.01 level, critical r = 0.115, df = 546
55
Globa
l Jo
urna
l of M
anag
emen
t an
d Bu
sine
ss R
esea
rch
Volum
e XI Issu
e IvvvvV
Version
I
March
201
1
©2011 Global Journals Inc. (US)
Contributory Pension Scheme, Workers Commitment, Retention and Attitude towards Retirement in The Nigerian Civil Service
Early V
iew
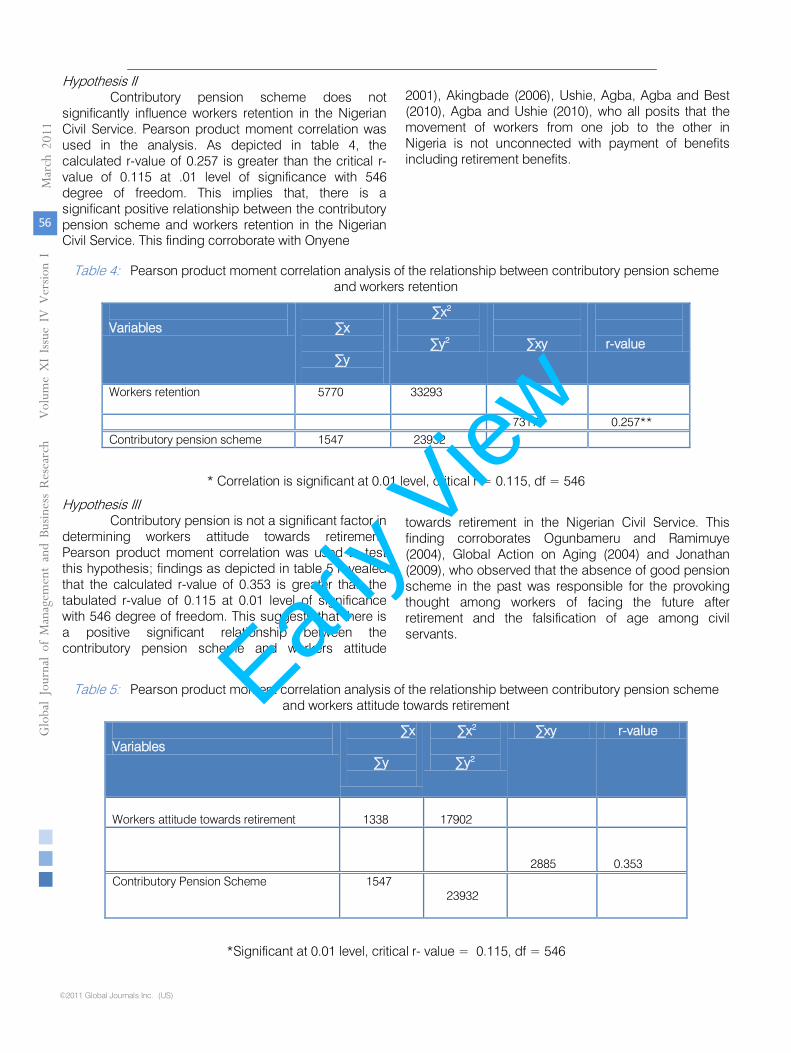
Hypothesis II Contributory pension scheme does not
significantly influence workers retention in the Nigerian Civil Service. Pearson product moment correlation was used in the analysis. As depicted in table 4, the calculated r-value of 0.257 is greater than the critical r-value of 0.115 at .01 level of significance with 546 degree of freedom. This implies that, there is a significant positive relationship between the contributory pension scheme and workers retention in the Nigerian Civil Service. This finding corroborate with Onyene
2001), Akingbade (2006), Ushie, Agba, Agba and Best (2010), Agba and Ushie (2010), who all posits that the movement of workers from one job to the other in Nigeria is not unconnected with payment of benefits including retirement benefits.
Table 4: Pearson product moment correlation analysis of the relationship between contributory pension scheme and workers retention
Variables
∑x
∑y
∑x2
∑y2
∑xy
r-value
Workers retention 5770 33293
7317 0.257**
Contributory pension scheme 1547 23932
* Correlation is significant at 0.01 level, critical r = 0.115, df = 546
Hypothesis III Contributory pension is not a significant factor in
determining workers attitude towards retirement. Pearson product moment correlation was used to test this hypothesis; findings as depicted in table 5 revealed that the calculated r-value of 0.353 is greater than the tabulated r-value of 0.115 at 0.01 level of significance with 546 degree of freedom. This suggests that there is a positive significant relationship between the contributory pension scheme and workers attitude
towards retirement in the Nigerian
Civil Service. This finding corroborates Ogunbameru and Ramimuye (2004), Global Action on Aging (2004) and Jonathan (2009), who observed that the absence of good pension scheme in the past was responsible for the provoking thought among workers of facing the future after retirement and the falsification of age among civil servants.
Table 5: Pearson product moment correlation analysis of the relationship between contributory pension scheme and workers attitude towards retirement
Variables
∑x
∑y
∑x2
∑y2
∑xy r-value
Workers attitude towards retirement
1338
17902
2885
0.353
Contributory Pension Scheme
1547
23932
*Significant at 0.01 level, critical r- value = 0.115, df = 546
56
March
201
1 Gl oba
l Jo
urna
l of M
anag
emen
tan
d Bu
sine
ss R
esea
rch
Volum
e XI Issu
e IV
Ver
sion
I
©2011 Global Journals Inc. (US)
Contributory Pension Scheme, Workers Commitment, Retention and Attitude towards Retirement in The Nigerian Civil Service
Early V
iew
V.
DISCUSSION OF FINDINGS
Prior to the introduction of the Contributory
Pension Scheme, payment of gratuity and other retirement benefits to retirees remained a high profile challenge in Nigeria. The absence of good pension scheme was responsible for the psychological, physiological and economic problems among retirees (Editorial, 2009). The cumulative and multiplier effect of the poor pension scheme was low morale and commitment to work among employees, fear of retirement, and bureaucratic crime, falsification of age and high labour turnover (Agba, Ikoh, Ushie & Agba 2008).
In consonant with the above assertions, this study demonstrated a significant positive relationship between workers commitment and the contributory pension scheme. The study revealed that workers are more committed to their duties since the introduction of the contributory pension scheme in Nigeria. This could be attributed to the motivational force behind pension benefits. According to Dhameji and Dhameji (2009), employees’ commitment to work is significantly related to how well he/she is motivated. Agba and Ushie (2010) observed that workers commitment is a function of monetary and non-monetary motivation. Agba, Nkpoyen and Ushie (2010) posit that the more a worker is motivated through monetary incentive and the more he or she is sure of his/her social security after retirement, the higher the degree of commitment to work.
Similarly, Sule and Ezugwu (2009), posit that good pension scheme guarantees employee’s comfort and commitment to the organization. Agba (2007) observed that delay in payment of gratuity and pension to workers after retirement have negative behavoural consequences on employees in Nigeria. According to Ushie, Agba, Agba and Best (2010), the low morale and carefree attitude among civil servants in Nigeria is not unconnected to the delay in payment of benefits to workers. However, it would be undertone to limit workers commitment to only pension or payment of benefits. According to Lodahl and Kejners (1965), Sulanick (1977), workers commitment could also be influenced by variables such as –
work environment, level of job
involvement or the responsibility of the worker, leadership style and career development.
Respondents acknowledge that there is a significant positive relationship between the contributory pension
scheme and worker turnover in the Nigerian
Civil Servants. The study demonstrated that, prior to the introduction of the contributory pension scheme, there was high labour turnover in the Nigerian Civil Service. Workers leave their jobs in the Civil Service to other well paid jobs or to places where their retirement benefits are
guaranteed. Corroborating this findings, Akingbade (2006), observed that the high labour turnover in the Civil Service especially among medical personnel is not unconnected with payment of benefits including retirement entitlements to workers.
Delay in the payment of workers benefits deprived employees of their psychological needs and could result into high labour turnover. Agba and Ushie (2010), observed that in the hospitality industry in Nigeria where pension and good salaries are hardly available labour turnover is significantly high. Similarly, Onyene (2001) posit that poor condition of service and poor retirement benefits in the teaching profession is jointly responsible for the exodus of teachers to other juicy occupations.
The study further demonstrated a significant positive relationship between workers attitude towards retirement and the introduction of the contributory pension scheme in the Civil Service. The study suggests that workers are more confident towards retirement now than when the contributory pension scheme was not introduced. The study revealed that the psychological and emotional abnormality among workers occasioned by fear of retiring is gradually fading away in the Nigerian Civil Service.
The non-contributory pension or the poor pension scheme in the past creates fears among workers. The fears of facing uncertain future after retirement “creates an ambiance of disturb” among employees in Nigeria (Editorial, 2009:1). According to Ogunbameru and Bamiwuye (2004), prior to the establishment of the contributory pension scheme in Nigeria, workers view retirement as a transition to psychological and physiological problem. Jonathan (2006) observed that the falsification of age in the civil service is attributed to poor pension schemes that characterized the Nigerian Federation before the contributory pension was introduced in 2004.
VI.
RECOMMENDATIONS
On the strength of this study finding, the
following recommendations were made: 1.
Government should put strict measures in place to ensure the proper monitoring and implementation of the provision of the Pension Reform Act of 2004. Pre-retirement enlightenment workshops should be organized for workers who are about to retire.
2.
Workers and employers of labour should be properly enlightened on the benefits of the contributory pension scheme. This would further ensure worker confidence towards retirement as well as reduce falsification of age in the civil service.
57
Globa
l Jo
urna
l of M
anag
emen
t an
d Bu
sine
ss R
esea
rch
Volum
e XI Issu
e IvvvvV
Version
I
March
201
1
©2011 Global Journals Inc. (US)
Contributory Pension Scheme, Workers Commitment, Retention and Attitude towards Retirement in The Nigerian Civil Service
Early V
iew
VII.
CONCLUSION
Contributory pension scheme is one of the
social security maintenance plan put in place by government to cater for the psychological, physiological and economic need of workers after their disengagement as employees through retirement. It is a paradigm shift from the 1979 Pension Act (which was non contributory). The new scheme was to correct the irregularity that characterized pension schemes in Nigeria. It was also established to build confidence among workers towards retirement and ensure employees commitment to work, as well as reduce unnecessary labour turnover especially in the civil service. Six years after the establishment of the contributory pension scheme in the Nigeria; findings in this study revealed that, the scheme significantly promoted workers commitment to work, reduced unnecessary labour turnover, as well as build positive attitudinal change among civil servants towards retirement. The study recommended among others that measures be put in place by government to ensure the proper implementation of the 2004 Pension Reform Act.
References Références Referencias 1.
Aderinokun, K. & Adoba, I. (2004). Why Pension Schemes Fail in Nigeria. This Day Online
Available at
http://www.globalaging.org/pension/world/2004/nigeria.htm. Retrieved 20/9/10.
2.
Agba, A.M.O., Ikoh, M.U., Ushie, E.M. & Agba, M.S.(2008). Bureaucratic Corruption
in
Nigeria: The Need for Institutional Reforms. Journal
of International Politics
and
Development Studies, 4 (1&2), 187-204.
3.
Agba, A.M.O, Ikoh, I.M. & Ashibi, N.I. (2010). Teachers Leadership Style, Classroom Variables and Students Academic Performance in Calabar Metropolis, Nigeria.
International
Journal of Educational Research, 1(6), 178-185. 4.
Agba, A.M.O, Nkpoyen, F. & Ushie, E.M.(2010). Career Development and Employee Commitment in Industrial Organizations in Calabar, Nigeria. American Journal
of
Scientific and Industrial Research, 1 (2), 105-
114. 5.
Agba, A. M. O. (2007). External Factors in Industrial Crisis: A Study of Higher Institutions in Cross River and Akwa Ibom States, Nigeria. Unpublished Ph.D
Thesis of the University
of Calabar, Nigeria 6.
Agba, A.M.O. & Ushie, E.M. (2010). Motivational Incentives and Staff Turnover in the Hospitality Industry in Cross Rivers State, Nigeria. Global Journal of
Management and Business Research, 10 (7), 18-28.
7.
Akingbade, B. (2006). Meeting the challenges of Human Capital Development in
Nigeria: The
Case for Reforms in Our Educational Policies and System. Being
paper presented by
CMO of MTN, at the Alumni Convocation lecture of the University of Nigeria, Nsuka.
8.
Aminu, F. (2010). Nigeria’s Contributory Pension Fund Assets Hits N1.7 Trillion.
Online,
available at: http://www.nairaland.com/nigeria/topic 479348.0html.
Retrieved 20/9/10
9.
Babbie,E. (1986). The Practice of Social Research.
California: Wadsworth.
10. Buhari, L.(2003). Public Finance. Lagos: Fourth Dimension Publishers.
11. Becton, C., Wysocki, A. & Keper, K. (2009). Providing a Motivational Environment
with
Associate Recognition. Online available at: http://edis.ifas.ufl.edu/HRO23.
Retrieved
16/11/09. 12.
Cohen, A. & Manion, L. (1986). Research Methods in Education. London: Groon Helm.
13. Denga, D.I. & Ali, A. (1998). An Introduction to Research Methodology and Statistics
in
Education and Social Sciences (3rd
ed.)
Calabar: Rapid Educational
Publication. 14.
Dhameja, S.K. & Dhamejja, S. (2009). Industrial Psychology. New Delhi: S.K. Kataria
and
Sons. 15.
Effiong –
Fuller, E. (1996). Calabar: The
Concept and its Evolution. Calabar: University
of Calabar Press. 16.
Editorial (2009). Nigeria: The Fear of Retirement Analysis. Daily Trust 5 October,2009. Online available at: http:// allafrica.com/stories/200910050546.html. Retrieved
September,2010.
17. Global Action
on Aging (2006). Retirees and
Pension Reform Act, 2004. (Online) available at: http://www.globalaging.org/pension/world/2006/nigeriareform.htm.
Reviewed 29/9/10.
18. Hart, L.A. (1969). Learning at Random. Saturday Review, 5, (16) 12-14.
19. Hackman, J.R. & Oldham, G.R. (1972). Motivation Through the Design of Work: Test of a Theory. Organizational Behaviour and Human Performance, 16, pp. 250-
279.
20. Hall, D.T. & Schneider, B.A(1972). Correlates of Organizational Identification as a
Career Pattern
and Organization Type. Administrative Science Quarterly,
15, pp.
176-189.
21. Ilesanmi, L.A. (2006). Contributory Pension Scheme in Nigeria: Philosophy, Objectives, Features and Implementation. A paper presented at the Ihsam International Workshop,
58
March
201
1 Gl oba
l Jo
urna
l of M
anag
emen
tan
d Bu
sine
ss R
esea
rch
Volum
e XI Issu
e IV
Ver
sion
I
©2011 Global Journals Inc. (US)
Contributory Pension Scheme, Workers Commitment, Retention and Attitude towards Retirement in The Nigerian Civil Service
Early V
iew
held at the University of Calabar Teaching Hospital Calabar on Thursday 2006.
22. Jonathan, G. (2009). Nigeria: The Fear of Retirement. Daily Trust. Online available at http://allafrica.com/stories/200910050546.htmml. Retrieved 20/9/10.
23. Lodahl, T.M. & Kejner, M. (1965). The Identification and Measurement of Job Involvement. Journal of Applied Psychology, 49, pp. 24-33.
24. National Pension Commission (2005). Frequently Asked Questions and their Answers on the Contributory Pension Scheme in Nigeria. Online available at: http://www/oauife.edu.ng/administration/registry/dloads/pencom.pdf. Retrieved 20/9/10.
25. National Pension Commission (2008). Highlights of the Contributory Pension Scheme in Nigeria. Online available at: http;//www.pencom.gov.ng/download/faq/highlights- of-CPS.pdf. Retrieved 20/9/10.
26. National Population Commission (2006). Census 2006. Abuja: NPC.
27. Onyene, V.E. (2001). Issues in Incentive administration for Effective Workforce Retention: A Study of Some Primary School Teachers in Aguata. In N.A. Nwagwu, E.T. Eliametator, M.A. Oguna & M. Nwadiani (ed.), Current Issues in Educational Management in Nigeria (176-188). Benin City: Ambik Press.
28. Ogunbameru, O. & Bamiwuye, S. (2004). Attitude Towards Retirement and Preretirement Education Among Nigerian Bank Workers. Education
Gerontology, 30 (5), 391-401.
29.
Salanick, G.R. (1977). Commitment and the Control of Organizational Behaviour and Belief. In H.M. Straw & G.R. Salanick (Eds.), New Directions in Organizational
Behaviour.
Chicago: St. Clair Press.
30.
Steers, R.M. (1977). Antecedents and Outcomes of Organizational Commitment. Administrative Science Quarterly, 22, 46-56.
31.
Sule, K. O & Ezugwu, C. I. (2009). Scheme on Employee Retirement Benefits of Quoted Firms in Nigeria. African Journal of Accounting, Economics, Finance and
Banking Research, 4 (4), 48-58.
32.
Ushie, E.M., Agba, A.M.O., Agba, M.S. & Best, E.G. (2010). Supplementary Livelihood Strategies among Workers in Nigeria: Implications for Organizational Growth and Effectiveness. International Journals of Business and Management, 5 (3), 146-154.
33.
Ushie, M. A., Agba A. M. Z, Agba, M. S. & Chima, J. (2010). Leadership Style and Employees’ Intrinsic Job Satisfaction in the Cross River Newspaper Corporation, Calabar, Nigeria. International Journal
of Development and Management Review,
(91), 61-74.
34.
World Health Organization, WHO (2007). World Health Statistics. Geneva: WHO.
59
Globa
l Jo
urna
l of M
anag
emen
t an
d Bu
sine
ss R
esea
rch
Volum
e XI Issu
e IvvvvV
Version
I
March
201
1
©2011 Global Journals Inc. (US)
Contributory Pension Scheme, Workers Commitment, Retention and Attitude towards Retirement in The Nigerian Civil Service
Early V
iew

©2011 Global Journals Inc. (US)
This page is intentionally left blank
60
March
201
1 Gl oba
l Jo
urna
l of M
anag
emen
tan
d Bu
sine
ss R
esea
rch
Volum
e XI Issu
e IV
Ver
sion
I
Early V
iew
Comparative Loan Performance In Banks And Micro-Credit Institutions Nigeria: A Case Study
Of Ondo State Dr. Tomola M. Obamuyi
Abstract : The paper compares the performance of loans granted to small and medium enterprises by banks and micro-credit institutions in Nigeria, using Ondo State as a case study. The paper reveals that the average repayment rate of 92.93% for banks is higher than the 34.06% for the micro-credit schemes. That is, the banks performed at much higher levels than micro-credit schemes. The stakeholders in the financial system must always work together to reinforce the financial benefits arising from high loan performance because it has positive effects on the stability of the financial system.
Keywords : Bank Loans, credit scheme, loan performance, Agency theory
I. INTRODUCTION
mall and medium enterprises (SMEs) are always constrained in accessing capital, especially from the formal financial institutions. Although, banks in
Nigeria are liquid, and would like to make loans available to SMEs, they are constrained by the unfavourable characteristics of the enterprises. The lack of accessibility to finance the enterprises, therefore, is attributable to both the supply and demand factors in lending. On the supply side, banks are reluctant to grant loans to SMEs because of lack of reliable information on borrowers, low transparency of operations and poor accounting standards, lack of discipline in the use of credit facilities, the perception of the SME sector as risky, and difficulties in enforcing loan contracts. On the demand side, borrowers are constrained by the absence of collateral, improper bookkeeping, high rates of loan diversion and their inability to prepare feasibility studies. In less developed countries where there is a dearth of information on the operations of SMEs, there is always risk aversion by the financial institutions in funding the sector (Ogujiuba, et. al., 2004). The SME sector in Nigeria comprises those enterprises with a total capital employed not less than N1.5 million, but not exceeding N200 million, including
About : Dr. Tomola M. Obamuyi is a Senior Lecturer in the Department
of Banking & Finance, Adekunle Ajasin University, Akungba-Akoko, Nigeria. His research interests include Entrepreneurship, Finance Issues and Economic Sustainability. Tel: +234 805 350 0258;
E-mail:[email protected]
working capital, but excluding cost of land and/or with staff strength of not less than 10 and not more than 300(see Table 1. The enterprises are in the following sectors: Production (Agriculture, Forestry and Fishing, Manufacturing, Mining and Quarrying; and Real Estate and Construction); General Commerce (domestic trade, export and imports); Services (Public Utilities, Transportation and Communication); and others (Personal and Professional, and Miscellaneous). Wynarczyk, et.al. (1993) identified the characteristics of the small firm other than size. They argued that there are three ways of differentiating between small and large firms. The small firm has to deal with: (i) Uncertainty associated with being a price taker; (ii) Limited customer and product base;
(iii) Uncertainty associated with greater diversity of objectives as compared with large firms.
As Berger et. al. (1998) observe, there is a consensus view from theoretical investigation supported by numerous empirical studies that small businesses as opposed to larger firms face specific constraints in raising external finance. The obvious question is why banks despite better debt servicing, do not expand SME portfolio? What is the performance of banks’ loans, based on their standardized lending requirements? Are the performance rates similar in banks and micro-credit institutions? Answers to the questions above constitute the focus of the research work. The paper compares the performance of loans granted to small and medium enterprises by banks and micro-credit institutions in Nigeria, using Ondo State as a case study. The paper also examines the factors that contribute to loan performance in banks and credit schemes in Nigeria. The study further examines the implications of such performance factors on financial stability of the country. This research, therefore, intends to provoke a further research, especially in developing countries on the issue of loan performance among small and medium enterprises. This is important in order to guarantee the safety, stability and soundness of the financial system.
S
61
Globa
l Jo
urna
l of M
anag
emen
t an
d Bu
sine
ss R
esea
rch
Volum
e XI Issu
e IvvvvV
Version
I
March
201
1
©2011 Global Journals Inc. (US)
Early V
iew
©2011 Global Journals Inc. (US)
The results of the study will be useful in SMEs policy formulation on firms’ financing, in both Nigeria and other countries.
II. LITERATURE REVIEW
The financing, growth and performance of small and medium enterprises (SMEs) are of interest for a number of reasons. The enterprises contribute significantly in employment generation, income generation and catalyzing development in urban and rural areas (Rogers, 1999, Hallberg, 2000, Olutunla, 2001, Kaibori, 2001, Cook, 2001, Davis and Gaburici, 2001, NRO, 2002, Berry, 2002, Beyene, 2002, Mahemba and De Bruijn, 2003, OECD, 2004, Fraser, 2004, Kimambo, 2005 and Williams, 2006). However, these enterprises are constrained by myriad of problems including finance, lack of managerial and technical skills, high costs of doing business and inadequate availability of support infrastructure services. The enterprises do not have access to public capital markets and hence depend on banks for funding. This means that distress in the banking system can have significant impact on the supply of credit to the SMEs (Ogujiuba, et. al., 2004). As Ojo(1992) agues, these enterprises have also been unable to obtain needed finance from the financial institutions, either because of (i) an "information gap", which prevents them from knowing how and where to obtain this finance on acceptable terms, or (ii) a genuine "availability of funds gap", which is due to the failure of financial institutions to appreciate the economic prospect and developmental role of these enterprises. The report of the World Bank (2001) survey in Nigeria, cited in Ogujiuba et. al. (2004), shows that 52% of the micro firms have access to external finance, 82% of small and 89% of medium scale firms also have access, while large firms have almost 100% access to external finance. The World Bank report also indicated that almost 50% of the micro, 39% and 37% of the small and medium scale firms sampled respectively, report being credit constrained, as opposed to 25% of the very large firms. The implication is that small businesses face funding limit, and are discriminated against in credit market, which may lead to large firms crowding out smaller firms in the market (Ogujiuba et. al. 2004). The lack of adequate funding means that SMEs are entangled in a vicious cycle of low incomes, low profits and low capital formation.Similarly, the imperfect credit market conditions and lenders inefficiency allows the powerful (politically or otherwise), dishonest or credit unworthy borrowers to have access to larger loans, who tend to get away with credit money or to become willful defaulters. This is not true for SMEs. Surprisingly, the banks regard the SMEs as a high-risk sector, with high rate of default in loan repayment, apart from the information asymmetry that
often exists between SMEs and the lending institutions. High default rate, if it exists, should be of major concern to both the lenders and policy makers, because of its unintended negative impacts on SMEs financing. Von-Pischke (1980) states that some of the impacts associated with default include: the inability to recycle funds to other borrowers; restraint by other financial intermediaries from serving the needs of small borrowers; and the creation of distrust.
Therefore, the theoretical framework adopted for the paper involved models of lending behaviour based on an agency framework (Cook, 2001). Agency theory is concerned with how agency affect the form of the contract and how they can be minimised, particularly, when contracting parties are asymmetrically informed. Fundamentally, the problem arises because lenders are imperfectly informed about the characteristics of potential borrowers, and it may be impossible, as a result, for lenders to distinguish 'good' borrowers from 'bad' ones (Fraser, 2004). As observed by Akerlof (1970), and cited by Kitchen (1972), a systematic bias may arise in SME financing, because of the theory of the market for "lemons". Because small businesses, especially in developing countries, are regarded as "high-risk", the level of risk associated with the riskiest small business tends to be applied to all small businesses. Consequently, bad businesses tend to drive the good out of the financial market. The good businesses have to raise equity or debt on terms that exaggerate their risk. The gap between the true risk and the perceived risk of the financial markets is termed the "lemon gap". The problem of information asymmetries highlights the importance of relationships between lenders and borrowers. As Fraser (2004) observes, longer and broader relationships increase the amount and flow of information to lenders, enabling good borrowers to obtain better access to finance over time. Therefore, information asymmetries lead to sub-optimal flows of finance available to smaller firms compared to larger firms (Cook, 2001).
III. COMMERCIAL BANKS AND MICRO-CREDIT’S PROGRAMMES FOR SMES
In Nigeria, the financial system is dualistic and consists of formal and informal systems. The Informal Financial System (IFS) comprises the institutions that are virtually outside the control of the established legal framework. The Formal Financial System (FFS) refers to an organized, registered and regulated sector of the financial system. Thus, banks and credit schemes are components of the formal and informal financial systems.
Commercial banks in Nigeria, although mainly cater for large borrowers, have developed an innovative interventionist lending strategy known as Small and Medium Industries Equity Investment Scheme (SMIEIS),
62
March
201
1 Gl oba
l Jo
urna
l of M
anag
emen
tan
d Bu
sine
ss R
esea
rch
Volum
e XI Issu
e IV
Ver
sion
IComparative Loan Performance In Banks And Micro-Credit Institutions Nigeria: A Case Study Of Ondo
State
Early V
iew
from 1st August, 2001, to address the credit needs of small borrowers. The scheme requires all commercial banks in Nigeria to invest 10 per cent of their profit before tax in small and medium scale enterprises of their choice in equity participation. This is aimed at improving the flow of funds to re-vitalize the real sector of the economy. A cumulative sum of N38.2 billion was set aside by the 25 banks under the SMIEIS as at the end of the first quarter of 2007, out of which N18.1 billion or 47.3 % was invested in 258 projects (CBN, 2007).
Commercial banking credit to the small and medium enterprises in Nigeria has continued to dwindle over the years. Figure 1 shows commercial banks’ loans to small-scale enterprises as percentage of total credit to the economy. In assessing the creditworthiness of borrowers, banks applied standard and stringent requirements, to determine the viability of the business and the ability to repay the loans. Banks prefer borrowers who have record of accomplishment of profitability and assets that can be used as collateral. The range of factors usually considered include financial strength, profitability, net worth, track record, management quality, relations and payment records with other banks, business prospects, business risks, opinions from trade counterparties and collateral. In most cases, banks request for personal guarantee for SMEs loans. The banks requested for collateral as an additional requirement, apart from requiring personal guarantees for SME loans, because the financial and operational transparencies of SMEs were relatively low and their accounting standards were poor. The enterprises are also perceived as risky because, in most cases, the death of the owner leads to the death of the business, diversion of funds, high cost of monitoring loans and the fact that most of the loans may not be collateralised. The enterprises are also accorded very low priority rating in credit institutions' lending, because they are perceived to be associated with high degree of loan diversion to unscheduled activities and high rate of
default in loan repayment (Inang and Ukpong, 1992). Loan default can be defined as the inability of a borrower to fulfill his or her loan obligation as and when due (Balogun and Alimi, 1990). Many factors have been identified as major determinants of loan defaults. A large number of studies has claimed that the disparity in problem loans and losses among commercial banks depend largely on bank internal factors such as management quality, bank size, portfolio composition, cost control, credit policy, capital adequacy and credit risk (Huh and Kim,1994; Iyoha and Udegbunam,1998; and Udegbunam, 2000, 2001). However, the lending activities of government credit institutions are different from that of the commercial banks. This is because the cost of administering small business loans is higher for the banks. As Hill and Martin (2000) observe, if default rates and loans administration costs differ between two
groups, lenders have an economic motive for applying different lending criteria to different groups. Most micro-credit institutions in Nigeria are public owed. Some of the past and present government credit schemes in Nigeria are Small Scale Industries Credit Guarantee Scheme (1971), Agricultural Credit Guarantee Scheme (1973), National Economic Reconstruction Fund (1992), Small and Medium Scale Enterprises Loan Scheme (1992), Family Economic Advancement Programme (1997), and Small and Medium Enterprises Development Agency of Nigeria (SMEDAN) in 2004. The government of Ondo State put forth
comprehensive credit schemes to minimise the adverse economic impacts on the economically active entrepreneurs. The schemes are meant to provide credit for the small and medium businesses in the State. The loans attract low interest rates and maximum of three-year repayment period. The main intentions of the credit schemes are to create self-employment and target poverty reduction. Thus, there is improper screening of loan application, improper monitoring of loans after approval and lack of political will to enforce loan contract. There is a tendency for most of the loans from micro-credit institutions to be involved in defaults. Moreover, the fact that most of the loans may not be collaterised means that the micro-Credit institutions are likely to be involved in problem loans and losses. Okorie (1986) shows that the nature, time of disbursement, supervision and profitability of enterprises which benefited from small holder loan scheme in Ondo State, contributed to the repayment ability and consequently high default rates.
IV. METHODOLOGY
The study was conducted in Ondo State, Nigeria, because the State has abundant human and natural resources for the growth of Small and medium enterprises. Data were collected from the records of commercial banks in the State. The list of all commercial banks and their addresses were obtained from the Central Bank of Nigeria, Akure Branch. From 28 commercial banks, 15 banks were selected through a stratified random sampling technique, out of which 9 banks provided complete data for the study. In each bank, data was collected, dealing with the number of SMEs financed, amount of loans granted, amount of loans repaid , amount of loans defaulted and the perception of the banks about SMEs, among others. This information was used to assess the level of loan defaults by small and medium enterprises.
For comparative purpose, the study also made use of data collected from the records of 9 micro-credit schemes, out of the 13 credit schemes based on their involvement in SMEs loans. The author also administered questionnaire to 166 SMEs, which were
63
Globa
l Jo
urna
l of M
anag
emen
t an
d Bu
sine
ss R
esea
rch
Volum
e XI Issu
e IvvvvV
Version
I
March
201
1
©2011 Global Journals Inc. (US)
Comparative Loan Performance In Banks And Micro-Credit Institutions Nigeria: A Case Study Of Ondo State
Early V
iew
©2011 Global Journals Inc. (US)
randomly selected from a list of active (operating) enterprises provided at the Ondo State Board of Internal Revenue and Ondo State Ministry of Commerce and Industry, Akure.
V. DATA ANALYSIS AND RESULTS
The fear of loan performance has been pronounced in many public lectures as one of the reasons why commercial banks have not shown much interest in SMEs financing. This perception, notwithstanding, the commercial banks interviewed indicated that their unwillingness to lend to SMEs is due to a number of unfavourable factors associated with the enterprises. As shown in Figure 2, some of the constraints militating against commercial banks granting loans to SMEs include, although not limited to, poor credit worthiness (41.7%), lack of collateral security (33.3%), poor project-package (33.3%), lack of adequate record (25.0%) and high risk (25.0%). All these problems have combined in several ways to make lending to the SMEs sector very difficult by the commercial banks. The full implications of the various constraints to lending have been that commercial banks lending to the SMEs sector has been mainly on short-term basis, which hardly improve firm performance. Jaramillo and Schiantarelli (1996) gave two main reasons why long-term loans may improve productivity of firms. First, it may allow firms to better and more productive technologies, which the firm may be reluctant in financing with short-term debt because of fear of liquidation. Second, lack of availability of long-term finance may put a squeeze on working capital and this may have adverse consequences on productivity. Table 2 shows a comparative loan performance of banks and micro-credit schemes among the small and medium enterprises. From Table 2, the average repayment rate of 92.93% for banks is higher than the 34.06% for the micro-credit schemes. Thus, the banks have generated self-employment opportunities for people who were either unemployed or underemployed earlier, increasing economic activities in the State. Anderson (1982), for example, spoke of default rates varying from 10 per cent to 60 per cent or more in most developing countries. Little (1987), quoting Levitsky (1983) and Rangarajan (1980) and cited in Balogun and Alimi(1988), concluded that "when loans have been made to very small and new enterprises by development banks, the default rate has been high, often catastrophically high". The explanation for the observed high repayments of debt by the SMEs operators could be that the SMEs are utilizing the loans for productive purposes. The entrepreneurs may wish to preserve their reputations as good borrowers and to avoid the threat of direct sanctions. As warned by Albee(1996) and cited in Snow and Buss (2001), this development presumes that there is no potential
'debt trap' for the borrowers by using new loans to pay off old loans, creating the illusion of high repayment rates. However, part of the result is likely to be due to the bias that for those small and medium enterprises that the lenders believe they have high probabilities of default, loan applications are not approved, as well as the problems of self-rationing of small and medium enterprises.
However, the performance rate of banks can be compared to that of credit schemes in the State. Based on the analysis in Table 2, it was found that the repayment rates in most of the government credit schemes were very high at 65.94%. Specifically, the low performance rate in the credit schemes could be attributed to the following reasons: First, there was no credit culture in lending for the schemes, which among others involves proper screening of loan applications, and monitoring of the loans after approval. Second, the design of the schemes made it entirely state-owned and state-managed schemes. Thus, the wrong perception of Nigerians and the entrepreneurs about State-owned and State-managed schemes has reflected in their unwillingness to repay loans, as they considered the loans as their shares of government funds. Although, the funds obtained were used by the entrepreneurs to either start or expand their businesses, most times, they are unwilling to repay based on the mentality of using government funds. Third, the politically active entrepreneurs are always favoured in lending for start-up or expansion, but may not be sufficiently committed to the businesses for which the loans were granted. Thus, it becomes difficult for the government, to exercise necessary political will to force repayment, if the business failed or could not pay back the loans. It is common for most of such businesses failing after 6 - 10 months of establishment. Fourth, the low repayment could have also arisen from the long period over which loans were granted (between 12- 48 months), especially in the absence of good lending principles. The results of low loan performance for government credit schemes in this study confirm the study in Indonesia(USAID, 2005), where public ownership models for microfinance for the past three decades have not performed well, due to misguided government policies which distort markets, through targeted subsidised credits, political interference or corruption. This explains why governments in some countries have taken new approaches to public ownership of Micro Finance Institutions, by encouraging public-private ownership, mechanisms to depoliticalise the institutions, and an increased adherence to market principles (USAID, 2005). The Grameen bank’s extraordinarily high repayment from 98 t0 100 per cent is largely due to the tight supervision and the participatory process at work in the groups of five and in the centre (Bahar, 2001).
64
March
201
1 Gl oba
l Jo
urna
l of M
anag
emen
tan
d Bu
sine
ss R
esea
rch
Volum
e XI Issu
e IV
Ver
sion
IComparative Loan Performance In Banks And Micro-Credit Institutions Nigeria: A Case Study Of Ondo
State
Early V
iew
However, the study found that only few
enterprises in Ondo State, Nigeria, have capital investment above the N1.5 million stipulated as minimum capital for SMEs. This is not surprising because the level of income is low in the country, and most enterprises derive their start-up capital from past savings and borrowing from friends/relatives. Thus, the government and the banks should review the operational definition of SMEs, especially for the purpose of SMEIS financing.
VI. CONCLUSIONS
The paper compares the performance of loans granted to small and medium enterprises by banks and micro-credit institutions in Nigeria, using Ondo State as a case study. The study also examined the implications of such loan performance on financial stability of the country. The research reveals that loan performance rate in bank was higher than that of government credit schemes for SMEs in Ondo State. Thus, the results imply that the banks have performed at much higher levels than government credit schemes. The results disagree with the common belief that small business lending is risky for banks relative to other types of lending. The stakeholders in the financial system must always work together to reinforce the financial benefits arising from high loan performance because it has positive effects on the stability of the financial system. There is need for the private-public sector approaches in SMEs funding. Additionally, there should be stern efforts by the banks and the credit institutions in screening of loan applications, monitoring of approved loans and enforcing loan contract. Policy makers should ensure conducive environment necessary for improved performance and growth of SMEs. This might involve providing the basic infrastructural facilities, which unnecessarily increase the cost of doing business in the country.
REFERENCES RÉFÉRENCES REFERENCIAS
1) Akerlof, G (1970), ‘The Market of 'Lemons': Quality of Uncertainty and the Market Mechanism’, Quarterly Journal of Economics 84: 488-500
2) Albee, A (1996), ‘Beyond Banking for the Poor Credit Mechanisms and Women's Empowerment’, Gender and Development, 4 (3), 48-53
3) Anderson, D. (1982), ‘Small Industry in Developing Countries: A Discussion of Issues’, World Development 10, No. 11: 913-948.
4) Balogun E.D and Alimi, A. (1988), ‘Loan Delinquency Among Small Farmers in Developing Countries: A Case Study of the Small - Farmer Credit Programme in Lagos
State of Nigeria’, CBN Economic and Financial Review; Vol. 26, No 3 September
5)
Bahar, H.(2001), ‘Financing for Micro-Enterprises, Small, medium-Sized and Cottage Industries: Bangladesh Perspective’, A paper presented at the ESCAP-ADB Joint Workshop on Mobilising Domestic Finance for Development: Reassessment of Bank Finance and Debt Market in Asia and the Pacific, Bangkok, 222-23 November
6)
Beyene, A. (2002), ‘Enhancing the Competitiveness and Productivity of Small and Medium Scale Enterprises (SMEs) in Africa: An Analysis of Differential Roles of National Governments Through Improved Support Services,’
Africa Development, Vol. XXVII, No.
3, pp. 130-156.
7)
Berger, A.N., Saunders, A., Scalise J.M, and Udell G.F (1998), ‘The Effects of Bank Mergers and Acquisitions on Small Business Lending’, Journal of Financial Economics, 50:187 –
229.
8)
Berry, A. (2002), ‘The Role of the Small and Medium Enterprise Sector in Latin America and Similar Developing Economies Developing Economies’, Seton Hall Journal of Diplomacy and International Relations; Winter/Spring. pp. 130-156.
9)
Central Bank of Nigeria(CBN)(2007), Economic
Report for the First Quarter of 2007, Abuja
10) Cook, P. (2001) ‘Finance and Small and Medium-Sized Enterprise in Developing Countries’, Journal of Developmental Entrepreneurship, April. www.findarticles.com/p/articles/m:
11) Davis, J. and Gaburici, A. (2001), ‘Non-Farm Employment in Small-Scale Enterprises in Romania: Policy and Development Issues’, Natural Resources Institute Report, No. 2637, August. http://www.nri.org/rnfe/index.html
12) Fraser, S. (2004), ‘Finance for Small and Medium -
Sized Enterprises’, A Report on the
2004 UK Survey of SME Finances. www2.warwick.ac.uk/fac/soc/wbs/research/csme/annual-report
13) Hallberg, K.(2000), ‘A Market -
Oriented
Strategy for Small and Medium Scale Enterprises’, International Finance Corporation Discussion Paper, 40, April
14) Hill, R. C. and Martin, R. E.(2000), ‘Loan Performance and Race’, Economic Inquiry, Volume 38
15) Huh, C. and Kim, S. B. (1994),‘Financial Regulation and Banking Sector Performance: A comparison of Loan Problems in Japan and Korea’, Federal Reserve Bank of San Francisco Economic Review, No. 2.
65
Globa
l Jo
urna
l of M
anag
emen
t an
d Bu
sine
ss R
esea
rch
Volum
e XI Issu
e IvvvvV
Version
I
March
201
1
©2011 Global Journals Inc. (US)
Comparative Loan Performance In Banks And Micro-Credit Institutions Nigeria: A Case Study Of Ondo State
Early V
iew
©2011 Global Journals Inc. (US)
16) Inang, E.E and Ukpong, G.E (1992),‘A Review of Small-Scale Enterprises Credit Delivery Strategies in Nigeria’, CBN Economic and Financial Review. Vol. 30 No. 4, pp 249 - 278.
17) Iyoha, M. A. and Udegbunam, R. I (1998),‘Prediction of Bank Failure in Nigeria Using Financial Ratios and a Logit Regression Model’, PRAJANAN, Journal of Social and Management Sciences, Vol. xxvii, No.3, Octobe December.
18) Jaramillo, F. and Schiantarelli, F. (1999), ‘Access to Long Term Debt and Effects on Firms’, Performance: Lessons From Ecuador’, Paper prepared for the conference -Term Finance: Theory and Evidence, Finance and Private Sector Development Division, Policy Research Department, the World Bank, Washington D.C., June 14, 1996.
19) Kaibori, S. (2001), ‘Development of Small and Medium-sized Enterprises and Policy Support: Action Guidelines for Tomorrow for Policymakers in Transition Countries’, Economic and Social Research Institute, March.www.esri.go.jp/ent/tie/Russia/Russia7-e.pdf
20) Kimambo, C.Z.M (2005), ‘Stimulating Small and Medium Enterprises Development for Poverty Reduction through Business and Technology Incubation’, Proceeding of the Discourse on Engineering Contribution in Poverty Reduction, Dar es Salaam, March 18-19,pp 109-124.
21) Kitchen, R (1972), ‘Venture Capital: Is it Appropriate for Developing Countries?’, Business Finance in Less Developed Capital Markets: An Emerging Field of Study, Book by Klaus P. Fischer, George J. Papaioannou; Greenwood Press.
22) Levitsky J (1983), ‘Assessment of Bank Small Scale Enterprises Lending’, Washington D.C.: World Bank Industry Department, Mimeo.www.oxfordjournal.org
23) Little I.M.D. (1987), ‘Small Manufacturing Enterprises in Developing Countries’, World Bank Economic Review, 1, No. 2:203-235.
24) Mahemba, C.M. and De Bruijn E.J. (2003,‘Innovation Activities by Small and Medium-Sized Manufacturing Enterprises in Tanzania,’ Creativity and Innovation Management; Vol. 12, No. 3, pp. 162-173, September.
25) Olutunla, G.T (2001), ‘ Entrepreneurship for Economic Development’,Inaugural Lecture Series, 27, FUTA, April 26.
26) Organisation for Economic Co-operation and Development (OECD) (2004),‘Small and Medium - Sized Enterprises in Turkey, Issues and Policies’, www.oecd.org/agr
27) Ogujiuba, K.K, Ohuche, F.K. and Adenuga, A.O (2004), ‘Credit Availability to Small and Medium Scale Enterprises in Nigeria: Importance of New Capital Base for Banks - Background and Issues’, ://ideas.repec.org/p/wpa/wuwpma/0411002.html
28) Ojo, A.T. (1992), ‘Problems of Orthodox Formal Capital Markets in Developing Countries, with Particular Reference to Nigeria’, Business Finance in Less Developed Capital Markets: An Emerging Field of Study. Book by Klaus P. Fischer, George J. Papaioannou; Greenwood Press
29) Okorie, A.(1986,’Major Determinants of Agricultural Loan Repayments’, Savings and development, Vol. X, No. 1, pp. 89 - 99.
30) Rangarajan C. (1980),’Innovation in Banking, the India Experience: Impact on Deposits and Credit". Domestic Finance Studies 63. Washington, D.C.: World Bank.
31) Rogers, M. (1999),’The Performance of Small and Medium Enterprises: An Overview Using the Growth and Performance Survey’, Melbourne Institute Working Paper, No. 1/99, January.
32) Snow, D.R and Buss, T.F (2001), ‘Development and the Role of Micro Credit’, Policy Studies Journal, Vol. 29
33) The Nottinghamshire Research Observatory(NRO)(2002),’Skills and Training in Nottinghamshire Small and Medium Sized Enterprises (SMEs) Emerging Issues’, The Nottinghamshire Research Observatory Occasional Paper Series, No. 1
34) Udegbunam, R. T. (2000), ‘Financial Distress and Performance Difference among Commercial Banks in Nigeria, A Multivariate Ratio Analysis’, The Quarterly Journal of Finance, Vol. xv, No. 2
35) Udegbunam, R. T. (2001), ‘Examining the Internal Factors Determining the Disparity in Loan Performance across the Commercial Banks in Nigeria’, CBN Economic and Financial Review, Vol. 39, No.2
36) United States Agency International Development (USAID)(2005),‘Government Issues in Microfinance’, A paper presented at
37) the International Year of Micro Credit (IYME) Workshop (PRISMS), 16 December
38)
Von-Pischke, J.D (1980), ‘Rural Credit Project Design, Implementation and Loan Collection
66
March
201
1 Gl oba
l Jo
urna
l of M
anag
emen
tan
d Bu
sine
ss R
esea
rch
Volum
e XI Issu
e IV
Ver
sion
I
Performance’, Savings and Development, Vol. IV, No. 2, pp 81 - 91.
Comparative Loan Performance In Banks And Micro-Credit Institutions Nigeria: A Case Study Of Ondo State
Early V
iew
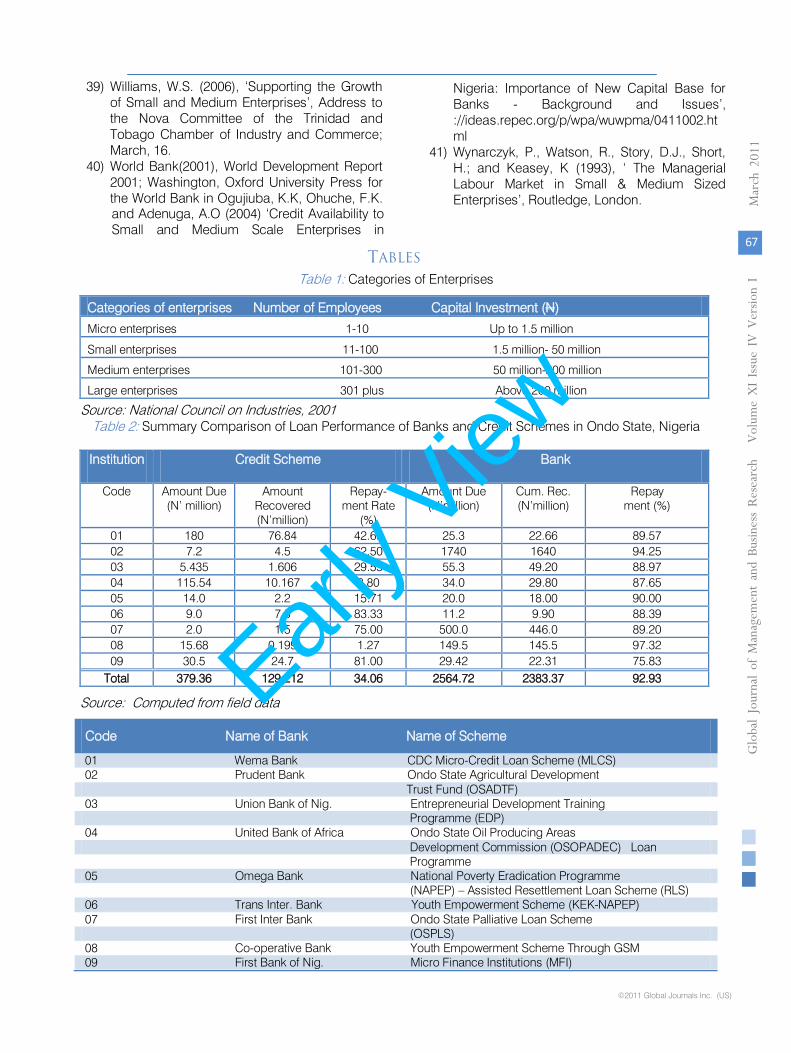
39)
Williams, W.S. (2006), ‘Supporting the Growth of Small and Medium Enterprises’, Address to the Nova Committee of the Trinidad and Tobago Chamber of Industry and Commerce; March, 16.
40)
World Bank(2001), World Development Report 2001; Washington, Oxford University Press for the World Bank in Ogujiuba, K.K, Ohuche, F.K. and Adenuga, A.O (2004) ‘Credit Availability to Small and Medium Scale Enterprises in
Nigeria: Importance of New Capital Base for Banks -
Background and Issues’, ://ideas.repec.org/p/wpa/wuwpma/0411002.html
41)
Wynarczyk, P., Watson, R., Story, D.J., Short, H.; and Keasey, K (1993), ‘ The Managerial Labour Market in Small & Medium Sized Enterprises’, Routledge, London.
TABLES
Table 1: Categories of Enterprises
Categories of enterprises Number of Employees Capital Investment (N) Micro enterprises 1-10 Up to 1.5 million Small enterprises 11-100 1.5 million- 50 million Medium enterprises 101-300 50 million-200 million Large enterprises 301 plus Above 200 million
Source: National Council on Industries, 2001 Table 2: Summary Comparison of Loan Performance of Banks and Credit Schemes in Ondo State, Nigeria
Institution Credit Scheme Bank
Code Amount Due (N’ million)
Amount Recovered (N’million)
Repay-ment Rate
(%)
Amount Due (N’million)
Cum. Rec. (N’million)
Repay ment (%)
01 180 76.84 42.69 25.3 22.66 89.57 02 7.2 4.5 62.50 1740 1640 94.25 03 5.435 1.606 29.55 55.3 49.20 88.97 04 115.54 10.167 8.80 34.0 29.80 87.65 05 14.0 2.2 15.71 20.0 18.00 90.00 06 9.0 7.5 83.33 11.2 9.90 88.39 07 2.0 1.5 75.00 500.0 446.0 89.20 08 15.68 0.199 1.27 149.5 145.5 97.32 09 30.5 24.7 81.00 29.42 22.31 75.83
Total 379.36 129.212 34.06 2564.72 2383.37 92.93
Source: Computed from field data
Code Name of Bank Name of Scheme
01 Wema Bank CDC Micro-Credit Loan Scheme (MLCS) 02 Prudent Bank Ondo State Agricultural Development Trust Fund (OSADTF) 03 Union Bank of Nig. Entrepreneurial Development Training Programme (EDP) 04 United Bank of Africa Ondo State Oil Producing Areas Development Commission (OSOPADEC) Loan Programme 05 Omega Bank National Poverty Eradication Programme (NAPEP) – Assisted Resettlement Loan Scheme (RLS) 06 Trans Inter. Bank Youth Empowerment Scheme (KEK-NAPEP) 07 First Inter Bank Ondo State Palliative Loan Scheme (OSPLS) 08 Co-operative Bank Youth Empowerment Scheme Through GSM 09 First Bank of Nig. Micro Finance Institutions (MFI)
67
Globa
l Jo
urna
l of M
anag
emen
t an
d Bu
sine
ss R
esea
rch
Volum
e XI Issu
e IvvvvV
Version
I
March
201
1
©2011 Global Journals Inc. (US)
Comparative Loan Performance In Banks And Micro-Credit Institutions Nigeria: A Case Study Of Ondo State
Early V
iew

©2011 Global Journals Inc. (US)
FIGURES
68
March
201
1 Gl oba
l Jo
urna
l of M
anag
emen
tan
d Bu
sine
ss R
esea
rch
Volum
e XI Issu
e IV
Ver
sion
IComparative Loan Performance In Banks And Micro-Credit Institutions Nigeria: A Case Study Of Ondo
State
0
5
10
15
20
25
30
35
40
45
50
Pe
rce
nta
ge
YearFig. 1: Commercial Banks Loans to Small Scale Enterprises as
Percentage of Total Credit to the Economy
0
5
10
15
20
25
30
35
40
45
Perc
en
t
Poor Credit
Worthiness
Lack of Collateral
Security
Poor Project
Package
Lack of Adequat e
Record
High credit Risk Diversion of Loans
M ult iple re spo nses were a llo wed: T herefo re , sum m ay e xceed 10 0
Fig. 2: Constraints in Lending to SMEs
Early V
iew

Celebrity Endorsement And Its Impact On Sales: A Research Analysis Carried Out In India.
Dr Vipul Jain
Abstract : The practice of celebrities being used for rendering services other than performing their actual job as either an actor or an athlete, such as endorsements has proliferated over time. Despite the cost and the risks involved with this technique of advertising, it is been used quite extensively in the present era. The instrument of celebrity endorsement has nowadays become a pervasive element in advertising and communication management. India as a country is known for loving its stars. The Indians idolize their bollywood actors and cricketers. The advertisers see this as an opportunity to grab and work on so as to expand their operations and promote their product. This dissertation focuses on examining the perception of these Indian Consumers about the celebrity endorsement process and the subsequent impact on their purchase decisions.
I. BACKGROUND TO THE TOPIC
arketers spend enormous amounts of money annually on celebrity endorsement contracts based on the belief that celebrities are effective
spokespeople for their products or brands (Katyal, 2007). Celebrity Endorsement is viewed as a billion dollar industry in today’s era. (Kambitsis et al, 2002). Various companies are signing deals with celebrities in the hope that by using celebrities they can accomplish a unique and relevant position in the minds of the consumers. (Temperley & Tangen, 2006).Celebrity endorsement is increasingly being employed across various industries regardless of the product type. It is known to be playing the role of a signaling strategy. (Mustafa, 2005). Also According to Reynolds (2000) celebrity endorsement can give a brand a touch of glamour. Everything said and done, one have to weigh the potential risks vs. the potential rewards as celebrity endorsements are always a high-risk, high-reward situation and there is always a human element that you might not know about.
II. RESEARCH AIM
The topic of celebrity endorsements and its elements is heavily documented in academic literature, but what makes this research interesting is that it enables us to understand the celebrity endorsement process from an Indian consumer’s point of view.
About : Assistant Professor Sgrrits, 80 Patel Nagar Dehradun
9412900055,01352627102. Email: [email protected]
Not much work has been seen in the Indian light despite the fact of it being perceived as a potential market for celebrity endorsed products. Indian consumer attitudes are changing at a rapid pace and they are becoming more aware of the products that they use to define their ‘self’. The research is carried out to obtain a view amongst Indian Consumers about celebrity endorsement. Is it as positive as it is assumed to be? Most advertisements, be it of any form, majorly focuses on the young generation therefore their perception about the celebrity endorsed form of advertisement is of utmost importance, also getting to know the attitude the youth provides the knowledge of the most current incidents or attitudes of any country, hence the youth has been targeted in this research. The research undertaken on celebrity endorsement in this paper will be useful on both academic and professional platform, as it looks into the perception of Indian consumers on celebrity endorsement, providing theory for scholarly and directives for managers and professionals.Strategic Positioning and effective communication are the two most important “mantras” guiding brand success in today’s competitive marketing environment. Corporate are ensuring all possible efforts to promote their brands and to grab the customer’s mind share. The impetus is on attracting the customer’s attention and developing positive associations not just to influence recall but also to induce trial and eventually effect purchase decisions. In a market where advertising plays a vital role in coordinating consumer purchases, it becomes pertinent for companies to induct all possible measures to influence motivate and inculcate desire to purchase, in the customer through an effective advertising campaign. Theory and practice proves that the use of superstars in advertising generates lot of publicity and attention. (Ohanian,1991). The billion of dollars spent on celebrity endorsement contracts show that celebrities like LIZ Hurley, Britney spears and Tiger woods play an important role in the advertising industry. (DaneShvary and Schwer,2000,Kambtsis et al.2002). It is estimated that the companies in US spent $800 million in 1998 to acquire talent entertainers, athletes andother high profile personalities -to spot light in advertising, promotion and PR campaigns (Clark,Hastmann, 2003) In India advertisers pour crores of rupees every year into celebrity advertising. Think of Sachin Tendulkar -he means PEPSI in soft drinks, Boost
M
69
Globa
l Jo
urna
l of M
anag
emen
t an
d Bu
sine
ss R
esea
rch
Volum
e XI Issu
e IvvvvV
Version
I
March
201
1
©2011 Global Journals Inc. (US)
Early V
iew
©2011 Global Journals Inc. (US)
in malted beverages, Fiat Palio in cars, TVS victor in two wheelers, Colgate Total in toothpaste, Britannia in Biscuits, Visa in credit cards, Airtel in mobile services and many more brands.
The underlying question is if and how the lively interest of the public in “ The rich and the famous “be effectively used by companies to promote their brands and consequently increase their revenues. (Schlecht,2003) As a first step to answer this question, this paper will examine the relationship between endorsements and brand there by unearthing risks and returns related to this strategy. In order to draw the relationship between celebrities, the brands they endorse and the perception of the people related to the two, models and concepts like source credibility, match up hypothesis ,model of meaning transfer and multi product endorsement would be discussed.
III. WHO IS A CELEBRITY?
Celebrities are people who enjoy public recognition by a large share of a certain group of people whereas attributes like attractiveness, extraordinary lifestyle are just examples and specific common characteristics cannot be observed though it can be said that within a corresponding social group celebrities generally differ from the social norm and enjoy a high degree of public awareness (Schlecht, 2003).(Anonymous, Business Standard, Dec,2003)This is true for classic forms of celebrities like actors (ex Sharukh khan, Amitabh Bachhan), models ( John Abraham, Malaika Arora, Diya Mirza) Sports athletes (ex. Sachin Tendulkar, Sania Mirza) entertainers (Barkha Dutt, Shekhar Suman) And Pop Stars (Mika, Dailer Mehndi) but also for less obvious groups like businessmen (ex Dirubhai Ambani) or politicians (Laloo Prasad Yadav) Besides these there are fictional celebrities like Ronald McDonald, Fido dido, gattu, Amul Girl, Pillsbury doughboy and the like. Celebrities appear in public in different ways. First, they appear in public when fulfilling their profession ex Sachin Tendulkar is loved by millions for his wonderful performance in the cricket fields. Further more, celebrities appear in public by attending special celebrity events ex. filmfare star awards, Videocon screen awards etc. In addition they are present in News, Fashion magazines and tabloids, which provide second source of information on events and private life of celebrities through mass media channels. Last but not the least celebrities act as spokes people in advertising to promote products and services.(Kambitsis et al, 2002, Tom et.al. , 1992)
IV. A firm that decides to employ a celebrity to promote its products or services has a choice of using
the celebrity as:
Testimonial: If the celebrity has personally used a product or service and is in a position to attest its quality ,then he or she may give a testimonial citing its benefits. For instance Aishwarya Rai endorses Lux by testifying the quality of the product as it forms a part of her consumption basket.
Endorsement: celebrities often lend their names to ads for product or services for which they may or may not be the experts For instance Sachin Tendulkar has been endorsing the Palio brand of Fiat.
Actor: A Celebrity may be asked to present a product or service as a part of character enactment rather than personal testimonial or endorsement. For instance Sweta Tiwari of “Prerna fame” (Kasuati Zindagi ki ) enacts as a housewife for Nirma’s ad campaign. It has nothing to do with her on screen or off-screen image In fact she just enacts the character and expectations of a normal housewife from a detergent bar.
Spokesperson
Over 80% of the people remembered the celebrity but forget about the brand.
: A celebrity who represents a brand or company over an extended periods of time often in print and TV ads as well as in personal appearances is usually called a company’s spokesperson. (Schiffman and Kanuk,1997)
The reason for using celebrities a spokesperson goes back to their huge potential influences. Compared to other endorsers, types, famous people achieve a higher degree of attention and recall. They increase awareness of a company’s advertising create positive feelings towards brands and are perceived by consumers as more entertaining (Solomon, 2002) Using a celebrity in advertising is therefore likely to positively affect consumer’s brand attitude and purchase intentions. Cyber media research study published in business world unearthed different truths about celebrity endorsement. The study spread over 3 phases in different cities of India (Delhi, Mumbai, Chennai, Kolkota, Nasik, Coimbatore, Meerut) 12 focus gp interviews, 6 expert instruments and 8 expert interviews with ad agencies were conducted. Besides this survey of 480 respondent in 4 cities and 3375 respondent in 8 cities helped to develop different insights on celebrity endorsements that are given as under:
Different stars appealed to different geographic groups of customers (eg., Aishwarya Rai had highest recall in down south as against ShahRukh Khan who had little appeal there.
70
March
201
1 Gl oba
l Jo
urna
l of M
anag
emen
tan
d Bu
sine
ss R
esea
rch
Volum
e XI Issu
e IV
Ver
sion
ICelebrity Endorsement And Its Impact On Sales: A Research Analysis Carried Out In India.
Early V
iew
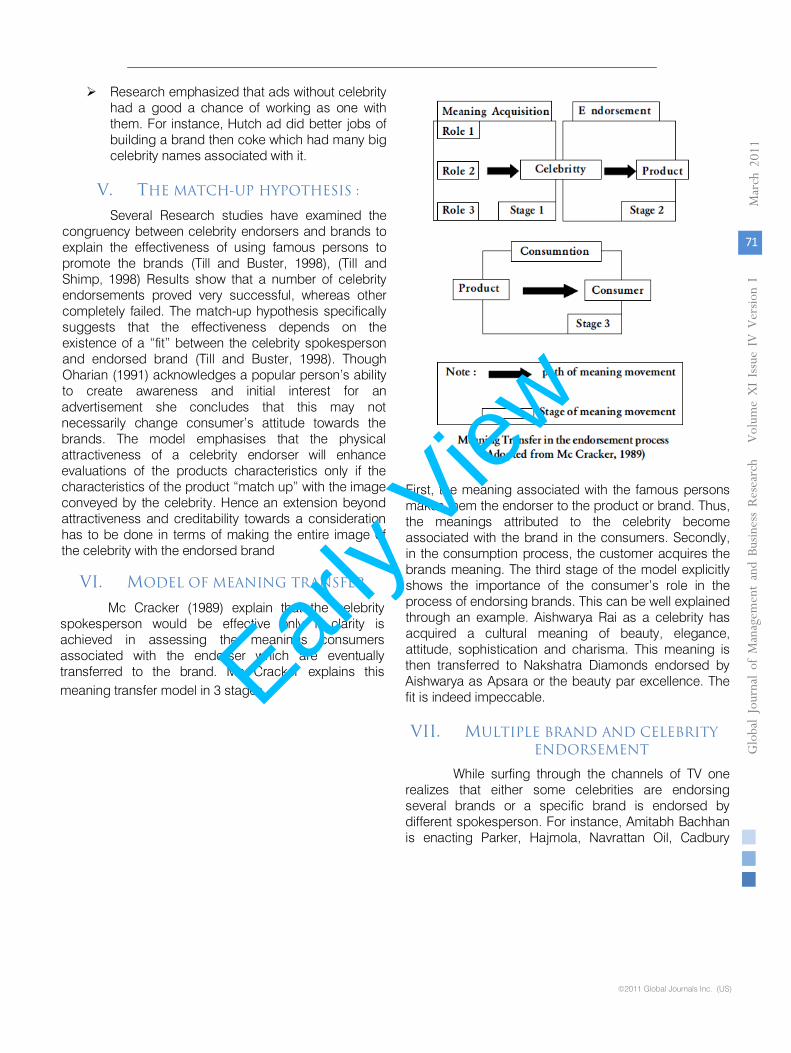
Research emphasized that ads without celebrity had a good a chance of working as one with them. For instance, Hutch ad did better jobs of building a brand then coke which had many big celebrity names associated with it.
V.
THE MATCH-UP HYPOTHESIS :
Several Research studies have examined the congruency
between celebrity endorsers and brands to
explain the effectiveness of using famous persons to promote the brands (Till and Buster, 1998), (Till and Shimp, 1998)
Results show that a number of celebrity
endorsements proved very successful, whereas other completely failed. The match-up hypothesis specifically suggests that the effectiveness depends on the existence of a “fit” between the celebrity spokesperson and endorsed brand (Till and Buster, 1998). Though Oharian (1991) acknowledges a popular person’s ability to create awareness and initial interest for an advertisement she concludes that this may not necessarily change consumer’s attitude towards the brands. The model emphasises that the physical attractiveness of a celebrity endorser will enhance evaluations of the products characteristics only if the characteristics of the product “match up” with the image conveyed by the celebrity. Hence an extension beyond attractiveness and creditability towards a consideration has to be done in terms of making the entire image of the celebrity with the endorsed brand
VI.
MODEL OF MEANING TRANSFER
Mc Cracker (1989) explain that the celebrity spokesperson would be effective only if clarity is achieved in assessing the meanings consumers associated with the endorser which are eventually transferred to the brand. Mc Cracker explains this meaning transfer model in 3 stages.
First, the meaning associated with the famous persons makes them the endorser to the product or brand. Thus, the meanings attributed to the celebrity become associated with the brand in the consumers. Secondly, in the consumption process, the customer acquires the brands meaning.
The third stage of the model explicitly shows the importance of the consumer’s role in the process of endorsing brands. This can be well explained through an example. Aishwarya Rai as a celebrity has acquired a cultural meaning of beauty, elegance, attitude, sophistication and charisma. This meaning is then transferred to Nakshatra Diamonds endorsed by Aishwarya as Apsara or the beauty par excellence. The fit is indeed impeccable.
VII.
MULTIPLE BRAND AND CELEBRITY ENDORSEMENT
While surfing through the channels of TV one realizes that either some celebrities are endorsing several brands or a specific brand is endorsed by different spokesperson. For instance, Amitabh Bachhan is enacting Parker, Hajmola, Navrattan Oil, Cadbury
71
Globa
l Jo
urna
l of M
anag
emen
t an
d Bu
sine
ss R
esea
rch
Volum
e XI Issu
e IvvvvV
Version
I
March
201
1
©2011 Global Journals Inc. (US)
Celebrity Endorsement And Its Impact On Sales: A Research Analysis Carried Out In India.
Early V
iew
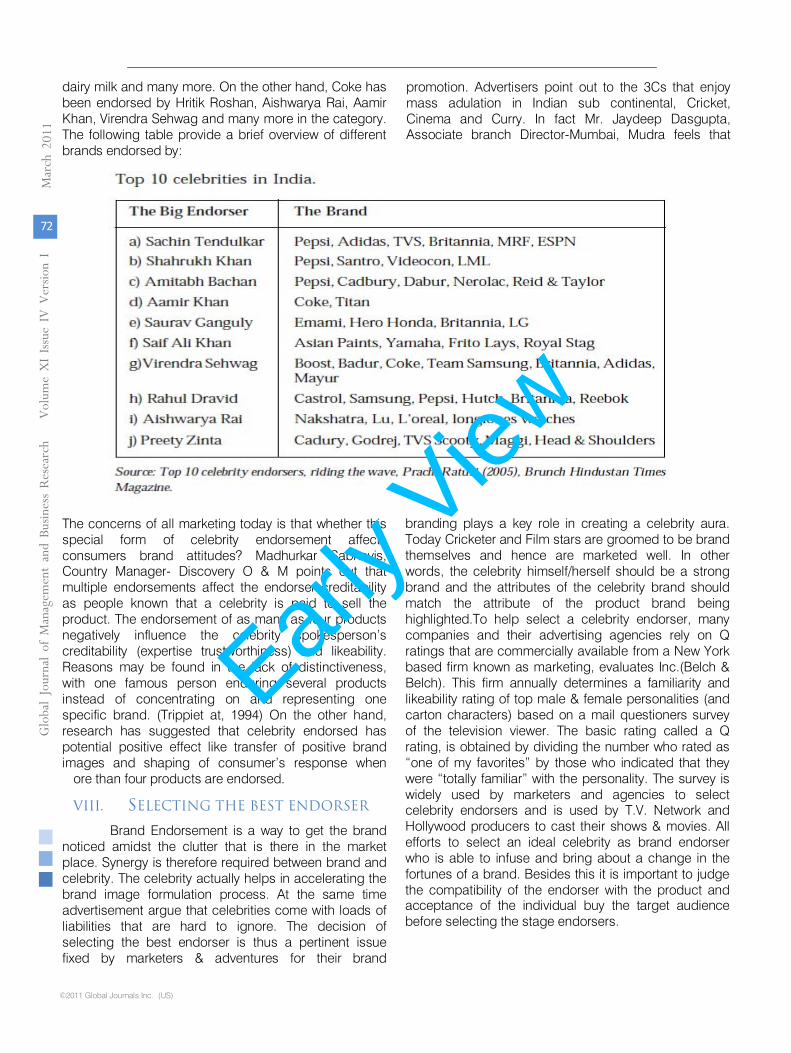
©2011 Global Journals Inc. (US)
dairy milk and many more. On the other hand, Coke has been endorsed by Hritik Roshan, Aishwarya Rai, Aamir Khan, Virendra Sehwag and many more in the category. The following table provide a brief overview of different brands endorsed by:
The concerns of all marketing today is that whether this special form of celebrity endorsement affects consumers brand attitudes? Madhurkar Sabnavis, Country Manager- Discovery O & M points out that multiple endorsements affect the endorser creditability as people known that a celebrity is paid to sell the product. The endorsement of as many as four products negatively influence the celebrity spokesperson’s creditability (expertise trustworthiness) and likeability. Reasons may be found in the lack of distinctiveness, with one famous person enduring several products instead of concentrating on and representing one specific brand. (Trippiet at, 1994) On the other hand, research has suggested that celebrity endorsed has potential positive effect like transfer of positive brand images and shaping of consumer’s response when
ore than four products are endorsed.
VIII. SELECTING THE BEST ENDORSER
Brand Endorsement is a way to get the brand noticed amidst the clutter that is there in the market place. Synergy is therefore required between brand and celebrity. The celebrity actually helps in accelerating the brand image formulation process. At the same time advertisement argue that celebrities come with loads of liabilities that are hard to ignore. The decision of selecting the best endorser is thus a pertinent issue fixed by marketers & adventures for their brand
promotion. Advertisers point out to the 3Cs that enjoy mass adulation in Indian sub continental,
Cricket, Cinema and Curry. In fact Mr. Jaydeep Dasgupta, Associate branch Director-Mumbai, Mudra feels that
branding plays a key role in creating a celebrity aura. Today Cricketer and Film stars are groomed to be brand themselves and hence are marketed well. In other words, the celebrity himself/herself should be a strong brand and the attributes of the celebrity brand should match the attribute of the product brand being highlighted.To help select
a celebrity endorser, many companies and their advertising agencies rely on Q ratings that are commercially available from a New York based firm known as marketing, evaluates Inc.(Belch & Belch). This firm annually determines a familiarity and likeability
rating of top male & female personalities (and carton characters) based on a mail questioners survey of the television viewer. The basic rating called a Q rating, is obtained by dividing the number who rated as “one of my favorites” by those who indicated
that they were “totally familiar” with the personality. The survey is widely used by marketers and agencies to select celebrity endorsers and is used by T.V. Network and Hollywood producers to cast their shows & movies.
All efforts to select an ideal celebrity as brand endorser who is able to infuse and bring about a change in the fortunes of a brand. Besides this it is important to judge the compatibility of the endorser with the product and
72
March
201
1 Gl oba
l Jo
urna
l of M
anag
emen
tan
d Bu
sine
ss R
esea
rch
Volum
e XI Issu
e IV
Ver
sion
ICelebrity Endorsement And Its Impact On Sales: A Research Analysis Carried Out In India.
acceptance of the individual buy the target audience before selecting the stage endorsers.
Early V
iew
IX.
IMPACT OF CELEBRITY ENDORSEMENT
The increasing number of endorsements throws
a valid question to the consumers. Is there a science behind the choice of these endorsers or is it just by the popularity measurement? What are the reasons which lead to impact of celebrity endorsement on brands?
Through research and analysis, this paper develops a 12 point model, which can be used as a blueprint criterion which can be used by brand managers for selecting celebrities, and capitalizes the celebrity resource through 360 degree brand communication, since our research proposes it as the foundation brick of the impact of celebrity endorsement. Our study reveals that the impact of celebrity endorsement is proportional to the 14 factors discussed in the model.The success of a brand through celebrity endorsement is a cumulative of the following 14 attributes. Greater the score of the below parameters, greater are the chances of getting close to the desired impact.
1)
Celebrity-Target Audience Match
Smriti Irani endorsing the WHO recommended
ORS Campaign in India. Indian mothers can associate with Smriti Irani through the facets she projects on screen or in regular life which helps develop a connect with the target audience since mothers medicate their children with ORS.
2)
Celebrity Values
Tabu endorsing Tetra Packed Milk, Shabana
Azmi campaigning for AIDS Awareness, Amitabh Bachchan & Shahrukh Khan campaigning for Pulse Polio or Aishwarya Rai appearing in the Donate Eyes campaign are few examples, which reflect the transfer of celebrity values to the brand, creating an impact that generates recall.
3)
Costs of Acquiring the Celebrity
Recently, a newspaper report showed how cola
firms had gone beyond their advertising budgets to get the best celebrities. Small Firms that use celebrities’ services run greater risks if they invest large amounts. Although nobody is willing to say exactly how much celebrities get paid, industry sources say Sachin Tendulkar’s price is believed to be between Rs. 2.0-2.5 crores per endorsement, and musician A. R. Rehman, who had signed up with AirTel, is believed to have picked up Rs. 1.75 crores. Film-star Hrithik Roshan was rumored to have picked up Rs. 2 crores for the Fly With Hrithik campaign to push Close-Up, and Shahrukh Khan’s rate seems to be between Rs. 2.5-3.0 crores. Aishwarya Rai apparently picks up Rs. 1.25 crores for an endorsement and the Indian cricket captain Saurav Ganguly is believed to get between Rs. 90 lakh to Rs. 1.5 crores, while film-star Aamir Khan apparently makes Rs. 1.5 crores per endorsement.
4)
Celebrity Regional Appeal Factors
R. Madhavan endorsing Pepsi in southern India
or Sachin Tendulkar endorsing in India are few examples of how celebrities are chosen to reach out to target audiences for brands in
regional markets.
5)
Celebrity-Product Match
Cyrus Broacha is the brand ambassador for
MTV since both the celebrity and the brand are considered as friendly, young, moodboosting, humorous and outspoken. MTV’s brand personality overlaps Cyrus Broacha’s image as a brand.Some more examples of compatible celebrity product match in which celebrity brand attributes get transferred to the brand and increases the brand equity is of Govinda & Navratan Tel, Aishwarya Rai & Nakshatra, etc.
6)
Celebrity Controversy Risk
The
perfect example here is of Salman Khan and the controversy in which he crushed a man to death with his Pajero when he was driving under the influence of alcohol. Also, any act on the part of the endorser that gives him a negative image among the audience and goes on to affect the brands endorsed. The brand, in most instances, takes a bashing.
7)
Celebrity Popularity
Celebrity Brand association like Garnier
endorsed Tara Sharma & Simone Singh, Agni Diamonds & Riama Sen don’t get much brand recall, and even if they do, its difficult to attribute it to the celebrities’ endorsing the brand.On the other hand, HPCL has had increased popularity and share of voice due to the endorsement of the brand through Sania Mirza.
8)
Celebrity Availability
In case of various brands, there are situations in
which they prefer to go without a brand face, since there is no brand-fit between the celebrities available and the brand. Also, due to multiple endorsements by certain celebrities, brands refuse to adopt celebrity endorsement since they fear dilution of the brand image.
9)
Celebrity Physical Attractiveness
John Abraham endorsing Wrangler and Timex
Sunglasses are some examples which portray the celebrities’ physical attractiveness that helps create an impact.
10)
Celebrity Credibility
The most important aspect and reason for
celebrity endorsement is credibility. In a research carried out among 43 ad agencies and companies, most experts believed that the most important dimensions of credibility are trustworthiness and prowess or expertise with regard to the recommended product or service. One of the most obvious reasons of Amitabh Bachchan
73
Globa
l Jo
urna
l of M
anag
emen
t an
d Bu
sine
ss R
esea
rch
Volum
e XI Issu
e IvvvvV
Version
I
March
201
1
©2011 Global Journals Inc. (US)
Celebrity Endorsement And Its Impact On Sales: A Research Analysis Carried Out In India.
Early V
iew
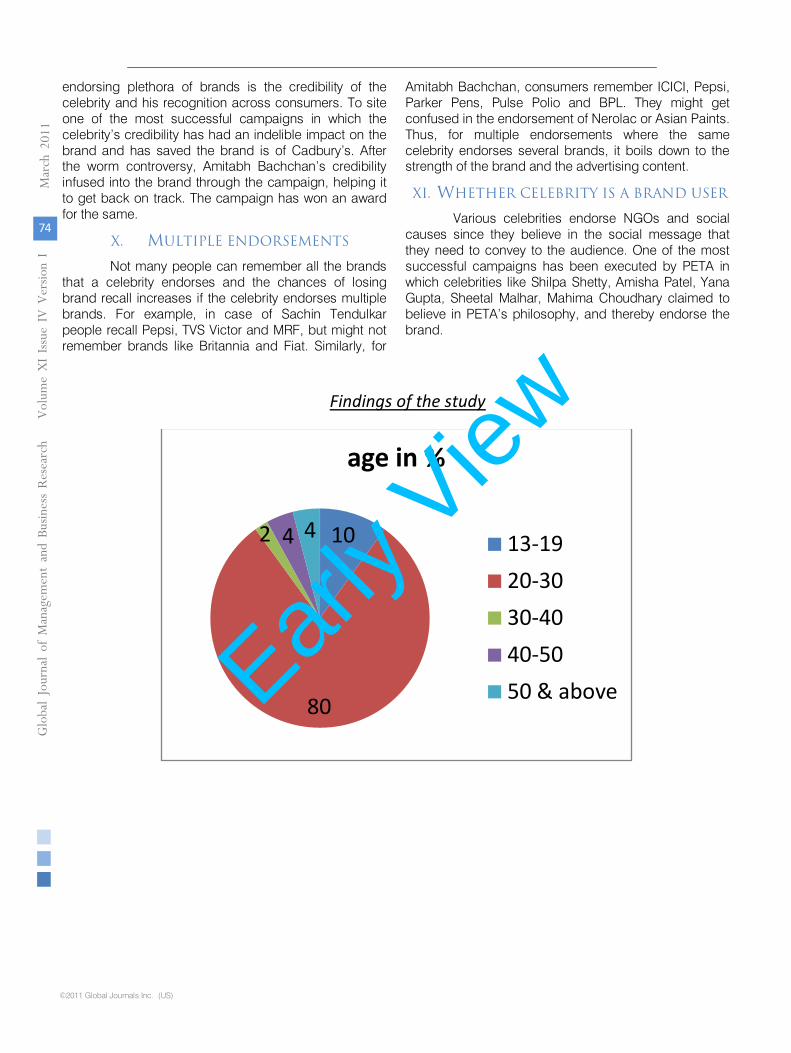
©2011 Global Journals Inc. (US)
endorsing plethora of brands is the credibility of the celebrity and his recognition across consumers. To site one of the most successful campaigns in which the celebrity’s credibility has had an indelible impact on the brand and has saved the brand is of Cadbury’s. After the worm controversy, Amitabh Bachchan’s credibility infused into the brand through the campaign, helping it to get back on track. The campaign has won an award for the same.
X. MULTIPLE ENDORSEMENTS
Not many people can remember all the brands that a celebrity endorses and the chances of losing brand recall increases if the celebrity endorses multiple brands. For example, in case of Sachin Tendulkar people recall Pepsi, TVS Victor and MRF, but might not remember brands like Britannia and Fiat. Similarly, for
Amitabh Bachchan, consumers remember ICICI, Pepsi, Parker Pens, Pulse Polio and BPL. They might get confused in the endorsement of Nerolac or Asian Paints. Thus, for multiple endorsements where the same celebrity endorses several brands, it boils down to the strength of the brand and the advertising content.
XI. WHETHER CELEBRITY IS A BRAND USER
Various celebrities endorse NGOs and social causes since they believe in the social message that they need to convey to the audience. One of the most successful campaigns has been executed by PETA in which celebrities like Shilpa Shetty, Amisha Patel, Yana Gupta, Sheetal Malhar, Mahima Choudhary claimed to believe in PETA’s philosophy, and thereby endorse the brand.
Findings of the study
10
80
2 4 4
age in %
13-19
20-30
30-40
40-50
50 & above
74
March
201
1 Globa
l Jo
urna
l of M
anag
emen
tan
d Bu
sine
ss R
esea
rch
Volum
e XI Issu
e IV
Ver
sion
ICelebrity Endorsement And Its Impact On Sales: A Research Analysis Carried Out In India.
Early V
iew

Celebrity endorsed products are of good quality?
Factors influencing buying decisions
16%
40%20%
20%4%
response in %
strongly agree(5)
agree(4)
0
50
For motor vehiclein %
75
Globa
l Jo
urna
l of M
anag
emen
t an
d Bu
sine
ss R
esea
rch
Volum
e XI Issu
e IvvvvV
Version
I
March
201
1
©2011 Global Journals Inc. (US)
Celebrity Endorsement And Its Impact On Sales: A Research Analysis Carried Out In India.
Early V
iew
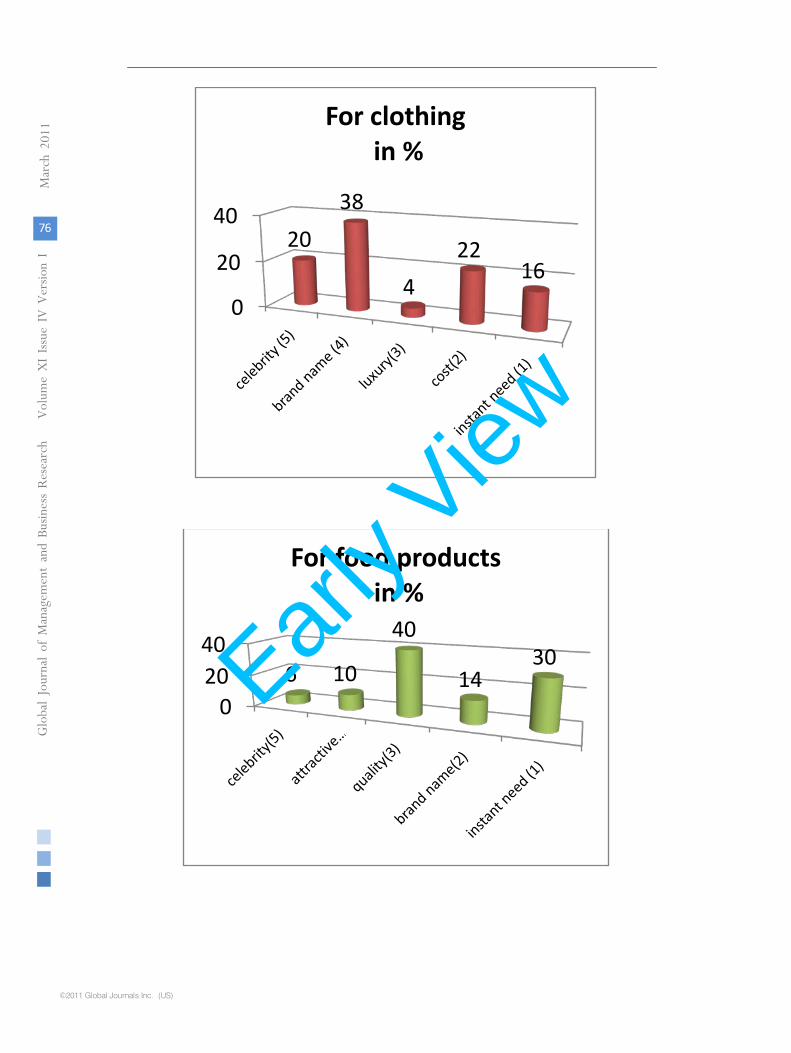
©2011 Global Journals Inc. (US)
0
20
4020
38
4
2216
For clothingin %
02040
6 10
40
1430
For food productsin %
76
March
201
1 Globa
l Jo
urna
l of M
anag
emen
tan
d Bu
sine
ss R
esea
rch
Volum
e XI Issu
e IV
Ver
sion
ICelebrity Endorsement And Its Impact On Sales: A Research Analysis Carried Out In India.
Early V
iew
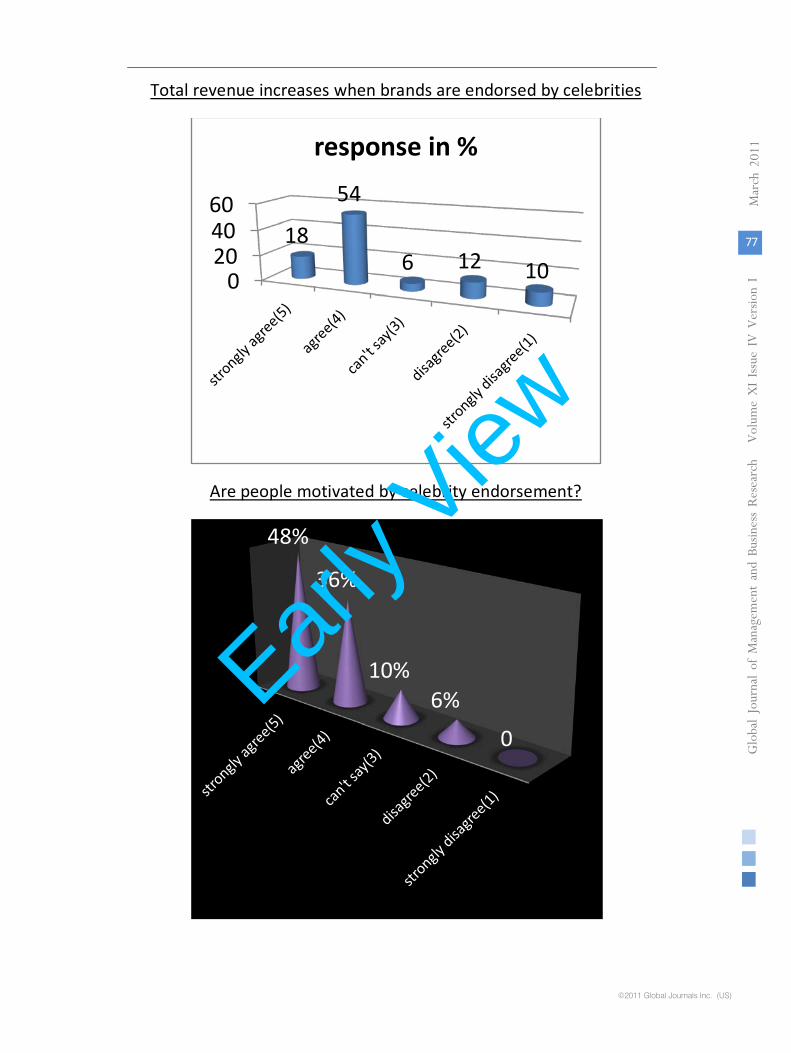
Total revenue increases when brands are endorsed by celebrities
Are people motivated by celebrity endorsement?
0204060
18
54
6 12 10
response in %
48%
36%
10%6%
0
77
Globa
l Jo
urna
l of M
anag
emen
t an
d Bu
sine
ss R
esea
rch
Volum
e XI Issu
e IvvvvV
Version
I
March
201
1
©2011 Global Journals Inc. (US)
Celebrity Endorsement And Its Impact On Sales: A Research Analysis Carried Out In India.
Early V
iew
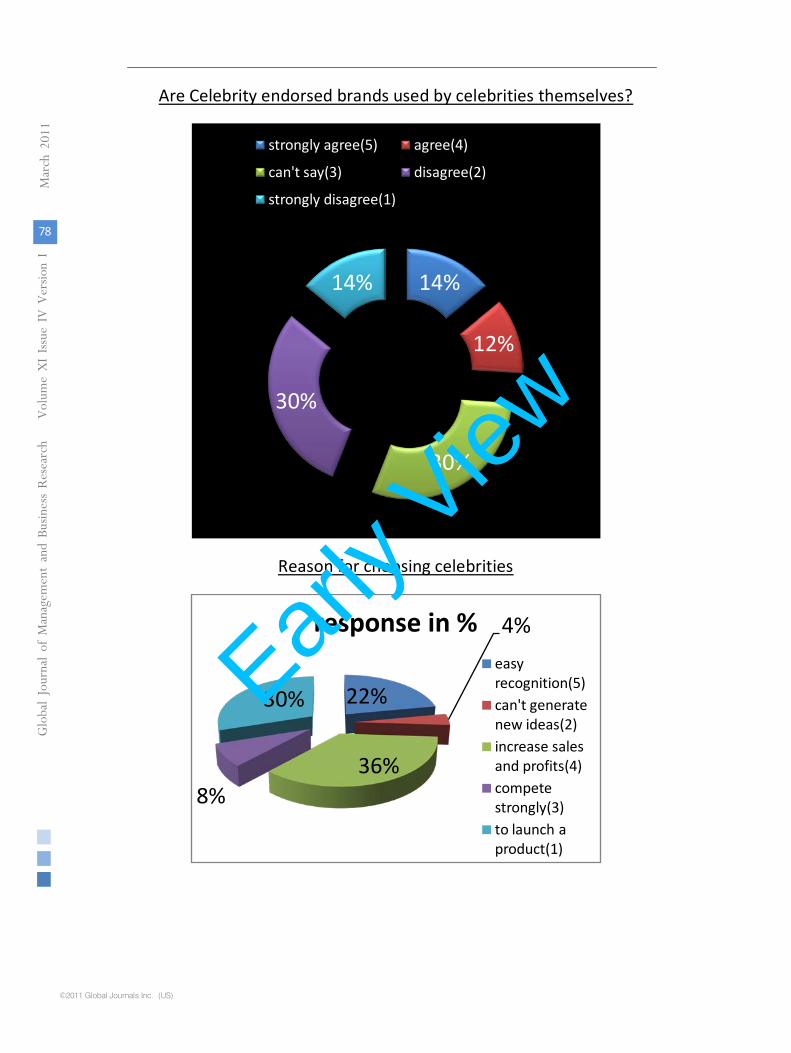
Are Celebrity endorsed brands used by celebrities themselves?
Reason for choosing celebrities
14%
12%
30%
30%
14%
strongly agree(5) agree(4)
can't say(3) disagree(2)
strongly disagree(1)
22%
4%
36%8%
30%
response in %easy recognition(5)can't generate new ideas(2)increase sales and profits(4)compete strongly(3)to launch a product(1)
78
March
201
1 Globa
l Jo
urna
l of M
anag
emen
tan
d Bu
sine
ss R
esea
rch
Volum
e XI Issu
e IV
Ver
sion
I
©2011 Global Journals Inc. (US)
Celebrity Endorsement And Its Impact On Sales: A Research Analysis Carried Out In India.
Early V
iew
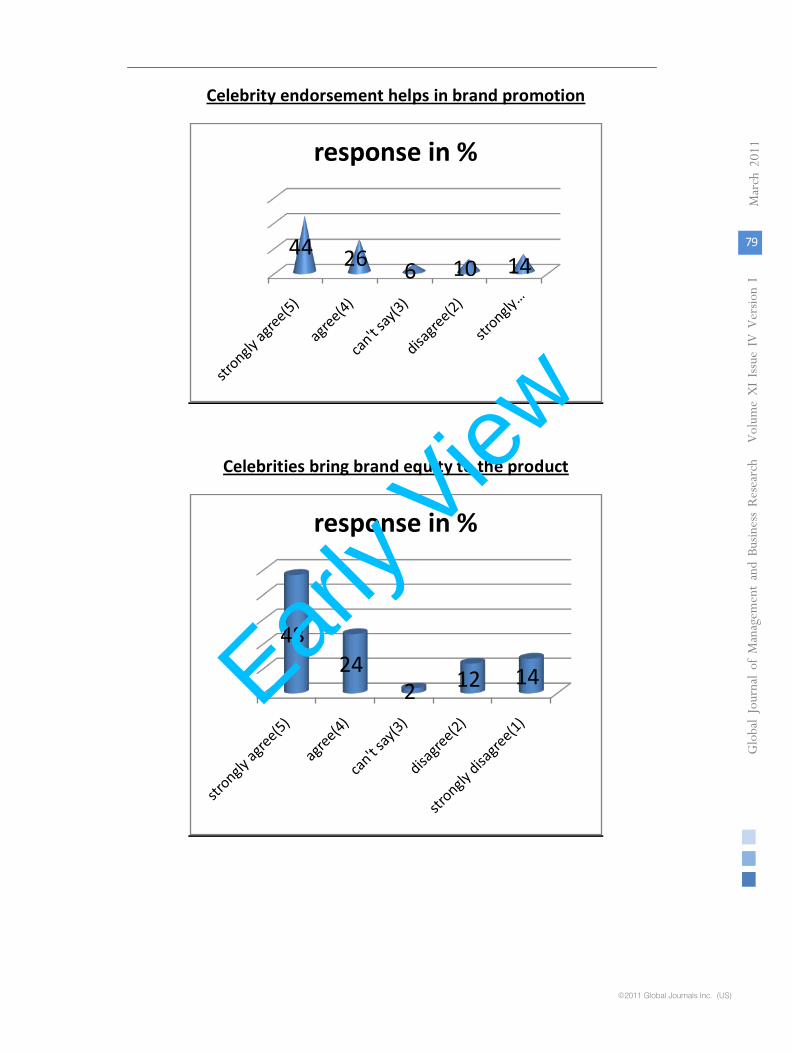
Celebrity endorsement helps in brand promotion
Celebrities bring brand equity to the product
44 26 6 10 14
response in %
4824
2 12 14
response in %
79
Globa
l Jo
urna
l of M
anag
emen
t an
d Bu
sine
ss R
esea
rch
Volum
e XI Issu
e IvvvvV
Version
I
March
201
1
©2011 Global Journals Inc. (US)
Celebrity Endorsement And Its Impact On Sales: A Research Analysis Carried Out In India.
Early V
iew
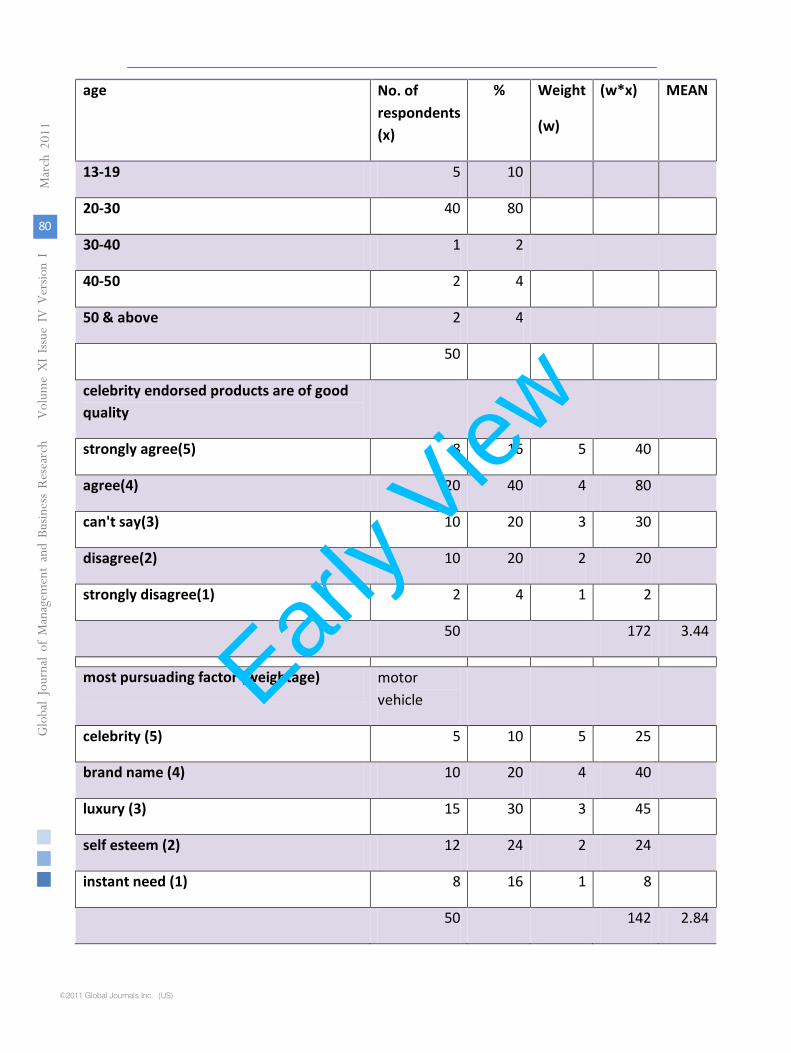
©2011 Global Journals Inc. (US)
age No. of respondents (x)
% Weight
(w)
(w*x) MEAN
13-19 5 10
20-30 40 80
30-40 1 2
40-50 2 4
50 & above 2 4
50
celebrity endorsed products are of good quality
strongly agree(5) 8 16 5 40
agree(4) 20 40 4 80
can't say(3) 10 20 3 30
disagree(2) 10 20 2 20
strongly disagree(1) 2 4 1 2
50 172 3.44
most pursuading factor (weightage) motor
vehicle
celebrity (5) 5 10 5 25
brand name (4) 10 20 4 40
luxury (3) 15 30 3 45
self esteem (2) 12 24 2 24
instant need (1) 8 16 1 8
50 142 2.84
80
March
201
1 Globa
l Jo
urna
l of M
anag
emen
tan
d Bu
sine
ss R
esea
rch
Volum
e XI Issu
e IV
Ver
sion
ICelebrity Endorsement And Its Impact On Sales: A Research Analysis Carried Out In India.
Early V
iew

clothing
celebrity (5) 10 20 5 50
brand name (4) 19 38 4 76
luxury(3) 2 4 3 6
cost(2) 11 22 2 22
instant need (1) 8 16 1 8
50 162 3.24
food products
celebrity(5) 3 0 5 15
attractive package(4) 5 10 4 20
quality(3) 20 40 3 60
brand name(2) 7 14 2 14
instant need (1) 15 30 1 15
50 124 2.48
total revenue inreases when brands are endorsed by celebrities
strongly agree(5) 9 18 5 45
agree(4) 27 54 4 108
can't say(3) 3 12 3 9
disagree(2) 6 12 2 12
strongly disagree(1) 5 10 1 5
50 179 3.58
people are motivated by celebrity endorsement
81
Globa
l Jo
urna
l of M
anag
emen
t an
d Bu
sine
ss R
esea
rch
Volum
e XI Issu
e IvvvvV
Version
I
March
201
1
©2011 Global Journals Inc. (US)
Celebrity Endorsement And Its Impact On Sales: A Research Analysis Carried Out In India.
Early V
iew
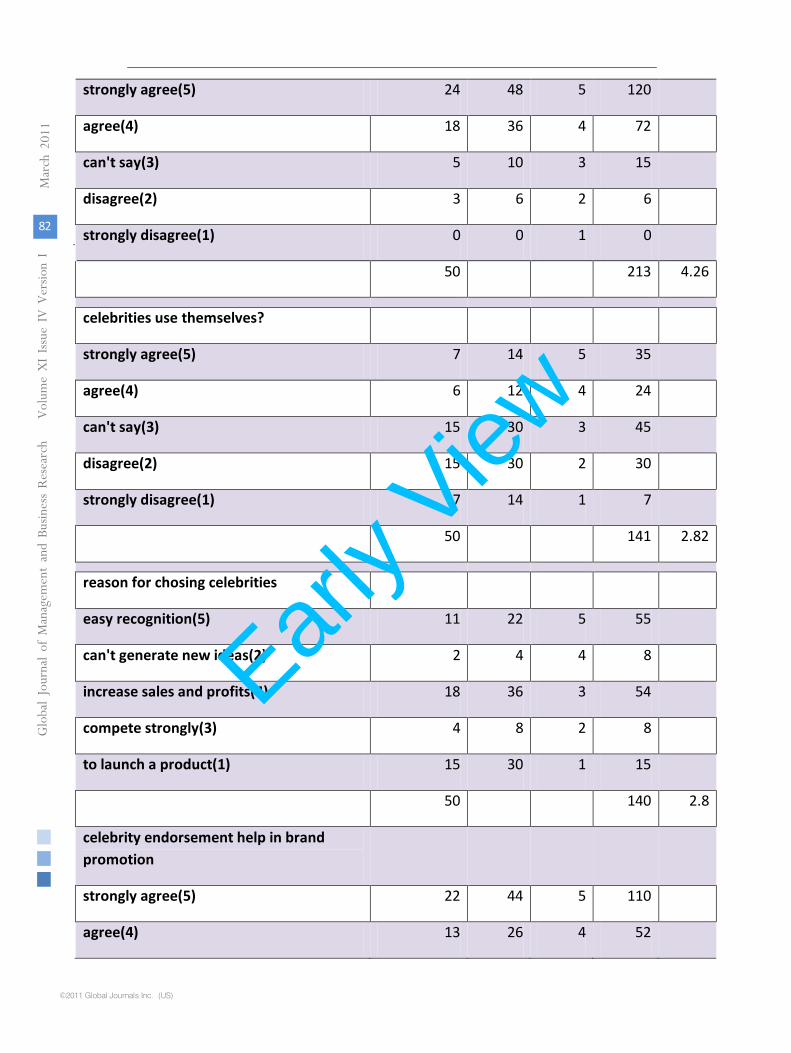
©2011 Global Journals Inc. (US)
strongly agree(5) 24 48 5 120
agree(4) 18 36 4 72
can't say(3) 5 10 3 15
disagree(2) 3 6 2 6
strongly disagree(1) 0 0 1 0
50 213 4.26
celebrities use themselves?
strongly agree(5) 7 14 5 35
agree(4) 6 12 4 24
can't say(3) 15 30 3 45
disagree(2) 15 30 2 30
strongly disagree(1) 7 14 1 7
50 141 2.82
reason for chosing celebrities
easy recognition(5) 11 22 5 55
can't generate new ideas(2) 2 4 4 8
increase sales and profits(4) 18 36 3 54
compete strongly(3) 4 8 2 8
to launch a product(1) 15 30 1 15
50 140 2.8
celebrity endorsement help in brand promotion
strongly agree(5) 22 44 5 110
agree(4) 13 26 4 52
82
March
201
1 Globa
l Jo
urna
l of M
anag
emen
tan
d Bu
sine
ss R
esea
rch
Volum
e XI Issu
e IV
Ver
sion
ICelebrity Endorsement And Its Impact On Sales: A Research Analysis Carried Out In India.
Early V
iew
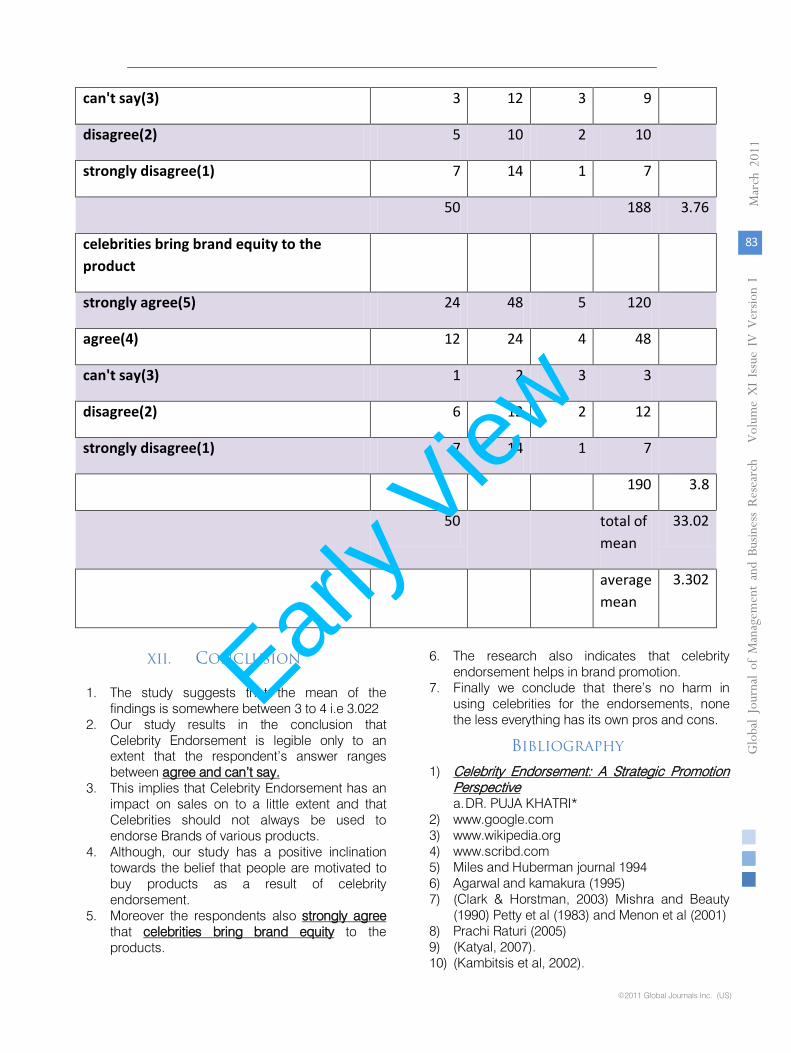
can't say(3)
3
12
3
9
disagree(2)
5
10
2
10
strongly disagree(1)
7
14
1
7
50
188
3.76
celebrities bring brand equity to the product
strongly agree(5)
24
48
5
120
agree(4)
12
24
4
48
can't say(3)
1
2
3
3
disagree(2)
6
12
2
12
strongly disagree(1)
7
14
1
7
190
3.8
50
total of mean
33.02
average mean
3.302
XII. CONCLUSION
1. The study suggests that the mean of the findings is somewhere between 3 to 4 i.e 3.022
2. Our study results in the conclusion that Celebrity Endorsement is legible only to an extent that the respondent’s answer ranges between
3. This implies that Celebrity Endorsement has an impact on sales on to a little extent and that Celebrities should not always be used to endorse Brands of various products.
agree and can’t say.
4. Although, our study has a positive inclination towards the belief that people are motivated to buy products as a result of celebrity endorsement.
5. Moreover the respondents also strongly agree that celebrities bring brand equity
6. The research also indicates that celebrity endorsement helps in brand promotion.
to the products.
7. Finally we conclude that there’s no harm in using celebrities for the endorsements, none the less everything has its own pros and cons.
BIBLIOGRAPHY
1)
a. DR. PUJA KHATRI*
Celebrity Endorsement: A Strategic Promotion Perspective
2) www.google.com 3) www.wikipedia.org 4) www.scribd.com 5) Miles and Huberman journal 1994 6) Agarwal and kamakura (1995) 7) (Clark & Horstman, 2003) Mishra and Beauty
(1990) Petty et al (1983) and Menon et al (2001) 8) Prachi Raturi (2005) 9) (Katyal, 2007). 10) (Kambitsis et al, 2002).
83
Globa
l Jo
urna
l of M
anag
emen
t an
d Bu
sine
ss R
esea
rch
Volum
e XI Issu
e IvvvvV
Version
I
March
201
1
©2011 Global Journals Inc. (US)
Celebrity Endorsement And Its Impact On Sales: A Research Analysis Carried Out In India.
Early V
iew

©2011 Global Journals Inc. (US)
11) Temperley & Tangen, 2006). 12) (Mustafa, 2005) 13) Reynolds (2000) 14) (Ohanian,1991). 15) DaneShvary and Schwer,2000, 16) Kambtsis et al.2002 17) Clark,Hastmann, 2003 18) (Remenyi et al., 1998 19)
Denzin and Lincoln, 2000, pp.10
20)
Gordon and Langmaid, 1988
21)
Silverman, 2000; Creswell, 2003
84
March
201
1 Globa
l Jo
urna
l of M
anag
emen
tan
d Bu
sine
ss R
esea
rch
Volum
e XI Issu
e IV
Ver
sion
ICelebrity Endorsement And Its Impact On Sales: A Research Analysis Carried Out In India.
Early V
iew
Reward System And Its Impact On Employee Motivation In Commercial Bank Of Sri Lanka Plc,
In Jaffna District. Puwanenthiren Pratheepkanth
Abstract : Increasingly, organizations are realizing that they have to establish an equitable balance between the employee’s contribution to the organization and the organization’s contribution to the employee. Establishing this balance is one of the main reasons to reward employees. Organizations that follow a strategic approach to creating this balance focus on the three main components of a reward system, which includes, compensation, benefits and recognition. Studies that have been conducted on the topic indicates that the most common problem in organizations today is that they miss the important component of Reward, which is the low-cost, high-return ingredient to a well-balanced reward system. A key focus of recognition is to make employees feel appreciated and valued. Research has proven that employees who get recognized tend to have higher self-esteem, more confidence, more willingness to take on new challenges and more eagerness to be innovative. The aim of this study is to investigate whether rewards and recognition has an impact on employee motivation. A biographical and Work Motivation Questionnaire was administered to respondents. The results also revealed that staff, and employees from non-white racial backgrounds experienced lower levels of rewards, and motivation. Future research on the latter issues could yield interesting insights into the different factors that motivate employees. Notwithstanding the insights derived from the current research, results need to be interpreted with caution since a convenience sample was used, thereby restricting the generalisability to the wider population.
Keywords : Reward, Motivation, Commercial Bank of Srilanka
I. INTRODUCTION
eward system is an important tool that management can use to channel employee motivation in desired ways. In other words,
reward systems seek to attract people to joint the organization to keep them coming to work, and motivate them to perform to high levels.The reward system consists of all organization components – including people processes rules and decision making activities involved in the allocate of compensation and benefits to employees in exchange for their contribution to the organization.
About : Department of Accounting, University of Jaffna, Sri Lanka,
Email: [email protected]
In order for an organization to meet its obligations to shareholders, employees and society, its top management must develop a relationship between the organization and employees that will fulfill the continually changing needs of both parties. At a minimum the organization expects employees to perform reliably the tasks assigned to them and at the standards set for them, and to follow the rules that have been established to govern the workplace. Management often expects more: that employees take initiative, supervise themselves, continue to learn new skills, and be responsive to business needs. At a minimum, employees expect their organization to provide fair pay, safe working conditions, and fair treatment. Like management, employees often expect more, depending on the strength of their needs for security, status, involvement, challenge, power, and responsibility. Just how ambitious the expectations of each party are, vary from organization to organization. For organizations to address these expectations an understanding of employee motivation is required (Beer, Spector, Lawrence, Mills, & Walton, 1984). Baron (1983) defines motivation as “a set of processes concerned with the force that energizes behavior and directs it towards attaining some goal.” Kreitner and Kinicki (1992) 1 postulate that motivation represents “those psychological processes that cause the arousal, direction and persistence of voluntary actions that are goal directed.” If it is the role of managers to successfully guide employees toward accomplishing organizational objectives, it is imperative that they understand these psychological processes.
Schermerhorn, Hunt and Osborn (1991)
conceptualizes motivation as based on content and process approaches. The content theories of motivation emphasize the reasons for motivated behavior and/or what causes it. These theories specify the correlates of motivated behavior that is states, feelings or attitudes associated with motivated behavior, and help to represent physiological or psychological deficiencies that an individual feels some compulsion to eliminate. Establishing this balance and meeting this need is one of the first reasons, according to Deeprose (1994) to reward and recognize employees. Formal reward programme which denote financial rewards such as salary, fringe benefits, bonuses, promotions or share
R
85
Globa
l Jo
urna
l of M
anag
emen
t an
d Bu
sine
ss R
esea
rch
Volum
e XI Issu
e IvvvvV
Version
I
March
201
1
©2011 Global Journals Inc. (US)
Early V
iew
©2011 Global Journals Inc. (US)
options play a significant role, but employees accept these as intrinsic factors to the job.
II. LITERATURE REVIEW AND PREVIOUS STUDIES
An intrinsically motivated individual, according to Ajila (1997) will be committed to his work to the extent to which the job inherently contains tasks that are rewarding to him or her. And an extrinsically motivated person will be committed to the extent that he can gain or receive external rewards for his or her job. He further suggested that for an individual to be motivated in a work situation there must be a need, which the individual would have to perceive a possibility of satisfying through some reward. If the reward is intrinsic to the job, such desire or motivation is intrinsic. But, if the reward is described as external to the job, the motivation is described as extrinsic. Good remuneration has been found over the years to be one of the policies the organization can adopt to increase their workers performance and thereby increase the organizations productivity. Also, with the present global economic trend, most employers of labour have realized the fact that for their organizations to compete favorably, the performance of their employees goes a long way in determining the to influence workers performance to motivate them began in the 1970s. So many people have carried out researches in this area, some of which are Oloko (1977), Kayode (1973), Egwuridi (1981), Nwachukwu (1994), Ajila (1997). The performance of workers has become important due to the increasing concern of human resources and personnel experts about the level of output obtained from workers due to poor remuneration. This attitude is also a social concern and is very important to identify problems that are obtained in industrial settings due to non-challant attitudes of managers to manage their workers by rewarding them well to maximize their productivity. All efforts must be geared towards developing workers interest in their job so as to make them happy in giving their best to their work, this will ensure industrial harmony. In view of this, this study attempts to identify the influence that rewards have on workers performance in order to address problems arising from motivational approaches in organizational settings. For some reasons most organizations use rewards external to the job in influencing their workers.
Vroom (1964), supported the assumption that workers tend to perform more effectively if there wages are related to performance which is not based on personal bias or prejudice, but on objective evaluation of an employees merit. Though several techniques of measuring job performance have been developed, in general the specific technique chosen varies with the type of work. All these issues call for research efforts, so as to bring to focus how an appropriate reward package
can jeer up or influence workers to develop positive attitude towards their job and thereby increase their productivity. Possibly the best means of understanding workers motivation is to consider the social meaning of work. In this respect, short-term goals and long-term goals of employees and employers may affect production variously. Accordingly, giving attention to the manner in which rewards given to workers are perceived is preferable to assuming that reward means the same thing to all. Rewards that an individual receives are very much a part of the understanding of motivation. Research has suggested that rewards now cause job motivation and satisfaction, which leads to performance. It showed that though there was no significant difference in motivational level and job satisfaction across various categories of workers in different organizations. Egwuridi (1981)
also investigated motivation among Nigerian
workers using a sample of workers of high and low occupational levels. The hypothesis that low-income workers will be intrinsically motivated was not confirmed, and the expectation that higher income worker will place a greater value on intrinsic job-factors than low-income workers was also not confirmed. This shows clearly the extent of value placed on extrinsic job factors. Akerele (1991)
observed that poor remuneration is related to profits made by organization. Wage differential between high and low income earners was related to the low morale, lack of commitment and low productivity. Nwachukwu (1994)
blamed the productivity of Nigerian
workers on several factors, among them is employer’s failure to provide adequate compensation for hard work and the indiscipline of the privileged class that arrogantly displays their wealth, which is very demoralizing to working class and consequently reduced their productivity. Judging from all these empirical studies and findings, one may generally conclude that a good remuneration package, which ties financial rewards to individual performance, can be expected to result in higher productivity. Another study carried out, which is of importance to this research, is that of Wood (1974)
7 He investigated the correlation between various workers attitudes and job motivation and performance using 290 skilled and semi-skilled male and female paper workers. The study revealed that highly involved employees who were more intrinsically oriented towards their job did not manifest satisfaction commensurate with company evaluations of performance. They depended more on intrinsic rewards as compared to those who were more extrinsic in orientation. Gibson, Ivancevich and Donnelly (2000)
say motivation is a concept we use when we describe the forces acting on or within an individual to initiate and direct behavior. We use the concept to explain differences in the intensity of behavior (regarding more intense behaviors as a result of higher levels of motivation) and also to indicate the direction of behavior
86
March
201
1 Globa
l Jo
urna
l of M
anag
emen
tan
d Bu
sine
ss R
esea
rch
Volum
e XI Issu
e IV
Ver
sion
IReward System And Its Impact On Employee Motivation In Commercial Bank Of Sri Lanka Plc, In Jaffna
District.
Early V
iew

(e.g., when you’re tired or sleepy, you direct your behavior toward getting some sleep).Snell (1999) says motivation is everything. Without motivation even the most talented people will not deliver to their potential. With motivation, others will perform way above the level expected of their intelligence and academic ability. He further asserts that company staff is its business. They are the company. They project the image of the company that customers see. They alone hold the power to deliver a high quality standard of service. It is a
company’s staff, not its managers, who ultimately have the power to boost or reduce its profits.
II.
CONCEPTUAL FRAME WORK
After The Careful Study of Literature Review, The Following Conceptual Model is Formulated to Illustrate the Relationship between Reward System and Employee Motivation.
III.
OBJECTIVES OF THE RESEARCH
This research is intended to achieve the following objectives:-
To determine if there is a relationship between reward and employee motivation.
To determine the impact of rewards on motivation.
To determine which factors contribute to work motivation.
To determine the impact of biographical variables on work motivation.
IV.
HYPOTHESES.
Based on the assumed casual relationship given in the conceptual model the following hypotheses were developed for testing.
H1:- Higher the employee rewards lead to higher the
Employee Motivation
H2:-
Lower the employee rewards lead to lower the Employee Motivation
V.
METHODOLOGY
1)
Data Sources
Primary and secondary data are used for the present study. Primary data are collected through the questionnaire. Secondary data are collected from annual reports, journals, internet, books and etc. there are two type of data used for this research study.
2) Mode of Analysis
Concept Variable Indicator Measure Reward System
1 Wages & salary Salary scale Rs. Questionnaire
2 Bonus Rupees. Questionnaire
3 Commission Rupees. Questionnaire
4 Status Increase or decrease. Questionnaire
5 Promotion No. of promotion with in a period
Questionnaire
6 Opportunities to Completion
High or low Questionnaire
7 Responsibility High or low Questionnaire
8 Meaning full work High or low Questionnaire
9 Work Kind Condition High or low Questionnaire
Employee motivation. 1 Higher performance consistency achieved.
Increase or decrease Questionnaire
2 Co – operation. High or low Questionnaire
Reward System
Employee Motivatio
Intrinsic Rewards
Extrinsic Rewards
Extrinsic reward
Intrinsic reward
87
Globa
l Jo
urna
l of M
anag
emen
t an
d Bu
sine
ss R
esea
rch
Volum
e XI Issu
e IvvvvV
Version
I
March
201
1
©2011 Global Journals Inc. (US)
Reward System And Its Impact On Employee Motivation In Commercial Bank Of Sri Lanka Plc, In Jaffna District.
Early V
iew

©2011 Global Journals Inc. (US)
3
Willing-ness of
responsibility High or low
Questionnaire
4
Challenging work
High or low
Questionnaire
5
Growth in job.
Increase or decrease.
Questionnaire
3) Statistical Techniques For this research several techniques were used
such as samples, percentage analysis, correlation analysis, means analysis and diagrams.
a) Percentage analysis
Motivated employee 70- 70%’
Dismotivated employee 30- 30%
b) Regression Analysis In order to find out the nature of relationship
between two variables factor analysis is carried out. The line regression explained the pattern of variation of
depending variables in relation to values the independent variable. In this research to find what relationship exits between reward system and employee motivation, the regression is applied.
This could be explained though the following equation.
Y = a+ bx a = Point cutting a cross axis Y, that is value of Y when x = 0 b = Slanting of the regression line c) Correlation analysis
This analysis measure the relationship between two data that are sealed to be independent of the unit of measurement. The value of the co-related rations calculated through the following formula.
∑x- Sum of the employees perspective innovation and learning perspective and internal business
perspective.
∑y- Sum of the performance.
r- Correlation ratio
d) Means analysis
This analysis measures the average level of reward and employee motivation for each branch.
∑ ∑ ∑ ∑∑ ∑ ∑
−−−
−=
2222 )()( yynxxn
yxxynr
88
March
201
1 Gl oba
l Jo
urna
l of M
anag
emen
tan
d Bu
sine
ss R
esea
rch
Volum
e XI Issu
e IV
Ver
sion
IReward System And Its Impact On Employee Motivation In Commercial Bank Of Sri Lanka Plc, In Jaffna
District.
Early V
iew
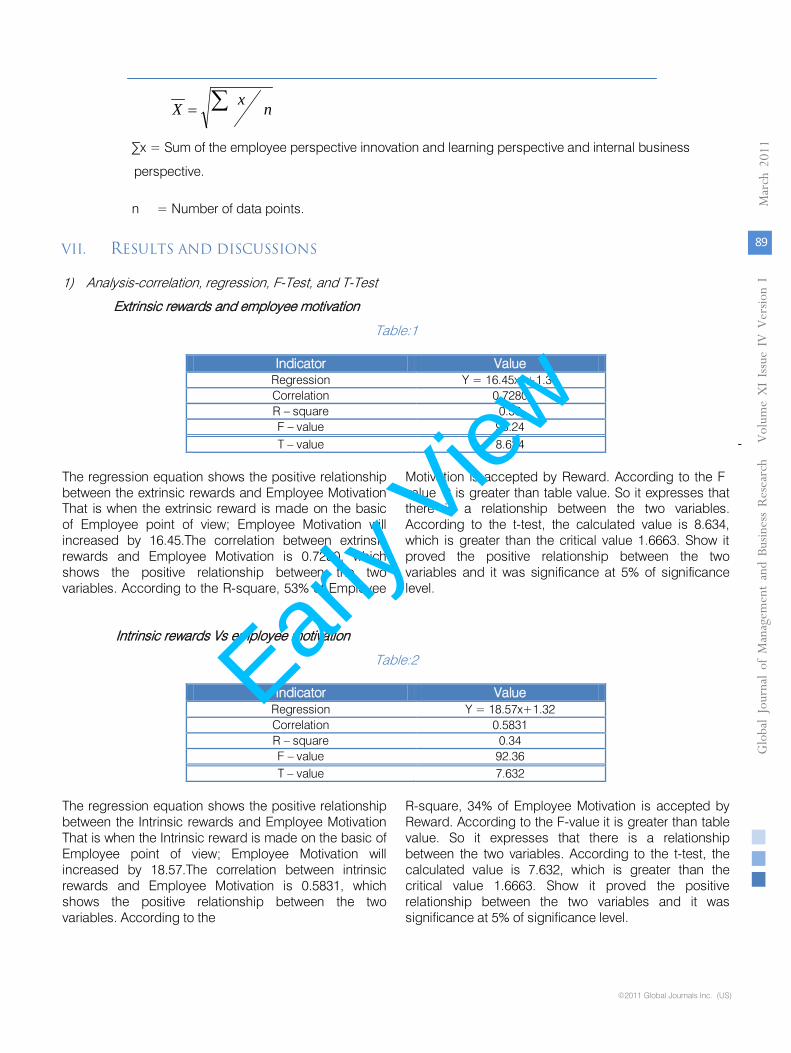
nxX ∑=
∑x = Sum of the employee perspective innovation and learning perspective and internal business
perspective.
n = Number of data points.
VII. RESULTS AND DISCUSSIONS
1) Analysis-correlation, regression, F-Test, and T-Test
Extrinsic rewards and employee motivation
Table:1
Indicator Value Regression Y = 16.45x. +1.34 Correlation 0.7280 R – square 0.53 F – value 96.24 T – value 8.634
The regression equation shows the positive relationship between the extrinsic rewards and Employee Motivation That is when the extrinsic reward is made on the basic of Employee point of view; Employee Motivation will increased by 16.45.The correlation between extrinsic rewards and Employee Motivation is 0.7280, which shows the positive relationship between the two variables. According to the R-square, 53% of Employee
Motivation is accepted by Reward. According to the F
-
value it is greater than table value. So it expresses that there is a relationship between the two variables. According to the t-test, the calculated value is 8.634, which is greater than the critical value 1.6663. Show it proved the positive relationship between the two variables and it was significance at 5% of significance level.
Intrinsic rewards Vs employee motivation
Table:2
Indicator Value Regression Y = 18.57x+1.32 Correlation 0.5831 R – square 0.34 F – value 92.36 T – value 7.632
The regression equation shows the positive relationship between the Intrinsic rewards and Employee Motivation That is when the Intrinsic reward is made on the basic of Employee point of view; Employee Motivation will increased by 18.57.The correlation between intrinsic rewards and Employee Motivation is 0.5831, which shows the positive relationship between the two variables. According to the
R-square, 34% of Employee Motivation is accepted by Reward. According to the F-value it is greater than table value. So it expresses that there is a relationship between the two variables. According to the t-test, the calculated value is 7.632, which is greater than the critical value 1.6663. Show it proved the positive relationship between the two variables and it was significance at 5% of significance level.
89
Globa
l Jo
urna
l of M
anag
emen
t an
d Bu
sine
ss R
esea
rch
Volum
e XI Issu
e IvvvvV
Version
I
March
201
1
©2011 Global Journals Inc. (US)
Reward System And Its Impact On Employee Motivation In Commercial Bank Of Sri Lanka Plc, In Jaffna District.
Early V
iew
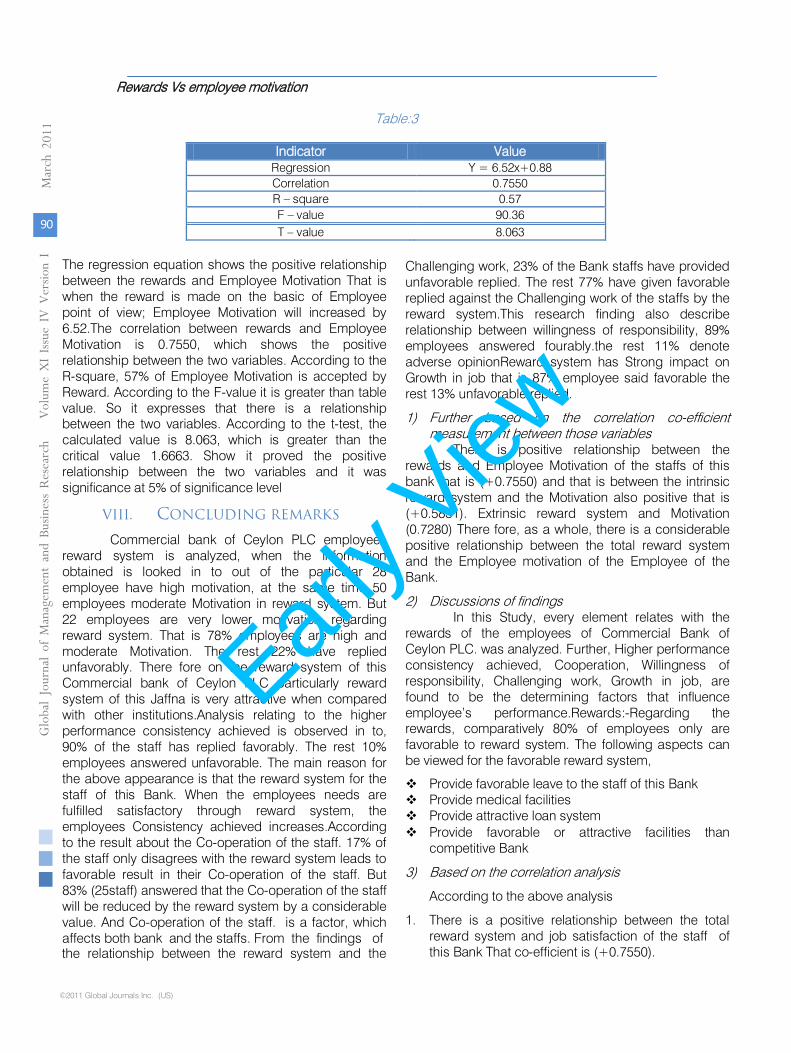
©2011 Global Journals Inc. (US)
Rewards Vs employee motivation
Table:3
Indicator Value Regression Y = 6.52x+0.88 Correlation 0.7550 R – square 0.57 F – value 90.36 T – value 8.063
The regression equation shows the positive relationship between the rewards and Employee Motivation That is when the reward is made on the basic of Employee point of view; Employee Motivation will increased by 6.52.The correlation between rewards and Employee Motivation is 0.7550, which shows the positive relationship between the two variables. According to the R-square, 57% of Employee Motivation is accepted by Reward. According to the F-value it is greater than table value. So it expresses that there is a relationship between the two variables. According to the t-test, the calculated value is 8.063, which is greater than the critical value 1.6663. Show it proved the positive relationship between the two variables and it was significance at 5% of significance level
VIII. CONCLUDING REMARKS
Commercial bank of Ceylon PLC employees reward system is analyzed, when the information obtained is looked in to out of the particular 28 employee have high motivation, at the same time 50 employees moderate Motivation in reward system. But 22 employees are very lower motivation regarding reward system. That is 78% employees are high and moderate Motivation. The rest 22% have replied unfavorably. There fore on the reward system of this Commercial bank of Ceylon PLC particularly reward system of this Jaffna is very attractive when compared with other institutions.Analysis relating to the higher performance consistency achieved is observed in to, 90% of the staff has replied favorably. The rest 10% employees answered unfavorable. The main reason for the above appearance is that the reward system for the staff of this Bank. When the employees needs are fulfilled satisfactory through reward system, the employees Consistency achieved increases.According to the result about the Co-operation of the staff. 17% of the staff only disagrees with the reward system leads to favorable result in their Co-operation of the staff. But 83% (25staff) answered that the Co-operation of the staff
will be reduced by the reward system by a considerable value. And Co-operation of the staff. is a factor, which affects both bank and the staffs. From the findings of
the relationship between the reward system and the
Challenging work, 23% of the Bank staffs have provided unfavorable replied. The rest 77% have given favorable replied against the Challenging work of the staffs by the reward system.This research finding also describe relationship between willingness of responsibility, 89% employees answered fourably.the rest 11% denote adverse opinionReward system has Strong impact on Growth in job that is 87% employee said favorable the rest 13% unfavorable replied.
1)
Further based on the correlation co-efficient measurement between those variables
There is positive relationship between the rewards and Employee Motivation of the staffs of this bank that is (+0.7550) and that is between the intrinsic reward system and the Motivation also positive that is (+0.5831). Extrinsic reward system and Motivation (0.7280) There fore, as a whole, there is a considerable positive relationship between the total reward system and the Employee motivation of the Employee of the Bank.
2)
Discussions of findings
In this Study, every element relates with the rewards of the employees of Commercial Bank of Ceylon PLC. was analyzed. Further, Higher performance consistency achieved, Cooperation, Willingness of responsibility, Challenging work, Growth in job, are found to be the determining factors that influence employee’s performance.Rewards:-Regarding the rewards, comparatively 80% of employees only are favorable to reward system. The following aspects can be viewed for the favorable reward system,
Provide favorable leave to the staff of this Bank Provide medical facilities Provide attractive loan system
Provide favorable or attractive facilities than competitive Bank
3)
Based on the correlation analysis
According to the above analysis
1.
There is a positive relationship between the total reward system and job satisfaction of the staff of this Bank That co-efficient is (+0.7550).
90
March
201
1 Gl oba
l Jo
urna
l of M
anag
emen
tan
d Bu
sine
ss R
esea
rch
Volum
e XI Issu
e IV
Ver
sion
IReward System And Its Impact On Employee Motivation In Commercial Bank Of Sri Lanka Plc, In Jaffna
District.
Early V
iew
2.
Correlation co-efficient between the reward system and the performance consistency achieved is also positive that is (+0.673).
3.
Correlation co-efficient between the reward system and the Cooperation of this staff is Positive that is (+ 0.6235).
4.
Correlation co-efficient between the reward system and the Willingness of responsibility this Bank is also Positive that is –(0.7151).
5.
Correlation co-efficient between the reward system and the Challenging work is also positive that is (+0.5235).
6.
Correlation co-efficient between the reward system and the , Growth in job is Positive that is (+ 0.6211).
4)
Hypotheses testing
H1:-
Higher the employee rewards lead to higher the
Employee Motivation
On the basis of 80% Employees of this Bank have High Motivation; these hypotheses confirmed by effectively Hence it illustrate that when both intrinsic and extrinsic rewards
provide, the Motivation of the employees of this
Bank also slightly improved and vice versa.
H2:-
Lower the employee rewards lead to lower the Employee Motivation
Here this hypothesis is accepted, because there is a positive relationship found between the reward system and the employee’s motivation. That is when the employee reward system Decrease, Motivation also decrease through the performance consistency achieved, Cooperation, Willingness of responsibility, Challenging work, Growth in job.
IX.
RECOMMENDATIONS
Bank must be careful in the following factors to increase the Employee motivation of the Employees by redesigning the reward system.
1)
Work environment
Society of this Bank must try to create supportive, pleasant full working environment internally, in order to satisfy the staff and work with efficiency.
2)
Employees should be trained according to the present content of the environment.
3)
The facilities to be provided to the employees in order to enhance their Employee motivation, job abilities.
4)
This bank can buildup the commitment among employees by rewards and achieve both individual and Organizational objectives.
5)
Employees with one another vary individually, according to physically and mentally. So, bank’s society must identify their different types of needs and fulfill them.
6) Regarding the salary and other allowances.
Management intensifies the salary scheme of employees. It should be supported to up great their standard of living. Further, the following non monitory awards also be increased.
1)
Holiday pay
2)
Bonus
3)
Pension benefits
4)
Overtime pay
5)
Proper training and promotion also to be given to the staff of this Bank in order to they will be satisfied their job.
6)
Responsibility with challenges
when an employee is involved in a challenging task, the result of which should be taken in to the account the responsibilities assigned to the staff should have relevant authority. As regards the staff moderately satisfied. Because the responsibility and financial rewards are not assigned to them in a disciplinary way.
7)
The facilities provided to the employees should be compared with that of other private Organization and facilities similar to it or more to be provided quickly.
X.
SUGGESTIONS FOR FURTHER RESEARCH
The effectiveness of any Organization is influenced greatly by human behaviors. Staffs who are a resources common to all Organization. Effective’s administrative exactitudes helped to create a work environment. That encourages, support and sustained improvement in work motivation. The following suggestion recommended for future researches.
1)
In this study only commercial bank of Ceylon PLC Jaffna is considered to develop the analysis and findings. There are millions of employees and Organization in Sri Lanka. In future studies could consider almost all employees and Bank in the others of district.
2)
Finding of this study analyzed only the employees of Bank of Jaffna. But there are various type of hospital and different types of employees works their. So, this analysis will helpful to conduct the further researcher including all the employees in the bank.
3)
Even through various factors determine the Motivation, if is considered as to how the monetary and non-monetary matters influence on the Motivation of the staff
of this Bank in this analysis.
Therefore, the analysis in relation to other factors that determine the Motivation must be considered.
4)
The analysis in relation to the effect and the problems and the inconvenience of the staff of this Bank / other Bank may be conducted based on the result of this analysis.
91
Globa
l Jo
urna
l of M
anag
emen
t an
d Bu
sine
ss R
esea
rch
Volum
e XI Issu
e IvvvvV
Version
I
March
201
1
©2011 Global Journals Inc. (US)
Reward System And Its Impact On Employee Motivation In Commercial Bank Of Sri Lanka Plc, In Jaffna District.
Early V
iew
©2011 Global Journals Inc. (US)
References Références Referencias
1.
Alderfer, C. (1972). Existence, relatedness, & growth. New York: Free Press.
2.
Barton, G.M. (2002). Recognition at work. Scottsdale: WorldatWork.
3.
Carnegie, D. (1987). Managing through people. New York: Dale Carnegie &
Associates, INC.
4.
Dodd, G. (2005). Canadian employees moving towards total rewards approach to Compensation. Retrieved February 27, 2005,
5.
htttp://www.watsonwyatt.com/Canada
6.
Informal Recognition: The biggest part of an effective recognition strategy. (n.d).
7.
BC Public Service Agency. Retrieved April 05, 2005
8.
http://www.bcpublicservice.ca/awards
9.
Motivation: What makes us tick? (2005). People Development. Retrieved February 27, 2005,
10. http:www.peopledevelopment.com
11. Robbins, S.P. (1993). Organizational behaviour. England: Prentice-Hall.
12. Wilson, T.B. (1994). Innovative reward systems for the changing workplace.
92
March
201
1 Gl oba
l Jo
urna
l of M
anag
emen
tan
d Bu
sine
ss R
esea
rch
Volum
e XI Issu
e IV
Ver
sion
IReward System And Its Impact On Employee Motivation In Commercial Bank Of Sri Lanka Plc, In Jaffna
District.
Early V
iew

Diversite Genre Dans Le Conseil D’administration Et Performance Des
Entreprises Tunisiennes CoteesImen M’hamid1, Rym Hachana2, Abdelwahed Omri3
Résumé : Dans le cadre de ce travail de recherche, nous essayerons de tester l’impact de la présence des femmes et des valeurs féminines au niveau du Conseil d’Administration sur la performance des entreprises tunisiennes. Pour ce faire, nous avons mené notre étude auprès de 34 entreprises tunisiennes cotées. La littérature existante en la matière supporte l’idée de l’effet simultané entre la diversité du Conseil et la performance des entreprises. L’analyse menée dans le contexte tunisien indique que l’amélioration de la performance des entreprises tunisiennes peut être attribuée à la diversité de leurs Conseils d’Administration. Nous avons pu détecter un effet positif de la diversité en termes de sexe mais par contre, un effet négatif en termes de valeurs féminines. En outre, nous avons pu détecter que la présence des femmes au niveau des Conseils d’Administration des entreprises est tributaire de certains facteurs tels que la performance passée de l’entreprise, la taille du Conseil ainsi que le pourcentage des administrateurs externes siégeant au niveau du Conseil. MotsClés: Diversité, Genre, Conseil d’Administration, Performance, Tunisie.
1. INTRODUCTION
elle que définie par Van der & Ingley (2003), la diversité genre dans le conseil d’administration a trait à la composition du conseil, à la variété de
ses attributs, de ses caractéristiques et de son expertise apportée par les administrateurs femmes qui participent ainsi au processus de contrôle exercé par le conseil.Cet axe de recherche a fait l’objet de plusieurs investigations empiriques, notamment, dans les pays développés telles que l’étude de Singh et al., (2001, 2008) effectuées en Grande Bretagne ; celle de Adams et Ferreira (2007, 2009) menée aux Etats-Unis, et également l’étude de Rose (2007) pour le cas des entreprises danoises. Nous tentons dans cet article de vérifier si nous sommes en droit de généraliser ces différents résultats pour le cas d’un pays émergent qui
About 1 : Docteur en Management à l’Institut Supérieur de Gestion de Tunis Assistante à l’Institut Supérieur d’Administration de Gafsa Cité Folla Sidi Ahmed Zarroug-Gafsa 0021698531812 Email: [email protected] About 2 : Docteur en Management de l’Université Paris IX DauphineMaître Assistante à la Faculté des Sciences Juridiques, Economiques et de Gestion de Jendouba Résidence Donia Bloc Selma S5A 1013 El Menzah 9 B 0021621863057 Email: [email protected] About 3 : Docteur en FinanceProfesseur à l’Institut Supérieur de Gestion de Tunis Avenue de la liberté, Bouchoucha, 2000 Le Bardo 0021698333961 Email : [email protected]
est la Tunisie sachant que la place occupée par la femme dans la société Tunisienne s’apparente plus à celle conquise par la femme européenne ou américaine qu’à celle occupée par les femmes arabes et musulmanes. En effet, en Tunisie, le principe d’égalité entre l’homme et la femme est énoncé par les textes constitutionnels et législatifs tunisiens. Le Code du Statut Personnel (CSP), promulgué en 1956, a aboli la polygamie, institué le divorce judiciaire, et fixé l’âge minimum du mariage.
Les femmes actives en Tunisie sont de plus en plus qualifiées grâce à l’expansion de l’éducation notamment universitaire. En effet, les statistiques1
1 Selon les statistiques effectuées par le Centre de Recherche, d’Etudes,
Documentation et Information sur la Femme, 2008.
montrent que le taux de présence des filles dans les facultés s’élève à 60% ; le taux de femmes actives est de 47,5% dans le secteur des services, et le nombre de femmes chefs d’entreprise est de 18.000 en 2007. De plus, 16,7% des femmes travaillant dans le secteur agricole sont chefs d’exploitation.
L’évolution du taux de participation des femmes dans la vie active en Tunisie est fortement liée :
- à l’évolution du taux de scolarisation féminine. A rappeler dans ce cadre que les femmes tunisiennes représentent 51% du corps des enseignants du primaire, 48% du celui du secondaire et 40% du celui du supérieur ; - La réduction du taux de natalité, permettant aux femmes d'assurer une activité marchande hors du domicile ; - La pression des besoins sur le ménage : la contribution nécessaire de la femme au revenu du ménage, du fait de l'insuffisance du revenu du conjoint, incite à accroître le nombre d'actifs ; - aux mécanismes mis en place par le ministère de l’Emploi pour leur insertion dans le marché du travail. Notons, à ce propos, que 33.000 projets initiés par des femmes ont été financés par la BTS (Banque Tunisienne de Solidarité) depuis sa création en 1997 et jusqu’à fin 2008, soit 31% du total des prêts accordés par la banque.
T
93
Globa
l Jo
urna
l of M
anag
emen
t an
d Bu
sine
ss R
esea
rch
Volum
e XI Issu
e IvvvvV
Version
I
March
201
1
©2011 Global Journals Inc. (US)
Early V
iew
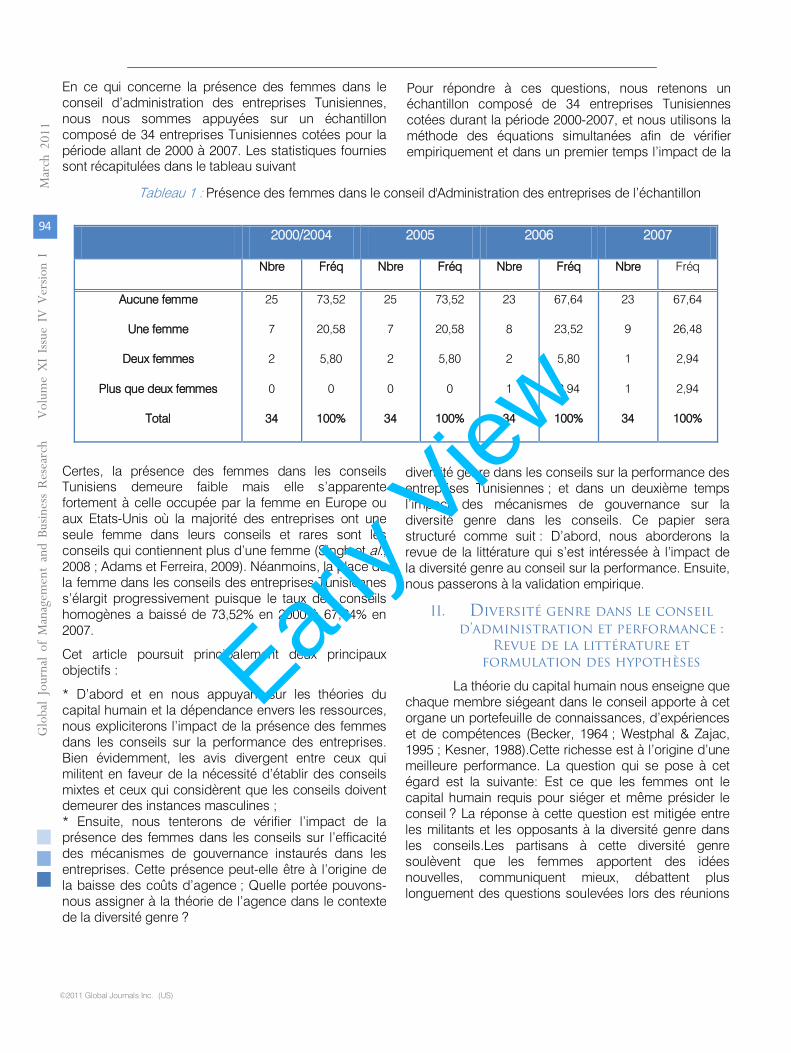
©2011 Global Journals Inc. (US)
En ce qui concerne la présence des femmes dans le conseil d’administration des entreprises Tunisiennes, nous nous sommes appuyées sur un échantillon composé de 34 entreprises Tunisiennes cotées pour la période allant de 2000 à 2007. Les statistiques fournies sont récapitulées dans le tableau suivant
Tableau 1 : Présence des femmes dans le conseil d'Administration des entreprises de l’échantillon
2000/2004 2005 2006 2007
Nbre Fréq Nbre Fréq Nbre Fréq Nbre Fréq
Aucune femme
Une femme
Deux femmes
Plus que deux femmes
Total
25
7
2
0
34
73,52
20,58
5,80
0
100%
25
7
2
0
34
73,52
20,58
5,80
0
100%
23
8
2
1
34
67,64
23,52
5,80
2,94
100%
23
9
1
1
34
67,64
26,48
2,94
2,94
100%
Certes, la présence des femmes dans les conseils Tunisiens demeure faible mais elle s’apparente fortement à celle occupée par la femme en Europe ou aux Etats-Unis où la majorité des entreprises ont une seule femme dans leurs conseils et rares sont les conseils qui contiennent plus d’une femme (Singh et al., 2008 ; Adams et Ferreira, 2009). Néanmoins, la place de la femme dans les conseils des entreprises Tunisiennes s’élargit progressivement puisque le taux des conseils homogènes a baissé de 73,52% en 2000 à 67,64% en 2007.
Cet article poursuit principalement deux principaux objectifs :
* D’abord et en nous appuyant sur les théories du capital humain et la dépendance envers les ressources, nous expliciterons l’impact de la présence des femmes dans les conseils sur la performance des entreprises. Bien évidemment, les avis divergent entre ceux qui militent en faveur de la nécessité d’établir des conseils mixtes et ceux qui considèrent que les conseils doivent demeurer des instances masculines ; * Ensuite, nous tenterons de vérifier l’impact de la présence des femmes dans les conseils sur l’efficacité des mécanismes de gouvernance instaurés dans les entreprises. Cette présence peut-elle être à l’origine de la baisse des coûts d’agence ; Quelle portée pouvons-nous assigner à la théorie de l’agence dans le contexte de la diversité genre ?
Pour répondre à ces questions, nous retenons un échantillon composé de 34 entreprises Tunisiennes cotées durant la période 2000-2007, et nous utilisons la méthode des équations simultanées afin de vérifier empiriquement et dans un premier temps l’impact de la
diversité genre dans les conseils sur la performance des entreprises Tunisiennes
; et dans un deuxième temps l’impact des mécanismes de gouvernance sur la diversité genre dans les conseils.
Ce papier sera structuré comme suit
: D’abord, nous aborderons la revue de la littérature qui s’est intéressée à l’impact de la diversité genre au conseil sur la performance. Ensuite, nous passerons à la validation empirique.
II.
Diversité genre dans le conseil d’administration et performance
: Revue de la littérature et
formulation des hypothèses
La théorie du capital humain nous enseigne que chaque membre siégeant dans le conseil apporte à cet organe un portefeuille de connaissances, d’expériences et de compétences (Becker, 1964
; Westphal & Zajac, 1995
; Kesner, 1988).Cette richesse est à l’origine d’une meilleure performance. La question qui se pose à cet égard est la suivante: Est ce que les femmes ont le capital humain requis pour siéger et même présider le conseil
? La réponse à cette question est mitigée entre les militants et les opposants à la diversité genre dans les conseils.Les partisans à cette diversité genre soulèvent que les femmes apportent des
idées nouvelles, communiquent mieux, débattent plus longuement des questions soulevées lors des réunions
94
March
201
1 Globa
l Jo
urna
l of M
anag
emen
tan
d Bu
sine
ss R
esea
rch
Volum
e XI Issu
e IV
Ver
sion
IDiversité Genre dans le Conseil d’Administration et Performance des Entreprises Tunisiennes Cotées
Early V
iew

des conseils (Carter et al., 2003 ; Adams and Ferreira, 2003 ; Erhardt et al.,2003) et réduisent la prise de risque excessive (Jianakoplos and Bernasek, 1998).En étudiant le profil des administrateurs nouvellement nominés aux conseils des entreprises anglaises, Singh et al. (2008) constatent que les femmes apportent une diversité et une richesse internationale à leurs conseils, elles sont hautement qualifiées et ont une bonne expérience accumulée à travers leurs participations dans les conseils des petites et moyennes entreprises. Ils rajoutent que les femmes ont les qualités requises pour présider le conseil.Les conseils mixtes améliorent l’image de l’entreprise à travers la divulgation de leur ouverture, leur tolérance et leur équité. Farrell et Hersch (2005) pensent même que l’augmentation du nombre des femmes dans les conseils est motivé, non pas par la reconnaissance de leurs qualités et de leurs utilités dans l’amélioration de la performance, mais surtout pour améliorer l’image de l’entreprise afin d’attirer de nouveaux investisseurs. En effet, plusieurs études ont démontré que l’annonce de l’ajout d’une femme au conseil est à l’origine de l’amélioration des rendements enregistrés (Kang et al., 2009).En outre, Adams & Ferreira (2009) démontrent que les femmes administrateurs participent plus activement aux réunions du conseil, et notamment aux débats engagés dans les comités subsidiaires tels que le comité d’audit, de nomination ou de rémunération. Ceci renforce le contrôle exercé par le conseil ce qui réduit les coûts d’agence et permet un meilleur alignement des intérêts des dirigeants sur ceux des actionnaires. Dans le même sillon d’idées, nous pouvons avancer que la diversité genre dans le conseil améliore l’efficacité des autres organes de contrôle et réduit ainsi les tentatives d’enracinement puisqu’il a été démontré par Adams et Ferreira (2009) que la rotation des dirigeants est plus élevée lorsque le conseil contient des femmes administrateurs. Ainsi, la sensibilité du maintien du poste du dirigeant est fortement corrélée à la performance en présence de conseils mixtes.La théorie de la dépendance envers les ressources complète la théorie du capital humain dans la mesure où la présence des femmes constitue une ressource supplémentaire forte utile, notamment, dans un environnement complexe et incertain (Pfeffer and Salancik, 1978 ; Francoeur et al., 2008).
Hypothèse 1 : Il existe une relation positive et significative entre la présence des femmes dans le conseil d’administration des entreprises tunisiennes et leurs performances.
Les opposants à la diversité genre aux conseils soulignent qu’elle accentue les conflits hommes/femmes, réduit la confiance qui est nécessaire pour faire face à un environnement risqué, augmente la rémunération des administrateurs (Shrader et al., 1997 ; Adams & Ferreira, 2004, 2009). La majorité des travaux
ayant déduit un impact négatif de la diversité genre aux conseils sur la performance l’expliquent par le nombre réduit des femmes dans ces conseils, ce qui peut biaiser et marginaliser la portée de leur présence. D’autres études ne soulèvent aucun effet de la diversité genre dans les conseils sur la performance (Rose, 2007 ; Farrell and Hersch, 2005).Nous accorderons une attention particulière à la divulgation des valeurs féminines au sein du conseil. En effet, les femmes semblent avoir un mode de gestion tout à fait spécifique, différent de celui des hommes : Elles semblent favoriser une structure horizontale et un mode de gestion souple, et encourager la participation, le partage du pouvoir et de l’information (B’Chir et al.
,
2009).
Hypothèse 2 : Il existe une relation positive et significative entre la divulgation des valeurs féminines dans le conseil d’administration des entreprises tunisiennes et leurs performances.
III. Diversité genre dans le conseil d’administration et performance :
Validation empirique dans le contexte tunisien
Dans ce qui suit, nous expliciterons le choix de l’échantillon, nous opérationnaliserons les différentes variables retenues et nous détaillerons la méthode économétrique adoptée afin de tester nos hypothèses.
1) Choix de l’échantillon Nous projetons d’effectuer notre étude
empirique en se basant sur un échantillon constitué de 34 entreprises tunisiennes cotées sur la bourse de Tunis durant la période allant de 2000 à 2007. Pour chaque entreprise, nous disposons des données financières obtenues à partir des états financiers publiés par la bourse des valeurs mobilière de Tunis. Les données manquantes ont été rajoutées grâce à l’administration d’un questionnaire et d’une entrevue avec les Présidents Directeurs Généraux des dites entreprises.
2) Opérationnalisation des variables Différentes variables seront utilisées afin de
tester le lien entre la diversité genre au conseil et la performance des entreprises Tunisiennes cotées :
La variable dépendante : Le Return On Assets (RACTit
)
est le taux de rendement de l'actif ou la rentabilité économique. Ce ratio mesure en pourcentage le rapport entre le résultat d'exploitation et l'actif total mobilisé dans l'activité.
Les variables indépendantes :
* La diversité du conseil (DVCAit) est mesurée en termes de pourcentages des femmes présentes dans le conseil. La diversité genre renforce la mission de contrôle assignée au conseil et réduit de ce fat les coûts
95
Globa
l Jo
urna
l of M
anag
emen
t an
d Bu
sine
ss R
esea
rch
Volum
e XI Issu
e IvvvvV
Version
I
March
201
1
©2011 Global Journals Inc. (US)
Diversité Genre dans le Conseil d’Administration et Performance des Entreprises Tunisiennes Cotées
Early V
iew
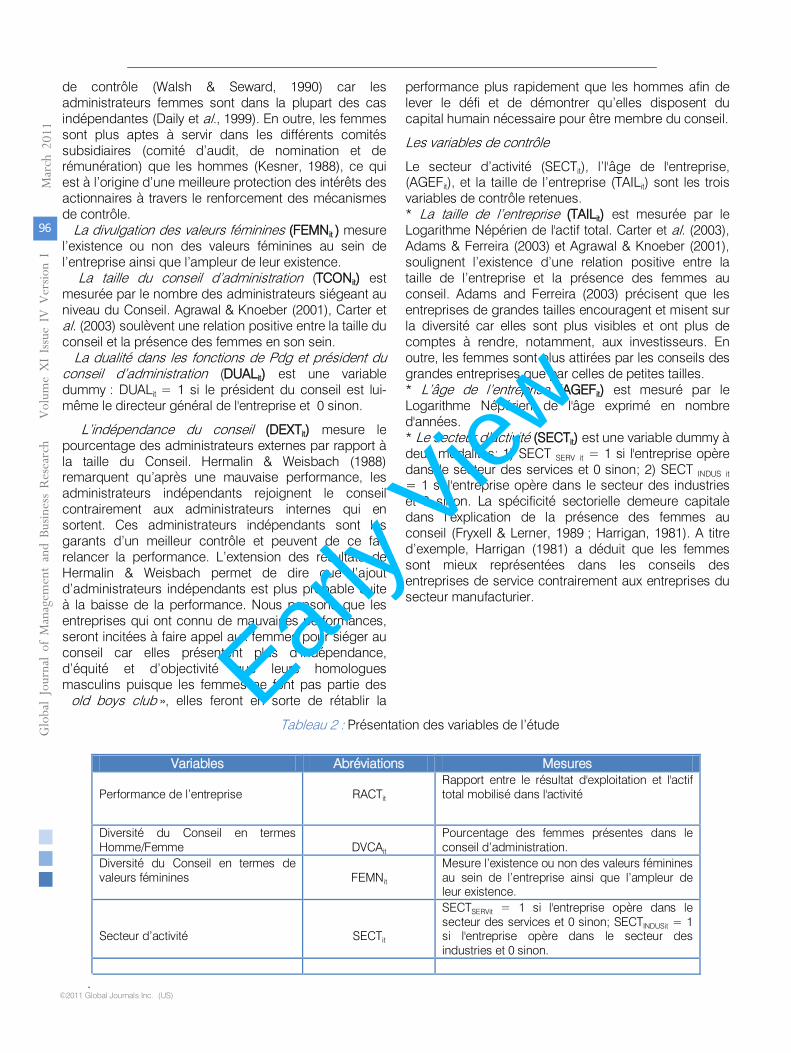
©2011 Global Journals Inc. (US)
de contrôle (Walsh & Seward, 1990) car les administrateurs femmes sont dans la plupart des cas indépendantes (Daily et al., 1999). En outre, les femmes sont plus aptes à servir dans les différents comités subsidiaires (comité d’audit, de nomination et de rémunération) que les hommes (Kesner, 1988), ce qui est à l’origine d’une meilleure protection des intérêts des actionnaires à travers le renforcement des mécanismes de contrôle.
La divulgation des valeurs féminines (FEMNit ) mesure l’existence ou non des valeurs féminines au sein de l’entreprise ainsi que l’ampleur de leur existence.
La taille du conseil d’administration (TCONit) est mesurée par le nombre des administrateurs siégeant au niveau du Conseil. Agrawal & Knoeber (2001), Carter et al. (2003) soulèvent une relation positive entre la taille du conseil et la présence des femmes en son sein.
La dualité dans les fonctions de Pdg et président du conseil d’administration (DUALit) est une variable dummy : DUALit = 1 si le président du conseil est lui-même le directeur général de l'entreprise et 0 sinon.
L’indépendance du conseil (DEXTit) mesure le pourcentage des administrateurs externes par rapport à la taille du Conseil. Hermalin & Weisbach (1988) remarquent qu’après une mauvaise performance, les administrateurs indépendants rejoignent le conseil contrairement aux administrateurs internes qui en sortent. Ces administrateurs indépendants sont les garants d’un meilleur contrôle et peuvent de ce fait relancer la performance. L’extension des résultats de Hermalin & Weisbach permet de dire que l’ajout d’administrateurs indépendants est plus probable suite à la baisse de la performance. Nous pensons que les entreprises qui ont connu de mauvaises performances, seront incitées à faire appel aux femmes pour siéger au conseil car elles présentent plus d’indépendance, d’équité et d’objectivité que leurs homologues masculins puisque les femmes ne font pas partie des old boys club », elles feront en sorte de rétablir la
performance plus rapidement que les hommes afin de lever le défi et de démontrer qu’elles disposent du capital humain nécessaire pour être membre du conseil.
Les variables de contrôle
Le secteur d’activité (SECTit), l’l'âge de l'entreprise, (AGEFit), et la taille de l’entreprise (TAILit) sont les trois variables de contrôle retenues. * La taille de l’entreprise (TAILit) est mesurée par le Logarithme Népérien de l'actif total. Carter et al. (2003), Adams & Ferreira (2003) et Agrawal & Knoeber (2001), soulignent l’existence d’une relation positive entre la taille de l’entreprise et la présence des femmes au conseil. Adams and Ferreira (2003) précisent que les entreprises de grandes tailles encouragent et misent sur la diversité car elles sont plus visibles et ont plus de comptes à rendre, notamment, aux investisseurs. En outre, les femmes sont plus attirées par les conseils des grandes entreprises que par celles de petites tailles. * L’âge de l’entreprise (AGEFit) est mesuré par le Logarithme Népérien de l'âge exprimé en nombre d'années. * Le secteur d’activité (SECTit) est une variable dummy à deux modalités: 1) SECT SERV it = 1 si l'entreprise opère dans le secteur des services et 0 sinon; 2) SECT INDUS it = 1 si l'entreprise opère dans le secteur des industries et 0 sinon. La spécificité sectorielle demeure capitale dans l’explication de la présence des femmes au conseil (Fryxell & Lerner, 1989 ; Harrigan, 1981). A titre d’exemple, Harrigan (1981) a déduit que les femmes sont mieux représentées dans les conseils des entreprises de service contrairement aux entreprises du secteur manufacturier.
Tableau 2 : Présentation des variables de l’étude
Variables Abréviations Mesures Performance de l’entreprise
RACTit
Rapport entre le résultat d'exploitation et l'actif total mobilisé dans l'activité
Diversité du Conseil en termes Homme/Femme
DVCAit
Pourcentage des femmes présentes dans le conseil d’administration.
Diversité du Conseil en termes de valeurs féminines
FEMNit
Mesure l’existence ou non des valeurs féminines au sein de l’entreprise ainsi que l’ampleur de leur existence.
Secteur d’activité
SECTit
SECTSERVit = 1 si l'entreprise opère dans le secteur des services et 0 sinon; SECTINDUSit = 1 si l'entreprise opère dans le secteur des industries et 0 sinon.
96
March
201
1 Gl oba
l Jo
urna
l of M
anag
emen
tan
d Bu
sine
ss R
esea
rch
Volum
e XI Issu
e IV
Ver
sion
IDiversité Genre dans le Conseil d’Administration et Performance des Entreprises Tunisiennes Cotées
Early V
iew
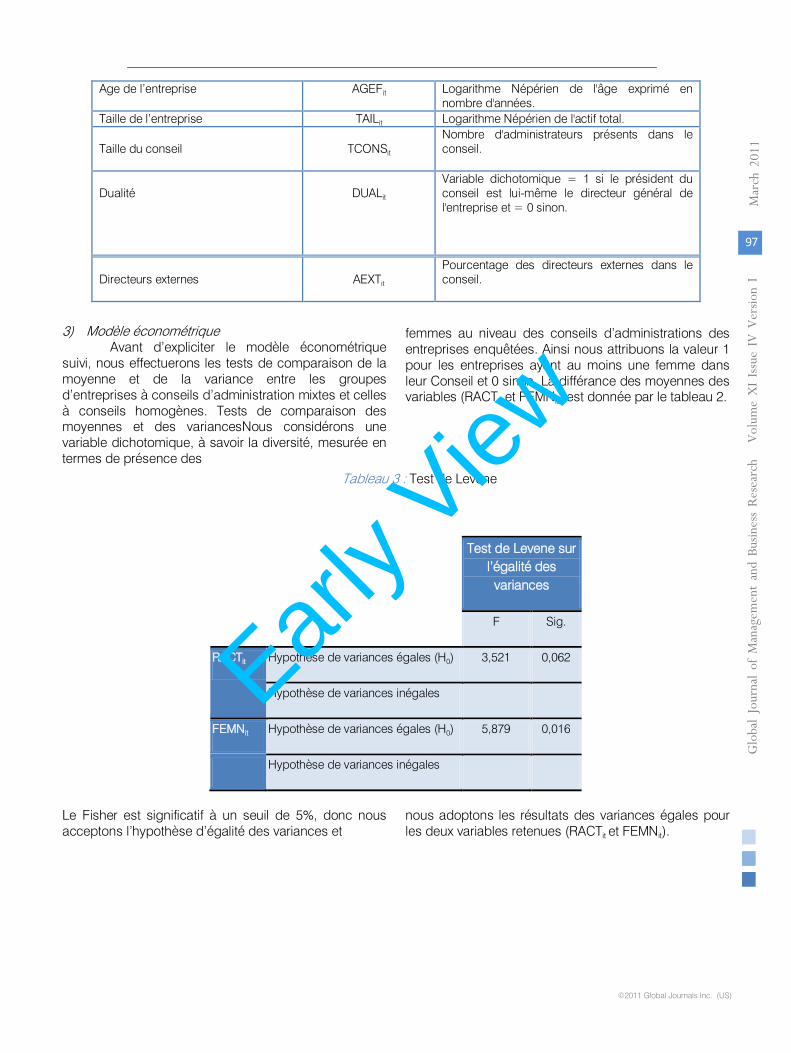
Age de l’entreprise
AGEFit
Logarithme Népérien de l'âge exprimé en nombre d'années.
Taille de l’entreprise
TAILit
Logarithme Népérien de l'actif total.
Taille du conseil
TCONSit
Nombre d'administrateurs présents dans le conseil.
Dualité
DUALit
Variable dichotomique = 1 si le président du conseil est lui-même le directeur général de l'entreprise et = 0 sinon.
Directeurs externes
AEXTit
Pourcentage des directeurs externes dans le conseil.
3) Modèle économétrique Avant d’expliciter le modèle économétrique
suivi, nous effectuerons les tests de comparaison de la moyenne et de la variance entre les groupes d’entreprises à conseils d’administration mixtes et celles à conseils homogènes. Tests de comparaison des moyennes et des variancesNous considérons une variable dichotomique, à savoir la diversité, mesurée en termes de présence des
femmes au niveau des conseils d’administrations des entreprises enquêtées. Ainsi nous attribuons la valeur 1 pour les entreprises ayant au moins une femme dans leur Conseil et 0 sinon. La différance des moyennes des variables (RACTit et FEMNit) est donnée par le tableau 2.
Tableau 3 : Test de Levene
Test de Levene sur l’égalité des variances
F Sig.
RACTit Hypothèse de variances égales (H0) 3,521 0,062
Hypothèse de variances inégales
FEMNit Hypothèse de variances égales (H0) 5,879 0,016
Hypothèse de variances inégales
Le Fisher est significatif à un seuil de 5%, donc nous acceptons l’hypothèse d’égalité des variances et
nous adoptons les résultats des variances égales pour les deux variables retenues (RACTit et FEMNit).
97
Globa
l Jo
urna
l of M
anag
emen
t an
d Bu
sine
ss R
esea
rch
Volum
e XI Issu
e IvvvvV
Version
I
March
201
1
©2011 Global Journals Inc. (US)
Diversité Genre dans le Conseil d’Administration et Performance des Entreprises Tunisiennes Cotées
Early V
iew
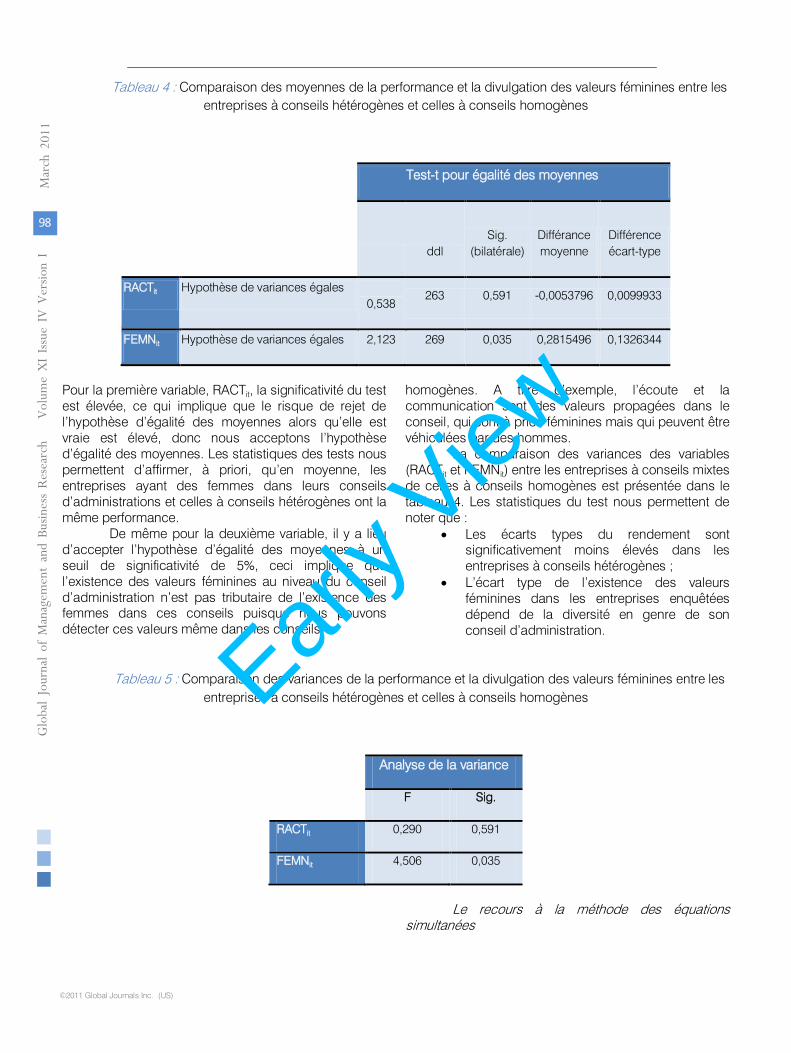
©2011 Global Journals Inc. (US)
Tableau 4 : Comparaison des moyennes de la performance et la divulgation des valeurs féminines entre les entreprises à conseils hétérogènes et celles à conseils homogènes
Test-t pour égalité des moyennes
ddl Sig.
(bilatérale) Différance moyenne
Différence écart-type
RACTit Hypothèse de variances égales 0,538
263 0,591 -0,0053796 0,0099933
FEMNit Hypothèse de variances égales 2,123 269 0,035 0,2815496 0,1326344
Pour la première variable, RACTit, la significativité du test est élevée, ce qui implique que le risque de rejet de l’hypothèse d’égalité des moyennes alors qu’elle est vraie est élevé, donc nous acceptons l’hypothèse d’égalité des moyennes. Les statistiques des tests nous permettent d’affirmer, à priori, qu’en moyenne, les entreprises ayant des femmes dans leurs conseils d’administrations et celles à conseils hétérogènes ont la même performance.
De même pour la deuxième variable, il y a lieu d’accepter l’hypothèse d’égalité des moyennes à un seuil de significativité de 5%, ceci implique que l’existence des valeurs féminines au niveau du conseil d’administration n’est pas tributaire de l’existence des femmes dans ces conseils puisque nous pouvons détecter ces valeurs même dans les conseils
homogènes. A titre d’exemple, l’écoute et la communication sont des valeurs propagées dans le conseil, qui sont à priori féminines mais qui peuvent être véhiculées par des hommes.
La comparaison des variances des variables (RACTit et FEMNit) entre les entreprises à conseils mixtes de celles à conseils homogènes est présentée dans le tableau 4. Les statistiques du test nous permettent de noter que :
• Les écarts types du rendement sont significativement moins élevés dans les entreprises à conseils hétérogènes ;
• L’écart type de l’existence des valeurs féminines dans les entreprises enquêtées dépend de la diversité en genre de son conseil d’administration.
Tableau 5 : Comparaison des variances de la performance et la divulgation des valeurs féminines entre les entreprises à conseils hétérogènes et celles à conseils homogènes
Analyse de la variance
F Sig.
RACTit 0,290 0,591
FEMNit 4,506 0,035
Le recours à la méthode des équations
simultanées
98
March
201
1 Globa
l Jo
urna
l of M
anag
emen
tan
d Bu
sine
ss R
esea
rch
Volum
e XI Issu
e IV
Ver
sion
IDiversité Genre dans le Conseil d’Administration et Performance des Entreprises Tunisiennes Cotées
Early V
iew
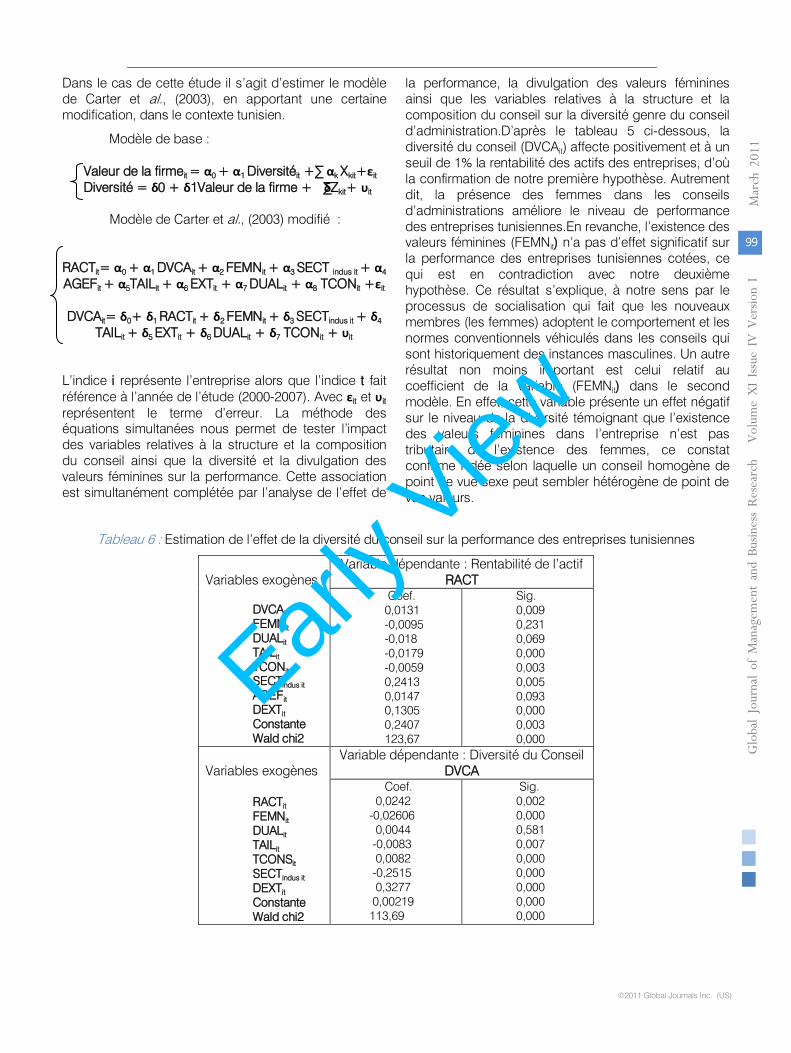
Dans le cas de cette étude il s’agit d’estimer le modèle de Carter et al., (2003), en apportant une certaine modification, dans le contexte tunisien.
Modèle de base :
Valeur de la firmeit = α0 + α1 Diversitéit +∑ αk Xkit+εit
Diversité = δ0 + δ1Valeur de la firme + ∑δZkit+ υit
Modèle de Carter et al., (2003) modifié :
RACTit= α0 + α1 DVCAit + α2 FEMNit + α3 SECT indus it + α4
AGEFit + α5TAILit + α6 EXTit + α7 DUALit
+ α8 TCONit
+εit
DVCAit= δ0+ δ1 RACTit + δ2 FEMNit + δ3 SECTindus it + δ4
TAILit + δ5 EXTit + δ6 DUALit
+ δ7 TCONit
+ υit
L’indice i représente l’entreprise alors que l’indice t fait référence à l’année de l’étude (2000-2007). Avec εit
et υit
représentent le terme d’erreur. La méthode des équations simultanées nous permet de tester l’impact des variables relatives à la structure et la composition du conseil ainsi que la diversité et la divulgation des valeurs féminines sur la performance. Cette association est simultanément complétée par l’analyse de l’effet de
la performance, la divulgation des valeurs féminines ainsi que les variables relatives à la structure et la composition du conseil sur la diversité genre du conseil d’administration.D’après le tableau 5 ci-dessous, la diversité du conseil (DVCAit) affecte positivement et à un seuil de 1% la rentabilité des actifs des entreprises, d’où la confirmation de notre première hypothèse. Autrement dit, la présence des femmes dans les conseils d’administrations améliore le niveau de performance des entreprises tunisiennes.En revanche, l’existence des valeurs féminines (FEMNit) n’a pas d’effet significatif sur la performance des entreprises tunisiennes cotées, ce qui est en contradiction avec notre deuxième hypothèse. Ce résultat s’explique, à notre sens par le processus de socialisation qui fait que les nouveaux membres (les femmes) adoptent le comportement et les normes conventionnels véhiculés dans les conseils qui sont historiquement des instances masculines. Un autre résultat non moins important est celui relatif au coefficient de la variable (FEMNit) dans le second modèle. En effet, cette variable présente un effet négatif sur le niveau de la diversité témoignant que l’existence des valeurs féminines dans l’entreprise n’est pas tributaire de l’existence des femmes, ce constat confirme l’idée selon laquelle un conseil homogène de point de vue sexe peut sembler hétérogène de point de vue valeurs.
Tableau 6 : Estimation de l’effet de la diversité du conseil sur la performance des entreprises tunisiennes
Variables exogènes
DVCAit FEMNit DUALit
TAILit
TCONit
SECTindus it
AGEFit
DEXTit
Constante Wald chi2
Variable dépendante : Rentabilité de l’actif RACT
Coef. 0,0131 -0,0095 -0,018 -0,0179 -0,0059 0,2413 0,0147 0,1305 0,2407 123,67
Sig. 0,009 0,231 0,069 0,000 0,003 0,005 0,093 0,000 0,003 0,000
Variables exogènes
RACTit FEMNit
DUALit
TAILit
TCONSit
SECTindus it
DEXTit
Constante Wald chi2
Variable dépendante : Diversité du Conseil DVCA
Coef. 0,0242 -0,02606 0,0044 -0,0083 0,0082 -0,2515 0,3277 0,00219 113,69
Sig. 0,002 0,000 0,581 0,007 0,000 0,000 0,000 0,000 0,000
99
Globa
l Jo
urna
l of M
anag
emen
t an
d Bu
sine
ss R
esea
rch
Volum
e XI Issu
e IvvvvV
Version
I
March
201
1
©2011 Global Journals Inc. (US)
Diversité Genre dans le Conseil d’Administration et Performance des Entreprises Tunisiennes Cotées
Early V
iew
La variable dualité (DUALit) affecte négativement le niveau de performance mesuré en termes de rendement des actifs, ce résultat converge avec celui de Daily et Dalton (1994); Brickley et al. (1997) et Goyal et Park (2006) alors que son impact sur le niveau de diversité du conseil apparaît non significatif ce qui diverge avec les résultats de Carter et al. (2008). Ainsi, nous constatons qu’avoir des femmes dans le conseil ne dépend pas du statut du Pdg ni de celui du président du conseil d’administration mais d’autres facteurs que nous allons cerner dans ce qui suit. Nous constatons qu’une taille élevée de l’entreprise affecte négativement la performance des entreprises cotées. Quant à son effet sur la diversité du conseil, il apparaît que les entreprises de grandes tailles ne s’intéressent pas au recrutement des femmes dans leurs conseils. Ces grandes entreprises sont généralement dominées par des hommes qui sont souvent réticents au recrutement des femmes, notamment dans leurs conseils. Quant à la taille du conseil, les résultats montrent que les entreprises dont la taille du conseil est élevée sont les moins performantes, ce résultat s’aligne avec les travaux de Hermalin et Weisbach (2003). En ce qui concerne son impact sur la diversité, celui-ci apparaît positif et significatif, les conseils à taille importante peuvent se permettre d'avoir plus de diversité parmi leurs administrateurs (Klein, 2002; Luoma et Goodstein, 1999) et ceci dans le but de recherche de nouvelles idées et de nouvelles perspectives qui ne sont pas fournies par les hommes.Outre l’influence de ces différentes variables, le secteur industriel apparaît plus performant et moins recrutant des femmes. En effet, les entreprises opérant dans le secteur industriel mobilisent des actifs plus que le secteur des services qui leurs permettent de réaliser plus de profit. En revanche, ce secteur demeure réticent quant au recrutement des femmes au niveau du conseil. Le secteur industriel ne permet pas une entrée massive des femmes au niveau du conseil. Il semble alors que ce secteur présente des caractéristiques telles que le risque et la fatigue qui ne s’adaptent pas avec les capacités des femmes. En ce qui concerne l’effet des administrateurs externes, ceux-ci affectent positivement et significativement outre le niveau de performance, le pourcentage des femmes existantes dans le conseil.
IV. CONCLUSION
Dans le cadre de cet article, nous nous sommes intéressés à l’impact de l’existence des femmes et des valeurs féminines au niveau du conseil d’administration sur la performance des entreprises en plus de l’examen de la relation mutuelle qui existe entre la rentabilité de l’actif et la diversité des conseils. La revue de la littérature théorique met l’accent sur la nécessite des valeurs féminines telles que l’encouragement de la participation, le partage du
pouvoir et de l’information Afin d’illustrer ces différents apports théoriques, nous avons présenté une synthèse des investigations empiriques qui cherchent à cerner l’impact de la diversité sur la performance de l’entreprise. Les résultats trouvées sont divergents et n’ont pas abouti à un consensus quant à l’amélioration ou à la détérioration de la valeur de l’entreprise suite à la diversification ou non de son conseil d’administration. L’analyse menée dans le contexte tunisien indique que l’amélioration de la performance des entreprises tunisiennes peut être attribuée à la diversité de leurs conseils d’administration. Nous avons pu détecter un effet positif de la diversité en termes de genre (sexe) mais par contre, un effet négatif en termes de valeurs féminines. En outre, nous avons pu détecter que la présence des femmes dans les conseils d’administration des entreprises est tributaire de certains facteurs tels que la performance passée de l’entreprise, la taille du conseil ainsi que le pourcentage des administrateurs externes siégeant dans le conseil. Nous militons en faveur de la nécessité d’intégrer la variable diversité genre parmi les attributs traditionnels d’un conseil d’administration efficace au même titre que l’indépendance du conseil ou de son engagement. Elle constitue à notre sens un véritable attribut de gouvernance.
BIBLIOGRAPHIE
1) ADAMS, R.B, and FERREIRA, D, 2009, “Women in the boardroom and their impact on governance and performance”, Journal of Financial Economics, Vol.94, pp.291-309.
2) ADAMS, R.B, and FERREIRA, D, 2007, “A theory of friendly boards”, Journal of Finance, Vol.62, pp.217-250.
3) ADAMS, R, and FERREIRA, D, 2004, “Diversity and incentives in teams: Evidence from corporate boards”, Working paper from Stockholm School of Economics.
4) ADAMS, R, FERREIRA, D, 2003, “Diversity and incentives: evidence from corporate boards”, Working Paper, University of Stockholm.
5) AGRAWAL, A, KNOEBER, C, 2001, “Do some outside directors play a political role?” Journal of Law and Economics, Vol. 44, pp. 179–198.
6) BRICKLEY, J.A, JEFFREY L.C, and GREGG, J, 1997, “Leadership structure: Separating the CEO and chairman of the board”, Journal of Corporate Finance, Vol.3, pp.189-220.
7) CARTER, D.A, SIMKINS, B.J. and SIMPSON, W.G, 2003, “Corporate governance, board diversity, and firm value”, The Financial Review, Vol.38, pp.33-53.
8) CARTER, D.A, D'SOUZA, F, SIMKINS, B.J, and SIMPSON, W.G, 2008, “The diversity of
100
March
201
1 Gl oba
l Jo
urna
l of M
anag
emen
tan
d Bu
sine
ss R
esea
rch
Volum
e XI Issu
e IV
Ver
sion
I
©2011 Global Journals Inc. (US)
Diversité Genre dans le Conseil d’Administration et Performance des Entreprises Tunisiennes Cotées
Early V
iew
corporate board committees and financial performance”, Working Paper.
9) FARELL, K.A. and HERSCH, P, 2005, “Additions to corporate boards: the effect of gender”, Journal of Corporate Finance, Vol.11, pp.85-106.
10) FRANCOEUR, C, LABELLE, R, and SNCLAIR-DESGAGNE, B, 2008, « Gender diversity in corporate governance and Top management », Journal of Business Ethics, Vol. 81, pp.83-95.
11) GOYAL, V.K and PARK, C.W, 2006, “Board leadership structure and CEO turnover”, Journal of Corporate Finance, Vol.8, pp.49-66.
12) HERMALIN, B.E, and WEISBACH, M.S, 2003, “Boards of directors as an endogenously determined institution: A survey of the economic literature”. Economic Policy Review, Vol.9, pp.7-26.
13) KANG, E, DING, D.K, CHAROENWONG, C, 2009, “Investor reaction to women directors”, Journal of Business Research, (fortcoming).
14) KLEIN, A, 2002, “Economic determinants of audit committee independence”, The Accounting Review, Vol.77, pp.435-452.
15) LUOMA, P, and GOODSTEIN, J, 1999, “Stakeholders and corporate boards: institutional influences on board composition, research note”, Academy of Management Journal, Vol.42, pp.553-563.
16) ROSE, C, 2007, “Does female board representation influence firm performance? The Danish evidence”, Corporate Governance, Vol.15, N°2, pp.404-413.
17) SINGH, V, TERJESEN, S, VINNICOMBE, S, 2008, “Newly appointed directors in the boardroom: How do women and men differ?”, European Management Journal, Vol. 26, pp.48-58.
18) VAN DER WALT, N, and INGLEY, C, 2003, “Board dynamics and the influence of professional background, gender and ethnic diversity of directors”, Corporate Governance: An International Review, Vol.11, pp.218-234.
19) Williamson, O.E. (1988), “Corporate Finance and Corporate Governance”, Journal of Finance, Vol.43, pp.567-592.
101
Globa
l Jo
urna
l of M
anag
emen
t an
d Bu
sine
ss R
esea
rch
Volum
e XI Issu
e IvvvvV
Version
I
March
201
1
©2011 Global Journals Inc. (US)
Diversité Genre dans le Conseil d’Administration et Performance des Entreprises Tunisiennes Cotées
Early V
iew
Related Documents