Journal of Anxiety Disorders 24 (2010) 715–722 Contents lists available at ScienceDirect Journal of Anxiety Disorders The Dutch Claustrophobia Questionnaire: Psychometric properties and predictive validity Ilse Van Diest a,∗ , Dirk Smits a,b , Davina Decremer a , Lori Maes a , Laurence Claes a a Department of Psychology, University of Leuven, Tiensestraat 102, B-3000 Leuven, Belgium b HUB, Campus Nieuwland, Nieuwland 198, 1000 Brussels, Belgium article info Article history: Received 3 December 2009 Received in revised form 10 May 2010 Accepted 11 May 2010 Keywords: Fear of suffocation Fear of restriction Claustrophobia fear Exposure Hyperventilation abstract Fear of suffocation and fear of restriction are thought to underlie claustrophobia and can be assessed with the Claustrophobia Questionnaire (CLQ; Radomsky et al., 2001). A first study tested the psychometric properties of a Dutch version of the CLQ. Students (N = 363) completed a Dutch translation of the CLQ and a set of other questionnaires assessing other specific fears, anxiety or depression. Results confirmed the two-factor structure and showed that the Dutch version of the CLQ has good psychometric properties. A second study tested the predictive validity of the Dutch CLQ. Participants (N = 23) were exposed each to nine claustrophobic situations with elements of suffocation, restriction or both. The Dutch CLQ was found to be a significant predictor of fear and respiratory reactivity during claustrophobic exposure. It can be concluded that the Dutch version of the CLQ is a reliable and valid instrument to assess claustrophobic fear. © 2010 Elsevier Ltd. All rights reserved. Claustrophobia, the fear of enclosed spaces, is a rather common specific phobia with a prevalence of 4% in the general population (Öst, 2007). Two major fear components are assumed to underlie the disorder: fear of restriction and fear of suffocation (Rachman & Taylor, 1993). Restriction is aversive and the fear experienced by claustrophobic patients in an enclosed space may, from an evolutionary perspective, resemble the fear that animals display when they cannot escape from a (potentially) dangerous situation (Rachman, 1997). This fear of restriction is not entirely independent from the other claustrophobic fear component, fear of suffocation. Because people need a constant supply of air to stay alive, possi- bility of getting an insufficient amount of air is a prominent threat. Following Rachman (1997), fear of suffocation will arise when (a) people think that there is insufficient air supply in the room, (b) access to air is hampered or interrupted externally, e.g., by breath- ing through a mask, and (c) there is sufficient air present in the room, but the air is thought to be blocked by a physiological mal- function, for example insufficient airflow through the trachea. Also a misinterpretation of bodily signals may trigger fear of suffocation (Rachman, 1997). The two-dimensional structure of claustrophobia was con- firmed by Rachman and Taylor back in 1993 (Rachman & Taylor, ∗ Corresponding author at: Research Group on Health Psychology, Psychology Department, University of Leuven, Tiensestraat 102, Box 3726, 3000 Leuven, Belgium. Tel.: +32 16 32 60 29; fax: +32 16 32 59 23. E-mail address: [email protected] (I. Van Diest). 1993). Participants were asked how much fear they would experience in each of 36 claustrophobic situations. A principal component analysis confirmed that two factors, interpreted as fear of restriction and fear of suffocation, were underlying self- reported claustrophobic fear. Based on this study, Rachman and Taylor (1993) developed the ‘The Claustrophobia Questionnaire’ (CLQ). Radomsky, Rachman, Thordarson, McIsaac, and Teachman (2001) further developed the CLQ and reduced it to 26 items. They applied a principal component analysis with direct oblimin rota- tion, resulting in a two-factor solution with 26 items, 14 items for the suffocation scale and 12 items for the restriction scale. Both factors were moderately correlated (r = .53) and accounted for 44% of the total variance in self-reported fear. Also normative data, internal consistency, discriminant validity and test-retest reliabil- ity of the 26-item CLQ were investigated. Radomsky et al. (2001) concluded that the CLQ has strong psychometric properties: it dis- criminates between healthy and claustrophobic individuals, it has a good internal consistency with Cronbach ˛s of .95, .85 and .96 for the CLQ total score, the suffocation scale and the restriction scale, respectively, and the test-retest reliability is high (r = .89 for the suf- focation scale, r = .77 for the restriction scale and r = .89 for the total CLQ). Finally, they showed that the CLQ predicts subjective fear, bodily sensations, and apprehensive cognitions during exposure to a small enclosed space. Also several other studies have confirmed the predictive validity of the CLQ (e.g., Harris, Robinson, & Menzies, 1999; McGlynn, Karg, & Lawyer, 2003; McGlynn, Smitherman, Hammel, & Lazarte, 2007; McIsaac, Thordarson, Shafran, Rachman, & Poole, 1998). 0887-6185/$ – see front matter © 2010 Elsevier Ltd. All rights reserved. doi:10.1016/j.janxdis.2010.05.003

Welcome message from author
This document is posted to help you gain knowledge. Please leave a comment to let me know what you think about it! Share it to your friends and learn new things together.
Transcript
Tp
Ia
b
a
ARRA
KFFCEH
s(t&bew(fBbFpairfa(
fi
DB
0d
Journal of Anxiety Disorders 24 (2010) 715–722
Contents lists available at ScienceDirect
Journal of Anxiety Disorders
he Dutch Claustrophobia Questionnaire: Psychometric properties andredictive validity
lse Van Diesta,∗, Dirk Smitsa,b, Davina Decremera, Lori Maesa, Laurence Claesa
Department of Psychology, University of Leuven, Tiensestraat 102, B-3000 Leuven, BelgiumHUB, Campus Nieuwland, Nieuwland 198, 1000 Brussels, Belgium
r t i c l e i n f o
rticle history:eceived 3 December 2009eceived in revised form 10 May 2010ccepted 11 May 2010
a b s t r a c t
Fear of suffocation and fear of restriction are thought to underlie claustrophobia and can be assessed withthe Claustrophobia Questionnaire (CLQ; Radomsky et al., 2001). A first study tested the psychometricproperties of a Dutch version of the CLQ. Students (N = 363) completed a Dutch translation of the CLQ and
eywords:ear of suffocationear of restrictionlaustrophobia fearxposure
a set of other questionnaires assessing other specific fears, anxiety or depression. Results confirmed thetwo-factor structure and showed that the Dutch version of the CLQ has good psychometric properties. Asecond study tested the predictive validity of the Dutch CLQ. Participants (N = 23) were exposed each tonine claustrophobic situations with elements of suffocation, restriction or both. The Dutch CLQ was foundto be a significant predictor of fear and respiratory reactivity during claustrophobic exposure. It can beconcluded that the Dutch version of the CLQ is a reliable and valid instrument to assess claustrophobic
yperventilation fear.
Claustrophobia, the fear of enclosed spaces, is a rather commonpecific phobia with a prevalence of 4% in the general populationÖst, 2007). Two major fear components are assumed to underliehe disorder: fear of restriction and fear of suffocation (Rachman
Taylor, 1993). Restriction is aversive and the fear experiencedy claustrophobic patients in an enclosed space may, from anvolutionary perspective, resemble the fear that animals displayhen they cannot escape from a (potentially) dangerous situation
Rachman, 1997). This fear of restriction is not entirely independentrom the other claustrophobic fear component, fear of suffocation.ecause people need a constant supply of air to stay alive, possi-ility of getting an insufficient amount of air is a prominent threat.ollowing Rachman (1997), fear of suffocation will arise when (a)eople think that there is insufficient air supply in the room, (b)ccess to air is hampered or interrupted externally, e.g., by breath-ng through a mask, and (c) there is sufficient air present in theoom, but the air is thought to be blocked by a physiological mal-unction, for example insufficient airflow through the trachea. Also
misinterpretation of bodily signals may trigger fear of suffocationRachman, 1997).The two-dimensional structure of claustrophobia was con-
rmed by Rachman and Taylor back in 1993 (Rachman & Taylor,
∗ Corresponding author at: Research Group on Health Psychology, Psychologyepartment, University of Leuven, Tiensestraat 102, Box 3726, 3000 Leuven,elgium. Tel.: +32 16 32 60 29; fax: +32 16 32 59 23.
E-mail address: [email protected] (I. Van Diest).
887-6185/$ – see front matter © 2010 Elsevier Ltd. All rights reserved.oi:10.1016/j.janxdis.2010.05.003
© 2010 Elsevier Ltd. All rights reserved.
1993). Participants were asked how much fear they wouldexperience in each of 36 claustrophobic situations. A principalcomponent analysis confirmed that two factors, interpreted asfear of restriction and fear of suffocation, were underlying self-reported claustrophobic fear. Based on this study, Rachman andTaylor (1993) developed the ‘The Claustrophobia Questionnaire’(CLQ). Radomsky, Rachman, Thordarson, McIsaac, and Teachman(2001) further developed the CLQ and reduced it to 26 items. Theyapplied a principal component analysis with direct oblimin rota-tion, resulting in a two-factor solution with 26 items, 14 items forthe suffocation scale and 12 items for the restriction scale. Bothfactors were moderately correlated (r = .53) and accounted for 44%of the total variance in self-reported fear. Also normative data,internal consistency, discriminant validity and test-retest reliabil-ity of the 26-item CLQ were investigated. Radomsky et al. (2001)concluded that the CLQ has strong psychometric properties: it dis-criminates between healthy and claustrophobic individuals, it hasa good internal consistency with Cronbach ˛s of .95, .85 and .96 forthe CLQ total score, the suffocation scale and the restriction scale,respectively, and the test-retest reliability is high (r = .89 for the suf-focation scale, r = .77 for the restriction scale and r = .89 for the totalCLQ). Finally, they showed that the CLQ predicts subjective fear,bodily sensations, and apprehensive cognitions during exposure to
a small enclosed space. Also several other studies have confirmedthe predictive validity of the CLQ (e.g., Harris, Robinson, & Menzies,1999; McGlynn, Karg, & Lawyer, 2003; McGlynn, Smitherman,Hammel, & Lazarte, 2007; McIsaac, Thordarson, Shafran, Rachman,& Poole, 1998).
7 nxiety
ttasiZRBiplh(sbonpite
sCtps
1
e
1
1
(camB
1
tphtn
112fia
1DqaBcp
16 I. Van Diest et al. / Journal of A
However, only a limited number of studies have addressedhe question whether the suffocation and restriction scales ofhe CLQ can differentially predict fear experienced in restrictionnd suffocation situations, respectively. Whereas several studieshow that the suffocation scale is predictive of anxious respond-ng to laboratory challenges inducing breathlessness (e.g., Eifert,volensky, Sorrell, Hopko, & Lejuez, 1999; Eke & McNally, 1996;assovsky, Kushner, Schwarze, & Wangensteen, 2000; Shipherd,eck, & Ohtake, 2001) less is known on the specific predictive valid-
ty of the restriction scale. In a study by Van Diest et al. (2005)articipants completed a Dutch ad-hoc translation of six items
oading high on the restriction scale and six other items loadingigh on the suffocation scale of the English version of the CLQRadomsky et al., 2001). Next, participants had to imagine threetandardized fear scripts, one depicting a situation with aspects ofoth restriction and risk of suffocation, one referring to restrictionnly, and one referring to neither claustrophobic fear compo-ents. Interestingly, participants’ scores on the restriction scaleredicted subjective fear, but not respiratory reactivity to imag-
ned restriction; scores on the suffocation scale were not relatedo self-reported fear or respiratory reactivity during the imaginedxposure.
The present studies aimed to (a) develop a validated Dutch ver-ion of the CLQ and (b) further explore the predictive validity of theLQ. In particular, we aimed to address the question to what extenthe restriction and the suffocation scales of the Dutch CLQ allow forrediction of actual fear and respiratory reactivity in claustrophobicituations with or without restriction and/or risk of suffocation.
. Study 1: Validation of the Dutch CLQ
The first study aimed to develop a Dutch version of Radomskyt al.’s (2001) Claustrophobia Questionnaire.
.1. Method
.1.1. ParticipantsParticipants were 371 undergraduate, Dutch-speaking students
282 women) aged 18–23 years old. They all received courseredit in return for their participation. All participants providedn informed consent. The study was approved by the Ethics Com-ittee of the Department of Psychology (University of Leuven,
elgium).
.1.2. ProcedureThe English CLQ was translated and back-translated several
imes until agreement was reached among three Dutch-speakingersons with a profound knowledge of English. Next, during two 1-group sessions one week apart, participants completed the Dutch
ranslation of the CLQ once, as well as a series of other question-aires (see below).
.1.3. Measures
.1.3.1. The Claustrophobia Questionnaire (CLQ; Radomsky et al.,001). Participants had to rate the 26 claustrophobic items on ave-point scale ranging from 0 (not at all anxious) to 4 (extremelynxious).
.1.3.2. The Beck Depression Inventory-II-NL (BDI-II-NL; van derroes, 2002). The BDI-II (Beck, Steer, & Brown, 1996) is a fre-
uently used questionnaire to measure self-experienced cognitivend somatic symptoms of depression. The Dutch translation of theDI-II, the BDI-II-NL has good psychometric qualities. The internalonsistency is high with Cronbach ˛s of .92 and .88 for a patientopulation and a control population, respectively. Also the test-Disorders 24 (2010) 715–722
retest reliability (r = .82) and the convergent validity are good (vander Droes, 2002). Cronbach ˛ in our sample of students was .88.
1.1.3.3. The Dutch NEO Five-Factor Inventory (NEO-FFI-NL; Hoekstra,Ormel, & De Fruyt, 1996). The Dutch version of the NEO-FFI(NEO-FFI-NL) contains 60 questions assessing the big five person-ality traits, Neuroticism (NEO-FFI-NL-N), Extraversion, Opennessto experience, Altruism and Conscientiousness. For the presentstudy, only scores on Neuroticism were investigated. This subscaleobtained a Cronbach � of .86 in our sample.
1.1.3.4. Spielberger’s State-Trait Anxiety Inventory (STAI; Spielberger,1983). Barenes, Harp, and Jung (2002) reviewed 816 papers inwhich the STAI was used to measure trait and state anxiety. Theyreport a mean internal consistency of .91 and .89 for the state andtrait subscales, respectively. The mean of the test-retest reliabilitywas .70 for the state and .88 for the trait subscale. van der Ploeg(2000) translated the STAI into Dutch. He reported Cronbach ˛s of.92 (state) and .90 (trait). Cronbach ˛ in our student sample was .82.
1.1.3.5. Anxiety Sensitivity Index-3 (ASI-3; Taylor et al., 2007). TheASI-3 is a multidimensional measurement of anxiety sensitivity. Itencompasses three factors: Physical Concerns, Cognitive Concerns,and Social Concerns. The validation study of the Dutch versiondemonstrated a good validity of the factor structure, as well as agood internal consistency for each of the three scales (Cronbach ˛swere .80 for Physical Concerns, .81 for Cognitive Concerns, and .76for Social Concerns; Taylor et al., 2007). Cronbach ˛ for the totalscale in our student sample was .83.
1.1.3.6. Fear of Pain Questionnaire-III (FPQ-III; McNeil & Rainwater,1998). The FPQ-III consists of 30 items related to the fear of severepain, minor pain, and medical pain. These factors accounted for51% of total variance. The scales of the questionnaire are internallyconsistent with Cronbach ˛s of .88, .87, .87, and .92 for the threesubscales and the total scale, respectively. The test-retest reliabilityis also good with correlations of .69, .73, .76, and .74 for the threesubscales and the total scale, respectively (McNeil & Rainwater,1998). Roelofs, Peters, Deutz, Spijker, and Vlaeyen (2005) trans-lated this questionnaire into Dutch. They also found evidence forthe three subscales, severe pain, minor pain, and medical pain. Fora sample of first-year college students, they found Cronbach ˛s.93, .88, .86, and .88 for the total FPQ-III and the subscales, respec-tively. For a sample of first-year and higher-year college studentsthey found Cronbach ˛s 91, .89, .82, and .85 for the total FPQ-IIIand the subscales, respectively. They reported a moderate to goodtest-retest stability and a good convergent and predictive validity.Cronbach ˛ in our sample of students was .92 for the total FPQ-III.
1.1.3.7. The Claustrophobia Scale (CS; Öst, 2007). The claustrophobiascale consists of two scales: one scale measuring anxiety (CSA) andone scale assessing avoidance behavior (CSB). We translated bothscales ourselves, because no Dutch validated version is available.The English SC has a high reliability with Cronbach ˛s .97 and .81 forthe anxiety and avoidance subscales, respectively. In our translatedDutch version, the anxiety subscale had a Cronbach ˛ .89; Cronbach˛ for the avoidance subscale was .80.
1.1.3.8. Fear Survey Schedule-III (FSS-III; Wolpe & Lang, 1964). Thisquestionnaire assesses specific fears. Psychometric properties for a
Dutch version of the FSS-III have been described by Arindell (1980)and are good, with a Cronbach ˛ of .95. Cronbach ˛ for the totalscale in our sample was .97. Three items of the FSS-III involve claus-trophobic fear (FSS-III-CL), such as fear of ‘crowds,’ ‘being in anelevator,’ and ‘enclosed spaces.’ The other 73 items are classified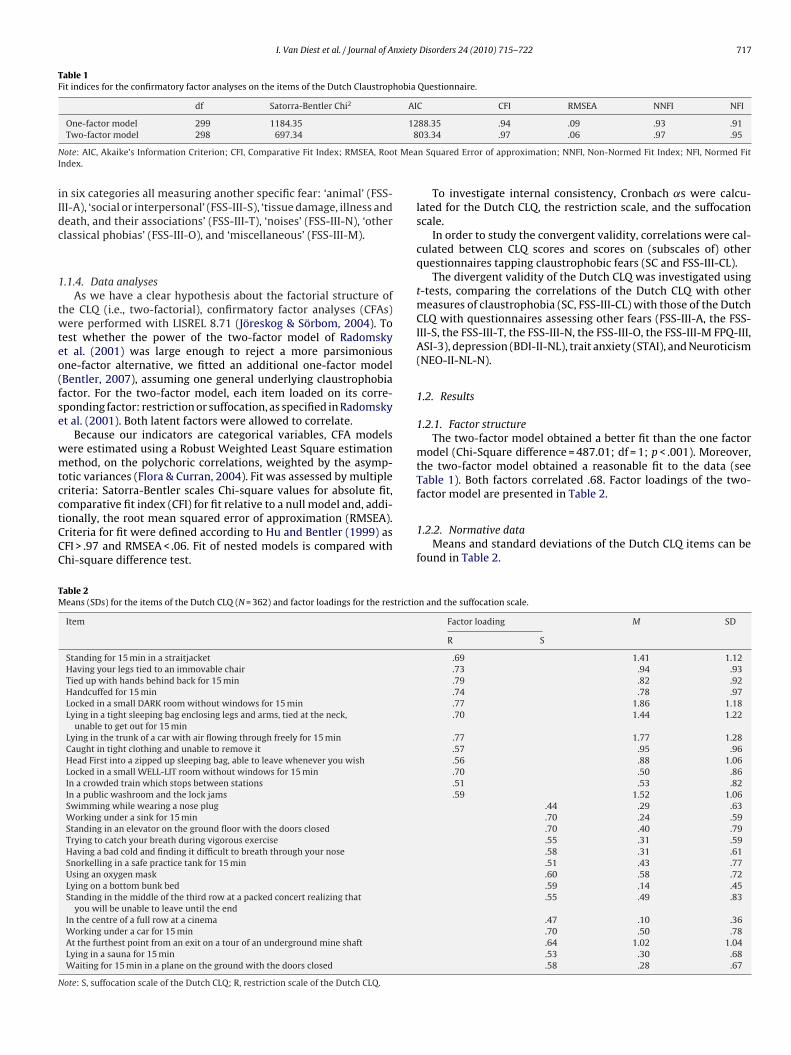
I. Van Diest et al. / Journal of Anxiety Disorders 24 (2010) 715–722 717
Table 1Fit indices for the confirmatory factor analyses on the items of the Dutch Claustrophobia Questionnaire.
df Satorra-Bentler Chi2 AIC CFI RMSEA NNFI NFI
128
N t MeaI
iIdc
1
twteo(fse
wmtcctCCC
TM
N
One-factor model 299 1184.35Two-factor model 298 697.34
ote: AIC, Akaike’s Information Criterion; CFI, Comparative Fit Index; RMSEA, Roondex.
n six categories all measuring another specific fear: ‘animal’ (FSS-II-A), ‘social or interpersonal’ (FSS-III-S), ‘tissue damage, illness andeath, and their associations’ (FSS-III-T), ‘noises’ (FSS-III-N), ‘otherlassical phobias’ (FSS-III-O), and ‘miscellaneous’ (FSS-III-M).
.1.4. Data analysesAs we have a clear hypothesis about the factorial structure of
he CLQ (i.e., two-factorial), confirmatory factor analyses (CFAs)ere performed with LISREL 8.71 (Jöreskog & Sörbom, 2004). To
est whether the power of the two-factor model of Radomskyt al. (2001) was large enough to reject a more parsimoniousne-factor alternative, we fitted an additional one-factor modelBentler, 2007), assuming one general underlying claustrophobiaactor. For the two-factor model, each item loaded on its corre-ponding factor: restriction or suffocation, as specified in Radomskyt al. (2001). Both latent factors were allowed to correlate.
Because our indicators are categorical variables, CFA modelsere estimated using a Robust Weighted Least Square estimationethod, on the polychoric correlations, weighted by the asymp-
otic variances (Flora & Curran, 2004). Fit was assessed by multipleriteria: Satorra-Bentler scales Chi-square values for absolute fit,
omparative fit index (CFI) for fit relative to a null model and, addi-ionally, the root mean squared error of approximation (RMSEA).riteria for fit were defined according to Hu and Bentler (1999) asFI > .97 and RMSEA < .06. Fit of nested models is compared withhi-square difference test.able 2eans (SDs) for the items of the Dutch CLQ (N = 362) and factor loadings for the restrictio
Item
Standing for 15 min in a straitjacketHaving your legs tied to an immovable chairTied up with hands behind back for 15 minHandcuffed for 15 minLocked in a small DARK room without windows for 15 minLying in a tight sleeping bag enclosing legs and arms, tied at the neck,
unable to get out for 15 minLying in the trunk of a car with air flowing through freely for 15 minCaught in tight clothing and unable to remove itHead First into a zipped up sleeping bag, able to leave whenever you wishLocked in a small WELL-LIT room without windows for 15 minIn a crowded train which stops between stationsIn a public washroom and the lock jamsSwimming while wearing a nose plugWorking under a sink for 15 minStanding in an elevator on the ground floor with the doors closedTrying to catch your breath during vigorous exerciseHaving a bad cold and finding it difficult to breath through your noseSnorkelling in a safe practice tank for 15 minUsing an oxygen maskLying on a bottom bunk bedStanding in the middle of the third row at a packed concert realizing that
you will be unable to leave until the endIn the centre of a full row at a cinemaWorking under a car for 15 minAt the furthest point from an exit on a tour of an underground mine shaftLying in a sauna for 15 minWaiting for 15 min in a plane on the ground with the doors closed
ote: S, suffocation scale of the Dutch CLQ; R, restriction scale of the Dutch CLQ.
88.35 .94 .09 .93 .9103.34 .97 .06 .97 .95
n Squared Error of approximation; NNFI, Non-Normed Fit Index; NFI, Normed Fit
To investigate internal consistency, Cronbach ˛s were calcu-lated for the Dutch CLQ, the restriction scale, and the suffocationscale.
In order to study the convergent validity, correlations were cal-culated between CLQ scores and scores on (subscales of) otherquestionnaires tapping claustrophobic fears (SC and FSS-III-CL).
The divergent validity of the Dutch CLQ was investigated usingt-tests, comparing the correlations of the Dutch CLQ with othermeasures of claustrophobia (SC, FSS-III-CL) with those of the DutchCLQ with questionnaires assessing other fears (FSS-III-A, the FSS-III-S, the FSS-III-T, the FSS-III-N, the FSS-III-O, the FSS-III-M FPQ-III,ASI-3), depression (BDI-II-NL), trait anxiety (STAI), and Neuroticism(NEO-II-NL-N).
1.2. Results
1.2.1. Factor structureThe two-factor model obtained a better fit than the one factor
model (Chi-Square difference = 487.01; df = 1; p < .001). Moreover,the two-factor model obtained a reasonable fit to the data (seeTable 1). Both factors correlated .68. Factor loadings of the two-factor model are presented in Table 2.
1.2.2. Normative dataMeans and standard deviations of the Dutch CLQ items can be
found in Table 2.
n and the suffocation scale.
Factor loading M SD
R S
.69 1.41 1.12
.73 .94 .93
.79 .82 .92
.74 .78 .97
.77 1.86 1.18
.70 1.44 1.22
.77 1.77 1.28
.57 .95 .96
.56 .88 1.06
.70 .50 .86
.51 .53 .82
.59 1.52 1.06.44 .29 .63.70 .24 .59.70 .40 .79.55 .31 .59.58 .31 .61.51 .43 .77.60 .58 .72.59 .14 .45.55 .49 .83
.47 .10 .36
.70 .50 .78
.64 1.02 1.04
.53 .30 .68
.58 .28 .67
718 I. Van Diest et al. / Journal of Anxiety
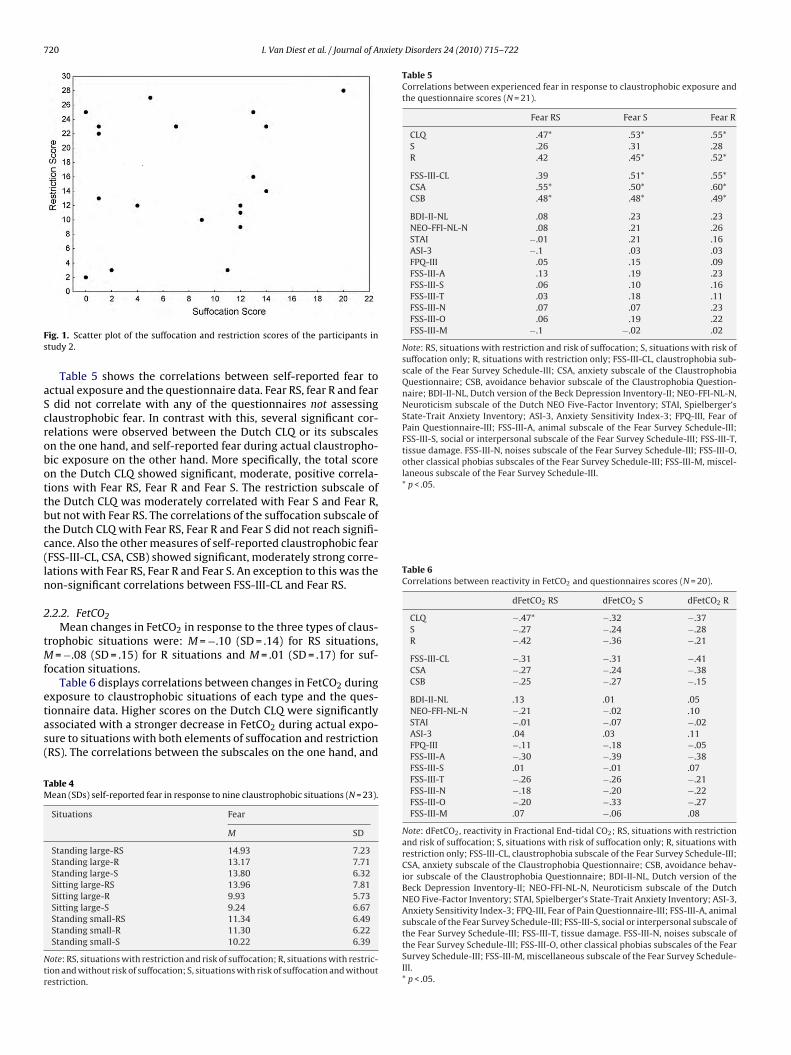
Table 3Correlations between the Dutch CLQ and other question-naires (N = 362).
Dutch CLQ
FSS-III-CL .61*CSA .73*CSB .55*
BDI-II-NL .35*NEO-FFI-NL-N .35*STAI .39*ASI-3 .39*FPQ-III .41*FSS-III-A .37*FSS-III-S .49*FSS-III-T .46*FSS-III-N .42*FSS-III-O .54*FSS-III-M .46*
Note: CLQ, Claustrophobia Questionnaire; FSS-III-CL,claustrophobia subscale of the Fear Survey Schedule-III;CSA, anxiety subscale of the Claustrophobia Ques-tionnaire; CSB, avoidance behavior subscale of theClaustrophobia Questionnaire; BDI-II-NL, Dutch versionof the Beck Depression Inventory-II; NEO-FFI-NL-N, Neu-roticism subscale of the Dutch NEO Five-Factor Inventory;STAI, Spielberger’s State-Trait Anxiety Inventory; ASI-3, Anxiety Sensitivity Index-3; FPQ-III, Fear of PainQuestionnaire-III; FSS-III-A, animal subscale of the FearSurvey Schedule-III; FSS-III-S, social or interpersonal sub-scale of the Fear Survey Schedule-III; FSS-III-T, tissuedamage. FSS-III-N, noises subscale of the Fear Survey
1
rr
1
3C(v
1
acoo
INtttO
tppItO
t
Schedule-III; FSS-III-O, other classical phobias subscalesof the Fear Survey Schedule-III; FSS-III-M, miscellaneoussubscale of the Fear Survey Schedule-III.* p < .05.
.2.3. Internal consistencyCronbach ˛ was .90 for the Dutch CLQ. For the subscales of
estriction and suffocation scale, Cronbach ˛s were .88 and .80,espectively.
.2.4. Convergent validityTable 3 displays the correlations between the Dutch CLQ and
other measures of self-reported claustrophobic fear. The DutchLQ correlated strongly with the FSS-III-CL (r = .61, p < .05), the CSAr = .73, p < .05) and the CSB (r = .55, p < .05), indicating a good con-ergent validity.
.2.5. Divergent validityGenerally, correlations between the Dutch CLQ and other tools
ssessing claustrophobic fear were significantly higher than theorrelations of the Dutch CLQ with questionnaires assessing fearsther than claustrophobia or with general measures of depressionr anxiety (see Table 3).
More specifically, the Dutch CLQ correlated higher with the FSS-II-CL than with the BDI-II-NL, t(304) = 5.11, p < .05, the NEO-FFI-L-N, t(304) = 4.85, p < .05, the STAI, t(304) = 4.17, p < .05, the ASI-3,
(304) = 4.29, p < .05, the FPQ-III, t(304) = 3.74, p < .05, the FSS-III-A,(304) = 4.40, p < .05, the FSS-III-S, t(304) = 2.66, p < .05, the FSS-III-T,(304) = 3.13, p < .05, the FSS-III-N, t(304) = 4.08, p < .05, the FSS-III-, t(304) = 1.69, p < .05, and the FSS-III-M, t(304) = 3.13, p < .05.
Similarly, the Dutch CLQ correlated more strongly with the CSAhan with the following questionnaires: BDI-II-NL, t(304) = 8.32,< .05, NEO-FFI-NL-N, t(304) = 8.06, p < .05, STAI, t(304) = 7.55,< .05, ASI-3, t(304) = 7.95, p < .05, FPQ-III, t(304) = 7.46, p < .05, FSS-
II-A, t(304) = 8.30, p < .05, FSS-III-S, t(304) = 6.51, p < .05, FSS-III-T,(304) = 7.03, p < .05, the FSS-III-N, t(304) = 8.15, p < .05, the FSS-III-, t(304) = 6.30, p < .05, and the FSS-III-M, t(304) = 7.17, p < .05.
In the same vein, correlations between the Dutch CLQ andhe CSB were significantly higher than correlations between the
Disorders 24 (2010) 715–722
Dutch CLQ and the BDI-II-NL, t(304) = 3.39, p < .05, the NEO-FFI-NL-N, t(304) = 3.39, p < .05, the STAI, t(304) = 2.79, p < .05, the ASI-3,t(304) = 2.93, p < .05, the FPQ-III, t(304) = 2.57, p < .05, the FSS-III-A,t(304) = 3.27, p < .05, the FSS-III-T, t(304) = 1.80, p < .05, the FSS-III-N, t(304) = 2.45, p < .05, and the FSS-III-M, t(304) = 1.77, p < .05. Thecorrelation between the Dutch CLQ and the SCB did not signifi-cantly differ from those between the Dutch CLQ and the FSS-III-Oand between the Dutch CLQ and the FSS-III-S.
2. Study 2: Predictive validity of the Dutch CLQ
The aim of the second study was to investigate to what extentthe Dutch CLQ and its subscales predict self-reported fear andrespiratory reactivity during actual exposure to different claustro-phobic situations. To this end, participants were exposed to nineclaustrophobic situations that varied with respect to the presenceor absence of elements of restriction and risk of suffocation. Wehypothesized that (a) the restriction scale would be the betterpredictor for reactivity to restriction situations without elementsreferring to risk of suffocation, (b) the suffocation scale would be thebetter predictor for reactivity to situations referring to risk of suffo-cation but without restriction, and (c) the total score on the DutchCLQ would predict fearful responding to all types of claustrophobicsituations.
2.1. Method
2.1.1. ParticipantsBased on the factor scores on fear of suffocation and fear of
restriction, which were calculated for each of the 362 participantsfrom study 1, 41 students scoring high for restriction or suffocation(not both) were invited for the experiment in a first wave. Becauseonly 8 participants could be recruited this way, all 362 participantsfrom study 1 were invited in a second wave. A total 23 students vol-unteered to participate in return for course credit or a fee of 7 Euro.Three of them were men. The study was approved by the ethicalcommission of Psychology Department of the University of Leuven.
2.1.2. Measures2.1.2.1. Subjective measures. Before entering each claustrophobicsituation, participants rated how fearful they expected to be in thatparticular situation (PRE). After exposure, participants rated theiraverage fear level during the exposure (POST) and during the mostfearful moment (PEAK). Each of these questions was rated on an 11-point Likert scale ranging from 0 (not at all fearful) to 10 (extremelyfearful).
2.1.2.2. Physiological measures. Cardio-respiratory activity wasmeasured continuously with the LifeShirt System (VivoMetrics,Inc., Ventura, CA), an ambulatory system using inductive plethys-mography and ECG. End-tidal CO2 was monitored using a nasalCO2-sampling cannula connected to an Oridion Microcap HandheldCapnograph, with a sampling flow rate of 50 ml/min. The monitoruses Microstream non-dispersive infrared (NDIR) spectroscopy tocontinuously measure the percentage of CO2 at the end of an expi-ration (FetCO2). FetCO2 is a good estimate of the level of CO2 inthe blood (Gardner, 1996). The CO2-signal was recorded using theVivologic software. End-tidal values for each breath were extractedoff-line with PSychoPHysiological Analysis (PSPHA – De Clerck,Verschuere, Crombez, & De Vlieger, 2006), a modular script-basedprogram which we further developed to perform such parameter
extraction. All waveforms were visually inspected off-line and tech-nical abnormalities and artifacts were eliminated using the PSPHAsoftware.The present paper will only report findings on FetCO2, becauseof two reasons. First, in contrast to parameters of heart rate and

nxiety
tvfBeihItbt(
2
lrfttfmtt
taitiatbcn(pPoi
rt
labsc
ia
rfis
l‘t
dst
I. Van Diest et al. / Journal of A
iming and volume components of the respiratory cycle, FetCO2aries not as a function of muscle activity and body position,or which the nine claustrophobic situations were not equalized.ecause blood gases of healthy humans are kept rather constant,ven under changing metabolic conditions, the end-tidal CO2 levels not expected to differ between situations where participantsave to stand, to sit down or to walk from one room to another.
n addition, FetCO2 is the most relevant indicator of hyperventila-ion, a situational respiratory stress response in which more CO2 isreathed out than is actually being produced by the body, leadingo a decreased pressure of CO2 in the blood and in the exhaled airVan Diest et al., 2001).
.1.3. ProcedureAfter providing their informed consent, participants put on the
ifeshirt and the nasal cannula. Following this, a 10 min baselineegistration of resting heart rate, respiration and FetCO2 was per-ormed. Next, the experimenter explained to the participants thathey would be asked to enter several particular situations and thathey would be asked to rate on a scale from 0 to 10 (1) how fear-ul they expected themselves to be in that situation (PRE), (2) the
aximum fear level they had experienced during actual exposureo the situation (PEAK), and (3) their average level of fear duringhe actual exposure (POST).
The nine claustrophobic situations were composed by crossingwo independent variables with three levels each. The first vari-ble (‘Situation’) referred to whether the claustrophobic exposurenvolved (a) standing in a large room (‘standing large’), (b) sit-ing on a chair in the large room (‘sitting large’), or (c) standingn a small room (‘standing small’). The second independent vari-ble referred to the claustrophobic fear that the situation intendedo evoke: (a) only restriction (‘R’), (b) only suffocation (‘S’), or (c)oth restriction and suffocation (‘RS’). Both variables were fullyrossed, yielding nine situations. Nine presentation orders for theseine situations were created in such a way that the same situationstanding large/sitting large/standing small) and the same claustro-hobic component (RS/R/S) were never presented twice in a row.articipants were counterbalanced across these nine presentationrders. Each situation lasted for 2 min, but participants were notnformed on this.
In situation ‘standing large-S’ participants had to stand in a largeoom (5.10 × 6.85 m, 3 m high) while wearing a face mask coveringheir nose and mouth and wearing a shawl around their neck.
In situation ‘standing large-R’ participants had to stand up in aocked dark closet that was placed in the large room. The closet hadsurface of 1 × 4 m, was 1.85 m high and had 30 visible holes in theack of the closet with a diameter of .5 cm. These holes aimed touggest a supply of ‘fresh air’ while the participant remained in theloset.
In situation ‘standing large-RS’ participants had to stay in a sim-lar, locked dark closet without such holes, suggesting that no freshir was available.
In situation ‘sitting large-R’ participants were sitting in the largeoom with their hands handcuffed behind their back and with theireet tied to the chair with a rope. In situation ‘sitting large-S’ partic-pants were wearing a mask covering their nose and mouth whileitting on a chair in the large room.
In situation ‘sitting large-RS’ participants were sitting down in aarge room while tied up to the chair in a similar ways as in situationsitting large-R.’ In addition, they were wearing a face mask covering
heir nose and mouth.In situation ‘standing small-R’ participants were locked up in aark, small room. A fan provided fresh air in the room. The room’surface was 220 × 90 cm and had a small kitchenette in the back;he height of the room was 270 cm.
Disorders 24 (2010) 715–722 719
In situation ‘standing small-S’ participants were standing in thesame small room, but now the room was unlocked, the fan wasremoved and they were wearing a neck supportive bandage.
In situation ‘standing small-RS’ participants were wearing aneck bracket and were locked up in the small room, without thefan.
Before entering each of the nine situations, participants receivedboth oral and written information about the specificities of situa-tion. For example, in situation ‘standing-RS’ participants were told“In a moment, you will enter this closet and we will lock you in withthis key. Next, we will leave the room. After a while, we will re-enterthe room to unlock the closet, so you can come out.” The same infor-mation was written down on a sheet, which they were asked to readafter the explanation by the experimenter. Then, participants wereasked to rate how much fear they expected to experience duringthe situation (PRE question). Following this, participants enteredthe situation for two minutes without knowing the duration of theexposure. After the exposure, participants completed the other fearratings (PEAK and POST). This procedure was repeated for each ofthe other eight situations. After the experiment the LifeShirt wasdisconnected and participants changed back into their own clothes.They received their course credit or money, were debriefed andthanked for their participation.
2.1.4. Analyses2.1.4.1. Subjective measurements. In order to reduce the amount ofdependent variables, a sum of the three fear scores (PRE, PEAK,and POST) was calculated for each situation and each participant.In a next step, these scores were averaged across the RS, R, andS situations for each participant, yielding three fear indexes perparticipant: fear in situations characterized by both claustrophobiccomponents (fear RS), fear in situations with only risk of suffocation(fear S), and fear in situations with only the restriction component(fear R). These fear indexes were correlated with each individual’sscores on the Dutch CLQ and its subscales (fear of restriction andfear of suffocation), as well as with the(sub)scores on all otherquestionnaires (FSS-III-CL, SCA, SCB, BDI-II-NL, NEO-II-NL-N, STAI,ASI-3, FPQ-III, FSS-III-A, FSS-III-S, FSS-III-T, FSS-III-N, FSS-III-O, andFSS-III-M).
2.1.4.2. Fractional end-tidal CO2 (FetCO2). FetCO2s of each breathwere averaged across each 2 min exposure for each participant. Themean FetCO2 during the 10 min baseline was subtracted from thesemean FetCO2s during each of the nine exposures, yielding an indexof reactivity in FetCO2 for each situation. These reactivity scores inFetCO2 were averaged across the three RS situations, the three Rsituations and the three S situations per participant. In a final step,these reactivity scores in FetCO2 were correlated with each individ-ual’s scores on the Dutch CLQ and its subscales (fear of restrictionand fear of suffocation), as well as with the (sub)scores of all otherquestionnaires (FSS-III-CL, SCA, SCB, BDI-II-NL, NEO-II-NL-N, STAI,ASI-3, FPQ-III, FSS-III-A, FSS-III-S, FSS-III-T, FSS-III-N, FSS-III-O, andFSS-III-M).
2.2. Results
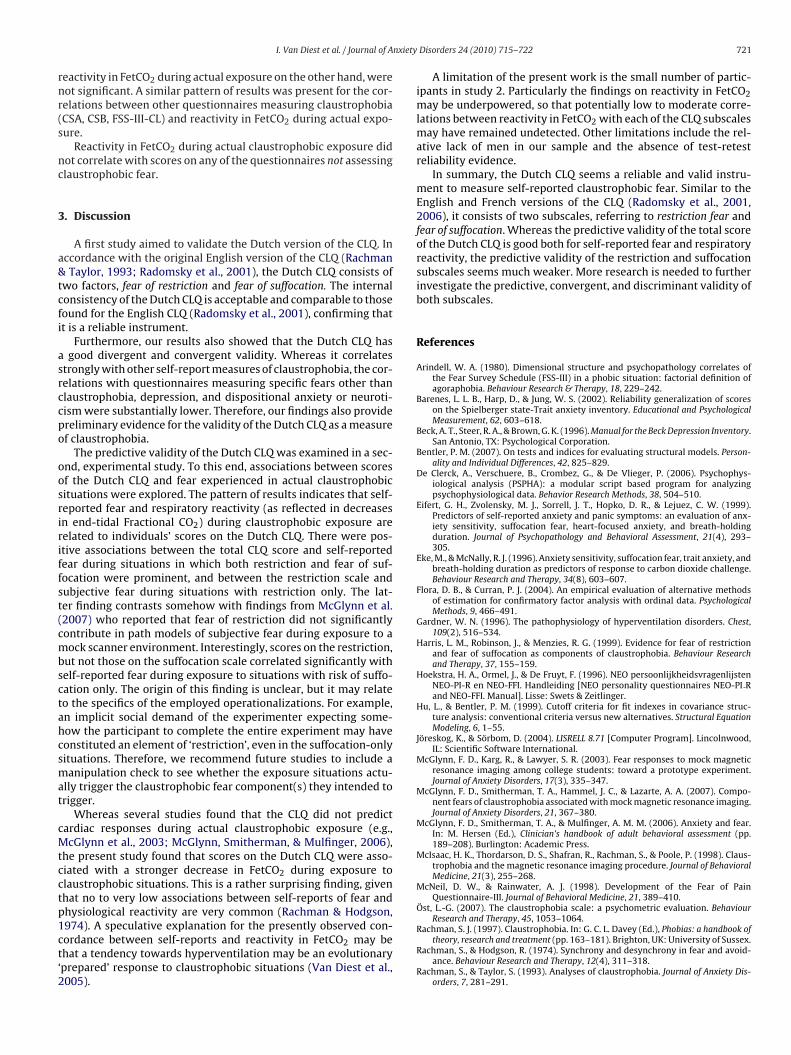
2.2.1. Self-reported fearMean scores of the participants on the Dutch CLQ and its
subscales as assessed in study 1 were: M = 23.24 (SD = 11.83)for the total score, M = 15.15 (SD = 8.83) for the restriction scaleand M = 7.55 (SD = 6.16) for the suffocation scale. The correlation
between both scales was not significant in this sample (r = .23,N = 21, see Fig. 1 for a scatter plot showing how participants weredistributed across both subscales).Table 4 displays the mean self-reported fear scores and standarddeviations for the nine claustrophobic situations.
720 I. Van Diest et al. / Journal of Anxiety Disorders 24 (2010) 715–722
Fs
aScrobottbtc(ln
2
tMf
etas(
TM
Ntr
Table 5Correlations between experienced fear in response to claustrophobic exposure andthe questionnaire scores (N = 21).
Fear RS Fear S Fear R
CLQ .47* .53* .55*S .26 .31 .28R .42 .45* .52*
FSS-III-CL .39 .51* .55*CSA .55* .50* .60*CSB .48* .48* .49*
BDI-II-NL .08 .23 .23NEO-FFI-NL-N .08 .21 .26STAI −.01 .21 .16ASI-3 −.1 .03 .03FPQ-III .05 .15 .09FSS-III-A .13 .19 .23FSS-III-S .06 .10 .16FSS-III-T .03 .18 .11FSS-III-N .07 .07 .23FSS-III-O .06 .19 .22FSS-III-M −.1 −.02 .02
Note: RS, situations with restriction and risk of suffocation; S, situations with risk ofsuffocation only; R, situations with restriction only; FSS-III-CL, claustrophobia sub-scale of the Fear Survey Schedule-III; CSA, anxiety subscale of the ClaustrophobiaQuestionnaire; CSB, avoidance behavior subscale of the Claustrophobia Question-naire; BDI-II-NL, Dutch version of the Beck Depression Inventory-II; NEO-FFI-NL-N,Neuroticism subscale of the Dutch NEO Five-Factor Inventory; STAI, Spielberger’sState-Trait Anxiety Inventory; ASI-3, Anxiety Sensitivity Index-3; FPQ-III, Fear ofPain Questionnaire-III; FSS-III-A, animal subscale of the Fear Survey Schedule-III;FSS-III-S, social or interpersonal subscale of the Fear Survey Schedule-III; FSS-III-T,tissue damage. FSS-III-N, noises subscale of the Fear Survey Schedule-III; FSS-III-O,other classical phobias subscales of the Fear Survey Schedule-III; FSS-III-M, miscel-laneous subscale of the Fear Survey Schedule-III.* p < .05.
Table 6Correlations between reactivity in FetCO2 and questionnaires scores (N = 20).
dFetCO2 RS dFetCO2 S dFetCO2 R
CLQ −.47* −.32 −.37S −.27 −.24 −.28R −.42 −.36 −.21
FSS-III-CL −.31 −.31 −.41CSA −.27 −.24 −.38CSB −.25 −.27 −.15
ig. 1. Scatter plot of the suffocation and restriction scores of the participants intudy 2.
Table 5 shows the correlations between self-reported fear toctual exposure and the questionnaire data. Fear RS, fear R and feardid not correlate with any of the questionnaires not assessing
laustrophobic fear. In contrast with this, several significant cor-elations were observed between the Dutch CLQ or its subscalesn the one hand, and self-reported fear during actual claustropho-ic exposure on the other hand. More specifically, the total scoren the Dutch CLQ showed significant, moderate, positive correla-ions with Fear RS, Fear R and Fear S. The restriction subscale ofhe Dutch CLQ was moderately correlated with Fear S and Fear R,ut not with Fear RS. The correlations of the suffocation subscale ofhe Dutch CLQ with Fear RS, Fear R and Fear S did not reach signifi-ance. Also the other measures of self-reported claustrophobic fearFSS-III-CL, CSA, CSB) showed significant, moderately strong corre-ations with Fear RS, Fear R and Fear S. An exception to this was theon-significant correlations between FSS-III-CL and Fear RS.
.2.2. FetCO2Mean changes in FetCO2 in response to the three types of claus-
rophobic situations were: M = −.10 (SD = .14) for RS situations,= −.08 (SD = .15) for R situations and M = .01 (SD = .17) for suf-
ocation situations.Table 6 displays correlations between changes in FetCO2 during
xposure to claustrophobic situations of each type and the ques-ionnaire data. Higher scores on the Dutch CLQ were significantlyssociated with a stronger decrease in FetCO2 during actual expo-ure to situations with both elements of suffocation and restrictionRS). The correlations between the subscales on the one hand, and
able 4ean (SDs) self-reported fear in response to nine claustrophobic situations (N = 23).
Situations Fear
M SD
Standing large-RS 14.93 7.23Standing large-R 13.17 7.71Standing large-S 13.80 6.32Sitting large-RS 13.96 7.81Sitting large-R 9.93 5.73Sitting large-S 9.24 6.67Standing small-RS 11.34 6.49Standing small-R 11.30 6.22Standing small-S 10.22 6.39
ote: RS, situations with restriction and risk of suffocation; R, situations with restric-ion and without risk of suffocation; S, situations with risk of suffocation and withoutestriction.
BDI-II-NL .13 .01 .05NEO-FFI-NL-N −.21 −.02 .10STAI −.01 −.07 −.02ASI-3 .04 .03 .11FPQ-III −.11 −.18 −.05FSS-III-A −.30 −.39 −.38FSS-III-S .01 −.01 .07FSS-III-T −.26 −.26 −.21FSS-III-N −.18 −.20 −.22FSS-III-O −.20 −.33 −.27FSS-III-M .07 −.06 .08
Note: dFetCO2, reactivity in Fractional End-tidal CO2; RS, situations with restrictionand risk of suffocation; S, situations with risk of suffocation only; R, situations withrestriction only; FSS-III-CL, claustrophobia subscale of the Fear Survey Schedule-III;CSA, anxiety subscale of the Claustrophobia Questionnaire; CSB, avoidance behav-ior subscale of the Claustrophobia Questionnaire; BDI-II-NL, Dutch version of theBeck Depression Inventory-II; NEO-FFI-NL-N, Neuroticism subscale of the DutchNEO Five-Factor Inventory; STAI, Spielberger’s State-Trait Anxiety Inventory; ASI-3,Anxiety Sensitivity Index-3; FPQ-III, Fear of Pain Questionnaire-III; FSS-III-A, animalsubscale of the Fear Survey Schedule-III; FSS-III-S, social or interpersonal subscale ofthe Fear Survey Schedule-III; FSS-III-T, tissue damage. FSS-III-N, noises subscale ofthe Fear Survey Schedule-III; FSS-III-O, other classical phobias subscales of the FearSurvey Schedule-III; FSS-III-M, miscellaneous subscale of the Fear Survey Schedule-III.* p < .05.
nxiety
rnr(s
nc
3
a&tcfi
asrccpo
oosririffst(cmbsctahcsmat
cMtcctp1ct‘2
I. Van Diest et al. / Journal of A
eactivity in FetCO2 during actual exposure on the other hand, wereot significant. A similar pattern of results was present for the cor-elations between other questionnaires measuring claustrophobiaCSA, CSB, FSS-III-CL) and reactivity in FetCO2 during actual expo-ure.
Reactivity in FetCO2 during actual claustrophobic exposure didot correlate with scores on any of the questionnaires not assessinglaustrophobic fear.
. Discussion
A first study aimed to validate the Dutch version of the CLQ. Inccordance with the original English version of the CLQ (RachmanTaylor, 1993; Radomsky et al., 2001), the Dutch CLQ consists of
wo factors, fear of restriction and fear of suffocation. The internalonsistency of the Dutch CLQ is acceptable and comparable to thoseound for the English CLQ (Radomsky et al., 2001), confirming thatt is a reliable instrument.
Furthermore, our results also showed that the Dutch CLQ hasgood divergent and convergent validity. Whereas it correlates
trongly with other self-report measures of claustrophobia, the cor-elations with questionnaires measuring specific fears other thanlaustrophobia, depression, and dispositional anxiety or neuroti-ism were substantially lower. Therefore, our findings also providereliminary evidence for the validity of the Dutch CLQ as a measuref claustrophobia.
The predictive validity of the Dutch CLQ was examined in a sec-nd, experimental study. To this end, associations between scoresf the Dutch CLQ and fear experienced in actual claustrophobicituations were explored. The pattern of results indicates that self-eported fear and respiratory reactivity (as reflected in decreasesn end-tidal Fractional CO2) during claustrophobic exposure areelated to individuals’ scores on the Dutch CLQ. There were pos-tive associations between the total CLQ score and self-reportedear during situations in which both restriction and fear of suf-ocation were prominent, and between the restriction scale andubjective fear during situations with restriction only. The lat-er finding contrasts somehow with findings from McGlynn et al.2007) who reported that fear of restriction did not significantlyontribute in path models of subjective fear during exposure to aock scanner environment. Interestingly, scores on the restriction,
ut not those on the suffocation scale correlated significantly withelf-reported fear during exposure to situations with risk of suffo-ation only. The origin of this finding is unclear, but it may relateo the specifics of the employed operationalizations. For example,n implicit social demand of the experimenter expecting some-ow the participant to complete the entire experiment may haveonstituted an element of ‘restriction’, even in the suffocation-onlyituations. Therefore, we recommend future studies to include aanipulation check to see whether the exposure situations actu-
lly trigger the claustrophobic fear component(s) they intended torigger.
Whereas several studies found that the CLQ did not predictardiac responses during actual claustrophobic exposure (e.g.,cGlynn et al., 2003; McGlynn, Smitherman, & Mulfinger, 2006),
he present study found that scores on the Dutch CLQ were asso-iated with a stronger decrease in FetCO2 during exposure tolaustrophobic situations. This is a rather surprising finding, givenhat no to very low associations between self-reports of fear andhysiological reactivity are very common (Rachman & Hodgson,
974). A speculative explanation for the presently observed con-ordance between self-reports and reactivity in FetCO2 may behat a tendency towards hyperventilation may be an evolutionaryprepared’ response to claustrophobic situations (Van Diest et al.,005).Disorders 24 (2010) 715–722 721
A limitation of the present work is the small number of partic-ipants in study 2. Particularly the findings on reactivity in FetCO2may be underpowered, so that potentially low to moderate corre-lations between reactivity in FetCO2 with each of the CLQ subscalesmay have remained undetected. Other limitations include the rel-ative lack of men in our sample and the absence of test-retestreliability evidence.
In summary, the Dutch CLQ seems a reliable and valid instru-ment to measure self-reported claustrophobic fear. Similar to theEnglish and French versions of the CLQ (Radomsky et al., 2001,2006), it consists of two subscales, referring to restriction fear andfear of suffocation. Whereas the predictive validity of the total scoreof the Dutch CLQ is good both for self-reported fear and respiratoryreactivity, the predictive validity of the restriction and suffocationsubscales seems much weaker. More research is needed to furtherinvestigate the predictive, convergent, and discriminant validity ofboth subscales.
References
Arindell, W. A. (1980). Dimensional structure and psychopathology correlates ofthe Fear Survey Schedule (FSS-III) in a phobic situation: factorial definition ofagoraphobia. Behaviour Research & Therapy, 18, 229–242.
Barenes, L. L. B., Harp, D., & Jung, W. S. (2002). Reliability generalization of scoreson the Spielberger state-Trait anxiety inventory. Educational and PsychologicalMeasurement, 62, 603–618.
Beck, A. T., Steer, R. A., & Brown, G. K. (1996). Manual for the Beck Depression Inventory.San Antonio, TX: Psychological Corporation.
Bentler, P. M. (2007). On tests and indices for evaluating structural models. Person-ality and Individual Differences, 42, 825–829.
De Clerck, A., Verschuere, B., Crombez, G., & De Vlieger, P. (2006). Psychophys-iological analysis (PSPHA): a modular script based program for analyzingpsychophysiological data. Behavior Research Methods, 38, 504–510.
Eifert, G. H., Zvolensky, M. J., Sorrell, J. T., Hopko, D. R., & Lejuez, C. W. (1999).Predictors of self-reported anxiety and panic symptoms: an evaluation of anx-iety sensitivity, suffocation fear, heart-focused anxiety, and breath-holdingduration. Journal of Psychopathology and Behavioral Assessment, 21(4), 293–305.
Eke, M., & McNally, R. J. (1996). Anxiety sensitivity, suffocation fear, trait anxiety, andbreath-holding duration as predictors of response to carbon dioxide challenge.Behaviour Research and Therapy, 34(8), 603–607.
Flora, D. B., & Curran, P. J. (2004). An empirical evaluation of alternative methodsof estimation for confirmatory factor analysis with ordinal data. PsychologicalMethods, 9, 466–491.
Gardner, W. N. (1996). The pathophysiology of hyperventilation disorders. Chest,109(2), 516–534.
Harris, L. M., Robinson, J., & Menzies, R. G. (1999). Evidence for fear of restrictionand fear of suffocation as components of claustrophobia. Behaviour Researchand Therapy, 37, 155–159.
Hoekstra, H. A., Ormel, J., & De Fruyt, F. (1996). NEO persoonlijkheidsvragenlijstenNEO-PI-R en NEO-FFI. Handleiding [NEO personality questionnaires NEO-PI Rand NEO-FFI. Manual]. Lisse: Swets & Zeitlinger.
Hu, L., & Bentler, P. M. (1999). Cutoff criteria for fit indexes in covariance struc-ture analysis: conventional criteria versus new alternatives. Structural EquationModeling, 6, 1–55.
Jöreskog, K., & Sörbom, D. (2004). LISRELL 8.71 [Computer Program]. Lincolnwood,IL: Scientific Software International.
McGlynn, F. D., Karg, R., & Lawyer, S. R. (2003). Fear responses to mock magneticresonance imaging among college students: toward a prototype experiment.Journal of Anxiety Disorders, 17(3), 335–347.
McGlynn, F. D., Smitherman, T. A., Hammel, J. C., & Lazarte, A. A. (2007). Compo-nent fears of claustrophobia associated with mock magnetic resonance imaging.Journal of Anxiety Disorders, 21, 367–380.
McGlynn, F. D., Smitherman, T. A., & Mulfinger, A. M. M. (2006). Anxiety and fear.In: M. Hersen (Ed.), Clinician’s handbook of adult behavioral assessment (pp.189–208). Burlington: Academic Press.
McIsaac, H. K., Thordarson, D. S., Shafran, R., Rachman, S., & Poole, P. (1998). Claus-trophobia and the magnetic resonance imaging procedure. Journal of BehavioralMedicine, 21(3), 255–268.
McNeil, D. W., & Rainwater, A. J. (1998). Development of the Fear of PainQuestionnaire-III. Journal of Behavioral Medicine, 21, 389–410.
Öst, L.-G. (2007). The claustrophobia scale: a psychometric evaluation. BehaviourResearch and Therapy, 45, 1053–1064.
Rachman, S. J. (1997). Claustrophobia. In: G. C. L. Davey (Ed.), Phobias: a handbook oftheory, research and treatment (pp. 163–181). Brighton, UK: University of Sussex.
Rachman, S., & Hodgson, R. (1974). Synchrony and desynchrony in fear and avoid-ance. Behaviour Research and Therapy, 12(4), 311–318.
Rachman, S., & Taylor, S. (1993). Analyses of claustrophobia. Journal of Anxiety Dis-orders, 7, 281–291.

7 nxiety
R
R
R
R
S
S
T
Psychosomatic Medicine, 67, 813–819.Van Diest, I., Winters, W., Devriese, S., Vercamst, E., Han, J. N., Van de Woestijne,
K. P., et al. (2001). Hyperventilation beyond fight/flight: respiratory responses
22 I. Van Diest et al. / Journal of A
adomsky, A. S., Quimet, A. J., Ashbaugh, A. R., Paradis, M. R., Lavoie, S. L., & O’Conner,K. P. (2006). Psychometric properties of the French and English versions of theClaustrophobia Questionnaire (CLQ). Anxiety Disorders, 20, 818–828.
adomsky, A. S., Rachman, S., Thordarson, D. S., McIsaak, H. K., & Teachman, B.A. (2001). The claustrophobia questionnaire. Journal of Anxiety Disorders, 15,287–297.
assovsky, Y., Kushner, M. G., Schwarze, N. J., & Wangensteen, O. D. (2000). Psycho-logical and physiological predictors of response to carbon dioxide challenge inindividuals with panic disorder. Journal of Abnormal Psychology, 109(4), 616–623.
oelofs, J., Peters, M. L., Deutz, J., Spijker, C., & Vlaeyen, J. W. S. (2005). The Fear ofPain Questionnaire (FPQ): further psychometric examination in a non-clinicalsample. Pain, 116, 339–346.
hipherd, J. C., Beck, J. G., & Ohtake, P. J. (2001). Relationships between the anxiety
sensitivity index, the suffocation fear scale, and responses to CO2 inhalation.Journal of Anxiety Disorders, 15(3), 247–258.pielberger, C. D. (1983). Manual for the State–Trait Anxiety Inventory (Form Y). PaloAlto, CA: Mind Garden.
aylor, S., Zvolensky, M. J., Cox, B. J., Deacon, B., Heimberg, R. G., Ledley, D. R., etal. (2007). Robust dimensions of anxiety sensitivity development and initial
Disorders 24 (2010) 715–722
validation of the Anxiety Sensitivity Index – 3. Psychological Assessment, 19,176–188.
van der Droes, A. J. W. (2002). BDI-II-NL: Nederlandse vertaling en bewerking [BDI-II-NL: The Dutch translation and revision]. Enschede, The Netherlands: ThePsychological Corporation.
van der Ploeg, H. M. (2000). Een Nederlandstalige bewerking van de Spielberger State-Trait Anxiety Inverntory: STAI-DY [A Dutch revision of the Spielberger State-TraitAnxiety Inventory: STAI-DY]. Lisse, The Netherlands: Swets Test Publishers.
Van Diest, I., De Peuter, S., Devriese, S., Wellens, E., Van de Woestijne, K. P., & Van denBergh, O. (2005). Imagined risk of suffocation as a trigger for hyperventilation.
during emotional imagery. Psychophysiology, 38, 961–968.Wolpe, J., & Lang, P. J. (1964). A Fear Survey Schedule for use in behavior therapy.
Behaviour Research and Therapy, 2, 27–30.
Related Documents