Ann. Geophys., 25, 2053–2068, 2007 www.ann-geophys.net/25/2053/2007/ © European Geosciences Union 2007 Annales Geophysicae The driving mechanisms of particle precipitation during the moderate geomagnetic storm of 7 January 2005 N. Longden 1 , F. Honary 1 , A. J. Kavanagh 1 , and J. Manninen 2 1 Department of Communication Systems, Lancaster University, UK 2 Sodankyl¨ a Geophysical Observatory, Sodankyl¨ a, Finland Received: 29 March 2007 – Revised: 20 July 2007 – Accepted: 18 September 2007 – Published: 2 October 2007 Abstract. The arrival of an interplanetary coronal mass ejec- tion (ICME) triggered a sudden storm commencement (SSC) at ∼09:22 UT on the 7 January 2005. The ICME followed a quiet period in the solar wind and interplanetary magnetic field (IMF). We present global scale observations of ener- getic electron precipitation during the moderate geomagnetic storm driven by the ICME. Energetic electron precipitation is inferred from increases in cosmic noise absorption (CNA) recorded by stations in the Global Riometer Array (GLO- RIA). No evidence of CNA was observed during the first four hours of passage of the ICME or following the sud- den commencement (SC) of the storm. This is consistent with the findings of Osepian and Kirkwood (2004) that SCs will only trigger precipitation during periods of geomagnetic activity or when the magnetic perturbation in the magneto- sphere is substantial. CNA was only observed following en- hanced coupling between the IMF and the magnetosphere, resulting from southward oriented IMF. Precipitation was ob- served due to substorm activity, as a result of the initial in- jection and particles drifting from the injection region. Dur- ing the recovery phase of the storm, when substorm activity diminished, precipitation due to density driven increases in the solar wind dynamic pressure (P dyn ) were identified. A number of increases in P dyn were shown to drive sudden im- pulses (SIs) in the geomagnetic field. While many of these SIs appear coincident with CNA, SIs without CNA were also observed. During this period, the threshold of geomagnetic activity required for SC driven precipitation was exceeded. This implies that solar wind density driven SIs occurring dur- ing storm recovery can drive a different response in particle precipitation to typical SCs. Keywords. Ionosphere (Particle precipitation) – Magne- tospheric physics (Solar wind-magnetosphere interaction; Storms and substorms) Correspondence to: N. Longden ([email protected]) 1 Introduction Riometers enable the investigation of precipitation of ener- getic electrons into the D-region of the ionosphere through measurement of the absorption of cosmic noise (CNA). One mechanism for the enhancement of precipitation in the auroral zones is the compression of the magnetosphere as a result of an increase in the dynamic pressure (P dyn ) of the solar wind (Brown et al., 1961). Compression of the mag- netosphere results in the stimulation of VLF waves, which in turn drive the pitch-angle diffusion necessary for trapped particles to precipitate into the ionosphere (Perona, 1972). Magnetospheric compression can be observed as an impul- sive perturbation in the horizontal component of the geo- magnetic field measured on the ground; i.e. a sudden com- mencement (SC). When followed by a geomagnetic storm, the event is termed a sudden storm commencement (SSC), and when not a sudden impulse (SI). Conversely, when the solar wind pressure decreases the magnetosphere can expe- rience rapid expansion. The signature of expansion is a neg- ative sudden impulse (SI - ) in the horizontal component of the geomagnetic field measured at mid to low latitudes (e.g. Takeuchi et al., 2002). Precipitation driven by a SC can be observed by riome- ters as short-lived CNA coincident with the onset of the SC, known as Sudden Commencement Absorption (SCA) (Brown et al., 1961). CNA observed following an SI is termed Sudden Impulse Absorption (SIA). When observed, SCA and SIA exhibit a geomagnetic latitude and local time dependency, with probability of occurrence maximis- ing around local noon between 65 ◦ and 70 ◦ magnetic lat- itude (Perona, 1972). Osepian and Kirkwood (2004) have determined that a storm SC event during a period of activ- ity, defined as a period when the geomagnetic index K p is two or greater, will result in SCA proportional to the magni- tude of the magnetic impulse observed at equatorial latitudes. However, a storm SC event during a period of quiet activity (K p <2) would only result in SCA if the magnitude of the Published by Copernicus Publications on behalf of the European Geosciences Union.

Welcome message from author
This document is posted to help you gain knowledge. Please leave a comment to let me know what you think about it! Share it to your friends and learn new things together.
Transcript

Ann. Geophys., 25, 2053–2068, 2007www.ann-geophys.net/25/2053/2007/© European Geosciences Union 2007
AnnalesGeophysicae
The driving mechanisms of particle precipitation during themoderate geomagnetic storm of 7 January 2005
N. Longden1, F. Honary1, A. J. Kavanagh1, and J. Manninen2
1Department of Communication Systems, Lancaster University, UK2Sodankyla Geophysical Observatory, Sodankyla, Finland
Received: 29 March 2007 – Revised: 20 July 2007 – Accepted: 18 September 2007 – Published: 2 October 2007
Abstract. The arrival of an interplanetary coronal mass ejec-tion (ICME) triggered a sudden storm commencement (SSC)at ∼09:22 UT on the 7 January 2005. The ICME followeda quiet period in the solar wind and interplanetary magneticfield (IMF). We present global scale observations of ener-getic electron precipitation during the moderate geomagneticstorm driven by the ICME. Energetic electron precipitationis inferred from increases in cosmic noise absorption (CNA)recorded by stations in the Global Riometer Array (GLO-RIA). No evidence of CNA was observed during the firstfour hours of passage of the ICME or following the sud-den commencement (SC) of the storm. This is consistentwith the findings of Osepian and Kirkwood (2004) that SCswill only trigger precipitation during periods of geomagneticactivity or when the magnetic perturbation in the magneto-sphere is substantial. CNA was only observed following en-hanced coupling between the IMF and the magnetosphere,resulting from southward oriented IMF. Precipitation was ob-served due to substorm activity, as a result of the initial in-jection and particles drifting from the injection region. Dur-ing the recovery phase of the storm, when substorm activitydiminished, precipitation due to density driven increases inthe solar wind dynamic pressure (Pdyn) were identified. Anumber of increases inPdyn were shown to drive sudden im-pulses (SIs) in the geomagnetic field. While many of theseSIs appear coincident with CNA, SIs without CNA were alsoobserved. During this period, the threshold of geomagneticactivity required for SC driven precipitation was exceeded.This implies that solar wind density driven SIs occurring dur-ing storm recovery can drive a different response in particleprecipitation to typical SCs.
Keywords. Ionosphere (Particle precipitation) – Magne-tospheric physics (Solar wind-magnetosphere interaction;Storms and substorms)
Correspondence to:N. Longden([email protected])
1 Introduction
Riometers enable the investigation of precipitation of ener-getic electrons into the D-region of the ionosphere throughmeasurement of the absorption of cosmic noise (CNA).
One mechanism for the enhancement of precipitation inthe auroral zones is the compression of the magnetosphere asa result of an increase in the dynamic pressure (Pdyn) of thesolar wind (Brown et al., 1961). Compression of the mag-netosphere results in the stimulation of VLF waves, whichin turn drive the pitch-angle diffusion necessary for trappedparticles to precipitate into the ionosphere (Perona, 1972).Magnetospheric compression can be observed as an impul-sive perturbation in the horizontal component of the geo-magnetic field measured on the ground; i.e. a sudden com-mencement (SC). When followed by a geomagnetic storm,the event is termed a sudden storm commencement (SSC),and when not a sudden impulse (SI). Conversely, when thesolar wind pressure decreases the magnetosphere can expe-rience rapid expansion. The signature of expansion is a neg-ative sudden impulse (SI−) in the horizontal component ofthe geomagnetic field measured at mid to low latitudes (e.g.Takeuchi et al., 2002).
Precipitation driven by a SC can be observed by riome-ters as short-lived CNA coincident with the onset of theSC, known as Sudden Commencement Absorption (SCA)(Brown et al., 1961). CNA observed following an SI istermed Sudden Impulse Absorption (SIA). When observed,SCA and SIA exhibit a geomagnetic latitude and localtime dependency, with probability of occurrence maximis-ing around local noon between 65◦ and 70◦ magnetic lat-itude (Perona, 1972). Osepian and Kirkwood(2004) havedetermined that a storm SC event during a period of activ-ity, defined as a period when the geomagnetic indexKp istwo or greater, will result in SCA proportional to the magni-tude of the magnetic impulse observed at equatorial latitudes.However, a storm SC event during a period of quiet activity(Kp<2) would only result in SCA if the magnitude of the
Published by Copernicus Publications on behalf of the European Geosciences Union.

2054 N. Longden et al.: Particle precipitation during 7 January 2005 storm
magnetic impulse exceeded a threshold of around 30 nT. Intheir study, SCA was evident during active periods irrespec-tive of the local time of the observing riometer. However,at quiet times, the local time sector altered the threshold ofmagnetic field perturbation required for SCA to occur, with agreater perturbation required for SCA in the local afternoonthan local morning.
Magnetospheric compression has been linked to substormprocesses, such as reducing the period of southward IMF re-quired for substorm activity to occur (Burch, 1972) and thetriggering of substorms (Brown, 1978). Precipitation due tosubstorms has been linked to a number of forms of CNA(e.g.Stauning, 1996, and references therein), including CNAaround local midnight, presumably close to the injection re-gion of the substorm, and in the morning sector, due to thedrift of injected electrons.
Interplanetary Coronal Mass Ejections (ICME) are theinterplanetary (IP) counterpart of Coronal Mass Ejections(CME). When earthward directed, ICMEs are known to drivegeomagnetic storms with levels of activity ranging from themost intense storms observed (Richardson et al., 2001) to rel-ative inactivity (Gosling et al., 1991). Taylor et al.(1994)have shown that ICMEs are the most likely drivers for SSCevents.
In this paper we study the global-scale effects on particleprecipitation of a moderate geomagnetic storm triggered byan ICME that collided with the magnetosphere on 7 January2005 and consider the effects in the context of the surveyof SSC-related absorption byOsepian and Kirkwood(2004).The ICME followed a period of low activity in both the so-lar wind and magnetosphere indicating little energy couplinginto the system. The storm developed over the course of twodays and exhibited at least two periods of substorm activity,observed by the Los Alamos National Laboratory (LANL)satellites at geosynchronous orbit. The recovery phase of thestorm on the 8 January 2005 was accompanied by a num-ber of solar wind density-driven sudden impulses that led toprecipitation confined mostly to the dayside magnetosphere.There was an advantageous configuration of riometers withcoverage of both magnetic noon and midnight at the time ofthe sudden commencement and during a good portion of therecovery phase of the storm making this an interesting casestudy on the effects of an ICME on energetic electron precip-itation on global scales.
2 Instrumentation
Observations of the solar wind and IMF during the event aretaken from the ACE satellite, in orbit around the L1 point,and the Geotail satellite. During this event, Geotail was lo-cated off the dawn flank moving towards noon close to theEarth. The solar wind velocities and magnetic structure ob-served by the ACE satellite are consistent with those ob-served by Geotail, indicating that Geotail is located outside
the bow shock and magnetosphere, directly in the solar windthroughout this event. The IMF data are obtained from theACE magnetic fields experiment (MAG) instrument (Smithet al., 1998) and the Geotail Magnetic Field Measurement(MGF) instrument (Kokubun et al., 1994). The ACE solarwind data are obtained from the Solar Wind Electron Pro-ton Alpha Monitor (SWEPAM) instrument (McComas et al.,1998) and the Geotail solar wind data are obtained fromthe Comprehensive Plasma Instrument (CPI) (Frank et al.,1994).
The global scale effects of the ICME in the ionospherewere investigated using two riometer chains; the NORSTARriometer chain (formerly CANOPUS), covering CANADA,and the SGO riometer chain in Fennoscandia. Data fromthe central beam (beam 25) of the imaging riometer (IRIS)located at Kilpisjarvi was also used. These riometers aredetailed in Table1 and form part of the GLORIA project(Global Riometer Array). Magnetic latitudes are given in theCorrected Geomagnetic (CGM) coordinate system using theInternational Geomagnetic Reference Field (IGRF) modelfor 2005 (e.g.Maus et al., 2005). GLORIA aims to linkthe data from riometers located throughout the Northern andSouthern Hemispheres to enable investigation of the effect ofelectron precipitation simultaneously across the globe. Smallerrors in the calculation of the quiet day curves for the riome-ters at Abisko and Rovaniemi could result in errors of the ab-solute magnitude of CNA of the order of 0.1 to 0.2 dB duringthis event.
The geomagnetic field local to the riometers was inves-tigated using data from ground based magnetometers. TheIMAGE magnetometer chain is located close to the SGOchain of riometers and the CARISMA magnetometer chain(formerly CANOPUS) is located close to the NORSTAR ri-ometers. Three of the magnetometer stations used are notlocated in the region of one of the riometers detailed in Ta-ble1. These are at Muonio (station code MUO), Rørvik (sta-tion code RVK) and Oulujarvi (station code OUJ). These sta-tions have a geographic latitude and longitude of 68.02◦ N,23.53◦ E, 64.94◦ N, 10.98◦ E and 64.52◦ N, 27.23◦ E respec-tively. Pi2 pulsations were investigating using the lowest lat-itude CARISMA station (Pinawa) and the York magnetome-ter (station code YOR) from the SAMNET magnetometerchain, located at 53.95◦ N, 1.05◦ W (geographic).
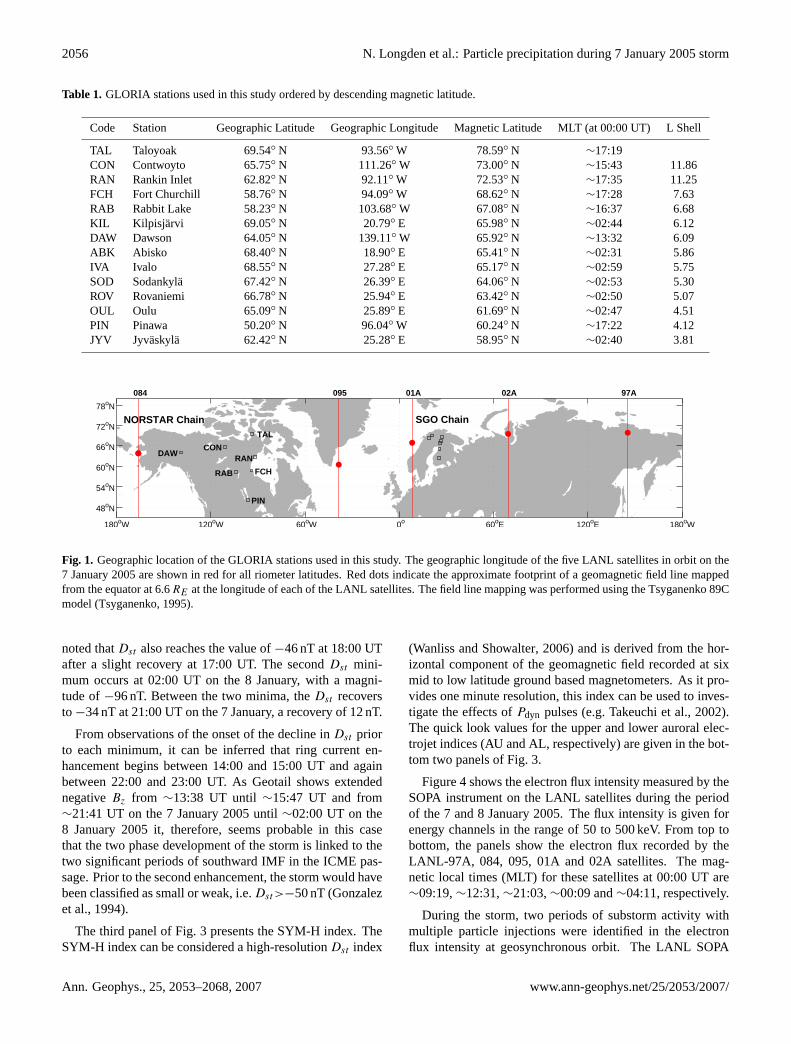
Geosynchronous particle flux intensity measurements aretaken from the Synchronous Orbit Particle Analyzer (SOPA)instrument (Belian et al., 1992) on board the LANL satel-lites. At the time of the ICME, data was available from fiveLANL satellites with SOPA instrumentation; 084, 095, 97A,01A and 02A. These satellites were located at geographiclongitudes of 166.13◦ W, 38.54◦ W, 145.36◦ E, 8.16◦ E and69.30◦ E, respectively, during this event. Figure1 indicatesthe geographic location of the GLORIA riometers used inthis study. The geographic longitude of the five LANL satel-lites are shown in red.
Ann. Geophys., 25, 2053–2068, 2007 www.ann-geophys.net/25/2053/2007/
N. Longden et al.: Particle precipitation during 7 January 2005 storm 2055
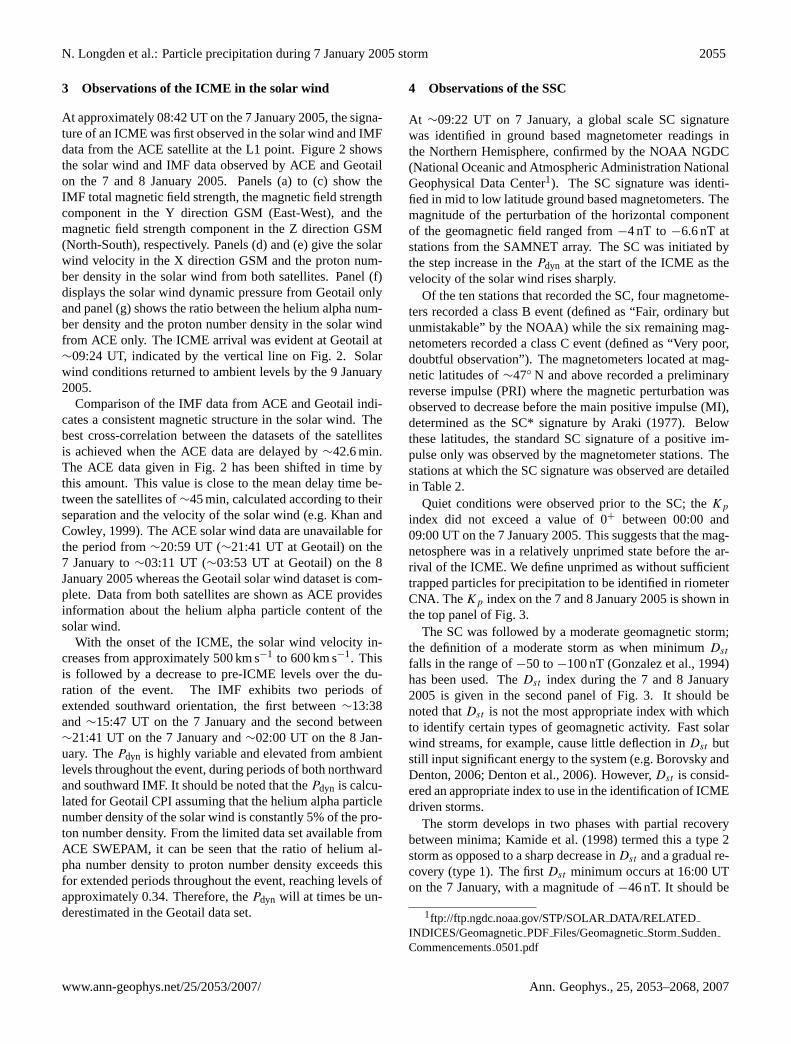
3 Observations of the ICME in the solar wind
At approximately 08:42 UT on the 7 January 2005, the signa-ture of an ICME was first observed in the solar wind and IMFdata from the ACE satellite at the L1 point. Figure2 showsthe solar wind and IMF data observed by ACE and Geotailon the 7 and 8 January 2005. Panels (a) to (c) show theIMF total magnetic field strength, the magnetic field strengthcomponent in the Y direction GSM (East-West), and themagnetic field strength component in the Z direction GSM(North-South), respectively. Panels (d) and (e) give the solarwind velocity in the X direction GSM and the proton num-ber density in the solar wind from both satellites. Panel (f)displays the solar wind dynamic pressure from Geotail onlyand panel (g) shows the ratio between the helium alpha num-ber density and the proton number density in the solar windfrom ACE only. The ICME arrival was evident at Geotail at∼09:24 UT, indicated by the vertical line on Fig.2. Solarwind conditions returned to ambient levels by the 9 January2005.
Comparison of the IMF data from ACE and Geotail indi-cates a consistent magnetic structure in the solar wind. Thebest cross-correlation between the datasets of the satellitesis achieved when the ACE data are delayed by∼42.6 min.The ACE data given in Fig.2 has been shifted in time bythis amount. This value is close to the mean delay time be-tween the satellites of∼45 min, calculated according to theirseparation and the velocity of the solar wind (e.g.Khan andCowley, 1999). The ACE solar wind data are unavailable forthe period from∼20:59 UT (∼21:41 UT at Geotail) on the7 January to∼03:11 UT (∼03:53 UT at Geotail) on the 8January 2005 whereas the Geotail solar wind dataset is com-plete. Data from both satellites are shown as ACE providesinformation about the helium alpha particle content of thesolar wind.
With the onset of the ICME, the solar wind velocity in-creases from approximately 500 km s−1 to 600 km s−1. Thisis followed by a decrease to pre-ICME levels over the du-ration of the event. The IMF exhibits two periods ofextended southward orientation, the first between∼13:38and∼15:47 UT on the 7 January and the second between∼21:41 UT on the 7 January and∼02:00 UT on the 8 Jan-uary. ThePdyn is highly variable and elevated from ambientlevels throughout the event, during periods of both northwardand southward IMF. It should be noted that thePdyn is calcu-lated for Geotail CPI assuming that the helium alpha particlenumber density of the solar wind is constantly 5% of the pro-ton number density. From the limited data set available fromACE SWEPAM, it can be seen that the ratio of helium al-pha number density to proton number density exceeds thisfor extended periods throughout the event, reaching levels ofapproximately 0.34. Therefore, thePdyn will at times be un-derestimated in the Geotail data set.
4 Observations of the SSC
At ∼09:22 UT on 7 January, a global scale SC signaturewas identified in ground based magnetometer readings inthe Northern Hemisphere, confirmed by the NOAA NGDC(National Oceanic and Atmospheric Administration NationalGeophysical Data Center1). The SC signature was identi-fied in mid to low latitude ground based magnetometers. Themagnitude of the perturbation of the horizontal componentof the geomagnetic field ranged from−4 nT to −6.6 nT atstations from the SAMNET array. The SC was initiated bythe step increase in thePdyn at the start of the ICME as thevelocity of the solar wind rises sharply.
Of the ten stations that recorded the SC, four magnetome-ters recorded a class B event (defined as “Fair, ordinary butunmistakable” by the NOAA) while the six remaining mag-netometers recorded a class C event (defined as “Very poor,doubtful observation”). The magnetometers located at mag-netic latitudes of∼47◦ N and above recorded a preliminaryreverse impulse (PRI) where the magnetic perturbation wasobserved to decrease before the main positive impulse (MI),determined as the SC* signature byAraki (1977). Belowthese latitudes, the standard SC signature of a positive im-pulse only was observed by the magnetometer stations. Thestations at which the SC signature was observed are detailedin Table2.
Quiet conditions were observed prior to the SC; theKp
index did not exceed a value of 0+ between 00:00 and09:00 UT on the 7 January 2005. This suggests that the mag-netosphere was in a relatively unprimed state before the ar-rival of the ICME. We define unprimed as without sufficienttrapped particles for precipitation to be identified in riometerCNA. TheKp index on the 7 and 8 January 2005 is shown inthe top panel of Fig.3.
The SC was followed by a moderate geomagnetic storm;the definition of a moderate storm as when minimumDst
falls in the range of−50 to−100 nT (Gonzalez et al., 1994)has been used. TheDst index during the 7 and 8 January2005 is given in the second panel of Fig.3. It should benoted thatDst is not the most appropriate index with whichto identify certain types of geomagnetic activity. Fast solarwind streams, for example, cause little deflection inDst butstill input significant energy to the system (e.g.Borovsky andDenton, 2006; Denton et al., 2006). However,Dst is consid-ered an appropriate index to use in the identification of ICMEdriven storms.
The storm develops in two phases with partial recoverybetween minima;Kamide et al.(1998) termed this a type 2storm as opposed to a sharp decrease inDst and a gradual re-covery (type 1). The firstDst minimum occurs at 16:00 UTon the 7 January, with a magnitude of−46 nT. It should be
1ftp://ftp.ngdc.noaa.gov/STP/SOLARDATA/RELATEDINDICES/GeomagneticPDF Files/GeomagneticStormSuddenCommencements0501.pdf
www.ann-geophys.net/25/2053/2007/ Ann. Geophys., 25, 2053–2068, 2007
2056 N. Longden et al.: Particle precipitation during 7 January 2005 storm
Table 1. GLORIA stations used in this study ordered by descending magnetic latitude.
Code Station Geographic Latitude Geographic Longitude Magnetic Latitude MLT (at 00:00 UT) L Shell
TAL Taloyoak 69.54◦ N 93.56◦ W 78.59◦ N ∼17:19CON Contwoyto 65.75◦ N 111.26◦ W 73.00◦ N ∼15:43 11.86RAN Rankin Inlet 62.82◦ N 92.11◦ W 72.53◦ N ∼17:35 11.25FCH Fort Churchill 58.76◦ N 94.09◦ W 68.62◦ N ∼17:28 7.63RAB Rabbit Lake 58.23◦ N 103.68◦ W 67.08◦ N ∼16:37 6.68KIL Kilpisj arvi 69.05◦ N 20.79◦ E 65.98◦ N ∼02:44 6.12DAW Dawson 64.05◦ N 139.11◦ W 65.92◦ N ∼13:32 6.09ABK Abisko 68.40◦ N 18.90◦ E 65.41◦ N ∼02:31 5.86IVA Ivalo 68.55◦ N 27.28◦ E 65.17◦ N ∼02:59 5.75SOD Sodankyla 67.42◦ N 26.39◦ E 64.06◦ N ∼02:53 5.30ROV Rovaniemi 66.78◦ N 25.94◦ E 63.42◦ N ∼02:50 5.07OUL Oulu 65.09◦ N 25.89◦ E 61.69◦ N ∼02:47 4.51PIN Pinawa 50.20◦ N 96.04◦ W 60.24◦ N ∼17:22 4.12JYV Jyvaskyla 62.42◦ N 25.28◦ E 58.95◦ N ∼02:40 3.81
180oW 120oW 60oW 0o 60oE 120oE 180oW
48oN
54oN
60oN
66oN
72oN
78oN
RAN
TAL
FCH
PIN
RAB
CONDAW
SGO ChainNORSTAR Chain
01A 02A 97A084 095
Fig. 1. Geographic location of the GLORIA stations used in this study. The geographic longitude of the five LANL satellites in orbit on the7 January 2005 are shown in red for all riometer latitudes. Red dots indicate the approximate footprint of a geomagnetic field line mappedfrom the equator at 6.6RE at the longitude of each of the LANL satellites. The field line mapping was performed using the Tsyganenko 89Cmodel (Tsyganenko, 1995).
noted thatDst also reaches the value of−46 nT at 18:00 UTafter a slight recovery at 17:00 UT. The secondDst mini-mum occurs at 02:00 UT on the 8 January, with a magni-tude of−96 nT. Between the two minima, theDst recoversto −34 nT at 21:00 UT on the 7 January, a recovery of 12 nT.
From observations of the onset of the decline inDst priorto each minimum, it can be inferred that ring current en-hancement begins between 14:00 and 15:00 UT and againbetween 22:00 and 23:00 UT. As Geotail shows extendednegativeBz from ∼13:38 UT until ∼15:47 UT and from∼21:41 UT on the 7 January 2005 until∼02:00 UT on the8 January 2005 it, therefore, seems probable in this casethat the two phase development of the storm is linked to thetwo significant periods of southward IMF in the ICME pas-sage. Prior to the second enhancement, the storm would havebeen classified as small or weak, i.e.Dst>−50 nT (Gonzalezet al., 1994).
The third panel of Fig.3 presents the SYM-H index. TheSYM-H index can be considered a high-resolutionDst index
(Wanliss and Showalter, 2006) and is derived from the hor-izontal component of the geomagnetic field recorded at sixmid to low latitude ground based magnetometers. As it pro-vides one minute resolution, this index can be used to inves-tigate the effects ofPdyn pulses (e.g.Takeuchi et al., 2002).The quick look values for the upper and lower auroral elec-trojet indices (AU and AL, respectively) are given in the bot-tom two panels of Fig.3.
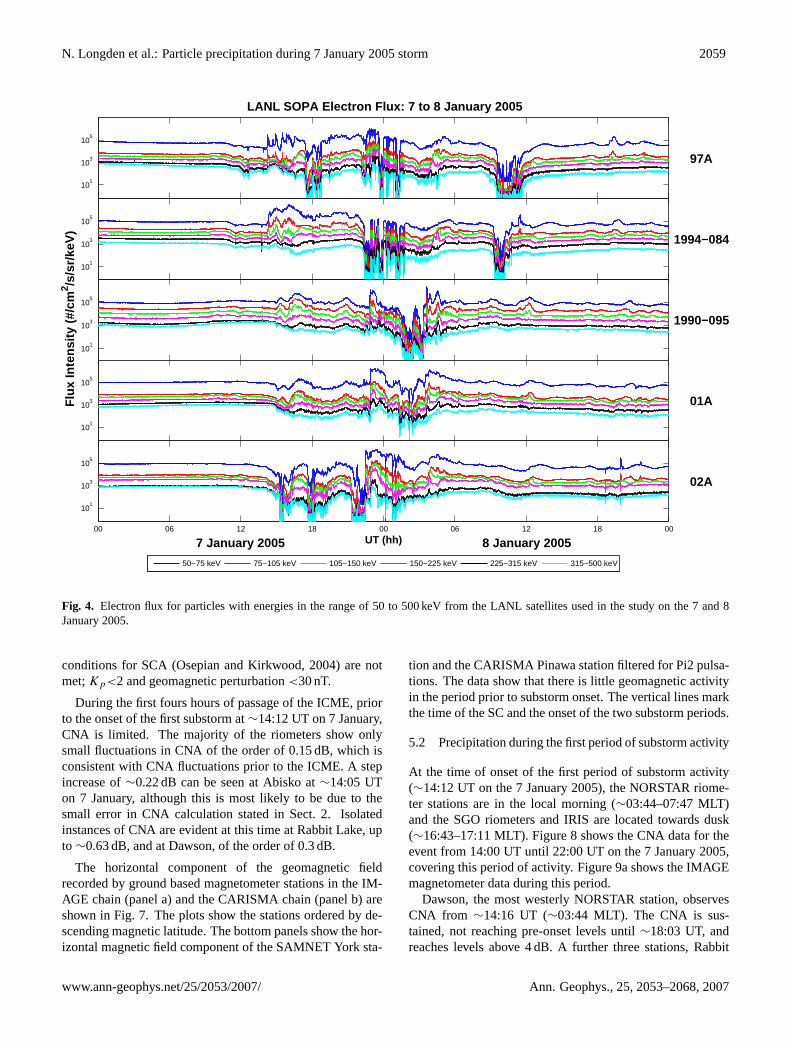
Figure4 shows the electron flux intensity measured by theSOPA instrument on the LANL satellites during the periodof the 7 and 8 January 2005. The flux intensity is given forenergy channels in the range of 50 to 500 keV. From top tobottom, the panels show the electron flux recorded by theLANL-97A, 084, 095, 01A and 02A satellites. The mag-netic local times (MLT) for these satellites at 00:00 UT are∼09:19,∼12:31,∼21:03,∼00:09 and∼04:11, respectively.
During the storm, two periods of substorm activity withmultiple particle injections were identified in the electronflux intensity at geosynchronous orbit. The LANL SOPA
Ann. Geophys., 25, 2053–2068, 2007 www.ann-geophys.net/25/2053/2007/

N. Longden et al.: Particle precipitation during 7 January 2005 storm 2057
Table 2. Magnetometer stations recording an SC signature at 09:22 UT on 7 January 2005, ordered by descending magnetic latitude.
Code Station Geographic Latitude Geographic Longitude Magnetic Latitude Class SC Type
LER Lerwick 60.13◦ N 1.18◦ W 57.92◦ N B SC*NUR Nurmijarvi 60.50◦ N 24.65◦ E 56.97◦ N C SC*ESK Eskdalemuir 55.32◦ N 3.20◦ W 52.57◦ N B SC*HAD Hartland 50.99◦ N 4.48◦ W 47.44◦ N B SC*BDV Budkov 49.08◦ N 14.02◦ E 44.43◦ N C SCMMB Memambetsu 43.91◦ N 144.19◦ E 37.26◦ N C SCSPT San Pablo Toledo 39.55◦ N 4.35◦ W 32.10◦ N C SCKAK Kakioka 36.23◦ N 140.19◦ E 29.46◦ N C SCKNY Kanoya 31.42◦ N 130.88◦ E 24.85◦ N C SCGUI Guima 28.32◦ N 16.44◦ W 13.03◦ N B SC
0
10
20
Solar Wind and IMF Data: 7 to 8 January 2005
−20
0
20
−20
0
20
−550
−450
0
40
80
0
20
00 06 12 18 00 06 12 18 000
0.1
0.2
0.3
UT (hh)
GeotailDelayed ACE
IMF |B| (nT)
IMF By (nT)
IMF Bz (nT)
SW Vx (km/s)
SW Np (#/cc)
SW DP(nPa)
SW Na/Np
7 January 2005 8 January 2005
a
b
c
d
e
f
g ICME Onset
Fig. 2. Solar Wind and Interplanetary Magnetic Field Data from the ACE and Geotail satellites on the 7 and 8 January 2005. ACE data hasbeen adjusted to the time of observation at Geotail. From(a) to (g), the panels show total magnetic field strength of the IMF, IMFBy GSM,IMF Bz GSM, solar wind speed in X direction GSM, solar wind proton number density, solar wind dynamic pressure and the ratio betweenhelium number density and proton number density in the solar wind.
www.ann-geophys.net/25/2053/2007/ Ann. Geophys., 25, 2053–2068, 2007

2058 N. Longden et al.: Particle precipitation during 7 January 2005 storm
0
4
8
−80
−40
0
−120
−80
−40
0
−400
0
400
00 06 12 18 00 06 12 18 00−2000
−1000
0
Kp
Geomagnetic Indices: 7 to 8 January 2005
ICME Onset
Dst(nT)
SYM−H(nT)
AU(nT)
AL(nT)
UT (hh)7 January2005
8 January2005
Fig. 3. Geomagnetic indices on the 7 and 8 January 2005. Fromtop to bottom, the panels show theKp index, theDst index, theSYM-H index, the AU index and the AL index.
data during the onset of the first period of substorm activ-ity is shown in Fig.5a, covering the period of 14:00 UT to15:15 UT on the 7 January 2005. From Fig.5a, the injec-tion signature of a substorm is evident in the electron fluxdata of LANL-97A at∼14:12 UT. At this time, the satellitewas located at an MLT of∼23:56, inside the injection re-gion. After approximately three minutes, the onset of a dis-persed injection signature of drifting electrons was observedin the electron flux of LANL-084, located at∼03:12 MLT.The dispersed signature results from electrons with differentenergies orbiting at different velocities away from the injec-tion region; the drift velocity of a particle is directly propor-tional to its energy (e.g.Hargreaves, 1992). Both satellitesshow evidence of a second enhancement in electron flux at∼14:53 UT.
This substorm activity follows the first decrease inDst , af-ter 14:00 UT, and a southward turning of the IMF. Conditionsremain disturbed following the substorm onset. Large en-hancements of electron flux are not evident after∼16:43 UT,although depletions can be seen at later times by LANL-97Aand 02A.
A seemingly dispersionless injection can be seen in theelectron flux intensity at LANL-02A at∼22:27 UT on 7 Jan-uary (∼02:39 MLT), indicating the onset of the second pe-riod of substorm activity at this time. The electron flux in-tensity from the LANL SOPA instruments between 22:15 UTand 23:30 UT on the 7 January 2005 are shown in Fig.5b.This activity follows the second decrease inDst , occurringbetween 22:00 UT and 23:00 UT, and a period of southwardIMF. This was followed by more activity at around 22:50 UT,with a seemingly dispersionless injection signature at LANL-095 (∼19:53 MLT) and 01A (∼22:59 MLT) at this time. Thedispersed signature of drifting electrons is evident at LANL-02A (∼03:00 MLT). A clear injection signature can also beseen at LANL-095 at∼03:33 UT on the 8 January 2005(∼00:35 MLT), with dispersed signatures evident at the othersatellites. The geosynchronous electron flux intensity duringthis injection is shown in Fig.5c.
5 Observations of particle precipitation
The ionospheric CNA data observed by seven of the SGO ri-ometers and IRIS at Kilpisjarvi throughout the ICME eventis shown in Fig.6a. From top to bottom, the plots relate tothese stations ordered by descending geomagnetic latitude.The SGO riometers and IRIS have operating frequencies inthe range 29.9 MHz to 38.2 MHz. As frequency can be con-sidered to be a scaling factor for absorption magnitude (e.g.Hargreaves, 1969), all absorption data have been scaled to afrequency of 30 MHz. The scaling was performed accordingto Eq. (1), wheref30 is a frequency of 30 MHz,fo is the op-erational frequency of the riometer andA is the absorption ata given frequency.
A(f30) = A(fo)(fo)
2
(f30)2(1)
Figure6b shows the CNA data for the event from seven ofthe NORSTAR riometers. From top to bottom, the plots re-late to these stations ordered by descending geomagnetic lat-itude. All NORSTAR riometers have a frequency of 30 MHz.The vertical lines on Fig.6 indicate the timing of the SC, at∼09:22 UT, and the onset of two substorms, at∼14:12 UTand∼22:27 UT, for both the SGO riometers and IRIS andthe NORSTAR riometers.
5.1 Precipitation prior to substorm onset
The GLORIA riometers provided simultaneous daysideand nightside coverage of the ionosphere at the time ofthe SC. The SGO and IRIS riometers were around lo-cal noon, in a suitable position for the detection of SCA.The NORSTAR riometers were located in the night sector(22:50–03:00 MLT) and so would be less likely to observeprecipitation effects (e.g.Ortner et al., 1962; Brown et al.,1972). No significant CNA is detected by any of the riome-ters following the SC. The absence of SCA is expected as the
Ann. Geophys., 25, 2053–2068, 2007 www.ann-geophys.net/25/2053/2007/
N. Longden et al.: Particle precipitation during 7 January 2005 storm 2059
101
103
105
Flu
x In
tens
ity (
#/cm
2 /s/s
r/ke
V)
101
103
105
101
103
105
00 06 12 18 00 06 12 18 00
101
103
105
UT (hh)
101
103
105
LANL SOPA Electron Flux: 7 to 8 January 2005
50−75 keV 75−105 keV 105−150 keV 150−225 keV 225−315 keV 315−500 keV
1990−095
1994−084
01A
02A
97A
7 January 2005 8 January 2005
Fig. 4. Electron flux for particles with energies in the range of 50 to 500 keV from the LANL satellites used in the study on the 7 and 8January 2005.
conditions for SCA (Osepian and Kirkwood, 2004) are notmet;Kp<2 and geomagnetic perturbation<30 nT.
During the first fours hours of passage of the ICME, priorto the onset of the first substorm at∼14:12 UT on 7 January,CNA is limited. The majority of the riometers show onlysmall fluctuations in CNA of the order of 0.15 dB, which isconsistent with CNA fluctuations prior to the ICME. A stepincrease of∼0.22 dB can be seen at Abisko at∼14:05 UTon 7 January, although this is most likely to be due to thesmall error in CNA calculation stated in Sect.2. Isolatedinstances of CNA are evident at this time at Rabbit Lake, upto ∼0.63 dB, and at Dawson, of the order of 0.3 dB.
The horizontal component of the geomagnetic fieldrecorded by ground based magnetometer stations in the IM-AGE chain (panel a) and the CARISMA chain (panel b) areshown in Fig.7. The plots show the stations ordered by de-scending magnetic latitude. The bottom panels show the hor-izontal magnetic field component of the SAMNET York sta-
tion and the CARISMA Pinawa station filtered for Pi2 pulsa-tions. The data show that there is little geomagnetic activityin the period prior to substorm onset. The vertical lines markthe time of the SC and the onset of the two substorm periods.
5.2 Precipitation during the first period of substorm activity
At the time of onset of the first period of substorm activity(∼14:12 UT on the 7 January 2005), the NORSTAR riome-ter stations are in the local morning (∼03:44–07:47 MLT)and the SGO riometers and IRIS are located towards dusk(∼16:43–17:11 MLT). Figure8 shows the CNA data for theevent from 14:00 UT until 22:00 UT on the 7 January 2005,covering this period of activity. Figure9a shows the IMAGEmagnetometer data during this period.
Dawson, the most westerly NORSTAR station, observesCNA from ∼14:16 UT (∼03:44 MLT). The CNA is sus-tained, not reaching pre-onset levels until∼18:03 UT, andreaches levels above 4 dB. A further three stations, Rabbit
www.ann-geophys.net/25/2053/2007/ Ann. Geophys., 25, 2053–2068, 2007

2060 N. Longden et al.: Particle precipitation during 7 January 2005 storm
101
103
105
Flu
x In
tens
ity (
#/cm
2 /s/s
r/ke
V)
101
103
105
101
103
105
1400 1415 1430 1445 1500 1515
101
103
105
UT (hhmm)
101
103
105
LANL SOPA Electron Flux7 January 2005
101
103
105
LANL SOPA Electron Flux7 January 2005
101
103
105
101
103
105
101
103
105
2215 2230 2245 2300 2315 2330
101
103
105
UT (hhmm)
101
103
105
LANL SOPA Electron Flux8 January 2005
101
103
105
101
103
105
101
103
105
0315 0330 0345 0400 0415 0430
101
103
105
UT (hhmm)
50−75 keV 75−105 keV 105−150 keV 150−225 keV 225−315 keV 315−500 keV
1990−095
1994−084
01A
02A
97A
a b c
Fig. 5. Electron flux for particles with energies in the range of 50 to 500 keV from the LANL satellites used in the study. Panel(a) showsdata during the period of 14:00 UT to 15:15 UT on the 7 January 2005. Panel(b) shows data during the period of 22:15 UT to 23:30 UT onthe 7 January 2005. Panel(c) shows data during the period of 03:15 UT to 04:30 UT on the 8 January 2005.
Lake, Pinawa and Fort Churchill, show the onset of a sus-tained period of CNA around∼14:26 UT (at∼06:49 MLT,∼07:34 MLT and∼07:40 MLT, respectively). Of the threeriometers located above 70◦ N geomagnetic latitude (RankinInlet, Contwoyto and Taloyoak) only Contwoyto shows sig-nificant CNA during the substorm. However, the onset at thisstation does not occur until∼14:48 UT (∼06:31 MLT), de-spite being the second most westerly station from the chain.The location of the riometers and the duration of the CNA in-dicate that this is likely to be Slowly Varying (Morning) Ab-sorption (SVA) caused by the hardening of eastward driftingelectrons from the substorm injection (e.g.Stauning, 1996,and references therein).
CNA is evident in IRIS and all SGO riometer stationsexcept Jyvaskyla after∼14:35 UT (∼17:05–17:34 MLT atCNA onset). Jyvaskyla is located at the lowest magnetic lat-itude of the SGO stations (58.95◦ N, L≈3.81). LANL satel-lites located eastward (LANL-02A) and westward (LANL-
01A) of the position of these riometers do not show an in-crease in electron flux intensities consistent with particle in-jection. They also do not show a significant variation acrossenergy channels consistent with drifting particles at the timeof the CNA.
The CNA is sporadic and exhibits a different tempo-ral signature at each riometer station, although the profilesat Rovaniemi and Sodankyla (30 MHz) are similar. TheCNA appears to end following a peak that moves latitudi-nally northward from Rovaniemi (onset at∼16:05 UT) toKilpisj arvi (onset at∼16:35 UT). CNA largely disappears at∼16:50 UT. Some small impulsive CNA is seen at IRIS un-til ∼18:00 UT. IMAGE magnetometer observations (Fig.9a)show disturbed conditions at all stations during the peri-ods of CNA, from∼14:25 UT. They show recovery from∼16:35 UT, although minor fluctuations continue, consistentwith the end of the CNA period. The disturbance originatesat high latitude and propagates southward. The initial small
Ann. Geophys., 25, 2053–2068, 2007 www.ann-geophys.net/25/2053/2007/

N. Longden et al.: Particle precipitation during 7 January 2005 storm 2061
0
3
6
SGO Riometers and IRIS Absorption: 7 to 8 January 2005
0
3
6
0
3
6
0
3
6
Ab
s (d
B)
0
3
6
0
3
6
00 06 12 18 00 06 12 18 000
3
6
UT (hh)
0
3
6
NORSTAR Riometers Absorption: 7 to 8 January 2005
0
3
6
0
3
6
0
3
6
Ab
s (d
B)
0
3
6
0
3
6
00 06 12 18 00 06 12 18 000
3
6
UT (hh)
KIL65.98o N
ABK65.41o N
IVA65.17o N
SOD64.06o N
ROV63.42o N
OUL61.69o N
JYV58.95o N
TAL78.59o N
CON73.00o N
RAN72.53o N
FCH68.62o N
RAB67.08o N
DAW65.92o N
PIN60.24o N
7 January2005
8 January2005
7 January2005
8 January2005
~0922 UT ~1412 UT ~2227 UT ~0922 UT ~1412 UT ~2227 UT
a b
Fig. 6. Ionospheric CNA from the selected GLORIA stations on the 7 and 8 January 2005. The stations are ordered by descending magneticlatitude. Panel(a) shows data from the SGO riometers and IRIS at Kilpisjarvi. Panel(b) shows data from the NORSTAR riometers.
increase in CNA is associated with the appearance of the sub-storm current system overhead and precedes the increase inPdyn; this may influence the subsequent increase in CNA butthat is inconclusive. The lack of electron flux at the localLANL satellite can be explained if the electrons responsiblefor the absorption are of lower than usual energy and if thecurrent system is confined earthward of geostationary orbit atthat magnetic local time. Inspection of a north-south alignedrow of beams in IRIS indicates that the CNA drops away withincreasing latitude such that the footprint of geostationary or-bit corresponds to essentially background CNA.
Variations in solar wind pressure can be observed at Geo-tail from ∼14:30 UT, with an impulse at∼14:57 UT. Thesevariations occur during the first period of substorm activity,when CNA is also observed at the SGO riometers and IRIS.ThePdyn increase is due to an increase in the proton numberdensity of the solar wind rather than velocity and is highlyvariable. At this time, theKp index indicates active condi-tions (Kp≥5).
The global geomagnetic field at this time can be investi-gated via the SYM-H index. An overall decrease in SYM-H can be observed from the time of the substorm onset at∼14:12 UT. Some deviations from the trend of SYM-H thatseem to reflect changes inPdyn can be seen. However, thereare manyPdyn variations that appear to have no effect onSYM-H. The sudden decrease inPdyn observed by Geotailat ∼17:56 UT is mirrored by a sudden decrease in SYM-Hat ∼18:00 UT, indicating rapid expansion of the magneto-sphere. The decreases inPdyn and SYM-H occur at the timeat which the period of CNA also finally tails off at both chainsof riometers and IRIS.
While the CNA at SGO and IRIS occurs during a period ofPdyn variations, there is no evidence that the CNA is directlydriven byPdyn at this time. For example, the most significantpeak in CNA at IRIS, observed from∼16:30 UT, does notcorrespond to an impulse in thePdyn or SYM-H index.
CNA related to magnetospheric compression is difficult toidentify in the NORSTAR riometers, which are located in the
www.ann-geophys.net/25/2053/2007/ Ann. Geophys., 25, 2053–2068, 2007

2062 N. Longden et al.: Particle precipitation during 7 January 2005 storm
9000
10500
IMAGE Magnetometers: 7 to 8 January 2005
10000
11500
10000
11500
10000
11500
H (
nT
)
10000
11500
12500
14000
00 06 12 18 00 06 12 18 00
12000
13500
00 06 12 18 00 06 12 18 00
−8
0
8
UT (hh)
Pi2
H (
nT
)
3500
5000
CARISMA Magnetometers: 7 to 8 January 2005
7000
8500
1000
2500
7500
9000
H (
nT
)
10000
11500
8500
10000
00 06 12 18 00 06 12 18 00
14000
15500
00 06 12 18 00 06 12 18 00
−40
0
40
UT (hh)
Pi2
H (
nT
)
KIL65.98o N
ABK65.41o N
IVA65.17o N
MUO64.81o N
SOD64.06o N
RVK62.27o N
OUJ61.08o N
YOR
50.84o N
7 January2005
8 January2005
TAL78.59o N
CON73.00o N
RAN72.53o N
FCH68.62o N
RAB67.08o N
DAW65.92o N
PIN60.24o N
7 January2005
8 January2005
ab
~0922 UT ~1412 UT ~2227UT ~2227UT~1412 UT~0922 UTPIN
60.24o N
Fig. 7. The horizontal component of the geomagnetic field from ground based magnetometers on the 7 and 8 January 2005. The stationsare ordered by descending magnetic latitude. Panel(a) shows data from the IMAGE magnetometer chain. Panel(b) shows data from theCARISMA magnetometer chain. Pi2 filtered data are shown for the SAMNET York station and the CARISMA Pinawa station.
morning at this time, as the impulses occur during ongoingsubstorm related precipitation. Following the end of the sub-storm activity, CNA is still evident at some of the NORSTARriometers at latitudes below 70◦ N. However, this does notappear to be linked toPdyn variations as coincident impulsesin SYM-H are not evident.
At ∼20:30 UT, a two-step increase in SYM-H of around30 nT is evident following aPdyn decrease followed almostimmediately by rapid increases. This coincides with a periodof enhanced CNA at NORSTAR with multiple peaks. Asprecipitation is observed prior to the impulse, the CNA maysimply be a continuation of the previous activity.
5.3 Precipitation during the second period of substorm ac-tivity
At the time of onset of the second period of substorm activ-ity (∼22:27 UT on the 7 January 2005), the SGO riometersand IRIS were located post-midnight (∼00:58–01:26 MLT)
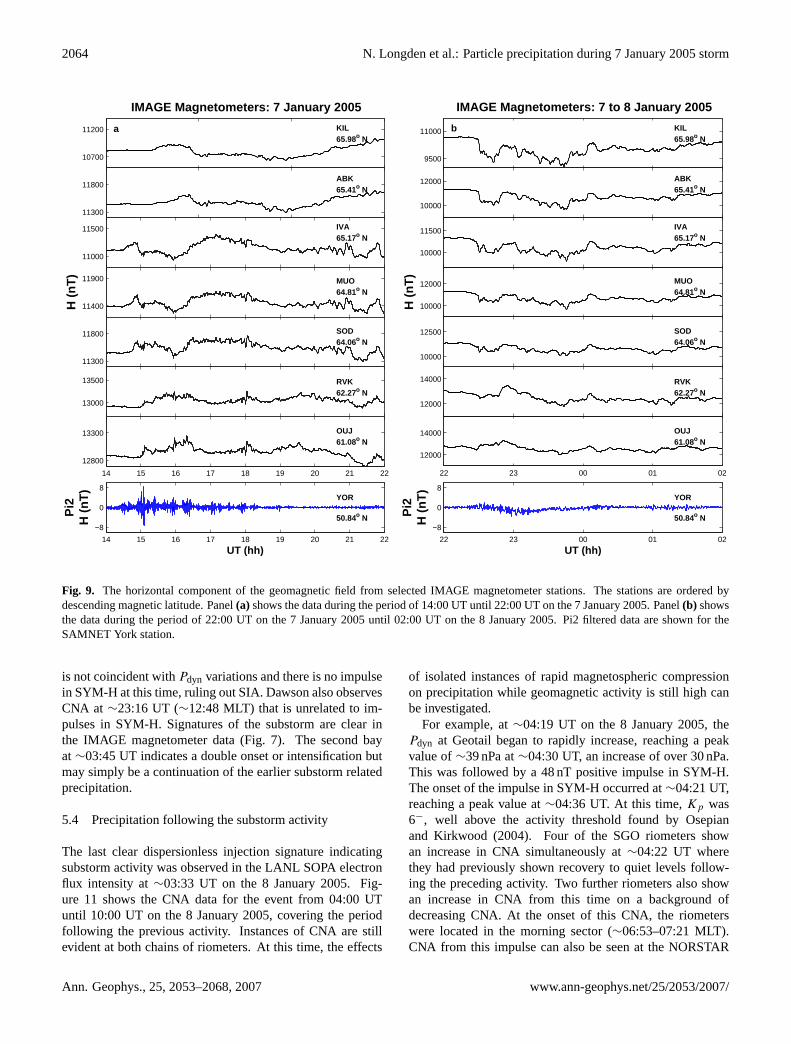
while the NORSTAR riometers were in the local afternoon(∼11:59–16:02 MLT). Figure10shows the CNA data for theevent from 22:00 UT on the 7 January 2005 until 02:00 UTon the 8 January 2005, covering this period of activity.The IMAGE magnetometer data for this period is shown inFig. 9b.
The SGO riometers (except Jyvaskyla) and IRIS begin toshow enhanced CNA from∼22:28 UT. There is evidence of arapid longitudinal motion westward in the CNA. It is first ob-served in the most easterly station, Ivalo, before progressingto the most westerly station, Abisko, after a time delay of theorder of two minutes. This CNA occurs after the onset of thesecond period of substorm activity with the apparently dis-persionless injection at∼22:27 UT at LANL-02A (Fig.5b).
The CNA remains enhanced (with discrete increases) fromthe start of the substorm activity until∼14:34 UT on 8 Jan-uary 2005. The signature is similar in riometers in whichCNA is observed, although timings of individual features
Ann. Geophys., 25, 2053–2068, 2007 www.ann-geophys.net/25/2053/2007/

N. Longden et al.: Particle precipitation during 7 January 2005 storm 2063
0
1
2
SGO Riometers and IRIS Absorption: 7 January 2005
0
1
2
0
1
2
0
1
2
Abs
(dB
)
0
1
2
0
1
2
14 15 16 17 18 19 20 21 22
0
1
2
UT (hh)
0
2
4
NORSTAR Riometers Absorption: 7 January 2005
0
2
4
0
2
4
0
2
4
Abs
(dB
)
0
2
4
0
2
4
14 15 16 17 18 19 20 21 220
2
4
UT (hh)
14 15 16 17 18 19 20 21 22
0
−50
UT (hh)SY
M−H
(nT
)
0
20
SW
DP
(nP
a)
0
20
SW
DP
(nP
a)
14 15 16 17 18 19 20 21 22
0
−50
UT (hh)SY
M−H
(nT
)
KIL65.98o N
ABK65.41o N
IVA65.17o N
SOD64.06o N
ROV63.42o N
OUL61.69o N
JYV58.95o N
TAL78.59o N
CON73.00o N
RAN72.53o N
FCH68.62o N
RAB67.08o N
DAW65.92o N
PIN60.24o N
a b
Fig. 8. Ionospheric CNA from the selected GLORIA stations during the period of 14:00 UT until 22:00 UT on the 7 January 2005. Thestations are ordered by descending magnetic latitude. Panel(a) shows data from the SGO riometers and IRIS at Kilpisjarvi. Panel(b) showsdata from the NORSTAR riometers. Solar wind dynamic pressure data from Geotail and the SYM-H index are shown at the bottom of eachpanel.
vary on a timescale of the order of five minutes. CNA isprimarily seen at the higher latitude stations of the SGOchain and IRIS. However, between∼23:32 and 23:55 UT,CNA reaching levels greater than 1.5 dB can even be seen atJyvaskyla. This indicates an expansion of the auroral oval tolatitudes below 60◦ N during this time.
The CNA over Fennoscandia also coincides with localgeomagnetic disturbances identified in the IMAGE magne-tometer data (Fig.9b). The later periods of CNA coincidewith impulsive short-lived disturbances in the local geomag-netic field.
Prior to 23:30 UT on 7 January 2005, the global geomag-netic field in the form of the SYM-H index appears to bedominated by the effects of the substorm activity. After this,compression and expansion of the magnetic field can be seenfollowing some of the largePdyn pulses observed at Geotail.
Initially, while the riometers are located in the night sec-tor, the precipitation appears to be directly related to the sub-storm activity. Much of this CNA occurs at times of elevated
electron flux intensities observed by LANL-01A and 02A.During the progression of the substorms,Pdyn is elevatedand impulsive signatures in the SYM-H index appear coinci-dent with CNA, for example at the time of CNA at Jyvaskyla.However, at these times some riometers in the SGO chain andIRIS exhibit CNA prior to the impulse and so it is not pos-sible to attribute the CNA to the impulse due to the ongoingprecipitation.
Throughout this substorm, the NORSTAR riometers seelittle CNA. When CNA is present, it is at individual sta-tions and is limited in time. The most significant CNA isrecorded by Pinawa, the most equatorward of the riometersin the chain, with onset at∼22:35 UT (∼15:57 MLT). Thereis evidence of enhanced electron flux at LANL-97A acrossall energy channels which does not exhibit a dispersed signa-ture. The other NORSTAR riometers lying in a meridionalchain with Pinawa do not show any enhancement in CNA atthis time. Therefore it is unlikely to be the result of substormrelated precipitation. Despite the impulsive profile, this CNA
www.ann-geophys.net/25/2053/2007/ Ann. Geophys., 25, 2053–2068, 2007
2064 N. Longden et al.: Particle precipitation during 7 January 2005 storm
10700
11200
IMAGE Magnetometers: 7 January 2005
11300
11800
11000
11500
11400
11900
H (
nT
)
11300
11800
13000
13500
14 15 16 17 18 19 20 21 22
12800
13300
14 15 16 17 18 19 20 21 22
−8
0
8
UT (hh)
Pi2
H (
nT
)
22 23 00 01 02
−8
0
8
UT (hh)
Pi2
H (
nT
)
22 23 00 01 02
12000
14000
10000
12500
12000
14000
10000
12000
H (
nT
)
10000
11500
10000
12000
11000
9500
IMAGE Magnetometers: 7 to 8 January 2005
KIL65.98o N
ABK65.41o N
IVA65.17o N
MUO64.81o N
SOD64.06o N
RVK62.27o N
OUJ61.08o N
YOR
50.84o N
a b KIL65.98o N
ABK65.41o N
IVA65.17o N
MUO64.81o N
SOD64.06o N
RVK62.27o N
OUJ61.08o N
YOR
50.84o N
Fig. 9. The horizontal component of the geomagnetic field from selected IMAGE magnetometer stations. The stations are ordered bydescending magnetic latitude. Panel(a) shows the data during the period of 14:00 UT until 22:00 UT on the 7 January 2005. Panel(b) showsthe data during the period of 22:00 UT on the 7 January 2005 until 02:00 UT on the 8 January 2005. Pi2 filtered data are shown for theSAMNET York station.
is not coincident withPdyn variations and there is no impulsein SYM-H at this time, ruling out SIA. Dawson also observesCNA at ∼23:16 UT (∼12:48 MLT) that is unrelated to im-pulses in SYM-H. Signatures of the substorm are clear inthe IMAGE magnetometer data (Fig.7). The second bayat ∼03:45 UT indicates a double onset or intensification butmay simply be a continuation of the earlier substorm relatedprecipitation.
5.4 Precipitation following the substorm activity
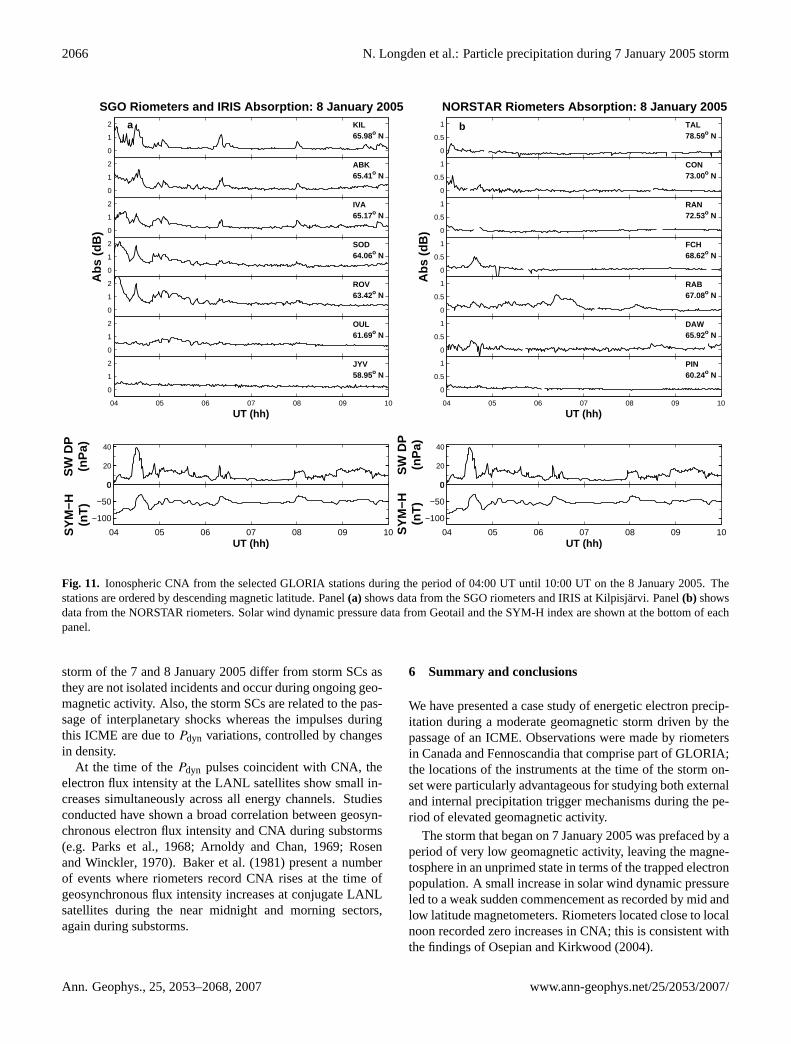
The last clear dispersionless injection signature indicatingsubstorm activity was observed in the LANL SOPA electronflux intensity at∼03:33 UT on the 8 January 2005. Fig-ure 11 shows the CNA data for the event from 04:00 UTuntil 10:00 UT on the 8 January 2005, covering the periodfollowing the previous activity. Instances of CNA are stillevident at both chains of riometers. At this time, the effects
of isolated instances of rapid magnetospheric compressionon precipitation while geomagnetic activity is still high canbe investigated.
For example, at∼04:19 UT on the 8 January 2005, thePdyn at Geotail began to rapidly increase, reaching a peakvalue of∼39 nPa at∼04:30 UT, an increase of over 30 nPa.This was followed by a 48 nT positive impulse in SYM-H.The onset of the impulse in SYM-H occurred at∼04:21 UT,reaching a peak value at∼04:36 UT. At this time,Kp was6−, well above the activity threshold found byOsepianand Kirkwood (2004). Four of the SGO riometers showan increase in CNA simultaneously at∼04:22 UT wherethey had previously shown recovery to quiet levels follow-ing the preceding activity. Two further riometers also showan increase in CNA from this time on a background ofdecreasing CNA. At the onset of this CNA, the riometerswere located in the morning sector (∼06:53–07:21 MLT).CNA from this impulse can also be seen at the NORSTAR
Ann. Geophys., 25, 2053–2068, 2007 www.ann-geophys.net/25/2053/2007/
N. Longden et al.: Particle precipitation during 7 January 2005 storm 2065
0
3
6
SGO Riometers and IRIS Absorption: 7 to 8 January 2005
0
3
6
0
3
6
0
3
6
Abs
(dB
)
0
3
6
0
3
6
22 23 00 01 020
3
6
UT (hh)
0
1
2
NORSTAR Riometers Absorption: 7 to 8 January 2005
0
1
2
0
1
2
0
1
2
Abs
(dB
)
0
1
2
0
1
2
22 23 00 01 020
1
2
UT (hh)
22 23 00 01 02
0
−50
−100
UT (hh)
SY
M−H
(nT
)
0
20
40
SW
DP
(nP
a)
0
20
40
SW
DP
(nP
a)
22 23 00 01 02
0
−50
−100
UT (hh)
SY
M−H
(nT
)
KIL65.98o N
ABK65.41o N
IVA65.17o N
SOD64.06o N
ROV63.42o N
OUL61.69o N
JYV58.95o N
TAL78.59o N
CON73.00o N
RAN72.53o N
FCH68.62o N
RAB67.08o N
DAW65.92o N
PIN60.24o N
a b
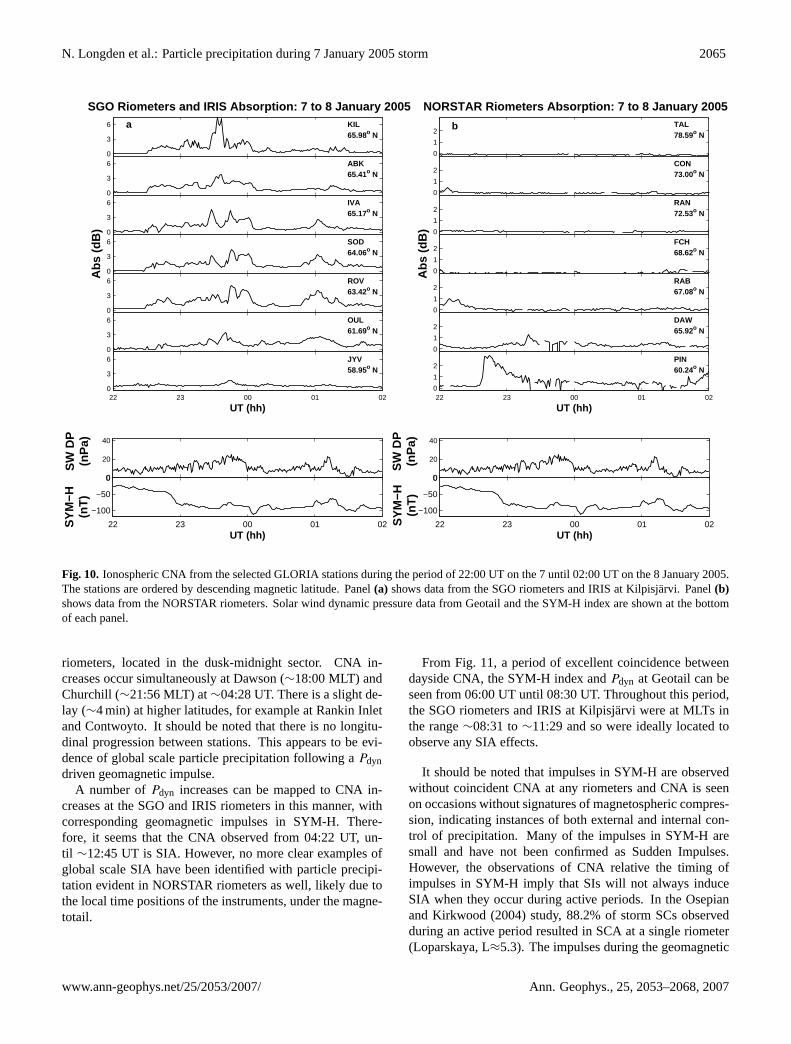
Fig. 10. Ionospheric CNA from the selected GLORIA stations during the period of 22:00 UT on the 7 until 02:00 UT on the 8 January 2005.The stations are ordered by descending magnetic latitude. Panel(a) shows data from the SGO riometers and IRIS at Kilpisjarvi. Panel(b)shows data from the NORSTAR riometers. Solar wind dynamic pressure data from Geotail and the SYM-H index are shown at the bottomof each panel.
riometers, located in the dusk-midnight sector. CNA in-creases occur simultaneously at Dawson (∼18:00 MLT) andChurchill (∼21:56 MLT) at∼04:28 UT. There is a slight de-lay (∼4 min) at higher latitudes, for example at Rankin Inletand Contwoyto. It should be noted that there is no longitu-dinal progression between stations. This appears to be evi-dence of global scale particle precipitation following aPdyndriven geomagnetic impulse.
A number ofPdyn increases can be mapped to CNA in-creases at the SGO and IRIS riometers in this manner, withcorresponding geomagnetic impulses in SYM-H. There-fore, it seems that the CNA observed from 04:22 UT, un-til ∼12:45 UT is SIA. However, no more clear examples ofglobal scale SIA have been identified with particle precipi-tation evident in NORSTAR riometers as well, likely due tothe local time positions of the instruments, under the magne-totail.
From Fig.11, a period of excellent coincidence betweendayside CNA, the SYM-H index andPdyn at Geotail can beseen from 06:00 UT until 08:30 UT. Throughout this period,the SGO riometers and IRIS at Kilpisjarvi were at MLTs inthe range∼08:31 to∼11:29 and so were ideally located toobserve any SIA effects.
It should be noted that impulses in SYM-H are observedwithout coincident CNA at any riometers and CNA is seenon occasions without signatures of magnetospheric compres-sion, indicating instances of both external and internal con-trol of precipitation. Many of the impulses in SYM-H aresmall and have not been confirmed as Sudden Impulses.However, the observations of CNA relative the timing ofimpulses in SYM-H imply that SIs will not always induceSIA when they occur during active periods. In theOsepianand Kirkwood(2004) study, 88.2% of storm SCs observedduring an active period resulted in SCA at a single riometer(Loparskaya, L≈5.3). The impulses during the geomagnetic
www.ann-geophys.net/25/2053/2007/ Ann. Geophys., 25, 2053–2068, 2007
2066 N. Longden et al.: Particle precipitation during 7 January 2005 storm
0
1
2
SGO Riometers and IRIS Absorption: 8 January 2005
0
1
2
0
1
2
0
1
2
Abs
(dB
)
0
1
2
0
1
2
04 05 06 07 08 09 10
0
1
2
UT (hh)
0
0.5
1
NORSTAR Riometers Absorption: 8 January 2005
0
0.5
1
0
0.5
1
0
0.5
1
Abs
(dB
)
0
0.5
1
0
0.5
1
04 05 06 07 08 09 10
0
0.5
1
UT (hh)
04 05 06 07 08 09 10
0
−50
−100
UT (hh)
SY
M−H
(nT
)
0
20
40
SW
DP
(nP
a)
0
20
40
SW
DP
(nP
a)
04 05 06 07 08 09 10
0
−50
−100
UT (hh)
SY
M−H
(nT
)
KIL65.98o N
ABK65.41o N
IVA65.17o N
SOD64.06o N
ROV63.42o N
OUL61.69o N
JYV58.95o N
TAL78.59o N
CON73.00o N
RAN72.53o N
FCH68.62o N
RAB67.08o N
DAW65.92o N
PIN60.24o N
a b
Fig. 11. Ionospheric CNA from the selected GLORIA stations during the period of 04:00 UT until 10:00 UT on the 8 January 2005. Thestations are ordered by descending magnetic latitude. Panel(a) shows data from the SGO riometers and IRIS at Kilpisjarvi. Panel(b) showsdata from the NORSTAR riometers. Solar wind dynamic pressure data from Geotail and the SYM-H index are shown at the bottom of eachpanel.
storm of the 7 and 8 January 2005 differ from storm SCs asthey are not isolated incidents and occur during ongoing geo-magnetic activity. Also, the storm SCs are related to the pas-sage of interplanetary shocks whereas the impulses duringthis ICME are due toPdyn variations, controlled by changesin density.
At the time of thePdyn pulses coincident with CNA, theelectron flux intensity at the LANL satellites show small in-creases simultaneously across all energy channels. Studiesconducted have shown a broad correlation between geosyn-chronous electron flux intensity and CNA during substorms(e.g. Parks et al., 1968; Arnoldy and Chan, 1969; Rosenand Winckler, 1970). Baker et al.(1981) present a numberof events where riometers record CNA rises at the time ofgeosynchronous flux intensity increases at conjugate LANLsatellites during the near midnight and morning sectors,again during substorms.
6 Summary and conclusions
We have presented a case study of energetic electron precip-itation during a moderate geomagnetic storm driven by thepassage of an ICME. Observations were made by riometersin Canada and Fennoscandia that comprise part of GLORIA;the locations of the instruments at the time of the storm on-set were particularly advantageous for studying both externaland internal precipitation trigger mechanisms during the pe-riod of elevated geomagnetic activity.
The storm that began on 7 January 2005 was prefaced by aperiod of very low geomagnetic activity, leaving the magne-tosphere in an unprimed state in terms of the trapped electronpopulation. A small increase in solar wind dynamic pressureled to a weak sudden commencement as recorded by mid andlow latitude magnetometers. Riometers located close to localnoon recorded zero increases in CNA; this is consistent withthe findings of Osepian and Kirkwood (2004).
Ann. Geophys., 25, 2053–2068, 2007 www.ann-geophys.net/25/2053/2007/

N. Longden et al.: Particle precipitation during 7 January 2005 storm 2067
CNA was only observed following periods of enhancedIMF-magnetosphere coupling (as indicated by negativeBz)which led to substorm activity with associated injections ofelectrons into the inner magnetosphere. An increase in CNAclose to dusk has been associated with the westward edge ofthe substorm current system rather than a coincident small in-crease inPdyn. Subsequent larger steps in the pressure mightaffect the precipitation but the observations are inconclusive.
Much of the CNA observed during the storm was linkedto substorm activity, through the precipitation of freshly in-jected electrons or following gradient curvature drift. How-ever, additional absorption directly driven by solar wind con-ditions was also observed. During the recovery phase ofthe storm, substorm activity diminished and the effect ofchanges inPdyn on CNA could be determined. For an im-pulse at∼04:20 UT, riometers in both the post-dawn anddusk-midnight sectors recorded a response; the rise time wassimilar for all instruments indicating a global response to thepressure enhancement.
Between 04:00 and 12:00 UT the dayside riometers recorda good correlation with the SYM-H index; although not allimpulses recorded in SYM-H show a corresponding absorp-tion signature. The nightside riometers do not show any fur-ther enhancements. Thus solar wind density-controlled SIsduring the recovery phase of a storm can produce a very dif-ferent precipitation response to typical SCs.
Acknowledgements.The authors wish to thank M. Denton for use-ful conversations. The ACE and Geotail solar wind and IMF datawere obtained from the NASA CDAWeb (http://cdaweb.gsfc.nasa.gov). The data originated from the Imaging Riometer for Iono-spheric Studies (IRIS), operated by the Department of Communi-cations Systems at Lancaster University (UK) in collaboration withthe Sodankyla Geophysical Observatory, and is funded by the Sci-ence and Technology Facilities Council (STFC, formerly PPARC).The NORSTAR riometer project is supported by the CanadianSpace Agency. We are grateful to E. Spanswick who baselined theNORSTAR data used in this study. We thank the institutes whomaintain the IMAGE magnetometer array and the Finnish Meteo-rological Institute; the IMAGE magnetometer data are collected asa joint European collaboration. The authors thank the SAMNETteam for magnetometer data. SAMNET is operated by LancasterUniversity and funded by STFC (formerly PPARC). The authorsthank I. R. Mann and the CARISMA team for data. CARISMAis operated by the University of Alberta with support from theCanadian Space Agency. TheDst andKp indices data were ob-tained from NOAA’s Space Physics Interactive Data Resources(http://spidr.ngdc.noaa.gov). The SYM-H and auroral electrojet in-dices data were obtained from the Kyoto World Data Center forGeomagnetism (http://swdcdb.kugi.kyoto-u.ac.jp). We thank DotDeLapp and team at LANL for providing the SOPA data.
Topical Editor I. A. Daglis thanks M. Jarvis and another anony-mous referee for their help in evaluating this paper.
References
Araki, T.: Global structure of geomagnetic sudden commence-ments, Planet. Space Sci., 25, 373–384, 1977.
Arnoldy, R. and Chan, K.: Particle substorms observed at the geo-stationary orbit, J. Geophys. Res., 74, 5019–5028, 1969.
Baker, D., Stauning P., Hones Jr., E., Higbie, P., and Belian, R.:Near-equatorial, high-resolution measurements of electron pre-cipitation at Lw6.6, J. Geophys. Res., 86(A4), 2295–2313, 1981.
Belian, R., Gisler, G., Cayton, T., and Christensen, R.: High-Z ener-getic particles at geosynchronous orbit during the great solar pro-ton event series of October 1989, J. Geophys. Res., 97, 16 897–16 906, 1992.
Borovsky, J. and Denton, M.: Differences between CME-drivenStorms and CIR-driven Storms, J. Geophys. Res., 111, A07S08,doi:10.1029/2005JA011447, 2006.
Brown, R.: On the poleward expansion of ionospheric absorptionregions triggered by sudden commencements of geomagneticstorms, J. Geophys. Res., 83(A3), 1169–1171, 1978.
Brown, R., Hartz, T., Landmark, B., Leinbach, H., and Ortner, J.:Large-scale electron bombardment of the atmosphere at the sud-den commencement of a geomagnetic storm, J. Geophys. Res.,66, 1035–1041, 1961.
Brown, R., Leinbach, H., Akasofu, S.-I., Driatsky, V., and Schmidt,R.: Quadruple conjugate pair observations of the sudden com-mencement absorption event on June 17, 1965, J. Geophys. Res.,77, 5602–5607, 1972.
Burch, J.: Preconditions for the triggering of polar magnetic sub-storms by storm sudden commencements, J. Geophys. Res., 77,5629–5632, 1972.
Denton, M., Borovsky, J., Skoug, R., Thomsen, M., Lavraud,B., Henderson, M., McPherron, R., Zhang, J., and Liemohn,M.: Geomagnetic storms driven by ICME- and CIR-dominated solar wind, J. Geophys. Res., 111, A07S07,doi:10.1029/2005JA011436, 2006.
Frank, L., Ackerson, K., Paterson, W., Lee, J., English, M., andPickett, G.: The Comprehensive Plasma Instrumentation (CPI)for the GEOTAIL spacecraft, J. Geomagn. Geoelectr., 46, 23–37,1994.
Gonzalez, W., Joselyn, J., Kamide, Y., Kroehl, H., Rostoker, G.,Tsurutani, B., and Vasyliunas, V.: What is a geomagnetic storm?,J. Geophys. Res., 99, 5771–5792, 1994.
Gosling, J., McComas, D., Phillips, J., and Bame, J.: Geomagneticactivity associated with Earth passage of interplanetary shockdisturbances and coronal mass ejections, J. Geophys. Res., 96,7831–7839, 1991.
Hargreaves, J.: Auroral absorption of HF radio waves in the iono-sphere: A review of results from the first decade of riometry, P.IEEE, 57, 1348–1373, 1969.
Hargreaves, J.: The Solar-Terrestrial Environment, Cambridge Uni-versity Press, 1992.
Kamide, Y., Yokoyama, N., Gonzalez, W., Tsurutani, B., Daglis, I.,Brekke, A., and Masuda, S.: Two step development of geomag-netic storms, J. Geophys. Res., 103, 6917–6921, 1998.
Khan, H. and Cowley, S.: Observations of the response time ofhigh-latitude ionospheric convection to variations in the inter-planetary magnetic field using EISCAT and IMP-8 Data, Ann.Geophys., 17, 1306–1335, 1999,http://www.ann-geophys.net/17/1306/1999/.
Kokubun, S., Yamamoto, T., Acuna, M., Hayashi, K., Shiokawa, K.,
www.ann-geophys.net/25/2053/2007/ Ann. Geophys., 25, 2053–2068, 2007

2068 N. Longden et al.: Particle precipitation during 7 January 2005 storm
and Kawano, H.: The GEOTAIL Magnetic Field Experiment, J.Geomagn. Geoelectr., 46, 7–21, 1994.
Maus, S., MacMillan, S., Chernova, T., Choi, S., Dater, D.,Golovkov, V., Lesur, V., Lowes, F., Luhr, H., Mai, W., McLean,S., Olsen, N., Rother, M., Sabaka, T., Thomson, A., and Zvereva,T.: The 10th generation international geomagnetic referencefield, Phys. Earth Planet. In., 151, 320322, 2005.
McComas, D., Bame, S., Barker, P., Feldman, W., Phillips, J., Riley,P., and Griffee, J.: Solar Wind Electron Proton Alpha Monitor(SWEPAM) for the Advanced Composition Explorer, Space Sci.Rev., 86, 563–612, 1998.
Ortner, J., Hultqvist, B., Brown, R., Hartz, T., Holt, O., Land-mark, B., Hook, J., and Leinbach, H.: Cosmic noise absorp-tion accompanying geomagnetic storm sudden commencements,J. Geophys. Res., 67, 4169–4186, 1962.
Osepian, A. and Kirkwood, S.: Cosmic radio-noise absorptionbursts caused by solar wind shocks, Ann. Geophys., 22, 2973–2987, 2004,http://www.ann-geophys.net/22/2973/2004/.
Parks, G., Arnoldy, R., Lezniak, T., and Winckler, J.: Correlatedeffects of energetic electrons at the 6.6Re equator and the auroralzone during magnetospheric substorms, Radio Sci., 3, 715–719,1968.
Perona, G.: Theory on the precipitation of magnetospheric electronsat the time of sudden commencement, J. Geophys. Res., 77, 101–111, 1972.
Richardson, I., Cliver, E., and Cane, H.: Sources of geomag-netic storms for solar minimum and maximum conditions during1972–2000, Geophys. Res. Lett., 28, 2567–2572, 2001.
Rosen, L. and Winckler, J.: Evidence for the large-scale azimuthaldrift of electron precipitation during magnetospheric substorms,J. Geophys. Res., 75, 5576–5581, 1970.
Smith, C., L’Heureux, J., Ness, N., Acuna, M., Burlaga, L., andScheifele, J.: The ACE Magnetic Fields Experiment, Space Sci.Rev., 86, 613–632, 1998.
Stauning, P.: Investigations of ionospheric radio wave absorptionprocesses using imaging riometer techniques, J. Atmos. Terr.Phys., 58, 753–764, 1996.
Takeuchi, T., Araki, T., Viljanen, A., and Watermann, J.: Ge-omagnetic negative sudden impulses: Interplanetary causesand polarization distribution, J. Geophys. Res., 107, A7,doi:10.1029/2001JA900152, 2002.
Taylor, J., Lester, M., and Yeoman, T.: A superposed epoch analysisof geomagnetic storms, Ann. Geophys., 12, 612–624, 1994,http://www.ann-geophys.net/12/612/1994/.
Tsyganenko, N.: Modeling the Earth’s magnetospheric field con-fined within a realistic magnetospause, J. Geophys. Res., 100,5599–5612, 1995.
Wanliss, J. and Showalter, K.: High-resolution global storm in-dex: Dst versus SYM-H, J. Geophys. Res., 111, A02202,doi:10.1029/2005JA011034, 2006.
Ann. Geophys., 25, 2053–2068, 2007 www.ann-geophys.net/25/2053/2007/
Related Documents