AN EQUAL EXIT? Marley Morris July 2018 Institute for Public Policy Research BRIEFING THE DISTRIBUTIONAL CONSEQUENCES OF LEAVING THE EU

Welcome message from author
This document is posted to help you gain knowledge. Please leave a comment to let me know what you think about it! Share it to your friends and learn new things together.
Transcript
AN EQUAL EXIT?
Marley Morris
July 2018
Institute for Public Policy Research
BRIEFING
THE DISTRIBUTIONAL CONSEQUENCES OF LEAVING THE EU
ABOUT IPPRIPPR, the Institute for Public Policy Research, is the UK’s leading progressive think tank. We are an independent charitable organisation with our main offices in London. IPPR North, IPPR’s dedicated think tank for the North of England, operates out of offices in Manchester and Newcastle, and IPPR Scotland, our dedicated think tank for Scotland, is based in Edinburgh.
Our purpose is to conduct and promote research into, and the education of the public in, the economic, social and political sciences, science and technology, the voluntary sector and social enterprise, public services, and industry and commerce.
IPPR 14 Buckingham Street London WC2N 6DF T: +44 (0)20 7470 6100 E: [email protected] www.ippr.org Registered charity no: 800065 (England and Wales), SC046557 (Scotland)
This paper was first published in July 2018. © IPPR 2018
The contents and opinions expressed in this paper are those of the authors' only.
The progressive policy think tank
An equal exit? The distributional consequences of leaving the EU 1IPPR BRIEFING
CONTENTS
Summary ..........................................................................................................................3
Introduction ....................................................................................................................5
Impacts across the income distribution ................................................................. 7
Impacts across nations, regions and localities ................................................... 11
Impacts for men and women .................................................................................... 17
Impacts across ethnic groups ..................................................................................19
Conclusion .....................................................................................................................21
References ....................................................................................................................23
An equal exit? The distributional consequences of leaving the EU2 IPPR BRIEFING
ABOUT THE AUTHORMarley Morris is a senior research fellow at IPPR.
ACKNOWLEDGEMENTS
I would like to thank the Barrow Cadbury Trust for their generous support of this project, without which the research would not have been possible, and in particular to Clare Payne for her comments and advice on this briefing. I am also very grateful to Nikhil Datta, Phillip McCann, Jonathan Portes, Dennis Novy and Anand Menon for their comments on earlier drafts of this paper and to Swati Dhingra , Holger Breinlich, and Hanwei Huang for their help and advice with the research. At IPPR, my thanks go to Phoebe Griffith, Tom Kibasi, Catherine Colebrook, Russell Gunson, Luke Raikes, Joe Dromey, Paulius Mackela and Carys Roberts for their advice and feedback throughout the course of the research, and to Richard Maclean and Abi Hynes for their support with copyediting and publication design. All errors and omissions remain my own.
DownloadThis document is available to download as a free PDF and in other formats at:http://www.ippr.org/research/publications/an-equal-exit
CitationIf you are using this document in your own writing, our preferred citation is:Morris M (2018) An equal exit? The distributional consequences of leaving the EU, IPPR. http://www.ippr.org/research/publications/an-equal-exit
Permission to shareThis document is published under a creative commons licence: Attribution-NonCommercial-NoDerivs 2.0 UK http://creativecommons.org/licenses/by-nc-nd/2.0/uk/ For commercial use, please contact [email protected]
An equal exit? The distributional consequences of leaving the EU 3IPPR BRIEFING
SUMMARY
The UK’s vote to leave the EU arose in part from deep social and geographical divides across the country. But could the decision to leave in turn impact on inequalities? In the two years since the referendum, some have argued that Brexit could boost the incomes of poorer groups through cheaper food prices, while others have argued that the most vulnerable groups and regions would bear the greatest burden of a ‘hard’ Brexit. Based on data on GVA impacts and price impacts, this briefing tests these claims and explores how the effects on trade of Brexit could influence inequalities across income groups, geographies, genders and ethnicities.
We find that there is a relatively weak relationship between the expected impact of Brexit by sector and a sector’s average wage, with higher paid sectors somewhat more likely to be negatively affected by Brexit. We also find that price impacts have a broadly neutral effect on income inequality. Our analysis suggests that, while Brexit is unlikely to worsen income inequality, all income groups - including the poorest - will face negative impacts. At the same time, there is little evidence that post-Brexit trade deals will benefit the worst-off overall; any reductions in import tariffs would be unlikely to compensate for the increase in prices due to Brexit-induced trade barriers between the UK and the EU.
The research on the geographical impacts of Brexit points in different directions: on the one hand, analysis of potential impacts by the LSE suggests that GVA impacts in London and the South East will be greatest because they have the highest concentration of services industries, which will be hit the hardest; on the other hand, analysis of EU exposure by City-REDI indicates that the Midlands and the north of England are most at risk because they have stronger trade links with the EU. Our analysis of new HMRC goods trade data suggests that it is areas outside of London – including Flintshire and Wrekham, Sunderland, Telford and Wrekin, south and west Derbyshire, and Luton – that are most dependent on EU goods exports. Therefore the geographical implications of Brexit differ depending on the measure used.
With respect to geographical price impacts, we find that areas outside London will be most affected by price increases brought about by new trade barriers after Brexit. London is least affected because a greater proportion of households’ expenditure goes on housing costs, which are not expected to be significantly impacted by Brexit. This reflects previous findings on the distributional impacts of inflation since the referendum.
Our analysis of the consequences of GVA impacts for gender indicates no evidence of a differential impact in the case of a soft Brexit, and a marginally higher impact for women in the case of a hard Brexit. We also find no evidence of a difference in price impacts for men and women.
In terms of ethnicity, we again find no evidence that the GVA impacts will affect ethnic groups differently in the case of a soft Brexit. We find that Asian/Asian British and Black/Black British groups are somewhat more affected in the case of a hard Brexit, because they tend to work in services industries which are more likely to suffer (notably finance and other business services). On the other hand, we find that price impacts will affect ethnic minority households less than White households, because their share of spending on housing his higher. This corresponds with our regional results, as London has a higher share of ethnic minority residents than other parts of the country.

An equal exit? The distributional consequences of leaving the EU4 IPPR BRIEFING
Overall, our analysis suggests that claims that Brexit will benefit the worst off or entrench inequalities further as too simplistic. The available research suggests that exiting the EU – in particular a hard Brexit – will have a negative GVA and price impact across different income groups, regions, genders and ethnicities, but it will not necessarily increase inequalities. The precise impacts will depend on the nature of the final deal and on how the government manages the impacts of Brexit on regions and sectors after the UK leaves the EU. An agreement that protects the UK and the EU’s trading relationship – such as our proposed ‘shared market’ model, which proposes regulatory alignment with the single market alongside a comprehensive UK-EU customs union – should help to minimise any negative economic effects, including for the most vulnerable groups.
An equal exit? The distributional consequences of leaving the EU 5IPPR BRIEFING
INTRODUCTION
The UK economy’s structural inequalities long pre-date the UK’s vote to leave the EU (IPPR 2017). The UK is one of the most unequal counties in western Europe: in 2015, there was a 11-fold difference in income between the poorest 10 per cent and the richest 10 per cent, larger than Denmark, France and Germany. Alongside these stubbornly persistent inequalities in income, the UK has deep geographical imbalances: almost 40 per cent of total UK output is now concentrated in London and the South East (ibid).
Moreover, the recent gender pay gap reporting and race equality audits have revealed stark divides in the labour market and the provision of public services. In 81 per cent of occupations, women on average earn less than men (Colebrook et al 2018). Black and Pakistani/Bangladeshi groups are paid less on average than White groups and tend to have lower rates of employment (Cabinet Office 2017).
A number of political scientists have argued that some of these inequalities played a critical role in the UK’s decision to leave the EU (for example Darvas 2016). Voting was notably split along class, age, educational and regional lines. Poorer areas tended to be more likely to vote leave, though of course this does not necessarily prove a causal link (ibid). Nevertheless, many have concluded that the vote for Brexit was – at least in part – a message of anger and disillusionment from those who felt excluded from the UK’s political and economic decision-making process (Goodwin and Heath 2016).
But while it has been argued that the referendum result was in part a product of the UK’s entrenched inequalities, the act of EU withdrawal itself may in turn have consequences for these same inequalities, and indeed for other types of inequalities as well. Some have claimed that leaving the EU could help to reduce income inequality, because new free trade agreements with third countries could reduce the price of basic goods, which are more often bought by those on poorer incomes (Leave means Leave et al 2017). There have also been suggestions that leaving the single market would have a particularly negative effect on the financial sector in London, which could help to rebalance the economy. On the other hand, others have argued that trade barriers between the UK and the EU could have the most damaging effect on the poorest, because it could have a disproportionate impact for less well-off regions and industries.
This briefing tries to assess these claims. Drawing together new research and secondary analysis, we explore the potential distributional impacts of Brexit – focusing in particular on the trade impact on income groups, nations and regions, gender, and ethnicity. We focus our analysis on the implications of new trading relationships between the UK and the EU after Brexit; we do not include other potential impacts – such as on migration or foreign investment – and how these might affect inequalities.
For each section, we primarily consider two measures of trade impacts for different Brexit scenarios: GVA impacts – ie the impacts on the value of goods and services each sector/region contributes to the economy – and price impacts – ie the impacts on final consumer prices.
We explore differential impacts for both GVA and price changes. With respect to GVA impacts, we identify how these might affect groups in different ways by looking at the distribution of employment across sectors (based on the Labour
An equal exit? The distributional consequences of leaving the EU6 IPPR BRIEFING
Force Survey). Simply put, people are employed in different sectors, and if certain groups are concentrated in sectors that are expected to be more affected due to Brexit, then they are more likely to be exposed to Brexit-related GVA changes.
With respect to price impacts, we identify how these might affect groups in different ways by looking at the distribution of household expenditure (based on the Living Costs and Food Survey). Simply put, households spend their money on different things, and if certain households spend a greater share of their expenditure in areas where prices are expected to increase more steeply due to Brexit, then they are more likely to be exposed to Brexit-related price changes.
For the GVA impacts, we draw on the analysis by LSE (Dhingra et al 2017a) of the potential sectoral impacts of a ‘soft’ and ‘hard’ Brexit. A ‘soft’ Brexit is defined as a Norway-style Brexit, where the UK continues to participate in the single market, but is not within a customs union (which would entail some non-tariff barriers). A ‘hard’ Brexit is defined as withdrawal without any deal, which would result in the UK trading with the EU on WTO terms (which would entail tariff barriers and significant non-tariff barriers). Based on a general equilibrium model, the LSE’s study calculates GVA impacts across 31 broad sectors. We then compare these sectoral impacts with data on the employment breakdown of each sector to analyse whether the sectoral impacts could affect certain groups more than others.
For the price impacts, we draw on a separate LSE study (Breinlich et al 2016b), which uses the same underlying general equilibrium model as Dhingra et al (2017a). This calculates price impacts across 13 sectors and uses data on gross household expenditure to weight trade-induced changes in real household income by the distribution of spending across different product groups.
For income groups, geographies, genders and ethnicities, we assess the potential distributional effects of both GVA and price impacts. The picture we find is a complex one: the impacts of leaving the EU are multifaceted and interlinked, and will depend on the precise nature of the final UK-EU agreement. But we also find some trends that provide an indication of how Brexit may affect, augment and potentially reshape the UK’s inequalities over the coming years.
An equal exit? The distributional consequences of leaving the EU 7IPPR BRIEFING
IMPACTS ACROSS THE INCOME DISTRIBUTION
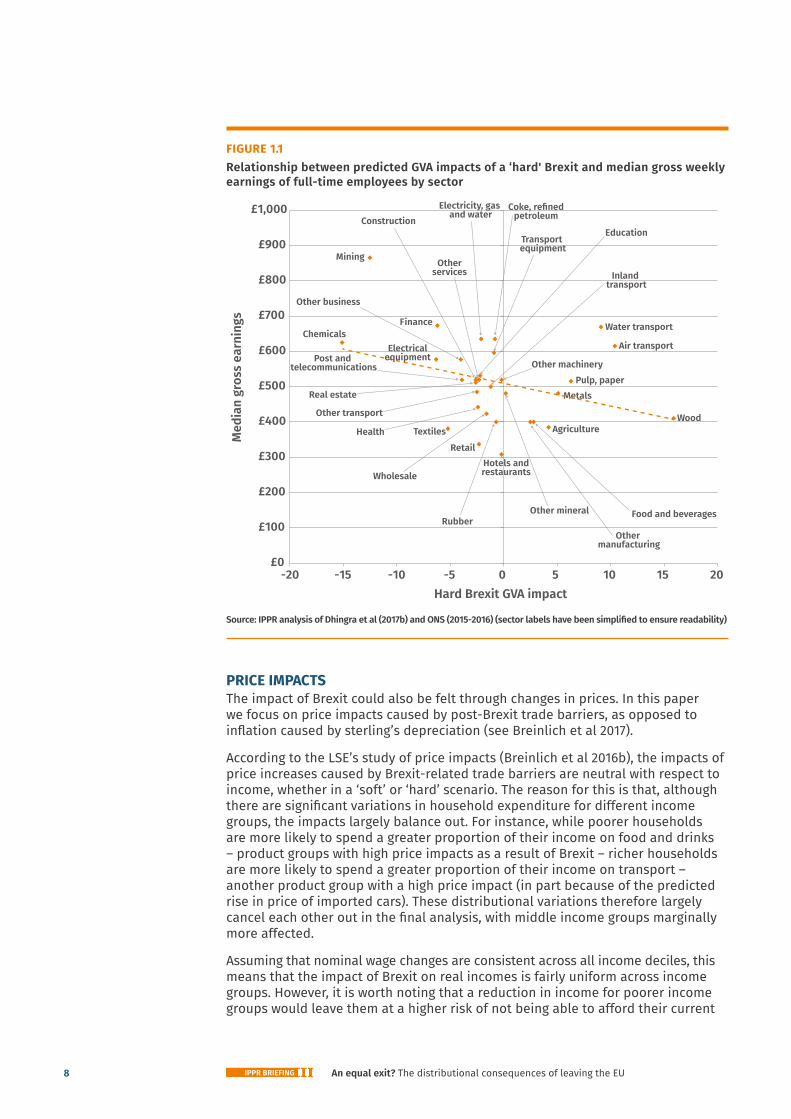
GVA IMPACTSTo understand the potential impact of the Brexit GVA shock on different income groups, we explore whether there is a correlation between the size of the projected sectoral impacts under a ‘soft’ or ‘hard’ scenario and average weekly earnings by sector. Figure 1.1 plots GVA impact due to Brexit against median gross weekly wages of full-time employees for each of the 31 sectors available (we plot the outcomes of a hard Brexit but there are no significant differences between the results described here and the correlation between wages and GVA impacts under a soft Brexit).
The scatterplot shows there is a weak correlation between Brexit GVA impacts and gross wages. Estimating the strength of the association between the two variables (assuming it is linear), we find that the Pearson correlation coefficient r is -0.33 – which becomes smaller when the outlier of ‘mining and quarrying’ (a small sector with very high median wages) is discounted (r=-0.17). This indicates that more highly paid sectors are somewhat more likely to be negatively affected by Brexit. But overall the relationship between the estimated sector GVA shock and average sector wage is relatively weak. Some of the sectors with the greatest shocks are relatively high-paid (eg financial intermediation), while others are relatively low-paid (eg textiles). The impacts of trade restrictions after Brexit will therefore by no means be limited simply to high-paid sectors such as finance.
Of course, this does not rule out intra-sector distributional impacts. It is possible that low-paid workers are most at risk of Brexit-related impacts, even in sectors that are on average well-paid. For instance, lower-paid or less senior staff members in firms considering downsizing or relocating due to Brexit may be at greater risk of redundancy. To understand these distributional impacts would require further firm-level analysis, which is beyond the scope of this briefing.
This analysis also highlights that the impacts of Brexit on the lowest paid sectors could be quite diverse. Retail, hotels and restaurants, textiles, and agriculture are the lowest paid sectors according to our analysis, but the GVA impacts differ considerably. Retail and hotels and restaurants are largely non-tradable sectors, so direct impacts of trade barriers are smaller, as reflected in figure 1.1. But interestingly, while the impacts on textiles and agriculture are larger, they point in different directions.
An equal exit? The distributional consequences of leaving the EU8 IPPR BRIEFING
FIGURE 1.1Relationship between predicted GVA impacts of a ‘hard' Brexit and median gross weekly earnings of full-time employees by sector
Source: IPPR analysis of Dhingra et al (2017b) and ONS (2015-2016) (sector labels have been simplified to ensure readability)
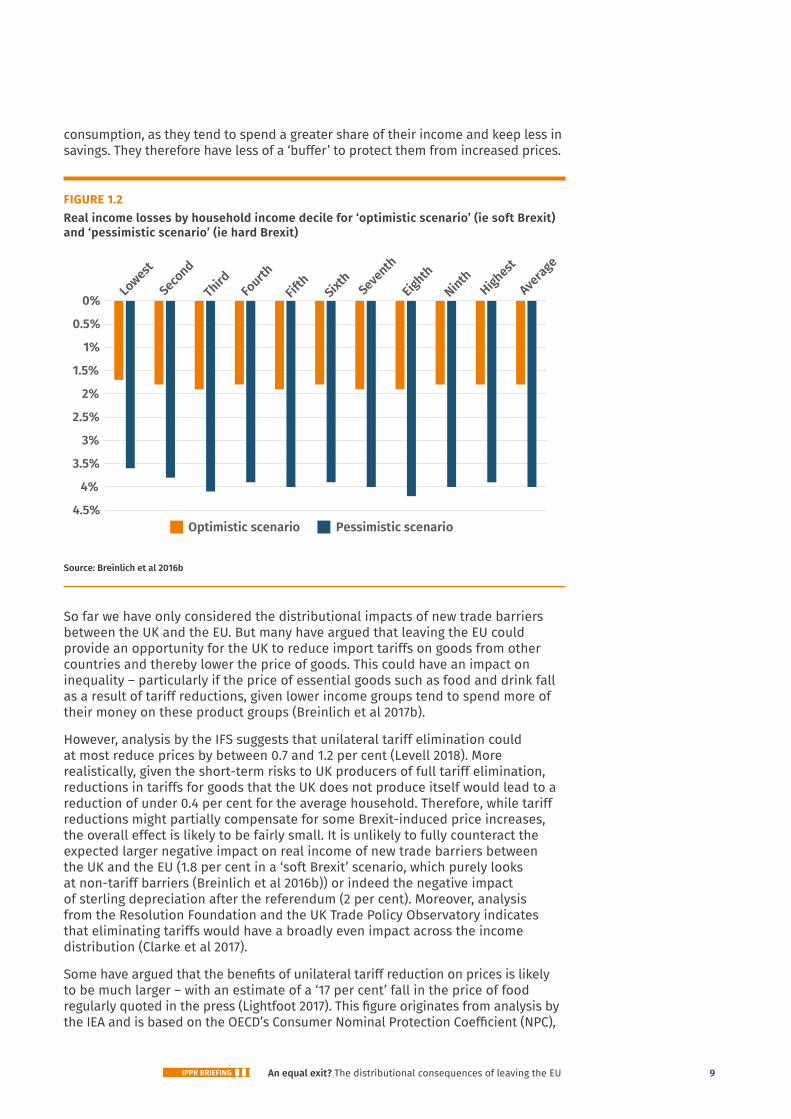
PRICE IMPACTSThe impact of Brexit could also be felt through changes in prices. In this paper we focus on price impacts caused by post-Brexit trade barriers, as opposed to inflation caused by sterling’s depreciation (see Breinlich et al 2017).
According to the LSE’s study of price impacts (Breinlich et al 2016b), the impacts of price increases caused by Brexit-related trade barriers are neutral with respect to income, whether in a ‘soft’ or ‘hard’ scenario. The reason for this is that, although there are significant variations in household expenditure for different income groups, the impacts largely balance out. For instance, while poorer households are more likely to spend a greater proportion of their income on food and drinks – product groups with high price impacts as a result of Brexit – richer households are more likely to spend a greater proportion of their income on transport – another product group with a high price impact (in part because of the predicted rise in price of imported cars). These distributional variations therefore largely cancel each other out in the final analysis, with middle income groups marginally more affected.
Assuming that nominal wage changes are consistent across all income deciles, this means that the impact of Brexit on real incomes is fairly uniform across income groups. However, it is worth noting that a reduction in income for poorer income groups would leave them at a higher risk of not being able to afford their current
Water transport
Air transport
WoodAgriculture
Pulp, paper
Health
Wholesale
RubberFood and beverages
Other manufacturing
Electricity, gas and water
Coke, refinedpetroleum
Inland transport
Real estate
Post and telecommunications
Transport equipment
Other machinery
Education
Metals
Mining
ChemicalsFinance
Textiles
Retail Hotels andrestaurants
Other transport
Other mineral
Other business
Otherservices
Construction
£0
£100
£200
£300
£400
£500
£600
£700
£800
£900
£1,000
-20 -15 -10 -5 0 5 10 15 20
Med
ian
gros
s ea
rnin
gs
Hard Brexit GVA impact
Electricalequipment
An equal exit? The distributional consequences of leaving the EU 9IPPR BRIEFING
consumption, as they tend to spend a greater share of their income and keep less in savings. They therefore have less of a ‘buffer’ to protect them from increased prices.
FIGURE 1.2Real income losses by household income decile for ‘optimistic scenario’ (ie soft Brexit) and ‘pessimistic scenario’ (ie hard Brexit)
Source: Breinlich et al 2016b
So far we have only considered the distributional impacts of new trade barriers between the UK and the EU. But many have argued that leaving the EU could provide an opportunity for the UK to reduce import tariffs on goods from other countries and thereby lower the price of goods. This could have an impact on inequality – particularly if the price of essential goods such as food and drink fall as a result of tariff reductions, given lower income groups tend to spend more of their money on these product groups (Breinlich et al 2017b).
However, analysis by the IFS suggests that unilateral tariff elimination could at most reduce prices by between 0.7 and 1.2 per cent (Levell 2018). More realistically, given the short-term risks to UK producers of full tariff elimination, reductions in tariffs for goods that the UK does not produce itself would lead to a reduction of under 0.4 per cent for the average household. Therefore, while tariff reductions might partially compensate for some Brexit-induced price increases, the overall effect is likely to be fairly small. It is unlikely to fully counteract the expected larger negative impact on real income of new trade barriers between the UK and the EU (1.8 per cent in a ‘soft Brexit’ scenario, which purely looks at non-tariff barriers (Breinlich et al 2016b)) or indeed the negative impact of sterling depreciation after the referendum (2 per cent). Moreover, analysis from the Resolution Foundation and the UK Trade Policy Observatory indicates that eliminating tariffs would have a broadly even impact across the income distribution (Clarke et al 2017).
Some have argued that the benefits of unilateral tariff reduction on prices is likely to be much larger – with an estimate of a ‘17 per cent’ fall in the price of food regularly quoted in the press (Lightfoot 2017). This figure originates from analysis by the IEA and is based on the OECD’s Consumer Nominal Protection Coefficient (NPC),
4.5%
4%
3.5%
3%
2.5%
2%
1.5%
1%
0.5%
0% Lowest
Second
ThirdFo
urth
Fifth
Sixth
Seventh
EighthNinth
Highest
Average
Optimistic scenario Pessimistic scenario
An equal exit? The distributional consequences of leaving the EU10 IPPR BRIEFING
which measures the ratio between world food prices and domestic prices for OECD countries (Niemietz 2013). While this figure provides an indication of the impact of agricultural protection on consumers, it cannot be interpreted directly as the impact of the removal of protections on final consumer prices. This is because it measures domestic prices at the farmgate level, rather than at the retail level, and only one component of retail consumer prices is directly affected by agricultural support. (The IFS study takes this into account.) Moreover, the IEA’s analysis is now out of date: following the same methodology based on the latest NPC figures indicates a price difference of only 6 per cent (OECD 2017). This reflects the fact that the EU’s agricultural policy has become less distortive over recent decades.
Another way that the UK could reduce prices is through new trade agreements with non-EU countries after Brexit, rather than unilateral tariff reductions. This would have the potential benefit of reducing prices via removing non-tariff barriers as well as tariffs. However, again it is unlikely that any price reductions would compensate post-Brexit price increases. Estimates by the LSE suggest that, overall, the EU’s previous trade agreements with third countries have reduced consumer prices in the UK by around 0.5 per cent, and that the projected price reductions for an EU-US and EU-Japan trade agreement are 0.4 and 0.2 per cent respectively (Breinlich et al 2016a). Given that the EU will continue to negotiate trade deals with third countries once the UK leaves, it is hard to see how the UK could significantly outpace the EU in negotiating agreements that lower consumer prices, to the point where this would compensate the expected price increases due to new trade barriers between the UK and the EU.
Of course, it is possible that the UK could focus its trade energies after Brexit on deals that reduce consumer prices with respect to product groups that tend to be bought by households on lower incomes (eg food and drink). This could help to reduce income inequality. But our review of the analysis suggests that the overall position of the poorest income deciles is likely to be negative: the reduction in income due to Brexit-related trade barriers will most likely not be fully compensated by price reductions due to unilateral tariff elimination or third country trade deals. In summary, a progressive trade policy post-Brexit might help to reduce income inequality, but (all other things being equal) it is unlikely to prevent the poorest income groups from ending up worse off than they would otherwise be.
An equal exit? The distributional consequences of leaving the EU 11IPPR BRIEFING
IMPACTS ACROSS NATIONS, REGIONS AND LOCALITIES
GVA IMPACTSWe now turn to the geographical implications of Brexit. The current body of work on national, regional and local impacts is complex and points to somewhat divergent results. But there are some common themes, particularly with regard to the resilience of different parts of the UK to the shock of Brexit.
One study by the LSE’s Centre for Economic Performance (Dhingra et al 2017b) has estimated the local GVA effects of Brexit from their original general equilibrium model (Dhingra et al 2017a). By taking the estimated sectoral impacts of Brexit and applying these calculations to data on the employment shares of each local authority, the LSE study estimates the local GVA shock of a ‘soft’ and ‘hard’ Brexit. The analysis suggests that local authorities in London and the South East would be most impacted by EU withdrawal – in particular local authorities in the financial centre of London, such as the City of London and Tower Hamlets (as well as Aberdeen). This is because these local authorities have the highest concentration of people employed in services sectors – particularly financial services and business activities – and the analysis suggests that the GVA impacts of Brexit in services sectors are on average more negative.
However, the LSE analysis does not take into account the varying trade patterns of individual sectors across each part of the UK. Evidence from HMRC (2018) suggests that regions outside London and the South East export more goods to the EU in proportion to the size of their economies. Figure 2.1 highlights the regions and localities with the highest ratio of EU goods exports to GVA (as GVA and exports are measured in different terms, this should be seen as an indicative ratio rather than a percentage). The areas with the highest EU goods exports according to this measure are Flintshire and Wrexham, Sunderland, Telford and Wrekin, South and West Derbyshire, and Luton. A number of these regions contain major car factories, which may help to explain this pattern. (It is important to note that the local analysis on the right hand side excludes certain energy exports, which could underestimate the scale of EU exports in parts of the UK, particularly Scotland.)
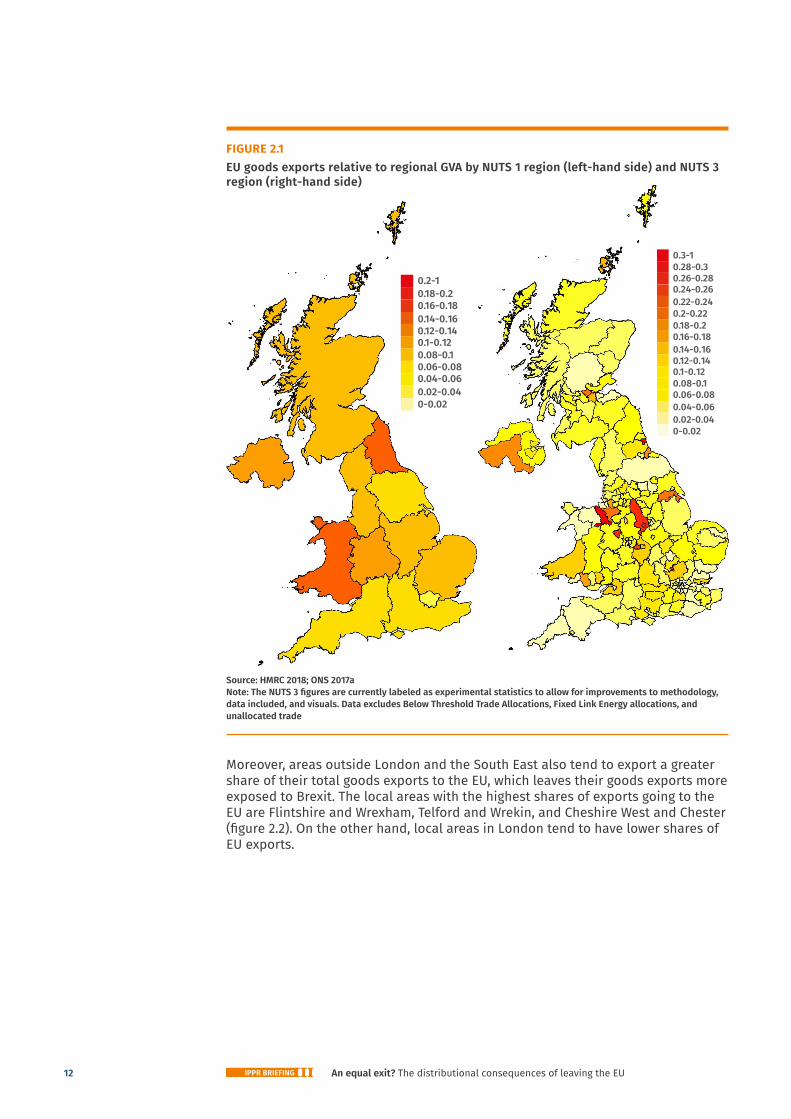
An equal exit? The distributional consequences of leaving the EU12 IPPR BRIEFING
FIGURE 2.1EU goods exports relative to regional GVA by NUTS 1 region (left-hand side) and NUTS 3 region (right-hand side)
Source: HMRC 2018; ONS 2017a Note: The NUTS 3 figures are currently labeled as experimental statistics to allow for improvements to methodology, data included, and visuals. Data excludes Below Threshold Trade Allocations, Fixed Link Energy allocations, and unallocated trade
Moreover, areas outside London and the South East also tend to export a greater share of their total goods exports to the EU, which leaves their goods exports more exposed to Brexit. The local areas with the highest shares of exports going to the EU are Flintshire and Wrexham, Telford and Wrekin, and Cheshire West and Chester (figure 2.2). On the other hand, local areas in London tend to have lower shares of EU exports.
0.2-10.18-0.20.16-0.180.14-0.160.12-0.140.1-0.120.08-0.10.06-0.080.04-0.060.02-0.040-0.02
0.3-1
0.18-0.20.16-0.180.14-0.160.12-0.140.1-0.12
0.28-0.30.26-0.280.24-0.260.22-0.240.2-0.22
0.08-0.10.06-0.080.04-0.060.02-0.040-0.02
An equal exit? The distributional consequences of leaving the EU 13IPPR BRIEFING
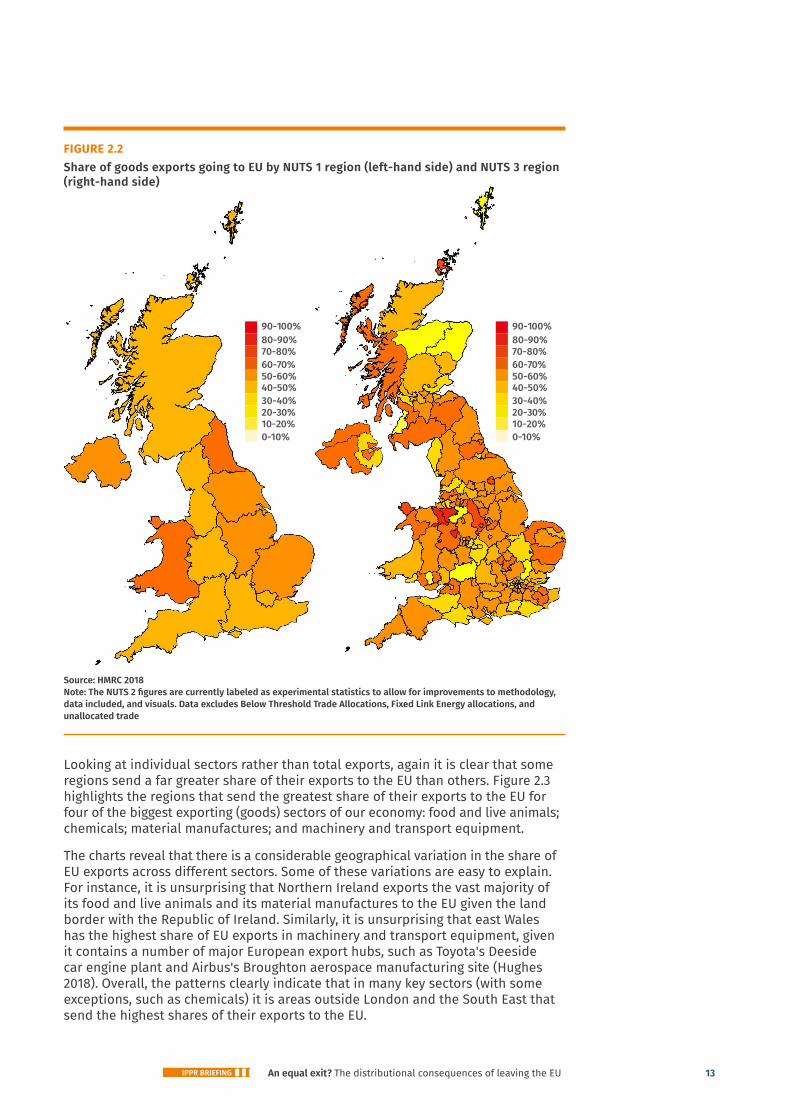
FIGURE 2.2Share of goods exports going to EU by NUTS 1 region (left-hand side) and NUTS 3 region (right-hand side)
Source: HMRC 2018 Note: The NUTS 2 figures are currently labeled as experimental statistics to allow for improvements to methodology, data included, and visuals. Data excludes Below Threshold Trade Allocations, Fixed Link Energy allocations, and unallocated trade
Looking at individual sectors rather than total exports, again it is clear that some regions send a far greater share of their exports to the EU than others. Figure 2.3 highlights the regions that send the greatest share of their exports to the EU for four of the biggest exporting (goods) sectors of our economy: food and live animals; chemicals; material manufactures; and machinery and transport equipment.
The charts reveal that there is a considerable geographical variation in the share of EU exports across different sectors. Some of these variations are easy to explain. For instance, it is unsurprising that Northern Ireland exports the vast majority of its food and live animals and its material manufactures to the EU given the land border with the Republic of Ireland. Similarly, it is unsurprising that east Wales has the highest share of EU exports in machinery and transport equipment, given it contains a number of major European export hubs, such as Toyota's Deeside car engine plant and Airbus's Broughton aerospace manufacturing site (Hughes 2018). Overall, the patterns clearly indicate that in many key sectors (with some exceptions, such as chemicals) it is areas outside London and the South East that send the highest shares of their exports to the EU.
90-100%80-90%70-80%60-70%50-60%40-50%30-40%20-30%10-20%0-10%
90-100%80-90%70-80%60-70%50-60%40-50%30-40%20-30%10-20%0-10%
An equal exit? The distributional consequences of leaving the EU14 IPPR BRIEFING
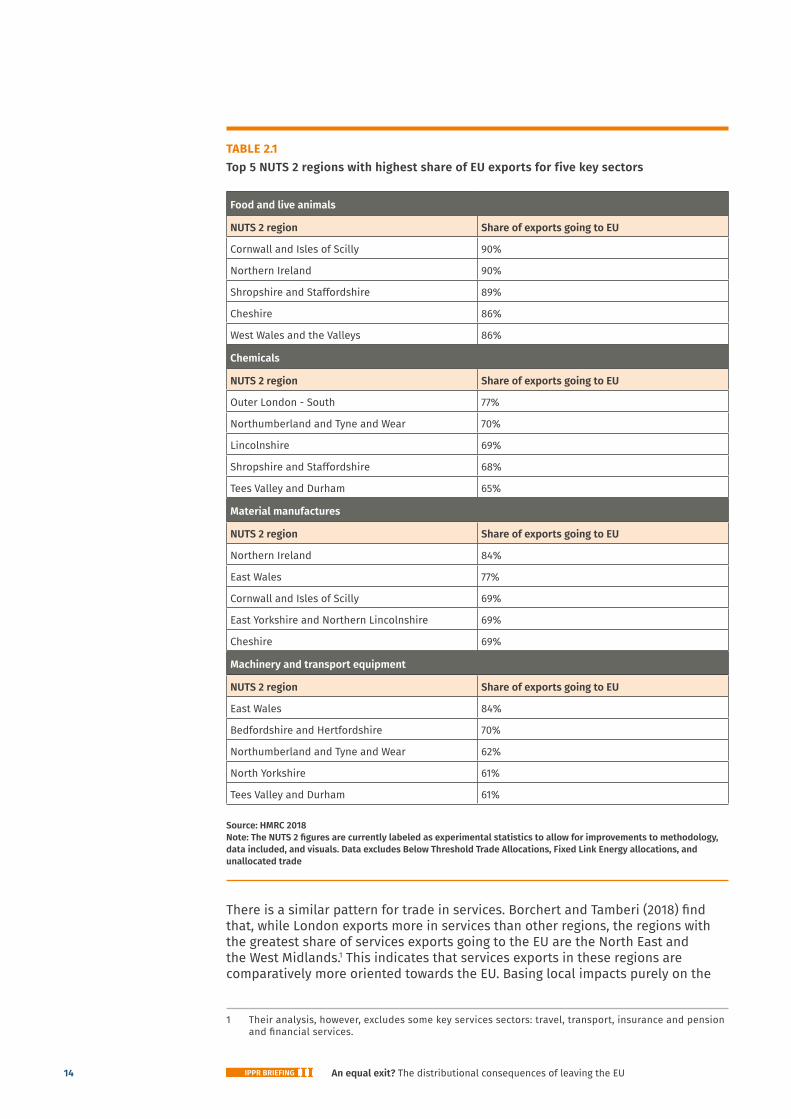
TABLE 2.1Top 5 NUTS 2 regions with highest share of EU exports for five key sectors
Food and live animals
NUTS 2 region Share of exports going to EU
Cornwall and Isles of Scilly 90%
Northern Ireland 90%
Shropshire and Staffordshire 89%
Cheshire 86%
West Wales and the Valleys 86%
Chemicals
NUTS 2 region Share of exports going to EU
Outer London - South 77%
Northumberland and Tyne and Wear 70%
Lincolnshire 69%
Shropshire and Staffordshire 68%
Tees Valley and Durham 65%
Material manufactures
NUTS 2 region Share of exports going to EU
Northern Ireland 84%
East Wales 77%
Cornwall and Isles of Scilly 69%
East Yorkshire and Northern Lincolnshire 69%
Cheshire 69%
Machinery and transport equipment
NUTS 2 region Share of exports going to EU
East Wales 84%
Bedfordshire and Hertfordshire 70%
Northumberland and Tyne and Wear 62%
North Yorkshire 61%
Tees Valley and Durham 61% Source: HMRC 2018 Note: The NUTS 2 figures are currently labeled as experimental statistics to allow for improvements to methodology, data included, and visuals. Data excludes Below Threshold Trade Allocations, Fixed Link Energy allocations, and unallocated trade
There is a similar pattern for trade in services. Borchert and Tamberi (2018) find that, while London exports more in services than other regions, the regions with the greatest share of services exports going to the EU are the North East and the West Midlands.1 This indicates that services exports in these regions are comparatively more oriented towards the EU. Basing local impacts purely on the
1 Their analysis, however, excludes some key services sectors: travel, transport, insurance and pension and financial services.
An equal exit? The distributional consequences of leaving the EU 15IPPR BRIEFING
sectoral make-up of each locality may therefore understate the impacts of barriers in trade with the EU outside of London, with respect to both goods and services.
Building on this approach, a study by City-REDI (Chen et al 2017) uses a method that extends the World Input-Output Database (a global database of intermediate and final trade flows) to account for regional variations in trade patterns. This method recognises the criss-crossing nature of modern global trade: supply chains are often cross-border and goods and services may be traded between multiple countries in intermediate stages before reaching their final use. By isolating the domestic value added in exports embodied in UK-EU trade for each region of the UK, they are able to calculate the level of exposure each region has to EU trade. This measure is then considered in effect equivalent to the implications of Brexit in an extreme scenario where all trade links between the UK and the EU cease. According to this measure, the regions most exposed to EU trade are in fact in the Midlands and the north of England, rather than London and Scotland.
The reasons for the differences between these results are threefold. First, the two studies make use of different methodological approaches to measure the implications of Brexit: the City-REDI study measures EU trade exposure while the LSE study uses a general equilibrium model, taking into account substitution effects. Second, the studies model different trade scenarios: City-REDI’s trade exposure approach in effect indirectly models a ‘no-trade’ scenario while the LSE study models the FTA and EEA scenarios. Third, the studies use different approaches to estimate regional impacts: the City-REDI study accounts for differing sectoral trade patterns across the UK whereas the LSE study assumes these are uniform. This means that the LSE study suggests that those areas with high concentrations of services sectors (ie London and the South East) are most at risk, while the City-REDI study suggests that those areas more economically integrated with the EU (ie the Midlands and the north of England) are most at risk.
It is also worth noting two other studies that explore the geographical impacts of Brexit. A study by Cambridge Econometrics for the GLA found a greater negative impact of Brexit outside London, using a similar approach to the LSE; the reason for the different final results appears to be that the Cambridge Econometrics study made an effort to account for London’s resilience to economic shocks in its calculations (see the discussion on resilience below) (GLA 2018).
Finally, the government’s internal modelling also suggests that regions outside London and the South East are most likely to face economic losses because of their reliance on exports and their export composition. However, little further detail is given about the methodology, so it is hard to properly assess the results for the time being (House of Commons Exiting the EU Committee 2018).2
The short-to-medium term regional and local GVA effects of Brexit are therefore hard to determine with certainty. However, most studies suggest that in the long run it is areas outside London and the South East that are most likely to suffer from a downturn. This is because London and the South East are more resilient to economic shocks than the rest of the country (Dhingra et al 2017b). As with the financial crisis, even if the immediate economic shock is strongest in the South East because of the concentration of the financial services sector, the region’s skills make-up and track record of economic growth suggests that it is likely to rebound more quickly than other parts of the country.3
2 Interestingly the government study implies that those regions that export more in goods relative to services are more exposed to Brexit-related trade barriers; this is the reverse of the LSE’s analysis, which identifies services as more at risk than goods.
3 While this briefing does not focus on migration, it is worth noting that ending free movement is also likely to have significant variations in geographic impact. Most notably, London has a significantly higher share of EU workers than in other parts of the country.
An equal exit? The distributional consequences of leaving the EU16 IPPR BRIEFING
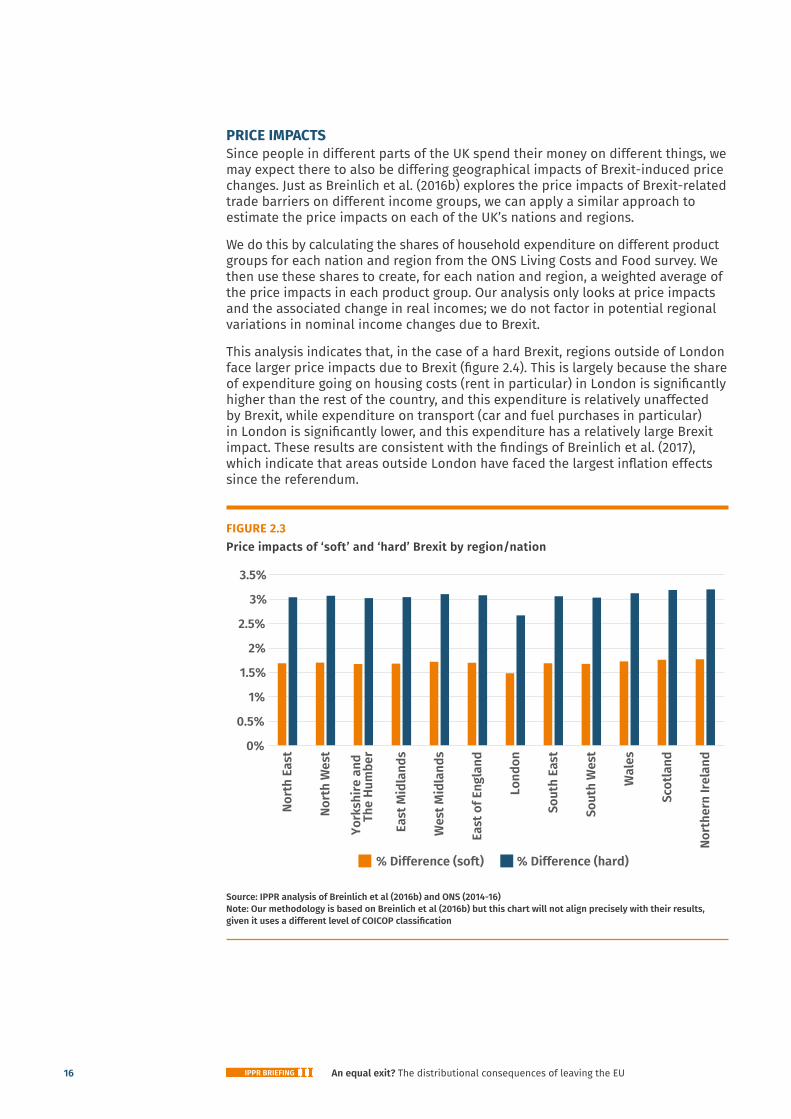
PRICE IMPACTSSince people in different parts of the UK spend their money on different things, we may expect there to also be differing geographical impacts of Brexit-induced price changes. Just as Breinlich et al. (2016b) explores the price impacts of Brexit-related trade barriers on different income groups, we can apply a similar approach to estimate the price impacts on each of the UK’s nations and regions.
We do this by calculating the shares of household expenditure on different product groups for each nation and region from the ONS Living Costs and Food survey. We then use these shares to create, for each nation and region, a weighted average of the price impacts in each product group. Our analysis only looks at price impacts and the associated change in real incomes; we do not factor in potential regional variations in nominal income changes due to Brexit.
This analysis indicates that, in the case of a hard Brexit, regions outside of London face larger price impacts due to Brexit (figure 2.4). This is largely because the share of expenditure going on housing costs (rent in particular) in London is significantly higher than the rest of the country, and this expenditure is relatively unaffected by Brexit, while expenditure on transport (car and fuel purchases in particular) in London is significantly lower, and this expenditure has a relatively large Brexit impact. These results are consistent with the findings of Breinlich et al. (2017), which indicate that areas outside London have faced the largest inflation effects since the referendum.
FIGURE 2.3Price impacts of ‘soft’ and ‘hard’ Brexit by region/nation
Source: IPPR analysis of Breinlich et al (2016b) and ONS (2014-16) Note: Our methodology is based on Breinlich et al (2016b) but this chart will not align precisely with their results, given it uses a different level of COICOP classification
3.5%
3%
2.5%
2%
1.5%
1%
0.5%
0%
Nort
h Ea
st
Nort
h W
est
York
shire
and
Th
e Hu
mbe
r
East
Mid
land
s
Wes
t Mid
land
s
East
of E
ngla
nd
Lond
on
Sout
h Ea
st
Sout
h W
est
Wal
es
Scot
land
Nort
hern
Irel
and
% Difference (soft) % Difference (hard)
An equal exit? The distributional consequences of leaving the EU 17IPPR BRIEFING
IMPACTS FOR MEN AND WOMEN
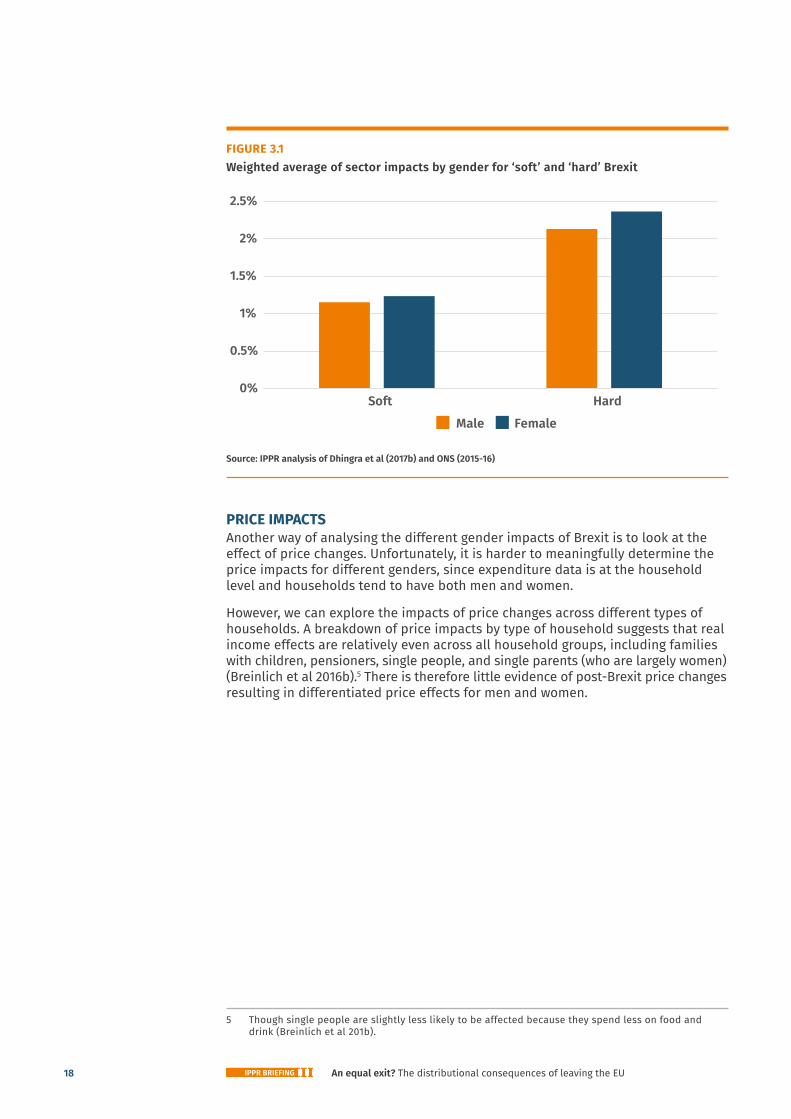
GVA IMPACTSHow might we be able to quantify the potential impacts of Brexit by gender? One way is to look at employment patterns. We use the same approach developed in the LSE’s study on the local economic effects of Brexit (Dhingra et al 2017b) to estimate the different impacts of Brexit on men and women. We draw on the sectoral GVA analysis and then weight these sectoral impacts using data on the employment patterns of men and women to calculate a weighted average of sectoral impacts by gender. This weighted average provides an indication of the relative impact of Brexit on each gender group: the more that the gender group is concentrated in a negatively affected sector, the greater the weighted average for that gender group.4
Using this approach, we find that the weighted average is the same for men and women in the event of a soft Brexit and marginally larger for women in the event of a hard Brexit (see figure 3.1). On the face of it, this result is somewhat surprising, as men tend to work in tradable sectors and we would expect the impact to be larger here. Yet while negative impacts are larger in certain goods sectors where men tend to work (for example, chemicals and electrical equipment), these are relatively small sectors. Moreover, there are some male-dominated sectors where impacts are predicted to be positive (eg agriculture, paper and publishing). On the other hand, women tend to work in services sectors (for example, education, health and social care, and retail), where the LSE’s analysis indicates that GVA impacts are more negative. While many of these services sectors are largely non-tradable, the LSE study suggests that Brexit-related trade barriers will nevertheless leave them indirectly impacted. Overall, this means that our analysis suggests both gender groups are affected by Brexit to a similar degree – with women slightly more affected in the event of a hard Brexit.
4 Reflecting Dhingra et al (2017b), the precise calculation for our weighted average is MaleEmploymentShares × NationalGVAShocks for men and FemaleEmploymentShares × NationalGVAShocks for women (where 's' stands for a sector).
An equal exit? The distributional consequences of leaving the EU18 IPPR BRIEFING
FIGURE 3.1Weighted average of sector impacts by gender for ‘soft’ and ‘hard’ Brexit
Source: IPPR analysis of Dhingra et al (2017b) and ONS (2015-16)
PRICE IMPACTSAnother way of analysing the different gender impacts of Brexit is to look at the effect of price changes. Unfortunately, it is harder to meaningfully determine the price impacts for different genders, since expenditure data is at the household level and households tend to have both men and women.
However, we can explore the impacts of price changes across different types of households. A breakdown of price impacts by type of household suggests that real income effects are relatively even across all household groups, including families with children, pensioners, single people, and single parents (who are largely women) (Breinlich et al 2016b).5 There is therefore little evidence of post-Brexit price changes resulting in differentiated price effects for men and women.
5 Though single people are slightly less likely to be affected because they spend less on food and drink (Breinlich et al 201b).
0%
0.5%
1%
1.5%
2%
2.5%
Soft Hard
Male Female
An equal exit? The distributional consequences of leaving the EU 19IPPR BRIEFING
IMPACTS ACROSS ETHNIC GROUPS
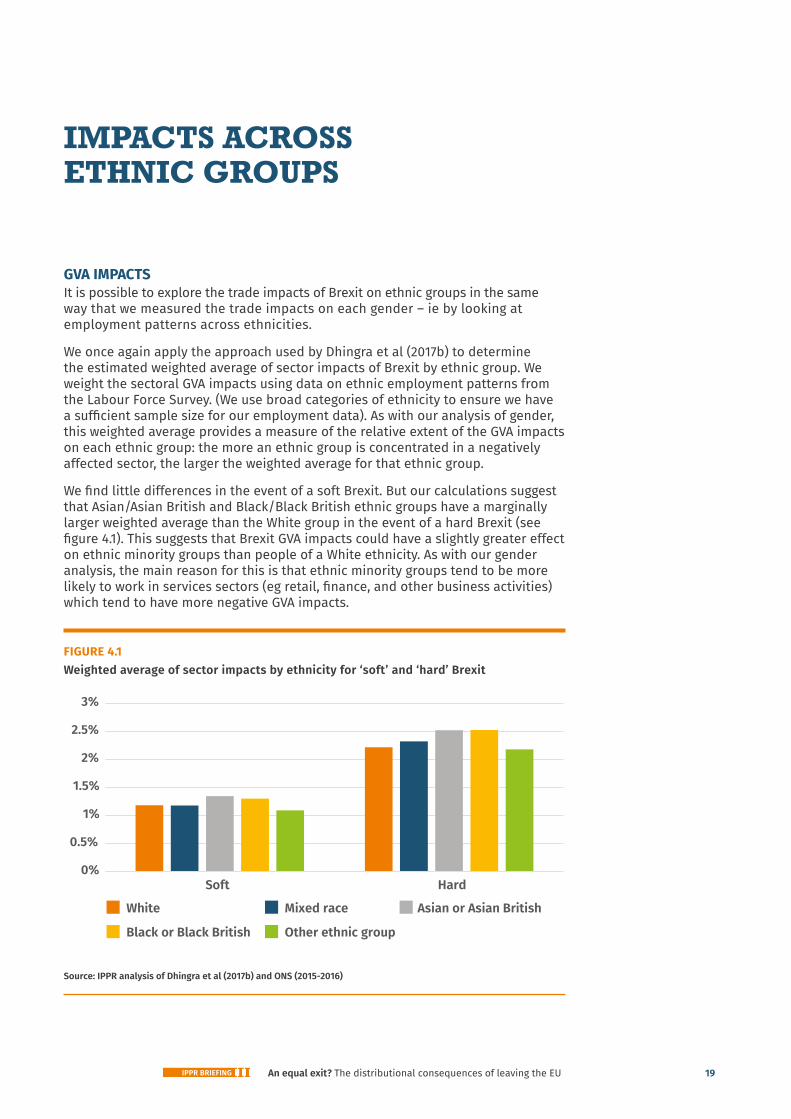
GVA IMPACTSIt is possible to explore the trade impacts of Brexit on ethnic groups in the same way that we measured the trade impacts on each gender – ie by looking at employment patterns across ethnicities.
We once again apply the approach used by Dhingra et al (2017b) to determine the estimated weighted average of sector impacts of Brexit by ethnic group. We weight the sectoral GVA impacts using data on ethnic employment patterns from the Labour Force Survey. (We use broad categories of ethnicity to ensure we have a sufficient sample size for our employment data). As with our analysis of gender, this weighted average provides a measure of the relative extent of the GVA impacts on each ethnic group: the more an ethnic group is concentrated in a negatively affected sector, the larger the weighted average for that ethnic group.
We find little differences in the event of a soft Brexit. But our calculations suggest that Asian/Asian British and Black/Black British ethnic groups have a marginally larger weighted average than the White group in the event of a hard Brexit (see figure 4.1). This suggests that Brexit GVA impacts could have a slightly greater effect on ethnic minority groups than people of a White ethnicity. As with our gender analysis, the main reason for this is that ethnic minority groups tend to be more likely to work in services sectors (eg retail, finance, and other business activities) which tend to have more negative GVA impacts.
FIGURE 4.1Weighted average of sector impacts by ethnicity for ‘soft’ and ‘hard’ Brexit
Source: IPPR analysis of Dhingra et al (2017b) and ONS (2015-2016)
3%
2.5%
2%
1.5%
1%
0.5%
0%Soft Hard
GVA shock by ethnicity
White Mixed race Asian or Asian British
Black or Black British Other ethnic group
An equal exit? The distributional consequences of leaving the EU20 IPPR BRIEFING
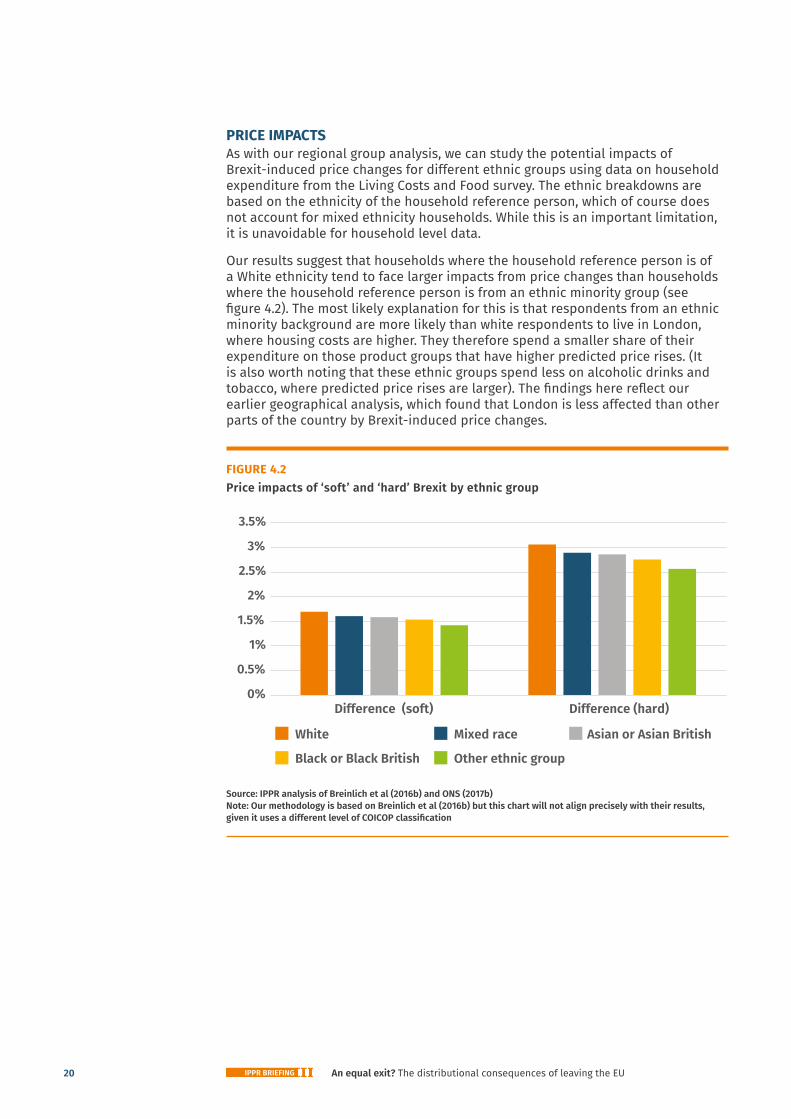
PRICE IMPACTSAs with our regional group analysis, we can study the potential impacts of Brexit-induced price changes for different ethnic groups using data on household expenditure from the Living Costs and Food survey. The ethnic breakdowns are based on the ethnicity of the household reference person, which of course does not account for mixed ethnicity households. While this is an important limitation, it is unavoidable for household level data.
Our results suggest that households where the household reference person is of a White ethnicity tend to face larger impacts from price changes than households where the household reference person is from an ethnic minority group (see figure 4.2). The most likely explanation for this is that respondents from an ethnic minority background are more likely than white respondents to live in London, where housing costs are higher. They therefore spend a smaller share of their expenditure on those product groups that have higher predicted price rises. (It is also worth noting that these ethnic groups spend less on alcoholic drinks and tobacco, where predicted price rises are larger). The findings here reflect our earlier geographical analysis, which found that London is less affected than other parts of the country by Brexit-induced price changes.
FIGURE 4.2Price impacts of ‘soft’ and ‘hard’ Brexit by ethnic group
Source: IPPR analysis of Breinlich et al (2016b) and ONS (2017b) Note: Our methodology is based on Breinlich et al (2016b) but this chart will not align precisely with their results, given it uses a different level of COICOP classification
3.5%
3%
2.5%
2%
1.5%
1%
0.5%
0%Difference (soft) Difference (hard)
White Mixed race Asian or Asian British
Black or Black British Other ethnic group
An equal exit? The distributional consequences of leaving the EU 21IPPR BRIEFING
CONCLUSION
Many partisan supporters of Remain or Leave have sought to portray the distributional effects of Brexit as straightforwardly positive or negative. In fact, our analysis suggests that the potential effects of Brexit on inequality are complex and multifaceted. We find that higher paid sectors are somewhat more likely to face more negative GVA impacts. But many low-paid sectors are also expected to be hit, especially under a hard Brexit. Price effects are likely to have little impact on income inequality. Yet, while Brexit may not increase inequality, it is likely to put greater pressure on people in poorer income groups, who spend a larger proportion of their income and have less in savings.
For regional inequality, the picture is mixed. On one hand, the sectors likely to be most negatively affected by Brexit (eg financial services and other business activities) tend to be concentrated in London and the South East. At the same time, for both goods and some services, it is in other parts of the country where the shares of exports going to the EU are at their highest. This could leave exporting businesses particularly exposed in some parts of the country – for instance, in Northern Ireland, where 90 per cent of food and live animal exports are sent to the EU, or in east Wales, where 84 per cent of machinery and transport equipment exports are sent to the EU. Moreover, over time London and the South East are likely to be more resilient to a Brexit-related economic shock. Regions and nations outside of London are also more likely to be hit by an increase in prices due to new trade barriers (as well as by the post-referendum rise in inflation due to the depreciation of sterling).
In terms of gender and ethnicity, an examination of employment patterns suggests that a soft Brexit will have little impact on equalities but that a hard Brexit could have a small negative impact. This is because women and ethnic minority groups tend to work in services sectors, which the LSE’s model suggests would be more negatively hit due to Brexit. Price impacts, however, would not necessarily have the same effect: there is unlikely to be a differential impact for men and women, and there could be a smaller price impact for ethnic minority households compared with white households (because ethnic minority groups are more likely to live in London).
Of course, the precise impacts of Brexit on inequality will depend on the nature of the final deal with the EU. But this analysis clearly indicates that there are no straightforward ways of limiting inequalities by prioritising one sector over another in the trade negotiations. Manufacturing tends to be concentrated outside of London and the South East, but some manufacturing sub-sectors are very well-paid (and often male-dominated). At the same time, services sectors may be concentrated in London, but in other parts of the country their exports rely to a greater degree on trade with the EU, and some services sectors employ high shares of female and ethnic minority workers. It is therefore too simplistic to claim, for instance, that a deal that protects trade in goods over services would be the most egalitarian settlement for post-Brexit Britain.
Moreover, it is clear that sectors cannot be neatly separated out within the Brexit negotiations. The EU views the four freedoms of goods, services, capital and people as intimately linked, and the UK cannot simply cherry-pick the sectors it wishes to protect. Restrictions on trade in services would likely be accompanied with greater frictions in the movement of goods, and vice versa.
The best hope for a progressive Brexit is therefore broad alignment with the different aspects of the single market, in order to limit the potential economic
An equal exit? The distributional consequences of leaving the EU22 IPPR BRIEFING
impacts. IPPR’s proposal of a ‘shared market’ consists of regulatory alignment with the single market alongside a comprehensive customs union with the EU. The UK would have the option to diverge from single market rules over time, which would result in corresponding and proportionate restrictions in market access. Under this arrangement, if the UK considered diverging from single market rules, it could evaluate and prepare for the consequences of such a move by first assessing the potential impacts on inequalities.
Some might argue for an alternative, more distant trading relationship with the EU, on the basis that a 'hard' Brexit would have particularly detrimental impacts for well-paid sectors such as finance, and so might reduce inequality overall. But this form of Brexit, while potentially reducing inequality, is still expected to make the poorest groups worse off than under our proposal. This approach might suit those who are happy to 'level down' if it reduces inequality, or those who prioritise other goals, such as loosening EU regulations or halting immigration. But from a progressive perspective - concerned with the wellbeing of the worst off - such a proposal is seriously problematic.
Perhaps most importantly of all, the impact of Brexit on inequality in the UK will be mediated through government action. If the government chooses to respond to a potentially weaker fiscal position by reducing spending, this could further widen inequalities. On the other hand, if the government takes steps to protect vulnerable regions and industries from the risks of Brexit, or to compensate them for any negative effects, then the consequences for inequality could be positive. A ‘Brexit adjustment fund’, for instance, that provides support to workers who lose their jobs or who are otherwise exposed to the negative effects of Brexit, could help to address many of the potential risks to inequality highlighted in this report. The impacts of Brexit on inequality are far from pre-ordained and could be transformed by government intervention.
As we highlighted in the introduction of this report, many have argued that it was in part the deep and sustained inequalities in the UK that precipitated the decision to leave the EU in 2016. Two years on, as the government prepares for Brexit, it is critical that it secures a final settlement which serves to tackle these inequalities, rather than entrench them further.
An equal exit? The distributional consequences of leaving the EU 23IPPR BRIEFING
REFERENCES
Borchert I and Tamberi N (2018) ‘Brexit and regional services exports: a heat map approach’, UK Trade Policy Observatory, 14 January 2018. http://blogs.sussex.ac.uk/uktpo/publications/brexit-and-regional-services-exports-a-heat-map-approach/
Breinlich H, Dhingra S and Ottaviano G (2016a) How have EU’s trade agreements impacted consumers?, CEP Discussion Paper No 1417, Centre for Economic Performance, March 2016. http://cep.lse.ac.uk/pubs/download/dp1417.pdf
Breinlich H, Dhingra S, Sampson T, and Van Reenen J (2016b) ‘Who bears the pain? How the costs of Brexit would be distributed across income groups’, Brexit paper 7, Centre for Economic Performance. http://cep.lse.ac.uk/pubs/download/brexit07.pdf
Breinlich H, Leromain E, Novy D and Sampson T (2017) ‘The Brexit vote, inflation, and UK living standards’, Brexit paper 11, Centre for Economic Performance. http://cep.lse.ac.uk/pubs/download/brexit11.pdf
Cabinet Office (2017) ‘Ethnicity facts and figures’, Employment and Average Hourly Pay. https://www.ethnicity-facts-figures.service.gov.uk/
Chen W, Los B, McCann P, Ortega-Argilés R, Thissen M, and van Oort F (2017) ‘The continental divide? Economic exposure to Brexit in regions and countries on both sides of The Channel’, Papers in Regional Science, Volume 97, Issue 1, pp.25-54, March 2018. https://onlinelibrary.wiley.com/doi/full/10.1111/pirs.12334
Clarke S, Serwicka I, and Winters L A (2017) Changing Lanes: The impact of different post-Brexit trading policies on the cost of living, Resolution Foundation and UK Trade Policy Observatory. https://www.resolutionfoundation.org/app/uploads/2017/10/ Changing-Lanes.pdf
Colebrook C, Snelling C and Longlands S (2018) The state of pay: Demystifying the gender pay gap, IPPR. http://www.ippr.org/research/publications/the-state-of-pay
Darvas Z (2016) ‘High inequality and poverty helped trigger the Brexit protest vote’, LSE Brexit blog, 31 August 2016. http://blogs.lse.ac.uk/brexit/2016/08/31/brexit-should-be-a-wake-up-call-in-the-fight-against-inequality/
Dhingra S, Huang H, Ottaviano G, Pessoa JP, Sampson T, and Van Reenen J (2017a) The Costs and Benefits of Leaving the EU: Trade Effects, CEP Discussion Paper No 1478, Centre for Economic Performance, April 2017. http://cep.lse.ac.uk/pubs/download/dp1478.pdf
Dhingra S, Machin S, and Overman H (2017b) ‘The Local Economic Effects of Brexit’, Brexit Paper 10, Centre for Economic Performance. http://cep.lse.ac.uk/pubs/download/brexit10.pdf
Goodwin M and Heath O (2016) Brexit vote explained: poverty, low skills and lack of opportunities, Joseph Rowntree Foundation. https://www.jrf.org.uk/report/brexit-vote-explained-poverty-low-skills-and-lack-opportunities
Greater London Authority [GLA] (2018) Preparing for Brexit, Cambridge Econometrics. https://www.london.gov.uk/sites/default/files/preparing_for_brexit_final_report.pdf
HMRC (2018) ‘Regional Trade in Goods Statistics disaggregated by smaller geographical areas: 2016’, Data tables. https://www.uktradeinfo.com/Statistics/RTS/Pages/Analysis.aspx
House of Commons Exiting the EU Committee (2018) ‘EU Exit Analysis Cross Whitehall Briefing’, January 2018. https://www.parliament.uk/documents/commons-committees/Exiting-the-European-Union/17-19/Cross-Whitehall-briefing/EU-Exit-Analysis-Cross-Whitehall-Briefing.pdf
Hughes O (2018) ‘Toyota gives Deeside engine plant major boost’, Daily Post, 28 February 2018. https://www.dailypost.co.uk/business/business-news/toyota-gives-deeside-engine-plant-14349759
An equal exit? The distributional consequences of leaving the EU24 IPPR BRIEFING
IPPR (2017) Time for Change: A New Vision for the British Economy – The Interim Report of the IPPR Commission on Economic Justice, IPPR http://www.ippr.org/research/publications/cej-time-for-change
Leave means Leave, Labour Leave and Economists for Free Trade (2017) ‘New model economy for a post-Brexit Britain’, September 2017. https://www.economistsforfreetrade.com/wp-content/uploads/2017/09/Economists-for-Free-Trade-NME-Paper.pdf
Levell P (2018) The customs union, tariff reductions and consumer prices, Institute for Fiscal Studies, March 2018. https://www.ifs.org.uk/publications/12854
Lightfoot W (2017) ‘Here’s how we could see lower food prices after Brexit’, Telegraph, 5 May 2017. https://www.telegraph.co.uk/news/2017/05/05/could-see-lower-food-prices-brexit/
Niemietz K (2013) ‘Abolish the CAP, let food prices tumble’, Institute of Economic Affairs, 18 January 2013. https://iea.org.uk/blog/abolish-the-cap-let-food-prices-tumble
OECD (2017) Agriculture support estimates. https://www.oecd-ilibrary.org/agriculture-and-food/data/oecd-agriculture-statistics/agricultural-support-estimates-edition-2017_545b3853-en
Office for National Statistics [ONS] (2014-2016), ‘Detailed household expenditure by countries and regions, UK: Table A35’. https://www.ons.gov.uk/peoplepopulationandcommunity/personalandhouseholdfinances/expenditure/datasets/detailedhouseholdexpenditurebycountriesandregionsuktablea35
Office for National Statistics [ONS] (2015-2016), Social Survey Division, Northern Ireland Statistics and Research Agency, Central Survey Unit (2015–16) Quarterly Labour Force Survey (2015 Q3 to 2016 Q2) [data collection] 2nd Edition. UK Data Service.
Office for National Statistics [ONS] (2017a), Regional gross value added (income approach) reference tables. https://www.ons.gov.uk/economy/grossvalueaddedgva/datasets/regionalgrossvalueaddedincomeapproach
Office for National Statistics [ONS] (2017b), Department for Environment, Food and Rural Affairs. Living Costs and Food Survey, 2015-2016. [data collection]. 2nd Edition. UK Data Service. SN: 8210, http://doi.org/10.5255/UKDA-SN-8210-4

Institute for Public Policy Research

GET IN TOUCHFor more information about the Institute for Public Policy Research, please go to www.ippr.org
You can also call us on +44 (0)20 7470 6100, e-mail [email protected] or tweet us @ippr
Institute for Public Policy ResearchRegistered Charity no. 800065 (England & Wales), SC046557 (Scotland), Company no, 2292601 (England & Wales)
The progressive policy think tank
Related Documents