Surgery, slice preparation and Electrophysiology: 10 - 14 week male Sprague Dawley rats were anesthetsized with a combination of Ketamine and Xylazine, and transcardially perfused with ice-cold saline sloution (with Sucrose replacing NaCl), as per within the guidelines set by the University of Texas IACUC committee. Near horizontal 350μm thick slices were made and whole cell patch-clamp recordings were made in the current-clamp mode from the middle hippocampal region using an IX2-700 dual channel amplifier (Dagan) and a BVC-700 single channel am- plicfier (Dagan), along with differential interference contrast microscopy on a Nikon Eclipse microscope, fitted with a 60x water-immersion objective lens, for visual guidance. ACSF contained (in mM): 125 NaCl, 2.5 KCl, 1.25 NaH 2 PO 4 , 25 NaHCO 3 , 2 CaCl 2 , 2MgCl 2 and 12.5 Dextrose. Internal pipette solution contained (in mM): 120 K-Gluconate, 20 KCl, 11 HEPES, 4 NaCl, 4 MgATP, 0.3 Na-GTP and 7 2K-phosphocreatinine adjusted to ph 7.35 with KOH. Pipette Resistance: 4-7 MΩ glass pipettes were pulled fresh before recording and recordings were dicontinued if series resistance was above 30MΩ. Voltages: Although, experiments were carried out at mulitple voltages, the data showed here is from traces recorded at -70mV (uncorrected for junction potential, which was approx 8mV). Typically, the neurons rested between -65 and -70 mV Temperature: 31-33˚C Impedance profile measurements : ‘Chirp’ stimulus was used to characterize the impedance profile, which is a sinu- soidal current of constant amplitude (50pA for data showed here), linearly spanning 0 - 15 Hz in frequency. The chirp stimulus normally preceeded with a 500 ms, 50 pA hyperpolarizing pulse to monitor input resistance. The magnitude of the ratio of the Fourier transform of the voltage response to the Fourier transform of the Chirp stimulus formed the Impedance Amplitude Profile (ZAP) as follows: The magnitude of the ratio of the Fourier transform of the voltage response to the Fourier transform of the Chirp stimulus formed the Impedance Phase Profile (ZPP) as follows: The distribution of HCN channels normalizes phase and synchronizes inputs in the theta frequency range along the apical dendrite of CA1 pyramidal neurons Sachin P. Vaidya and Daniel Johnston Center for Learning and Memory; Institute for Neuroscience, University of Texas at Austin, Austin, TX 78712 USA The gradient of H-conductance along the apical dendrite synchronizes the timing of incoming theta frequency inputs at the soma Theta Frequency Oscillatory inputs from the dendrite and the soma are synchronized at the soma A1 C A2 B D1 D2 H-channels modulate the phase of the oscillatory signals Abstract A typical CA1 neuron in the rodent hippocampus recieves about 20,000 (mostly) excitatory synapses in the s. radiatum region (1), which spans Methods Frequency (Hz) Control Control 0 - 15 Hz in 15s | Z |(f) = (Re(Z(f)) 2 + (Im(Z(f)) 2 ø(f) = tan -1 Re(Z(f) Im(Z(f) We would like to thank members of the Johnston lab at UT Austin for helpful discussions as well as technical help during the course of this study. References: 1. Megias et al., Neuroscience. 2001;102(3):527-40. 2. Buzsaki G, Neuron. 2002 Jan 31;33(3):325-40. Review 3. Kamondi et al., Hippocampus. 1998;8(3):244-61. 4. Magee, J.C. J Neurosci. 18(19):7613-24 (1998). 5. Narayanan, R. & Johnston, D. J Neurosci, 28(22), 5846-60 (2008). Figure 1: The local impedance measurement along the apical dendrite of a CA1 neuron shows a gradient of increasing resonance frequency and a gradient of phase advance with distance from the soma: (A) Illustra- tion of the apical dendrite of a CA1 neuron along with color-coded distance markers for local measurement of input impedance. (B) The local voltage responses to the chirp stimulus (see methods) used for analysis of impedance amplitude, as depicted in (C), and impedance phase (ZPP), as depicted in (D). 300 μm 150μm 50μm 2 mV 2 s A B C frequency (Hz) Impedance amplitude (MΩ) Local oscillatory dynamics vary with disance from the soma D Impedance phase (rad) -π/6 frequency (Hz) -π/3 Frequency (Hz) Difference in Phase (radians) -π/12 π/12 0 Phase Difference Plot: Difference of Phase as relative to the LOCAL SOMATIC RESPONSE -65 mV -70 mV -75 mV Frequency (Hz) Difference in Phase (radians) -π/12 π/12 0 Mean Phase Difference Plot: Difference of Phase as relative to the LOCAL SOMATIC RESPONSE -65 mV -70 mV -75 mV Voltage Dependence of Synchrony Phase Difference Plot: Difference of Phase as relative to the LOCAL DENDRITIC RESPONSE Difference in Phase (radians) -π/12 0 -π/6 Frequency (Hz) Propagated to Dendrite Local Soma Phase Synchrony is direction-dependent Control 20 μM ZD 7288 Difference in Phase (radians) π/12 -π/12 0 -π/6 Frequency (Hz) Phase Difference Plot: Difference of Phase as relative to the LOCAL SOMATIC RESPONSE Phase Synchrony is abolished by HCN blocker ZD7288 0 -π/6 -π/3 Phase plot: Propagation from Dendrite to the Soma Frequency (Hz) Phase (radians) Local Dendrite Propagated to Soma Local Soma θ Frequency range Phase Difference Plot: Difference of Phase as relative to the LOCAL SOMATIC RESPONSE Frequency (Hz) Difference in Phase (radians) -π/12 π/12 0 Local Dendrite Propagated to Soma θ Frequency range 250 μm 0 μm (soma) 250 μm 0 μm (soma) Dendritic phase advance compensates for propagation delay in the theta range Figure 3:Theta Frequency Oscillatory inputs from the distal dendrite (propagated) and the soma (local) are synchronized at the soma: (A1) ZPPs for Chirps injected in the dendrite (250 μm) and the soma, as measured locally (refer adjacent schematic) along with the ZPP for the propagated signal from the dendrite to the soma, as measured at the soma. Note that the propagated ZPP and local somatic ZPP cross in the theta frequency range. This indicates that the propagated oscillatory signal from the dendrite and the local so- matic voltage response are coincident at the soma in the theta frequency range. We refer to this as phase synchrony. This occurs as the phase advance of the local dendritic signal compensates for its delay of propagation to the soma. (A2) same as A1, but now, depicted as a difference in phase relative to the local somatic voltage response. (B) shows that the phase synchrony is dependent on the inductive gradient of h-channels, because when blocked with 20 μM ZD7288, the dendritic signal always arrives after the somatic signal irre- spective of the input frequency. (C) shows that the phenomenon of phase normalization is directional in nature, as signals propogated in the opposite direction, from the soma to the dendrite, do not show phase synchrony at the dendritic location i.e oscillatory signals propagated from the soma always arrive after the local dendritic response. (D1) and (D2) show that the frequency of synchronization (as seen in A2) is voltage-dependent for an individual neuron and for a populaion of neurons, respectively. 0 -π/6 -π/3 Phase (radians) Frequency (Hz) Phase Plot: Phase Gradient within a Neuron 150 μm soma 300 μm 300 μm 150 μm 0 μm (soma) 2 Hz 7 Hz 14 Hz 100 ms 50 ms 20 ms The gradient of H-channels leads to a phase gradient along the dendritc axis 2 Hz 7 Hz 100 ms 50 ms 0 -π/6 -π/3 Phase (radians) Frequency (Hz) Phase Plot: Local Phase measured at soma 0 μm (soma) Control Control ZD 7288 ZD 7288 Figure 2:The distribution of H-channels leads to a gradient of local phase advance along the dendritic axis : (A) A somatic recording depicting the ZPP in response to the chirp stimulus before and after the application of HCN (H) chan- nel blocker ZD 7288 ( 20μM). The inductive reactance imparted by the h-channels counteracts the capacitative reactance of the neuronal membrane to advance the phase of the voltage response as shown on the right. (B) The gradient of in- creasing h-conductance from soma to distal dendrites leads to a gradient of increasing local phase advance as shown by the local ZPPs in response to chirps at soma, 150 μm and 300 μm, with corresponding voltage traces on the right. A B Current trace V m = -65 mV 300 μm 150 μm 0 μm (soma) Inputs across the entire apical dendrite are synchronized at the soma for Theta frequency inputs 0 -π/6 -π/3 -π/2 Frequency (Hz) Phase (radians) Local Soma Propagated from 300μm Propagated from 150μm Phase plot: Propagation from Dendrite to the Soma Within same Neuron Frequency (Hz) Difference in Phase (radians) -π/12 -π/6 π/12 0 Phase Difference Plot: Difference of Phase as relative to the LOCAL SOMATIC RESPONSE Within same Neuron Propagated from 150μm Propagated from 300μm V m = -65 mV Proximal 166±10μm n=6 0 μm (soma) Distal 297± 20μm n=5 Frequency (Hz) Difference in Phase (radians) -π/12 0 Propagated Proximal Propagated Distal Across Population Mean Phase Difference Plot: Difference of Phase as relative to the LOCAL SOMATIC RESPONSE Frequency (Hz) Difference in Phase (radians) -π/12 π/12 0 Mean Difference Plot: Difference of Phase as relative to the LOCAL SOMATIC RESPONSE Across Population Local Distal Local Proximal Propagated Proximal Propagated Distal Input synchrony is maintained across the apical dendrite Phase synchrony is established by differential local phase advance Figure 4:Theta Frequency Oscillatory inputs are synchronized across the apical dendrite at the soma: We performed simultaneous triple whole cell recordings on the soma, proximal dendrite (150 μm) and distal dendrite (300 μm) to investigate if the phase of the propagated oscillatory inputs is synchronized across the apical dendrite at the soma.(A1) depicts the experimental setup along with a train of backpropagating action potentials as measured at the soma, 150 μm and 300μm. (A2) shows the ZPPs at the soma for chirps injected at 300 μm, 150 μm and the soma. Note, that they have a single crossover point in the theta frequency range. This indicates that irrespective of the input location of the chirp along the apical dendrite, the theta frequency inputs are co-incident at the soma. This synchrony is clearer in the phase difference plot (A3), where the phase differences between proximally and distally propagated inputs, as relative to the somatic response, cross over precisely at the zeroline. This phenomenon is further confirmed when data from dual recordings is pooled to- gether in two bins based on the distance (B1) with proximal defined as 150 - 200 μm ( 166 ± 10 μm, n=6) and distal as 250 - 350 μm ( 297 ± 20 μm, n=5) for testing of phase differences within the propa- gated signals. As shown in (B2), the avereage phase differences between proximal and distal propa- gated inputs are not significantly different near the zeroline which occurs in the theta frequenccy range. This again confirms the hypothesis that irrespective of the origin of the theta frequency oscilla- tory signal, the propogated responses are phase synchronized at the soma. Moreover, when the local phase differences between the proximal and distal regions are plotted along with the propa- gated differences (all relative to the somatic local response), it is clear how the neuron exploits the gradient of phase advance to normalize the phase of the propagated inputs at the soma. The distal inputs are significantly phase advanced locally as compared to the proximal inputs (B3), so that they reach the soma at the same time. Thus, the neuron utilizes the gradient of increasing h-channels to normalize the distance-dependent differences in the timing of incoming oscillatory inputs. 250 μm 0 μm (soma) 250 μm 0 μm (soma) fR = 5.22 Q = 1.18 Impedance (MΩ) Normalized Impedance to Resoance Frequency θ Frequency range Frequency (Hz) Frequency (Hz) Local Soma Local Dendrite Propagated to Dendrite fR = 5.22 Q = 1.18 fR = 7.23 Q = 1.57 fR = 7.09 Q = 1.49 Local Soma Local Dendrite Propagated to Soma θ Frequency range Impedance (MΩ) Frequency (Hz) Frequency (Hz) Normalized Impedance to Resoance Frequency Impedance (MΩ) Impedance (MΩ) ZD7288 ZD7288 Propagated to Dendrite Propagated to Soma Frequency (Hz) A1 A2 B1 B2 B3 A3 The gradient of increasing resonance acts as a band-pass filter for Theta frequency inputs Figure 5:The gradient of resonance frequency optimizes the propagation of Theta frequency oscillatory signals: (A1) shows the local ZAPs at the soma and the dendrite (250 μm) and the ZAP for the propagated chirp from dendrite to soma. (A2) shows the same ZAPs, but now, normalized to their respective resonance frequencies (fR), with the dotted line in- dicating an arbitrary 90% cutoff for the sake of comparing pref- ferred frequencies, hence called Resonance Frequency Range (fRR). Note that while the somatic fRR is left-shifted and the local dendritic fRR is right-shifted, the propagated fRR ex- actly coincides with the Thetta frequency range. This indicates that the increasing gradient of resonance along the apical den- drite ensures that the theta frequency signals are preferentially propagated to the soma.(B1 & B2) same as (A1 & A2), but now depicting the ZAPs and fRRs for propagation of signals from soma to the dendrite, albiet with the same conclusion. (C) and (D) show that the application of H-channel blocker 20 μM ZD7288 abolishes fRR and thus the apical dendrite acts as a low-pass filter and not as a band-pass filter, in both directions. These results, taken together with phase analysis, emphasize how the CA1 neuron membrane properties, especially the h- gradient, normalize phase and optimize amplitude for the natu- rally occuring theta oscillations. Acknowledgements & References A1 A2 B2 B1 C D ‘online’ state of the network, show that the CA1 neuron recieves periodic excitation and inhbition resulting in theta frequency (4-10 Hz) mem- brane potential oscillations in the dendrites as well as the soma (3). Here we show that the CA1 neuron exploits about 350 μm from the soma to the start of s.l.m, re- cieving primarily inputs from the CA3/CA2 region. An obvious challenge for the CA1 neuron is to integrate these inputs across this expansive region simultane- ously with no differences in timing based on their spa- tial distribution. So, how does a CA1 neuron reach across hundreds of micrometers without compromising the temporal resolution of the incoming inputs? To answer this question, we first considered the spatiotemporal nature of inputs that the CA1 neuron experiences during the active state of the hippocampal network. Studies have shown that whenever the rat is involved in an active volutuntary activity, be it foraging for food or processing of sensory stimuli like odor or touch, the hippocampus enters a network state called ‘Theta rhythm’ which is characterized by slow oscillations in the 4-10Hz frequency range (2).Furthermore, intracellular recordings during this these slow rhythmic inputs such that inputs across the apical dendrite reach the integration zone near the soma simultaneously irrespective of their location of origin along the apical dendrite. This phenomenon of ‘synchrony’ across the apical dendrite occurs due to the gradient of HCN (H) channels along the apical dendrite. H-channels, due to their tendency to resist membrane change, act as an inductor in the membrane. The inductive reactance thus generated counter- acts the capacitative reactance of the neuronal membrane and advances the phase of oscillatory inputs. Furthermore, as H-channels are distributed in a gradient with increasng conductance from proximal to distal regions of the apical dendrite (4), they generate a gradient of local ‘phase advance’ (5). Here, we show that this gradient of phase advance counteracts the distance- dependent delay in propagation of inputs, to normalize the timing of inputs across the stratum radiatum during dendritic integration. s. lacunosum moleculare (s.l.m.) s. radiatum s. pyramidale s. oriens Summary - The gradient of H-channels along the apical dendrite forms a gradient of local phase advance which counteracts the propagation delay for distal inputs towards the perisomatic integration site. - This normalizes the timing of inputs across the apical dendrite such that irre- spective of the input location of a theta frequency oscillatory signal, it is co- incident at the soma. - Taken together with the band-filtering of theta signals along the apical den- drite, the CA1 neuron achieves both, phase normalization and amplitude opti- mization for natural rhythmic inputs in the theta frequency range 50 μm

Welcome message from author
This document is posted to help you gain knowledge. Please leave a comment to let me know what you think about it! Share it to your friends and learn new things together.
Transcript
Surgery, slice preparation and Electrophysiology: 10 - 14 week male Sprague Dawley rats were anesthetsized with a combination of Ketamine and Xylazine, and transcardially perfused with ice-cold saline sloution (with Sucrose replacing NaCl), as per within the guidelines set by the University of Texas IACUC committee. Near horizontal 350µm thick slices were made and whole cell patch-clamp recordings were made in the current-clamp mode from the middle hippocampal region using an IX2-700 dual channel amplifier (Dagan) and a BVC-700 single channel am-plicfier (Dagan), along with differential interference contrast microscopy on a Nikon Eclipse microscope, fitted with a 60x water-immersion objective lens, for visual guidance. ACSF contained (in mM): 125 NaCl, 2.5 KCl, 1.25 NaH2PO4, 25 NaHCO3, 2 CaCl2, 2MgCl2 and 12.5 Dextrose. Internal pipette solution contained (in mM): 120 K-Gluconate, 20 KCl, 11 HEPES, 4 NaCl, 4 MgATP, 0.3 Na-GTP and 7 2K-phosphocreatinine adjusted to ph 7.35 with KOH. Pipette Resistance: 4-7 MΩ glass pipettes were pulled fresh before recording and recordings were dicontinued if series resistance was above 30MΩ. Voltages: Although, experiments were carried out at mulitple voltages, the data showed here is from traces recorded at -70mV (uncorrected for junction potential, which was approx 8mV). Typically, the neurons rested between -65 and -70 mV Temperature: 31-33˚C Impedance profile measurements : ‘Chirp’ stimulus was used to characterize the impedance profile, which is a sinu-soidal current of constant amplitude (50pA for data showed here), linearly spanning 0 - 15 Hz in frequency. The chirp stimulus normally preceeded with a 500 ms, 50 pA hyperpolarizing pulse to monitor input resistance. The magnitude of the ratio of the Fourier transform of the voltage response to the Fourier transform of the Chirp stimulus formed the Impedance Amplitude Profile (ZAP) as follows: The magnitude of the ratio of the Fourier transform of the voltage response to the Fourier transform of the Chirp stimulus formed the Impedance Phase Profile (ZPP) as follows:
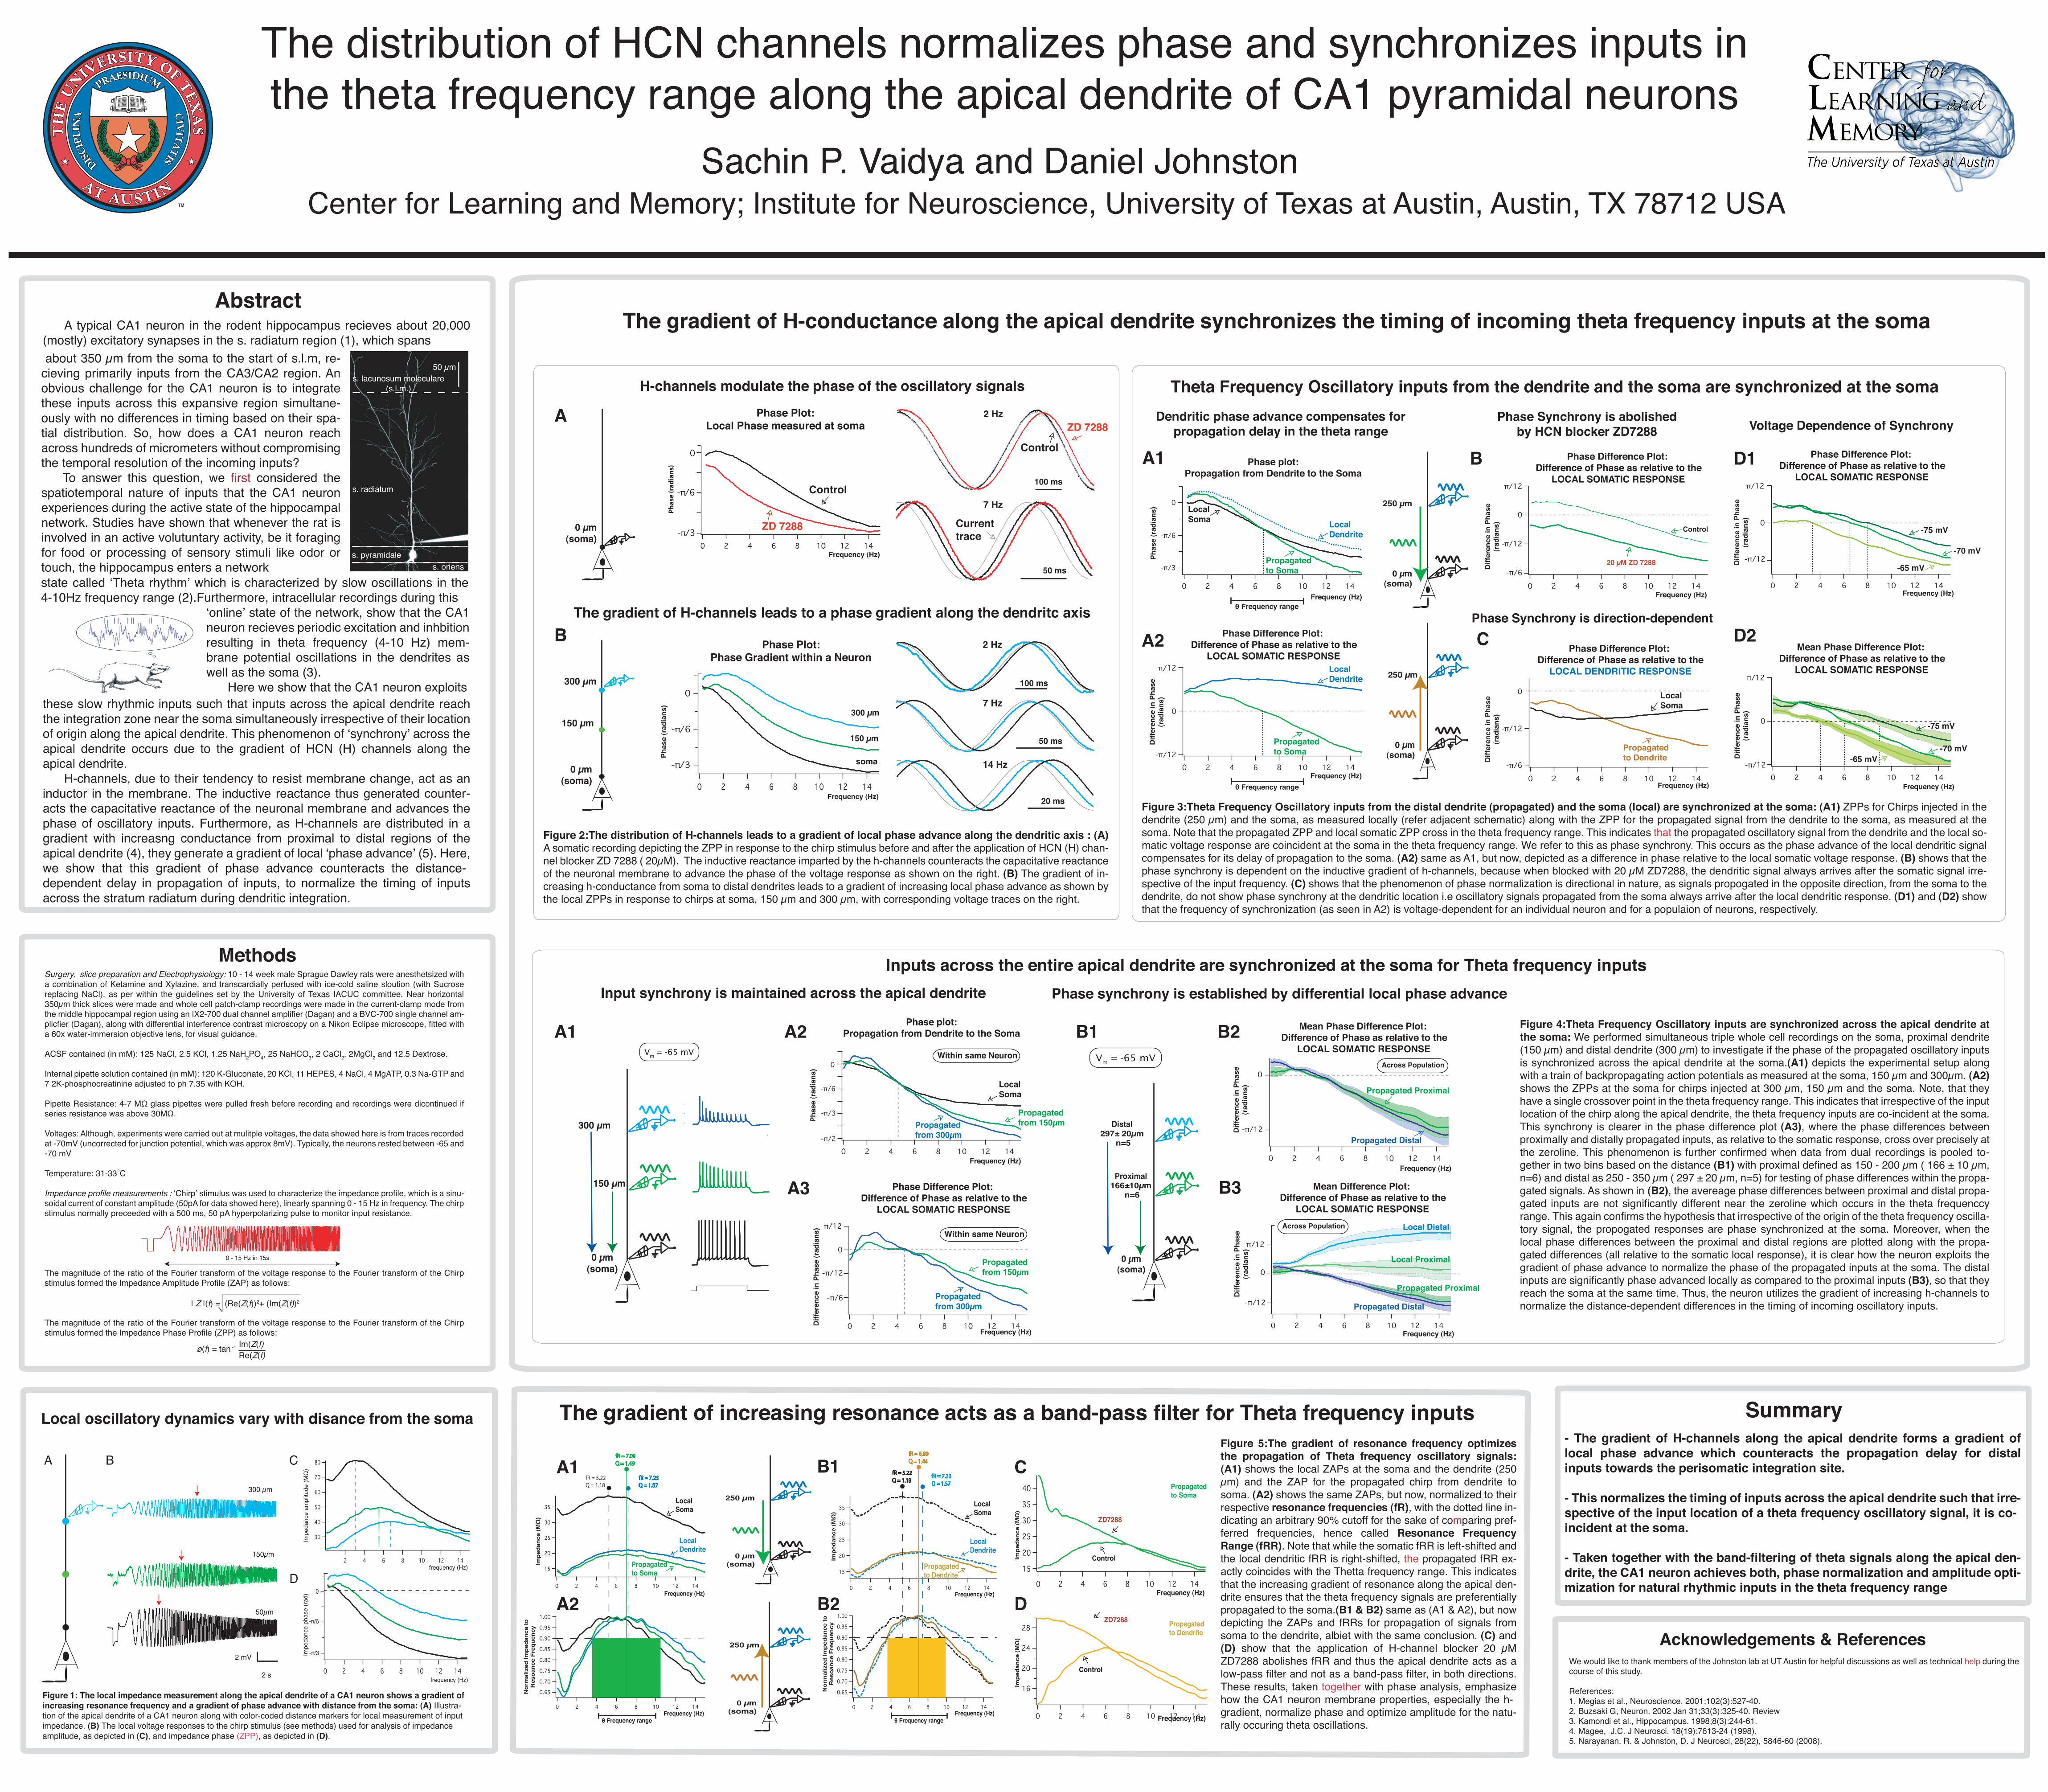
The distribution of HCN channels normalizes phase and synchronizes inputs in the theta frequency range along the apical dendrite of CA1 pyramidal neurons
Sachin P. Vaidya and Daniel JohnstonCenter for Learning and Memory; Institute for Neuroscience, University of Texas at Austin, Austin, TX 78712 USA
The gradient of H-conductance along the apical dendrite synchronizes the timing of incoming theta frequency inputs at the soma
Theta Frequency Oscillatory inputs from the dendrite and the soma are synchronized at the soma
A1
C A2
B D1
D2
H-channels modulate the phase of the oscillatory signals
Abstract A typical CA1 neuron in the rodent hippocampus recieves about 20,000 (mostly) excitatory synapses in the s. radiatum region (1), which spans
Methods
Frequency (Hz)
Control
Control
0 - 15 Hz in 15s
| Z |(f) = (Re(Z(f))2+ (Im(Z(f))2
ø(f) = tan -1
Re(Z(f) Im(Z(f)
We would like to thank members of the Johnston lab at UT Austin for helpful discussions as well as technical help during the course of this study.
References: 1. Megias et al., Neuroscience. 2001;102(3):527-40. 2. Buzsaki G, Neuron. 2002 Jan 31;33(3):325-40. Review3. Kamondi et al., Hippocampus. 1998;8(3):244-61.4. Magee, J.C. J Neurosci. 18(19):7613-24 (1998).5. Narayanan, R. & Johnston, D. J Neurosci, 28(22), 5846-60 (2008).
Figure 1: The local impedance measurement along the apical dendrite of a CA1 neuron shows a gradient of increasing resonance frequency and a gradient of phase advance with distance from the soma: (A) Illustra-tion of the apical dendrite of a CA1 neuron along with color-coded distance markers for local measurement of input impedance. (B) The local voltage responses to the chirp stimulus (see methods) used for analysis of impedance amplitude, as depicted in (C), and impedance phase (ZPP), as depicted in (D).
300 µm
150µm
50µm
2 mV
2 s
A B C
frequency (Hz)
Impe
danc
e am
plitu
de (M
Ω)
Local oscillatory dynamics vary with disance from the soma
D
Impe
danc
e ph
ase
(rad)
-π/6
frequency (Hz)
-π/3
Frequency (Hz)
Diff
eren
ce in
Pha
se
(rad
ians
)
-π/12
π/12
0
Phase Difference Plot: Difference of Phase as relative to the
LOCAL SOMATIC RESPONSE
-65 mV
-70 mV
-75 mV
Frequency (Hz)
Diff
eren
ce in
Pha
se
(rad
ians
)
-π/12
π/12
0
Mean Phase Difference Plot: Difference of Phase as relative to the
LOCAL SOMATIC RESPONSE
-65 mV -70 mV
-75 mV
Voltage Dependence of Synchrony
Phase Difference Plot: Difference of Phase as relative to the
LOCAL DENDRITIC RESPONSE
Diff
eren
ce in
Pha
se
(rad
ians
)
-π/12
0
-π/6
Frequency (Hz)
Propagated to Dendrite
Local Soma
Phase Synchrony is direction-dependent
Control
20 µM ZD 7288 Diff
eren
ce in
Pha
se
(rad
ians
)
π/12
-π/12
0
-π/6
Frequency (Hz)
Phase Difference Plot: Difference of Phase as relative to the
LOCAL SOMATIC RESPONSE
Phase Synchrony is abolished by HCN blocker ZD7288
0
-π/6
-π/3
Phase plot: Propagation from Dendrite to the Soma
Frequency (Hz)
Phas
e (r
adia
ns)
Local Dendrite
Propagated to Soma
Local Soma
θ Frequency range
Phase Difference Plot: Difference of Phase as relative to the
LOCAL SOMATIC RESPONSE
Frequency (Hz)
Diff
eren
ce in
Pha
se
(rad
ians
)
-π/12
π/12
0
Local Dendrite
Propagated to Soma
θ Frequency range
250 µm
0 µm (soma)
250 µm
0 µm (soma)
Dendritic phase advance compensates for propagation delay in the theta range
Figure 3:Theta Frequency Oscillatory inputs from the distal dendrite (propagated) and the soma (local) are synchronized at the soma: (A1) ZPPs for Chirps injected in the dendrite (250 µm) and the soma, as measured locally (refer adjacent schematic) along with the ZPP for the propagated signal from the dendrite to the soma, as measured at the soma. Note that the propagated ZPP and local somatic ZPP cross in the theta frequency range. This indicates that the propagated oscillatory signal from the dendrite and the local so-matic voltage response are coincident at the soma in the theta frequency range. We refer to this as phase synchrony. This occurs as the phase advance of the local dendritic signal compensates for its delay of propagation to the soma. (A2) same as A1, but now, depicted as a difference in phase relative to the local somatic voltage response. (B) shows that the phase synchrony is dependent on the inductive gradient of h-channels, because when blocked with 20 µM ZD7288, the dendritic signal always arrives after the somatic signal irre-spective of the input frequency. (C) shows that the phenomenon of phase normalization is directional in nature, as signals propogated in the opposite direction, from the soma to the dendrite, do not show phase synchrony at the dendritic location i.e oscillatory signals propagated from the soma always arrive after the local dendritic response. (D1) and (D2) show that the frequency of synchronization (as seen in A2) is voltage-dependent for an individual neuron and for a populaion of neurons, respectively.
0
-π/6
-π/3
Phas
e (r
adia
ns)
Frequency (Hz)
Phase Plot: Phase Gradient within a Neuron
150 µm
soma
300 µm
300 µm
150 µm
0 µm (soma)
2 Hz
7 Hz
14 Hz
100 ms
50 ms
20 ms
The gradient of H-channels leads to a phase gradient along the dendritc axis
2 Hz
7 Hz
100 ms
50 ms
0
-π/6
-π/3
Ph
ase
(rad
ian
s)
Frequency (Hz)
Phase Plot: Local Phase measured at soma
0 µm (soma)
Control
Control
ZD 7288
ZD 7288
Figure 2:The distribution of H-channels leads to a gradient of local phase advance along the dendritic axis : (A) A somatic recording depicting the ZPP in response to the chirp stimulus before and after the application of HCN (H) chan-nel blocker ZD 7288 ( 20µM). The inductive reactance imparted by the h-channels counteracts the capacitative reactance of the neuronal membrane to advance the phase of the voltage response as shown on the right. (B) The gradient of in-creasing h-conductance from soma to distal dendrites leads to a gradient of increasing local phase advance as shown by the local ZPPs in response to chirps at soma, 150 µm and 300 µm, with corresponding voltage traces on the right.
A
B
Current trace
Vm = -65 mV
300 µm
150 µm
0 µm (soma)
Inputs across the entire apical dendrite are synchronized at the soma for Theta frequency inputs
0
-π/6
-π/3
-π/2
Frequency (Hz)
Phas
e (r
adia
ns)
Local Soma
Propagated from 300µm
Propagated from 150µm
Phase plot: Propagation from Dendrite to the Soma
Within same Neuron
Frequency (Hz)
Diff
eren
ce in
Pha
se (r
adia
ns)
-π/12
-π/6
π/12
0
Phase Difference Plot: Difference of Phase as relative to the
LOCAL SOMATIC RESPONSE
Within same Neuron
Propagated from 150µm
Propagated from 300µm
Vm = -65 mV
Proximal 166±10µm
n=6
0 µm (soma)
Distal 297± 20µm
n=5
Frequency (Hz)
Diff
eren
ce in
Pha
se
(rad
ians
)
-π/12
0
Propagated Proximal
Propagated Distal
Across Population
Mean Phase Difference Plot: Difference of Phase as relative to the
LOCAL SOMATIC RESPONSE
Frequency (Hz)
Diff
eren
ce in
Pha
se
(rad
ians
)
-π/12
π/12
0
Mean Difference Plot: Difference of Phase as relative to the
LOCAL SOMATIC RESPONSE Across Population Local Distal
Local Proximal
Propagated Proximal
Propagated Distal
Input synchrony is maintained across the apical dendrite Phase synchrony is established by differential local phase advance
Figure 4:Theta Frequency Oscillatory inputs are synchronized across the apical dendrite at the soma: We performed simultaneous triple whole cell recordings on the soma, proximal dendrite (150 µm) and distal dendrite (300 µm) to investigate if the phase of the propagated oscillatory inputs is synchronized across the apical dendrite at the soma.(A1) depicts the experimental setup along with a train of backpropagating action potentials as measured at the soma, 150 µm and 300µm. (A2) shows the ZPPs at the soma for chirps injected at 300 µm, 150 µm and the soma. Note, that they have a single crossover point in the theta frequency range. This indicates that irrespective of the input location of the chirp along the apical dendrite, the theta frequency inputs are co-incident at the soma. This synchrony is clearer in the phase difference plot (A3), where the phase differences between proximally and distally propagated inputs, as relative to the somatic response, cross over precisely at the zeroline. This phenomenon is further confirmed when data from dual recordings is pooled to-gether in two bins based on the distance (B1) with proximal defined as 150 - 200 µm ( 166 ± 10 µm, n=6) and distal as 250 - 350 µm ( 297 ± 20 µm, n=5) for testing of phase differences within the propa-gated signals. As shown in (B2), the avereage phase differences between proximal and distal propa-gated inputs are not significantly different near the zeroline which occurs in the theta frequenccy range. This again confirms the hypothesis that irrespective of the origin of the theta frequency oscilla-tory signal, the propogated responses are phase synchronized at the soma. Moreover, when the local phase differences between the proximal and distal regions are plotted along with the propa-gated differences (all relative to the somatic local response), it is clear how the neuron exploits the gradient of phase advance to normalize the phase of the propagated inputs at the soma. The distal inputs are significantly phase advanced locally as compared to the proximal inputs (B3), so that they reach the soma at the same time. Thus, the neuron utilizes the gradient of increasing h-channels to normalize the distance-dependent differences in the timing of incoming oscillatory inputs.
250 µm
0 µm (soma)
250 µm
0 µm (soma)
fR = 5.22 Q = 1.18
Impe
danc
e (M
Ω)
Nor
mal
ized
Impe
danc
e to
R
esoa
nce
Freq
uenc
y
θ Frequency range Frequency (Hz)
Frequency (Hz)
Local Soma
Local Dendrite
Propagated to Dendrite
fR = 5.22 Q = 1.18
fR = 7.23 Q = 1.57
fR = 7.09 Q = 1.49
Local Soma
Local Dendrite
Propagated to Soma
θ Frequency range
Impe
danc
e (M
Ω)
Frequency (Hz)
Frequency (Hz)
Nor
mal
ized
Impe
danc
e to
R
esoa
nce
Freq
uenc
y
Impe
danc
e (M
Ω)
Impe
danc
e (M
Ω)
ZD7288
ZD7288
Propagated to Dendrite
Propagated to Soma
Frequency (Hz)
A1 A2 B1 B2
B3 A3
The gradient of increasing resonance acts as a band-pass filter for Theta frequency inputs Figure 5:The gradient of resonance frequency optimizes the propagation of Theta frequency oscillatory signals: (A1) shows the local ZAPs at the soma and the dendrite (250 µm) and the ZAP for the propagated chirp from dendrite to soma. (A2) shows the same ZAPs, but now, normalized to their respective resonance frequencies (fR), with the dotted line in-dicating an arbitrary 90% cutoff for the sake of comparing pref-ferred frequencies, hence called Resonance Frequency Range (fRR). Note that while the somatic fRR is left-shifted and the local dendritic fRR is right-shifted, the propagated fRR ex-actly coincides with the Thetta frequency range. This indicates that the increasing gradient of resonance along the apical den-drite ensures that the theta frequency signals are preferentially propagated to the soma.(B1 & B2) same as (A1 & A2), but now depicting the ZAPs and fRRs for propagation of signals from soma to the dendrite, albiet with the same conclusion. (C) and (D) show that the application of H-channel blocker 20 µM ZD7288 abolishes fRR and thus the apical dendrite acts as a low-pass filter and not as a band-pass filter, in both directions. These results, taken together with phase analysis, emphasize how the CA1 neuron membrane properties, especially the h-gradient, normalize phase and optimize amplitude for the natu-rally occuring theta oscillations.
Acknowledgements & References
A1
A2 B2
B1 C
D
‘online’ state of the network, show that the CA1 neuron recieves periodic excitation and inhbition resulting in theta frequency (4-10 Hz) mem-brane potential oscillations in the dendrites as well as the soma (3). Here we show that the CA1 neuron exploits
about 350 µm from the soma to the start of s.l.m, re-cieving primarily inputs from the CA3/CA2 region. An obvious challenge for the CA1 neuron is to integrate these inputs across this expansive region simultane-ously with no differences in timing based on their spa-tial distribution. So, how does a CA1 neuron reach across hundreds of micrometers without compromising the temporal resolution of the incoming inputs? To answer this question, we first considered the spatiotemporal nature of inputs that the CA1 neuron experiences during the active state of the hippocampal network. Studies have shown that whenever the rat is involved in an active volutuntary activity, be it foraging for food or processing of sensory stimuli like odor or touch, the hippocampus enters a networkstate called ‘Theta rhythm’ which is characterized by slow oscillations in the 4-10Hz frequency range (2).Furthermore, intracellular recordings during this
these slow rhythmic inputs such that inputs across the apical dendrite reach the integration zone near the soma simultaneously irrespective of their location of origin along the apical dendrite. This phenomenon of ‘synchrony’ across the apical dendrite occurs due to the gradient of HCN (H) channels along the apical dendrite. H-channels, due to their tendency to resist membrane change, act as an inductor in the membrane. The inductive reactance thus generated counter-acts the capacitative reactance of the neuronal membrane and advances the phase of oscillatory inputs. Furthermore, as H-channels are distributed in a gradient with increasng conductance from proximal to distal regions of the apical dendrite (4), they generate a gradient of local ‘phase advance’ (5). Here, we show that this gradient of phase advance counteracts the distance-dependent delay in propagation of inputs, to normalize the timing of inputs across the stratum radiatum during dendritic integration.
s. lacunosum moleculare (s.l.m.)
s. radiatum
s. pyramidale s. oriens
Summary - The gradient of H-channels along the apical dendrite forms a gradient of local phase advance which counteracts the propagation delay for distal inputs towards the perisomatic integration site. - This normalizes the timing of inputs across the apical dendrite such that irre-spective of the input location of a theta frequency oscillatory signal, it is co-incident at the soma. - Taken together with the band-filtering of theta signals along the apical den-drite, the CA1 neuron achieves both, phase normalization and amplitude opti-mization for natural rhythmic inputs in the theta frequency range
50 µm
Related Documents