minerals Article The Disappearance of Coal Seams Recorded in Associated Gangue Rocks in the SW Part of the Upper Silesian Coal Basin, Poland Justyna Ciesielczuk * , Monika J. Fabia ´ nska , Magdalena Misz-Kennan, Dominik Jura, Pawel Filipiak and Aniela Matuszewska Citation: Ciesielczuk, J.; Fabia ´ nska, M.J.; Misz-Kennan, M.; Jura, D.; Filipiak, P.; Matuszewska, A. The Disappearance of Coal Seams Recorded in Associated Gangue Rocks in the SW Part of the Upper Silesian Coal Basin, Poland. Minerals 2021, 11, 735. https://doi.org/ 10.3390/min11070735 Academic Editor: Shifeng Dai Received: 20 May 2021 Accepted: 3 July 2021 Published: 7 July 2021 Publisher’s Note: MDPI stays neutral with regard to jurisdictional claims in published maps and institutional affil- iations. Copyright: © 2021 by the authors. Licensee MDPI, Basel, Switzerland. This article is an open access article distributed under the terms and conditions of the Creative Commons Attribution (CC BY) license (https:// creativecommons.org/licenses/by/ 4.0/). Institute of Earth Sciences, University of Silesia, 60 B ˛ edzi ´ nska Str., PL-41-200 Sosnowiec, Poland; [email protected] (M.J.F.); [email protected] (M.M.-K.); [email protected] (D.J.); pawel.fi[email protected] (P.F.); [email protected] (A.M.) * Correspondence: [email protected]; Tel.: +48-323689336 Abstract: Coal seams in the Upper Silesian Coal Basin vanish within the Carboniferous Upper Silesian Sandstone Series and below an unconformity marking the Carboniferous top surface. Changes in the geochemical, mineralogical, petrological and palynological characteristics of gangue rocks associated with the vanished seams record what happened. The observed changes could have been caused by (1) coal-seam paleofire, (2) peat combustion, (3) igneous intrusion, (4) metasomatism and/or (5) weathering. Multifaceted research on samples collected at the Jas-Mos mining area, a part of the operating Jastrz˛ ebie-Bzie Coal Mine that are representative of different geological settings in the northern and southern parts of the mining area, point to intra-deposit paleofire as the most plausible reason for the disappearance. Biomarkers enabled recognition of differences in heating duration and oxygen access. Coal seams in the south burned quickly with abundant oxygen supply. Seams in the north pyrolyzed for an extended time under conditions of limited oxygen. Though other methods used proved less sensitive, all confirmed low (100–150 ◦ C) paleotemperature heating. Overall, the reason for the local disappearance of the coal seams, making their exploitation difficult and unprofitable, can be assigned to a variety of different processes in a complex overlapping history of variable weathering, heating due to local endogenic fires and, probably, earlier peat combustion. Keywords: disappearing coal seam; thermal alteration of gangue rocks; paleofire; Upper Silesian Coal Basin 1. Introduction Coal and coal-bearing rocks in the south-western part of the Upper Silesian Coal Basin (USCB) of Early Pennsylvanian (Namurian BC) age underwent changes resulting in the partial/complete disappearance of coal seams over an area of ca 500 km 2 . This disappearance is associated with gangue rocks of various colors, typically located above the seams. Maximum noticed thickness reduction up to disappearing was observed in coal seam No. 505, which, with a regular thickness of ca 5 m, shows this most clearly—though the problem concerns coal seams Nos. 415/1 and 510 [1], 504, 505 and 506 [2–4] and 406/4 [5], exploited in both the Polish and Czech parts of the USCB. The coal there, if any, is grey-black, dull, heavily cracked, brittle and without a banded structure. The altered, variably colored coal-bearing rocks are characterized by increased fracturing, porosity and reduction of physical and mechanical properties [6,7], all a reflection of oxidation and heating. Changes in the gangue rocks accompanying the vanishing coal seams may have been caused by weathering and thermal alteration of coal-bearing sediments locally preserved below a regional unconformity marking the Carboniferous top surface and within intra- Pennsylvanian disconformities [8]. General (geological) and detailed (petrographical, Minerals 2021, 11, 735. https://doi.org/10.3390/min11070735 https://www.mdpi.com/journal/minerals

Welcome message from author
This document is posted to help you gain knowledge. Please leave a comment to let me know what you think about it! Share it to your friends and learn new things together.
Transcript
minerals
Article
The Disappearance of Coal Seams Recorded in AssociatedGangue Rocks in the SW Part of the Upper Silesian CoalBasin, Poland
Justyna Ciesielczuk * , Monika J. Fabianska , Magdalena Misz-Kennan, Dominik Jura, Paweł Filipiakand Aniela Matuszewska
�����������������
Citation: Ciesielczuk, J.; Fabianska,
M.J.; Misz-Kennan, M.; Jura, D.;
Filipiak, P.; Matuszewska, A. The
Disappearance of Coal Seams
Recorded in Associated Gangue
Rocks in the SW Part of the Upper
Silesian Coal Basin, Poland. Minerals
2021, 11, 735. https://doi.org/
10.3390/min11070735
Academic Editor: Shifeng Dai
Received: 20 May 2021
Accepted: 3 July 2021
Published: 7 July 2021
Publisher’s Note: MDPI stays neutral
with regard to jurisdictional claims in
published maps and institutional affil-
iations.
Copyright: © 2021 by the authors.
Licensee MDPI, Basel, Switzerland.
This article is an open access article
distributed under the terms and
conditions of the Creative Commons
Attribution (CC BY) license (https://
creativecommons.org/licenses/by/
4.0/).
Institute of Earth Sciences, University of Silesia, 60 Bedzinska Str., PL-41-200 Sosnowiec, Poland;[email protected] (M.J.F.); [email protected] (M.M.-K.); [email protected] (D.J.);[email protected] (P.F.); [email protected] (A.M.)* Correspondence: [email protected]; Tel.: +48-323689336
Abstract: Coal seams in the Upper Silesian Coal Basin vanish within the Carboniferous Upper SilesianSandstone Series and below an unconformity marking the Carboniferous top surface. Changes in thegeochemical, mineralogical, petrological and palynological characteristics of gangue rocks associatedwith the vanished seams record what happened. The observed changes could have been causedby (1) coal-seam paleofire, (2) peat combustion, (3) igneous intrusion, (4) metasomatism and/or(5) weathering. Multifaceted research on samples collected at the Jas-Mos mining area, a part ofthe operating Jastrzebie-Bzie Coal Mine that are representative of different geological settings inthe northern and southern parts of the mining area, point to intra-deposit paleofire as the mostplausible reason for the disappearance. Biomarkers enabled recognition of differences in heatingduration and oxygen access. Coal seams in the south burned quickly with abundant oxygen supply.Seams in the north pyrolyzed for an extended time under conditions of limited oxygen. Thoughother methods used proved less sensitive, all confirmed low (100–150 ◦C) paleotemperature heating.Overall, the reason for the local disappearance of the coal seams, making their exploitation difficultand unprofitable, can be assigned to a variety of different processes in a complex overlapping historyof variable weathering, heating due to local endogenic fires and, probably, earlier peat combustion.
Keywords: disappearing coal seam; thermal alteration of gangue rocks; paleofire; Upper SilesianCoal Basin
1. Introduction
Coal and coal-bearing rocks in the south-western part of the Upper Silesian CoalBasin (USCB) of Early Pennsylvanian (Namurian BC) age underwent changes resultingin the partial/complete disappearance of coal seams over an area of ca 500 km2. Thisdisappearance is associated with gangue rocks of various colors, typically located abovethe seams. Maximum noticed thickness reduction up to disappearing was observed in coalseam No. 505, which, with a regular thickness of ca 5 m, shows this most clearly—thoughthe problem concerns coal seams Nos. 415/1 and 510 [1], 504, 505 and 506 [2–4] and406/4 [5], exploited in both the Polish and Czech parts of the USCB. The coal there, if any,is grey-black, dull, heavily cracked, brittle and without a banded structure. The altered,variably colored coal-bearing rocks are characterized by increased fracturing, porosityand reduction of physical and mechanical properties [6,7], all a reflection of oxidationand heating.
Changes in the gangue rocks accompanying the vanishing coal seams may have beencaused by weathering and thermal alteration of coal-bearing sediments locally preservedbelow a regional unconformity marking the Carboniferous top surface and within intra-Pennsylvanian disconformities [8]. General (geological) and detailed (petrographical,
Minerals 2021, 11, 735. https://doi.org/10.3390/min11070735 https://www.mdpi.com/journal/minerals
Minerals 2021, 11, 735 2 of 30
geochemical, palynological) descriptions of these variably colored beds indicate weatheringeffects and/or thermal transformations, the origin of which is not clear, as subsurfacemapping and sample collection is possible only from boreholes and single outcrops inoperating coal mines. As exploitation avoids regions possibly lacking coal, these parts ofmines are abandoned and inaccessible.
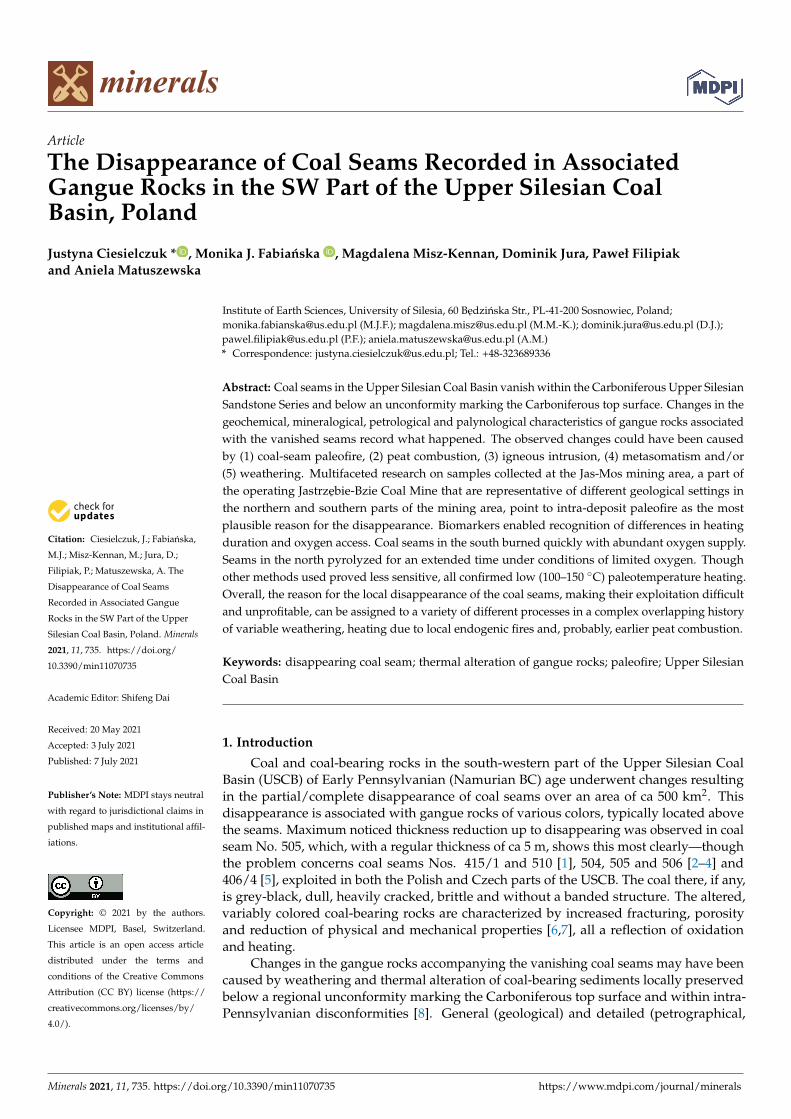
Several underground outcrops with vanishing coal seams and weathered and/orthermally altered gangue rocks of various types and irregular geometries occur in themining areas between Jastrzebie in Poland and Karviná in the Czech Republic (Figure 1).Anomalies favoring reduced coal-seam thickness and increasing coalification occur mainlyin the coalfield of the Jas-Mos, a part of the Jastrzebie-Bzie Coal Mine (Figures 2 and 3).
Minerals 2021, 11, x 2 of 31
Minerals 2021, 11, x. https://doi.org/10.3390/xxxxx www.mdpi.com/journal/minerals
below a regional unconformity marking the Carboniferous top surface and within intra-Pennsylvanian disconformities [8]. General (geological) and detailed (petrographical, ge-ochemical, palynological) descriptions of these variably colored beds indicate weathering effects and/or thermal transformations, the origin of which is not clear, as subsurface map-ping and sample collection is possible only from boreholes and single outcrops in operat-ing coal mines. As exploitation avoids regions possibly lacking coal, these parts of mines are abandoned and inaccessible.
Several underground outcrops with vanishing coal seams and weathered and/or thermally altered gangue rocks of various types and irregular geometries occur in the mining areas between Jastrzębie in Poland and Karviná in the Czech Republic (Figure 1). Anomalies favoring reduced coal-seam thickness and increasing coalification occur mainly in the coalfield of the Jas-Mos, a part of the Jastrzębie-Bzie Coal Mine (Figures 2 and 3).
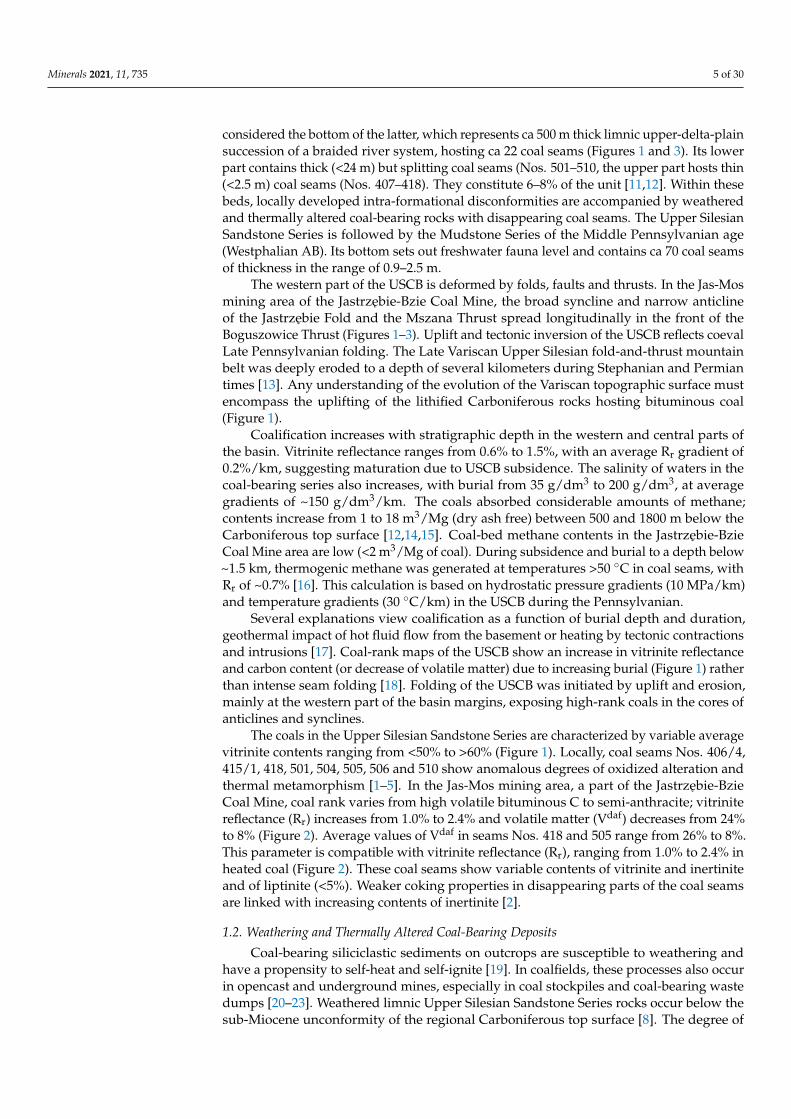
Figure 1. Subsurface structural map of the Carboniferous coal-bearing Paralic, Upper Silesian Sandstone and Mudstone Series in the western part of the Upper Silesian Coal Basin (USCB) (after [9,10]; simplified). Areas with vanishing coal seams and associated altered gangue rocks at the top of the Carboniferous units are shown in pink. 1: Jas-Mos mining area, a part of the Jastrzębie-Bzie Coal Mine; 2: Mudstone Series, Westphalian AB (CwAB), with bottom isolines (coal seam 405); 3: Upper Silesian Sandstone Series, Namurian BC (CnBC), with bottom isolines (coal seam 510); 4: Paralic Series, Na-murian A (CnA), with bottom isolines; 5: bottom isolines in km a.s.l.; 6: isolines of average random vitrinite reflectance Rr (%); 7: isolines of average vitrinite content (%); 8: fault; 9: thrust.
Figure 1. Subsurface structural map of the Carboniferous coal-bearing Paralic, Upper Silesian Sandstone and MudstoneSeries in the western part of the Upper Silesian Coal Basin (USCB) (after [9,10]; simplified). Areas with vanishing coal seamsand associated altered gangue rocks at the top of the Carboniferous units are shown in pink. 1: Jas-Mos mining area, apart of the Jastrzebie-Bzie Coal Mine; 2: Mudstone Series, Westphalian AB (CwAB), with bottom isolines (coal seam 405);3: Upper Silesian Sandstone Series, Namurian BC (CnBC), with bottom isolines (coal seam 510); 4: Paralic Series, NamurianA (CnA), with bottom isolines; 5: bottom isolines in km a.s.l.; 6: isolines of average random vitrinite reflectance Rr (%);7: isolines of average vitrinite content (%); 8: fault; 9: thrust.
Minerals 2021, 11, 735 3 of 30
Minerals 2021, 11, x 3 of 31
Minerals 2021, 11, x. https://doi.org/10.3390/xxxxx www.mdpi.com/journal/minerals
405); 3: Upper Silesian Sandstone Series, Namurian BC (CnBC), with bottom isolines (coal seam 510); 4: Paralic Series, Na‐
murian A (CnA), with bottom isolines; 5: bottom isolines in km a.s.l.; 6: isolines of average random vitrinite reflectance Rr
(%); 7: isolines of average vitrinite content (%); 8: fault; 9: thrust.
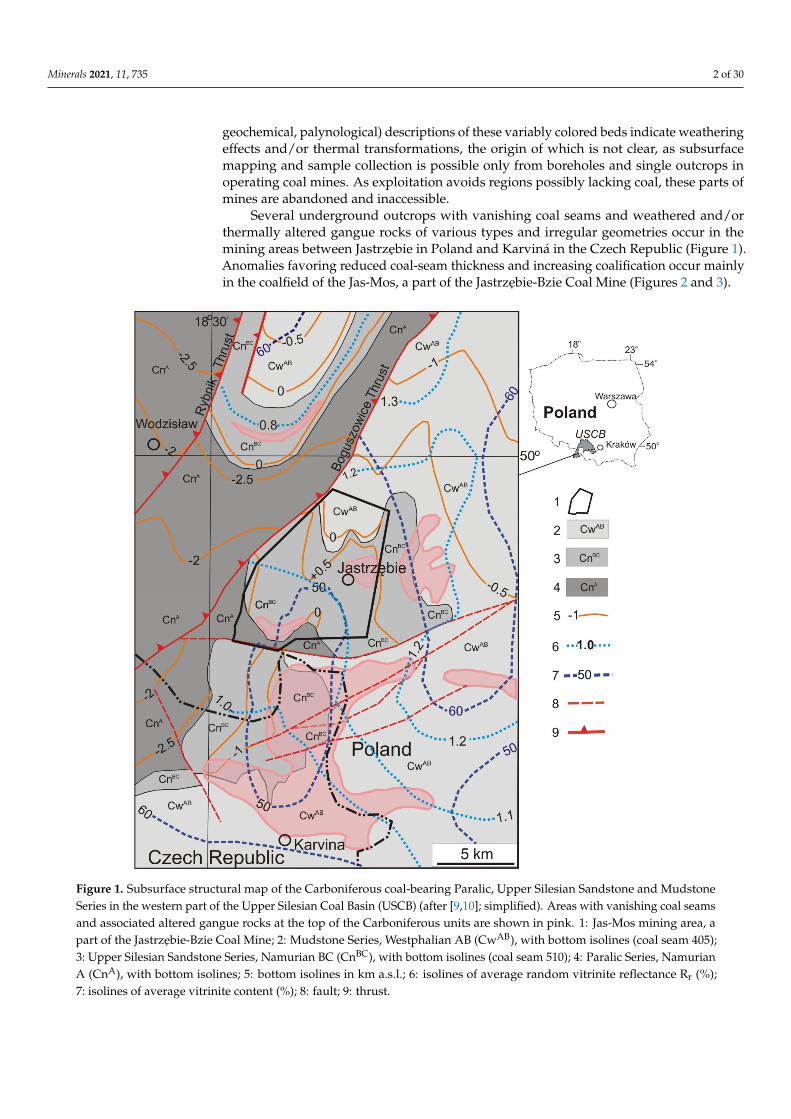
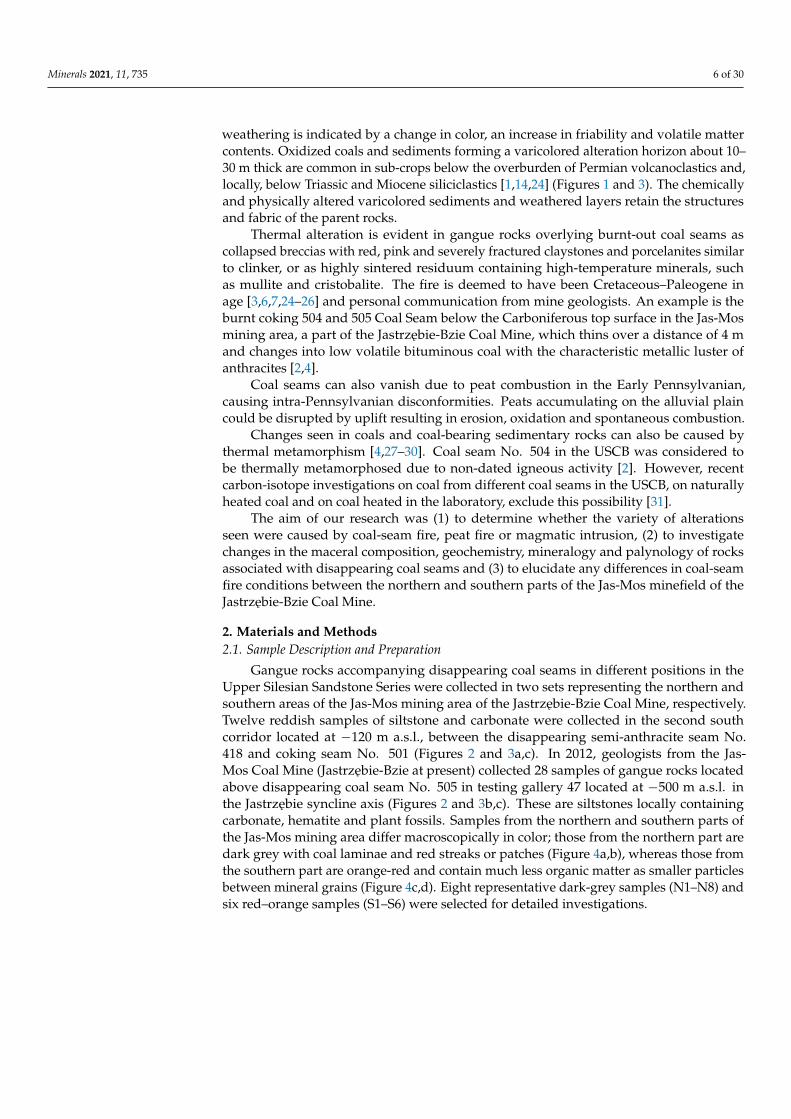
Figure 2. Structural sketch map of the coal seam No. 505 in the Jas‐Mos mining area, a part of the Jastrzębie‐Bzie Coal
Mine, and its disappearance (based on geological documentation of Jastrzębie‐Bzie Coal Mine, simplified). 1: isoline of the
bottom of coal seam No 505 in m a.s.l.; 2: subcrop of 505 coal seam below Miocene claystone; 3: coal rank and quality—
isolines of the average volatile matter content (Vdaf %), vitrinite reflectance Rr % and coal types; 4: unexploited coalfield, 5:
exploited coal; 6: altered associated gangue rocks and vanishing coal seam 505; 7: fault and thrust; 8: geological cross‐
section lines; 9: outcrops of coal seam 505 in testing gallery 47 (samples N1–8 in blue) and in south corridor II below coal
seam 418 (samples S1–6 in red); 10: shaft; 11: drilling.
Figure 2. Structural sketch map of the coal seam No. 505 in the Jas-Mos mining area, a part of the Jastrzebie-Bzie Coal Mine,and its disappearance (based on geological documentation of Jastrzebie-Bzie Coal Mine, simplified). 1: isoline of the bottomof coal seam No 505 in m a.s.l.; 2: subcrop of 505 coal seam below Miocene claystone; 3: coal rank and quality—isolines ofthe average volatile matter content (Vdaf %), vitrinite reflectance Rr % and coal types; 4: unexploited coalfield, 5: exploitedcoal; 6: altered associated gangue rocks and vanishing coal seam 505; 7: fault and thrust; 8: geological cross-section lines;9: outcrops of coal seam 505 in testing gallery 47 (samples N1–N8 in blue) and in south corridor II below coal seam 418(samples S1–S6 in red); 10: shaft; 11: drilling.
Minerals 2021, 11, 735 4 of 30Minerals 2021, 11, x 4 of 31
Minerals 2021, 11, x. https://doi.org/10.3390/xxxxx www.mdpi.com/journal/minerals
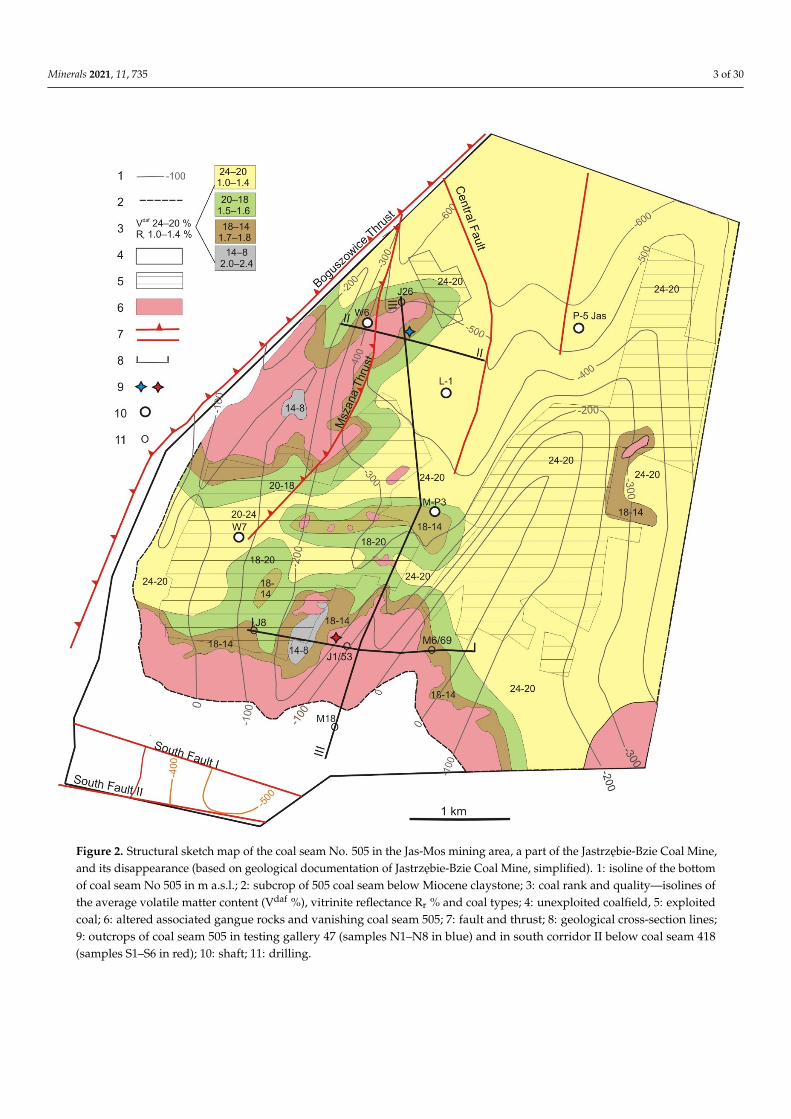
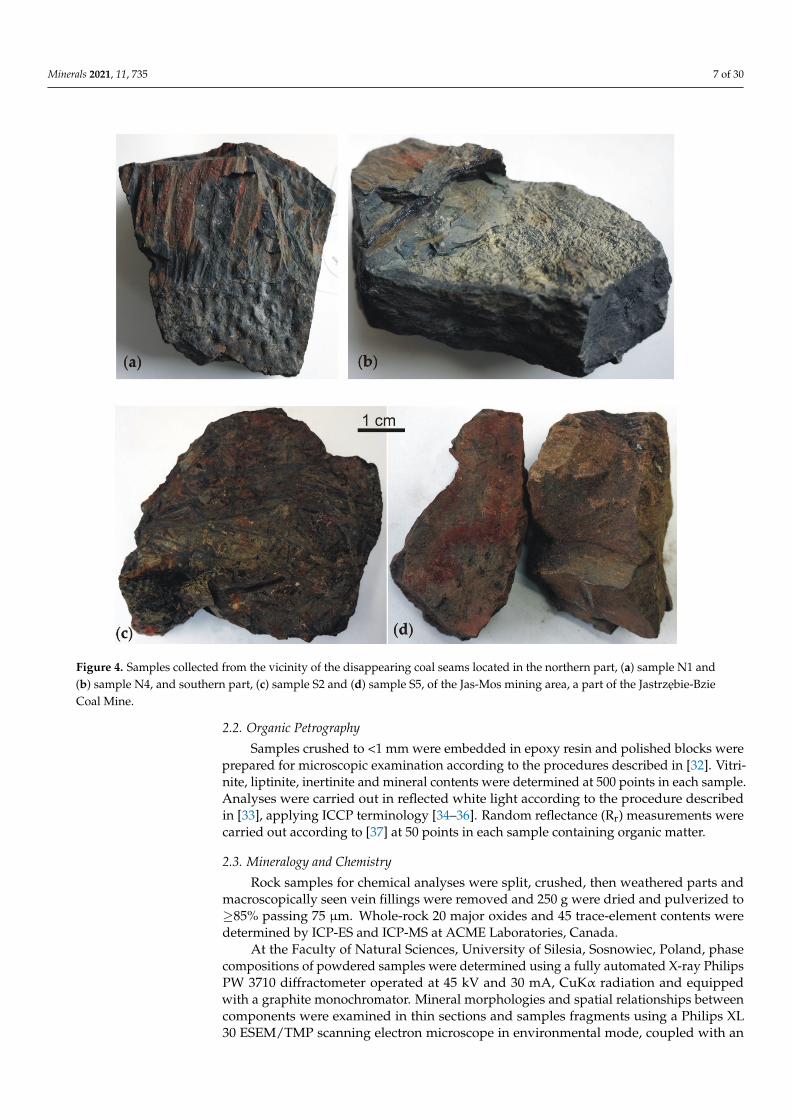
Figure 3. Cross-sections showing simplified geological settings in different areas of the Jas-Mos mining area, a part of the operating Jastrzębie-Bzie Coal Mine, with sample collecting locations (based on geological documentation of Jastrzębie-Bzie Coal Mine, simplified). (a) W–E southern cross-section I-I and location of samples S1–6 in south corridor II below coal seam 418; (b) W–E northern cross-section II-II with location of samples N1–8 collected from the outcrop of 505 seam in testing gallery 47, where the seam thins from 3.2 m to 0.4 m, at the distance of 30 m; (c) parallel N–S cross-section III-III, showing the position of samples N1–8 and S1–6.
Figure 3. Cross-sections showing simplified geological settings in different areas of the Jas-Mos mining area, a part of theoperating Jastrzebie-Bzie Coal Mine, with sample collecting locations (based on geological documentation of Jastrzebie-BzieCoal Mine, simplified). (a) W–E southern cross-section I-I and location of samples S1–S6 in south corridor II below coalseam 418; (b) W–E northern cross-section II-II with location of samples N1–N8 collected from the outcrop of 505 seam intesting gallery 47, where the seam thins from 3.2 m to 0.4 m, at the distance of 30 m; (c) parallel N–S cross-section III-III,showing the position of samples N1–N8 and S1–S6.
1.1. Geological Background
On the western margin of the USCB, the Mudstone–Sandstone Paralic Series of theLatest Mississippian age (Namurian A) are discordantly overlapped by the Upper SilesianSandstone Series of Early Pennsylvanian age (Namurian BC). The coal seam No.510 is
Minerals 2021, 11, 735 5 of 30
considered the bottom of the latter, which represents ca 500 m thick limnic upper-delta-plainsuccession of a braided river system, hosting ca 22 coal seams (Figures 1 and 3). Its lowerpart contains thick (<24 m) but splitting coal seams (Nos. 501–510, the upper part hosts thin(<2.5 m) coal seams (Nos. 407–418). They constitute 6–8% of the unit [11,12]. Within thesebeds, locally developed intra-formational disconformities are accompanied by weatheredand thermally altered coal-bearing rocks with disappearing coal seams. The Upper SilesianSandstone Series is followed by the Mudstone Series of the Middle Pennsylvanian age(Westphalian AB). Its bottom sets out freshwater fauna level and contains ca 70 coal seamsof thickness in the range of 0.9–2.5 m.
The western part of the USCB is deformed by folds, faults and thrusts. In the Jas-Mosmining area of the Jastrzebie-Bzie Coal Mine, the broad syncline and narrow anticlineof the Jastrzebie Fold and the Mszana Thrust spread longitudinally in the front of theBoguszowice Thrust (Figures 1–3). Uplift and tectonic inversion of the USCB reflects coevalLate Pennsylvanian folding. The Late Variscan Upper Silesian fold-and-thrust mountainbelt was deeply eroded to a depth of several kilometers during Stephanian and Permiantimes [13]. Any understanding of the evolution of the Variscan topographic surface mustencompass the uplifting of the lithified Carboniferous rocks hosting bituminous coal(Figure 1).
Coalification increases with stratigraphic depth in the western and central parts ofthe basin. Vitrinite reflectance ranges from 0.6% to 1.5%, with an average Rr gradient of0.2%/km, suggesting maturation due to USCB subsidence. The salinity of waters in thecoal-bearing series also increases, with burial from 35 g/dm3 to 200 g/dm3, at averagegradients of ~150 g/dm3/km. The coals absorbed considerable amounts of methane;contents increase from 1 to 18 m3/Mg (dry ash free) between 500 and 1800 m below theCarboniferous top surface [12,14,15]. Coal-bed methane contents in the Jastrzebie-BzieCoal Mine area are low (<2 m3/Mg of coal). During subsidence and burial to a depth below~1.5 km, thermogenic methane was generated at temperatures >50 ◦C in coal seams, withRr of ~0.7% [16]. This calculation is based on hydrostatic pressure gradients (10 MPa/km)and temperature gradients (30 ◦C/km) in the USCB during the Pennsylvanian.
Several explanations view coalification as a function of burial depth and duration,geothermal impact of hot fluid flow from the basement or heating by tectonic contractionsand intrusions [17]. Coal-rank maps of the USCB show an increase in vitrinite reflectanceand carbon content (or decrease of volatile matter) due to increasing burial (Figure 1) ratherthan intense seam folding [18]. Folding of the USCB was initiated by uplift and erosion,mainly at the western part of the basin margins, exposing high-rank coals in the cores ofanticlines and synclines.
The coals in the Upper Silesian Sandstone Series are characterized by variable averagevitrinite contents ranging from <50% to >60% (Figure 1). Locally, coal seams Nos. 406/4,415/1, 418, 501, 504, 505, 506 and 510 show anomalous degrees of oxidized alteration andthermal metamorphism [1–5]. In the Jas-Mos mining area, a part of the Jastrzebie-BzieCoal Mine, coal rank varies from high volatile bituminous C to semi-anthracite; vitrinitereflectance (Rr) increases from 1.0% to 2.4% and volatile matter (Vdaf) decreases from 24%to 8% (Figure 2). Average values of Vdaf in seams Nos. 418 and 505 range from 26% to 8%.This parameter is compatible with vitrinite reflectance (Rr), ranging from 1.0% to 2.4% inheated coal (Figure 2). These coal seams show variable contents of vitrinite and inertiniteand of liptinite (<5%). Weaker coking properties in disappearing parts of the coal seamsare linked with increasing contents of inertinite [2].
1.2. Weathering and Thermally Altered Coal-Bearing Deposits
Coal-bearing siliciclastic sediments on outcrops are susceptible to weathering andhave a propensity to self-heat and self-ignite [19]. In coalfields, these processes also occurin opencast and underground mines, especially in coal stockpiles and coal-bearing wastedumps [20–23]. Weathered limnic Upper Silesian Sandstone Series rocks occur below thesub-Miocene unconformity of the regional Carboniferous top surface [8]. The degree of
Minerals 2021, 11, 735 6 of 30
weathering is indicated by a change in color, an increase in friability and volatile mattercontents. Oxidized coals and sediments forming a varicolored alteration horizon about 10–30 m thick are common in sub-crops below the overburden of Permian volcanoclastics and,locally, below Triassic and Miocene siliciclastics [1,14,24] (Figures 1 and 3). The chemicallyand physically altered varicolored sediments and weathered layers retain the structuresand fabric of the parent rocks.
Thermal alteration is evident in gangue rocks overlying burnt-out coal seams ascollapsed breccias with red, pink and severely fractured claystones and porcelanites similarto clinker, or as highly sintered residuum containing high-temperature minerals, suchas mullite and cristobalite. The fire is deemed to have been Cretaceous–Paleogene inage [3,6,7,24–26] and personal communication from mine geologists. An example is theburnt coking 504 and 505 Coal Seam below the Carboniferous top surface in the Jas-Mosmining area, a part of the Jastrzebie-Bzie Coal Mine, which thins over a distance of 4 mand changes into low volatile bituminous coal with the characteristic metallic luster ofanthracites [2,4].
Coal seams can also vanish due to peat combustion in the Early Pennsylvanian,causing intra-Pennsylvanian disconformities. Peats accumulating on the alluvial plaincould be disrupted by uplift resulting in erosion, oxidation and spontaneous combustion.
Changes seen in coals and coal-bearing sedimentary rocks can also be caused bythermal metamorphism [4,27–30]. Coal seam No. 504 in the USCB was considered tobe thermally metamorphosed due to non-dated igneous activity [2]. However, recentcarbon-isotope investigations on coal from different coal seams in the USCB, on naturallyheated coal and on coal heated in the laboratory, exclude this possibility [31].
The aim of our research was (1) to determine whether the variety of alterationsseen were caused by coal-seam fire, peat fire or magmatic intrusion, (2) to investigatechanges in the maceral composition, geochemistry, mineralogy and palynology of rocksassociated with disappearing coal seams and (3) to elucidate any differences in coal-seamfire conditions between the northern and southern parts of the Jas-Mos minefield of theJastrzebie-Bzie Coal Mine.
2. Materials and Methods2.1. Sample Description and Preparation
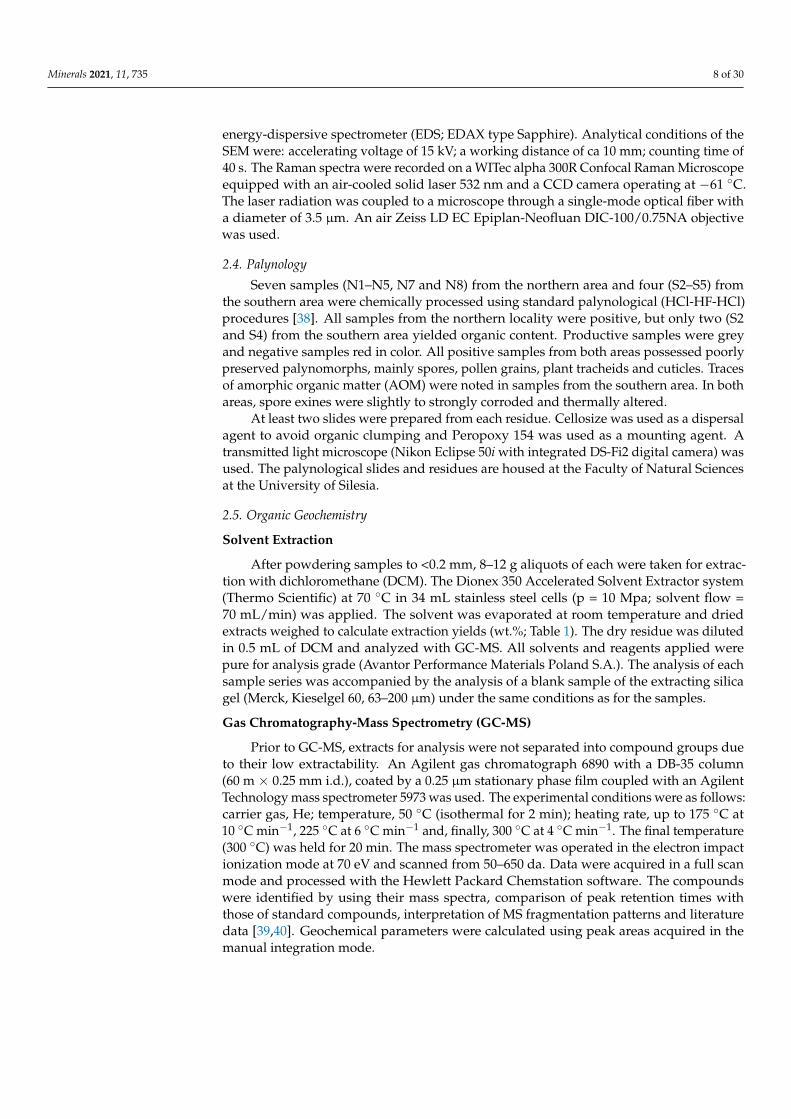
Gangue rocks accompanying disappearing coal seams in different positions in theUpper Silesian Sandstone Series were collected in two sets representing the northern andsouthern areas of the Jas-Mos mining area of the Jastrzebie-Bzie Coal Mine, respectively.Twelve reddish samples of siltstone and carbonate were collected in the second southcorridor located at −120 m a.s.l., between the disappearing semi-anthracite seam No.418 and coking seam No. 501 (Figures 2 and 3a,c). In 2012, geologists from the Jas-Mos Coal Mine (Jastrzebie-Bzie at present) collected 28 samples of gangue rocks locatedabove disappearing coal seam No. 505 in testing gallery 47 located at −500 m a.s.l. inthe Jastrzebie syncline axis (Figures 2 and 3b,c). These are siltstones locally containingcarbonate, hematite and plant fossils. Samples from the northern and southern parts ofthe Jas-Mos mining area differ macroscopically in color; those from the northern part aredark grey with coal laminae and red streaks or patches (Figure 4a,b), whereas those fromthe southern part are orange-red and contain much less organic matter as smaller particlesbetween mineral grains (Figure 4c,d). Eight representative dark-grey samples (N1–N8) andsix red–orange samples (S1–S6) were selected for detailed investigations.
Minerals 2021, 11, 735 7 of 30Minerals 2021, 11, x 7 of 31
Minerals 2021, 11, x. https://doi.org/10.3390/xxxxx www.mdpi.com/journal/minerals
Figure 4. Samples collected from the vicinity of the disappearing coal seams located in the northern part, (a) sample N1
and (b) sample N4, and southern part, (c) sample S2 and (d) sample S5, of the Jas‐Mos mining area, a part of the Jastrzębie‐
Bzie Coal Mine.
2.2. Organic Petrography
Samples crushed to <1 mm were embedded in epoxy resin and polished blocks were
prepared for microscopic examination according to the procedures described in [32]. Vit‐
rinite, liptinite, inertinite and mineral contents were determined at 500 points in each sam‐
ple. Analyses were carried out in reflected white light according to the procedure de‐
scribed in [33], applying ICCP terminology [34–36]. Random reflectance (Rr) measure‐
ments were carried out according to [37] at 50 points in each sample containing organic
matter.
2.3. Mineralogy and Chemistry
Rock samples for chemical analyses were split, crushed, then weathered parts and
macroscopically seen vein fillings were removed and 250 g were dried and pulverized to
85% passing 75 μm. Whole‐rock 20 major oxides and 45 trace‐element contents were de‐
termined by ICP‐ES and ICP‐MS at ACME Laboratories, Canada.
At the Faculty of Natural Sciences, University of Silesia, Sosnowiec, Poland, phase
compositions of powdered samples were determined using a fully automated X‐ray
Philips PW 3710 diffractometer operated at 45 kV and 30 mA, CuKα radiation and
equipped with a graphite monochromator. Mineral morphologies and spatial relation‐
ships between components were examined in thin sections and samples fragments using
Figure 4. Samples collected from the vicinity of the disappearing coal seams located in the northern part, (a) sample N1 and(b) sample N4, and southern part, (c) sample S2 and (d) sample S5, of the Jas-Mos mining area, a part of the Jastrzebie-BzieCoal Mine.
2.2. Organic Petrography
Samples crushed to <1 mm were embedded in epoxy resin and polished blocks wereprepared for microscopic examination according to the procedures described in [32]. Vitri-nite, liptinite, inertinite and mineral contents were determined at 500 points in each sample.Analyses were carried out in reflected white light according to the procedure describedin [33], applying ICCP terminology [34–36]. Random reflectance (Rr) measurements werecarried out according to [37] at 50 points in each sample containing organic matter.
2.3. Mineralogy and Chemistry
Rock samples for chemical analyses were split, crushed, then weathered parts andmacroscopically seen vein fillings were removed and 250 g were dried and pulverized to≥85% passing 75 µm. Whole-rock 20 major oxides and 45 trace-element contents weredetermined by ICP-ES and ICP-MS at ACME Laboratories, Canada.
At the Faculty of Natural Sciences, University of Silesia, Sosnowiec, Poland, phasecompositions of powdered samples were determined using a fully automated X-ray PhilipsPW 3710 diffractometer operated at 45 kV and 30 mA, CuKα radiation and equippedwith a graphite monochromator. Mineral morphologies and spatial relationships betweencomponents were examined in thin sections and samples fragments using a Philips XL30 ESEM/TMP scanning electron microscope in environmental mode, coupled with an
Minerals 2021, 11, 735 8 of 30
energy-dispersive spectrometer (EDS; EDAX type Sapphire). Analytical conditions of theSEM were: accelerating voltage of 15 kV; a working distance of ca 10 mm; counting time of40 s. The Raman spectra were recorded on a WITec alpha 300R Confocal Raman Microscopeequipped with an air-cooled solid laser 532 nm and a CCD camera operating at −61 ◦C.The laser radiation was coupled to a microscope through a single-mode optical fiber witha diameter of 3.5 µm. An air Zeiss LD EC Epiplan-Neofluan DIC-100/0.75NA objectivewas used.
2.4. Palynology
Seven samples (N1–N5, N7 and N8) from the northern area and four (S2–S5) fromthe southern area were chemically processed using standard palynological (HCl-HF-HCl)procedures [38]. All samples from the northern locality were positive, but only two (S2and S4) from the southern area yielded organic content. Productive samples were greyand negative samples red in color. All positive samples from both areas possessed poorlypreserved palynomorphs, mainly spores, pollen grains, plant tracheids and cuticles. Tracesof amorphic organic matter (AOM) were noted in samples from the southern area. In bothareas, spore exines were slightly to strongly corroded and thermally altered.
At least two slides were prepared from each residue. Cellosize was used as a dispersalagent to avoid organic clumping and Peropoxy 154 was used as a mounting agent. Atransmitted light microscope (Nikon Eclipse 50i with integrated DS-Fi2 digital camera) wasused. The palynological slides and residues are housed at the Faculty of Natural Sciencesat the University of Silesia.
2.5. Organic Geochemistry
Solvent Extraction
After powdering samples to <0.2 mm, 8–12 g aliquots of each were taken for extrac-tion with dichloromethane (DCM). The Dionex 350 Accelerated Solvent Extractor system(Thermo Scientific) at 70 ◦C in 34 mL stainless steel cells (p = 10 Mpa; solvent flow =70 mL/min) was applied. The solvent was evaporated at room temperature and driedextracts weighed to calculate extraction yields (wt.%; Table 1). The dry residue was dilutedin 0.5 mL of DCM and analyzed with GC-MS. All solvents and reagents applied werepure for analysis grade (Avantor Performance Materials Poland S.A.). The analysis of eachsample series was accompanied by the analysis of a blank sample of the extracting silicagel (Merck, Kieselgel 60, 63–200 µm) under the same conditions as for the samples.
Gas Chromatography-Mass Spectrometry (GC-MS)
Prior to GC-MS, extracts for analysis were not separated into compound groups dueto their low extractability. An Agilent gas chromatograph 6890 with a DB-35 column(60 m × 0.25 mm i.d.), coated by a 0.25 µm stationary phase film coupled with an AgilentTechnology mass spectrometer 5973 was used. The experimental conditions were as follows:carrier gas, He; temperature, 50 ◦C (isothermal for 2 min); heating rate, up to 175 ◦C at10 ◦C min−1, 225 ◦C at 6 ◦C min−1 and, finally, 300 ◦C at 4 ◦C min−1. The final temperature(300 ◦C) was held for 20 min. The mass spectrometer was operated in the electron impactionization mode at 70 eV and scanned from 50–650 da. Data were acquired in a full scanmode and processed with the Hewlett Packard Chemstation software. The compoundswere identified by using their mass spectra, comparison of peak retention times withthose of standard compounds, interpretation of MS fragmentation patterns and literaturedata [39,40]. Geochemical parameters were calculated using peak areas acquired in themanual integration mode.
Minerals 2021, 11, 735 9 of 30
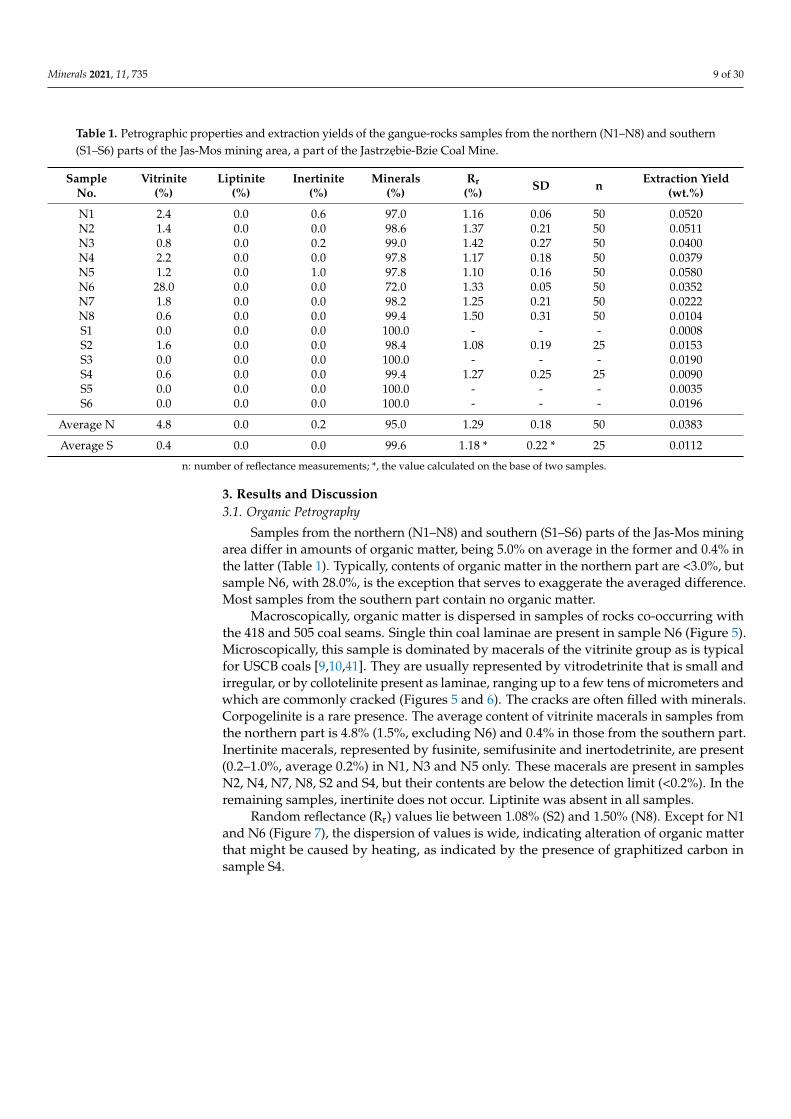
Table 1. Petrographic properties and extraction yields of the gangue-rocks samples from the northern (N1–N8) and southern(S1–S6) parts of the Jas-Mos mining area, a part of the Jastrzebie-Bzie Coal Mine.
SampleNo.
Vitrinite(%)
Liptinite(%)
Inertinite(%)
Minerals(%)
Rr(%) SD n Extraction Yield
(wt.%)
N1 2.4 0.0 0.6 97.0 1.16 0.06 50 0.0520N2 1.4 0.0 0.0 98.6 1.37 0.21 50 0.0511N3 0.8 0.0 0.2 99.0 1.42 0.27 50 0.0400N4 2.2 0.0 0.0 97.8 1.17 0.18 50 0.0379N5 1.2 0.0 1.0 97.8 1.10 0.16 50 0.0580N6 28.0 0.0 0.0 72.0 1.33 0.05 50 0.0352N7 1.8 0.0 0.0 98.2 1.25 0.21 50 0.0222N8 0.6 0.0 0.0 99.4 1.50 0.31 50 0.0104S1 0.0 0.0 0.0 100.0 - - - 0.0008S2 1.6 0.0 0.0 98.4 1.08 0.19 25 0.0153S3 0.0 0.0 0.0 100.0 - - - 0.0190S4 0.6 0.0 0.0 99.4 1.27 0.25 25 0.0090S5 0.0 0.0 0.0 100.0 - - - 0.0035S6 0.0 0.0 0.0 100.0 - - - 0.0196
Average N 4.8 0.0 0.2 95.0 1.29 0.18 50 0.0383
Average S 0.4 0.0 0.0 99.6 1.18 * 0.22 * 25 0.0112
n: number of reflectance measurements; *, the value calculated on the base of two samples.
3. Results and Discussion3.1. Organic Petrography
Samples from the northern (N1–N8) and southern (S1–S6) parts of the Jas-Mos miningarea differ in amounts of organic matter, being 5.0% on average in the former and 0.4% inthe latter (Table 1). Typically, contents of organic matter in the northern part are <3.0%, butsample N6, with 28.0%, is the exception that serves to exaggerate the averaged difference.Most samples from the southern part contain no organic matter.
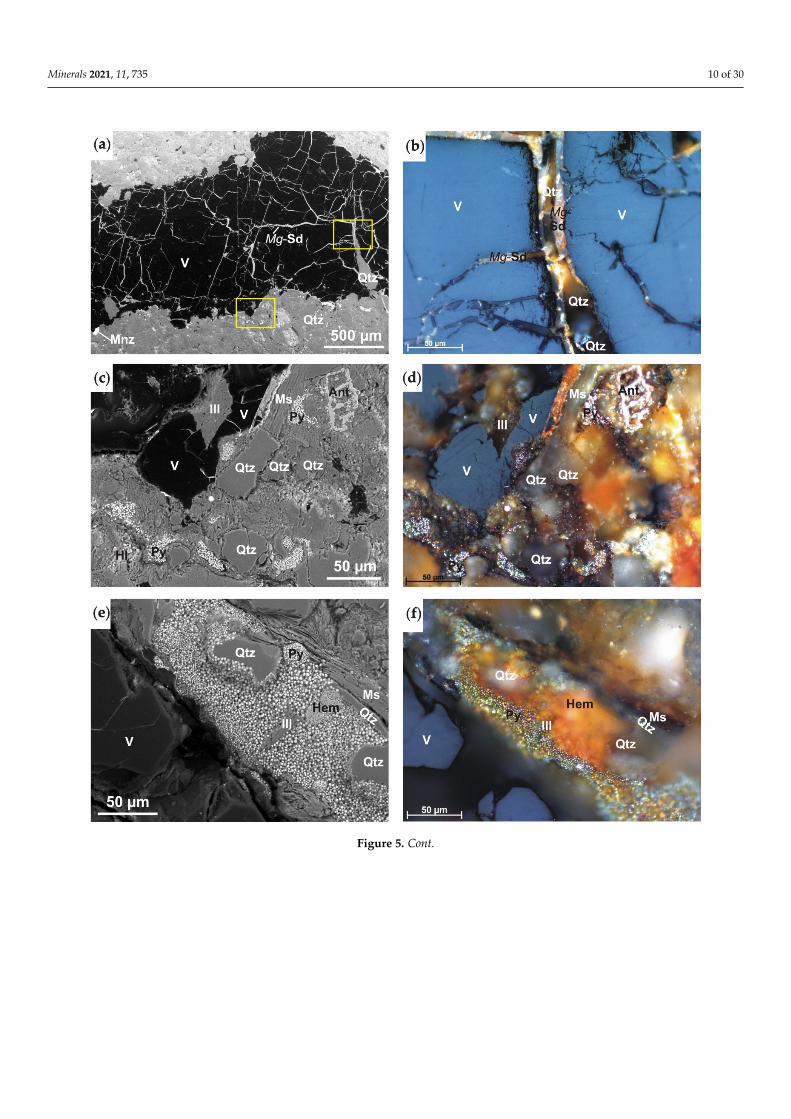
Macroscopically, organic matter is dispersed in samples of rocks co-occurring withthe 418 and 505 coal seams. Single thin coal laminae are present in sample N6 (Figure 5).Microscopically, this sample is dominated by macerals of the vitrinite group as is typicalfor USCB coals [9,10,41]. They are usually represented by vitrodetrinite that is small andirregular, or by collotelinite present as laminae, ranging up to a few tens of micrometers andwhich are commonly cracked (Figures 5 and 6). The cracks are often filled with minerals.Corpogelinite is a rare presence. The average content of vitrinite macerals in samples fromthe northern part is 4.8% (1.5%, excluding N6) and 0.4% in those from the southern part.Inertinite macerals, represented by fusinite, semifusinite and inertodetrinite, are present(0.2–1.0%, average 0.2%) in N1, N3 and N5 only. These macerals are present in samplesN2, N4, N7, N8, S2 and S4, but their contents are below the detection limit (<0.2%). In theremaining samples, inertinite does not occur. Liptinite was absent in all samples.
Random reflectance (Rr) values lie between 1.08% (S2) and 1.50% (N8). Except for N1and N6 (Figure 7), the dispersion of values is wide, indicating alteration of organic matterthat might be caused by heating, as indicated by the presence of graphitized carbon insample S4.
Minerals 2021, 11, 735 10 of 30Minerals 2021, 11, x 10 of 31
Minerals 2021, 11, x. https://doi.org/10.3390/xxxxx www.mdpi.com/journal/minerals
Figure 5. Cont.
Minerals 2021, 11, 735 11 of 30
Minerals 2021, 11, x 10 of 31
Minerals 2021, 11, x. https://doi.org/10.3390/xxxxx www.mdpi.com/journal/minerals
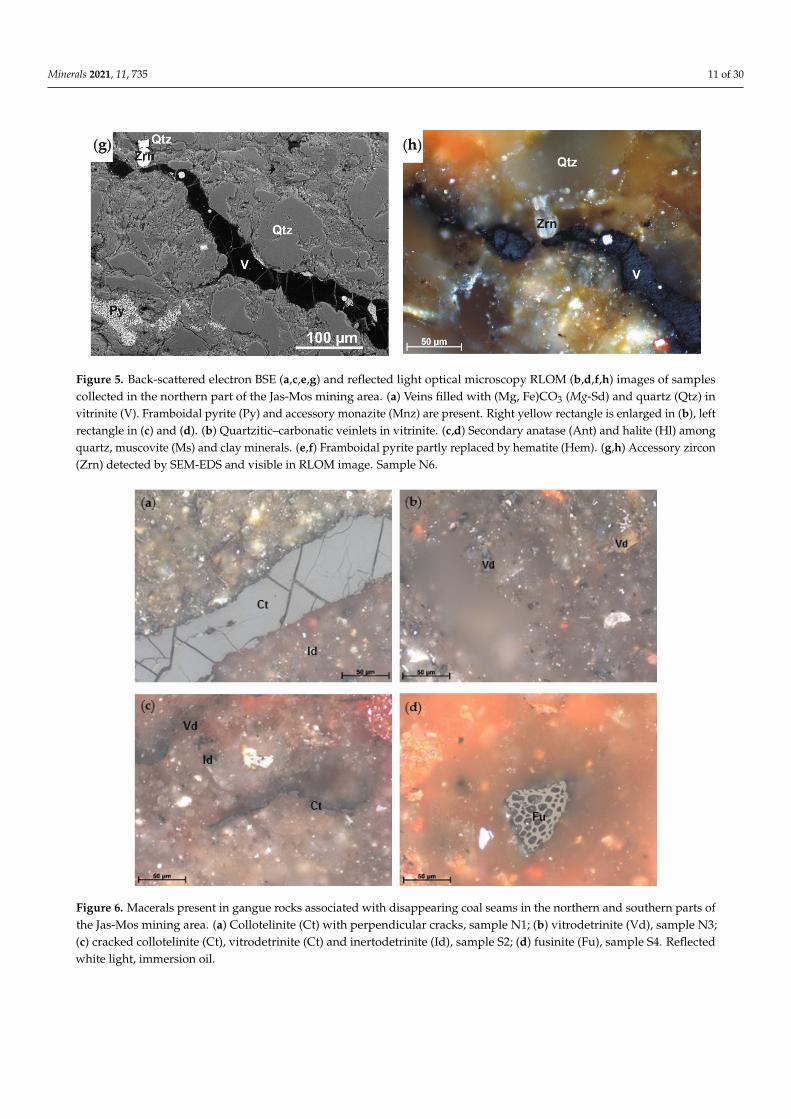
Figure 5. Back-scattered electron BSE (a,c,e,g) and reflected light optical microscopy RLOM (b,d,f,h) images of samplescollected in the northern part of the Jas-Mos mining area. (a) Veins filled with (Mg, Fe)CO3 (Mg-Sd) and quartz (Qtz) invitrinite (V). Framboidal pyrite (Py) and accessory monazite (Mnz) are present. Right yellow rectangle is enlarged in (b), leftrectangle in (c) and (d). (b) Quartzitic–carbonatic veinlets in vitrinite. (c,d) Secondary anatase (Ant) and halite (Hl) amongquartz, muscovite (Ms) and clay minerals. (e,f) Framboidal pyrite partly replaced by hematite (Hem). (g,h) Accessory zircon(Zrn) detected by SEM-EDS and visible in RLOM image. Sample N6.
Minerals 2021, 11, x 11 of 31
Minerals 2021, 11, x. https://doi.org/10.3390/xxxxx www.mdpi.com/journal/minerals
Figure 5. Back‐scattered electron BSE (a,c,e,g) and reflected light optical microscopy RLOM (b,d,f,h) images of samples
collected in the northern part of the Jas‐Mos mining area. (a) Veins filled with (Mg, Fe)CO3 (Mg‐Sd) and quartz (Qtz) in
vitrinite (V). Framboidal pyrite (Py) and accessory monazite (Mnz) are present. Right yellow rectangle is enlarged in (b),
left rectangle in (c) and (d). (b) Quartzitic–carbonatic veinlets in vitrinite. (c,d) Secondary anatase (Ant) and halite (Hl)
among quartz, muscovite (Ms) and clay minerals. (e,f) Framboidal pyrite partly replaced by hematite (Hem). (g,h) Acces‐
sory zircon (Zrn) detected by SEM‐EDS and visible in RLOM image. Sample N6.
Figure 6. Macerals present in gangue rocks associated with disappearing coal seams in the northern and southern parts of
the Jas‐Mos mining area. (a) Collotelinite (Ct) with perpendicular cracks, sample N1; (b) vitrodetrinite (Vd), sample N3;
(c) cracked collotelinite (Ct), vitrodetrinite (Ct) and inertodetrinite (Id), sample S2; (d) fusinite (Fu), sample S4. Reflected
white light, immersion oil.
Figure 6. Macerals present in gangue rocks associated with disappearing coal seams in the northern and southern parts ofthe Jas-Mos mining area. (a) Collotelinite (Ct) with perpendicular cracks, sample N1; (b) vitrodetrinite (Vd), sample N3;(c) cracked collotelinite (Ct), vitrodetrinite (Ct) and inertodetrinite (Id), sample S2; (d) fusinite (Fu), sample S4. Reflectedwhite light, immersion oil.
Minerals 2021, 11, 735 12 of 30Minerals 2021, 11, x 12 of 31
Minerals 2021, 11, x. https://doi.org/10.3390/xxxxx www.mdpi.com/journal/minerals
Figure 7. Back‐scattered electron BSE (a–d) and reflected light optical microscopy RLOM (e–f) images of samples collected
in the southern part of the Jas‐Mos mining area. (a) Siderite (Sd) rhombohedra, calcite (Cal) and barite (Brt) occurring in
fractures in sample S1; (b) carbonates impregnating the gangue rock with dolomite (Dol) forming veins along the organic
matter (OM) and kaolinite (Kln) and muscovite (Ms) form interlayers in sample S2; (c) quartz (Qtz), muscovite, kaolinite,
illite (Ill), siderite and accessory zircon (Zrn) in sample S3; (d) secondary hydroxylapatite (Ap), anatase (Ant) among
quartz, K‐feldspars (K‐fs), muscovite, Fe‐chlorite (Chl), siderite and clay minerals in sample S5; (e) cracked collotelinite
(Ct) and vitrodetrinite (Vd) particle in mineral matter in sample S3; (f) graphitized carbon in sample S4.
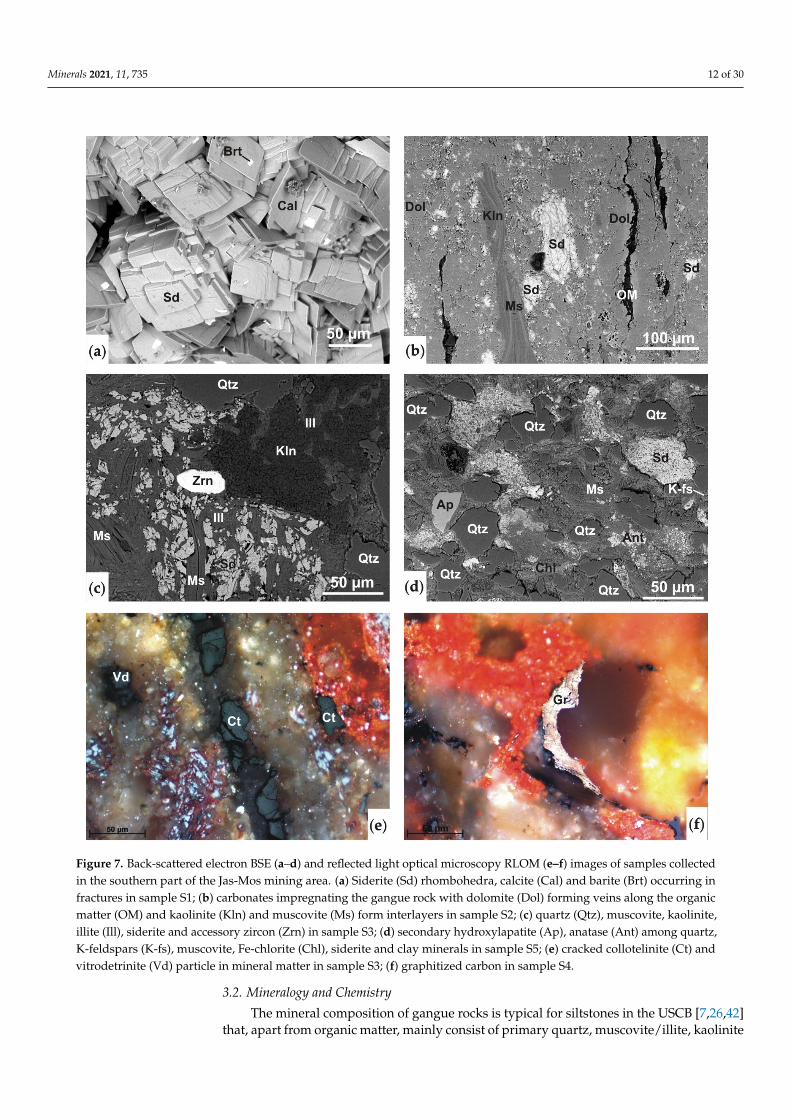
Figure 7. Back-scattered electron BSE (a–d) and reflected light optical microscopy RLOM (e–f) images of samples collectedin the southern part of the Jas-Mos mining area. (a) Siderite (Sd) rhombohedra, calcite (Cal) and barite (Brt) occurring infractures in sample S1; (b) carbonates impregnating the gangue rock with dolomite (Dol) forming veins along the organicmatter (OM) and kaolinite (Kln) and muscovite (Ms) form interlayers in sample S2; (c) quartz (Qtz), muscovite, kaolinite,illite (Ill), siderite and accessory zircon (Zrn) in sample S3; (d) secondary hydroxylapatite (Ap), anatase (Ant) among quartz,K-feldspars (K-fs), muscovite, Fe-chlorite (Chl), siderite and clay minerals in sample S5; (e) cracked collotelinite (Ct) andvitrodetrinite (Vd) particle in mineral matter in sample S3; (f) graphitized carbon in sample S4.
3.2. Mineralogy and Chemistry
The mineral composition of gangue rocks is typical for siltstones in the USCB [7,26,42]that, apart from organic matter, mainly consist of primary quartz, muscovite/illite, kaolinite
Minerals 2021, 11, 735 13 of 30
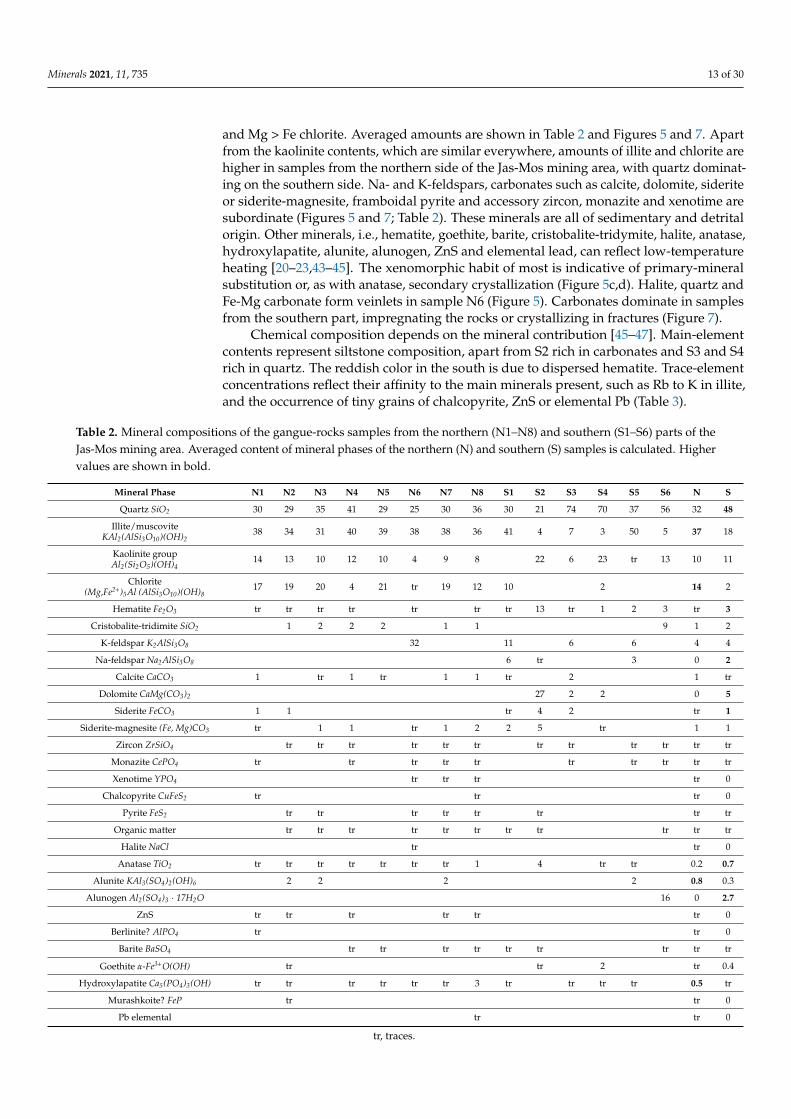
and Mg > Fe chlorite. Averaged amounts are shown in Table 2 and Figures 5 and 7. Apartfrom the kaolinite contents, which are similar everywhere, amounts of illite and chlorite arehigher in samples from the northern side of the Jas-Mos mining area, with quartz dominat-ing on the southern side. Na- and K-feldspars, carbonates such as calcite, dolomite, sideriteor siderite-magnesite, framboidal pyrite and accessory zircon, monazite and xenotime aresubordinate (Figures 5 and 7; Table 2). These minerals are all of sedimentary and detritalorigin. Other minerals, i.e., hematite, goethite, barite, cristobalite-tridymite, halite, anatase,hydroxylapatite, alunite, alunogen, ZnS and elemental lead, can reflect low-temperatureheating [20–23,43–45]. The xenomorphic habit of most is indicative of primary-mineralsubstitution or, as with anatase, secondary crystallization (Figure 5c,d). Halite, quartz andFe-Mg carbonate form veinlets in sample N6 (Figure 5). Carbonates dominate in samplesfrom the southern part, impregnating the rocks or crystallizing in fractures (Figure 7).
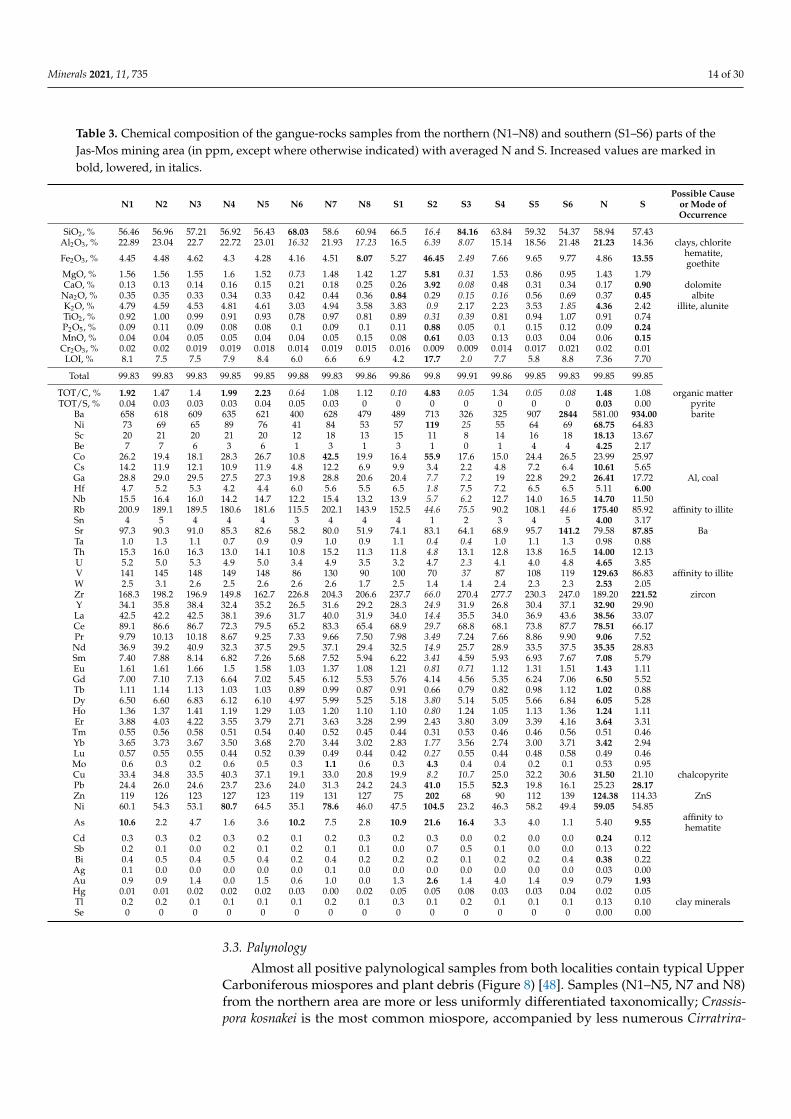
Chemical composition depends on the mineral contribution [45–47]. Main-elementcontents represent siltstone composition, apart from S2 rich in carbonates and S3 and S4rich in quartz. The reddish color in the south is due to dispersed hematite. Trace-elementconcentrations reflect their affinity to the main minerals present, such as Rb to K in illite,and the occurrence of tiny grains of chalcopyrite, ZnS or elemental Pb (Table 3).
Table 2. Mineral compositions of the gangue-rocks samples from the northern (N1–N8) and southern (S1–S6) parts of theJas-Mos mining area. Averaged content of mineral phases of the northern (N) and southern (S) samples is calculated. Highervalues are shown in bold.
Mineral Phase N1 N2 N3 N4 N5 N6 N7 N8 S1 S2 S3 S4 S5 S6 N S
Quartz SiO2 30 29 35 41 29 25 30 36 30 21 74 70 37 56 32 48
Illite/muscoviteKAl2(AlSi3O10)(OH)2
38 34 31 40 39 38 38 36 41 4 7 3 50 5 37 18
Kaolinite groupAl2(Si2O5)(OH)4
14 13 10 12 10 4 9 8 22 6 23 tr 13 10 11
Chlorite(Mg,Fe2+)5Al (AlSi3O10)(OH)8
17 19 20 4 21 tr 19 12 10 2 14 2
Hematite Fe2O3 tr tr tr tr tr tr tr 13 tr 1 2 3 tr 3
Cristobalite-tridimite SiO2 1 2 2 2 1 1 9 1 2
K-feldspar K2AlSi3O8 32 11 6 6 4 4
Na-feldspar Na2AlSi3O8 6 tr 3 0 2
Calcite CaCO3 1 tr 1 tr 1 1 tr 2 1 tr
Dolomite CaMg(CO3)2 27 2 2 0 5
Siderite FeCO3 1 1 tr 4 2 tr 1
Siderite-magnesite (Fe, Mg)CO3 tr 1 1 tr 1 2 2 5 tr 1 1
Zircon ZrSiO4 tr tr tr tr tr tr tr tr tr tr tr tr
Monazite CePO4 tr tr tr tr tr tr tr tr tr tr
Xenotime YPO4 tr tr tr tr 0
Chalcopyrite CuFeS2 tr tr tr 0
Pyrite FeS2 tr tr tr tr tr tr tr tr
Organic matter tr tr tr tr tr tr tr tr tr tr tr
Halite NaCl tr tr 0
Anatase TiO2 tr tr tr tr tr tr tr 1 4 tr tr 0.2 0.7
Alunite KAl3(SO4)2(OH)6 2 2 2 2 0.8 0.3
Alunogen Al2(SO4)3 · 17H2O 16 0 2.7
ZnS tr tr tr tr tr tr 0
Berlinite? AlPO4 tr tr 0
Barite BaSO4 tr tr tr tr tr tr tr tr tr
Goethite α-Fe3+O(OH) tr tr 2 tr 0.4
Hydroxylapatite Ca5(PO4)3(OH) tr tr tr tr tr tr 3 tr tr tr tr 0.5 tr
Murashkoite? FeP tr tr 0
Pb elemental tr tr 0
tr, traces.
Minerals 2021, 11, 735 14 of 30
Table 3. Chemical composition of the gangue-rocks samples from the northern (N1–N8) and southern (S1–S6) parts of theJas-Mos mining area (in ppm, except where otherwise indicated) with averaged N and S. Increased values are marked inbold, lowered, in italics.
N1 N2 N3 N4 N5 N6 N7 N8 S1 S2 S3 S4 S5 S6 N SPossible Cause
or Mode ofOccurrence
SiO2, % 56.46 56.96 57.21 56.92 56.43 68.03 58.6 60.94 66.5 16.4 84.16 63.84 59.32 54.37 58.94 57.43Al2O3, % 22.89 23.04 22.7 22.72 23.01 16.32 21.93 17.23 16.5 6.39 8.07 15.14 18.56 21.48 21.23 14.36 clays, chlorite
Fe2O3, % 4.45 4.48 4.62 4.3 4.28 4.16 4.51 8.07 5.27 46.45 2.49 7.66 9.65 9.77 4.86 13.55 hematite,goethite
MgO, % 1.56 1.56 1.55 1.6 1.52 0.73 1.48 1.42 1.27 5.81 0.31 1.53 0.86 0.95 1.43 1.79CaO, % 0.13 0.13 0.14 0.16 0.15 0.21 0.18 0.25 0.26 3.92 0.08 0.48 0.31 0.34 0.17 0.90 dolomite
Na2O, % 0.35 0.35 0.33 0.34 0.33 0.42 0.44 0.36 0.84 0.29 0.15 0.16 0.56 0.69 0.37 0.45 albiteK2O, % 4.79 4.59 4.53 4.81 4.61 3.03 4.94 3.58 3.83 0.9 2.17 2.23 3.53 1.85 4.36 2.42 illite, aluniteTiO2, % 0.92 1.00 0.99 0.91 0.93 0.78 0.97 0.81 0.89 0.31 0.39 0.81 0.94 1.07 0.91 0.74P2O5, % 0.09 0.11 0.09 0.08 0.08 0.1 0.09 0.1 0.11 0.88 0.05 0.1 0.15 0.12 0.09 0.24MnO, % 0.04 0.04 0.05 0.05 0.04 0.04 0.05 0.15 0.08 0.61 0.03 0.13 0.03 0.04 0.06 0.15Cr2O3, % 0.02 0.02 0.019 0.019 0.018 0.014 0.019 0.015 0.016 0.009 0.009 0.014 0.017 0.021 0.02 0.01
LOI, % 8.1 7.5 7.5 7.9 8.4 6.0 6.6 6.9 4.2 17.7 2.0 7.7 5.8 8.8 7.36 7.70
Total 99.83 99.83 99.83 99.85 99.85 99.88 99.83 99.86 99.86 99.8 99.91 99.86 99.85 99.83 99.85 99.85
TOT/C, % 1.92 1.47 1.4 1.99 2.23 0.64 1.08 1.12 0.10 4.83 0.05 1.34 0.05 0.08 1.48 1.08 organic matterTOT/S, % 0.04 0.03 0.03 0.03 0.04 0.05 0.03 0 0 0 0 0 0 0 0.03 0.00 pyrite
Ba 658 618 609 635 621 400 628 479 489 713 326 325 907 2844 581.00 934.00 bariteNi 73 69 65 89 76 41 84 53 57 119 25 55 64 69 68.75 64.83Sc 20 21 20 21 20 12 18 13 15 11 8 14 16 18 18.13 13.67Be 7 7 6 3 6 1 3 1 3 1 0 1 4 4 4.25 2.17Co 26.2 19.4 18.1 28.3 26.7 10.8 42.5 19.9 16.4 55.9 17.6 15.0 24.4 26.5 23.99 25.97Cs 14.2 11.9 12.1 10.9 11.9 4.8 12.2 6.9 9.9 3.4 2.2 4.8 7.2 6.4 10.61 5.65Ga 28.8 29.0 29.5 27.5 27.3 19.8 28.8 20.6 20.4 7.7 7.2 19 22.8 29.2 26.41 17.72 Al, coalHf 4.7 5.2 5.3 4.2 4.4 6.0 5.6 5.5 6.5 1.8 7.5 7.2 6.5 6.5 5.11 6.00Nb 15.5 16.4 16.0 14.2 14.7 12.2 15.4 13.2 13.9 5.7 6.2 12.7 14.0 16.5 14.70 11.50Rb 200.9 189.1 189.5 180.6 181.6 115.5 202.1 143.9 152.5 44.6 75.5 90.2 108.1 44.6 175.40 85.92 affinity to illiteSn 4 5 4 4 4 3 4 4 4 1 2 3 4 5 4.00 3.17Sr 97.3 90.3 91.0 85.3 82.6 58.2 80.0 51.9 74.1 83.1 64.1 68.9 95.7 141.2 79.58 87.85 BaTa 1.0 1.3 1.1 0.7 0.9 0.9 1.0 0.9 1.1 0.4 0.4 1.0 1.1 1.3 0.98 0.88Th 15.3 16.0 16.3 13.0 14.1 10.8 15.2 11.3 11.8 4.8 13.1 12.8 13.8 16.5 14.00 12.13U 5.2 5.0 5.3 4.9 5.0 3.4 4.9 3.5 3.2 4.7 2.3 4.1 4.0 4.8 4.65 3.85V 141 145 148 149 148 86 130 90 100 70 37 87 108 119 129.63 86.83 affinity to illiteW 2.5 3.1 2.6 2.5 2.6 2.6 2.6 1.7 2.5 1.4 1.4 2.4 2.3 2.3 2.53 2.05Zr 168.3 198.2 196.9 149.8 162.7 226.8 204.3 206.6 237.7 66.0 270.4 277.7 230.3 247.0 189.20 221.52 zirconY 34.1 35.8 38.4 32.4 35.2 26.5 31.6 29.2 28.3 24.9 31.9 26.8 30.4 37.1 32.90 29.90La 42.5 42.2 42.5 38.1 39.6 31.7 40.0 31.9 34.0 14.4 35.5 34.0 36.9 43.6 38.56 33.07Ce 89.1 86.6 86.7 72.3 79.5 65.2 83.3 65.4 68.9 29.7 68.8 68.1 73.8 87.7 78.51 66.17Pr 9.79 10.13 10.18 8.67 9.25 7.33 9.66 7.50 7.98 3.49 7.24 7.66 8.86 9.90 9.06 7.52Nd 36.9 39.2 40.9 32.3 37.5 29.5 37.1 29.4 32.5 14.9 25.7 28.9 33.5 37.5 35.35 28.83Sm 7.40 7.88 8.14 6.82 7.26 5.68 7.52 5.94 6.22 3.41 4.59 5.93 6.93 7.67 7.08 5.79Eu 1.61 1.61 1.66 1.5 1.58 1.03 1.37 1.08 1.21 0.81 0.71 1.12 1.31 1.51 1.43 1.11Gd 7.00 7.10 7.13 6.64 7.02 5.45 6.12 5.53 5.76 4.14 4.56 5.35 6.24 7.06 6.50 5.52Tb 1.11 1.14 1.13 1.03 1.03 0.89 0.99 0.87 0.91 0.66 0.79 0.82 0.98 1.12 1.02 0.88Dy 6.50 6.60 6.83 6.12 6.10 4.97 5.99 5.25 5.18 3.80 5.14 5.05 5.66 6.84 6.05 5.28Ho 1.36 1.37 1.41 1.19 1.29 1.03 1.20 1.10 1.10 0.80 1.24 1.05 1.13 1.36 1.24 1.11Er 3.88 4.03 4.22 3.55 3.79 2.71 3.63 3.28 2.99 2.43 3.80 3.09 3.39 4.16 3.64 3.31Tm 0.55 0.56 0.58 0.51 0.54 0.40 0.52 0.45 0.44 0.31 0.53 0.46 0.46 0.56 0.51 0.46Yb 3.65 3.73 3.67 3.50 3.68 2.70 3.44 3.02 2.83 1.77 3.56 2.74 3.00 3.71 3.42 2.94Lu 0.57 0.55 0.55 0.44 0.52 0.39 0.49 0.44 0.42 0.27 0.55 0.44 0.48 0.58 0.49 0.46Mo 0.6 0.3 0.2 0.6 0.5 0.3 1.1 0.6 0.3 4.3 0.4 0.4 0.2 0.1 0.53 0.95Cu 33.4 34.8 33.5 40.3 37.1 19.1 33.0 20.8 19.9 8.2 10.7 25.0 32.2 30.6 31.50 21.10 chalcopyritePb 24.4 26.0 24.6 23.7 23.6 24.0 31.3 24.2 24.3 41.0 15.5 52.3 19.8 16.1 25.23 28.17Zn 119 126 123 127 123 119 131 127 75 202 68 90 112 139 124.38 114.33 ZnSNi 60.1 54.3 53.1 80.7 64.5 35.1 78.6 46.0 47.5 104.5 23.2 46.3 58.2 49.4 59.05 54.85
As 10.6 2.2 4.7 1.6 3.6 10.2 7.5 2.8 10.9 21.6 16.4 3.3 4.0 1.1 5.40 9.55 affinity tohematite
Cd 0.3 0.3 0.2 0.3 0.2 0.1 0.2 0.3 0.2 0.3 0.0 0.2 0.0 0.0 0.24 0.12Sb 0.2 0.1 0.0 0.2 0.1 0.2 0.1 0.1 0.0 0.7 0.5 0.1 0.0 0.0 0.13 0.22Bi 0.4 0.5 0.4 0.5 0.4 0.2 0.4 0.2 0.2 0.2 0.1 0.2 0.2 0.4 0.38 0.22Ag 0.1 0.0 0.0 0.0 0.0 0.0 0.1 0.0 0.0 0.0 0.0 0.0 0.0 0.0 0.03 0.00Au 0.9 0.9 1.4 0.0 1.5 0.6 1.0 0.0 1.3 2.6 1.4 4.0 1.4 0.9 0.79 1.93Hg 0.01 0.01 0.02 0.02 0.02 0.03 0.00 0.02 0.05 0.05 0.08 0.03 0.03 0.04 0.02 0.05Tl 0.2 0.2 0.1 0.1 0.1 0.1 0.2 0.1 0.3 0.1 0.2 0.1 0.1 0.1 0.13 0.10 clay mineralsSe 0 0 0 0 0 0 0 0 0 0 0 0 0 0 0.00 0.00
3.3. Palynology
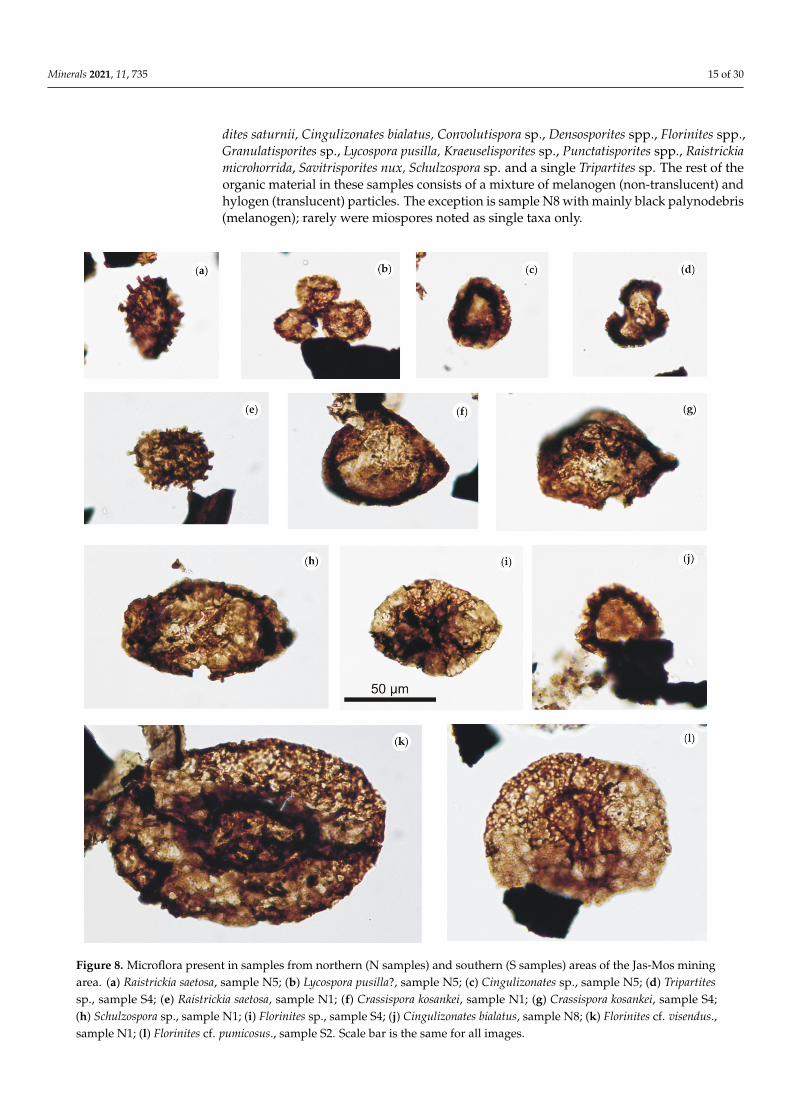
Almost all positive palynological samples from both localities contain typical UpperCarboniferous miospores and plant debris (Figure 8) [48]. Samples (N1–N5, N7 and N8)from the northern area are more or less uniformly differentiated taxonomically; Crassis-pora kosnakei is the most common miospore, accompanied by less numerous Cirratrira-
Minerals 2021, 11, 735 15 of 30
dites saturnii, Cingulizonates bialatus, Convolutispora sp., Densosporites spp., Florinites spp.,Granulatisporites sp., Lycospora pusilla, Kraeuselisporites sp., Punctatisporites spp., Raistrickiamicrohorrida, Savitrisporites nux, Schulzospora sp. and a single Tripartites sp. The rest of theorganic material in these samples consists of a mixture of melanogen (non-translucent) andhylogen (translucent) particles. The exception is sample N8 with mainly black palynodebris(melanogen); rarely were miospores noted as single taxa only.
Minerals 2021, 11, x 16 of 31
Minerals 2021, 11, x. https://doi.org/10.3390/xxxxx www.mdpi.com/journal/minerals
Figure 8. Microflora present in samples from northern (N samples) and southern (S samples) areas of the Jas‐Mos mining
area. (a) Raistrickia saetosa, sample N5; (b) Lycospora pusilla?, sample N5; (c) Cingulizonates sp., sample N5; (d) Tripartites
sp., sample S4; (e) Raistrickia saetosa, sample N1; (f) Crassispora kosankei, sample N1; (g) Crassispora kosankei, sample S4; (h)
Schulzospora sp., sample N1; (i) Florinites sp., sample S4; (j) Cingulizonates bialatus, sample N8; (k) Florinites cf. visendus.,
sample N1; (l) Florinites cf. pumicosus., sample S2. Scale bar is the same for all images.
Samples S2 and S4 from the southern area possess fewer miospores and
taxonomically differentiated taxa assemblages. Identified miospores are Crassispora
kosankei, Florinites sp., Lycospora pusilla, Raistrickia sp., Schulzospora sp. and Triprtites sp.
Miospores were more common in S4, than in sample S2. The predominant fraction of
Figure 8. Microflora present in samples from northern (N samples) and southern (S samples) areas of the Jas-Mos miningarea. (a) Raistrickia saetosa, sample N5; (b) Lycospora pusilla?, sample N5; (c) Cingulizonates sp., sample N5; (d) Tripartitessp., sample S4; (e) Raistrickia saetosa, sample N1; (f) Crassispora kosankei, sample N1; (g) Crassispora kosankei, sample S4;(h) Schulzospora sp., sample N1; (i) Florinites sp., sample S4; (j) Cingulizonates bialatus, sample N8; (k) Florinites cf. visendus.,sample N1; (l) Florinites cf. pumicosus., sample S2. Scale bar is the same for all images.
Minerals 2021, 11, 735 16 of 30
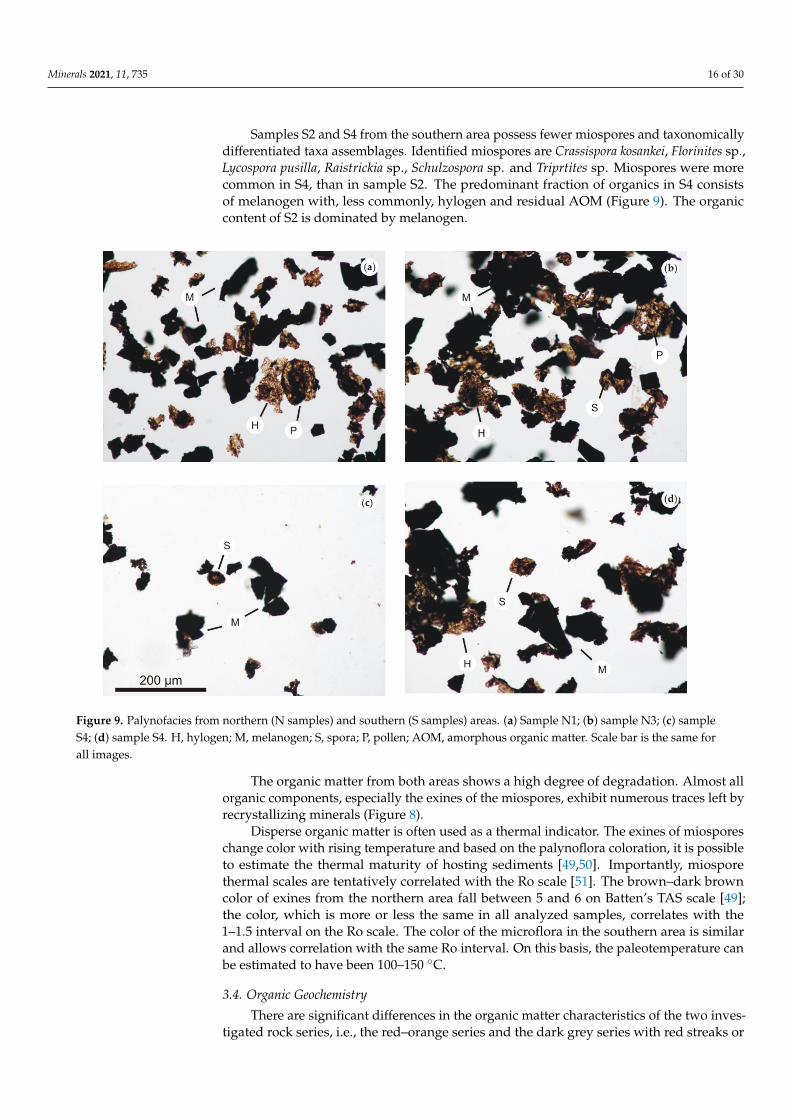
Samples S2 and S4 from the southern area possess fewer miospores and taxonomicallydifferentiated taxa assemblages. Identified miospores are Crassispora kosankei, Florinites sp.,Lycospora pusilla, Raistrickia sp., Schulzospora sp. and Triprtites sp. Miospores were morecommon in S4, than in sample S2. The predominant fraction of organics in S4 consistsof melanogen with, less commonly, hylogen and residual AOM (Figure 9). The organiccontent of S2 is dominated by melanogen.
Minerals 2021, 11, x 17 of 31
Minerals 2021, 11, x. https://doi.org/10.3390/xxxxx www.mdpi.com/journal/minerals
organics in S4 consists of melanogen with, less commonly, hylogen and residual AOM
(Figure 9). The organic content of S2 is dominated by melanogen.
Figure 9. Palynofacies from northern (N samples) and southern (S samples) areas. (a) Sample N1; (b) sample N3; (c) sample
S4; (d) sample S4. H, hylogen; M, melanogen; S, spora; P, pollen; AOM, amorphous organic matter. Scale bar is the same
for all images.
The organic matter from both areas shows a high degree of degradation. Almost all
organic components, especially the exines of the miospores, exhibit numerous traces left
by recrystallizing minerals (Figure 8).
Disperse organic matter is often used as a thermal indicator. The exines of miospores
change color with rising temperature and based on the palynoflora coloration, it is
possible to estimate the thermal maturity of hosting sediments [49,50]. Importantly,
miospore thermal scales are tentatively correlated with the Ro scale [51]. The brown–dark
brown color of exines from the northern area fall between 5 and 6 on Batten’s TAS scale
[49]; the color, which is more or less the same in all analyzed samples, correlates with the
1–1.5 interval on the Ro scale. The color of the microflora in the southern area is similar
and allows correlation with the same Ro interval. On this basis, the paleotemperature can
be estimated to have been 100–150°C.
3.4. Organic Geochemistry
There are significant differences in the organic matter characteristics of the two
investigated rock series, i.e., the red–orange series and the dark grey series with red
streaks or patches. Extraction yields range from 0.0008 wt% to 0.0580 wt%, with the latter
series showing 10 times higher extractability (Table 1). Though extracts of both series
Figure 9. Palynofacies from northern (N samples) and southern (S samples) areas. (a) Sample N1; (b) sample N3; (c) sampleS4; (d) sample S4. H, hylogen; M, melanogen; S, spora; P, pollen; AOM, amorphous organic matter. Scale bar is the same forall images.
The organic matter from both areas shows a high degree of degradation. Almost allorganic components, especially the exines of the miospores, exhibit numerous traces left byrecrystallizing minerals (Figure 8).
Disperse organic matter is often used as a thermal indicator. The exines of miosporeschange color with rising temperature and based on the palynoflora coloration, it is possibleto estimate the thermal maturity of hosting sediments [49,50]. Importantly, miosporethermal scales are tentatively correlated with the Ro scale [51]. The brown–dark browncolor of exines from the northern area fall between 5 and 6 on Batten’s TAS scale [49];the color, which is more or less the same in all analyzed samples, correlates with the1–1.5 interval on the Ro scale. The color of the microflora in the southern area is similarand allows correlation with the same Ro interval. On this basis, the paleotemperature canbe estimated to have been 100–150 ◦C.
3.4. Organic Geochemistry
There are significant differences in the organic matter characteristics of the two inves-tigated rock series, i.e., the red–orange series and the dark grey series with red streaks or
Minerals 2021, 11, 735 17 of 30
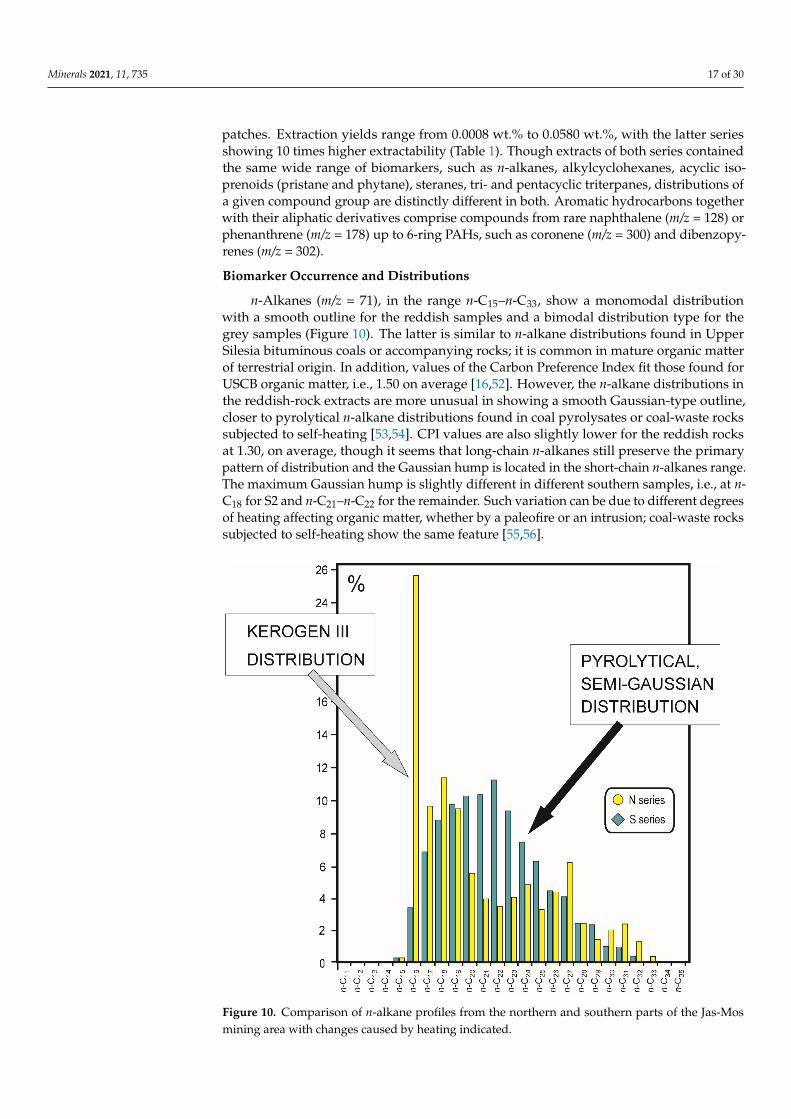
patches. Extraction yields range from 0.0008 wt.% to 0.0580 wt.%, with the latter seriesshowing 10 times higher extractability (Table 1). Though extracts of both series containedthe same wide range of biomarkers, such as n-alkanes, alkylcyclohexanes, acyclic iso-prenoids (pristane and phytane), steranes, tri- and pentacyclic triterpanes, distributions ofa given compound group are distinctly different in both. Aromatic hydrocarbons togetherwith their aliphatic derivatives comprise compounds from rare naphthalene (m/z = 128) orphenanthrene (m/z = 178) up to 6-ring PAHs, such as coronene (m/z = 300) and dibenzopy-renes (m/z = 302).
Biomarker Occurrence and Distributions
n-Alkanes (m/z = 71), in the range n-C15–n-C33, show a monomodal distributionwith a smooth outline for the reddish samples and a bimodal distribution type for thegrey samples (Figure 10). The latter is similar to n-alkane distributions found in UpperSilesia bituminous coals or accompanying rocks; it is common in mature organic matterof terrestrial origin. In addition, values of the Carbon Preference Index fit those found forUSCB organic matter, i.e., 1.50 on average [16,52]. However, the n-alkane distributions inthe reddish-rock extracts are more unusual in showing a smooth Gaussian-type outline,closer to pyrolytical n-alkane distributions found in coal pyrolysates or coal-waste rockssubjected to self-heating [53,54]. CPI values are also slightly lower for the reddish rocksat 1.30, on average, though it seems that long-chain n-alkanes still preserve the primarypattern of distribution and the Gaussian hump is located in the short-chain n-alkanes range.The maximum Gaussian hump is slightly different in different southern samples, i.e., at n-C18 for S2 and n-C21–n-C22 for the remainder. Such variation can be due to different degreesof heating affecting organic matter, whether by a paleofire or an intrusion; coal-waste rockssubjected to self-heating show the same feature [55,56].
Minerals 2021, 11, x 18 of 31
Minerals 2021, 11, x. https://doi.org/10.3390/xxxxx www.mdpi.com/journal/minerals
contained the same wide range of biomarkers, such as n‐alkanes, alkylcyclohexanes,
acyclic isoprenoids (pristane and phytane), steranes, tri‐ and pentacyclic triterpanes,
distributions of a given compound group are distinctly different in both. Aromatic
hydrocarbons together with their aliphatic derivatives comprise compounds from rare
naphthalene (m/z = 128) or phenanthrene (m/z = 178) up to 6‐ring PAHs, such as coronene
(m/z = 300) and dibenzopyrenes (m/z = 302).
Biomarker occurrence and distributions
n‐Alkanes (m/z = 71), in the range n‐C15–n‐C33, show a monomodal distribution with
a smooth outline for the reddish samples and a bimodal distribution type for the grey
samples (Figure 10). The latter is similar to n‐alkane distributions found in Upper Silesia
bituminous coals or accompanying rocks; it is common in mature organic matter of
terrestrial origin. In addition, values of the Carbon Preference Index fit those found for
USCB organic matter, i.e., 1.50 on average [16,52]. However, the n‐alkane distributions in
the reddish‐rock extracts are more unusual in showing a smooth Gaussian‐type outline,
closer to pyrolytical n‐alkane distributions found in coal pyrolysates or coal‐waste rocks
subjected to self‐heating [53,54]. CPI values are also slightly lower for the reddish rocks at
1.30, on average, though it seems that long‐chain n‐alkanes still preserve the primary
pattern of distribution and the Gaussian hump is located in the short‐chain n‐alkanes
range. The maximum Gaussian hump is slightly different in different southern samples,
i.e., at n‐C18 for S2 and n‐C21–n‐C22 for the remainder. Such variation can be due to different
degrees of heating affecting organic matter, whether by a paleofire or an intrusion; coal‐
waste rocks subjected to self‐heating show the same feature [55,56].
Figure 10. Comparison of n‐alkane profiles from the northern and southern parts of the Jas‐Mos
mining area with changes caused by heating indicated. Figure 10. Comparison of n-alkane profiles from the northern and southern parts of the Jas-Mosmining area with changes caused by heating indicated.
Minerals 2021, 11, 735 18 of 30
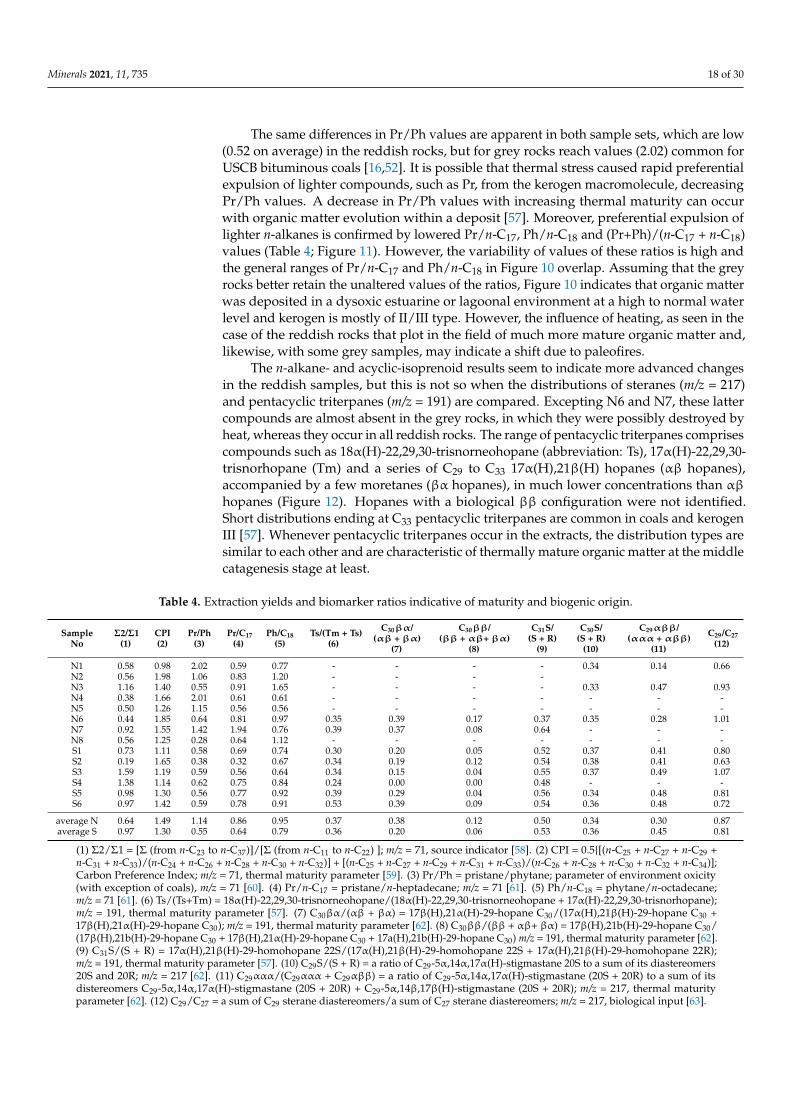
The same differences in Pr/Ph values are apparent in both sample sets, which are low(0.52 on average) in the reddish rocks, but for grey rocks reach values (2.02) common forUSCB bituminous coals [16,52]. It is possible that thermal stress caused rapid preferentialexpulsion of lighter compounds, such as Pr, from the kerogen macromolecule, decreasingPr/Ph values. A decrease in Pr/Ph values with increasing thermal maturity can occurwith organic matter evolution within a deposit [57]. Moreover, preferential expulsion oflighter n-alkanes is confirmed by lowered Pr/n-C17, Ph/n-C18 and (Pr+Ph)/(n-C17 + n-C18)values (Table 4; Figure 11). However, the variability of values of these ratios is high andthe general ranges of Pr/n-C17 and Ph/n-C18 in Figure 10 overlap. Assuming that the greyrocks better retain the unaltered values of the ratios, Figure 10 indicates that organic matterwas deposited in a dysoxic estuarine or lagoonal environment at a high to normal waterlevel and kerogen is mostly of II/III type. However, the influence of heating, as seen in thecase of the reddish rocks that plot in the field of much more mature organic matter and,likewise, with some grey samples, may indicate a shift due to paleofires.
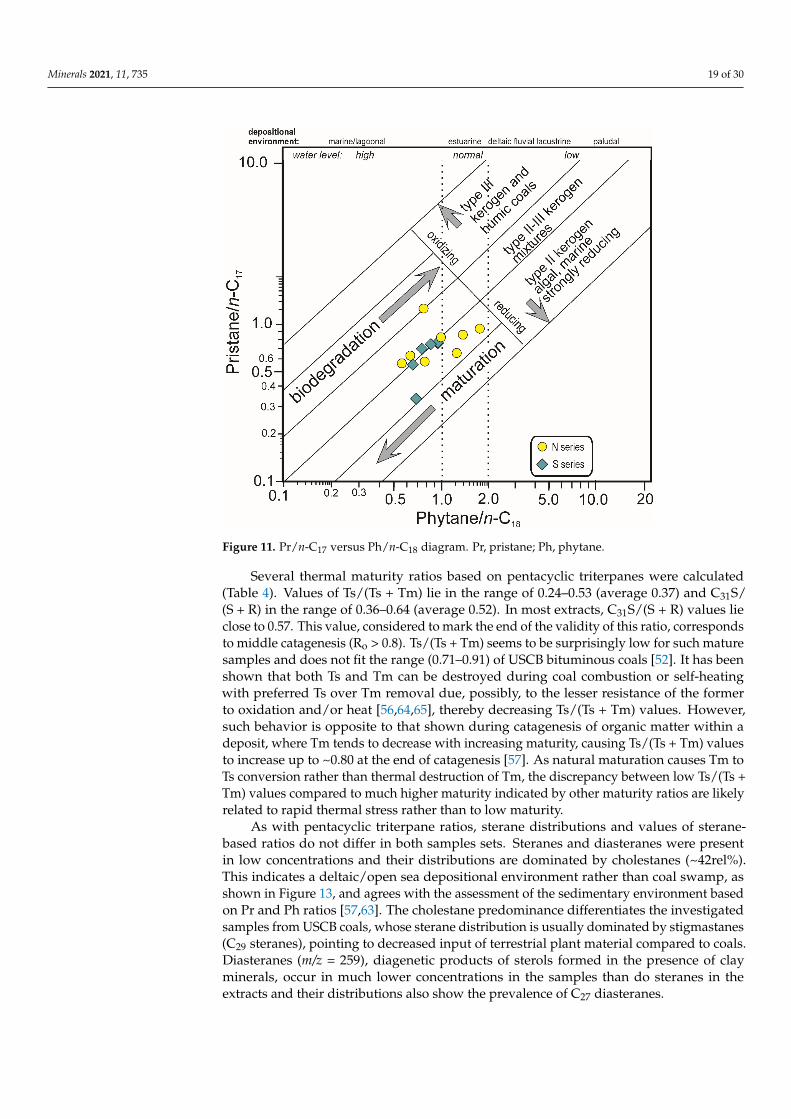
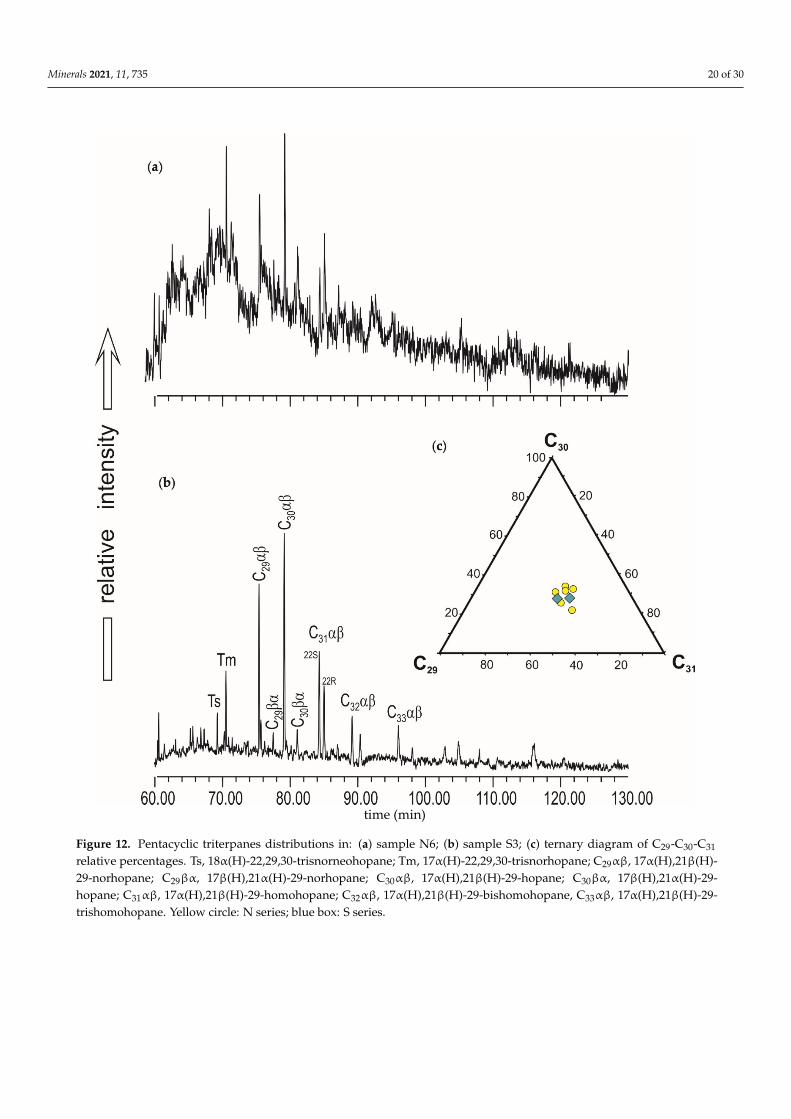
The n-alkane- and acyclic-isoprenoid results seem to indicate more advanced changesin the reddish samples, but this is not so when the distributions of steranes (m/z = 217)and pentacyclic triterpanes (m/z = 191) are compared. Excepting N6 and N7, these lattercompounds are almost absent in the grey rocks, in which they were possibly destroyed byheat, whereas they occur in all reddish rocks. The range of pentacyclic triterpanes comprisescompounds such as 18α(H)-22,29,30-trisnorneohopane (abbreviation: Ts), 17α(H)-22,29,30-trisnorhopane (Tm) and a series of C29 to C33 17α(H),21β(H) hopanes (αβ hopanes),accompanied by a few moretanes (βα hopanes), in much lower concentrations than αβ
hopanes (Figure 12). Hopanes with a biological ββ configuration were not identified.Short distributions ending at C33 pentacyclic triterpanes are common in coals and kerogenIII [57]. Whenever pentacyclic triterpanes occur in the extracts, the distribution types aresimilar to each other and are characteristic of thermally mature organic matter at the middlecatagenesis stage at least.
Table 4. Extraction yields and biomarker ratios indicative of maturity and biogenic origin.
SampleNo
Σ2/Σ1(1)
CPI(2)
Pr/Ph(3)
Pr/C17(4)
Ph/C18(5)
Ts/(Tm + Ts)(6)
C30βα/(αβ + βα)
(7)
C30ββ/(ββ + αβ+ βα)
(8)
C31S/(S + R)
(9)
C30S/(S + R)
(10)
C29αββ/(ααα + αββ)
(11)
C29/C27(12)
N1 0.58 0.98 2.02 0.59 0.77 - - - - 0.34 0.14 0.66N2 0.56 1.98 1.06 0.83 1.20 - - - -N3 1.16 1.40 0.55 0.91 1.65 - - - - 0.33 0.47 0.93N4 0.38 1.66 2.01 0.61 0.61 - - - - - - -N5 0.50 1.26 1.15 0.56 0.56 - - - - - - -N6 0.44 1.85 0.64 0.81 0.97 0.35 0.39 0.17 0.37 0.35 0.28 1.01N7 0.92 1.55 1.42 1.94 0.76 0.39 0.37 0.08 0.64 - - -N8 0.56 1.25 0.28 0.64 1.12 - - - - - - -S1 0.73 1.11 0.58 0.69 0.74 0.30 0.20 0.05 0.52 0.37 0.41 0.80S2 0.19 1.65 0.38 0.32 0.67 0.34 0.19 0.12 0.54 0.38 0.41 0.63S3 1.59 1.19 0.59 0.56 0.64 0.34 0.15 0.04 0.55 0.37 0.49 1.07S4 1.38 1.14 0.62 0.75 0.84 0.24 0.00 0.00 0.48 - - -S5 0.98 1.30 0.56 0.77 0.92 0.39 0.29 0.04 0.56 0.34 0.48 0.81S6 0.97 1.42 0.59 0.78 0.91 0.53 0.39 0.09 0.54 0.36 0.48 0.72
average N 0.64 1.49 1.14 0.86 0.95 0.37 0.38 0.12 0.50 0.34 0.30 0.87average S 0.97 1.30 0.55 0.64 0.79 0.36 0.20 0.06 0.53 0.36 0.45 0.81
(1) Σ2/Σ1 = [Σ (from n-C23 to n-C37)]/[Σ (from n-C11 to n-C22) ]; m/z = 71, source indicator [58]. (2) CPI = 0.5{[(n-C25 + n-C27 + n-C29 +n-C31 + n-C33)/(n-C24 + n-C26 + n-C28 + n-C30 + n-C32)] + [(n-C25 + n-C27 + n-C29 + n-C31 + n-C33)/(n-C26 + n-C28 + n-C30 + n-C32 + n-C34)];Carbon Preference Index; m/z = 71, thermal maturity parameter [59]. (3) Pr/Ph = pristane/phytane; parameter of environment oxicity(with exception of coals), m/z = 71 [60]. (4) Pr/n-C17 = pristane/n-heptadecane; m/z = 71 [61]. (5) Ph/n-C18 = phytane/n-octadecane;m/z = 71 [61]. (6) Ts/(Ts+Tm) = 18α(H)-22,29,30-trisnorneohopane/(18α(H)-22,29,30-trisnorneohopane + 17α(H)-22,29,30-trisnorhopane);m/z = 191, thermal maturity parameter [57]. (7) C30βα/(αβ + βα) = 17β(H),21α(H)-29-hopane C30/(17α(H),21β(H)-29-hopane C30 +17β(H),21α(H)-29-hopane C30); m/z = 191, thermal maturity parameter [62]. (8) C30ββ/(ββ + αβ+ βα) = 17β(H),21b(H)-29-hopane C30/(17β(H),21b(H)-29-hopane C30 + 17β(H),21α(H)-29-hopane C30 + 17a(H),21b(H)-29-hopane C30) m/z = 191, thermal maturity parameter [62].(9) C31S/(S + R) = 17α(H),21β(H)-29-homohopane 22S/(17α(H),21β(H)-29-homohopane 22S + 17α(H),21β(H)-29-homohopane 22R);m/z = 191, thermal maturity parameter [57]. (10) C29S/(S + R) = a ratio of C29-5α,14α,17α(H)-stigmastane 20S to a sum of its diastereomers20S and 20R; m/z = 217 [62]. (11) C29ααα/(C29ααα + C29αββ) = a ratio of C29-5α,14α,17α(H)-stigmastane (20S + 20R) to a sum of itsdistereomers C29-5α,14α,17α(H)-stigmastane (20S + 20R) + C29-5α,14β,17β(H)-stigmastane (20S + 20R); m/z = 217, thermal maturityparameter [62]. (12) C29/C27 = a sum of C29 sterane diastereomers/a sum of C27 sterane diastereomers; m/z = 217, biological input [63].
Minerals 2021, 11, 735 19 of 30Minerals 2021, 11, x 20 of 31
Minerals 2021, 11, x. https://doi.org/10.3390/xxxxx www.mdpi.com/journal/minerals
Figure 11. Pr/n‐C17 versus Ph/n‐C18 diagram. Pr, pristane; Ph, phytane.
The n‐alkane‐ and acyclic‐isoprenoid results seem to indicate more advanced
changes in the reddish samples, but this is not so when the distributions of steranes (m/z
= 217) and pentacyclic triterpanes (m/z = 191) are compared. Excepting N6 and N7, these
latter compounds are almost absent in the grey rocks, in which they were possibly
destroyed by heat, whereas they occur in all reddish rocks. The range of pentacyclic
triterpanes comprises compounds such as 18α(H)‐22,29,30‐trisnorneohopane
(abbreviation: Ts), 17α(H)‐22,29,30‐trisnorhopane (Tm) and a series of C29 to C33
17α(H),21β(H) hopanes (αβ hopanes), accompanied by a few moretanes (βα hopanes), in
much lower concentrations than αβ hopanes (Figure 12). Hopanes with a biological ββ
configuration were not identified. Short distributions ending at C33 pentacyclic triterpanes
are common in coals and kerogen III [57]. Whenever pentacyclic triterpanes occur in the
extracts, the distribution types are similar to each other and are characteristic of thermally
mature organic matter at the middle catagenesis stage at least.
Figure 11. Pr/n-C17 versus Ph/n-C18 diagram. Pr, pristane; Ph, phytane.
Several thermal maturity ratios based on pentacyclic triterpanes were calculated(Table 4). Values of Ts/(Ts + Tm) lie in the range of 0.24–0.53 (average 0.37) and C31S/(S + R) in the range of 0.36–0.64 (average 0.52). In most extracts, C31S/(S + R) values lieclose to 0.57. This value, considered to mark the end of the validity of this ratio, correspondsto middle catagenesis (Ro > 0.8). Ts/(Ts + Tm) seems to be surprisingly low for such maturesamples and does not fit the range (0.71–0.91) of USCB bituminous coals [52]. It has beenshown that both Ts and Tm can be destroyed during coal combustion or self-heatingwith preferred Ts over Tm removal due, possibly, to the lesser resistance of the formerto oxidation and/or heat [56,64,65], thereby decreasing Ts/(Ts + Tm) values. However,such behavior is opposite to that shown during catagenesis of organic matter within adeposit, where Tm tends to decrease with increasing maturity, causing Ts/(Ts + Tm) valuesto increase up to ~0.80 at the end of catagenesis [57]. As natural maturation causes Tm toTs conversion rather than thermal destruction of Tm, the discrepancy between low Ts/(Ts +Tm) values compared to much higher maturity indicated by other maturity ratios are likelyrelated to rapid thermal stress rather than to low maturity.
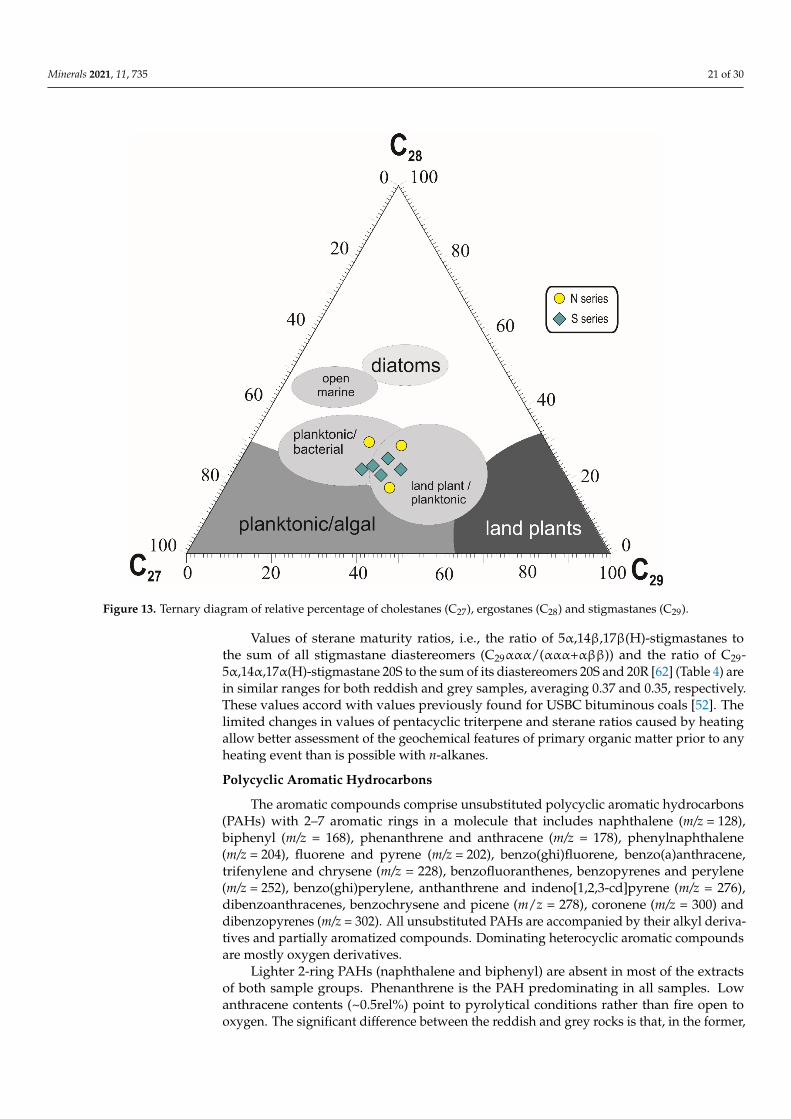
As with pentacyclic triterpane ratios, sterane distributions and values of sterane-based ratios do not differ in both samples sets. Steranes and diasteranes were presentin low concentrations and their distributions are dominated by cholestanes (~42rel%).This indicates a deltaic/open sea depositional environment rather than coal swamp, asshown in Figure 13, and agrees with the assessment of the sedimentary environment basedon Pr and Ph ratios [57,63]. The cholestane predominance differentiates the investigatedsamples from USCB coals, whose sterane distribution is usually dominated by stigmastanes(C29 steranes), pointing to decreased input of terrestrial plant material compared to coals.Diasteranes (m/z = 259), diagenetic products of sterols formed in the presence of clayminerals, occur in much lower concentrations in the samples than do steranes in theextracts and their distributions also show the prevalence of C27 diasteranes.
Minerals 2021, 11, 735 20 of 30Minerals 2021, 11, x 21 of 31
Minerals 2021, 11, x. https://doi.org/10.3390/xxxxx www.mdpi.com/journal/minerals
time (min)
Figure 12. Pentacyclic triterpanes distributions in: (a) sample N6; (b) sample S3; (c) ternary diagram of C29‐C30‐C31 relative
percentages. Ts, 18α(H)‐22,29,30‐trisnorneohopane; Tm, 17α(H)‐22,29,30‐trisnorhopane; C29αβ, 17α(H),21β(H)‐29‐
norhopane; C29βα, 17β(H),21α(H)‐29‐norhopane; C30αβ, 17α(H),21β(H)‐29‐hopane; C30βα, 17β(H),21α(H)‐29‐hopane;
C31αβ, 17α(H),21β(H)‐29‐homohopane; C32αβ, 17α(H),21β(H)‐29‐bishomohopane, C33αβ, 17α(H),21β(H)‐29‐
trishomohopane . Yellow circle: N series; blue box: S series.
Several thermal maturity ratios based on pentacyclic triterpanes were calculated
(Table 4). Values of Ts/(Ts + Tm) lie in the range of 0.24–0.53 (average 0.37) and C31S/(S +
R) in the range of 0.36–0.64 (average 0.52). In most extracts, C31S/(S + R) values lie close to
0.57. This value, considered to mark the end of the validity of this ratio, corresponds to
middle catagenesis (Ro > 0.8). Ts/(Ts + Tm) seems to be surprisingly low for such mature
samples and does not fit the range (0.71–0.91) of USCB bituminous coals [52]. It has been
shown that both Ts and Tm can be destroyed during coal combustion or self‐heating with
Figure 12. Pentacyclic triterpanes distributions in: (a) sample N6; (b) sample S3; (c) ternary diagram of C29-C30-C31
relative percentages. Ts, 18α(H)-22,29,30-trisnorneohopane; Tm, 17α(H)-22,29,30-trisnorhopane; C29αβ, 17α(H),21β(H)-29-norhopane; C29βα, 17β(H),21α(H)-29-norhopane; C30αβ, 17α(H),21β(H)-29-hopane; C30βα, 17β(H),21α(H)-29-hopane; C31αβ, 17α(H),21β(H)-29-homohopane; C32αβ, 17α(H),21β(H)-29-bishomohopane, C33αβ, 17α(H),21β(H)-29-trishomohopane. Yellow circle: N series; blue box: S series.
Minerals 2021, 11, 735 21 of 30
Minerals 2021, 11, x 22 of 31
Minerals 2021, 11, x. https://doi.org/10.3390/xxxxx www.mdpi.com/journal/minerals
preferred Ts over Tm removal due, possibly, to the lesser resistance of the former to
oxidation and/or heat [56,64,65], thereby decreasing Ts/(Ts + Tm) values. However, such
behavior is opposite to that shown during catagenesis of organic matter within a deposit,
where Tm tends to decrease with increasing maturity, causing Ts/(Ts + Tm) values to
increase up to ~0.80 at the end of catagenesis [57]. As natural maturation causes Tm to Ts
conversion rather than thermal destruction of Tm, the discrepancy between low Ts/(Ts +
Tm) values compared to much higher maturity indicated by other maturity ratios are
likely related to rapid thermal stress rather than to low maturity.
As with pentacyclic triterpane ratios, sterane distributions and values of sterane‐
based ratios do not differ in both samples sets. Steranes and diasteranes were present in
low concentrations and their distributions are dominated by cholestanes (~42rel%). This
indicates a deltaic/open sea depositional environment rather than coal swamp, as shown
in Figure 13, and agrees with the assessment of the sedimentary environment based on Pr
and Ph ratios [57,63]. The cholestane predominance differentiates the investigated
samples from USCB coals, whose sterane distribution is usually dominated by
stigmastanes (C29 steranes), pointing to decreased input of terrestrial plant material
compared to coals. Diasteranes (m/z = 259), diagenetic products of sterols formed in the
presence of clay minerals, occur in much lower concentrations in the samples than do
steranes in the extracts and their distributions also show the prevalence of C27 diasteranes.
Figure 13. Ternary diagram of relative percentage of cholestanes (C27), ergostanes (C28) and stigmastanes (C29).
Values of sterane maturity ratios, i.e., the ratio of 5α,14β,17β(H)‐stigmastanes to the
sum of all stigmastane diastereomers (C29ααα/(ααα+αββ)) and the ratio of C29‐
5α,14α,17α(H)‐stigmastane 20S to the sum of its diastereomers 20S and 20R [62] (Table 4)
are in similar ranges for both reddish and grey samples, averaging 0.37 and 0.35,
respectively. These values accord with values previously found for USBC bituminous
Figure 13. Ternary diagram of relative percentage of cholestanes (C27), ergostanes (C28) and stigmastanes (C29).
Values of sterane maturity ratios, i.e., the ratio of 5α,14β,17β(H)-stigmastanes tothe sum of all stigmastane diastereomers (C29ααα/(ααα+αββ)) and the ratio of C29-5α,14α,17α(H)-stigmastane 20S to the sum of its diastereomers 20S and 20R [62] (Table 4) arein similar ranges for both reddish and grey samples, averaging 0.37 and 0.35, respectively.These values accord with values previously found for USBC bituminous coals [52]. Thelimited changes in values of pentacyclic triterpene and sterane ratios caused by heatingallow better assessment of the geochemical features of primary organic matter prior to anyheating event than is possible with n-alkanes.
Polycyclic Aromatic Hydrocarbons
The aromatic compounds comprise unsubstituted polycyclic aromatic hydrocarbons(PAHs) with 2–7 aromatic rings in a molecule that includes naphthalene (m/z = 128),biphenyl (m/z = 168), phenanthrene and anthracene (m/z = 178), phenylnaphthalene(m/z = 204), fluorene and pyrene (m/z = 202), benzo(ghi)fluorene, benzo(a)anthracene,trifenylene and chrysene (m/z = 228), benzofluoranthenes, benzopyrenes and perylene(m/z = 252), benzo(ghi)perylene, anthanthrene and indeno[1,2,3-cd]pyrene (m/z = 276),dibenzoanthracenes, benzochrysene and picene (m/z = 278), coronene (m/z = 300) anddibenzopyrenes (m/z = 302). All unsubstituted PAHs are accompanied by their alkyl deriva-tives and partially aromatized compounds. Dominating heterocyclic aromatic compoundsare mostly oxygen derivatives.
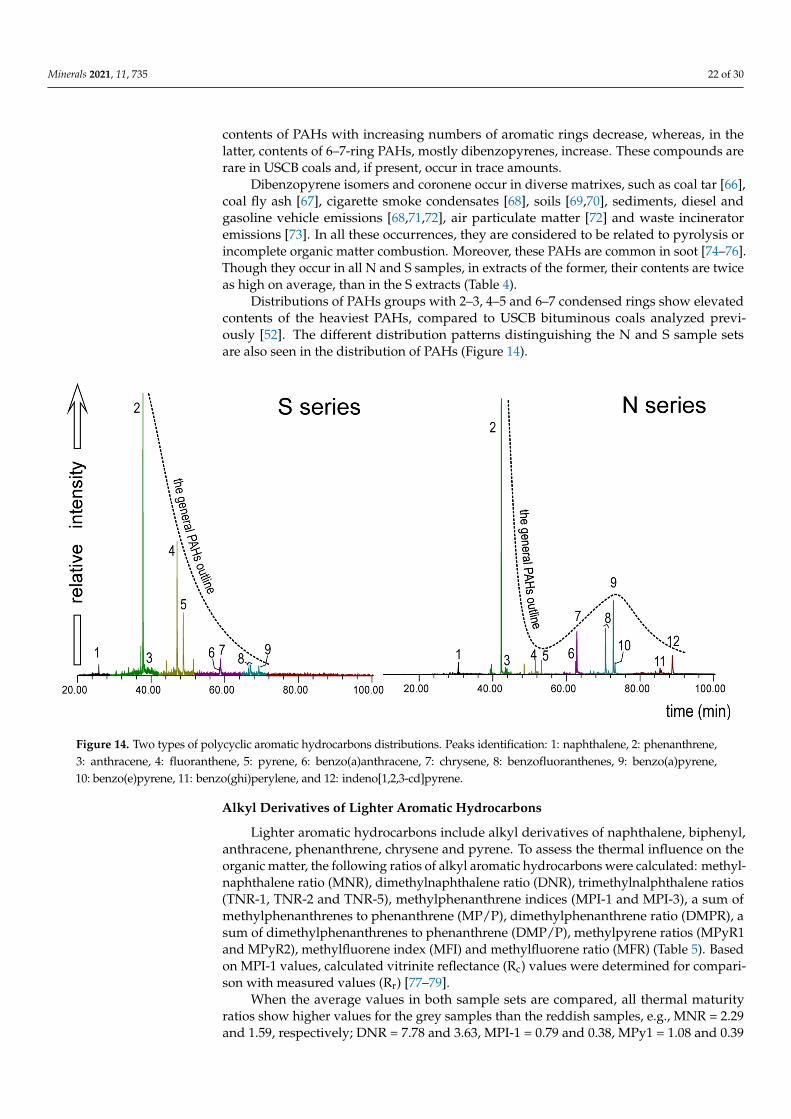
Lighter 2-ring PAHs (naphthalene and biphenyl) are absent in most of the extractsof both sample groups. Phenanthrene is the PAH predominating in all samples. Lowanthracene contents (~0.5rel%) point to pyrolytical conditions rather than fire open tooxygen. The significant difference between the reddish and grey rocks is that, in the former,
Minerals 2021, 11, 735 22 of 30
contents of PAHs with increasing numbers of aromatic rings decrease, whereas, in thelatter, contents of 6–7-ring PAHs, mostly dibenzopyrenes, increase. These compounds arerare in USCB coals and, if present, occur in trace amounts.
Dibenzopyrene isomers and coronene occur in diverse matrixes, such as coal tar [66],coal fly ash [67], cigarette smoke condensates [68], soils [69,70], sediments, diesel andgasoline vehicle emissions [68,71,72], air particulate matter [72] and waste incineratoremissions [73]. In all these occurrences, they are considered to be related to pyrolysis orincomplete organic matter combustion. Moreover, these PAHs are common in soot [74–76].Though they occur in all N and S samples, in extracts of the former, their contents are twiceas high on average, than in the S extracts (Table 4).
Distributions of PAHs groups with 2–3, 4–5 and 6–7 condensed rings show elevatedcontents of the heaviest PAHs, compared to USCB bituminous coals analyzed previ-ously [52]. The different distribution patterns distinguishing the N and S sample setsare also seen in the distribution of PAHs (Figure 14).
Minerals 2021, 11, x 23 of 31
Minerals 2021, 11, x. https://doi.org/10.3390/xxxxx www.mdpi.com/journal/minerals
coals [52]. The limited changes in values of pentacyclic triterpene and sterane ratios
caused by heating allow better assessment of the geochemical features of primary organic
matter prior to any heating event than is possible with n‐alkanes.
Polycyclic aromatic hydrocarbons
The aromatic compounds comprise unsubstituted polycyclic aromatic hydrocarbons
(PAHs) with 2–7 aromatic rings in a molecule that includes naphthalene (m/z = 128),
biphenyl (m/z = 168), phenanthrene and anthracene (m/z = 178), phenylnaphthalene (m/z =
204), fluorene and pyrene (m/z = 202), benzo(ghi)fluorene, benzo(a)anthracene, trifenylene
and chrysene (m/z = 228), benzofluoranthenes, benzopyrenes and perylene (m/z = 252),
benzo(ghi)perylene, anthanthrene and indeno[1,2,3‐cd]pyrene (m/z = 276),
dibenzoanthracenes, benzochrysene and picene (m/z = 278), coronene (m/z = 300) and
dibenzopyrenes (m/z = 302). All unsubstituted PAHs are accompanied by their alkyl
derivatives and partially aromatized compounds. Dominating heterocyclic aromatic
compounds are mostly oxygen derivatives.
Lighter 2‐ring PAHs (naphthalene and biphenyl) are absent in most of the extracts of
both sample groups. Phenanthrene is the PAH predominating in all samples. Low
anthracene contents (~0.5rel%) point to pyrolytical conditions rather than fire open to
oxygen. The significant difference between the reddish and grey rocks is that, in the
former, contents of PAHs with increasing numbers of aromatic rings decrease, whereas,
in the latter, contents of 6–7‐ring PAHs, mostly dibenzopyrenes, increase. These
compounds are rare in USCB coals and, if present, occur in trace amounts.
Dibenzopyrene isomers and coronene occur in diverse matrixes, such as coal tar [66],
coal fly ash [67], cigarette smoke condensates [68], soils [69,70], sediments, diesel and
gasoline vehicle emissions [68,71,72], air particulate matter [72] and waste incinerator
emissions [73]. In all these occurrences, they are considered to be related to pyrolysis or
incomplete organic matter combustion. Moreover, these PAHs are common in soot [74–
76]. Though they occur in all N and S samples, in extracts of the former, their contents are
twice as high on average, than in the S extracts (Table 4).
Distributions of PAHs groups with 2–3, 4–5 and 6–7 condensed rings show elevated
contents of the heaviest PAHs, compared to USCB bituminous coals analyzed previously
[52]. The different distribution patterns distinguishing the N and S sample sets are also
seen in the distribution of PAHs (Figure 14).
Figure 14. Two types of polycyclic aromatic hydrocarbons distributions. Peaks identification: 1: naphthalene, 2: phenanthrene,3: anthracene, 4: fluoranthene, 5: pyrene, 6: benzo(a)anthracene, 7: chrysene, 8: benzofluoranthenes, 9: benzo(a)pyrene,10: benzo(e)pyrene, 11: benzo(ghi)perylene, and 12: indeno[1,2,3-cd]pyrene.
Alkyl Derivatives of Lighter Aromatic Hydrocarbons
Lighter aromatic hydrocarbons include alkyl derivatives of naphthalene, biphenyl,anthracene, phenanthrene, chrysene and pyrene. To assess the thermal influence on theorganic matter, the following ratios of alkyl aromatic hydrocarbons were calculated: methyl-naphthalene ratio (MNR), dimethylnaphthalene ratio (DNR), trimethylnalphthalene ratios(TNR-1, TNR-2 and TNR-5), methylphenanthrene indices (MPI-1 and MPI-3), a sum ofmethylphenanthrenes to phenanthrene (MP/P), dimethylphenanthrene ratio (DMPR), asum of dimethylphenanthrenes to phenanthrene (DMP/P), methylpyrene ratios (MPyR1and MPyR2), methylfluorene index (MFI) and methylfluorene ratio (MFR) (Table 5). Basedon MPI-1 values, calculated vitrinite reflectance (Rc) values were determined for compari-son with measured values (Rr) [77–79].
When the average values in both sample sets are compared, all thermal maturityratios show higher values for the grey samples than the reddish samples, e.g., MNR = 2.29and 1.59, respectively; DNR = 7.78 and 3.63, MPI-1 = 0.79 and 0.38, MPy1 = 1.08 and 0.39
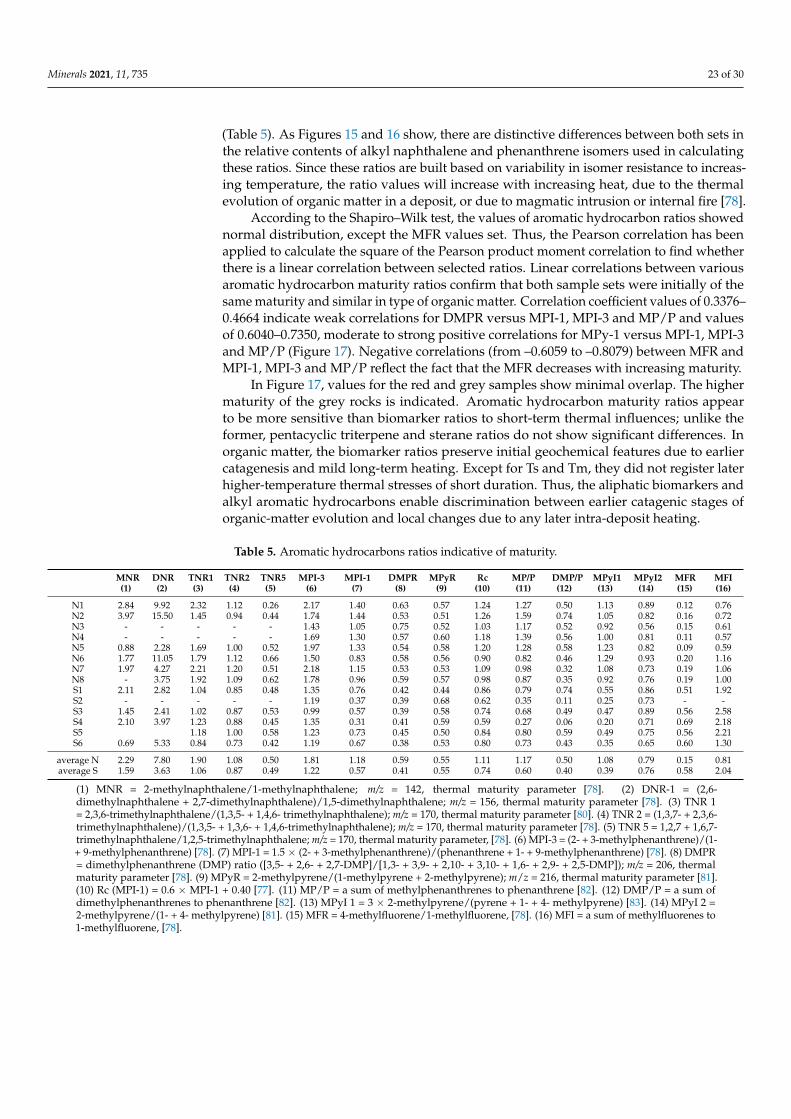
Minerals 2021, 11, 735 23 of 30
(Table 5). As Figures 15 and 16 show, there are distinctive differences between both sets inthe relative contents of alkyl naphthalene and phenanthrene isomers used in calculatingthese ratios. Since these ratios are built based on variability in isomer resistance to increas-ing temperature, the ratio values will increase with increasing heat, due to the thermalevolution of organic matter in a deposit, or due to magmatic intrusion or internal fire [78].
According to the Shapiro–Wilk test, the values of aromatic hydrocarbon ratios showednormal distribution, except the MFR values set. Thus, the Pearson correlation has beenapplied to calculate the square of the Pearson product moment correlation to find whetherthere is a linear correlation between selected ratios. Linear correlations between variousaromatic hydrocarbon maturity ratios confirm that both sample sets were initially of thesame maturity and similar in type of organic matter. Correlation coefficient values of 0.3376–0.4664 indicate weak correlations for DMPR versus MPI-1, MPI-3 and MP/P and valuesof 0.6040–0.7350, moderate to strong positive correlations for MPy-1 versus MPI-1, MPI-3and MP/P (Figure 17). Negative correlations (from –0.6059 to –0.8079) between MFR andMPI-1, MPI-3 and MP/P reflect the fact that the MFR decreases with increasing maturity.
In Figure 17, values for the red and grey samples show minimal overlap. The highermaturity of the grey rocks is indicated. Aromatic hydrocarbon maturity ratios appearto be more sensitive than biomarker ratios to short-term thermal influences; unlike theformer, pentacyclic triterpene and sterane ratios do not show significant differences. Inorganic matter, the biomarker ratios preserve initial geochemical features due to earliercatagenesis and mild long-term heating. Except for Ts and Tm, they did not register laterhigher-temperature thermal stresses of short duration. Thus, the aliphatic biomarkers andalkyl aromatic hydrocarbons enable discrimination between earlier catagenic stages oforganic-matter evolution and local changes due to any later intra-deposit heating.
Table 5. Aromatic hydrocarbons ratios indicative of maturity.
MNR(1)
DNR(2)
TNR1(3)
TNR2(4)
TNR5(5)
MPI-3(6)
MPI-1(7)
DMPR(8)
MPyR(9)
Rc(10)
MP/P(11)
DMP/P(12)
MPyI1(13)
MPyI2(14)
MFR(15)
MFI(16)
N1 2.84 9.92 2.32 1.12 0.26 2.17 1.40 0.63 0.57 1.24 1.27 0.50 1.13 0.89 0.12 0.76N2 3.97 15.50 1.45 0.94 0.44 1.74 1.44 0.53 0.51 1.26 1.59 0.74 1.05 0.82 0.16 0.72N3 - - - - - 1.43 1.05 0.75 0.52 1.03 1.17 0.52 0.92 0.56 0.15 0.61N4 - - - - - 1.69 1.30 0.57 0.60 1.18 1.39 0.56 1.00 0.81 0.11 0.57N5 0.88 2.28 1.69 1.00 0.52 1.97 1.33 0.54 0.58 1.20 1.28 0.58 1.23 0.82 0.09 0.59N6 1.77 11.05 1.79 1.12 0.66 1.50 0.83 0.58 0.56 0.90 0.82 0.46 1.29 0.93 0.20 1.16N7 1.97 4.27 2.21 1.20 0.51 2.18 1.15 0.53 0.53 1.09 0.98 0.32 1.08 0.73 0.19 1.06N8 - 3.75 1.92 1.09 0.62 1.78 0.96 0.59 0.57 0.98 0.87 0.35 0.92 0.76 0.19 1.00S1 2.11 2.82 1.04 0.85 0.48 1.35 0.76 0.42 0.44 0.86 0.79 0.74 0.55 0.86 0.51 1.92S2 - - - - - 1.19 0.37 0.39 0.68 0.62 0.35 0.11 0.25 0.73 - -S3 1.45 2.41 1.02 0.87 0.53 0.99 0.57 0.39 0.58 0.74 0.68 0.49 0.47 0.89 0.56 2.58S4 2.10 3.97 1.23 0.88 0.45 1.35 0.31 0.41 0.59 0.59 0.27 0.06 0.20 0.71 0.69 2.18S5 1.18 1.00 0.58 1.23 0.73 0.45 0.50 0.84 0.80 0.59 0.49 0.75 0.56 2.21S6 0.69 5.33 0.84 0.73 0.42 1.19 0.67 0.38 0.53 0.80 0.73 0.43 0.35 0.65 0.60 1.30
average N 2.29 7.80 1.90 1.08 0.50 1.81 1.18 0.59 0.55 1.11 1.17 0.50 1.08 0.79 0.15 0.81average S 1.59 3.63 1.06 0.87 0.49 1.22 0.57 0.41 0.55 0.74 0.60 0.40 0.39 0.76 0.58 2.04
(1) MNR = 2-methylnaphthalene/1-methylnaphthalene; m/z = 142, thermal maturity parameter [78]. (2) DNR-1 = (2,6-dimethylnaphthalene + 2,7-dimethylnaphthalene)/1,5-dimethylnaphthalene; m/z = 156, thermal maturity parameter [78]. (3) TNR 1= 2,3,6-trimethylnaphthalene/(1,3,5- + 1,4,6- trimethylnaphthalene); m/z = 170, thermal maturity parameter [80]. (4) TNR 2 = (1,3,7- + 2,3,6-trimethylnaphthalene)/(1,3,5- + 1,3,6- + 1,4,6-trimethylnaphthalene); m/z = 170, thermal maturity parameter [78]. (5) TNR 5 = 1,2,7 + 1,6,7-trimethylnaphthalene/1,2,5-trimethylnaphthalene; m/z = 170, thermal maturity parameter, [78]. (6) MPI-3 = (2- + 3-methylphenanthrene)/(1-+ 9-methylphenanthrene) [78]. (7) MPI-1 = 1.5 × (2- + 3-methylphenanthrene)/(phenanthrene + 1- + 9-methylphenanthrene) [78]. (8) DMPR= dimethylphenanthrene (DMP) ratio ([3,5- + 2,6- + 2,7-DMP]/[1,3- + 3,9- + 2,10- + 3,10- + 1,6- + 2,9- + 2,5-DMP]); m/z = 206, thermalmaturity parameter [78]. (9) MPyR = 2-methylpyrene/(1-methylpyrene + 2-methylpyrene); m/z = 216, thermal maturity parameter [81].(10) Rc (MPI-1) = 0.6 × MPI-1 + 0.40 [77]. (11) MP/P = a sum of methylphenanthrenes to phenanthrene [82]. (12) DMP/P = a sum ofdimethylphenanthrenes to phenanthrene [82]. (13) MPyI 1 = 3 × 2-methylpyrene/(pyrene + 1- + 4- methylpyrene) [83]. (14) MPyI 2 =2-methylpyrene/(1- + 4- methylpyrene) [81]. (15) MFR = 4-methylfluorene/1-methylfluorene, [78]. (16) MFI = a sum of methylfluorenes to1-methylfluorene, [78].
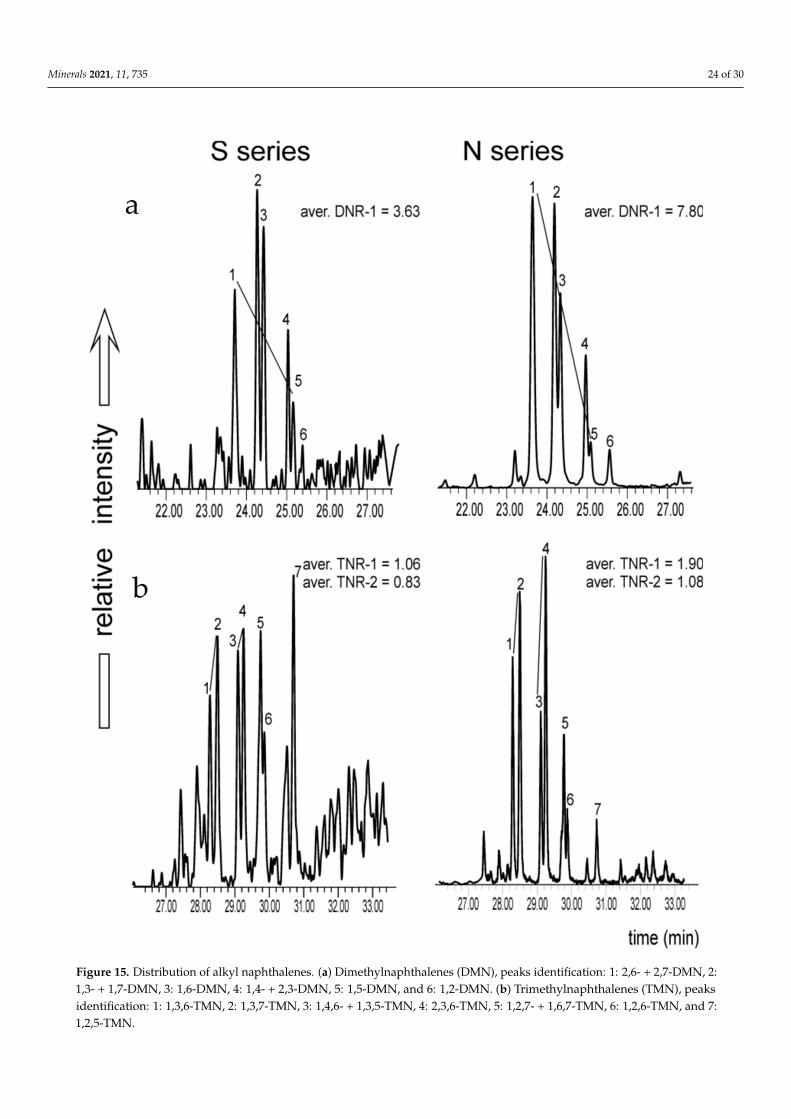
Minerals 2021, 11, 735 24 of 30
Minerals 2021, 11, x 25 of 31
Minerals 2021, 11, x. https://doi.org/10.3390/xxxxx www.mdpi.com/journal/minerals
Figure 15. Distribution of alkyl naphthalenes. (a) Dimethylnaphthalenes (DMN), peaks identification: 1: 2,6‐ + 2,7‐DMN,
2: 1,3‐ + 1,7‐DMN, 3: 1,6‐DMN, 4: 1,4‐ + 2,3‐DMN, 5: 1,5‐DMN, and 6: 1,2‐DMN. (b) Trimethylnaphthalenes (TMN), peaks
identification: 1: 1,3,6‐TMN, 2: 1,3,7‐TMN, 3: 1,4,6‐ + 1,3,5‐TMN, 4: 2,3,6‐TMN, 5: 1,2,7‐ + 1,6,7‐TMN, 6: 1,2,6‐TMN, and 7:
1,2,5‐TMN.
Figure 15. Distribution of alkyl naphthalenes. (a) Dimethylnaphthalenes (DMN), peaks identification: 1: 2,6- + 2,7-DMN, 2:1,3- + 1,7-DMN, 3: 1,6-DMN, 4: 1,4- + 2,3-DMN, 5: 1,5-DMN, and 6: 1,2-DMN. (b) Trimethylnaphthalenes (TMN), peaksidentification: 1: 1,3,6-TMN, 2: 1,3,7-TMN, 3: 1,4,6- + 1,3,5-TMN, 4: 2,3,6-TMN, 5: 1,2,7- + 1,6,7-TMN, 6: 1,2,6-TMN, and 7:1,2,5-TMN.
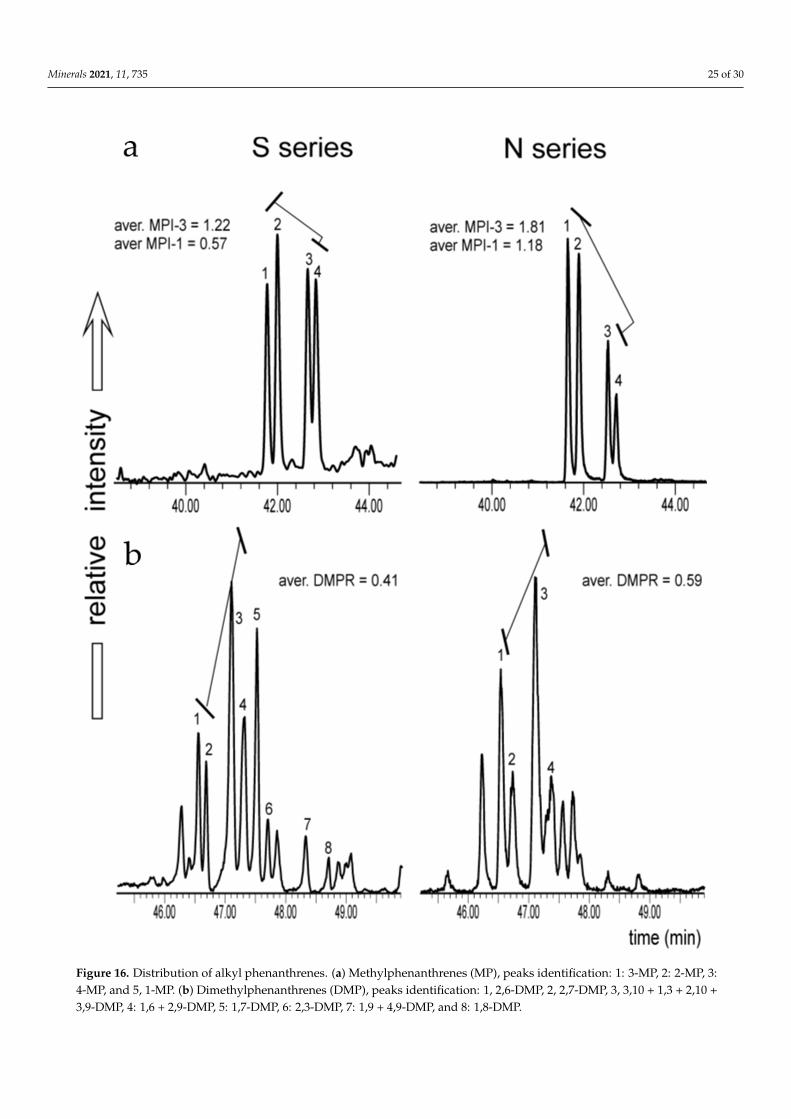
Minerals 2021, 11, 735 25 of 30Minerals 2021, 11, x 26 of 31
Minerals 2021, 11, x. https://doi.org/10.3390/xxxxx www.mdpi.com/journal/minerals
Figure 16. Distribution of alkyl phenanthrenes. (a) Methylphenanthrenes (MP), peaks identification: 1: 3‐MP, 2: 2‐MP, 3:
4‐MP, and 5, 1‐MP. (b) Dimethylphenanthrenes (DMP), peaks identification: 1, 2,6‐DMP, 2, 2,7‐DMP, 3, 3,10 + 1,3 + 2,10 +
3,9‐DMP, 4: 1,6 + 2,9‐DMP, 5: 1,7‐DMP, 6: 2,3‐DMP, 7: 1,9 + 4,9‐DMP, and 8: 1,8‐DMP.
Figure 16. Distribution of alkyl phenanthrenes. (a) Methylphenanthrenes (MP), peaks identification: 1: 3-MP, 2: 2-MP, 3:4-MP, and 5, 1-MP. (b) Dimethylphenanthrenes (DMP), peaks identification: 1, 2,6-DMP, 2, 2,7-DMP, 3, 3,10 + 1,3 + 2,10 +3,9-DMP, 4: 1,6 + 2,9-DMP, 5: 1,7-DMP, 6: 2,3-DMP, 7: 1,9 + 4,9-DMP, and 8: 1,8-DMP.
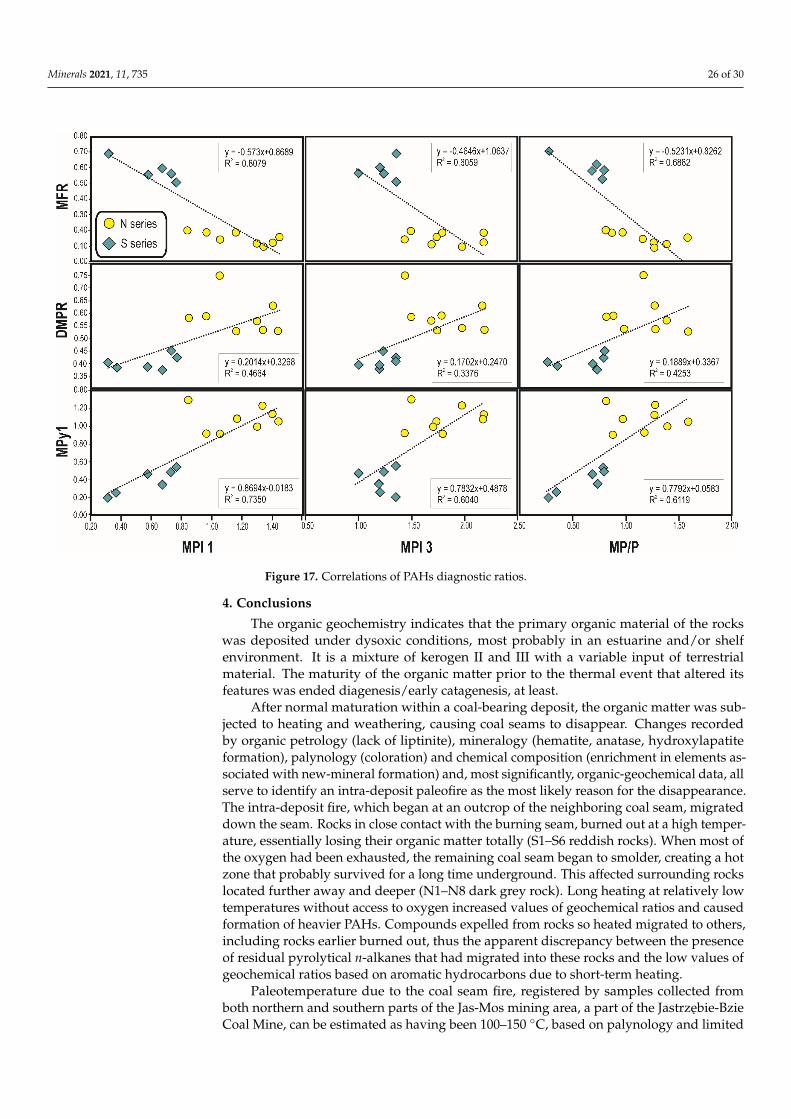
Minerals 2021, 11, 735 26 of 30
Minerals 2021, 11, x 27 of 31
Minerals 2021, 11, x. https://doi.org/10.3390/xxxxx www.mdpi.com/journal/minerals
According to the Shapiro–Wilk test, the values of aromatic hydrocarbon ratios
showed normal distribution, except the MFR values set. Thus, the Pearson correlation has
been applied to calculate the square of the Pearson product moment correlation to find
whether there is a linear correlation between selected ratios. Linear correlations between
various aromatic hydrocarbon maturity ratios confirm that both sample sets were initially
of the same maturity and similar in type of organic matter. Correlation coefficient values
of 0.3376–0.4664 indicate weak correlations for DMPR versus MPI‐1, MPI‐3 and MP/P and
values of 0.6040–0.7350, moderate to strong positive correlations for MPy‐1 versus MPI‐1,
MPI‐3 and MP/P (Figure 17). Negative correlations (from –0.6059 to –0.8079) between MFR
and MPI‐1, MPI‐3 and MP/P reflect the fact that the MFR decreases with increasing
maturity.
Figure 17. Correlations of PAHs diagnostic ratios.
In Figure 17, values for the red and grey samples show minimal overlap. The higher
maturity of the grey rocks is indicated. Aromatic hydrocarbon maturity ratios appear to
be more sensitive than biomarker ratios to short‐term thermal influences; unlike the
former, pentacyclic triterpene and sterane ratios do not show significant differences. In
organic matter, the biomarker ratios preserve initial geochemical features due to earlier
catagenesis and mild long‐term heating. Except for Ts and Tm, they did not register later
higher‐temperature thermal stresses of short duration. Thus, the aliphatic biomarkers and
alkyl aromatic hydrocarbons enable discrimination between earlier catagenic stages of
organic‐matter evolution and local changes due to any later intra‐deposit heating.
4. Conclusions
The organic geochemistry indicates that the primary organic material of the rocks
was deposited under dysoxic conditions, most probably in an estuarine and/or shelf
environment. It is a mixture of kerogen II and III with a variable input of terrestrial
Figure 17. Correlations of PAHs diagnostic ratios.
4. Conclusions
The organic geochemistry indicates that the primary organic material of the rockswas deposited under dysoxic conditions, most probably in an estuarine and/or shelfenvironment. It is a mixture of kerogen II and III with a variable input of terrestrialmaterial. The maturity of the organic matter prior to the thermal event that altered itsfeatures was ended diagenesis/early catagenesis, at least.
After normal maturation within a coal-bearing deposit, the organic matter was sub-jected to heating and weathering, causing coal seams to disappear. Changes recordedby organic petrology (lack of liptinite), mineralogy (hematite, anatase, hydroxylapatiteformation), palynology (coloration) and chemical composition (enrichment in elements as-sociated with new-mineral formation) and, most significantly, organic-geochemical data, allserve to identify an intra-deposit paleofire as the most likely reason for the disappearance.The intra-deposit fire, which began at an outcrop of the neighboring coal seam, migrateddown the seam. Rocks in close contact with the burning seam, burned out at a high temper-ature, essentially losing their organic matter totally (S1–S6 reddish rocks). When most ofthe oxygen had been exhausted, the remaining coal seam began to smolder, creating a hotzone that probably survived for a long time underground. This affected surrounding rockslocated further away and deeper (N1–N8 dark grey rock). Long heating at relatively lowtemperatures without access to oxygen increased values of geochemical ratios and causedformation of heavier PAHs. Compounds expelled from rocks so heated migrated to others,including rocks earlier burned out, thus the apparent discrepancy between the presenceof residual pyrolytical n-alkanes that had migrated into these rocks and the low values ofgeochemical ratios based on aromatic hydrocarbons due to short-term heating.
Paleotemperature due to the coal seam fire, registered by samples collected fromboth northern and southern parts of the Jas-Mos mining area, a part of the Jastrzebie-BzieCoal Mine, can be estimated as having been 100–150 ◦C, based on palynology and limited
Minerals 2021, 11, 735 27 of 30
changes in chemical-, organic- and mineral-matter composition. Peat combustion in theEarly Pennsylvanian times could have occurred locally, but the methodology used did notdeliver any evidence for such. If peat fires occurred, any evidence was later obscured/resetby coal-seam burning and weathering.
Author Contributions: Conceptualization, J.C., M.J.F. and D.J.; methodology, M.J.F., J.C., M.M.-K.,P.F.; software, J.C., M.J.F., M.M.-K., D.J. and P.F.; validation, J.C. and M.J.F.; formal analysis, M.J.F.,P.F., M.M.-K. and J.C.; investigation, D.J. and J.C.; resources, D.J. and A.M.; data curation, J.C.;writing—original draft preparation, M.J.F., J.C., M.M.-K., P.F. and D.J.; writing—review and editing,J.C. and M.J.F.; visualization, J.C., M.J.F., M.M.-K., D.J. and P.F.; supervision, J.C. and M.J.F.; projectadministration, J.C.; funding acquisition, J.C., D.J. and M.J.F. All authors have read and agreed to thepublished version of the manuscript.
Funding: This research was funded by the National Science Centre, Poland, grant No 2016/21/B/ST10/02293.
Acknowledgments: Tomasz Krzykawski and Kamila Banasik are thanked for conducting XRD andRaman spectroscopy. We are grateful to Janusz Rduch and the whole geologists’ team of the JAS-MOScoal mine for sample collections. Pádhraig Kennan (University College Dublin, Ireland) is thankedfor language correction.
Conflicts of Interest: The authors declare no conflict of interest.
References1. Kowalski, W.C. Procesy wietrzeniowe i epigenetyczne w obrebie pstrych utworów Rybnickiego Okregu Weglowego. Prz. Geol.
1983, 31, 591–595. (In Polish and English Summary).2. Gabzdyl, W.; Probierz, K. The occurrence of anthracites in the area characterised by low rank coals in the Upper Silesian Coal
Basin of Poland. Int. J. Coal Geol. 1987, 7, 209–225. [CrossRef]3. Klika, Z.; Osovsky, M. Thermally altered coal from Upper Silesian Coal Basin. J. Czech Geol. Soc. 1999, 44, 343–352.4. Probierz, K. Coal Petrology in recognition of coking coal in Jastrzebie area. Kwart. Górnictwo Geol. 2012, 7, 87–117. (In Polish and
English Summary).5. Klika, Z. Geochemistry of Coal from Region of the Red Beds Bodies of the Upper Silesian Coal Basin; VSB—Technical University Ostrava,
HGF—Faculty of Minig and Geology: Ostrava, Czech Republic, 1998; pp. 1–85.6. Klika, Z.; Koszubek, T.; Martinec, P.; Kliková, C.; Dostál, Z. Mathematical modeling of bituminous coal seams burning contempo-
raneously with the formation of a variegated beds body. Int. J. Coal Geol. 2004, 59, 137–151. [CrossRef]7. Muszynski, M.; Skowronski, A.; Lipiarski, I. Red beds of the collapse-type breccia from the “Marcel” Coal Mine (Upper Silesian
Coal Basin). Geologia 2006, 32, 345–367, (In Polish and English Summary).8. Jura, D. Discordances of the top surface of Carboniferous deposits of the Upper Silesian Coal Basin. Pol. Geol. Inst. Spec. Pap.
2002, 7, 125–132.9. Jureczka, J.; Dopita, M.; Gałka, M.; Krieger, W.; Kwarcinski, J.; Martinec, P. Geological Atlas of Coal Deposits of the Polish Czech Patrs
of the Upper Silesian Coal Basin 1:200 000; Polish Geological Institute: Warszawa, Poland, 2005.10. Jurczak-Drabek, A. Petrographical Atlas of the Deposits Upper Silesian Coal Basin 1:300 000; Polish Geological Institute: Warszawa,
Poland, 1996.11. Wagner, M. Petrological Character of Bituminous Coal from the Mottled Sediments (Upper Carboniferous), Southern Part of
Rybnik Coal District. Geologia 1983, 9, 87–105. (In Polish and English Summary).12. Kotas, A. Geological bacground. In Coal-Bed Methane Potential of the Upper Silesian Coal Basin; Panstwowy Instytut Geologiczny:
Warszawa, Poland, 1994; Volume 142, pp. 6–15.13. Jura, D. Late Variscan and Alpine Geodynamics of the Upper Silesian Coal Basin. In Proceedings of the XIII Congress of the
Carboniferous and Permian; Polish Geological Institute: Warsaw, Poland, 1997; Volume 157, pp. 169–176.14. Jura, D. Morphotectonics and evolution of discordances of different age oresent in the top surface of the Carboniferous of the
Upper Silesian Coal Basin. Pr. Nauk. Uniw. Slaskiego Katowicach 1952, 2001, 1–176. (In Polish and English summary).15. Kedzior, S. Distribution of methane contents and coal rank in the profiles of deep boreholes in the Upper Silesian Coal Basin,
Poland. Int. J. Coal Geol. 2019, 202, 190–208. [CrossRef]16. Kotarba, M.J.; Clayton, J.L. A stable carbon isotope and biological marker study of Polish bituminous coals and carbonaceous
shales. Int. J. Coal Geol. 2003, 55, 73–94. [CrossRef]17. Dill, H.G.; Sachsenhofer, R.F. Fossil fuels, ore and industrial minerals. In The Geology of Central Europe; The Geological Society:
London, UK, 2008; pp. 1341–1449.18. Jura, D.; Trzepierczynski, J. Morphotectonic development of the sub-Permian surface along the Upper Silesian Coal Basin.
In Proceedings of the XIII Congress of the Carboniferous and Permian; Polish Geological Institute: Warsaw, Poland, 1997; Volume 157,pp. 177–182.
Minerals 2021, 11, 735 28 of 30
19. Kim, A.G. Coal formation and the origin of coal fires. In Coal and Peat Fires, A Global Perspective; Stracher, G.B., Prakash, A., Sokol,E.V., Eds.; Elsevier: Amsterdam, The Netherlands, 2011; Volume 1, pp. 1–23.
20. Sokol, E.V.; Maksimova, N.V.; Nigmatulina, E.N.; Sharygin, V.V.; Kalugin, V.M. Combustion Metamorphism; SB RAS: Novosibirsk,Russia, 2005; pp. 1–312, (In Russian, with some English Abstracts).
21. Stracher, G.B.; Prakash, A.; Sokol, E.V. Coal and Peat Fires: A Global Perspective; Elsevier: Amsterdam, The Netherlands, 2011;Volume 1, pp. 1–357.
22. Stracher, G.B.; Prakash, A.; Sokol, E.V. Coal and Peat Fires: A Global Perspective; Elsevier: Amsterdam, The Netherlands, 2013;Volume 2, pp. 1–554.
23. Stracher, G.B.; Prakash, A.; Sokol, E.V. Coal and Peat Fires: A Global Perspective; Elsevier: Amsterdam, The Netherlands, 2015;Volume 3, pp. 1–786.
24. Martinec, P.; Dopita, M. Paleorelief of the epivariscan platform and its rocks mantle. In Geology of the Czech Part of the UpperSilesian Basin; Ministry of the Environment of the Czech Republik: Praha, Czech Republic, 1997; pp. 181–187. (In Czech andEnglish Summary).
25. Krs, M.; Kssová, M.; Martinec, P.; Pruner, P. Paleomagnetism of the Carboniferous and Variegated Layers of the Moravian-SilesianRegion. Geol. Carpathica 1993, 44, 301–314.
26. Klika, Z.; Kraussova, J. Propierties of altered coals associated with Carboniferous red beds in the Upper Silesian Coal Basin andtheir tentative classification. Int. J. Coal Geol. 1993, 22, 217–235. [CrossRef]
27. Yoksoulian, L.E.; Rimmer, S.M.; Rowe, H.D. Anatomy of an intruded coal, II: Effect of contact metamorphism on organic δ13C andimplications for the release of thermogenic methane, Springfield (No. 5) Coal, Illinois Basin. Int. J. Coal Geol. 2016, 158, 129–136.[CrossRef]
28. Rahman, M.W.; Rimmer, S.M.; Rowe, H.D.; Huggett, W.W. Carbon isotope analysis of whole-coal and vitrinite from intrudedcoals from the Illinois Basin: No isotopic evidence for thermogenic methane generation. Chem. Geol. 2017, 453, 1–11. [CrossRef]
29. Rahman, M.W.; Rimmer, S.M.; Rowe, H.D. The impact of rapid heating by intrusion on the geochemistry and petrography ofcoals and organic-rich shales in the Illinois Basin. Int. J. Coal Geol. 2018, 187, 45–53. [CrossRef]
30. Sanders, M.M.; Rimmer, S.M. Revisiting the thermally metamorphosed coals of the Transantarctic Mountains, Antarctica. Int. J.Coal Geol. 2020, 228, 103550. [CrossRef]
31. Ciesielczuk, J.; Górka, M.; Fabianska, M.J.; Misz-Kennan, M.; Jura, D. The influence of heating on the carbon isotope composition,organic geochemistry and petrology of coal from the Upper Silesian Coal Basin (Poland): An experimental and field study. Int. J.Coal Geol. 2021, 241, 103749. [CrossRef]
32. ISO 7404-2. Methods for the Petrographic Analysis of Coals—Part 2: Methods of Preparing Coal Samples; ISO: Geneva, Switzerland,2009; 12p.
33. ISO 7404-3. Methods for the Petrographic Analysis of Coals—Part 3: Method of Determining Maceral Group Composition; ISO: Geneva,Switzerland, 2009; 7p.
34. International Committee for Coal and Organic Petrology. New vitrinite classification (ICCP system 1994). Fuel 1998, 77, 349–358.[CrossRef]
35. International Committee for Coal and Organic Petrology. New inertinite classification (ICCP system 1994). Fuel 2001, 80, 459–471.[CrossRef]
36. Pickel, W.; Kus, J.; Flores, D.; Kalaitzidis, S.; Christanis, K.; Cardott, B.J.; Misz-Kennan, M.; Rodrigues, S.; Hentschel, A.;Hamor-Vido, M.; et al. ICCP. Classification of liptinite—ICCP System 1994. Int. J. Coal Geol. 2017, 169, 40–61. [CrossRef]
37. ISO 7404-5. Methods for the Petrographic Analysis of Coals—Part 5: Method of Determining Microscopically the Reflectance of Vitrinite;ISO: Geneva, Switzerland, 2009; 14p.
38. Wood, G.; Gabriel, A.M.; Lawson, J.C. Palynological techniques—Processing and microscopy. In Palynology: Principles andApplications; Jansonius, J., McGregor, D.C., Eds.; American Association of Stratigraphic Palynologists Foundation: Salt Lake City,UT, USA, 1996; Volume 1, pp. 29–50.
39. Philp, R.P. Fossil Fuel Biomarkers. Application and Spectra; Elsevier: Amsterdam, The Netherlands, 1985.40. Wiley/NBS. Registry of Mass Spectral; John Wiley & Sons, Inc.: Hoboken, NJ, USA, 2012.41. Jureczka, J.; Kotas, A. Coal deposits. Upper Silesian Coal Basin. In The Carboniferous System in Poland; Zdanowski, A.,
Zakowa, H., Eds.; Polish Geological Institute: Warsaw, Poland, 1995; pp. 164–173.42. Parzentny, H.R. Spatial macroscale variability of the role of mineral matter in concentrating some trace elements in bituminous
coal in a coal basin—A case study from the Upper Silesian Coal Basin in Poland. Minerals 2020, 10, 422. [CrossRef]43. Ward, C.R. Analysis, origin and significance of mineral matter in coal: An updated review. Int. J. Coal Geol. 2016, 165, 1–27.
[CrossRef]44. Kribek, B.; Sýkorová, I.; Veselovský, F.; Laufek, F.; Malec, J.; Knésl, I.; Majer, V. Trace element geochemistry of self-burning and
weathering of a mineralized coal waste dump: The Novátor mine, Czech Republic. Int. J. Coal Geol. 2017, 173, 158–175. [CrossRef]45. Finkelman, R.B.; Dai, S.; French, D. The importance of minerals in coal as the hosts of chemical elements. Int. J. Coal Geol. 2019,
212, 103251. [CrossRef]46. Seredin, V.V.; Dai, S. Coal deposits as potential alternative sources for lanthanides and yttrium. Int. J. Coal Geol. 2012, 94, 67–93.
[CrossRef]47. Ward, C.R. Analysis and significance of mineral matter in coal seams. Int. J. Coal Geol. 2002, 50, 135–168. [CrossRef]
Minerals 2021, 11, 735 29 of 30
48. Clayton, G.; Coquel, R.; Doubinger, J.; Gueinn, K.; Loboziak, S.; Owens, B.; Streel, M. Carboniferous Spores of Western Europe.Illustration and Zonation. Report of Commission Internationale de Microflore du Paléozoïque, Working Group on CarboniferousStratigraphical Palynology. Meded. Rijks Geol. Dienst 1977, 29, 1–71.
49. Batten, J. Palynofacies, palaeoenvironments and petrolum. J. Micropaleont. 1982, 1, 107–114. [CrossRef]50. Batten, D.J. Palynofacies and palaeoenvironmental interpretation. In Palynology: Principles and Applications; Jansonius, J.,
McGregor, D.C., Eds.; American Association of Stratigraphy Palynologists Foundation: Salt Lake City, UT, USA, 1996; Volume 3,pp. 1011–1064.
51. Traverse, A. Paleopalynology, 2nd ed.; Springer: Dordrecht, The Netherlands, 2008; pp. 1–813.52. Fabianska, M.J.; Cmiel, S.R.; Misz-Kennan, M. Biomarkers and aromatic hydrocarbons in bituminous coals of Upper Silesian Coal
Basin: Example from 405 coal seam of the Zaleskie Beds (Poland). Int. J. Coal Geol. 2013, 107, 96–111. [CrossRef]53. Misz-Kennan, M.; Fabianska, M.J. Thermal transformation of organic matter in coal waste from Rymer Cones (Upper Silesian
Coal Basin, Poland). Int. J. Coal Geol. 2010, 81, 343–358. [CrossRef]54. Misz-Kennan, M.; Fabianska, M.J. Application of organic petrology and geochemistry to coal waste studies. Int. J. Coal Geol. 2011,
88, 1–23. [CrossRef]55. Misz-Kennan, M. Thermal alterations of organic matter in coal wastes from Upper Silesia, Poland. Mineralogia 2010, 41, 105–236.
[CrossRef]56. Nádudvari, Á.; Fabianska, M.J. Use of geochemical analysis and vitrinite reflectance to assess different self-heating processes in
coal-waste dumps (Upper Silesia, Poland). Fuel 2016, 181, 102–119. [CrossRef]57. Peters, K.E.; Walters, C.C.; Moldowan, J.M. The Biomarker Guide. Biomarkers and Isotopes in Petroleum Exploration and Earth History;
Cambridge University Press: Cambridge, UK, 2005.58. Tissot, B.P.; Welte, D.H. Petroleum Formation and Occurrence, 2nd ed.; Springer: Berlin/Heidelberg, Germany, 1984.59. Bray, E.E.; Evans, E.D. Distribution of n-paraffins as a clue to recognition of source beds. Geochim. Cosmochim. Acta 1961, 22, 2–15.
[CrossRef]60. Didyk, B.M.; Simoneit, B.R.T.; Brassell, S.C.; Eglington, G. Organic geochemical indicators of palaeoenvironmental conditions of
sedimentation. Nature 1978, 272, 216–222. [CrossRef]61. Leythaeuser, D.; Schwarzkopf, T. The pristane/n-heptadecane ratio as an indicator for recognition of hydrocarbon migration
effects. Org. Geochem. 1986, 10, 191–197. [CrossRef]62. Seifert, W.K.; Moldowan, J.M. Use of biological markers in petroleum exploration. Methods Geochem. Geophys. 1986, 24, 261–290.63. Huang, W.-Y.; Meinschein, W.G. Sterols as ecological indicators. Geochim. Cosmochim. Acta 1979, 43, 739–745. [CrossRef]64. Fabianska, M.J.; Smołka-Danielowska, D. Biomarker compounds in ash from coal combustion in domestic furnaces (Upper Silesia
Coal Basin, Poland). Fuel 2012, 102, 333–344. [CrossRef]65. Fabianska, M.; Kozielska, B.; Konieczynski, J. Differences in the Occurrence of Polycyclic Aromatic Hydrocarbons and Geochemi-
cal Markers in the Dust Emitted from Various Coal-Fired Boilers. Energy Fuels 2017, 31, 2585–2595. [CrossRef]66. Schubert, P.; Schantz, M.; Sander, L.; Wise, S. Determination of polycyclic aromatic hydrocarbons with molecular weight 300
and 302 in environmental-matrix standard reference materials by gas chromatography/ mass spectrometry. Anal. Chem. 2003,75, 234–246. [CrossRef]
67. Masala, S.; Bergvall, C.; Westerholm, R. Determination of benzo[a]pyrene and dibenzopyrenes in a Chinese coal fly ash certifiedreference material. Sci. Total Environ. 2012, 432, 97–102. [CrossRef] [PubMed]
68. Seidel, A.; Frank, H.; Behnke, A.; Schneider, D.; Jacob, J. Determination of dibenzo[a,l]pyrene and other fjord-region PAH isomerswith mw 302 in environmental samples. Polycycl. Aromat. Compd. 2004, 24, 759–771. [CrossRef]
69. Pace, C.; Betowski, L. Measurement of high-molecular-weight polycyclic aromatic hydrocarbons in soils by particle beam highperformance liquid chromatography-mass spectrometry. J. Am. Soc. Mass Spectrom. 1995, 6, 597–607. [CrossRef]
70. Prus, W.; Fabianska, M.J.; Łabno, R. Geochemical markers of soil anthropogenic contaminants in polar scientific stations nearby(Antarctica, King George Island). Sci. Total. Environ. 2015, 518–519, 266–279. [CrossRef] [PubMed]
71. Sauvain, J.; VuDuc, T. Approaches to identifying and quantifying polycyclic aromatic hydrocarbons of molecular weight 302 indiesel particulates. J. Sep. Sci. 2004, 27, 78–88. [CrossRef] [PubMed]
72. Bergvall, C.; Westerholm, R. Identification and determination of highly carcinogenic dibenzopyrene isomers in air particulatesamples from a street canyon, a rooftop, and a subway station in Stockholm. Environ. Sci. Technol. 2007, 41, 731–737. [CrossRef]
73. Mininni, G.; Sbrilli, A.; Guerriero, E.; Rotatori, M. Polycyclic aromatic hydrocarbons formation in sludge incineration by fluidisedbed and rotary kiln furnace. Water Air Soil Pollut. 2004, 154, 3–18. [CrossRef]
74. Ikegami, M. Soot formation Fundamentals. In Growth and Destruction of Soot Particles; Someya, T., Ed.; Springer: Berlin/Heidelberg,Germany, 1993; pp. 161–204.
75. Sarofim, A.F.; Longwell, J.P.; Wornat, M.J.; Mukherjee, J. The Role of Biaryl Reactions in PAH and Soot Formation. In SootFormation in Combustion; Bockhorn, H., Ed.; Springer: Berlin/Heidelberg, Germany, 1994; pp. 485–499.
76. Ravindra, K.; Sokhi, R.; Van Grieken, R. Atmospheric polycyclic aromatic hydrocarbons: Source attribution, emission factors andregulation. Atmos. Environ. 2008, 42, 2895–2921. [CrossRef]
77. Radke, M.; Welte, D.H. The methylphenanthrene index (MPI): A maturity parameter based on aromatic hydrocarbons. Adv. Org.Geochem. 1981, 1983, 504–512.
78. Radke, M. Organic geochemistry of aromatic hydrocarbons. Adv. Pet. Geochem. 1988, 2, 141–203.

Minerals 2021, 11, 735 30 of 30
79. Radke, M.; Vriend, S.P.; Ramanampisoa, L.R. Alkyldibenzofurans in terrestrial rocks: Influence of organic facies and maturation.Geochim. Cosmochim. Acta 2000, 64, 275–286. [CrossRef]
80. Alexander, R.; Kagi, R.I.; Rowland, S.J.; Sheppard, P.N.; Chirila, T.V. The effects of thermal maturation on distributions ofdimethylnaphthalenes and trimethylnaphthalenes in some ancient sediments and petroleums. Geochim. Cosmochim. Acta 1985,49, 385–395. [CrossRef]
81. Kruge, M.A. Determination of thermal maturity and organic matter type by principal components analysis of the distributions ofpolycyclic aromatic compounds. Int. J. Coal Geol. 2000, 43, 27–51. [CrossRef]
82. Ishiwatari, R.; Fukushima, K. Generation of unsaturated and aromatic hydrocarbons by thermal alteration of young kerogen.Geochim. Cosmochim. Acta 1979, 43, 1343–1349. [CrossRef]
83. Garrigues, P.; Connan, J.; Parlanti, E.; Bellocq, J.; Ewald, M. Relationship between rank and distribution of methylaromatichydrocarbons for condensates of different origins. Org. Geochem. 1988, 13, 1115–1121. [CrossRef]
Related Documents