International Journal of Economic Perspectives, 2012, Volume 6, Issue 4, 93-111. International Journal of Economic Perspectives ISSN 1307-1637 © International Economic Society http://www.econ-society.org 93 The Difficult Quest for an Answer to Low Growth Dilemma in Turkey: The Channel of Debt and Productivity Mehmet BALCILAR Department of Economics, Eastern Mediterranean University, Famagusta, Turkish Republic of Northern Cyprus, via Mersin 10, Turkey. Tel: +90 392 630 1271, Fax: +90 392 365 1017, e-mail: [email protected]. ABSTRACT Turkey is the only founding member of the OECD that lagged behind western economies in terms of per capita GDP. Turkey’s low growth has been a dilemma, because it reformed it is economy, adopted Western institutions, and achieved high capital deepening for several decades, yet it is growth record has been disappointing. This paper analyzes the relationship between public debt and productivity in Turkey and offers a possible explanation to the long standing dilemma. Using time series data over the period 1970-2008, the study obtains evidence of a significant and negative relationship between total public debt and productivity growth in Turkey. In terms of the specific channels through which high debt affects economic growth and the allocation of resources in Turkey, the study finds that high public debt harms growth mostly through its impact on total factor productivity (TFP) growth. Our results indicate that the indirect impact on growth through reduced investment proposed by the debt overhang theories is not significant for Turkey. High debt levels reduce TFP growth by directing resources to poor investments, reducing infrastructure and human capital investment that enhances private sector productivity, and delaying reforms. Our results indicate that on average high debt reduced TFP growth in Turkey by 2.59 percent per year. JEL Classification: E62; H63. Key Words: Growth; Total Factor Productivity; Turkey. 1. INTRODUCTION Public debt has been one of the most important problems facing many developed as well as developing countries. Most of the current developed countries in Europe had steadily rising public debt to gross domestic product (GDP) ratios after the World War II. The US also had a similar trend. However, developed countries are now characterized by lower public debt to GDP ratios. On the other hand, debt ratios in many developing countries evolved to more than 100 percent of their GDP levels. Many of the highly indebted developing countries faced debt crises that could only be overcome with significant contributions from the international organizations such as the World Bank and the IMF. External borrowing was seen as a relief to the lack of sufficient domestic saving in developing countries and it was hoped that these borrowings would finance productive investments and in the long-run domestic savings would increase enough to finance investments and also repay the debt (Avramovic, 1964). The frequent debt crises occurring in the highly indebted developing countries and their failure to close the per capita income gap with the developed countries motivated alternative views on the impact of debt. The “debt overhang” and “liquidity constraint” theories (Krugman, 1988; Corden, 1989; Froot, 1989; Sachs, 1989; Cohen, 1992) arose as a possible explanation to this problem. According these theories, beyond a certain threshold debt could discourage consumption and investment and, thus, may harm economic growth. This is known as indirect effect of debt since growth is reduced due to lower investment level. It can also be hypothesized that debt may have a direct impact on growth by lowering productivity (see, e.g., Fosu, 1996, 1999, 2008; Pattillo et al., 2002, 2003). Countries facing large debt service to GDP ratio are observed to have low productive investments (Fosu, 1996). In this case, even if the investment and savings are not reduced by the generous debt services, they may, nevertheless, reduce growth by diverting resources to poor and low productive investments. This is referred as “direct effect” since growth is reduced as a direct result of lower total facto productivity (TFP) growth. This paper employs annual time series data from 1970 to 2008 to investigate the impact of public debt on TFP growth in Turkey. Turkey presents a very interesting case study for investigating the impact of debt on productivity. Adamopoulos and Akyol (2006) and Altug et al. (2007) argue that Turkey’s poor growth was not

Welcome message from author
This document is posted to help you gain knowledge. Please leave a comment to let me know what you think about it! Share it to your friends and learn new things together.
Transcript
International Journal of Economic Perspectives, 2012, Volume 6, Issue 4, 93-111.
International Journal of Economic Perspectives ISSN 1307-1637 © International Economic Society
http://www.econ-society.org
93
The Difficult Quest for an Answer to Low Growth Dilemma in
Turkey: The Channel of Debt and Productivity
Mehmet BALCILAR Department of Economics, Eastern Mediterranean University, Famagusta, Turkish
Republic of Northern Cyprus, via Mersin 10, Turkey. Tel: +90 392 630 1271, Fax:
+90 392 365 1017, e-mail: [email protected].
ABSTRACT
Turkey is the only founding member of the OECD that lagged behind western economies in terms of per capita
GDP. Turkey’s low growth has been a dilemma, because it reformed it is economy, adopted Western institutions,
and achieved high capital deepening for several decades, yet it is growth record has been disappointing. This
paper analyzes the relationship between public debt and productivity in Turkey and offers a possible explanation
to the long standing dilemma. Using time series data over the period 1970-2008, the study obtains evidence of a
significant and negative relationship between total public debt and productivity growth in Turkey. In terms of the
specific channels through which high debt affects economic growth and the allocation of resources in Turkey,
the study finds that high public debt harms growth mostly through its impact on total factor productivity (TFP)
growth. Our results indicate that the indirect impact on growth through reduced investment proposed by the debt
overhang theories is not significant for Turkey. High debt levels reduce TFP growth by directing resources to
poor investments, reducing infrastructure and human capital investment that enhances private sector
productivity, and delaying reforms. Our results indicate that on average high debt reduced TFP growth in Turkey
by 2.59 percent per year.
JEL Classification: E62; H63.
Key Words: Growth; Total Factor Productivity; Turkey.
1. INTRODUCTION
Public debt has been one of the most important problems facing many developed as well as developing
countries. Most of the current developed countries in Europe had steadily rising public debt to gross domestic
product (GDP) ratios after the World War II. The US also had a similar trend. However, developed countries are
now characterized by lower public debt to GDP ratios. On the other hand, debt ratios in many developing
countries evolved to more than 100 percent of their GDP levels. Many of the highly indebted developing
countries faced debt crises that could only be overcome with significant contributions from the international
organizations such as the World Bank and the IMF. External borrowing was seen as a relief to the lack of
sufficient domestic saving in developing countries and it was hoped that these borrowings would finance
productive investments and in the long-run domestic savings would increase enough to finance investments and
also repay the debt (Avramovic, 1964).
The frequent debt crises occurring in the highly indebted developing countries and their failure to close the per
capita income gap with the developed countries motivated alternative views on the impact of debt. The “debt
overhang” and “liquidity constraint” theories (Krugman, 1988; Corden, 1989; Froot, 1989; Sachs, 1989; Cohen,
1992) arose as a possible explanation to this problem. According these theories, beyond a certain threshold debt
could discourage consumption and investment and, thus, may harm economic growth. This is known as indirect
effect of debt since growth is reduced due to lower investment level. It can also be hypothesized that debt may
have a direct impact on growth by lowering productivity (see, e.g., Fosu, 1996, 1999, 2008; Pattillo et al., 2002,
2003). Countries facing large debt service to GDP ratio are observed to have low productive investments (Fosu,
1996). In this case, even if the investment and savings are not reduced by the generous debt services, they may,
nevertheless, reduce growth by diverting resources to poor and low productive investments. This is referred as
“direct effect” since growth is reduced as a direct result of lower total facto productivity (TFP) growth.
This paper employs annual time series data from 1970 to 2008 to investigate the impact of public debt on TFP
growth in Turkey. Turkey presents a very interesting case study for investigating the impact of debt on
productivity. Adamopoulos and Akyol (2006) and Altug et al. (2007) argue that Turkey’s poor growth was not
International Journal of Economic Perspectives, 2012, Volume 6, Issue 4, 93-111.
International Journal of Economic Perspectives ISSN 1307-1637 © International Economic Society
http://www.econ-society.org
94
indeed to low capital growth, rather it was mainly result of low TFP growth and declining labor force
participation rates. Thus, Turkey is an interesting case to examine the channels through which debt reduces
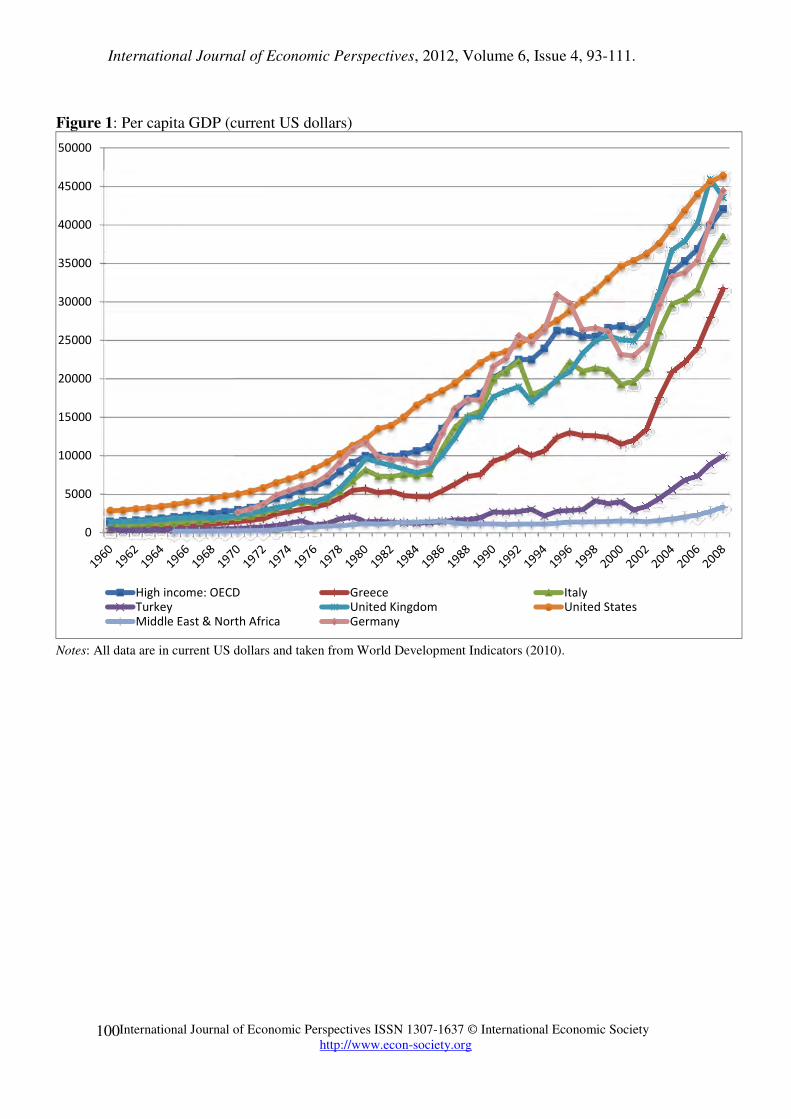
economic growth. Turkey is the only OECD country that failed to close the per capita income gap with
developed countries (see Figure 1) even though it achieved significant capital deepening by the end of 1970s,
generously borrowed since the early 1960s, adopted Western institutions, and maintained high investment rates
for most of the periods since 1960 (see Figures 2 and 3).
The paper investigates the direct impact of central government debt on TFP growth in Turkey. Using the bounds
testing and autoregressive distributed lag (ARDL) approach (Pesaran et al. 2001; Pesaran and Shin, 1999) we
investigate the long-run relationship between the debt ratio and TFP growth. Our results indicate that high public
debt harms growth in Turkey through its significant impact on productivity. On average we find that one
percentage point increase in the debt to GDP ratio reduces TFP growth by about 0.074 percent. Our findings
offer some explanation to the puzzling case of Turkey, a country that failed to close the per capita income gap
with developed economies against its significant capital deepening, high investment ratios, long established
Western institutions, and close ties with Western international organizations.
The organization of the rest of the paper is as follows: Section 2 briefly presents relevant economic theory on the
debt-growth relationships and reviews previous empirical evidence. In Section 3, we explain the estimation
methodology used in the study. Section 4 describes the data and presents empirical results. Section 5 concludes
the paper with policy implications.
2. THEORIES ON DEBT-GROWTH RELATIONSHIP AND EMPIRICAL EVIDENCE
In the last few decades, developing countries have increasingly relied on external debt and borrowed large
amounts. It was hoped that borrowing would move these countries into faster growth paths by allowing higher
investment levels. In the 1980s, the debt to GDP ratios exceeded 100 percent in several countries, such as
Argentina, Mexico, and Brazil. With accumulated debts in these countries exceeding their annual GDP levels
and debt crises leading the IMF and World Bank to launch debt initiatives to lower debt ratios, it was understood
that, although low debt rates may help to finance initial development, beyond a certain threshold high debt
levels not only reduce growth rates but the repayment would also not be possible. This nonlinear relationship
between the debt ratio and growth is summarized by the so called “debt Laffer curve” (Krugman, 1988; Sachs,
1989), in that there exits a threshold level of debt ratio and beyond this threshold borrowing reduces economic
growth. Below the threshold the borrowing may put developing countries on a higher growth paths. Countries in
their early stages of development have investment opportunities with high returns. These countries can invest
borrowed funds in high return investment and enjoy higher growth rates that allow timely repayment of the debt.
According to the debt cycle theory of Avramovic (1964) the external debt compensates for low saving rates and
eases growth, but in the long-run domestic saving should increase to finance the increased investment and repay
the debt. The evidence, though, indicates that most developing countries are trapped in the first stage of this
cycle since their domestic saving is still low and external debt continues to grow.
The negative impact of debt on growth above the threshold debt ratio is usually attributed to what is known as
debt overhang theory (Krugman, 1988; Cohen, 1989; Sachs, 1989). The high debt burden resulting in high debt
service to GDP ratios will create uncertainty about the country’s payment ability and fear of increased taxation in
the future. The uncertainty will distract both domestic and foreign investors. Moreover, high debt service rations
will constrain public investment. The net result is overall reduction in investment and hence lower growth rates.
In addition to debt overhang there are two other channels through which high debt ratio leads to lower growth.
First, the high debt countries accession to international credit will be impaired, leading to higher domestic
interest rates. Higher interest rates crowds out private investment and in turn leads to lower growth rates.
Second, the downturn in economic activity and reduced public investment, which is complimentary to private
investment, reduce the profitability of investment. Lower return also reduces investment and thus economic
growth. In sum, the debt overhang theory suggests that high debt stock will be perceived as tax on future output,
reducing current investment and in turn pushing the debtor country to a lower growth path.
A number of studies examined the empirical relationship between the debt and growth, mostly considering
external debt. Savvides (1992) argues that debtor countries with high debt burden will have little incentive to
promote domestic investment and savings when most benefits go to creditors. Using panel data on 43 countries
over the period 1980-1986, the author concludes that debt overhang reduced capital inflow and investment in
these countries. Felstein (1986) offers an explanation based on the foreign exchange requirement of the debt
repayment. He argues that the debt burden is not only a problem of freeing resources but also converting these
resources into foreign exchange. Developing countries have fast growing import requirement and foreign
International Journal of Economic Perspectives, 2012, Volume 6, Issue 4, 93-111.
International Journal of Economic Perspectives ISSN 1307-1637 © International Economic Society
http://www.econ-society.org
95
exchange directed to debt repayments limits imports and thus harms GDP growth. Deshpande (1990) examined
the relationship between investment and debt using panel data on 13 highly indebted countries. He finds
evidence in support of the debt overhang hypothesis by estimating investment debt relationship over 1975-1983
and 1984-1991 sample periods. On the contrary, Cohen (1993) estimates investment-debt relationship for a
sample of 81 countries and finds that debt does not have significant impact on investment. Warner (1992) also
finds results complementary to Cohen (1993) using data on 13 highly indebted countries. Rockerbie (1994)
criticizes Warner’s (1992) results for econometric misspecification and obtains evidence in favor of the debt
overhang theory using data on the same 13 indebted countries that experienced debt crises. Using panel data on
29 sub-Saharan countries over the period 1970-1980, Fosu (1996) identifies nonlinear relationship between the
debt and investment, confirming the debt overhang theory. Pattillo et al. (2002) obtains evidence that the debt
has negative effect on growth above the threshold debt to GDP ratio of 35 percent. The nonlinear growth-debt
relationship is examined by Clements et al. (2003) and Cordella et al. (2005) and supportive evidence is
obtained. Elbadawi et al. (1997) estimates the growth maximizing debt to GDP ratio as 97 percent using a
quadratic growth-debt specification. On the other hand Reinhart et al. (2003) estimates a threshold debt ratio of
15 percent, which is much lower than the estimates in Pattillo et al. (2002) and Elbadawi et al. (1997).
There are only a few empirical studies that directly deal with the impact of debt on TFP. Fosu, (1996, 1999,
2008) finds that, using panel data on a group of sub-Saharan African countries, external debt reduces growth by
reducing TFP rather than through deceleration of the capital accumulation. Fosu (1996) estimates the direct
impact of external debt on TFP using pane data on 29 sub-Saharan African countries over the period 1970-1986
and finds evidence that debt impairs economic growth by lowering TFP. Pattillo et al. (2003) uses data on 61
developing countries over the period 1969-1998 and find that the negative impact of debt on economic growth is
more due to impact on TFP (2/3 contribution to lower TFP) rather than indirect reduced investment impact (1/3
contribution to lower investment). Two related studies examined the impact of budget deficits on productivity.
Fischer (1993) found that budged deficits reduce both capital accumulation and productivity, while Bosworth
and Collins (2003) found evidence that budget deficits primarily affect capital accumulation not productivity.
The literature discussed above emphasizes the debt overhang for the negative impact of debt on economic
growth. The debt overhang impairs growth indirectly by lowering investment and saving. However, there is a
second direct channel through which the debt may harm economic growth. There are several reasons that the
debt may lower TFP. TFP is one of the most significant components of growth and its significant contribution
has been confirmed by numerous studies (Solow, 1957; Denison, 1962; Jorgenson and Griliches, 1967). The
growth in highly indebted countries may be weak, if the public debt significantly lowers TFP. Then, the growth
rates may stay low in these countries even though their investment to GDP ratio is high. In this case, high
investment and capital deepening will not significantly improve economic growth. Particularly external debt may
lower economic growth via its impact on TFP, even if it has little impact on investment.
Why would debt lower TFP growth? The literature emphasized several reasons. Corden (1989) emphasizes a
broader interpretation of debt overhang theory and argues that activities with incurring costs today that promote
future production are discouraged. Therefore, governments will have little incentive to undertake challenging
policy reforms with significant initial political and economic costs. The delayed reforms contribute to lower TFP
growth. The governments also avoid policy reforms that enhance their capacity to repay, which will have a
similar impact on TFP. High debt ratios create uncertainties about the proportion of output that will be taxed for
the repayment. The reduced investment due to uncertainty emphasized by the debt overhang theory may also
contribute to low TFP. In an uncertain environment, the investors will prefer to wait further even if the
fundamentals are improving in order to avoid irreversible projects (Serven, 1997). Uncertainty may also lead to
resource misallocation and poor quality investment, contributing further to low TFP (Patillo et al., 2003).
One strand of literature following the influential work of Arrow and Kurz (1970) examined the impact of debt on
economic growth through its impact on public capital formation and human capital accumulation. In these
models, initially debt may foster public capital accumulation that is complimentary to private capital and thus
enhances its productivity. Debt may also allow governments to allocate resources to schooling and education.
Recent literature on endogenous growth argues that education enhances productivity and works as an
endogenous growth engine (Uzawa, 1965; Lucas, 1988; Rebelo, 1991). Therefor, it can be argued that the debt
financed public investment may lead to higher long-run growth by improving productivity (see e.g., Turnovsky,
1995, p. 418). The argument also runs in the apposite direction. Beyond a threshold debt ratio, governments will
be distracted from productive investment and high debt services will continuously reduce the public spending on
infrastructure and education, lowering productivity and growth in the long-run.
International Journal of Economic Perspectives, 2012, Volume 6, Issue 4, 93-111.
International Journal of Economic Perspectives ISSN 1307-1637 © International Economic Society
http://www.econ-society.org
96
3. METHODOLOGY
The empirical model specification relates TFP growth to debt ratio and other determinants, which are used as
control variables, and is given by
(1)
where TFP is the total factor productivity expressed as a percentage growth per year, D is the total public debt
(external plus internal debts) to GDP ratio in percentage, is a vector of control variables, which are assumed
to affect TFP, is the random error term, and t is time or trend variable. The control variables we use include
secondary school enrollment rate (EDUC) used as a proxy for human capital, openness (OPEN) measured as the
ratio of exports plus imports to GDP, ratio of fixed capital formation to GDP (INV), and an index of financial
development (FDIX). Equation (1) is a long-run level relationship and provides the basis for the models
estimated in this study. The major empirical question in the study is the existence of the levels relationship in
equation (1) and the impact of debt ratio1 on TFP.
Our study uses annual time series data on Turkey for the period 1970-2008 and the relationship in equation (1)
should be estimated using cointegration or long-run levels relationship estimation methods due to the non-
stationarity of the some of the variables. In order test the existence of the levels relationship in equation (1), we
use the bounds test proposed by Pesaran et al. (2001)2. The bounds testing procedure involves two stages. The
first stage is to establish the existence of a long-run relationship. Once a long-run relationship has been
established, a two-step procedure is used to estimate the long-run relationship based on the autoregressive
distributed lag (ARDL) approach of Pesaran and Shin (1999).
Suppose the theory predicts that there is a long-run relationship among the variables TFP, D, and X. Without
having any prior information about the direction of the long-run relationship among the variables, the bounds
testing approach estimates an unrestricted conditional error-correction model (UECM) by taking each of the
variables in turn as dependent variable. For instance, UECM when TFP is dependent variable takes the following
form:
(2)
where Zt is a vector of exogenous variables such as the structural change dummies.3 The first stage in bounds
testing approach is to estimate equation (1) by ordinary least squares (OLS). The null hypothesis of no long-run
levels relationship against the alternative of a levels relationship is performed as a Wald restriction test. The null
and alternative hypotheses are specified as follows:
H0:
H1:
The asymptotic distributions of the F-statistic is non-standard under the null hypothesis of levels relationship
among the variables in the UECM in equation (2), irrespective of whether variables are purely I(0), I(1),
fractionally integrated, or mutually cointegrated.4 Two sets of asymptotic critical values are provided by Pesaran
1 In the empirical section, we use total debt to GDP ratio as a measure of indebtedness. Most empirical studies examining the
impact of debt on growth used only external debt to GDP ratio, partly due to unavailability of data. In this study, we do not
make any distinction on external and internal debt but our results are robust to which debt ratio is used. 2 There are several alternatives one can use to test for long-run relationship among a set of time series, including two step
Engle and Granger (1987) and Johansen (1988) full information methods. Compared to other tests, bounds testing approach
has better small sample properties and can be applied irrespective of whether the underlying regressors are purely I(0), purely
I(1), fractionally integrated, or mutually co-integrated. 3 The lag order p in the UECM model should be specified prior to estimation. We use Shwarz (Bayesian) information criteria
to select the lag order parameter p. 4 According to Pesaran et al. (2001), the dependent variable TFP in equation (2) must be an I(1) variable, but the regressors
can be either I(0) or I(1). The critical values given in Pesaran et al. (2001) corresponds to cases where all regressors are I(1),
TFPt = α + βDt + ′γ Xt + ε t
Xε
∆TFPt = c0 + c1t + φ1TFPt−1 + φ2Dt−1 + φ j+2X j ,t−1
j =1
k
∑ + λ j ∆TFPt− j
j =1
p
∑
+ ω j∆Dt− j
j =0
p
∑ + θij ∆Xi,t− j
j =0
p
∑i=1
k
∑ + ′ψ Zt + ut
φ1
= φ2
=L = φk +2
= 0
φ1
≠ φ2
≠L≠ φk +2
≠ 0
International Journal of Economic Perspectives, 2012, Volume 6, Issue 4, 93-111.
International Journal of Economic Perspectives ISSN 1307-1637 © International Economic Society
http://www.econ-society.org
97
et al. (2001). The first set assumes that all variables are I(0) while the second set assumes that all variables are
I(1). We reject the null hypothesis of no levels relationship and conclude that there exists a long-run equilibrium
among the variables, if the computed F-statistic is greater than the upper bound critical value. On the other had,
we cannot reject the null hypothesis of no levels relationship, if the computed F-statistic is less than the lower
bound critical value. The bounds test is inconclusive, if the computed F-statistic falls within the lower and upper
bound critical values.
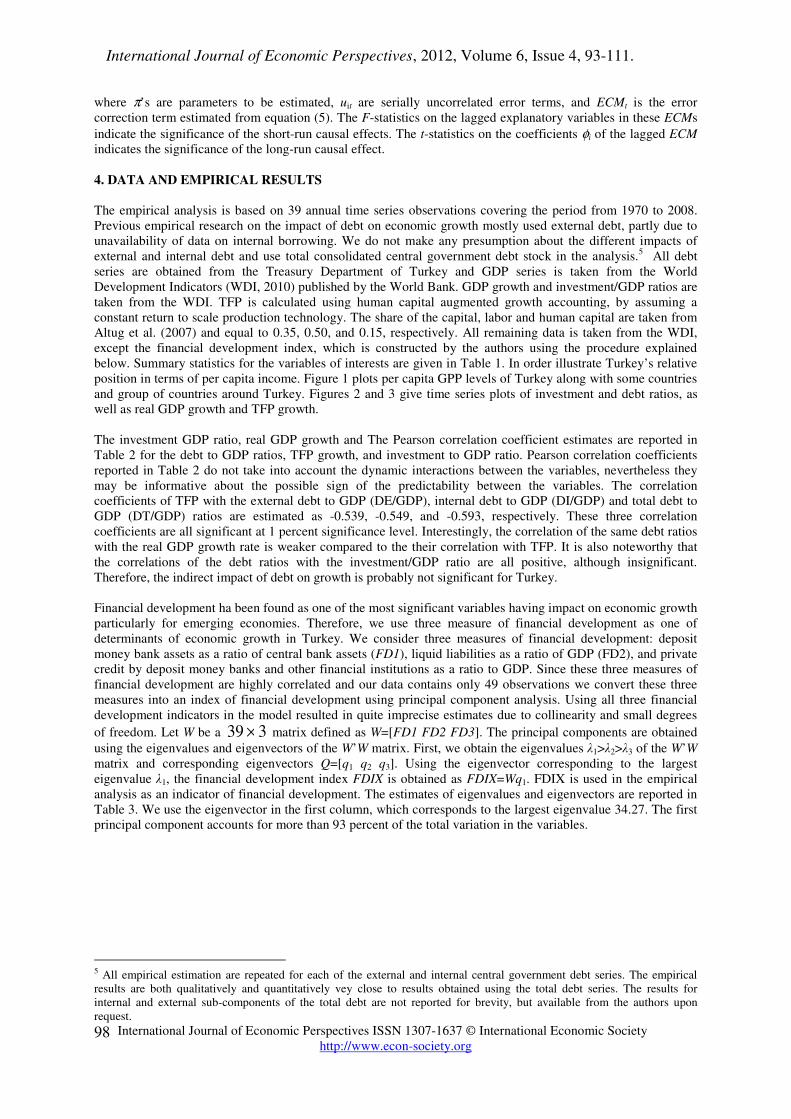
If a long-run relationship has been established in the first stage, the second stage uses a two-step procedure to
estimate the long-run relationship. In the first step, a conditional ARDL(p1,q1,…,qk) long-run model for TFP is
estimated as:
(3)
where all variables are as defined above and the lag lengths p1,q1,…,qk+1 are selected using the Akaike (AIC) or
Schwarz’s Bayesian (SBC) Information Criterion. The second step of the second stage of bounds testing ARDL
approach involves estimating a conditional ECM model. The conditional ECM model is specified as follows:
(4)
where λi, and θij are short-run parameters, ϑ is the speed of adjustment, which determines model’s convergence
to equilibrium, and the error-correction term ECMt is defined as
(5)
The long-run parameters in (5) are obtained from the OLS estimates of the conditional ARDL model in
equation (3) as follows:
, , i = 1, 2, …, k+1
We compute the standard errors of using the Delta-method.
Engle and Granger (1987) showed that if two I(1) series maintain a long-run levels relationship then there should
be a causal relationship at least in one direction. The direction of causality can be detected from the conditional
error-correction model. In our case, tests for Granger causality can be done using the following equations:
(6a)
(6b)
(6c)
the upper bound, and all regressors are I(0), the lower bound, but the critical values remain valid for a mixture of I(0)/I(1)
variables.
TFPt = c0 + α jTFPt− j
j=1
p1
∑ + θ1 j Dt− j
j=0
q1
∑ + θi+1, j Xi,t− j
j=0
qi+1
∑i=1
k
∑ + ′ψ Zt + ut
∆TFPt = µ + λ j∆TFPt− j
j=1
p
∑ + θ1 j ∆Dt− j
j=0
p
∑ + θi+1, j∆Xi,t− j
j=0
p
∑i=1
k
∑
+ϑECM t−1 + ′ψ Zt + ut
ECM t = TFPt − β0 − β1Dt − β j+1X j ,t−1
j =1
k
∑
ˆiβ
β0 = c0 1− αkk=1
p
∑( ) βi = θijj =0
qi
∑( ) 1− αkk=1
p
∑( )ˆ
iβ
∆TFPt = π10 + π11, j ∆TFPt− j
j =1
p
∑ + π12, j ∆Dt− j
j= j
p
∑ + π1,i+2, j∆Xi,t− j
j =1
p
∑i=1
k
∑ + ϕ1ECM t−1 + u1t
∆Dt = π 20 + π 21, j ∆TFPt− j
j=1
p
∑ + π 22, j ∆Dt− j
j = j
p
∑ + π 2,i+2, j ∆Xi,t− j
j=1
p
∑i=1
k
∑ + ϕ2ECM t−1 + u2 t
∆Xlt = π l+2,0 + π l+2,1, j ∆TFPt− j
j =1
p
∑ + π l+2,2, j ∆Dt− j
j= j
p
∑ + π l+2,i+2, j ∆Xi,t− j
j=1
p
∑i=1
k
∑
+ϕ l+2ECM t−1 + ul +2,t l = 1, 2,� ,k
International Journal of Economic Perspectives, 2012, Volume 6, Issue 4, 93-111.
International Journal of Economic Perspectives ISSN 1307-1637 © International Economic Society
http://www.econ-society.org
98
where π’s are parameters to be estimated, uit are serially uncorrelated error terms, and ECMt is the error
correction term estimated from equation (5). The F-statistics on the lagged explanatory variables in these ECMs
indicate the significance of the short-run causal effects. The t-statistics on the coefficients φi of the lagged ECM
indicates the significance of the long-run causal effect.
4. DATA AND EMPIRICAL RESULTS
The empirical analysis is based on 39 annual time series observations covering the period from 1970 to 2008.
Previous empirical research on the impact of debt on economic growth mostly used external debt, partly due to
unavailability of data on internal borrowing. We do not make any presumption about the different impacts of
external and internal debt and use total consolidated central government debt stock in the analysis.5 All debt
series are obtained from the Treasury Department of Turkey and GDP series is taken from the World
Development Indicators (WDI, 2010) published by the World Bank. GDP growth and investment/GDP ratios are
taken from the WDI. TFP is calculated using human capital augmented growth accounting, by assuming a
constant return to scale production technology. The share of the capital, labor and human capital are taken from
Altug et al. (2007) and equal to 0.35, 0.50, and 0.15, respectively. All remaining data is taken from the WDI,
except the financial development index, which is constructed by the authors using the procedure explained
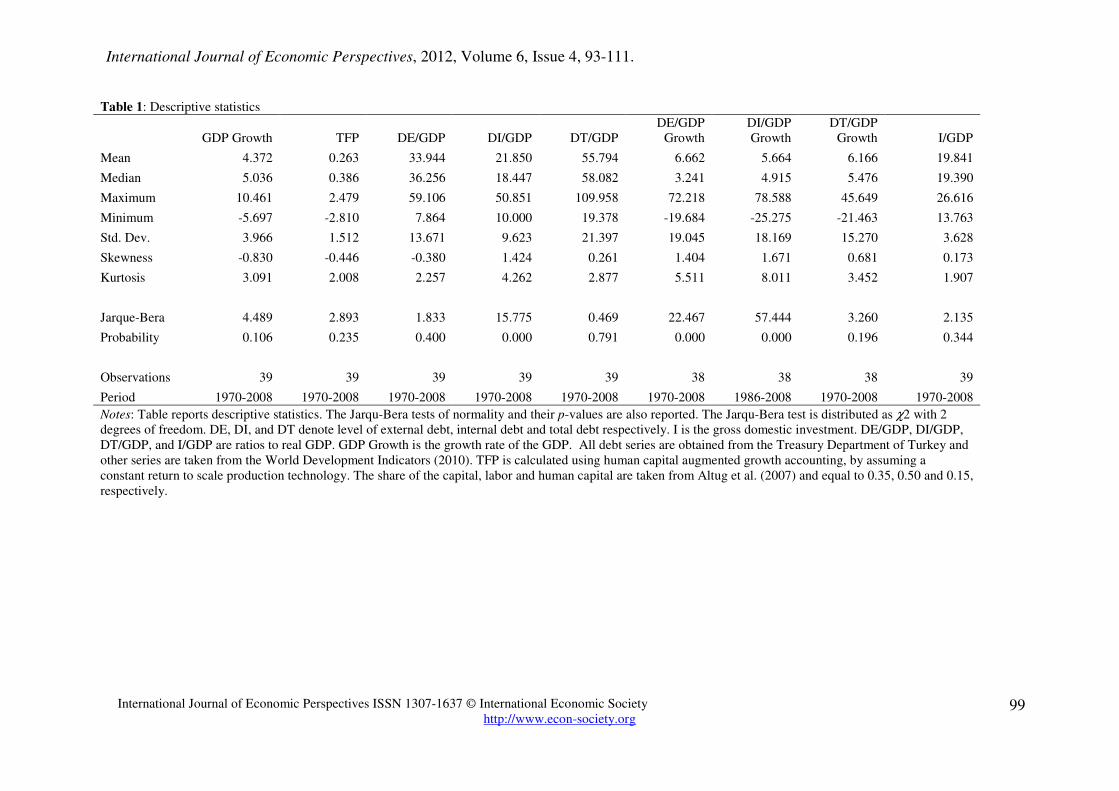
below. Summary statistics for the variables of interests are given in Table 1. In order illustrate Turkey’s relative
position in terms of per capita income. Figure 1 plots per capita GPP levels of Turkey along with some countries
and group of countries around Turkey. Figures 2 and 3 give time series plots of investment and debt ratios, as
well as real GDP growth and TFP growth.
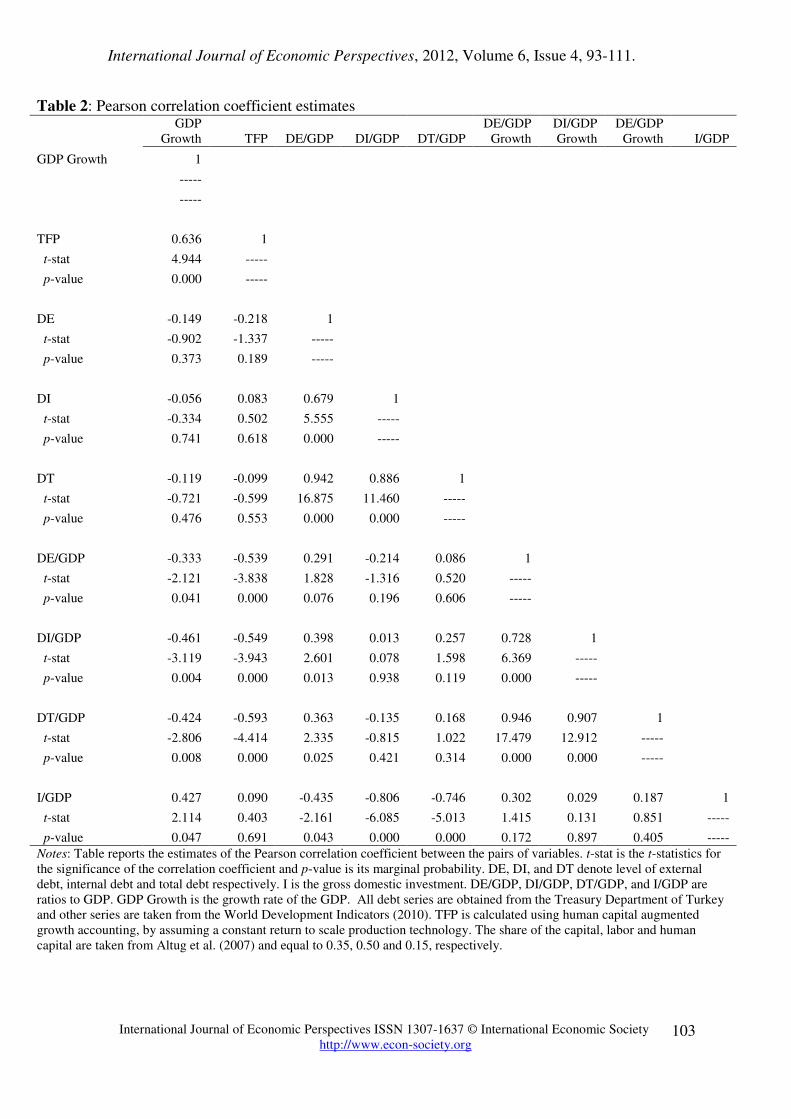
The investment GDP ratio, real GDP growth and The Pearson correlation coefficient estimates are reported in
Table 2 for the debt to GDP ratios, TFP growth, and investment to GDP ratio. Pearson correlation coefficients
reported in Table 2 do not take into account the dynamic interactions between the variables, nevertheless they
may be informative about the possible sign of the predictability between the variables. The correlation
coefficients of TFP with the external debt to GDP (DE/GDP), internal debt to GDP (DI/GDP) and total debt to
GDP (DT/GDP) ratios are estimated as -0.539, -0.549, and -0.593, respectively. These three correlation
coefficients are all significant at 1 percent significance level. Interestingly, the correlation of the same debt ratios
with the real GDP growth rate is weaker compared to the their correlation with TFP. It is also noteworthy that
the correlations of the debt ratios with the investment/GDP ratio are all positive, although insignificant.
Therefore, the indirect impact of debt on growth is probably not significant for Turkey.
Financial development ha been found as one of the most significant variables having impact on economic growth
particularly for emerging economies. Therefore, we use three measure of financial development as one of
determinants of economic growth in Turkey. We consider three measures of financial development: deposit
money bank assets as a ratio of central bank assets (FD1), liquid liabilities as a ratio of GDP (FD2), and private
credit by deposit money banks and other financial institutions as a ratio to GDP. Since these three measures of
financial development are highly correlated and our data contains only 49 observations we convert these three
measures into an index of financial development using principal component analysis. Using all three financial
development indicators in the model resulted in quite imprecise estimates due to collinearity and small degrees
of freedom. Let W be a 39 × 3 matrix defined as W=[FD1 FD2 FD3]. The principal components are obtained
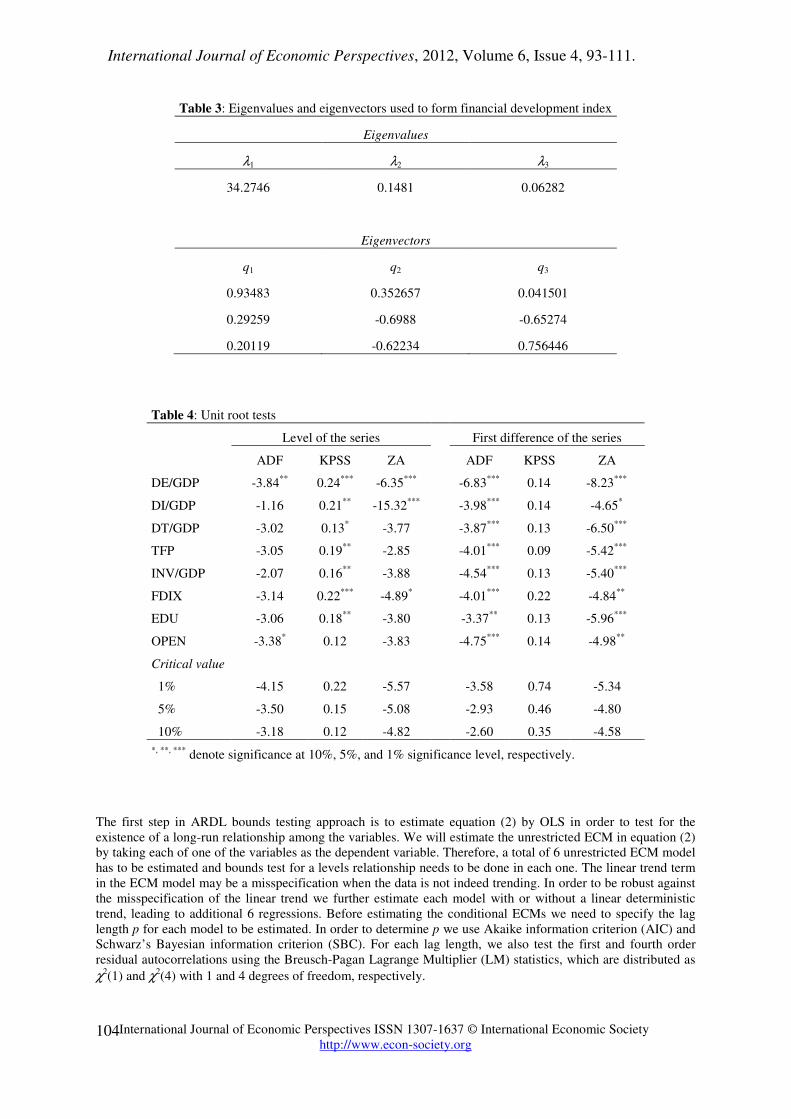
using the eigenvalues and eigenvectors of the W’W matrix. First, we obtain the eigenvalues λ1>λ2>λ3 of the W’W
matrix and corresponding eigenvectors Q=[q1 q2 q3]. Using the eigenvector corresponding to the largest
eigenvalue λ1, the financial development index FDIX is obtained as FDIX=Wq1. FDIX is used in the empirical
analysis as an indicator of financial development. The estimates of eigenvalues and eigenvectors are reported in
Table 3. We use the eigenvector in the first column, which corresponds to the largest eigenvalue 34.27. The first
principal component accounts for more than 93 percent of the total variation in the variables.
5 All empirical estimation are repeated for each of the external and internal central government debt series. The empirical
results are both qualitatively and quantitatively vey close to results obtained using the total debt series. The results for
internal and external sub-components of the total debt are not reported for brevity, but available from the authors upon
request.
International Journal of Economic Perspectives, 2012, Volume 6, Issue 4, 93-111.
International Journal of Economic Perspectives ISSN 1307-1637 © International Economic Society
http://www.econ-society.org
99
Table 1: Descriptive statistics
GDP Growth TFP DE/GDP DI/GDP DT/GDP
DE/GDP
Growth
DI/GDP
Growth
DT/GDP
Growth I/GDP
Mean 4.372 0.263 33.944 21.850 55.794 6.662 5.664 6.166 19.841
Median 5.036 0.386 36.256 18.447 58.082 3.241 4.915 5.476 19.390
Maximum 10.461 2.479 59.106 50.851 109.958 72.218 78.588 45.649 26.616
Minimum -5.697 -2.810 7.864 10.000 19.378 -19.684 -25.275 -21.463 13.763
Std. Dev. 3.966 1.512 13.671 9.623 21.397 19.045 18.169 15.270 3.628
Skewness -0.830 -0.446 -0.380 1.424 0.261 1.404 1.671 0.681 0.173
Kurtosis 3.091 2.008 2.257 4.262 2.877 5.511 8.011 3.452 1.907
Jarque-Bera 4.489 2.893 1.833 15.775 0.469 22.467 57.444 3.260 2.135
Probability 0.106 0.235 0.400 0.000 0.791 0.000 0.000 0.196 0.344
Observations 39 39 39 39 39 38 38 38 39
Period 1970-2008 1970-2008 1970-2008 1970-2008 1970-2008 1970-2008 1986-2008 1970-2008 1970-2008
Notes: Table reports descriptive statistics. The Jarqu-Bera tests of normality and their p-values are also reported. The Jarqu-Bera test is distributed as χ2 with 2
degrees of freedom. DE, DI, and DT denote level of external debt, internal debt and total debt respectively. I is the gross domestic investment. DE/GDP, DI/GDP,
DT/GDP, and I/GDP are ratios to real GDP. GDP Growth is the growth rate of the GDP. All debt series are obtained from the Treasury Department of Turkey and
other series are taken from the World Development Indicators (2010). TFP is calculated using human capital augmented growth accounting, by assuming a
constant return to scale production technology. The share of the capital, labor and human capital are taken from Altug et al. (2007) and equal to 0.35, 0.50 and 0.15,
respectively.
International Journal of Economic Perspectives, 2012, Volume 6, Issue 4, 93-111.
International Journal of Economic Perspectives ISSN 1307-1637 © International Economic Society
http://www.econ-society.org
100
Figure 1: Per capita GDP (current US dollars)
Notes: All data are in current US dollars and taken from World Development Indicators (2010).
0
5000
10000
15000
20000
25000
30000
35000
40000
45000
50000
High income: OECD Greece ItalyTurkey United Kingdom United StatesMiddle East & North Africa Germany
International Journal of Economic Perspectives, 2012, Volume 6, Issue 4, 93-111.
International Journal of Economic Perspectives ISSN 1307-1637 © International Economic Society
http://www.econ-society.org
101
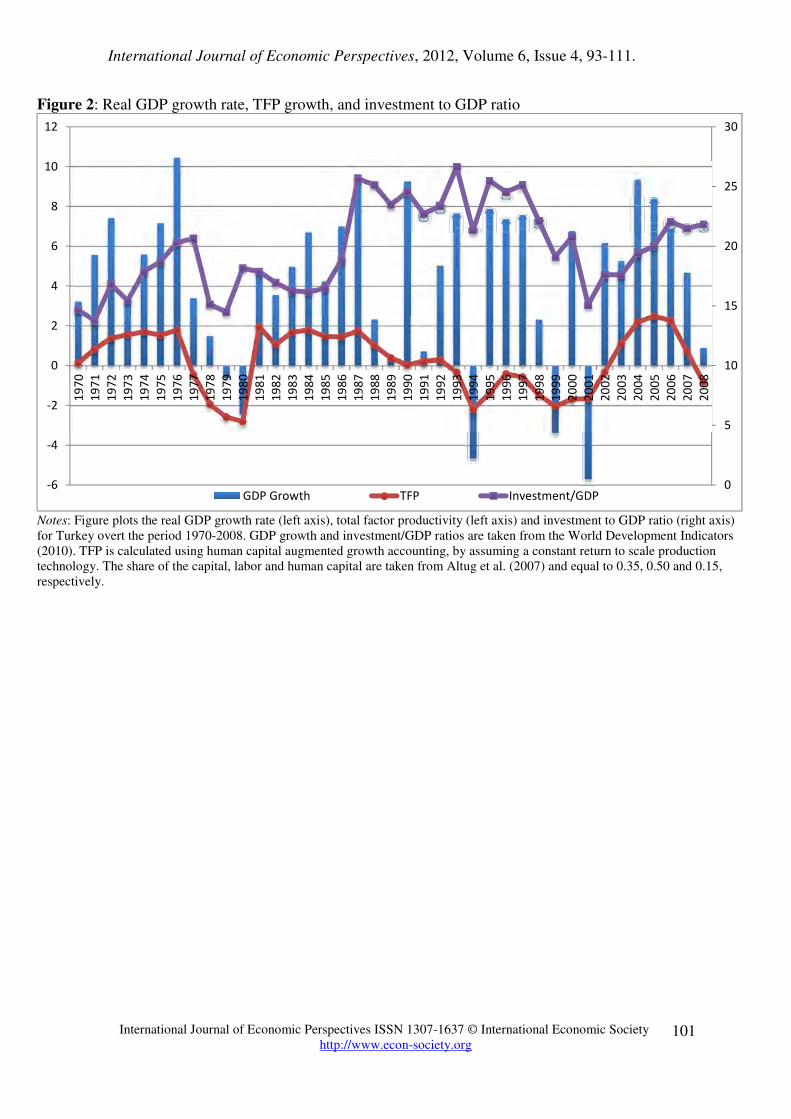
Figure 2: Real GDP growth rate, TFP growth, and investment to GDP ratio
Notes: Figure plots the real GDP growth rate (left axis), total factor productivity (left axis) and investment to GDP ratio (right axis)
for Turkey overt the period 1970-2008. GDP growth and investment/GDP ratios are taken from the World Development Indicators
(2010). TFP is calculated using human capital augmented growth accounting, by assuming a constant return to scale production
technology. The share of the capital, labor and human capital are taken from Altug et al. (2007) and equal to 0.35, 0.50 and 0.15,
respectively.
0
5
10
15
20
25
30
-6
-4
-2
0
2
4
6
8
10
12
19
70
19
71
19
72
19
73
19
74
19
75
19
76
19
77
19
78
19
79
19
80
19
81
19
82
19
83
19
84
19
85
19
86
19
87
19
88
19
89
19
90
19
91
19
92
19
93
19
94
19
95
19
96
19
97
19
98
19
99
20
00
20
01
20
02
20
03
20
04
20
05
20
06
20
07
20
08
GDP Growth TFP Investment/GDP
International Journal of Economic Perspectives, 2012, Volume 6, Issue 4, 93-111.
International Journal of Economic Perspectives ISSN 1307-1637 © International Economic Society
http://www.econ-society.org
102
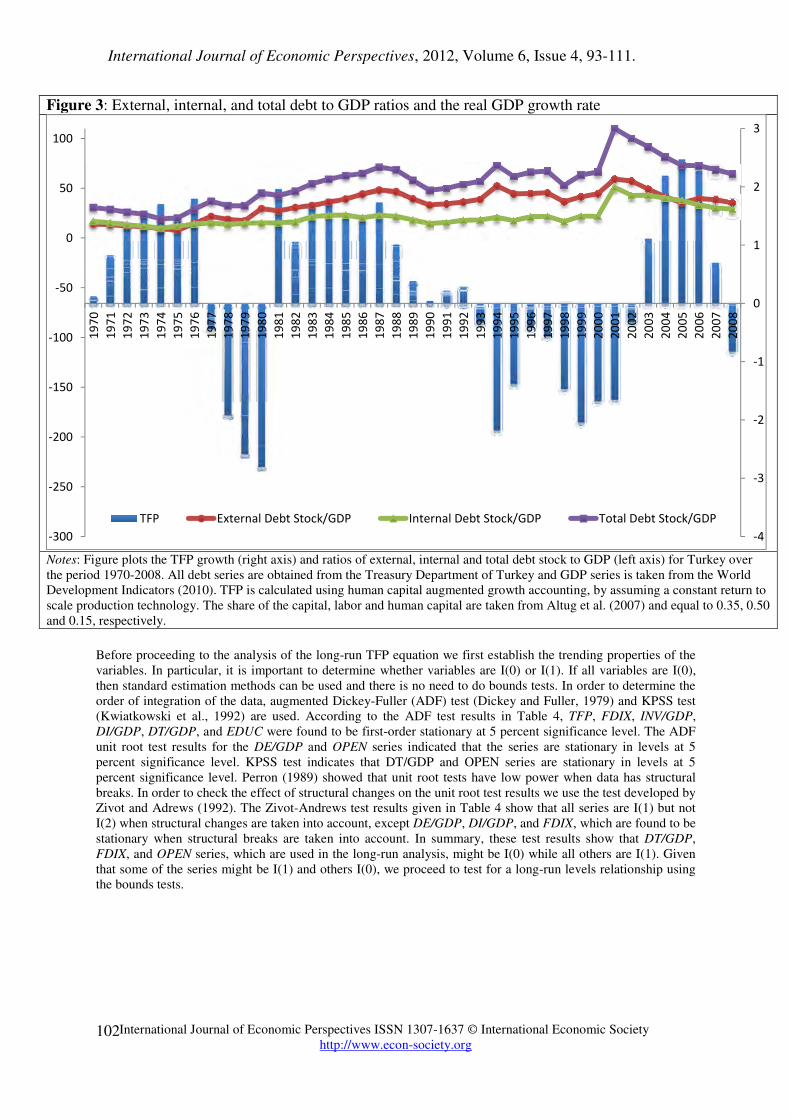
Figure 3: External, internal, and total debt to GDP ratios and the real GDP growth rate
Notes: Figure plots the TFP growth (right axis) and ratios of external, internal and total debt stock to GDP (left axis) for Turkey over
the period 1970-2008. All debt series are obtained from the Treasury Department of Turkey and GDP series is taken from the World
Development Indicators (2010). TFP is calculated using human capital augmented growth accounting, by assuming a constant return to
scale production technology. The share of the capital, labor and human capital are taken from Altug et al. (2007) and equal to 0.35, 0.50
and 0.15, respectively.
Before proceeding to the analysis of the long-run TFP equation we first establish the trending properties of the
variables. In particular, it is important to determine whether variables are I(0) or I(1). If all variables are I(0),
then standard estimation methods can be used and there is no need to do bounds tests. In order to determine the
order of integration of the data, augmented Dickey-Fuller (ADF) test (Dickey and Fuller, 1979) and KPSS test
(Kwiatkowski et al., 1992) are used. According to the ADF test results in Table 4, TFP, FDIX, INV/GDP,
DI/GDP, DT/GDP, and EDUC were found to be first-order stationary at 5 percent significance level. The ADF
unit root test results for the DE/GDP and OPEN series indicated that the series are stationary in levels at 5
percent significance level. KPSS test indicates that DT/GDP and OPEN series are stationary in levels at 5
percent significance level. Perron (1989) showed that unit root tests have low power when data has structural
breaks. In order to check the effect of structural changes on the unit root test results we use the test developed by
Zivot and Adrews (1992). The Zivot-Andrews test results given in Table 4 show that all series are I(1) but not
I(2) when structural changes are taken into account, except DE/GDP, DI/GDP, and FDIX, which are found to be
stationary when structural breaks are taken into account. In summary, these test results show that DT/GDP,
FDIX, and OPEN series, which are used in the long-run analysis, might be I(0) while all others are I(1). Given
that some of the series might be I(1) and others I(0), we proceed to test for a long-run levels relationship using
the bounds tests.
-300
-250
-200
-150
-100
-50
0
50
100
19
70
19
71
19
72
19
73
19
74
19
75
19
76
19
77
19
78
19
79
19
80
19
81
19
82
19
83
19
84
19
85
19
86
19
87
19
88
19
89
19
90
19
91
19
92
19
93
19
94
19
95
19
96
19
97
19
98
19
99
20
00
20
01
20
02
20
03
20
04
20
05
20
06
20
07
20
08
-4
-3
-2
-1
0
1
2
3
TFP External Debt Stock/GDP Internal Debt Stock/GDP Total Debt Stock/GDP
International Journal of Economic Perspectives, 2012, Volume 6, Issue 4, 93-111.
International Journal of Economic Perspectives ISSN 1307-1637 © International Economic Society
http://www.econ-society.org
103
Table 2: Pearson correlation coefficient estimates
GDP
Growth TFP DE/GDP DI/GDP DT/GDP
DE/GDP
Growth
DI/GDP
Growth
DE/GDP
Growth
I/GDP
GDP Growth 1
-----
-----
TFP 0.636 1
t-stat 4.944 -----
p-value 0.000 -----
DE -0.149 -0.218 1
t-stat -0.902 -1.337 -----
p-value 0.373 0.189 -----
DI -0.056 0.083 0.679 1
t-stat -0.334 0.502 5.555 -----
p-value 0.741 0.618 0.000 -----
DT -0.119 -0.099 0.942 0.886 1
t-stat -0.721 -0.599 16.875 11.460 -----
p-value 0.476 0.553 0.000 0.000 -----
DE/GDP -0.333 -0.539 0.291 -0.214 0.086 1
t-stat -2.121 -3.838 1.828 -1.316 0.520 -----
p-value 0.041 0.000 0.076 0.196 0.606 -----
DI/GDP -0.461 -0.549 0.398 0.013 0.257 0.728 1
t-stat -3.119 -3.943 2.601 0.078 1.598 6.369 -----
p-value 0.004 0.000 0.013 0.938 0.119 0.000 -----
DT/GDP -0.424 -0.593 0.363 -0.135 0.168 0.946 0.907 1
t-stat -2.806 -4.414 2.335 -0.815 1.022 17.479 12.912 -----
p-value 0.008 0.000 0.025 0.421 0.314 0.000 0.000 -----
I/GDP 0.427 0.090 -0.435 -0.806 -0.746 0.302 0.029 0.187 1
t-stat 2.114 0.403 -2.161 -6.085 -5.013 1.415 0.131 0.851 -----
p-value 0.047 0.691 0.043 0.000 0.000 0.172 0.897 0.405 -----
Notes: Table reports the estimates of the Pearson correlation coefficient between the pairs of variables. t-stat is the t-statistics for
the significance of the correlation coefficient and p-value is its marginal probability. DE, DI, and DT denote level of external
debt, internal debt and total debt respectively. I is the gross domestic investment. DE/GDP, DI/GDP, DT/GDP, and I/GDP are
ratios to GDP. GDP Growth is the growth rate of the GDP. All debt series are obtained from the Treasury Department of Turkey
and other series are taken from the World Development Indicators (2010). TFP is calculated using human capital augmented
growth accounting, by assuming a constant return to scale production technology. The share of the capital, labor and human
capital are taken from Altug et al. (2007) and equal to 0.35, 0.50 and 0.15, respectively.
International Journal of Economic Perspectives, 2012, Volume 6, Issue 4, 93-111.
International Journal of Economic Perspectives ISSN 1307-1637 © International Economic Society
http://www.econ-society.org
104
Table 3: Eigenvalues and eigenvectors used to form financial development index
Eigenvalues
λ1 λ2 λ3
34.2746 0.1481 0.06282
Eigenvectors
q1 q2 q3
0.93483 0.352657 0.041501
0.29259 -0.6988 -0.65274
0.20119 -0.62234 0.756446
Table 4: Unit root tests
Level of the series
First difference of the series
ADF KPSS ZA
ADF KPSS ZA
DE/GDP -3.84**
0.24***
-6.35***
-6.83***
0.14 -8.23***
DI/GDP -1.16 0.21**
-15.32***
-3.98***
0.14 -4.65*
DT/GDP -3.02 0.13* -3.77
-3.87
*** 0.13 -6.50
***
TFP -3.05 0.19**
-2.85
-4.01***
0.09 -5.42***
INV/GDP -2.07 0.16**
-3.88
-4.54***
0.13 -5.40***
FDIX -3.14 0.22***
-4.89*
-4.01
*** 0.22 -4.84
**
EDU -3.06 0.18**
-3.80
-3.37**
0.13 -5.96***
OPEN -3.38* 0.12 -3.83
-4.75
*** 0.14 -4.98
**
Critical value
1% -4.15 0.22 -5.57
-3.58 0.74 -5.34
5% -3.50 0.15 -5.08
-2.93 0.46 -4.80
10% -3.18 0.12 -4.82
-2.60 0.35 -4.58
*, **, *** denote significance at 10%, 5%, and 1% significance level, respectively.
The first step in ARDL bounds testing approach is to estimate equation (2) by OLS in order to test for the
existence of a long-run relationship among the variables. We will estimate the unrestricted ECM in equation (2)
by taking each of one of the variables as the dependent variable. Therefore, a total of 6 unrestricted ECM model
has to be estimated and bounds test for a levels relationship needs to be done in each one. The linear trend term
in the ECM model may be a misspecification when the data is not indeed trending. In order to be robust against
the misspecification of the linear trend we further estimate each model with or without a linear deterministic
trend, leading to additional 6 regressions. Before estimating the conditional ECMs we need to specify the lag
length p for each model to be estimated. In order to determine p we use Akaike information criterion (AIC) and
Schwarz’s Bayesian information criterion (SBC). For each lag length, we also test the first and fourth order
residual autocorrelations using the Breusch-Pagan Lagrange Multiplier (LM) statistics, which are distributed as
χ2(1) and χ2
(4) with 1 and 4 degrees of freedom, respectively.
International Journal of Economic Perspectives, 2012, Volume 6, Issue 4, 93-111.
International Journal of Economic Perspectives ISSN 1307-1637 © International Economic Society
http://www.econ-society.org
105
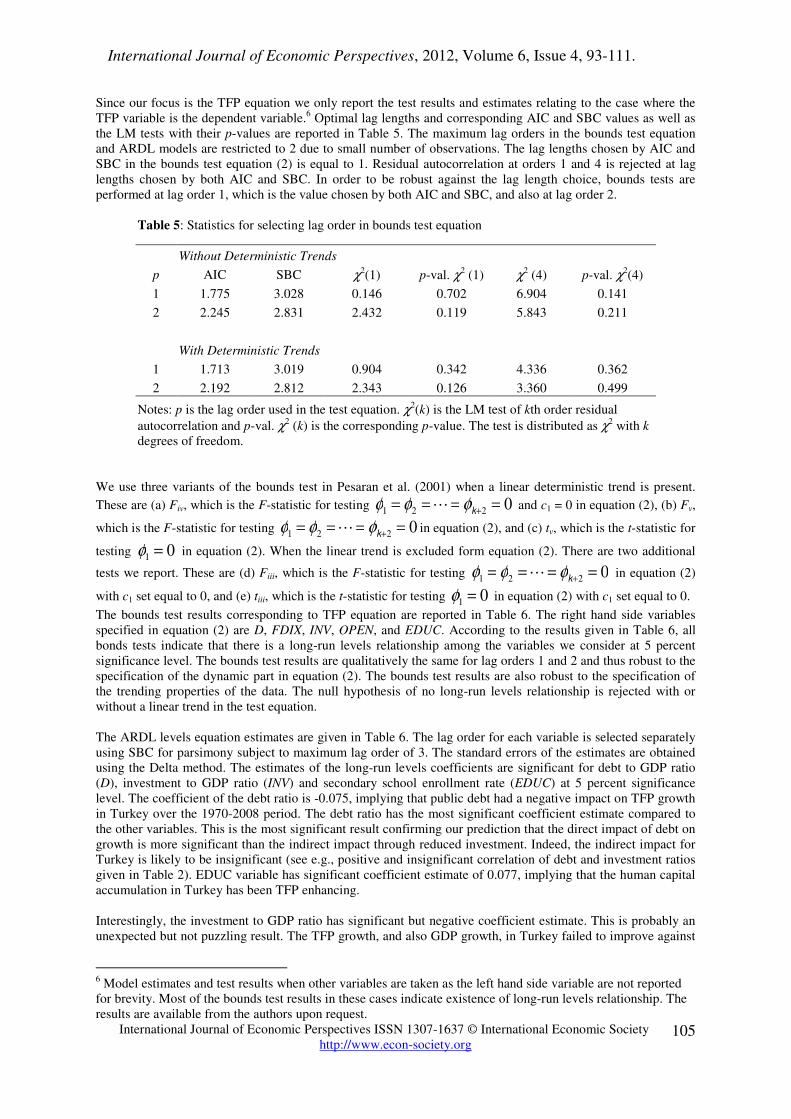
Since our focus is the TFP equation we only report the test results and estimates relating to the case where the
TFP variable is the dependent variable.6 Optimal lag lengths and corresponding AIC and SBC values as well as
the LM tests with their p-values are reported in Table 5. The maximum lag orders in the bounds test equation
and ARDL models are restricted to 2 due to small number of observations. The lag lengths chosen by AIC and
SBC in the bounds test equation (2) is equal to 1. Residual autocorrelation at orders 1 and 4 is rejected at lag
lengths chosen by both AIC and SBC. In order to be robust against the lag length choice, bounds tests are
performed at lag order 1, which is the value chosen by both AIC and SBC, and also at lag order 2.
Table 5: Statistics for selecting lag order in bounds test equation
Without Deterministic Trends
p AIC SBC χ2(1) p-val. χ2
(1) χ2 (4) p-val. χ2
(4)
1 1.775 3.028 0.146 0.702 6.904 0.141
2 2.245 2.831 2.432 0.119 5.843 0.211
With Deterministic Trends
1 1.713 3.019 0.904 0.342 4.336 0.362
2 2.192 2.812 2.343 0.126 3.360 0.499
Notes: p is the lag order used in the test equation. χ2(k) is the LM test of kth order residual
autocorrelation and p-val. χ2 (k) is the corresponding p-value. The test is distributed as χ2
with k
degrees of freedom.
We use three variants of the bounds test in Pesaran et al. (2001) when a linear deterministic trend is present.
These are (a) Fiv, which is the F-statistic for testing and c1 = 0 in equation (2), (b) Fv,
which is the F-statistic for testing in equation (2), and (c) tv, which is the t-statistic for
testing in equation (2). When the linear trend is excluded form equation (2). There are two additional
tests we report. These are (d) Fiii, which is the F-statistic for testing in equation (2)
with c1 set equal to 0, and (e) tiii, which is the t-statistic for testing in equation (2) with c1 set equal to 0.
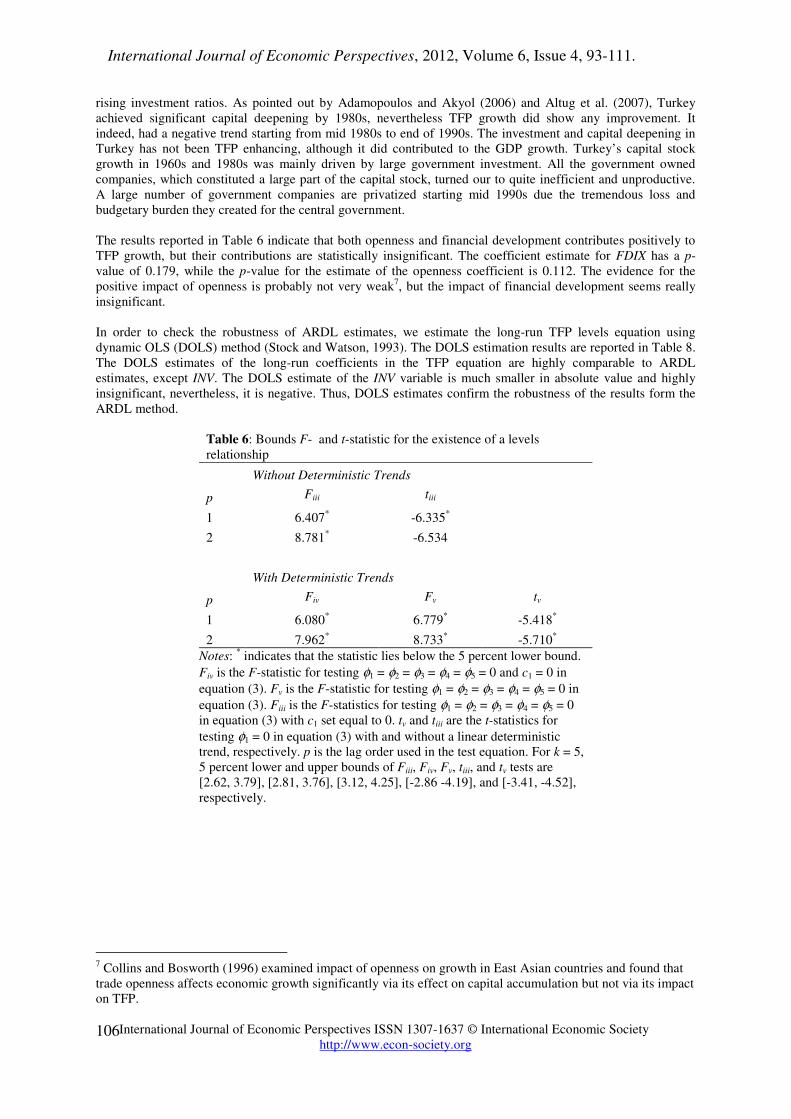
The bounds test results corresponding to TFP equation are reported in Table 6. The right hand side variables
specified in equation (2) are D, FDIX, INV, OPEN, and EDUC. According to the results given in Table 6, all
bonds tests indicate that there is a long-run levels relationship among the variables we consider at 5 percent
significance level. The bounds test results are qualitatively the same for lag orders 1 and 2 and thus robust to the
specification of the dynamic part in equation (2). The bounds test results are also robust to the specification of
the trending properties of the data. The null hypothesis of no long-run levels relationship is rejected with or
without a linear trend in the test equation.
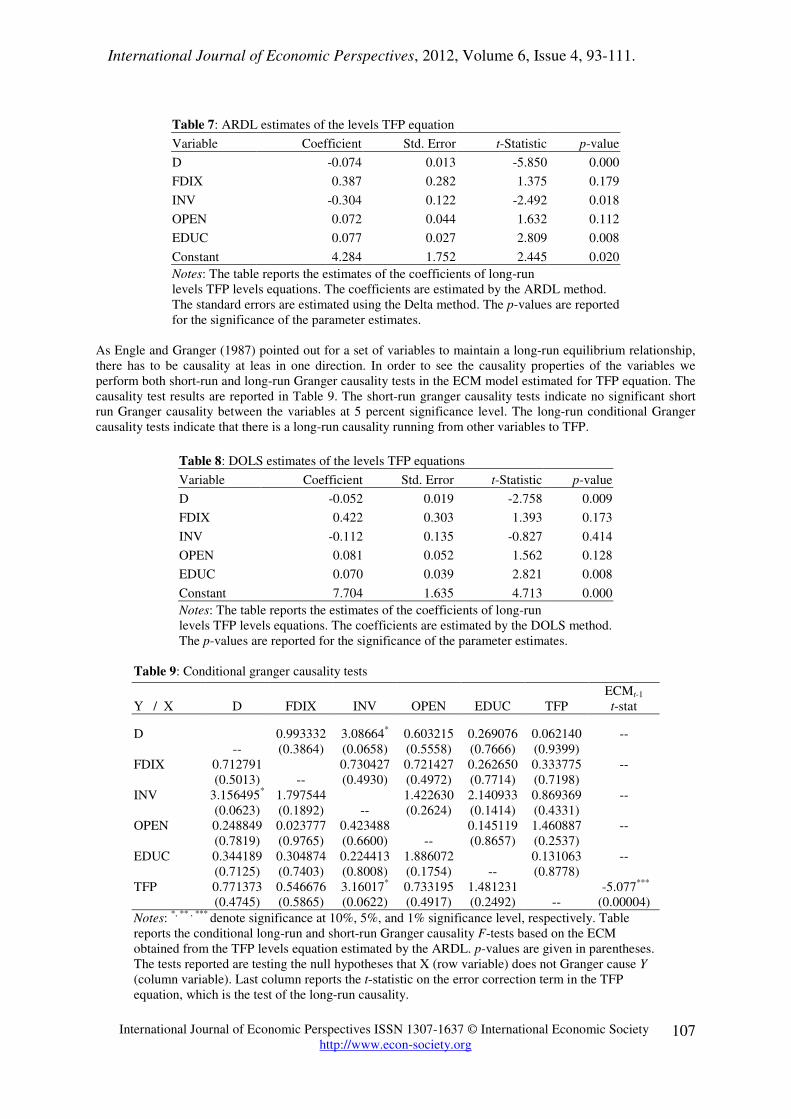
The ARDL levels equation estimates are given in Table 6. The lag order for each variable is selected separately
using SBC for parsimony subject to maximum lag order of 3. The standard errors of the estimates are obtained
using the Delta method. The estimates of the long-run levels coefficients are significant for debt to GDP ratio
(D), investment to GDP ratio (INV) and secondary school enrollment rate (EDUC) at 5 percent significance
level. The coefficient of the debt ratio is -0.075, implying that public debt had a negative impact on TFP growth
in Turkey over the 1970-2008 period. The debt ratio has the most significant coefficient estimate compared to
the other variables. This is the most significant result confirming our prediction that the direct impact of debt on
growth is more significant than the indirect impact through reduced investment. Indeed, the indirect impact for
Turkey is likely to be insignificant (see e.g., positive and insignificant correlation of debt and investment ratios
given in Table 2). EDUC variable has significant coefficient estimate of 0.077, implying that the human capital
accumulation in Turkey has been TFP enhancing.
Interestingly, the investment to GDP ratio has significant but negative coefficient estimate. This is probably an
unexpected but not puzzling result. The TFP growth, and also GDP growth, in Turkey failed to improve against
6 Model estimates and test results when other variables are taken as the left hand side variable are not reported
for brevity. Most of the bounds test results in these cases indicate existence of long-run levels relationship. The
results are available from the authors upon request.
φ1 = φ2 =L= φk+2 = 0
φ1 = φ2 =L= φk+2 = 0
φ1 = 0
φ1 = φ2 =L= φk+2 = 0
φ1 = 0
International Journal of Economic Perspectives, 2012, Volume 6, Issue 4, 93-111.
International Journal of Economic Perspectives ISSN 1307-1637 © International Economic Society
http://www.econ-society.org
106
rising investment ratios. As pointed out by Adamopoulos and Akyol (2006) and Altug et al. (2007), Turkey
achieved significant capital deepening by 1980s, nevertheless TFP growth did show any improvement. It
indeed, had a negative trend starting from mid 1980s to end of 1990s. The investment and capital deepening in
Turkey has not been TFP enhancing, although it did contributed to the GDP growth. Turkey’s capital stock
growth in 1960s and 1980s was mainly driven by large government investment. All the government owned
companies, which constituted a large part of the capital stock, turned our to quite inefficient and unproductive.
A large number of government companies are privatized starting mid 1990s due the tremendous loss and
budgetary burden they created for the central government.
The results reported in Table 6 indicate that both openness and financial development contributes positively to
TFP growth, but their contributions are statistically insignificant. The coefficient estimate for FDIX has a p-
value of 0.179, while the p-value for the estimate of the openness coefficient is 0.112. The evidence for the
positive impact of openness is probably not very weak7, but the impact of financial development seems really
insignificant.
In order to check the robustness of ARDL estimates, we estimate the long-run TFP levels equation using
dynamic OLS (DOLS) method (Stock and Watson, 1993). The DOLS estimation results are reported in Table 8.
The DOLS estimates of the long-run coefficients in the TFP equation are highly comparable to ARDL
estimates, except INV. The DOLS estimate of the INV variable is much smaller in absolute value and highly
insignificant, nevertheless, it is negative. Thus, DOLS estimates confirm the robustness of the results form the
ARDL method.
Table 6: Bounds F- and t-statistic for the existence of a levels
relationship
Without Deterministic Trends
p Fiii tiii
1 6.407* -6.335
*
2 8.781* -6.534
With Deterministic Trends
p Fiv Fv tv
1 6.080* 6.779
* -5.418
*
2 7.962* 8.733
* -5.710
*
Notes: * indicates that the statistic lies below the 5 percent lower bound.
Fiv is the F-statistic for testing φ1 = φ2 = φ3 = φ4 = φ5 = 0 and c1 = 0 in
equation (3). Fv is the F-statistic for testing φ1 = φ2 = φ3 = φ4 = φ5 = 0 in
equation (3). Fiii is the F-statistics for testing φ1 = φ2 = φ3 = φ4 = φ5 = 0
in equation (3) with c1 set equal to 0. tv and tiii are the t-statistics for
testing φ1 = 0 in equation (3) with and without a linear deterministic
trend, respectively. p is the lag order used in the test equation. For k = 5,
5 percent lower and upper bounds of Fiii, Fiv, Fv, tiii, and tv tests are
[2.62, 3.79], [2.81, 3.76], [3.12, 4.25], [-2.86 -4.19], and [-3.41, -4.52],
respectively.
7 Collins and Bosworth (1996) examined impact of openness on growth in East Asian countries and found that
trade openness affects economic growth significantly via its effect on capital accumulation but not via its impact
on TFP.
International Journal of Economic Perspectives, 2012, Volume 6, Issue 4, 93-111.
International Journal of Economic Perspectives ISSN 1307-1637 © International Economic Society
http://www.econ-society.org
107
Table 7: ARDL estimates of the levels TFP equation
Variable Coefficient Std. Error t-Statistic p-value
D -0.074 0.013 -5.850 0.000
FDIX 0.387 0.282 1.375 0.179
INV -0.304 0.122 -2.492 0.018
OPEN 0.072 0.044 1.632 0.112
EDUC 0.077 0.027 2.809 0.008
Constant 4.284 1.752 2.445 0.020
Notes: The table reports the estimates of the coefficients of long-run
levels TFP levels equations. The coefficients are estimated by the ARDL method.
The standard errors are estimated using the Delta method. The p-values are reported
for the significance of the parameter estimates.
As Engle and Granger (1987) pointed out for a set of variables to maintain a long-run equilibrium relationship,
there has to be causality at leas in one direction. In order to see the causality properties of the variables we
perform both short-run and long-run Granger causality tests in the ECM model estimated for TFP equation. The
causality test results are reported in Table 9. The short-run granger causality tests indicate no significant short
run Granger causality between the variables at 5 percent significance level. The long-run conditional Granger
causality tests indicate that there is a long-run causality running from other variables to TFP.
Table 8: DOLS estimates of the levels TFP equations
Variable Coefficient Std. Error t-Statistic p-value
D -0.052 0.019 -2.758 0.009
FDIX 0.422 0.303 1.393 0.173
INV -0.112 0.135 -0.827 0.414
OPEN 0.081 0.052 1.562 0.128
EDUC 0.070 0.039 2.821 0.008
Constant 7.704 1.635 4.713 0.000
Notes: The table reports the estimates of the coefficients of long-run
levels TFP levels equations. The coefficients are estimated by the DOLS method.
The p-values are reported for the significance of the parameter estimates.
Table 9: Conditional granger causality tests
Y / X D FDIX INV OPEN EDUC TFP
ECMt-1
t-stat
D
--
0.993332
(0.3864)
3.08664*
(0.0658)
0.603215
(0.5558)
0.269076
(0.7666)
0.062140
(0.9399)
--
FDIX 0.712791
(0.5013) --
0.730427
(0.4930)
0.721427
(0.4972)
0.262650
(0.7714)
0.333775
(0.7198)
--
INV 3.156495*
(0.0623)
1.797544
(0.1892) --
1.422630
(0.2624)
2.140933
(0.1414)
0.869369
(0.4331)
--
OPEN 0.248849
(0.7819)
0.023777
(0.9765)
0.423488
(0.6600) --
0.145119
(0.8657)
1.460887
(0.2537)
--
EDUC 0.344189
(0.7125)
0.304874
(0.7403)
0.224413
(0.8008)
1.886072
(0.1754) --
0.131063
(0.8778)
--
TFP 0.771373
(0.4745)
0.546676
(0.5865)
3.16017*
(0.0622)
0.733195
(0.4917)
1.481231
(0.2492) --
-5.077***
(0.00004)
Notes: *, ** , ***
denote significance at 10%, 5%, and 1% significance level, respectively. Table
reports the conditional long-run and short-run Granger causality F-tests based on the ECM
obtained from the TFP levels equation estimated by the ARDL. p-values are given in parentheses.
The tests reported are testing the null hypotheses that X (row variable) does not Granger cause Y
(column variable). Last column reports the t-statistic on the error correction term in the TFP
equation, which is the test of the long-run causality.
International Journal of Economic Perspectives, 2012, Volume 6, Issue 4, 93-111.
108
As Adamopoulos and Akyol (2006) forcefully underlines Turkey is “an interesting case study of relative
stagnation” because it is the only founding member of the OECD that lagged behind western economies in
terms of per capita GDP since 1950 (see Figure 1). Starting from the early modernization of the country in
1930s, Turkey has been the member of Western international organizations and adopted Western institutions for
several decades. Adamopoulos and Akyol (2006) point out that relative stagnation and continuing low standard
of living in Turkey has not been due to capital deepening. Indeed, Turkey enjoyed large external borrowing and
foreign aid since 1960s and has experienced a strong capital accumulation until 1980s. As Figure 2 illustrates
Turkey’s capital formation to GDP ratio was about 6 percent at the end of 1980s and external debt stock was
about 20 percent of its GDP in 1979. There was brief period from 1976 to 1984 due to political instability where
Turkey had lower capital growth rates, averaging to 4 percent of the GDP over this period. The growth
accounting calculations by Adamopoulos and Akyol (2006) and Altug et al. (2007) show that Turkey’s poor
growth was not indeed due to low capital growth, rather it was mainly result of low growth of TFP and
declining labor force participation rates. Our calculations, shown in Figure 1, also confirm their results. The TFP
growth in Turkey did not exceed 2 percent from 1970 to 1977, and indeed was negative from 1979 to 1981 and
also from 1993 to 2003. Saygili et al. (2001) also confirm low TFP growth for Turkey. Indeed, they find that
TFP growth is -0.29 percent for the period 1972-1979. Altug et al. (2007) investigates the sources of growth in
Turkey over the period 1880-2005 and reach a similar conclusion. By using a two sector model with human
capital, they found that TFP growth was as low as 0.64 percent for Turkey over the period 1950-2005. Altug et
al. (2007) concludes that economic growth in Turkey for the post-1950 era is primarily driven by capital
accumulation and labor force, while the contribution from TFP was quite negligible. Our calculations based on
growth accounting of the aggregate economy show that the average TFP growth in Turkey for the period 1970-
2008 is 0.27 percent (see Table 1 and Figure 2). The results obtained in this study, rigorously prove the point
raised in Adamopoulos and Akyol (2006) and Altug et al. (2007), but further shows that a major cause of low
TFP growth in Turkey is high debt ratio.
Although, low TFP growth explains Turkey’s inability to close the income gap with developed economies and
particularly with OECD countries, the causes of low TFP growth in Turkey have not been examined in the
literature. Figure 2 shows that TFP growth in Turkey have been historically low and fluctuated below 2 percent
over the 1970-2004 period. Only for three consecutive years during 2004-2006, TFP growth exceeded 2 percent
with a maximum of 2.47 in 2005. Investment to GDP ratio in Turkey have been 8 to 10 percent between 1986
and 2000. Interestingly, this period is also prolonged low TFP years in Turkey. Indeed, TFP was negative
between 1993 and 2003. As the numbers rigorously show, this period is a lost decade for Turkey. In Figure 3,
we plot the external debt to GDP ratio, internal debt to GDP ratio, and total debt (to GDP ratio for the period
1970-2008. The average total debt ratio was 55.79 percent, but remained mostly above 50 percent after 1987.
External and internal debt ratios for the sample period averaged to 33.94 and 21.85 percent, respectively.
Historically, Turkey’s external debt has always exceeded its internal debt since 1976. Bauerfreund (1989)
examines impact of both internal and external debt on growth in Turkey and concludes that they both reduced
growth via debt overhang. We do not have any significant evidence to support the indirect impact via debt
overhang, but our results strongly supports the direct negative impact on TFP. Turkey had three major financial
and currency crises covered in our sample, namely in 1980, 1994, and 2001. Figure 3 shows that debt ratios
have reached historical record levels before all these crises and TFP growth significantly reduced mostly
becoming negative for prolonged periods after these crises. The total debt ration exceeded 60 percent in 1985
and stayed at high levels since then. The TFP growth in Turkey continuously fell from 1985 to 2002. In each of
the three major crises in Turkey, which seems to trigger not only low GDP growth but also low TFP growth,
high debt was a major cause. High foreign debt services in these periods drained large amounts of foreign
currency and raised interest rates. Turkey had to change its fixed exchange rate system in the first crises,
switched to pegged exchange rate in 1994, and finally adopted floating exchange rate system in 2001. As
observed form Figure 2, declined investment does not seem to be a cause of low growth in Turkey. Indeed,
investment GDP ratio was at highest levels from 1985 to 1997. As our estimates profoundly reveals, Turkey’s
capital deepening was significant but not productivity enhancing. Uncertainties, delayed reforms and poor
investment all caused by high debt are likely causes of deprived TFP growth in Turkey.
5. CONCLUSION
When many developing countries were undertaking significant external debt in 1960s most economists and
international organizations were highly sympathetic about it. International organizations, such at the IMF, the
World Bank, and the UNDP, did even served as creditors and initiated projects that are hoped to help these
nations break the vicious circle of low growth. The hope was that the debt would be a relief to low saving rates
in developing nations, investment in productive projects financed by external debt would in the long-run put
these nation into a faster growth path, increase savings and enough resources could be created to repay the debt
International Journal of Economic Perspectives, 2012, Volume 6, Issue 4, 93-111.
109
in the long-run. Although, benefits of debt to some certain threshold level cannot be denied, highly indebted
nations have experienced frequent debt crises and these crises triggered long periods of stagnation. The debt
overhang theories are developed to explain that debt may harm growth beyond a certain threshold. There are
two ways debt can harm growth, an indirect channel that works through reduced investment and a direct channel
with negative impact on TFP. Most studies examined the indirect channel and the evidence by now can best be
described as mixed, if not confusing. There are only a few empirical studies examining the impact of debt on
TFP. Turkey serves probably the best case study of highly indebted low growth country with historically
sufficient capital deepening and high investment. To our knowledge, there is no study in the literature that
examines the causes of low TFP growth in Turkey. Our study is a first attempt on the topic. The major focus of
this study was to investigate whether public debt has adverse effects on productivity in Turkey.
We have shown that public debt has a significant negative direct impact on TFP growth in Turkey. Among a set
of variables that are expected to influence TFP, the debt to GDP ratio is estimated to have the highest statistical
significance. Moreover, the evidence on the indirect effect of debt is very weak for Turkey. Indeed, Turkey
recently achieved reasonably high investment to GDP rates, nevertheless, its growth rate did not improve. Our
results show that high debt in Turkey influences growth through the direct channel, i.e., by reducing TFP.
Unlike previous studies, we did not estimate a nonlinear relationship to discriminate between low-level and
high-level debt ratios, thus, a threshold is also not estimated. The results obtained in this study take into account
the dynamic links between the variables and also controls for the impact of other factors, but are linear in its
nature. Our results show that a 1 percentage point increase in debt to GDP ratio lowers the TFP growth by
0.074 percentage point. Assuming a debt overhang threshold of 35 percent (see, Pattillo et al., 2002) and a total
debt to GDP ratio of 70 percent—the average level in recent years—the loss in TFP growth amounts to 2.59
percent per year in Turkey. The cost of delayed reforms, poor investment projects, reduced public spending on
infrastructure and education, etc., all linked closely to high debt levels continuing for decades, seems
tremendous for Turkey.
In terms of policy implications, our results imply that, at least for Turkey, reducing debt level will boost
economic growth by improving TFP and direct resources to more productive investment projects. Moreover,
there does not seem to be a significant indirect impact on growth through investment. Reducing debt level in
Turkey should indeed not reduce investment, rather it will boost productive capital accumulation. There are, of
course, conditions for the expected effects from debt reduction to be realized. Government should maintain
macroeconomic and political stability and should make necessary reforms, if needed. The debt reduction should
not be at the expense of reduced infrastructure investment that enhances private sector’s productivity. As debt
level is gradually reduced, the debt services will be less binding and more resources will indeed be available.
Turkey still has many ineffective and unproductive government companies involved in productive activities that
should be left to private sector. Privatization of these unproductive companies will reduce the debt requirement
and lighten the budgetary demand on the central governments. These reforms will additionally help to reduce
public debt and eliminate uncertainties.
REFERENCES
Adamopoulos, T., Akyol, A. (2006). “Relative Stagnation alla Turca,” York University, Department of
Economics, Toronto.
Altug, S., Filiztekin, A., Pamuk, S. (2007). “The Sources of Long-Term Economic Growth for Turkey, 1880-
2005”, Discussion Paper No. 6463, Centre For Economic Policy Research, September 2007.
Arrow, K. J., Kurz, M. (1970). Public investment, the rate of return, and optimal fiscal policy. Baltimore: John
Hopkins Press.
Avramovic, D. (1964). Economic Growth and External Debt. The Johns Hopkins Press, Baltimore.
Bauerfreund, Ohad. (1989). “External Debt and Economic Growth: A Computable General Equilibrium Case
Study of Turkey 1985-1986”, Duke University Ph.D. Thesis.
Bosworth, B., Collins, S. (2003). “The Empirics of Growth: An Update,” Brookings Papers on Economic
Activity 34, 113-206.
Clements, B., Bhattacharya, R., Nguyen, T.Q. (2003). “External debt, public investment, and growth in low-
income countries,” IMF Working Paper 249. IMF, Washington, DC.
International Journal of Economic Perspectives, 2012, Volume 6, Issue 4, 93-111.
110
Cohen, Daniel. (1989). “How to Cope with a Debt Overhang: Cut Flows Rather Than Stocks.” Dealing with the
Debt Crisis. Washington, D.C. (World Bank Discussion Papers.)
Cohen, Daniel. (1992). “Large external debt and (slow) domestic growth: a theoretical analysis,” Journal of
Economic Dynamics and Control 19, 1141–1163.
Cohen, Daniel. (1993). “Low Investment and Large LDC Debt in the 1980's”, The American Economic Review
83, 437-449.
Collins, Susan M., Bosworth, Barry P. (1996). “Economic Growth in East Asia: Accumulation versus
Assimilation,” Brookings Papers on Economic Activity 27, 135–91.
Cordella, T., Ricci, L.A., Ruiz-Arranz, M. (2005). “Debt overhang or debt irrelevance? Revisiting the debt-
growth link,” IMF Working Paper 05/223. IMF, Washington, DC.
Corden, W. Max. (1989). “Debt Relief and Adjustment Incentives.” In Analytical Issues inDebt, edited by Jacob
A. Frenkel, Michael P. Dooley, and P.Wickam. International Monetary Fund.
Denison, Edward. F. (1962). “The Sources of Economic Growth in the United States and the Alternatives
Before Us,” Supplementary Paper No. 13, New York, Committee for Economic Development.
Deshpande, Ashwini. (1990). “The Debt Overhang and the Disincentive to Invest”, Journal of Development
Economics 52, 169-187.
Dickey, D. and Fuller, W. (1979). “Distribution of the estimators for autoregressive time series with a unit root,”
Journal of the American Statistical Association 74, 427-431.
Elbadawi, Ibrahim, Ndulu, Benno, Ndung’u, Njuguna. (1997). “Debt Overhang and Economic Growth in Sub-
Saharan Africa,” in External Finance for Low-Income Countries, ed. by Iqbal, Zubair and Ravi Kanbur
(Washington: IMF Institute), pp. 49- 76.
Engle, R. F., Granger, C. W. J. (1987). “Cointegration and Error Correction Representation: Estimation and
Testing,” Econometrica 55, 251-276.
Feldstein, Martin. (1986). “International Debt Service and Economic Growth: Some Simple Analytics”,
National Bureau of Economic Research, No. 2076.
Fischer, Stanley. (1993). “The Role of Macroeconomic Factors in Growth,” Journal of Monetary Economics 32,
485–512.
Fosu, A.K. (1996). “The impact of external debt on economic growth in sub-Saharan Africa,” Journal of
Economic Development 21, 93–118.
Fosu, A.K. (1999). “The external debt burden and economic growth in the 1980s: evidence from sub-Saharan
Africa,” Canadian Journal of Development Studies 20, 307–318.
Fosu, A.K. (2008). “Implications of the external debt-servicing constraint for public health expenditure in sub-
Saharan Africa,” Oxford Development Studies 36, 364–377.
Froot, Kennneth. (1989). “Buybacks, Exit Bonds, and the Optimality of Debt and Liquidity Relief,”
International Economic Review 30, 49-70.
Johansen, S. (1988). “Statistical Analysis of Cointegrating Vectors,” Journal of Economic Dynamic and Control
12, 231-254.
Jorgenson, Dale W., Griliches, Zvi. (1967). “The Explanation of Productivity Change.” The Review of
Economic Studies 34: 249-280.
International Journal of Economic Perspectives, 2012, Volume 6, Issue 4, 93-111.
111
Kwiatkowski, D., Phillips, P., Schmidt, P. and Shin, Y. (1992). “Testing the null hypothesis of stationarity
against the alternative of a unit root,” Journal of Econometrics 54, 159-178.
Krugman, Paul. (1988). “Financing vs. Forgiving a Debt Overhang,” Journal of Development Economics 29,
253-268.
Lucas, R.E. (1988). “On the mechanics of economic development,” Journal of Monetary Economics 22, 3–42.
Pattillo, C., Poirson, H., Ricci, L. (2002). “External debt and growth,” IMF Working Paper WP/02/69. IMF,
Washington, DC.
Pattillo, C., Poirson, H., Ricci, L., Kraay, A., Rigobon. R. (2003). “Through What Channels Does External Debt
Affect Growth?” Brookings Trade Forum 2003: 229-277.
Perron, Pierre. (1989). “The Great Crash, the Oil Price Shock, and the Unit Root Hypothesis,” Econometrica 57,
1361-1401.
Pesaran, M. H., Shin, Y. (1999). “An Autoregressive Distributed Lag Modeling Approach to Cointegration
Analysis.” In Strom, S. (Ed.), Econometrics and Economic Theory in the 20th Century: The Ragnar Frisch
Centennial Symposium (pp. 371-413), Cambridge: Cambridge University Press.
Pesaran, M. H., Shin, Y., Smith, R. (2001). “Bounds Testing Approaches to the Analysis of Level
Relationships,” Journal of Applied Econometrics 16, 289-326.
Rebelo, S. (1991). “Long-run policy analysis and long-run growth,” Journal of Political Economy 99, 500–521.
Reinhart, C, K Rogoff, and M Savastano. (2003), “Debt Intolerance,” Brookings Papers on Economic Activity
34, 1-74.
Rockerbie, Duane W. (1994). “Did Debt Crisis Cause the Investment Crisis? Further Evidence”, Applied
Economics 26, 731-738.
Sachs, Jeffrey. (1989). “Efficient Debt Reduction,” Dealing with the Debt Crisis. Washington, D.C. (World
Bank Discussion Papers.)
Savvides, Andreas. (1992). “Investment Slowdown in Developing Countries During the 1980s: Debt Overhang
Or Foreign Capital Inflows”, Kyklos 3, 363-378.
Saygili, S., Cihan, C., Yurtoglu, H. (2001), “Productivity and Growth in OECD Countries: An Assessment of
the Determinants of Productivity,” Yapi Kredi Economic Review 12, 49-64.
Serven, Luis. (1997). “Uncertainty, Instability, and Irreversible Investment: Theory, Evidence, and Lessons for
Africa,” World Bank Policy Research Working Paper No. 1722, pp.1-44.
Solow, Robert M. (1957). “Technical Change and the Aggregate Production Function,” Review of Economics
and Statistics 39, 312-320.
Stock, J. H.; Watson, M. W. (1993). “A simple estimator of co-integrating vectors in higher order integrated
systems,” Econometrica 61, 783-820.
Turnovsky, S.J. (1995). Methods of Macroeconomic Dynamics. The MIT Press, Cambridge, MA.
Uzawa, H. (1965). “Optimum technical change in an aggregative model of economic growth,” International
Economic Review 6, 18–31.
Warner, Andrew M. (1992). “Did the Debt Crisis Cause the Investment Crisis,” Quarterly Journal of Economics
107, 1161- 1186.
Zivot, Eric, Andrews, Donald W. K. (1992). “Further Evidence on the Great Crash, the Oil-Price Shock, and
the Unit-Root Hypothesis,” Journal of Business & Economic Statistics 10, 251-70.

Copyright of International Journal of Economic Perspectives is the property of InternationalEconomic Society and its content may not be copied or emailed to multiple sites or posted toa listserv without the copyright holder's express written permission. However, users mayprint, download, or email articles for individual use.
Related Documents