The Different Nature of Band Edge Absorption and Emission in Colloidal PbSe/CdSe Core/Shell Quantum Dots Bram De Geyter, †,‡ Yolanda Justo, † Iwan Moreels, † Karel Lambert, † Philippe F. Smet, § Dries Van Thourhout, ‡ Arjan J. Houtepen, Dominika Grodzinska, ¶ Celso de Mello Donega, ¶ Andries Meijerink, ¶ Daniel Vanmaekelbergh, ¶ and Zeger Hens †, * † Physics and Chemistry of Nanostructures, ‡ Photonics Research Group, § Lumilab, Ghent University, Ghent, Belgium, Department of Chemistry, Delft University of Technology, Delft, The Netherlands, and ¶ Condensed Matter and Interfaces, Debye Institute, Utrecht University, The Netherlands C ompared to plain core quantum dots (QDs), core/shell QDs offer an enhanced stability and tunability of the optical and electronic properties. This difference arises from the spatial distribu- tion of electron and hole wave functions in the QD heterostructures. On the basis of the bulk band alignment and the effective mass theory in a quantum confined heterostruc- ture, three regimes of core/shell QDs can be distinguished, depending on the localiza- tion of the charge carrier wave functions (see Figure 1). In a type-I localization re- gime, the electron and hole are both local- ized in the core, resulting in chemically stable and well-passivated QDs with high photoluminescence (PL) quantum yield (QY). In a type-II regime the electron and hole are spatially separated. In a quasi-type- II 1 localization regime, one of the carriers is fully delocalized, while the other remains lo- calized. As amply demonstrated with QD heterostructures emitting in the visible, this opens up new possibilities for engineering the intrinsic opto-electronic properties of nanomaterials. For instance, a 5-fold reduc- tion of the gain threshold was demon- strated with CdS/ZnSe dots, due to repul- sive biexciton interaction of spatially separated excitons. 2 Similar effects, com- bined with a decrease in the Auger re- combination rate were observed for CdTe/CdSe QDs. 3,4 For CdSe/CdTe heteronanocrystals 5,6 and ZnTe/ZnSe QDs, 7 long radiative lifetimes, indicative of charge separation, and a strong redshift of the exciton transitions were reported. RESULTS AND DISCUSSION Previous work on colloidal type-II heter- onanocrystals has focused primarily on compositions emitting in the visible spec- tral range. Colloidal core/shell heterostruc- tures active in the near-infrared wavelength range (10003000 nm, NIR) have been scarcely investigated. For example, it has been recently shown that PbSe/PbS core/ shell QDs with outer diameters below 10 nm behave like single composition QDs, where electron and hole are delocalized over the entire heterostructure. 8 Colloidal synthesis techniques were recently ex- tended to concentric PbX/CdX (X S, Se, Te) core/shell QDs. 9,10 In this work we fo- cus on PbSe/CdSe QDs, investigating their carrier distribution by absorption and pho- toluminescence (PL) spectroscopy and at- tempt to understand the electronic nature of the lowest absorbing and emitting states. PbSe/CdSe core/shell QDs were made by cation exchange on PbSe QDs as de- *Address correspondence to [email protected]. Received for review June 8, 2010 and accepted December 10, 2010. Published online December 28, 2010. 10.1021/nn102980e © 2011 American Chemical Society ABSTRACT We present a quantitative analysis of the absorption and luminescence of colloidal PbSe/CdSe core/shell quantum dots (QDs). In absorption, both the energy and the oscillator strength of the first exciton transition coincide with that of plain PbSe QDs. In contrast, luminescence lifetime measurements indicate that the oscillator strength of the emitting transition is reduced by at least a factor of 4 compared to PbSe core QDs. Moreover, the addition of an electron scavenger quenches the PbSe/CdSe emission, while a hole scavenger does not. This implies that the electron wave function reaches the QD surface, while the hole is confined to the PbSe core. These observations are consistent with calculations based on the effective mass model, which show that PbSe/CdSe QDs are at the boundary between the type-I and quasi-type-II regime, where the electron spreads over the entire nanoparticle and the hole remains confined in the PbSe core. However, as this only leads to a minor reduction of the oscillator strength, it follows that the drastic reduction of the oscillator strength in emission cannot be explained in terms of electron delocalization. In combination with the increased Stokes shift for PbSe/ CdSe QDs, this indicates that the emission results from lower energy states that are fundamentally different from the absorbing states. KEYWORDS: semiconductor nanocrystals · core/shell · cation exchange · PbSe/CdSe · oscillator strength · exciton lifetime · exciton absorption · exciton emission ARTICLE VOL. 5 ▪ NO. 1 ▪ DE GEYTER ET AL. www.acsnano.org 58

Welcome message from author
This document is posted to help you gain knowledge. Please leave a comment to let me know what you think about it! Share it to your friends and learn new things together.
Transcript

The Different Nature of Band EdgeAbsorption and Emission in ColloidalPbSe/CdSe Core/Shell Quantum DotsBram De Geyter,†,‡ Yolanda Justo,† Iwan Moreels,† Karel Lambert,† Philippe F. Smet,§ Dries Van Thourhout,‡
Arjan J. Houtepen,� Dominika Grodzinska,¶ Celso de Mello Donega,¶ Andries Meijerink,¶
Daniel Vanmaekelbergh,¶ and Zeger Hens†,*†Physics and Chemistry of Nanostructures, ‡Photonics Research Group, §Lumilab, Ghent University, Ghent, Belgium, �Department of Chemistry, Delft University ofTechnology, Delft, The Netherlands, and ¶Condensed Matter and Interfaces, Debye Institute, Utrecht University, The Netherlands
Compared to plain core quantumdots (QDs), core/shell QDs offer anenhanced stability and tunability of
the optical and electronic properties. This
difference arises from the spatial distribu-
tion of electron and hole wave functions in
the QD heterostructures. On the basis of the
bulk band alignment and the effective mass
theory in a quantum confined heterostruc-
ture, three regimes of core/shell QDs can be
distinguished, depending on the localiza-
tion of the charge carrier wave functions
(see Figure 1). In a type-I localization re-
gime, the electron and hole are both local-
ized in the core, resulting in chemically
stable and well-passivated QDs with high
photoluminescence (PL) quantum yield
(QY). In a type-II regime the electron and
hole are spatially separated. In a quasi-type-
II1 localization regime, one of the carriers is
fully delocalized, while the other remains lo-calized. As amply demonstrated with QDheterostructures emitting in the visible, thisopens up new possibilities for engineeringthe intrinsic opto-electronic properties ofnanomaterials. For instance, a 5-fold reduc-tion of the gain threshold was demon-strated with CdS/ZnSe dots, due to repul-sive biexciton interaction of spatiallyseparated excitons.2 Similar effects, com-bined with a decrease in the Auger re-combination rate were observed forCdTe/CdSe QDs.3,4 For CdSe/CdTeheteronanocrystals5,6 and ZnTe/ZnSeQDs,7 long radiative lifetimes, indicative ofcharge separation, and a strong redshift ofthe exciton transitions were reported.
RESULTS AND DISCUSSIONPrevious work on colloidal type-II heter-
onanocrystals has focused primarily oncompositions emitting in the visible spec-tral range. Colloidal core/shell heterostruc-tures active in the near-infrared wavelengthrange (1000�3000 nm, NIR) have beenscarcely investigated. For example, it hasbeen recently shown that PbSe/PbS core/shell QDs with outer diameters below 10nm behave like single composition QDs,where electron and hole are delocalizedover the entire heterostructure.8 Colloidalsynthesis techniques were recently ex-tended to concentric PbX/CdX (X � S, Se,Te) core/shell QDs.9,10 In this work we fo-cus on PbSe/CdSe QDs, investigating theircarrier distribution by absorption and pho-toluminescence (PL) spectroscopy and at-tempt to understand the electronic natureof the lowest absorbing and emitting states.
PbSe/CdSe core/shell QDs were madeby cation exchange on PbSe QDs as de-
*Address correspondence [email protected].
Received for review June 8, 2010and accepted December 10, 2010.
Published online December 28, 2010.10.1021/nn102980e
© 2011 American Chemical Society
ABSTRACT We present a quantitative analysis of the absorption and luminescence of colloidal PbSe/CdSe
core/shell quantum dots (QDs). In absorption, both the energy and the oscillator strength of the first exciton
transition coincide with that of plain PbSe QDs. In contrast, luminescence lifetime measurements indicate that
the oscillator strength of the emitting transition is reduced by at least a factor of 4 compared to PbSe core QDs.
Moreover, the addition of an electron scavenger quenches the PbSe/CdSe emission, while a hole scavenger does
not. This implies that the electron wave function reaches the QD surface, while the hole is confined to the PbSe
core. These observations are consistent with calculations based on the effective mass model, which show that
PbSe/CdSe QDs are at the boundary between the type-I and quasi-type-II regime, where the electron spreads over
the entire nanoparticle and the hole remains confined in the PbSe core. However, as this only leads to a minor
reduction of the oscillator strength, it follows that the drastic reduction of the oscillator strength in emission
cannot be explained in terms of electron delocalization. In combination with the increased Stokes shift for PbSe/
CdSe QDs, this indicates that the emission results from lower energy states that are fundamentally different from
the absorbing states.
KEYWORDS: semiconductor nanocrystals · core/shell · cation exchange ·PbSe/CdSe · oscillator strength · exciton lifetime · exciton absorption · excitonemission
ART
ICLE
VOL. 5 ▪ NO. 1 ▪ DE GEYTER ET AL. www.acsnano.org58
scribed by Pietryga et al.9 The cation exchange does
not alter the total QD size and original size distribu-
tion,11 and yields PbSe/CdSe core/shell QDs with tun-
able core size and shell thickness. This is corroborated
by the absorption spectra (see Figure 2a), which show
an increasing blueshift with increasing exchange time.
The blueshift can be attributed to the shrinking of the
PbSe core and the simultaneous increase of the CdSe
shell thickness. Using high resolution transmission elec-
tron microscopy (HR-TEM), we showed that the cation
exchange process is quite anisotropic,11 partially lead-
ing to particles with eccentric and nonspherical cores.
This heterogeneity accounts for the broadening of the
absorption and PL spectra with increasing exchange
time (see Figure 2a).
Relation between Absorption Energy and Core Diameter.
Knowledge of the core diameter and shell thickness is
important for the present study of the QD optical and
electronic properties. Although HR-TEM can be used for
this purpose, it is not a practical technique for the analy-
sis of a large number of samples in a short time span.
Moreover, even when the boundary between core and
shell can be distinguished, it is not clear whether to
place it on a cation or anion plane. Therefore, we mea-
sured the Pb/Se ratio of the original PbSe core QDs and
of the derived PbSe/CdSe QDs by TEM-based energy
dispersive X-ray spectroscopy (EDX). Since the Se-
content stays constant, we can calculate the amount
of Pb in the PbSe/CdSe core, taking the
nonstoichiometry12,13 of the parent PbSe QDs into ac-
count (see Supporting Information). Since the stoichi-
ometry of the core is not known, we assume the PbSe
core is terminated by Pb-planes and therefore has the
stoichiometry of PbSe QD with the same diameter. This
effective diameter for the PbSe core, determined with
EDX, is in good agreement with the diameter deter-
mined using the PbSe QD sizing curve12(see Figure 2b).
It shows that the Pb content of the PbSe/CdSe QD de-
termines the bandgap, and hence we justify using the
PbSe QD sizing curve to estimate the PbSe effective
core diameter in PbSe/CdSe core/shell QDs.
Absorption Oscillator Strength. The first exciton transi-
tion is characterized by its energy and its oscillator
strength fif,abs. To obtain the oscillator strength, the
spectrum of the absorbance (A) must be converted
into the spectrum of the molar extinction coefficient �.
For this, the QD concentration c and the cuvette length
L are needed (Beer’s law):
Figure 1. Core/shell QDs can be divided in three types, de-pending on the localization of the electron and hole wavefunction. In type-I, electron and hole are confined in thesame region (either core or shell), in type-II, they are spa-tially separated. In a quasi-type-II one carrier is fully delocal-ized over the entire volume and one is localized in oneregion.
Figure 2. (a) Absorption and luminescence spectra of PbSe/CdSe QDs in C2Cl4 for increasing exchange times. (b) Diameterdetermined from EDX vs diameter determined from the position of the first absorption peak, using the PbSe sizing curve.The black line indicates a 1-to-1 relationship.12
ARTIC
LE
www.acsnano.org VOL. 5 ▪ NO. 1 ▪ 58–66 ▪ 2011 59
Hence, under the assumption that the concentrationof PbSe QDs before exchange, which can be calculatedfrom their absorption spectrum,12 does not change dur-ing shell growth, the spectrum of � is readily obtainedfrom the absorbance spectrum of a PbSe/CdSesuspension.
Having the � spectrum for PbSe/CdSe QDs with dif-ferent shell-volume-to-total-QD-volume ratios (Vsh/VQD),fif,abs can be calculated from the energy-integrated mo-lar extinction coefficient �gap of the first exciton transi-tion, in analogy with calculations for PbSe12 and PbS16
QDs:
Here, �0 stands for the permittivity of the vacuum, c isthe speed of light, me is the electron mass, ns is the sol-vent refractive index (1.53 for C2 Cl4), NA is Avogadro’sconstant, � is Planck’s constant, e is the unit charge, andfLF is the local field factor. Neeves et al.17 provide the fol-lowing expression for |fLF|2 in the case of a core/shellparticle:
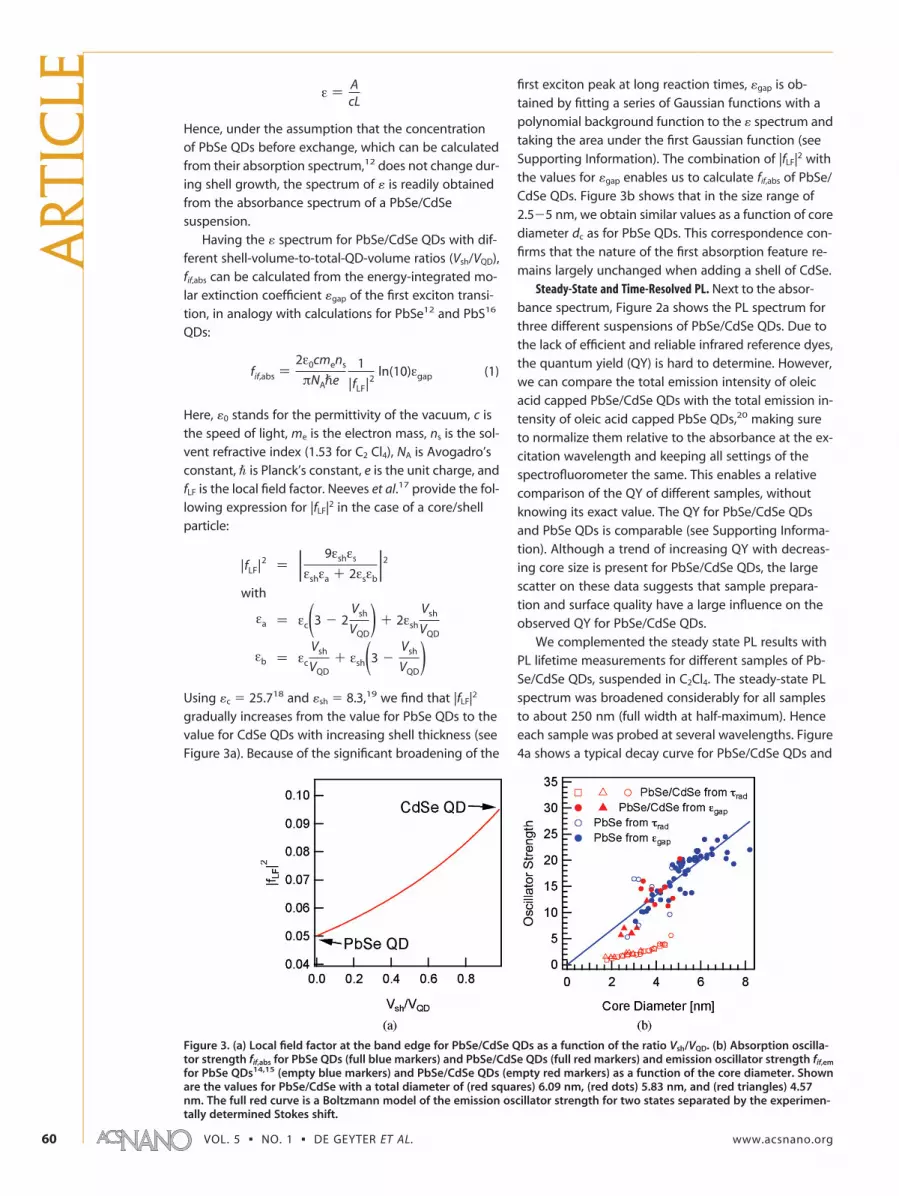
Using �c � 25.718 and �sh � 8.3,19 we find that |fLF|2
gradually increases from the value for PbSe QDs to thevalue for CdSe QDs with increasing shell thickness (seeFigure 3a). Because of the significant broadening of the
first exciton peak at long reaction times, �gap is ob-
tained by fitting a series of Gaussian functions with a
polynomial background function to the � spectrum and
taking the area under the first Gaussian function (see
Supporting Information). The combination of |fLF|2 with
the values for �gap enables us to calculate fif,abs of PbSe/
CdSe QDs. Figure 3b shows that in the size range of
2.5�5 nm, we obtain similar values as a function of core
diameter dc as for PbSe QDs. This correspondence con-
firms that the nature of the first absorption feature re-
mains largely unchanged when adding a shell of CdSe.
Steady-State and Time-Resolved PL. Next to the absor-
bance spectrum, Figure 2a shows the PL spectrum for
three different suspensions of PbSe/CdSe QDs. Due to
the lack of efficient and reliable infrared reference dyes,the quantum yield (QY) is hard to determine. However,we can compare the total emission intensity of oleicacid capped PbSe/CdSe QDs with the total emission in-tensity of oleic acid capped PbSe QDs,20 making sureto normalize them relative to the absorbance at the ex-citation wavelength and keeping all settings of thespectrofluorometer the same. This enables a relativecomparison of the QY of different samples, withoutknowing its exact value. The QY for PbSe/CdSe QDsand PbSe QDs is comparable (see Supporting Informa-tion). Although a trend of increasing QY with decreas-ing core size is present for PbSe/CdSe QDs, the largescatter on these data suggests that sample prepara-tion and surface quality have a large influence on theobserved QY for PbSe/CdSe QDs.
We complemented the steady state PL results withPL lifetime measurements for different samples of Pb-Se/CdSe QDs, suspended in C2Cl4. The steady-state PLspectrum was broadened considerably for all samplesto about 250 nm (full width at half-maximum). Henceeach sample was probed at several wavelengths. Figure4a shows a typical decay curve for PbSe/CdSe QDs and
ε ) AcL
fif,abs )2ε0cmens
πNApe1
|fLF|2ln(10)εgap (1)
|fLF|2 ) | 9εshεs
εshεa + 2εsεb|2
with
εa ) εc(3 - 2Vsh
VQD) + 2εsh
Vsh
VQD
εb ) εc
Vsh
VQD+ εsh(3 -
Vsh
VQD)
Figure 3. (a) Local field factor at the band edge for PbSe/CdSe QDs as a function of the ratio Vsh/VQD. (b) Absorption oscilla-tor strength fif,abs for PbSe QDs (full blue markers) and PbSe/CdSe QDs (full red markers) and emission oscillator strength fif,em
for PbSe QDs14,15 (empty blue markers) and PbSe/CdSe QDs (empty red markers) as a function of the core diameter. Shownare the values for PbSe/CdSe with a total diameter of (red squares) 6.09 nm, (red dots) 5.83 nm, and (red triangles) 4.57nm. The full red curve is a Boltzmann model of the emission oscillator strength for two states separated by the experimen-tally determined Stokes shift.
ART
ICLE
VOL. 5 ▪ NO. 1 ▪ DE GEYTER ET AL. www.acsnano.org60
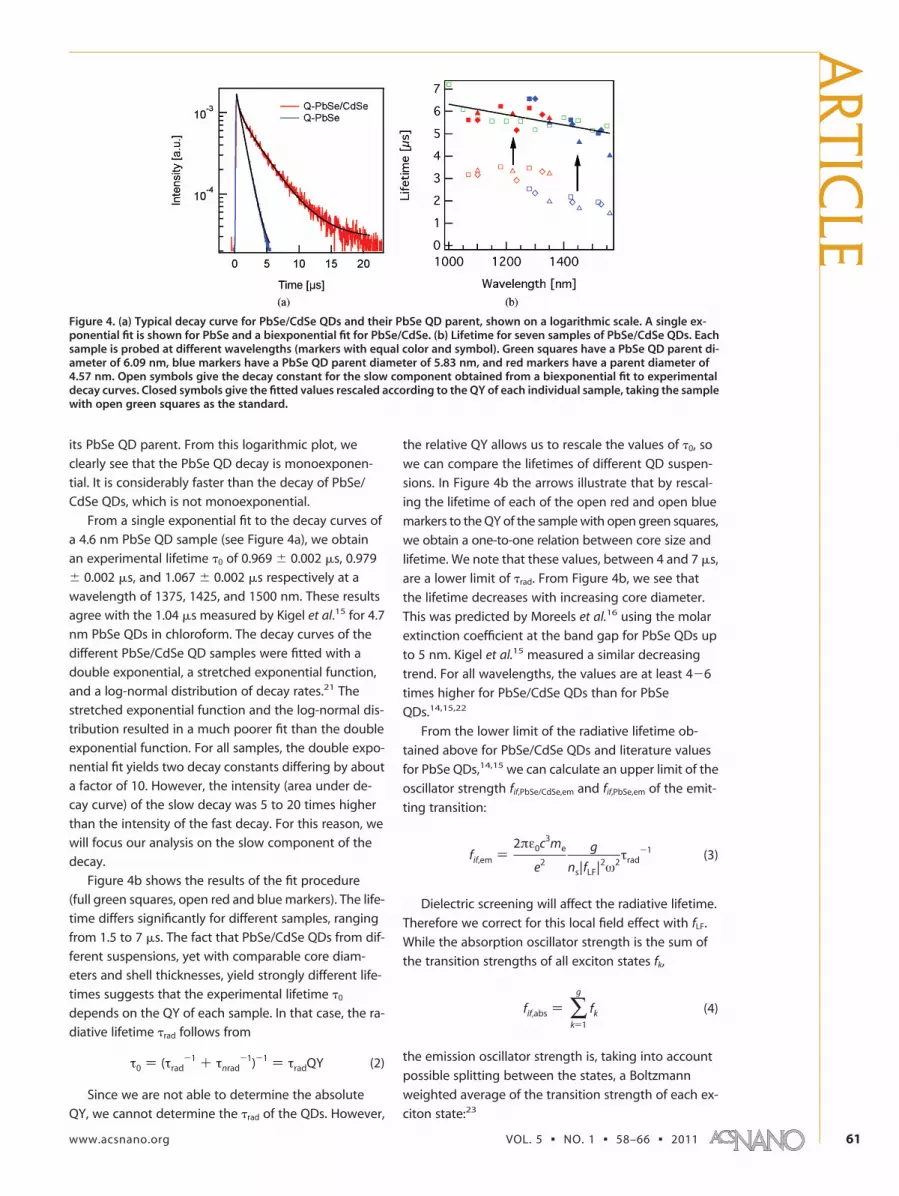
its PbSe QD parent. From this logarithmic plot, we
clearly see that the PbSe QD decay is monoexponen-
tial. It is considerably faster than the decay of PbSe/
CdSe QDs, which is not monoexponential.
From a single exponential fit to the decay curves of
a 4.6 nm PbSe QD sample (see Figure 4a), we obtain
an experimental lifetime �0 of 0.969 � 0.002 �s, 0.979
� 0.002 �s, and 1.067 � 0.002 �s respectively at a
wavelength of 1375, 1425, and 1500 nm. These results
agree with the 1.04 �s measured by Kigel et al.15 for 4.7
nm PbSe QDs in chloroform. The decay curves of the
different PbSe/CdSe QD samples were fitted with a
double exponential, a stretched exponential function,
and a log-normal distribution of decay rates.21 The
stretched exponential function and the log-normal dis-
tribution resulted in a much poorer fit than the double
exponential function. For all samples, the double expo-
nential fit yields two decay constants differing by about
a factor of 10. However, the intensity (area under de-
cay curve) of the slow decay was 5 to 20 times higher
than the intensity of the fast decay. For this reason, we
will focus our analysis on the slow component of the
decay.
Figure 4b shows the results of the fit procedure
(full green squares, open red and blue markers). The life-
time differs significantly for different samples, ranging
from 1.5 to 7 �s. The fact that PbSe/CdSe QDs from dif-
ferent suspensions, yet with comparable core diam-
eters and shell thicknesses, yield strongly different life-
times suggests that the experimental lifetime �0
depends on the QY of each sample. In that case, the ra-
diative lifetime �rad follows from
Since we are not able to determine the absolute
QY, we cannot determine the �rad of the QDs. However,
the relative QY allows us to rescale the values of �0, so
we can compare the lifetimes of different QD suspen-
sions. In Figure 4b the arrows illustrate that by rescal-
ing the lifetime of each of the open red and open blue
markers to the QY of the sample with open green squares,
we obtain a one-to-one relation between core size and
lifetime. We note that these values, between 4 and 7 �s,
are a lower limit of �rad. From Figure 4b, we see that
the lifetime decreases with increasing core diameter.
This was predicted by Moreels et al.16 using the molar
extinction coefficient at the band gap for PbSe QDs up
to 5 nm. Kigel et al.15 measured a similar decreasing
trend. For all wavelengths, the values are at least 4�6
times higher for PbSe/CdSe QDs than for PbSe
QDs.14,15,22
From the lower limit of the radiative lifetime ob-
tained above for PbSe/CdSe QDs and literature values
for PbSe QDs,14,15 we can calculate an upper limit of the
oscillator strength fif,PbSe/CdSe,em and fif,PbSe,em of the emit-
ting transition:
Dielectric screening will affect the radiative lifetime.
Therefore we correct for this local field effect with fLF.
While the absorption oscillator strength is the sum of
the transition strengths of all exciton states fk,
the emission oscillator strength is, taking into account
possible splitting between the states, a Boltzmann
weighted average of the transition strength of each ex-
citon state:23
Figure 4. (a) Typical decay curve for PbSe/CdSe QDs and their PbSe QD parent, shown on a logarithmic scale. A single ex-ponential fit is shown for PbSe and a biexponential fit for PbSe/CdSe. (b) Lifetime for seven samples of PbSe/CdSe QDs. Eachsample is probed at different wavelengths (markers with equal color and symbol). Green squares have a PbSe QD parent di-ameter of 6.09 nm, blue markers have a PbSe QD parent diameter of 5.83 nm, and red markers have a parent diameter of4.57 nm. Open symbols give the decay constant for the slow component obtained from a biexponential fit to experimentaldecay curves. Closed symbols give the fitted values rescaled according to the QY of each individual sample, taking the samplewith open green squares as the standard.
τ0 ) (τrad-1 + τnrad
-1)-1 ) τradQY (2)
fif,em )2πε0c3me
e2
g
ns|fLF|2ω2τrad
-1 (3)
fif,abs ) ∑k)1
g
fk (4)
ARTIC
LE
www.acsnano.org VOL. 5 ▪ NO. 1 ▪ 58–66 ▪ 2011 61
Effectively, this yields the average transition strengthof the states that contribute to emission. Since emis-sion comes from radiative decay of a single exciton,which occupies only one of all possible ground excitonstates, and absorption involves all exciton states, wemultiply in eq 5 by the total number of exciton statesg � 64 to obtain a total emission oscillator strength.This is equivalent to compressing the fine structure toone single emitting state with degeneracy g and oscil-lator strength fif,em.
The resulting values for fif,PbSe/CdSe,em and fif,PbSe,em arerepresented by the open markers in red and blue, re-spectively, in Figure 3b. The values for fif,PbSe,em are simi-lar to the values obtained from the absorption spec-trum fif,PbSe,abs. Values smaller by at least 75% are foundfor the emission oscillator strength fif,PbSe/CdSe,em.
PL Quenching. The quantitative analysis of the absorp-tion and luminescence data yields contradictory out-comes. While the energy and the absorption oscillatorstrength of the band gap transition in PbSe/CdSe are in-dicative of a type-I localization regime, the sensitivityof the emission QY and the increase in exciton lifetimeassociated with a decrease in emission oscillator
strength suggest that one of the carriers is delocalized
over the entire QD (quasi-type-II) or even localized in
the CdSe shell (type-II). To pinpoint the localization re-
gime, we added dodecanethiol (DDT), a well-known
hole scavenger for CdSe24,25 and PbSe26,27 and methyl
viologen (MV2�), an electron scavenger,28,29 to PbSe/
CdSe suspensions and analyzed their effect on the
photoluminescence.
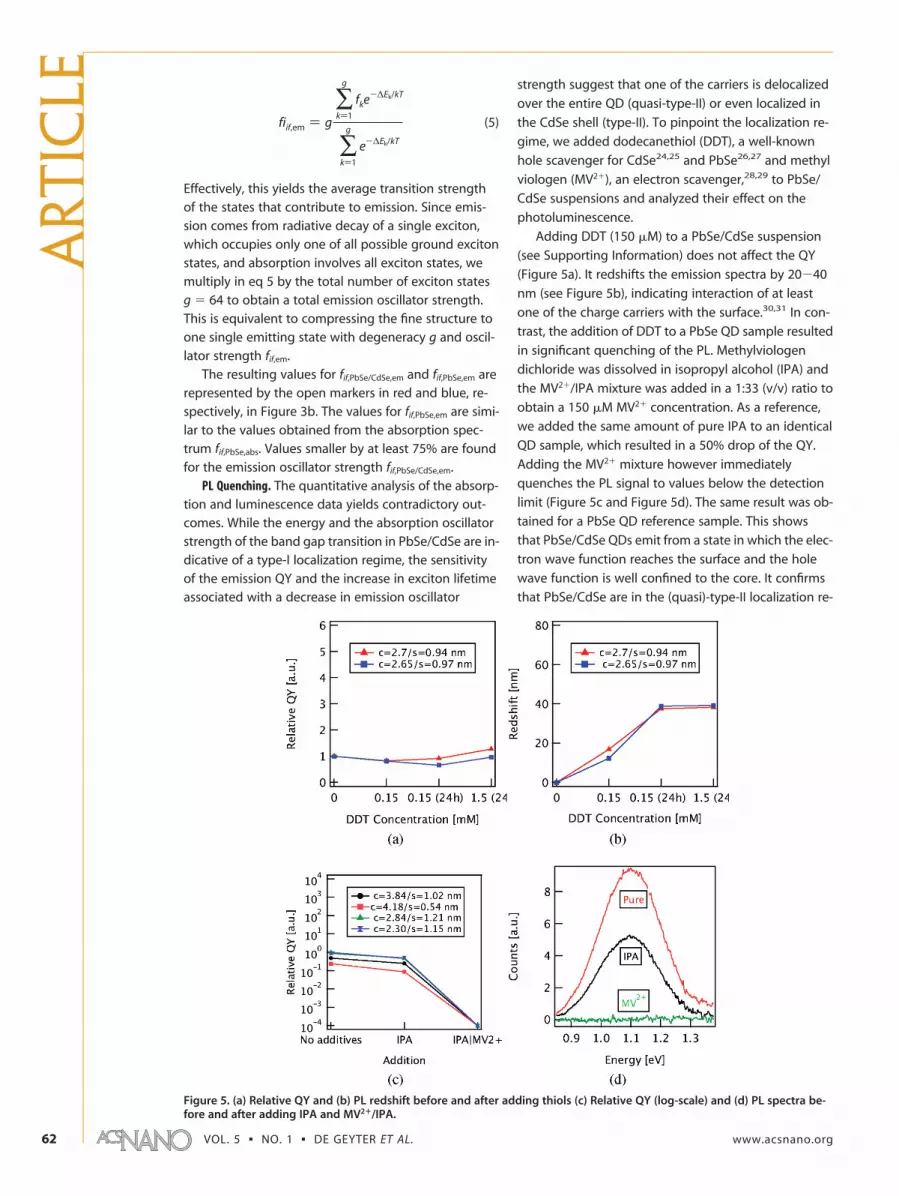
Adding DDT (150 �M) to a PbSe/CdSe suspension
(see Supporting Information) does not affect the QY
(Figure 5a). It redshifts the emission spectra by 20�40
nm (see Figure 5b), indicating interaction of at least
one of the charge carriers with the surface.30,31 In con-
trast, the addition of DDT to a PbSe QD sample resulted
in significant quenching of the PL. Methylviologen
dichloride was dissolved in isopropyl alcohol (IPA) and
the MV2�/IPA mixture was added in a 1:33 (v/v) ratio to
obtain a 150 �M MV2� concentration. As a reference,
we added the same amount of pure IPA to an identical
QD sample, which resulted in a 50% drop of the QY.
Adding the MV2� mixture however immediately
quenches the PL signal to values below the detection
limit (Figure 5c and Figure 5d). The same result was ob-
tained for a PbSe QD reference sample. This shows
that PbSe/CdSe QDs emit from a state in which the elec-
tron wave function reaches the surface and the hole
wave function is well confined to the core. It confirms
that PbSe/CdSe are in the (quasi)-type-II localization re-
Figure 5. (a) Relative QY and (b) PL redshift before and after adding thiols (c) Relative QY (log-scale) and (d) PL spectra be-fore and after adding IPA and MV2�/IPA.
fiif,em ) g
∑k)1
g
fke-∆Ek/kT
∑k)1
g
e-∆Ek/kT
(5)
ART
ICLE
VOL. 5 ▪ NO. 1 ▪ DE GEYTER ET AL. www.acsnano.org62

gime. The delocalization of the electron will reduce the
wave function overlap to some extent. However, these
measurements are not sufficient to conclude that this
reduction in overlap fully accounts for the reduction in
emission oscillator strength. In addition, they do not ex-
plain why the absorption oscillator strength essentially
remains unchanged.
Effective Mass Modeling. Atomistic calculations that rec-
oncile the experimental results are not yet available.
Therefore, we interpret our results in terms of an effec-
tive mass model, based on literature data of the bulk
band alignment and the effective masses.32�34 In addi-
tion, we use the energy criterion introduced by Klimov
et al. to classify quantum confined heterojunctions
based on their carrier localization.35 This criterion can
best be appreciated by means of the square of the
wavenumber for electron (ke2) and hole (kh
2):
Here, Ve,h denotes the potential (i.e., the position of the
bulk energy bands) in each region and me,h is the effec-
tive mass for electron and hole. If k2 is negative, the
wavenumber is imaginary, resulting in an exponen-
tially decaying wave function. Provided that the charac-
teristic decay length k�1 is sufficiently small, this means
that a charge carrier is preferentially found in that re-
gion of the heterostructure where k2 is positive and the
resulting wavenumber is real. Hence, looking at binary
heterostructures, we talk about type-I regime, if ke2 and
kh2 have the same sign in each region of the hetero-
structure. For type-II regime, ke2 and kh
2 have opposite
sign in every region. Finally, for quasi-type-II regime, ke2
and kh2 have the same sign in one of the regions, and
opposite sign in the other region (see Figure 6a).
According to Michaelson,36 bulk PbSe and CdSe
have a type-I bulk band alignment with a valence band
offset of 0.78 eV and conduction band offset of 0.70
eV. Using the effective masses of PbSe and CdSe as
summarized in Table 1, we obtain the wave function
of a PbSe/CdSe QD with a core radius of 1.5 nm and a
shell thickness of 1 nm as plotted in Figure 6b. Owing to
the difference in effective mass between electron and
hole in CdSe, we find that the electron wave function
spreads throughout the entire QD, while the hole wave
function is confined to the core. Taking the band off-
set as an adjustable parameter, we find that PbSe/
CdSe QDs are at the boundary between the type-I and
quasi-type-II regime. The overlap integral slightly drops
from a value close to 1 for large band offsets to about
0.8 when equals zero. Since the overlap integral is di-
rectly proportional to the oscillator strength, this con-
firms the experimental result that fif,PbSe/CdSe,abs does not
significantly differ from fif,PbSe,abs.
Even though there is only a small reduction in over-
lap, the electron wave function does have a nonzero
value at the QD outer surface, while the hole wave func-
tion is negligible at the QD outer surface. This overall
picture is confirmed by the PL quenching experiments,
which show that the electron is transferred to the elec-
tron acceptor at the surface, while the hole does not
transfer to the hole acceptor.
ke,h2 )
2me,h
p2(Ee,h - Ve,h)
Figure 6. (a) Definition of types of localization regimes incore/shell quantum dots in terms of the square of the wave-number k2. (b) Electron and hole wave functions (r2�2) forPbSe/CdSe QDs (green and red) in a simple effective massmodel. The confinement energy (striped) is drawn within thebulk band diagram. (c) Overlap integral as a function of theconduction band offset �. The dotted line shows the overlapintegral for PbSe QDs.
TABLE 1. Effective masses of PbSe and cubic CdSe
PbSe32 cubic CdSe33,34
me 0.047 0.12mh 0.040 0.8
ARTIC
LE
www.acsnano.org VOL. 5 ▪ NO. 1 ▪ 58–66 ▪ 2011 63
This simple model fails to explain why fif,PbSe/CdSe,em
is reduced. The fact that the QY of PbSe/CdSe QDs iscomparable to and often higher than that of PbSe QDsand the clear dependence of fif,PbSe/CdSe,em on the QD di-ameter indicate that this is most likely an intrinsic PbSe/CdSe QD property, and not an artifact due to surface-state mediated radiative recombination. Therefore, itsuggests that the fine structure of PbSe/CdSe QDs,which our model cannot resolve, is more complex.Looking at eq 4 and eq 5, fif,abs and fif,em will only differsignificantly when (a) the energy splitting is much largerthan the thermal energy kT and (b) the emitting stateshave a much lower oscillator strength than the absorb-ing states. Therefore, the band edge emission in PbSe/CdSe QDs comes from states that are fundamentally dif-ferent from the bright absorbing states.
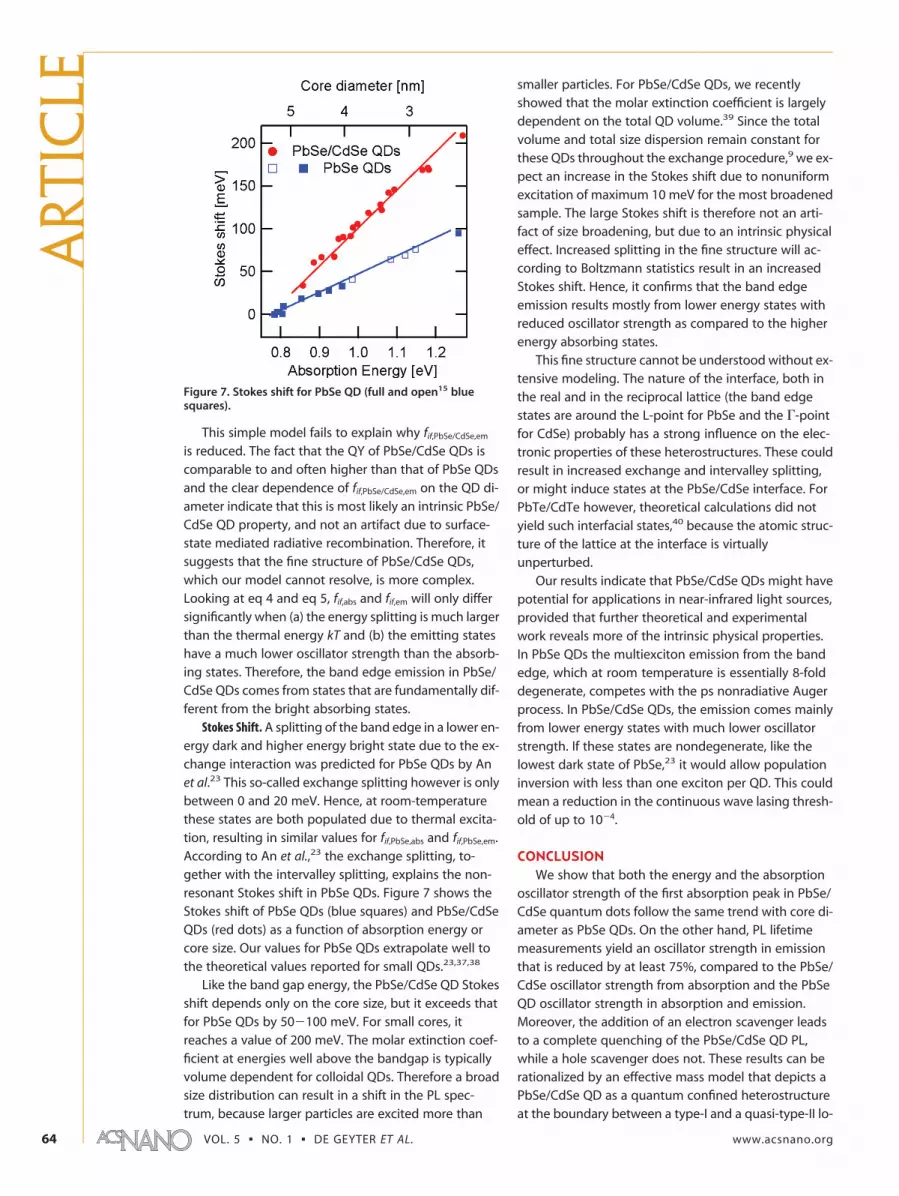
Stokes Shift. A splitting of the band edge in a lower en-ergy dark and higher energy bright state due to the ex-change interaction was predicted for PbSe QDs by Anet al.23 This so-called exchange splitting however is onlybetween 0 and 20 meV. Hence, at room-temperaturethese states are both populated due to thermal excita-tion, resulting in similar values for fif,PbSe,abs and fif,PbSe,em.According to An et al.,23 the exchange splitting, to-gether with the intervalley splitting, explains the non-resonant Stokes shift in PbSe QDs. Figure 7 shows theStokes shift of PbSe QDs (blue squares) and PbSe/CdSeQDs (red dots) as a function of absorption energy orcore size. Our values for PbSe QDs extrapolate well tothe theoretical values reported for small QDs.23,37,38
Like the band gap energy, the PbSe/CdSe QD Stokesshift depends only on the core size, but it exceeds thatfor PbSe QDs by 50�100 meV. For small cores, itreaches a value of 200 meV. The molar extinction coef-ficient at energies well above the bandgap is typicallyvolume dependent for colloidal QDs. Therefore a broadsize distribution can result in a shift in the PL spec-trum, because larger particles are excited more than
smaller particles. For PbSe/CdSe QDs, we recentlyshowed that the molar extinction coefficient is largelydependent on the total QD volume.39 Since the totalvolume and total size dispersion remain constant forthese QDs throughout the exchange procedure,9 we ex-pect an increase in the Stokes shift due to nonuniformexcitation of maximum 10 meV for the most broadenedsample. The large Stokes shift is therefore not an arti-fact of size broadening, but due to an intrinsic physicaleffect. Increased splitting in the fine structure will ac-cording to Boltzmann statistics result in an increasedStokes shift. Hence, it confirms that the band edgeemission results mostly from lower energy states withreduced oscillator strength as compared to the higherenergy absorbing states.
This fine structure cannot be understood without ex-tensive modeling. The nature of the interface, both inthe real and in the reciprocal lattice (the band edgestates are around the L-point for PbSe and the -pointfor CdSe) probably has a strong influence on the elec-tronic properties of these heterostructures. These couldresult in increased exchange and intervalley splitting,or might induce states at the PbSe/CdSe interface. ForPbTe/CdTe however, theoretical calculations did notyield such interfacial states,40 because the atomic struc-ture of the lattice at the interface is virtuallyunperturbed.
Our results indicate that PbSe/CdSe QDs might havepotential for applications in near-infrared light sources,provided that further theoretical and experimentalwork reveals more of the intrinsic physical properties.In PbSe QDs the multiexciton emission from the bandedge, which at room temperature is essentially 8-folddegenerate, competes with the ps nonradiative Augerprocess. In PbSe/CdSe QDs, the emission comes mainlyfrom lower energy states with much lower oscillatorstrength. If these states are nondegenerate, like thelowest dark state of PbSe,23 it would allow populationinversion with less than one exciton per QD. This couldmean a reduction in the continuous wave lasing thresh-old of up to 10�4.
CONCLUSIONWe show that both the energy and the absorption
oscillator strength of the first absorption peak in PbSe/CdSe quantum dots follow the same trend with core di-ameter as PbSe QDs. On the other hand, PL lifetimemeasurements yield an oscillator strength in emissionthat is reduced by at least 75%, compared to the PbSe/CdSe oscillator strength from absorption and the PbSeQD oscillator strength in absorption and emission.Moreover, the addition of an electron scavenger leadsto a complete quenching of the PbSe/CdSe QD PL,while a hole scavenger does not. These results can berationalized by an effective mass model that depicts aPbSe/CdSe QD as a quantum confined heterostructureat the boundary between a type-I and a quasi-type-II lo-
Figure 7. Stokes shift for PbSe QD (full and open15 bluesquares).
ART
ICLE
VOL. 5 ▪ NO. 1 ▪ DE GEYTER ET AL. www.acsnano.org64

calization regime. They show that the absorbing statesessentially remain unchanged by the addition of a CdSeshell. However, they do not explain the reduction ofthe oscillator strength of the band gap emission. Incombination with the significantly increased Stokesshift, we conclude that the band gap emission in PbSe/CdSe QDs comes from fundamentally different states
with lower oscillator strength that are energeticallywell separated from the absorbing states at room tem-perature. Moreover, these emitting states are differentthan the emitting states in PbSe QDs. Depending on thedegeneracy of the emitting states, these binary hetero-structures could allow lasing in the NIR wavelengthrange using single excitons.
METHODSMaterials. Technical oleic acid (90%) was purchased from
Sigma-Aldrich. PbCl2 (99.999%), PbO (99.999%), and seleniumpowder (�200 mesh, 99.999%) were ordered from Alfa-Aesar.CdO (99.999%) and Tri-n-octylphosphine (97%) were obtainedfrom Strem Chemicals. Diphenyl ether, methanol, butanol, andtoluene were all of quality for synthesis and were ordered fromVWR.
PbSe Synthesis. Monodisperse colloidal PbSe QDs were synthe-sized by a high-temperature synthesis developed by Murrayet al.41 The ligand shell consists of oleic acid (OA), as shown bynuclear magnetic resonance spectroscopy.20
PbSe/CdSe Cation Exchange. PbSe/CdSe core�shell QDs weresynthesized starting from PbSe core QDs by means of a cationexchange reaction.9 In this reaction, Cd-oleate (0.3 M stock solu-tion) is added to a PbSe QD suspension in toluene at 100 °C(the typical Pb/Cd ratio used is 1:10). After 40 min, the reactionis quenched using a mixture of MeOH and BuOH (1:2) and pre-cipitated twice.
Determination of the Core Diameter and Concentration. The absor-bance spectra are measured with a Perkin-Elmer Lambda 950UV/vis/NIR spectrophotometer. We use a black walled self-masking microcell with a path length of l � 1 cm. The absorp-tion diameter is determined from the spectral position of the firstabsorption peak and the PbSe sizing curve.12 For the determina-tion of �, care is taken to recover all QD material from the cat-ion exchange step and resuspend the resulting PbSe/CdSe core/shell QDs in the same volume. We assume the concentration ofthis suspension to be identical to the concentration of the PbSeQD parent suspension. Equal volumes are then taken, dried, anddissolved in C2Cl4 to measure the absorbance A. After convert-ing the absorption spectrum to a molar extinction coefficientspectrum, the first peak was integrated on an energy scale be-tween the low energy onset of the first absorption peak and themaximum of first absorption peak. This value was doubled to ob-tain the values for �gap.
Steady-State PL. The steady-state PL is measured using an Edin-burgh Instruments FS920 PL setup and excited at 400 nm usinga 500 W xenon lamp, coupled to a monochromator. The PL ismeasured using a liquid N2 cooled Ge detector, coupled to amonochromator. The PL spectra are corrected for detector andgrating efficiency. The absorbance at 400 nm is kept below 0.1cm�1 to avoid inhomogeneous spatial excitation and reabsorp-tion. For more information on the determination of the relativeQY, we refer to the Supporting Information.
Time-Resolved PL. Luminescence decay curves were recordedunder pulsed excitation with a Spectra-Physik LPD3000 dye la-ser at 480 nm pumped by a Lambda Physik LPX excimer laser.The multichannel scaling (MCS) option integrated in the FLS920spectrofluorometer was used to record the luminescence decaycurves, using the IR-sensitive Hamamatsu R5509-72 photomulti-plier tube. We measured seven different PbSe/CdSe samples inC2Cl4. The samples stemmed from three PbSe QD parent suspen-sions with diameter of 4.6, 5.8, and 6.1 nm. The core diametersranged between 2.5 and 4.2 nm. The average shell thickness wasbetween 0.8 and 1.4 nm. With the lattice constant of cubic CdSe(0.6077 nm), this is between 2 and 4 monolayers of CdSe.
Determination of the Stokes Shift. The PL spectrum was convertedto an energy scale with the appropriate correction and fitted us-ing a Gaussian curve. The absorption spectrum was fitted on anenergy scale using a Gaussian curve and a polynomial back-ground function. The Stokes shift was determined as the differ-
ence between the absorption energy and the luminescence en-ergy from the fitting procedures.
Supporting Information Available: Techniques used for calcu-lation of the size from EDX, the QY and Stokes shift. Fits to the ab-sorption spectrum, along with fitting data. Details on the effec-tive mass model. This material is available free of charge via theInternet at http://pubs.acs.org.
Acknowledgment. This research is funded by Ghent Univer-sity (Bijzonder Onderzoeksfonds, NB-Photonics), IWT-Vlaanderen(SBO-Metacel), the Belgian Science Policy Office (IAP P6/10), theEU Seventh Framework Program (EU-FP7 ITN Herodot), and theFWO-Vlaanderen (G.0.144.08.N.10). P.F.S. and I.M. are postdoc-toral researchers of FWO-Vlaanderen.
REFERENCES AND NOTES1. Ivanov, S. A.; Piryatinski, A.; Nanda, J.; Tretiak, S.; Zavadil,
K. R.; Wallace, W. O.; Werder, D.; Klimov, V. I. Type-IICore/Shell Cds/ZnSe Nanocrystals: Synthesis, ElectronicStructures, and Spectroscopic Properties. J. Am. Chem. Soc.2007, 129, 11708–11719.
2. Klimov, V. I.; Ivanov, S. A.; Nanda, J.; Achermann, M.; Bezel,I.; McGuire, J. A.; Piryatinski, A. Single-Exciton Optical Gainin Semiconductor Nanocrystals. Nature 2007, 447,441–446.
3. Oron, D.; Kazes, M.; Banin, U. Multiexcitons in Type-IIColloidal Semiconductor Quantum Dots. Phys. Rev. B 2007,75, 035330.
4. Dorfs, D.; Franzl, T.; Osovsky, R.; Brumer, M.; Lifshitz, E.; Klar,T. A.; Eychmueller, A. Type-I and Type-II NanoscaleHeterostructures Based on CdTe Nanocrystals: AComparative Study. Small 2008, 4, 1148–1152.
5. Jones, M.; Kumar, S.; Lo, S. S.; Scholes, G. D. ExcitonTrapping and Recombination in Type II CdSe/CdTeNanorod Heterostructures. J. Phys. Chem. C 2008, 112,5423–5431.
6. de Mello Donega, C. Formation of Nanoscale SpatiallyIndirect Excitons: Evolution of the Type-II OpticalCharacter of CdTe/CdSe Heteronanocrystals. Phys. Rev. B2010, 81, 165303.
7. Bang, J.; Park, J.; Lee, J. H.; Won, N.; Nam, J.; Lim, J.; Chang,B. Y.; Lee, H. J.; Chon, B.; Shin, J.; et al. ZnTe/ZnSe(Core/Shell) Type-II Quantum Dots: Their Optical andPhotovoltaic Properties. Chem. Mater. 2010, 22, 233–240.
8. Bartnik, A. C.; Wise, F. W.; Kigel, A.; Lifshitz, E. ElectronicStructure of PbSe/PbS Core�Shell Quantum Dots. Phys.Rev. B 2007, 75, 245424.
9. Pietryga, J.; Werder, D.; Williams, D.; Casson, J.; Schaller, R.;Klimov, V.; Hollingworth, J. Utilizing the Lability of LeadSelenide to Produce Heterostructured Nanocrystals withBright, Stable Infrared Emission. J. Am. Chem. Soc. 2008,130, 4879–4885.
10. Zhang, Y.; Dai, Q.; Li, X.; Cui, Q.; Gu, Z.; Zou, B.; Wang, Y.;Yu, W. W. Formation of PbSe/CdSe Core/Shell Nanocrystalsfor Stable Near-Infrared High PhotoluminescenceEmission. Nanoscale. Res. Lett. 2010, 5, 1279–1283.
11. Lambert, K.; De Geyter, B.; Moreels, I.; Hens, Z. PbTelCdTeCorel/Shell Particles by Cation Exchange, A HR-TEM Study.Chem. Mater. 2009, 21, 778–780.
ARTIC
LE
www.acsnano.org VOL. 5 ▪ NO. 1 ▪ 58–66 ▪ 2011 65
12. Moreels, I.; Lambert, K.; De Muynck, D.; Vanhaecke, F.;Poelman, D.; Martins, J. C.; Allan, G.; Hens, Z. Compositionand Size-Dependent Extinction Coefficient of ColloidalPbSe Quantum Dots. Chem. Mater. 2007, 19, 6101–6106.
13. Dai, Q.; Wang, Y.; Li, X.; Zhang, Y.; Pellegrino, D. J.; Zhao,M.; Zou, B.; Seo, J.; Wang, Y.; Yu, W. W. Size-DependentComposition and Molar Extinction Coefficient of PbSeSemiconductor Nanocrystals. ACS Nano 2009, 3,1518–1524.
14. Schaller, R. D.; Crooker, S. A.; Bussian, D. A.; Pietryga, J. M.;Joo, J.; Klimov, V. I. Revealing the Exciton Fine Structure ofPbSe Nanocrystal Quantum Dots Using OpticalSpectroscopy in High Magnetic Fields. Phys. Rev. Lett.2010, 105, 067403.
15. Kigel, A.; Brumer, M.; Maikov, G. I.; Sashchiuk, A.; Lifshitz, E.Thermally Activated Photoluminescence in Lead SelenideColloidal Quantum Dots. Small 2009, 5, 1675–1681.
16. Moreels, I.; Lambert, K.; Smeets, D.; De Muynck, D.; Nollet,T.; Martins, J. C.; Vanhaecke, F.; Vantomme, A.; Delerue, C.;Allan, G.; et al. Size-Dependent Optical Properties ofColloidal PbS Quantum Dots. ACS Nano 2009, 3,3023–3030.
17. Neeves, A.; Birnboim, M. Composite Structures for theEnhancement of Nonlinear-Optical Susceptibility. J. Opt.Soc. Am. B 1989, 6, 787–796.
18. Suzuki, N.; Sawai, K.; Adachi, S. Optical Properties of PbSe.J. Appl. Phys. 1995, 77, 1249–1255.
19. Ninomiya, S.; Adachi, S. Optical Properties of Cubic andHexagonal Cdse. J. Appl. Phys. 1995, 78, 4681–4689.
20. Moreels, I.; Fritzinger, B.; Martins, J. C.; Hens, Z. SurfaceChemistry of Colloidal PbSe Nanocrystals. J. Am. Chem. Soc.2008, 130, 15081–15086.
21. van Driel, A. F.; Nikolaev, I. S.; Vergeer, P.; Lodahl, P.;Vanmaekelbergh, D.; Vos, W. L. Statistical Analysis of Time-Resolved Emission from Ensembles of SemiconductorQuantum Dots: Interpretation of Exponential DecayModels. Phys. Rev. B 2007, 75, 035329.
22. Oron, D.; Aharoni, A.; Donega, C. d. M.; van Rijssel, J.;Meijerink, A.; Banin, U. Universal Role of Discrete AcousticPhonons in the Low-Temperature Optical Emission ofColloidal Quantum Dots. Phys. Rev. Lett. 2009, 102, 177402.
23. An, J. M.; Franceschetti, A.; Zunger, A. The ExcitonicExchange Splitting and Radiative Lifetime in PbSeQuantum Dots. Nano Lett. 2007, 7, 2129–2135.
24. Aldana, J.; Wang, Y.; Peng, X. Photochemical Instability ofCdSe Nanocrystals Coated by Hydrophilic Thiols. J. Am.Chem. Soc. 2001, 123, 8844–8850.
25. Wuister, S. F.; Donega, C. D.; Meijerink, A. Influence of ThiolCapping on the Exciton Luminescence and Decay Kineticsof CdTe and CdSe Quantum. J. Phys. Chem. B 2004, 108,17393–17397.
26. Wang, C.; Kwon, K.-W.; Odlyzko, M. L.; Lee, B. H.; Shim, M.PbSe Nanocrystal/TiOx Heterostructured Films: A SimpleRoute to Nanoscale Heterointerfaces and Photocatalysis. J.Phys. Chem. C 2007, 111, 11734–11741.
27. Luther, J. M.; Law, M.; Song, Q.; Perkins, C. L.; Beard, M. C.;Nozik, A. J. Structural, Optical, and Electrical Properties ofSelf-Assembled Films of PbSe Nanocrystals Treated with1,2-Ethanedithiol. ACS Nano 2008, 2, 271–280.
28. Burda, C.; Green, T.; Link, S.; El-Sayed, M. Electron Shuttlingacross the Interface of CdSe Nanoparticles Monitored byFemtosecond Laser Spectroscopy. J. Phys. Chem. B 1999,103, 1783–1788.
29. Matylitsky, V. V.; Dworak, L.; Breus, V. V.; Basche, T.;Wachtveitl, J. Ultrafast Charge Separation in MultiexcitedCdSe Quantum Dots Mediated by Adsorbed ElectronAcceptors. J. Am. Chem. Soc. 2009, 131, 2424–2425.
30. Koole, R.; Luigjes, B.; Tachiya, M.; Pool, R.; Vlugt, T. J. H.;Donega, C. D. M.; Meijerink, A.; Vanmaekelbergh, D.Differences in Cross-Link Chemistry between Rigid andFlexible Dithiol Molecules Revealed by Optical Studies ofCdTe Quantum Dots. J. Phys. Chem. C 2007, 111,11208–11215.
31. Talgorn, E.; Moysidou, E.; Abellon, R. D.; Savenije, T. J.;
Goossens, A.; Houtepen, A. J.; Siebbeles, L. D. A. HighlyPhotoconductive CdSe Quantum-Dot Films: Influence ofCapping Molecules and Film Preparation Procedure. J.Phys. Chem. C 2010, 114, 3441–3447.
32. Martinez, G.; Schluter, M.; Cohen, M. L. Electronic Structureof PbSe and PbTe. I. Band Structures, Densities of States,and Effective Masses. Phys. Rev. B 1975, 11, 651–659.
33. Dalven, R. Calculation of Effective Masses in Cubic CdS andCdSe. Phys. Status Solidi B 1971, 48, K13.
34. Nikitine, S.; Dimmock, J.; Wheeler, R. Exciton Structure andZeeman Effects in Cadmium Selenide. J. Appl. Phys. 1961,32, 2271–2277.
35. Piryatinski, A.; Ivanov, S. A.; Tretiak, S.; Klimov, V. I. Effect ofQuantum and Dielectric Confinement on theExciton�Exciton Interaction Energy in Type II Core/ShellSemiconductor Nanocrystals. Nano Lett. 2007, 7, 108–115.
36. Michaelson, H. B. Relation between an AtomicElectronegativity Scale and the Work Function. IBM J. Res.Dev. 1978, 22, 72–80.
37. Leitsmann, R.; Bechstedt, F. Characteristic Energies andShifts in Optical Spectra of Colloidal IV�VI SemiconductorNanocrystals. ACS Nano 2009, 3, 3505–3512.
38. Franceschetti, A. Structural and Electronic Properties ofPbSe Nanocrystals from First Principles. Phys. Rev. B 2008,78, 075418.
39. De Geyter, B.; Hens, Z. The Absorption Coefficient of PbSe/CdSe Core/Shell Colloidal Quantum Dots. Appl. Phys. Lett.2010, 97, 161908.
40. Leitsmann, R.; Bechstedt, F.; Groiss, H.; Schaeffler, F.; Heiss,W.; Koike, K.; Harada, H.; Yano, M. Structural and ElectronicProperties of PbTe (Rocksalt)/CdTe (Zinc-Blende)Interfaces. Appl. Surf. Sci. 2007, 254, 397–400.
41. Murray, C.; Sun, S.; Gaschler, W.; Doyle, H.; Betley, T.;Kagan, C. Colloidal Synthesis of Nanocrystals andNanocrystal Superlattices. IBM J. Res. Dev. 2001, 45, 47–56.
ART
ICLE
VOL. 5 ▪ NO. 1 ▪ DE GEYTER ET AL. www.acsnano.org66
Related Documents