THE DIALOGICAL SELF OF MIGRANTS: EXPLORING THE MIGRATION EXPERIENCE THROUGH SELF-NARRATIVES Mariel Sanchez-Rockliffe Faculty of Health, Arts and Design Swinburne University of Technology Australia A Report of an investigation submitted as partial requirement for the degree of Doctor of Psychology (Counselling Psychology) December 2015

Welcome message from author
This document is posted to help you gain knowledge. Please leave a comment to let me know what you think about it! Share it to your friends and learn new things together.
Transcript

THE DIALOGICAL SELF OF MIGRANTS:
EXPLORING THE MIGRATION EXPERIENCE THROUGH SELF-NARRATIVES
Mariel Sanchez-Rockliffe
Faculty of Health, Arts and Design
Swinburne University of Technology
Australia
A Report of an investigation submitted
as partial requirement for the degree of
Doctor of Psychology (Counselling Psychology)
December 2015
i
Declaration
I declare that that this thesis does not incorporate without acknowledgment any
material previously submitted for a degree in any university, or other educational
institution; and that to the best of my knowledge and belief it does not contain any
material previously published or written by another person except where due reference
is made in the text.
I further declare that the ethical principles and procedures specified by the
Psychology Department’s document on human research and experimentation have been
adhered to in the preparation of this report.
Mariel Sanchez-Rockliffe

ii
Abstract
Hermans’ theory of the dialogical self and the self-confrontation method (SCM)
are used to study the effect of migration on the self. A radical change in the social
environment, in this case migration, is shown to be reflected in the structure of the
dialogical self. Relationships between migrants’ I-positions relating to life in their
countries of origin and in Australia are explored.
The study is based on a sample of 38 migrants to Australia who perceived
themselves as having two identities, one for their country of origin, the other for their
new country. Participants were interviewed under the procedures of the SCM to elicit a
total of 1500 valuations (narratives) relating to their I-positions. These were scored
along the standard four SCM dimensions: self-enhancement (S), union-with-the-other
(O), positive affect (P) and negative affect (N). Participants also provided demographic
data, and self-reports of psychological well-being and distress.
The first study employed cluster analysis to group participants into four types.
“Progressives” steadily moved towards a valued goal; “Low-stables” experienced little
affective change, remaining at a lower level than “High-stables”, who likewise changed
little but were at a higher level of well-being. “Regressives” were the opposite of
“Progressive”. The types were then characterised in terms of self-confrontation indices,
demographics and psychological self-reports, and their differences identified. In the
second study participants were classified according to the nature of their valuations and
a transition matrix constructed linking the major themes of their valuations for country
of origin and for Australia. The transition matrix was statistically tested for the null
hypothesis that migration had no effect on I-position. The dialogical self was treated as
a hypothetical probability distribution of themes of valuations whereby the SCM is a
technique for generating a sample of valuations. The properties of the underlying
iii
distribution could then be inferred, as in standard sampling theory. The third study was
idiographic, analysing case studies representing each of the participant types identified
by the first study.
The main finding is the overall stability of the thematic content of valuations.
Where differences occur, they are intelligible. For example, many respondents seemed
to be responding positively to the peaceful, liberal social conditions they find in
Australia. The research corroborates previous research that identifies two modes of
biculturalism: compatible and oppositional. Low-stable and High-stable migrants
viewed their heritage and host cultures as complementary, whereas Progressive and
Regressive migrants viewed them as discrepant and conflicting. Many migrants had I-
positions with unambiguously different thematic content. This is evidence for Hermans’
dialogical view of the self and against the hypothesis of an underlying integrated self.
Most migrants showed self-enhancement (S) in their Australian than in their country of
origin I-positions, whereas union-with-the-other (O) did not differ significantly,
suggesting that migration accommodates self-enhancement (S) proportionately more
than union-with-the-other (O). Migrants varied in their psychological states in a
plausible and consistent way. In general, Progressive and High-stable migrants were
lowest on distress and highest on well-being; Regressive migrants were the opposite;
and the Low-stable migrants were intermediate. Lastly, good matches were found
between the case studies and the participant types they represented.

iv
Acknowledgments
It is pleasure and deep gratitude that I acknowledge the help, support and advice
extended to me in completing this thesis.
I am indebted to Swinburne University for the opportunity to undertake it, and for
their financial support and encouragement in attending international conferences
pertinent to my research.
To my supervisor, Glen Bates, I extend my deepest thanks for his guidance and
support. Without his patience and understanding this thesis would surely never have
been completed.
To my friend and mentor, James Symons, I extend my thanks for his untiring
efforts and advice in developing and testing hypotheses relating to the thesis. To my
husband, I extend my gratitude for his assistance in data management and editorial
matters. And to both I offer my sincere appreciation for their keen critical insights,
which were all the more valuable as they were drawn from disciplines outside my own.
Lastly, I extend my thanks to all those—friends, family and colleagues too
numerous to mention—who have stood by me.

v
Table of Contents
Declaration i
Abstract ii
Acknowledgments iv
Table of Contents v
List of Tables vii
List of Figures ix
CHAPTER 1: Introduction and Overview 1
CHAPTER 2: Self and Identity 3 2.1 James’ Theory of the Self 3 2.2 Symbolic Interactionism 6 2.3 Identity 11 2.4 The Dialogical Self 24 2.5 Summary 34
CHAPTER 3: Migration and Acculturation 36
3.1 Australian Migration 36 3.2 Acculturation 44 3.3 Acculturation Outcomes 58 3.4 Individualism versus Collectivism 67 3.5 Summary 73
CHAPTER 4: The Dialogical Self and Acculturation 75 4.1 Globalisation and the Illusion of Stability 75 4.2 A Dialogical Theory of Acculturation 82
4.3 Cultural Continuity 87 4.4 Research Aims and Questions 94
CHAPTER 5: Research Methodology 99 5.1 Participants 99 5.2 Self-report Measures of Psychological Distress and Well-being 104 5.3 Self-confrontation Method (SCM) 114 5.4 Procedure 118
5.5 Treatment of the Interview Data 121 5.6 Comparison with Previous Studies 127 5.7 Personal Reflections on the Experience of Migration 130
CHAPTER 6: Study 1 – Identification and Comparison of Migrant Groups 135 6.1 Preliminary Analysis 135
6.2 Distinguishing I-positions 143
6.3 Analyses of Participant Type 157
6.4 Comparison of Participant Types 170
vi
6.5 Summary 177
CHAPTER 7: Study 2 – The Dialogical Self as a Probability Distribution 180 7.1 The Dialogical Self as a Probability Distribution of Themes 180 7.2 Hypotheses 184 7.3 Analysis Based on Major Themes 185 7.4 Analysis Based on Self-confrontation Indices 195 7.5 Summary 199
CHAPTER 8: Study 3 – Case Studies 200 8.1 Euclidean distance 200 8.2 Case study: The ‘Progressive’ Migrant (Type 1) 204 8.3 Case study: The “Low-stable” Migrant (Type 2) 211
8.4 Case study: The “High-stable” Migrant (Type 3) 218 8.5 Case study: The “Regressive” Migrant (Type 4) 227 8.6 Summary 233
CHAPTER 9: General Discussion 236 9.1 Summary of the Empirical Work 236 9.2 Main Findings 239 9.3 Directions for Future Research 265 9.4 Conclusions 271
Glossary 273
References 275

vii
List of Tables
Table 3.1 Migrant stock: selected countries of large-scale immigration 39
Table 5.1 Characteristics of the sample, by gender 101
Table 5.2 Means and standard deviations for Years in Australia, Age and
Individualism, by gender 102
Table 5.3 Number of participants, by Hofstede’s individualism index 103
Table 5.4 Dimensions of Ryff’s Psychological Well-being Scale (PWB) 110
Table 5.5 Questions of the Self-confrontation method 116
Table 5.6 Composition of indices in the SCM 122
Table 5.7 Composition of major themes 125
Table 5.8 Empirical studies using the Self Confrontation Method 128
Table 5.9 Demographic difference between minority and majority cultures
for selected studies 128
Table 6.1 Means and standard deviations for the self-report measures 136
Table 6.2 Correlations among self-report measures 137
Table 6.3 Correlations among self-confrontation indices 139
Table 6.4 Correlations among self-reports and self-confrontation indices 141
Table 6.5 Means and standard deviations of self-confrontation indices 144
Table 6.6 Number of participants by cluster: country of origin 149
Table 6.7 Mean self-confrontation indices for country of origin I-position,
by cluster in country of origin 151
Table 6.8 Number of participants by cluster: Australia 154
Table 6. 9 Mean self-confrontation indices for Australian I-position, by
cluster in Australia 155
Table 6.10 Number of participants, by cluster in country of origin and in
Australia 157
Table 6.11 Mean self-confrontation indices for the I-position, by location
and participant type 159
Table 6.12 Tabulation of demographic characteristics, by participant type 171
Table 6.13 Mean and standard deviation of demographic characteristics, by
participant type 172
Table 6.14 Mean psychological distress, by participant type 173
Table 6.15 Mean psychological well-being, by participant type 174
Table 6.16 Mean self-confrontation indices for country of origin I-position,
by participant type 175
Table 6.17 Mean self-confrontation indices for the Australian I-position, by

viii
participant type 176
Table 7.1 Rules for assigning valuations to major themes 186
Table 7.2 Number of valuations, by participant type and major theme 187
Table 7.3 Thematic profiles showing “important” major themes, by
participant and location 190
Table 7.4 Average differences in proportions of major themes 194
Table 7.5 Thematic transitions 197
Table 7.6 Average differences in thematic scores (Australia minus country
of origin) 198
Table 8.1 Valuations with major themes, by location and period: Yoana 210
Table 8.2 Valuations with major themes, by location and period: Juan 217
Table 8.3 Valuations with major themes, by location and period: Luisa 225
Table 8.4 Valuations with major themes, by location and period: Carla 234
ix
List of Figures
Figure 6.1 Agglomeration schedule: cluster in country of origin 147
Figure 6.2 Dendrogram of 2-cluster solution: cluster in country of origin 148
Figure 6.3 Sum of squares from centroid: cluster in country of origin 150
Figure 6.4 Mean self-confrontation indices for country of origin I-position,
by cluster in country of origin 151
Figure 6.5 Agglomeration schedule: cluster in Australia 152
Figure 6.6 Dendrogram of 2-cluster solution: cluster in Australia 153
Figure 6.7 Sum of squares from centroid: cluster in Australia 154
Figure 6.8 Mean self-confrontation indices for Australian I-position, by
cluster in Australia 156
Figure 6.9 Mean self-enhancement for country of origin and Australian I-
position, by participant type 161
Figure 6.10 Mean union-with-the-other for country of origin and Australian
I-position, by participant type 162
Figure 6.11 Mean positive affect for country of origin and Australian I-
position, by participant type 163
Figure 6.12 Mean negative affect for country of origin and Australian I-
position, by participant type 164
Figure 6.13 Differences in self-confrontation indices for country of origin
and Australian I-positions, by participant type 165
Figure 6.14 Mean self-confrontation indices, by participant type 167
Figure 7.1 Hypothetical probability distribution of valuation themes:
oblique view and plan view (inset) 182
Figure 8.1 Euclidean distance between profiles for country of origin and
Australia based on mean self-confrontation indices of
valuations 202
Figure 8.2 Euclidean distance between profiles for country of origin and
Australia based on proportions of major themes of valuations 203
Figure 8.3 Proportion of valuations, by major theme and location:
Progressive migrants and Yoana 206
Figure 8.4 Mean indices of valuations, by location: Yoana 207
Figure 8.5 Mean indices of valuations, by location and period: Yoana 208
Figure 8.6 Proportion of valuations, by major theme and location: Type 2
participants and Juan 213
Figure 8.7 Mean indices of valuations, by location: Juan 214
Figure 8.8 Mean indices of valuations, by location and period: Juan 215
Figure 8.9 Proportion of valuations, by major theme and location: Type 3
participants and Luisa 220

x
Figure 8.10 Mean indices of valuations, by location: Luisa 221
Figure 8.11 Mean indices of valuations, by location and period: Luisa 222
Figure 8.12 Proportion of valuations, by major theme and location: Type 4
participants and Carla 229
Figure 8.13 Mean self-confrontation indices, by location: Carla 230
Figure 8.14 Proportion of valuations, by location and period: Carla 231

1
CHAPTER 1: Introduction and Overview
The overarching aim of the thesis is to strengthen the empirical evidence base of
the theory of the dialogical self. To this end, it explores the effect of migration on the
self within the theoretical context of Hubert Hermans’ theory of the dialogical self. It
does so by means of Hermans’ self-confrontation method (SCM), an investigative tool
widely used to access and explore the dialogical self. It shows how a radical change in
the social environment—in this case migration to a new country—is reflected in the
repertoire of I-positions of migrants. In so doing, it develops the nomothetic aspect of
the SCM by identifying significant associations between migrants’ I-positions relating
to life in their countries of origin, and their I-positions relating to life in Australia.
The thesis is structured as follows. Chapters 2, 3 and 4 review the relevant
literature. Chapter 2 (Self and Identity) explores the psychological concept of the self.
This is central to the thesis as it is what is accessed and measured by the SCM. The
thesis discusses current theories, including the theory of the dialogical self, and explores
the proposition that people possess multiple I-positions. Particular attention is paid to
previous studies of migrants.
Chapter 3 (Migration and acculturation) describes psychological theories of how
and why people migrate, and what happens to them at a psychological level when they
do. It explores the proposition that some migrants preserve their former cultural identity
while taking on a new one for the their country of settlement; it is “integrated” migrants
such as these who were the subject of the current research.
Chapter 4 (The Dialogical Self and Migration) brings together the previous two
chapters — one on theories of the self, the other on theories of migration and
acculturation. It shows how the theory of the dialogical self applies to migration and the
acculturative stress that it entails. From this synthesis, research questions are developed.
2
Chapter 5 (Method) explains how the data were gathered from guided interviews
of 38 migrants. The data collection process is described and the analytical procedures
set out. The data were analysed in two ways, termed Studies 1. 2 and 3, that differed in
approach.
Chapter 6, 7 and 8 present the results of three separate studies using the same data
set. Study 1 uses cluster analysis as a data reduction technique to group participants into
four types, and analyses their characteristics. Study 2 classifies participants into groups
on the basis of their “valuations” (to use Hermans’ terminology, which is defined later).
By treating the dialogical self as a hypothetical probability distribution of themes of
valuations, it permits formal hypothesis testing of transition matrices linking the
participants’ group in country of origin, with their group in Australia. Study 3 presents
four case-studies identified in the course of the preceding studies, one to exemplify each
of the four migrant types identified under Study 1.
Lastly Chapter 9 discusses the results of all three studies. In terms of external
validity, the thesis had the advantage of being based on a non-clinical respondent
sample; but its conclusions are limited to migrants of a particular kind (“integrated”),
and particular countries of origin and settlement. More work would be needed to extend
the validity of its conclusions. In terms of method, in Study 2 the thesis introduced a
novel way of characterising the dialogical self: as a frequency distribution of valuations.
A frequency distribution of this kind does not capture the full richness of the dialogical
self nor the I-positions that compose it, but it does offer powerful insights for exploring
the changes in the dialogical self that may be of value to future researchers, particularly
in the area of formal hypothesis testing.

3
CHAPTER 2: Self and Identity
This chapter identifies the antecedents of the theory of the dialogical self and
traces its evolution. It begins with William James’ theory of the self, since it was James
who arguably set the agenda for future social psychological inquiry about self and
identity (Suls, Tesser & Felson, 2000). Next, it discusses contemporary issues of self
and identity: the collective self, multiple selves versus a unified self, and identity—
personal, social, and bicultural. The concept of the dialogical self is then introduced.
Dialogical self theory, it is argued, is a powerful conceptual model for understanding
the process of acculturation in that it addresses weaknesses of previous acculturation
models, principally that of Berry (1990).
2.1 James’ Theory of the Self
James (1890) was not the first thinker to explore the nature of personal identity;
the Ancient Greek philosophers, notably Heraclitus, had pondered the notion. But James
was one of the first to articulate a distinction between the I (or self-as-subject) and the
Me (or the self-as-object)—a notion that came to be known as the duality of the self. For
James, the I was the knower, and the Me was the known, being the empirical aggregate
of everything objectively known about the self. James viewed the I as the subjective self
because it organised and interpreted one’s experiences.
According to Westen (1995), it is in James’ I that the sense of self resides; and it
is in James’ I that individuals experience themselves as the thinkers of their thoughts,
feelers of their feelings, and agents of their actions. Harter (1996) notes that, for James,
the “I-self” also demonstrated more specific types of awareness, such as a concern with
one’s personal continuity through time, and an awareness of the uniqueness of one’s life
experiences leading to the distinctiveness of oneself as a person. Although it was

4
essential for James to posit a knowing “I-self” as the active agent responsible for
constructing the “Me-self”, it is the Me that came to be labelled the self-concept and that
has received most attention in the field of self psychology (Harter, 1988; 1996).
James (1890) used the term “empirical self” to refer to the ways in which people
think about themselves:
The Empirical Self of each of us is all that he is tempted to call by the name of
me. But it is clear that between what a man calls me and what he simply calls mine
the line is difficult to draw. We feel and act about certain things that are ours very
much as we feel and act about ourselves. Our fame, our children, the work of our
hands, may be as dear to us as our bodies are, and arouse the same feelings and
the same acts of reprisal if attacked. And our bodies themselves, are they simply
ours, or are they us? (p. 291)
James’ (1890) definition of the “empirical self”—or “Me”—is broad:
In its widest possible sense, … a man’s Self is the sum total of all that he CAN call
his, not only his body and his psychic powers, but his clothes and his house, his
wife and children, his ancestors and friends, his reputation and works, his lands
and horses, and yacht and bank-account. All these things give him the same
emotions. If they wax and prosper, he feels triumphant; if they dwindle and die
away, he feels cast down—not necessarily in the same degree for each thing, but
in much the same way for all. (pp. 291–292, emphasis original)
This definition is broad enough to encompass most aspects of personhood
(Brown, 1998).
James subdivided his Me into three: the spiritual Me (the inner self or the
psychological self) at the top, the material Me (tangible objects, people, or places
designated as “my” or “mine”) at the bottom, and the social Me in the middle. It is
James’ notion of the social Me that appears to be the forerunner of most psychological
research and theories concerning personal identity. In James’ conception, the social Me

5
consists of the recognition a person receives from others, and hence there exists a
different social Me for each group whose opinion one is concerned about:
… a man has as many social selves as there are individuals who recognise him
and carry an image of him in their mind… But as the individuals who carry the
images fall naturally into classes, we may practically say that he has as many
different social selves as there are distinct groups of persons about whose opinion
he cares. He generally shows a different side of himself to each of these different
groups. (p. 294)
It is through the recognition of others that what he calls “the different sides of
oneself” begin to develop. Thus, by having different people or groups respond to one in
different ways, one begins to acquire various social roles—that is, distinctive patterns of
behaviour that are displayed in, and because of, different social situations.
For James, each of these social selves (for instance, “mother” versus “student”)
has its own set of expectations and behaviours; which are sometimes at variance and
occasionally in conflict due to competing demands from others.
Many a youth who is demure enough before his parents and teachers, swears and
swaggers like a pirate among his ‘tough’ young friends. We do not show
ourselves to our children as to our club-companions, to our customers as to the
laborers we employ, to our own masters and employers as to our intimate friends.
From this there results what practically is a division of the man into several
selves; and this may be a discordant splitting, as where one is afraid to let one set
of acquaintances know him as he is elsewhere; or it may be a perfectly
harmonious division of labor, as where one tender to his children is stern to the
soldiers or prisoners under his command. (p. 294)
For James’, how people think of themselves largely depends on their social roles
(Roberts & Donahue, 1994). Difficulties arise, however, where roles clash (Brown,
1998). People furthermore seek recognition; they affiliate, he argued, not just for the
company but to seek recognition and status, otherwise known as social climbing.
6
A man’s Social Self is the recognition which he gets from his mates. We are not
only gregarious animals, liking to be in sight of our fellows, but we have an innate
propensity to get ourselves noticed, and noticed favorably, by our kind. No more
fiendish punishment could be devised, were such a thing physically possible, than
that one should be turned loose in society and remain absolutely unnoticed by all
the members thereof. (p. 293)
These social selves have come to be referred to as social identities. Deaux, Reid,
Mizrahi, and Ethier (1995) distinguished five types: personal relationships (husband,
wife etc.), ethnic or religious affiliation, political affiliation, stigmatised group, and
vocation. Some, one is born with, others are attained. So for example, a person might in
this way see herself as “mother”, “Hispanic”, “Catholic”, “left-wing” and a “teacher”.
2.2 Symbolic Interactionism
Symbolic interactionism is a conceptual model of the self-concept first conceived
by Cooley (1902) and Mead (1934). It is concerned with the process of socialisation,
that is, how culture is acquired and perpetuated, and how people come to adopt the
values, standards, and norms of the society into which they are born. It posits that the
self-concept, being a product of social interaction with others, is in constant flux. For
both Cooley and Mead the self is fundamentally social in origin. Mead held that social
interaction creates an individual’s sense of self. People learn to take the role of others
and in this way learn who they are and how they should behave. Cooley, with his notion
of the “looking glass self”, held that people obtain a sense of who they are by how
others perceive them. The implication of their theories for the present thesis is that since
society itself is not constant (as is the case for migrants), the change of environment
creates a new self, which arises as a result of the new social commerce in the new
society; migrants experience a social rebirth in fact.
7
Cooley (1902), who gave a sociological perspective to the self, acknowledged that
he was strongly influenced by William James. He developed a conceptual framework
for dealing with the relationship between self and society, which he considered to be
aspects of the same whole. In explaining the origin of the self, he said, “self and society
are twin born … and the notion of a separate and independent ego is an illusion” (p. 8,
cited in Breakwell, 1983). The mind is a social construct, and society a mental
construct, and the relationship between them is best understood by the metaphor of a
“looking glass self”, by which he meant that what one internalises as one’s own is based
on information about oneself that one receives from others (Weinreich, 2003). In other
words, people see themselves as others see them because they learn about themselves
from others, who act as mirrors in which a person sees himself or herself.
James’ idea of the formative effect of the responses of others on the development
of a social self was pursued by social psychologist George Mead, who in a development
of Cooley’s theory elaborated on James’ social self and produced a more extensive
theory of its development (Mead, 1934). Mead differed markedly from James in his
conception of the social self: for James it was one constituent of the self; for Mead it
was the entire self, for the self is wholly a social construct, and is created particularly
through the use of language (Breakwell, 1983). According to Mead (1934, p 135):
the self is something which has a development; it is not initially there, at birth, but
arises in the process of social experience and activity, that is, develops in the
given individual as a result of his relations to that process as a whole and to other
individuals within that process.
Mead (1934) conceptualised the self “as that which can be an object to itself, is
essentially a social structure, and it arises in social experience” (p. 140). The person gets
to know himself only through others; that is, he cannot experience himself directly as
such, “but only indirectly, from the particular standpoints of other individual members

8
of the same social group, or from the generalised standpoint of the social group as a
whole to which he belongs” (p. 138). In this way Mead affirmed the primacy of the
social context—particularly the family—in which an individual is born and socialised
that defines a station in life in terms of kinship relationships, race and class. For Mead
the self-concept arises in social interaction. It is in the course of this socialisation that
people learn to take the “perspective of the other”, to place oneself in the other’s shoes.
According to Mead, the self is defined through linguistic exchanges (that is, symbolic
interactions) within communities. Initially people take on the roles of the significant
others in their immediate world: parents, playmates, and so on. Over time, they extend
their framework to take on the role of the generalised other—their culture. This abstract
and generalised other represents the broader society and culture into which they are
born. Socialisation is conceived as role learning; it forms a person’s identity as a
consequence of social interaction. The acquisition of roles results in the development of
self-conception. In time, the person is able to view the self, as it were, from outside the
self—as mirrored reflections of others. People learn how their culture interprets
gestures, and in this way they develop a self-concept: they see themselves through a
cultural lens. Through the learning of a culture (that is, a sort of symbolic “language”)
one can both predict the behaviour of others and anticipate the predictions that others
make of one’s own behaviour (Mead (1934); Breakwell, 1983). The opposite is also
true: migrants and others, who are immersed in a foreign culture, are unable to gauge
others’ reactions, and hence may become unsure of who they really are.
Mead (1934) conceptualised his “looking glass self” as a consensus about the
self’s typical characteristics as reflected by the “generalised other” that represents an
amalgamation of others who view the self’s enduring ways. The Meadian “self” is
firmly situated within a nexus of others, without which there would be no notion of
9
“self”. Identities are given by the roles people occupy as defined by society—one’s
identity as “mother”, “student”, “migrant”, and so on. In Mead’s symbolic interactionist
view of the self, identities are not self-contained but are the products of social
interactions (Weinreich, 2003). Thus James’ (1890) argument that the individual has “as
many social selves as there are individuals who recognise him” (p. 178) is further
elaborated in Mead’s view that multiple roles are a normal consequence of life in a
complex social world.
Mead’s focus was primarily on the Me, or self as object. With his “generalised
other”, Mead claimed to have solved the problem of how one can be an object to oneself
(Burns, 1979). He differentiated between the self as known (the Me) and the self as
knower (the I) by the context in which each operates. The Me operates in the context of
group membership, status, roles, and interactions with others; the I operates in the
context of asserting individuality:
The simplest way of handling the problem would be in terms of memory. I talk to
myself, and I remember what I said and perhaps the emotional content that went
with it. The “I” of this moment is present in the “Me” of the next moment. There
again I cannot turn around quick enough to catch myself. (Strauss, 1956, p.242).
So as Mead’s I moves along, it leaves Me in its wake and provides for the self a
way of thinking about the self—self-knowledge. Burns (1979) noted that Mead’s “I-
Me” dichotomy differs in a major way from James’ initial formulation: Mead’s I is the
impulsive tendency, the undisciplined, disorganised potential of the individual (almost
parallel to the Freudian id). Every behaviour commences as an I but evolves into a Me
as it comes under the influence of society’s constraints. In Mead’s analysis, the Me is
essentially a social construction, eminently compatible with James’ social self.
While James, Cooley, and Mead often refer to the self in the singular, its lived
presence in the world of everyday life needs to be plural (Holstein & Gubrium, 2000).
10
James called attention to the socially manifold self when he stated: “Properly speaking,
a man has as many social selves as there are individuals who recognise him and carry
an image of him in their mind” (emphasis in the original, p.189-190).
Mead (1934) saw the self as developing out of social interactions and, as in
James’ theory of multiple social selves, allows for the existence of several selves within
one person: “… we divide ourselves up in all sorts of different selves with reference to
our acquaintances. We discuss politics with one and religion with another. There are all
sorts of different selves answering to all sorts of different social situations” (p. 140).
As Holstein and Gubrium (2000) asserted, James’, Cooley’s, and Mead’s selves
were plural because their attention was focused on the varied “we’s”, “us’s”, and
“them’s” that people are to one another as they go about their daily lives. The social self
was always the “self-at-hand, the socially operative sense of who we are to ourselves
and to others” (p. 20). Both Cooley and Mead stress the role that significant others play
in shaping the self-concept through social interactions. Here the individual considers not
only feedback from others, but the process through which more generalised attitudes
towards the self are adopted. Cooley moreover hints at a developmental process of
internalisation whereby the reflected appraisals of others are incorporated in the form of
enduring attitudes about the self—a process with implications for the stability of the
self-concept. Given that the self emerges in the context of a complex, organised,
differentiated society, it too must be complex, organised, and differentiated, reflecting
Stryker’s (1980) view that “self reflects society”, and James’ (1890) notion that an
individual has as many selves as social roles . As Stryker (1980) noted, a person has “an
internalised positional designation” (p.60), for each role the person holds in society.
To summarise, this section has reviewed some important antecedents of many
current theories of the self that hold that individuals’ self-concepts derive meaning

11
through relationships with other people and groups. The next section examines
contemporary issues that have emerged from these historical roots and are relevant to
the present thesis’ emphasis on understanding the philosophical and theoretical
underpinnings of dialogical self theory.
2.3 Identity
Personal versus social identity: one self or many? The core tenet of the theory
of the dialogical self is that individuals have within them not one self but many
(Hermans & Kempen, 1993). It is therefore appropriate to investigate where this notion
arose, and how well-founded it is. This section outlines prominent psychological and
sociological theories that embody this idea.
It was James (1890) who first drew the distinction between the spiritual self
(being one’s inner or subjective being and dispositions) and the social self (being the
recognition one receives from others). Since then, psychologists and sociologists have
long debated whether the personal (internal) or social (external) aspects of identity are
more important in understanding human behaviour. Tappan (1998) pointed out that
much of the theoretical and empirical work on the self has been conducted from two
perspectives: psychological and sociological. The multiplicity of identity, or senses of
self, was proposed early in the twentieth century. As noted earlier, James (1890)
observed that there may be incompatibility between certain role-related selves leading
to the “conflict of the different Me’s”.
By the mid-twentieth century, however, the consensus of opinion had reverted to a
unitary conception of the self. In the explicitly psychological perspective (Damon &
Hart, 1988), theorists such as Jung (1957) and Maslow (1961) asserted that a person is
most truly his or herself and closest to his or her authentic identity when experiencing a
deep sense of personal uniqueness. Allport, Rogers, and Maslow, for example, spoke of
12
the self in the singular; they accepted that a person might exhibit subsidiary social
selves or roles, but saw them as less real, central, or authentic (Martindale, 1980). And
although Jung (1956) and Assagioli (1976) accepted that people were indeed possessed
of multiple subselves or subpersonalities, they argued that these are (or could be)
integrated in a deeper-level unitary self. In such a paradigm, identity was simply a
personal characteristic, and its development a result of internal cognitive processes.
Debate over the unity of the self is not new. As Martindale (1980) observed, it has
concerned scholars for centuries. Does a person have a single dominant and enduring
self, or a multiplicity of subselves that compete for control? In tracing the dominant
viewpoints about the self through time, he noted that in the early nineteenth century the
theoretical consensus, exemplified by theorists such as Kant and Bain, favoured a
unitary self or transcendental ego. But by the end of the century opinion had swung the
other way: psychiatrists and psychoanalysts explicitly denied the existence of a
superordinate self and instead postulated the existence of multiple selves. The
phenomenon of multiple personality was adduced as evidence; supposedly, in the
normal personality these different selves were elicited appropriately as circumstances
required, but in the abnormal personality one or more attained an unwonted autonomy
(Martindale, 1980). Other social psychologists and sociologists defined identity almost
exclusively in social terms: “Identity is socially bestowed, socially sustained, and
socially transformed” (Berger, 1963, p.98). They focused mainly on the social
component of identity because “the shaping of one’s identity is dependent on the
valuations (sanctions, reinforcements) placed on one’s public conduct by relevant
others” (Sarbin & Allen, 1968, p.550).
Sociological role theorists such as Goffman (1959) took the distinction between
components of identity to its logical extreme. They maintained that people adopt short-
13
term selves, donning them as roles and shedding them as easily. People are actors in a
drama where, for a time, the role dictates the appropriate actions. Goffman did not
explain who the actors are behind the roles they play, nor who they are when no role is
available, for according to Goffman they always have roles to perform. As Breakwell
(1983) noted, one could conclude from Goffman that the individual is nothing but an
agglomeration of roles, and that the self is always socially constructed. That individuals
present differently in different social settings casts doubt on the stability of a self that
transcends social roles. Gergen (1968) argued as much: “the popular notion of the self-
concept as unified, consistent, or perceptually whole psychological structure is possibly
ill-conceived” (p. 306). In his experiments he showed that individuals do indeed modify
their self-presentation, and also the way they see and experience themselves, with
different people in different situations; and he concluded: “The individual has many
potential selves. He carries with him the capacity to define himself as warm or cold,
dominant or submissive, sexy or plain. The social conditions around him help determine
which of these options are evoked.” (Gergen,1972, p.66). By maintaining that the self
consists solely of social roles, theorists such as Gergen (1982, also Shotter & Gergen,
1989), deny the existence of a separate self; they see the self and identity as exclusively
social and lacking personal agency or authenticity. Other theorists find this position
extreme, however, and adhere to James’ position that a person’s social identities share
an enduring sense of self (Brown, 1998).
Further evidence for the multiplicity of the self was provided by the Twenty
Statements Test (TST) developed by Kuhn and McPartland (1954). Linking identity to
the question “Who am I?”, they found that responses are typically couched in terms of
social positions or social roles that respondents perform (or aspire to), that is, they name
their “masks” or personas (defined as that aspect of one’s personality that one displays
14
to others). Since a person occupies multiple social positions and performs multiple
social roles, it follows that he or she would have multiple social identities. Indeed, Kuhn
and McPartland further point out that when asked to give twenty separate answers to the
question “Who am I?”, nearly all participants named masks or personas, and many
named up to twenty. Gecas (1973, 1982; Gecas & Schwalbe, 1983) found that research
using the TST has focused on socialisation into the identity (e.g., gender-roles),
evaluations of the identity (e.g., racial and ethnic), and role transitions (e.g., adjustment
to widowhood, identity loss in the family).
Social roles also feature in research by Rosenberg and Gara (1985), who argued
that personal identity consists of a person’s various social and “personal” roles—kinship
roles, occupational roles, religious affiliation, group membership, intellectual concerns,
and so on. Thus, a person could, for example, have an identity consisting of such roles
as mother, stockbroker, Catholic, university student, avid reader, and so on. Each role,
or “identity” as Rosenberg and Gara call them, is “an amalgam of features—personal
characteristics, feelings, values, intentions, and images—experienced by the individual”
(p. 90) that can be enacted in different situations. They conceptualised relations between
identities in various ways, including that of subset-superset and disjunction. The subset-
superset relation occurs when one identity includes all the features of another identity;
thus someone’s identity as a mother might include all the features of her identity as a
caregiver. The disjunction relation occurs when two or more identities have nothing in
common, as where the identity of a devout church-goer might share no features with the
identity of an aggressive stockbroker. Although their main concern is with the social
roles played by the individual, these roles are defined in terms of feelings, values, and
so on, experienced by the individual rather than in terms of social interaction. This
resembles James’ (1890) view that the social self is in the mind, the major difference

15
being that for Rosenberg and Gara the social self is in the mind of the person playing
the role, while James’ social self is in the minds of those who recognise the person.
In another insight, Markus and Kunda (1986) noted that “the self is not a unitary
structure or even a generalised average of images and cognitions. Instead, the self-
concept encompasses … a wide variety of self-conceptions—the good selves, the bad
selves, the hoped-for selves, the feared selves, the not-me selves, the ideal selves, the
possible selves, the ought selves” (p. 858). They reason that at any given moment
people function according to a working self-concept: the most currently available view
of ourselves.
In his more recent discussion of the postmodern era, Gergen (1991) observed that
in the modern world, people confront “a swirling sea of multiple social relationships”.
They adapt by constructing multiple selves, but sometimes at a cost to themselves, for
their different selves may not necessarily harmonise. Their enduring, core self is
compromised by playing the “social chameleon”. The postmodern identity, dubbed
“multiphrenia” by Gergen (1991), is “the splitting of the individual into a multiplicity of
self-investments” (p. 73–74). He claimed that “In place of the enduring and identifiable
self, we find fragmentation and incoherence… the postmodern sensibility questions the
concept of ‘true’ or ‘basic’ self, and the concomitant need for personal coherence or
consistency” (p. 172–178).
Lifton’s (1993) postmodern “protean self” (named after Proteus, the shape-
shifting Greek god), develops the same theme. The protean self emerges out of
“confusion, from the widespread feeling that we are losing our psychological moorings”
(p. 1); “the older version of personal identity, at least insofar as it suggests inner
stability and sameness, was derived from a version of tradition culture in which
16
relationships to symbols and institutions are still relatively intact—hardly the case in the
last years of the twentieth century” (p. 4).
In summary, this section outlines prominent theories that hold that within every
individual there is not a single self but many. This notion is a central to the concept of
the dialogical self, which holds that not only are individuals composed of multiple
selves, but those selves are in constant dialogue (Hermans & Kempen, 1993). The
attraction and strength of dialogical self theory is that it integrates these multiple strands
of thought into a single and unifying theoretical framework that is amenable to
empirical testing, conceptual refinement, and widespread application. It is furthermore
for this reason that dialogical self theory underpins the exploratory tools used in this
thesis to explore the acculturative aspects of migration.
Identity as memory. The previous section discussed the multiplicity of the self;
this section broaches another key strand—identity as continuity of memory. Both are
core aspects of the theory of the dialogical self, since the dialogical self is accessed
through narratives, which themselves are founded in memory. As stated before, the
singularity and unity of personal identity has long held a central position in Western
philosophical and psychological thought (Tafarodi, Lo, Yamaguchi, Lee, & Katsura,
2004). James (1890) challenged this orthodoxy by arguing for a plurality of selves:
“Each of us, when he awakens says, here’s the same old self again, just as he says,
here’s the same old bed, the same old room, the same old world” (p. 334).
While Tafarodi et al. (2004) agree that James’ “same old self” is the familiarity of
some “formless, elusive I”, they recognise that it is also much more. It lies in the
perceived continuity of the traits, intentions, beliefs, attitudes and emotions that people
use to define themselves in society (Tafarodi et al., 2004). So, although people conduct
17
themselves differently according to the social demands of the circumstances, they do
not lose their essential sense of self.
People are not static. Just as James’ material Me grows old, so his social Me
evolves: roles are added and moulded, and old ones discarded (James, 1890). One can
assume that James’ spiritual Me changes as well. Over a lifetime, hardly a single aspect
of the person remains the same. Nevertheless, most people have an unmistakable sense
of continuity. James (1890) was one of the first to consider the sense of personal
continuity and the sense of distinctness from others as constructs of identity. For James
(1890), the sense of personal identity was most closely associated with the I or the “self-
as-knower”. A stable self-identity derives from a sense of continuity of the self-as-
knower. According to James, “each of us spontaneously considers that by the “I” he
means something always the same” (1961, p.63). James believes that “the worst
alterations of the self” (1948, p.207) are associated with disruptions of the sense of
personal continuity. For James, this feeling of individuality derives from the subjective
nature of the self-as-knower: “Other men’s experiences, no matter how much I may
know about them, never bear this vivid, this peculiar brand” (1961, p.71). It is this
special feeling associated with one’s own experience which is the basis for one’s sense
of personal uniqueness. But according to James the identity of self-consciousness across
time is “only a loosely construed thing”: James gives the example of adults failing to
recognise photos of themselves as children. In this case, the disjunction is not only due
to a lack of memory for “what it was like to be” (Nagel, cited in Tafarodi et al., 2004)
but also to dissimilarity in physical appearance. People furthermore may change in other
ways and so revise aspects of their inner selves, and accordingly revise specific beliefs
about who and what they are (Bem, 1972).

18
Giles (1997) commented that the way in which James (1890) developed his
argument about personal identity as memory was by noting that everyone is familiar
with an aspect of existence—a central nucleus or core—that seems peculiarly one’s
own. The I is the stream of consciousness that creates one’s knowing of the Me, which
is the aggregate of things known about the self. James’ I is fundamentally a stream of
thoughts in which each thought can “remember” the one before, and it is this that lends
a sense of continuity across time. James’ solution to understanding personal identity is
that personal identity is to be found in treating the spiritual self in a concrete way—that
is, treating it as a seamless flow of uninterrupted perceptions. Each perception flows by
and they are joined because they are part of the same stream of consciousness. It is this
consciousness that provides a feeling of continuity of the self. Even if there are gaps in
this continuity (due to sleep or otherwise) there is a sense in which consciousness before
the gap “goes together with” consciousness after the gap. For James, consciousness
coheres over time, and mainly through the effects of memory (Apter, 1983).
Moreover, according to James (1890), it is the feeling associated with each
perception that provides the tie that binds them. Each perception carries a distinctive
feeling that people recognise as theirs and theirs alone:
Each thought, out of a multitude of other thoughts of which it may think, is able to
distinguish those which belong to its own [self] from those which do not. The
former have a warmth and intimacy about them of which the later are completely
devoid … (p. 330).
So, for James, personal identity is one’s uninterrupted memory for prior
perceptions and the affect that accompanied them. Giles (1997):
A uniform feeling of “warmth”…pervades [our various selves] and this is what
gives them a generic unity, and makes them the same kind…where the
19
resemblance and continuity are no longer felt, the sense of personal identity goes
too. (p. 335).
For James (1890), it is not only the continuity of consciousness but also the
continuity of warmth and intimacy of a person’s memories that underlies personal
identity. In this way, personal identity requires more than memory; it requires an ability
to recapture the feelings associated with the experience:
If a man wakes up some fine day unable to recall any of his past experiences, so
that he has to learn his biography afresh, or if he only recalls the facts of it in a
cold abstract way … he feels, and he says that he is a changed person. (p. 336)
According to James, then, one’s sense of personal identity is underlain by one’s
autobiographical memories and what it felt like to experience them. The notion of
identity as a felt sense of similarity and continuity became better known through the
work of Erikson (1950, 1956, 1959), who sought to establish a bridge between personal
and social phenomena:
The term identity expresses a mutual relation in that it connotes both a persistent
sameness within oneself (self-sameness) and a persistent sharing of some kind of
essential character with others. At one time it [identity] will appear to refer to a
conscious sense of individual identity; at another, to an unconscious striving for a
continuity of personal character; at a third, as a criterion of the silent doings of
ego-synthesis; and finally, as a maintenance of inner solidarity with a group’s
ideals and identity. (p. 102)
In this way he characterised identity by two essential experiences: an enduring
and unique personal existence over time, and the sharing of an essential unity at some
level with others. In his definition, Erikson follows the general definition—of
continuously being one and the same person—but adds a social component, namely the
recognition of this sameness and continuity by others and the wider sociocultural
context the person lives in (Erikson, 1950). His conception of identity invokes the
20
interplay of individual and context: a person can feel embedded in his or her context. In
contrast, Erikson (1964) has discussed the feelings of “uprootedness” of migrants. They
are missing that sense of embeddedness.
In conclusion, the theory of the dialogical self, which is elaborated later, inherits a
long philosophical and psychological tradition that holds that identity is founded in
memory—a crucial aspect of dialogical self theory and the interview technique that is
employed to access it.
Identity as narratives. The previous section argued that identity is founded in
memory. This section explores how memories are accessed and marshalled to create
identity, and how both memory and identity are in a sense social; for memory comes
alive in the act of narration, and identity is realised when the self is presented to another.
Human identities are emergent constructs based on social interactions over a
lifetime. Narratives on the other hand are specific to time and place, use a particular
language, and refer to a particular stock of historical conventions, beliefs and values
(Crites, 1971). Narrative theories have in the past tended to focus on textual analysis
(such as rhetorical devices and form). More recently, theories have focused on the
meanings, relationships and socio-cultural context (such as motives and plots) (Gergen
& Gergen, 1986; Hermans & Hermans-Jansen, 1995; McAdams, 1985, 2014;
Polkinghorne, 1988, Hoshmand, 2005). For example, Mancuso and Sarbin (1983) focus
explicitly on the integration and coherence of self. The individual is the narrator of the
story, constructing plots that give meaning to important events. They distinguish
between the “I” as narrator, agent, organiser, and the “me” as actor, player, performer;
and “emplotment” is the process by which meaning is assigned so as to develop a
unified story:
21
The underlying assumption in employing the narrative as a root metaphor is:
Human beings think, perceive, imagine, and dream according to a narrative
structure … When one probes into the ordered or patterned perceptual response, it
becomes immediately apparent that a plot is imposed on the disparate inputs …
Only when the raw data are placed in the context of a plot structure does the
possibility exist for establishing a coherent plot. (p. 234-235).
The self-as-a-story-or-theory approach, also known as the narratology approach
(Shotter & Gergen, 1989, McAdams, 2014), has two central tenets. One is the appeal to
an informal story that is a theory of self; it is the story that the self uses to explain to the
self and to others why one is as one is, and why one acts as one does. For example, a
person’s much rehearsed story of disadvantage and abuse that explains a proneness to
being victimised. The second is the notion that certain people express a dominant view
of themselves and the world in terms of their story, to which all else is subordinated; for
example a story in which one is a victim of circumstances that are continually recalled
as being the reason for all subsequent experiences—a “poor me” dominant story.
In the “identity is a life story” approach (McAdams, 1998), “the problem of
identity is the problem of arriving at a life story that makes sense—provides unity and
purpose—within a socio-historical matrix that embodies a much larger story” (p. 18.).
Thus, the individual recurrently constructs and reconstructs the story that is ultimately
the answer to the existential question, “Who am I?” Furthermore, “the story provides a
coherent narrative framework within which the disparate events and the various roles of
a person’s life can be embedded and given meaning” (p. 19). McAdams’s narrative
approach to identity focuses explicitly on the integration and coherence of self, which
are key aspects of the sense of identity in Erikson’s terms. McAdams (1996) argued that
people organise their life stories in the context of a personal narrative. The individual is
the narrator of the story, constructing plots that give meaning to important events.
22
Adopting a symbolic interactionist perspective, Gergen and Gergen (1988) hold
that self-identity grows out of the narratives people tell to others and to themselves.
Stories, they contend, “serve as a critical means by which we make ourselves
intelligible within the social world … We use the story form to identify ourselves to
others and ourselves’ (p. 35). People’s experiences of self and others, the Gergens say,
is not based on “a series of discrete, endlessly juxtaposed moments, “but is instead
derived from “goal-directed, coherent’ narratives in which they attempt to “understand
life events as systematically related”. And moreover, they also emphasise that
“narratives of the self are not fundamentally possessions of the individual; rather they
are products of social interchange: “Narratives are essentially social constructions,
undergoing continuous alteration as interaction progresses” (pp. 20-21).
Gergen and Gergen (1988) proposed some of the rules of narrative form and the
types of narratives that are commonly employed, maintaining that cultural conventions
determine the validity of the story rather than the “absolute match between word and
thing”. Narrative structure often revolves around temporal forms or recurring sequences.
These rules of narrative structure lend coherence and directionality to a life. Plots are
made chronologically linear with respect of evaluative shifts over time; and within
them, sub-plots and overarching themes may involve stability, progressive change, or
regressive change (Gergen & Gergen, 1983). A paradox of human relationships,
however, is that “functioning viably in a relationship often depends on one’s ability to
show that one has always been the same, and will continue to be so, and yet,
contrapuntally to show how one is continuing to improve” (Gergen & Gergen, 1983,
p.266). Focusing on the protagonist’s developmental movement, Gergen and Gergen
(1988) differentiated between “progressive” narratives, where there is a positive change
in self-evaluation; “regressive” narratives, where there is a negative change in self-
23
evaluation: and “stable” narratives (elaborated later), where there is no change in self-
evaluation. In their schema, a life story establishes the main plot and, within it, which
incidents are construed as advancing (“progressing”), retreating (“regressing”) or
digressing. They proposed that progressive and regressive narratives be viewed as
moving through a two-dimensional space. One dimension refers to its evaluation,
positive or negative, the other its direction: “progressive”, “regressive” or “stable”. In a
progressive narrative, events are linked “in such a way that one steadily progresses
toward a goal” (p. 27): and in a regressive narrative one is “continuously moving away
from a valued state” (p. 27). Thus Gergen and Gergen’s (1986) framework for the
analysis of progressive and regressive narrative structures accounts for direction, where
direction has to do with moving towards or away from the goal.
Gergen (1991) noted that in different situations people view themselves
differently: that is, they make up a different story about themselves. The multiplicity of
the self here is understood to follow from the proposition that individuals harbour the
“capacity for a multiplicity of narratives forms” (Gergen & Gergen, 1988, p.35). They
emphasise the changes in self-identity as the person engages in different interactions in
different situations. The point is that in the postmodern world, our main task is just to be
different people in different situations.
Because narratives are communicative acts with a particular listener in mind, the
same story requires major adaptation to appeal to different audiences, who value
different things and judge narratives by different criteria. It is commonplace to tell
conflicting stories in different contexts, as the different voices in Hermans’ dialogical
self cannot all be satisfied with the same narrative (Hermans, 1996a). Thus, the demand
for narrative consistency, highlighted by McAdams et al. (1997), clashes with the need
to please different audiences with different accounts of the same actions. As has been

24
shown, some contemporary theorists challenge the view that the mature individual
necessarily strives towards a consistent identity. Instead, they argue that personal
sameness and continuity are a social construct, and since modern societies are
constantly in flux, personal sameness is no longer a sign of maturity (Hermans,
Kempen, & Van Loon, 1992; Gergen, 1991; Lifton, 1993; Sampson, 1995).
To summarise, the literature contrasts traditional and post-modern conceptions of
personal identity: the former holds that good mental health is founded on a largely
coherent and harmonious life story; the latter holds that lives—even healthy lives—are
messy and disorganised in narrative terms.
2.4 The Dialogical Self
Since the 1980s there has been a resurgence of interest in the self (Harter, 1988).
New models have proliferated, though researchers have sought guidance from past
scholars, typically paying intellectual homage to James (1890) and symbolic
interactionists such as Cooley (1903) and Mead (1934). Hermans’ (1992) theory of the
dialogical self is one of the more influential models that have appeared since that time.
As previously discussed, it draws on James’ (1890) distinction between I (the “self-as-
knower”) and Me (the “self-as-known”) as the two main components of the self. This
section describes the building blocks of dialogical self theory, and explains how they fit
together.
I-positions and voices. According to Hermans (1996a), dialogical self theory
… conceptualized the self in terms of a dynamic multiplicity of relatively
autonomous I positions in an imaginal landscape. In this conception, the I has the
possibility to move, as in a space, from one position to the other in accordance
with changes in situation and time. The I fluctuates among different and even
opposed positions and has the capacity to imaginatively endow each position with
a voice so that analogical relations between positions can be established. The

25
voices function like interacting characters in a story, involved in a process of
question and answer, agreement and disagreement. Each of them has a story to tell
about his or her own experiences from his or her own stance. As different voices,
these characters exchange information about their respective Mes, resulting in a
complex, narratively structured self (p.33).
This quote captures the two main ways in which Hermans’ view differs from that
of James. Where James saw the I “as a unifying principle that is responsible for
organizing the different aspects of the Me as parts of a continuous stream of
consciousness” (Hermans, 2001, p. 246), Hermans sees it as possessing “the possibility
to move from one spatial position to another in accordance with changes in situation
and time” (p. 248). The distinction is one of stasis versus flux: James’ I is continuous
and corporeally bound—both essentially static notions; Hermans’ I possesses
discontinuity as well as continuity, and combines temporal characteristics with the
spatial—both essentially dynamic.
Dialogical self theory furthermore posits that multiple I-positions can be occupied
by the same person in space and time (Hermans, 2001), giving rise to identities that are
fluid and multiple. At the same time it accepts a self that remains continuous through
space and time (Richardson, Rogers, & McCarroll, 1998). In this way it belongs to the
“multiple selves” school of thought in the sense that it echoes ideas current at the turn of
the century, such as those of James, to which Hermans and colleagues (Hermans,
Kempen & Van Loon, 1992; Hermans & Kempen, 1993) pay explicit homage; but it
also transcends them.
Derivatives of I-positions. The concept of the I-position has generated a number
of derivative concepts, of which three—the “meta-position”, the “coalition” of I-
positions, and the “third position”—are central to a dialogical understanding of
acculturation.
26
I-positions form a “society of mind” (Hermans (2004_, p. 2), and like members of
any society they can form coalitions and hierarchies. Primary I-positions can therefore
be grouped in the mind of the observer into “coalitions” of I-positions. Likewise, “meta-
positions” stand in a hierarchically superordinate relation to coalitions of primary I-
positions in that they allow individuals to observe their own I-positions “from the
outside, as an act of self-reflection” (Hermans and Hermans-Konopka, 2010; p. 9).
According to Hermans (2001)
… a meta-position has several specific features: it creates a certain distance
toward the other positions; it provides an overarching view; it enables the
participants to interrelate the positions as part of their personal history; it provides
an opportunity for evaluating the several positions and their organization; and,
finally, the direction of change and the importance of one or more positions in
view of future possibilities become apparent. In summary, the meta-position
contributes, more than most other positions, to the integration and unity of the
repertoire. (p. 354)
In this manner, acculturating individuals are able to group their I-positions into
two coalitions (among others), one comprising I-positions that relate to their country of
origin, the other to Australia; and to survey each coalition independently but as a
collectivity by means of a meta-position unique to each coalition. It is this integrative
function of meta-positions and coalitions of I-positions that render the concepts crucial
in understanding acculturation.
Lastly, “third positions” (Hermans and Hermans-Konopka, 2010) are formed from
the dialogical creative interaction of I-positions. Far from being a simple amalgamation
of their formative primary I-positions, third positions may be completely or partly
novel, whereby ‘relationships of tension are transformed into conciliation and creation’
(Surgan & Abbey, 2011; p. 165). Surgan & Abbey and Valsiner (2002) propose various

27
mechanisms by which this takes place in the case of transcultural migrants, many of
which fall under the broad category of cultural “hybridisation” (see Chapter 4).
Emotional voices. “Dialogical voices can be reasoned or emotional” (Hermans,
2010; p. 41). It is natural to suppose that the “reasoned” content of dialogical voices
should matter, as reason facilitates rational dialogue. But not all dialogue is rational in
the narrow sense. By colouring the dialogical relationship, emotion constrains the range
of possible dialogical outcomes in terms of ethnic identification: majority culture,
minority, or hybrid. Dialogue that is coloured by antagonism is unlikely to lead to
resolution; conversely, shared emotional ground provides a basis for negotiating an
outcome that benefits both parties; and both are reflected in mental wellbeing. In the
cultural context, this may make all the difference between adaptive acculturation and
maladaptive.
What actually determines this emotional content is, however, another matter.
Hermans and Hermans-Konopka (2010) and Kinnvall (2004), point to power disparities
between minority and majority groups. When confronted by racism, whether outright or
in its more subtle manifestations, migrants may seek to counter its impact though
strategies that ascribe comforting emotional content to acts and objects—strategies such
as localisation and homesteading (see Chapter 4). Mahmoud (2009), Malhi (2009) and
Verkuyten (2002) see emotion (or “feeling”, as they put it) as a mediating factor in
determining ethnic identity. The relationships they describe are complex, but in essence
ethnic identity is partly a personal choice, but one that is governed by social context and
constrained by social norms. In dialogical terms all these models require that dialogical
voices be freighted with emotion.
Dialogue. Hermans (1996a) describes dialogue as implying “an interchange
between mutually influencing voices” (p. 31). The concept draws on the Russian
28
literary critic Bakhtin’s (1973) concept of the “polyphonic novel”. Hermans, Rijks and
Kempen (1993) conceive of the polyphonic novel as one “where different voices, often
of a markedly different character and representing a multiplicity of relatively
independent worlds, interact to create a self narrative” (p. 208). In the polyphonic novel
the author adopts a number of viewpoints corresponding to different imaginary
characters, who are not necessarily consistent in their attitudes, knowledge or beliefs
(Hermans, Kempen & Van Loon, 1992). According to Hermans and his colleagues, the
self is best regarded as a composite of characters that exhibits the variety one might find
in such a novel. Some—the I-positions—correspond to different authorial viewpoints;
others—the Me-positions—are the characters. Like the characters in such a novel, they
engage in dialogue, hence the term “dialogical self”. This “multivoiced” self contrasts
sharply with the conventional view of the self as organised around a single centre or
core. As author of its own life story, the I moves from one I-position to another,
adopting different perspectives. The self emerges as the totality of such I-positions,
together with their inter-relationships, that is, dialogues.
Self-narratives. Hermans, Rijks and Kempen (1993) hold that the metaphor of
the polyphonic novel extends the original narrative conception of the I as author and the
Me as actor (Sarbin, 1986). But unlike Sarbin, who assumes that a single narrator tells a
story about himself or herself as actor, Hermans, Rijks and Kempen consider that
narrators adopt numerous vantage points. According to Hermans and colleagues (1993;
Hermans, 1996a; 2001; 2002) the conception of the self as a polyphonic novel goes
even further in that it assumes that:
The one and the same individual lives in a multiplicity of worlds with each world
having its own author who may tell a story relatively independent of the authors
of the other worlds. It is thus assumed that the individual consists of multiple
29
authors entering into dialogical relationships with each other and creating a more
complex organization of the self (p. 213).
In their view each author relates a story that is entirely independent of that told by
another. Authors relate to one another, but they do so dialogically, with none having
ultimate power, though each may dominate at different times and in different places. It
is in the spatial dimension that Hermans’ dialogical model departs from those of other
advocates of a narrative approach, such as Sarbin (1986), Bruner (1986), Gergen and
Gergen (1988), and McAdams (1993). Following Bakhtin, time and space are seen as
equally important. This is suggested by the words “position” and “positioning”, which
Hermans employs in place of the traditional term “role” (Hermans, 2001); and also by
Bakhtin’s (1929/1973) usage of the term “juxtaposition”, which presupposes a plurality
of voices that are heterogeneous and even opposed, much less identical or unified.
Valuations. In the theory of the dialogical self, a “valuation” is “anything that a
person finds to be of importance when thinking about his or her life situation”
(Hermans, 1988, p.792). Valuations include loved ones, those one dislikes, disturbing
dreams, problems, cherished opportunities, memories of important events, plans or
goals, and so on. Each valuation is a “unit of meaning”, and each has either a positive,
negative or mixed (ambivalent) emotional quality. Through self-reflection, people
organise their valuations into self-narratives that situate them in time and space—a
valuation system. This means that the “person lives in the present and is, from a specific
point in space and time, oriented toward the past as well as the future” (Hermans &
Kempen, 1993, p.81). By reflecting on past and future experiences, the individual
composes a personal story consisting of significant events by. Moreover valuations may
differ through the life-cycle because the individual’s reference point changes (Hermans,
2006; 1991).
30
The latent–manifest distinction. Hermans (1993) introduced a latent-manifest
distinction into valuation theory. It assumes
that a small set of basic motives are latent in the affective component of the
valuation system. These motives, moreover, are… assumed to be similar across
individuals and to be continuously active within each individual. But, at the
manifest level, valuations vary phenomenologically not only across individuals
but also within a single individual across time and space. (p. 442)
Hermans (1989) notes that the reflective individual, as an observer of his or her
own life, “can look back with nostalgia on the past, be worried about the present, and
have hope for the future” (p. 14), but is always limited in his or her perspective by the
circumstances of the present. Since Hermans conceives personality as a process in time
and space, the perspective of the “I” is not fixed but changes from moment to moment:
The question is now how this concept of change can be related to the manifest and
latent levels of life meaning representation. It is expected that when the
perspective of the “I” changes, there may be a concomitant change in the manifest
experience of an event. Whether or not this change also implies basic
reorganization at the latent level remains to be seen. (p. 14 )
According to Hermans, valuations can be interpreted in terms of two primary
motives: the self-enhancement motive and the union-with-the-other motive. Following
Bakan’s (1966) concepts of agency and communion, the self-enhancement motive is
self-oriented—a striving for superiority, expansion, power and control. The union-with-
the-other motive is other-oriented—a longing for contact, union and intimacy. The two
motives give direction and organisation to the valuations in a person’s life story.
Sampson (1988) echoed the same idea when referring to the work of Bakan (1966). In
every individual there coexist two mutually opposing motives. “Agency”, manifests as
the urge for self-assertion, self-protection, and self-aggrandizement; “communion”,
manifests as the urge to seek union with something larger than the individual. These two

31
motives are paralleled in other research. McAdams (1985) distinguished power and
intimacy as basic motives. Many researchers in cross-cultural psychology (e.g.,
Triandis, Bontempo, Villareal, Asai, & Luca, 1988; Schwartz, 1990) make use of a
notion that is variously labelled “individualism–collectivism” and “idiocentrism–
allocentrism”, which in all its guises closely resembles Herman’s “self-enhancement”
and “union-with-the-other”.
Another way of describing valuations is by their affectivity, positive and negative.
Each valuation reflects positive and negative feelings, which indicate the extent to
which basic motives referred to above are fulfilled. Different I-positions may be
compared and contrasted, then, with respect to the extent to which their valuation
systems exhibit different degrees of self-enhancement motive, union-with-the-other
motive, positive affect, and negative affect. The following example clarifies the
relationship between the motivational and affective components of a valuation. The
valuation, “I gained my doctorate by hard work”, evinces pride and strength; the self-
enhancement motive is manifest in these affects as part of the valuation. Similarly, the
evaluation, “I enjoyed the time when I was together with my family,” evinces
tenderness and intimacy.
Identity. That personal identity is essentially dialogical is a natural extension of
the notion of a narrative self, and follows from the proposition that self-narratives are
collaborative, involving one or more listeners (Sarbin, 1993). In the contextualist view
of human conduct (Sarbin, 1976, 1986), human identities are evolving constructions;
they emerge out of continual social interactions in the course of life. This is a theme that
permeates the novels of Amin Maalouf, a Lebanese migrant to France: “Identity isn’t
given once and for all: it is built up and changes throughout a person’s lifetime.”
32
A person’s social identity may designate the collectivity with which a person
identifies (e.g., an ideology or religion) or with a location on the social map (Berger,
1966). Greenwald (1988) used the term collective self to refer to the individual’s
identification with a reference group, which leads to adoption of the group’s values and
goals. He pointed out that a range of groups can provide the basis of the collective self
(e.g., religious, racial, ethnic, national, political, corporate, and professional groups).
Although dialogical self theory posits that the dialogical self is “social” (Hermans,
2001a), this sociality is “not in the sense that a self-contained individual enters into
social interactions with other outside people, but in the sense that other people occupy
positions in the multivoiced self” (p. 250). Commenting on the relationship between self
and collectivity (e.g., Miller & Prentice, 1994; Turner, Hogg, Oakes, Reicher, &
Wetherell, 1987), Hermans (2001a) notes that the
idea of the Cartesian individualist and centralized self, which is separated from
group and culture, can be contrasted with his dialogical approach that opens the
realm of collective voices. (p. 262)
For Hermans, Baktin’s multivoicedness entails not only “the simultaneous
existence of different individual voices in the self, but the simultaneous existence of an
individual voice and voice of a group” (p. 262). In answer to his question regarding how
are these individual and collective voices related to one another, Hermans comments:
Empirical evidence suggests that the two voices function as relatively autonomous
parts of the self …The relative autonomy of the personal and the collective parts
of the self requires us to study their dialogical relations. As individuals people
may agree or disagree with the collectivities to which they belong. (p. 262)
Individuals engage in dialogue at a collective level as well as an individual one
(Hermans, 2002a, 2002b, 2003). The individual and collective voices within the
dialogical self parallel the personal and social positions in which people may find
33
themselves. Social positions are defined by the expectations and prescriptions of
society, personal positions by how individuals choose to organize their lives. Hermans
(2001a) illustrates this point with the following example:
when a person in a particular culture is defined as a woman, this social position
carries specific expectations regarding the person’s dress, movements, behaviour
and emotion regulation. However, from the perspective of her personal point of
view, she may feel feminine in some situations (e.g. in dress), but masculine in
other situations (e.g. in sexual behaviour). In this case, the meaning system of this
person is constructed in a field of tension between her social position and one or
more of her personal positions. (p. 263)
Thus, in Hermans, dialogical voices are not always harmonious but are engaged in
“negotiation, disagreement, power, negation, conflict, domination, privileging and
hierarchy” (Bhatia & Ram, 2001, p.301). For Hermans (2001a) these individual and
collective voices coexist and are in constant tension between “(symmetrical)
interchange and (asymmetrical) social domination” (p. 266). In this way the theory
accommodates the ways in which power asymmetries emerge between cultures and
social groups.
In this sense, culture operates as a collective voice that organises the meaning of
the dialogical relations (Hermans, 2001a). Because the self and culture are conceived in
the theory in terms of a “multiplicity of positions among which dialogical relationships
can develop” (p. 243), it then follows that cultural changes bring about changes in the
dialogical self by creating a movement of I positions as well as a change in how these
positions relate mutually. The culturally constituted dialogical self can be observed and
understood from personal narrative accounts (Hermans, 2004; McAdams, 1993;
McAdams & Pals, 2006). Since a personal narrative embodies memories, feelings, and
experiences, narrators generally tell their stories in highly selected ways that depend on

34
changing situations and social expectations (Hermans, 2000). This means that the
created world of the self-narrative, where the recounted actions and the dramatised
voices take place, is always context-dependent. Different narrative identities are
constructed according to linguistic, social and physical context. Speakers make narrative
choices in order to display a particular portrait of themselves, constructed for a
particular context and a particular audience. They may also tell different and sometimes
contrasting stories from different positions at different times (Hermans 2001a).
In short, dialogical self theory provides a conceptual toolkit with which to explore
the psychological aspects of culture and acculturation. Applying it, however, demands
elaborations and extensions of the theory, which are described in Chapter 4.
2.5 Summary
This chapter discusses the concept of the self, showing how and why it relates to
the thesis. A pervading theme is the notion of multiple selves. This idea is not new, but
has now become mainstream, beginning with James’ theories, and progressing through
Cooley, Mead, and Hermans. Their theories differ, sometimes substantially, in detail
and approach, but all have in common the notion that people possess multiple selves,
and that different selves are manifest in different circumstances.
Since Hermans developed his theory of the dialogical self, researchers have
refined and extended his theory into practical areas of application, important among
them being migration and acculturation. Their work is also described, but because it
relates closely to theories of migration and acculturation, it is presented after the next
chapter on migration and acculturation theories.
The idea that people have multiple selves that coexist in time and space is central
to this thesis. It is furthermore necessary, for the kind of Cartesian individualist and
centralized self, separated from group and culture, is incapable of explaining the

35
changes that often (though not always) occur when migrants migrate. For that one needs
a multivoiced approach, and furthermore one that accepts that the self is moulded by the
external environment, in this case culture. The empirical component of the thesis
therefore focuses on participants’ multiple selves, namely those corresponding to the
participant as a member of the culture of their country of origin, and those
corresponding to the participant as a member of the culture of their country of
settlement, in this case Australia.

36
CHAPTER 3: Migration and Acculturation
Ce qui fait que je suis moi-même et pas un autre, c’est que je suis ainsi à la lisière
de deux pays … C’est précisément cela qui définit mon identité. Serais-je plus
authentique si je m’amputais d’une partie de moi-même? [What makes me myself
rather than anyone else is the very fact that I am poised between two countries …
It is precisely this that defines my identity. Would I exist more authentically if I
cut off a part of myself?]
Amin Maalouf (1949– )
In my case, the effort for these years to live in the dress of Arabs, and to imitate
their mental foundation, quitted me of my English self, and let me look at the
West and its conventions with new eyes: they destroyed it all for me. At the same
time I could not sincerely take on the Arab skin: it was an affectation only ….
Sometimes these selves would converse in the void; and then madness was very
near, as I believe it would be near the man who could see things through the veils
at once of two customs, two educations, two environments.
T. E. Lawrence, Seven Pillars of Wisdom (1922)
This chapter describes the migration experience from a psychological and
sociological perspective, with particular focus on the Australian experience. It explores
the process of migration and acculturation in order to understand the various outcomes
of intercultural contact, and concludes with a synopsis of acculturation theories and
their implications for the thesis.
3.1 Australian Migration
The global context. It is commonplace to say we now live in a ‘globalised’
world. One measure of this is language. Language is not the same thing as culture, but
being relatively easy to observe, it is a serviceable indicator of it. For instance, the
European Commission (2012) reported that just over half of Europeans were ‘able to
37
hold a conversation in at least one additional language…’ (p. 5). By that criterion, most
people in Europe at least have to engage at some level with a culture not their own.
Global figures are harder to come by, but the British Council (2014) estimated that ‘one
out of four of the world's population speak English to some level of competence;
demand from the other three-quarters is increasing.’
If second language acquisition is a sign of potential acculturation, migration is
even more so. The OECD (2013) recently reported:
Some 232 million international migrants are living in the world today. Since 1990,
the number of international migrants in the global North increased by around 53
million (65%), while the migrant population in the global South grew by around
24 million (34%). Today, about six out of every ten international migrants reside
in the developed regions.
In short, migration is large and growing, particularly from the ‘South’ (which the
OECD broadly defines as developing economies), to the ‘North’ (developed
economies). Given the differences between their cultures, it is clear that acculturation
issues are greater than they have ever been, and are moreover set to increase.
The historical perspective. Australian immigration has been characterised by
several phases. Since European settlement began over 200 years ago until the end of
World War 2, Australia was essentially a “British” country—British in population in
that its people hailed overwhelmingly from the British Isles; and British in customs,
more so than the British in some ways, since Australians saw themselves as “peoples of
the three kingdoms [England, Scotland and Ireland]… equal sharers in this new
community” Hirst (2014; p. 146). Even the Irish, whose country at that time was part of
the United Kingdom, were happy enough to regard themselves as “British” in Australia,
when they would have resolutely rejected the notion back in Ireland.

38
All that changed in the aftermath of World War 2, by which time Australia’s
proportion of immigrants had fallen from a high of about 30% in 1893, to a low of near
10% in the late 1940s (Australian Bureau of Statistics 2013, December). After the near
invasion of their country by Japan, Australians rallied to the slogan: ‘Populate or
perish!’ True, institutionalised racism (present since Federation) remained a formal part
of the new immigration policy, but given the shortfall of British migrants, Australians
were persuaded to accept—reluctantly at first—other northern Europeans, then
successively more southerners, and ultimately non-Europeans. And accept them they
did (Hirst, 2010, 2014; Markus et al., 2009). By the 1970s the proportion of foreign-
born neared 25%.
The White Australia Policy was finally abolished in the mid-1970s, leading to a
surge in non-European immigration, mostly from Asia and the Middle-East. By the
mid-1990s nearly 50% of new entrants came from Asia, although Britain and New
Zealand were still major source countries (Castles, Iredale & Vasta, 1994).
Current situation. Australia is exceptional in its migration history, which is
reflected in its current migrant composition. Other countries may have a higher
proportion of foreign-born residents, but those countries are not traditionally countries
of settlement in the way that Australia is: some are burdened by refugees, such as
Jordan; some have large guest worker communities, such as Saudi Arabia and
Switzerland; and many are small island countries that have little impact globally, such
as Bermuda (OECD & UNDESA, 2013). Only Australia has so many foreign-born,
increasing so rapidly. Even Israel, with which Australia is often compared in matters of
migration, has these days a lower proportion of foreign-born (and that against a
backdrop of Israel’s Law of Return, which accords any Jew the right to migrate to
Israel).

39
Table 3.1 compares Australia with comparable countries from a migration
perspective. Australia’s migrant stock, though proportionately lower than Israel’s in
1990, now exceeds it; and its rate of growth exceeds that of all countries but New
Zealand. Canada, with which Australia is also commonly compared, is culturally more
diverse (Hawkins, 1989) but has proportionately fewer migrants. Because of its size the
United States receives many more immigrants than Australia in absolute terms, but
proportionately its migrant stock is half that of Australia’s and in recent years has
grown half as fast.
Table 3.1 Migrant stock: selected countries of large-scale immigration
Migrant stock
1990 2013
Growth rate
2010-2013
Australia 22.7% 27.7% 2.5% pa
Israel 36.3% 26.5% 0.5% pa
Canada 16.3% 20.7% 1.3% pa
New Zealand 15.4% 25.1% 3.4% pa
United States 9.1% 14.3% 1.2% pa
Source: OECD & UNDESA (2013).
Demographic analysis based on the 2006 national census showed that out of a
population reaching 21 million, nearly a quarter of the population was born overseas,
and a third had at least one overseas-born parent. The UK and New Zealand still remain
the most common birth countries. The dominant culture remains European, with British,
Italian and German still the main non-Australian ancestries, but Australians are
becoming less European and more Asian. Chinese are now the fourth largest overseas-
born group, with Italian third. Overall, Australia has 250 ancestries speaking 400

40
languages at home, but 79 per cent only speak English at home. Italian, Greek and
Cantonese are the most common non-English tongues.
Policy settings. When mass immigration began after the World War II, the policy
objective was officially one of cultural assimilation: migrants would become Australian
in the quickest possible time, and to that end were termed ‘New Australians’ by
Government and agencies (Hirst, 2010, 2014; Markus et al., 2009). By the mid-1960s,
this had changed: cultural “integration” was officially the goal, by which was meant that
the authorities “still sought social cohesion but more gently” (Hirst, 2014; p. 160).And
by the mid-seventies the term “multiculturalism” was officially adopted in recognition
of a social environment became much more tolerant and accepting of difference, despite
the racist ideas of the past (Castles & Vasta, 2000; Castles, Iredale, & Vasta, 1994;
Ward, Bochner and Furnham, 2001). Although few countries are completely
monocultural, some are more culturally diverse than others, and Australia is often cited
as an example of a culturally diverse society, as are the United States and Canada
(Berry, 1997; Bochner, 1986; Bochner & Hesketh, 1994).
There is a pattern to this policy progression: the foundation for what Hirst (2014)
terms Australia’s migration “success” rested on Australians’ fears being allayed. At
first, non-British, European migrants were accepted, grudgingly, and then only because
they were needed: this was the era of ‘Populate or perish’. Even so, ‘old’ Australians
demanded that they adopt Australian ways. Later, when Australians realised the
newcomers caused no trouble (and indeed, brought interesting cuisines with them), they
were allowed to keep their cultural identity (Hirst, 2014; Markus et al., 2009). Finally,
those customs were accepted as part of the Australian social fabric. It took 30 years, but
the transformation was dramatic, and still continues.

41
Push and pull factors. In a review of post-war literature on Australia’s
immigration program, Betts (1996) observed that immigration was largely explained in
terms of pull factors, that is, ones intrinsic to the host country that draw migrants to it.
Such theories have flourished in Australia and overseas since the mid-1970s, despite the
fact that since 1974 changes in immigration were already beginning to make these
theories incomplete. Instead, she suggested push factors are now more important,
driving migration in the absence of the former official policy of active recruitment, and
often in the face of attempts at exclusion. She saw a need to further define the terms
“push” and “pull” factors more clearly—that is, not from the point of view of the host
society but of the potential immigrant. For example, in the “new economics” theory,
potential migrants weigh up the net costs and benefits of attempting to emigrate
(Massey et al., 1993). This means that they consider the pull of the attractions in the
new country together with the push of negative factors in their home country and
evaluate these against the expense and risk of moving.
Betts (1996) also noted that the distinction between push and pull is confusing
when perceived from the migrant’s point of view. If a person is contemplating a move
he or she must see some attraction (pull) in the target country as well as some reason to
depart (push) in the home country. It follows that a potential migrant’s actions are
neither governed by push or pull: if benefits are to be perceived, both push and pull are
required. The decision to move involves weighing up the benefits of both against the
cost of breaking old ties, making a journey, and so on.
Motivations. Young and Madden (1992) examined how people arrive at the
decision to migrate to Australia. In a study of over 500 migrants from the United
Kingdom, Ireland, Lebanon, Malaysia/Brunei, and Vietnam, they found that women
generally migrated for “family reasons”, while men more often migrated as skilled
42
workers. Men were more likely to be ‘primary’ migrants in all categories and women
were ‘secondary’ migrants.
Maydell-Stevens, Masgoret & Ward (2007) found that motives were a key
influence on migrants’ adaptation to a new culture, to the extent even of determining
their acculturation strategy. Boneva and Frieze (2001) found that achievement
motivation, power motivation, and affiliation motivation all influence the desire to
migrate: intending migrants tend to be above average in achievement and power
motivation and lower in affiliation motivation. Migration is an expression of an
individualistic orientation: those high in achievement motivation may migrate in order
to seek opportunities, and those high in power motivation may be more willing to take
risks in reaching their goals. The authors interpret migration as a life-changing event
that offers opportunity but also carries risk: by moving into a new and usually larger
society, migration offers career and economic enhancement but impedes social ties with
home.
Migrants also differ from other cross-cultural travellers in motivation and
commitment to country of resettlement. Unlike refugees, who are “pushed” into an alien
environment, migrants are “pulled” towards a new country in pursuit of personal,
familial, social, financial and political goals (Winter-Ebmer, 1994). Economic factors
exert the strongest influence, though family reunification and political pressures play a
part. In a psychological analysis of migration intention, Winchie and Carmen (1988)
found that migrants are more likely to be dissatisfied with their employment in their
home country and come from a lower socio-economic stratum than non-migrants.
A typology of migrants. Taylor (1969) identified three types of migrant.
“Resultant” migrants are pressured by circumstances to move; they move essential
because they have to. “Dislocated” migrants move to avoid “dislocation” from their
43
primary group, often to join family or friends who have already migrated. But the most
are “aspirers”, who migrate to better themselves and their children. The “dislocated”
and “aspirers” are responding mainly to “pull” factors; the “resultant”, to “push” factors.
Modern economic theories of migration place the cause for moving within the
immigrants’ perceptions of their situations rather than within the host countries’
economic and political institutions, which may explain the selectivity of migration
(Massey et al., 1993). These factors point to economic, demographic and network
factors in order to explain why people leave their countries of origin (Massey et al.,
1993). They do not, however, explain why some people become migrants and others in
similar socio-economic conditions do not.
It may be that some people are psychologically predisposed to migration, that is,
they may possess characteristics that predispose them to migrate and help them endure
the challenges of migrant life. Jennings (1970) coined the term “mobicentric man” for
individuals who value action and are constantly on the move. Morrison and Wheeler
(1976) coined the term “pioneering personality” and suggested that the desire for
novelty might be as important a motivator as the desire for material advancement.
Other studies support the notion of a “migrant personality” and specify its
characteristics. Boneva and Frieze (2001) note that not everyone in poor countries wants
to migrate to richer ones, and would-be migrants are not all from the poorest class. They
accept that economic prospects, migration policies, and network support in the receiving
country create the preconditions for the desire to migrate, but argue that at the level of
the individual, migration is largely driven by personality. They found that primary
migrants (that is, those making the initial decision) to be more work-oriented, and
motivated more by achievement and power than by affiliation or family centrality, than
44
secondary migrants (that is, those who follow in order to be reunited with family)
(Boneva & Frieze, 2001; Frieze et al., 2004).
3.2 Acculturation
Terms and concepts. Acculturation is “the process by which individuals change,
by being influenced by contact with another culture and by being participants in the
general acculturation changes under way in their own culture” (Berry, 1990, p.204). It is
important to differentiate acculturation of the group from acculturation of the individual.
Sociologists and anthropologists were the first to study acculturation, and were mainly
interested in group-level changes; Redfield, Linton, and Herskovits (1936) were among
the first to provide a formal definition:
Acculturation comprehends those phenomena which result when groups of
individuals having different cultures come into continuous first-hand contact, with
subsequent changes in the original culture patterns of either or both groups. (p.
149)
Later, Graves (1967) introduced the concept of “psychological acculturation” to
describe changes as a result of personal contact with the other culture, and participation
in acculturation at the group level (Berry, 1990), so recognising migrants’ emotional
attachment to the host culture and country of origin (Betancourt & Lopez, 1993).
According to Berry, the phenomena are different at the two levels: at the group level,
changes occur mainly in the group’s social structure, economic base, and political
organisation; at the individual level, changes occur in identity, values, attitudes, habits
and motives (Berry, Kim, Power, Young, & Bujaki, 1989; Berry, Poortinga, Segall, &
Dasen, 2002).
Acculturative changes are normally adaptive in that they help individual to
transact two different cultures. This is illustrated in Figure 3.1.

45
Figure 3.1 The acculturation process (adapted from Berry, 2005)
Group-level factors (at top) precede acculturation in the society of origin, and pre-
exist in the society of settlement. Individual-level factors (at bottom) precede
acculturation in the migrant. In the middle are factors that arise in individuals during the
course of acculturation. Both societies act jointly to initiate and shape psychological
acculturation, which is described in terms of stressors, responses, and outcomes (for a
review, see Berry & Kim, 1988; Berry, Kim, Minde & Mok, 1987; Berry, 2005).
Individuals differ in how they experience acculturation. Some perceive acculturative
changes as stressors that expose deficits in coping skills; others perceive them as benign
opportunities for growth. Acculturative stress is manifest in affective, behavioural or
Stress
and skill
deficits
Responses:
affective,
behavioural,
cognitive
Outcomes:
psychological
sociocultural
adaptation
Cross-cultural
transition
experience
Societal-level variables
Individual-level variables
Society of origin
Social factors
Political factors
Economic factors
Cultural factors
Society of settlement
Social factors
Political factors
Economic factors
Cultural factors
Person
Personality
Language fluency
Training and experience
Cultural identity
Acculturation strategies
Values
Reasons for migration
Situation
Length of cultural contact
Amount of intra- and inter-group contact
Quality of intra- and inter-group contact
Cultural distance
Amount of life changes
Social support

46
cognitive responses. Variations in adaptation (psychological or sociocultural) range
from the well-adapted to maladapted.
Intercultural contact. The social psychology of cross-cultural relations and the
psychological effects of culture contact are important areas of research in cross-cultural
psychology, (e.g., Ward, Bochner & Furnham, 2001; Bochner, 1982; Brislin, 1981).
Bochner (1982) found intercultural contact to be of two kinds: that between members of
a culturally diverse society, and that which takes place when a person from one culture
travels to another with a particular objective, for example, to work, play, study, exploit,
convert, or assist. Over the last 30 years empirical research on intercultural contact has
flourished, particularly as concerns sojourners, refugees, migrants and expatriate
workers. Migrant adaptation has been found to be influenced by pre-migration
conditions, by the transitional experience in moving from one country to another, by the
characteristics of the migrants themselves, and by the conditions of the receiving
country, including government policies and economic factors. Migrants generally
relocate with the intention of long-term, if not permanent, resettlement (Ward, Bochner
& Furnham, 2001).
Berry (1990) observed that, technically, overseas-born, first generation settlers
should be described as migrants, and their descendants as members of ethnocultural
groups. Ward and colleagues (2001) pointed out that it is the initial contact between the
first generation migrants and the members of the receiving culture that most closely
resembles a between-culture contact. Over time, this interaction merges into a within-
culture contact, with successive generations as migrants groups evolve into established
ethnocultural communities within the larger society.
Migration and identity. As common as migration is, it is not the experience of
most people. Migration is a complex psychosocial process with lasting effects on

47
individual identity. For most migrants, their identity impinges on almost everything they
do. So how do migrants, who move between cultures, reconcile their social identities?
Oddly, James (1890, p.213), who “regarded [personal identity] as the most
puzzling puzzle with which psychology has to deal,” had little to say about migration;
but as Brown (1998) points out, James wrote at a time when psychology was mostly the
province of white males operating in their own cultural milieu. Not so Freud, possibly
because as a Jew in ethnically diverse Vienna he felt his ethnicity more personally. In a
1926 address to the B’nai B’rith (a Jewish community organisation) he referred to his
“irresistible” attraction to being a member of an ethnic group, so echoing his own
writings, which claimed the search for identity to be one of the mind’s basic motives
because it guaranteed safety and wish fulfilment (Graafsma, 1994).
Whenever I felt an inclination to national enthusiasm, I strove to suppress it as
being harmful and wrong, alarmed by the warning examples of the peoples among
whom we Jews live. But plenty of other things remained over to make the
attraction of Jewry and Jews irresistible—many obscure emotional forces … as
well as a clear consciousness of inner identity, the safe privacy of a common
mental construction. And beyond this there was a perception that it was to my
Jewish nature alone that I owed two characteristics that had become indispensable
to me in the difficult course of my life. Because I was a Jew, I was free from
many prejudices which restricted others in the use of their intellect; and, as a Jew,
I was prepared to join the Opposition and to do without agreement with the
“compact majority” (Freud, cited in Zavalloni, 1983, p.205)
According to Brown (1998), two aspects of collective identity have received
attention by researchers. One is how people evaluate identity: some minority members
resent or even disown their ethnic identity to avoid the stigma they feel (Lewin, 1948).
The other aspect explored how people maintain their ethnic identity as a minority in a

48
dominant culture. Amin Maalouf (2000), a Lebanese-born writer who has lived and
worked in France for decades, wrote:
How many times, since I left Lebanon in 1976 to live in France, have people
asked me, with the best intentions in the world, whether I felt ‘more French’ or
‘more Lebanese’? And I always give the same answer: ‘Both!’ I say that not in the
interests of fairness or balance, but because any other answer would be a lie. What
makes me myself rather than anyone else is the very fact that I am poised between
two countries, two or three languages and several cultural traditions. It is precisely
this that defines my identity. Would I exist more authentically if I cut off a part of
myself?
So am I half French and half Lebanese? Of course not. Identity can’t be
compartmentalized. You can’t divide it up into halves or thirds or any other
separate segments. I haven’t got several identities: I’ve got just one, made up of
many components in a mixture that is unique to every individual.
Sometimes, after I’ve been giving a detailed account of exactly why I lay claim to
all my affiliations, someone comes and pats me on the shoulder and says, “of
course, of course – but what do you really feel, deep down inside?” (pp. 3-4)
Maalouf has a life story that according to McAdams’s (2003) theory of identity
captures what he is in all his complexity. Unity is important for Maalouf, but he wants a
unity that is comprehensive, not one that cuts out portions of his story to arrive at a false
coherence. His audiences, however, demand a simplification that is fundamentally in
error. Biculturalism can foster pride in one’s origins, solidarity with compatriots, and a
rich appreciation of history; equally it can bring confusion, disappointment and cultural
conflict (Haritatos & Benet-Martınez, 2003). Migrants find themselves simultaneously
immersed in multiple cultures, and so typically have multiple group allegiances.
Liebkind (2008) brought another perspective when he observed that ethnicity is
both ascribed (in that one cannot choose one’s ethnic origin) and achieved (in that it is a
matter of choice). Identification with one’s ethnic roots therefore involves both a
49
cognitive self-categorisation and a sense of attachment. Liebkind (1996) notes that
ethnic/cultural identity has been empirically treated not only as “mere self-
identification” but also as “feelings of belongingness and commitment” towards one’s
group (p. 164).
On its own, ethnic self-identification says little about a migrant’s attitudes towards
the heritage culture or strength of identification with the self-applied category. For
example, Ethier and Deaux (1990) asked Hispanic American college students to name
their ethnic identities and list the characteristics they associated with each. Most (but
not all) claimed a Hispanic identity but associated with it differed meanings: some were
positive, others ambivalent. Likewise, in a study of students from ethnically diverse
high schools in the United States, Phinney and Devich-Navarro (1997) found no
statistical link between self-ascribed ethnicity and degree of involvement in their origin
ethnic group and/or American society. Likewise, in a study of first- and second-
generation Chinese Australian and Chinese American adolescents, Rosenthal and
Feldman (1992) found that ethnic identification (that is, labelling oneself as Chinese)
and knowledge and practice of Chinese culture declined over time, but subjective
evaluation of their Chinese identity and the importance attached to Chinese cultural
practices did not. They concluded that although the behavioural aspects of ethnic
identity diminished, its internal components did not.
In a review of relevant studies, Phinney (1990) found contradictory evidence to
link ethnic identification with degree of acculturation. Some studies showed the two
dimensions to be unrelated: Hutnik (1986) for instance found no significant correlation
between ethnic identity and cultural attitudes among young Indians in Britain. But other
studies gave a different picture: in separate studies of Israeli students in the United
States, Elias and Blanton (1987) found some correlations of behavioural and affective

50
aspects of ethnic identity. Phinney concludes from such studies that “ethnic identity is
not necessarily a linear construct” (p. 509). At a conceptual level, therefore, there exist
two main acculturation models that differ according to whether acculturation is seen as
unidimensional or bidimensional. Gordon (1964) proposed a unidimensional model. At
one end of the spectrum, migrants cling to their own culture; at the other, they adopt the
host culture’s values, attitudes, and behaviours. In a refinement of this simplistic view,
the so-called ‘balance’ model permitted a both cultures to coexist in the form of
biculturalism. However, it still viewed heritage and host cultures as interdependent
rather than orthogonal, and failed to accommodate those who identified strongly (or
weakly) with both cultures. Biculturalism was considered a temporary state in the
transition to full adoption of the host culture (Goldlust & Richmond, 1974;
LaFromboise, Coleman, & Gerton, 1993; Ryder, Alden, & Paulhus (2000).
To address these difficulties, acculturation models were devised that considered
heritage and host cultures as independent influences. These so-called “bidimensional”
models accommodate biculturalism and intensity of cultural involvement as orthogonal
dimensions (e.g., Berry, 1980; La Fromboise et al., 1993; Szapockznik, Kurtiness, &
Fernandez, 1980). They are based on two core assumptions: that individuals differ in the
degree to which their identity includes values, attitudes and behaviours from their
heritage culture; and that individuals can possess multiple cultural identities of varying
independence and strength (Ryder, Alden, & Paulhus, 2000). In models based on the
first assumption, immigrants can indeed relate to both heritage and host cultures
differently, but in different domains of life; they may for instance learn the host
language but still cling to the values they were brought up with. In models based on the
second assumption, the influences of both cultures are independent of each other. The
51
leading model of this kind is the one proposed by Berry (1980, 1984, 1997), described
next.
Berry’s acculturation model. Berry (1980, 1984, 1990, 1997, 2005) developed a
widely accepted framework for acculturation that embodies factors pertaining to both
the group and the individual, and to both the society of origin and that of settlement.
Berry (1980, 1984; Berry & Sam, 1997) was the first to propose that cultural identities
were separate dimensions rather than extremes of a single dimension; or to put it
another way, identifying more with one culture did not mean identifying less with the
other. There were instead four possible psychological responses to cultural change,
which Berry calls “acculturation strategies”: identification with the societies of both
origin and settlement indicates “integration” (real biculturalism); identification with the
culture of settlement alone indicates “assimilation”; identification with the culture of
origin alone indicates “separation”; and identification with neither culture indicates
“marginalisation” (e.g., Berry, 1980, 1985, 1990, 1997; 2005; Berry & Sam, 1997; Sam
& Berry, 2006). Most long term migrants adopt a strategy of “integration” or
“assimilation”, depending on whether or not they respectively retain or discard their
culture of origin. But not all migrants take this path: some either choose or are forced
into a strategy of “separation” or “marginalisation”, again depending on whether or not
they respectively retain or discard their culture of origin.
According to Berry’s (1980, 1984) psychological acculturation model, migrants
settled in the host society face two fundamental choices: whether or not to retain their
migrant culture; and whether or not to seek relations with the host society. There are
four possible psychological response combinations, which Berry calls “acculturation
strategies”: integration, assimilation, separation, and marginalisation. Integration means
maintaining some features of the migrant culture while adopting other features of the

52
host culture, and integrating the two. Assimilation means relinquishing the migrant
culture in its entirety and replacing it with that of the host culture. Separation is its
opposite: maintaining the migrant culture in its entirety and rejecting the host culture.
Finally, marginalisation means rejecting both cultures—their own and that of the
majority. These four strategies can be adopted at the individual or level (Berry, 1980,
1984). Acculturation may, however, vary across the domains of behaviour and social
life: “For example, one may seek economic assimilation (in work), linguistic integration
(by way of bilingualism), and marital separation (by endogamy)” (Berry, 1990, p.217).
Numerous empirical studies have shown the Berry model to have strong
descriptive and explanatory power (Berry, 1997; Redmond, 2000; Sam, 1995). Berry
and his associates (Berry, 1980, Berry, Kim, Power, Young, & Bujaki, 1989)
investigated the acculturation strategies of the following first-generation immigrants to
North America among others: Portuguese, Hungarians, and Koreans in Canada (Berry et
al., 1989); Lebanese in Canada (Sayegh & Lasry, 1993), and Indians in the United
States (Berry & Krishnan, 1992). They found integration to be the preferred
acculturation strategy, followed by assimilation and separation; marginalisation was
least preferred. Other studies confirm migrants’ preference for integration, and
furthermore see flow-on mental health benefits (Niles, 1999). For example, migrants to
Belgium and the Netherlands seek to combine their own culture with that of the
mainstream (e.g., Phalet & Hagendoorn, 1996; Van de Vijver, Helms-Lorenz, &
Feltzer, 1999). In a Canadian study, migrants who opted for integration were minimally
affected by acculturative stress, whereas the marginalized and separated tended to be
highly stressed (Berry, Kim, Minde & Mok, 1987); a tendency confirmed by Berry
(1997), who found that the assimilated experienced intermediate levels of acculturative
stress. However, none of this negates the distinction migrants draw between public and

53
private domains; for example, Turkish migrants in the Netherlands were found to favour
separation in the private domain but integration in the public (Ourasse & van de Vijver
(2005).
Beyond Berry. For all its elegance, Berry’s acculturation model has come under
increasing criticism. In particular, Berry’s “integration” says little about how people
maintain two cultures or why biculturalism is hard to sustain. He assumes that
acculturation to the new culture and to the culture of origin are independent (Berry,
1980; 1990); and although he offers a taxonomy of acculturation, he does not explain
how acculturation type is manifest in migrant identity, nor how migrants negotiate two
cultures. Ryder, Alden, and Paulhus (2000) remedied this by showing that migrants who
prefer integration (in Berry’s terminology) are bicultural in the sense of reporting more
than one cultural identity; and that cultural identifications are independent of measures
of personality, self-identity, and adjustment.
Some researchers consider Berry’s model to be too simplistic to account for the
complexities of acculturation (e.g., Boski, 1998; Weinreich, 1998). Bourhis, Moise,
Perreault, and Senecal (1997) replaced Berry’s social contact and participation
dimension with one pertaining to host culture adoption: “Is it considered to be of value
to adopt the culture of the host community?” (p. 378). Ward (1999) likewise identified
different underlying dimensions of cultural identity. Just as acculturation strategies are
classified on two dimensions (own cultural maintenance and involvement with host
society), migrants’ self-perceptions are also constructed along two dimensions:
identification with their country of origin’s heritage (their cultural or ethnic identity),
and identification with the host society (their created national identity) (Phinney, 1990;
1999; 2000). Moreover, the two dimensions of acculturation strategy are orthogonal, as
are the two dimensions of cultural self-perception. The strategies that emerge, mirror
54
Berry’s four acculturation strategies. Phinney (1990) described four possible outcomes
based on strength of identification with the majority and minority groups. Those who
identify with the dominant culture, while still identifying strongly with their cultural
background, are said to be acculturated, integrated, or bicultural. Those who abandon
their ethnic identity for that of the dominant culture, are said to be assimilated. Those
who decline to identify with the dominant culture are said to be separated. And those
who lose their ties to both cultural groups are said to be marginalised. Research suggests
that a bicultural identity is the most adaptive kind for migrants (Phinney, Horenczyk,
Liebkind, & Vedder, 2001), and bicultural competence, or the ability to interact in two
cultures without tension, is essential (LaFromboise et al, 1993). In short, it is possible to
possess two cultural identities at the same time.
Birman (1994) suggested two models of biculturalism: the alternation model and
the fusion model. In a review of biculturalism similar to that of LaFromboise et al.
(1993), she draws a distinction between the behavioural aspects of biculturalism
(LaFromboise et al.’s “bicultural competence”) and the psychological (“bicultural
identity”), recommending that both be considered. By “alternation” she means the type
of biculturalism where individuals feel acculturated to either one culture or the other
depending on context, and feel a sense of belonging to both. By contrast, according to
the fusion model, migrants exhibit a blended pattern of multicultural behaviour; rather
than having two distinct cultural repertoires that are invoked in different cultural
contexts, they belong to neither culture exclusively but instead to both (Birman, 1994;
Hermans & Kempen, 1998; LaFromboise et al., 1993). In Hermans and Kempen’s
(1998) view an acculturating individual fuses both cultures in a “hybrid” identity that
combines the best of each.
55
In a study of Mexican Americans and African Americans in California,
participants provided quantitative and qualitative data (Phinney, 1992). The study
generated a typology of bicultural identification. “Blended” biculturalism describes
those who identified equally with both cultures and dealt with them by combining them;
they are migrants who, when asked their ethnicity, might answer, say: “I am both
Mexican and American” (see for instance Phinney & Devich-Navarro, 1997).
“Alternating” biculturalism describes those who identified more with their ethnic
culture but were comfortable in both; they are migrants who, when asked to describe
their ethnicity, might answer, say: “I am a Mexican in America,” but not “I am Mexican
American” (Phinney & Devich-Navarro, 1997). Alternating biculturals identify with
both cultures (as do blended biculturals) but are also conscious of cultural discrepancies
that could be a source of internal conflict, so they keep their cultural identities separate
(Phinney & Devich-Navarro, 1997; Vivero & Jenkins, 1999).
There are thus two apparent modes of biculturalism: compatible and oppositional.
The one views their heritage and host cultures as complementary, the other as discrepant
or conflicting. Neither depends on how long an individual has lived in the host culture
(Phinney & Devich-Navarro, 1997) nor on attitudes toward biculturalism (Vivero &
Jenkins, 1999). However, as Vivero & Jenkins note, oppositional biculturalism can
generate internal conflict, which reduces well-being.
Benet-Martinez, Leu, Lee, and Morris (2002) elaborated the compatible-versus-
oppositional dichotomy by proposing that it arose from “bicultural identity integration”
(BII), an individual difference that moderates cultural “frame-switching”, or the act of
moving between cultures in response to situational cues. Bicultural individuals, whether
low or high on BII, exhibit Berry’s acculturative strategy of integration and hence show
56
a bicultural/bilingual pattern of cultural identification and language proficiency (Benet-
Martinez et al., 2002; Benet-Martinez et al., 2006).
In a later study, Benet-Martinez and Haritatos (2005) found that migrants
internalize potentially conflicting cultural identifications. Using their purpose-designed
Bicultural Identity Integration Scale, they scored a sample of first-generation Chinese-
American migrants on BII and correlated the results with measures of personality traits
and bicultural stressors. They inferred the existence of two modes of bicultural identity
integration: cultural conflict, which perceives that cultures clash, and was correlated
with neuroticism, discrimination, and strain in intercultural relations; and cultural
distance, which perceives that cultures are separate, and was correlated with low
openness and living in a culturally isolated environment. They then identified two
groups: the high BII, who feel their cultures can coexist, and who identify more with the
mainstream culture, even though competence in their ethnic culture of origin is often
similar for both groups; and the low BII, who feel conflicted about their two cultures
and see them as oppositional. These findings accord with the “alternation” model for
second culture acquisition (e.g., LaFromboise, Coleman, & Gerton, 1993), as
experimental research showed that often those high in BII also take part in cultural
frame-switching.
Benet-Martinez and Haritatos (2005) also found low-BII persons to be culturally
more complex than high-BII persons, which they attributed to the greater cultural
conflict that low-BII migrants experience. They suggested that low-BII people,
particularly migrants, feel “culturally homeless”, quoting from Vivero & Jenkins’s
(1999) study, in which one bicultural individual is further recorded as stating:
You start building a home in one place within one culture … but do not complete
it. Then you continue to build your home within another culture …. At the end,
57
you have different pieces of home in different places. You can never put them
together, because they may contradict or conflict with one another (p. 7).
Expanding on Benet-Martinez et. al’s (2002) concept of bicultural identity
integration, Boski (2008, p.148) distinguished “harmonious” and “conflictual”
biculturality. The harmoniously integrated experience a consistency between the two
identities: when either is activated, both are parts of the same cultural context and
correspond to each other. But the conflictually integrated experience dissonance
between cultures. This implies two modes of integration, irrespective of competence in
both cultural contexts. According to Boski (2009, p.148), to be bicultural means to
experience a “psychological parallelism” where a person switches between cultures and
functions effectively and coherently in both. But it can also mean that a person
experiences both antagonistically, to the detriment of psychological well-being. Both
depart from the premise that the person is equipped with competence in both cultures:
this is the paradox. What comes out of this is that integration in Berry’s occurs only
when the two identities are harmonious, as it is a contradictory to say that a person is
biculturally integrated when the two identities are in conflict. And yet, Cheng, Lee and
Benet-Martinez (2006) report that both harmoniously and conflictually bicultural
Chinese-Americans endorse Berry’s integration style.
Psychological theories of acculturation focus on changes in attitudes and mental
health (Berry, 1990). According to Phinney and Flores (2002), such changes must be
explained in terms of a two-dimensional model of acculturation. Like Berry and Sam
(1997), they propose that acculturation is not one-dimensional in that an increase in
involvement in one culture implies a decrease in involvement in the other; but two
dimensional in that involvement in one culture is independent of involvement in the
other. To test this proposition, they examined measures of acculturation as predictors of
58
traditional gender role attitudes in a sample of first-, second-, and third-generation
Hispanic migrants. Acculturation was measured in terms of ethnic retention (Spanish
language, Hispanic friendships), mainstream involvement (English language, non-
Hispanic friendships), and traditional gender role attitudes. English language and non-
Hispanic friendships correlated negatively with traditional gender role attitudes; Spanish
language and Hispanic friendships were uncorrelated. Thus the bicultural Hispanic can
be highly involved in, and share the values of, mainstream America, and yet retain
Hispanic social networks and Spanish language. Furthermore, “migrant generation”
(that is, first, second, third etc.) was unrelated to social networks, Hispanic and non-
Hispanic, or to English language usage. Thus, knowing a person’s migrant generation
reveals little about the effects of cultural contact on the individual. Such findings
powerfully support Berry and Sam’s (1997) two-dimensional model of acculturation in
that mainstream adaptation and ethnic retention are revealed to be independent of each
other and to have different outcomes.
Researchers (e.g., LaFromboise, Coleman & Gerton, 1998) agree that
“successful” migrants acquire social skills, cultural knowledge, and other aspects of the
society of settlement. Those who do not achieve bicultural competence may experience
acculturative stress in the form of hostility, anxiety, identity confusion, depression, and
feelings of marginality and alienation. The implication is clear: acculturation strategy
matters, because it affects well-being; likewise cultural identity, since an acculturation
strategy is defined by the migrant’s cultural identity (or identities).
3.3 Acculturation Outcomes
The literature views acculturation outcome from three conceptual angles:
psychopathology, behaviour, and acculturative stress. Psychopathology sees it as a
stressor, hence potentially problematic. Migrants, it implies, require assistance in

59
coping, But according to Bonanno (2004) and Ward (1996) this cannot be so, as most
migrants relocate successfully, with health, psychological and social outcomes like
those of the mainstream. When viewed in terms of observable behaviour, acculturation
is usually seen as unproblematic. It comprises three sub-processes: culture shedding,
culture learning, and culture conflict (Berry, 1992). In a process of “adjustment” (Ward
& Kennedy, 1993b), culture shedding and culture learning entail replacement of
inappropriate behaviours with ones that sit better with the host culture. They are
perceived as accomplished with little difficulty, but if conflict occurs, it is resolved by
the migrant’s yielding to the norms of the mainstream. Assimilation is the likely
outcome. Lastly, when viewed in terms of acculturative stress, acculturation is judged to
be problematic but surmountable (Berry, Kim, Mindle & Mok, 1987). Migrants
experience changes that challenge their cultural norms in ways that cannot be dealt with
by adjusting or assimilating.
The psychopathology of culture shock. Migration always causes a certain
“culture shock” (Garza-Guerrero, 1974). The anxiety that ensues challenges the stability
of the migrant’s “psychic organisation” and
a growing sensation of discontinuity of identity emerges. It is as if, out of his
usual habitat, the newcomer no longer has the necessary corroborative
environmental feedback for his ego identity …. The severity of the threats to the
individual identity runs parallel to the severity of concomitant mourning. Thus,
the more serious the break with the newcomer’s continuity of his identity, the
greater this yearning for those lost love objects (abandoned culture) which in the
past provided a comfortable sense of continuity. On the other hand, the greater the
longing for those love objects, the more afflictive the threats to his identity.
(Garza-Guerrero 1974, pp. 418–419)
For Volkan (2004), issues of personal identity are paramount for migrants.
Migrants go through a mourning process, which may be complicated by feelings of guilt
60
over loss of parts of the self (e.g., the migrant’s previous identity, his or her investment
in the language, culture, land, and people left behind). Guilt may trigger other
psychological processes, such as depression, identity confusion, shame, helplessness,
and culture shock. It is this culture shock that embraces adaptive processes that may
include reactions of anxiety, depression, fear, uncertainty, and anger.
Among the best known early writers on international relocation is Oberg (1960)
who discussed “culture shock”, the disorientation and confusion that results when a
person enters a second culture and familiar cues are absent. This results in feelings of
loss, confusion over roles and role expectations, and feelings of loss of control. Oberg’s
detailed four phases of emotional reactions: (a) the “honeymoon”, characterised by
euphoria, enchantment, fascination, and enthusiasm; (b) the crisis, characterised by
feelings of inadequacy, frustration, anxiety and anger; (c) the recovery, including crisis
resolution and culture learning; and finally (d) adjustment, characterised by enjoyment
of, and functional competence in, the new environment. Oberg had in mind people who
were more or less suddenly exposed to a completely unfamiliar setting and largely
overwhelmed by it. Some of the affective responses consistently mentioned in the
literature included confusion, anxiety, disorientation, suspicion, bewilderment,
perplexity and an intense desire to be elsewhere.
This “honeymoon period” of culture shock may be contrasted with hypotheses
arising from the stress-and-coping literature which predict that, in contrast to “entry
euphoria”, immigrants suffer the most severe adjustment problems at the initial stages
of transition when the number of life changes is the highest and coping resources are
lowest (Ward, Bochner & Furnham, 2001). Early research on culture shock compared it
to a disease, to be cured with appropriate treatment. This approach highlights the factors
that reduce the distress of culture contact, including personal resources such as self-

61
efficacy and emotional resilience, and interpersonal assets such as social support. The
affective outcome of a well-adapted migrant in the new culture is a psychological
adjustment.
Acculturation stress. The migrant must accommodate different beliefs, routines,
and social roles (Hovey, 2000). The term “acculturative stress” captures the stress and
loss this entails. For Lazarus & Folkman (1984), acculturative stress is an outcome of
the losses that occur when adopting a new system of beliefs, routines, and social
roles (Hovey, 2000). It draws on the broader paradigms of stress, adaptation, and
coping. Berry, Kim, Minde & Mok (1987) concur, seeing acculturative stress as a
reaction to life events rooted in the experience of acculturation, with depression, anxiety
and psychosomatic problems as some of its adverse consequences (Berry, 1997; Berry
& Sam, 1997).
Under this approach, the long-held prevailing view was that acculturation
inevitably brought about a decline in mental health. However, this view is no longer
supported (Berry & Kim, 1988). Many factors mitigate acculturative experiences such
that mental health is unaffected or only slightly so. Through adaptation the
consequences of acculturative stress may be positive as migrants develop skills and
behaviours that enhance mental and physical health, and social functioning.
In this regard, Okazaki (1997) explored the role of ethnicity in emotional distress
in a sample of Asian-born migrants to the United States. Drawing on Markus and
Kitayama’s (1991) model of self-construals, she found that Asian Americans are
socialised to hold highly interdependent self-construals; in consequence they are more
attuned to social cues and so more susceptible to social anxiety than others. After
controlling for depression and social anxiety, ethnicity and self-construal predicted for
social anxiety, and self-construal alone predicted fear of negative evaluation.

62
Building on work by Okazaki (1997), Norasakkunkit and Kalick (2002) measured
self-reported depression, social avoidance and distress, and fear of negative evaluation
in a sample of European Americans and Asians. They found that for the Asians, but not
the others, the measures were positively related to interdependent self-construal, and
negatively related to independent self-construal and self-enhancement. This was
explained in terms of the Asians’ greater sensitivity to relationships, given their greater
interdependent self-construal.
On the assumption that acculturative stress diminishes with time, researchers in
the 1980s and 1990s began to use acculturation level as a proxy for acculturative stress.
Their findings are contradictory. For example, studies of migrants’ attitudes in Canada
showed that an integration strategy produces the lowest acculturative stress (Berry,
1990; Berry & Kim, 1988; Berry et al. 1987). Conversely, in a study of acculturative
stress and depression, Hovey and King (1996), found that acculturation level and stress
to be unrelated. It may therefore be wrong to assume that the less acculturated (e.g.,
separated) experience more acculturative stress than the more acculturated.
Many factors contribute to successful acculturation at the individual level:
personal experience of each individual, often associated with age and gender; social
status such as education, prior contact with diverse cultures, familiarity with the
language and culture of the host community; and personality. Moreover, the greater the
cultural distance between the origin and host society, the more difficulties migrants
encounter (Ward & Kennedy, 1992; Ward & Searle, 1991; Hirst, 2014).
Acculturation adaptation. Except perhaps for social identity theory (Ward,
2001), acculturation studies usually conceptualise individual changes either as a
response to stress (Berry, Kim, Minde & Monk, 1987), or as a response to a need, in
this case to learn cultural skills so as to thrive and survive (Furnham & Bochner, 1986).
63
Acculturation results in the migrant’s learning skills that are adaptive and functional
(Berry, Poortinga, Segall & Dasen, 1992). Adaptation takes various forms, though all
are largely stable changes at an individual or group level in response to external
demands (Berry, 1997; Ward, 2001). It does not require that migrants become more like
their environment (a strategy of assimilation); it may imply resistance, efforts to change
the mainstream, or distancing (a strategy of separation). And the outcome varies
accordingly, from material, social and mental success, to the inability to function
effectively in the new society (Berry, 1997).
As illustrated in Figure 3.2, the literature distinguishes three theoretical
approaches to acculturation, one that invokes psychological models of stress-and-coping
as applied to cross-cultural adaptation; a culture learning approach; and a social
identification approach (Ward, Bochner & Furnham, 2001).
The stress-and-coping approach views cross-cultural transitions as a series of
stress-provoking life changes that require coping responses from the migrant. The
culture learning approach focuses on the skills and behaviours required in order to
succeed in a new culture; adaptation is a result of learning new and appropriate skills
(Bochner, 1972, 1986). Lastly, the social identification approach is associated with
social identification theories, and is concerned with values, attitudes, beliefs,
expectations, self-identity, cultural identity (Taft, 1977).
Another distinction found in the literature is that between psychological and
sociocultural adaptation (Searle & Ward, 1990). Psychological adaptation covers
depression, anxiety and psychosomatic problems, which are the most common mental
health consequences of acculturating individuals (Berry, 1997; Berry & Sam, 1997).
Sociocultural adaptation covers the relationship between individuals and their cultural
context, and concerns the success or otherwise of participation in the host society

64
(Ward, Bochner & Furnham, 2001; Searle & Ward, 1990; Ward et al., 2001; Ward &
Kennedy, 1994). In this framework, the stress of acculturation results in the acquisition
of adaptive and functional coping skills (Berry, Poortinga, Segall & Dasen, 1992)..
Figure 3.2 The “ABC model” of acculturation, adapted from Ward, Bochner &
Furnham (2001)
Though separate, psychological and sociocultural adaptation are linked, for
success in the host culture are likely to boost feelings of well-being, leading to a
virtuous circle. Two studies provide empirical support for this: Berry (2003) found
correlations in the range of .4 to .5 between measures of psychological and sociocultural
Affects Behav-
iours
Percep-
tions
Developing
changing,
maintaining
identity
Acquiring
specific
skills
Coping
with
cultural
change
Cognition Social
identification
theories
Affect
Stress and
coping
theories
Behaviour
Culture
learning
theories
Processes
Outcomes
65
adaptation; Ward and Kennedy (1999) also found them to be positively correlated.
Moreover, the strength of the association was positively related to with cultural
proximity to, and integration in, the host society (Ward, 1999; Ward & Kennedy, 1996;
Ward & Rana-Deuba, 1999).
Several studies on cross-cultural adjustment have focused on differentiating
psychological and sociocultural forms of adjustment. Berry and colleagues (2002)
argued that, while empirically related to some extent, psychological and sociocultural
adaptation are distinct in time-scale and causation. Psychological problems often
increase soon after contact, declining over time, whereas sociocultural adaptation
typically proceeds linearly. Likewise, psychological adaptation is mainly predicted by
personality and social support, whereas sociocultural adaptation is predicted by other
factors: cultural knowledge, degree of contact, and intergroup attitudes (Berry et al.,
2002).
In order to elaborate and test the distinction between psychological and
sociocultural adjustment Searle and Ward (1990) investigated a sample of Malaysian
and Singaporean students in New Zealand. Depression (a psychological measure) and
social difficulty (a sociocultural one) were tested for their relationship to expected
difficulty, cultural distance, quantity and quality of extraversion, life changes, and other
variables. They found that social difficulty, satisfaction with host contacts, extraversion,
and life changes accounted for 34% of the variance in psychological adjustment and
cultural distance, expected difficulty, and depression accounted for 36% of the variance
in sociocultural adjustment. No significant differences were found for either
psychological or sociocultural adjustment on length of residence. They concluded that
satisfying interactions with members of the host culture predicted psychological
adjustment. More specifically, they found that while the quantity of host national

66
contact predicted socio-cultural adjustment, it was the quality of the contact that
predicted psychological adjustment. For relationship satisfaction implied adequate
social support, and relationship dissatisfaction implied increased psychological
distress—findings that are congruent with the clinical literature on social support and
mental health (Ward & Kennedy, 1992). In contrast, Ward and Kennedy (1993) found
that it was relations with co-nationals which form the important social support network,
and that it was satisfaction with these relations that underpins psychological adjustment.
Acculturation strategies and adaptation. Any acculturation strategy that
migrants prefer can be experienced as stressful if they have to strive hard to realise their
aims regarding successful adaptation to a new culture (Berry, 1992; Berry & Sam,
1996). In her review of research on acculturation, Ward (1996; Ward & Kennedy, 1993)
found that both psychological and sociocultural adaptation are helped by adopting an
acculturation strategy of integration and by minimising cultural distance. Research
relating adaptation to acculturation strategies allows for some generalisations (Berry,
1997; Ward, 1996). In most cases, the integrated appear to be best adapted, the
marginalised are worst adapted, and the assimilated and the marginalised lie in between.
Other research into acculturation strategies and psychological adaptation as an
outcome variable has been contradictory. Sing (cited in Ourasse & van de Vijver, 2005)
found that identification with the host culture was positively related to stress; Padilla
(1986) found the opposite. Ghaffarian (1987) found that identification with the host
culture was negatively related to depression; Kaplan and Marks (1990 found the
opposite. Buriel, Calzada, and Vasquez (1982), moreover, found that a balanced
identification with both cultures was positively related to psychological adjustment;
Ward and Kennedy (1994) found differently: identification with the host culture was
67
positively associated with sociocultural adjustment, but identification with the migrant
culture was negatively related to psychological problems.
For many researchers, integration is the preferred acculturation strategy, mainly
because it is seen to promote mental health (Niles, 1999). They find, for example, that
most migrants to Belgium and the Netherlands want to combine their native mainstream
cultures (e.g., Phalet & Hagendoorn, 1996; Van de Vijver, Helms-Lorenz, & Feltzer,
1999). Likewise, the psychological adjustment of migrants to Canada could be ranked
from highest to lowest as follows: integrated, assimilated, separated and marginalised
(Berry, Kim, Minde & Mok, 1987; Berry & Annis, 1974)
3.4 Individualism versus Collectivism
This section examines the individualism–collectivism dimension that researchers
such as Hofstede (1980, 1984) have used to characterise cultures. Individualism–
collectivism is not the only dimension that has been used in this way (Hofstede initially
defined four) but it holds special relevance for this thesis because it parallels the
dimensions by which the dialogical self is characterised, and hence is discussed in depth
here and referred to in later chapters.
Using the previously mentioned self-confrontation method (Hermans & Hermans-
Jansen, 1995), the dialogical self can be characterised in terms of two motives, self-
enhancement and union-with-the-other, whereas cultures can be characterised as
“individualistic” or “collectivist”. Although the parallel is not straightforward, it
suggests that there is a link between self and identity on the one hand, and migration
and acculturation on the other.
Anthropologists and cultural psychologists have long argued that personhood is
constructed differently in different cultures (for instance Shweder & Bourne, 1984).
Geertz (1975) noted the distinctive features of the Western conception of personhood:

68
… the Western conception of the person as a bounded, unique, more or less
integrated motivational and cognitive universe, a dynamic centre of awareness,
emotion, judgement and action organised into a distinctive whole and set
contrastively both against other such wholes and against its social and natural
background is, however incorrigible it may seem to us, a rather peculiar idea
within the context of the world’s cultures. (p. 48)
In the West, the self is generally conceived of as autonomous and separate from
other people or social contexts (Geertz, 1975). Non-Western countries tend to stress
group solidarity and connectedness, viewing the self as embedded in social roles, duties,
and responsibilities. Shweder and Bourne (1984) suggested that the concept of the
person varies across cultures. They distinguish two main types of personal organisation:
“egocentric-contractual” (individualistic, subjected to and limited by sociocultural
rules), and “sociocentric-organic” (outward-directed, closely integrated with the
surrounding environment). Various other distinctions and perspectives exist:
achievement orientation and affiliation orientation, self-directed and other-directed or
field dependent.
For Sampson (1988), individualism is more a philosophical and practical principle
than a universally espoused standard of social life. Referencing Heelas and Lock (1981),
he observes that all cultures distinguish self and the nonself, but do so very differently.
American society promotes a self-contained individualism that fosters individual
freedom and achievement, whereas “elements of Japanese, Chinese, and Islamic
indigenous psychologies offer ensembled type [sic] of individualism” (Sampson, 1988,
p.17). Other researchers have largely concurred. For example, societies can be
characterised by their location on the individualism-collectivism dimension (Triandis,
Bontempo, Villareal, Asai, & Lucca, 1988). According to Hofstede (1980, 1984), in
individualistic societies, individuals are expected only to look after themselves and

69
immediate family; in collectivistic societies individuals are integrated into cohesive in-
groups that protect them in return for group loyalty. In such a culture the individual’s
“selves” largely derive from, and are sustained by, the groups to which they belong.
Research by Hofstede (1980), Triandis (1990), Triandis, Bontempo, et al. (1986)
and Triandis, Bontempo, Villareal, Asai, & Lucca (1988) found collectivism to be
highest in traditional societies, and in East Asia and most of Africa, Asia, Latin
America, and the Pacific Islands. Hofstede (1980) found that the most individualistic
countries were the United States, Australia, and the UK,. Moderate levels of
individualism are found in the rest of Europe. In a refinement of Hofstede’s (1980)
conceptualisation of individualism and collectivism as bipolar opposites, Triandis et al.
(1986) found that at the cultural level, each construct of individualism and collectivism
consists of two factors. Individualism he defines as separation from in-groups, plus self-
reliance combined with hedonism; collectivism he defines as family integrity, plus
interdependence combined with sociability. They suggested that individualism and
collectivism are not opposite poles of a single bipolar construct, but are independent
constructs.
Triandis, Leung, Villareal, and Clark (1985) distinguished between cultural
individualism and collectivism, and psychological individualism and collectivism,
which they term allocentrism and idiocentrism. Allocentric individuals subordinate their
personal goals to the interests of their collectivity and may derive satisfaction in doing
so. Idiocentric individuals, on the other hand set their personal goals above the interest
of any collectivity. While allocentrics in individualist cultures join communes and other
collectives, idiocentrics in collectivist cultures try to escape the dominance of their in-
groups (Triandis et al, 1985).
70
Along similar lines, many researchers contrast Western conceptions of the self,
which emphasise the separateness of the individual, with non-Western conceptions that
emphasise relatedness. For example, Markus and Kitayama (1991) found that the
Western cultures seek to maintain the independence of the individual as a separate, self-
contained entity; individuals are socialised to be unique, to express themselves, and to
realise and actualise their inner self and promote personal goals. The emphasis is on
personal attributes, demonstrated in public and confirmed in private through social
comparison (Shweder & Bourne, 1984), and to “be true to one’s own internal structures
of preferences, rights, convictions, and goals” (Markus & Kitayama, 1994, p.569).
Non-Western cultures, by comparison, do not value overt separateness but tend to
emphasise the “fundamental connectedness of human beings” (Matsumoto, 2000).
Under the interdependent self-construal (Markus & Kitayama, 1991), individuals focus
on their interdependent status with other people: the self is unbounded, flexible, and
contingent on context. Furthermore, the most salient aspects of the self are defined in
relationships—that is, those features of the self related to and inseparable from social
contexts. The overall aim is to maintain social harmony.
Pervin (1999) observed that although the distinction between the independent and
interdependent self is helpful, it is far from the whole story. Selves are not
dichotomously independent or interdependent; they may be both (Singelis, 1994). That
is, collectivism and individualism are two dimensions, not opposite ends of a single
dimension (Rhee, Uleman & Lee (1996). Moreover, there is considerable variation in
self-construal within a single culture. Matsumoto (2000) points out that the concept of
independent versus interdependent selves is not unlike other dualities of the self and
human nature, including Freud’s (1930/1961) “union with others” versus egoistic
happiness, Balint’s (1959) ocnophilic and philobatic tendencies, Bakan’s (1966)
71
communion and agency, Boen’s (1966) togetherness and individuality, Bowlby’s (1969)
attachment and separation, Franz and White’s (1985) individuation and attachment,
Stewart and Malley’s (1987) interpersonal relatedness and self-definition, and Slavin
and Kriegman’s (1992) mutualistic and individualistic urges (all cited in Guisinger &
Blatt, 1994).
In elaboration of this notion, Guisinger and Blatt (1994) acknowledged that
although mainstream psychology has historically placed more importance on self-
development for autonomy than for interpersonal relatedness, the two processes are not
mutually exclusive. Subsequently, Niedenthal and Beike (1997) proposed the existence
of both interrelated and isolated self-concepts. Like Guisinger and Blatt (1994), they
argue that these concepts exist not as dichotomies but as interrelated dualities, and that
an individual can possess both self-concepts in the same domain simultaneously.
According to Matsumoto (2000) the implication of the existence of these dualities
means that cultures may emphasise both types of self-construal rather than only one.
Finally, Hermans and Kempen (1998) argued that
Globalization involves social processes that are complex and laden with tension.
These processes fall squarely outside the scope of cultural dichotomies, which by
their nature are oversimplifying and insensitive to the apparent tensions that are so
typical of the relationships between cultural groups. (p. 1112).
They concluded that theories involving cultural dichotomies are flawed since they
take cultures to be homogeneous, distinct, and geographically delineated. According to
Hermans and Kempen, globalisation shows that cultural identities are neither fixed nor
static, but fluid, dynamic, negotiable, and in flux; they cite the example of individuals
who grow up in bicultural environments and experience cultural dialogues within
themselves that represent a dynamic and interactive multiplicity of different and
contrasting voices and roles.

72
Hermans is not without his critics. Roland (2001), a psychoanalyst who has
worked in India and Japan and with patients from diverse cultures and ethnic
backgrounds in New York, has expressed his reservations in these words:
[Hermans’] dismissal of the work of Markus and Kitayama (1991), Marsella
(1983), Shweder and Bourne (1984), Triandis (1980) and others as too
dichotomous, as being too governed by a Cartesian dualist of the ‘West against
the rest’, is really a continuation of his agenda to flatten out radically different
cultural/psychological worlds (p. 317).
He notes that his own research in inter-Asian analyses indicated that “radically
different cultural psychological worlds do exist” (Roland, 1988).
Tweed, Conway and Ryder (1999) have also responded to Hermans and
Kempen’s (1998) criticism that mainstream cross-cultural psychology sees cultural
differences in terms of strict, stable dichotomies defining homogeneous groups. They
note that Triandis’s (1989) research “has already hinted at the complexity of self and
identity with his assertion that each individual has multiple selves from which to
sample” (p. 838). In terms of cultural conceptions of the self, Triandis (1989) argued
that there are three kinds of self-conceptions: private, public, and collective selves.
Private selves are the aspect of self-conceptions that are shown and known to oneself;
public selves are those aspects that are presented to others; and collective selves
represent the self as members of various groups. Markus and Kitayama’s
conceptualisation of interdependent self-construal “conflates Triandis’s public and
collective selves into one type of conception of the self that emphasises its social and
contextual embeddedness” (Kashima, 2001, p.213). Kashima further notes that the
argument has been that Triandis’s public and collective selves, and Markus and
Kitayama’s interdependent self-construal, are more prevalent and emphasised in
collectivist cultures such as East Asia and Latin America, while public selves and

73
independent self-construal are more prevalent and emphasised in individualist cultures
such as Western European-based cultures including North America and Australia.
Triandis’s (1989) differentiation of the self along three dimensions has been
further developed by other researchers. For example, Brewer and Gardner (1996)
proposed a distinction between three sources of self-representations: the personal, the
interpersonal, and the collective. They propose that
At the individual level, the personal self is the differentiated, individuated self-
concept most characteristic of studies of the self in Western psychology. At the
interpersonal level, the relational self is the self concept derived from connections
and role relationships with significant others. This corresponds most closely to the
interdependent self as defined by Markus and Kitayama (1991). Finally, at the
group level, is the collective self, which corresponds to the concept of social
identity as represented in social identity theory and self-categorisation theory.
(Turner, Hogg, Oakes, Reicher, & Wetherell, 1987, p.84)
Along these same lines, Kashima (2001) postulated a concept of self in relation to
“at least three major classes of other entities: goals, individuals, and groups” (p. 214):
A self in relation to a goal is an agentic self; a self in relation to another individual
is a relational self; and a self in relation to a group is a collective self. These three
aspects constitute three components of the meaning of a self. (p. 214)
Recently something of a consensus has developed. Most researchers now agree
that all cultures accommodate multiple self-construals of the self to varying degrees,
and that different selves manifest in different contexts (Church, 2000).
3.5 Summary
This chapter first described Australia’s migration program: its history, the policies
that shaped it, and the social forces that sustained it—and still do. The chapter then
explored the psychological aspects of the acculturation that commonly accompanies
74
migration. James and the early psychologists paid scant attention to acculturation,
probably because they lived in an era of limited international migration by the
bourgeoisie, who were then the only ones to attract the serious attention of the
psychologists. Later, anthropologists and sociologists took an interest, but did so from
the perspective of their own disciplines. Arguably, Berry was the first to develop a
psychological model of acculturation, which subsequently attracted great attention from
psychologists and others; and for that reason it is explained at length. Also explained are
the many models that succeeded Berry but which, like Berry, are essentially static in
nature and not dynamic. The next chapter demonstrates how the theory of the dialogical
self—as a dynamic, process-oriented model—has the potential to address many
criticisms of Berry’s model and those of his successors.
75
CHAPTER 4: The Dialogical Self and Acculturation
The two preceding chapters described theories of the self and acculturation
independently. This chapter brings them together by showing how one particular theory
of the self, the dialogical self, offers a framework to analyse and explain the
psychological dimensions of acculturation in a way that Berry’s acculturation model
(and other models constructed along similar lines) do not.
The chapter opens with a discussion of the phenomenon of globalisation, for it is
this that has caused researchers from Hermans (1998) onwards to question previous
models of acculturation. Next follows a section showing how dialogical self theory
accounts for aspects of acculturation in an era of globalisation—in particular cultural
continuity—that were troubling for previous models. The chapter concludes with the
research questions addressed in this thesis, having first placed them in the context of the
theories of migration and acculturation.
4.1 Globalisation and the Illusion of Stability
Globalization is “a process by which cultures influence one another and become
more alike through trade, immigration, and the exchange of information and ideas”
(Arnett, 2002; p. 774). Although globalisation began centuries ago with the rise of the
great trade-driven European maritime empires (Friedman, 2005), it has come to the fore
in the public consciousness only in recent decades (Kinnvall, 2004; Hermans &
Dimaggio, 2007). But for all its boons, globalisation has a “shadow side”, to which
Hermans and Dimaggio attach the descriptor of “uncertainty”. It is against the backdrop
of globalisation, and the psychological influence that it exerts, that traditional models of
acculturation have been found wanting, and which dialogical self theory addresses.
76
The challenge of globalisation. By revealing weaknesses in previous
acculturation models, globalisation has thrown up challenges for cultural psychologists.
According to Kadianaki (2009; p. 477), whereas migration is “complex and dynamic”,
past theories focus “on states rather than processes”; and what is needed instead is a
theory that captures “life histories of individuals as they develop in space and time”.
Dialogical self theory addresses these issues: as a theory it is inherently process-
oriented (Andreouli (2013), and as a metatheoretical substrate for a range of
psychological “complex and dynamic” phenomena such as acculturation, it lends itself
to ready elaboration (Hermans & Dimaggio, 2007). It is, thus, a “language” in which
dynamic models and theories can be couched.
The remainder of this section makes the case that previous models, being static
and dichotomous in nature, do not adequately account for cultural identity on a world
increasingly populated by cultural hybrids.
Blurred boundaries: the hybridised identity. The impact of globalisation on
culture is nowhere better captured than in the concept of the “hybridised identity”. The
term seems to be of recent origin, along with globalisation itself. Over a century ago,
James (1890) recognized that the self is shaped by cultural and community, but wrote
little on the subject. A century later, Bruner (1986, 1990) provided a cultural
perspective, as did Hermans, Kempen, and van Loon (1992), who argued that ”the
concept of the dialogical self is based on the notion that people have told each other
stories and listened to stories across cultures and across times” (p. 108; emphasis
added).
In this vein, Hermans (2004) observed that cultural identities and boundaries are
far from fixed. With the metaphor of the dialogical self as a “society of mind”, he
highlighted its similarity to society itself, replete with shifting coalitions, tensions and
77
factional conflict (Hermans, 2002a). This multivoiced aspect of the dialogical self
therefore renders it particularly suitable for analysing cultural identity (Hermans &
Dimaggio, 2007) because the pace of social change has led to new forms of cultural
identity and “hybridized” identities (Hermans & Kempen, 1998):
...[such] as Mexican school girls dressed in Greek togas dancing in the style of
Isadora Duncan, a London boy of Asian origin playing for a local Bengali cricket
team and at the same time supporting the Arsenal football club, Thai boxing by
Moroccan girls in Amsterdam, and native Americans celebrating Mardi Gras in
the United States. (p. 1113).
Hybridised identities are not a developmental end-point but rather they shape a
person’s dialogical negotiations in the context of racism, gender, imperialism, and
power (Bhatia & Ram, 2001; Bhatia, 2002; Da Cunha, 1995). Hermans (2001a)
explained how dialogical self theory accommodates cultural misunderstanding:
When people are raised in one culture and then migrate to another, they arrive in a
situation in which two or more heterogeneous internal positions (e.g., I as
Egyptian and I as Dutch) interact with a multiplicity of very heterogeneous
external positions (e.g., the family of one’s culture of origin and individuals and
groups representing the host culture). Such positions (e.g., Egyptian versus Dutch)
may be felt as conflicting or they may coexist in relatively independent ways or
even fuse so that hybrid combinations emerge in the form of multiple identities (p.
258).
It is the multi-faceted nature of cultural identities (Hermans & Kempen, 1998)
that prompts the question of “how people, involved in a process of acculturation,
organize and reorganize their self-system in such a way that they are able to share with
other people cultural elements that may be highly divergent, partly unknown and laden
with power differences” (Hermans, 2001a, p.258). For Hermans, acculturation is an
78
“intercultural phenomenon par excellence because it takes place on the contact zone
between someone’s home culture and host culture” (p. 269).
Hermans (2001a) noted that Bhatia and Ram (2001) called into question Berry’s
(1980) acculturation model and strategies:
One of the main assumptions is that, although there are considerable variations in
the life circumstances of the cultural groups involved, the psychological processes
that operate during acculturation are essentially the same for all groups. (pp. 269-
270)
Berry, as has been stated, claimed that his “integration” strategy was optimal for
the acculturating migrant since it provided the best social support, allowing involvement
in the host culture while maintaining connections to home (Berry, 1980). But Hermans
(2001a), again echoing Bhatia and Ram (2001), observed that Berry’s model mistakenly
implied that the psychological processes were the same for migrants from Western
Europe as for those from former colonies. Berry’s model also considered integration “to
be a linear trajectory that leads to an end-goal” (Hermans, 2001a; p.271), but did not
show how that goal could be achieved given the power and status differences between
the majority and minority cultures.
In his review of Hermans (2001a), Roland (2001) agreed with Hermans in
rejecting cross-cultural psychology’s “assumption that [acculturation] is the same for
everyone and that everyone comes to it with the same psychological make up” (p. 318).
He further agreed that it is the process of acculturation that is more important than its
outcome or endpoint. Roland only questions whether an endpoint is ever achieved, as
“there is always the issue of how much of the indigenous self is kept or disavowed in
relationship to a newer self in the eventual makeup of a bicultural self” (p. 318),
especially when a person migrates from a different “civilisation”.
79
Nevertheless, Adams and Markus (2001) acknowledged that the dialogical self
model, with its emphasis on the multiplicity of identity and the agency of the self as a
constructor of identity, makes an important contribution as a model of identity
negotiation. They saw the model as illustrating how the self functions as a “zone of
proximal development”, where both personal-identity and cultural-identity categories
“make each other up” (p. 293). The dialogical self supersedes the one-dimensionality of
other paradigms, such as the acculturation studies paradigm (Berry & Sam, 1997),
which view cultures as mutually distinct and internally homogeneous, and presupposes
a linear conception of cultural change. In the dialogical self paradigm, identities can be
hyphenated and hybrid constructions made of heterogeneous and contrasting elements.
Lastly, Falmagne (2004) welcomed the dialogical self model for its analytical
sophistication in respect of the self, although she criticised it for its lack of a societal-
level frame of analysis. The model sees the self as “continuous with culture” (Hermans,
2001a), but according to Falmagne it has little to say about the politics of culture
(Squire, 2000), and the societal system of which culture is a constituent.
False dichotomies and reification. Thus far, traditional acculturation models
have been criticised on empirical grounds. Criticism has been levelled on
methodological grounds as well. Traditional acculturation models, it is said, force
acculturation into a false dichotomy. This leads to the logical fallacy of reification,
whereby a category that is implied by theory is treated as if it existed in reality when in
fact (given that the theory is incorrect) it does not (Schwartz, 2010).
Foremost among these critics is Rudmin (2003), who observed that a common and
serious failing of theorists was to ignore the obvious fact that in any acculturative
setting there is not one culture but two; so each of Berry’s four acculturative strategies
80
applies not only to the minority culture but to the majority culture as well, making 16
possible combinations, not the mere four that Berry and his fellow theorists discuss.
To suggest that minorities are psychologically reactive to intercultural contact and
that dominant groups are not almost implies that minority people are a different
species of psychological being, one distinct from the majority…. To the contrary,
as a result of the speed and ease of world travel, global communications, and
international marketing, all humans, everywhere, are subject to acculturation
processes, whether they know it or not and whether they like it or not (p. 6).
He went on to criticise researchers’ lack of logical rigour, which explains why
their studies have variously found measures of incompatible acculturative attitudes to be
positively correlated, and why bicultural integration and marginalisation are confounded
constructs, and why there is no robust evidence that biculturalism is most adaptive. This
latter presumption he found so irksome that he was moved to complain that “studies
showing minorities to have superior health are called ‘counter-intuitive’ and a
‘paradox’…. In fact many studies using large samples show immigrants to have
superior mental health…” (Rudmin (2010b, p. 302). He also drew attention to other
errors and claims that acculturation research has produced little and has been guilty of
confused concepts, circular reasoning, wrong research questions, and “mistaken
citations of mistaken interpretations of studies using mistaken measurements” (Rudmin
(2010a; 2010b, p. 299).
Gillespie, Howarth and Cornish (2012) have also criticised traditional
acculturation models on methodological grounds. Social categories, they claim, are
“perspectival” in that categorization stems from social position, history and particular
interests, none of which is objective; social categories are “historical” in that they and
their members are in constant flux; social categories are blurred by the movement of
people between categories; social categories are “re-constitutive of the phenomena they

81
seek to describe” (p. 1) because people react to categorisation; and social categories
oversimplify by blurring intra-group differences and accentuating inter-group
differences.
Even dialogical self theory itself has not escaped methodological criticism, though
unlike the criticism directed at older models, it is not deemed to be fatal. Adams and
Markus (2001) voiced misgivings as to “whether the dialogical self meets the objective
of a non-reifying account of culture and self” (p. 284). They observed that Hermans’
“treatment of culture as positions” as in itself entailing the “reification of dynamic
flowing [cultural] patterns into static, fixed entities” (p. 284). Further, they see
Hermans’ notion of positioning as based on the premise that “selves and ‘cultures’ can
be represented or ‘fixed’ as locations in space” (p. 284); and that the Hermans’
metaphor of dialogue “restricts cultural influence to knowable, objectified ‘me’ aspects
of the Jamesian self and appears to neglect or understate the possibility of cultural
influence on knowing, subjective ‘I’ aspects”, with the implication of “an essential, core
self—whether unitary and continuous or multiple and discontinuous—that is insensitive
to cultural variation” (p. 284). Notwithstanding, they conclude that
As a model of identity negotiation, Hermans’ dialogical self makes important
contributions: it emphasizes the multiplicity of identity, highlights the agency of
the self as a constructor of identity, and suggests the importance of psychology—
and the study of self, in particular— for the study of culture (p. 283).
In summary, researchers have criticised traditional acculturation models on two
main grounds, empirical and methodological. At the empirical level, researchers have
argued that traditional models do not adequately fit the facts since they cannot
accommodate the blurred boundaries of cultural hybrids; and at the methodological
level, researchers have argued that traditional models and the methods by which they
are applied are logically flawed.

82
4.2 A Dialogical Theory of Acculturation
The previous section made the case that traditional acculturation models do not
adequately explain acculturation. This section makes the converse case by showing how
dialogical self theory explains the epiphenomena of acculturation, such as localisation
(as a counterforce to globalisation), asymmetric power relations, and cultural continuity.
It is argued that all such epiphenomena have as their driving force a single impetus: the
desire by migrants and others to mitigate the debilitating and disturbing impact of
uncertainty.
Uncertainty and its discontents. Uncertainty has long been recognised by all
branches of the social sciences as undesirable and undesired. For instance, Hofstede
(1980) recognised uncertainty avoidance as one of his cultural dimensions, and in the
field of cross-cultural psychology, Hermans (1999) linked the discontents of uncertainty
to globalisation:
Globalization is easily understood as contrary to living one's “authentic life” in
peace, partly because authenticity and pureness, however conceptualized, is better
suited to a homogeneous, stable, localized, and predictable society than an
increasingly heterogeneous, changing, translocal, and unpredictable global world.
(p. 1118).
He went on to argue that uncertainty and the strategies mitigating it must be
understood in a dialogical framework; and that “uncertainty is not primarily in a
culture's core but in its contact zones” (pp. 1119), where migrants meet their hosts. In
his later studies, Hermans (2001a; Hermans & Dimaggio, 2007) saw the progression
towards hybrid identity in the following terms: globalization leads to identity
hybridisation, which leads to uncertainty, which leads to anxiety. The logic of this
progression is found in dialogical self theory. In dialogical terms, the hybrid cultural
83
identity is characterised by an unprecedented density and heterogeneity of I-positions,
and the self is subjected to larger “position leaps” than ever before.
To recap, uncertainty is an unavoidable outcome of globalisation, particularly for
migrants, who themselves are a product of globalisation. But uncertainty alone does not
create anxiety; for that to happen there must also exist the possibility of undesired
outcomes among life’s many uncertainties. This is where power relationships enter the
argument, for it is the asymmetry of power as between migrant and host country that
diminishes the control that migrants have over their lives, and hence the likelihood of
undesired outcomes. Therein lies anxiety.
Power relationships. Disparities of power colour the acculturation process
(Hermans (2001). Migrants find themselves in a strange and unfamiliar environment
where even the simplest exchanges can conceal pitfalls as words are misunderstood or
unintended offence given. Hermans (2001) depicted the problem in dialogical terms by
characterising cultures
...as collective voices that function as social positions in the self. Such voices are
expressions of embodied and historically situated selves that are constantly
involved in dialogical relationships with other voices. At the same time these
voices are constantly subjected to differences in power. (p. 272, italics added)
Identity formation takes place by means of an internal dialogue between personal
and collective voices, in which external power relations play a role (Hermans &
Hermans-Konopka, 2010). Psychological and cultural processes are moreover
intimately connected, such that cultural diversity is reflected in the self.
Subsequent researchers have expanded on this theme. Kinnvall (2004) observed
that migration “is often characterized by a sense of powerlessness and dependence as
insecurity is increasing among many migrants. This is frequently mixed with an acute
anxiety about their new circumstances and strong feelings of homelessness” (p. 747).

84
Bhatia (2002) and Chaudhary & Sriram (2001) drew attention to the role of race and the
history of colonialism that colours much North–South migration. Raggatt (2007)
identified power relationships as central to his taxonomy of positioning in the dialogical
self. Lastly, much of the work of O'Sullivan-Lago (2011a; 2011b; O’Sullivan-Lago &
de Abreu, 2008; 2010; O’Sullivan-Lago, de Abreu & Burgess, 2008), which concerns
immigrants to Ireland, is conducted against a backdrop of power asymmetry,
exacerbated by the inclusion of asylum-seekers in her sample (see also later section on
cultural continuity).
Power relationships are of importance because of their function—or rather, lack of
one—in traditional acculturation models. Models such as that of Berry (1980) are
limited largely because they do not recognise and formally incorporate the reality of
power relationships. According to Bhatia and Ram (2001), such models implicitly
assume that psychological processes are the same for all migrants, weak and strong.
Migrants, it is supposed, are free to choose a preferred acculturation strategy,
integration being touted as the one with the best outcome in terms of mental well-being.
This, argue Bhatia and Ram, simply misrepresents the reality: asymmetries of power
and status can often rule out integration, and sometimes even assimilation, leading some
migrants to choose separation and leaving others to be marginalised.
In dialogical terms, migration is often less a “blissful marriage of … cultures” and
more a series of “contested, negotiated and painful, rupturing experiences associated
with living between cultures.” (Hermans, 2001; p. 271). When people migrate, they
naturally take with them an existing heterogeneous set of internal I-positions, developed
in their home country in dialogue with its culturally specific external I-positions; which
then confront an equally heterogeneous, but thoroughly unfamiliar, multiplicity of
external positions I-positions from the adoptive culture. In Hermans’ (2003) words:

85
Voices from the culture of origin do not simply disappear when people are
involved in an acculturation process. Instead, the older or deeper voices are often
established parts of the self, and they are challenged, evoked, repressed, or simply
ignored (p. 95).
Strategies for uncertainty mitigation. According to Hermans and Dimaggio
(2007), in an effort to calm the anxiety arising from the turbulence and unpredictability
of globalisation, people may resort to “localising” and “homesteading” (best seen as a
type of localisation) as a counterforce to the globalising forces they see all around. The
authors couch their explanation in terms of the dialogical self, which, they argue, is the
appropriate theoretical framework for the task. They grant that dialogical self theory is
not the only theory that claims to explain localisation: the others are social identity
theory, in which membership creates self-categorization to favour the in-group; optimal
distinctiveness theory, in which people seek a balance between desire to fit in or stand
out; and intersectionality theory, in which race, class, and gender are seen as
intersecting and interlocking. But in their view, none of these alternative theories
adequately explains the epiphenomenon of localisation.
Hermans and Hermans-Konopka (2010) identify “Five strategies to cope with the
heightened level of uncertainty” (pp. 44–47). The first is to reduce the number of a
person’s I-positions and their heterogeneity—to simplify life and so restore tranquillity.
The second strategy is to let a single, powerful I-position take the lead; leaders may rely
on this in their followers either for good (when they termed “inspirational”), or ill (when
they are termed “populists”). The third strategy is to delineate more firmly the boundary
between in-group and out-group (“We are not like them”), whereby multiple internal I-
positions effectively become external and so can be subordinated and subdued. The
fourth strategy is to augment the number of I-positions by adding others that provide
solace—a strategy not without risk as the same turbulent I-positions remain in place.
86
Lastly, the fifth strategy is what Hermans terms “going into uncertainty”, that is, to
confront and wrestle with uncertainty dialogically, as one would in constructive debate.
Significantly, all five strategies draw on dialogical self theory, but in different
ways. Strategies one through four are dialogical only in the sense that they intentionally
manipulate the number and type of I-positions. The fifth strategy is exceptional in that
the intention lies in the dialogue, not the I-positions that may or may not result. Any
change in I-positions is therefore unintentional in the sense of being unpredicted; what
is intentional is the dialogue that causes them. The I-position changes are necessarily
unpredictable, emerging perhaps serendipitously, for if not they would have been
managed already by one or other of the other strategies. Therein lies the real power of
dialogical thinking.
Kinnvall (2004; 2010), like Hermans, argues that globalisation diminishes
people’s sense of security. Majority and minority communities in Europe have reacted
by searching for one stable and secure identity, which she terms “the securitization of
subjectivity” (Kinnvall, 2004; p. 763). One strategy for achieving this aim—in essence,
localisation—is what Kinnvall calls “homesteading”, a term coined by Kronsell (2002)
for the different physical circumstances of an academic establishment, but co-opted by
Kinnvall to describe “making and shaping a political space for oneself in order to go
beyond and surpass the life of contradictions and anxieties that characterizes
homelessness” (Kinnvall, 2010, p. 601). Another, topical, example (not Kinnvall’s) is
provided by the independence movements of such places as Catalonia and Scotland,
which can be interpreted as localising resistance to the globalising impact of the Spanish
and British states. And though it seems paradoxical that both regions should so strongly
support membership of the European Union, the paradox is resolved when if Brussels is
perceived as a more distant, and therefore acceptable, alternative to the stifling embrace

87
of the mother country, providing enough political certainty to mitigate the uncertainty
and insecurity of smallness.
4.3 Cultural Continuity
Thus far, the discussion has centred on the mechanism by which globalisation
generates anxiety, and on the means of mitigating that anxiety. This section
demonstrates how this process commonly manifests itself in practice: the search for
cultural continuity, that is, the efforts that migrants (and more broadly anyone
experiencing acculturative stress) make to preserve their mother culture, sometimes
with success, sometimes not.
Fear of fragmentation. Culture metaphorically cradles the self in the sense that it
creates the “others” to which the self must relate dialogically, and so generates many of
the external I-positions that constitute the dialogical self (Salgado and Hermans, 2005).
And in so doing, it shapes and moulds the self in its image—or a reflection of it. But
attractive as this metaphor is, it does not of itself explain what happens to the self when
culture changes. For whatever else takes place, migrants (except in exceptional and
possibly pathological cases) do normally preserve their sense of personal continuity. It
seems, then, that individual and cultural continuity are intimately entwined in the sense
that the one depends very much on the other. It is for example impossible to imagine
cultural continuity without individual continuity (or indeed any kind of continuity for
that matter). Conversely, it may not be impossible, but it is certainly problematic, to
imagine individual continuity without cultural continuity.
This theme was ably explored by Chandler and Lalonde (1998; 2004; 2008) in
their research into First Nations of Canada. Like many indigenous communities, the
First Nations are migrants of a kind—not geographical but temporal: they stayed put
while the world changed around them. But the acculturation problems they faced were

88
nonetheless real, and the worse for being involuntary and infected with the power
dynamics of racism. In an extensive survey of First Nations communities, Chandler and
Lalonde (2008) found that those “that preserve heritage culture, and control destinies,
are dramatically more successful in insulating their youth against the risks of suicide”
(p. 6). The reason is that the adolescents of communities, already at an age of precarious
selfhood, see no future for themselves, literally, unless sustained by the visible and
emotional signifiers of cultural continuity. Chandler and Lalonde (2004) state:
If, owing to some train of personal or collective mishaps, single individuals or
whole communities lose track of themselves in time, and so suffer some
disconnect with their past or future, then old responsibilities and new promissory
notes fly out the same window, and life, we argue, becomes cheap. (p. 3)
It remains to explain this phenomenon in dialogical terms.
Salgado and Hermans (2005) argued that the self exists only by virtue of its
context. Rejecting both Thomist monism and Cartesian dualism, they see the self as an
emergent property of dialogism: “the I emerges by reference with an Other” (p.10). In
this way they reconcile the notion that the self must change as its dialogical others
change. The implication is that if one’s culture ceases to exist, then the external I-
positions that it sustains likewise are extinguished, which goes to the very core of
selfhood.
An alternative, but still consistent, explanation is afforded by the phenomenon of
fragmentation. Fragmentation is one form of dissociation, the others being omission,
subduing and distortion (Hermans & Hermans-Jansen, 1995). Unlike the postmodern
self, the dialogical self does not normally give rise to fragmentation; instead, it bridges
the gap between the modern ideas of discontinuity and continuity (Hermans (2001a).
Voices from different I-positions may disagree, but they are normally in dialogue, that
is, the oppositional I-positions acknowledge the other’s existence and may compromise.
89
Where the strains are too great, however, fragmentation may occur, such as that
experienced by Chaudhary (Chaudhary & Sriram, 2001), but it falls far short of the
pathological:
Whatever I do or say… either exotic or weird… I resist, sometimes consciously,
sometimes unknowingly… but the foreign culture is affecting my psyche…
nothing I do is irrelevant, it is either a reaction or an act of conformity…
sometimes I go out of my way not to resist… I want to be open… beyond
culture… (p. 383)
In summary, cultural and personal identity are inseparable but it is nevertheless
possible for the self to persist throughout the acculturation process and still retain its
sense of continuity. It does so by means of dialogue with multiple cultures,. Strategies
for doing so are described next.
Strategies for engaging alterity. In a program of research spanning two decades,
Bhatia and colleagues explored the acculturation of mainly South Asian migrants to the
United States. What they found resembled less a linear transition from monoculture to
one of Berry’s four acculturated states, than a dialogically mediated struggle.
Bhatia & Ram (2001; 2007) found that race, gender, imperialism and power
relations coloured and shaped cultural choices. Migrant women in particular, including
second-generation daughters, were caught in a dynamic of push-and-pull dialogical
negotiation, alternately tugged this way and that by their separate cultural identities.
According to Bhatia & Ram (2001):
These negotiations are multi-layered and complex because the voices of parents,
peers, language, siblings, homeland and American society are all represented in
the dialogical self. (p. 305)
In an investigation of how diasporic women negotiate multiple and conflicting
cultural identities, Bhatia and Ram (2004; 2007) found that they adopted three
90
dialogical strategies: polyphonization, expropriation, and ventriloquation. By
‘polyphonization’ is meant a strategy whereby selves oppose each other’s voices in a
complex dialogue that despite its contradictions does not fragment; by ‘expropriation’ is
meant a monologue whereby social institutions that demands total obedience to social
norms and institutions attempt to suppress dissenting voices, usually without success;
and by ‘ventriloquation’ is meant the phenomenon of one voice infusing the other voice
to express its own voice or I position. These are all dialogical strategies that attempt to
mitigate (whether in a healthy way or not) acculturative stress; and consequently they
demand a dialogical theory of the self in order to be understood.
Bhatia and Ram (2009) describe the experience of South Asian migrants to the
United States during the terrorist attack on the Twin Towers. Having taken for granted
that they were “integrated”, they found to their shock that they were not; overnight they
came to be treated as the “Other” for no other reason than they looked Arab, at least in
some Americans’ eyes. Bhatia (2002; 2003; 2014) echoes this theme by describing
Edward Said’s struggles with forming a coherent identity, and describing the cultural
constraints places on migrants in an occasionally racist host culture: “Will we ever
belong?” The implication is that “an immigrant’s journey through acculturation is not
straightforward, direct, self-evident or ever complete” (p. 147).
Although integration and bicultural competency may be worthy goals to
achieve… for most people living in contemporary diasporas, their negotiation
with multiple cultural sites is fluid, dynamic, interminable and often unstable. (p.
148)
Homesteading is another dialogical strategy to assuage the existential insecurity
engendered by encountering alterity. According to Hermans and Hermans-Konopka
(2010), “A primary way of responding to these experiences is to seek reaffirmation by
drawing closer to any localized group that is seen as capable of reducing uncertainty and
91
insecurity” (pp. 41–42). Bhatia (2007) explains how South Asians migrants to the
United States have done so: by re-creating India in the home, through media
consumption (mainly movies and music), membership of social clubs etc.
Homesteading, like localisation, is an antidote to the homogenising impact of
globalisation in that it sustains external I-positions reflecting the home culture.
Yet another strategy is to develop “adaptive” I-positions, by which is meant ones
that are conducive to functioning in the host culture. Aveling and Gillespie (2008)
identify three distinct I-positions among adolescents of Turkish origin in the UK, and
show that they are adaptive to the fractured and asymmetrical social contexts in which
they are embedded. As an example, the researchers show that one such I-position can
undermine these constraining racial chauvinisms, allowing them to build cultural
bridges, as, for example, in the diversity of their friendship groups. Thus while
reflecting persistent and unresolved dialogical struggles resulting from the
asymmetries of power which structure their socio-cultural context, this movement
between positions is nonetheless adaptive. (p. 21)
Lastly, Gillespie, Kadianaki, and O’Sullivan-Lago (2012) and O’Sullivan-Lago
(2008; 2010a) draw on the theory of semiotics for ameliorative strategies. Semiotic
regulation refers to the way in which meanings and actions regulate the thoughts and
actions of self and other:
Encountering alterity cannot be reduced to contact in the sense of co-presence in
the same geographical space. For a genuine encounter with alterity to occur, the
perspective of the other has to permeate the self and to some extent, transform the
self.… In the same way that living tissue expunges alien objects, semantic barriers
operate within the semantic realm to expunge discomforting ideas; just as the
body regulates what enters it, the self regulates what enters the semiotic realm. (p.
706)
92
In summary, what these strategies have in common is the attempt to mould the
migrants’ mental and physical environment to accommodate the demands placed upon
them by the imposition of otherness, and this way to create a familiar and hence
restorative mental and physical space.
Strategies for identity maintenance. O’Sullivan-Lago and her collaborators
(O’Sullivan-Lago, 2011a; O’Sullivan-Lago & de Abreu, 2008; 2010a; 2010b) have for
many years researched the acculturative experiences of immigrants to Ireland. Ireland
has traditionally been a land of emigrants, so to start receiving immigrants was therefore
a novel, and to many Irish people, disturbing experience. O’Sullivan-Lago and
collaborators saw this therefore as fertile ground for employing dialogical self theory to
explore how both immigrants and Irish adapted to the situation.
O'Sullivan-Lago de Abreu and Burgess (2008) describe a strategy whereby both
immigrants and Irish adapted an I-position that permitted both groups to accept the
dignity of the other. As a basis for their research they drew on Chandler and Lalonde’s
(1998) research into youth suicide in Canadian First Nations communities, which found
enormously elevated rates in certain communities, and linked these to a lack of cultural
continuity. According to O'Sullivan-Lago et al. (2008), the relevance to Ireland is two-
staged: first, “an individual’s decision to end their own life might be made far easier if
they were suffering from broken personal continuity because they would lose their
personal meaningful connection to who they will become in the future” (p. 350); and
second, “we can infer from Chandler’s theory that… cultural continuity has a profound
impact at the individual level” (p. 355). Or to trace the causal link from its genesis,
cultural continuity affects individual continuity, which in turn affects suicidal
behaviour. Completing the syllogism, immigration has caused cultural discontinuity,
which has caused, not suicide, but mental ill-health—or would do so but for the
93
ameliorative I-position adopted by both sides: “I as a human being”, the function of
which is to maintain cultural, and hence individual, continuity in the face of
demonstrated stresses on cultural continuity:
The strategy of evaluating all as equal due to the possession of the ‘I as a human
being’ identity allowed each group to attempt to restore their broken continuity.
All are, and always will be, human beings despite divisions such as culture and
ethnicity. (p. 361)
In an elaboration of this theme, O’Sullivan-Lago (2011a) explored “how
solidarity might be formed between the groups now resident in the multicultural space
and examine[d] what identity spaces are available that will bridge the gap between self
and other” (p. 3.18). Besides the shared-humanity perspective identified by O'Sullivan-
Lago et al. (2008), several other representations of intercultural solidarity were found,
concerning religion, collective history, and EU membership. In an analysis of Roma
(otherwise termed Romanies or Gypsies), O’Sullivan-Lago (2011b) explored the same
theme from a negative perspective, that is, one where the “I as a human being” position
is not established. By constructing the Romany other as less than human… the
relationship is no longer dialogical but monological: the possibility of a relationship, of
dialogue, is removed” (p. 68). Though not achieved in this case, the shared-humanity I-
position is seen as supremely important for dialogue and thereby the maintenance of
culture.
O'Sullivan-Lago and de Abreu (2010b) approached cultural continuity from a
different angle, by asking not about coping strategies as such (as O'Sullivan-Lago de
Abreu and Burgess, 2008) but about their proposed identity strategies given the cultural
futures they foresee for themselves. Accepting the proposition that the dialogical self is
a “self-organizing system”, they asked “what happens in the Dialogical Self when
individuals experience cultural discontinuity” (p. 284). The answer depended on the

94
group in question. The native-born Irish represented Irish cultural ways as “normal”,
which carried the suggestion that migrants should assimilate. The voluntary immigrants
stressed their integration into Irish culture but at the same time emphasized the
maintenance of their own cultural identity positions—an “integration” strategy in
Berry’s terms. Lastly, the asylum seekers espoused a more or less assimilationist
position because they needed to stay in Ireland. What is interesting about these
strategies is not that they fit Berry’s taxonomy (which anyway covers the range of what
is possible) but that they are negotiated, malleable (the voluntary migrants might want
to repatriate, so keep their cultural options open), and above all constrained. All seek to
restore continuity, but find different ways to do so given their differing circumstances.
4.4 Research Aims and Questions
Aims. The preceding review of the research to date strongly suggests that
dialogical self theory has the potential to explain the nature of acculturation better than
previous theories. Supporting evidence is important, given that dialogical self theory is
a relatively new model of personality. Quantitative research is particularly needed, to
build on existing qualitative research. The present thesis seeks to investigate the
migration experience by utilising a dialogical-self perspective to add to this endeavour.
There are two broad aims. One is to test the theory of the dialogical self in a
natural context, namely the phenomenon of migration. The logic of the investigation is
as follows: the migration experience constitutes a transition in the lives of migrants,
which places them under acculturative stress; this cultural rupture, which broadly takes
the form of uncertainty, is then manifest in the repertoire of I-positions of migrants
when probed using the self-confrontation method. Verifying this analysis would buttress
dialogical self theory as both an explanatory and a diagnostic tool in a range of
applications.

95
The second aim of the thesis follows from the first. To recap, the first aim is to
use the theory of the dialogical self to establish whether or not migration is reflected in
the migrant’s repertoire of I-positions; the second is to determine the magnitude of any
such change.
Research questions. Five research questions (some being multi-part) are
investigated.
Migrant identity. The present thesis has presented theories of acculturation that
have implications for I-positions. In essence, a number of theories claim ethnic
identification as a causal factor in acculturation outcome. Research questions 1a and 1b
explore this proposition.
Research question 1a: Biculturalism. How is biculturalism reflected in I-
positions?
Research question 1b: Ethnic identification. How is ethnic identification reflected
in I-positions?
Stability and change in the dialogical self. The present thesis has shown that
people have multiple selves that coexist in time and space, and that this proposition is
widely, though not universally, accepted by contemporary theorists in the field. It is,
furthermore, a central and defining plank of the theory of the dialogical self. For these
reasons it is central to this thesis. The thesis moreover tests the existence of multiple
selves, for migration qualifies as exactly the type of life change that might propagate a
corresponding I-position. At the same time, however, it is not expected that all migrants
will exhibit changes in I-position, for even theories of multiple identity acknowledge
that change must take place against a backdrop of stability, without which it is
impossible to talk about the individual as an enduring construct. Research questions 2a

96
and 2b pertain to migrants who claim to have two cultural identities, and were explicitly
selected for the study sample.
Research question 2a: Stability of the dialogical self. Are country-of-origin and
Australian I-positions similar, and if so, how?
Research question 2b: Changes in the dialogical self. Do country-of-origin and
Australian I-positions differ, and if so, how?
Composition of I-positions. The present thesis has presented theories of identity
some of which suggest possible parallels with aspects of the dialogical self. Research
questions 3a, 3b and 3c explore aspects of this and similar propositions.
Research question 3a: Evidence of multivalence of the dialogical self. Can
individuals simultaneously possess I-positions that differ significantly in their major
themes.
Research question 3b: Evidence of adjustment to migration. If so, do individuals’
I-positions correspond to those for country of origin and Australia? In what way?
Research question 3c: Motives for migration. What motivates successful migrants:
the desire for self-enhancement or union-with-the-other?
Psychological state of migrants. The surveyed literature touched on migrants’
psychological response to acculturation in terms of culture shock and acculturation
stress. Although marked distress was not expected (the study sample had lived in
Australia long enough to have passed through any period of culture shock, or cultural
“honeymoon”), it was thought that psychological responses to migration might reveal
the degree of adaptation to life in Australia. Research question 4 is grounded in theories
that invoke a cultural adaptation as a response to the stresses imposed by trying to
survive and prosper in an alien culture, particularly the “ABC model” of acculturation.

97
It reveals migrants’ attempts to adapt to circumstances by exploring the relationship
between their I-positions and their psychological distress and psychological well-being.
Research question 4: Psychological distress and well-being. How do migrants,
when classified by their I-positions pertaining to country of origin and Australia, vary in
psychological distress and well-being?
Case studies. Research question 5 seeks to corroborate the answers to research
questions 1 and 2 by taking an idiographic approach.
Research question 5: Idiographic confirmation. Are differences between
individuals classified by their I-positions reflected in the life stories of specific case
studies?
Plan of the empirical work. The present research took the form of three parallel
studies. Study 1 was exploratory in nature. It investigated whether or not there might
exist naturally forming groups among migrants. Its specific aim was to investigate if
migration brings into being separate I-positions relating variously to the migrant’s
country of origin and to Australia; and if so, to determine if the nature of those I-
positions were related to the demographic characteristics, psychological self-reports and
self-confrontation indices of the migrants possessing them. Study 1 therefore addressed
the first stated aim of the research, namely to establish whether or not migration were
reflected in the migrant’s repertoire of I-positions.
The aim of Study 2 was to elaborate and thereby corroborate Study 1. Unlike
Study 1, which used cluster analysis to group individuals, Study 2 classified them by
comparing their valuations in their country of origin and Australia. Despite their
differences in analytical approach, both studies investigated similar patterns of stability
and change in I-positions. However, it was in the context of Study 2 that hypotheses
concerning stability of the self were developed and formally tested. Study 2 therefore
98
addressed the second stated aim of the research, namely to determine the magnitude of
any change observed under Study 1.
Study 3 adopted an idiographic approach to complement the nomothetic approach
of Study 1. Four case studies will be discussed, one of each migrant type: Progressive,
Low-stable High-stable, and Regressive. The aim is to exemplify and corroborate the
nomothetic principles identified in Study 1, and thereby to furnish a more complete
understanding of the individual.
All three studies employ data gathered from the same sample of 38 adult migrants
to Australia. To maximise comparability they were selected according to five criteria:
they perceived themselves as having two separate cultural identities, one for their
country of origin and the other for Australia; they were all born overseas and migrated
to Australia after the age of 12; they were voluntary migrants (as opposed to refugees);
they had lived in Australia for at least five years; and they had a good knowledge of
English. Chapter 5 documents the rationale for these criteria and details the
characteristics of the sample.

99
CHAPTER 5: Research Methodology
This chapter describes the research method adopted in the thesis. First, the
characteristics of the sample are described. Next, details are given for the data gathered
under the study; these were of two main kinds: self-report measures and self-
confrontation indices. After that, the self-confrontation method (SCM) is described, this
being the method by which the self-confrontation indices were derived. The chapter
concludes with a description of the procedure for gathering data, and the procedure for
computing the self-confrontation indices from the participants’ responses.
5.1 Participants
Sample selection. Data for the present thesis came from a sample of 38 migrants
(14 men and 24 women), who were recruited using a variety of methods. Initially it was
thought that the sample could be recruited on campus, and to this end advertisements
were placed on notice boards posted around the university campus (see Appendix A). In
the event only two student participants were obtained in this way. A “snowball”
sampling method (Valentine, 1997) was adopted instead, which had the advantage that
the respondents were drawn from the broader community. This was deemed appropriate
as the major research goal was to study a range of migrants’ valuations to see whether
patterns existed across them. First, a few participants were recruited from interested
applicants who contacted the researcher after she was interviewed about the study by a
local community radio station. These then suggested others, who in some cases
suggested still others.
To maximise comparability of participants, they were selected according to five
criteria:
100
Criterion 1: On questioning, the participants reported that they perceived
themselves as having two separate cultural identities—that is, they thought of
themselves as having achieved bi-cultural identification, one identity belonging to their
country of origin and the other identity belonging to Australia.
Criterion 2: The participants were all born overseas and had experienced the same
life changing event: migration to Australia after the age of 12. As such, they are
categorised as first-generation migrants (Rumbaut, 2004) since those who arrive in their
adolescent years have similar experiences and adaptive outcome as adult migrants.
Criterion 3: The participants were voluntary migrants (as opposed to refugees).
Reasons for migrating have been studied using the concepts of “pull/push motivations”
(Berry, 1990), where push motives characterise the involuntary or forced migration of
refugees. This is generally negative and mostly reactive, whereas pull motives
characterise voluntary migration of migrants, which is generally positive and mostly
proactive, seeking a better future (Richmond, 1993).
Criterion 4: The participants had lived in Australia for at least five years so as to
allow for sufficient time to fully experience migration and also to allow for enough time
for the adaptation process to take place (Taft, 1986).
Criterion 5: The participants had a good knowledge of English to avoid translation
difficulties. Also, following La Fromboise et al.’s (1994) focus on the concept of
bicultural competence, English language proficiency underlies the ability to function
effectively in mainstream Australia. A good language competence is known to facilitate
the adaptation process and be an important indicator of acculturation level (Berry,
1990).
Sample characteristics. Table 5.1 sets out the salient characteristics of the
sample.
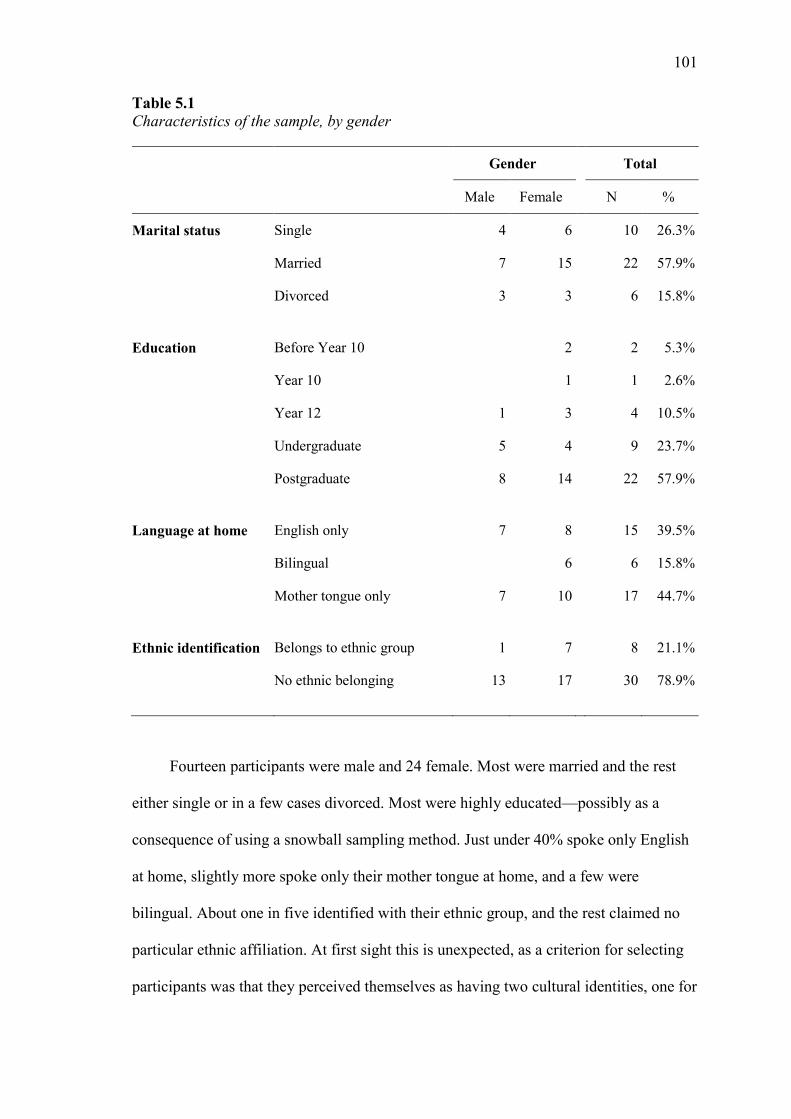
101
Table 5.1 Characteristics of the sample, by gender
Gender Total
Male Female N %
Marital status Single 4 6 10 26.3%
Married 7 15 22 57.9%
Divorced 3 3 6 15.8%
Education Before Year 10 2 2 5.3%
Year 10 1 1 2.6%
Year 12 1 3 4 10.5%
Undergraduate 5 4 9 23.7%
Postgraduate 8 14 22 57.9%
Language at home English only 7 8 15 39.5%
Bilingual 6 6 15.8%
Mother tongue only 7 10 17 44.7%
Ethnic identification Belongs to ethnic group 1 7 8 21.1%
No ethnic belonging 13 17 30 78.9%
Fourteen participants were male and 24 female. Most were married and the rest
either single or in a few cases divorced. Most were highly educated—possibly as a
consequence of using a snowball sampling method. Just under 40% spoke only English
at home, slightly more spoke only their mother tongue at home, and a few were
bilingual. About one in five identified with their ethnic group, and the rest claimed no
particular ethnic affiliation. At first sight this is unexpected, as a criterion for selecting
participants was that they perceived themselves as having two cultural identities, one for

102
country of origin, the other for Australia. One would not, therefore, expect them to
express “no ethnic belonging”. A plausible explanation is that they perceived their
ethnic identity as private rather than public. Thus they have two private cultural
identities while at the same time not identifying publicly with their ethnic group.
Table 5.2 presents means of continuous variables by gender. No significant
differences were found for years in Australia, t(36) = –.46, p = .65 (two-tailed), or for
age, t(36) = –.33, p = .74.
Table 5.2 Means and standard deviations for Years in Australia, Age and Individualism, by
gender
Gender
Male Female All
Years in Australia Mean 18.7 20.4 19.8
Standard deviation 10.7 10.6 10.5
Age Mean 41.1 42.2 41.8
Standard deviation 10.4 9.6 9.8
Individualism Mean 38.4 43.1 41.4
Standard deviation 12.5 24.5 20.8
Hofstede’s (1980) concept of individualism was discussed in Chapter 2. Table 5.3
ranks the sample by individualism score of their country of origin. About three-quarters
of the sample was drawn from countries such China and Colombia that are low on
individualism (arbitrarily defined as 50 on Hofstede’s scale) and consequently high on
collectivism. These are cultures that stress collective identity, in-group loyalties,
emotional interdependence, sharing, duties and obligations, a need for stable and
predetermined friendships, and subordination of individual interests.
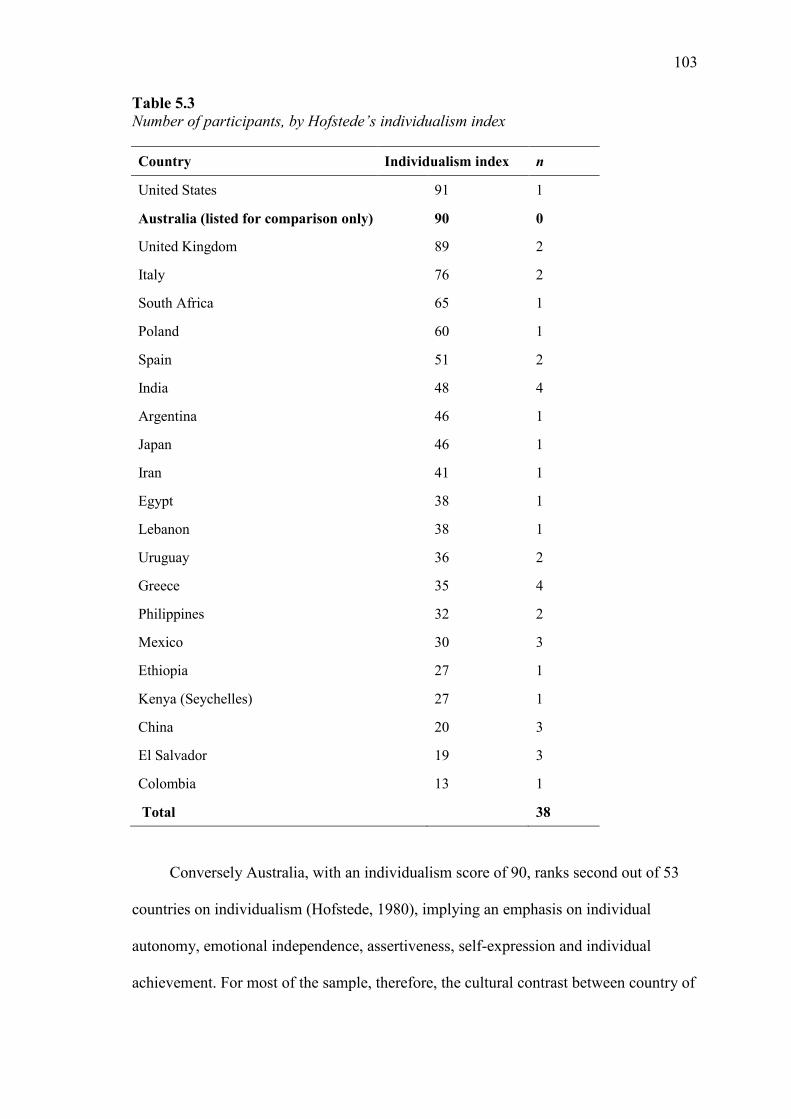
103
Table 5.3 Number of participants, by Hofstede’s individualism index
Country Individualism index n
United States 91 1
Australia (listed for comparison only) 90 0
United Kingdom 89 2
Italy 76 2
South Africa 65 1
Poland 60 1
Spain 51 2
India 48 4
Argentina 46 1
Japan 46 1
Iran 41 1
Egypt 38 1
Lebanon 38 1
Uruguay 36 2
Greece 35 4
Philippines 32 2
Mexico 30 3
Ethiopia 27 1
Kenya (Seychelles) 27 1
China 20 3
El Salvador 19 3
Colombia 13 1
Total
38
Conversely Australia, with an individualism score of 90, ranks second out of 53
countries on individualism (Hofstede, 1980), implying an emphasis on individual
autonomy, emotional independence, assertiveness, self-expression and individual
achievement. For most of the sample, therefore, the cultural contrast between country of
104
origin and Australia is substantial. It follows that most have had to make a big cultural
adjustment if it is assumed that they are representative of their birth cultures (which is
not necessarily the case). In the present study, however, men and women did not differ
significantly in the individualism score of their countries of origin, t(36) = –.67, p = .51
(see Table 5.2 for means).
Sample representativeness. In requiring that participants possess “two separate
cultural identities”, the sample made no claim to be statistically representative of
migrants in general, and this is evident in the sample characteristics. Most participants
were well educated (over 80% university educated) and all had a good command of
English (40% spoke it in the home, including three participants from English-speaking
countries). However, the intention was not that the sample be representative but that it
include migrants from a range of backgrounds. Tellingly, they were diverse in their
responses, some finding the migrant experience positive, some not. This is appropriate
to test the study’s research questions.
5.2 Self-report Measures of Psychological Distress and Well-being
Each participant completed a questionnaire that contained self-report measures of
psychological distress and well-being (Appendix A). Descriptive statistics (including
reliability coefficients) relating to the psychological scales are presented in Appendix C.
Psychological Adjustment Measures. Three measures were used. All were self-
reports and are discussed below.
Social Avoidance and Distress Scale. The Social Avoidance and Distress Scale
(SAD; Watson & Friend, 1969) was employed as a cognitive and behavioural
measurement of social adjustment. The SAD contains 28 items, 14 of which assess
social avoidance and 14 of which measure social anxiety. It uses a True/False response
105
format, evenly divided between true and false items. Scale scores on the true/false scale
range from 0 (lowest avoidance and distress) to 28 (highest avoidance and distress).
Social avoidance and distress as measured by the SAD refers to an individual’s
tendency to avoid social situations and to feel anxious while in such situations. The
authors distinguished between avoidance and the failure to approach, arguing that the
opposite of avoidance is not social approach, but simply lack of avoidance. Further,
they deliberately included only items that assessed subjective distress and behavioural
avoidance and excluded items that dealt with physiological indices of anxiety and
impaired behavioural performance (Leary, 1991). Patterson & Strauss (1972) used
factor analysis to verify the subscale structure for avoidance and distress; however, the
subscales have not been validated in this way, and most research using this scale has
used the full-scale version (Leary, 1991). Watson and Friend (1969) reported three
experimental and one correlational study of the SAD. The data indicated that people
defined as high anxious (those with scores of 11 and above) on the SAD were less
interested in participating in group activities and talked less when in an interpersonal
situation than the low anxious (those with scores below 3). Watson and Friend (1969)
reported a mean for university students of 9.1 (SD = 8.0), adequate internal consistency
(Cronbach’s alpha = .77), test-retest reliability (r = .68 to .79 over a 1-month period),
and construct validity (Watson & Friend, 1969). More recently, Hofmann, Dibartolo,
Holaway, and Heimberg (2004), in a study conducted to check the psychometrics of the
SAD on a sample of 199 college students, reported a Cronbach’s alpha of .93.
Cronbach’s alpha for the present thesis was .93.
Fear of Negative Evaluation Scale. The Fear of Negative Evaluation Scale (FNE;
Watson & Friend, 1969) was employed as a cognitive measurement of sociocultural
adaptation. The FNE is a 30-item measure of the degree to which people expect to be

106
negatively evaluated by others, to look foolish, and to make a bad impression. Watson
and Friend (1969) defined fear of negative evaluation as “apprehension about others’
evaluations, distress over their negative evaluations, avoidance of evaluative situations,
and the expectation that others would evaluate oneself negatively”. In elaboration, they
further stated that “fear of loss of social approval would be identical to FNE” (p. 449),
and that the opposite of high FNE is the lack of apprehension about other’s evaluations,
but not necessarily a desire or need to be evaluated positively.
The FNE’s items are scored true or false, split roughly equally between positively
and negatively scored items. True responses are scored as 1 point and scores range from
0 to 30, with higher scores indicating greater fear of negative evaluation. The FNE
norms (and also the SAD norms) were derived from a pilot study by Watson and Friend
based on an original sample of 205 college undergraduates that revealed a mean of 15.5
(SD = 8.6), with total scores of “18 or higher” and “9 or lower” on the FNE
corresponding to cut-off scores for the top and bottom 25%, respectively. They reported
that participants high on FNE became nervous in evaluative conditions, and were more
likely to expect disapproval from a leader and in addition more likely to seek approval
from others in order to avoid anticipated disapproval than low FNE participants. The
authors reported high internal consistency (Cronbach’s alphas = .94 to .96), strong test-
retest reliability (r = .78 to .94 over a 1-month period), and construct validity (Watson
& Friend, 1969).
Arkowitz, Lichtenstein, McGovern and Hines (1975), using a sample of 205 high
and low frequency daters in a college population, reported a mean FNE score of 7.85 for
high frequency daters, and 18.74 for low frequency daters. British FNE norms were
established by Stopa and Clark (1991) in two studies using a large sample of students.
107
Research on individual differences on the FNE has found that, compared with low
scorers, participants high in FNE avoid situations that could lead to potentially
threatening comparisons with others (Friend & Gilbert, 1973), are more affected by
negative evaluations about themselves (Smith & Saranson, 1975), worry more about
how they come across to other people (Leary, 1983), are more socially anxious and
more easily embarrassed (Heimberg, Hope, Rapee, & Bruch, 1988; Miller, 1995) are
more sensitive to criticism (Atlas, 1994), are more dependent (Overholser & Freheit,
1994), and are inclined to interpret others’ facial expressions as negative (Winton,
Clark, & Edelmann, 1995) than low FNE participants. The FNE has been validated
through significant positive correlations with selected personality measures (e.g., social
approval, locus of control; Corcoran & Fischer, 2000) and a negative correlation with
self-acceptance (Durm & Glaze, 2001). Cronbach’s alpha for the present thesis was .96.
Beck Depression Inventory, second edition (BDI–II; Beck, Steer, & Brown,
1996). The BDI-II was employed as a measure of psychological adjustment. The BDI-II
is the 21-item Beck Depression Inventory (BDI; Beck & Steer, 1993), which assessed
the severity of depression in normal and psychiatric populations of both adolescents and
adults, updated in light of criteria from the Diagnostic and Statistical Manual of Mental
Disorders (DSM-IV; American Psychiatric Association, 1994) for major depressive
disorder. The BDI–II comprises 21 items relating to symptoms and attitudes considered
to reflect depth or severity of depressive symptomatology in individuals aged 13 years
and older (Beck, Steer, & Brown, 1996). The BDI–II measures the cognitive, affective,
somatic, and vegetative aspects of depressive experience. Participants indicate the
extent to which they have experienced the symptoms over the last two weeks.
Individual items are rated on an ordered (0 to 3) scale, with higher scores indicating
higher levels of depression. The maximum total score for all 21 items is 63. According
108
to the BDI-II manual, scores from 0 to 13 indicate minimal depression, 14 to 19 indicate
mild depression, 20 to 28 indicate moderate depression, and 29 to 63 indicate severe
depression. More typically, clinically depressed or maladaptively nonclinical
populations score in the 14 to 28 range (Beck et al., 1996).
The BDI-II has demonstrated high internal consistency (alpha coefficients were
.93 among college students, and .92 among adult psychiatric outpatients (Beck et al.,
1996). The authors also demonstrated adequate validity (e.g. content, construct,
factorial), and established diagnostic discrimination. In their psychometric evaluation of
the BDI-II, Dozois, Dobson and Ahnberg (1998) established corresponding BDI-II cut-
off scores for classifying groups of research participants (0 to 12, nondepressed; 13 to
19, dysphoric; 20 to 63, dysphoric-depressed) based on cut-offs developed by Kendall,
Hollon, Beck, Hammen, and Ingram (1987) for the BDI. Dozois et al. (1998) also
reported a high level of internal consistency (Cronbach’s alpha of .91). More recent
research by Steer, Rissmiller, and Beck (2000) found that the total BDI-II score was not
significantly correlated with gender, age, or ethnicity of the participants. Cronbach’s
alpha for the present thesis was .93.
Psychological Well-being Scale. The Psychological Well-being Scale (PWB;
Ryff, 1989a; Ryff & Essex, 1992; Ryff, Lee, Essex & Schmutte, 1994) was employed as
a measurement of psychological adjustment. Derived from the literature on lifespan
development, mental health, and personal growth (Ryff, 1989b), the PWB consist of 84
items rated by a response scale ranging from 1 (strongly disagree) to 6 (strongly agree).
The version of the PWB used here contains six subscales: environmental mastery,
positive relations with others, autonomy, personal growth, purpose in life, and self-
acceptance.

109
Each PWB subscale was operationalised with a 14-item scale of positively and
negatively phrased items, which were mixed and, where appropriate, reversed to
produce a single inventory. Each subscale has a range of 14 to 84, high scores indicating
higher self-ratings of the dimension assessed. These six dimensions are found in Table
5.4 and describe psychological well-being in terms of the presence of positive attributes
rather than the absence of mental illness.

110
Table 5.4 Dimensions of Ryff’s Psychological Well-being Scale (PWB)
Dimension Score Definition
Environmental
mastery
High Has a sense of mastery and competence in managing the
environment; controls a complex array of external activities; makes
effective use of surrounding opportunities; is able to choose or
create contexts suitable to personal needs and values.
Low Has difficulty managing everyday affairs; feels unable to change or
improve surrounding context; is unaware of surrounding
opportunities; lacks sense of control over external world.
Positive
relations
with others
High Has warm, satisfying, trusting relationship with others; is
concerned about the welfare of others; is capable of strong
empathy, affection, and intimacy; understands the give and take of
human relationships.
Low Has few close, trusting relationships with others; finds it difficult to
be warm, open, and concerned about others; is isolated and
frustrated in interpersonal relationships; is not willing to make
compromises to sustain important ties with others.
Autonomy High Is self-determining and independent; is able to resist social
pressures to think and act on certain ways; regulates behaviour
from within; evaluates self by personal standards.
Low Is concerned about the expectations and evaluations of others;
relies on judgments of others to make important decisions; conforms
to social pressures to think and act in certain ways.
Personal
growth
High Has a feeling of continued development; sees self as growing and
expanding; is open to new experiences; has sense of realising his or
her potential; sees improvement in self and behaviour over time; is
changing in ways that reflect more self-knowledge and effectiveness.
Low Has a sense of personal stagnation; lacks sense of improvement or
expansion over time; feels bored and uninterested with life; feels
unable to develop new attitudes or behaviours.
Purpose
in life
High Has goals in life and a sense of directedness; feels there is meaning
to present and past life; holds beliefs that give life purpose; has
aims and objectives for living.
Low Lacks a sense of meaning in life; has few goals or aims; lacks sense
of direction; does not see purpose of past life; has no outlook or
beliefs that give life meaning.
Self-
acceptance
High Possesses a positive attitude towards the self; acknowledges ad
accepts multiple aspects of self, including good and bad qualities,
feels positive about past life.
Low Feels dissatisfied with self; is disappointed with what has occurred
in past life, is troubled about certain personal qualities; wishes to
be different from what one is.

111
Ryff (1989a) demonstrated the convergent validity of the scale with positive and
significant correlations with five prior measures of positive functioning: Affect Balance
Scale (Bradburn, 1969), Life Satisfaction Index (Neugarten, Havighurst & Tobin 1961),
Self-Esteem Scale (Rosenberg, 1965), Locus of Control – Internal (Levenson, 1974),
and Revised Philadelphia Geriatric Center Morale Scale (Lawton, 1975). Coefficients
ranged from .25 to .73.
Discriminant validity was shown via negative and significant correlations with
three established prior measures of negative functioning: Locus of Control-Powerful
Others, and Chance Control (Levenson, 1974), and Zung Depression Scale (Zung,
1965). Coefficients ranged from –.30 to –.60.
Intercorrelations amongst the six dimensions were all positive and significant and
ranged from .32 to .76 (Ryff, 1989a). The three highest intercorrelations (between self-
acceptance and environmental mastery, r = –.76, between self-acceptance and purpose
in life, r = .72, and between purpose in life and personal growth, r = .72) suggest that
these dimensions might be linked at some underlying causal level. Ryff (1989a),
however, found that they showed differential age profiles, and hence represent different
facets of positive psychological well-being.
Ryff (1989a) reported a high level internal consistency for the original 20-item
version scale, with Cronbach’s alpha ranging from .86 for autonomy to .93 for the self-
acceptance. She also reported excellent test-retest reliability over a six-week period,
with reliability coefficients ranging from .81 for environmental mastery and personal
growth, to .88 for autonomy (Ryff, 1989a).
The PWB scales have shown replicable patterns of significant age and gender
differences (Ryff, 1989a; 1991; 1995). Ryff (1989a) asked young, middle-aged, and
old-aged adults to rate themselves on each of the dimensions of well-being. She found

112
that environmental mastery and autonomy, increased with age, particularly from young
adulthood to midlife; personal growth and purpose in life decreased, especially from
midlife to old age; and positive relations with others and self-acceptance did not change
significantly (Ryff, 1989, 1995; Ryff & Keyes, 1995; Ryff et al., 2003). In a metastudy
of gender differences, Ryff (1995) found that women consistently scored higher than
men on positive relations with others and personal growth; but she found no significant
differences between men and women on the other subscales (Keyes, Shmotkin, & Ryff,
2002; Ryff, 1989; Ryff & Keyes, 1995).
Other studies using the Ryff scales explored the effect of education, and socio-
economic status on psychological well-being (Clarke, Marshall, Ryff, & Wheaton,
2001; Marmot, Ryff, Bumpass, Shipley, & Marks, 1997; Ryff, 1989; Ryff & Keyes,
1995; Ryff, Keyes, & Hughes, 2003). In respect of education, psychological well-being
in general, and purpose in life and personal growth in particular, were associated with
higher levels of education (Keyes & Ryff, 1998, chap. 7; Marmot et al., 1997; Ryff et
al., 2003).
In a study investigating how a life experience such as community relocation
relates to mental health, Ryff and Essex (1992) used the 14-item, shortened version of
the original PWB (Ryff, 1989a). Results were encouraging for the robustness of the
PWB; internal consistency for the reduced scales ranged from .86 to .93, correlations
with the 20-item original scales ranged from .97 to .98, and test-retest reliability over
ranged from .91 to .88 (Ryff & Essex, 1992).
In a 1997 study, Schmutte and Ryff examined the common affective
underpinnings between measures of personality and well-being, with 2 samples of
midlife adults completing measures of personality (NEO Five-Factor Inventory; Costa
& McCrae, 1992) and the shortened (14-item scales) versions of the original Ryff’s

113
(1989a) PWB. They found consistent relationships between the Big Five personality
factors and the six PWB subscales. Internal consistency (alpha) coefficients for the 14-
item scales ranged from .82 to .90.
More recently, Diehl, Hastings and Stanton (2001) used the shortened (14-item
scales) versions of Ryff’s (1989a) PWB in their study to investigate the extent to which
persons’ self-representations are different for different social roles and contexts, across
the adult life span, and their associations with psychological well-being. They obtained
coefficients of internal consistency of .91, .89, .87, .88, .84, and .87 for self-acceptance,
environmental mastery, purpose in life, positive relations with others, personal growth,
and autonomy, respectively.
Ryff (1989a, b) argued that previous perspectives on operationalizing well-being
“have little theoretical grounding” (Ryff, 1989a, p.1069) and neglect important aspects
of positive functioning. To address this shortcoming Ryff drew on the theories of
positive mental health (Jahoda, 1968), personal growth (e.g., Maslow 1968; Rogers,
1961; Allport, 1961), life span developmental (e.g., Erikson, 1959). In her view, well-
being is not simple the attainment of happiness but is characterised by “the striving for
perfection that represents the realization of one’s true potential” (Ryff, 1995, p.100). In
this view, happiness is “the by-product of a life that is well-lived” (Ryff & Singer, 1998,
p.5), and is reflected in six ideals: autonomy, personal growth, self-acceptance, purpose
in life, environmental mastery, and positive relations with others. And on that basis,
Ryff (1989a) developed a multidimensional instrument to measure them: Ryff’s
Psychological Well-Being (PWB).
The Ryff scales have also been used cross-culturally. For instance, Ryff (1995)
used it to investigate the psychological well-being in middle-aged Americans and South
Koreans. Interestingly, findings were broadly consistent with known cultural

114
differences. For instance, age and gender profiles were similar, but the Americans had
higher scores on all of the Ryff scales; Americans were more likely to attribute positive
qualities to themselves than were South Koreans; gender differences were the same in
both cultures, with women rating themselves significantly higher than men on positive
relations with others and personal growth; South Koreans placed greater emphasis on
the well-being of other people (e.g., children) in defining their own well-being than did
the Americans.
These and other findings lend credence to the robustness and usefulness of the
Ryff scales, including in a cross-cultural context. Cronbach’s alphas in the present
thesis were .91 for environmental mastery, .92 for positive relations with others, .88 for
autonomy, .88 for personal growth, .87 for purpose in life, and .91 for self-acceptance.
5.3 Self-confrontation Method (SCM)
Overview and rationale. Valuations were accessed and measured by means of
the self-confrontation method (SCM), which is an investigative tool used to access and
explore the dialogical self (Hermans, 1987a, 1987b, 1988, 1989, 1992; Hermans &
Hermans-Jansen, 1995). It did so by accessing I-positions. According to Hermans, “the
I … continuously organizes and interprets experience …”; people adopt different I-
positions depending on their life circumstances. If those circumstances are cultural, then
cultural identity is a special case of an I-position.
In the SCM, each valuation is assigned four indices, one each for the self-
enhancement motive, the union-with-the-other motive, positive affect, and negative
affect—respectively termed the S, O, P and N indices (or simply S, O, P and N for
short). Collectively, they represent the “theme” of the valuation. Although valuations
may in principle exhibit any combination of indices, many (but not all) can be assigned
115
to one or other of six “major themes”, each denoted by a characteristic feeling (Hermans
& Hermans-Jansen, 1995, p.73). (The SCM is elaborated in Chapter 4.)
Two additional concepts, “general feeling” (Hermans, 1988) and “ideal feeling”
(Hermans & Oles, 1996), are now explained. “General feeling” measures how a
particular valuation impinges on the general experience of the person; “ideal feeling”
measures how a valuation impinges on the ideal experience of the person. The more
generalising power a valuation has, the more influential is its affective component in
colouring the way the person generally feels, and the more idealising power a valuation
has, the more it says about the way the person would like things to be.
The SCM is administered in three stages: (a) valuation elicitation, (b) affective
rating, and (c) evaluation and integration (Lyddon, Yowell & Hermans, 2006). As an
investigative tool, the SCM is particularly suited to a study of this kind. First, it was
expressly designed to access I-positions. Second, it allows access to cultural identities
both before and after migration, so obviating a costly and difficult longitudinal
experimental design. Third, it avoids the bias of self-report questionnaires because its
purpose is not apparent to the participant (Berry, 1990, p.482). The present thesis used
an adapted version of the SCM. The procedure had three steps: (a) identification of the
cultural positions of the self that are current in the person’s life; (b) formulation of a
valuation system pertaining to each cultural position; and (c) assessment of the affective
implications of the valuations of the two positions.
Valuation elicitation. In the SCM, valuations are elicited by using a set of
standard, open-ended questions (see Table 5.5).

116
Table 5.5 Questions of the Self-confrontation method
Set 1: The Past
These questions are intended to guide you in reviewing one or more aspects of your life
which may have been of great importance to you.
Has there been anything of major significance in your past life which still
continues to exert a strong influence on you? Example: “After high school I never
managed to build up a group of friends; I felt left out and stuck between two
worlds.”
Was there in the past any person or persons, experience or circumstance which
greatly influenced your life and still appreciably affects your present existence?
Example: “My parents have always treated us as equals. They always tried to keep
me stimulated. I could always talk very well with my parents”.
Set 2: The Present
This set again consists of two questions which will lead you, after a certain amount of
reflection, to formulate a response:
Is there anything in your present existence which is of major importance to you or
exerts a significant influence on you? Example: “Bodily complaints: Every time I
find that I have a problem, my body signals it in one way or another”.
Is there in your present existence any person or persons or circumstance which
exerts a significant influence on you? Example: “Wendy is a good friend”.
Set 3: The Future
The following questions will again guide you to a response:
Do you foresee anything that will be of great importance for, or exert a major
influence on your future life? Example: “I want to pursue a combination of
studying and volunteer work”.
Do you feel that a certain person, persons or circumstance will exert a significant
influence on your future life? Example: “John and I want children in the future”.
Is there any future goal or object which you expect to play an important role in
your life? Example: “I would like to meet somebody who would teach me how to
have a normal life”.
Two final questions:
How do you generally feel these days?
How would you like to feel?
These questions are not answered by a formulation. Instead, you answer them by adding
two extra rows in the matrix using the same list of affect terms.

117
The questions are read aloud by the interviewer while sitting next to the
participant, and relate to people, experiences, circumstances and goals from the past,
present and future, that are significant in the judgment of the participant. The questions
invite participants to reflect on their life in such a way that they feel free to mention
those concerns that are most relevant from the perspective of the present. Participants
are free to interpret the questions how they want. They are also encouraged to phrase the
valuation in their own terms. During the interview, each elicited valuation is written by
the participant on a small card. The typical form of expression is a sentence or
sentences, as long as it as felt to be one total experience, where the participant brings
together those events that he or she feels belong together as elements of a personal unit
of meaning. A quick response is not required, and there is no one-to-one relation
between question and answer.
The participant is encouraged to mention all valuations that come to mind and, as
is typical of the SCM, each question leads to more than one valuation. The aim of each
interview is to arrive at an exhaustive assessment (Hermans, 1993) of the experiences
relevant to the participant from each I-position. At the end of each interview participants
are asked whether it covers all the experiences they consider (from their vantage point
of their present I-position perspective) to be important. If something is missing, they are
free to add this. At the end of the procedure the range of valuations elicited from each
participant is in most cases between 20 to 40 valuations for each I-position. Also at the
end of the valuation elicitation phase, participants are asked the following questions:
“How do you generally feel these days?” and “How would you like to feel?” Responses
are used to gauge the extent of generalisation (G) and idealisation (I) of a valuation
within the system. These questions do not ask for a specific valuation but instead assess
the participant’s “general feeling” and “ideal feeling”, respectively.
118
Affective rating. Next, the participant is presented with a standard list of affect
terms (see Table 4.6), is asked to return to each valuation and, after reflecting on the
experience it related to, to rate on a 0-5 point scale (0 = not at all, 1 = a little bit, 2 = to
some extent, 3 = rather much, and 5 = very much) to what extent he or she experiences
each of the 24 affects in relation to each valuation. Participants use a matrix they are
provided with in which the rows consist of valuations and each of the columns
represents an affect term in order to rate each valuation with the same list of affect terms
(see Appendix A). Next, participants also use the same 0-5 point scale to answer each of
the last two final questions (regarding their general and ideal feelings) directly by going
over all the 24 affect terms that are used to rate the valuations. The last two rows of the
matrix are used by the participant to answer the last two questions referring to their
general and ideal feelings.
5.4 Procedure
Pre-testing. To pre-test the measures, the instruments were trialled on the first
two respondents. Trialling took the form of analysing the resulting data to determine
that they were credible and hence that the instruments were working as intended. In the
event, no problems were encountered at the pre-test stage and the instruments were not
modified as a result.
Self-report measures. In a preliminary telephone interview, potential participants
who met the selection criteria were sent the research questionnaire with a return
envelope. Eight persons did not meet the criteria; an explanation was given to them and
they were thanked for their interest. Selected participants were told what was required
of them, and informed of the time commitment expected, the general purpose of the
study and the use to which the data would be put. Participants signed a consent form
attached to each questionnaire and returned it to the researcher in the envelope provided.
119
Four people who originally agreed to participate later declined, stating that they
did not want to relive the experience of migration. All ethical procedures were
observed: participation in the study was voluntary and confidential. To ensure
confidentiality in the statistical analysis an identification number was allocated to each
participant, and participants’ names have been changed in the case studies. As
recounting migration experiences might cause distress, participants were informed that
they could stop at any time. One participant took advantage of this; the interview was
discontinued and the participant removed from the study sample. After participants had
completed both the questionnaire and the SCM, they were fully debriefed.
The questionnaire took approximately 45 minutes to complete and was returned to
the researcher. The questionnaire included: a Demographics page, the Social Anxiety
and Distress Scale (SADS), the Fear of Negative Evaluation Scale (FNES), the
Psychological Well-being Scale (PWS), and the Beck’s Depression Inventory-ii (BDI-
II). After completing the questionnaire containing the self-report measures, participants
returned them to the researcher in a pre-paid envelope. Participants were then
telephoned to schedule the first interview under the SCM protocol.
Self-confrontation method interview. The procedure described below closely
follows that set out in the SCM Manual (see Hermans & Hermans-Jansen (1995),
Chapter 9).
Participants took part in two or more in-depth face-to-face interviews using the
SCM. All participants were interviewed by the researcher, who was trained in the use of
the SCM at an international two-week summer course at the University of Nijmegen in
the Netherlands. Interviews averaged an hour and a half in length depending on the
participant; to avoid fatigue none exceeded two and a half hours. Thirty-two participants
were interviewed at home and six at the psychology clinic at Swinburne University’s
120
Hawthorn campus. Participants were told they would be questioned about what they
saw as important experiences in their past and present lives in their country of origin
and in Australia. The response of the thirty-eight participants was enthusiastic. In fact,
the main problem in the interviews was to keep them focused and for many the
interview was therapeutic either because they found new insights because of the
questions they were asked or because the interview setting afforded them an opportunity
to relieve important stories of their migration experience.
Identification of cultural positions of the self. At the first interview, participants
were invited to select two cultural identities of their personality, after confirming that
the sense of two identities corresponded to what was required for the research. They
were told: “Many migrants feel that they have developed two identities as a result of
moving to a new country. One identity retains aspects of how they were in their country
of origin; the other identity relates to their new country”. Participants were allowed time
to reflect and describe their perception of themselves as having two distinct identities in
their own terms.
Formulation of valuation systems from each I-position. Also at the first
interview, participants were invited to focus on their cultural identity of their country of
origin; to think about their past, present, and future, and relate important experiences
from this perspective (I-position). This produced a valuation system for each participant
from the viewpoint of their society of origin (Hermans, 2001). At the second interview,
which usually took place a week after the first one, participants were invited to focus on
their Australian cultural identity and to think of their past, present and future, and to
relate important experiences from this perspective (I-position). This resulted in a second
valuation system of each participant (Hermans, 2001).
121
By the end of the interview procedure the number of valuations elicited from each
participant averaged about 20 for each I-position.
Affective ratings. After the interviews had taken place, participants were asked to
return to each valuation and, after reflecting on the experience it related to, to rate on a
0-5 point scale to what extent he or she experienced each of the 24 affects in relation to
each valuation. Participants used a matrix provided by the researcher (in which the rows
consist of valuations and each of the columns represents an affect term—see Appendix
A) to rate each valuation with the same list of affect terms. Next, participants used the
same 0–5 point scale to answer each of the last two final questions (regarding their
general and ideal feelings) directly by going over all the 24 affect terms that were used
to rate the valuations. The last two rows of the matrix were used by the participant to
answer the last two questions referring to their general and ideal feelings. The matrices
were then collected by the researcher.
5.5 Treatment of the Interview Data
Once the affective ratings for the different valuations were obtained, affect scores
were aggregated into four indices, each representing a different motive or affect
(Table 5.6): the S index (range 0 to 20) obtained by summing the scores for the four
affects indicating the strength of the self-enhancement motive; the O index (range 0 to
20) obtained by summing the scores for the four affects indicating the strength of the
union-with-the-other motive; the P index (range 0 to 40) obtained by summing the
scores for the eight affects indicating the strength of positive affect; and the N index
(range 0 to 40) obtained by summing the scores for the eight affects indicating the
strength of negative affect. Table 5.6 shows the composition of the four indices
(Hermans &Hermans-Jansen, 1995). The indices represent the affective character of the
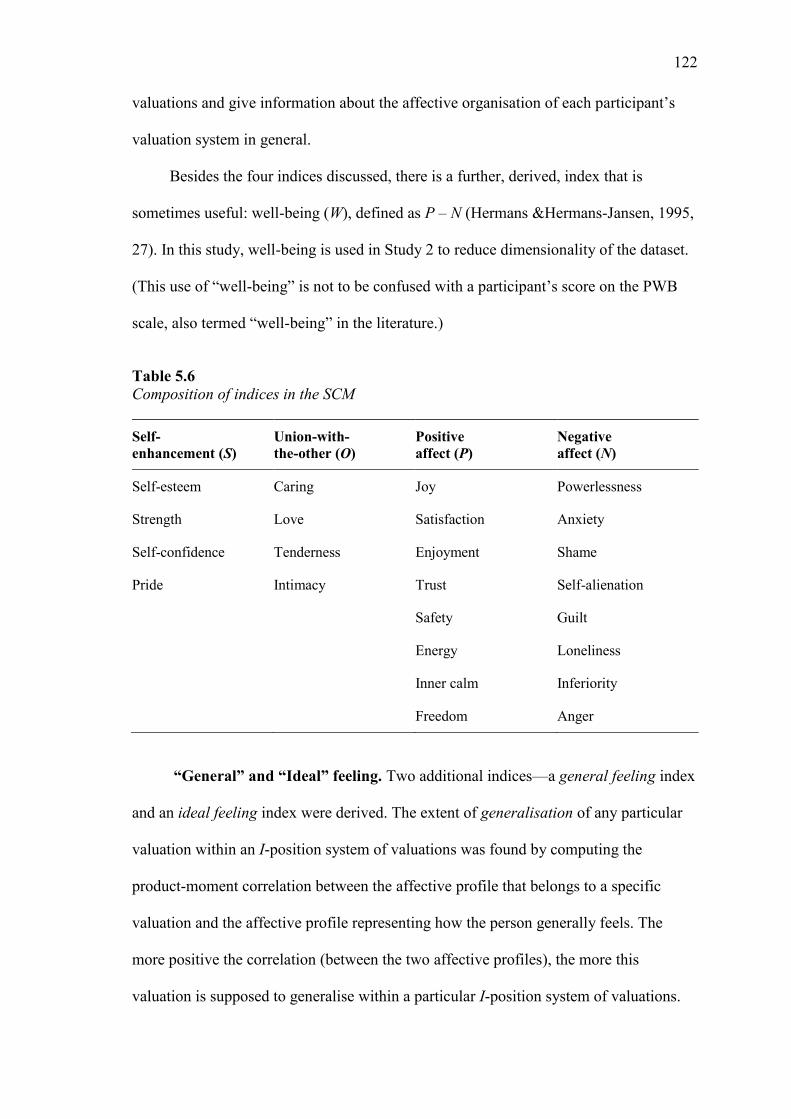
122
valuations and give information about the affective organisation of each participant’s
valuation system in general.
Besides the four indices discussed, there is a further, derived, index that is
sometimes useful: well-being (W), defined as P – N (Hermans &Hermans-Jansen, 1995,
27). In this study, well-being is used in Study 2 to reduce dimensionality of the dataset.
(This use of “well-being” is not to be confused with a participant’s score on the PWB
scale, also termed “well-being” in the literature.)
Table 5.6 Composition of indices in the SCM
Self-
enhancement (S)
Union-with-
the-other (O)
Positive
affect (P)
Negative
affect (N)
Self-esteem Caring Joy Powerlessness
Strength Love Satisfaction Anxiety
Self-confidence Tenderness Enjoyment Shame
Pride Intimacy Trust Self-alienation
Safety Guilt
Energy Loneliness
Inner calm Inferiority
Freedom Anger
“General” and “Ideal” feeling. Two additional indices—a general feeling index
and an ideal feeling index were derived. The extent of generalisation of any particular
valuation within an I-position system of valuations was found by computing the
product-moment correlation between the affective profile that belongs to a specific
valuation and the affective profile representing how the person generally feels. The
more positive the correlation (between the two affective profiles), the more this
valuation is supposed to generalise within a particular I-position system of valuations.
123
The scores of the general feelings index were also used to assess the general well-being.
This is represented by the P–N difference belonging to the general feelings.
To measure the extent of idealisation of any particular valuation, the same
procedure was followed. The correlation between the affective profile belonging to a
specific valuation and the affective profile belonging to the ideal feeling indicates the
ideal quality of this valuation. The height of the correlation indicates the extent of the
idealisation of the valuation within a particular I-position system of valuations. The
more positive the correlation between the two, the higher the idealisation.
Reliability of indices. The present thesis used Cronbach’s alphas to establish the
reliability of the S, O, P, and N indices, consistent with Hermans (1987b) who also used
this method with a group of 43 students (20 men and 23 women) and a group of 40
clients (20 men and 20 women). Hermans reported that in the student sample, the
reliabilities (coefficient alpha) of the S, O, P, and N indices were .83, .86, .90, and .88,
respectively. The correlation between S and O was .27, and between P and N was –.80.
In the client group (who had identity problems and problems in social relationships), the
reliabilities of the S, O, P, and N indices were .83, .89, .95, and .91, respectively. The
correlation between S and O was .64, and between P and N was –.67. When the groups
were compared, the client group showed lower scores for S (p < .001), lower scores for
O (p < .001), and higher scores for N (p < .001) than did the student group. No
difference was found between men and women (Hermans, 1987b). More recently, the
differences in patterning of the indices between the valuation systems of the college
student sample and the clinical sample was cited as evidence for the discriminant
validity of the SCM (Lyddon, Yowell, & Hermans, (2006).
The Cronbach’s alphas in the present thesis were excellent: .96, .96, .98, and .96,
for the S, O, P, and N indices respectively.

124
Coding of major themes. Another way of comparing valuations in the SCM is to
arrange them according to six “major themes” (Hermans and Hermans-Jansen, 1995).
The numerical criteria for assigning valuations to major themes vary between
researchers: “… the choice of such minimum scores is quite arbitrary” (Hermans &
Hermans-Jansen, 1995, p.254). However, they must comply with the general directions
set out in Table 5.7. The numerical rules that were applied in the current research are set
out in the Results section.
Strength and unity. Valuations that refer to an experience of “strength and unity”
(labelled +HH by Hermans) are typically characterised by both high self-enhancement
and high union-with-the-other motives, and because they are normally associated with
positive feelings, they are also characterised by both high positive affect and a low
negative affect. These are valuations in which the fulfilment of both basic motives
coincide, that is, the fulfilment of one motive goes with the fulfilment of the other, thus
creating high levels of well-being, as in “I made a puppet—something from myself for
my girlfriend." (S = 16, O =14, P = 17, N = 0)” (Hermans & Hermans-Jansen, 1995,
p.95). A valuation with this profile of scores refers to and is abbreviated as valuation of
the +HH type.

125
Table 5.7 Composition of major themes
Composition
Description S O P N
+HH Strength and unity High High High Low
+O Unity and love Low High High Low
–O Unfulfilled longing Low High Low High
–LL Powerlessness and isolation Low Low Low High
–S Aggression and anger High Low Low High
+S Autonomy and success High Low High Low
Unity and love. Valuations that refer to experience of “unity and love” (labelled
+O by Hermans) are typically characterised by low self-enhancement and high union-
with-the-other motives, and because the wish was fulfilled, they are also characterised
by both high positive affect and a low negative affect. These valuations depict an
increased contact and union with something else (a person, group, animal, object, or the
surrounding world) which is satisfying as in “I enjoy singing with a group of people,
being together without any pressure. (S = 4, O = 13, P = 19, N = 0)” (Hermans &
Hermans-Jansen, 1995, p.83). A valuation with this profile of scores refers to and is
abbreviated as valuation of the +O type.
Unfulfilled longing. Valuations that refer to “unfulfilled longing” (labelled –O by
Hermans) are typically characterised by low self-enhancement and high union-with-the-
other motives, and because the longing is unfulfilled, they are also characterised by both
low positive affect and high negative affect. These valuations depict “the adoption or
maintenance of a loving orientation toward another person or object that is, or is

126
imagined to be, unreachable”, as in “I regret that it is over with Alice. I want to hold on
to this feeling, and I will not allow the clichés to prevail; I find her too valuable. (S = 6,
O = 16, P = 2, N = 13)” (Hermans & Hermans-Jansen, 1995, p.83). A valuation with
this profile of scores refers to and is abbreviated as valuation of the –O type.
Powerlessness and isolation. Valuations that refer to an experience of
“powerlessness and isolation” are typically characterised by low self-enhancement and
low union-with-the other motives, and because they are normally associated with
negative feelings, they are also characterised by both low positive affect and high
negative affect. These are valuations where both motives are unfulfilled at the same
time, and where the individual typically feels that there is no way out, as in “I was raped
about 8 weeks ago by a man; because of this I feel humiliated and sad. (S = 0, O = 0, P
= 0, N = 18)” (Hermans & Hermans-Jansen, 1995, p.91). A valuation with this profile of
scores refers to and is abbreviated as a valuation of the –LL type.
Aggression and anger. Valuations that refer to an experience of “aggression and
anger” (labelled –S by Hermans) are typically characterised by both high self-
enhancement and low union-with-the-other motives, and because they are normally
associated with negative feelings, they are also characterised by low positive affect and
high negative affect. These valuations depict “some kind of opposition in which
individuals feel opposed to somebody or something that is threatening their self-
esteem”, as in “I am opposed to those people who want to decide for me what I must do.
(S = 15, O = 0, P = 3, N = 16)” (Hermans & Hermans-Jansen, 1995, p.70). A valuation
with this profile of scores refers to and is abbreviated as valuation of the –S type.
Autonomy and success. Valuations that refer to an experience of “autonomy and
success” (labelled +S by Hermans) are typically characterised by high self-enhancement
and high union-with-the-other motives, and because they are generally experienced as
127
positive, they are also characterised by high positive affect and a low negative affect.
These valuations depict a high degree of autonomy and productive coping with the
environment, as in “I hope to achieve a better position through my evening courses (S =
17, O = 4, P = 12, N = 4)” (Hermans & Hermans-Jansen, 1995, p.74). A valuation with
this profile of scores refers to and is abbreviated as valuation of the +S type.
5.6 Comparison with Previous Studies
Table 5.8 lists the dimensions of previous studies. The current research covers 38
participants and some 1600 valuations. Though not particularly large in terms of
respondents, it is possibly the largest of its kind in terms of valuations. This may be
because most studies of the dialogical self to date have been case studies with an
idiographic approach, and valuable as these are, they do not, nor are they intended to,
generate big datasets, without which detailed statistical analysis is impossible.
Besides having a larger sample than previous studies, the present thesis also
differs in sample composition. Table 5.9 compares the respondent sample for the
present thesis with those of other studies. Each sample is drawn from a minority group
(mostly immigrants but in one case an indigenous culturally distinct population) within
a majority group, and each is ranked on six demographic dimensions according to the
similarity of the minority and majority groups. The table shows that sample used in the
present thesis is demographically more similar to its majority culture (in this case
mainstream Australia) than are the samples used by the other studies to which it is
compared. Table 5.8 supports this conclusion in that it shows that most empirical
analysis to date using the SCM has been based on student and clinical samples, which
may be atypical of the wider population.
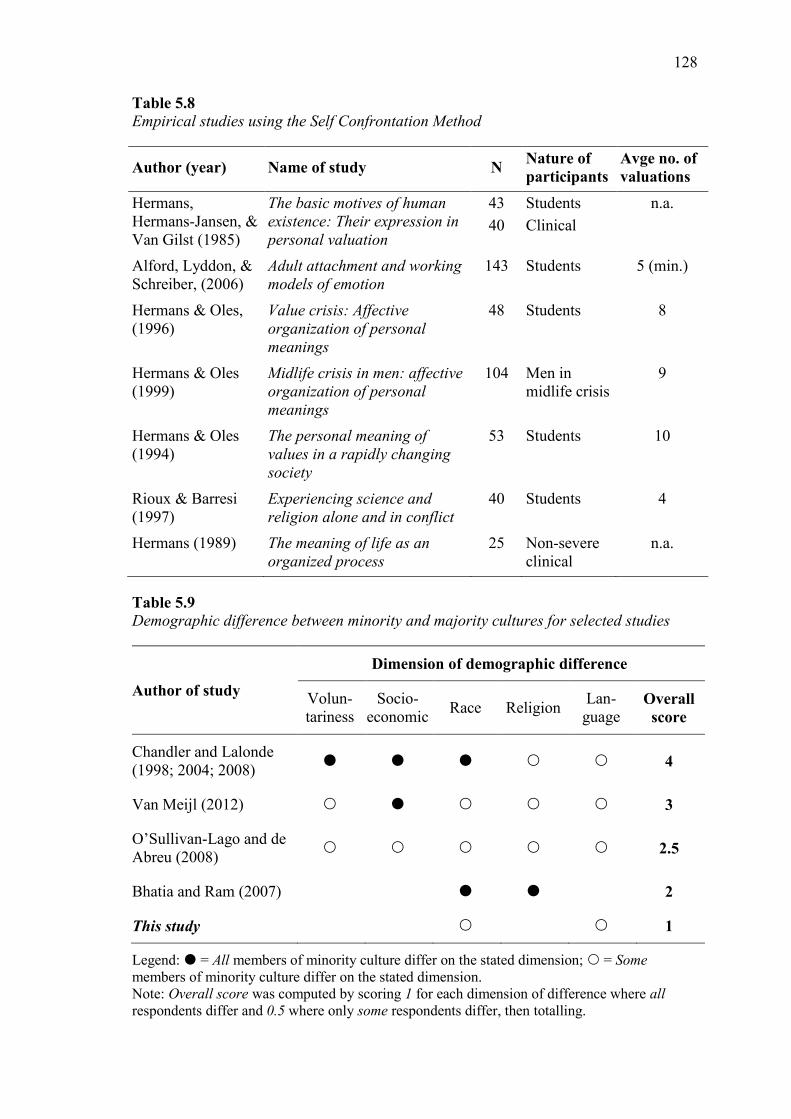
128
Table 5.8 Empirical studies using the Self Confrontation Method
Author (year) Name of study N Nature of
participants
Avge no. of
valuations
Hermans,
Hermans-Jansen, &
Van Gilst (1985)
The basic motives of human
existence: Their expression in
personal valuation
43
40
Students
Clinical
n.a.
Alford, Lyddon, &
Schreiber, (2006)
Adult attachment and working
models of emotion
143 Students 5 (min.)
Hermans & Oles,
(1996)
Value crisis: Affective
organization of personal
meanings
48 Students 8
Hermans & Oles
(1999)
Midlife crisis in men: affective
organization of personal
meanings
104 Men in
midlife crisis
9
Hermans & Oles
(1994)
The personal meaning of
values in a rapidly changing
society
53 Students 10
Rioux & Barresi
(1997)
Experiencing science and
religion alone and in conflict
40 Students 4
Hermans (1989) The meaning of life as an
organized process
25 Non-severe
clinical
n.a.
Table 5.9
Demographic difference between minority and majority cultures for selected studies
Author of study
Dimension of demographic difference
Volun-
tariness
Socio-
economic Race Religion
Lan-
guage Overall
score
Chandler and Lalonde
(1998; 2004; 2008) 4
Van Meijl (2012) 3
O’Sullivan-Lago and de
Abreu (2008) 2.5
Bhatia and Ram (2007) 2
This study 1
Legend: = All members of minority culture differ on the stated dimension; = Some
members of minority culture differ on the stated dimension.
Note: Overall score was computed by scoring 1 for each dimension of difference where all
respondents differ and 0.5 where only some respondents differ, then totalling.
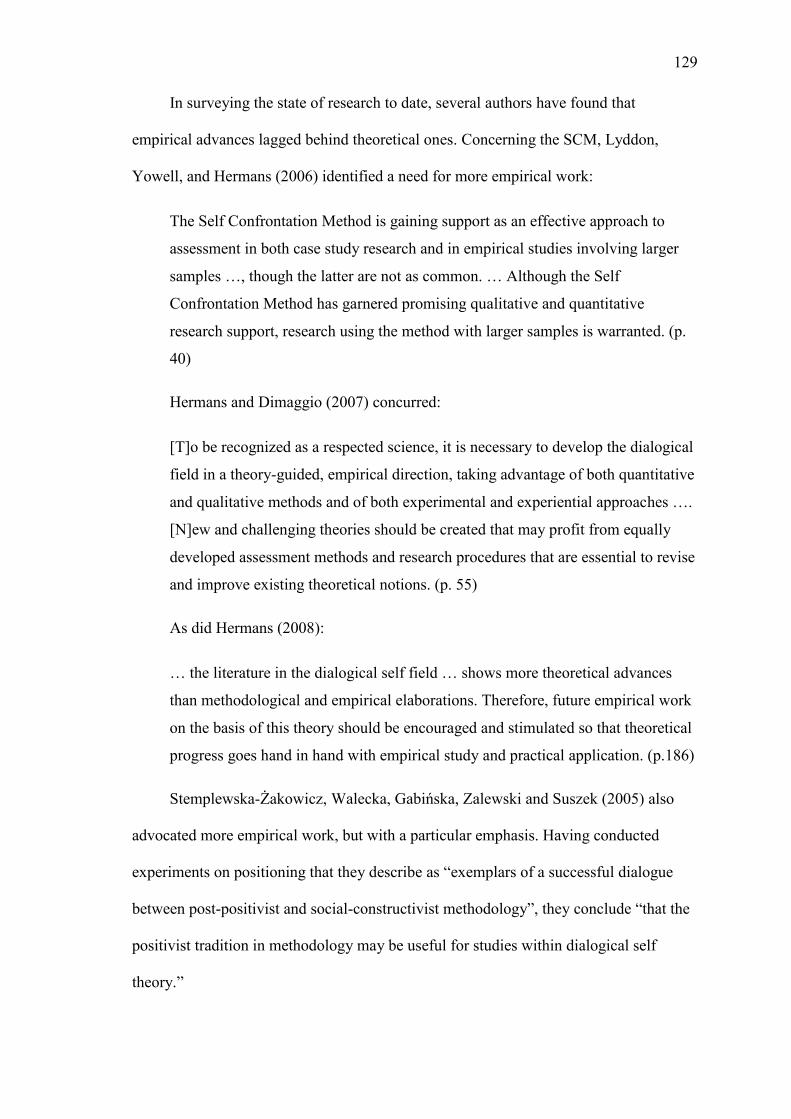
129
In surveying the state of research to date, several authors have found that
empirical advances lagged behind theoretical ones. Concerning the SCM, Lyddon,
Yowell, and Hermans (2006) identified a need for more empirical work:
The Self Confrontation Method is gaining support as an effective approach to
assessment in both case study research and in empirical studies involving larger
samples …, though the latter are not as common. … Although the Self
Confrontation Method has garnered promising qualitative and quantitative
research support, research using the method with larger samples is warranted. (p.
40)
Hermans and Dimaggio (2007) concurred:
[T]o be recognized as a respected science, it is necessary to develop the dialogical
field in a theory-guided, empirical direction, taking advantage of both quantitative
and qualitative methods and of both experimental and experiential approaches ….
[N]ew and challenging theories should be created that may profit from equally
developed assessment methods and research procedures that are essential to revise
and improve existing theoretical notions. (p. 55)
As did Hermans (2008):
… the literature in the dialogical self field … shows more theoretical advances
than methodological and empirical elaborations. Therefore, future empirical work
on the basis of this theory should be encouraged and stimulated so that theoretical
progress goes hand in hand with empirical study and practical application. (p.186)
Stemplewska-Żakowicz, Walecka, Gabińska, Zalewski and Suszek (2005) also
advocated more empirical work, but with a particular emphasis. Having conducted
experiments on positioning that they describe as “exemplars of a successful dialogue
between post-positivist and social-constructivist methodology”, they conclude “that the
positivist tradition in methodology may be useful for studies within dialogical self
theory.”
130
These conclusions all point to a relative insufficiency of empirical research, which
the present study, with its quantitative focus, goes some way towards filling.
5.7 Personal Reflections on the Experience of Migration
Conventional wisdom has it that the scientist, including the social scientist, is an
impartial observer, neither influencing what is observed nor filtering it through the lens
of subjectivity. But if this view was ever widely held, it is less so now than ever,
particularly in the field of narrative research which, being inherently dialogical, must
have an author in dialogue with an audience. According to Bruner (1990): "The-story-
of-a-life as told to a particular person is in some deep sense a joint product of the teller
and the told" (p. 124). Stiles (1993) stated: “… good practice recommends disclosure by
the investigator of his or her expectations for the study, preconceptions, values, and
orientation…” (p. 602). Most recently, Lawrence-Lightfoot (2005) stated: “All
researchers—whether working within the quantitative or qualitative methodological
paradigm—are selective in defining and shaping the data they collect and the
interpretations that flow from their findings…The shaping hand of the investigator is
counterbalanced by the skepticism and scrutiny that is the signature of good research”
(p. 11).
If, then, the researcher inevitably influences the outcome of the research, how is
this to be accommodated? Wortham (2000) and Potter and Hepburn (2005) have
developed and advocate analytical tools and procedures for delving more deeply into the
“interactional” (as opposed to “representational”) aspect of dialog. But these tools,
powerful as they are, are too time-consuming to use on the approximately 1600
narrative “valuations” elicited in the present research. However, many of these
problems, namely those that Potter and Hepburn term “contingent”, can be addressed by

131
the interviewer’s appropriate positioning in the narrative dyad. This was elaborated by
Hermans (2000):
the interactional nature of the autobiographical interview requires the interviewer
to develop a position repertory which helps him to tune in to the flux of
experiences on the side of the narrator. A broad repertory which enables the
interviewer to move flexibly from one to another position, in accordance with the
needs of the narrator, is a precondition for studying the person’s autobiography in
all its complexity and multifacetness.
Fortunately my experience as a migrant has equipped me with a broad repertoire
(to use Hermans’ terminology). In two migrant episodes at very different stages in my
life I have been, or have attempted to be, variously “separated”, “assimilated”,
“integrated” and “marginalised”, (to use Berry’s terminology) and sometimes more than
one at the same time, if in different domains of life—separated at home, and assimilated
(or attempting to be so) at work. This has enabled me to read, and empathise with, my
interviewees. It is for this reason that I write this section, and moreover do so in the first
person, to remind the reader that the present research was in some degree shaped by my
experiences as a migrant myself. What follows is a brief autobiographical sketch.
I was born and raised in the Dominican Republic. My first migration (though at
the time I had no idea how long-lasting it would be) was supposedly to further my
education. But the real reason was that my parents wanted me out of the house. That
suited me; I wanted to go. So they arranged for me stay with an aunt while I studied
English in New York.
My aunt’s household was Dominican from top to bottom—artefacts, music, food,
everything. She was a political exile. Her husband, a prominent political and intellectual
figure, had been assassinated by the former dictator. But by the time he was
assassinated in his turn, and her return became possible, her children, my cousins, had
132
become Americanised and completely bilingual, while she still spoke very little English.
Torn as she was between children and homeland, she stayed. Lawson (2000) describes
this existential migrant condition as “a state of in between-ness”, and I was part of it. I
inhabited a Dominican “ghetto” where everybody knew who I was and what I was. In
the words of Deaux (2000), I was “remoored”.
Coming from a privileged family, I had lived a materially comfortable, but
sequestered, existence. I found New York liberating and transforming. Although living
with family, I was the freest I had ever been. At first I struggled with English. I did not
want to sound like an outsider. “Passing”, as Goffman (1968) put it, was my goal. Like
any teenager, I just wanted to fit in (Camilleri and Malewska-Peyre 1997). Going back
was always on the cards, and in fact central to my Dominican identity. But it was not
what I chose—at least, not straight away. I was to spend nine years in the States—a
marriage, a child, a divorce, by which time my country of birth had become haloed by
nostalgia. Only then, in a way defeated, did I return. Looking back, my migrant
identities—Dominican and American—reflected the ambivalence that makes a person
long for a place when living in another, identifying with home when abroad, and with
abroad when home (King, 1995). I knew then that migration changes one, forever,
which is why it is so often associated with loss. Life became complicated and I became
wistful, always lacking, never complete.
My second migration was to Australia, where I now live. It was to accompany my
second partner, a migrant himself, to his adopted country. By now, I was fluent in
English, and although the my accent was never to leave me, I was comfortable with it.
In Australia I embraced my difference. I was Dominican in Australia and so an outsider,
but by now I accepted my difference as a creative resource, not a blemish to be erased. I
played with cultural repertoires, confident in acquiring a new cultural dimension—
133
becoming Australian. Migration gave me a new perspective, a “third space” where I
could explore and extend my cultural repertoire, creatively reconstructing my
Dominican and Australian identities as “hybrid” (Bhabha 1994).
I’m now a “foreigner” who speaks fluent English and lives in Australia. I am in it
but not of it. I am between cultures. It is a role that can be hard to sustain, and has on
occasion been the cause of unhappiness. But it also offers something precious: I am able
to observe Australian culture with a degree of detachment and in this way reflect all the
more on my own life in time and space. At times I feel a bitter-sweet nostalgia for my
country of birth, for what was and never will be. But at other times my nostalgia is like
an illness, which is what Johannes Hofer, the doctor who coined the word ‘nostalgia’ in
1688, believed it to be. It is a rare migrant that has not felt the pain of letting go the life
they once knew.
The migrant story is one of pain. In Australia this is only beginning to be widely
discussed. “In Australia I will”, the posters once trumpeted. Well, some did and some
didn’t; and those who did, often had a hard time of it. Some deplore all this
remembering. Nostalgia would seem to be, after all, the opposite of progress. But
Australia’s migrant experience is not an unmixed march of progress. It also contains
countless stories of heartache. The nation’s identity would be greatly enriched if both
sides of the migrant story were told. In Carey’s (2002) words: “… we are a nation of
immigrants…”.
Having thus disclosed my preconceptions, values, and orientation (following
Stiles, 1993) I now come to my expectations for the present research. As should by now
be apparent, this thesis is autobiographical in two senses: it calls on my participants to
divulge their autobiographical details; equally, it is strengthened by my candid
disclosure of my own autobiographical experience of migration—in general terms if not

134
in detail—in that my participants were all aware that I shared this aspect of life
experience with them. In short, I satisfied all the criteria that I required of my
participants; they knew it, and the knowledge possibly credentialled me in their eyes.
My research took as a framework my own experience of migration; and sharing this
experience with my participants was crucial to establishing the authenticity of my
relationship with them. In this I followed Janesick’s (1998) precept of “researcher as
instrument”, in which I was a participant observer using my own subjectivity to
interpret data.
More specifically, I wanted to give my survey participants the psychological
space to talk freely, and in this way I hoped to encourage them to reflect on, and make
sense of, their bifurcated life stories and possibly disrupted sense of self. I hoped that it
would offer participants constructive outcomes as a result of migration. Accordingly,
my research did not harbour presuppositions about the migration experience, nor did it
define a population of which my participants would constitute a representative sample.
On the contrary, I expected diversity in self-narratives, which made the reported
similarities in emotional valence all the more striking.

135
CHAPTER 6: Study 1 – Identification and Comparison of Migrant Groups
This chapter discusses the first of the three studies conducted as part of this thesis.
All were based on the same data and were complementary in nature. Study 1 was
largely exploratory. Its aim was not to test hypotheses but to reveal the existence of
naturally forming groups among migrants, that is, to determine whether migration
brings into being new I-positions, and if so, whether there exist any patterns among
migrants in their I-positions in country of origin and Australia that can be discerned in
terms of demographics, psychological self-reports and self-confrontation indices.
Four groups of participants were identified by means of cluster analysis. Because
cluster analysis is an exploratory technique that lacks formal tests of statistical
significance, it was only once the groups were identified that hypotheses were tested.
Significant differences were found among the groups, and these differences were found
to be plausible in terms of theory. The four groups identified in Study 1 were
corroborated by Studies 2 and 3. Statistical analyses were performed using SPSS 16.0.
6.1 Preliminary Analysis
Self-report measures of distress and well-being. The distributions of all
measures were inspected for outliers. Preliminary data screening found a single high
outlier on BDI–II, and single low outliers on PWB Personal growth and Purpose in life.
Three low outliers were found on PWB Self-acceptance, two of which were marginal.
Other than the two marginals, all other outliers related to the same participant, which
suggests that they were not due to a coding error but represented a single participant
with mild depression.
Table 6.1 shows the sample means, standard deviations, skewness and kurtosis for
the self-report measures of distress and well-being. Kolmogorov-Smirnov tests showed

136
that normality assumptions were significantly violated at the 5% level for SAD, FNE,
BDI-II and, marginally, PWB Self-acceptance. Although this might cast doubt on later
MANOVAs with these variables, MANOVA is normally robust to such violations
(Tabachnik & Fidell, 2006).
Table 6.1 Means and standard deviations for the self-report measures
Psychological Distress Psychological Well-being Scale
SAD FNE BDI–II PWB1 PWB2 PWB3 PWB4 PWB5 PWB6
Mean 8.4 13.3 9.1 63.1 67.1 63.4 72.7 66.1 64.6
SD 7.2 9.5 9.3 12.1 12.1 11.9 8.0 10.8 12.4
Skewness .831 .374 1.784 -.656 -.568 -.638 -1.018 -1.024 -.876
Kurtosis -.607 -1.261 4.099 .703 -.063 -.672 1.810 2.995 .568
N = 38
Note: SAD = Social Avoidance and Distress Scale; FNE = Fear of Negative Evaluation Scale;
BDI-II = Beck Depression Inventory–II; PWB1 = Environmental mastery; PWB2 = Positive
relations with others; PWB3 = Autonomy; PWB4 = Personal growth; PWB5 = Purpose in life;
PWB6 = Self-acceptance.
Table 6.2 presents bivariate correlations of the self-report measures of distress and
well-being. All were significantly (p < .01) correlated. As can be seen, the
psychological distress scales were significantly positively correlated with each other.
Participants who had a high SAD score tended to have a high FNE score (r = .63);
participants who had a high SAD score also tended to have a high BDI-II score
(r = .45); and participants who had a high FNE score tended to have a high BDI-II score
(r = .57). The PWB subscales, all of which measure various components of
psychological well-being, were strongly positively correlated with each other (r = .63 to
r = .90). Lastly, the PWB subscales were strongly negatively correlated with the three
psychological distress scales (r = –.49 to r = –.80).

137
Table 6.2 Correlations among self-report measures
Psychological Distress Psychological Well-being Scale (PWB)
SAD FNE BDI-II PWB1 PWB2 PWB3 PWB4 PWB5 PWB6
Social Avoidance and Distress Scale (SAD)
Fear of Negative Evaluation Scale (FNE) .628**
Beck Depression Inventory–II (BDI-II) .449** .569**
PWB Environmental mastery (PWB1) -.575** -.668** -.744**
PWB Positive relations with others (PWB2) -.610** -.586** -.592** .725**
PWB Autonomy (PWB3) -.570** -.734** -.561** .718** .638**
PWB Personal growth (PWB4) -.508** -.528** -.623** .664** .661** .725**
PWB Purpose in life (PWB5) -.478** -.544** -.796** .863** .698** .628** .731**
PWB Self-acceptance (PWB6) -.524** -.672** -.750** .903** .677** .820** .759** .815**
N = 38
Note: Values are Pearson’s r correlations, * p < .05 (two-tailed), ** p < .01 (two-tailed).
138
Self-confrontation data. Each participant in the study produced about 40
valuations on average, divided roughly evenly between those relating to country of
origin and those relating to Australia. They were further split across valuations relating
to the past, the present, and the future.
Preliminary data screening found no outliers in the self-confrontation indices (S,
O, P and N) as they describe participants’ valuations relating to country of origin and
Australia. Table 6.5 (Section 5.2, p.116) shows the sample means, standard deviations,
skewness and kurtosis for self-confrontation indices at country of origin and Australia.
Kolmogorov-Smirnov tests showed that normality assumptions were significantly
violated at the 5% level for O for country of origin, and N for Australia. Although this
might cast doubt on later MANOVAs with these variables, MANOVA is normally
robust to such violations (Tabachnik & Fidell, 2006).
Table 6.3 presents bivariate correlations of the indices. For each set of indices
(i.e., for country of origin, Australia, general feeling, and ideal feeling), S, O and P in
the same set were all significantly correlated with each other (p < .01). For country-of-
origin indices, participants who were high on S tended also to be high on O and P
(r = .84 to r = .95). For Australian indices, participants who were high on S tended also
to be high on O and P (r = .84 to r = .95). For indices relating to general feeling,
participants who were high on S tended also to be high on O and P (r = .75 to r = .91).
For indices relating to ideal feeling, participants who were high on S tended also to be
high on O and P (r = .75 to r = .78). Overall, high S and O were statistically associated
both with each other and with high P. The same was also generally true if the indices
came from different sets (although the ideal feeling indices were less strongly correlated
with those of other sets).
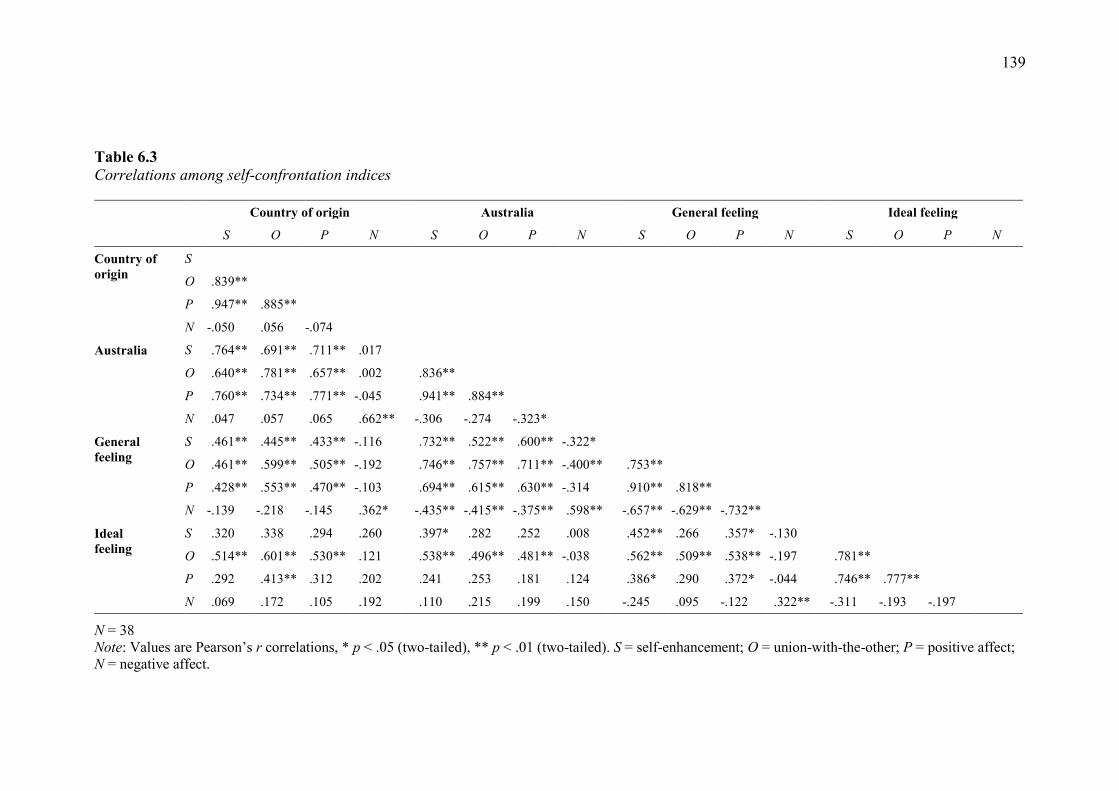
139
Table 6.3 Correlations among self-confrontation indices
Country of origin Australia General feeling Ideal feeling
S O P N S O P N S O P N S O P N
Country of
origin
S
O .839**
P .947** .885**
N -.050 .056 -.074
Australia S .764** .691** .711** .017
O .640** .781** .657** .002 .836**
P .760** .734** .771** -.045 .941** .884**
N .047 .057 .065 .662** -.306 -.274 -.323*
General
feeling
S .461** .445** .433** -.116 .732** .522** .600** -.322*
O .461** .599** .505** -.192 .746** .757** .711** -.400** .753**
P .428** .553** .470** -.103 .694** .615** .630** -.314 .910** .818**
N -.139 -.218 -.145 .362* -.435** -.415** -.375** .598** -.657** -.629** -.732**
Ideal
feeling
S .320 .338 .294 .260 .397* .282 .252 .008 .452** .266 .357* -.130
O .514** .601** .530** .121 .538** .496** .481** -.038 .562** .509** .538** -.197 .781**
P .292 .413** .312 .202 .241 .253 .181 .124 .386* .290 .372* -.044 .746** .777**
N .069 .172 .105 .192 .110 .215 .199 .150 -.245 .095 -.122 .322** -.311 -.193 -.197
N = 38
Note: Values are Pearson’s r correlations, * p < .05 (two-tailed), ** p < .01 (two-tailed). S = self-enhancement; O = union-with-the-other; P = positive affect;
N = negative affect.
140
The relationships among S, O and P on the one hand, and N on the other, were
less clear-cut. For country-of-origin indices, N was not significantly correlated with S, O
and P (r = –.07 to r = .06). For Australian indices, N was not significantly correlated
with S (r = –.31) or O (r = –.27), but was moderately negatively correlated with P (r = –
.32, p < .05). For indices relating to the ideal feeling, N was not significantly correlated
with S, O or P (r = –.19 to r = .31). However, for indices relating to the general feeling,
N was strongly negatively correlated with S, O and P (r = –.63 to r = –.73).
In general, correlations were highest between indices within the same set. Lower
(but still significant) correlations were observed between general feeling indices and
those in country of origin. The lowest (mostly not significant) correlations were
between ideal feeling and the other sets.
Relationship between self-report measures and self-confrontation indices.
Table 6.4 presents bivariate correlations of the self-report measures and self-
confrontation indices. In general, self-report measures were not significantly correlated
with self-confrontation indices for the country of origin I-position, and hardly at all with
ideal feeling indices, but were mostly significantly correlated with indices for the
Australian I-position, and even more so with general feeling indices.
As is evident from Table 6.4, for country of origin, self-confrontation indices
were significantly correlated with measures of psychological distress in one instance:
negative affect was positively correlated with BDI-II (r = –.49, p < .01). Likewise, self-
confrontation indices were significantly correlated with measures of psychological well-
being in one case: P was positively correlated with PWB Autonomy (r = –.36, p < .05).

141
Table 6.4 Correlations among self-reports and self-confrontation indices
Country of origin Australia General feeling Ideal feeling
S O P N S O P N S O P N S O P N
SAD -.049 -.063 -.101 .259 -.286 -.206 -.249 .347* -.399* -.449** -.312 .379 -.071 -.166 -.131 .132
FNE -.149 -.109 -.222 .222 -.368* -.133 -.287 .355* -.482** -.399* -.426** .421** -.237 -.254 -.176 .093
BDI-II -.087 -.132 -.160 .491** -.311 -.237 -.335 .647** -.467** -.538** -.517** .654** .047 -.133 .064 .120
PWB1 .267 .267 .289 -.286 .516** .363* .446** -.476** .662** .598** .656** -.608** .181 .328* .163 -.193
PWB2 .179 .233 .201 -.214 .532** .437** .499** -.561** .601** .630** .557** -.638** .249 .372* .227 -.174
PWB3 .291 .216 .358* -.284 .432** .228 .391* -.376* .622** .407* .510** -.377* .320* .448** .384* -.316
PWB4 .194 .247 .274 -.096 .497** .307 .457** -.297 .706** .485** .640** -.490** .293 .374* .173 -.198
PWB5 .263 .294 .315 -.277 .510** .391* .481** -.439** .653** .660** .648** -.585** .091 .272 .122 -.041
PWB6 .224 .160 .255 -.299 .476** .258 .410* -.483** .673** .521** .609** -.538** .158 .279 .103 -.311
N = 38
Note: Values are Pearson’s r correlations, * p < .05, two-tailed, ** p < .01, two-tailed. S = self-enhancement; O = union-with-the-other; P = positive affect;
N = negative affect; PWB1 = Environmental mastery; PWB2 = Positive relations with others; PWB3 = Autonomy; PWB4 = Personal growth;
PWB5 = Purpose in life; PWB6 = Self-acceptance.

142
In the case of the Australian I-position, self-confrontation indices were
significantly correlated with measures of psychological distress in three instances: S was
negatively correlated with FNE (r = –.37, p < .05); and N was positively correlated with
both SAD (r = .35, p < .01) and FNE (r = .36, p < .01). Self-confrontation indices were
also significantly correlated with measures of psychological well-being: S was
positively correlated with all PWB subscales (r = .42 to .53, all at p < .05); O was
positively correlated with PWB Environmental mastery (r = .36, p < .05), Positive
relations with others (r = .44, p < .01), and Purpose in life (r =.39, p < .05); P was
positively correlated with all PWB subscales (r = .39 to .50, most at p < .01) ); and N
was negatively correlated with all PWB subscales except Personal growth (r = –.38 to –
.56, most at p < .01).
In the case of general feeling, self-confrontation indices were significantly
correlated with all measures of psychological distress in all cases but two: S (r = –.40 to
–.48, mostly at p < .01); O (r = –.40 to –.54, p < .05); P (r = –.43 to –.52, p < .05); and
N (r = .42 to .65, p < .05). Self-confrontation indices were also significantly correlated
with all measures of psychological well-being: positively with S (r = .60 to .71, all at p
< .05); positively with O (r = .41 to .66, most at p.< .05); positively with P (r = .51 to
.66, all at p < .05) ); and negatively with N (r = –.49 to –.64, most at p < .05).
In the case of ideal feeling, self-confrontation indices were not significantly
correlated with measures of psychological distress. However, they were significantly
correlated with measures of psychological well-being in several cases. S was positively
correlated with PWB Autonomy (r = .32, p < .05); O was positively correlated with
PWB Environmental mastery (r = .33, p < .05), PWB Positive relations with others (r =
.37, p < .05), and PWB Autonomy (r = .45, p < .01); and P correlated with PWB
Autonomy (r = .38, p < .05).
143
6.2 Distinguishing I-positions
The theory of dialogical self implies that life-changing events such as migration
can give rise to additional I-positions, and that these I-positions may be accessed
through the SCM. Although not all migrants necessarily develop in this way, the
participants in this study were required to meet the criterion that they perceived
themselves as having “developed two identities as a result of moving to [Australia]”,
where one identity retains aspects of how they were in their country of origin and the
other identity relates to their new country. As part of the data exploration, therefore,
analogous self-confrontation indices pertaining to each participant’s I-position in
country of origin were compared with those pertaining to the I-position in Australia
with the aim of determining if the group means differed significantly.
Comparing self-confrontation indices for country of origin and Australian I-
positions. Paired-samples t-tests were conducted to compare self-confrontation indices
for country of origin and Australian I-positions. Table 6.5 shows means and standard
deviations of self-confrontation indices. Independent samples t-tests were conducted to
compare the self-confrontation indices for country of origin and Australia. Results
revealed that S was significantly greater for Australia than for country of origin,
t(37) = –3.31, p = .002 (two-tailed); and P was significantly greater for Australia than
for country of origin, t(37) = –2.37, p = .023 (two-tailed). No significant differences
were found in the case of O or N. Mean O for Australia did not differ significantly from
that for country of origin, t(37) = –1.12, p = .270 (two-tailed); nor did N for Australia
differ significantly from that for country of origin, t(37) = –0.49, p = .625 (two-tailed).
However, the significance of the difference in at least some self-confrontation indices,
in this case S and P, shows that a new I-position has come into existence, for some
participants at least.

144
Table 6.5 Means and standard deviations of self-confrontation indices
Location
Index
S O P N
Country of origin Mean 10.02 9.54 19.11 10.03
SD 3.91 4.23 7.83 6.14
Skewness -.123 -.211 -.133 .503
Kurtosis -.729 -.997 -.884 -.787
Australia Mean 11.45 10.07 21.17 10.45
SD 3.86 4.52 7.96 6.40
Skewness -.036 -.169 -.014 .378
Kurtosis .561 -1.220 -.873 -.926
N = 38
Note: S and O are scored from 0 to 20; P and N from 0 to 40; S = self-enhancement; O = union-
with-the-other; P = positive affect; N = negative affect.
What these results show is that the differences between means for country of
origin and Australia were small (though nevertheless significant), and that the
variability in self-confrontation indices within groups were large (as revealed in their
standard deviations). There is a simple explanation for both these findings, namely that
the sample contained disparate responses. For some the new I-position reflected a view
of life in Australia as an unalloyed reward, so creating a new I-position with more
positive affect and greater satisfaction of the S- and O-motives; for others, it was the
very opposite; and for others there was little difference. Over the whole sample, then,
the effects may cancel out, so that group mean self-confrontation indices differ little,
when in fact the self-confrontation indices for individual participants differ greatly, but
in opposite directions (a case of the ‘ecological fallacy’). This implies that significant

145
differences in self-confrontation indices may be found when the sample is examined in
more detail, as was done next.
Cluster analysis. Cluster analysis was used as a data reduction method to classify
participants into a small number of relatively homogeneous groups for the purpose of
exploring possible relationships among variables that were masked at the aggregate
level of the whole sample. Participants were characterised according to their I-positions
in country of origin and Australia. Since it was considered that the country-of-origin I-
position might differ from the Australian, two cluster analyses were conducted, one to
classify participants into clusters determined by their self-confrontation indices for
country of origin, the other to cluster participants by their self-confrontation indices for
Australia. Thus, each participant was characterised by membership of two clusters.
Two cluster methods were employed. Hierarchical clustering was selected as the
principal clustering method as it requires no a priori assumptions as to the nature of the
clusters, instead allowing optimal cluster centroids to be determined as part of the
clustering procedure (Clatworthy, Buick, Hankins, Weinman & Horne, 2005). Self-
confrontation indices were clustered according to the CLUSTER procedure in SPSS,
using Ward’s minimum variance method with a squared Euclidean distance metric to
represent dissimilarity between case-pair. This is an agglomerative hierarchical cluster
analysis procedure that joins clusters of cases together in a way that minimises increases
in the within-cluster variance (or fusion coefficient) (Clatworthy et al., 2005). Because
index metrics differed markedly in range and mean, they were converted to z-scores for
clustering purposes so as to avoid bias when computing squared Euclidean distance.
Since clustering techniques lack formal tests of statistical significance,
Beauchaine and Beauchaine (2002) recommend that the robustness of the hierarchical
solution be assessed by re-clustering by k-means clustering. Unlike hierarchical
146
clustering, k-means clustering is an non-hierarchical iterative procedure that assigns and
reassigns cases to the “closest” cluster as measured by Euclidean distance, and requires
that the number and initial centroids of the clusters be specified in advance. When k-
means clustering is used to corroborate hierarchical clustering, it is appropriate to
“seed” the k-means cluster means with those previously established by hierarchical
clustering (Beauchaine and Beauchaine, 2002).
There are no hard-and-fast rules for determining the appropriate number of
clusters, but the cluster dendrogram and agglomeration schedule are taken to be a good
guide. Parsimony favours fewer clusters, while explanatory power favours more
(Aldenderfer & Blashfield, 1984). An abrupt lessening in the incremental reduction in
within-cluster variance in the agglomeration schedule as the number of clusters grows,
and a similar shortening in dendrogram branches, show where further disaggregation is
likely to become unhelpful.
Clusters in country of origin
Hierarchical clustering. The agglomeration schedule (Figure 6.1) and
dendrogram (Figure 6.2) were examined for clustering by self-confrontation indices for
country of origin.
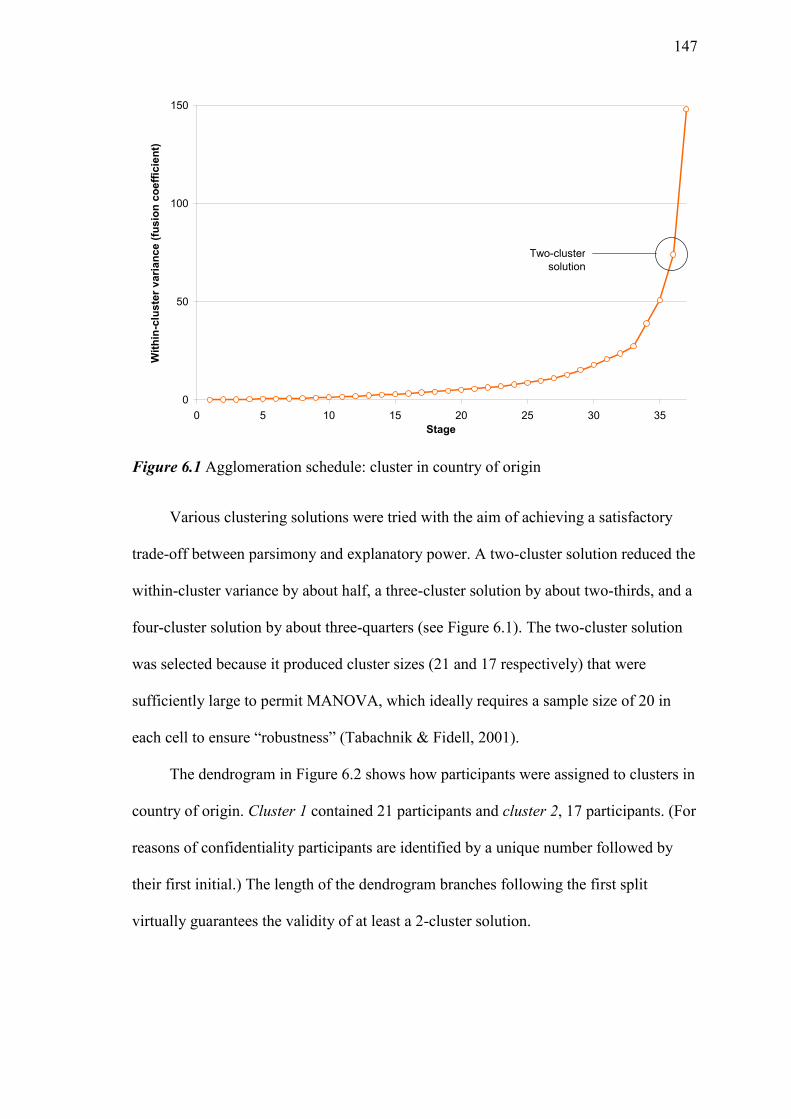
147
Figure 6.1 Agglomeration schedule: cluster in country of origin
Various clustering solutions were tried with the aim of achieving a satisfactory
trade-off between parsimony and explanatory power. A two-cluster solution reduced the
within-cluster variance by about half, a three-cluster solution by about two-thirds, and a
four-cluster solution by about three-quarters (see Figure 6.1). The two-cluster solution
was selected because it produced cluster sizes (21 and 17 respectively) that were
sufficiently large to permit MANOVA, which ideally requires a sample size of 20 in
each cell to ensure “robustness” (Tabachnik & Fidell, 2001).
The dendrogram in Figure 6.2 shows how participants were assigned to clusters in
country of origin. Cluster 1 contained 21 participants and cluster 2, 17 participants. (For
reasons of confidentiality participants are identified by a unique number followed by
their first initial.) The length of the dendrogram branches following the first split
virtually guarantees the validity of at least a 2-cluster solution.
0
50
100
150
0 5 10 15 20 25 30 35
Stage
Wit
hin
-clu
ste
r v
ari
an
ce
(fu
sio
n c
oe
ffic
ien
t)
Two-cluster
solution
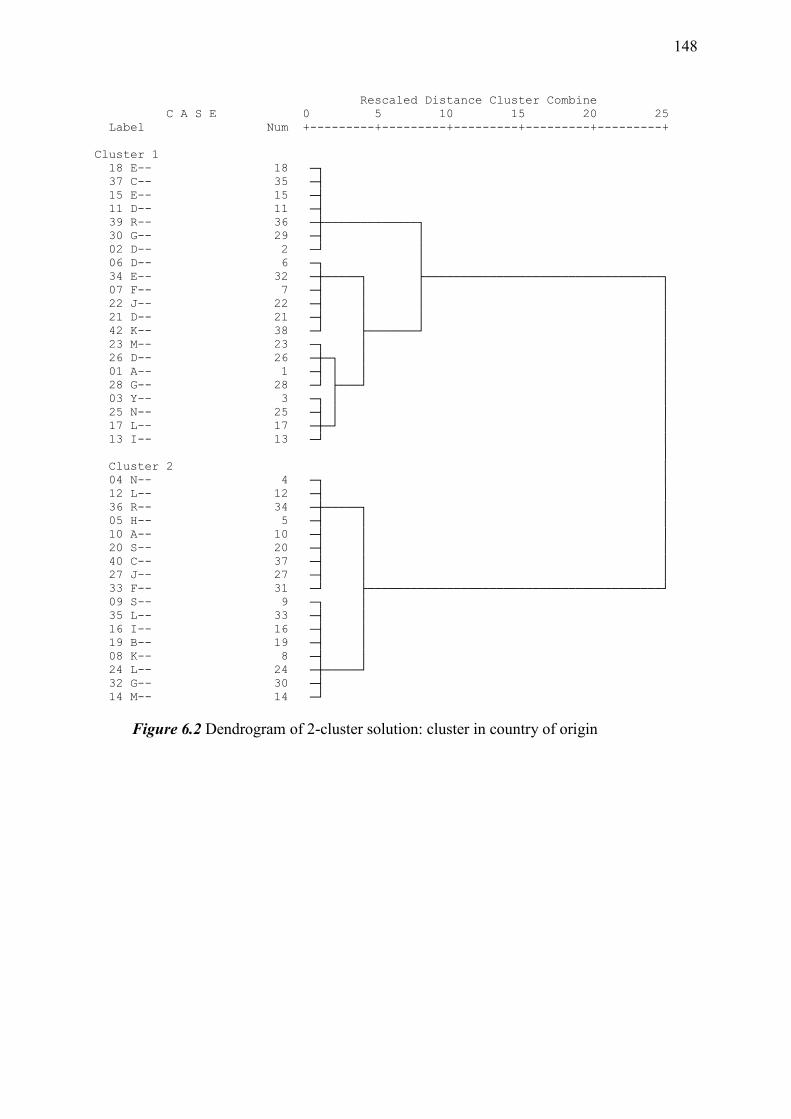
148
Rescaled Distance Cluster Combine
C A S E 0 5 10 15 20 25
Label Num +---------+---------+---------+---------+---------+
Cluster 1
18 E-- 18 ─┐
37 C-- 35 ─┤
15 E-- 15 ─┤
11 D-- 11 ─┤
39 R-- 36 ─┼─────────────┐
30 G-- 29 ─┤ │
02 D-- 2 ─┘ │
06 D-- 6 ─┐ │
34 E-- 32 ─┼─────┐ ├─────────────────────────────────┐
07 F-- 7 ─┤ │ │ │
22 J-- 22 ─┤ │ │ │
21 D-- 21 ─┤ │ │ │
42 K-- 38 ─┘ ├───────┘ │
23 M-- 23 ─┐ │ │
26 D-- 26 ─┼─┐ │ │
01 A-- 1 ─┤ │ │ │
28 G-- 28 ─┘ ├───┘ │
03 Y-- 3 ─┐ │ │
25 N-- 25 ─┤ │ │
17 L-- 17 ─┼─┘ │
13 I-- 13 ─┘ │
│
Cluster 2 │
04 N-- 4 ─┐ │
12 L-- 12 ─┤ │
36 R-- 34 ─┼─────┐ │
05 H-- 5 ─┤ │ │
10 A-- 10 ─┤ │ │
20 S-- 20 ─┤ │ │
40 C-- 37 ─┤ │ │
27 J-- 27 ─┤ │ │
33 F-- 31 ─┘ ├─────────────────────────────────────────┘
09 S-- 9 ─┐ │
35 L-- 33 ─┤ │
16 I-- 16 ─┤ │
19 B-- 19 ─┤ │
08 K-- 8 ─┤ │
24 L-- 24 ─┼─────┘
32 G-- 30 ─┤
14 M-- 14 ─┘
Figure 6.2 Dendrogram of 2-cluster solution: cluster in country of origin

149
K-means clustering. Table 6.6 shows that there was a close match between cluster
membership under both clustering methods. This largely corroborates the hierarchical
clustering procedure.
Table 6.6 Number of participants by cluster: country of origin
K-means cluster Hierarchical cluster
Cluster 1 Cluster 2 Total
Cluster 1 19 – 19
Cluster 2 2 17 19
Total 21 17 38
Two participants were classified differently by the clustering procedures:
participants 01 and 34 were both placed in hierarchical cluster 1 but in k-means cluster
2. It is possible that this was because they lay on the margins of their respective clusters;
a change in the clustering algorithm therefore caused them to switch from one cluster to
another. An examination of the sum of squared differences between each observation
and cluster centroids supports this supposition. Figure 6.3 confirms that k-means
clustering correctly assigned each participant to the cluster with the “nearest” centroid,
as required by definition. However, in some cases participants were almost equidistant
between pairs of clusters, and in such cases hierarchical clustering assigned the
participant to the other cluster of the pair. This is of little consequence for the analysis.
It means that the affected participant has features of both clusters—its hierarchical
cluster and its k-means cluster. This is expected in cluster analysis, where it is normal
for some observations to lie near cluster boundaries (Aldenderfer & Blashfield, 1984).
What is important in this case is that there were few instances of this, which suggests
that cluster identity was mostly unambiguous.

150
Figure 6.3 Sum of squares from centroid: cluster in country of origin
Cluster means. As the clusters were purposely created to be as different as
possible on the selected variables, significant differences between the groups on those
variables were to be expected (Aldenderfer & Blashfield, 1984). In the present study,
the purpose of conducting significance t-tests or ANOVAS using the variables that were
used to form the clusters was to get an indication of whether and how clusters differed
on each clustering variable (Mulry, Kalichman, Kelly, Ostrow, & Heckman, 1997), that
is, to clarify the relative contributions of the different variables to the cluster solution or
the degree of separation of the clusters.
Table 6.7 and Figure 6.4 show mean self-confrontation indices for country of
origin broken down by cluster in country of origin. Independent samples t-tests were
conducted to compare the mean self-confrontation indices for both clusters. Cluster 1
had lower S than Cluster 2, t(36) = –8.74, p < .001 (two-tailed). Cluster 1 also had lower
O than Cluster 2, t(36) = –7.31, p < .001 (two-tailed). Cluster 1 also had lower P than
0
2
4
6
8
10
12
14
16
18
20
01
A--
-
02
D--
-
03
Y--
-
04
N--
-
05
H--
-
06
D--
-
07
F--
-
08
K--
-
09
S--
-
10
A--
-
11
D--
-
12
L--
-
13
I--
-
14
M--
-
15
E--
-
16
I--
-
17
L--
-
18
E--
-
19
B--
-
20
S--
-
21
D--
-
22
J--
-
23
M--
-
24
L--
-
25
N--
-
26
D--
-
27
J--
-
28
G--
-
30
G--
-
32
G--
-
33
F--
-
34
E--
-
35
L--
-
36
R--
-
37
C--
-
39
R--
-
40
C--
-
42
K--
-
Respondent
Su
m o
f s
qu
are
d d
iffe
ren
ces
fro
m
hie
rarc
hic
al
clu
ste
r c
en
trio
d
Cluster 1
Cluster 2
Hierarchical cluster
conflicts with K-means Hierarchical cluster
conflicts with K-means
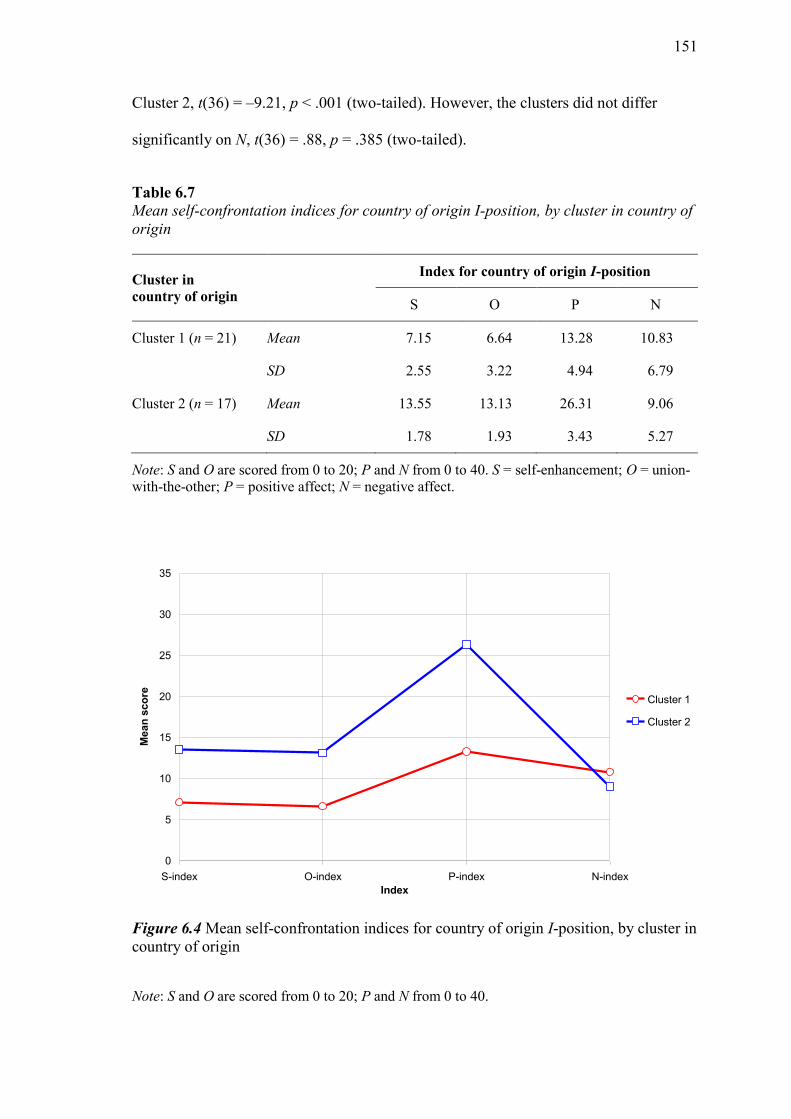
151
Cluster 2, t(36) = –9.21, p < .001 (two-tailed). However, the clusters did not differ
significantly on N, t(36) = .88, p = .385 (two-tailed).
Table 6.7 Mean self-confrontation indices for country of origin I-position, by cluster in country of
origin
Cluster in
country of origin
Index for country of origin I-position
S O P N
Cluster 1 (n = 21) Mean 7.15 6.64 13.28 10.83
SD 2.55 3.22 4.94 6.79
Cluster 2 (n = 17) Mean 13.55 13.13 26.31 9.06
SD 1.78 1.93 3.43 5.27
Note: S and O are scored from 0 to 20; P and N from 0 to 40. S = self-enhancement; O = union-
with-the-other; P = positive affect; N = negative affect.
Figure 6.4 Mean self-confrontation indices for country of origin I-position, by cluster in
country of origin
Note: S and O are scored from 0 to 20; P and N from 0 to 40.
0
5
10
15
20
25
30
35
S-index O-index P-index N-index
Index
Mean
sco
re
Cluster 1
Cluster 2

152
Clusters in Australia
Hierarchical clustering. The agglomeration schedule (Figure 6.5) and
dendrogram (Figure 6.6) were examined, and a two-cluster solution selected for the
same reasons as applied to clustering by self-confrontation indices for the Australian I-
position.
Figure 6.5 Agglomeration schedule: cluster in Australia
The dendrogram shows how participants were assigned to clusters in country of
origin. Cluster 1 contained 14 participants and cluster 2, 24 participants. The length of
the dendrogram branches following the first split virtually guarantees the validity of at
least a 2-cluster solution.
0
50
100
150
0 5 10 15 20 25 30 35
Stage
Wit
hin
-clu
ste
r v
ari
an
ce
(fu
sio
n c
oe
ffic
ien
t)
Two-cluster
solution
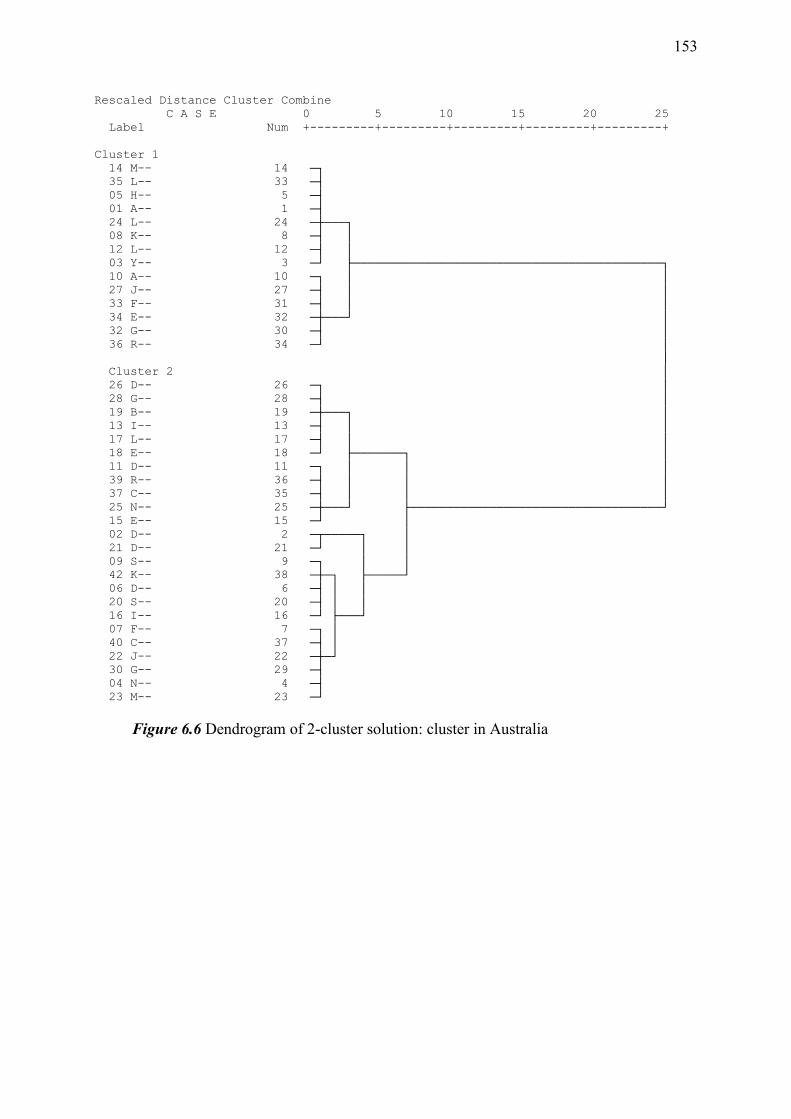
153
Rescaled Distance Cluster Combine
C A S E 0 5 10 15 20 25
Label Num +---------+---------+---------+---------+---------+
Cluster 1
14 M-- 14 ─┐
35 L-- 33 ─┤
05 H-- 5 ─┤
01 A-- 1 ─┤
24 L-- 24 ─┼───┐
08 K-- 8 ─┤ │
12 L-- 12 ─┤ │
03 Y-- 3 ─┘ ├───────────────────────────────────────────┐
10 A-- 10 ─┐ │ │
27 J-- 27 ─┤ │ │
33 F-- 31 ─┤ │ │
34 E-- 32 ─┼───┘ │
32 G-- 30 ─┤ │
36 R-- 34 ─┘ │
│
Cluster 2 │
26 D-- 26 ─┐ │
28 G-- 28 ─┤ │
19 B-- 19 ─┼───┐ │
13 I-- 13 ─┤ │ │
17 L-- 17 ─┤ │ │
18 E-- 18 ─┘ ├───────┐ │
11 D-- 11 ─┐ │ │ │
39 R-- 36 ─┤ │ │ │
37 C-- 35 ─┤ │ │ │
25 N-- 25 ─┼───┘ ├───────────────────────────────────┘
15 E-- 15 ─┘ │
02 D-- 2 ─┬─────┐ │
21 D-- 21 ─┘ │ │
09 S-- 9 ─┐ │ │
42 K-- 38 ─┼─┐ ├─────┘
06 D-- 6 ─┤ │ │
20 S-- 20 ─┤ │ │
16 I-- 16 ─┘ ├───┘
07 F-- 7 ─┐ │
40 C-- 37 ─┤ │
22 J-- 22 ─┼─┘
30 G-- 29 ─┤
04 N-- 4 ─┤
23 M-- 23 ─┘
Figure 6.6 Dendrogram of 2-cluster solution: cluster in Australia
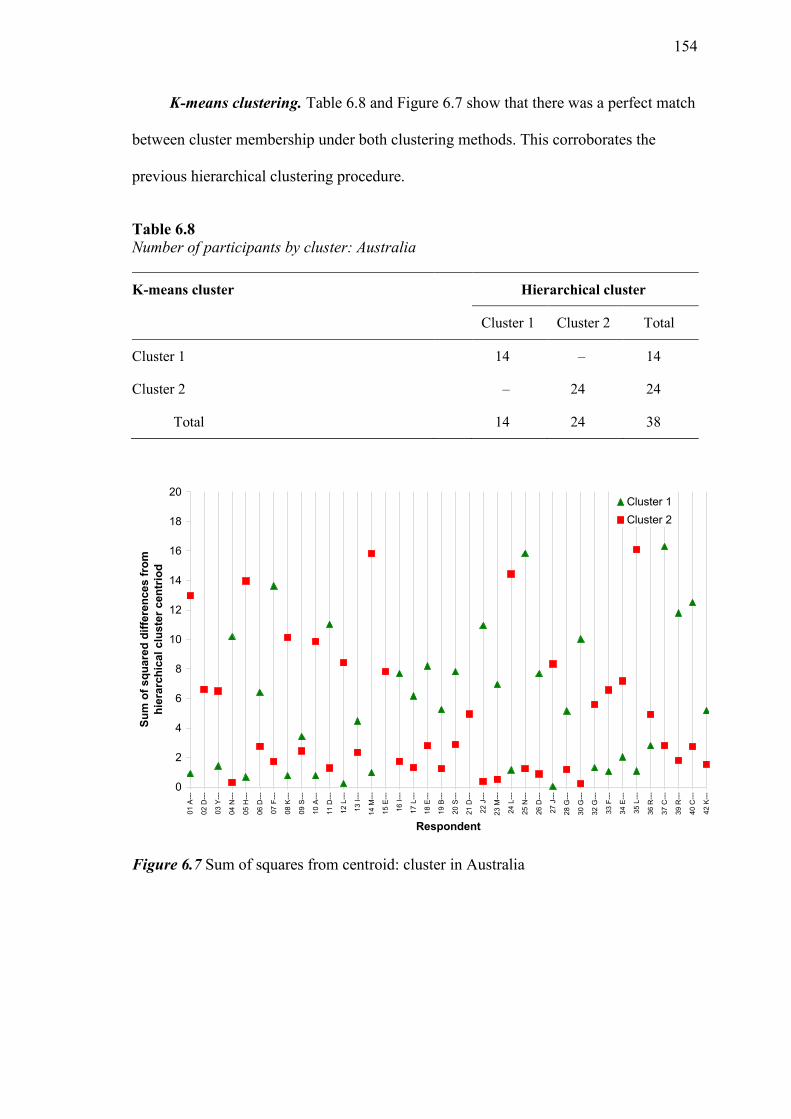
154
K-means clustering. Table 6.8 and Figure 6.7 show that there was a perfect match
between cluster membership under both clustering methods. This corroborates the
previous hierarchical clustering procedure.
Table 6.8 Number of participants by cluster: Australia
K-means cluster Hierarchical cluster
Cluster 1 Cluster 2 Total
Cluster 1 14 – 14
Cluster 2 – 24 24
Total 14 24 38
Figure 6.7 Sum of squares from centroid: cluster in Australia
0
2
4
6
8
10
12
14
16
18
20
01
A--
-
02
D--
-
03
Y--
-
04
N--
-
05
H--
-
06
D--
-
07
F--
-
08
K--
-
09
S--
-
10
A--
-
11
D--
-
12
L--
-
13
I--
-
14
M--
-
15
E--
-
16
I--
-
17
L--
-
18
E--
-
19
B--
-
20
S--
-
21
D--
-
22
J--
-
23
M--
-
24
L--
-
25
N--
-
26
D--
-
27
J--
-
28
G--
-
30
G--
-
32
G--
-
33
F--
-
34
E--
-
35
L--
-
36
R--
-
37
C--
-
39
R--
-
40
C--
-
42
K--
-
Respondent
Su
m o
f s
qu
are
d d
iffe
ren
ces
fro
m
hie
rarc
hic
al
clu
ste
r c
en
trio
d
Cluster 1
Cluster 2

155
Cluster means. Table 6.9 and Figure 6.8 show mean self-confrontation indices for
country of origin broken down by country-of-origin cluster. Independent samples t-tests
were conducted to compare the mean self-confrontation indices for both clusters.
Cluster 1 had higher S than Cluster 2, t(36) = 8.95, p < .001 (two-tailed). Cluster 1 also
had higher O than Cluster 2, t(36) = 7.79, p < .001 (two-tailed). Cluster 1 also had
higher P than Cluster 2, t(36) = 9.69, p < .001 (two-tailed). Finally, Cluster 1 had lower
N than Cluster 2, t(36) = –2.53, p = .016 (two-tailed).
Table 6. 9 Mean self-confrontation indices for Australian I-position, by cluster in Australia
Cluster in
Australia
Index for country of origin I-position
S O P N
Cluster 1 Mean 15.59 14.51 29.91 7.23
(n = 21) SD 1.79 2.24 3.08 4.77
Cluster 2 Mean 9.03 7.48 16.06 12.32
(n = 17) SD 2.37 3.31 4.78 6.56
Note: S and O are scored from 0 to 20; P and N from 0 to 40. S = self-enhancement; O = union-
with-the-other; P = positive affect; N = negative affect.

156
Figure 6.8 Mean self-confrontation indices for Australian I-position, by cluster in
Australia
Note: S and O are scored from 0 to 20; P and N from 0 to 40.
0
5
10
15
20
25
30
35
S-index O-index P-index N-index
Index
Mean
sco
re
Cluster 1
Cluster 2
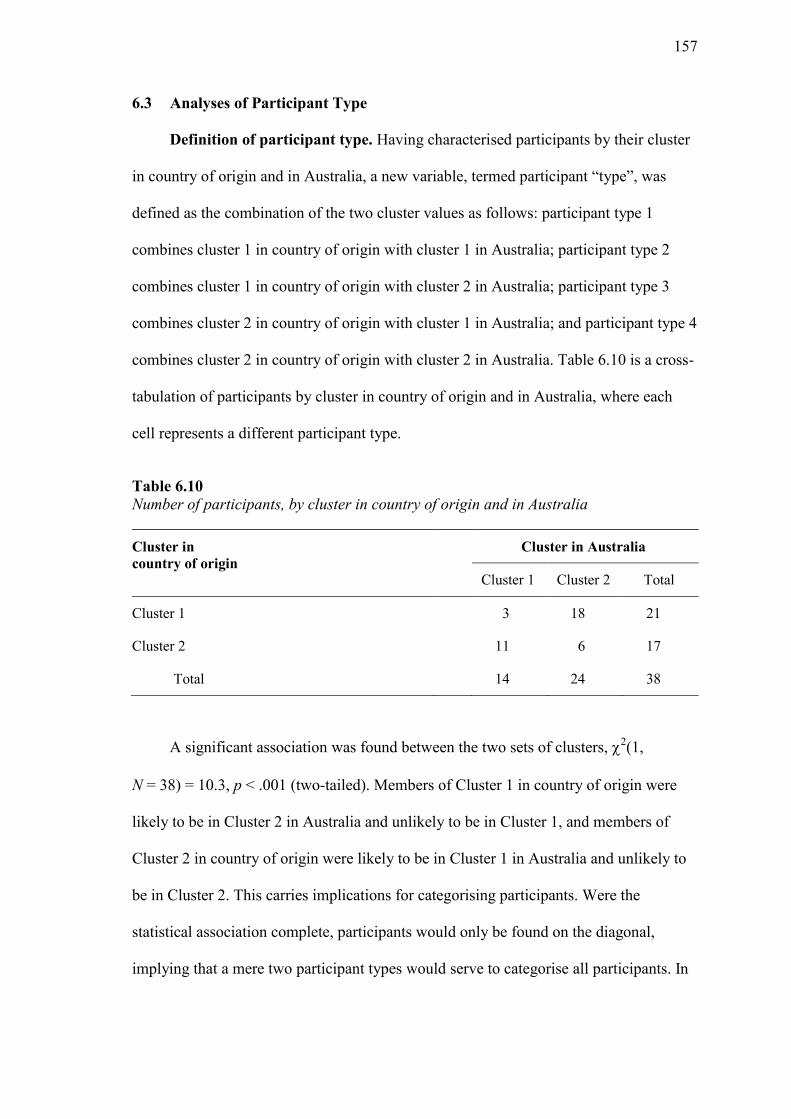
157
6.3 Analyses of Participant Type
Definition of participant type. Having characterised participants by their cluster
in country of origin and in Australia, a new variable, termed participant “type”, was
defined as the combination of the two cluster values as follows: participant type 1
combines cluster 1 in country of origin with cluster 1 in Australia; participant type 2
combines cluster 1 in country of origin with cluster 2 in Australia; participant type 3
combines cluster 2 in country of origin with cluster 1 in Australia; and participant type 4
combines cluster 2 in country of origin with cluster 2 in Australia. Table 6.10 is a cross-
tabulation of participants by cluster in country of origin and in Australia, where each
cell represents a different participant type.
Table 6.10 Number of participants, by cluster in country of origin and in Australia
Cluster in
country of origin
Cluster in Australia
Cluster 1 Cluster 2 Total
Cluster 1 3 18 21
Cluster 2 11 6 17
Total 14 24 38
A significant association was found between the two sets of clusters, 2(1,
N = 38) = 10.3, p < .001 (two-tailed). Members of Cluster 1 in country of origin were
likely to be in Cluster 2 in Australia and unlikely to be in Cluster 1, and members of
Cluster 2 in country of origin were likely to be in Cluster 1 in Australia and unlikely to
be in Cluster 2. This carries implications for categorising participants. Were the
statistical association complete, participants would only be found on the diagonal,
implying that a mere two participant types would serve to categorise all participants. In

158
fact a quarter of participants lay in “off-diagonal” cells, implying that more participant
types are needed.
Main analyses. Table 6.11 shows means and standard deviations for self-
confrontation indices by I-position location and participant type. “Location” is a
variable that captures the location of the I-position (country of origin or Australia) to
which the self-confrontation indices relate.
A 2-by-4 mixed-design repeated-measures MANOVA was conducted on the self-
confrontation indices as dependent variables, with location as the within-subject
independent variable and participant type as the between-subject independent variable.

159
Table 6.11 Mean self-confrontation indices for the I-position, by location and participant type
Index Participant type
Location
Country of origin Australia
Mean SD Mean SD
Self-enhancement Type 1 (n = 3) 9.19 3.62 14.92 1.88
Type 2 (n = 18) 6.82 2.29 8.52 2.46
Type 3 (n = 11) 13.83 2.09 15.77 1.81
Type 4 (n = 6) 13.03 0.96 10.57 1.27
Union-with-the-other Type 1 (n = 3) 10.47 3.23 14.49 1.01
Type 2 (n = 18) 6.00 2.82 6.82 3.32
Type 3 (n = 11) 13.24 2.30 14.52 2.52
Type 4 (n = 6) 12.92 1.09 9.47 2.55
Positive affect Type 1 (n = 3) 18.23 4.49 27.38 3.85
Type 2 (n = 18) 12.46 4.61 15.07 4.95
Type 3 (n = 11) 26.46 4.18 30.61 2.64
Type 4 (n = 6) 26.04 1.62 19.03 2.81
Negative affect Type 1 (n = 3) 13.25 7.07 6.52 7.67
Type 2 (n = 18) 10.42 6.87 11.01 6.55
Type 3 (n = 11) 9.01 5.94 7.43 4.20
Type 4 (n = 6) 9.14 4.28 16.25 5.25

160
Main effects of type and location on I-position. A MANOVA on self-
confrontation indices revealed a significant multivariate effect of participant type,
Pillai’s Trace = .88, F(12,99) = 3.42, p < .001, partial η2 = .29, and I-position location,
Pillai’s Trace = .49, F(4,31) = 7.55, p = .001, partial η2 = .50.
Student-Newman-Keuls post hoc comparisons (p < .05) showed that Type 2 was
significantly lower on S (M = 7.67) and P (M = 13.77) than Type 4 (M = 11.80 and
M = 22.54 respectively) and Type 1 (M = 12.05 and M = 22.80), and that both these
types were significantly lower than Type 3 (M = 14.80 and M = 28.53). A post hoc
comparison showed that Type 2 was significantly lower on O (M = 6.41) than Type 4
(M = 11.19), Type 1 (M = 12.48) and Type 3 (M = 13.88). A post hoc comparison
showed no significant differences between types on N.
These main effects were qualified by a significant interaction between location
and type, Pillai’s Trace = .82, F(12,99) = 3.13, p = .001, partial η2 = .28. Simple effects
analyses were conducted comparing self-confrontation indices among the four types at
each I-position location.

161
Interactions of type and location on I-position: self-enhancement. Univariate
comparisons showed significant differences between participant types on self-
enhancement (S). Figure 6.9 compares mean S for country of origin and Australia.
Although S differed significantly according to the location of the I-position,
F(3,34) = 15.10, p < .001, partial η2 = .57, the effect differed by participant type.
A Student-Newman-Keuls post hoc comparison (p < .05) showed that Type 2
(M = 6.82) and Type 1 (M = 9.19) were significantly lower on S for country of origin
than Type 4 (M = 13.03) and Type 3 (M = 13.83). A second Student-Newman-Keuls
post hoc comparison (p < .05) showed that Type 2 (M = 8.52) and Type 4 (M = 10.57)
were significantly lower on S for Australia than Type 1 (M = 14.92) and Type 3
(M = 15.77).
Figure 6.9 Mean self-enhancement for country of origin and Australian I-position, by
participant type
0
2
4
6
8
10
12
14
16
18
Origin Australia
Location
S-i
nd
ex
Type 1
Type 2
Type 3
Type 4
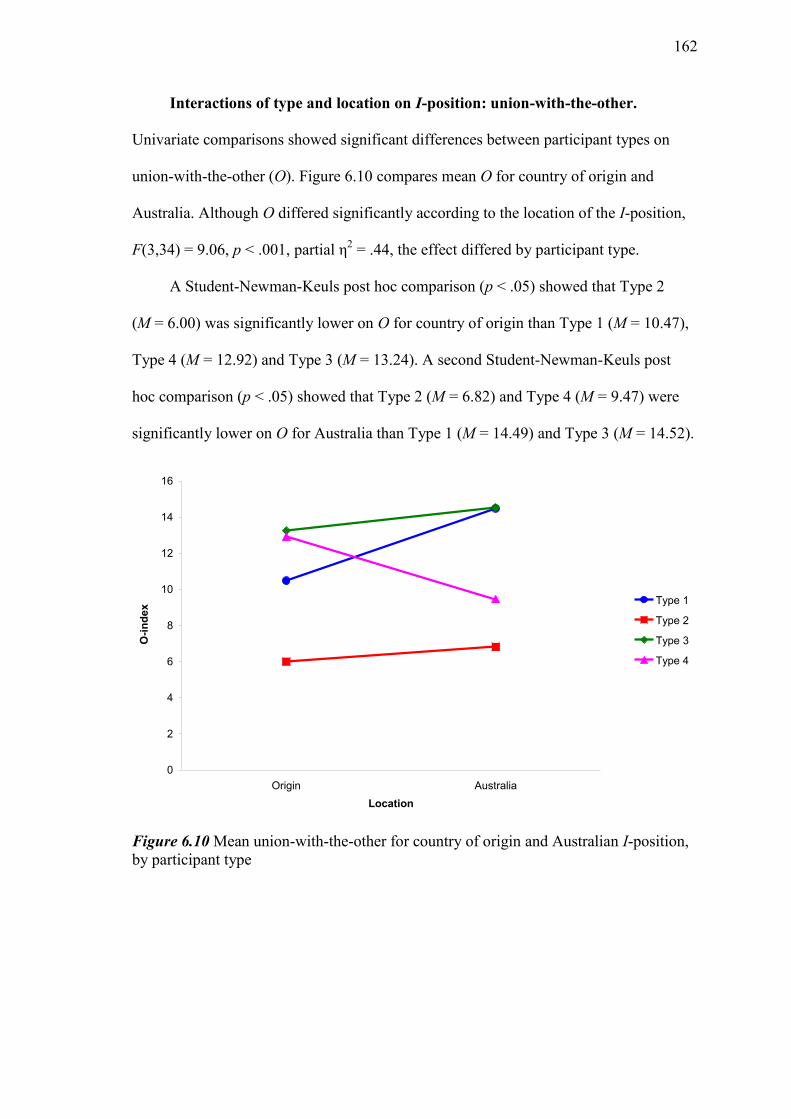
162
Interactions of type and location on I-position: union-with-the-other.
Univariate comparisons showed significant differences between participant types on
union-with-the-other (O). Figure 6.10 compares mean O for country of origin and
Australia. Although O differed significantly according to the location of the I-position,
F(3,34) = 9.06, p < .001, partial η2 = .44, the effect differed by participant type.
A Student-Newman-Keuls post hoc comparison (p < .05) showed that Type 2
(M = 6.00) was significantly lower on O for country of origin than Type 1 (M = 10.47),
Type 4 (M = 12.92) and Type 3 (M = 13.24). A second Student-Newman-Keuls post
hoc comparison (p < .05) showed that Type 2 (M = 6.82) and Type 4 (M = 9.47) were
significantly lower on O for Australia than Type 1 (M = 14.49) and Type 3 (M = 14.52).
Figure 6.10 Mean union-with-the-other for country of origin and Australian I-position,
by participant type
0
2
4
6
8
10
12
14
16
Origin Australia
Location
O-i
nd
ex
Type 1
Type 2
Type 3
Type 4
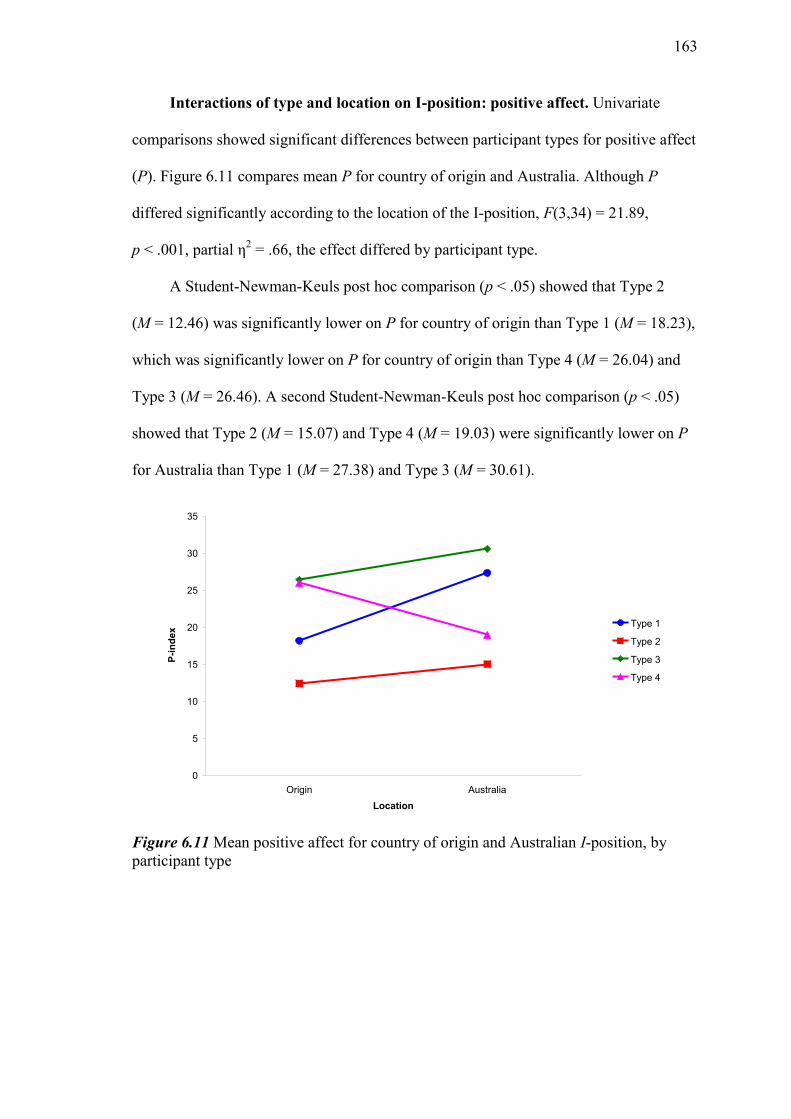
163
Interactions of type and location on I-position: positive affect. Univariate
comparisons showed significant differences between participant types for positive affect
(P). Figure 6.11 compares mean P for country of origin and Australia. Although P
differed significantly according to the location of the I-position, F(3,34) = 21.89,
p < .001, partial η2 = .66, the effect differed by participant type.
A Student-Newman-Keuls post hoc comparison (p < .05) showed that Type 2
(M = 12.46) was significantly lower on P for country of origin than Type 1 (M = 18.23),
which was significantly lower on P for country of origin than Type 4 (M = 26.04) and
Type 3 (M = 26.46). A second Student-Newman-Keuls post hoc comparison (p < .05)
showed that Type 2 (M = 15.07) and Type 4 (M = 19.03) were significantly lower on P
for Australia than Type 1 (M = 27.38) and Type 3 (M = 30.61).
Figure 6.11 Mean positive affect for country of origin and Australian I-position, by
participant type
0
5
10
15
20
25
30
35
Origin Australia
Location
P-i
nd
ex
Type 1
Type 2
Type 3
Type 4

164
Interactions of type and location on I-position: negative affect. Univariate
comparisons showed significant differences between participant types for negative
affect (N). Figure 6.12 compares mean N for country of origin and Australia. Although
N differed significantly according to the location of the I-position, F(3,34) = 10.14,
p < .001, partial η2 = .47, the effect differed by participant type.
A Student-Newman-Keuls post hoc comparison (p < .05) showed no significant
differences on N for country of origin. A second Student-Newman-Keuls post hoc
comparison (p < .05) showed that the subset comprising Type 1 (M = 6.52), Type 3
(M = 7.42) and Type 2 (M = 11.01) was significantly lower on N in Australia than the
subset comprising Type 2 (M = 11.01) and Type 4 (M = 16.25).
Figure 6.12 Mean negative affect for country of origin and Australian I-position, by
participant type
0
2
4
6
8
10
12
14
16
18
Origin Australia
Location
N-i
nd
ex
Type 1
Type 2
Type 3
Type 4
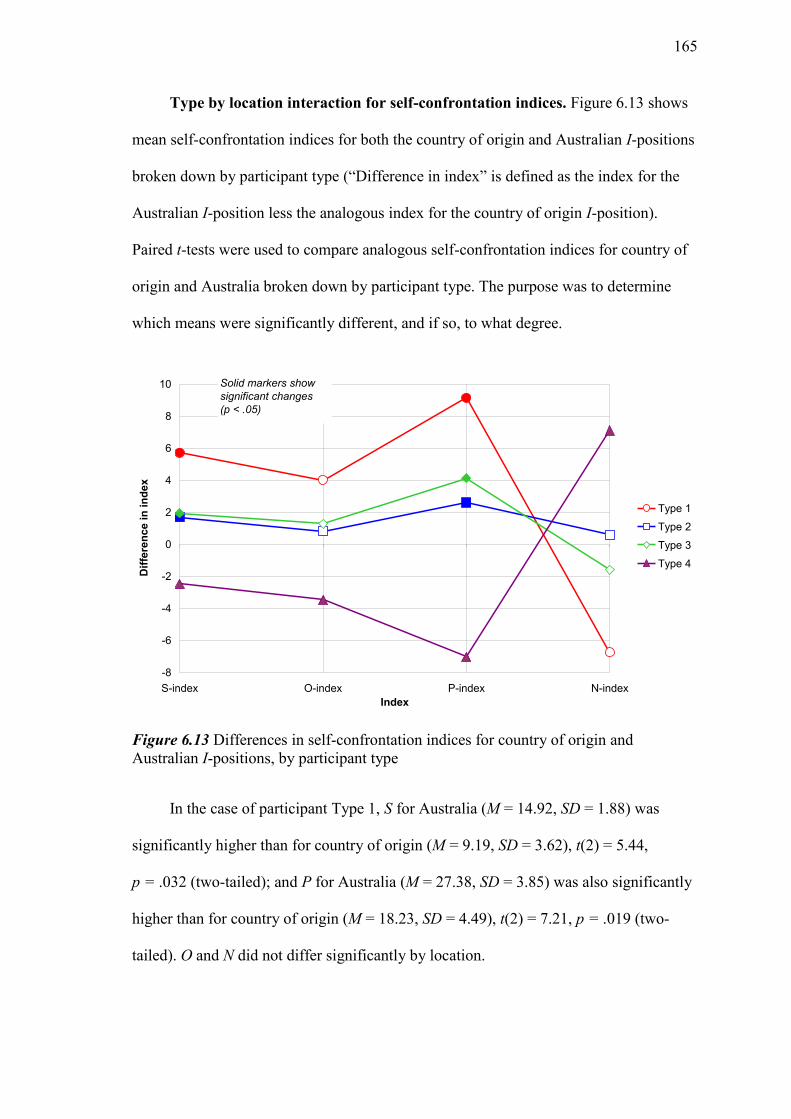
165
Type by location interaction for self-confrontation indices. Figure 6.13 shows
mean self-confrontation indices for both the country of origin and Australian I-positions
broken down by participant type (“Difference in index” is defined as the index for the
Australian I-position less the analogous index for the country of origin I-position).
Paired t-tests were used to compare analogous self-confrontation indices for country of
origin and Australia broken down by participant type. The purpose was to determine
which means were significantly different, and if so, to what degree.
Figure 6.13 Differences in self-confrontation indices for country of origin and
Australian I-positions, by participant type
In the case of participant Type 1, S for Australia (M = 14.92, SD = 1.88) was
significantly higher than for country of origin (M = 9.19, SD = 3.62), t(2) = 5.44,
p = .032 (two-tailed); and P for Australia (M = 27.38, SD = 3.85) was also significantly
higher than for country of origin (M = 18.23, SD = 4.49), t(2) = 7.21, p = .019 (two-
tailed). O and N did not differ significantly by location.
-8
-6
-4
-2
0
2
4
6
8
10
S-index O-index P-index N-index
Index
Dif
fere
nc
e i
n i
nd
ex
Type 1
Type 2
Type 3
Type 4
Solid markers show
significant changes
(p < .05)

166
In the case of participant Type 2, S for Australia (M = 8.52, SD = 2.46) was
significantly higher than for country of origin (M = 6.82, SD = 2.29), t(17) = 3.94,
p = .001 (two-tailed); and P for Australia (M = 15.07, SD = 4.95) was also significantly
higher than for country of origin (M = 12.46, SD = 4.61), t(17) = 3.20, p < .01 (two-
tailed). O and N did not differ significantly.
In the case of participant Type 3, S for Australia (M = 15.77, SD = 1.81) was
significantly higher than for country of origin (M = 13.83, SD = 2.09), t(10) = 2.97,
p = .014 (two-tailed); and P for Australia (M = 30.61, SD = 2.64) was also significantly
higher than for country of origin (M = 26.46, SD = 4.18), t(10) = 3.88, p = .003 (two-
tailed). O and S did not differ significantly.
In the case of participant Type 4, S for Australia (M = 10.57, SD = 1.27) was
significantly lower than for country of origin (M = 13.03, SD = 0.96), t(5) = –9.32,
p < .001 (two-tailed); O for Australia (M = 9.47, SD = 2.55) was significantly lower
than for country of origin (M = 12.92, SD = 1.09), t(5) = –3.87, p = .012 (two-tailed);
and P for Australia (M = 19.03, SD = 2.81) was also significantly lower than for the
country of origin (M = 26.04, SD = 1.62), t(5) = –8.19, p < .001 (two-tailed).
Conversely, N for Australia (M = 16.25, SD = 5.25) was significantly higher than for
country of origin (M = 9.14, SD = 4.28), t(5) = 5.17, p = .004 (two-tailed).
Naming of participant types. Figure 6.14 shows the self-confrontation indices
both in country of origin and in Australia relating to each participant type. Each of the
four participant types was accorded a mnemonic name on the basis of its pattern of self-
confrontation indices and the differences between valuations pertaining to the country
of origin I-position and to the Australian I-position. Since self-enhancement, union-
with-the-other, and positive affect were highly correlated, and negatively correlated

167
with negative affect, participant types were described by whether their S, O, and P were
relatively higher or lower for country of origin as compared with Australia.
Cluster 1 in Australia Cluster 2 in Australia
Type 1 (Progressive) Type 2 (Low-stable)
Clu
ster
1 i
n
cou
ntr
y o
f ori
gin
n = 3 n = 18
Type 3 (High-stable) Type 4 (Regressive)
Clu
ster
2 i
n
cou
ntr
y o
f ori
gin
n = 11 n = 6
Note: Solid markers show significant differences (p < .05).
Figure 6.14 Mean self-confrontation indices, by participant type
Participant type 1: “Progressive”. For this group (n = 3; 8%) the country of
origin I-position was characterised by a low S, O and P, and high N; but the Australian
I-position by high S, O and P, and a low N. When the two I-positions were compared,
the Australian was found to have significantly higher S and P. In summary, these are
0
5
10
15
20
25
30
S index O index P index N index
Origin
Australia
0
5
10
15
20
25
30
S index O index P index N index
Origin
Australia
0
5
10
15
20
25
30
S index O index P index N index
Origin
Australia
0
5
10
15
20
25
30
S index O index P index N index
Origin
Australia

168
people whose Australian I-position is perceived in a more positive light than their
country of origin I-position.
In Gergen & Gergen’s (1986) typology, a “progressive” narrative links events “in
such a way that one steadily progresses towards a goal” (p. 27). Consequently this
group is termed “Progressive” as their well-being is higher for their Australian I-
position, suggesting greater fulfilment of their S and O motives through migration.
Participant type 2: “Low-stable”. For this group (n = 18; 47%) the country of
origin I-position was characterised by low S, O and P, and high N; and the Australian I-
position also by low S, O and P, and high N. When the two I-positions were compared,
the Australian was found to have significantly higher S and P, though the differences
were small. In summary, these are people who perceive both their I-positions more
negatively than do the other participant types.
In Gergen & Gergen’s (1986) typology, a “stability” narrative links events “in
such a way that the protagonist remains essentially unchanged with respect to evaluative
position” (p. 27). Consequently this group is termed “Low-stable” as their well-being
remains low for their Australian I-position, suggesting largely unchanged fulfilment of
their S and O motives through migration.
Participant type 3: “High-stable”. For this group (n = 11; 29%) the country of
origin I-position was characterised by high S, O and P, and low N; and the Australian I-
position also by high S, O and P, and low N. When the two I-positions were compared,
the Australian was found to have significantly higher self S and P, though the
differences were small. In summary, these are people who perceive both their I-
positions more positively than do the other participant types.
In Gergen & Gergen’s (1986) typology, a “stability” narrative links events “in
such a way that the protagonist remains essentially unchanged with respect to evaluative

169
position” (p. 27). Consequently this group is termed “High-stable” as their well-being
remains high for their Australian I-position, suggesting largely unchanged fulfilment of
their S and O motives through migration.
Participant type 4: “Regressive”. For this group (n = 6; 16%) the country of
origin I-position was characterised by high S, O and P, and low N; but the Australian I-
position by low S, O and P, and high N. When the two I-positions were compared, the
Australian was found to have significantly lower S, O and P, and higher N. In summary,
these are people whose Australian I-position is perceived in a more negative light than
their country of origin I-position.
In Gergen & Gergen’s (1986) typology, a “regressive” narrative is one in which
one “is continuously moving away from the valued state” (p. 27). Therefore their self-
narrative should reflect relative decrease in well-being, not only by location but also
through time. Consequently this group is termed “Regressive” as their well-being is
lower for their Australian I-position, suggesting reduced fulfilment of their S and O
motives through migration.
Patterns of change. Two overall patterns—one absolute, one relative—are
observed when comparing country of origin and Australian I-positions. In absolute
terms the Australian I-positions of most participant types—84% of the sample—had a
higher S and P (though not O) than their country of origin I-positions; and one
participant type, Type 4 (Regressive), showed the opposite. But in relative terms the
Australian I-positions of most participants—the two “stable” types, totalling 76% of the
sample—stayed relatively the same; that is, the ranking of S and P for country of origin
and Australia, as compared with those of other participant types, did not differ.
170
6.4 Comparison of Participant Types
This section examines how the four participant types differed on demographic
characteristics, on measures of psychological distress and of well-being, and on the self-
confrontation indices.
Demographic characteristics. Table 6.12 shows the nominal demographic
variables cross-tabulated by participant type. Chi-square analysis revealed no
differences across participant types for gender, χ2(3, N = 38) = .49, p = .92 (two-tailed),
marital status, χ2(6, N = 38) = 2.47, p = .87 (two-tailed), education, χ
2(12,
N = 38) = 8.46, p = .75 (two-tailed), or language, χ2(6, N = 38) = 9.46, p = .15 (two-
tailed). However, participant types did differ on ethnic identification, χ2(3,
N = 38) = 13.11, p < .01 (two-tailed). Those who identified with their ethnic group were
more likely to be found among Type 1 (Progressive) (38% as compared to an expected
8%) and less likely to be among Type 4 (Regressive) (0% as compared to an expected
16%). Thus it seems that ethnic identification predisposes to higher S and O, and higher
P for the Australian I-position (though it is noted that this finding is based on a very
small sample).
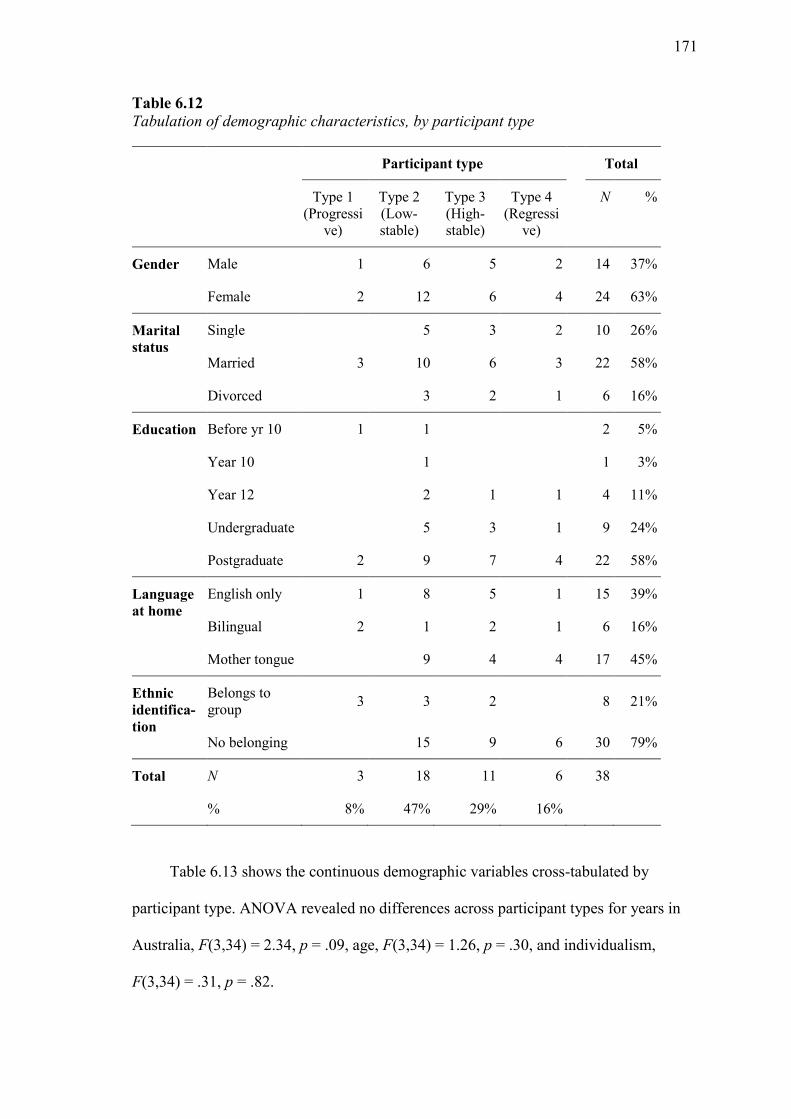
171
Table 6.12 Tabulation of demographic characteristics, by participant type
Participant type Total
Type 1
(Progressi
ve)
Type 2
(Low-
stable)
Type 3
(High-
stable)
Type 4
(Regressi
ve)
N %
Gender Male 1 6 5 2 14 37%
Female 2 12 6 4 24 63%
Marital
status
Single 5 3 2 10 26%
Married 3 10 6 3 22 58%
Divorced 3 2 1 6 16%
Education Before yr 10 1 1 2 5%
Year 10 1 1 3%
Year 12 2 1 1 4 11%
Undergraduate 5 3 1 9 24%
Postgraduate 2 9 7 4 22 58%
Language
at home
English only 1 8 5 1 15 39%
Bilingual 2 1 2 1 6 16%
Mother tongue 9 4 4 17 45%
Ethnic
identifica-
tion
Belongs to
group 3 3 2 8 21%
No belonging 15 9 6 30 79%
Total N 3 18 11 6 38
% 8% 47% 29% 16%
Table 6.13 shows the continuous demographic variables cross-tabulated by
participant type. ANOVA revealed no differences across participant types for years in
Australia, F(3,34) = 2.34, p = .09, age, F(3,34) = 1.26, p = .30, and individualism,
F(3,34) = .31, p = .82.
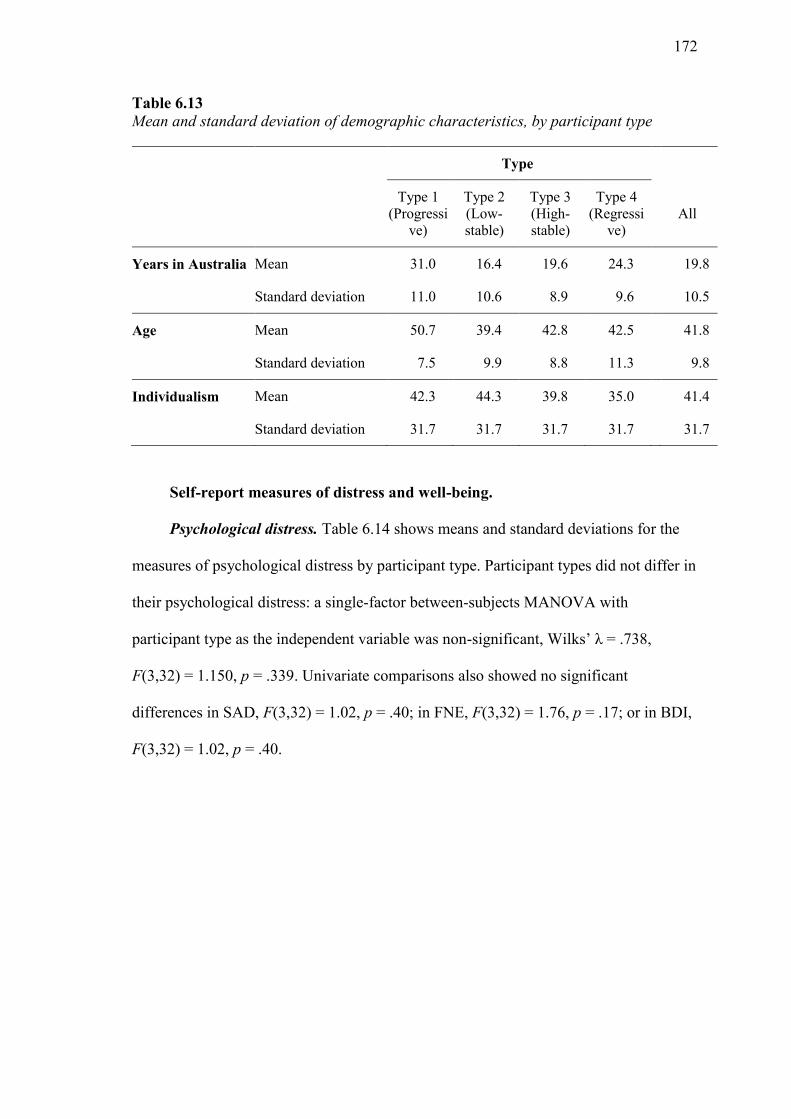
172
Table 6.13 Mean and standard deviation of demographic characteristics, by participant type
Type
Type 1
(Progressi
ve)
Type 2
(Low-
stable)
Type 3
(High-
stable)
Type 4
(Regressi
ve)
All
Years in Australia Mean 31.0 16.4 19.6 24.3 19.8
Standard deviation 11.0 10.6 8.9 9.6 10.5
Age Mean 50.7 39.4 42.8 42.5 41.8
Standard deviation 7.5 9.9 8.8 11.3 9.8
Individualism Mean 42.3 44.3 39.8 35.0 41.4
Standard deviation 31.7 31.7 31.7 31.7 31.7
Self-report measures of distress and well-being.
Psychological distress. Table 6.14 shows means and standard deviations for the
measures of psychological distress by participant type. Participant types did not differ in
their psychological distress: a single-factor between-subjects MANOVA with
participant type as the independent variable was non-significant, Wilks’ λ = .738,
F(3,32) = 1.150, p = .339. Univariate comparisons also showed no significant
differences in SAD, F(3,32) = 1.02, p = .40; in FNE, F(3,32) = 1.76, p = .17; or in BDI,
F(3,32) = 1.02, p = .40.
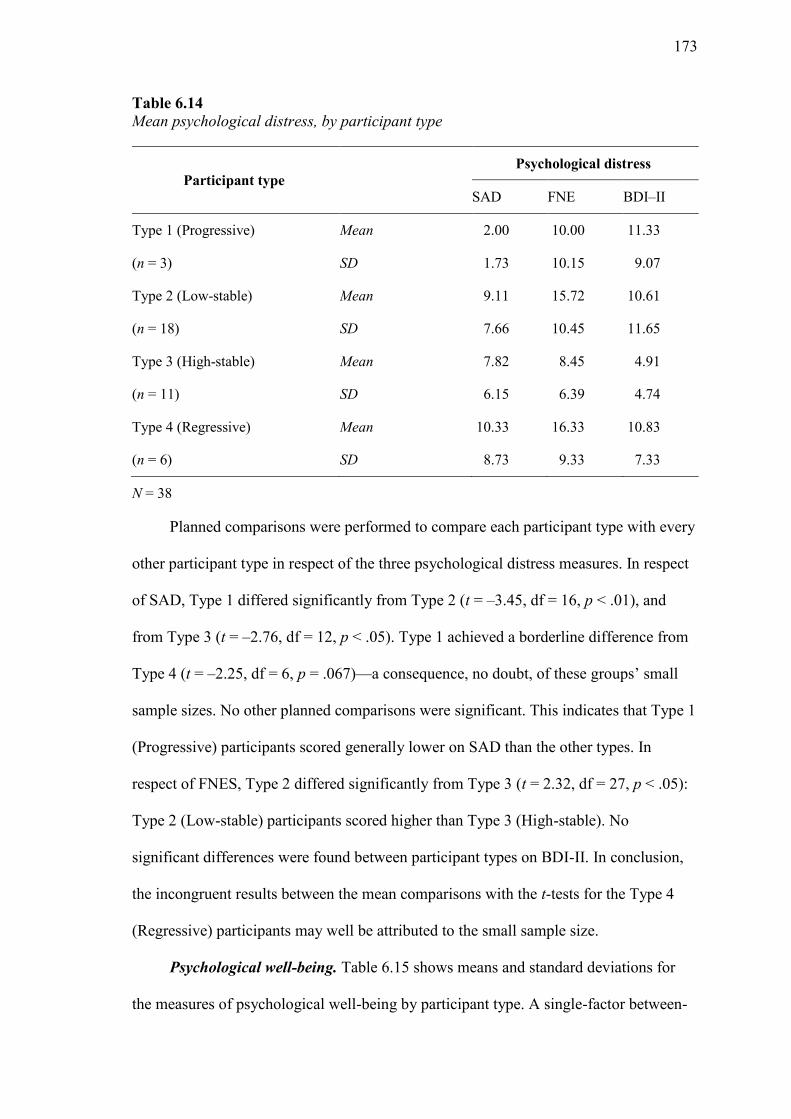
173
Table 6.14 Mean psychological distress, by participant type
Participant type
Psychological distress
SAD FNE BDI–II
Type 1 (Progressive) Mean 2.00 10.00 11.33
(n = 3) SD 1.73 10.15 9.07
Type 2 (Low-stable) Mean 9.11 15.72 10.61
(n = 18) SD 7.66 10.45 11.65
Type 3 (High-stable) Mean 7.82 8.45 4.91
(n = 11) SD 6.15 6.39 4.74
Type 4 (Regressive) Mean 10.33 16.33 10.83
(n = 6) SD 8.73 9.33 7.33
N = 38
Planned comparisons were performed to compare each participant type with every
other participant type in respect of the three psychological distress measures. In respect
of SAD, Type 1 differed significantly from Type 2 (t = –3.45, df = 16, p < .01), and
from Type 3 (t = –2.76, df = 12, p < .05). Type 1 achieved a borderline difference from
Type 4 (t = –2.25, df = 6, p = .067)—a consequence, no doubt, of these groups’ small
sample sizes. No other planned comparisons were significant. This indicates that Type 1
(Progressive) participants scored generally lower on SAD than the other types. In
respect of FNES, Type 2 differed significantly from Type 3 (t = 2.32, df = 27, p < .05):
Type 2 (Low-stable) participants scored higher than Type 3 (High-stable). No
significant differences were found between participant types on BDI-II. In conclusion,
the incongruent results between the mean comparisons with the t-tests for the Type 4
(Regressive) participants may well be attributed to the small sample size.
Psychological well-being. Table 6.15 shows means and standard deviations for
the measures of psychological well-being by participant type. A single-factor between-
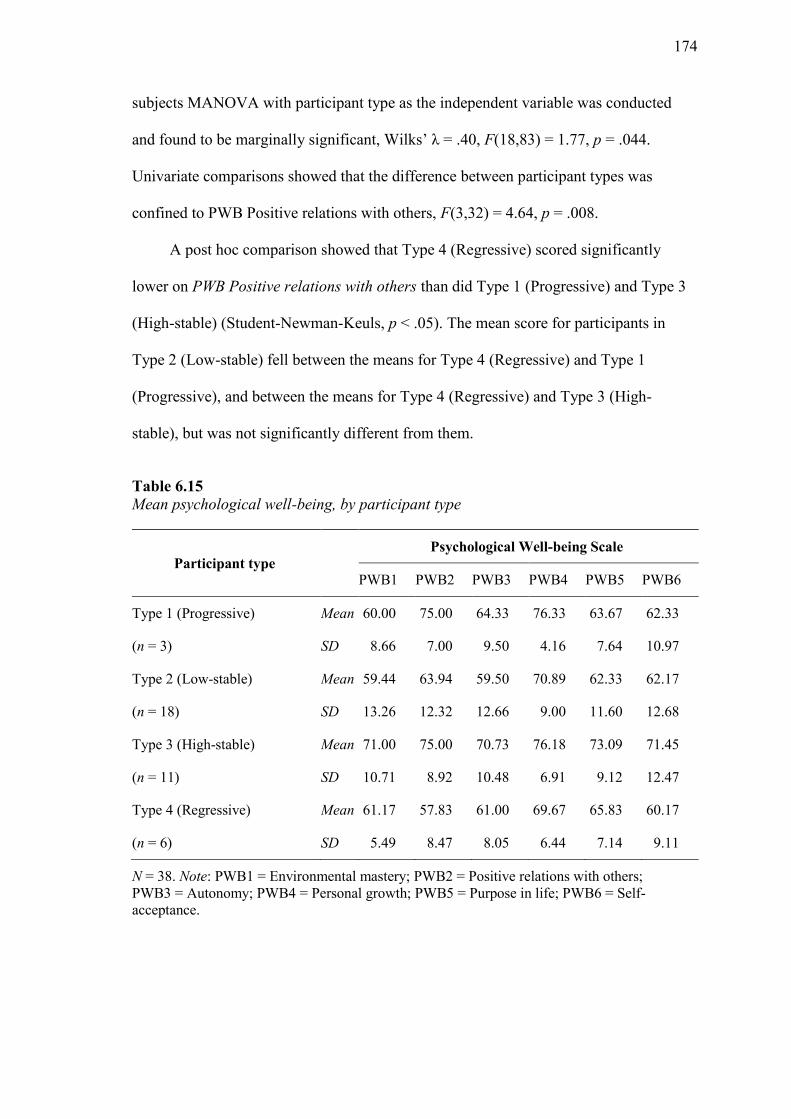
174
subjects MANOVA with participant type as the independent variable was conducted
and found to be marginally significant, Wilks’ λ = .40, F(18,83) = 1.77, p = .044.
Univariate comparisons showed that the difference between participant types was
confined to PWB Positive relations with others, F(3,32) = 4.64, p = .008.
A post hoc comparison showed that Type 4 (Regressive) scored significantly
lower on PWB Positive relations with others than did Type 1 (Progressive) and Type 3
(High-stable) (Student-Newman-Keuls, p < .05). The mean score for participants in
Type 2 (Low-stable) fell between the means for Type 4 (Regressive) and Type 1
(Progressive), and between the means for Type 4 (Regressive) and Type 3 (High-
stable), but was not significantly different from them.
Table 6.15 Mean psychological well-being, by participant type
Participant type
Psychological Well-being Scale
PWB1 PWB2 PWB3 PWB4 PWB5 PWB6
Type 1 (Progressive) Mean 60.00 75.00 64.33 76.33 63.67 62.33
(n = 3) SD 8.66 7.00 9.50 4.16 7.64 10.97
Type 2 (Low-stable) Mean 59.44 63.94 59.50 70.89 62.33 62.17
(n = 18) SD 13.26 12.32 12.66 9.00 11.60 12.68
Type 3 (High-stable) Mean 71.00 75.00 70.73 76.18 73.09 71.45
(n = 11) SD 10.71 8.92 10.48 6.91 9.12 12.47
Type 4 (Regressive) Mean 61.17 57.83 61.00 69.67 65.83 60.17
(n = 6) SD 5.49 8.47 8.05 6.44 7.14 9.11
N = 38. Note: PWB1 = Environmental mastery; PWB2 = Positive relations with others;
PWB3 = Autonomy; PWB4 = Personal growth; PWB5 = Purpose in life; PWB6 = Self-
acceptance.
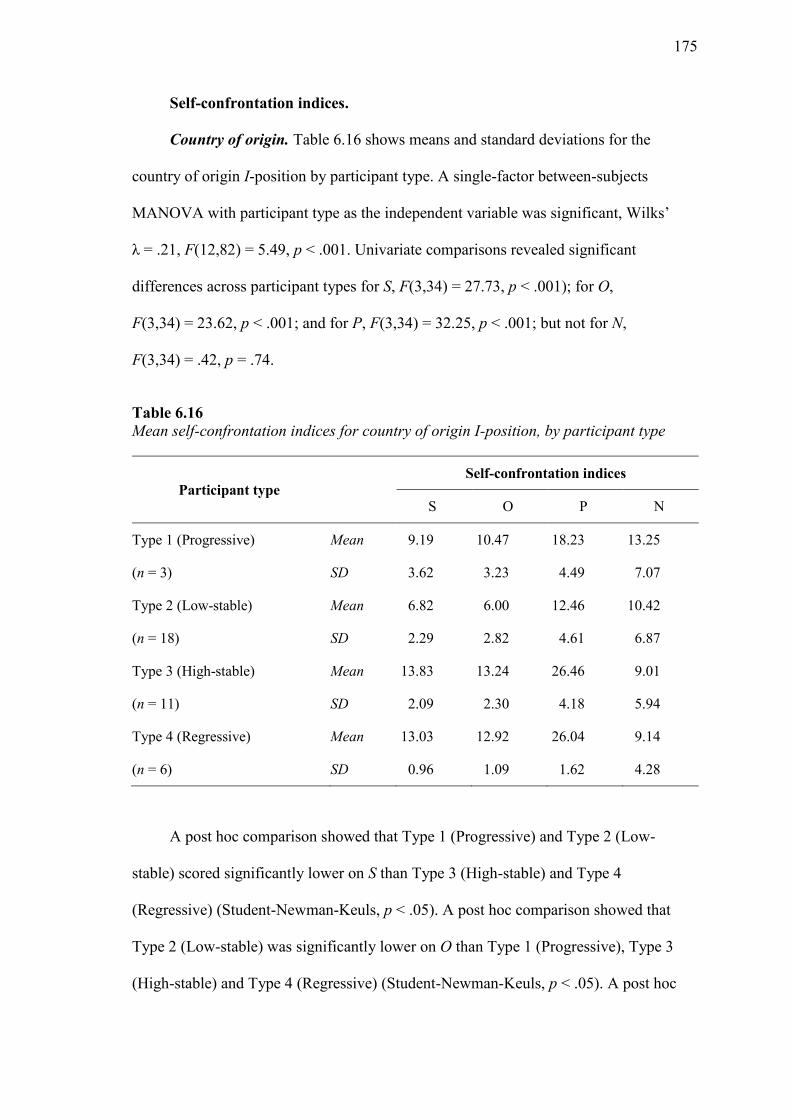
175
Self-confrontation indices.
Country of origin. Table 6.16 shows means and standard deviations for the
country of origin I-position by participant type. A single-factor between-subjects
MANOVA with participant type as the independent variable was significant, Wilks’
λ = .21, F(12,82) = 5.49, p < .001. Univariate comparisons revealed significant
differences across participant types for S, F(3,34) = 27.73, p < .001); for O,
F(3,34) = 23.62, p < .001; and for P, F(3,34) = 32.25, p < .001; but not for N,
F(3,34) = .42, p = .74.
Table 6.16 Mean self-confrontation indices for country of origin I-position, by participant type
Participant type
Self-confrontation indices
S O P N
Type 1 (Progressive) Mean 9.19 10.47 18.23 13.25
(n = 3) SD 3.62 3.23 4.49 7.07
Type 2 (Low-stable) Mean 6.82 6.00 12.46 10.42
(n = 18) SD 2.29 2.82 4.61 6.87
Type 3 (High-stable) Mean 13.83 13.24 26.46 9.01
(n = 11) SD 2.09 2.30 4.18 5.94
Type 4 (Regressive) Mean 13.03 12.92 26.04 9.14
(n = 6) SD 0.96 1.09 1.62 4.28
A post hoc comparison showed that Type 1 (Progressive) and Type 2 (Low-
stable) scored significantly lower on S than Type 3 (High-stable) and Type 4
(Regressive) (Student-Newman-Keuls, p < .05). A post hoc comparison showed that
Type 2 (Low-stable) was significantly lower on O than Type 1 (Progressive), Type 3
(High-stable) and Type 4 (Regressive) (Student-Newman-Keuls, p < .05). A post hoc

176
comparison showed that Type 2 (Low-stable) scored significantly lower on P than did
Type 1 (Progressive), and that both of these types scored significantly lower than
Type 3 (High-stable) and Type 4 (Regressive) (Student-Newman-Keuls, p < .05).
Australia. Table 6.17 shows means and standard deviations for the Australian I-
position by participant type. A single-factor between-subjects MANOVA with
participant type as the independent variable was significant, Wilks’ λ = .18,
F(12,82) = 6.24, p < .001. Univariate comparisons showed significant differences across
participant types for S, F(3,34) = 30.22, p < .001; for O, F(3,34) = 18.63, p < .001; for
P, F(3,34) = 36.58, p < .001, and for N, F(3,34) = 3.46, p < .05.
Table 6.17 Mean self-confrontation indices for the Australian I-position, by participant type
Participant type
Self-confrontation indices
S O P N
Type 1 (Progressive) Mean 14.92 14.49 27.38 6.52
(n = 3) SD 1.88 1.01 3.85 7.67
Type 2 (Low-stable) Mean 8.52 6.82 15.07 11.01
(n = 18) SD 2.46 3.32 4.95 6.55
Type 3 (High-stable) Mean 15.77 14.52 30.61 7.43
(n = 11) SD 1.81 2.52 2.64 4.20
Type 4 (Regressive) Mean 10.57 9.47 19.03 16.25
(n = 6) SD 1.27 2.55 2.81 5.25
A post hoc comparison showed that Type 2 (Low-stable) and Type 4 (Regressive)
scored significantly lower on S than did Type 1 (Progressive) and Type 3 (High-stable)
(Student-Newman-Keuls, p < .05). A post hoc comparison showed that Type 2 (Low-
stable) and Type 4 (Regressive) were significantly lower on O than were Type 1

177
(Progressive) and Type 3 (High-stable) (Student-Newman-Keuls, p < .05). A post hoc
comparison showed that Type 2 (Low-stable) and Type 4 (Regressive) scored
significantly lower on P than did Type 1 (Progressive) and Type 3 (High-stable)
(Student-Newman-Keuls, p < .05). A post hoc comparison showed that Type 1
(Progressive) and Type 3 (High-stable) scored significantly lower on N than did Type 4
(Regressive) (Student-Newman-Keuls, p < .05). The mean score for participants in
Type 2 (Low-stable) fell between the means for Type 1 (Progressive) and Type 3 (High-
stable) and the mean for Type 4 (Regressive) but was not significantly different.
6.5 Summary
In Study 1, participants were first characterised in terms of demographic
descriptors, psychological self-reports and self-confrontation indices. Cluster analysis
was then employed as a data reduction technique. The participants were grouped into
four types: Progressive, Low-stable, High-stable and Regressive. Following that, mixed-
design repeated-measures MANOVAs were conducted on the self-confrontation indices
as dependent variables, with location of the I-position (country of origin or Australia) as
the within-subject independent variable and participant type as the between-subject
independent variable.
Because the main effects were qualified by significant interactions between
location and participant type, separate paired t-tests were conducted to compare self-
confrontation indices pertaining to each participant’s I-position in country of origin with
those pertaining to the I-position in Australia. Having established that participants could
be grouped in types, and that the types differed in terms of self-confrontation indices,
MANOVA was used to explore where and how the participant types differed in terms of
demographics and psychological self-reports.
178
Perhaps the most significant finding concerned the stability of I-positions.
Participants belonging to Types 2 (Low-stable) and 3 (High-stable), together comprising
76% of the sample, evinced little difference between their Australian and country-of-
origin I-positions. True, their self-enhancement (S) and positive affect (P) were
significantly higher for Australia than for country of origin, but only marginally so.
Only Types 1 (Progressive) and 4 (Regressive), together comprising 14% of the sample,
showed much difference.
Another finding concerned the self-confrontation indices of participant types.
Participants belonging to Types 1 (Progressive), 2 (Low-stable) and 3 (High-stable),
together comprising 84% of the sample, showed on average more self-enhancement and
positive affect for their Australian valuations than for their country-of-origin valuations.
Type 4 (Regressive), comprising 16% of the sample, was the only group not to
benefit in this way: not only did they experience less self-enhancement and union-with-
the-other motives but their well-being declined as a result of reduced positive affect and
increased negative affect. Interestingly, for Types 1, 2 and 3 the self-enhancement
motive (S) was significantly higher for Australia than for country of origin but the
union-with-the-other motive (O) was not significantly different.
A third finding concerned differences in psychological distress and well-being. As
measured by SAD, Type 1 (Progressive) participants were in general less socially
anxious than the other types, though the difference from Type 4 (Regressive) was of
borderline significance due to the smallness of the sample. As measured by FNE, Type
2 (Low-stable) participants were more fearful of negative evaluation than Type 3 (High-
stable). Again, the smallness of the sample appears to have prevented significance
differences being found where otherwise they would have been expected: between, say,

179
Type 1 (Progressive) and Type 4 (Regressive). Lastly, no significant differences were
found between participant types on depression as measured by BDI-II.
Turning now to psychological well-being, significant differences were found in
one of these: Positive relations with others. Type 4 (Regressive) participants had
significantly worse ‘relations with others’ than did Type 1 (Progressive) and Type 3
(High-stable). Type 2 (Low-stable) participants on average rated above Type 4
(Regressive) and below Type 1 (Progressive) and Type 3 (High-stable), but the
differences were non-significant.
In conclusion, this chapter documents the first of three studies performed as part
of thesis. Like the second study, which is discussed next, it is nomothetic in nature, but
differs from it in the way the data were organised at the case level.
180
CHAPTER 7: Study 2 – The Dialogical Self as a Probability Distribution
This chapter discusses the second study conducted as part of this thesis. (A
version of this material has appeared in the International Journal for Dialogical Science
(Sanchez-Rockliffe & Symons, 2010.) It characterises the dialogical self as a
hypothetical probability distribution of themes of valuations, wherein the self-
confrontation method is a technique for generating a sample of themes from which the
properties of this distribution can be inferred, as in standard sampling theory. Since the
dialogical self emerges from a probability distribution of valuation themes, a sampling
interpretation is a fruitful way to view this technique. It was in this context that
hypotheses concerning stability of the self were developed and formally tested.
Study 2 corroborated Study 1 in a broad sense. Unlike Study 1, which used cluster
analysis to group individuals, Study 2 classified them by comparing their valuations in
their country of origin and Australia. But despite the difference in analytical approach,
Study 2 also found differences in migration experience that in key ways resembled
those of Study 1. In particular, both studies identified broadly similar patterns of
stability and change in I-positions.
7.1 The Dialogical Self as a Probability Distribution of Themes
This section presents a conceptual model of the dialogical self that is grounded in
statistical sampling theory. Such an approach is uniquely appropriate because the
dialogical self is by nature not one thing but many, and so demands measurement
methods that recognise the fact. Unlike most psychological variables, which describe a
single characteristic of the individual, the dialogical self describes a multitude of semi-
autonomous selves and their inter-relationships (Hermans & Kempen, 1993; Hermans &
Hermans-Jansen, 1995). In this sense, therefore, it is more like a community than an
181
individual. Communities are conveniently described not by considering a single
member but by considering a sample and expressing the results as frequency
distributions and correlations. This approach makes clear the basis by which statistically
testable hypotheses are generated.
In this model, every individual can generate a potentially infinite number of
valuations, and it is through these valuations that the individual’s dialogical self is
expressed. Each valuation furthermore has a “theme”, by which is meant its vector of S,
O, P, N variables as measured by the SCM. It follows therefore that the dialogical self is
described by a hypothetical multidimensional probability distribution of valuation
themes.
Graphical representation. Figure 7.1 shows the probability distribution of
themes for a hypothetical individual. Each point on the horizontal plane denotes a
particular theme, and the height of the graphical surface at each point represents the
probability with which the individual will generate valuations having that theme.
Alternatively the figure can be regarded as showing the relative proportion of themes in
the total set of valuations. The distribution of themes, considered as a complex but well-
defined mathematical entity, is thus a characteristic of the dialogical self. As with any
model, it is a simplification—for instance it does not capture inter-relationships between
I-positions—but it does provide an objective and useful description of the dialogical self
by conveying the relative weight of various themes in the life of the individual.
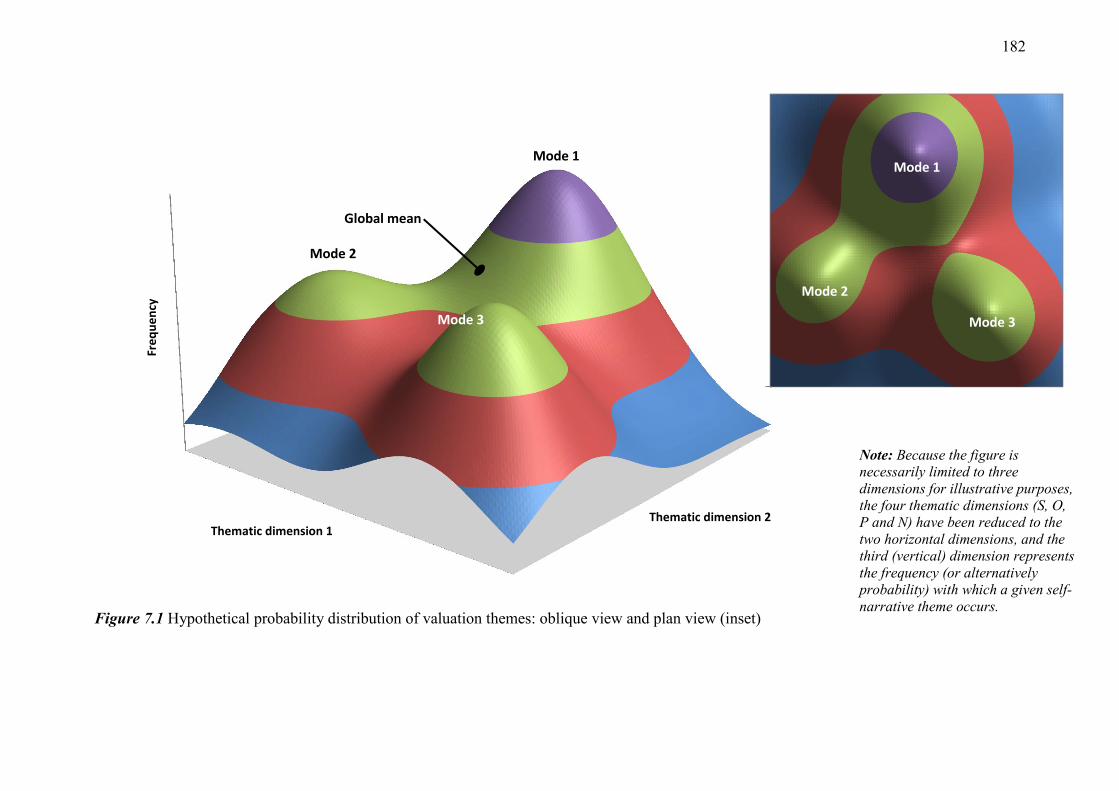
182
Figure 7.1 Hypothetical probability distribution of valuation themes: oblique view and plan view (inset)
Thematic dimension 2
Fre
qu
en
cy
Thematic dimension 1
Global mean
Mode 1
Mode 3
Mode 2
Mode 3
Mode 2
Mode 1
Note: Because the figure is
necessarily limited to three
dimensions for illustrative purposes,
the four thematic dimensions (S, O,
P and N) have been reduced to the
two horizontal dimensions, and the
third (vertical) dimension represents
the frequency (or alternatively
probability) with which a given self-
narrative theme occurs.
183
The properties of the distribution need to be inferred from a sample of valuation
themes. This sample is provided by the SCM: participants generate a sample of
valuations, which are then scored to establish their themes. The modes of the
distribution are of particular interest as they correspond to recurrent themes in
valuations. For a multi-modal distribution, the mean is less informative than the modes.
It is, however, easy to calculate, and the average thematic value of a set of valuations is
clearly a useful statistic. In general, inferring the detailed structure of a multivariate,
multimodal probability distribution is difficult with modest sample sizes, as here. Hence
a variety of ad hoc procedures are employed in the current research to study these
distributions.
I-positions. The I-position is conceived of as the hypothetical author of a
valuation. This study focuses on the themes of valuations, as it is these that are directly
measurable. Participants were required to perceive themselves as having two separate
cultural identities—that is, they should think of themselves as having achieved bi-
cultural identification, one identity belonging to their country of origin and the other
identity belonging to Australia. Later, in the SCM, participants were invited to focus
first on their cultural identity of their country of origin, then on their cultural identity in
Australia, and to tell about important experiences and circumstances from these
particular perspectives.
Thematic modes. Themes that regularly occur in valuations are of particular
interest, as they reflect psychological invariance over I-positions. These valuations will
be revealed as modes of the probability distribution of themes (see Figure 6.18). In a
sample of valuations, clusters of roughly similar theme appear as modes. Strongly
recurrent themes will tend to produce larger clusters and thus larger hills around the
184
mode. Figure 7.1 is drawn with three modes. In this case three sets of similar themes
would tend to re-occur in the valuations of the particular individual.
Themes and migration. This section explores what happens to the distribution of
themes when a person experiences a dramatic change in life circumstances, as for
example occurs after migration. A requirement of the study was that participants
acknowledge both an Australian identity and a continued identity associated with the
country of origin. This implies that living as a migrant brings into being new I-
positions. However, it may be that these new I-positions are thematically similar to
corresponding I-positions in the country of origin, at least in some cases. For instance,
the themes of domestic I-positions (I-as-parent, I-as-spouse etc.) might change little in a
migrant who brings his or her family, but those for work I-positions might change
greatly. The probability surface would then shift, more in some places than others. The
study gauged the extent to which migration changed the thematic distribution for this
sample.
7.2 Hypotheses
The aim of Study 2 was to explore how the dialogical self is affected by a radical
change in the social environment, in particular by migration to a new country. However,
since the temporal stability of the self is one of its abiding characteristics (James, 1890),
an explanation is required as to how such change might occur. According to Hermans
(1987a, b, 1988, 1992), valuations have both latent and manifest content. The latent
content is represented by the S and O motives; the manifest, by the P and N affects. In
this theoretical framework, the S and O motives represent deep psychological drives; the
P and N affects represent the extent to which these motives are gratified in a particular
social environment, and hence manifest as affects.
185
For an individual placed in two different environments, one can therefore consider
four possibilities.
Hypothesis 1: Latents constant, manifests constant. This is the case of complete
thematic stability. It would occur when the individual’s fundamental motives are
constant and each environment offers an equivalent opportunity for gratification.
Hypothesis 2: Latents constant, manifests change. This is perhaps the most natural
case. The new environment offers different possibilities for gratification but the
individual’s fundamental motives remain the same.
Hypothesis 3: Latents change, manifests constant. This could arise from
psychological development over the life cycle. As an individual progresses through life,
it is natural to expect fundamental motives to change. This may not be accompanied by
affective change.
Hypothesis 4: Latents change, manifests change. In this case the fundamental
motives of the individual change, as does the extent of gratification. This could come
about if the new environment creates new I-positions on the one hand, or simply for
developmental reasons on the other.
7.3 Analysis Based on Major Themes
Two similar but comparable analyses were performed in Study 2. In the first
analysis, participants were grouped on the basis of the profiles of major themes
manifested by their valuations. This was done separately for valuations pertaining to the
country of origin and to Australia. A transition matrix was then generated to determine
which participants were in the same group for both sets of valuations, and which
participants changed groups. Formal tests of statistical significance were then performed
on the transition matrices to test the null hypothesis that participants remained in the
same groupings, that is, that migration produced no significant change in I-position.

186
Thematic nature of I-positions. In Study 1, valuations (and hence participants)
have been characterised in terms of self-confrontation indices. In this study, valuations
were classified according to the six “major themes” defined by Hermans and Hermans-
Jansen (1995) rather than by indices. The rules for classifying valuations are set out in
Table 7.1 and are largely those used by Hermans and Hermans-Jansen (1995, p.254). As
some latitude is permitted, however, the definitions of “high” or “low” self-
enhancement and union-with-the-other were set at 17 and 4 respectively for this study.
This typology is not exhaustive, as valuations can fail to meet the criteria for inclusion
under any of the major themes; by setting the rules in this way, the 1565 valuations
obtained from all migrants were reduced a more manageable 570. The analysis was
based on these.
Table 7.1 Rules for assigning valuations to major themes
Major theme
Criteria for assignment
P – N S – O S O
Strength and unity (+HH) ≥ 12 … > 17 > 17
Unity and love (+O) ≥ 12 ≤ –6 … …
Unfulfilled longing (–O) ≤ –12 ≤ –6 … …
Powerlessness and isolation (–LL) ≤ –12 … < 4 < 4
Aggression and anger (–S) ≤ –12 ≥ 6 … …
Autonomy and success (+S) ≥ 12 ≥ 6 … …
Key: S = Self-enhancement; O = Union-with-the-other; P = Positive affect; N = Negative affect.
Participant types were characterised by the major themes that their valuations
revealed, yielding a thematic profile of each type. Table 7.2 tabulates those valuations
by participant type, by I-position location (that is, country of origin or Australia), and by
major theme. Each row represents the profile of the stipulated I-position of each
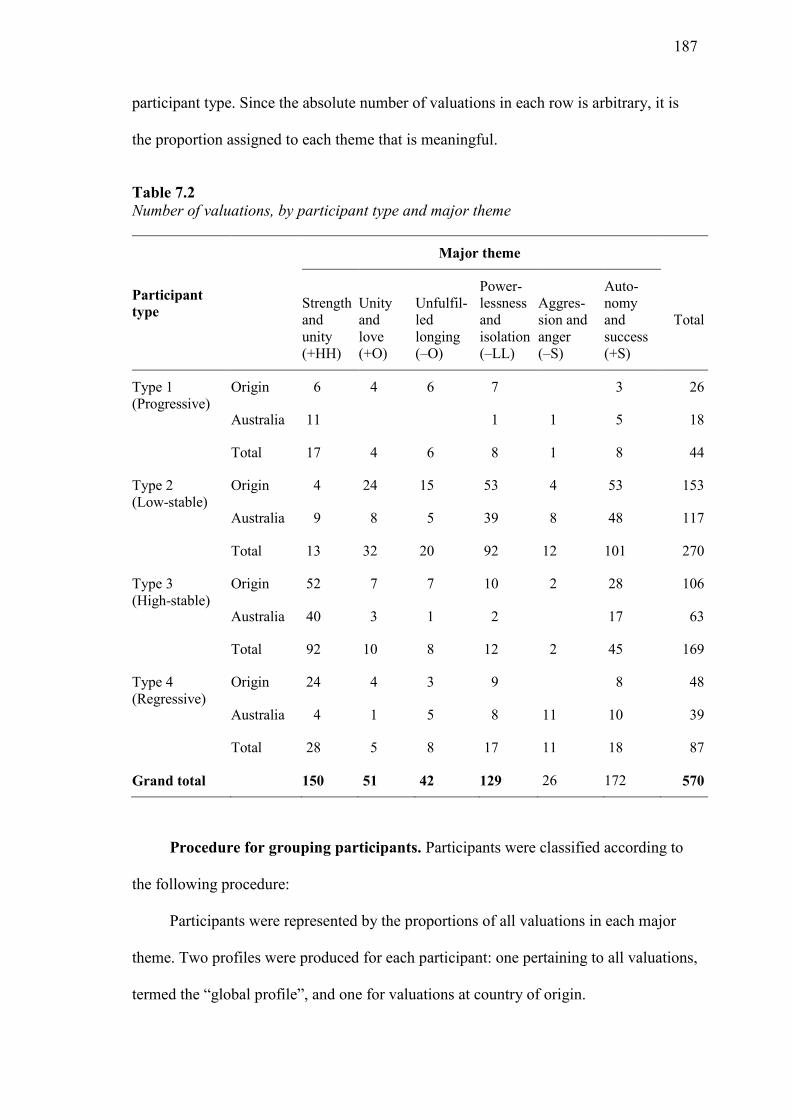
187
participant type. Since the absolute number of valuations in each row is arbitrary, it is
the proportion assigned to each theme that is meaningful.
Table 7.2 Number of valuations, by participant type and major theme
Participant
type
Major theme
Strength
and
unity
(+HH)
Unity
and
love
(+O)
Unfulfil-
led
longing
(–O)
Power-
lessness
and
isolation
(–LL)
Aggres-
sion and
anger
(–S)
Auto-
nomy
and
success
(+S)
Total
Type 1
(Progressive)
Origin 6 4 6 7 3 26
Australia 11 1 1 5 18
Total 17 4 6 8 1 8 44
Type 2
(Low-stable)
Origin 4 24 15 53 4 53 153
Australia 9 8 5 39 8 48 117
Total 13 32 20 92 12 101 270
Type 3
(High-stable)
Origin 52 7 7 10 2 28 106
Australia 40 3 1 2 17 63
Total 92 10 8 12 2 45 169
Type 4
(Regressive)
Origin 24 4 3 9 8 48
Australia 4 1 5 8 11 10 39
Total 28 5 8 17 11 18 87
Grand total 150 51 42 129 26 172 570
Procedure for grouping participants. Participants were classified according to
the following procedure:
Participants were represented by the proportions of all valuations in each major
theme. Two profiles were produced for each participant: one pertaining to all valuations,
termed the “global profile”, and one for valuations at country of origin.

188
Proportions were regarded as “important” if they were 20% or more of the total
number of valuations; otherwise they were regarded as unimportant.
Participants were assigned to a common group if they had important proportions
in precisely the same categories.
For this purpose, an important proportion in strength and unity (+HH) was
regarded as equivalent to important proportions in both autonomy and success (+S) and
unity and love (+O).
Likewise, an important proportion in powerlessness and isolation (–LL) was
regarded as equivalent to important proportions in both aggression and anger (–S) and
unfulfilled longing (–O).
Table 7.3 shows the resulting classification (names of participants in this table and
subsequently were changed to preserve anonymity). Each row of the table gives the
proportion of each participant’s valuations expressing each major theme. Proportions
pertaining “important” major themes are bolded and underlined. The resulting vector of
proportions is termed the participant’s “thematic profile”.
Ideally the country-of-origin profile for each participant would have been
compared with the corresponding Australian one. This was not done because some
participants had too few Australian valuations with major themes (two or fewer) to
render comparison meaningful; they would have had to be dropped from the sample. By
comparing the country-of-origin profile with the global profile the problem was
mitigated, but at the cost of creating another one: the null hypothesis was now harder to
reject since the global profile was contaminated with country-of-origin valuations. In
the event this did not matter as this null was still rejected, for rejection of the one
hypothesis entails rejection of the other. Under this approach only nine of the 38 in the
sample needed to be dropped, limiting the test sample to 29.

189
On the basis of this table, participants were classified into two groups: “univalent”
and “multivalent”. Univalent participants are those who expressed only a single affect,
either positive or negative (but not both) in their valuations. Multivalent participants
were those who expressed a mix of both positive and negative affects. The distinction is
crucial as it is the basis for determining the stability of thematic profiles. Multivalent
participants are of particular interest because they have unambiguously multimodal
major themes and hence exhibit instability in their thematic profiles. These individuals
are thus much in line with Hermans’ view of the dialogical self. It is noteworthy that
this instability is not merely an artefact of migrants’ differential states of mind at origin
and destination: of the 15 multivalent participants, 12 were multivalent at country of
origin.
Of the univalent respondents, one expressed only –O; three expressed both –S and
–O; six expressed only +S; and 13 expressed both +S and +O. Of the multivalent
respondents, three expressed a mix of most major themes (+S, +O, –S and –O), two
expressed +S but also –LL, two expressed +O but also –LL, one expressed +HH but
also –O, one expressed +HH but also –S, and six expressed +S but also –LL. The three
most common profiles are those whose valuations expressed only autonomy and success
(+S); those that expressed both motives (S and O), both with positive affect; and those
that expressed autonomy and success (+S), but combined with powerlessness and
isolation (–LL).
To judge whether country-of-origin profiles were importantly different from
global profiles, participants were subjectively classed as either “stable” or “unstable” on
the basis of the degree of difference between their respective profiles. Of the 29
participants classed in this way, 23 were considered stable and six unstable.
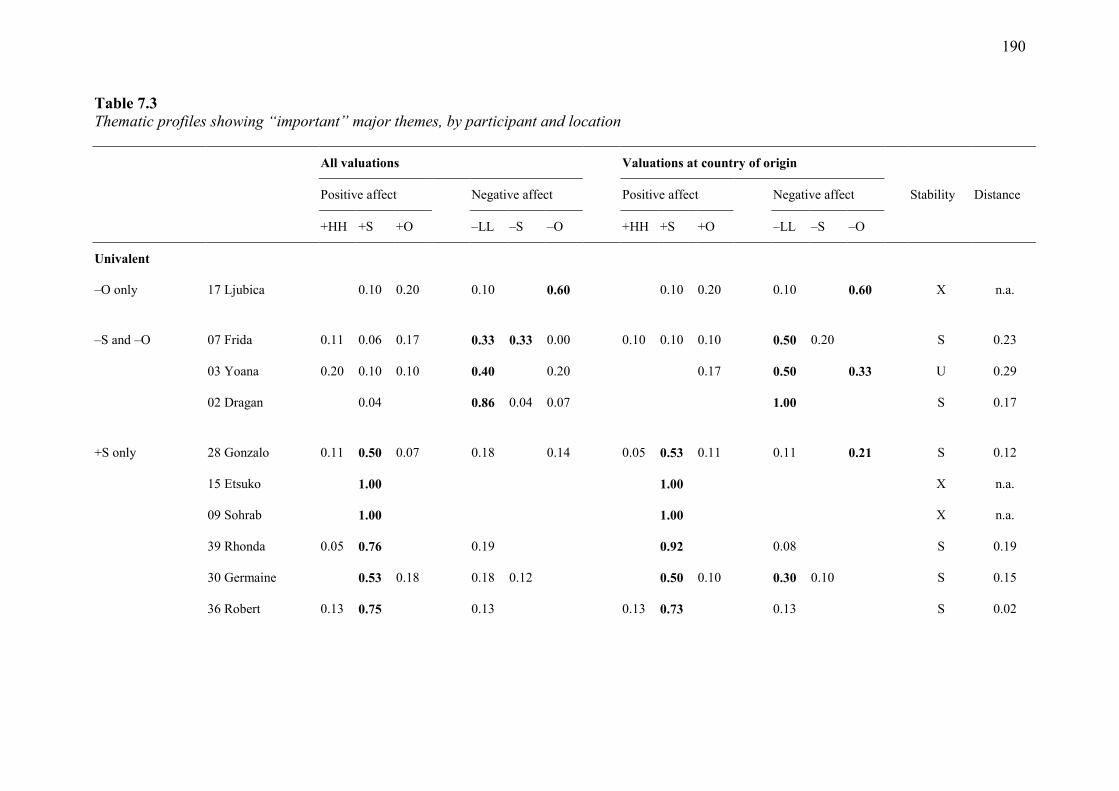
190
Table 7.3
Thematic profiles showing “important” major themes, by participant and location
All valuations
Valuations at country of origin
Positive affect Negative affect Positive affect Negative affect Stability Distance
+HH +S +O
–LL –S –O
+HH +S +O
–LL –S –O
Univalent
–O only 17 Ljubica
0.10 0.20
0.10
0.60
0.10 0.20
0.10
0.60
X n.a.
–S and –O 07 Frida 0.11 0.06 0.17
0.33 0.33 0.00
0.10 0.10 0.10
0.50 0.20
S 0.23
03 Yoana 0.20 0.10 0.10
0.40
0.20
0.17
0.50
0.33
U 0.29
02 Dragan
0.04
0.86 0.04 0.07
1.00
S 0.17
+S only 28 Gonzalo 0.11 0.50 0.07
0.18
0.14
0.05 0.53 0.11
0.11
0.21
S 0.12
15 Etsuko
1.00
1.00
X n.a.
09 Sohrab
1.00
1.00
X n.a.
39 Rhonda 0.05 0.76
0.19
0.92
0.08
S 0.19
30 Germaine
0.53 0.18
0.18 0.12
0.50 0.10
0.30 0.10
S 0.15
36 Robert 0.13 0.75
0.13
0.13 0.73
0.13
S 0.02
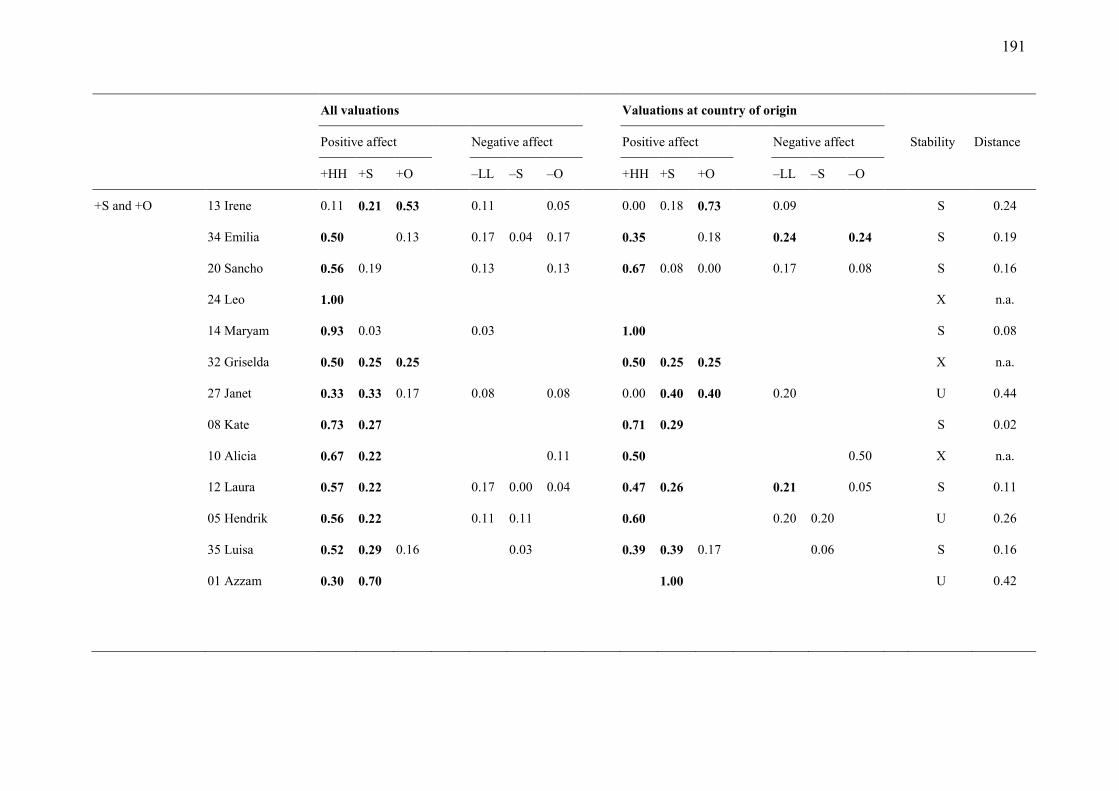
191
All valuations
Valuations at country of origin
Positive affect Negative affect Positive affect Negative affect Stability Distance
+HH +S +O
–LL –S –O
+HH +S +O
–LL –S –O
+S and +O 13 Irene 0.11 0.21 0.53
0.11
0.05
0.00 0.18 0.73
0.09
S 0.24
34 Emilia 0.50
0.13
0.17 0.04 0.17
0.35
0.18
0.24
0.24
S 0.19
20 Sancho 0.56 0.19
0.13
0.13
0.67 0.08 0.00
0.17
0.08
S 0.16
24 Leo 1.00
X n.a.
14 Maryam 0.93 0.03
0.03
1.00
S 0.08
32 Griselda 0.50 0.25 0.25
0.50 0.25 0.25
X n.a.
27 Janet 0.33 0.33 0.17
0.08
0.08
0.00 0.40 0.40
0.20
U 0.44
08 Kate 0.73 0.27
0.71 0.29
S 0.02
10 Alicia 0.67 0.22
0.11
0.50
0.50
X n.a.
12 Laura 0.57 0.22
0.17 0.00 0.04
0.47 0.26
0.21
0.05
S 0.11
05 Hendrik 0.56 0.22
0.11 0.11
0.60
0.20 0.20
U 0.26
35 Luisa 0.52 0.29 0.16
0.03
0.39 0.39 0.17
0.06
S 0.16
01 Azzam 0.30 0.70
1.00
U 0.42

192
All valuations
Valuations at country of origin
Positive affect Negative affect Positive affect Negative affect Stability Distance
+HH +S +O
–LL –S –O
+HH +S +O
–LL –S –O
Multivalent
S and O, and
both positive
and negative affect
19 Beatriz 0.25 0.31 0.13
0.25
0.06
0.29 0.29 0.14
0.29
S 0.09
23 Marta
0.50 0.25
0.25
0.50 0.50
X n.a.
18 Eva
0.50 0.25
0.25
0.50
0.50
X n.a.
+S and -LL 42 Keira
0.43 0.14
0.36
0.07
0.00 0.22 0.22
0.56
U 0.31
04 Nadine
0.33
0.67
1.00
X n.a.
+O and -LL 25 Nicole 0.06 0.11 0.28
0.50
0.06
0.10
0.40
0.40
0.10
S 0.20
06 Danilo 0.15 0.08 0.23
0.31 0.08 0.15
0.33
0.33 0.11 0.22
S 0.22
+HH and -O 33 Farid 0.31
0.15
0.15
0.38
0.27
0.09
0.18
0.45
S 0.10
+HH and -S 40 Carla 0.37 0.11
0.14 0.29 0.09
0.71 0.06
0.18
0.06
X 0.45
+S and -LL 26 Damon
0.78
0.22
0.67
0.33
S 0.16
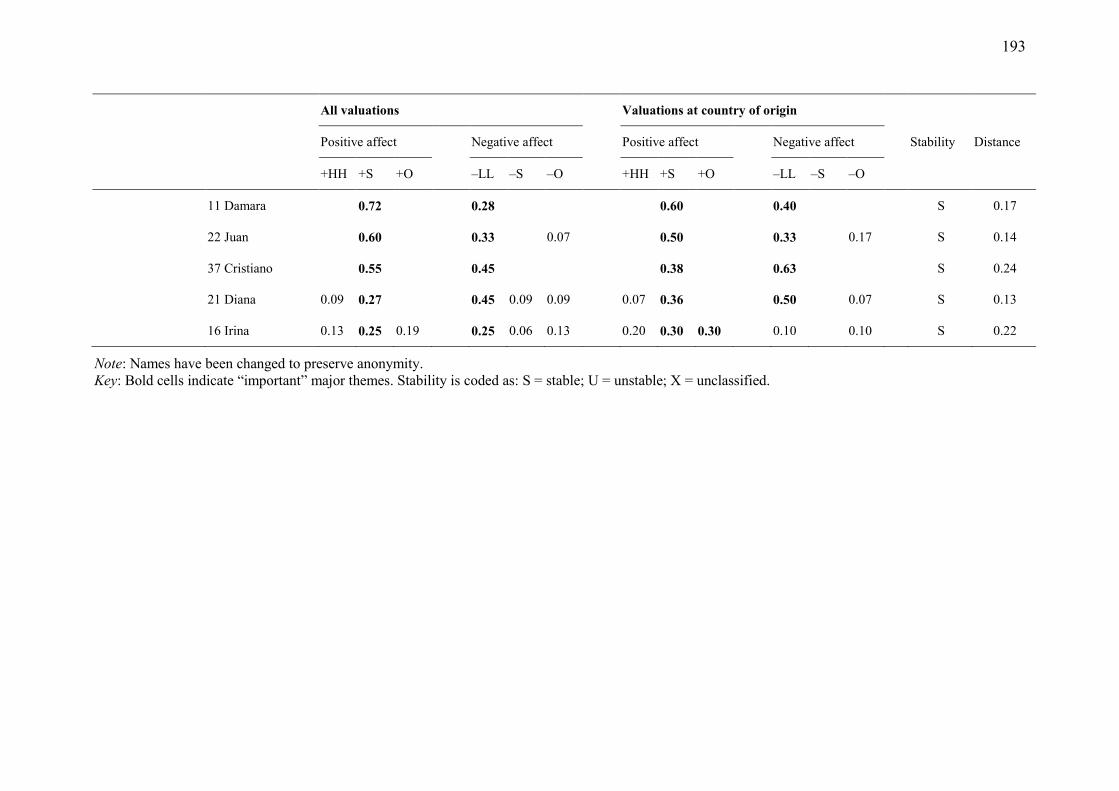
193
All valuations
Valuations at country of origin
Positive affect Negative affect Positive affect Negative affect Stability Distance
+HH +S +O
–LL –S –O
+HH +S +O
–LL –S –O
11 Damara
0.72
0.28
0.60
0.40
S 0.17
22 Juan
0.60
0.33
0.07
0.50
0.33
0.17
S 0.14
37 Cristiano
0.55
0.45
0.38
0.63
S 0.24
21 Diana 0.09 0.27
0.45 0.09 0.09
0.07 0.36
0.50
0.07
S 0.13
16 Irina 0.13 0.25 0.19
0.25 0.06 0.13
0.20 0.30 0.30
0.10
0.10
S 0.22
Note: Names have been changed to preserve anonymity.
Key: Bold cells indicate “important” major themes. Stability is coded as: S = stable; U = unstable; X = unclassified.

194
Tests of statistical significance. The null hypothesis was that thematic profiles
are stable as between country of origin and Australia. Tests of the null are based on the
differences between the profiles measured separately with respect to country of origin
and Australia. Due to occasional lack of classified data at origin or in Australia, five
participants in the sample of 38 were perforce dropped from the analysis. Table 7.4
reports averages, standard deviations, and t-statistics for the remaining 33, for the null
hypothesis that mean differences are zero.
For two-tailed tests, only –LL is significant at the 5% level: thus on average,
participants told fewer –LL valuations of Australia. It is, however, notable (though of
borderline significance) that they also told more +HH and +S valuations and fewer +O
valuations of Australia.
Table 7.4 Average differences in proportions of major themes
Major theme M SD t df p
Strength and unity (+HH) 0.08 0.27 1.80 32 0.081
Unity and love (+O) 0.09 0.27 1.92 32 0.064
Unfulfilled longing (–O) –0.05 0.21 –1.54 32 0.133
Powerlessness and isolation (–LL) –0.11 0.29 –2.33 32 0.026
Aggression and anger (–S) 0.03 0.13 1.59 32 0.122
Autonomy and success (+S) –0.04 0.16 –1.42 32 0.165
The question is whether the six average differences are jointly different from zero.
This requires a test of a mean, complicated by the fact that the mean is here a vector in
six dimensions. Such a test can be based on the statistic:
12 )/( NVT
195
where μ is the measured vector of means (of differences), V the covariance matrix
of the sample of differences, and N the sample-size.1
In computing this statistic, account must be taken of the fact that the underlying
variables are proportions that sum to unity. The resulting redundancy is solved by
arbitrarily eliminating one of the six categories: –O was chosen. If this is done the
statistic is distributed as a chi-square with five degrees of freedom under the null of no
differences in means (in large samples).
There is strong evidence against the hypothesis of complete stability of the
thematic profile, 2(5, N = 33) = 26.2, p < .002. In other words, for some individuals at
least, the themes of Australian valuations tended to differ significantly from those of
their country of origin valuations.
7.4 Analysis Based on Self-confrontation Indices
The second analysis of Study 2 resembled the first except that participants were
grouped on the basis of the self-confrontation indices of their valuations—whether
above or below the mean. As with in the first analysis, this was done separately for
valuations pertaining to the country of origin and to Australia. A transition matrix was
then generated to determine which participants were in the same group for both sets of
1 If the five selected variates were normally and independently distributed, this statistic would be the sum
of squares of the t-statistics in Table 3, which is chi-square with five degrees of freedom in large samples.
The presence of the term V/N in the formula is to correct for possible cross-tabulations between the
variates. This approach has the advantage that it follows on naturally from the t-tests. It is thus preferable
to a contingency table analysis, which would be in any case vitiated by low expected frequencies in many
cells.
196
valuations, and which participants changed groups. Formal tests of statistical
significance were then performed on the transition matrices to test the null hypothesis
that participants remained in the same groupings, that is, that migration produced no
significant change in I-position.
Procedure for grouping participants. The preceding analysis was based on
Hermans’ typology of valuation themes. His classification has the advantage of clinical
experience but results in large attrition of valuations since only about one third of
valuations are so classified; diagnostic certainty is gained at the cost of potential loss of
information. The following analysis therefore considers the full set of valuations. A
typology of participants exploiting the full set is required. To reduce dimensionality,
positive and negative affect indices are represented by a single index, well-being (see
Chapter 4).
Next, a version of Hermans’ typology is constructed from each participant’s
average score on the three indices S, O and W, both at country of origin and in Australia.
An index value is considered high (or low) if it is higher (or lower) than the full sample
mean in the country of origin. This gives an eight-way classification of individuals at
the origin and in Australia. Using this typology it is possible to construct an 8 × 8
transition matrix to compare the themes expressed by migrants concerning the country
of origin and Australia. This procedure extends the Hermans classification of valuations
to a classification of individuals.
Note that under this typology it is possible for an individual to score low on S and
O and high on W, as well as high on S and O and low on W. Such cases are ignored in
the Hermans approach but the proposed classification procedure throws up a few
examples, termed +E and –E, respectively. The transition matrix is given in Table 7.5.
Row-totals and column-totals give the numbers of participants classified in each of the
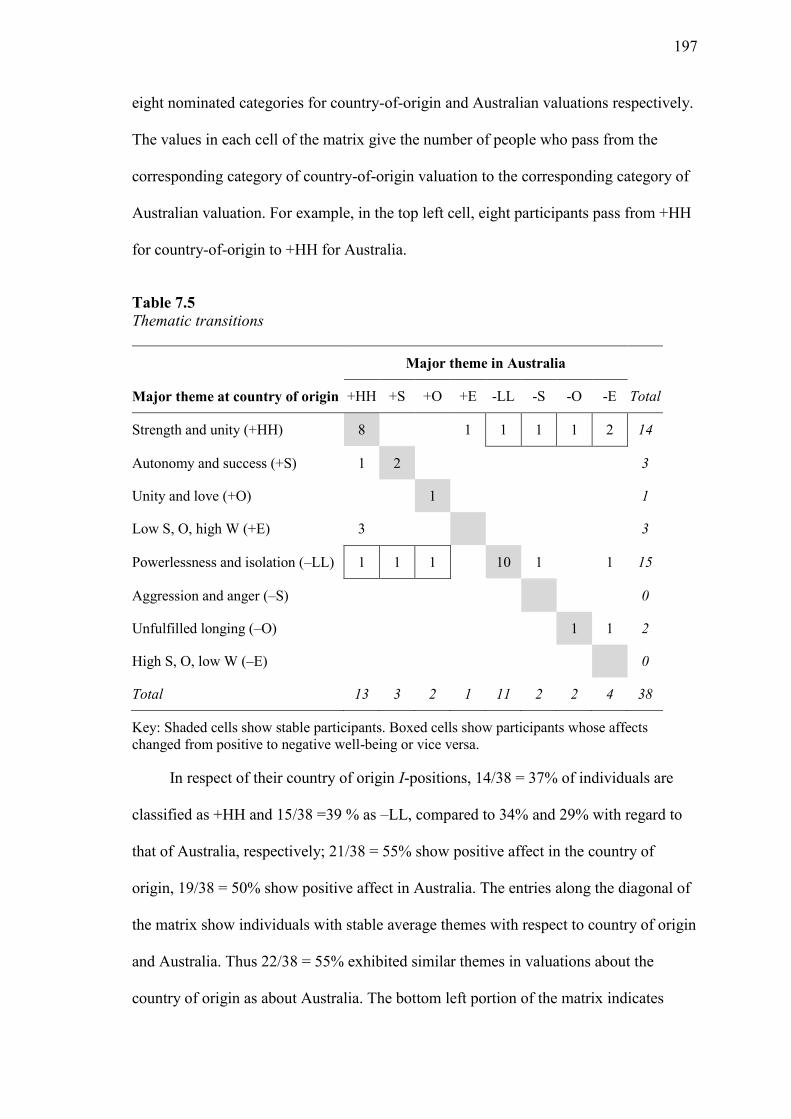
197
eight nominated categories for country-of-origin and Australian valuations respectively.
The values in each cell of the matrix give the number of people who pass from the
corresponding category of country-of-origin valuation to the corresponding category of
Australian valuation. For example, in the top left cell, eight participants pass from +HH
for country-of-origin to +HH for Australia.
Table 7.5
Thematic transitions
Major theme in Australia
Major theme at country of origin +HH +S +O +E -LL -S -O -E Total
Strength and unity (+HH) 8
1 1 1 1 2 14
Autonomy and success (+S) 1 2
3
Unity and love (+O)
1
1
Low S, O, high W (+E) 3
3
Powerlessness and isolation (–LL) 1 1 1
10 1
1 15
Aggression and anger (–S)
0
Unfulfilled longing (–O)
1 1 2
High S, O, low W (–E)
0
Total 13 3 2 1 11 2 2 4 38
Key: Shaded cells show stable participants. Boxed cells show participants whose affects
changed from positive to negative well-being or vice versa.
In respect of their country of origin I-positions, 14/38 = 37% of individuals are
classified as +HH and 15/38 =39 % as –LL, compared to 34% and 29% with regard to
that of Australia, respectively; 21/38 = 55% show positive affect in the country of
origin, 19/38 = 50% show positive affect in Australia. The entries along the diagonal of
the matrix show individuals with stable average themes with respect to country of origin
and Australia. Thus 22/38 = 55% exhibited similar themes in valuations about the
country of origin as about Australia. The bottom left portion of the matrix indicates
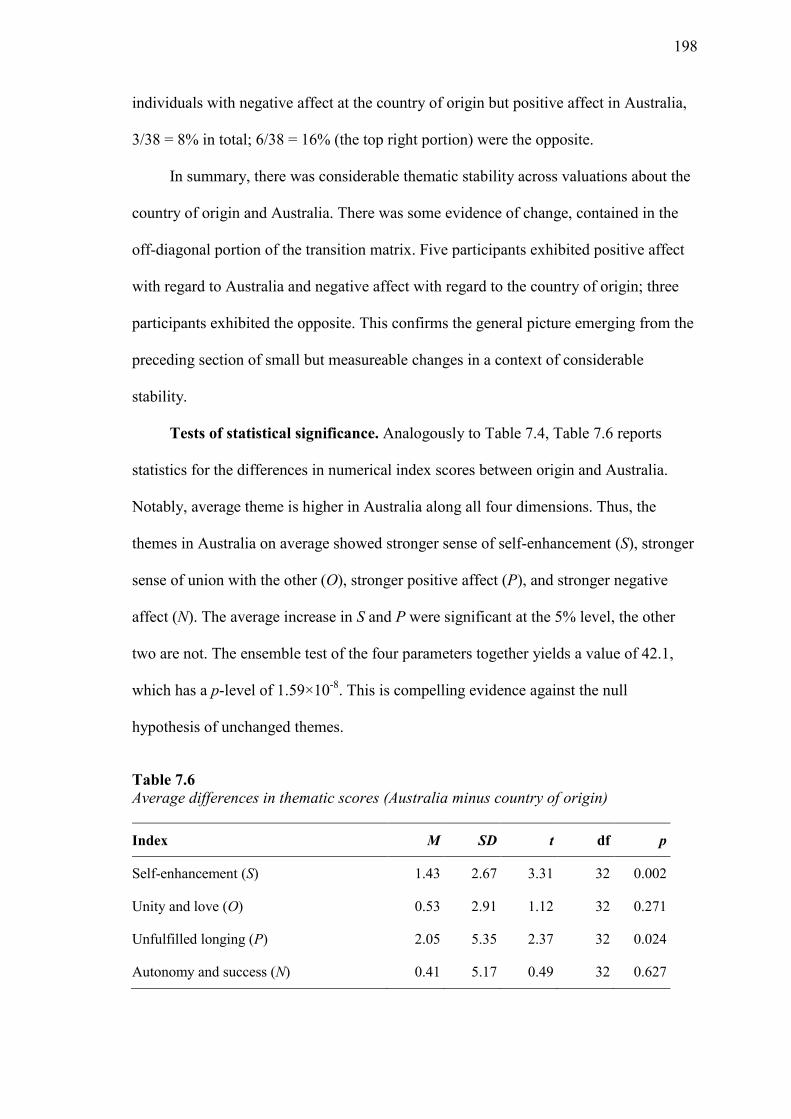
198
individuals with negative affect at the country of origin but positive affect in Australia,
3/38 = 8% in total; 6/38 = 16% (the top right portion) were the opposite.
In summary, there was considerable thematic stability across valuations about the
country of origin and Australia. There was some evidence of change, contained in the
off-diagonal portion of the transition matrix. Five participants exhibited positive affect
with regard to Australia and negative affect with regard to the country of origin; three
participants exhibited the opposite. This confirms the general picture emerging from the
preceding section of small but measureable changes in a context of considerable
stability.
Tests of statistical significance. Analogously to Table 7.4, Table 7.6 reports
statistics for the differences in numerical index scores between origin and Australia.
Notably, average theme is higher in Australia along all four dimensions. Thus, the
themes in Australia on average showed stronger sense of self-enhancement (S), stronger
sense of union with the other (O), stronger positive affect (P), and stronger negative
affect (N). The average increase in S and P were significant at the 5% level, the other
two are not. The ensemble test of the four parameters together yields a value of 42.1,
which has a p-level of 1.59×10⁻⁸
. This is compelling evidence against the null
hypothesis of unchanged themes.
Table 7.6
Average differences in thematic scores (Australia minus country of origin)
Index M SD t df p
Self-enhancement (S) 1.43 2.67 3.31 32 0.002
Unity and love (O) 0.53 2.91 1.12 32 0.271
Unfulfilled longing (P) 2.05 5.35 2.37 32 0.024
Autonomy and success (N) 0.41 5.17 0.49 32 0.627
199
7.5 Summary
Two separate but comparable analyses were performed in Study 2. In both,
participants were grouped on the basis of the types of valuations they produced, though
according to different rules. One analysis grouped participants according to the
combinations of major themes manifested by their valuations; the other grouped them
according to the self-confrontation indices of their valuations. This was done separately
for valuations pertaining to the country of origin and to Australia. Transition matrices
were then produced to determine which participants were in the same group for both
sets of valuations, and which participants changed groups. Finally, tests of statistical
significance were performed on the transition matrices to test the null hypothesis that
participants remained in the same groupings, that is, that migration produced no
significant change in I-position.
There were two significant findings. Under both analyses, results were as
hypothesised: that is, I-positions were found to differ as between those pertaining to
country of origin and those pertaining to Australia. The other significant finding comes
from Analysis 1 and relates to locational differences in the major themes of valuations.
On average, participants told significantly fewer –LL valuations for Australia than for
country of origin.
In conclusion, this chapter documents the second of three studies performed as
part of thesis. Like the second study, which was discussed in the preceding chapter, it is
nomothetic in nature, but differs from it in the way the data were organised at the case
level. The third study, which is discussed next, was idiographic, analysing case studies
representing each of the participant types identified by the first study.

200
CHAPTER 8: Study 3 – Case Studies
In Study 3, an idiographic approach was adopted to complement the nomothetic
approach of Studies 1 and 2. Four case studies are discussed, one of each migrant type:
Progressive, Low-stable High-stable, and Regressive. The aim was to exemplify and
corroborate the nomothetic principles previously identified. The idiographic analyses in
this chapter furnish a more complete understanding of the individual than do the
nomothetic analyses of the preceding two chapters.
The chapter begins with a discussion of the Euclidean distance between each
participant’s valuation profiles pertaining to country of origin and to Australia. This
assisted in the selection of case studies by showing how they are positioned in relation
to other study participants. By comparing and contrasting pairs of valuations, one from
country of origin and the other from Australia, the case studies illustrate how I-positions
differed, or conversely were stable, between the two locations. Importantly, the case
studies demonstrate at an individual level that while most migrants are stable in terms of
their I-positions, a minority are not.
8.1 Euclidean distance
An objective corroboration of stability of the self was provided by the Euclidean
distance between valuation profiles, defined as the square root of the sum of squared
differences between them (Deza & Deza, 2009). Figures 7.1 and 7.2 both rank
participants by Euclidean distance, shown by the length of the bars along the horizontal
axis. The figures differ in that Figure 8.1 uses self-confrontation indices as the measure
of Euclidean difference, while Figure 8.2 uses major themes. The dark blue and orange
bars in both charts denote participant Type 1 Progressive and Type 4 Regressive, that is,
the two migrant types that exhibited most instability in I-position.

201
An interesting, but unsurprising, finding is that participants of the unstable
types—that is, Types 1 and 4—also tended to exhibit the greatest Euclidean distance
between their profiles for country of origin and Australia. The tendency is more
pronounced in Figure 8.1 than 7.2 because the former is based on self-confrontation
indices, which were directly used to derive the participant types, while the latter is based
on major themes, which are only indirectly linked to self-confrontation indices, and
thence to major themes.
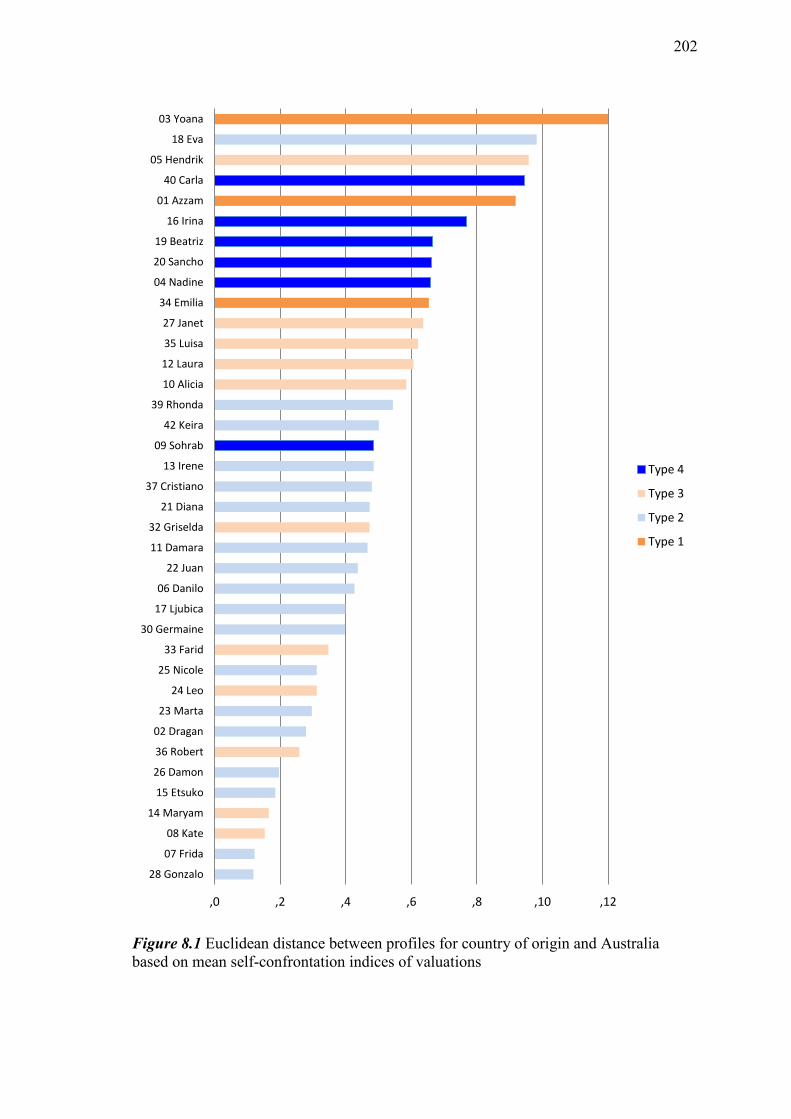
202
Figure 8.1 Euclidean distance between profiles for country of origin and Australia
based on mean self-confrontation indices of valuations
,0 ,2 ,4 ,6 ,8 ,10 ,12
28 Gonzalo
07 Frida
08 Kate
14 Maryam
15 Etsuko
26 Damon
36 Robert
02 Dragan
23 Marta
24 Leo
25 Nicole
33 Farid
30 Germaine
17 Ljubica
06 Danilo
22 Juan
11 Damara
32 Griselda
21 Diana
37 Cristiano
13 Irene
09 Sohrab
42 Keira
39 Rhonda
10 Alicia
12 Laura
35 Luisa
27 Janet
34 Emilia
04 Nadine
20 Sancho
19 Beatriz
16 Irina
01 Azzam
40 Carla
05 Hendrik
18 Eva
03 Yoana
Type 4
Type 3
Type 2
Type 1

203
Figure 8.2 Euclidean distance between profiles for country of origin and Australia
based on proportions of major themes of valuations
,0.0 ,0.2 ,0.4 ,0.6 ,0.8 ,1.0
08 Kate
36 Robert
19 Beatriz
22 Juan
11 Damara
02 Dragan
14 Maryam
30 Germaine
21 Diana
28 Gonzalo
35 Luisa
39 Rhonda
25 Nicole
26 Damon
07 Frida
13 Irene
05 Hendrik
16 Irina
01 Azzam
10 Alicia
12 Laura
20 Sancho
34 Emilia
33 Farid
06 Danilo
18 Eva
23 Marta
04 Nadine
03 Yoana
27 Janet
42 Keira
40 Carla
37 Cristiano
Type 4
Type 3
Type 2
Type 1
204
8.2 Case study: The ‘Progressive’ Migrant (Type 1)
Yoana (this and other names are pseudonyms) is representative of the Progressive
migrant type. She is a Colombian who came to Australia at 23. At the time of the
interview she was married with two young children, a girl and a boy, both still in
primary school. Although she had obtained a degree in journalism in her native country,
she was not working at the time of the interview and she listed her occupation as “house
duties”. Two key points come across from her valuations about her youth in Colombia.
Her parents divorced when she was seven and she felt abandoned by her much-admired
father, as well as sympathy for her mother’s predicament. This sense of abandonment
was compounded when her sister migrated to Spain. The second theme concerns her
distress at the quality of life in Colombia, which she perceives as “a world full of
materialism, alcohol, sex, drugs, violence, etc.” In Australia she has made a happy
marriage. Her valuations emphasise her devotion to her children. She is a convert to the
Baha’i religion and aspires to “a very pure and spiritual life”.
Yoana’s measures of psychological distress and well-being corroborate this
picture of a determined and caring person who does not let adversity get the better of
her. At the time of the interview she was confident in social situations (SAD = 1, cf.
sample mean of 8.4); had little concern at giving a negative impression to others (FNE =
1, cf. sample mean of 13.3); and was not depressed with respect to the sample mean
(BDI-II = 10, cf. sample mean of 9.1). Her psychological well-being was above average
on all subscales except ‘Purpose in life’, where she was slightly below (62 cf. sample
mean of 66.1).
Major themes. Figure 8.3 shows the mean thematic profile of Type 1 participants
(Panel 1) and for Yoana, the case-study selected to exemplify them (Panel 2). The mean
profile of valuations of Type 1 participants differed significantly according to whether

205
they pertained to country of origin or Australia, χ2(5, N = 44) = 16.56, p < .01 (two-
tailed). Valuations located in country of origin were high on the themes of Unfulfilled
longing and Powerlessness and isolation, but those in Australia were high on the
themes of Strength and unity and Autonomy and success.
Yoana’s thematic profiles correlated highly with the mean profiles of Type 1
participants both for country of origin ( r = .67) and for Australian valuations (r = .90),
indicating that she is representative of the Progressive migrant type.

206
Panel 1 All Progressive migrants
Panel 2 Yoana
Figure 8.3 Proportion of valuations, by major theme and location: Progressive migrants
and Yoana
0%
10%
20%
30%
40%
50%
Strength and unity
Unity and love
Unfulfilled longing
Powerlessness and isolation
Aggression and anger
Autonomy and success
Origin
Australia
0%
10%
20%
30%
40%
50%
Strength and unity
Unity and love
Unfulfilled longing
Powerlessness and isolation
Aggression and anger
Autonomy and success
Origin
Australia
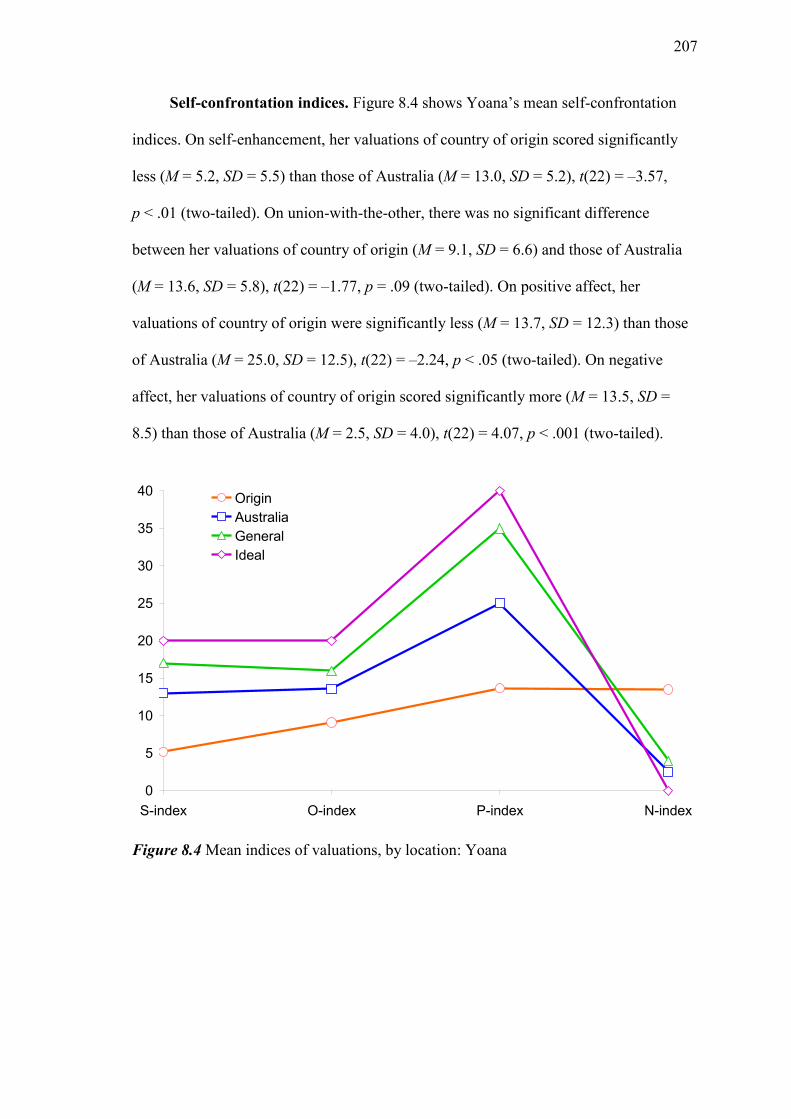
207
Self-confrontation indices. Figure 8.4 shows Yoana’s mean self-confrontation
indices. On self-enhancement, her valuations of country of origin scored significantly
less (M = 5.2, SD = 5.5) than those of Australia (M = 13.0, SD = 5.2), t(22) = –3.57,
p < .01 (two-tailed). On union-with-the-other, there was no significant difference
between her valuations of country of origin (M = 9.1, SD = 6.6) and those of Australia
(M = 13.6, SD = 5.8), t(22) = –1.77, p = .09 (two-tailed). On positive affect, her
valuations of country of origin were significantly less (M = 13.7, SD = 12.3) than those
of Australia (M = 25.0, SD = 12.5), t(22) = –2.24, p < .05 (two-tailed). On negative
affect, her valuations of country of origin scored significantly more (M = 13.5, SD =
8.5) than those of Australia (M = 2.5, SD = 4.0), t(22) = 4.07, p < .001 (two-tailed).
Figure 8.4 Mean indices of valuations, by location: Yoana
0
5
10
15
20
25
30
35
40
S-index O-index P-index N-index
Origin
Australia
General
Ideal

208
Yoana is representative of the Type 1 (Progressive) migrant. According to Gergen
& Gergen (1986) a “progressive” narrative links events “in such a way that one steadily
progresses towards a goal” (p. 27). Corroboration of this is found in Figure 8.5, which
shows the temporal dimension of her self-confrontation indices.
Yoana’s S , O and P rise, and her N falls, in her future-oriented country-of-origin
valuations—a clear temporal progression. But no such temporal progression is observed
in her Australian valuations, which are at a uniformly high level. This suggests that
Yoana is basically affectively positive both about Australia (in all periods) and about
the future (in both locations). What makes her “progressive” is the fact that her past-
and present-oriented valuations are relatively affectively negative for her country of
origin but not for Australia.
Figure 8.5 Mean indices of valuations, by location and period: Yoana
0
5
10
15
20
25
30
35
Past Present Future Past Present Future
Origin Australia
S
O
P
N

209
Self-narrative. Yoana’s self-narrative is characterised by progression towards a
desired goal. She espouses the twin goals of mother and spiritual being. The following
contrasting valuations show how she is attaining these goals.
She has turned away from her own mother’s goal of focusing on her husband
(Yoana’s father) and instead focuses on her children:
Country of origin: “… my mother used to see my father as the centre of her
universe” (–LL).
Australia: “In my present existence the most important thing are my children …”
(+HH).
She has successfully repudiated the drinking culture of her country of origin:
Country of origin: “I look at alcohol as a destructive drug” (–O).
Australia: “I was so impressed by the fact that the youth were not drinking alcohol
…” (+HH).
... and has likewise decided to be a spiritual person, and has achieved that aim:
Country of origin: “I decided to live a very pure and spiritual life”.
Australia: “… I closed my eyes and I experience God” (+HH).
... and has successfully fought a familial tendency towards depression:
Country of origin and Australia: “Another influence has been my aunty who
suffered from depression when I was a little girl. When … I suffered my own
depression I decided never to be like her, therefore I had the strength to fight it
and overcome it” (–LL).
Yoana’s is a self-narrative of setting new and very different goals, and achieving
them—truly a progression to better things.
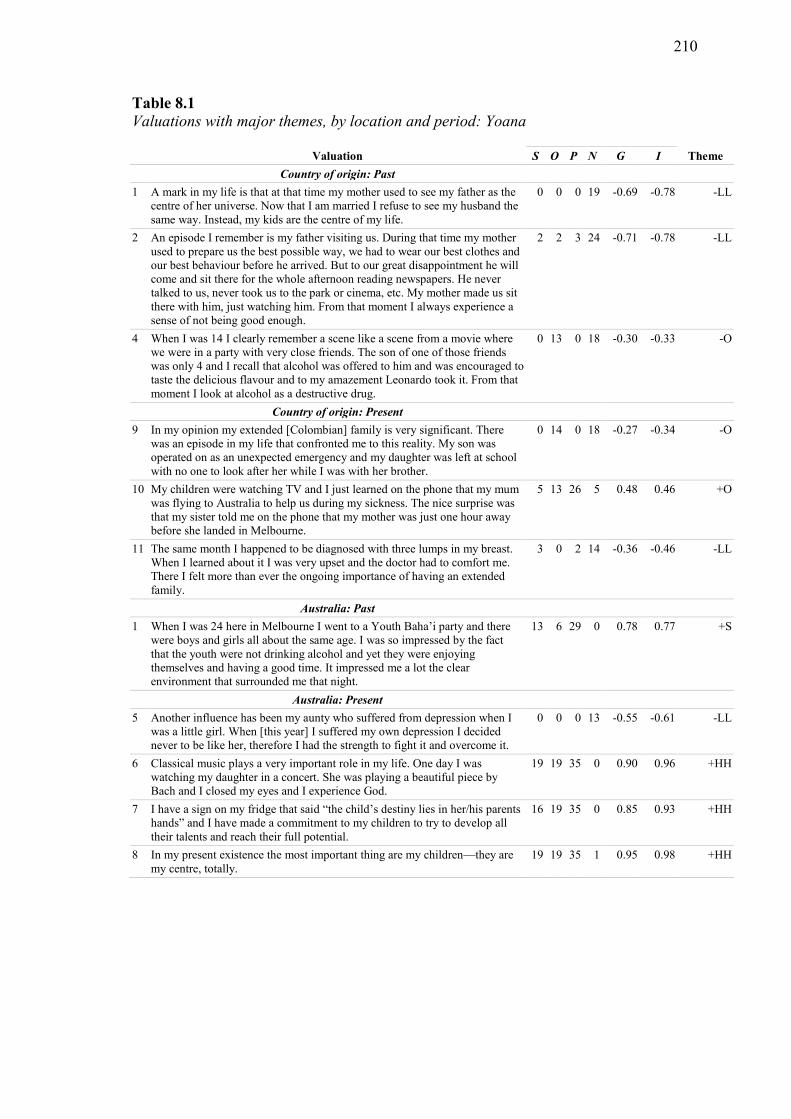
210
Table 8.1 Valuations with major themes, by location and period: Yoana
Valuation S O P N G I Theme
Country of origin: Past
1 A mark in my life is that at that time my mother used to see my father as the
centre of her universe. Now that I am married I refuse to see my husband the
same way. Instead, my kids are the centre of my life.
0 0 0 19 -0.69 -0.78 -LL
2 An episode I remember is my father visiting us. During that time my mother
used to prepare us the best possible way, we had to wear our best clothes and
our best behaviour before he arrived. But to our great disappointment he will
come and sit there for the whole afternoon reading newspapers. He never
talked to us, never took us to the park or cinema, etc. My mother made us sit
there with him, just watching him. From that moment I always experience a
sense of not being good enough.
2 2 3 24 -0.71 -0.78 -LL
4 When I was 14 I clearly remember a scene like a scene from a movie where
we were in a party with very close friends. The son of one of those friends
was only 4 and I recall that alcohol was offered to him and was encouraged to
taste the delicious flavour and to my amazement Leonardo took it. From that
moment I look at alcohol as a destructive drug.
0 13 0 18 -0.30 -0.33 -O
Country of origin: Present
9 In my opinion my extended [Colombian] family is very significant. There
was an episode in my life that confronted me to this reality. My son was
operated on as an unexpected emergency and my daughter was left at school
with no one to look after her while I was with her brother.
0 14 0 18 -0.27 -0.34 -O
10 My children were watching TV and I just learned on the phone that my mum
was flying to Australia to help us during my sickness. The nice surprise was
that my sister told me on the phone that my mother was just one hour away
before she landed in Melbourne.
5 13 26 5 0.48 0.46 +O
11 The same month I happened to be diagnosed with three lumps in my breast.
When I learned about it I was very upset and the doctor had to comfort me.
There I felt more than ever the ongoing importance of having an extended
family.
3 0 2 14 -0.36 -0.46 -LL
Australia: Past
1 When I was 24 here in Melbourne I went to a Youth Baha’i party and there
were boys and girls all about the same age. I was so impressed by the fact
that the youth were not drinking alcohol and yet they were enjoying
themselves and having a good time. It impressed me a lot the clear
environment that surrounded me that night.
13 6 29 0 0.78 0.77 +S
Australia: Present
5 Another influence has been my aunty who suffered from depression when I
was a little girl. When [this year] I suffered my own depression I decided
never to be like her, therefore I had the strength to fight it and overcome it.
0 0 0 13 -0.55 -0.61 -LL
6 Classical music plays a very important role in my life. One day I was
watching my daughter in a concert. She was playing a beautiful piece by
Bach and I closed my eyes and I experience God.
19 19 35 0 0.90 0.96 +HH
7 I have a sign on my fridge that said “the child’s destiny lies in her/his parents
hands” and I have made a commitment to my children to try to develop all
their talents and reach their full potential.
16 19 35 0 0.85 0.93 +HH
8 In my present existence the most important thing are my children—they are
my centre, totally.
19 19 35 1 0.95 0.98 +HH

211
8.3 Case study: The “Low-stable” Migrant (Type 2)
Juan is representative of the “Low stable” migrant type. He was born and brought
up in El Salvador and emigrated to Australia as a young adult. His childhood was in
some ways difficult. “[N]aïve and trusting” as a child, he nevertheless felt rejected by
his mother; and though his father was “fair”, he was also “inflexible”. Having “learned
to be with people who feel ambivalent about me”, he would “accept blame for
anything” and became obedient in order to please those around him. One salient event
he remarked on: his sister’s apparent suicide, for which he “admired” her. At school he
was “insecure”, “a loner” and “shy”, and his academic performance poor. Later he
would drop out of university in Australia and suffer an extended bout of depression. He
had married in El Salvador, but his marriage broke up in Australia. Having left El
Salvador to live in a “peaceful place”, has no desire to return. On the plus side, he is
“happy” in Australia and expresses guarded optimism about the future and what it
holds.
Juan’s measures of psychological distress and well-being complete the picture of
a well-adjusted person who accepts life as it comes. At the time of the interview he felt
confident in social situations (SAD = 2, cf. sample mean of 8.4); had little concern at
giving a negative impression to others (FNE = 2, cf. sample mean of 13.3); and was not
depressed (BDI-II = 0, cf. sample mean of 9.1). His psychological well-being was about
average on all subscales except Self-acceptance, where it was somewhat higher (PWB6
= 70, cf. sample mean of 64.6).
Major themes. Figure 8.6 shows the mean thematic profile of Type 2 participants
(Panel 1) and for Juan, the case-study selected to exemplify them (Panel 2). The mean
profile of valuations of Type 1 participants differed significantly, but only slightly,
between country of origin and Australia, χ2(5, N = 270) = 14.09, p = .015 (two-tailed).

212
Valuations located in country of origin were high on Autonomy and success,
Powerlessness and isolation, and Aggression and anger whereas those in Australia,
though still high on Autonomy and success and Powerlessness and isolation, were
higher on Aggression and anger and lower on Unity and love.
Juan’s thematic profiles correlated highly with the mean profiles of Type 2
participants both for country of origin ( r = .89) and for Australian valuations (r = .97),
indicating that he is representative of the Type 2 migrant type.

213
Panel 1 All Low-stable migrants
Panel 2 Juan
Figure 8.6 Proportion of valuations, by major theme and location: Type 2 participants
and Juan
0%
10%
20%
30%
40%
50%
Strength and unity
Unity and love
Unfulfilled longing
Powerlessness and isolation
Aggression and anger
Autonomy and success
Origin
Australia
0%
10%
20%
30%
40%
50%
Strength and unity
Unity and love
Unfulfilled longing
Powerlessness and isolation
Aggression and anger
Autonomy and success
Origin
Australia

214
Self-confrontation indices. Figure 8.7 shows Juan’s mean self-confrontation
indices. On self-enhancement, there was no significant difference between his
valuations of country of origin (M = 7.4, SD = 4.9) and those of Australia (M = 9.2, SD
= 5.2), t(33) = –1.07, p = .29 (two-tailed). On union-with-the-other, there was no
significant difference between his valuations of country of origin (M = 6.4, SD = 3.6)
and those of Australia (M = 4.8, SD = 3.2), t(34) = 1.36, p = .18 (two-tailed). On
positive affect, there was no significant difference between his valuations of country of
origin (M = 14.9.7, SD = 9.4) and those of Australia (M = 16.8, SD = 10.5), t(32) = –.58,
p = .57 (two-tailed). On negative affect, there was no significant difference between his
valuations of country of origin (M = 20.5, SD = 12.3) and those of Australia (M = 13.4,
SD = 11.5), t(34) = 1.79, p = .08 (two-tailed).
Figure 8.7 Mean indices of valuations, by location: Juan
0
5
10
15
20
25
30
35
40
S-index O-index P-index N-index
Origin
Australia
General
Ideal

215
Juan is representative of the Type 2, “Low stable” migrant type. According to
Gergen & Gergen (1986) a “stability” narrative links events “in such a way that the
protagonist remains essentially unchanged with respect to evaluative position” (p. 27).
Corroboration of this is found in Figure 8.8, which shows the temporal dimension of his
self-confrontation indices.
Juan’s self-confrontation indices show a slight temporal progression, which is,
however, unrelated to location. That is, his past-oriented valuations for country of origin
resemble his past-oriented valuations for Australia, and likewise for present- and future-
oriented valuations. This explains why his valuations appear to be stable when the
temporal dimension is ignored: they are stable with respect to location. Juan does show
a slight progression in a temporal sense—his future-oriented S and O are slightly higher,
and well-being (defined as P minus N) is substantially higher; but that progression is not
noticeably linked to the act of migration.
Figure 8.8 Mean indices of valuations, by location and period: Juan
0
5
10
15
20
25
30
35
Past Present Future Past Present Future
Origin Australia
S
O
P
N

216
Self-narrative. Juan’s self-narrative is characterised by stasis. He struggles; his is
not an easy life. The following paired valuations show this.
He was, and is, an outsider:
Country of origin: “At school I felt insecure. I was a loner …” (–LL).
Australia: “I felt that I did not belong to this society because people did not know
who I was”. “I felt that I did not belong even to the groups I was participating in
(e.g. University) (–LL).
His reaction to what to most people would be a life-changing event, is almost
laconic: his sister’s suicide did not even qualify for a major theme under his affective
rating. Later, in Australia, he suffers from occasional depression and a negative self-
image:
Country of origin: “When [my sister] apparently killed herself I admired her for
it.”
Australia: “I was very depressed and I had very low self-esteem.” (–LL).
But his life is not without its small victories. He is less shy now:
Country of origin: “I was shy and I learnt not to show off because I thought
people would not like me” (–LL).
Australia: “I am able to express my feelings and thoughts more easily now” (+S).
... and is learning, and relishing, some independence:
Country of origin: “I learnt from [my father] that rules were not to be bent or
broken” (–LL). “I learnt to accept blame for anything and to be obedient …”
Australia: “For the first time in my life I feel I am working for myself as an
individual” (+S).
… though apparently not enough to prevent his being classified as “Low-stable”.
Juan’s is a self-narrative of mental struggle and survival—stable, but
compromised by underachievement.
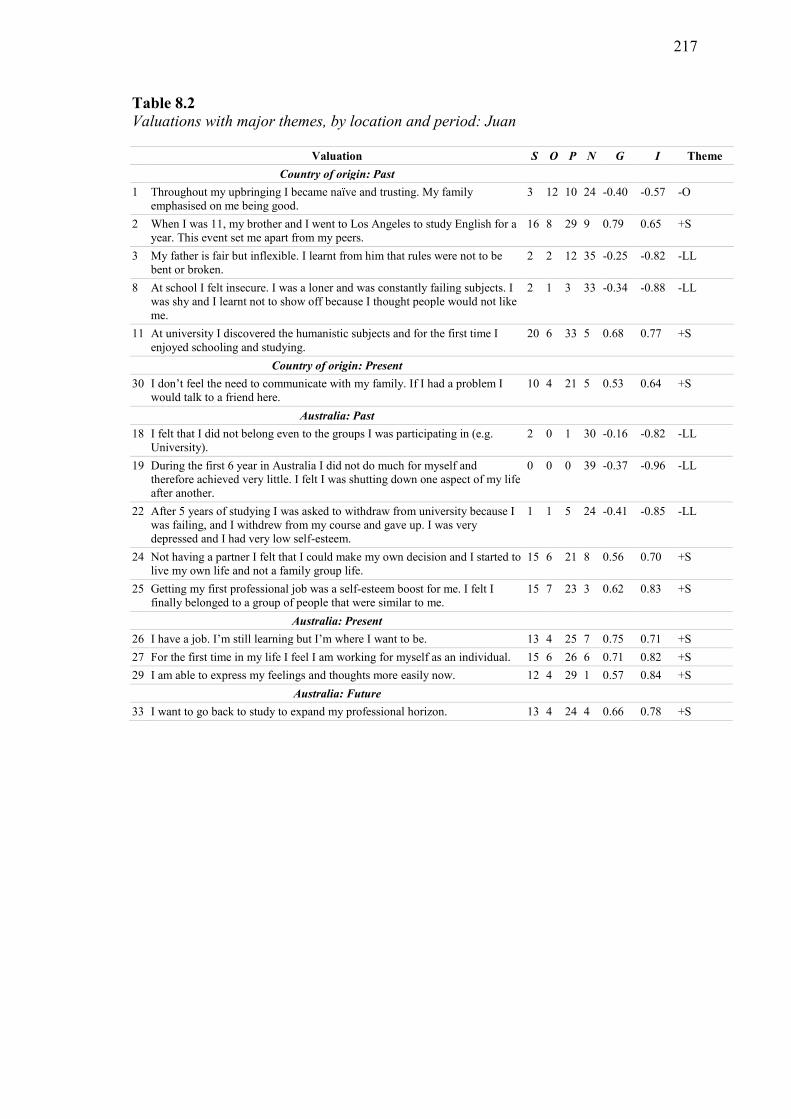
217
Table 8.2 Valuations with major themes, by location and period: Juan
Valuation S O P N G I Theme
Country of origin: Past
1 Throughout my upbringing I became naïve and trusting. My family
emphasised on me being good.
3 12 10 24 -0.40 -0.57 -O
2 When I was 11, my brother and I went to Los Angeles to study English for a
year. This event set me apart from my peers.
16 8 29 9 0.79 0.65 +S
3 My father is fair but inflexible. I learnt from him that rules were not to be
bent or broken.
2 2 12 35 -0.25 -0.82 -LL
8 At school I felt insecure. I was a loner and was constantly failing subjects. I
was shy and I learnt not to show off because I thought people would not like
me.
2 1 3 33 -0.34 -0.88 -LL
11 At university I discovered the humanistic subjects and for the first time I
enjoyed schooling and studying.
20 6 33 5 0.68 0.77 +S
Country of origin: Present
30 I don’t feel the need to communicate with my family. If I had a problem I
would talk to a friend here.
10 4 21 5 0.53 0.64 +S
Australia: Past
18 I felt that I did not belong even to the groups I was participating in (e.g.
University).
2 0 1 30 -0.16 -0.82 -LL
19 During the first 6 year in Australia I did not do much for myself and
therefore achieved very little. I felt I was shutting down one aspect of my life
after another.
0 0 0 39 -0.37 -0.96 -LL
22 After 5 years of studying I was asked to withdraw from university because I
was failing, and I withdrew from my course and gave up. I was very
depressed and I had very low self-esteem.
1 1 5 24 -0.41 -0.85 -LL
24 Not having a partner I felt that I could make my own decision and I started to
live my own life and not a family group life.
15 6 21 8 0.56 0.70 +S
25 Getting my first professional job was a self-esteem boost for me. I felt I
finally belonged to a group of people that were similar to me.
15 7 23 3 0.62 0.83 +S
Australia: Present
26 I have a job. I’m still learning but I’m where I want to be. 13 4 25 7 0.75 0.71 +S
27 For the first time in my life I feel I am working for myself as an individual. 15 6 26 6 0.71 0.82 +S
29 I am able to express my feelings and thoughts more easily now. 12 4 29 1 0.57 0.84 +S
Australia: Future
33 I want to go back to study to expand my professional horizon. 13 4 24 4 0.66 0.78 +S
218
8.4 Case study: The “High-stable” Migrant (Type 3)
Luisa is representative of the “High stable”, migrant type. She was born in
Mexico and emigrated to Australia as a mature adult of 30. Her childhood was largely
happy, but not without the frustration of “not being recognised … because [she] was a
girl”, and because being “the only girl among four brothers suppressed [her] character.”.
Nevertheless, she saw herself very much as the equal of the men in her family,
describing herself as “competitive” with her brother and the “soul mate” of her husband.
She was also adventurous, with a “thirst for independence” and a fascination for distant
lands, and Australia in particular. Though her relationship with her father was “not very
close”, she states, “I treasure the memory where my father went to my school to drop
the book he had bought for me - which he covered with beautiful paper and labelled
with my name. I felt so special.”
Luisa’s measures of psychological distress and well-being complete the picture of
an optimistic personality who gets the most she can from life. At the time of the
interview she felt confident in social situations (SAD = 1, cf. sample mean of 8.4); had
some, but still below-average, concern at giving a negative impression to others (FNE =
7, cf. sample mean of 13.3); and was not depressed (BDI-II = 3, cf. sample mean of
9.1). Her psychological well-being was well above average on all subscales (PWB1 =
77, cf. sample mean of 63.1; PWB2 = 83, cf. sample mean of 67.1; PWB3 = 79, cf.
sample mean of 63.4; PWB4 = 84, cf. sample mean of 72.7; PWB5 = 83, cf. sample
mean of 66.1; and PWB6 = 70, cf. sample mean of 64.6).
Major themes. Figure 8.9 shows the mean thematic profile of Type 3 participants
(Panel 1) and for Luisa, the case-study selected to exemplify them (Panel 2). The mean
profile of valuations of Type 3 participants did not differ significantly according to
whether they pertained to country of origin or Australia, χ2(5, N = 169) = 7.21, p = .21

219
(two-tailed). Valuations located in both country of origin and Australia were high on the
themes of Strength and unity and Autonomy and success; and, for Luisa but not Type 3
in general, moderately high on Unity and love.

220
Panel 1 All High-stable migrants
Panel 2 Luisa
Figure 8.9 Proportion of valuations, by major theme and location: Type 3 participants
and Luisa
0%
10%
20%
30%
40%
50%
Strength and unity
Unity and love
Unfulfilled longing
Powerlessness and isolation
Aggression and anger
Autonomy and success
Origin
Australia
0%
10%
20%
30%
40%
50%
Strength and unity
Unity and love
Unfulfilled longing
Powerlessness and isolation
Aggression and anger
Autonomy and success
Origin
Australia
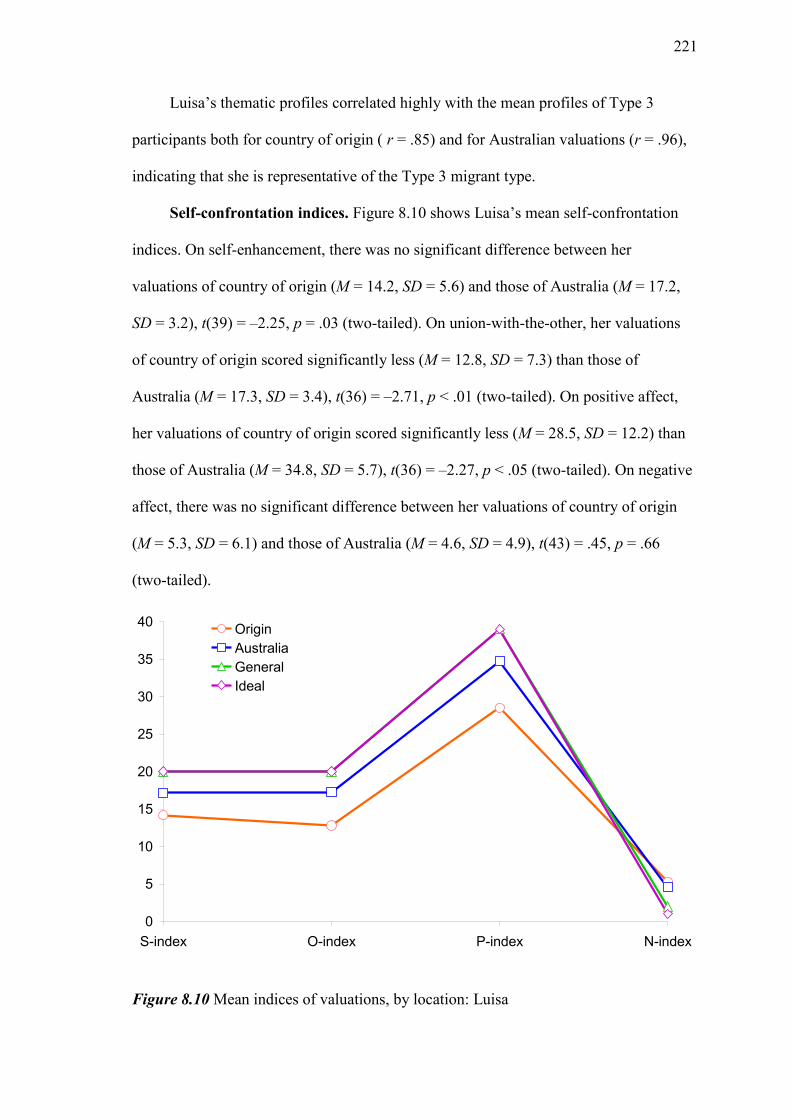
221
Luisa’s thematic profiles correlated highly with the mean profiles of Type 3
participants both for country of origin ( r = .85) and for Australian valuations (r = .96),
indicating that she is representative of the Type 3 migrant type.
Self-confrontation indices. Figure 8.10 shows Luisa’s mean self-confrontation
indices. On self-enhancement, there was no significant difference between her
valuations of country of origin (M = 14.2, SD = 5.6) and those of Australia (M = 17.2,
SD = 3.2), t(39) = –2.25, p = .03 (two-tailed). On union-with-the-other, her valuations
of country of origin scored significantly less (M = 12.8, SD = 7.3) than those of
Australia (M = 17.3, SD = 3.4), t(36) = –2.71, p < .01 (two-tailed). On positive affect,
her valuations of country of origin scored significantly less (M = 28.5, SD = 12.2) than
those of Australia (M = 34.8, SD = 5.7), t(36) = –2.27, p < .05 (two-tailed). On negative
affect, there was no significant difference between her valuations of country of origin
(M = 5.3, SD = 6.1) and those of Australia (M = 4.6, SD = 4.9), t(43) = .45, p = .66
(two-tailed).
Figure 8.10 Mean indices of valuations, by location: Luisa
0
5
10
15
20
25
30
35
40
S-index O-index P-index N-index
Origin
Australia
General
Ideal

222
Luisa is representative of the Type 3, “High stable” migrant type. According to
Gergen & Gergen (1986) a “stability” narrative links events “in such a way that the
protagonist remains essentially unchanged with respect to evaluative position” (p. 27).
Corroboration of this is found in Figure 8.11, which shows the temporal dimension of
her self-confrontation indices.
Luisa’s self-confrontation indices show little temporal or other progression. For
the most part, the self-confrontation indices of all her valuations are quite similar,
whether differentiated by location, by period, or both.
Figure 8.11 Mean indices of valuations, by location and period: Luisa
0
5
10
15
20
25
30
35
Past Present Future Past Present Future
Origin Australia
S
O
P
N
223
Self-narrative. Luisa’s self-narrative is characterised by stasis. She brims with
self-confidence and the achievements, real and perceived, that such confidence
engenders. The following paired valuations show this.
From the outset she feels special and valued—a sentiment that stands her in good
stead later in life:
Country of origin: “I treasure the memory where my father went to my school … I
felt so special” (+HH).
Australia: “This provided me with an interest and the freedom to be with John
when we had time off work” (+HH).
She anticipates, and plans for, a marriage of equals, and achieves it:
Country of origin: “I came back to Mexico. John followed me a few months after
and we were married” (+HH).
Australia: “This was an encounter with a soul mate; we felt so happy in each
other’s company from the beginning and we fell in love” (+HH).
She has a childhood dream, and achieves that too:
Country of origin: “Since my childhood I felt a special fascination with anything
to do with Australia”.
Australia: “I had already become an Australia citizen and I felt totally at home”
(+HH).
Her two dreams—of a soul-mate and a spiritual home—are captured again in
these valuations:
Country of origin: “I finally came to visit Australia. I met my future husband
during this trip. It was on the cards”.
Australia: “My first arrival in Australia was almost like a homecoming.
Everything was more than I ever expected” (+HH).
And she does it all by complementing her country-of-origin self, not by
repudiating or changing it:

224
Country of origin: “The joy of participating closely with the family is hard to
describe. The warmth of the people in general” (+HH).
Australia: “The early years of my children were the happiest and the most
rewarding of my life. I was completely fulfilled and did not want for anything
more” (+HH).
Luisa’s is a self-narrative of building on a strong sense of herself and achieving
more—stability crowned by emotional reward.

225
Table 8.3 Valuations with major themes, by location and period: Luisa
Valuation S O P N G I Theme
Country of origin: Past
3 Whilst in the U.S. (for a period of 2 and a half years) I had to conform with
my grandmother’s ideas of discipline, and that involved performing a number
of responsibilities in the household which did not befit a fourteen year old.
8 0 0 19 -0.44 -0.46 -S
4 School life - year 7 and 8 was a fantastic experience, both academic and
social.
15 8 32 0 0.76 0.76 +S
5 Childhood years- enjoyed school enormously and always excelled in my
grades.
15 9 36 1 0.79 0.80 +S
6 Social life revolved around our cousins and our neighbourhood friends. It
was fun.
9 16 31 10 0.69 0.69 +O
7 I treasure the memory where my father went to my school to drop the book
he had bought for me- which he covered with beautiful paper and labelled
with my name. I felt so special.
20 20 35 0 0.93 0.94 +HH
8 At the age of 15 I returned home to Mexico. Because of the education system
of the time I could not go to high school and therefore the opportunity of
going to university was closed to me. My parents chose to send me to a
secretarial course instead. This was quite disappointing for many years.
11 5 27 3 0.56 0.57 +S
9 When I finished secretarial school I applied for work in the airline industry. I
was very lucky to get a job straight away with American Airlines. From there
I moved on to a better position with Qantas airways. I was 19 at the time.
This was to be an experience that opened my horizons and changed my life.
19 9 38 0 0.86 0.87 +S
10 Being the only girl among four brothers suppressed my character. And this
promoted in me a great thirst for independence. I became very competitive
with Eduardo, my brother, who was closest in age to me and I felt quite
happy when I could earn a better salary [than him, working as a secretary].
16 2 25 4 0.49 0.50 +S
11 My job with Qantas lasted 10 years. It offered me a fabulous wide experience
of interesting work, very rewarding in every sense: intellectually, socially
and financially.
19 12 37 0 0.88 0.89 +S
12 During those same 10 years I was able to travel extensively to places I never
dreamed of.
19 8 35 0 0.80 0.81 +S
13 After 10 years of working for Qantas I finally came to visit Australia. I met
my future husband during this trip. It was on the cards.
16 14 37 0 0.93 0.94
14 [After John’s marriage proposal] I came back to Mexico. John followed me a
few months after and we were married.
20 20 39 3 0.99 0.99 +HH
17 On the other hand I had a close relationship with my mother. As I have got
older I have discovered many of her traits in my personality.
19 20 30 14 0.52 0.54 +HH
18 As my children reached the age of 10 and 12 years we felt we would like to
move to Mexico for them to absorb the Mexican culture; for all of us to live
close to our extended family and cement our family values along the
Mexican traditions.
10 20 32 6 0.76 0.73 +O
19 The 8 years we spent in Mexico allowed us to enjoy a very rich experience of
family life. The joy of participating closely with the family is hard to
describe. The warmth of the people in general.
18 20 36 2 0.98 0.97 +HH
Country of origin: Present
21 My bonding with my mother and brothers has not diminished for the fact I
live away. Our communication is rich and constant.
20 20 34 11 0.80 0.80 +HH
22 I share my Mexican culture with my children here in Australia. We always
speak Spanish amongst ourselves, enjoy our music, food, drinks and the spirit
of our connection with Mexico.
19 20 35 1 0.92 0.93 +HH
Country of origin: Future
24 In the future there will always be a special bonding with my children which
comes from sharing our Mexican culture.
19 20 38 0 0.98 0.99 +HH
25 One of my important goals in the future is to continue visiting Mexico and to
keep in contact with my family, friends and culture.
9 20 31 2 0.71 0.72 +O

226
Australia: Past
2 The great feeling I always had for Australia was a great influence in the way
I found myself so fulfilled when I came here. I had never felt that way
before.
19 18 35 1 0.95 0.96 +HH
3 I met John, my husband, on my first visit to Australia. This was an encounter
with a soul mate; we felt so happy in each other’s company from the
beginning and we fell in love.
20 20 39 1 1.00 1.00 +HH
5 [After our marriage in Mexico] we came back to Australia and I felt I had
migrated to a new country. I had taken a big step.
12 19 36 4 0.90 0.89 +O
6 Over a period of time I felt a combination of emotions. I soon discovered I
did not belong here. I had no friends or family to seek support from.
10 16 24 9 0.54 0.53 +O
8 I left my job to start a business importing Mexican silver jewellery. This
provided me with an interest and the freedom to be with John when we had
time off work.
18 19 38 1 0.97 0.98 +HH
9 The arrival of our first child meant the end of my business. By this stage I
had already become an Australia citizen and I felt totally at home.
20 20 39 1 1.00 1.00 +HH
10 The early years of my children were the happiest and the most rewarding of
my life. I was completely fulfilled and did not want for anything more.
20 20 39 2 0.99 1.00 +HH
11 I became a freelance interpreter when the children started going to school.
This was a very interesting and rewarding experience, as it allowed me to
become familiar with the issues of the migrant communities in Melbourne.
20 11 39 2 0.86 0.87 +S
12 Almost at the same time I joined a refugee support group. It was wonderful
to be able to help so many families to settle with a new life in Australia.
20 18 39 3 0.98 0.98 +HH
Australia: Present
15 [Since] January 2000 we [are] back in Melbourne. It took me about a week to
settle back in, it was like coming back to my old shoes. I knew we had
challenges ahead, but I had great confidence because we knew we were in a
place where there is law and order.
18 20 36 4 0.96 0.95 +HH
16 Our time here has given us the satisfaction to look back and know it was a
good decision. Referring to the way in which our children responded. They
feel very happy and fulfilled.
20 20 38 1 0.99 1.00 +HH
17 John and I bought a business which taught us a totally different industry—
hospitality. We thoroughly enjoy our work and the stability it has given us
once more.
20 20 39 1 1.00 1.00 +HH

227
8.5 Case study: The “Regressive” Migrant (Type 4)
Carla is representative of the “Regressive”, migrant type. She emigrated from
Uruguay with her family at seven years of age. She became very unhappy in Australia,
missing her relatives in Uruguay and feeling isolated both at school and within her
family. She and her mother returned to Uruguay when she was 14 where she re-
established connection with her Uruguayan family. She began a relationship which she
thought would lead to marriage, but her mother forced her to return to Australia, and her
boyfriend subsequently jilted her. She married at 18 in Australia and had two children,
but the marriage ended in a bitter divorce with shared custody. Because of the shared
custody she was unable to return to Uruguay with her children; however, when her
grandmother became terminally ill, she obtained a dispensation from the court ruling
and was able to return. She was happy there, but felt and still feels she could not remain
in Uruguay as her children have better chances in Australia. She has returned and still
feels estranged from her family in Australia. Carla in effect migrated three times to
Australia, twice as a child, when she was not party to the decision and seemingly would
have opposed it if she could; and once as an adult, when she chose to return: “…home
was Australia if I wanted [my children] to have opportunities.” It is for this reason that
she is treated as a “voluntary” migrant for the purpose of this thesis.
Carla’s measures of psychological distress and well-being complete the picture of
a person who has encountered disappointment in life and has let it get her down. At the
time of the interview she lacked confidence in social situations (SAD = 12, cf. sample
mean of 8.4); was concerned at giving a negative impression to others (FNE = 15, cf.
sample mean of 13.3); and was mildly depressed (BDI-II = 20, cf. sample mean of 9.1).
Her psychological well-being was average or below on all subscales, particularly Self-
acceptance, where she was well below (50 cf. sample mean of 64.6).

228
Major themes. Figure 8.12 shows the mean thematic profile of Type 4
participants (Panel 1) and for Carla, the case-study selected to exemplify them (Panel
2). The mean profile of valuations of Type 4 participants differed significantly
according to whether they pertained to country of origin or Australia, χ2(5,
N = 87) = 27.23, p < .001 (two-tailed). Valuations located in country of origin were high
on Strength and unity and Powerlessness and isolation, whereas those in Australia were
high on Autonomy and success, Powerlessness and isolation, and Aggression and
anger.
Carla’s thematic profiles correlated highly with the mean profiles of Type 4
participants both for country of origin ( r = .97) and for Australian valuations (r = .77),
indicating that she is representative of the Type 4, (Regressive), migrant type.

229
Panel 1 All Regressive migrants
Panel 2 Carla
Figure 8.12 Proportion of valuations, by major theme and location: Type 4 participants
and Carla
0%
10%
20%
30%
40%
50%
Strength and unity
Unity and love
Unfulfilled longing
Powerlessness and isolation
Aggression and anger
Autonomy and success
Origin
Australia
0%
10%
20%
30%
40%
50%
Strength and unity
Unity and love
Unfulfilled longing
Powerlessness and isolation
Aggression and anger
Autonomy and success
Origin
Australia
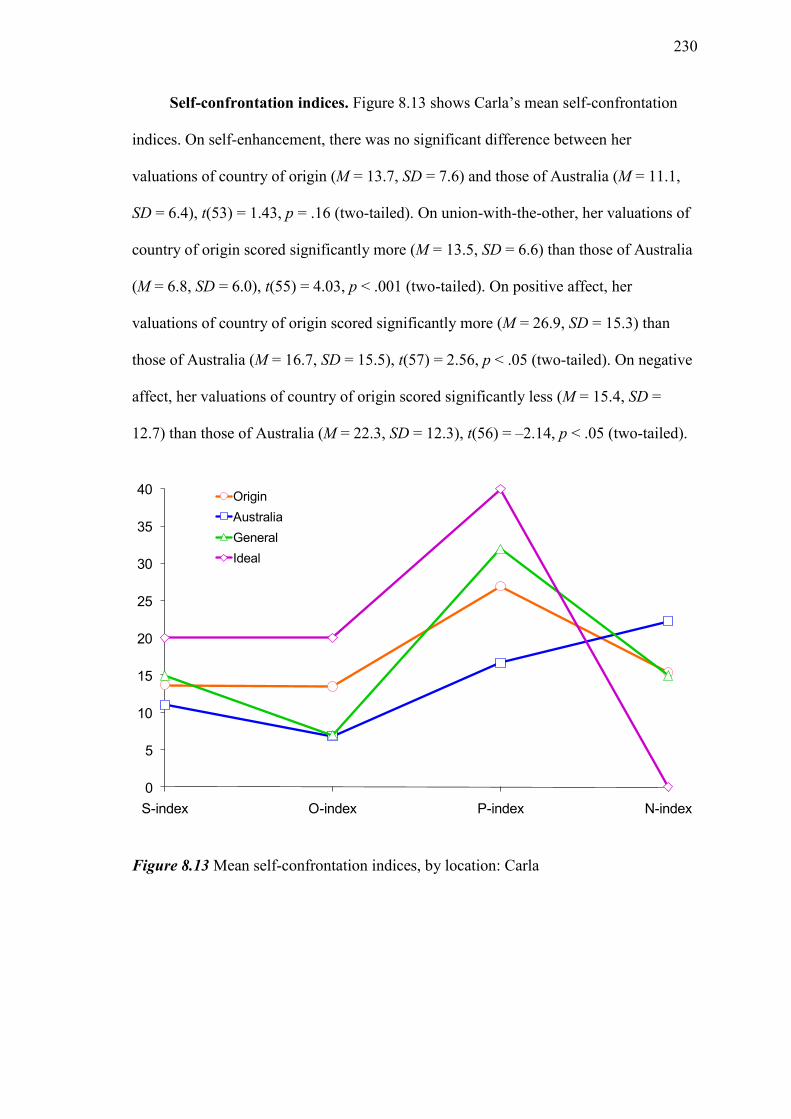
230
Self-confrontation indices. Figure 8.13 shows Carla’s mean self-confrontation
indices. On self-enhancement, there was no significant difference between her
valuations of country of origin (M = 13.7, SD = 7.6) and those of Australia (M = 11.1,
SD = 6.4), t(53) = 1.43, p = .16 (two-tailed). On union-with-the-other, her valuations of
country of origin scored significantly more (M = 13.5, SD = 6.6) than those of Australia
(M = 6.8, SD = 6.0), t(55) = 4.03, p < .001 (two-tailed). On positive affect, her
valuations of country of origin scored significantly more (M = 26.9, SD = 15.3) than
those of Australia (M = 16.7, SD = 15.5), t(57) = 2.56, p < .05 (two-tailed). On negative
affect, her valuations of country of origin scored significantly less (M = 15.4, SD =
12.7) than those of Australia (M = 22.3, SD = 12.3), t(56) = –2.14, p < .05 (two-tailed).
Figure 8.13 Mean self-confrontation indices, by location: Carla
0
5
10
15
20
25
30
35
40
S-index O-index P-index N-index
Origin
Australia
General
Ideal

231
Carla is representative of the Type 4 (Regressive) migrant type. In Gergen &
Gergen’s (1986) typology, a “regressive” narrative is one in which one “is continuously
moving away from the valued state” (p. 27). Corroboration of this is found in Figure
8.14, which shows the temporal dimension of Carla’s self-confrontation indices.
Temporally, Carla presents a complex picture. No clear temporal progression is
observable in S and O. Well-being (defined as P minus N) appears to rise through time
for Australia but not country of origin. Carla’s regressive classification is based on the
fact that her Australian valuations are on average more negative than her country-of-
origin ones. However, unfortunate for her as this no doubt is, it is notable that in
Australia the trend is up. It was Carla’s extremely rocky start in Australia that
apparently gave rise to her “regressive” classification.
Figure 8.14 Proportion of valuations, by location and period: Carla
0
5
10
15
20
25
30
35
Past Present Future Past Present Future
Origin Australia
S
O
P
N
232
Self-narrative. Carla’s self-narrative is characterised loss and disappointment;
her desires are thwarted. She was stripped of all she held dear, and when finally she
regained her freedom, it was hollow. The following valuations show this.
From the outset migration was a let-down. Her disappointment at not going to
Sydney (about which as a mere child she surely knew little) may mask a deeper
antipathy:
Country of origin: “I felt I had a place in the family…. I was doted on by all
family members.” (+S).
Australia: “[W]e came to Melbourne instead of Sydney. This was disappointing.
My parents had not kept their promise … I remember the fear of not being
understood” (–S).
... and she makes the depth of her feelings clear:
Country of origin: “I remember feeling special and having lots of self-esteem,
feeling good about myself, being very out there, and being very affectionate
towards my relatives” (+HH).
Australia: “I hated Australia” (–O).
At first she delights in the return to her longed-for home:
Country of origin: “From the minute I stepped into Uruguay I felt whole, I felt I
was someone …. I remember kissing, hugging and being very affectionate with
my gran and all my family” (+HH).
Australia: “My dad was physically abusive towards me” (–LL). “I felt my mum
did not protect me from my dad ” (–LL).
... but as an adult she finds she has changed. Or maybe it is her childhood home
that has changed. Either way, things are not what they are, and she must make the best
of it:
Country of origin: “… I no longer have the urge to be in Uruguay with my family,
as I have come to terms with the fact that I don’t belong there …”.
233
Australia: “Eventually connecting with someone romantically in the long term”
(–S).
Carla’s self-narrative is one of distancing from all she holds dear. She clings to a
receding past, and when finally she revisits it, mirage-like it is no longer there. This is a
story of regression from a desired state.
8.6 Summary
This study presents four case studies chosen to represent the four migrant types—
Progressive, Low-stable, High-stable and regressive— identified in the analysis. They
were found to corroborate the findings of Studies 1 and 2 in that good matches were
found between the case studies and the participant types they represent.
Yoana’s self-narrative is of setting new and very different goals, and achieving
them—truly a progression to better things. She exemplifies the Progressive migrant
type. Juan’s self-narrative is of mental struggle and survival—stable, but compromised
by underachievement. He exemplifies the Low-stable migrant type. Luisa’s self-
narrative builds on a strong sense of herself and achieving more—stability crowned by
emotional reward. She exemplifies the ‘High-stable’ migrant type. Carla’s self-narrative
is of distancing from all she holds dear. She clings to a receding past, and when finally
she revisits it, mirage-like it is no longer there. This is a story of regression from a
desired state. She exemplifies the Regressive migrant type.
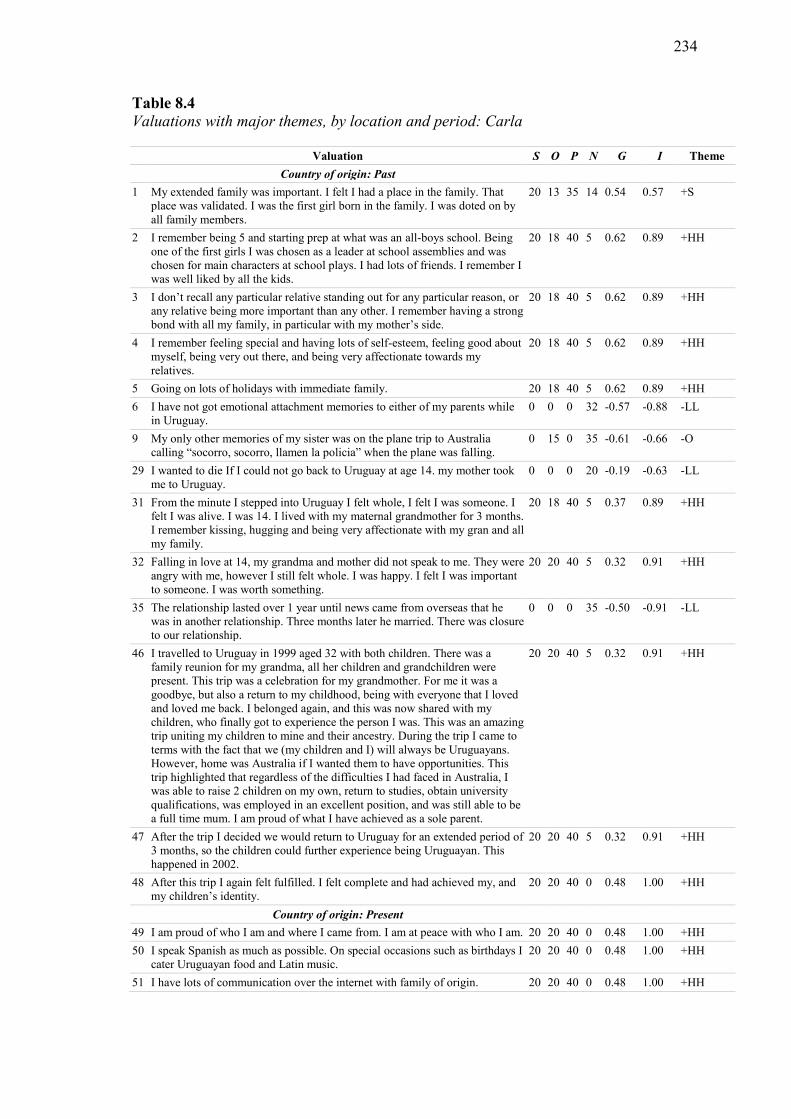
234
Table 8.4 Valuations with major themes, by location and period: Carla
Valuation S O P N G I Theme
Country of origin: Past
1 My extended family was important. I felt I had a place in the family. That
place was validated. I was the first girl born in the family. I was doted on by
all family members.
20 13 35 14 0.54 0.57 +S
2 I remember being 5 and starting prep at what was an all-boys school. Being
one of the first girls I was chosen as a leader at school assemblies and was
chosen for main characters at school plays. I had lots of friends. I remember I
was well liked by all the kids.
20 18 40 5 0.62 0.89 +HH
3 I don’t recall any particular relative standing out for any particular reason, or
any relative being more important than any other. I remember having a strong
bond with all my family, in particular with my mother’s side.
20 18 40 5 0.62 0.89 +HH
4 I remember feeling special and having lots of self-esteem, feeling good about
myself, being very out there, and being very affectionate towards my
relatives.
20 18 40 5 0.62 0.89 +HH
5 Going on lots of holidays with immediate family. 20 18 40 5 0.62 0.89 +HH
6 I have not got emotional attachment memories to either of my parents while
in Uruguay.
0 0 0 32 -0.57 -0.88 -LL
9 My only other memories of my sister was on the plane trip to Australia
calling “socorro, socorro, llamen la policia” when the plane was falling.
0 15 0 35 -0.61 -0.66 -O
29 I wanted to die If I could not go back to Uruguay at age 14. my mother took
me to Uruguay.
0 0 0 20 -0.19 -0.63 -LL
31 From the minute I stepped into Uruguay I felt whole, I felt I was someone. I
felt I was alive. I was 14. I lived with my maternal grandmother for 3 months.
I remember kissing, hugging and being very affectionate with my gran and all
my family.
20 18 40 5 0.37 0.89 +HH
32 Falling in love at 14, my grandma and mother did not speak to me. They were
angry with me, however I still felt whole. I was happy. I felt I was important
to someone. I was worth something.
20 20 40 5 0.32 0.91 +HH
35 The relationship lasted over 1 year until news came from overseas that he
was in another relationship. Three months later he married. There was closure
to our relationship.
0 0 0 35 -0.50 -0.91 -LL
46 I travelled to Uruguay in 1999 aged 32 with both children. There was a
family reunion for my grandma, all her children and grandchildren were
present. This trip was a celebration for my grandmother. For me it was a
goodbye, but also a return to my childhood, being with everyone that I loved
and loved me back. I belonged again, and this was now shared with my
children, who finally got to experience the person I was. This was an amazing
trip uniting my children to mine and their ancestry. During the trip I came to
terms with the fact that we (my children and I) will always be Uruguayans.
However, home was Australia if I wanted them to have opportunities. This
trip highlighted that regardless of the difficulties I had faced in Australia, I
was able to raise 2 children on my own, return to studies, obtain university
qualifications, was employed in an excellent position, and was still able to be
a full time mum. I am proud of what I have achieved as a sole parent.
20 20 40 5 0.32 0.91 +HH
47 After the trip I decided we would return to Uruguay for an extended period of
3 months, so the children could further experience being Uruguayan. This
happened in 2002.
20 20 40 5 0.32 0.91 +HH
48 After this trip I again felt fulfilled. I felt complete and had achieved my, and
my children’s identity.
20 20 40 0 0.48 1.00 +HH
Country of origin: Present
49 I am proud of who I am and where I came from. I am at peace with who I am. 20 20 40 0 0.48 1.00 +HH
50 I speak Spanish as much as possible. On special occasions such as birthdays I
cater Uruguayan food and Latin music.
20 20 40 0 0.48 1.00 +HH
51 I have lots of communication over the internet with family of origin. 20 20 40 0 0.48 1.00 +HH

235
Australia: Past
11 I remember we came to Melbourne instead of Sydney. This was
disappointing. My parents had not kept their promise. We arrived at a hostel
(Springvale). I remember the fear of not being understood when my dad told
me to go and buy a coke at the milk bar.
15 4 13 28 -0.08 -0.36 -S
13 The 1st day at school I screamed and cried for the teacher to go get my
brother. I hated Australia.
2 10 0 30 -0.46 -0.61 -O
14 I was responsible for taking my younger sister to kinder. One day I forgot to
pick her up. It was 5 pm when I remembered. The kinder was closed and I
was banging on the kinder doors. I was 7.
2 10 0 30 -0.46 -0.61 -O
17 Home: parents worked. I was responsible for myself, sister and brother to a
degree. I had a key to our home and was responsible until parents finished
work. “latch key kids”, “just my job”. I still resented coming here as I did not
have this as my job in Uruguay.
10 0 9 34 -0.09 -0.66 -S
18 Academically, my teacher continuously reinforced that English was my
second language and I would need to improve to get ahead. This also
reinforced my wog mentality, that I did not fit in, that I was not an “Aussie”.
12 4 12 31 -0.25 -0.56 -S
19 I was becoming more and more self-conscious, not belonging (8 to 10 years
old).
12 4 12 31 -0.25 -0.56 -S
20 I had physical fights with my entire grade (year 5). Boys would hit me for no
reason. I always fought back as I was told in the hostel that they (my parents)
did not want me to come home crying because someone had hit me. If I came
home crying I would be hit by them.
10 0 0 36 -0.40 -0.82 -S
21 In grade 6 I became very popular. I was friends with most popular kids in the
school. I felt like I did in Uruguay.
17 11 31 7 0.68 0.80 +S
22 In year 7 and 8 I hated school. I felt like I did when I arrived in Australia, out
of place.
10 0 0 36 -0.40 -0.82 -S
24 In year 8 I hated school. I wagged and felt no connection with school. 10 0 0 36 -0.40 -0.82 -S
26 My dad was physically abusive towards me. 0 0 0 30 -0.54 -0.82 -LL
27 I felt isolated within my family. I felt singled out in a negative way. I had no
one to turn to.
6 0 2 30 -0.30 -0.74 -S
28 I felt my mum did not protect me from my dad. 0 0 0 25 -0.37 -0.73 -LL
39 I focused on work and went back to school, and made a new group of friends
(17 years old).
19 11 38 6 0.50 0.76 +S
43 The separation was very violent. I had no support from extended family. I felt
that if I was in Uruguay this would not have occurred this way as family
members would have intervened. I had no protection.
6 0 0 35 -0.42 -0.81 -S
Australia: Present
55 I am currently enjoying my work, but am evaluating long term goals and
exploring future employment options.
20 11 40 5 0.74 0.79 +S
Australia: Future
59 Eventually connecting with someone romantically in the long term. 8 2 16 28 0.01 -0.54 -S
60 My goals: Continue to enjoy being me, travelling, purchasing a house. 20 18 38 0 0.53 0.99 +HH
236
CHAPTER 9: General Discussion
This chapter considers the findings from the three studies that constituted the
empirical work for this thesis. It opens with restatement of each study and synopses of
the research questions. Next, the findings are compared and contrasted with other
research in the field. For each finding the relationships, generalisations and implications
for the broader theory of the dialogical self are identified. The final section considers
the strengths and limitations of the research, showing where they break new ground and
suggesting profitable areas for future research.
9.1 Summary of the Empirical Work
The present thesis comprises three separate studies. All were based on data from
the same sample of 38 migrants to Australia, analysed in different ways. The data were
obtained by means of in-depth interviews using the self-confrontation method
complemented by self-report measures.
9.1.1 Study 1
The analytical purpose of Study 1 was data reduction: it employed the statistical
technique of cluster analysis to group participants into four types, and on that basis
analysed their characteristics. Study 1 considered the full set of self-narratives of the 38
participants, both in country of origin and Australia in terms of valuation theory.
Average self-enhancement (S), union-with-the-other (O) and positive affect (P) were
found to be higher for Australian I-positions than for country of origin, but significantly
so only for self-enhancement (S), and positive affect (P). This indicates the formation of
I-positions with different thematic content. Cluster analysis was performed on the four
indices for country of origin and for Australia. In both cases, two clusters were
identified, explaining about half the within-cluster variance. One was characterised by
237
high self-enhancement (S), union-with-the-other (O) and positive affect (P), and low
negative affect (N); the other by low self-enhancement (S), union-with-the-other (O) and
positive affect (P), and high negative affect (N).
This procedure served to identify four different participant “types”. Progressive
migrants increase self-enhancement (S), union-with-the-other (O) and positive affect
(P), and reduce negative affect (N) as between origin and Australia; Regressive
migrants, the opposite. Stable migrants showed no important changes in these indices:
these were classified as High-stable or Low-stable according to whether their S, O, and
P indices were high or low. Progressives comprised 8% of the sample, Regressives
16%, and Stable types 76%, of which 29% were High-stable and 47% Low-stable.
Besides differing in motives and affects, participant “types” also differed in their
psychological distress and well-being. Progressive participants were in general less
socially anxious than the other types, though the difference from Regressive was
borderline. Low-stable participants were more fearful of negative evaluation than High-
stable. However, the smallness of the sample appears to have prevented significance
differences being found where otherwise they would have been expected: between, say,
Progressives and Regressives. No significant differences were found between
participant types on depression. On psychological well-being, some significant
differences were evident: Regressives had significantly worse ‘relations with others’
than did Progressives and High-stables.
9.1.2 Study 2
The analytical purpose of Study 2 was, like that of Study 1, data reduction, but of
a different kind. By treating the dialogical self as a hypothetical probability distribution
of themes of valuations, it permitted formal hypothesis testing of differences between
participants’ self-narratives pertaining to their countries of origin, and their self-
238
narratives pertaining to Australia. Study 2 considered the set of self-narratives
classifiable into Hermans’ six major themes of self-narratives. The entire set of 1,565
valuations was allocated to Hermans’ six major themes wherever possible (about a third
of the full set, as most self-narratives had no major theme). Using this classification, a
profile giving the proportion of each major theme in the full set of valuations was
attached to each individual both globally and for country of origin. Participants were
then classified into two groups: “univalent” and “multivalent”. Univalent migrants were
those who expressed only a single affect, either positive or negative (but not both) in
their valuations. Multivalent migrants were those who expressed a mix of both positive
and negative affects. Thirty-nine per cent of migrants expressed multivalent major
themes. These migrants had multi-modal thematic I-positions and thus correspond to the
dialogical view of the self.
Participants were subjectively classed as either “stable” or “unstable” on the basis
of the degree of difference between their profiles calculated for narratives in Australia
and at country of origin. On this basis 82% of migrants had stable narratives between
origin and destination. Parametric tests were conducted for the differences in
proportions of major themes at origin and destination. Participants’ narratives contained
fewer –LL valuations in Australia, more +HH valuations, more +S valuations and fewer
O+ valuations, but only the first of these was significant at the 5% level. A joint test of
the null hypothesis of complete thematic stability was decisively rejected.
A further analysis was conducted on the full set of valuations to escape the
attrition implicit in Hermans’ typology of major themes. An eight-way classification of
participants was obtained by considering whether their average scores on S, O and W (=
P – N) were higher or lower than the sample average, both at origin and in Australia.
The resulting matrix showed how their narratives differed between origin and Australia,
239
with entries on the diagonal corresponding to stability. Considerable thematic stability
was again found across valuations for country of origin and Australia, though there was
some evidence of change, contained in the off-diagonal portion of the transition matrix.
9.1.3 Study 3
Study 3 was idiographic in approach; its purpose was to corroborate the previous
two nomothetic studies by examining the self-narratives of specific participants. Four
case studies were chosen to represent the four migrant types identified in Study 1—
Progressive, Low-stable, High-stable and Regressive. In all cases a good match was
found between the case study and the participant type it represented. Idiographic and
nomothetic analyses have complementary strengths. The idiographic content of these
valuations from each of the four groups served to provide more information about the
range and individual natures of the experiences examined in this thesis.
9.2 Main Findings
The present thesis explored four areas of research: stability and change in the
dialogical self, the nature of migrant identity, the composition of I-positions, and the
psychological state of migration. This section presents the salient findings of the thesis,
ordered according to the specific research questions to which they relate, and places
them in the context of existing research,
9.2.1 Migrant identity
Research question 1a: How is biculturalism reflected in I-positions? The
participants were found to experience dual cultural identities. Specifically, both
compatible (Low- and High-stable) and conflictual (Progressive and Regressive)
biculturality were evident in a sample of migrants who claimed to be integrated into the
Australian society and perceived themselves as having two cultural identities.
240
This finding builds on work by Phinney and Devich-Navarro (1997) that found
that biculturalism has two components, ethnic and national. To be bicultural is to
identify strongly with both, and this implies integration into the larger society. As in
their research, participants in the present study explored meaningful stories of their lives
as part of their membership of their ethnic group and of mainstream Australia; their
sense of being part of two cultures; whether or not it caused conflict in their lives; and
how they dealt with the relationship between the two cultures. The use of Hermans’
classification of valuations in terms of their positive and negative valences was one of
the features that differentiated the present migrant’s self-narratives and gave the overall
affective qualities of their lives as depicted in their stories from home and from
Australia. This pattern is evident in other research: LaFromboise et al. (1993) and
Phinney & Devich-Navarro (1997) found similar differences.
Based on positive and negative valences of the valuations in their self-narratives,
and the extent to which self-enhancement (S) or union-with-the-other (O) dominate the
self-narratives, the present study generated a typology of bicultural identification. Low-
stable and High-stable participants did not perceive the mainstream and ethnic cultures
as mutually exclusive or conflicting. In their stories and self-reported motivation and
affects, they showed equal representation in both. This finding concurs with Phinney
and Devich-Navarro’s (1997) finding that people who identified equally with both
cultures and dealt with them by combining them exhibited “blended” biculturalism. For
example, when asked to say if they are ethnic or American, they tended to say “I am
both” (Phinney & Devich-Navarro, 1997). By not providing a distinctive differentiation
between the motives and affects belonging to the respective stories from the two I-
positions, the participants in the Low- and High-Stable clusters exhibited a blend of the
two cultures in each I-position.

241
On the other hand, those participants who identified more with one culture than
with the other, despite being able to function in both settings, demonstrated Phinney &
Devich-Navarro’s (1997) “alternating” biculturalism. In their stories, Progressive
participants represented their Australian identity more positively than they represented
their country of origin identity; while Regressive participants identified more positively
with their country of origin identity than with their Australian identity. Although they
outwardly identify with both cultures, their stories show that their dual cultures differ
greatly in terms of motives and affect. Regressives, not unexpectedly, tend to keep their
cultural identities apart; for them, Australian and country of origin identities are
perceived as distinct, separate, and oppositional (Phinney & Devich-Navarro, 1997;
Vivero & Jenkins, 1999). The present results provide a foundation for research in
bicultural identity and suggest that Berry’s model of acculturation does not fully explain
bicultural identity integration.
In sum, the present research corroborated previous research that identifies two
modes of biculturalism: compatible and oppositional. Low-stable and High-stable
migrants, having compatible bicultural identities, viewed their heritage and host cultures
as complementary, whereas Progressive and Regressive migrants, having oppositional
identities, viewed them as discrepant and conflicting. It is the latter view that fosters
internal conflict and may compromise well-being (Vivero & Jenkins, 1999), which may
explain why Regressive migrants had significantly lower well-being (specifically
‘relations with others’) than did Progressives and High-stables. Present research
furthermore corroborates previous findings that compatibility does not depend on how
long migrants have lived in the host culture (Phinney & Devich-Navarro, 1997), or their
migrants’ attitudes toward biculturalism (Vivero & Jenkins, 1999).

242
The compatible/oppositional dichotomy has been elaborated further in the work of
Benet-Martinez, Leu, Lee, and Morris (2002), Benet-Martinez & Haritatos (2005) and
Benet-Martinez, Lee, & Leu (2006). Their findings of “harmonious” and “conflictual”
biculturality can also be used to interpret the present findings. The two migrant types—
Low-stable and High-stable—correlate with “harmonious” biculturality in the sense that
they exhibited “congruence” between the two cultural identities in terms of themes and
affective tone in their self-narratives. These migrants exhibited their two identities as
“congruent”: when either was activated, both reflected a psychological consonance of
themes and affective tone and corresponded to each other. However, the other two
migrant types—Progressive and Regressive—correlate to “conflictual” biculturality.
For them, their two identities related conflictually and were experienced as a paradox,
reflecting a psychological dissonance between cultures: the activated identity elicited a
cognitive style in terms of self-enhancement (S) and union-with-the-other (O) that was
characteristic of the alternative culture. This translated into two modes of integration.
While all participants were all able to switch between cultures and elicit self-narratives,
only Progressive and Regressive migrants (the “conflictual biculturals”) experienced the
two cultures in an antagonistic way. Moreover, because the antagonism between the two
cultures for the Regressive participants’ self-narratives resides in their Australian
identity, this translated to a detriment of their present psychological well-being.
This finding can also be understood in the context of work by Benet-Martinez and
Haritatos (2005; Benet-Martinez, Lee, and Leu (2006), which investigated how persons
connected to more than one culture internalise potentially conflicting cultural
identifications. They found that “biculturals can differ … in the extent to which they
perceive their cultural identities as largely integrated and compatible … or dissociated
and difficult to integrate …” (p. 395). Benet-Martinez, Leu, Leu, and Morris (2002)

243
conceptualised the tendency to perceive cultural identities as either compatible or
oppositional as an individual difference, which they termed bicultural identity
integration. They found that those high on BII do not feel their cultures have a difficult
coexistence, and do not see them as oppositional. Compared to individuals low on BII,
those high on BII identify more with the mainstream culture, even though identification
with their culture of origin may be similar for both groups.
In summary, the present research identified two types of migrant, Progressive and
Regressive, that are similar to those with “conflictual” biculturality (Boski, 2008) in that
they exhibited disharmony between the two cultural identities in terms of themes and
affective tone in their self-narratives from their country of origin and from Australia.
Like Vivero and Jenkins (1999)’s notion that bicultural migrants with low integration
between their identities may feel “culturally homeless”, the Progressive and Regressive
migrants in the present study have “different pieces of home in different places” that can
never be put together, because they “contradict or conflict with one another” (p. 7).
While the sense of cultural homelessness resides in the past for Progressive migrants,
the opposite holds for Regressive: the Progressives found harmony in their Australian
cultural identity; the Regressives found conflict.
As Phinney and Devich-Navarro’s (1997) observed: “biculturalism is a complex
and multidimensional phenomenon; there is not just one way of being bicultural.” (p.
19). But although the importance of this complex and important field has been
acknowledged (e.g., Hermans & Kempen, 1998; LaFromboise, Coleman, & Gerton,
1993), empirical research is sparse (Benet-Martinez & Haritatos, 2005). The present
thesis helps to fill this gap.
Socio-cultural adaptation (Ward & Searle, 1990) concerns the relationship
between migrants and their host society, and it includes their ability to cope with the
244
everyday issues that require social interactions. On the other hand, psychological
adaptation includes intra-psychic aspects such as feelings of well-being and emotional
satisfaction. In the present research psychological adaptation was assessed with
measures of depression and well-being, and socio-cultural adaptation was assessed with
two measures of social anxiety. Social anxiety as assessed by the SAD scale is by
definition, an expression of discomfort in or about, interpersonal situations; and fear of
negative evaluation as assessed by the FNE Scale was defined by the scale's authors as
“apprehension about other's evaluation, distress over their negative evaluation, and the
expectation that others would evaluate one negatively”, and suggested that “fear of loss
of social approval would be identical to FNE” (Watson & Friend, 1969, p.449). That
Regressive migrants scored highest on both measures suggests, therefore, that social
relationships with host nationals (and perhaps co-nationals as well) may have reduced
their sociocultural and psychological adaptation. This is corroborated by their
significantly lower scores on the Positive relations with others subscale of the
psychological well-being measure.
Research question 1b: How is ethnic identification reflected in I-position?
Participant types were found to differ little demographically. This is unsurprising as the
study sample was limited in the range of socio-economic status (most were middle-
class), age range (most were in mid-life), and education (most were educated to tertiary
level). Most too were from middle-income countries such as Mexico and Malaysia. But
one variable, ethnic identity, was found to vary significantly between participant types.
The question posed was: “Do you think of yourself as belonging to a particular ethnic
group, for instance Italian, Greek, Chinese etc.?” Of the entire sample, 21% answered
yes, 79% no.

245
This might seem to clash with the requirement that all participants possess “two
identities” (see Chapter 4 Method). However, having an (ethnic) “identity” is different
from “belonging to a particular ethnic group”; the latter requires a continuing active
association with compatriots. It is unsurprising, therefore, to find most of the sample
claiming to have “two identities” but not “belonging to a particular ethnic group”. It is
hard, nevertheless, to glean much from the response to this question as cell-counts were
too small to permit a reliable test of statistical association. That said, it is noteworthy
that all Progressive migrants answered in the affirmative while all Regressive migrants
answered in the negative (the other two, stable, types responded in roughly the same
proportions as the sample in aggregate, and are therefore unexceptional).
This is an unexpected finding, for it suggests that those individuals with the
greatest well-being in Australia are the most involved at a personal level with their own
ethnic communities—and the converse, of course. This might seem counterintuitive, but
as Berry and Sam (1997) point out, integration “appears to be a consistent predictor of
more positive outcomes than the alternatives” (p. 318). If so, those who maintain a close
personal connection with the communities from which they come, as well as
acculturating to the host society, will have the highest well-being. So although all
people in the sample of migrants studied in this thesis were required to be “integrated”
in Berry’s sense, some were apparently more “integrated” than others.
Finally, the present finding of low ethnic identification despite an a-priori
endorsement of the integration strategy by all participants, agrees with Liebkind’s
(2008) notion that while the strength and nature of a migrant’s actual identification with
the in-group will determine much of his or her response to acculturation, it should not,
therefore, be confused with endorsement of native culture and/or adoption of host
culture.
246
Evidence from case studies. Biculturalism and ethnic identification were apparent
in the four case studies that exemplify the four migrant types identified in this study.
The two “stable” migrants—Juan (Low-stable) and Luisa (High-stable)—show
“blended/harmonious” biculturalism. This is evident in the similarity of motive and
affect, whether positive or negative, as between their I-positions for country of origin
and for Australia. For instance, Juan found both cultures equally alienating: in his
country of origin he felt “insecure”, and in Australia he felt “he did not belong” (Table
8.2, p. 206). By way of contrast, for Luisa both cultures were equally welcoming, and
her arrival in Australia “was almost like a homecoming” (Table 8.3, p.221). The point
here is that each person harboured similar feelings towards two cultures, in one case
negative, in the other positive, but nevertheless similar.
The two “unstable” migrants—Yoana (Progressive) and Carla (Regressive)—also
show biculturalism, but of a conflictual kind. Referring to alcohol, of which she
disapproves, Yoana recalls how she recalls a child being encouraged to consume liquor
in her country of origin, while in Australia she had observed the very opposite (Table
8.1, p. 206). Carla, however, “wanted to die If [she] could not go back to Uruguay”
(Table 8.4, p. 230). Both participants participated in the respective cultures of their
countries of origin and Australia, but their biculturalism was of an
“alternating/conflictual” type because its parts could not be reconciled.
9.2.2 Stability and change in the dialogical self
Research question 2a: Are country-of-origin and Australian I-positions similar,
and if so, how? Figure 9.1 summarises the findings as they relate to I-positions of the
four respondent types. The main finding is one of modest change in I-positions in a
context of overall stability of thematic content of valuations. For some participants
(Types 1 and 4), I-positions were unstable, but for most (Types 2 and 3), there was little

247
difference in country-of-origin and Australian I-positions. Specifically, in Study 1, 76%
of participants showed similar thematic profiles in valuations about Australia and
country of origin. Nevertheless, the hypothesis of complete thematic constancy was
rejected.
Type 1 (Progressive) Type 2 (Low-stable)
Type 3 (High-stable) Type 4 (Regressive)
Figure 9.1 Average wellbeing (W), by average self-enhancement (S) and union-with-
the-other (O), by participant type
Note: Circle area represents well-being.
0
5
10
15
20
0 5 10 15 20
O-i
nd
ex
S-index
Origin
Australia
0
5
10
15
20
0 5 10 15 20
O-i
nd
ex
S-index
Origin
Australia
0
5
10
15
20
0 5 10 15 20
O-i
nd
ex
S-index
Origin
Australia
0
5
10
15
20
0 5 10 15 20
O-i
nd
ex
S-index
Origin
Australia
248
This finding supports the theory of the dialogical self given that modest change in
a context of overall stability is essential for any theory if it is to be useful. Hermans
(2006) recognises this when commenting in a therapeutic context:
… stability and change need each other; a certain degree of stability is needed in
order to realize a significant change. The experience of safety and continuity provided
by the stable parts of the valuation system help clients to face the discontinuities in their
lives that otherwise would be disrupting. In other words, stability and change are both
necessary parts of the therapeutic reorganization of the valuation system. (p. 12–13;
italics added)
Researchers in the field of narrative theory (for instance McAdams, 2014) tend to
stress the organising role of the narrative rather than its stability. In fact both are valid.
A story has a plot, which is to say the events in it happen for reasons that are both
plausible and evident. In telling their stories, therefore, individuals are implicitly saying:
“This person I am today is who I have been years becoming” (Rosenwald & Ochberg,
1992, p.9). Thus stability that accommodates incremental and (usually) gradual change
is a necessary attribute of the narrative. In short, the two attributes—coherence and
stability—are one and the same. More generally, McAdams (2001; 2014), in his life
story model of identity, exemplifies this unity when he stresses the integrative nature of
stories, through which the self seeks temporal coherence. Since the self is changing,
self-narratives are constructed to integrate past, present and anticipated future. The life
thus rendered consists of coherent stories with beginnings, middles, and ends
(McAdams, 1985; Polkinghorne, 1988). Likewise Baumeister, Stillwell, & Wotman
(1990) and Gergen & Gergen (1988) regard narratives as personal accounts that make
life intelligible and hence predictable, which they do by imposing a logical structure on
events. Interpreting personal accounts in this way reveals how individuals make sense

249
of their lives: narrators select from a virtually limitless array those moments they deem
significant, and arrange them in a coherent order. This fashioning of order is more than
a chronology; it implies a causal chain.
As noted earlier, Gergen and Gergen (1988) suggested that each event in a
narrative can be viewed as moving through a two-dimensional space. One dimension
refers to its positive or negative evaluation, the other refers to stability or progression.
In their “stability” narrative, there is no change in self-evaluation. It “links incidents,
images, or concepts in such a way that the protagonist remains essentially unchanged
with respect to evaluative position” (1986, p.27). In this case the function of the self-
narrative is to provide the self with unity, continuity, purpose and meaning to life
events: “One’s present identity is thus not a sudden and mysterious event, but a sensible
result of a life story” (p. 19). In this way the narrative form engenders a sense of
continuity by linking past, present and future in a plausible causal chain (Gergen &
Gergen, 1988). Thus, Gergen and Gergen’s (1986) framework for the analysis of
stability narrative structure accounts for coherence, where coherence concerns the
elements in the narrative that relate to the valued end goal.
Research question 2b: Do country-of-origin and Australian I-positions differ, and
if so, how? Where I-positions differed, it was found that they did so in an intelligible
way. When all participants were treated as a single group, the mean values for self-
enhancement (S) and positive affect (P) were significantly higher for Australia than for
country of origin, while union-with-the-other (O) and negative affect (N) did not change
significantly. When participants were furthermore classified into types, further patterns
emerged. Progressive, Low-stable and High-stable migrants, together comprising 84%
of the sample, showed on average more self-enhancement (S) and positive affect (P) in
their Australian than in their country-of-origin valuations. This suggests that most found
250
migration to be rewarding: it apparently gave them scope for self-enhancement (S), and
their well-being (W) rose as a result of increased positive affect (P), particularly so in
the case of Progressive migrants. Regressive migrants, comprising 16% of the sample,
did not benefit in this way: not only did their Australian I-position show less self-
enhancement (S) and union-with-the-other (O), but well-being was lower as a result of
reduced positive affect (P) and increased negative affect (N).
Sanchez-Rockliffe and Symons (2010) studied changes in themes in these data.
Examining self-narratives, they found that many participants seemed to be responding
positively to the social conditions they find in Australia. Once these factors were
controlled for, there were no significant changes in the means of any of the self-
confrontation indices between country of origin and Australia. In other words, these
migrants’ greater self-enhancement (S) and positive affect (P) could reflect a favourable
response to the peaceful, liberal society described by Hirst (2014). Interestingly, for
Progressive and High- and Low-stable migrants, self-enhancement (S) was significantly
higher for their Australian I-position than for their country of origin, but union-with-the-
other (O) was not. A possible explanation for this disparity, which is discussed later, is
that migration accommodates self-enhancement (S) proportionately more than union-
with-the-other (O) since by definition it takes the migrant away from family and friends.
The findings have noteworthy implications for the underlying theory of the
dialogical self. Hermans and Hermans-Jansen (1995) interpret self-enhancement (S) and
union-with-the-other (O) as fundamental motives, as distinct from positive affect (P)
and negative affect (N), which are, as their names imply, affects related to well-being. It
is natural, therefore, to expect positive affect (P) and negative affect (N) to change in
the new social environment offered by migration to another country, as the individual
finds more or less scope for fulfilment. In this way theory explains the observed change
251
in positive affect (P). Changes in motives, such as the observed increase in the self-
enhancement (S), demand a different explanation. They suggest that the social
environment may bring about I-positions that differ in their motives, at least in some
cases. This too is consistent with theory: Hermans and Hermans-Jansen (1995) argue
that motives evolve throughout the lifespan and differ between I-positions (e.g., worker,
spouse, parent).
Finding unity and purpose in life amid constant change—Gergen’s
multiphrenia—has been questioned by theorists such as Gergen (1991). The saturated
and fragmented self depicted by postmodern theorists places the individual at war with
societal change, struggling to make sense of life. Gergen’s “saturated self” has lost
coherence and is instead numbed by a deluge of diverse and opposing messages. In this
postmodern understanding of selfhood, people move from one identity to another as
situations change and life moves on (Lifton, 1993). The findings of the present thesis
are, however, consistent with Gergen. Although most of the sample can be seen as
having overcome multiphrenia, some—the Regressives—can be seen as particularly
affected by it. These are people whose lives are afflicted by the disruption resulting
from changing cultures, which is reflected in their I-positions. In short, multiphrenia
may affect everyone, but not everyone can cope with it. And in terms of multiphrenia,
migration’s acculturative burden is large.
Narrative research into personality development has focused either on story-
telling in particular social contexts, or on the content of the stories told (McAdams,
2012). The present thesis belongs to the body of work that explores how story content
makes meaning out of important life experiences and draws connections between them.
Hermans and McAdams both focus on the content of self-narratives, noting that self-
narratives differ in the importance they give to Bakan’s (1966) themes of “agency” and
252
“communion” (Hermans, 1988, 1996, 2010; McAdams, 2003). Consistent with this
approach, the present thesis examined the autobiographical events the participants
considered important when thinking about their lives, and evaluated their content in
terms of two motives—self-enhancement (S) and union-with-the-other (O)—as they
differed across time and space. It sought to compare migrants’ self-narratives in terms
of the degree to which self-enhancement (S) or union-with-the-other (O) dominated the
narratives across time (self-narratives from the past, present and future) and space (self-
narratives from country of origin and from Australia). The findings are consistent with
Hermans’ (1988, 1996, 2010) narrative theory of personality, and offer an alternative to
the modern notion of the self. Unlike the saturated postmodern self, in which plurality
translates into fragmentation or saturation, the dialogical self is fluid and multiple
(Hermans (2001). Although theorists of the dialogical self talk of multiple I-positions,
there is a substantial self that persists unchanged (Richardson, Rogers, & McCarroll,
1998). According to Hermans (1996a, cited in McAdams, 2003):
One’s life becomes a story with a cast of self-characters who assume different
positions in the narrative, take on different voices, represent different self-facets,
personify significant trends during different developmental chapters—all is in the
same evolving story, the same identity. (p. 193)
Evidence from case studies. The coexistence of “modest change in a context of
overall stability” is evident in the four case studies chosen to exemplify the four migrant
types identified in this study. Two migrants represent the stability of the dialogical self,
though from diametrically opposed stand-points. Juan (Low-stable) experiences “mental
struggle and survival—stable, but compromised by underachievement” (Section 7.3,
p.188). Luisa (High-stable) experiences “building on a strong sense of herself and
achieving more—stability crowned by emotional reward” (Section 7.3, p.196).
Together, these two migrant types account for most of the sample. Two other migrants
253
represent change in the dialogical self, also from diametrically opposed stand-points.
Yoana (Progressive) experiences “setting new and very different goals, and achieving
them—truly a progression to better things” (Section 7.1, p.181). Carla (Regressive)
experiences a “distancing from all she holds dear. She clings to a receding past, and
when finally she revisits it, mirage-like it is no longer there. This is a story of regression
from a desired state” (Section 7.4, p.205). Together, these two migrant types account for
a minority of the sample.
9.2.3 Composition of I-positions
Research question 3a: Can individuals simultaneously possess I-positions that
differ significantly in their major themes? This question can be addressed by
demonstrating that some individuals have multivalent I-positions, meaning that they
express significant major themes with both positive affect (P) and negative affect (N).
Such individuals cannot have a single coherent I-position but speak with multiple
voices. About 39% of the sample (15 of 38 participants—see p. 185 and Table 7.3) were
found to be multivalent in this sense. This shows that a large subset of the sample had I-
positions with unambiguously different thematic content. They are thus evidence for
Hermans’ dialogical view of the self (Hermans & Hermans-Jansen, 1995) and are
harder to explain under views that emphasise an underlying integrated self, such as that
of McAdams (2014). Moreover, the multivalence of these individuals is not an artefact
of different experiences in Australia and country of origin: of the 15 identified
multivalents, all but three were also multivalent in narratives concerned with the
country of origin.
Research question 3b: If individuals simultaneously possess I-positions that differ
significantly in their major themes, as discussed above, do their I-positions correspond
to those for country of origin and Australia? If so, in what way? Participants’ I-
254
positions were found to differ between country of origin and Australia. For all but
Regressive migrants, self-enhancement (S) and positive affect (P) were significantly
higher for their Australian I-position. For the stable types—Low-stable and High-
stable—the increase was small but nevertheless statistically significant; for Progressive
migrants it was large. This is consistent with the view that many, though not all,
migrants acquire I-positions pertaining to their country of settlement that differ
motivationally so as to profit from its different environment and opportunities, and this
benefit is manifest as increased well-being.
This still leaves several questions. First, why was the difference small for most of
the sample? This can be explained by the stability of personal identity, a theme explored
earlier. Motives are more enduring than temporary mood states (McAdams, 2009), more
labile than traits, and reflect “major thematic goals, desires, and preoccupations during a
given period of a particular person’s life” (p. 295). It is therefore to be expected that
although motives can and do change, they normally do not change much or quickly.
A second question that emerges is: Why did Regressive migrants not profit from
new circumstances, as evidenced by their Australian I-position, in the same way as the
others? Instead their Australian I-position regressed both in motives and well-being. For
one reason or another they were unable to adapt so as to profit from their new
environment, which they found less congenial than the one they had left. Interestingly,
the reduction was greater for union-with-the-other (O) than for self-enhancement (S).
This suggests that such migrants suffered particularly as a consequence of separation
from friends and family, and their difficulty in relating to others in an unfamiliar
culture—not unexpected for a migrant. Though only a small proportion of the sample,
they clearly merit further study.

255
The third and final question is: Why did self-enhancement (S) differ significantly
and not union-with-the-other (O)? This is answered in the next section, which explores
the relative motivations of successful migrants.
Research question 3c: What motivates successful migrants: the desire for self-
enhancement or union-with-the-other? Progressive participants showed significantly
more self-enhancement (S) in their Australian than in their country of origin I-positions;
Low- and High-stable participants, marginally more; and Regressive participants
significantly less. However, in no case did their union-with-the-other (O) differ
significantly. A possible explanation is that migration accommodates self-enhancement
(S) proportionately more than union-with-the-other (O) since by definition it takes the
migrant away from family, friends and a familiar culture. Another kind of life-change—
one that offered scope for union-with-the-other (O), such as migration for the purpose of
family unification—might have displayed a similar boost in affect for some individuals.
But that was not the case in the current study.
According to Ward and Kennedy (1994) psychological adjustment is influenced
by social support and personality, with adjustment being predicted when there is a fit
between the migrants’ traits and host nationals’ traits. In this line of research, a close fit
between migrants’ self-construals in their country of origin and their self-construals
predominant in the host society predicts migrants’ psychological adjustment.
Singelis (1994) argued that individuals have both independent and interdependent
self-construals that are manifest in individualist and collectivist attitudes. The attitudes
that predominate in a given social context depend on the nature of the relationship,
whether with a spouse, parent, neighbour, co-worker, or other party (Matsumoto,
Weissman, Preston, Brown & Kupperbusch, 1997; Matsumoto et al., 1997).
Reinterpreting pre-existing measures of individualism and collectivism, Singelis (1994)

256
showed that Asian Americans scored higher on the interdependent and lower on the
independent self-construal factor than did European Americans. His independent self-
construal items were mostly concerned with individual agency, whereas his
interdependent items mostly concerned self-ingroup relationships. His study suggests
that differences in cultural self-conceptions may be primarily localised in the
individualist self and secondarily in the collective self. Therefore, a key difference may
be the extent to which the self is conceptualised as a goal-directed agent, or embedded
in an in-group, rather than whether the self is conceptualised in relation to other
individuals.
Yet another view is embodied in the “culture fit” hypothesis. Triandis et al.
(1985), defined ‘allocentrism’ (the willing subordination of personal goals to those of
the collectivity) and ‘idiocentrism’ (the prioritising of personal goals above those of the
collectivity) as personality traits that are analogous at the individual level to
collectivism and individualism at the community level. The culture fit hypothesis holds
that allocentrism and idiocentrism are linked to their community-level analogs. Ward &
Chang (1997) found that allocentrics are generally better adjusted in collectivist, and
idiocentrics in individualist, cultures.
In elaboration, Triandis and Suh (2002) state: “The idiocentrics in collectivist
cultures are more likely than the allocentrics to feel oppressed by their culture and to
seek to leave it” (p.141, italics added). This may explain why Low- and High-stable
migrants showed higher self-enhancement (S) in their Australian self-narratives, for as
people who have chosen to migrate, they are predominantly idiocentrics; and as
idiocentrics, they “emphasise self-reliance, competition, uniqueness, hedonism, and
emotional distance from in-groups” (Triandis and Suh, 2002; p.140)—all traits
characteristic of self-enhancement.
257
The results of the present thesis are relevant to the current understanding of the
relationship between sociocultural and psychological adjustment factors among
integrated migrants, that is, ones who identify as having two cultural identities. In a
pluralistic society such as Australia, migrants who adopt Berry’s integration strategy
desire to be in, not between, two cultures. But, in the study sample of integrated
migrants, there were individual differences in the manner of relating to the dominant
culture and to the native culture. Regressive migrants showed low involvement in
positive relationships in Australia, which points to their preference for a separation
strategy, at least in this domain. Their ambivalence about interpersonal relationships
with members of mainstream society, as exhibited by higher measures of social anxiety
and fear of negative evaluation, may be due to perceived rejection, prejudice or
discrimination in Australia. Consequently they tend to avoid contact with members of
the mainstream society. That they showed high involvement with members of their
native culture in their country-of-origin narratives supports this view, as it is these
narratives that offer comfort, security and self-respect.
Evidence from case studies. Multivalence of the dialogical self emerged in two of
the four case studies that exemplify the four migrant types identified in this study. In a
valuation pertaining to his country of origin Juan (Low-stable) states, “My father is fair
but inflexible. I learnt from him that rules were not to be bent or broken.” Likewise
when Carla (Regressive) states, “My extended family was important... I was doted on...”
(Table 7.4), she is both appreciative (shown by a high O motive) and at the same time
perhaps feeling suffocated (shown by a high S motive). The fact that these valuation rate
highly on both positive and negative affect strongly suggests that they were being
viewed from different I-positions (though in this case not ones associated with country
of residence).
258
Evidence of adjustment to migration and for differing motives for migration
(more S, same O) is found in the many valuations pertaining to the Australian I-position
that both emphasise personal achievement and show high positive affect. Luisa (High-
stable) is an example when she writes, “I knew we had challenges ahead [in Australia],
but I had great confidence.”
9.2.4 Psychological distress and well-being
Research question 4: How do migrants, when classified by their I-positions
pertaining to country of origin and Australia, vary in psychological distress and well-
being? As part of Study 1, participants were scored for psychological distress and
psychological well-being (not to be confused with well-being as computed from their
self-confrontation indices). Psychological distress was measured using three scales:
SAD, FNE and BDI-II. On the SAD scale, Progressive migrants were in general less
socially anxious than the other types, though the difference from Regressive migrants
was of borderline significance, probably due to the smallness of the sample. On the
FNE scale, Low-stable migrants were more fearful of negative evaluation than the
High-stable. Again, the smallness of the sample may have prevented significant
differences being found where otherwise they would have been expected: between, say,
Progressive and Regressive migrants. Lastly, on the BDI-II scale, no significant
differences were found between migrant types on depression.
Participants also provided self-evaluations of psychological well-being using
Ryff’s Psychological Well-being Scale. Significant differences were found in only one
of the six subscales: Positive relations with others. Regressive migrants had
significantly worse relations with others than did Progressive and High-stable migrants.
Low-stable migrants on average rated above Regressive, and below Progressive and
High-stable migrants, but the differences were not significant.

259
In summary, migrants varied in their psychological states in a plausible and
consistent way. In general, Progressive and High-stable migrants were lowest on
distress and highest on well-being; Regressive migrants were the opposite; and the
Low-stable migrants were intermediate. Where no significant differences were
discerned, it is probably explained by the smallness of the sample.
Work by Searle and Ward (1990; Ward & Kennedy, 1992) on the prediction of
psychological and socio-cultural adjustment during cross-cultural transitions may help
to explain these findings. To recap, socio-cultural adaptation (Ward & Searle, 1990)
concerns the relationship between migrants and their host society, and it includes their
ability to cope with the everyday issues that require social interactions. On the other
hand, psychological adaptation includes intra-psychic aspects such as feelings of well-
being and emotional satisfaction. In the present research, psychological adaptation was
assessed by means of measures of depression and well-being, and socio-cultural
adaptation was assessed by means of measures of social adjustment (the SAD scale) and
sociocultural adaptation (the FNE scale). The SAD scale is, by definition, a measure of
discomfort in, or about, interpersonal situations, and the FNE Scale is defined as
“apprehension about other's evaluation, distress over their negative evaluation, and the
expectation that others would evaluate one negatively”, and the authors suggested that
“fear of loss of social approval would be identical to FNE” (Watson & Friend, 1969,
p.449). That Regressive migrants scored highest on both measures suggests, therefore,
that social relationships with host nationals (and perhaps co-nationals as well) may have
reduced their sociocultural and psychological adaptation. This is corroborated by their
significantly lower scores on the Positive relations with others subscale of the
psychological well-being measure.
260
Ward and Searle (1991) and Ward and Kennedy (1994) support these findings.
They found that migrants who identify strongly with the culture of their country of
origin tend to be psychologically well adjusted; and those who identify strongly with
their host country tend to be socio-culturally well adjusted. Further support of this came
from Ward and Rana-Deuba (1999), who found that identification with culture of origin
is the most salient factor in the migrants’ psychological well-being and is associated
with a decrease in depressive symptoms. They found that those who identify strongly
with their origin culture experience most social difficulty in the host culture, which
impedes sociocultural adaptation. Though identification with one’s origin culture is
generally beneficial and is not a problem for socio-cultural adjustment, it becomes one
when identification with the host culture is weak, as it may impede culturally
appropriate behaviours and attitudes. Ward and Kennedy (1994) found that the greatest
social difficulty was experienced by those who distanced themselves from the host
society in a strategy of “separation”.
The notion of different preferences according to whether the domain is public
(functional or utilitarian) or private (emotional, value-oriented) may also explain the
findings for the Regressive migrants. Their preference for sociocultural adaptation and
cultural maintenance may vary across life domains, so that while emphasising the need
for both native and host culture identities, their host culture identity integration is
expressed in the public domain, where they may seek economic or work integration,
while in their private domain they prefer to adopt and maintain a separation strategy.
Such a pattern of cultural alternation has been found to be most adaptive. For instance,
in an investigation of how migrants adapted culturally in different life domains, Arends-
Toth and van de Vijver (2003) found that Turkish migrants in the Netherlands adapted
more to Dutch culture in the public domain than in the private, but that cultural
261
maintenance was important in both—that is, Turkish culture was preferred at home and
Dutch elsewhere. In Berry’s terminology, these migrants favoured separation in the
private domain but integration in the public domain. Likewise, Phalet and Andriessen
(cited in van de Vijver & Phalet, 2004) found that the acculturation profile of successful
minority students appeared to alternate between separation in the family and integration
at school.
In the present thesis, Regressive migrants were the least adapted in terms of
psychological distress and well-being measures, as described earlier. Indeed, the
importance of host society social networks has been noted by others. For example,
LaFromboise et al. (1993) proposed that successful bicultural (Integrated) migrants are
those who have established a stable social network with host nationals in the new
culture. They argued that it was the attainment of this social network that constituted an
important outcome of second-culture acquisition and one that enhanced the migrant’s
ability to cope with life in a bicultural environment. This interpretation may explain the
Regressives’ significantly lower score on the Positive relations with others subscale of
the psychological well-being measure.
The literature regarding the importance of social support for psychological well-
being is ambiguous as to the source of social support: some researchers emphasise good
relationships with host nationals (Furnham & Bochner, 1986), others emphasise good
relationships with co-nationals (Searle &Ward, 1990). Also, while the sample in some
of this research was limited to a particular type of migrant such as sojourners (Ward &
Kennedy, 1994), who reside in a host society for a relatively brief period, the present
sample consists exclusively of people who came to Australia intending to stay
indefinitely. Such migrants must be concerned with their relationship to the host society
(Taft, 1977), and the present finding that at least some Integrated migrants who, despite
262
having lived in Australia for years still have difficulty in social adaptation, indicates that
attaining social belongingness in a non-native culture is not automatic. There seems to
be more to integration and adjustment than meets the eye, with different levels of
adaptation within the one strategy. More research is needed to elucidate this.
The literature suggests that a strategy of integration is associated with fewest
psychological difficulties (Berry & Sam, 1997; Ward & Kennedy, 1994). The present
findings support the view that integration is insufficient for optimal adaptation, at least
for some migrants. In contrast, migrants who had positive relationships with host
nationals and felt accepted by them (Progressive and High-stable) were well adapted
both socio-culturally and psychologically. Their positive attitudes towards interactions
with host nationals may have helped them to receive social support and hence cope
more effectively. The present findings agree with Arends-Toth and van de Vijver’s
(2004) notion that within integration—the combination of adaptation and cultural
maintenance—there are many variations in how it is managed and negotiated between
migrants and the host society as a result of the various possible combinations of
cultures. It points to the need of having the term “integration” more precisely defined in
further research and theory. As Arends-Toth and van de Vijver’s (2006) note, it is
plausible that given migrants’ massive preference for integration, most variations occur
within integration and not between acculturation orientations.
9.2.5 Idiographic Support
Research question 5: Are differences between individuals classified by their I-
positions reflected in the life stories of specific case studies? Good matches were found
between the case studies and the participant types they represent, and in this way Study
3 corroborated Studies 1 and 2. A single case study was chosen to represent each
participant type, four in all, and the content of their valuations described. Figure 9.2
263
displays the patterns relating to each participant type. Yoana’s self-narrative is of setting
new and different goals, and achieving them—truly a progression to better things. She
exemplifies the Progressive migrant. Juan’s self-narrative is of mental struggle and
survival—stable, but compromised by underachievement. He exemplifies the Low-
stable migrant. Luisa’s self-narrative of building on a strong sense of herself and
achieving more—stability crowned by emotional reward. She exemplifies the High-
stable migrant. Carla’s self-narrative is of distancing from all she holds dear. She clings
to a receding past, and when finally she revisits it, mirage-like it vanishes. This is a
story of regression from a desired state. She exemplifies the Regressive migrant.

264
Type 1 (Progressive) Type 2 (Low-stable)
Type 3 (High-stable) Type 4 (Regressive)
Figure 9.2 Proportion of valuations, by major theme, location, and participant type
Note: Arrows represent direction and indicative magnitude of significant differences in the
composite I-position of all participants of each specified type.
Gergen and Gergen’s (1988) narrative forms are evident in participants’ self-
narratives. Their narrative forms echoed those in the literary tradition of the Western
world, with Frye (1957) noting that positively toned stories often take the form of
“comedy” or “romance”—where the protagonist succeeds; and negatively toned stories
often take the form of “tragedy” or “irony”—where the protagonist fails. Gergen and
Gergen establish the narrative plot and, within it, which incidents should be construed
+HH
+O
-O
-LL
-S
+S
Origin
Australia
+HH
+O
-O
-LL
-S
+S
Origin
Australia
+HH
+O
-O
-LL
-S
+S
Origin
Australia
+HH
+O
-O
-LL
-S
+S
Origin
Australia
265
as advances, retreats or digressions. They distinguish progressive, regressive, and
stability narratives. Progressive narratives begin with negative affective evaluations of
events but proceed over time to positive ones, such as the well-being and success of the
protagonist. Regressive narratives begin with positive affective evaluations that become
progressively more negative, ending with failure. Stability narratives may be either
positive or negative in affective tone but do not change evaluative valence over time.
Any life story may draw on these evaluative trajectories, and so provide thematic
coherence to a life: “My Life has been all uphill” or “My life has been a series of ups
and downs” (Habermas & Bluck, 2000).
As noted earlier, in a redemption sequence the narrator relates how bad turns to
good. Although there are likely to be multiple outcomes of given life event, the
redemptive narrator dwells on the positive—as do Progressive migrants. By contrast, in
a contamination sequence the narrator dwells on the negative consequences of a positive
event—as do Regressive migrants. In both cases, the narrator chooses what to relate and
what to omit. This has implications for how self-narratives are to be interpreted and why
they are so revealing. For if it is accepted that in their self-narratives people are
attempting to provide an accurate accounting of events (Gergen & Gergen, 1988), then
individual differences in narrative style and content reflect psychosocial adaptation as
much as what actually happened.
9.3 Directions for Future Research
The previous section showed how the findings of the present thesis addressed the
research questions that were set for it, and how they did so in the context of existing
research. This section looks towards future directions for research emanating from the
present findings. First it critically examines the theoretical and methodological strengths
and limitations of the three studies that make up the thesis. Then it suggests future
266
directions for research designed to exploit the identified strengths and to overcome the
weaknesses.
9.3.1 Strengths and Limitations
Although its antecedents go back a century or more, dialogical self theory came to
prominence with Hermans’ work published in the 1990s. It is now one of several
leading personality theories. While not dominating or supplanting, other theories, it
does offer additional insights, particularly in the field of cultural psychology.
Until recently Berry’s model of acculturation was arguably the most widely held.
However, globalisation has since given rise to cultural mixing on an unprecedented
scale. No longer do migrants leave their countries of origin expecting never to return.
Instead they may maintain contact with frequent visits and even more frequent
telecommunication. The result has been cultural hybridisation and a range of related
issues that all demand an explanatory model. These include power imbalances between
minority and majority cultures, and strategies for mitigating the uncertainty that results.
Acculturation theories such as Berry’s, that see cultures as essentially
dichotomous, have been criticised as unable to account adequately for these phenomena.
Dialogical self theory, which accommodates the many paths by which individuals can
negotiate their cultural identities, is more accommodating. As both a cause and a
consequence of its wide acceptance, dialogical self theory has been applied by
numerous practitioners and researchers to a range of circumstances besides
acculturation. Nevertheless, work remains to be done on testing and refining the theory.
The present thesis contributes to that goal by contributing theoretical insights and by
strengthening the empirical evidence base of the theory of the dialogical self.
The dialogical self as a frequency distribution of valuations. In representing a
person’s I-positions as a frequency distribution of valuations categorised by major
267
theme, this thesis introduces a new way of describing the dialogical self. The modes of
this distribution correspond to frequently occurring self-narratives that are generically
similar. In fact, much of the empirical work in this thesis is interpretable as estimating
modal themes from collections of self-narratives. A frequency distribution does not
capture the full richness of the dialogical self nor the I-positions that compose it, since
the theory concerns not just I-positions but the relationships between them; but it does
offer valuable conceptual insights for exploring the changes in the dialogical self that
arise when people encounter changed social environments. Moreover, once it is
accepted that valuations are in effect ‘sampled’ from an underlying population that
represents the self, then the appropriate techniques for the statistical analysis of data
pertaining to valuations become clear, namely those of sampling theory.
Filling a research need. Several authors have acknowledged the lack of
empirically based investigation into dialogical self theory (Lyddon et al., 2006;
Hermans and Dimaggio, 2007; Hermans, 2008; Stemplewska-Żakowicz et al., 2005).
One reason for this lack may simply be that the theory is still quite recent (Hermans,
2006). Though foreshadowed in Hermans’ writings (Hermans, 1987a, 1987b, 1988,
1989, and 1992), the term “dialogical self” was introduced as late as 1992 (Hermans,
Kempen & Van Loon, 1992). Another may be the very richness of the theory, which
transcends the traditional confines and challenges the core assumptions of narrative
psychology in a quite radical way (Hermans, 2006):
Whereas narrative psychology typically assumes the existence of one more or less
integrated self-narrative, dialogical psychology assumes that dialogue is able to
surpass any existing narrative. This implies that dialogue may disrupt or
undermine any existing narrative and that the shift toward another position may
lead to a different story, even about the “same” events. (pp. 22–23)
268
This research has helped to fill this research gap in two ways. First, it used a
larger sample of valuations than did earlier studies (see Table 5.8), and so permits a
more sophisticated quantitative analysis. Second, its sample is demographically more
similar to its majority culture (see Tables 5.8 and 5.9) than are the samples used by the
other studies to which it is compared, which tend to be drawn from students or clinical
patients. Student samples assist in the development of empirical support, and clinical
samples are relevant to the SCM as a therapeutic tool. However, the dialogical self is a
general theory, so it is of value to test it with a general sample as well, as it reduces the
risk that differences in I-position repertoires could be due to demographic differences
and not cultural ones.
This thesis draws its data from a sample of participants who are neither university
students nor in therapy. This study fills a gap in the literature by focusing on non-
clinical participants. Moreover it considered approximately 1600 valuations, which may
be the largest such set of data anywhere in the literature. Lastly, most studies of the
dialogical self to date have been case studies with an idiographic approach (Lyddon,
Yowell, & Hermans, 2006; Dimaggio, Salvatore, Azzara & Catania, 2003; Hermans,
1996b; Hermans & Hermans-Jansen, (1995); Hermans, 1987). Valuable as these are,
they do not (nor are intended to) generate datasets suitable for the kind of statistical
analysis conducted for this thesis.
9.3.2 Scope for Further Work
Generalising the findings. Although the findings were limited by the relative
homogeneity of the sample, this is not necessarily a limitation. The aim of the present
thesis was not to construct a universal model of migration but to test specific hypotheses
that did not of themselves demand a representative (hence large and diverse) sample;
and for that purpose the sample was statistically adequate. It is nevertheless true that the
269
sample was insufficient to allow statistical hypothesis testing where cross-tabulation
was required, which prevented inference about specific subgroups of migrants. Even
were this possible, the scope for generalisation would have been limited by the
narrowness of the participants’ demographics. Most were middle-class, in mid-life, and
well educated, and many were from middle-income countries like Mexico and
Malaysia. This would have introduced a considerable bias, as according to a meta-
analysis by Moyerman and Forman (1992), the socio-economic status of the migrants
had the strongest and most consistent influence on the acculturation process, to the
extent that they considered it a protective factor for acculturation. As for how education
is related to acculturation, Phinney and Flores (2002) note that many migrants migrate
in order to improve their social status; education is one means of achieving this. Hence
higher levels of education are more likely to expose migrants to mainstream values and
ideas and to lead to jobs in mainstream settings. Suinn, Ahuna, and Khoo (1992)
demonstrated that higher levels of education boost host culture identification. So, had
the present sample included blue-collar and older migrants, or those from poor
backgrounds in low-income countries, the findings might have been different. Another
causal factor is the voluntariness of migration. The present study restricted the sample
to voluntary migrants. But it is impossible a priori to hold voluntariness completely
constant. Some “voluntary” migrants—for instance spouses and, more so, adolescents—
have little or no say in the matter, as they migrate as part of a family group: Carla,
discussed previously as a case study, is an example.
The role of such variables is a promising area for further application of dialogical
self theory. Research could be conducted with different types of migrants from different
countries of origin and destination to explore the differences between migrant groups
and countries.
270
Study design: longitudinal vs cross-sectional. The present research analyses a
cross-section of individuals observed at a single point in time. This implies that
temporal variation cannot be used to ascertain directions of causality. Roughly half of
the valuations pertain to events that occurred in the past, often the distant past: such data
may be termed quasi-longitudinal. Because lifespan development is not controlled for,
little is known as to why I-positions differ as they do, nor why some migrants are stable
and others not.
A longitudinal study would help to deepen the understanding of this aspect of the
migration experience. Intending migrants could be interviewed in terms of their current
sense of their dialogical self before they left, and then interviewed again some years
after arrival in Australia. This would provide clearer idea of the change in, and possible
integration of, their I-positions. Currently it is known where migrants stand in terms
their I-positions, but not how they got there and why; that must be inferred.
Implications for policy. The findings of the thesis may furnish practical insights
into the specific field of migration policy. According to König (2009), there is a
pressing and growing need, and a dialogical approach is a promising way to address it.
In a study of migrants to the Netherlands, she found that “acculturation is facilitated if a
dialogue is encouraged between personal cultural positions about how and why
individuals make and define their personal cultural choices, and these decisions are
explored in an inter- and/or intra-personal dialogue.” Instead, however, “most
integration programmes for asylum seekers in Holland submerge the fresh immigrant
under a layer of knowledge about the new environment in a classroom setting” (p. 117).
Dialogical self theory can in principle contribute in two ways: clinical and
psychoeducational. But first, research is needed to enable interventions to be targeted to
those who would benefit. For while this thesis has established that migrants differ in
271
their capacity to prosper in Australia, there is as yet no way to predict the path that each
intending or recent migrant will take.
In some cases migrants’ evaluations of their country of origin is a reliable guide.
For instance, Low-stable migrants (see Figure 9.1) tend to harbour negative affective
evaluations of their country of origin to a degree that distinguishes them from other
types of migrant; and furthermore they tend not to prosper psychologically in Australia.
So on that basis it might be possible to target them for early intervention. But other
migrants are harder to target. For instance, Regressive and High-stable migrants share
positive affective evaluations of their country of origin, but the High-stable migrants
prosper in Australia while the Regressive migrants do not (see Figure 9.1). Diagnostic
procedures are needed to distinguish these groups.
Dialogical self theory, possibly through the application of content analysis of self-
narratives, is a promising candidate, especially given its longstanding therapeutic role in
helping individuals integrate negative experiences into their life story. In this it could be
complemented by self-report measures of depression and anxiety, since these were
found to be more prevalent among the target migrant types. Resources did not permit
the present thesis to go into this level of detail, but the database of evaluations is
available in electronic form for future researchers.
9.4 Conclusions
The research conducted in this thesis used Hermans’ theory of the dialogical self
and the self-confrontation method to study the effect of migration on the self. A sample
of 38 migrants to Australia was interviewed in depth and the data analysed in several
ways. Specifically, it was established that (1) those migrants that see themselves as
having two perspectives (I-positions of country of origin and Australia) do actually
differ in the contents in their perspectives; (2) the differences between the two

272
perspectives, while significant, is not large; and (3) such differences as were observed
are characterised by meaningful patterns that are related to wellbeing and adjustment.
Overall, the research found evidence for Hermans’ dialogical view of the self and
against the hypothesis of an underlying integrated self.
Study 1 found that most migrants showed greater self-enhancement (S) in their
Australian than in their country of origin I-positions, whereas union-with-the-other (O)
did not differ significantly, suggesting that migration accommodates self-enhancement
(S) proportionately more than union-with-the-other (O). Migrants furthermore were
found to vary in their psychological states in a plausible and consistent way. Those who
showed greater self-enhancement (S) in their Australian than in their country of origin I-
positions were also lowest on distress and highest on well-being. Study 3 corroborated
the findings of Study 1 in a set of case studies.
Study 2 found there to be overall stability in migrants’ motives and affect, and
where differences occurred, they were intelligible. The research corroborates previous
research that identifies two modes of biculturalism: compatible and oppositional: most
migrants viewed their heritage and host cultures as complementary, whereas a minority
viewed them as discrepant and conflicting.
Besides these findings, the present research has advanced the methodological
basis of analysing data generated by the self-confrontation method (SCM). Much
previous research using SCM data has taken a case-study approach, and has been
largely qualitative in approach. The present thesis complements this with its largely
quantitative emphasis, and contributes to filling an acknowledged research gap.

273
Glossary
Valuation A unit of meaning from an individual’s self-expressed life-narrative
(Hermans and Hermans-Jansen, 1995, p.15).
“[A]nything that a person finds to be of importance when thinking about
his or her life situation” (Hermans, 1988, p.792).
Self-narrative An individual’s account of his or her life containing all that individual’s
valuations.
Valuation system People organise their valuations into self-narratives that situate them in
time and space—a valuation system. The valuation system is a
composite of changing valuations.
Self-confrontation
indices
Four indices (S, O, P, N) that are attached to valuations by means of the
self-confrontation method (SCM).
Self-confrontation
method (SCM)
The prescribed interviewing procedure for eliciting self-confrontation
indices (S, O, P, N) pertaining to valuations.
Theme The vector of self-confrontation indices (S, O, P, N) pertaining to a
valuation, as measured by the self-confrontation method (SCM).
Major theme Each of six categories into which many (but not all) themes can be
placed by means of a set of computable rules. Major themes are believed
to be of psychological significance.
“[G]eneral types of valuation, which reflect the organizational structure
of the person’s valuation system… can be conceived of as major
themes…” (Hermans and Hermans-Jansen, 1995, p.73)
I-position The hypothetical author of a valuation. It will usually be the case that a
single I-position is the author of many valuations. Typically these
valuations will arise from similar contexts.
Dialogical self The dialogical self arises when the set of valuations has many I-
positions.

274
Distribution of
themes
The frequency distribution of themes from the full set of self-narratives
an individual might express.
Modal theme The modes of an individual’s distribution of themes.

275
References
World Migration in Figures A joint contribution by UN-DESA and the OECD to
the United Nations High-Level Dialogue on Migration and Development, 3-4
October 2013
Adams G., & Markus H. R. (2001). Culture as patterns: An alternative approach to
the problem of reification. Culture & Psychology 7, 283–296.
Aldenderfer, M. S., & Blashfield, R. K. (1984). Cluster analysis. Newbury Park,
CA: Sage Publishing.
American Psychiatric Association (1994). Diagnostic and Statistical Manual of
Mental Disorders, Fourth Edition (DSM IV). Washington DC: Author.
Anderberg, M. R. (1973). Cluster analysis for applications. New York: Academic
Press.
Andreouli, E. (2013). Identity and acculturation: The case of naturalised citizens in
Britain. Culture & Psychology, 19, 165–183.
Arends-Toth, J., & van de Vijver, F. J. R. (2003). Multiculturalism and
acculturation: Views of Dutch and Turkish-Dutch. European Journal of
Social Psychology, 33, 249–266.
Arends-Toth, J., & van de Vijver, F. J. R. (2004). Domains and dimensions in
acculturation: Implicit theories of Turkish-Dutch. International Journal of
Intercultural Relations, 28, 19–35.
Argyle, M. (1982). Intercultural communication. In S. Bochner (Ed.) Cultures in
contact: Studies in cross-cultural interaction (pp. 61–80). Oxford: Pergamon.
Arkowitz, H., Lichtenstein, E., McGovern, K., & Hines, P. (1975). The
behavioural assessment of social competence in males. Behaviour Therapy, 6,
3–13.
Arnett, J. J. (2002). The psychology of globalization. American Psychologist,
57(10), 774–783.
Atlas, G. D. (1994). Sensitivity to criticism: A new measure of responses to
everyday criticisms. Journal of Psychoeductional Assessment, 12, 241–253.
Australian Bureau of Statistics (2013, December). Migration, Australia (no.
3412.0). Retrieved from http//:www.abs.gov.au/
Aveling, E., & Gillespie, A. (2008). Negotiating multiplicity: Adaptive
asymmetries within second-generation Turks’ “society of mind”. Journal of
Constructivist Psychology, 21(3), 200–222.
276
Bakan, D. (1966). The duality of human existence. Chicago: Rand-McNally.
Bakhtin, M. (1973). Problems of Dostoevsky’s poetics (2nd
ed.) (Translated by R.
W. Rotsel.) Ann Arbor, MI: Ardis. (Original work published 1929).
Barcinski, M., & Kalia, V. (2005). Extending the boundaries of the dialogical self:
Speaking from within the feminist perspective. Culture & Psychology, Vol.
11(1), 101–109.
Blasfield, R. K., & Aldenderfer, M. S. (1988). The methods and problems of
cluster analysis. In J. R. Nesselroade & R. B. Cattell (Eds.), Handbook of
multivariate experimental psychology (pp. 447–473). New York: Plenum.
Barresi, J. (2002). From `the thought is the thinker' to `the voice is the speaker':
William James and the dialogical self. Theory & Psychology 12, 237–250.
Barresi, J. (2011). Time and the dialogical self. In H. J. M. Hermans & T. Gieser
(Eds.), Handbook of dialogical self theory (pp. 46-62). Cambridge:
Cambridge University Press.
Beauchaine, T. P., & Beauchaine, R. J. III (2002). A comparison of maximum
covariance and k-means cluster analysis in classifying cases into known taxon
groups. Psychological Methods, 7, 245–261.
Beck, A. T., & Steer, R. A. (1993). Manual for the Beck Depression Inventory, San
Antonio, Texas: The Psychological Corporation. Hartcort Brace & Company.
Beck, A. T., Steer, R. A., & Brown, G. K. (1996). Manual for the Beck Depression
Inventory-II. San Antonio, Texas: The Psychological Corporation. Harcourt
Brace & Company.
Bell, N. J., & Das, A. (2011). Emergent organization in the dialogical self:
Evolution of a ''both'' ethnic identity position. Culture & Psychology 17, 241–
262.
Bem, D. J. (1972). Self-perception theory. In L. Berkowitz (Ed.), Advances in
experimental social psychology (Vol. 6, pp. 1-62). New York: Academic
Press.
Benet-Martinez, V., & Haritatos, J. (2005). Bicultural identity integration (BII):
Components and psychological antecedents. Journal of Personality, 73,
1015–1050.
Benet-Martinez, V., Lee, F., & Leu, J. (2006). Biculturalism and cognitive
complexity: Expertise in cultural representations. Journal of Cross-Cultural
Psychology, 37, 386–407.

277
Benet-Martinez, V., Leu, J., Lee, V., & Morris, M. (2002). Negotiating
biculturalism: Cultural frame switching in biculturals with oppositional versus
compatible cultural identities. Journal of Cross-Cultural Psychology, 33, 492-
516.
Berger, P. (1966). Identity as a problem in the sociology of knowledge. European
Journal of Sociology, 7, 105–115.
Berger, P. L. (1963). Invitation to sociology. Garden City, NY: Doubleday.
Berry, J. W. (1980). Acculturation as varieties of adaptation. In A. M. Padilla
(Ed.), Acculturation: Theory, models and some new findings (pp. 9–25).
Boulder CO: Westview.
Berry, J. W. (1984). Cultural relations in plural societies: Alternatives to
segregation and their sociopsychological implications. In N. Miller & M.
Brewer (Eds.), Groups in contact. New York: Academic Press.
Berry, J. W. ( 1985). Psychological adaptation of foreign students in Canada. In R.
Samuda, & A. Wolfgang (Eds.), Intercultural counselling (pp. 235–248).
Toronto: Hogreffe.
Berry, J. W. (1990). Psychology of acculturation. In J. J. Berman (Ed.), Nebraska
Symposium on Motivation, 1989: Vol. 37, Cross-cultural perspectives (pp.
201–234). Lincoln: University of Nebraska.
Berry, J. W. (1992). Acculturation and adaptation in a new society. International
Migration, 30, 69–85.
Berry, J. W. (1997), Immigration, acculturation, and adaptation. Applied
Psychology: An International Review, 46, 5–68.
Berry, J. W. (2001). A psychology of immigration. Journal of Social Issues, 57(3),
615–631.
Berry, J. W. (2002). Acculturation and intercultural relations. In J. W. Berry, Y. H.
Poortinga, M. H. Segall, & P .R. Dasen (Eds.), Cross-cultural psychology:
Research and applications, 2nd
edition, (pp. 344-383). Cambridge: Cambridge
University Press.
Berry, J. W. (2003). Conceptual approaches to acculturation. In K.M. Chun, P.
Balls Organista, G. Marin (Eds.), Acculturation: Advances in
theory, measurement, and applied research. Washington, D.C.: American
Psychological Association.
Berry, J. W. (2005). Acculturation: Living successfully in two cultures.
International Journal of Intercultural Relations, 29, 697–712.
278
Berry, J. W., & Annis, R. C. (1974). Acculturative stress: The role of ecology,
culture and differentiation. Journal of Cross-Cultural Psychology, 5, 382–
406.
Berry, J. W., Kim, U., Minde, T., & Mok, D. (1987). Comparative studies of
acculturative stress. International Migration Review, 21, 491–511.
Berry, J. W., Kim, U., Power, S., Young, M., & Bujaki, M. (1989). Acculturation
attitudes in plural societies. Applied Psychology: An International Review, 38,
185–206.
Berry, J. W., Poortinga, Y. H., Segall, M. H., & Dasen, P. R. (1992). Cross-
cultural psychology: Research and applications (2nd
Ed.). New York:
Cambridge University Press.
Berry, J. W., & Sam, D. (1997). Acculturation and adaptation. In J. W. Berry, M.
H. Seagull, & C. Kagitcibasi (Eds.), Handbook of cross-cultural psychology:
Social behaviour and applications (Vol. 3, pp. 291–326). Needham Heights,
MA: Allyn and Bacon.
Berry, J. W., Trimble, J., & Olmedo, E. (1986). Assessment of acculturation. In W.
Lonner & J. Berry (Eds.), Field methods in cross-cultural research (pp. 291–
334). Newbury Park: CA: Sage.
Betancourt, H.,& Lopez, S. R. (1993). The study of culture, ethnicity, and race in
American psychology. American Psychologist, 48, 629–637.
Betts, K. (1996). Explaining Australian immigration. Journal of the Australian
Population Association, 13(2), 195–229.
Bhatia, S. (2002). Acculturation, dialogical voices, and the construction of the
diasporic self. Theory & Psychology, 12, 55–77.
Bhatia, S. (2003). Is ‘integration’ the developmental end goal for all immigrants?
Redefining ‘acculturation strategies’ from a genetic-dramatistic perspective.
In I. Josephs (Ed.), Dialogicality in development (pp. 197-216). Westport:
Greenwood Publishing Group.
Bhatia, S. (2007). American Karma. New York: New York University Press.
Bhatia, S. (2014). Acculturation and dialogical formation of immigrant identity:
Race and culture in diaspora spaces. In Hermans, H. J. M. & Gieser, T. (Eds.),
Handbook of dialogical self theory (pp. 115–131). Cambridge, UK:
Cambridge University Press.
Bhatia, S., & Ram, A. (2001a). Rethinking ‘acculturation’ in relation to diasporic
cultures and postcolonial identities. Human Development, 44, 1–18.
279
Bhatia, S., & Ram, A. (2001b). Locating the dialogical self in the age of
transnational migration, border crossings, and diasporas. Culture &
Psychology, 7, 297–309.
Bhatia, S., & Ram, A. (2004). Culture, hybridity, and the dialogical self: Cases
from the South Asian diaspora. Mind, Culture, and Activity, 1(3), 224–240.
Bhatia, S., & Ram, A. (2009). Theorizing identity in transnational and diaspora
cultures: A critical approach to acculturation. International Journal of
Intercultural Relations 33, 140–149.
Bhugra, D. (2004). Migration, distress, and cultural identity. British Medical
Bulletin, 69, 129–141.
Bhugra, D., Bhui, K., Mallet, R., Desai, M., Singh, J., & Leff, J. (1999). Cultural
identity and its measurement: A questionnaire for Asians. International
Review of Psychiatry, 11, 244–249.
Birman, D. (1994). Acculturation and human diversity in a multicultural society. In
E. J. Trickett, R. J. Watts, & D. Birman (Eds.), Human diversity: Perspectives
on people in context (pp. 115–141). San Francisco, CA: Jossey-Bass.
Birman, D., & Trickett, E. J. (2001). Cultural transitions in first-generation
immigrants: Acculturation of Soviet Jewish refugee adolescents and parents.
Journal of Cross-Cultural Psychology, 32(4), 456–477.
Bochner, S. (1982). The social psychology of cross-cultural relations. In S.
Bochner (Ed.), Cultures in contact: Studies in cross-cultural interaction (pp.
5–44). Oxford: Pergamon.
Bochner, S. (1994). Cross-cultural differences in the self-concept: A test of
Hofstede’s individualism/collectivism distinction. Journal of Cross-cultural
Psychology, 25, 273–283.
Bochner, S., & Hesketh, B. (1994). Power distance, individualism/collectivism,
and job-related attitudes in a culturally diverse work group. Journal of Cross-
Cultural Psychology, 25, 233–257.
Bonanno, G. A. (2004). Loss, trauma, and human resilience: Have we understood
the human capacity to thrive after extremely adverse events? American
Psychologist, 59, 20–28.
Boneva, B. S., & Frieze, I. H. (2001). Toward a concept of a migrant personality.
Journal of Social Issues, 57, 477–491.
Boneva, B. S., Frieze, I. H., Ferligoj, A., Jarosova, E., Pauknerova, D., & Orgocka,
A. (1998). Achievement, power, and affiliation motives as clues to
(e)migration desires. A four-countries comparison. European psychologist,
3(4), 247–254.

280
Boski, P. (2008). Five meanings of integration in acculturation research.
International Journal of Intercultural Relations, 32, 142–153.
Breakwell, G. M. (1983). Threatened identities. New York: John Wiley & Sons.
Brewer, M. B., & Gardner, W. (1996). Who is this “we”? Levels of collective
identity and self-representations. Journal of Social and Personality
Psychology, 71, 83–93.
Brown, J. D. (1998). The self. Boston: McGraw Hill.
Bruner, J. (1990). Acts of meaning: Four lectures on mind and culture. Cambridge,
MA: Harvard University Press.
Buriel, R., Calzada, S., & Vasquez, R. (1982). Relationship of traditional Mexican
American culture to adjustment and delinquency among three generations of
Mexican-American male adolescents. Hispanic Journal of Behavioral
Sciences, 1, 41–55.
Camilleri, C. & Malewska-Peyre, H. (1997) Socialization and identity strategies. In
Berry, J.W., Dasen, P.R. and Saraswathi, T.S. (Eds.), Handbook of Cross-
Cultural Psychology, Vol. 2: Basic Processes and Human Development (pp.
41–68). London: Allyn & Bacon.
Castles, S., Iredale, R., & Vasta, E. (1992). Australian immigration between
globalization and recession. The International Migration Review, 28(2), 370–
384.
Castles, S., & Vasta, E. (2000). Ethnicity in Australian society. In J. Najman & J.
Western (Eds.), A sociology of Australian society (3rd
ed.). South Melbourne:
McMillan Co. of Australia.
Caughey, J. L. (1980). Personal identity and social organization. Ethos, 8, 173–
203.
Chandler, M. J., & Lalonde. C. (1998). Cultural continuity as a hedge against
suicide in Canada's first nations. Transcultural Psychiatry, 35(2): 191–219.
Cheek, J. M. (1989). Identity orientations and self-interpretation. In D. M. Buss &
N. Cantor (Eds.), Personality psychology: Recent trend and emerging
directions (pp. 275–285). New York: Springer-Verlag.
Christopher, J. C., & Bickhard, M. H. (2007). Culture, self and identity:
Interactivist contributions to a metatheory for cultural psychology. Culture &
Psychology 13, 259–295.
Church, A. T. (2000). Culture and personality: Toward an integrated cultural trait
psychology. Journal of Personality, 68(4), 651–703.
281
Clatworthy, J., Buick, D., Hankins, M., Weinman, J., & Horne, R. (2005). The use
and reporting of cluster analysis in health psychology: A review. British
Journal of Health Psychology, 10, 329–358.
Cohler, B J. (1982). Personal narrative and life course. In P.B. Baltes & O.G. Brim,
Jr. (Eds.), Life span development and behavior (Vol. 44, pp. 205–241). New
York: Academic Press.
Cooley, C. H. (1902). Human nature and the social order. New York: Scribner.
Corcoran, K., & Fischer, J. (2000). Measures for clinical practice: a sourcebook.
Vol 2. Adults (3rd
ed.). New York: The Free Press.
Crites, S. (1971). The narrative quality of experience. Journal of the American
Academy of Religion, 39(3), 291-311.
Damon, W., & Hart, D. (1988). Self-understanding in childhood and adolescence.
New York: Cambridge University Press.
Deaux, K. (1993). Reconstructing social identity. Personality and Social
Psychology Bulletin, 19(1), 4–12.
Deaux, K. (2000). Surveying the landscape of immigration: Social psychological
perspectives, Journal of Community and Applied Social Psychology. 10, 421–
431.
Deaux, K., Reid, A., Mizrahi, K., & Ethier, K.A. (1995). Parameters of social
identity. Journal of Personality and Social Psychology, 68, 280–291.
Deza, M. M., & Deza, E. (2009). Encyclopaedia of distances. Berlin: Springer-
Verlag.
Diehl, M., Hastings, C. T., & Stanton, J. M. (2001). Self-concept differentiation
across the adult life span. Psychology and Aging, 16, 643–654.
Dimaggio, G., Salvatore, G., Azzara, C., & Catania, D. (2003). Rewriting self-
narratives: The therapeutic process. Journal of Constructivist Psychology, 16,
155–181.
Dona, G., & Berry, J. W. (1994). Acculturation attitudes and acculturative stress of
Central American refugees. International Journal of Psychology, 29, 57–70.
Dos Santos, M. A., Gauer, G., & Gomes, W. B. (2010). Dialogical valence: A
novel measure for the dialogical self and it implications for psychotherapy.
International Journal for Dialogical Science, 4(2), 105-117.
Dozois, D. J. A., Dobson, K. S., & Ahnberg, J. L. (1998). A psychometric
evaluation of the Beck Depression Inventory-II. Psychological Assessment,
10, 83–89.

282
Durm, M. W., & Glaze, P. E. (2001). Construct validity for self-acceptance and
fear of negative evaluation. Psychological Reports, 89, 386.
Elias, N., & Blanton, J. (1987). Dimensions of ethnic identity in Israeli Jewish
families living in the United States. Psychological Reports, 60, 367–375.
Erikson, E. H. (1950). Childhood and society. London: Vintage [1995].
Erikson, E. H. (1956). The problem of ego identity. Journal of the American
Psychoanalytic Association, 4, 56–121.
Erikson, E. H. (1968). Identity, youth and crisis. New York: Norton.
Falmagne, R. J. (2004). On the constitution of ‘self’ and ‘mind’: The dialectic of
the system and the person. Theory & Psychology, 14(6), 822–845.
Freud, S. (1900). The interpretation of dreams. London: Allen & Unwin [1915].
Friedman, T. L. (2005). The world is flat: A brief history of the twenty-first
century. New York: Farrar, Straus and Giroux
Friend, R., & Gilbert, J. (1973). Threat and fear of negative evaluation as
determinants of locus of social comparison. Journal of Personality, 41, 328–
340.
Frieze, I. H., Boneva, B. S., Sarlija, N., Horvat, J., Ferligoj, A., Kogovšek, T.,
Miluska, J., Popova, L., Korobanova, J., Sukhareva, N., Erokhina, L., &
Jarosova, E. (2004). Psychological differences in stayers and leavers:
Emigration desires in Central and Eastern European university students.
European Psychologist, 9(1), 15–23.
Furnham, A., & Bochner, S. (1986). Culture shock: Psychological reactions to
unfamiliar environment. London: Methuen.
Garza-Guerrero, A. C. (1974). Culture shock: Its mourning and the vicissitudes of
identity. Journal of the American Psychoanalytic Association, 22, 408–429.
Gecas, V. (1973). Self-conceptions of migrant and settled Mexican Americans.
Social Science Quarterly, 54, 579-595
Gecas, V. (1982). The self-concept. Annual Review of Sociology, 8, 1-33.
Gecas, V., & Schwalbe, M. L. (1983). Beyond the looking glass self: Social
structure and efficacy-based self-esteem. Social Psychology Quarterly, 46(2),
77-88.
Gergen, K .J. (1968). Personal consistency and the presentation of self. In C.
Gordon & J. Gergen (Eds.), The self in social interaction (pp. 299–308). New
York: Wiley.
283
Gergen, K. J. (1971). The concept of self. New York: Holt, Rinehart, & Winston.
Gergen, K. J. (1972). Multiple identity: The healthy, happy human being wears
many masks. Psychology Today, 5, 31–35, 64–66.
Gergen, K. J. (1982). From self to science: What is there to know? In J. Suls (Ed.),
Psychological perspectives on the self (Vol. 1, pp. 129–149). Hillsdale, NJ:
Lawrence Erlbaum Associates.
Gergen, K.J (1991). The saturated self. New York: Basic Books.
Gergen, K. J. & Gergen, M. (1986). Narrative form and the construction of
psychological science. In T. R. Sarbin (Ed.), Narrative Psychology: The
storied nature of human conduct. New York: Praeger.
Gergen, K. J. & Gergen, M. (1988). Narrative and self as relationship. In L.
Berkowitz (Ed.), Advances in experimental social psychology (Vol. 21, pp.
17–56). San Diego: Academic Press.
Ghaffarian, S. (1987). The acculturation of Iranians in the United States. Journal of
Social Psychology, 127, 565–571.
Gillespie, A., Howarth, C., & Cornish, F. (2012). Four problems for researchers
using social categories. Culture and psychology, 18(3), 391-402.
Gillespie,A., Kadianaki, I., & O’Sullivan-Lago, R. (2012). Encountering alterity:
Geographic and semantic movements. In J. Valsiner (Ed.), The Oxford
handbook of culture and psychology. (pp. 695-709). New York: Oxford
University Press.
Goffman, E. (1959). The presentation of the self in everyday life. New York;
Anchor.
Goffman, E. (1968) Stigma. Notes on the Management of Spoiled Identity. London:
Penguin.
Graafsma, T. L. G. (1994). Psychoanalysis. In H. Bosma, T. Graafsma. H.
Grotevant, & D. de Levita (Eds.), Identity and development: An
interdisciplinary approach (pp. 21–24). Thousand Oaks, CA: Sage
Publications.
Graves, T. D. (1967). Psychological acculturation in a tri-ethnic community.
South-western Journal of Anthropology, 23, 337–350.
Greenwald, A. G. (1988). A social-cognitive account of the self’s development. In
D. Lapsley & F. C. Power (Eds.), Self, ego, and identity: Integrative
approaches (pp. 30–42). New York: Springer-Verlag.
Habermas, T., & Bluck, S. (2000). Getting a life: The emergence of the life story in
adolescence. Psychological Bulletin, 126, 748–769.
284
Harre, R. (1983). Identity projects. In G. Breakwell (Ed), Threatened identities.
Chichester: John Wiley.
Hawkins, F. (1989). Critical Years in Immigration: Canada and Australia
Compared. Sydney: New South Wales University Press.
Heimberg, R. G., Hope, D. A., Rapee, R. M., & Bruch, M. A. (1988). The validity
of the Social Avoidance and Distress Scale and the Fear of Negative
Evaluation Scale with social phobic patients. Behaviour Research and
Therapy, 26, 407–410.
Hermans, H. J. M. (1987a). Self as organized system of valuations: Towards a
dialogue with the person. Journal of Counseling Psychology, 34, 10–19.
Hermans, H. J. M. (1987b). The dream in the process of valuation: A method of
interpretation. Journal of Personality and Social Psychology, 53, 163–175.
Hermans, H. J. M. (1988). On the integration of nomothetic and idiographic
research methods in the study of personal meaning. Journal of Personality,
56, 785–812.
Hermans, H. J. M. (1989). The meaning of life as an organized process.
Psychotherapy, 26, 11–22.
Hermans, H. J. M. (1991). The person as co-investigator in self-research:
Valuation theory. European Journal of Personality, 5, 217–234.
Hermans, H. J. M. (1992). Unhappy self-esteem: A meaningful exception to the
rule. Journal of Psychology, 126, 555–570.
Hermans, H. J. M. (1993). Moving opposites in the self: A Heraclitean approach.
Journal of Analytical Psychology, 38, 437–462.
Hermans, H. J. M. (1995). From assessment to change: The personal meaning of
clinical problems in the context of the self-narrative. In R .A. Neimeyer and
M. J. Mahoney (Eds.), Constructivism in psychotherapy (pp. 247–272).
Washington, DC: American Psychological Association.
Hermans, H. J. M. (1996a). Voicing the self: From information processing to
dialogical interchange. Psychological Bulletin, 119, 31–50.
Hermans, H. J. M. (1996b). Opposites in a dialogical self: Constructs as characters.
Journal of Constructivist Psychology, 9, 1–26.
Hermans, H. J. M. (1998). Moving cultures: The perilous problems of cultural
dichotomies in a globalizing society. American Psychologist, 53(10), 1111-
1120.
Hermans, H. J. M. (1999). Dialogical thinking and self-innovation. Culture &
Psychology, 5, 67–87.
285
Hermans, H. J. M. (2000). The coherence of incoherent narratives. Narrative
Inquiry, 10(1), 223–227.
Hermans, H. J. M. (2000). The position repertory of interviewer and narrator.
Narrative Inquiry, 10(1), 191-194.
Hermans, H. J. M. (2001a). The dialogical self: Toward a theory of personal and
cultural positioning. Culture & Psychology, 7(3), 243–282.
Hermans, H. J. M. (2001b). Mixing and moving cultures require a dialogical self.
Human Development, 44, 24–28.
Hermans, H. J. M. (2001c). The construction of a personal position repertoire:
Method and practice. Culture & Psychology, 7(3), 323–365.
Hermans, H. J. M. (2002a). The dialogical self as a society of mind: Introduction.
Theory & Psychology, 12(2), 147–160.
Hermans, H.J.M. (2002b) The dialogical self: One person, different stories. In Y.
Kashima, M. Foddy & M. Platow (Eds.), Self and identity: Personal, social
and symbolic (pp. 71–99). New Jersey: Lawrence Erlbaum Associates.
Hermans, H. J. M. (2003). The construction and reconstruction of a dialogical self.
Journal of Constructivist Psychology, 16, 89–130.
Hermans, H. J. M. (2004). The innovation of self-narratives: A dialogical
approach. In. L. Angus & J. McLeod (Eds.), The handbook of narrative and
psychotherapy: Practice, theory, and research (pp. 175–191). Thousand
Oaks, CA: Sage
Hermans, H. J. M. (2004b). The dialogical self: Between exchange and power. In
H. J. M. Hermans & G. Dimaggio (Eds.), The dialogical self in
psychotherapy: An introduction (pp.13-28). London: Brunner-Routledge.
Hermans, H. J. M. (2006). Moving through three paradigms, yet remaining the
same thinker. Counseling Psychology Quarterly, 19(1), 5–25.
Hermans, H. J. M. (2008). How to perform research on the basis of dialogical self
theory? Journal of Constructivist Psychology, 21,185–199.
Hermans, H. J. M., & Dimaggio, G. (2007). Self, identity and globalization in
times of uncertainty: A dialogical analysis. Review of General Psychology,
11(1), 31-61,
Hermans, H. J. M, & Hermans-Jansen, E. (1995). Self-narratives: The construction
of meaning in psychotherapy. New York: Guilford Press.
Hermans, H. J. M. & Hermans-Konopka, A. (2012). Dialogical self theory:
Positioning and counter-positioning in a globalizing society. Cambridge, UK:
Cambridge University Press.

286
Hermans, H. J. M., & Kempen, H .J. G. (1993). The dialogical self: Meaning as
movement. San Diego: Academic Press.
Hermans, H. J. M., & Kempen, H. J. G. (1998). Moving cultures: The perilous
problems of cultural dichotomies in a globalizing society. American
Psychologist, 53, 1111–1120.
Hermans, H. J. M., Kempen, H. J. G., & Van Loon, R. J. P. (1992). The dialogical
self: Beyond individualism and rationalism. American Psychologist, 47, 23–
33.
Hermans, H. J. M., & Oles, P. K. (1996). Value crisis: Affective organization of
personal meanings. Journal of Research in Personality, 30, 457–482.
Hermans, H. J. M., Rijks, T. I., & Kempen, H .J. G. (1993). Imaginal dialogues in
the self: Theory and method. Journal of Personality, 61, 207–236.
Hirst, J. B. (2010). Looking for Australia. Melbourne, Australia: Black Inc.
Hirst, J. B. (2014). Australian history in 7 questions. Melbourne, Australia: Black
Inc.
Hofmann, S. G., DiBartolo, P. M., Holaway, R. M., & Heimberg, R. G. (2004).
Scoring error of Social Avoidance and Distress Scale and its psychometric
implications. Depression and Anxiety, 19, 197–198.
Hofstede, G. (1980). Culture’s consequences: International differences in work-
related values. Beverly Hills, CA: Sage.
Hofstede, G. (1991). Cultures and organizations: Software of the mind. New York:
McGraw-Hill.
Holstein, J. A., & Gubrium, J. F. (2000). The self we live by: Narrative identity in
a post-modern world. Symbolic Interaction, 23(4), 407-409.
Hovey, J. D. (2000). Acculturative stress, depression, and suicidal ideation in
Mexican immigrants. Cultural diversity & Ethnic Minority Psychology, 5(2),
134–151.
Hovey, J .D. & King, C. A. (1996). Acculturative stress, depression, and suicidal
ideation among immigrant and second-generation Latino adolescents. Journal
of the American Academy of Child and Adolescent Psychiatry, 35, 1183–
1192.
Imamoglou, E. O. (1998). Individualism and collectivism in a model and scale of
balanced differentiation and integration. Journal of Psychology, 132, 95–105.
James, W. (1890). The Principles of psychology (Vol.1). London: Macmillan.
James, W. (1948). Psychology. New York: World Publishing Co.
287
James, W. (1961). Psychology: The briefer course. New York: Harper & Row.
Jung, C. G. (1957). The undiscovered self. New York: New American Library.
Kaplan, M. S., & Marks, J. (1990). Adverse effects of acculturation: Psychological
distress among Mexican American young adults. Social Science and
Medicine, 31, 1313–1319.
Kadianaki, I. (2009). Dramatic life courses: Migrants in the making. In J. Valsiner,
P. C. M. Molenaar, M. C. D. P. Lyra, & N. Chaudhary (Eds.), Dynamic
Process Methodology in the Social and Developmental Sciences (pp. 477-
492). New York: Springer.
Kashima, Y., Yamaguchi, S. Kim, U., Choi, S. C., Gelfand, M. J. & Yuki, M.
(1995). Culture, gender, and self: A perspective from individualism-
collectivism research. Journal of Personality and Social Psychology, 69, 925–
937.
Kashima, Y. (2001). Culture and social cognition: Towards a social psychology of
cultural dynamics. In D. Matsumoto (Ed.), Handbook of culture and
psychology (pp. 325-360). New York: Oxford University Press.
Kendall, P. C., Hollon, S. D., Beck, A. T., Hammen, C. L., & Ingram, R. E. (1987).
Issues and recommendations regarding the use of the Beck Depression
Inventory. Cognitive Therapy and Research, 11, 289–299.
King, R. (1995) “Migrations, globalisation and place”. In Massey, D. and Jess, P.
(Eds.) A Place in the World? Places, Culture and Globalisation (Vol. 4, pp.
5-44). Oxford: Open University Press.
Kinnvall, C. (2004). Globalization and religious nationalism: Self, identity, and the
search for ontological security. Political Psychology, 25(5), 741–767.
Kinnvall, C. & Nesbitt-Larking, P. (2011). The political psychology of
globalisation: Muslims in the west. Oxford, UK: Oxford University Press.
König, J. (2009). Moving experience: Dialogues between personal cultural
Positions. Culture & Psychology, 15, 97–119.
Kosmitzki, C. (1996). The reaffirmation of cultural identity in the context of cross-
cultural encounters. Personality and Social Psychology Bulletin, 22, 239–429.
Kuhn, M. H., & McPartland, T. S. (1954). An empirical investigation of self-
attitudes. American Sociological Review, 19, 68–76.
LaFromboise, T., Coleman, H. L. K., & Gerton, J. (1993). Psychological impact of
biculturalism: Evidence and theory. Psychological Bulletin, 114, 395–412.
Lawrence-Lightfoot, S. (2005). Reflections on portraiture: A dialogue between art
and science. Qualitative Inquiry, (11)3, 3-15.

288
Leary, M. R. (1983). A brief version of the Fear of Negative Evaluation Scale.
Personality and Social Psychology Bulletin, 9, 371-376.
Leary, M. R. (1991). Social anxiety, shyness, and related constructs. In J. P.
Robinson, P. R. Shaver, & L. S. Wrightsman (Eds.), Measures of personality
and social psychological attitudes (pp. 161–194). New York: Academic
Press.
Lee, E. (1966). A theory of migration. Demography, 3, 47–57.
Lyddon, W. J., Yowell, D. R., & Hermans, H .J. M. (2006). The self-confrontation
method: Theory, research, and practical utility. Counselling Psychology
Quarterly, 19(1), 27–43.
Maalouf, A. (1998). On identity (B. Bray, Trans.). London: The Harvill Press.
Madden, R., & Young, S. (1993). Women and men immigrating to Australia: Their
characteristics and immigration decisions. Canberra: Australian Government
Publishing Service.
Mahalingam, R. (2008). Power, social marginality, and the cultural psychology of
identities at the cultural contact zones: Commentary on O’Sulligan-Lago, de
Abreu, and Burgess. Human Development, 51, 368-273.
Mahalingam, R. (2012). Model minority myth: Engendering cultural psychology of
Asian immigrants. In E. L. Grigorenko (Ed.), U. S. immigration and
education: Cultural and policy issues across the lifespan (pp. 119-136). New
York: Springer.
Mahalingam, R., & Leu, J. (2005). Culture, essentialism, immigration and
representations of gender. Theory & Psychology, 15(6), 839-860.
Malhi, R. L. Boon, S. D. & Rogers, T. B. (2009). Being Canadian and being
Indian: Subject positions and discourses used in South Asian-Canadian
women’s talk about ethnic identity. Culture & Psychology, 15(2), 255-283.
Markus, A., Jupp, J., & McDonald, P. (2009). Australia’s immigration revolution.
Sydney, Australia: Allen & Unwin.
Markus, H. R., & Kitayama, S. (1991). Culture and the self: Implications for
cognition, emotion, and motivation. Psychological Review, 98, 224–253.
Markus, H. R., & Kunda, Z. (1986). Stability and malleability of the self-concept.
Journal of Personality and Social Psychology, 51, 858–866.
Martindale, C. (1980). Subselves: The internal representation of situational and
personal dispositions. In Wheeler, L. (Ed.), Review of personality and social
psychology (pp. 193–218). Beverly Hills: Sage.
289
Maslow, A. H. (1961). Peak-experiences as acute identity experiences. American
Journal of Psychoanalysis, 21, 254–260.
Massey, D. S., Arango, J., Hugo, G., Kouaouci, A., Pellegrino, A,. & Taylor, E.
(2006). Theories of international migration: A review and appraisal. In A.
Messina & G. Lahav, (Eds.), The migration reader: Exploring politics and
policies. Boulder, CA: Lynne Rienner Publishers.
Maydell-Stevens, E., Masgoret, A., & Ward (2007). Problems of psychological and
sociocultural adaptation among Russian-speaking immigrants in New
Zealand. Social Policy Journal of New Zealand, 30, 178–196.
McAdams, D. P. (1982). Experiences in intimacy and power: Relationships
between social motives and autobiographical memory. Journal of Personality
and Social Psychology, 42, 292–302.
McAdams, D. P. (1985). Power, intimacy, and the life story: Personological
inquiries into identity. Chicago: Dorsey Press.
McAdams, D. P. (1989). The development of a narrative identity. In D. Buss & N.
Cantor (Eds.), Personality psychology: Recent trends and emerging directions
(pp. 160–174). New York: Springer-Verlag.
McAdams, D. P. (1990). Unity and purpose in human lives: The emergence of
identity as a life story. In A. Rabin, R. Zucker, R. Emmons, & S. Frank (Eds.),
Studying persons and lives (pp. 148–200). New York: Springer.
McAdams, D. P. (1993). The stories we live by: Personal myths and the making of
the self. New York: Guilford Press.
McAdams, D. P. (1996). Personality, modernity, and the storied self: A
contemporary framework for studying persons. Psychological Inquiry, 7 (4),
295–321.
McAdams, D. P. (1997). The case for unity in the (post)modern self: A modest
proposal. In R. Ashmore & L. Jussim (Eds.), Self and identity: Fundamental
issues (pp. 46–78). New York: Oxford University Press.
McAdams, D. P. (2003). Identity and the life story. In R. Fivush & C. A. Haden
(Eds.), Autobiographical memory and the construction of a narrative self (pp.
187–208). Hoboken, NJ: Taylor & Francis.
McAdams, D. P. (2006). The person: An introduction to personality psychology
(4th
ed.). Hoboken, NJ: John Wylie & Sons.
McAdams, D. P. (2012). Exploring psychological themes through life-narrative
accounts. In James Holstein and Jaber Gubrium (Eds.), Varieties of Narrative
Analysis. pp. 15-32. Los Angeles, CA: Sage Publications, Inc.
290
McAdams, D. P. (2014). The life narrative at midlife. In B. Schiff (Ed.), Rereading
Personal Narrative and the Life Course. New Directions for Child and
Adolescent Development, 145, 57-69.
McAdams, D. P., & Pals, J. L. (2006). A new big five: Fundamental principles for
an integrative science of personality. American Psychologist, 61(3), 204–217.
McAdams, D. P., Reynolds, J., Lewis, M., Patten, A. H., & Bowman, P. J. (2001).
When bad things turn good and good things turn bad: Sequences of
redemption and contamination in life narrative and their relation to
psychosocial adaptation in midlife adults and in students. Personality and
Social Psychology Bulletin, 27, 474–485.
Mead, G. H. (1934). Mind, self, and society. Chicago: The University of Chicago
Press.
Miller, R. S. (1995). On the nature of embarrassability: Shyness, social evaluation,
and social skill. Journal of Personality, 63, 315–339.
Moffit, K. H., & Singer, J. A. (1994). Continuity in the life story: Self-defining
memories, affect, and approach/avoidance personal strivings. Journal of
Personality, 62, 21–43.
Moghaddam. F. M. (2002). Cultural surplus and social mobility among minorities.
Culture Psychology, 8, 401–407.
Moyerman, D. R,. & Forman, B. D. (1992). Acculturation and adjustment: A meta-
analytic study. Hispanic Journal of Behavioral Sciences, 14, 163–200.
Mulry, G., Kalichman, S. C., Kelly, J. A., Ostrow, D. J., & Heckman, T. G. (1997).
Grouping gay man on dimensions reflecting sexual behavior preferences:
Implications for HIV–AIDS prevention. Psychology and Health, 12, 405–415.
Nesdale, D., & Mak, A. S. (2003). Ethnic identification, self-esteem ,and
immigrant psychological health. International Journal of Intercultural
Relations, 27, 23–40.
Nesdale, D., Rooney, R., & Smith. L. (1997). Migrant ethnic identity and
psychological distress. Journal of Cross-Cultural Psychology, 28, 569–588.
Niedenthal, P. M., & Beike, D. R. (1997). Interrelated and isolated self-concepts.
Personality and Social Psychology Review, Vol. 1, 106–128.
Norasakkunkit, V., & Kalick, S. M. (2002). Culture, ethnicity, and emotional
distress measures: The role of self-construal and self-enhancement. Journal of
Cross-Cultural Psychology, 33, 56–70.
Okazaki, S. (1997). Sources of ethnic differences between Asian-American and
White American college students on measures of depression and social
anxiety. Journal of Abnormal Psychology, 106, 52–60.

291
O'Sullivan-Lago, R. (2011a). “I think they’re just the same as us”: Building
solidarity across the self/other divide. Papers on Social Representations, 20,
3.1-3.27) [http://www.psych.lse.ac.uk/psr/]
O'Sullivan-Lago, R. (2011b) The possibility of resolving conflict through
dialogue?: Continuing from power. Psychology & Society, 4(1), 67-70.
O’Sullivan-Lago, R., & de Abreu, G. (2008). Going back to their roots:
Maintaining continuity in the dialogical self through signs. Psychology &
Society, 1(1), 42-53.
O'Sullivan-Lago, R., & de Abreu, G. (2010a). Maintaining continuity in a cultural
contact zone: Identification strategies in the dialogical self. Culture &
Psychology, 16(1), 73-92.
O'Sullivan-Lago, R., & de Abreu, G. (2010b). The dialogical self in a cultural
contact zone: Exploring the perceived ‘cultural correction’ function of
schooling. Journal of Community & Applied Social Psychology, 20, 275-287.
O’Sullivan-Lago, R., de Abreu, G., & Burgess, M. (2008). ‘I am a human being
like you’: An identification strategy to maintain continuity in a cultural
contact zone. Human Development, 51, 349-357.
Overholser, J. C., & Freheit, S. R. (1994). Assessment of interpersonal dependency
using the Milton Clinical Multiaxial Inventory-II (MCMI-II) and the
Depressive Experience Questionnaire. Personality and Individual Differences,
17, 71–78.
Park, R. E, (1928). Human migration and the marginal man. The American Journal
of Sociology, 33, 881–893.
Patterson, M. L., & Strauss, M .E. (1972). An examination of the discriminant
validity of the social avoidance and distress scale. Journal of Consulting and
Clinical Psychology, 39, 169.
Phalet, K., & Hagendoorn, L. (1996). Personal adjustment to acculturative
transitions: The Turkish experience. International Journal of Psychology, 31,
131–144.
Phinney, J. S. (1990). Ethnic identity in adolescents and adults: Review of
research. Psychological Bulletin, 108, 499–514.
Phinney, J. S. (1996). When we talk about American ethnic groups, what do we
mean? American Psychologist, 51(9), 918–927.
Phinney, J. S. (1999). An intercultural approach in psychology: Cultural contact
and identity. Cross-Cultural Psychology Bulletin, 33, 24–31.
Phinney, J. S. (2000). Identity formation across cultures: The interaction of
personal, societal and historical change. Human Development, 43, 27–31.
292
Phinney, J. S., & Flores, J. (2002). “Unpackaging” acculturation: Aspects of
acculturation as predictors of traditional sex role attitudes. Journal of Cross-
Cultural Psychology, 33, 320–331.
Potter, J., & Hepburn, A. (2005). Qualitative interviews in psychology: problems
and possibilities. Qualitative Research in Psychology, 2, 281–307.
Prokopiou, E., Cline, T., & de Abreu, G. (2012). “Silent” monologues, “loud”
dialogues, and the emergence of hibernated I-positions in the negotiation of
multivoiced cultural identities. Culture & Psychology, 18(4), 494-509.
Raggatt, P. T. F. (2000). Mapping the dialogical self: Towards a rationale and
method of assessment. European Journal of Personality, 14, 65-90.
Raggatt, P. T. F. (2007). Forms of positioning in the dialogical self: A system
classification and the strange case of Dame Edna Everage. Theory &
Psychology, 17(3), 355-382.
Raggatt, P. T. F. (2010). The self positioned in time and space: Dialogical
paradigms. Theory & Psychology, 20(3), 451-460.
Raggatt, P. T. F. (2014). Positioning in the dialogical self: Recent advances in
theory construction. In Hermans, H. J. M. & Gieser, T. (Eds.), Handbook of
dialogical self theory (pp. 29–45). Cambridge, UK: Cambridge University
Press.
Redfield, R., Linton, R., & Herskovits, M. J. (1936). Memorandum on the study of
acculturation. American Anthropologist, 38, 149–152.
Richmond, A. H. (1988). Immigration and ethnic conflict. London: The Macmillan
Press.
Richmond, A. H. (1993). Reactive migration: Sociological perspectives on refugee
movement. Journal of Refugee Studies, 6, 7–24.
Robins, R. W., & John, O. P. (1997). The quest for self-insight: Theory and
research on accuracy and bias in self-perception. In R. Hogan, J. Johnson, &
S. Briggs (Eds.), Handbook of personality psychology (pp. 649–679). San
Diego, CA: Academic Press.
Roccas, S., Horenczyk, G., & Schwartz S. H. (2000). Acculturation discrepancies
and well-being: The moderating role of conformity. European Journal of
Social Psychology, 30, 323–334.
Rosenberg, M. (1986). Conceiving the self. Melbourne, FL: Kreiger.
Rosenberg, S., & Gara, M.A. (1985). The multiplicity of personal identity. Review
of Personality and Social Psychology, 6, 87–114.
293
Rosenwald, G. C., & Ochberg, R. L. (Eds.) (1992). Storied lives: The cultural
politics of self-understanding. CT: Yale University Press.
Rudmin, F. W. (2003). Critical history of the acculturation psychology of
assimilation, separation, integration, and marginalization. Review of General
Psychology, 7(1), 3-37.
Rudmin, F. W. (2010a). The phenomenology of acculturation: Retrospective
reports from the Philippines, Japan, Quebec and Norway. Culture &
Psychology, 16(3), 313-332.
Rudmin, F. W. (2010b). Steps towards the renovation of acculturation research
paradigms: What scientists’ personal experiences of migration might tell
science. Culture & Psychology, 16(3), 299-312.
Rumbaut, R.G. (2004). Ages, life stages, and generational cohorts: Decomposing
the immigrant first and second generations in the United States. The
International Migration Review, 38(3), 1160–1205.
Ryder, A. G., lden, L. E., & Paulhus, D. L. (2000). Is acculturation unidimensional
or bidimensional? A head-to-head comparison in the prediction of personality,
self-identity, and adjustment. Journal of Personality and Social Psychology,
79, 49–65.
Ryff, C. D. (1989a). Happiness is everything, or is it? Explorations on the meaning
of psychological well-being. Journal of Personality and Social Psychology, 6,
1069–1081.
Ryff, C. D. (1989b). Beyond Ponce de Leon and life satisfaction: New directions in
quest of successful aging. International Journal of Behavioural Development,
12, 35–55.
Ryff, C. D. (1991) Possible selves in adulthood and old age: A tale of shifting
horizons. Psychology and Aging, 6, 286–295.
Ryff, C. D. (1995). Psychological well-being in adult life. Current Directions in
Psychological Science, 4, 99–104.
Ryff, C. D., & Essex, M. J. (1992). The interpretation of life experience and well-
being: The sample case of relocation. Psychology and Aging, 7, 507–517.
Ryff, C. D., & Keyes, C. L. M. (1995). The structure of psychological well-being
revisited. Journal of Personality and Social Psychology, 69, 719–727.
Ryff, C. D., & Singer, B. (1996). Psychological well-being: Meaning,
measurement, and implications for psychotherapy research. Psychotherapy
and Psychosomatics, 65, 14–23.

294
Ryff, C. D., Lee, Y. H., Essex, M. J., & Schmutte, P. M. (1994). My children and
me: Midlife evaluations of grown children and of self. Psychology and Aging,
9, 195–205.
Sanchez-Rockliffe, M., & Symons, J. (2010). How migration affects the dialogical
self. International Journal for Dialogical Science, 4(2), 5–34.
Sarbin, T. R., & Allen, V. L. (1968). Role theory. In G. Lindzey and E. Aronson
(Eds.), The handbook of social psychology. Reading, MA: Addison-Wesley.
Schwartz, S. H. (1990). Individualism-collectivism: Critique and proposed
refinements. Journal of Cross-Cultural Psychology, 21, 139–195.
Schwartz, S. J, Unger, J. B., Zamboanga, B. L., & Szapocznik, J. (2010).
Rethinking the concept of acculturation Implications for theory and research.
American Psychologist, 65(4), 237-251.
Searle, W., & Ward, C. (1990). The prediction of psychological and sociocultural
adjustment during cross-cultural transitions. International Journal of
Intercultural Relations, 14, 449–464.
Shotter, J., & Gergen, K. (Eds.). (1989). Tests of identity. London: Sage.
Singelis, T. M. (1994). The measurement of independent and interdependent self-
construals, Personality and Social Psychology Bulletin. 20, 580–59.
Singer, J. A. (1990). Affective responses to autobiographical memories and their
relationship to long term goals. Journal of Personality, 58, 535–563.
Singer, J. A., & Salovey, P. (1993). The remembered self: Emotion and memory in
personality. New York: The Free Press.
Smith, R. E., & Sarason, I. G. (1975). Social anxiety and the evaluation of negative
interpersonal feedback. Journal of Consulting and Clinical Psychology, 43,
429.
Steer, R. A., Rissmiller, D. J., & Beck, A. T. (2000). Use of the Beck Depression
Inventory-II with depressed geriatric inpatients. Behaviour Research and
Therapy, 38, 31–318.
Stemplewska-Żakowicz, K., Walecka, J., Gabińska, A., Zalewski, B., & Suszek, H.
(2005). Experiments on positioning, positioning the experiments. In P. Oles &
H. J. M. Hermans (Eds.), The dialogical self: Theory and research (pp. 183–
199). Lublin, Poland: Wydawnictwo KUL.
Strauss, A. (1956). The social psychology of George Herbert Mead. Chicago:
University of Chicago Press.
Stryker, S. (1980). Symbolic interactionism: A social structural version. Menlo
Park, CA: Benjamin/Cummings.

295
Stiles, W. B. (1993). Quality control in qualitative research. Clinical Psychology
Review, 13, 593–618.
Stonequist, E. V. (1937). The marginal man. New York: Scribner.
Stopa, L., & Clark, D. M. (2001). Social phobia: Comments on the viability and
validity of an analogue research strategy and British norms for the Fear of
Negative Evaluation questionnaire. Behavioural and Cognitive
Psychotherapy, 29, 423–440.
Suinn, R. M., Ahuna, C., & Khoo, G. (1992). The Suinn-Lew Asian Self-Identity
Acculturation Scale: Concurrent and factorial validation. Educational and
Psychological Measurement, 52, 1041–1046.
Surgan, S. ,& Abbey, E. (2014). Identity construction among transnational
migrants. In Hermans, H.J.M. & Gieser, T. (Eds.), Handbook of dialogical
self theory (pp. 151–168). Cambridge, UK: Cambridge University Press.
Tabachnik, B. G., & Fidell, L. S. (2001). Using multivariate statistics. (4th ed.).
Boston, MA: Allyn & Bacon.
Taft, R. (1986). Methodological considerations in the study of immigrant
adaptation in Australia. Australian Journal of Psychology, 38(3), 339–346.
Taylor, R. (1969). Migration and motivation: A study of determinants and types. In
J.A. Jackson (Ed.), Migration. Cambridge, UK: Cambridge University Press.
Triandis, H .C., & Suh, E .M. (2002). Cultural influences on personality. Annual
Review of Psychology, 53, 133–160.
Triandis, H .C., Leung, K., Villareal, M. J. & Clack, F. L. (1985). Allocentric
versus idiocentric tendencies: convergent and discriminant validation. Journal
of Research in Personality, 19, 395–415.
Triandis, H. C., Bontempo, R., Villareal, M. J., Asai, M., & Luca, N. (1988).
Individualism and collectivism: Cross-cultural perspectives on self-group
relationships. Journal of Personality and Social Psychology, 54, 323–338.
OECD (Organisation for Economic Co-operation and Development) and UNDESA
(United Nations Department of Economic and Social Affairs) (2013). World
Migration in Figures. Paris: OECD.
Valentine, G. (1997). Tell me about …: Using interviews as a research
methodology. In R. Flowerdew & D. Martin (Eds.) Methods in Human
Geography (pp. 110–136). Essex, UK: Addison Wesley Longman.
Valsiner, J. (2000). Culture and human development. London: Sage.
Valsiner, J. (2002). Forms of dialogical relations and semiotic autoregulation
within the self. Theory & Psychology, 12(2), 251–265.
296
Van de Vijver, F. J. R., Helms-Lorenz, M., & Feltzer, M. F. (1999). Acculturation
and cognitive performance of migrant children in the Netherlands.
International Journal of Psychology, 34, 149–162.
Van de Vijver, F. J. R., & Phalet, K. (2004). Assessment in multicultural groups:
the role of acculturation. Applied Psychology: An International Review, 53,
215–236.
Van Geel, R., & de Mey, H. R. A. (2004). A theory-guided hexagonal
representation of single valuation systems for use with Hermans’ self-
confrontation method. Journal of Constructivist Psychology, 17, 85–104.
Van Meijl, T. (2012). Multicultural adolescents between tradition and
postmodernity: Dialogical self theory and the paradox of localization and
globalization. In H. J. M. Hermans (Ed.), Applications of dialogical self
theory: New directions for child and adolescent development, (137, 39-52).
Hoboken, NJ: Wiley.
Van Meijl, T. (2014). Multiculturalism, multiple identifications and the dialogical
self: Shifting paradigms of personhood in sociocultural anthropology. In
Hermans, H. J. M. & Gieser, T. (Eds.), Handbook of dialogical self theory
(pp. 98–114). Cambridge, UK: Cambridge University Press.
Van Oudenhoven, J. P., & Eisses, A. M. (1998). Integration and assimilation of
Moroccan immigrants in Israel and the Netherlands. International Journal of
Intercultural Relations, 22, 293–307.
Verkuyten, M., & de Wolf, A. (2002). Being, feeling and doing: Discourses and
ethnic self-definitions among minority group members. Culture &
Psychology, 8, 371-399.
Volkan, V. D. (2004). From hope for a better life to broken spirits: An
introduction. In J. P. Wilson & B. Drozdek (Eds.), Broken Spirits: The
treatment of traumatized asylum seekers, refugees, war and torture victims
(pp. 7–12). New York: Brunner-Routledge.
Ward, C. (1999). Models and measurement of acculturation. In W. J. Lonner, D. L.
Dinnel, D. K. Forgas, & S. Hays (Eds.), Merging past, present and future (pp.
221–230). Lisse, The Netherlands: Swets & Zeitlinger.
Ward, C. (2001). The A, B, C’s of acculturation. In D. Matsumoto (Ed.), The
handbook of culture and psychology (pp. 411–445). Oxford: Oxford
University Press.
Ward, C., Bochner, S., & Furnham, A. F. (2001). The psychology of culture shock.
London: Routledge.
Ward, C., & Chang, W. C. (1997). “Cultural fit”: A new perspective on personality
and sojourner adjustment. International Journal of Intercultural Relations, 21,
525–533.
297
Ward, C., & Kennedy, A. (1993a). Where’s the culture in cross-cultural transition?
Comparative studies of sojourner adjustment. Journal of Cross-Cultural
Psychology, 24(2), 221–249.
Ward, C., & Kennedy, A. (1993b). Psychological and sociocultural adjustment
during cross-cultural transitions: A comparison of secondary students
overseas and at home. International Journal of Psychology, 28, 129–147.
Ward, C., & Kennedy, A. (1996). Crossing cultures: The relationship between
psychological and sociocultural dimensions of cross-cultural adjustment. In J.
Pandey, D. P. S. Bhawuk & D. Sinha (Eds.), Asian contributions to cross-
cultural psychology (pp. 289–306). New Delhi: Sage.
Ward, C., & Rana-Deuba, A. (1999). Acculturation and adaptation revisited.
Journal of Cross-Cultural Psychology, 30, 372–392.
Ward, C., & Searle, W. (1991). The impact of value discrepancies and cultural
identity on psychological and sociocultural adjustment of sojourners.
International Journal of Intercultural Relations, 15, 209–225.
Watson, D., & Friend, R. (1969). Measurement of social evaluative anxiety.
Journal of Consulting and Clinical Psychology, 33, 448–457.
Westen, D. (1995). A clinical-empirical model of personality: Life after the
Mischelian ice age and the NEO-lithic era. Journal of Personality, 63, 495–
524.
Whitbourne, S. K. (1986). The me I know: A study of adult identity. New York:
Springer.
Wortham, S. (2000). Interactional positioning and narrative self-construction.
Narrative Inquiry, 10(1), 157–184.
Yamada, A. M., & Singelis, T. M. (1999). Biculturalism and self-construal.
International journal of Intercultural Relations, 23, 697–709.
Young, S., & Madden, R. (1992). Immigration Selection Policies Affecting
Women and Men. In Proceedings of Second National Immigration Outlook
Conference (pp. 252–259). Melbourne, Australia: Bureau of Immigration
Research.
Zheng, X., & Berry, J. W. (1991). Psychological adaptation of Chinese sojourners
in Canada. International Journal of Psychology, 26, 451–470.

THE DIALOGICAL SELF OF MIGRANTS:
EXPLORING THE MIGRATION EXPERIENCE THROUGH SELF-NARRATIVES
Mariel Sanchez-Rockliffe
Faculty of Health, Arts and Design
Swinburne University of Technology
Australia
A Report of an investigation submitted
As partial requirement for the degree of
Doctor of Psychology (Counselling Psychology)
December 2015

i
Contents
APPENDIX A RESEARCH INSTRUMENTS 1
A.1 Notice for the Purpose of Recruiting Participants 2
A.2 Letter to Participants 3
A.3 Questionnaire 4
A.4 Questions of the Self-confrontation Method 22
A.5 Affect Terms for Rating Valuations 23
A.6 Matrix of Valuation / Affect 24
APPENDIX B STATISTICAL ANALYSIS FOR STUDY 1 25
B.1 Reliability of Psychological Self-reports and Self-confrontation Indices 27
B.2 Tables 32
B.3 Cluster Analysis 40
B.4 Repeated-measures MANOVA 52
B.5 Paired t-tests 64
B.6 Single-factor between-subjects MANOVA 69
APPENDIX C STATISTICAL ANALYSIS FOR STUDY 2 103
C.1 Analysis of Valuations by Theme 104
C.2 T-tests 108
APPENDIX D SELF-NARRATIVES OF CASE-STUDY PARTICIPANTS 114
D.1 Participant 03 Yoana 114
D.2 Participant 22 Juan 117
D.3 Participant 35 Luisa 119
D.4 Participant 40 Carla 122

1
APPENDIX A
RESEARCH INSTRUMENTS
Notice for the purpose of recruiting participants
Letter to participants
Questionnaire
Questions of the self-confrontation method
Affect terms for rating participants’ valuations
Matrix of valuation / affect

2
A.1 Notice for the Purpose of Recruiting Participants
Are you a migrant who has lived in Australia for five or more years?
Many migrants feel that they have developed two
identities as a result of moving to a new country. One
identity retains aspects of how they were in their
country of origin; the other identity relates to their new
country. If this is your experience I would like to hear
from you.
My research project
My name is Mariel Sanchez-Rockliffe, and I am a doctoral student of counselling
psychology at Swinburne University of Technology. I am researching the link between
personal identity and the migrant experience. I am investigating the life stories of migrants
using structured interviews designed to identify aspects of people’s life stories that reflect
their identity.
Would you like to participate?
If you are a migrant and you wish to participate in my research, I want to hear from you!
Please note that this study is an On-Campus Project and participation will count towards
your course requirement.
To participate you will first complete a questionnaire about personal qualities and
relationships with others. You will then participate in a research interview. You will be able
to follow up with questions and comments, and I can provide feedback on your individual
life story. Naturally, all information you provide will be confidential and you are free to
withdraw at any time.
04
13
537
28
2
04
13
537
28
2
04
13
537
28
2
04
13
537
28
2
04
13
537
28
2
04
13
537
28
2
04
13
537
28
2
04
13
537
28
2
04
13
537
28
2
04
13
537
28
2
04
13
537
28
2
04
13
537
28
2
04
13
537
28
2
04
13
537
28
2
04
13
537
28
2
04
13
537
28
2

3
A.2 Letter to Participants
DATE
NAME
ADDRESS
Dear NAME
Understanding Self-narratives and Emotional Reactions using the Self-confrontation
method
Thank you for agreeing to participate in my research. I enclose a blank questionnaire. Please
complete it in one sitting, preferably within the next two weeks. I estimate that it will take about
45 minutes. When you have finished, please mail it to me at Swinburne in the pre-addressed,
stamped envelope provided.
When I receive the completed questionnaire I will contact you to arrange a time to administer
the second and final questionnaire of this study. This will take the form of a structured face-to-
face interview.
If you have any questions, or need to contact me for any reason, please call me on 9429 2903 or
0413 537 282, or email me at [email protected].
Sincerely
Mariel Sanchez-Rockliffe
Enclosure: Questionnaire

4
A.3 Questionnaire
Understanding the Influence of Migration on
Personal Identity
Information Sheet
Conducted by Mariel Sanchez-Rockliffe
Supervisors: Dr Glen Bates and Dr Emiko Kashima
This study compares the self-narratives (or life stories) of migrants with those of other migrants.
The primary aim is to help us understand how the migrant experience affects one’s sense of
personal identity.
Those wishing to participate will first complete a questionnaire relevant to personal qualities and
relationships with others. The person would then participate in a research interview designed to
elicit the person’s current life story.
The questionnaire will take approximately 45 minutes to complete and the interview will take
approximately 90 minutes. All participants will receive feedback on their life story, and will have
an opportunity to follow up any comments or reactions they have after the interview.
Participants will be identified by a number, and their data will not contain their name on any part
of the record. Please be assured that while the general results from the study may appear in
publications, information by individual participants will be kept confidential. You are free to
withdraw your consent and discontinue participating in the study at any time.
Please consider the purpose and time commitment of this study before you decide whether or not
to participate. Retain this information sheet for your own records.
Questions about this project can be directed to me (9214-5554) or to my supervisors, Dr Glen
Bates (9214-8100), and Dr Emiko Kashima (9214-8206), Psychology Discipline, School of
Behavioural Sciences, Swinburne University of Technology. If you have queries or concerns
which the senior investigaror was unable to satisfy, please contact:
The Chair, SBS Research Ethics Committee
School of Social and Behavioural Sciences, Mail H24
Swinburrne University of Technology, Hawthorn, Victoria 3122
If you have a complaint about the way that you were treated during this study please write to:
The Chair, Human Research Ethics Committee
Swinburrne University of Technology, Hawthorn, Victoria 3122
Thank you.
5
Understanding the Influence of Migration on
Personal Identity
An investigation into how the migrant experience affects one’s sense of personal identity.
I (FULL NAME)……………………………………………………………………………………………
OF (ADDRESS)….………….…………………………………………………………………………….
CONTACT PHONE NUMBER……………………………………………………………………………
HAVE READ AND UNDERSTOOD THE INFORMATION ABOVE.
I AGREE TO PARTICIPATE IN THIS STUDY, REALISING THAT I AM FREE TO WITHDRAW
AT ANY TIME.
I AGREE THAT RESEARCH DATA COLLECTED FOR THE STUDY MAY BE PUBLISHED ON
THE CONDITION THAT MY NAME IS NOT USED.
NAME OF PARTICIPANT…………………………………………………………………………………
SIGNATURE………………………………………………….……..DATE………………………………

6
Demographics
Age ............................................................................................................................ years
Occupation ............................................................................................................... specify
Sex
Circle one
Male ........................................................................................................................... 1
Female ....................................................................................................................... 2
Marital status
Circle one number to show what best describes your marital circumstances at the moment.
Single ......................................................................................................................... 1
Married or marital relationship .................................................................................... 2
Divorced or separated ................................................................................................ 3
Widowed .................................................................................................................... 4
Highest level of education
Circle one number to show which best describes the highest level of education you have
achieved
Before Year 10 ........................................................................................................... 1
Year 10 ...................................................................................................................... 2
Year 11 ...................................................................................................................... 3
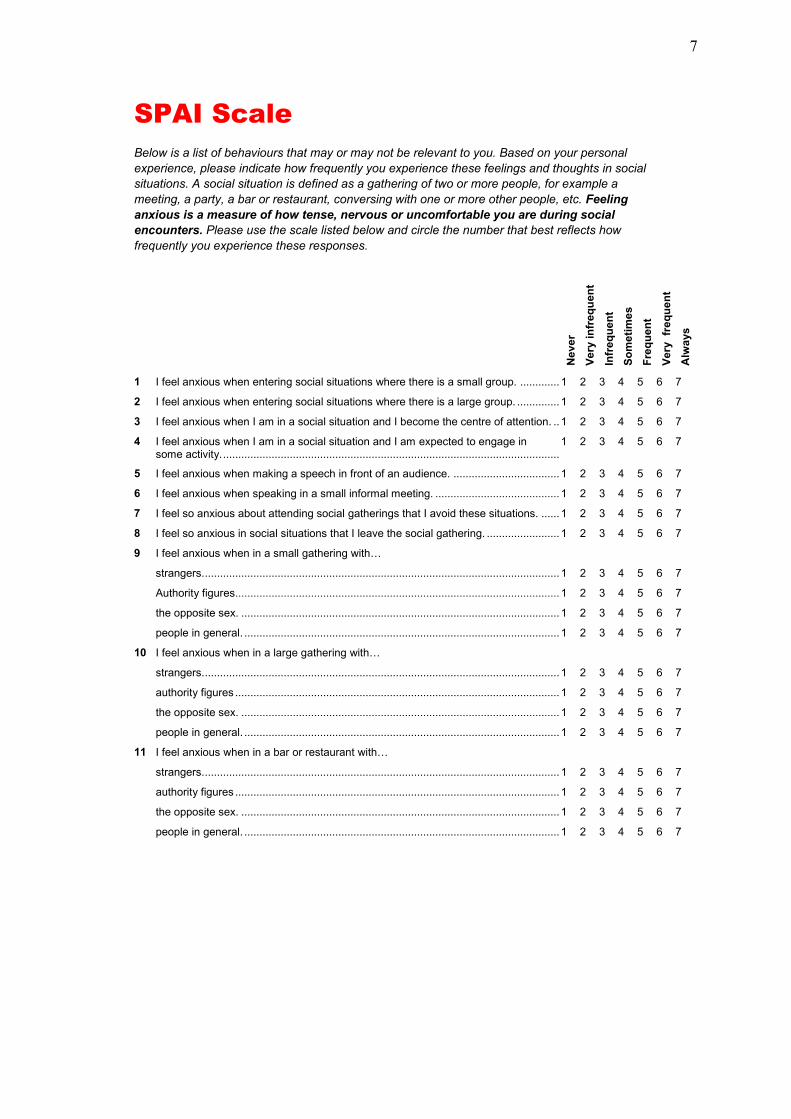
7
SPAI Scale
Below is a list of behaviours that may or may not be relevant to you. Based on your personal
experience, please indicate how frequently you experience these feelings and thoughts in social
situations. A social situation is defined as a gathering of two or more people, for example a
meeting, a party, a bar or restaurant, conversing with one or more other people, etc. Feeling
anxious is a measure of how tense, nervous or uncomfortable you are during social
encounters. Please use the scale listed below and circle the number that best reflects how
frequently you experience these responses.
Ne
ve
r
Ve
ry in
fre
qu
en
t
Infr
eq
ue
nt
So
me
tim
es
Fre
qu
en
t
Ve
ry fr
eq
ue
nt
Alw
ays
1 I feel anxious when entering social situations where there is a small group. ................ 1 2 3 4 5 6 7
2 I feel anxious when entering social situations where there is a large group. ................. 1 2 3 4 5 6 7
3 I feel anxious when I am in a social situation and I become the centre of attention. ..... 1 2 3 4 5 6 7
4 I feel anxious when I am in a social situation and I am expected to engage in some activity. ..................................................................................................................
1 2 3 4 5 6 7
5 I feel anxious when making a speech in front of an audience. ...................................... 1 2 3 4 5 6 7
6 I feel anxious when speaking in a small informal meeting. ............................................ 1 2 3 4 5 6 7
7 I feel so anxious about attending social gatherings that I avoid these situations. ......... 1 2 3 4 5 6 7
8 I feel so anxious in social situations that I leave the social gathering. ........................... 1 2 3 4 5 6 7
9 I feel anxious when in a small gathering with…
strangers. ........................................................................................................................ 1 2 3 4 5 6 7
Authority figures.............................................................................................................. 1 2 3 4 5 6 7
the opposite sex. ............................................................................................................ 1 2 3 4 5 6 7
people in general. ........................................................................................................... 1 2 3 4 5 6 7
10 I feel anxious when in a large gathering with…
strangers. ........................................................................................................................ 1 2 3 4 5 6 7
authority figures .............................................................................................................. 1 2 3 4 5 6 7
the opposite sex. ............................................................................................................ 1 2 3 4 5 6 7
people in general. ........................................................................................................... 1 2 3 4 5 6 7
11 I feel anxious when in a bar or restaurant with…
strangers. ........................................................................................................................ 1 2 3 4 5 6 7
authority figures .............................................................................................................. 1 2 3 4 5 6 7
the opposite sex. ............................................................................................................ 1 2 3 4 5 6 7
people in general. ........................................................................................................... 1 2 3 4 5 6 7
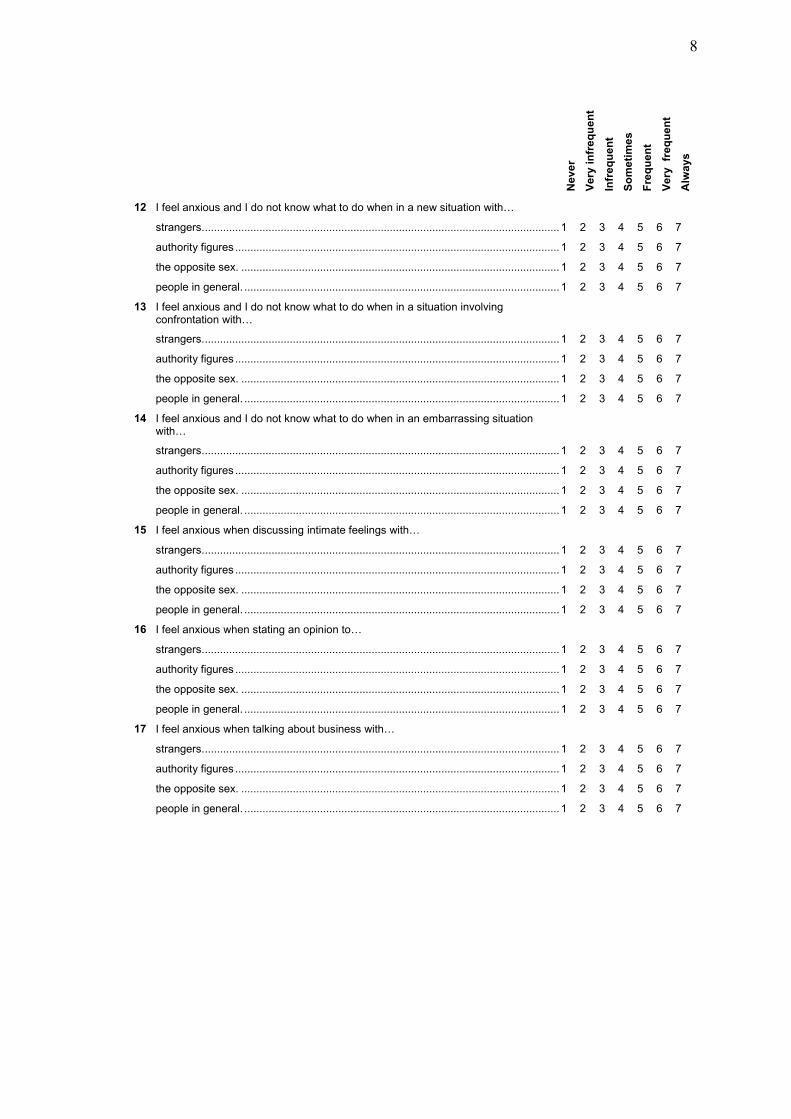
8
Neve
r
Very
in
freq
uen
t
Infr
eq
uen
t
So
meti
me
s
Fre
qu
en
t
Very
fr
eq
uen
t
Alw
ays
12 I feel anxious and I do not know what to do when in a new situation with…
strangers. ........................................................................................................................ 1 2 3 4 5 6 7
authority figures .............................................................................................................. 1 2 3 4 5 6 7
the opposite sex. ............................................................................................................ 1 2 3 4 5 6 7
people in general. ........................................................................................................... 1 2 3 4 5 6 7
13 I feel anxious and I do not know what to do when in a situation involving confrontation with…
strangers. ........................................................................................................................ 1 2 3 4 5 6 7
authority figures .............................................................................................................. 1 2 3 4 5 6 7
the opposite sex. ............................................................................................................ 1 2 3 4 5 6 7
people in general. ........................................................................................................... 1 2 3 4 5 6 7
14 I feel anxious and I do not know what to do when in an embarrassing situation with…
strangers. ........................................................................................................................ 1 2 3 4 5 6 7
authority figures .............................................................................................................. 1 2 3 4 5 6 7
the opposite sex. ............................................................................................................ 1 2 3 4 5 6 7
people in general. ........................................................................................................... 1 2 3 4 5 6 7
15 I feel anxious when discussing intimate feelings with…
strangers. ........................................................................................................................ 1 2 3 4 5 6 7
authority figures .............................................................................................................. 1 2 3 4 5 6 7
the opposite sex. ............................................................................................................ 1 2 3 4 5 6 7
people in general. ........................................................................................................... 1 2 3 4 5 6 7
16 I feel anxious when stating an opinion to…
strangers. ........................................................................................................................ 1 2 3 4 5 6 7
authority figures .............................................................................................................. 1 2 3 4 5 6 7
the opposite sex. ............................................................................................................ 1 2 3 4 5 6 7
people in general. ........................................................................................................... 1 2 3 4 5 6 7
17 I feel anxious when talking about business with…
strangers. ........................................................................................................................ 1 2 3 4 5 6 7
authority figures .............................................................................................................. 1 2 3 4 5 6 7
the opposite sex. ............................................................................................................ 1 2 3 4 5 6 7
people in general. ........................................................................................................... 1 2 3 4 5 6 7

9
Ne
ve
r
Ve
ry in
fre
qu
en
t
Infr
eq
ue
nt
So
me
tim
es
Fre
qu
en
t
Ve
ry fr
eq
ue
nt
Alw
ays
18 I feel anxious when approaching and/or initiating a conversation with…
strangers. ........................................................................................................................ 1 2 3 4 5 6 7
authority figures .............................................................................................................. 1 2 3 4 5 6 7
the opposite sex. ............................................................................................................ 1 2 3 4 5 6 7
people in general. ........................................................................................................... 1 2 3 4 5 6 7
19 I feel anxious when having to interact for longer than a few minutes with…
strangers. ........................................................................................................................ 1 2 3 4 5 6 7
authority figures .............................................................................................................. 1 2 3 4 5 6 7
the opposite sex. ............................................................................................................ 1 2 3 4 5 6 7
people in general. ........................................................................................................... 1 2 3 4 5 6 7
20 I feel anxious when drinking (any type of beverage) and/or eating in front of…
strangers. ........................................................................................................................ 1 2 3 4 5 6 7
authority figures .............................................................................................................. 1 2 3 4 5 6 7
the opposite sex. ............................................................................................................ 1 2 3 4 5 6 7
people in general. ........................................................................................................... 1 2 3 4 5 6 7
21 I feel anxious when writing or typing in front of…
strangers. ........................................................................................................................ 1 2 3 4 5 6 7
authority figures .............................................................................................................. 1 2 3 4 5 6 7
the opposite sex. ............................................................................................................ 1 2 3 4 5 6 7
people in general. ........................................................................................................... 1 2 3 4 5 6 7
22 I feel anxious when speaking in front of…
strangers. ........................................................................................................................ 1 2 3 4 5 6 7
authority figures .............................................................................................................. 1 2 3 4 5 6 7
the opposite sex. ............................................................................................................ 1 2 3 4 5 6 7
people in general. ........................................................................................................... 1 2 3 4 5 6 7
23 I feel anxious when being criticised or rejected by…
strangers. ........................................................................................................................ 1 2 3 4 5 6 7
authority figures .............................................................................................................. 1 2 3 4 5 6 7
the opposite sex. ............................................................................................................ 1 2 3 4 5 6 7
people in general. ........................................................................................................... 1 2 3 4 5 6 7

10
Neve
r
Very
in
freq
uen
t
Infr
eq
uen
t
So
meti
me
s
Fre
qu
en
t
Very
fr
eq
uen
t
Alw
ays
24 I attempt to avoid social situations where there are…
strangers. ........................................................................................................................ 1 2 3 4 5 6 7
authority figures .............................................................................................................. 1 2 3 4 5 6 7
the opposite sex. ............................................................................................................ 1 2 3 4 5 6 7
people in general. ........................................................................................................... 1 2 3 4 5 6 7
25 I leave social situations where there are…
strangers. ........................................................................................................................ 1 2 3 4 5 6 7
authority figures .............................................................................................................. 1 2 3 4 5 6 7
the opposite sex. ............................................................................................................ 1 2 3 4 5 6 7
people in general. ........................................................................................................... 1 2 3 4 5 6 7
26 Before entering a social situation I think about all the things that can go wrong. The types of thoughts I experience are:
Will I be dressed properly? ............................................................................................. 1 2 3 4 5 6 7
I will probably make a mistake and look foolish. ............................................................ 1 2 3 4 5 6 7
What will I do if no one speaks to me? ........................................................................... 1 2 3 4 5 6 7
If there is a lag in the conversation what can I talk about? ............................................ 1 2 3 4 5 6 7
People will notice how anxious I am. ............................................................................. 1 2 3 4 5 6 7
27 I feel anxious before entering a social situation. ........................................................... 1 2 3 4 5 6 7
28 My voice leaves me or changes when I am talking in a social situation. ...................... 1 2 3 4 5 6 7
29 I am not likely to speak to people until they speak to me. ............................................. 1 2 3 4 5 6 7
30 I experience troublesome thoughts when I am in a social setting. For example:
I wish I could leave and avoid the whole situation. ....................................................... 1 2 3 4 5 6 7
If I mess up again I will really lose my confidence. ....................................................... 1 2 3 4 5 6 7
What kind of impression am I making? ......................................................................... 1 2 3 4 5 6 7
Whatever I say it will probably sound stupid. ................................................................ 1 2 3 4 5 6 7
31 I experience the following prior to entering a social situation:
sweating ......................................................................................................................... 1 2 3 4 5 6 7
frequent urge to urinate .................................................................................................. 1 2 3 4 5 6 7
heart palpitations ............................................................................................................ 1 2 3 4 5 6 7
32 I experience the following in a social situation:
sweating ......................................................................................................................... 1 2 3 4 5 6 7
frequent urge to urinate .................................................................................................. 1 2 3 4 5 6 7
heart palpitations ............................................................................................................ 1 2 3 4 5 6 7
33 I feel anxious when I am home alone. ............................................................................ 1 2 3 4 5 6 7
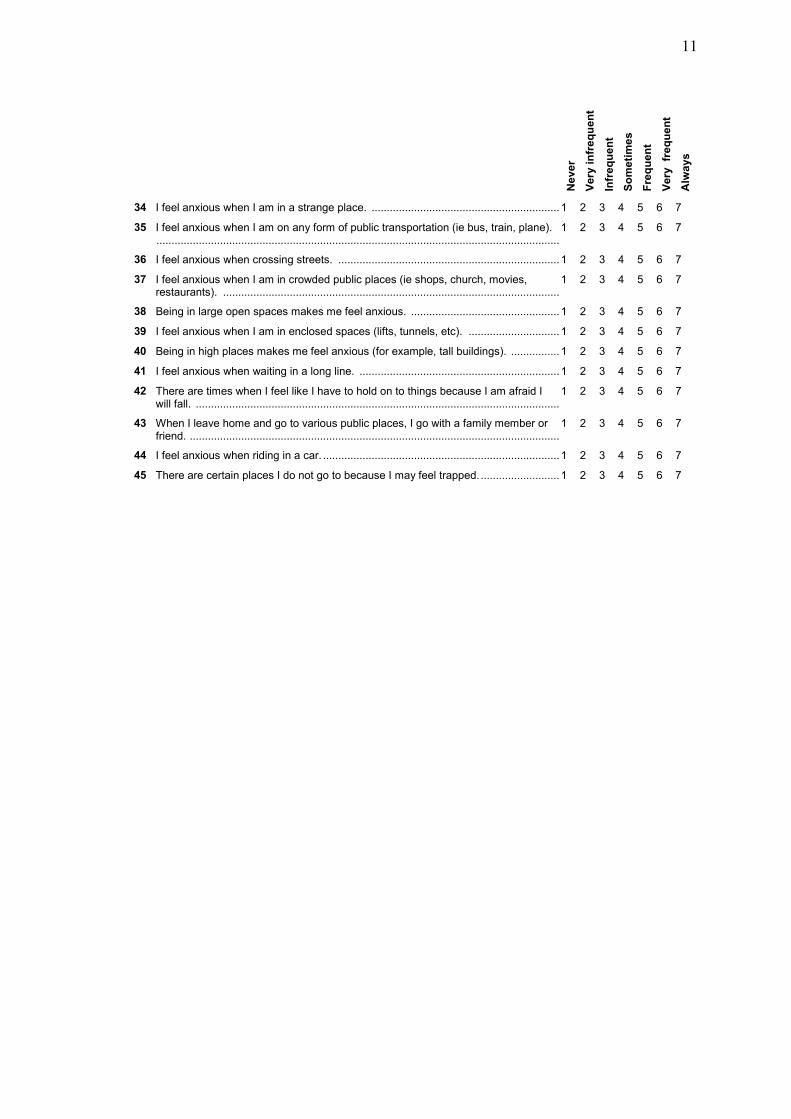
11
Ne
ve
r
Ve
ry in
fre
qu
en
t
Infr
eq
ue
nt
So
me
tim
es
Fre
qu
en
t
Ve
ry fr
eq
ue
nt
Alw
ays
34 I feel anxious when I am in a strange place. ................................................................. 1 2 3 4 5 6 7
35 I feel anxious when I am on any form of public transportation (ie bus, train, plane). ........................................................................................................................................
1 2 3 4 5 6 7
36 I feel anxious when crossing streets. ............................................................................ 1 2 3 4 5 6 7
37 I feel anxious when I am in crowded public places (ie shops, church, movies, restaurants). ..................................................................................................................
1 2 3 4 5 6 7
38 Being in large open spaces makes me feel anxious. .................................................... 1 2 3 4 5 6 7
39 I feel anxious when I am in enclosed spaces (lifts, tunnels, etc). ................................. 1 2 3 4 5 6 7
40 Being in high places makes me feel anxious (for example, tall buildings). ................... 1 2 3 4 5 6 7
41 I feel anxious when waiting in a long line. ..................................................................... 1 2 3 4 5 6 7
42 There are times when I feel like I have to hold on to things because I am afraid I will fall. ...........................................................................................................................
1 2 3 4 5 6 7
43 When I leave home and go to various public places, I go with a family member or friend. .............................................................................................................................
1 2 3 4 5 6 7
44 I feel anxious when riding in a car. ................................................................................. 1 2 3 4 5 6 7
45 There are certain places I do not go to because I may feel trapped. ............................. 1 2 3 4 5 6 7
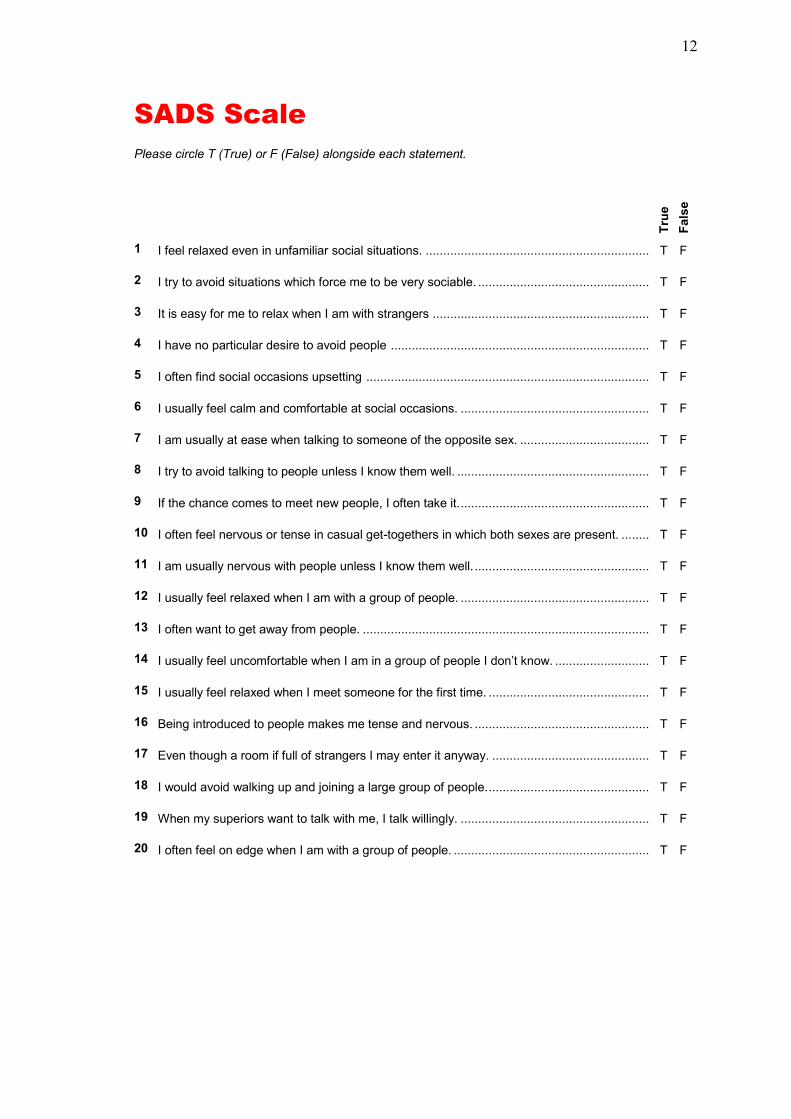
12
SADS Scale
Please circle T (True) or F (False) alongside each statement.
Tru
e
Fals
e
1 I feel relaxed even in unfamiliar social situations. ................................................................ T F
2 I try to avoid situations which force me to be very sociable. ................................................. T F
3 It is easy for me to relax when I am with strangers .............................................................. T F
4 I have no particular desire to avoid people .......................................................................... T F
5 I often find social occasions upsetting ................................................................................. T F
6 I usually feel calm and comfortable at social occasions. ...................................................... T F
7 I am usually at ease when talking to someone of the opposite sex. ..................................... T F
8 I try to avoid talking to people unless I know them well. ....................................................... T F
9 If the chance comes to meet new people, I often take it. ...................................................... T F
10 I often feel nervous or tense in casual get-togethers in which both sexes are present. ........ T F
11 I am usually nervous with people unless I know them well. .................................................. T F
12 I usually feel relaxed when I am with a group of people. ...................................................... T F
13 I often want to get away from people. .................................................................................. T F
14 I usually feel uncomfortable when I am in a group of people I don’t know. ........................... T F
15 I usually feel relaxed when I meet someone for the first time. .............................................. T F
16 Being introduced to people makes me tense and nervous. .................................................. T F
17 Even though a room if full of strangers I may enter it anyway. ............................................. T F
18 I would avoid walking up and joining a large group of people. .............................................. T F
19 When my superiors want to talk with me, I talk willingly. ...................................................... T F
20 I often feel on edge when I am with a group of people. ........................................................ T F

13
FNES Scale
Please circle T (True) or F (False) alongside each statement.
Tru
e
Fals
e
1 I rarely worry about seeming foolish to others. .................................................................... T F
2 I worry about what people will think of me even when I know it doesn’t make any difference. T F
3 I become tense and jittery if I know someone is sizing me up. ............................................. T F
4 I am unconcerned even if I know people are forming an unfavourable impression of me. ... T F
5 I feel very upset when I commit some social error. .............................................................. T F
6 The opinions that important people have of me cause me little concern. ............................ T F
7 I am often afraid that I may look ridiculous or make a fool of myself. .................................. T F
8 I react very little when other people disapprove of me. ....................................................... T F
9 I am frequently afraid of other people noticing my shortcomings. ........................................ T F
10 The disapproval of others would have little effect on me. .................................................... T F
11 If someone is evaluating me I tend to expect the worst. ...................................................... T F
12 I rarely worry about what kind of impression I am making on someone. .............................. T F
13 I am afraid that others will not approve of me. ..................................................................... T F
14 I am afraid that people will find fault with me. ...................................................................... T F
15 Other people’s opinions of me do not bother me. ................................................................ T F
16 I am not necessarily upset if I do not please someone. ....................................................... T F
17 When I am talking to someone, I worry about what they may be thinking about me. ........... T F
18 I feel that you can’t help making social errors sometimes, so why worry about it. ............... T F
19 I am usually worried about what kind of impression I make. ................................................ T F
20 I worry a lot about what my superiors think of me. .............................................................. T F
21 I know if someone is judging me, it has little effect on me. .................................................. T F
22 I worry that others will think I am not worthwhile. ................................................................ T F
23 I worry very little about what others will think of me. ............................................................ T F
24 Sometimes I think I am too concerned with what other people think of me. ......................... T F
25 I often worry that I will say or do the wrong things. .............................................................. T F
26 I am often indifferent to the opinions others have of me. ..................................................... T F
27 I am usually confident that others will have a favourable impression of me. ........................ T F
28 I often worry that people who are important to me won’t think much of me. ........................ T F
29 I brood about the opinions my friends have about me. ........................................................ T F
30 I become tense and jittery if I know I am being judged by my superiors. ............................. T F

14
FNES Scale
Please circle T (True) or F (False) alongside each statement.
Tru
e
Fals
e
1 I rarely worry about seeming foolish to others. .................................................................... T F
2 I worry about what people will think of me even when I know it doesn’t make any difference. T F
3 I become tense and jittery if I know someone is sizing me up. ............................................. T F
4 I am unconcerned even if I know people are forming an unfavourable impression of me. ... T F
5 I feel very upset when I commit some social error. .............................................................. T F
6 The opinions that important people have of me cause me little concern. ............................ T F
7 I am often afraid that I may look ridiculous or make a fool of myself. .................................. T F
8 I react very little when other people disapprove of me. ....................................................... T F
9 I am frequently afraid of other people noticing my shortcomings. ........................................ T F
10 The disapproval of others would have little effect on me. .................................................... T F
11 If someone is evaluating me I tend to expect the worst. ...................................................... T F
12 I rarely worry about what kind of impression I am making on someone. .............................. T F
13 I am afraid that others will not approve of me. ..................................................................... T F
14 I am afraid that people will find fault with me. ...................................................................... T F
15 Other people’s opinions of me do not bother me. ................................................................ T F
16 I am not necessarily upset if I do not please someone. ....................................................... T F
17 When I am talking to someone, I worry about what they may be thinking about me. ........... T F
18 I feel that you can’t help making social errors sometimes, so why worry about it. ............... T F
19 I am usually worried about what kind of impression I make. ................................................ T F
20 I worry a lot about what my superiors think of me. .............................................................. T F
21 I know if someone is judging me, it has little effect on me. .................................................. T F
22 I worry that others will think I am not worthwhile. ................................................................ T F
23 I worry very little about what others will think of me. ............................................................ T F
24 Sometimes I think I am too concerned with what other people think of me. ......................... T F
25 I often worry that I will say or do the wrong things. .............................................................. T F
26 I am often indifferent to the opinions others have of me. ..................................................... T F
27 I am usually confident that others will have a favourable impression of me. ........................ T F
28 I often worry that people who are important to me won’t think much of me. ........................ T F
29 I brood about the opinions my friends have about me. ........................................................ T F
30 I become tense and jittery if I know I am being judged by my superiors. ............................. T F

15
Personal Wellbeing Scale
The following statements relate to descriptions of personal views of life. Each statement has six
possible answers, with the numbers 1 and 6 being extreme ends of a continuum. Please circle
the number which best expresses your answer. If you completely disagree with the statement,
circle “1”. If you completely agree with the statement, circle “6”. If you think differently, circle the
number which best expresses your response. Please circle only one response for each
statement.
Str
on
gly
dis
ag
ree
Dis
ag
ree
Mild
ly d
isag
ree
Mild
ly a
gre
e
Ag
ree
Str
on
gly
ag
ree
1 In general, I feel I am in charge of the situation in which I live........................................................... 1 2 3 4 5 6
2 Most people see me as loving and affectionate. ................................................................................ 1 2 3 4 5 6
3 Sometimes I change the way I act or think to be more like those around me. .................................. 1 2 3 4 5 6
4 I am not interested in activities that will expand my horizons. ........................................................... 1 2 3 4 5 6
5 I feel good when I think of what I’ve done in the past and what I hope to do in the future. ................................................................................................................................................. 1 2 3 4 5 6
6 When I look at the story of my life, I am pleased with how things have turned out. .......................... 1 2 3 4 5 6
7 The demands of everyday life often get me down. ............................................................................ 1 2 3 4 5 6
8 Maintaining close relationships has been difficult and frustrating for me. .......................................... 1 2 3 4 5 6
9 I am not afraid to voice my opinions, even when they are in opposition to the opinions of most people. ................................................................................................................................... 1 2 3 4 5 6
10 In general, I feel that I continue to learn more about myself as time goes by. ................................... 1 2 3 4 5 6
11 I live life one day at a time and don’t really think about the future. .................................................... 1 2 3 4 5 6
12 In general, I feel confident and positive about myself. ....................................................................... 1 2 3 4 5 6
13 I do not fit very well with the people and the community around me. ................................................ 1 2 3 4 5 6
14 I often feel lonely because I have few close friends with whom to share my concerns. .................... 1 2 3 4 5 6
15 My decisions are not usually influenced by what everyone else is doing. ......................................... 1 2 3 4 5 6
16 I am the kind of person who likes to give new things a try. ................................................................ 1 2 3 4 5 6
17 I tend to focus on the present, because the future nearly always brings me problems. .................... 1 2 3 4 5 6
18 I feel like many of the people I know have got more out of life than I have. ...................................... 1 2 3 4 5 6
19 I am quite good at managing the many responsibilities of my daily life. ............................................ 1 2 3 4 5 6
20 I enjoy personal and mutual conversations with family members or friends. ..................................... 1 2 3 4 5 6
21 I tend to worry about what other people think of me. ......................................................................... 1 2 3 4 5 6
22 I don’t want to try new ways of doing things—my life if fine the way it is. .......................................... 1 2 3 4 5 6
23 I have a sense of direction and purpose in life. .................................................................................. 1 2 3 4 5 6
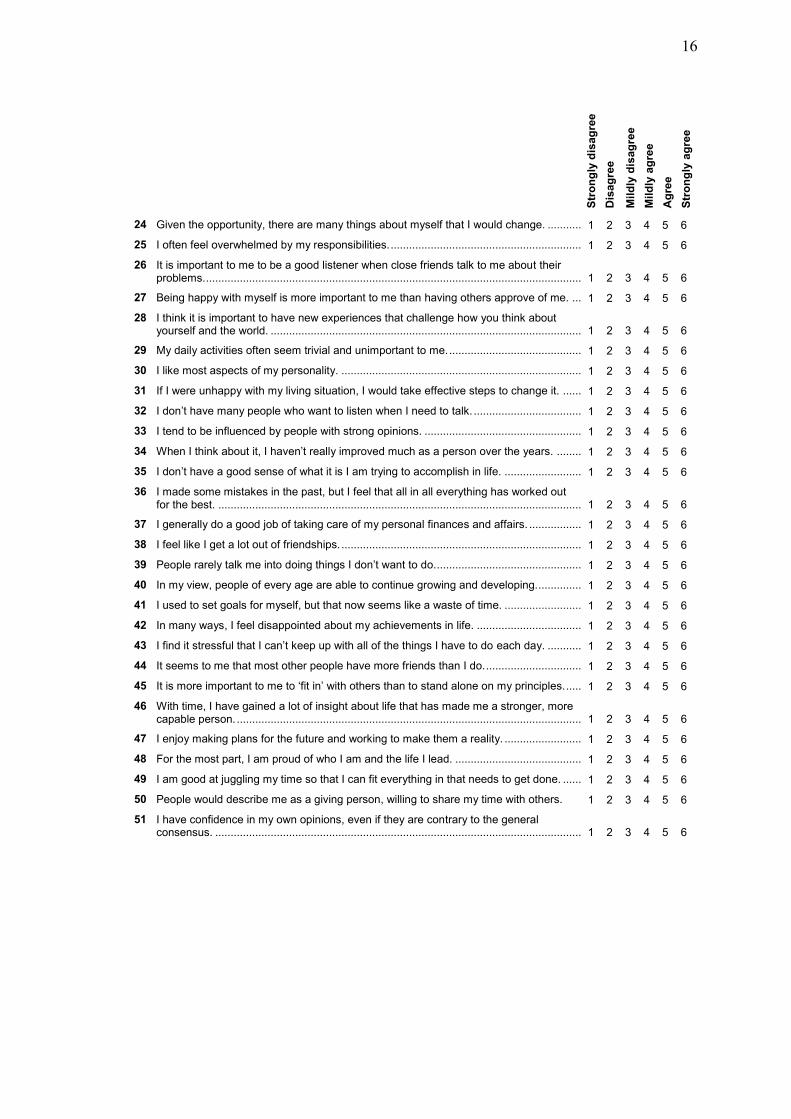
16
Str
on
gly
dis
ag
ree
Dis
ag
ree
Mild
ly d
isag
ree
Mild
ly a
gre
e
Ag
ree
Str
on
gly
ag
ree
24 Given the opportunity, there are many things about myself that I would change. ............................. 1 2 3 4 5 6
25 I often feel overwhelmed by my responsibilities. ................................................................................ 1 2 3 4 5 6
26 It is important to me to be a good listener when close friends talk to me about their problems. ............................................................................................................................................ 1 2 3 4 5 6
27 Being happy with myself is more important to me than having others approve of me. ..................... 1 2 3 4 5 6
28 I think it is important to have new experiences that challenge how you think about yourself and the world. ....................................................................................................................... 1 2 3 4 5 6
29 My daily activities often seem trivial and unimportant to me. ............................................................. 1 2 3 4 5 6
30 I like most aspects of my personality. ................................................................................................ 1 2 3 4 5 6
31 If I were unhappy with my living situation, I would take effective steps to change it. ........................ 1 2 3 4 5 6
32 I don’t have many people who want to listen when I need to talk. ..................................................... 1 2 3 4 5 6
33 I tend to be influenced by people with strong opinions. ..................................................................... 1 2 3 4 5 6
34 When I think about it, I haven’t really improved much as a person over the years. .......................... 1 2 3 4 5 6
35 I don’t have a good sense of what it is I am trying to accomplish in life. ........................................... 1 2 3 4 5 6
36 I made some mistakes in the past, but I feel that all in all everything has worked out for the best. ........................................................................................................................................ 1 2 3 4 5 6
37 I generally do a good job of taking care of my personal finances and affairs. ................................... 1 2 3 4 5 6
38 I feel like I get a lot out of friendships. ................................................................................................ 1 2 3 4 5 6
39 People rarely talk me into doing things I don’t want to do.................................................................. 1 2 3 4 5 6
40 In my view, people of every age are able to continue growing and developing................................. 1 2 3 4 5 6
41 I used to set goals for myself, but that now seems like a waste of time. ........................................... 1 2 3 4 5 6
42 In many ways, I feel disappointed about my achievements in life. .................................................... 1 2 3 4 5 6
43 I find it stressful that I can’t keep up with all of the things I have to do each day. ............................. 1 2 3 4 5 6
44 It seems to me that most other people have more friends than I do. ................................................. 1 2 3 4 5 6
45 It is more important to me to ‘fit in’ with others than to stand alone on my principles. ....................... 1 2 3 4 5 6
46 With time, I have gained a lot of insight about life that has made me a stronger, more capable person. .................................................................................................................................. 1 2 3 4 5 6
47 I enjoy making plans for the future and working to make them a reality. ........................................... 1 2 3 4 5 6
48 For the most part, I am proud of who I am and the life I lead. ........................................................... 1 2 3 4 5 6
49 I am good at juggling my time so that I can fit everything in that needs to get done. ........................ 1 2 3 4 5 6
50 People would describe me as a giving person, willing to share my time with others. 1 2 3 4 5 6
51 I have confidence in my own opinions, even if they are contrary to the general consensus. ......................................................................................................................................... 1 2 3 4 5 6
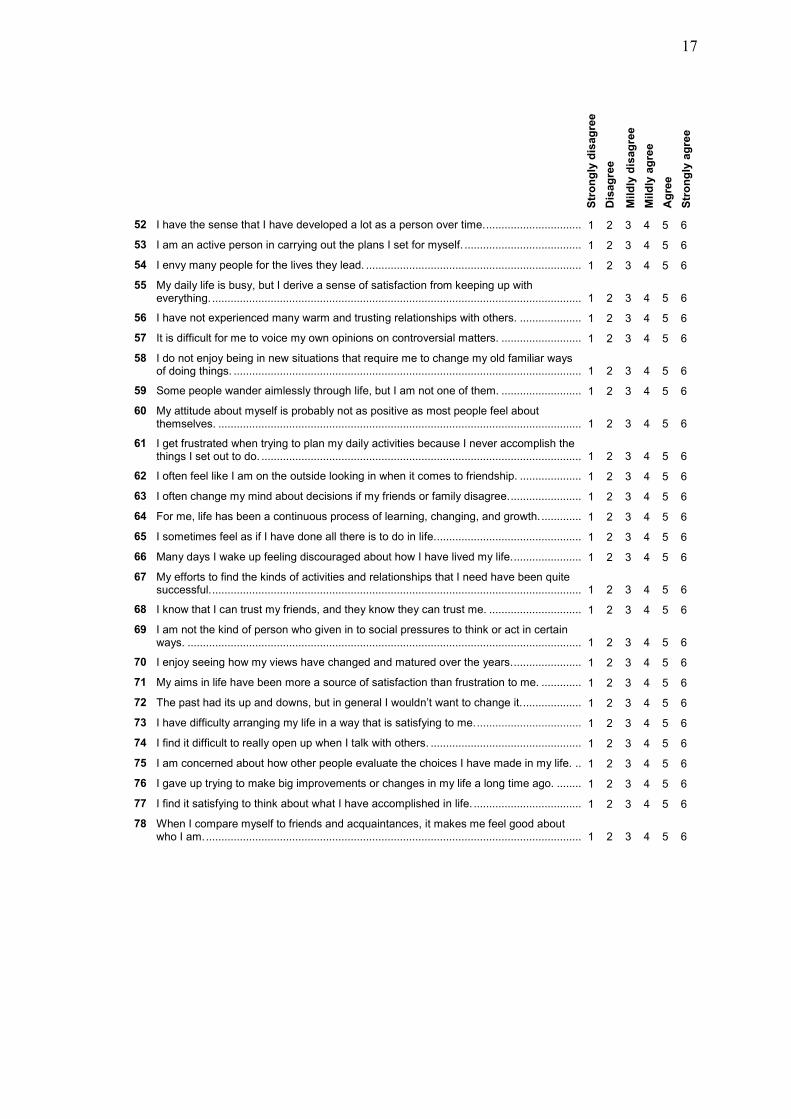
17
Str
on
gly
dis
ag
ree
Dis
ag
ree
Mild
ly d
isag
ree
Mild
ly a
gre
e
Ag
ree
Str
on
gly
ag
ree
52 I have the sense that I have developed a lot as a person over time. ................................................. 1 2 3 4 5 6
53 I am an active person in carrying out the plans I set for myself. ........................................................ 1 2 3 4 5 6
54 I envy many people for the lives they lead. ........................................................................................ 1 2 3 4 5 6
55 My daily life is busy, but I derive a sense of satisfaction from keeping up with everything. .......................................................................................................................................... 1 2 3 4 5 6
56 I have not experienced many warm and trusting relationships with others. ...................................... 1 2 3 4 5 6
57 It is difficult for me to voice my own opinions on controversial matters. ............................................ 1 2 3 4 5 6
58 I do not enjoy being in new situations that require me to change my old familiar ways of doing things. ................................................................................................................................... 1 2 3 4 5 6
59 Some people wander aimlessly through life, but I am not one of them. ............................................ 1 2 3 4 5 6
60 My attitude about myself is probably not as positive as most people feel about themselves. ........................................................................................................................................ 1 2 3 4 5 6
61 I get frustrated when trying to plan my daily activities because I never accomplish the things I set out to do. .......................................................................................................................... 1 2 3 4 5 6
62 I often feel like I am on the outside looking in when it comes to friendship. ...................................... 1 2 3 4 5 6
63 I often change my mind about decisions if my friends or family disagree. ......................................... 1 2 3 4 5 6
64 For me, life has been a continuous process of learning, changing, and growth. ............................... 1 2 3 4 5 6
65 I sometimes feel as if I have done all there is to do in life.................................................................. 1 2 3 4 5 6
66 Many days I wake up feeling discouraged about how I have lived my life. ........................................ 1 2 3 4 5 6
67 My efforts to find the kinds of activities and relationships that I need have been quite successful. .......................................................................................................................................... 1 2 3 4 5 6
68 I know that I can trust my friends, and they know they can trust me. ................................................ 1 2 3 4 5 6
69 I am not the kind of person who given in to social pressures to think or act in certain ways. .................................................................................................................................................. 1 2 3 4 5 6
70 I enjoy seeing how my views have changed and matured over the years. ........................................ 1 2 3 4 5 6
71 My aims in life have been more a source of satisfaction than frustration to me. ............................... 1 2 3 4 5 6
72 The past had its up and downs, but in general I wouldn’t want to change it. ..................................... 1 2 3 4 5 6
73 I have difficulty arranging my life in a way that is satisfying to me. .................................................... 1 2 3 4 5 6
74 I find it difficult to really open up when I talk with others. ................................................................... 1 2 3 4 5 6
75 I am concerned about how other people evaluate the choices I have made in my life. .................... 1 2 3 4 5 6
76 I gave up trying to make big improvements or changes in my life a long time ago. .......................... 1 2 3 4 5 6
77 I find it satisfying to think about what I have accomplished in life. ..................................................... 1 2 3 4 5 6
78 When I compare myself to friends and acquaintances, it makes me feel good about who I am. ............................................................................................................................................ 1 2 3 4 5 6
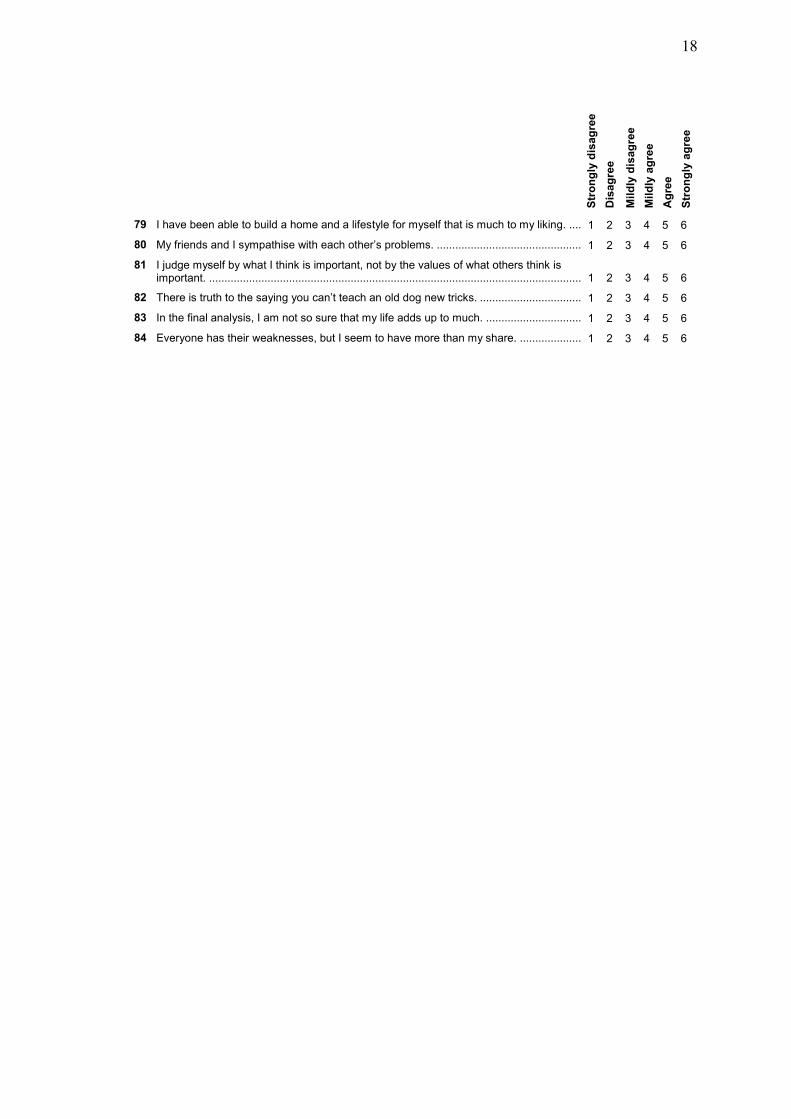
18
Str
on
gly
dis
ag
ree
Dis
ag
ree
Mild
ly d
isag
ree
Mild
ly a
gre
e
Ag
ree
Str
on
gly
ag
ree
79 I have been able to build a home and a lifestyle for myself that is much to my liking. ...................... 1 2 3 4 5 6
80 My friends and I sympathise with each other’s problems. ................................................................. 1 2 3 4 5 6
81 I judge myself by what I think is important, not by the values of what others think is important. ........................................................................................................................................... 1 2 3 4 5 6
82 There is truth to the saying you can’t teach an old dog new tricks. ................................................... 1 2 3 4 5 6
83 In the final analysis, I am not so sure that my life adds up to much. ................................................. 1 2 3 4 5 6
84 Everyone has their weaknesses, but I seem to have more than my share. ...................................... 1 2 3 4 5 6

19
BDI-II Scale
This questionnaire consists of 21 groups of statements. Please read each group of statements
carefully, and then pick out the one statement in each group that best describes the way you
have been feeling during the past two weeks, including today. Circle the number beside the
statement you have picked. If several statements in the groups seem to apply equally well, circle
the highest number for that group. Be sure that you do not choose more than one statement for
any group, including Item 16 (Changes in Sleeping Pattern) or Item 18 (Changes in Appetite).
1 Sadness I do not feel sad. ....................................................................................................................... 0
I feel sad much of the time. ....................................................................................................... 1
I am sad all of the time. ............................................................................................................. 2
I am so sad or unhappy that I can’t stand it. .............................................................................. 3
2 Pessimism I am not discouraged about my future. ...................................................................................... 0
I feel more discouraged about my future than I used to be. ....................................................... 1
I do not expect things to work out for me. .................................................................................. 2
I feel my future is hopeless and will only get worse. .................................................................. 3
3 Past failure I do not feel like a failure. .......................................................................................................... 0
I have failed more than I should have. ....................................................................................... 1
As I look back, I see a lot of failures. ......................................................................................... 2
I feel I am a total failure as a person. ........................................................................................ 3
4 Loss of pleasure I get as much pleasure as I ever did from the things I enjoy. ..................................................... 0
I don’t enjoy things as much as I used to. ................................................................................. 1
I get very little pleasure from the things I used to enjoy. ............................................................ 2
I can’t get any pleasure from the things I used to enjoy. ............................................................ 3
5 Guilty feelings I don’t feel particularly guilty. ..................................................................................................... 0
I feel guilty over many things I have done or should have done. ............................................... 1
I feel quite guilty most of the time. ............................................................................................. 2
I feel guilty all of the time. .......................................................................................................... 3
6 Punishment
feelings I don’t feel I am being punished. ............................................................................................... 0
I feel I may be punished. ........................................................................................................... 1
I expect to be punished. ............................................................................................................ 2
I feel I am being punished. ........................................................................................................ 3

20
7 Self-dislike I feel the same about myself as ever. ........................................................................................ 0
I have lost confidence in myself ................................................................................................ 1
I am disappointed in myself ....................................................................................................... 2
I dislike myself. ......................................................................................................................... 3
8 Self-criticism I don’t criticise or blame myself more than usual. ...................................................................... 0
I am more critical of myself than I used to be. ........................................................................... 1
I criticise myself for all of my faults. ........................................................................................... 2
I blame myself for everything bad that happens. ....................................................................... 3
9 Suicidal thoughts
or wishes I don’t have any thoughts of killing myself. ................................................................................ 0
I have thoughts of killing myself, but I would not carry them out. ............................................... 1
I would like to kill myself ............................................................................................................ 2
I would kill myself if I had the chance. ....................................................................................... 3
10 Crying I don’t cry any more than I used to. ........................................................................................... 0
I cry more than I used to. .......................................................................................................... 1
I cry over every little thing. ........................................................................................................ 2
I feel like crying, but I can’t. ....................................................................................................... 3
11 Agitation I am no more restless or wound up than usual. ......................................................................... 0
I feel more restless or wound up than usual. ............................................................................. 1
I am so restless or agitated that it’s hard to stay still. ................................................................ 2
I am so restless or agitated that I have to keep moving or doing something. ................................................................................................................................
3
12 Loss of interest I have not lost interest in other people or activities. ................................................................... 0
I am less interested in other people or things than before. ........................................................ 1
I have lost most of my interest in other people or things. ........................................................... 2
It’s hard to get interested in anything. ........................................................................................ 3
13 Indecisiveness I make decisions about as well as ever. .................................................................................... 0
I find it more difficult to make decisions than usual. ................................................................... 1
I have much greater difficulty in making decisions than I used to. ............................................. 2
I have trouble making any decisions. ........................................................................................ 3
14 Worthlessness I do not feel I am worthless. ...................................................................................................... 0
I don’t consider myself as worthwhile and useful as I used to. ................................................... 1
I feel more worthless as compared to other people. .................................................................. 2
I feel utterly worthless. .............................................................................................................. 3
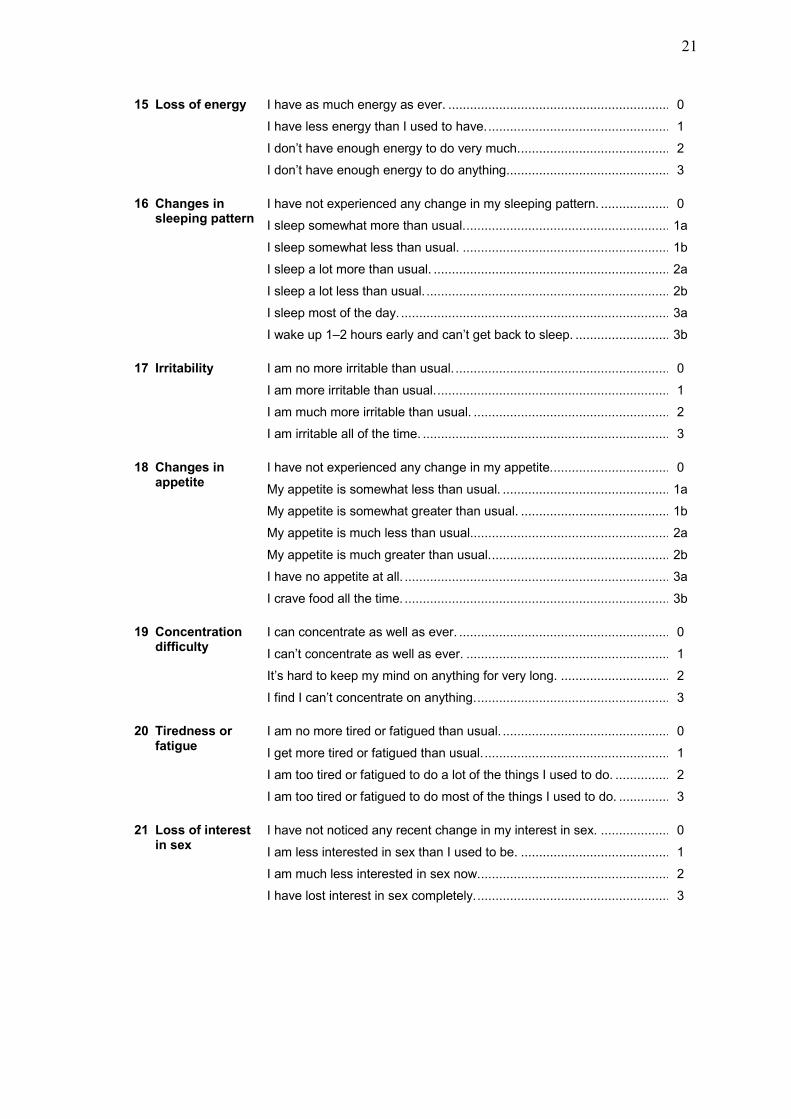
21
15 Loss of energy I have as much energy as ever. ................................................................................................ 0
I have less energy than I used to have. ..................................................................................... 1
I don’t have enough energy to do very much. ............................................................................ 2
I don’t have enough energy to do anything................................................................................ 3
16 Changes in
sleeping pattern I have not experienced any change in my sleeping pattern. ...................................................... 0
I sleep somewhat more than usual. ........................................................................................... 1a
I sleep somewhat less than usual. ............................................................................................ 1b
I sleep a lot more than usual. .................................................................................................... 2a
I sleep a lot less than usual. ...................................................................................................... 2b
I sleep most of the day. ............................................................................................................. 3a
I wake up 1–2 hours early and can’t get back to sleep. ............................................................. 3b
17 Irritability I am no more irritable than usual. .............................................................................................. 0
I am more irritable than usual. ................................................................................................... 1
I am much more irritable than usual. ......................................................................................... 2
I am irritable all of the time. ....................................................................................................... 3
18 Changes in
appetite I have not experienced any change in my appetite. ................................................................... 0
My appetite is somewhat less than usual. ................................................................................. 1a
My appetite is somewhat greater than usual. ............................................................................ 1b
My appetite is much less than usual.......................................................................................... 2a
My appetite is much greater than usual. .................................................................................... 2b
I have no appetite at all. ............................................................................................................ 3a
I crave food all the time. ............................................................................................................ 3b
19 Concentration
difficulty I can concentrate as well as ever. ............................................................................................. 0
I can’t concentrate as well as ever. ........................................................................................... 1
It’s hard to keep my mind on anything for very long. ................................................................. 2
I find I can’t concentrate on anything. ........................................................................................ 3
20 Tiredness or
fatigue I am no more tired or fatigued than usual. ................................................................................. 0
I get more tired or fatigued than usual. ...................................................................................... 1
I am too tired or fatigued to do a lot of the things I used to do. .................................................. 2
I am too tired or fatigued to do most of the things I used to do. ................................................. 3
21 Loss of interest
in sex I have not noticed any recent change in my interest in sex. ...................................................... 0
I am less interested in sex than I used to be. ............................................................................ 1
I am much less interested in sex now. ....................................................................................... 2
I have lost interest in sex completely. ........................................................................................ 3

22
A.4 Questions of the Self-confrontation Method
Questions of the Self-confrontation method
Set 1: The Past
These questions are intended to guide you in reviewing one or more aspects of your life
which may have been of great importance to you.
■ Has there been anything of major significance in your past life which still continues to
exert a strong influence on you? Example: ‘After high school I never managed to build
up a group of friends; I felt left out and stuck between two worlds’.
■ Was there in the past any person or persons, experience or circumstance which greatly
influenced your life and still appreciably affects your present existence? Example: ‘My
parents have always treated us as equals. They always tried to keep me stimulated. I could
always talk very well with my parents’.
Set 2: The Present
This set again consists of two questions which will lead you, after a certain amount of
reflection, to formulate a response:
■ Is there anything in your present existence which is of major importance to you or exerts
a significant influence on you? Example: ‘Bodily complaints: Every time I find that I
have a problem, my body signals it in one way or another’.
■ Is there in your present existence any person or persons or circumstance which exerts a
significant influence on you? Example: ‘Wendy is a good friend’.
Set 3: The Future
The following questions will again guide you to a response:
■ Do you foresee anything that will be of great importance for, or exert a major influence
on your future life? Example: ‘I want to pursue a combination of studying and volunteer
work’.
■ Do you feel that a certain person, persons or circumstance will exert a significant
influence on your future life? Example: ‘John and I want children in the future’.
■ Is there any future goal or object which you expect to play an important role in your life?
Example: ‘I would like to meet somebody who would teach me how to have a normal
life’.
Two final questions:
■ How do you generally feel these days?
■ How would you like to feel?
These questions are not answered by a formulation. Instead, you answer them by adding two
extra tows in th matrix using the same list of affect terms.

23
A.5 Affect Terms for Rating Valuations
Affect Terms
To what extent do you experience the following feelings
in relation to the specific valuation you have formulated?
When you experience the feeling very much, give a 5
When you experience the feeling much, give a 4
When you experience the feeling rather much, give a 3
When you experience the feeling to some extent, give a 2
When you experience the feeling a little bit, give a 1
When you experience the feeling not at all, give a 0
1 Joy 13 Guilt
2 Powerlessness 14 Self-confidence
3 Self-esteem 15 Loneliness
4 Anxiety 16 Trust
5 Satisfaction 17 Inferiority
6 Strength 18 Intimacy
7 Shame 19 Safety
8 Enjoyment 20 Anger
9 Caring 21 Pride
10 Love 22 Energy
11 Self-alienation 23 Inner calm
12 Tenderness 24 Freedom

24
A.6 Matrix of Valuation / Affect
Matrix of Valuation x Affect
1 2 3 4 5 6 7 8 9 10 11 12 13 14 15 16 17 18 19 20 21 22 23 24
p n s n p s n p o o n o n s n p n o p n s p p p S O P N
Val. no.
37
38
39
40
41
42
43
44
45
46
47
48
Note: Rows represent valuations and columns represent affect terms used for the indices S, O, P and N.
Each cell in the matrix indicates on 0-5 scale the extent to which a particular affect applies to a valuation.

25
APPENDIX B
STATISTICAL ANALYSIS FOR STUDY 1
Variables in the dataset
Variable name Description
Affect scores affe_01..24 Mean affect scores for 24 affects
Self-confrontation indices 1
Country of origin orign_s Self-enhancement (in country of origin)
orign_o Union-with-the-other (in country of origin)
orign_p Positive affect (in country of origin)
orign_n Negative affect (in country of origin)
Australia austr_s Self-enhancement (in Australia)
austr_o Union-with-the-other (in Australia)
austr_p Positive affect (in Australia)
austr_n Negative affect (in Australia)
General genrl_s Self-enhancement (general)
genrl_o Union-with-the-other (general)
genrl_p Positive affect (general)
genrl_n Negative affect (general)
Ideal ideal_s Self-enhancement (ideal)
ideal_o Union-with-the-other (ideal)
ideal_p Positive affect (ideal)
ideal_n Negative affect (ideal)
Psychological self-reports
SAD sads_01..28 Individual item responses
sads 2 Composite scale
FNE fnes_01..30 Individual item responses
fnes 2 Composite scale
BDI-II bdi2_01..21 Individual item responses
bdi2 2 Composite scale
PWB pws__01..84 Individual item responses
pws1 2 Environmental mastery subscale
pws2 2 Positive relations with others subscale
pws3 2 Autonomy subscale
pws4 2 Personal growth subscale
pws5 2 Purpose in life subscale
pws6 2 Self-acceptance subscale
Demographics
dm_aged Age
dm_gend Sex
dm_marr Marital status
dm_educ Education level
dm_year Years in Australia
dm_lang Language at home
dm_refu Refugee status
dm_ethn Ethnic identification
dm_indi Individualism

26
Cluster variables
Hierarchical clustering clu2_13 Cluster in country of origin
clu2_23 Cluster in Australia
K-means clustering qcl_13 Cluster in country of origin
qcl_23 Cluster in Australia
Type id_typed Group
Notes
1 Self-confrontation indices were computed from affect scores before being entered into the
SPSS data set. Z-scores of indices, which are computed as part of the clustering
procedure, are prefixed by “z”: thus, zorign_s is the z-score of orign_s.
2 Computed in the course of the analysis.
3 Computed as part of the clustering procedure.
4 Computed from clu2_1 and clu2_2.
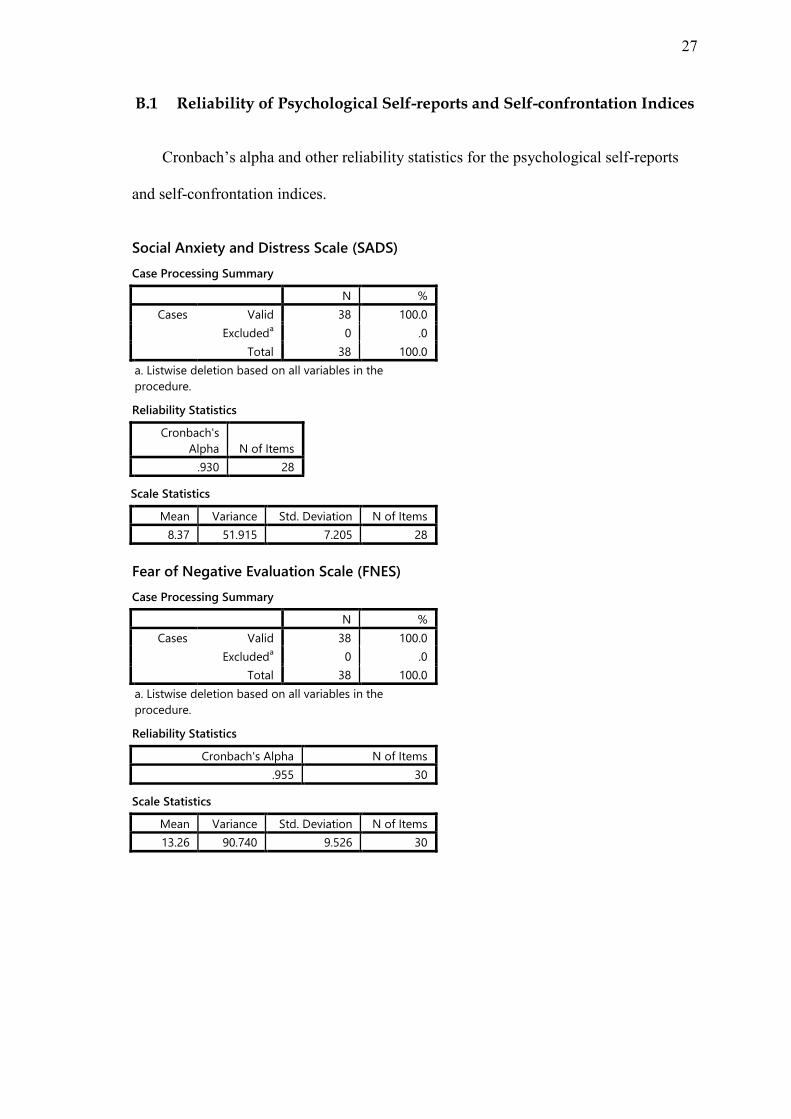
27
B.1 Reliability of Psychological Self-reports and Self-confrontation Indices
Cronbach’s alpha and other reliability statistics for the psychological self-reports
and self-confrontation indices.
Social Anxiety and Distress Scale (SADS)
Case Processing Summary
N %
Cases Valid 38 100.0
Excludeda 0 .0
Total 38 100.0
a. Listwise deletion based on all variables in the
procedure.
Reliability Statistics
Cronbach's
Alpha N of Items
.930 28
Scale Statistics
Mean Variance Std. Deviation N of Items
8.37 51.915 7.205 28
Fear of Negative Evaluation Scale (FNES)
Case Processing Summary
N %
Cases Valid 38 100.0
Excludeda 0 .0
Total 38 100.0
a. Listwise deletion based on all variables in the
procedure.
Reliability Statistics
Cronbach's Alpha N of Items
.955 30
Scale Statistics
Mean Variance Std. Deviation N of Items
13.26 90.740 9.526 30
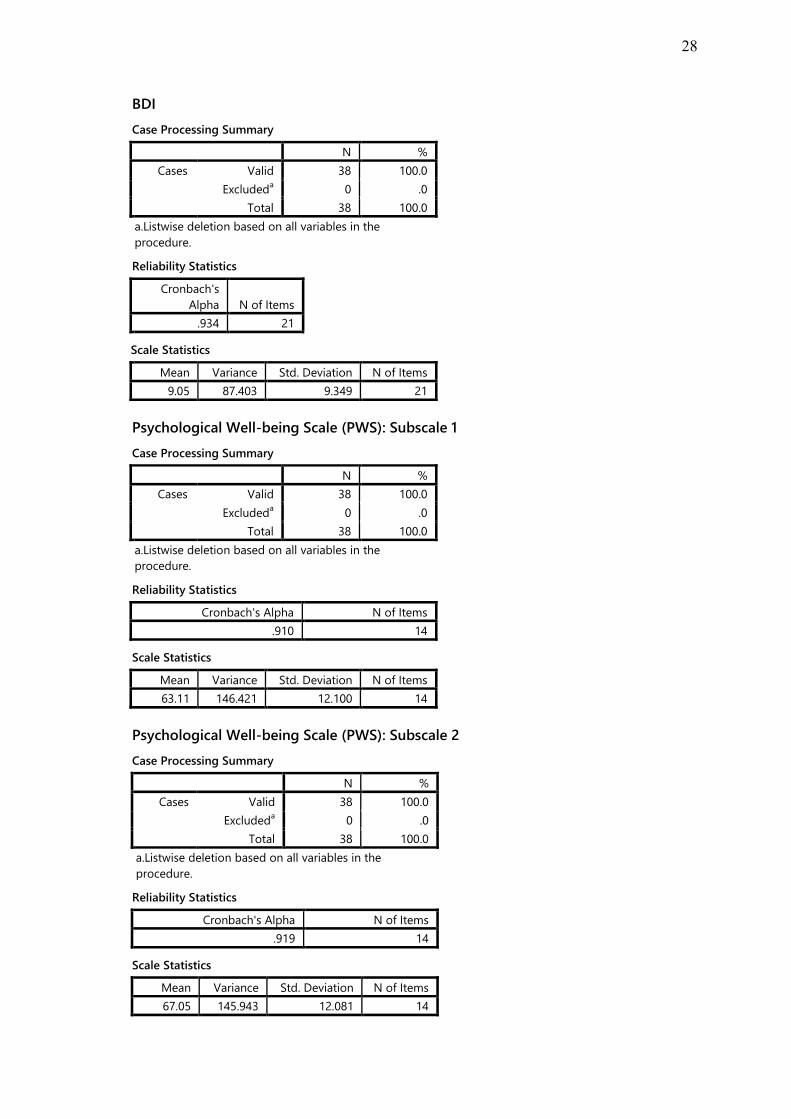
28
BDI
Case Processing Summary
N %
Cases Valid 38 100.0
Excludeda 0 .0
Total 38 100.0
a.Listwise deletion based on all variables in the
procedure.
Reliability Statistics
Cronbach's
Alpha N of Items
.934 21
Scale Statistics
Mean Variance Std. Deviation N of Items
9.05 87.403 9.349 21
Psychological Well-being Scale (PWS): Subscale 1
Case Processing Summary
N %
Cases Valid 38 100.0
Excludeda 0 .0
Total 38 100.0
a.Listwise deletion based on all variables in the
procedure.
Reliability Statistics
Cronbach's Alpha N of Items
.910 14
Scale Statistics
Mean Variance Std. Deviation N of Items
63.11 146.421 12.100 14
Psychological Well-being Scale (PWS): Subscale 2
Case Processing Summary
N %
Cases Valid 38 100.0
Excludeda 0 .0
Total 38 100.0
a.Listwise deletion based on all variables in the
procedure.
Reliability Statistics
Cronbach's Alpha N of Items
.919 14
Scale Statistics
Mean Variance Std. Deviation N of Items
67.05 145.943 12.081 14
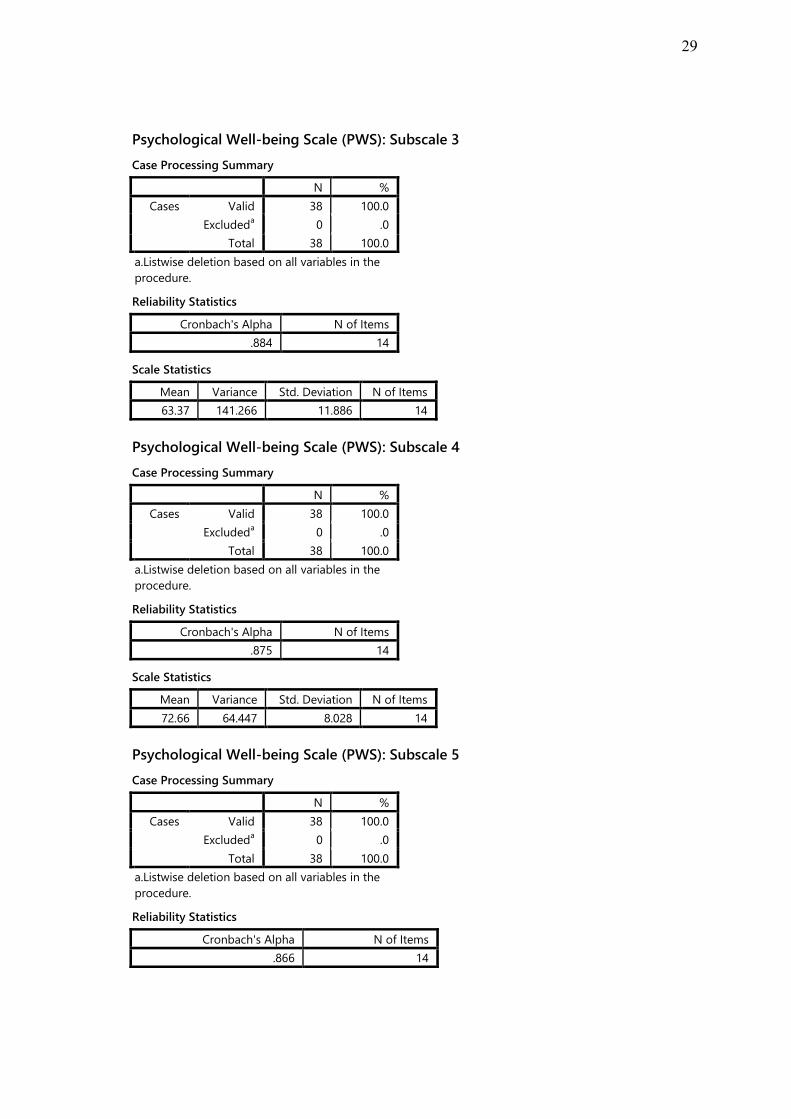
29
Psychological Well-being Scale (PWS): Subscale 3
Case Processing Summary
N %
Cases Valid 38 100.0
Excludeda 0 .0
Total 38 100.0
a.Listwise deletion based on all variables in the
procedure.
Reliability Statistics
Cronbach's Alpha N of Items
.884 14
Scale Statistics
Mean Variance Std. Deviation N of Items
63.37 141.266 11.886 14
Psychological Well-being Scale (PWS): Subscale 4
Case Processing Summary
N %
Cases Valid 38 100.0
Excludeda 0 .0
Total 38 100.0
a.Listwise deletion based on all variables in the
procedure.
Reliability Statistics
Cronbach's Alpha N of Items
.875 14
Scale Statistics
Mean Variance Std. Deviation N of Items
72.66 64.447 8.028 14
Psychological Well-being Scale (PWS): Subscale 5
Case Processing Summary
N %
Cases Valid 38 100.0
Excludeda 0 .0
Total 38 100.0
a.Listwise deletion based on all variables in the
procedure.
Reliability Statistics
Cronbach's Alpha N of Items
.866 14
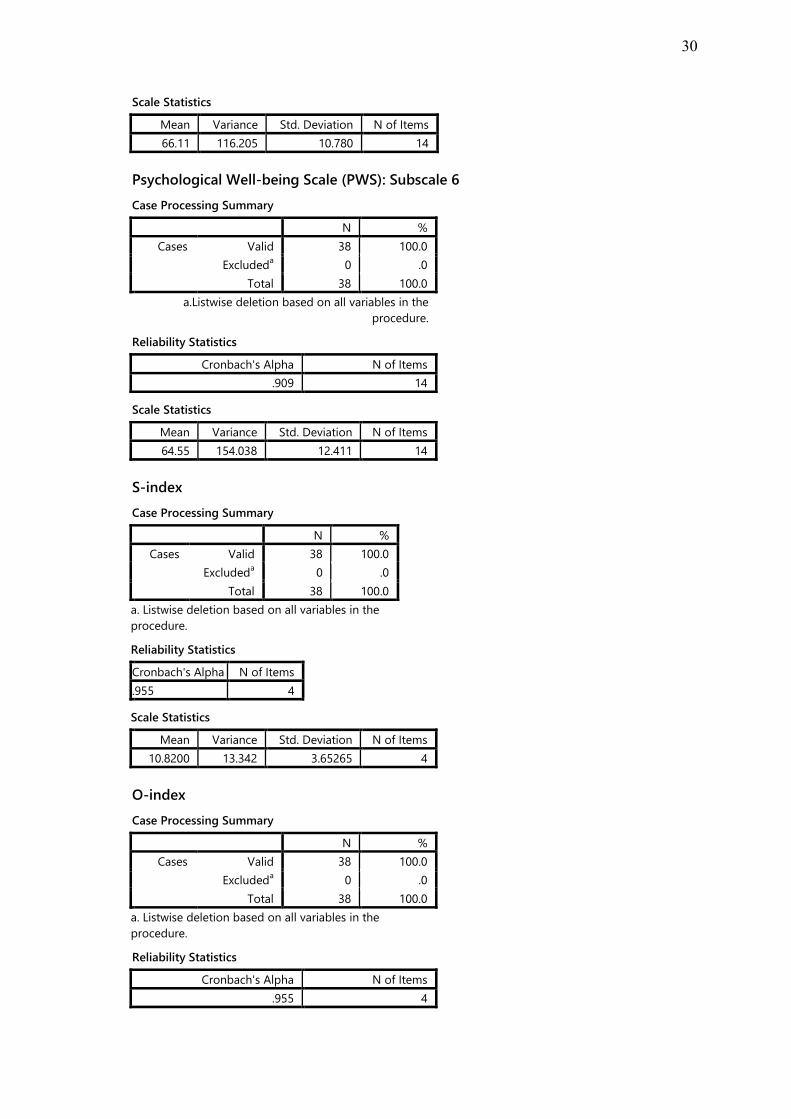
30
Scale Statistics
Mean Variance Std. Deviation N of Items
66.11 116.205 10.780 14
Psychological Well-being Scale (PWS): Subscale 6
Case Processing Summary
N %
Cases Valid 38 100.0
Excludeda 0 .0
Total 38 100.0
a.Listwise deletion based on all variables in the
procedure.
Reliability Statistics
Cronbach's Alpha N of Items
.909 14
Scale Statistics
Mean Variance Std. Deviation N of Items
64.55 154.038 12.411 14
S-index
Case Processing Summary
N %
Cases Valid 38 100.0
Excludeda 0 .0
Total 38 100.0
a. Listwise deletion based on all variables in the
procedure.
Reliability Statistics
Cronbach's Alpha N of Items
.955 4
Scale Statistics
Mean Variance Std. Deviation N of Items
10.8200 13.342 3.65265 4
O-index
Case Processing Summary
N %
Cases Valid 38 100.0
Excludeda 0 .0
Total 38 100.0
a. Listwise deletion based on all variables in the
procedure.
Reliability Statistics
Cronbach's Alpha N of Items
.955 4
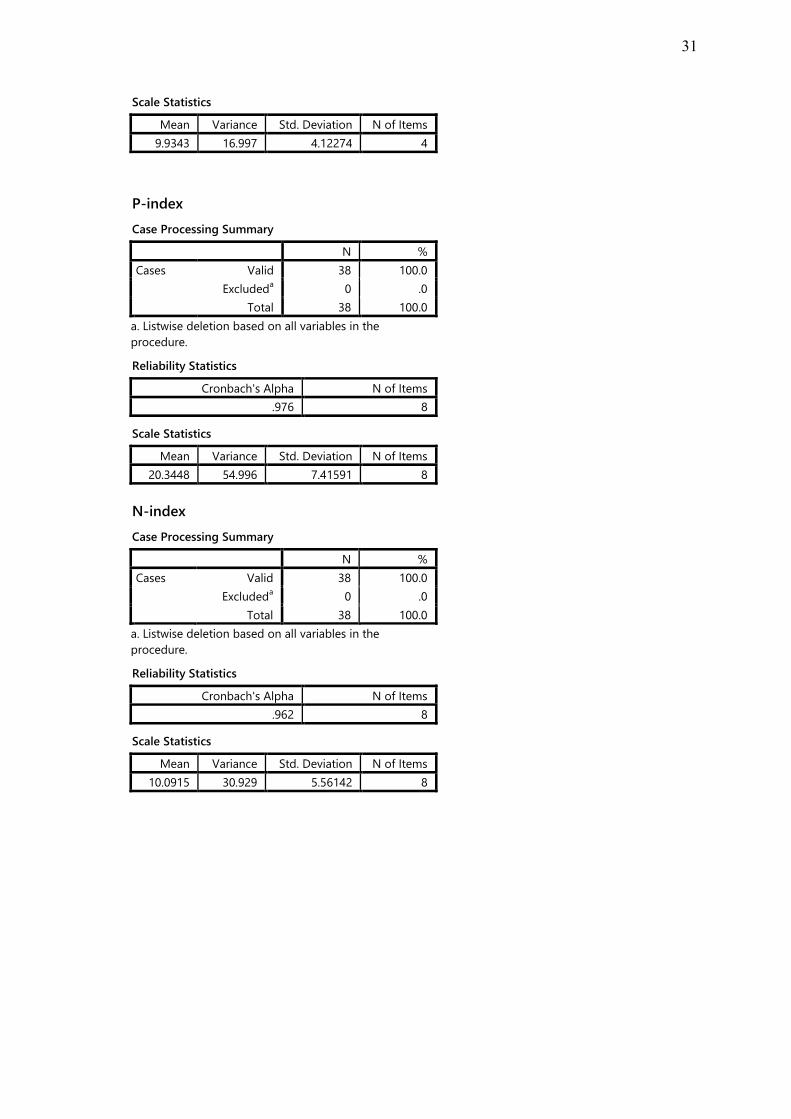
31
Scale Statistics
Mean Variance Std. Deviation N of Items
9.9343 16.997 4.12274 4
P-index
Case Processing Summary
N %
Cases Valid 38 100.0
Excludeda 0 .0
Total 38 100.0
a. Listwise deletion based on all variables in the
procedure.
Reliability Statistics
Cronbach's Alpha N of Items
.976 8
Scale Statistics
Mean Variance Std. Deviation N of Items
20.3448 54.996 7.41591 8
N-index
Case Processing Summary
N %
Cases Valid 38 100.0
Excludeda 0 .0
Total 38 100.0
a. Listwise deletion based on all variables in the
procedure.
Reliability Statistics
Cronbach's Alpha N of Items
.962 8
Scale Statistics
Mean Variance Std. Deviation N of Items
10.0915 30.929 5.56142 8
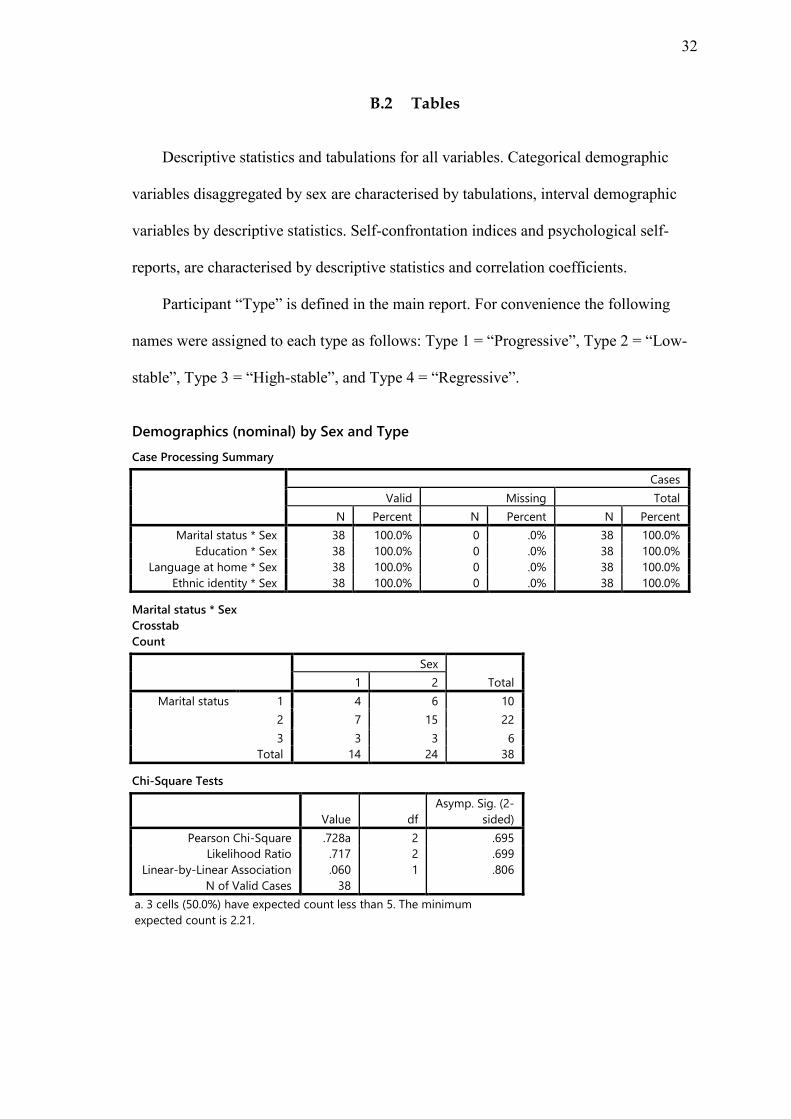
32
B.2 Tables
Descriptive statistics and tabulations for all variables. Categorical demographic
variables disaggregated by sex are characterised by tabulations, interval demographic
variables by descriptive statistics. Self-confrontation indices and psychological self-
reports, are characterised by descriptive statistics and correlation coefficients.
Participant “Type” is defined in the main report. For convenience the following
names were assigned to each type as follows: Type 1 = “Progressive”, Type 2 = “Low-
stable”, Type 3 = “High-stable”, and Type 4 = “Regressive”.
Demographics (nominal) by Sex and Type
Case Processing Summary
Cases
Valid Missing Total
N Percent N Percent N Percent
Marital status * Sex 38 100.0% 0 .0% 38 100.0%
Education * Sex 38 100.0% 0 .0% 38 100.0%
Language at home * Sex 38 100.0% 0 .0% 38 100.0%
Ethnic identity * Sex 38 100.0% 0 .0% 38 100.0%
Marital status * Sex
Crosstab
Count
Sex
Total 1 2
Marital status 1 4 6 10
2 7 15 22
3 3 3 6
Total 14 24 38
Chi-Square Tests
Value df
Asymp. Sig. (2-
sided)
Pearson Chi-Square .728a 2 .695
Likelihood Ratio .717 2 .699
Linear-by-Linear Association .060 1 .806
N of Valid Cases 38
a. 3 cells (50.0%) have expected count less than 5. The minimum
expected count is 2.21.

33
Education * Sex
Crosstab
Count
Sex
Total 1 2
Education 1 0 2 2
2 0 1 1
4 1 3 4
5 5 4 9
6 8 14 22
Total 14 24 38
Chi-Square Tests
Value df
Asymp. Sig. (2-
sided)
Pearson Chi-Square 3.348a 4 .501
Likelihood Ratio 4.311 4 .366
Linear-by-Linear Association 1.245 1 .265
N of Valid Cases 38
a. 7 cells (70.0%) have expected count less than 5. The minimum
expected count is .37.
Language at home * Sex
Crosstab
Count
Sex
Total 1 2
Language at home 1 7 8 15
2 0 6 6
3 7 10 17
Total 14 24 38
Chi-Square Tests
Value df
Asymp. Sig. (2-
sided)
Pearson Chi-Square 4.259a 2 .119
Likelihood Ratio 6.254 2 .044
Linear-by-Linear Association .071 1 .790
N of Valid Cases 38
a. 2 cells (33.3%) have expected count less than 5. The minimum
expected count is 2.21.
Ethnic identity * Sex
Crosstab
Count
Sex
Total 1 2
Ethnic identity 1 1 7 8
2 13 17 30
Total 14 24 38
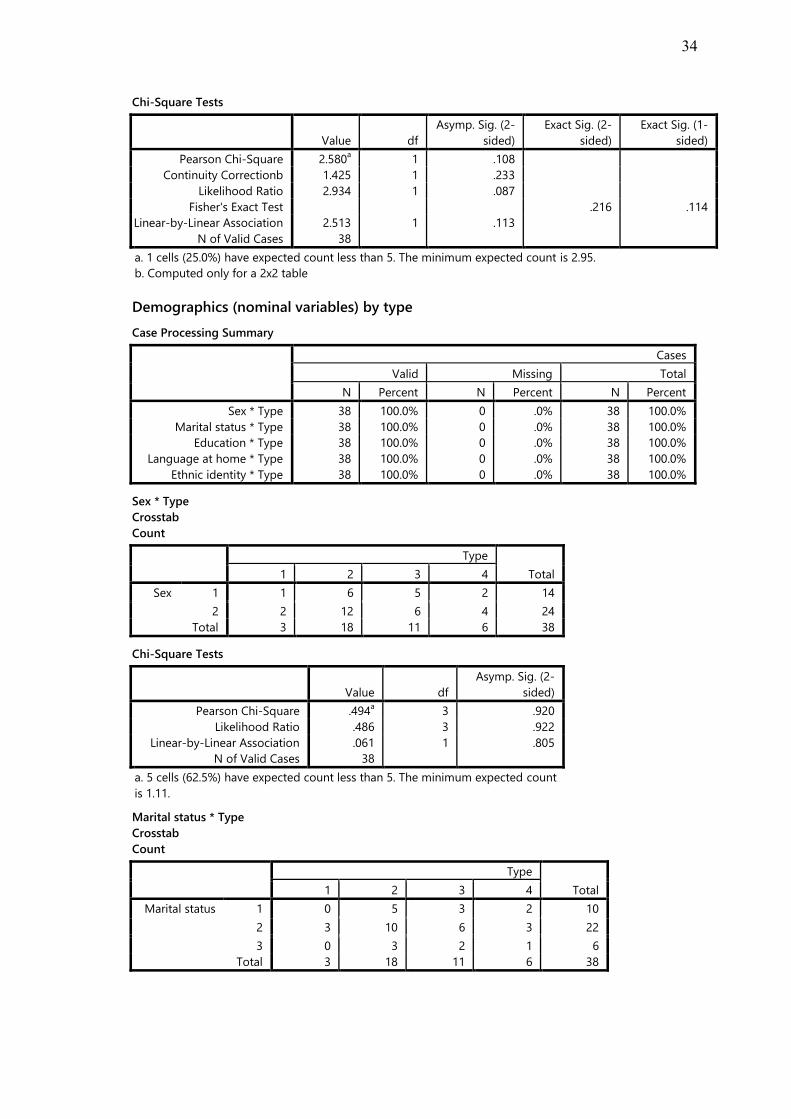
34
Chi-Square Tests
Value df
Asymp. Sig. (2-
sided)
Exact Sig. (2-
sided)
Exact Sig. (1-
sided)
Pearson Chi-Square 2.580a 1 .108
Continuity Correctionb 1.425 1 .233
Likelihood Ratio 2.934 1 .087
Fisher's Exact Test .216 .114
Linear-by-Linear Association 2.513 1 .113
N of Valid Cases 38
a. 1 cells (25.0%) have expected count less than 5. The minimum expected count is 2.95.
b. Computed only for a 2x2 table
Demographics (nominal variables) by type
Case Processing Summary
Cases
Valid Missing Total
N Percent N Percent N Percent
Sex * Type 38 100.0% 0 .0% 38 100.0%
Marital status * Type 38 100.0% 0 .0% 38 100.0%
Education * Type 38 100.0% 0 .0% 38 100.0%
Language at home * Type 38 100.0% 0 .0% 38 100.0%
Ethnic identity * Type 38 100.0% 0 .0% 38 100.0%
Sex * Type
Crosstab
Count
Type
Total 1 2 3 4
Sex 1 1 6 5 2 14
2 2 12 6 4 24
Total 3 18 11 6 38
Chi-Square Tests
Value df
Asymp. Sig. (2-
sided)
Pearson Chi-Square .494a 3 .920
Likelihood Ratio .486 3 .922
Linear-by-Linear Association .061 1 .805
N of Valid Cases 38
a. 5 cells (62.5%) have expected count less than 5. The minimum expected count
is 1.11.
Marital status * Type
Crosstab
Count
Type
Total 1 2 3 4
Marital status 1 0 5 3 2 10
2 3 10 6 3 22
3 0 3 2 1 6
Total 3 18 11 6 38
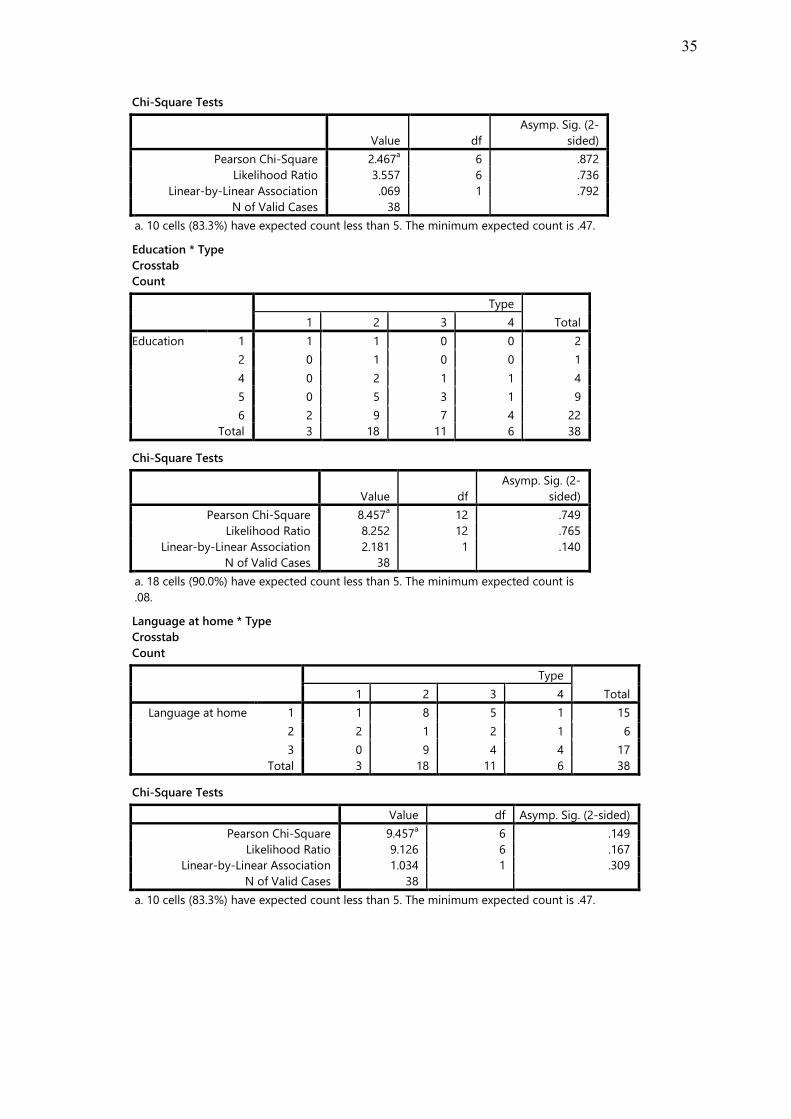
35
Chi-Square Tests
Value df
Asymp. Sig. (2-
sided)
Pearson Chi-Square 2.467a 6 .872
Likelihood Ratio 3.557 6 .736
Linear-by-Linear Association .069 1 .792
N of Valid Cases 38
a. 10 cells (83.3%) have expected count less than 5. The minimum expected count is .47.
Education * Type
Crosstab
Count
Type
Total 1 2 3 4
Education 1 1 1 0 0 2
2 0 1 0 0 1
4 0 2 1 1 4
5 0 5 3 1 9
6 2 9 7 4 22
Total 3 18 11 6 38
Chi-Square Tests
Value df
Asymp. Sig. (2-
sided)
Pearson Chi-Square 8.457a 12 .749
Likelihood Ratio 8.252 12 .765
Linear-by-Linear Association 2.181 1 .140
N of Valid Cases 38
a. 18 cells (90.0%) have expected count less than 5. The minimum expected count is
.08.
Language at home * Type
Crosstab
Count
Type
Total 1 2 3 4
Language at home 1 1 8 5 1 15
2 2 1 2 1 6
3 0 9 4 4 17
Total 3 18 11 6 38
Chi-Square Tests
Value df Asymp. Sig. (2-sided)
Pearson Chi-Square 9.457a 6 .149
Likelihood Ratio 9.126 6 .167
Linear-by-Linear Association 1.034 1 .309
N of Valid Cases 38
a. 10 cells (83.3%) have expected count less than 5. The minimum expected count is .47.
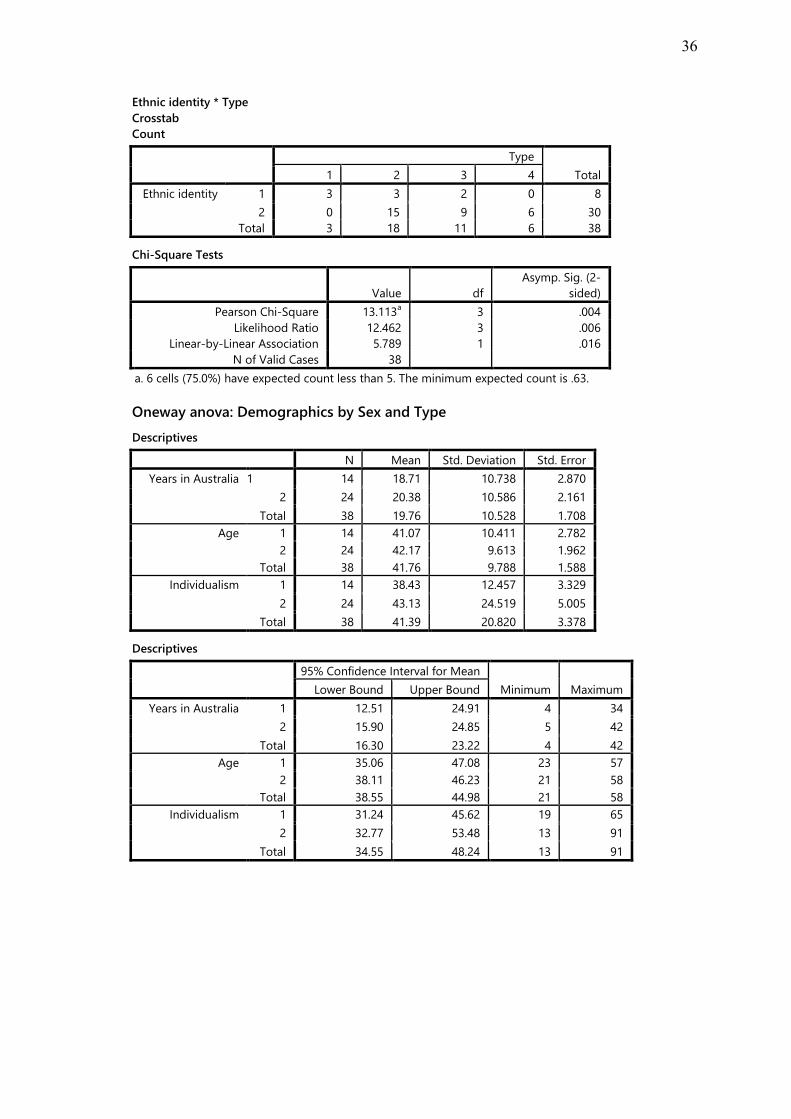
36
Ethnic identity * Type
Crosstab
Count
Type
Total 1 2 3 4
Ethnic identity 1 3 3 2 0 8
2 0 15 9 6 30
Total 3 18 11 6 38
Chi-Square Tests
Value df
Asymp. Sig. (2-
sided)
Pearson Chi-Square 13.113a 3 .004
Likelihood Ratio 12.462 3 .006
Linear-by-Linear Association 5.789 1 .016
N of Valid Cases 38
a. 6 cells (75.0%) have expected count less than 5. The minimum expected count is .63.
Oneway anova: Demographics by Sex and Type
Descriptives
N Mean Std. Deviation Std. Error
Years in Australia 1 14 18.71 10.738 2.870
2 24 20.38 10.586 2.161
Total 38 19.76 10.528 1.708
Age 1 14 41.07 10.411 2.782
2 24 42.17 9.613 1.962
Total 38 41.76 9.788 1.588
Individualism 1 14 38.43 12.457 3.329
2 24 43.13 24.519 5.005
Total 38 41.39 20.820 3.378
Descriptives
95% Confidence Interval for Mean
Minimum Maximum Lower Bound Upper Bound
Years in Australia 1 12.51 24.91 4 34
2 15.90 24.85 5 42
Total 16.30 23.22 4 42
Age 1 35.06 47.08 23 57
2 38.11 46.23 21 58
Total 38.55 44.98 21 58
Individualism 1 31.24 45.62 19 65
2 32.77 53.48 13 91
Total 34.55 48.24 13 91
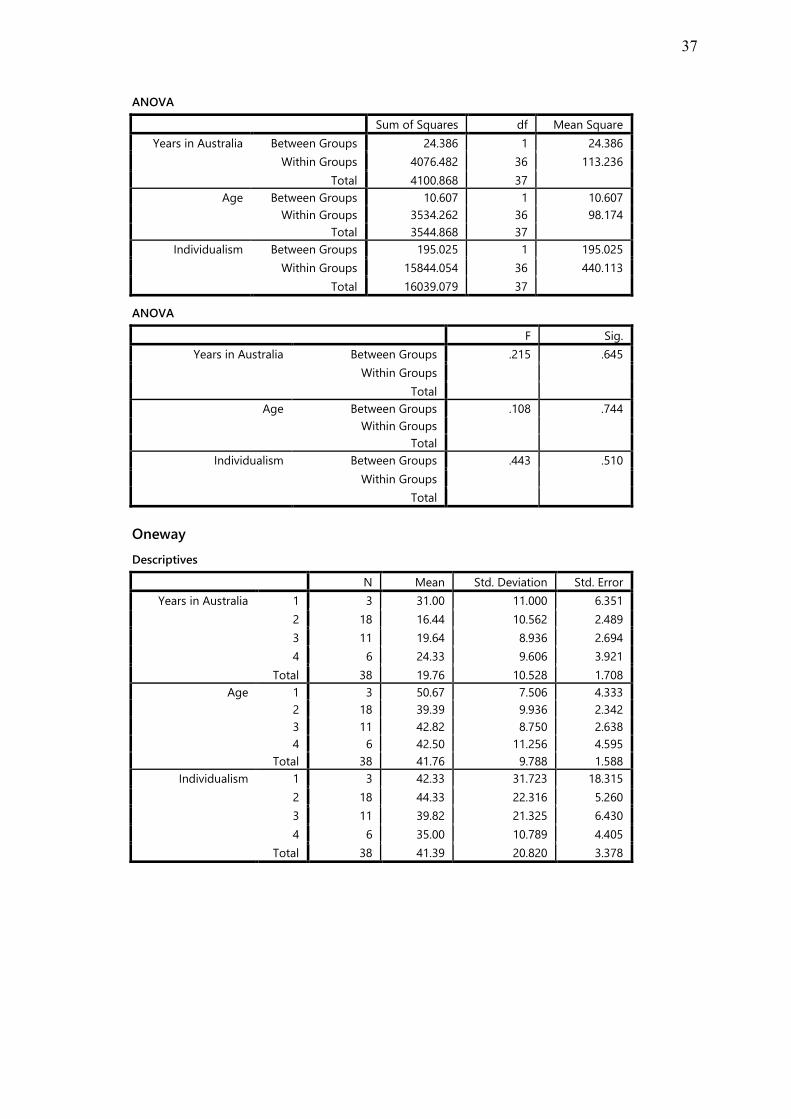
37
ANOVA
Sum of Squares df Mean Square
Years in Australia Between Groups 24.386 1 24.386
Within Groups 4076.482 36 113.236
Total 4100.868 37
Age Between Groups 10.607 1 10.607
Within Groups 3534.262 36 98.174
Total 3544.868 37
Individualism Between Groups 195.025 1 195.025
Within Groups 15844.054 36 440.113
Total 16039.079 37
ANOVA
F Sig.
Years in Australia Between Groups .215 .645
Within Groups
Total
Age Between Groups .108 .744
Within Groups
Total
Individualism Between Groups .443 .510
Within Groups
Total
Oneway
Descriptives
N Mean Std. Deviation Std. Error
Years in Australia 1 3 31.00 11.000 6.351
2 18 16.44 10.562 2.489
3 11 19.64 8.936 2.694
4 6 24.33 9.606 3.921
Total 38 19.76 10.528 1.708
Age 1 3 50.67 7.506 4.333
2 18 39.39 9.936 2.342
3 11 42.82 8.750 2.638
4 6 42.50 11.256 4.595
Total 38 41.76 9.788 1.588
Individualism 1 3 42.33 31.723 18.315
2 18 44.33 22.316 5.260
3 11 39.82 21.325 6.430
4 6 35.00 10.789 4.405
Total 38 41.39 20.820 3.378

38
Descriptives
95% Confidence Interval for Mean
Minimum Maximum Lower Bound Upper Bound
Years in Australia 1 3.67 58.33 20 42
2 11.19 21.70 4 42
3 13.63 25.64 5 34
4 14.25 34.41 6 32
Total 16.30 23.22 4 42
Age 1 32.02 69.31 43 58
2 34.45 44.33 21 57
3 36.94 48.70 28 58
4 30.69 54.31 24 57
Total 38.55 44.98 21 58
Individualism 1 -36.47 121.14 13 76
2 33.24 55.43 19 89
3 25.49 54.14 19 91
4 23.68 46.32 20 51
Total 34.55 48.24 13 91
ANOVA
Sum of Squares df Mean Square
Years in Australia Between Groups 702.545 3 234.182
Within Groups 3398.323 34 99.951
Total 4100.868 37
Age Between Groups 354.788 3 118.263
Within Groups 3190.081 34 93.826
Total 3544.868 37
Individualism Between Groups 430.776 3 143.592
Within Groups 15608.303 34 459.068
Total 16039.079 37
ANOVA
F Sig.
Years in Australia Between Groups 2.343 .090
Within Groups
Total
Age Between Groups 1.260 .303
Within Groups
Total
Individualism Between Groups .313 .816
Within Groups
Total

39
T-test: Demographics (scale variables) by Sex
T-Test
Group Statistics
Sex N Mean Std. Deviation Std. Error Mean
Age 1 14 41.07 10.411 2.782
2 24 42.17 9.613 1.962
Years in Australia 1 14 18.71 10.738 2.870
2 24 20.38 10.586 2.161
Individualism 1 14 38.43 12.457 3.329
2 24 43.13 24.519 5.005
Independent Samples Test
Levene's Test for Equality of Variances
F Sig.
Age Equal variances assumed .072 .790
Equal variances not assumed
Years in Australia Equal variances assumed .185 .670
Equal variances not assumed
Individualism Equal variances assumed 7.358 .010
Equal variances not assumed
Independent Samples Test
t-test for Equality of Means
t df Sig. (2-tailed)
Mean
Difference
Age Equal variances assumed -.329 36 .744 -1.095
Equal variances not assumed -.322 25.572 .750 -1.095
Years in Australia Equal variances assumed -.464 36 .645 -1.661
Equal variances not assumed -.462 27.013 .648 -1.661
Individualism Equal variances assumed -.666 36 .510 -4.696
Equal variances not assumed -.781 35.545 .440 -4.696
Independent Samples Test
t-test for Equality of Means
95% Confidence Interval of the
Difference
Std. Error
Difference Lower Upper
Age Equal variances assumed 3.332 -7.853 5.663
Equal variances not assumed 3.405 -8.099 5.909
Years in Australia Equal variances assumed 3.579 -8.918 5.597
Equal variances not assumed 3.592 -9.031 5.710
Individualism Equal variances assumed 7.055 -19.005 9.612
Equal variances not assumed 6.011 -16.893 7.500

40
B.3 Cluster Analysis
Hierarchical cluster analysis using Ward’s method on standardised (z-score)
indices for the country of origin I-position; saves membership of the highest two
clusters as variable clu2_1.
Cluster analysis as above for Australia; saves membership of the highest two
clusters as variable clu2_2.
Calculates and saves standardised (z-score) means for use in K-means clustering.
K-means cluster analysis on standardised (z-score) indices for the country of origin
I-position (where clusters are seeded with z-score means); saves membership of the
highest two clusters as variable qcl_1; cross-tabulates hierarchical cluster
membership with K-means cluster membership.
Cluster analysis as above for Australia, and saves membership of the highest two
clusters as variable qcl_2; repeats cross-tabulation as above.
Creates the variable id_type from clu2_1 and clu2_2 as follows:
clu2_2 = 1 clu2_2 = 2
clu2_1 = 1 id_type = 1 id_type = 2
clu2_1 = 2 id_type = 3 id_type = 4
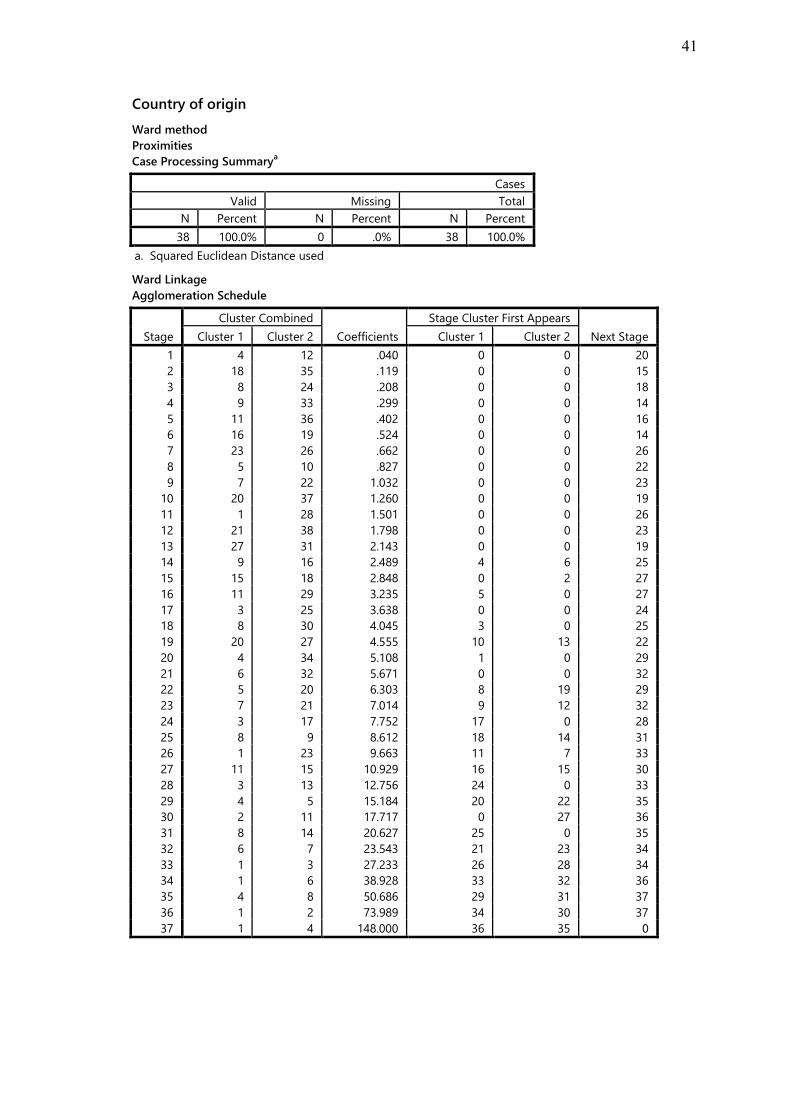
41
Country of origin
Ward method
Proximities
Case Processing Summarya
Cases
Valid Missing Total
N Percent N Percent N Percent
38 100.0% 0 .0% 38 100.0%
a. Squared Euclidean Distance used
Ward Linkage
Agglomeration Schedule
Stage
Cluster Combined
Coefficients
Stage Cluster First Appears
Next Stage Cluster 1 Cluster 2 Cluster 1 Cluster 2
1 4 12 .040 0 0 20
2 18 35 .119 0 0 15
3 8 24 .208 0 0 18
4 9 33 .299 0 0 14
5 11 36 .402 0 0 16
6 16 19 .524 0 0 14
7 23 26 .662 0 0 26
8 5 10 .827 0 0 22
9 7 22 1.032 0 0 23
10 20 37 1.260 0 0 19
11 1 28 1.501 0 0 26
12 21 38 1.798 0 0 23
13 27 31 2.143 0 0 19
14 9 16 2.489 4 6 25
15 15 18 2.848 0 2 27
16 11 29 3.235 5 0 27
17 3 25 3.638 0 0 24
18 8 30 4.045 3 0 25
19 20 27 4.555 10 13 22
20 4 34 5.108 1 0 29
21 6 32 5.671 0 0 32
22 5 20 6.303 8 19 29
23 7 21 7.014 9 12 32
24 3 17 7.752 17 0 28
25 8 9 8.612 18 14 31
26 1 23 9.663 11 7 33
27 11 15 10.929 16 15 30
28 3 13 12.756 24 0 33
29 4 5 15.184 20 22 35
30 2 11 17.717 0 27 36
31 8 14 20.627 25 0 35
32 6 7 23.543 21 23 34
33 1 3 27.233 26 28 34
34 1 6 38.928 33 32 36
35 4 8 50.686 29 31 37
36 1 2 73.989 34 30 37
37 1 4 148.000 36 35 0

42
Means
Case Processing Summary
Cases
Included Excluded Total
N Percent N Percent N Percent
S origin * Ward in Origin 38 100.0% 0 .0% 38 100.0%
O origin * Ward in Origin 38 100.0% 0 .0% 38 100.0%
P origin * Ward in Origin 38 100.0% 0 .0% 38 100.0%
N origin * Ward in Origin 38 100.0% 0 .0% 38 100.0%
Report
Ward in Origin S origin O origin P origin N origin
1 Mean 7.1540 6.6386 13.2868 10.8255
Std. Deviation 2.54982 3.21958 4.93917 6.79496
N 21 21 21 21
2 Mean 13.5497 13.1280 26.3121 9.0574
Std. Deviation 1.78377 1.92550 3.43412 5.26844
N 17 17 17 17
Total Mean 10.0153 9.5418 19.1139 10.0345
Std. Deviation 3.90851 4.23074 7.83357 6.14444
N 38 38 38 38
Means
Case Processing Summary
Cases
Included Excluded Total
N Percent N Percent N Percent
Zscore: S origin * Ward in Origin 38 100.0% 0 .0% 38 100.0%
Zscore: O origin * Ward in Origin 38 100.0% 0 .0% 38 100.0%
Zscore: P origin * Ward in Origin 38 100.0% 0 .0% 38 100.0%
Zscore: N origin * Ward in Origin 38 100.0% 0 .0% 38 100.0%
Report
Mean
Ward in Origin Zscore: S origin Zscore: O origin Zscore: P origin Zscore: N origin
1 -.7320484 -.6862045 -.7438639 .1287364
2 .9042951 .8476644 .9188907 -.1590274
Total .0000000 .0000000 .0000000 .0000000
Quick Cluster
Initial Cluster Centers
Cluster
1 2
Zscore: S origin -0.732048 0.904295
Zscore: O origin -0.686205 0.847664
Zscore: P origin -0.743864 0.918891
Zscore: N origin 0.128736 -0.159027
Input from INITIAL Subcommand
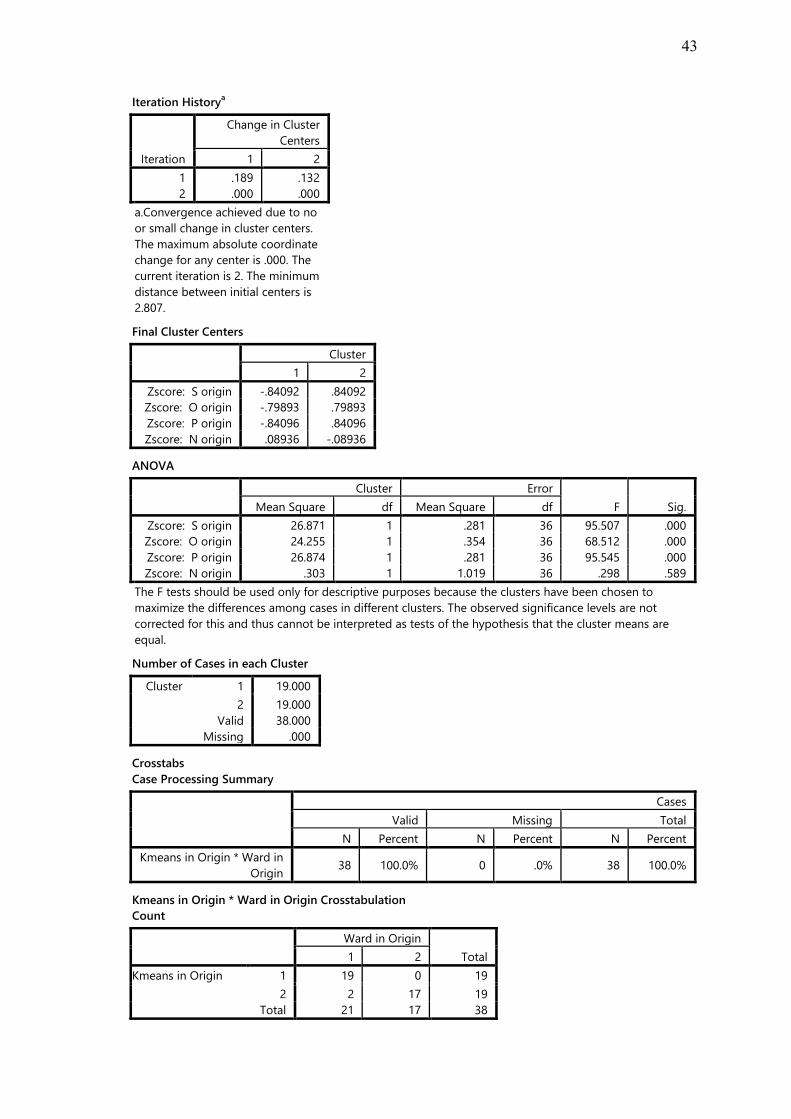
43
Iteration Historya
Iteration
Change in Cluster
Centers
1 2
1 .189 .132
2 .000 .000
a.Convergence achieved due to no
or small change in cluster centers.
The maximum absolute coordinate
change for any center is .000. The
current iteration is 2. The minimum
distance between initial centers is
2.807.
Final Cluster Centers
Cluster
1 2
Zscore: S origin -.84092 .84092
Zscore: O origin -.79893 .79893
Zscore: P origin -.84096 .84096
Zscore: N origin .08936 -.08936
ANOVA
Cluster Error
F Sig. Mean Square df Mean Square df
Zscore: S origin 26.871 1 .281 36 95.507 .000
Zscore: O origin 24.255 1 .354 36 68.512 .000
Zscore: P origin 26.874 1 .281 36 95.545 .000
Zscore: N origin .303 1 1.019 36 .298 .589
The F tests should be used only for descriptive purposes because the clusters have been chosen to
maximize the differences among cases in different clusters. The observed significance levels are not
corrected for this and thus cannot be interpreted as tests of the hypothesis that the cluster means are
equal.
Number of Cases in each Cluster
Cluster 1 19.000
2 19.000
Valid 38.000
Missing .000
Crosstabs
Case Processing Summary
Cases
Valid Missing Total
N Percent N Percent N Percent
Kmeans in Origin * Ward in
Origin 38 100.0% 0 .0% 38 100.0%
Kmeans in Origin * Ward in Origin Crosstabulation
Count
Ward in Origin
Total 1 2
Kmeans in Origin 1 19 0 19
2 2 17 19
Total 21 17 38
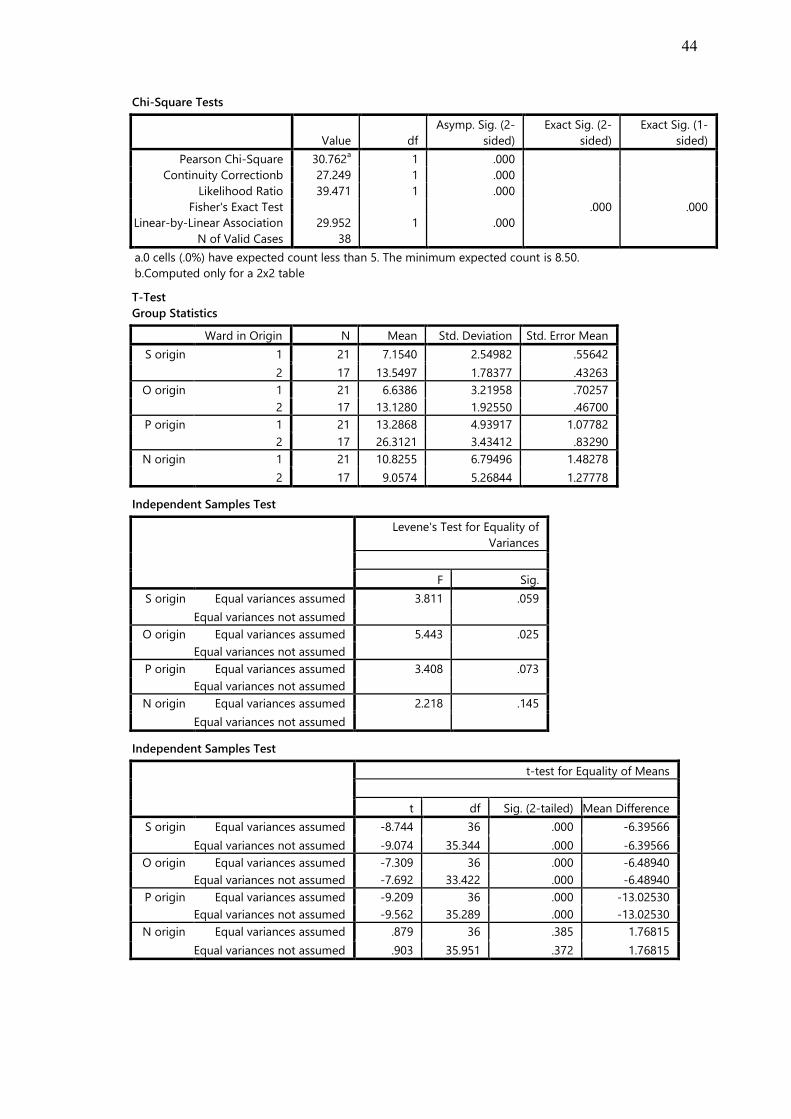
44
Chi-Square Tests
Value df
Asymp. Sig. (2-
sided)
Exact Sig. (2-
sided)
Exact Sig. (1-
sided)
Pearson Chi-Square 30.762a 1 .000
Continuity Correctionb 27.249 1 .000
Likelihood Ratio 39.471 1 .000
Fisher's Exact Test .000 .000
Linear-by-Linear Association 29.952 1 .000
N of Valid Cases 38
a.0 cells (.0%) have expected count less than 5. The minimum expected count is 8.50.
b.Computed only for a 2x2 table
T-Test
Group Statistics
Ward in Origin N Mean Std. Deviation Std. Error Mean
S origin 1 21 7.1540 2.54982 .55642
2 17 13.5497 1.78377 .43263
O origin 1 21 6.6386 3.21958 .70257
2 17 13.1280 1.92550 .46700
P origin 1 21 13.2868 4.93917 1.07782
2 17 26.3121 3.43412 .83290
N origin 1 21 10.8255 6.79496 1.48278
2 17 9.0574 5.26844 1.27778
Independent Samples Test
Levene's Test for Equality of
Variances
F Sig.
S origin Equal variances assumed 3.811 .059
Equal variances not assumed
O origin Equal variances assumed 5.443 .025
Equal variances not assumed
P origin Equal variances assumed 3.408 .073
Equal variances not assumed
N origin Equal variances assumed 2.218 .145
Equal variances not assumed
Independent Samples Test
t-test for Equality of Means
t df Sig. (2-tailed) Mean Difference
S origin Equal variances assumed -8.744 36 .000 -6.39566
Equal variances not assumed -9.074 35.344 .000 -6.39566
O origin Equal variances assumed -7.309 36 .000 -6.48940
Equal variances not assumed -7.692 33.422 .000 -6.48940
P origin Equal variances assumed -9.209 36 .000 -13.02530
Equal variances not assumed -9.562 35.289 .000 -13.02530
N origin Equal variances assumed .879 36 .385 1.76815
Equal variances not assumed .903 35.951 .372 1.76815
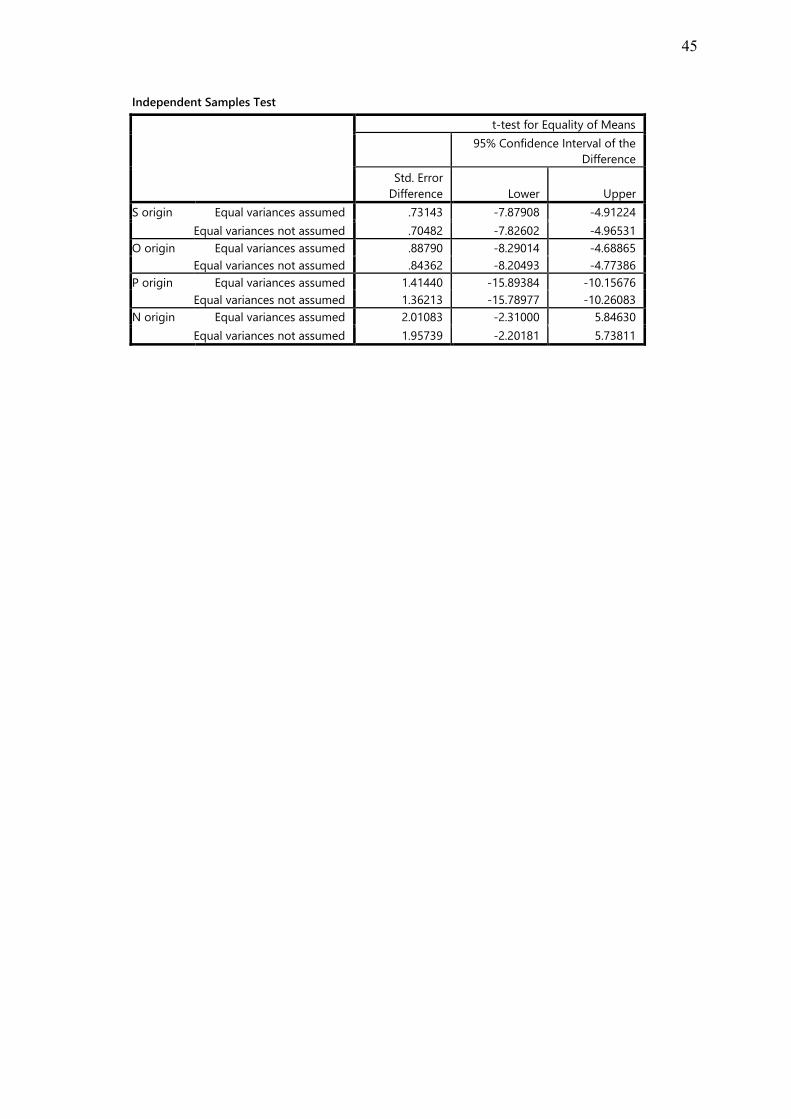
45
Independent Samples Test
t-test for Equality of Means
95% Confidence Interval of the
Difference
Std. Error
Difference Lower Upper
S origin Equal variances assumed .73143 -7.87908 -4.91224
Equal variances not assumed .70482 -7.82602 -4.96531
O origin Equal variances assumed .88790 -8.29014 -4.68865
Equal variances not assumed .84362 -8.20493 -4.77386
P origin Equal variances assumed 1.41440 -15.89384 -10.15676
Equal variances not assumed 1.36213 -15.78977 -10.26083
N origin Equal variances assumed 2.01083 -2.31000 5.84630
Equal variances not assumed 1.95739 -2.20181 5.73811

46
Australia
Proximities
Case Processing Summarya
Cases
Valid Missing Total
N Percent N Percent N Percent
38 100.0% 0 .0% 38 100.0%
a. Squared Euclidean Distance used
Cluster
Ward Linkage
Agglomeration Schedule
Stage
Cluster Combined
Coefficients
Stage Cluster First Appears
Next Stage Cluster 1 Cluster 2 Cluster 1 Cluster 2
1 14 33 .028 0 0 11
2 1 24 .060 0 0 25
3 22 29 .143 0 0 9
4 9 38 .279 0 0 21
5 11 36 .418 0 0 19
6 26 28 .562 0 0 15
7 13 17 .712 0 0 18
8 8 12 .895 0 0 17
9 4 22 1.080 0 3 20
10 6 20 1.284 0 0 16
11 5 14 1.515 0 1 25
12 7 37 1.749 0 0 29
13 31 32 1.999 0 0 22
14 10 27 2.290 0 0 24
15 19 26 2.612 0 6 27
16 6 16 2.941 10 0 21
17 3 8 3.285 0 8 31
18 13 18 3.648 7 0 27
19 11 35 4.113 5 0 26
20 4 23 4.633 9 0 29
21 6 9 5.174 16 4 32
22 30 31 5.769 0 13 24
23 2 21 6.408 0 0 35
24 10 30 7.176 14 22 28
25 1 5 7.968 2 11 31
26 11 25 9.157 19 0 30
27 13 19 10.810 18 15 34
28 10 34 12.805 24 0 33
29 4 7 15.007 20 12 32
30 11 15 17.411 26 0 34
31 1 3 19.911 25 17 33
32 4 6 24.271 29 21 35
33 1 10 31.450 31 28 37
34 11 13 38.781 30 27 36
35 2 4 49.251 23 32 36
36 2 11 68.678 35 34 37
37 1 2 148.000 33 36 0

47
Means
Case Processing Summary
Cases
Included Excluded Total
N Percent N Percent N Percent
S Australia * Ward in
Australia 38 100.0% 0 .0% 38 100.0%
O Australia * Ward in
Australia 38 100.0% 0 .0% 38 100.0%
P Australia * Ward in
Australia 38 100.0% 0 .0% 38 100.0%
N Australia * Ward in
Australia 38 100.0% 0 .0% 38 100.0%
Report
Ward in Australia S Australia O Australia P Australia N Australia
1 Mean 15.5908 14.5132 29.9133 7.2324
Std. Deviation 1.78843 2.24427 3.08485 4.77435
N 14 14 14 14
2 Mean 9.0305 7.4794 16.0628 12.3227
Std. Deviation 2.37237 3.30684 4.78490 6.56004
N 24 24 24 24
Total Mean 11.4474 10.0708 21.1656 10.4473
Std. Deviation 3.86103 4.51559 7.96366 6.39937
N 38 38 38 38
Means
Case Processing Summary
Cases
Included Excluded Total
N Percent N Percent N Percent
Zscore: S Australia * Ward
in Australia 38 100.0% 0 .0% 38 100.0%
Zscore: O Australia * Ward
in Australia 38 100.0% 0 .0% 38 100.0%
Zscore: P Australia * Ward
in Australia 38 100.0% 0 .0% 38 100.0%
Zscore: N Australia * Ward
in Australia 38 100.0% 0 .0% 38 100.0%
Report
Mean
Ward in Australia
Zscore: S
Australia
Zscore: O
Australia
Zscore: P
Australia
Zscore: N
Australia
1 1.0731323 .9837986 1.0984490 -.5023820
2 -.6259939 -.5738825 -.6407619 .2930562
Total .0000000 .0000000 .0000000 .0000000
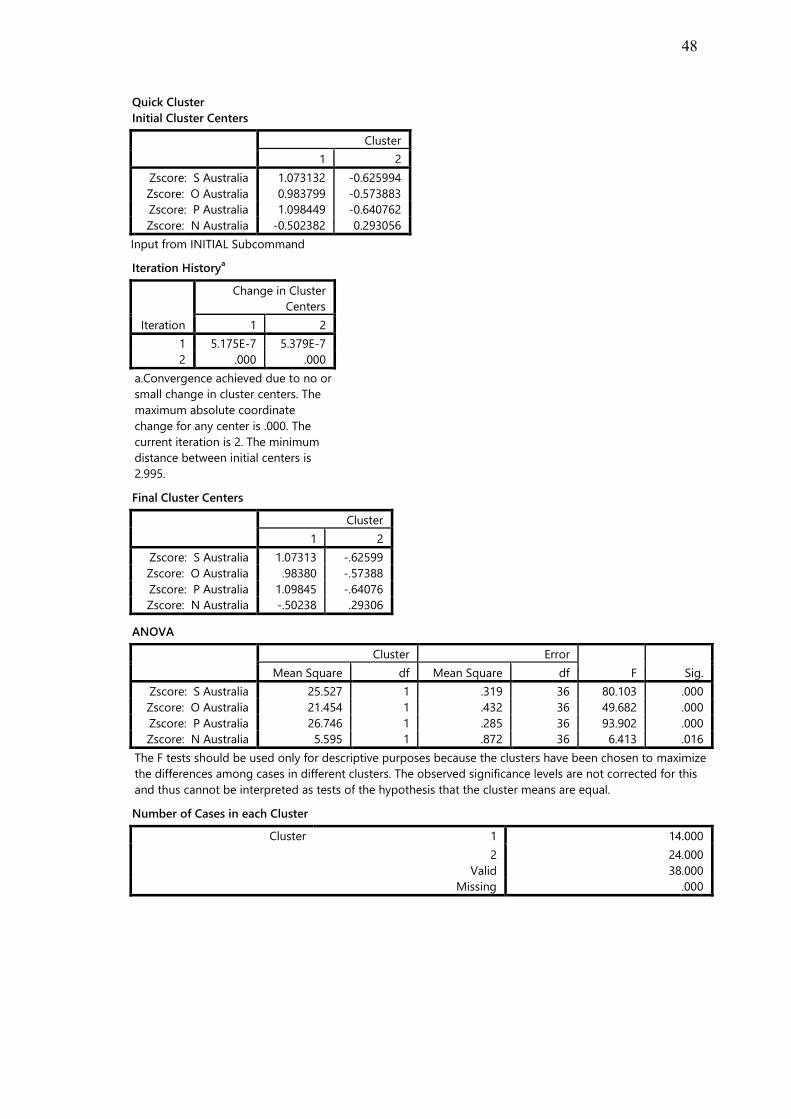
48
Quick Cluster
Initial Cluster Centers
Cluster
1 2
Zscore: S Australia 1.073132 -0.625994
Zscore: O Australia 0.983799 -0.573883
Zscore: P Australia 1.098449 -0.640762
Zscore: N Australia -0.502382 0.293056
Input from INITIAL Subcommand
Iteration Historya
Iteration
Change in Cluster
Centers
1 2
1 5.175E-7 5.379E-7
2 .000 .000
a.Convergence achieved due to no or
small change in cluster centers. The
maximum absolute coordinate
change for any center is .000. The
current iteration is 2. The minimum
distance between initial centers is
2.995.
Final Cluster Centers
Cluster
1 2
Zscore: S Australia 1.07313 -.62599
Zscore: O Australia .98380 -.57388
Zscore: P Australia 1.09845 -.64076
Zscore: N Australia -.50238 .29306
ANOVA
Cluster Error
F Sig. Mean Square df Mean Square df
Zscore: S Australia 25.527 1 .319 36 80.103 .000
Zscore: O Australia 21.454 1 .432 36 49.682 .000
Zscore: P Australia 26.746 1 .285 36 93.902 .000
Zscore: N Australia 5.595 1 .872 36 6.413 .016
The F tests should be used only for descriptive purposes because the clusters have been chosen to maximize
the differences among cases in different clusters. The observed significance levels are not corrected for this
and thus cannot be interpreted as tests of the hypothesis that the cluster means are equal.
Number of Cases in each Cluster
Cluster 1 14.000
2 24.000
Valid 38.000
Missing .000
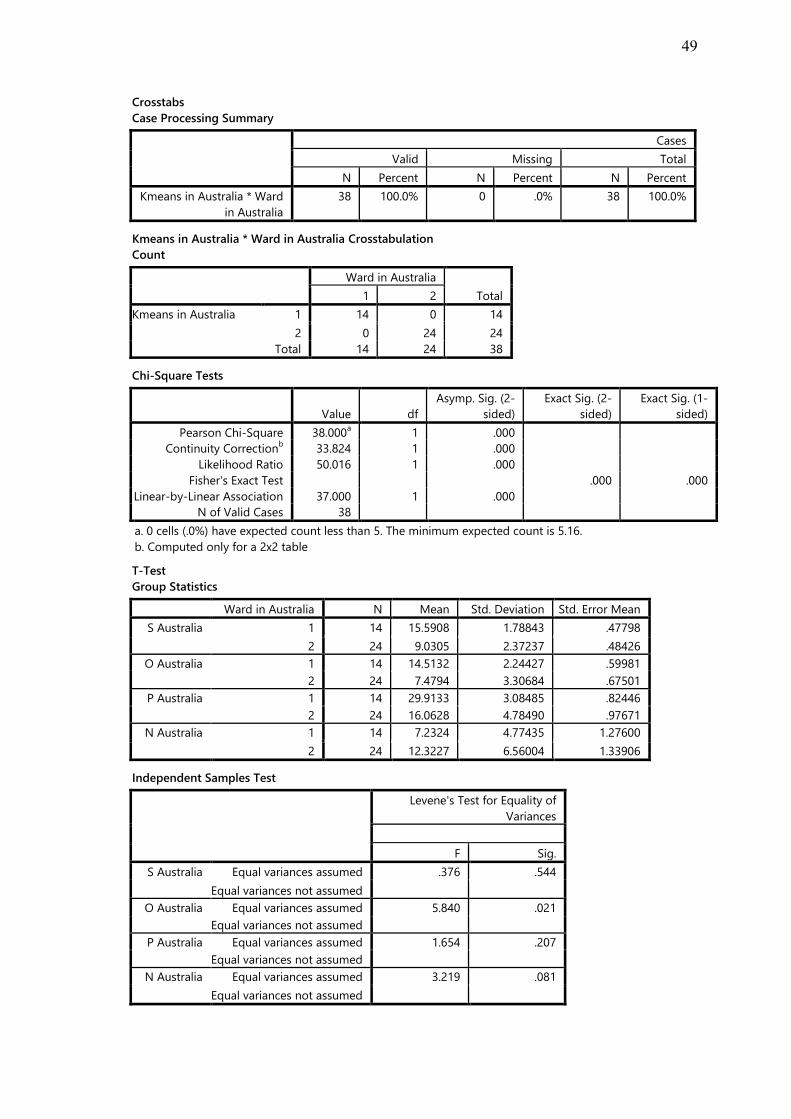
49
Crosstabs
Case Processing Summary
Cases
Valid Missing Total
N Percent N Percent N Percent
Kmeans in Australia * Ward
in Australia
38 100.0% 0 .0% 38 100.0%
Kmeans in Australia * Ward in Australia Crosstabulation
Count
Ward in Australia
Total 1 2
Kmeans in Australia 1 14 0 14
2 0 24 24
Total 14 24 38
Chi-Square Tests
Value df
Asymp. Sig. (2-
sided)
Exact Sig. (2-
sided)
Exact Sig. (1-
sided)
Pearson Chi-Square 38.000a 1 .000
Continuity Correctionb 33.824 1 .000
Likelihood Ratio 50.016 1 .000
Fisher's Exact Test .000 .000
Linear-by-Linear Association 37.000 1 .000
N of Valid Cases 38
a. 0 cells (.0%) have expected count less than 5. The minimum expected count is 5.16.
b. Computed only for a 2x2 table
T-Test
Group Statistics
Ward in Australia N Mean Std. Deviation Std. Error Mean
S Australia 1 14 15.5908 1.78843 .47798
2 24 9.0305 2.37237 .48426
O Australia 1 14 14.5132 2.24427 .59981
2 24 7.4794 3.30684 .67501
P Australia 1 14 29.9133 3.08485 .82446
2 24 16.0628 4.78490 .97671
N Australia 1 14 7.2324 4.77435 1.27600
2 24 12.3227 6.56004 1.33906
Independent Samples Test
Levene's Test for Equality of
Variances
F Sig.
S Australia Equal variances assumed .376 .544
Equal variances not assumed
O Australia Equal variances assumed 5.840 .021
Equal variances not assumed
P Australia Equal variances assumed 1.654 .207
Equal variances not assumed
N Australia Equal variances assumed 3.219 .081
Equal variances not assumed
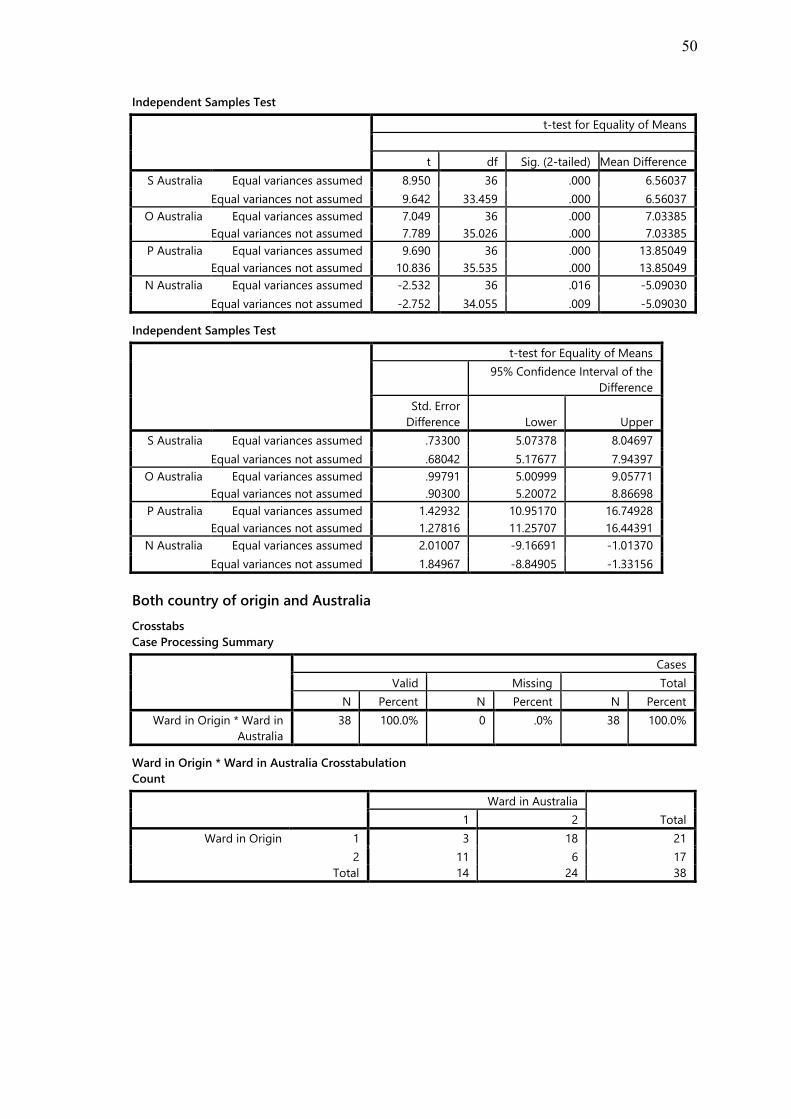
50
Independent Samples Test
t-test for Equality of Means
t df Sig. (2-tailed) Mean Difference
S Australia Equal variances assumed 8.950 36 .000 6.56037
Equal variances not assumed 9.642 33.459 .000 6.56037
O Australia Equal variances assumed 7.049 36 .000 7.03385
Equal variances not assumed 7.789 35.026 .000 7.03385
P Australia Equal variances assumed 9.690 36 .000 13.85049
Equal variances not assumed 10.836 35.535 .000 13.85049
N Australia Equal variances assumed -2.532 36 .016 -5.09030
Equal variances not assumed -2.752 34.055 .009 -5.09030
Independent Samples Test
t-test for Equality of Means
95% Confidence Interval of the
Difference
Std. Error
Difference Lower Upper
S Australia Equal variances assumed .73300 5.07378 8.04697
Equal variances not assumed .68042 5.17677 7.94397
O Australia Equal variances assumed .99791 5.00999 9.05771
Equal variances not assumed .90300 5.20072 8.86698
P Australia Equal variances assumed 1.42932 10.95170 16.74928
Equal variances not assumed 1.27816 11.25707 16.44391
N Australia Equal variances assumed 2.01007 -9.16691 -1.01370
Equal variances not assumed 1.84967 -8.84905 -1.33156
Both country of origin and Australia
Crosstabs
Case Processing Summary
Cases
Valid Missing Total
N Percent N Percent N Percent
Ward in Origin * Ward in
Australia
38 100.0% 0 .0% 38 100.0%
Ward in Origin * Ward in Australia Crosstabulation
Count
Ward in Australia
Total 1 2
Ward in Origin 1 3 18 21
2 11 6 17
Total 14 24 38

51
Chi-Square Tests
Value df
Asymp. Sig. (2-
sided)
Exact Sig. (2-
sided)
Exact Sig. (1-
sided)
Pearson Chi-Square 10.264a 1 .001
Continuity Correctionb 8.212 1 .004
Likelihood Ratio 10.717 1 .001
Fisher's Exact Test .002 .002
Linear-by-Linear Association 9.994 1 .002
N of Valid Cases 38
a. 0 cells (.0%) have expected count less than 5. The minimum expected count is 6.26.
b. Computed only for a 2x2 table
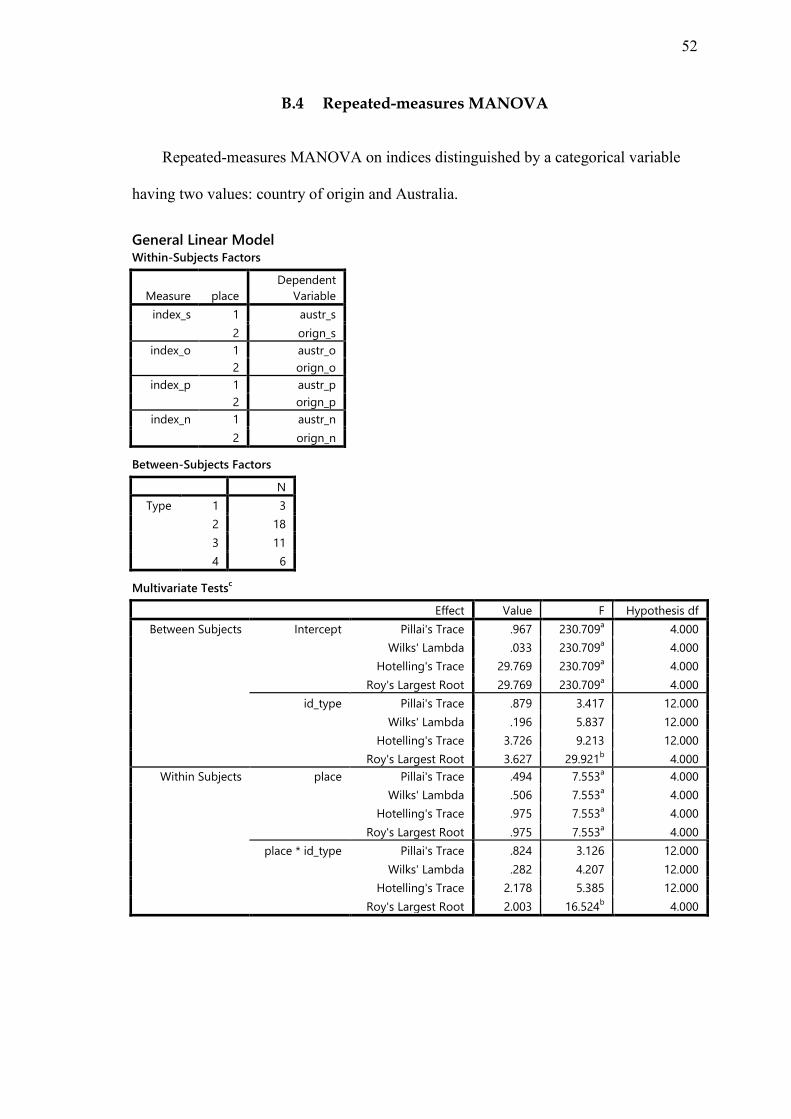
52
B.4 Repeated-measures MANOVA
Repeated-measures MANOVA on indices distinguished by a categorical variable
having two values: country of origin and Australia.
General Linear Model Within-Subjects Factors
Measure place
Dependent
Variable
index_s 1 austr_s
2 orign_s
index_o 1 austr_o
2 orign_o
index_p 1 austr_p
2 orign_p
index_n 1 austr_n
2 orign_n
Between-Subjects Factors
N
Type 1 3
2 18
3 11
4 6
Multivariate Testsc
Effect Value F Hypothesis df
Between Subjects Intercept Pillai's Trace .967 230.709a 4.000
Wilks' Lambda .033 230.709a 4.000
Hotelling's Trace 29.769 230.709a 4.000
Roy's Largest Root 29.769 230.709a 4.000
id_type Pillai's Trace .879 3.417 12.000
Wilks' Lambda .196 5.837 12.000
Hotelling's Trace 3.726 9.213 12.000
Roy's Largest Root 3.627 29.921b 4.000
Within Subjects place Pillai's Trace .494 7.553a 4.000
Wilks' Lambda .506 7.553a 4.000
Hotelling's Trace .975 7.553a 4.000
Roy's Largest Root .975 7.553a 4.000
place * id_type Pillai's Trace .824 3.126 12.000
Wilks' Lambda .282 4.207 12.000
Hotelling's Trace 2.178 5.385 12.000
Roy's Largest Root 2.003 16.524b 4.000

53
Multivariate Testsc
Effect Error df Sig.
Partial Eta
Squared
Between Subjects Intercept Pillai's Trace 31.000 .000 .967
Wilks' Lambda 31.000 .000 .967
Hotelling's Trace 31.000 .000 .967
Roy's Largest Root 31.000 .000 .967
id_type Pillai's Trace 99.000 .000 .293
Wilks' Lambda 82.310 .000 .419
Hotelling's Trace 89.000 .000 .554
Roy's Largest Root 33.000 .000 .784
Within Subjects place Pillai's Trace 31.000 .000 .494
Wilks' Lambda 31.000 .000 .494
Hotelling's Trace 31.000 .000 .494
Roy's Largest Root 31.000 .000 .494
place * id_type Pillai's Trace 99.000 .001 .275
Wilks' Lambda 82.310 .000 .344
Hotelling's Trace 89.000 .000 .421
Roy's Largest Root 33.000 .000 .667
a. Exact statistic
b. The statistic is an upper bound on F that yields a lower bound on the significance level.
c. Design: Intercept + id_type
Within Subjects Design: place
Mauchly's Test of Sphericityb
Within Subjects Effect Measure Mauchly's W
Approx. Chi-
Square df Sig.
place index_s 1.000 .000 0 .
index_o 1.000 .000 0 .
index_p 1.000 .000 0 .
index_n 1.000 .000 0 .
Mauchly's Test of Sphericityb
Within Subjects Effect Measure
Epsilona
Greenhouse-
Geisser Huynh-Feldt Lower-bound
place index_s 1.000 1.000 1.000
index_o 1.000 1.000 1.000
index_p 1.000 1.000 1.000
index_n 1.000 1.000 1.000
Tests the null hypothesis that the error covariance matrix of the orthonormalized transformed dependent
variables is proportional to an identity matrix.
a. May be used to adjust the degrees of freedom for the averaged tests of significance. Corrected tests are
displayed in the Tests of Within-Subjects Effects table.
b. Design: Intercept + id_type
Within Subjects Design: place

54
Tests of Within-Subjects Effects
Multivariatecd
Within Subjects Effect Value F Hypothesis df Error df
place Pillai's Trace .494 7.553a 4.000 31.000
Wilks' Lambda .506 7.553a 4.000 31.000
Hotelling's Trace .975 7.553a 4.000 31.000
Roy's Largest Root .975 7.553a 4.000 31.000
place * id_type Pillai's Trace .824 3.126 12.000 99.000
Wilks' Lambda .282 4.207 12.000 82.310
Hotelling's Trace 2.178 5.385 12.000 89.000
Roy's Largest Root 2.003 16.524b 4.000 33.000
Multivariatecd
Within Subjects Effect Sig.
Partial Eta
Squared
place Pillai's Trace .000 .494
Wilks' Lambda .000 .494
Hotelling's Trace .000 .494
Roy's Largest Root .000 .494
place * id_type Pillai's Trace .001 .275
Wilks' Lambda .000 .344
Hotelling's Trace .000 .421
Roy's Largest Root .000 .667
a. Exact statistic
b. The statistic is an upper bound on F that yields a lower bound on the significance level.
c. Design: Intercept + id_type
Within Subjects Design: place
d. Tests are based on averaged variables.

55
Univariate Tests
Source Measure
Type III Sum of
Squares df Mean Square F
place index_s Sphericity Assumed 36.928 1 36.928 22.185
Greenhouse-Geisser 36.928 1.000 36.928 22.185
Huynh-Feldt 36.928 1.000 36.928 22.185
Lower-bound 36.928 1.000 36.928 22.185
index_o Sphericity Assumed 5.475 1 5.475 2.139
Greenhouse-Geisser 5.475 1.000 5.475 2.139
Huynh-Feldt 5.475 1.000 5.475 2.139
Lower-bound 5.475 1.000 5.475 2.139
index_p Sphericity Assumed 61.170 1 61.170 11.525
Greenhouse-Geisser 61.170 1.000 61.170 11.525
Huynh-Feldt 61.170 1.000 61.170 11.525
Lower-bound 61.170 1.000 61.170 11.525
index_n Sphericity Assumed .294 1 .294 .038
Greenhouse-Geisser .294 1.000 .294 .038
Huynh-Feldt .294 1.000 .294 .038
Lower-bound .294 1.000 .294 .038
place * id_type index_s Sphericity Assumed 75.412 3 25.137 15.101
Greenhouse-Geisser 75.412 3.000 25.137 15.101
Huynh-Feldt 75.412 3.000 25.137 15.101
Lower-bound 75.412 3.000 25.137 15.101
index_o Sphericity Assumed 69.595 3 23.198 9.062
Greenhouse-Geisser 69.595 3.000 23.198 9.062
Huynh-Feldt 69.595 3.000 23.198 9.062
Lower-bound 69.595 3.000 23.198 9.062
index_p Sphericity Assumed 348.591 3 116.197 21.892
Greenhouse-Geisser 348.591 3.000 116.197 21.892
Huynh-Feldt 348.591 3.000 116.197 21.892
Lower-bound 348.591 3.000 116.197 21.892
index_n Sphericity Assumed 233.149 3 77.716 10.143
Greenhouse-Geisser 233.149 3.000 77.716 10.143
Huynh-Feldt 233.149 3.000 77.716 10.143
Lower-bound 233.149 3.000 77.716 10.143
Error(place) index_s Sphericity Assumed 56.595 34 1.665
Greenhouse-Geisser 56.595 34.000 1.665
Huynh-Feldt 56.595 34.000 1.665
Lower-bound 56.595 34.000 1.665
index_o Sphericity Assumed 87.043 34 2.560
Greenhouse-Geisser 87.043 34.000 2.560
Huynh-Feldt 87.043 34.000 2.560
Lower-bound 87.043 34.000 2.560
index_p Sphericity Assumed 180.459 34 5.308
Greenhouse-Geisser 180.459 34.000 5.308
Huynh-Feldt 180.459 34.000 5.308
Lower-bound 180.459 34.000 5.308
index_n Sphericity Assumed 260.503 34 7.662
Greenhouse-Geisser 260.503 34.000 7.662
Huynh-Feldt 260.503 34.000 7.662
Lower-bound 260.503 34.000 7.662
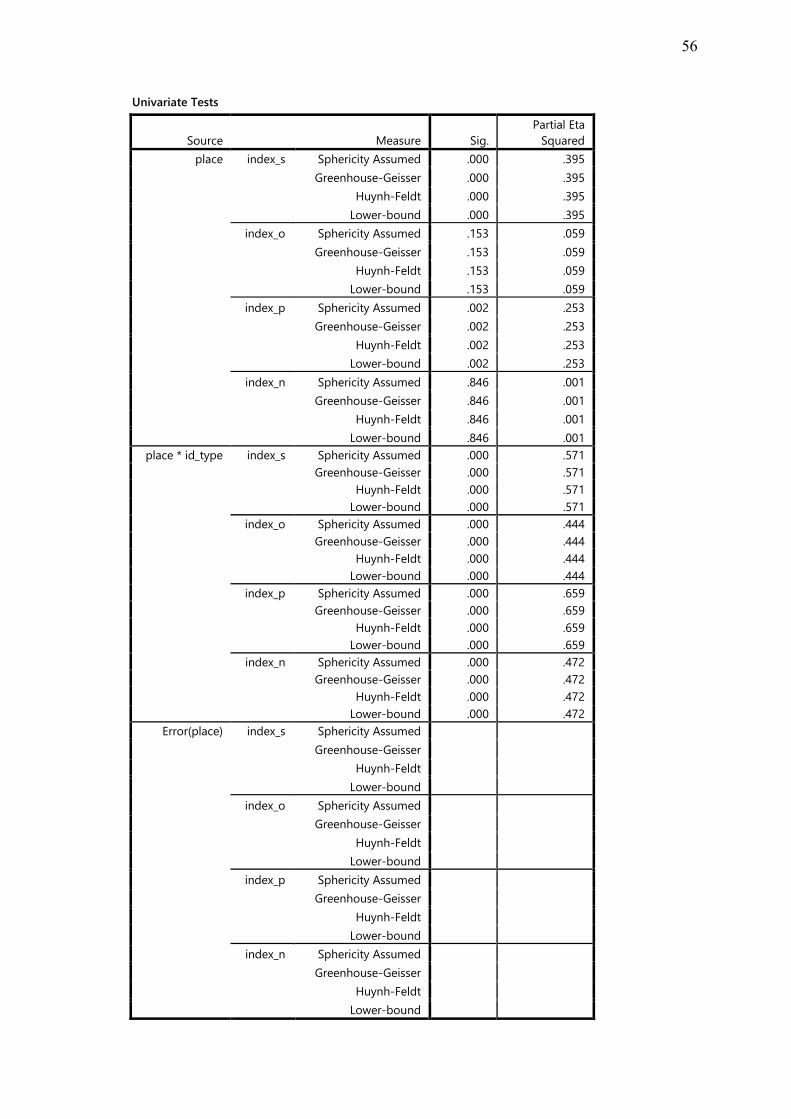
56
Univariate Tests
Source Measure Sig.
Partial Eta
Squared
place index_s Sphericity Assumed .000 .395
Greenhouse-Geisser .000 .395
Huynh-Feldt .000 .395
Lower-bound .000 .395
index_o Sphericity Assumed .153 .059
Greenhouse-Geisser .153 .059
Huynh-Feldt .153 .059
Lower-bound .153 .059
index_p Sphericity Assumed .002 .253
Greenhouse-Geisser .002 .253
Huynh-Feldt .002 .253
Lower-bound .002 .253
index_n Sphericity Assumed .846 .001
Greenhouse-Geisser .846 .001
Huynh-Feldt .846 .001
Lower-bound .846 .001
place * id_type index_s Sphericity Assumed .000 .571
Greenhouse-Geisser .000 .571
Huynh-Feldt .000 .571
Lower-bound .000 .571
index_o Sphericity Assumed .000 .444
Greenhouse-Geisser .000 .444
Huynh-Feldt .000 .444
Lower-bound .000 .444
index_p Sphericity Assumed .000 .659
Greenhouse-Geisser .000 .659
Huynh-Feldt .000 .659
Lower-bound .000 .659
index_n Sphericity Assumed .000 .472
Greenhouse-Geisser .000 .472
Huynh-Feldt .000 .472
Lower-bound .000 .472
Error(place) index_s Sphericity Assumed
Greenhouse-Geisser
Huynh-Feldt
Lower-bound
index_o Sphericity Assumed
Greenhouse-Geisser
Huynh-Feldt
Lower-bound
index_p Sphericity Assumed
Greenhouse-Geisser
Huynh-Feldt
Lower-bound
index_n Sphericity Assumed
Greenhouse-Geisser
Huynh-Feldt
Lower-bound
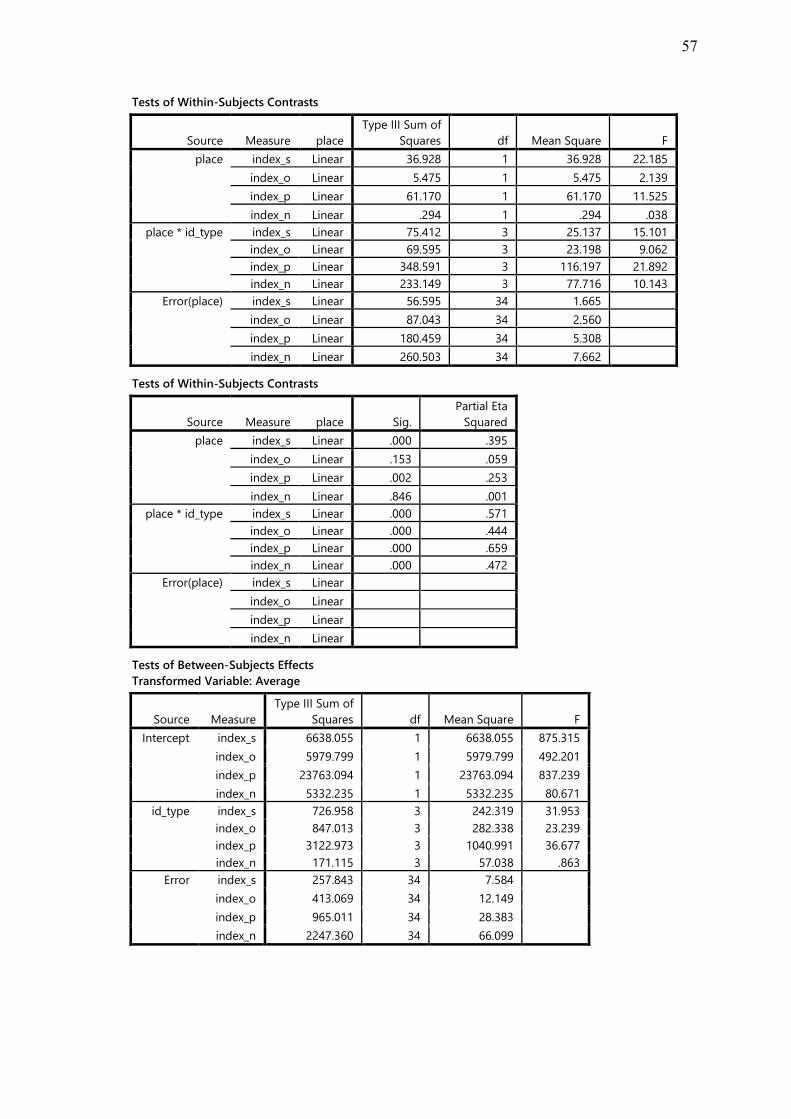
57
Tests of Within-Subjects Contrasts
Source Measure place
Type III Sum of
Squares df Mean Square F
place index_s Linear 36.928 1 36.928 22.185
index_o Linear 5.475 1 5.475 2.139
index_p Linear 61.170 1 61.170 11.525
index_n Linear .294 1 .294 .038
place * id_type index_s Linear 75.412 3 25.137 15.101
index_o Linear 69.595 3 23.198 9.062
index_p Linear 348.591 3 116.197 21.892
index_n Linear 233.149 3 77.716 10.143
Error(place) index_s Linear 56.595 34 1.665
index_o Linear 87.043 34 2.560
index_p Linear 180.459 34 5.308
index_n Linear 260.503 34 7.662
Tests of Within-Subjects Contrasts
Source Measure place Sig.
Partial Eta
Squared
place index_s Linear .000 .395
index_o Linear .153 .059
index_p Linear .002 .253
index_n Linear .846 .001
place * id_type index_s Linear .000 .571
index_o Linear .000 .444
index_p Linear .000 .659
index_n Linear .000 .472
Error(place) index_s Linear
index_o Linear
index_p Linear
index_n Linear
Tests of Between-Subjects Effects
Transformed Variable: Average
Source Measure
Type III Sum of
Squares df Mean Square F
Intercept index_s 6638.055 1 6638.055 875.315
index_o 5979.799 1 5979.799 492.201
index_p 23763.094 1 23763.094 837.239
index_n 5332.235 1 5332.235 80.671
id_type index_s 726.958 3 242.319 31.953
index_o 847.013 3 282.338 23.239
index_p 3122.973 3 1040.991 36.677
index_n 171.115 3 57.038 .863
Error index_s 257.843 34 7.584
index_o 413.069 34 12.149
index_p 965.011 34 28.383
index_n 2247.360 34 66.099
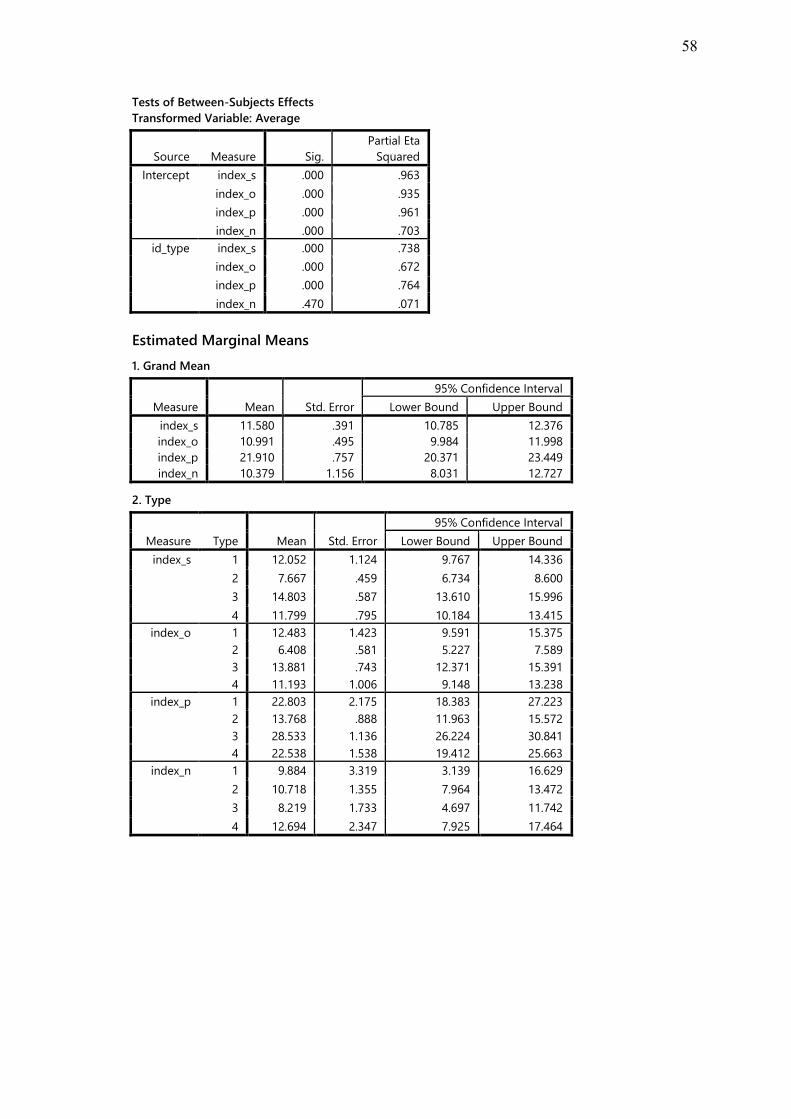
58
Tests of Between-Subjects Effects
Transformed Variable: Average
Source Measure Sig.
Partial Eta
Squared
Intercept index_s .000 .963
index_o .000 .935
index_p .000 .961
index_n .000 .703
id_type index_s .000 .738
index_o .000 .672
index_p .000 .764
index_n .470 .071
Estimated Marginal Means
1. Grand Mean
Measure Mean Std. Error
95% Confidence Interval
Lower Bound Upper Bound
index_s 11.580 .391 10.785 12.376
index_o 10.991 .495 9.984 11.998
index_p 21.910 .757 20.371 23.449
index_n 10.379 1.156 8.031 12.727
2. Type
Measure Type Mean Std. Error
95% Confidence Interval
Lower Bound Upper Bound
index_s 1 12.052 1.124 9.767 14.336
2 7.667 .459 6.734 8.600
3 14.803 .587 13.610 15.996
4 11.799 .795 10.184 13.415
index_o 1 12.483 1.423 9.591 15.375
2 6.408 .581 5.227 7.589
3 13.881 .743 12.371 15.391
4 11.193 1.006 9.148 13.238
index_p 1 22.803 2.175 18.383 27.223
2 13.768 .888 11.963 15.572
3 28.533 1.136 26.224 30.841
4 22.538 1.538 19.412 25.663
index_n 1 9.884 3.319 3.139 16.629
2 10.718 1.355 7.964 13.472
3 8.219 1.733 4.697 11.742
4 12.694 2.347 7.925 17.464

59
3. place
Measure place Mean Std. Error
95% Confidence Interval
Lower Bound Upper Bound
index_s 1 12.444 .423 11.585 13.303
2 10.717 .441 9.819 11.614
index_o 1 11.324 .582 10.140 12.507
2 10.659 .505 9.632 11.685
index_p 1 23.022 .812 21.371 24.673
2 20.799 .838 19.096 22.501
index_n 1 10.302 1.175 7.915 12.689
2 10.456 1.265 7.885 13.027
4. Type * place
Measure Type place Mean Std. Error
95% Confidence Interval
Lower Bound Upper Bound
index_s 1 1 14.917 1.214 12.449 17.385
2 9.186 1.268 6.610 11.763
2 1 8.519 .496 7.511 9.526
2 6.815 .518 5.763 7.867
3 1 15.775 .634 14.486 17.064
2 13.832 .662 12.486 15.178
4 1 10.566 .859 8.821 12.311
2 13.033 .897 11.210 14.855
index_o 1 1 14.492 1.673 11.092 17.891
2 10.474 1.451 7.525 13.423
2 1 6.817 .683 5.429 8.204
2 5.999 .592 4.796 7.203
3 1 14.519 .874 12.744 16.294
2 13.243 .758 11.703 14.782
4 1 9.467 1.183 7.064 11.871
2 12.918 1.026 10.833 15.003
index_p 1 1 27.376 2.333 22.635 32.117
2 18.231 2.406 13.341 23.120
2 1 15.072 .952 13.137 17.008
2 12.463 .982 10.467 14.459
3 1 30.605 1.218 28.129 33.081
2 26.460 1.256 23.906 29.013
4 1 19.034 1.650 15.682 22.386
2 26.041 1.701 22.584 29.499
index_n 1 1 6.519 3.374 -.338 13.375
2 13.249 3.634 5.864 20.634
2 1 11.015 1.377 8.215 13.814
2 10.422 1.484 7.407 13.436
3 1 7.427 1.762 3.846 11.008
2 9.011 1.898 5.155 12.868
4 1 16.247 2.386 11.399 21.095
2 9.142 2.570 3.920 14.364
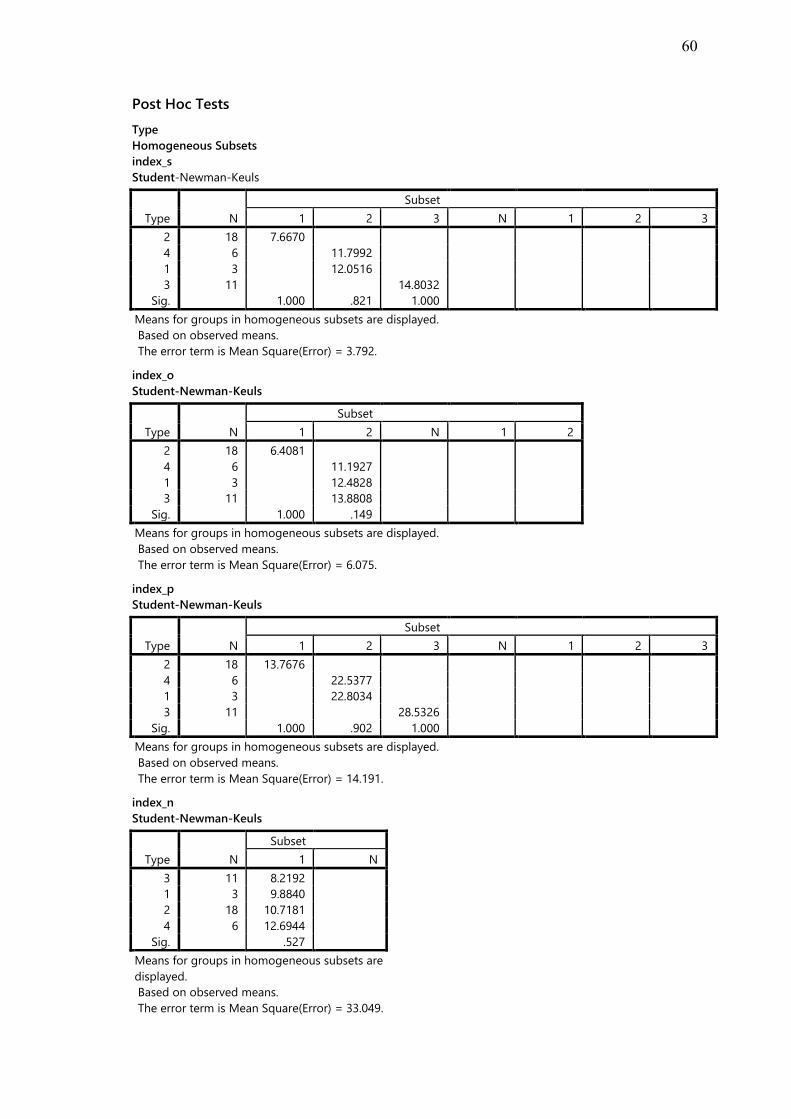
60
Post Hoc Tests
Type
Homogeneous Subsets
index_s
Student-Newman-Keuls
Type N
Subset
1 2 3 N 1 2 3
2 18 7.6670
4 6 11.7992
1 3 12.0516
3 11 14.8032
Sig. 1.000 .821 1.000
Means for groups in homogeneous subsets are displayed.
Based on observed means.
The error term is Mean Square(Error) = 3.792.
index_o
Student-Newman-Keuls
Type N
Subset
1 2 N 1 2
2 18 6.4081
4 6 11.1927
1 3 12.4828
3 11 13.8808
Sig. 1.000 .149
Means for groups in homogeneous subsets are displayed.
Based on observed means.
The error term is Mean Square(Error) = 6.075.
index_p
Student-Newman-Keuls
Type N
Subset
1 2 3 N 1 2 3
2 18 13.7676
4 6 22.5377
1 3 22.8034
3 11 28.5326
Sig. 1.000 .902 1.000
Means for groups in homogeneous subsets are displayed.
Based on observed means.
The error term is Mean Square(Error) = 14.191.
index_n
Student-Newman-Keuls
Type N
Subset
1 N
3 11 8.2192
1 3 9.8840
2 18 10.7181
4 6 12.6944
Sig. .527
Means for groups in homogeneous subsets are
displayed.
Based on observed means.
The error term is Mean Square(Error) = 33.049.

61
Oneway
ANOVA
Sum of Squares df Mean Square F Sig.
S origin Between Groups 401.224 3 133.741 27.726 .000
Within Groups 164.004 34 4.824
Total 565.228 37
O origin Between Groups 447.527 3 149.176 23.619 .000
Within Groups 214.741 34 6.316
Total 662.268 37
P origin Between Groups 1680.123 3 560.041 32.253 .000
Within Groups 590.374 34 17.364
Total 2270.496 37
N origin Between Groups 49.999 3 16.666 .421 .739
Within Groups 1346.905 34 39.615
Total 1396.904 37
S Australia Between Groups 401.145 3 133.715 30.221 .000
Within Groups 150.434 34 4.425
Total 551.579 37
O Australia Between Groups 469.080 3 156.360 18.629 .000
Within Groups 285.371 34 8.393
Total 754.451 37
P Australia Between Groups 1791.441 3 597.147 36.576 .000
Within Groups 555.097 34 16.326
Total 2346.538 37
N Australia Between Groups 354.265 3 118.088 3.458 .027
Within Groups 1160.957 34 34.146
Total 1515.222 37
Post Hoc Tests
Homogeneous Subsets
S origin
Student-Newman-Keuls
Type N
Subset for alpha = .05
1 2 N 1 2
2 18 6.8153
1 3 9.1865
4 6 13.0326
3 11 13.8318
Sig. .066 .526
Means for groups in homogeneous subsets are displayed.
O origin
Student-Newman-Keuls
Type N
Subset for alpha = .05
1 2 N 1 2
2 18 5.9994
1 3 10.4740
4 6 12.9181
3 11 13.2425
Sig. 1.000 .144
Means for groups in homogeneous subsets are displayed.
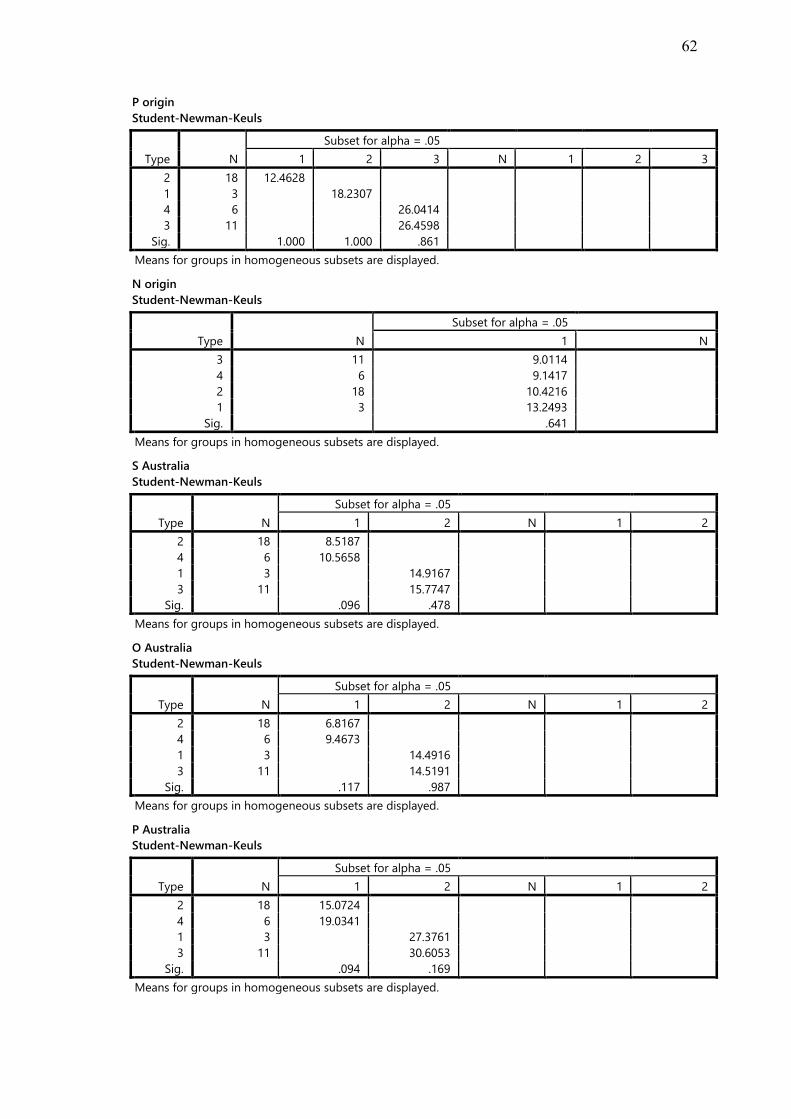
62
P origin
Student-Newman-Keuls
Type N
Subset for alpha = .05
1 2 3 N 1 2 3
2 18 12.4628
1 3 18.2307
4 6 26.0414
3 11 26.4598
Sig. 1.000 1.000 .861
Means for groups in homogeneous subsets are displayed.
N origin
Student-Newman-Keuls
Type N
Subset for alpha = .05
1 N
3 11 9.0114
4 6 9.1417
2 18 10.4216
1 3 13.2493
Sig. .641
Means for groups in homogeneous subsets are displayed.
S Australia
Student-Newman-Keuls
Type N
Subset for alpha = .05
1 2 N 1 2
2 18 8.5187
4 6 10.5658
1 3 14.9167
3 11 15.7747
Sig. .096 .478
Means for groups in homogeneous subsets are displayed.
O Australia
Student-Newman-Keuls
Type N
Subset for alpha = .05
1 2 N 1 2
2 18 6.8167
4 6 9.4673
1 3 14.4916
3 11 14.5191
Sig. .117 .987
Means for groups in homogeneous subsets are displayed.
P Australia
Student-Newman-Keuls
Type N
Subset for alpha = .05
1 2 N 1 2
2 18 15.0724
4 6 19.0341
1 3 27.3761
3 11 30.6053
Sig. .094 .169
Means for groups in homogeneous subsets are displayed.

63
N Australia
Student-Newman-Keuls
Type N
Subset for alpha = .05
1 2 N 1 2
1 3 6.5186
3 11 7.4270
2 18 11.0145 11.0145
4 6 16.2471
Sig. .376 .125
Means for groups in homogeneous subsets are displayed.

64
B.5 Paired t-tests
Paired t-tests for the entire sample and for each participant type separately,
comparing indices for the country of origin I-position with those for the Australian I-
position.
T-Test
Paired Samples Statistics
Mean N Std. Deviation Std. Error Mean
Pair 1 S Australia 11.4474 38 3.86103 .62634
S origin 10.0153 38 3.90851 .63404
Pair 2 O Australia 10.0708 38 4.51559 .73253
O origin 9.5418 38 4.23074 .68632
Pair 3 P Australia 21.1656 38 7.96366 1.29188
P origin 19.1139 38 7.83357 1.27077
Pair 4 N Australia 10.4473 38 6.39937 1.03812
N origin 10.0345 38 6.14444 .99676
Paired Samples Correlations
N Correlation Sig.
Pair 1 S Australia & S origin 38 .764 .000
Pair 2 O Australia & O origin 38 .781 .000
Pair 3 P Australia & P origin 38 .771 .000
Pair 4 N Australia & N origin 38 .662 .000
Paired Samples Test
Paired Differences
Mean Std. Deviation Std. Error Mean
Pair 1 S Australia - S origin 1.43220 2.67123 .43333
Pair 2 O Australia - O origin .52900 2.90979 .47203
Pair 3 P Australia - P origin 2.05172 5.34764 .86750
Pair 4 N Australia - N origin .41276 5.16564 .83798
Paired Samples Test
Paired Differences
t
95% Confidence Interval of the
Difference
Lower Upper
Pair 1 S Australia - S origin .55418 2.31021 3.305
Pair 2 O Australia - O origin -.42743 1.48542 1.121
Pair 3 P Australia - P origin .29399 3.80944 2.365
Pair 4 N Australia - N origin -1.28514 2.11067 .493
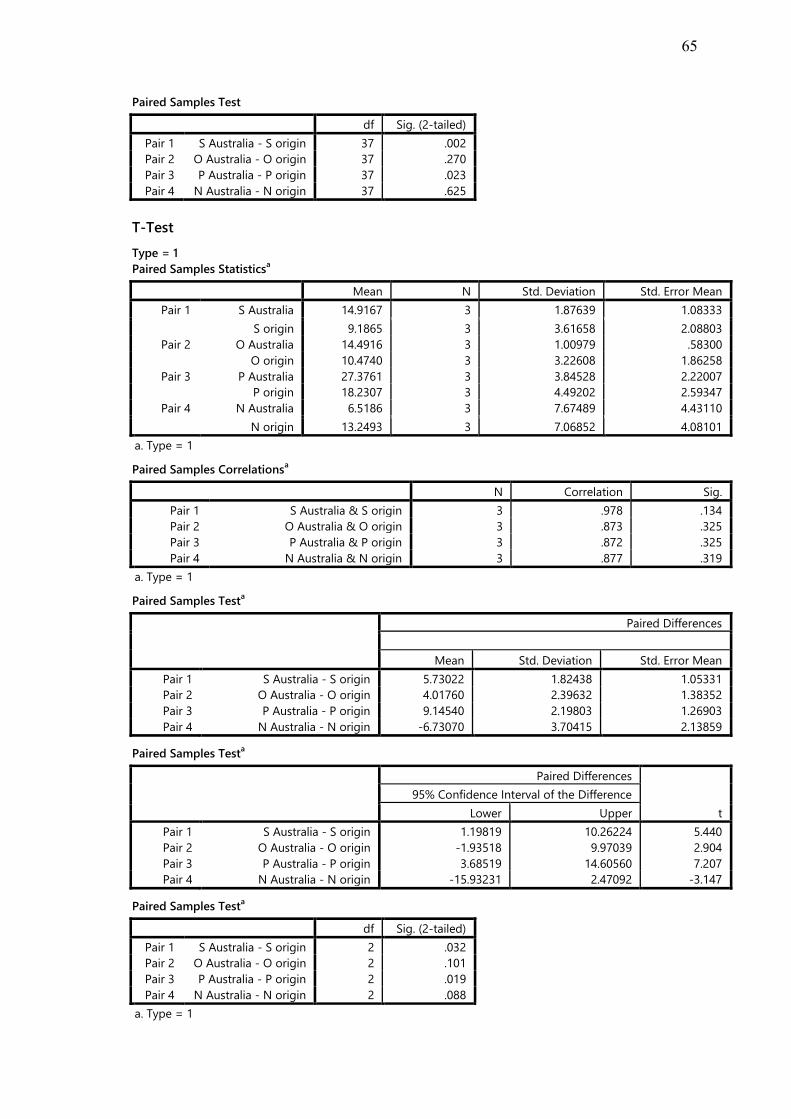
65
Paired Samples Test
df Sig. (2-tailed)
Pair 1 S Australia - S origin 37 .002
Pair 2 O Australia - O origin 37 .270
Pair 3 P Australia - P origin 37 .023
Pair 4 N Australia - N origin 37 .625
T-Test
Type = 1
Paired Samples Statisticsa
Mean N Std. Deviation Std. Error Mean
Pair 1 S Australia 14.9167 3 1.87639 1.08333
S origin 9.1865 3 3.61658 2.08803
Pair 2 O Australia 14.4916 3 1.00979 .58300
O origin 10.4740 3 3.22608 1.86258
Pair 3 P Australia 27.3761 3 3.84528 2.22007
P origin 18.2307 3 4.49202 2.59347
Pair 4 N Australia 6.5186 3 7.67489 4.43110
N origin 13.2493 3 7.06852 4.08101
a. Type = 1
Paired Samples Correlationsa
N Correlation Sig.
Pair 1 S Australia & S origin 3 .978 .134
Pair 2 O Australia & O origin 3 .873 .325
Pair 3 P Australia & P origin 3 .872 .325
Pair 4 N Australia & N origin 3 .877 .319
a. Type = 1
Paired Samples Testa
Paired Differences
Mean Std. Deviation Std. Error Mean
Pair 1 S Australia - S origin 5.73022 1.82438 1.05331
Pair 2 O Australia - O origin 4.01760 2.39632 1.38352
Pair 3 P Australia - P origin 9.14540 2.19803 1.26903
Pair 4 N Australia - N origin -6.73070 3.70415 2.13859
Paired Samples Testa
Paired Differences
t
95% Confidence Interval of the Difference
Lower Upper
Pair 1 S Australia - S origin 1.19819 10.26224 5.440
Pair 2 O Australia - O origin -1.93518 9.97039 2.904
Pair 3 P Australia - P origin 3.68519 14.60560 7.207
Pair 4 N Australia - N origin -15.93231 2.47092 -3.147
Paired Samples Testa
df Sig. (2-tailed)
Pair 1 S Australia - S origin 2 .032
Pair 2 O Australia - O origin 2 .101
Pair 3 P Australia - P origin 2 .019
Pair 4 N Australia - N origin 2 .088
a. Type = 1

66
Type = 2
Paired Samples Statisticsa
Mean N Std. Deviation Std. Error Mean
Pair 1 S Australia 8.5187 18 2.45534 .57873
S origin 6.8153 18 2.29341 .54056
Pair 2 O Australia 6.8167 18 3.32027 .78260
O origin 5.9994 18 2.81815 .66424
Pair 3 P Australia 15.0724 18 4.95009 1.16675
P origin 12.4628 18 4.61459 1.08767
Pair 4 N Australia 11.0145 18 6.54692 1.54312
N origin 10.4216 18 6.87254 1.61987
a. Type = 2
Paired Samples Correlationsa
N Correlation Sig.
Pair 1 S Australia & S origin 18 .703 .001
Pair 2 O Australia & O origin 18 .737 .000
Pair 3 P Australia & P origin 18 .740 .000
Pair 4 N Australia & N origin 18 .859 .000
a. Type = 2
Paired Samples Testa
Paired Differences
Mean Std. Deviation Std. Error Mean
Pair 1 S Australia - S origin 1.70338 1.83531 .43259
Pair 2 O Australia - O origin .81732 2.27649 .53657
Pair 3 P Australia - P origin 2.60958 3.45975 .81547
Pair 4 N Australia - N origin .59294 3.57427 .84246
Paired Samples Testa
Paired Differences
t
95% Confidence Interval of the Difference
Lower Upper
Pair 1 S Australia - S origin .79070 2.61606 3.938
Pair 2 O Australia - O origin -.31476 1.94939 1.523
Pair 3 P Australia - P origin .88908 4.33007 3.200
Pair 4 N Australia - N origin -1.18450 2.37038 .704
Paired Samples Testa
df Sig. (2-tailed)
Pair 1 S Australia - S origin 17 .001
Pair 2 O Australia - O origin 17 .146
Pair 3 P Australia - P origin 17 .005
Pair 4 N Australia - N origin 17 .491
a. Type = 2

67
Type = 3
Paired Samples Statisticsa
Mean N Std. Deviation Std. Error Mean
Pair 1 S Australia 15.7747 11 1.81116 .54609
S origin 13.8318 11 2.09383 .63131
Pair 2 O Australia 14.5191 11 2.51866 .75941
O origin 13.2425 11 2.30256 .69425
Pair 3 P Australia 30.6053 11 2.63742 .79521
P origin 26.4598 11 4.18274 1.26114
Pair 4 N Australia 7.4270 11 4.20208 1.26697
N origin 9.0114 11 5.93648 1.78992
a. Type = 3
Paired Samples Correlationsa
N Correlation Sig.
Pair 1 S Australia & S origin 11 .389 .238
Pair 2 O Australia & O origin 11 .567 .069
Pair 3 P Australia & P origin 11 .538 .088
Pair 4 N Australia & N origin 11 .620 .042
a. Type = 3
Paired Samples Testa
Paired Differences
Mean Std. Deviation Std. Error Mean
Pair 1 S Australia - S origin 1.94295 2.17183 .65483
Pair 2 O Australia - O origin 1.27658 2.25048 .67855
Pair 3 P Australia - P origin 4.14550 3.54665 1.06936
Pair 4 N Australia - N origin -1.58440 4.68734 1.41329
Paired Samples Testa
Paired Differences
t
95% Confidence Interval of the Difference
Lower Upper
Pair 1 S Australia - S origin .48390 3.40201 2.967
Pair 2 O Australia - O origin -.23531 2.78848 1.881
Pair 3 P Australia - P origin 1.76283 6.52817 3.877
Pair 4 N Australia - N origin -4.73340 1.56459 -1.121
Paired Samples Testa
df Sig. (2-tailed)
Pair 1 S Australia - S origin 10 .014
Pair 2 O Australia - O origin 10 .089
Pair 3 P Australia - P origin 10 .003
Pair 4 N Australia - N origin 10 .288
a. Type = 3

68
Type = 4
Paired Samples Statisticsa
Mean N Std. Deviation Std. Error Mean
Pair 1 S Australia 10.5658 6 1.27287 .51965
S origin 13.0326 6 .95798 .39109
Pair 2 O Australia 9.4673 6 2.54887 1.04057
O origin 12.9181 6 1.08573 .44325
Pair 3 P Australia 19.0341 6 2.80741 1.14612
P origin 26.0414 6 1.61607 .65976
Pair 4 N Australia 16.2471 6 5.25201 2.14413
N origin 9.1417 6 4.28065 1.74757
a. Type = 4
Paired Samples Correlationsa
N Correlation Sig.
Pair 1 S Australia & S origin 6 .868 .025
Pair 2 O Australia & O origin 6 .525 .285
Pair 3 P Australia & P origin 6 .672 .144
Pair 4 N Australia & N origin 6 .769 .074
a. Type = 4
Paired Samples Testa
Paired Differences
Mean Std. Deviation Std. Error Mean
Pair 1 S Australia - S origin -2.46676 .64841 .26471
Pair 2 O Australia - O origin -3.45084 2.18416 .89168
Pair 3 P Australia - P origin -7.00731 2.09669 .85597
Pair 4 N Australia - N origin 7.10543 3.36663 1.37442
Paired Samples Testa
Paired Differences
t
95% Confidence Interval of the Difference
Lower Upper
Pair 1 S Australia - S origin -3.14722 -1.78629 -9.319
Pair 2 O Australia - O origin -5.74298 -1.15870 -3.870
Pair 3 P Australia - P origin -9.20765 -4.80696 -8.186
Pair 4 N Australia - N origin 3.57237 10.63850 5.170
Paired Samples Testa
df Sig. (2-tailed)
Pair 1 S Australia - S origin 5 .000
Pair 2 O Australia - O origin 5 .012
Pair 3 P Australia - P origin 5 .000
Pair 4 N Australia - N origin 5 .004
a. Type = 4

69
B.6 Single-factor between-subjects MANOVA
MANOVAs with id_type as IV and the following DVs:
Self-confrontation indices for the country of origin I-position
Self-confrontation indices for the Australian I-position
Self-confrontation indices for General feeling
Self-confrontation indices for Ideal feeling
Self-confrontation indices for the country of origin I-position (standardised)
Self-confrontation indices for the Australian I-position (standardised)
Psychological distress scales (BDI-II, FNES, SADS)
Psychological Well-being Subscales (PWS1..6).
Contrasts

70
Indices by Type
General Linear Model
Between-Subjects Factors
N
Type 1 3
2 18
3 11
4 6
Descriptive Statistics
Type Mean Std. Deviation N
S origin 1 9.1865 3.61658 3
2 6.8153 2.29341 18
3 13.8318 2.09383 11
4 13.0326 .95798 6
Total 10.0153 3.90851 38
O origin 1 10.4740 3.22608 3
2 5.9994 2.81815 18
3 13.2425 2.30256 11
4 12.9181 1.08573 6
Total 9.5418 4.23074 38
P origin 1 18.2307 4.49202 3
2 12.4628 4.61459 18
3 26.4598 4.18274 11
4 26.0414 1.61607 6
Total 19.1139 7.83357 38
N origin 1 13.2493 7.06852 3
2 10.4216 6.87254 18
3 9.0114 5.93648 11
4 9.1417 4.28065 6
Total 10.0345 6.14444 38
Multivariate Testsc
Effect Value F Hypothesis df Error df
Intercept Pillai's Trace .956 168.113a 4.000 31.000
Wilks' Lambda .044 168.113a 4.000 31.000
Hotelling's Trace 21.692 168.113a 4.000 31.000
Roy's Largest Root 21.692 168.113a 4.000 31.000
id_type Pillai's Trace .857 3.298 12.000 99.000
Wilks' Lambda .211 5.486 12.000 82.310
Hotelling's Trace 3.418 8.449 12.000 89.000
Roy's Largest Root 3.324 27.426b 4.000 33.000
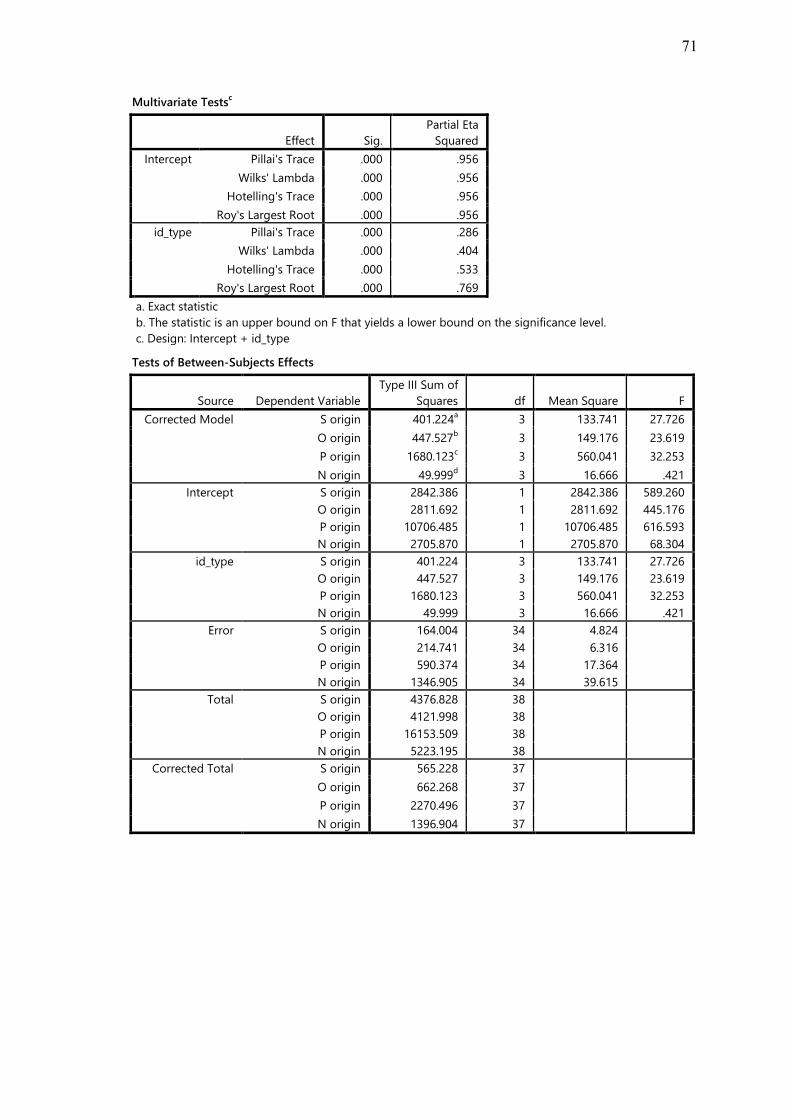
71
Multivariate Testsc
Effect Sig.
Partial Eta
Squared
Intercept Pillai's Trace .000 .956
Wilks' Lambda .000 .956
Hotelling's Trace .000 .956
Roy's Largest Root .000 .956
id_type Pillai's Trace .000 .286
Wilks' Lambda .000 .404
Hotelling's Trace .000 .533
Roy's Largest Root .000 .769
a. Exact statistic
b. The statistic is an upper bound on F that yields a lower bound on the significance level.
c. Design: Intercept + id_type
Tests of Between-Subjects Effects
Source Dependent Variable
Type III Sum of
Squares df Mean Square F
Corrected Model S origin 401.224a 3 133.741 27.726
O origin 447.527b 3 149.176 23.619
P origin 1680.123c 3 560.041 32.253
N origin 49.999d 3 16.666 .421
Intercept S origin 2842.386 1 2842.386 589.260
O origin 2811.692 1 2811.692 445.176
P origin 10706.485 1 10706.485 616.593
N origin 2705.870 1 2705.870 68.304
id_type S origin 401.224 3 133.741 27.726
O origin 447.527 3 149.176 23.619
P origin 1680.123 3 560.041 32.253
N origin 49.999 3 16.666 .421
Error S origin 164.004 34 4.824
O origin 214.741 34 6.316
P origin 590.374 34 17.364
N origin 1346.905 34 39.615
Total S origin 4376.828 38
O origin 4121.998 38
P origin 16153.509 38
N origin 5223.195 38
Corrected Total S origin 565.228 37
O origin 662.268 37
P origin 2270.496 37
N origin 1396.904 37
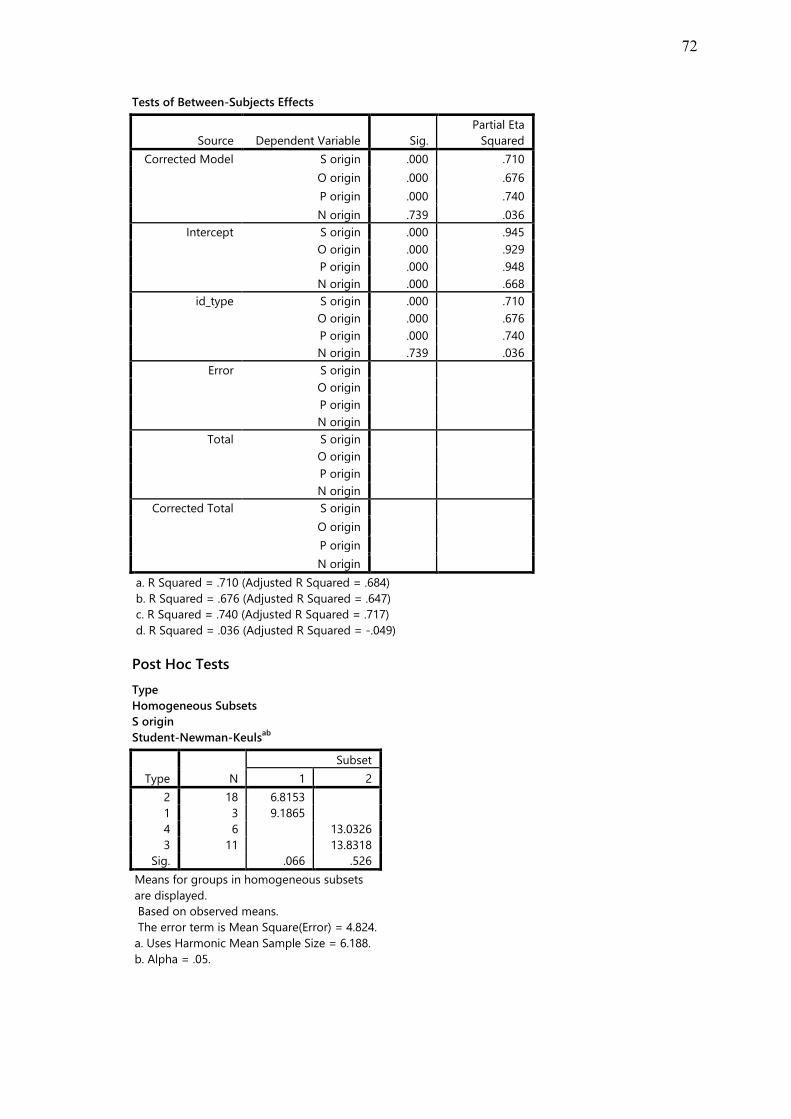
72
Tests of Between-Subjects Effects
Source Dependent Variable Sig.
Partial Eta
Squared
Corrected Model S origin .000 .710
O origin .000 .676
P origin .000 .740
N origin .739 .036
Intercept S origin .000 .945
O origin .000 .929
P origin .000 .948
N origin .000 .668
id_type S origin .000 .710
O origin .000 .676
P origin .000 .740
N origin .739 .036
Error S origin
O origin
P origin
N origin
Total S origin
O origin
P origin
N origin
Corrected Total S origin
O origin
P origin
N origin
a. R Squared = .710 (Adjusted R Squared = .684)
b. R Squared = .676 (Adjusted R Squared = .647)
c. R Squared = .740 (Adjusted R Squared = .717)
d. R Squared = .036 (Adjusted R Squared = -.049)
Post Hoc Tests
Type
Homogeneous Subsets
S origin
Student-Newman-Keulsab
Type N
Subset
1 2
2 18 6.8153
1 3 9.1865
4 6 13.0326
3 11 13.8318
Sig. .066 .526
Means for groups in homogeneous subsets
are displayed.
Based on observed means.
The error term is Mean Square(Error) = 4.824.
a. Uses Harmonic Mean Sample Size = 6.188.
b. Alpha = .05.
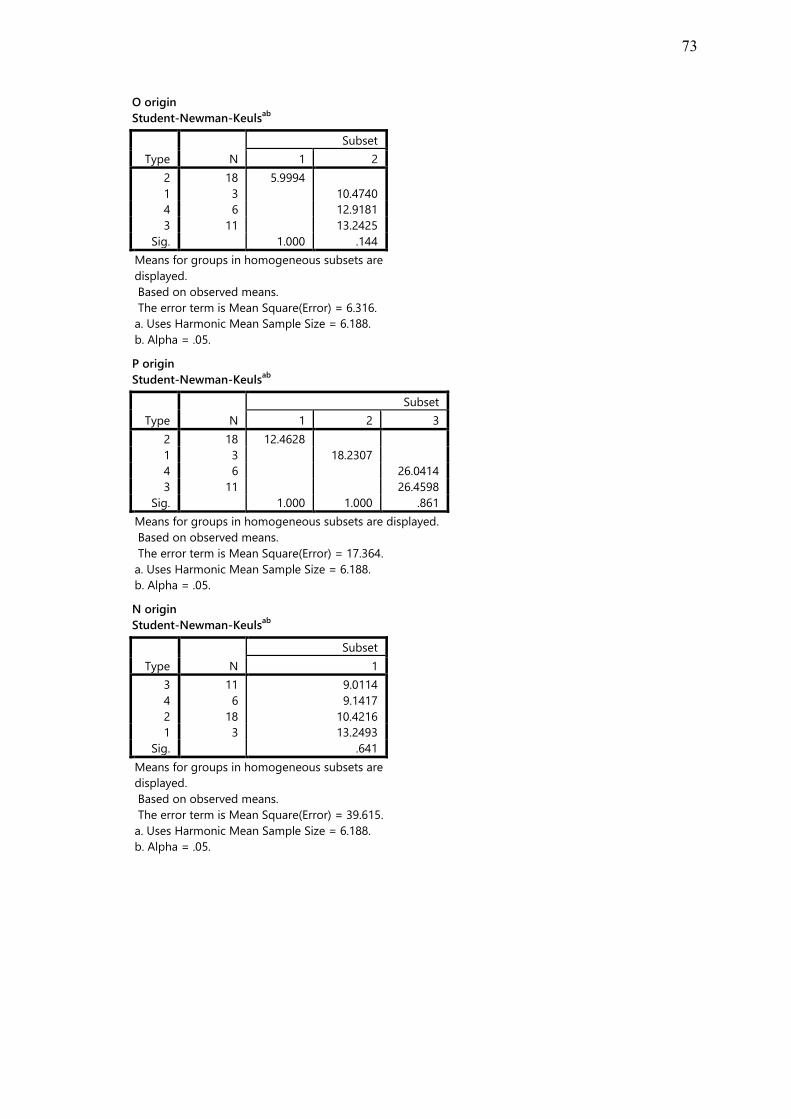
73
O origin
Student-Newman-Keulsab
Type N
Subset
1 2
2 18 5.9994
1 3 10.4740
4 6 12.9181
3 11 13.2425
Sig. 1.000 .144
Means for groups in homogeneous subsets are
displayed.
Based on observed means.
The error term is Mean Square(Error) = 6.316.
a. Uses Harmonic Mean Sample Size = 6.188.
b. Alpha = .05.
P origin
Student-Newman-Keulsab
Type N
Subset
1 2 3
2 18 12.4628
1 3 18.2307
4 6 26.0414
3 11 26.4598
Sig. 1.000 1.000 .861
Means for groups in homogeneous subsets are displayed.
Based on observed means.
The error term is Mean Square(Error) = 17.364.
a. Uses Harmonic Mean Sample Size = 6.188.
b. Alpha = .05.
N origin
Student-Newman-Keulsab
Type N
Subset
1
3 11 9.0114
4 6 9.1417
2 18 10.4216
1 3 13.2493
Sig. .641
Means for groups in homogeneous subsets are
displayed.
Based on observed means.
The error term is Mean Square(Error) = 39.615.
a. Uses Harmonic Mean Sample Size = 6.188.
b. Alpha = .05.
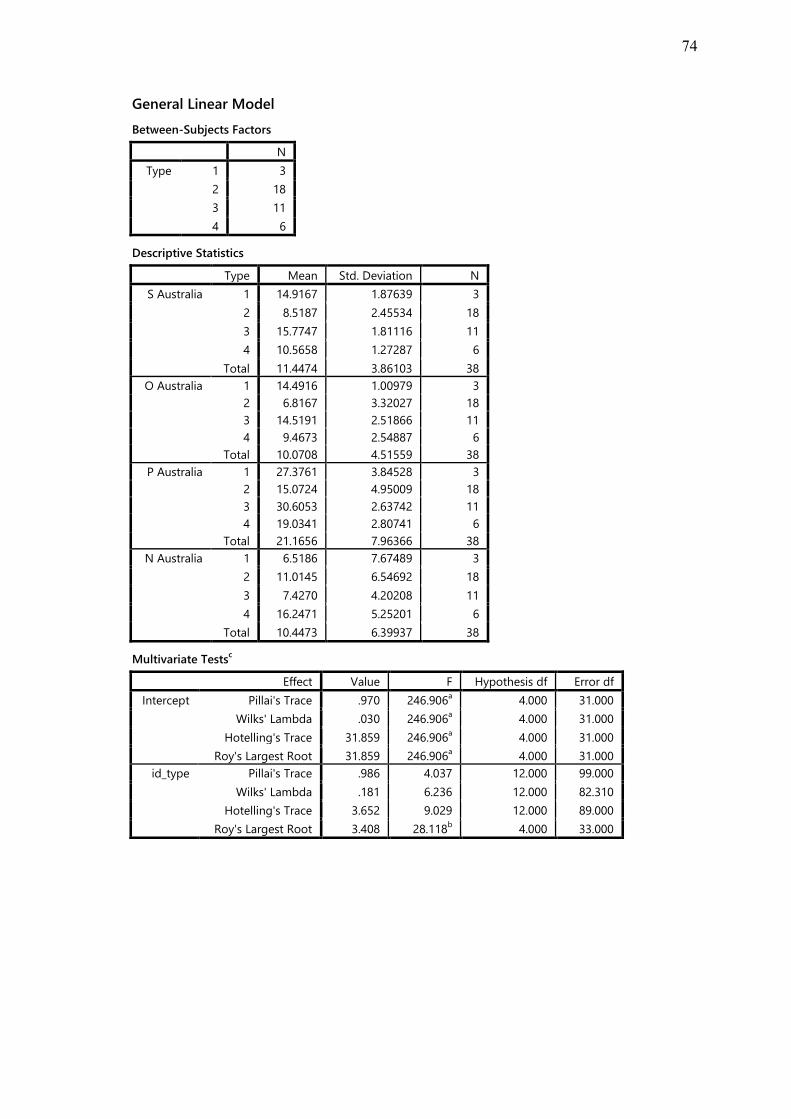
74
General Linear Model
Between-Subjects Factors
N
Type 1 3
2 18
3 11
4 6
Descriptive Statistics
Type Mean Std. Deviation N
S Australia 1 14.9167 1.87639 3
2 8.5187 2.45534 18
3 15.7747 1.81116 11
4 10.5658 1.27287 6
Total 11.4474 3.86103 38
O Australia 1 14.4916 1.00979 3
2 6.8167 3.32027 18
3 14.5191 2.51866 11
4 9.4673 2.54887 6
Total 10.0708 4.51559 38
P Australia 1 27.3761 3.84528 3
2 15.0724 4.95009 18
3 30.6053 2.63742 11
4 19.0341 2.80741 6
Total 21.1656 7.96366 38
N Australia 1 6.5186 7.67489 3
2 11.0145 6.54692 18
3 7.4270 4.20208 11
4 16.2471 5.25201 6
Total 10.4473 6.39937 38
Multivariate Testsc
Effect Value F Hypothesis df Error df
Intercept Pillai's Trace .970 246.906a 4.000 31.000
Wilks' Lambda .030 246.906a 4.000 31.000
Hotelling's Trace 31.859 246.906a 4.000 31.000
Roy's Largest Root 31.859 246.906a 4.000 31.000
id_type Pillai's Trace .986 4.037 12.000 99.000
Wilks' Lambda .181 6.236 12.000 82.310
Hotelling's Trace 3.652 9.029 12.000 89.000
Roy's Largest Root 3.408 28.118b 4.000 33.000
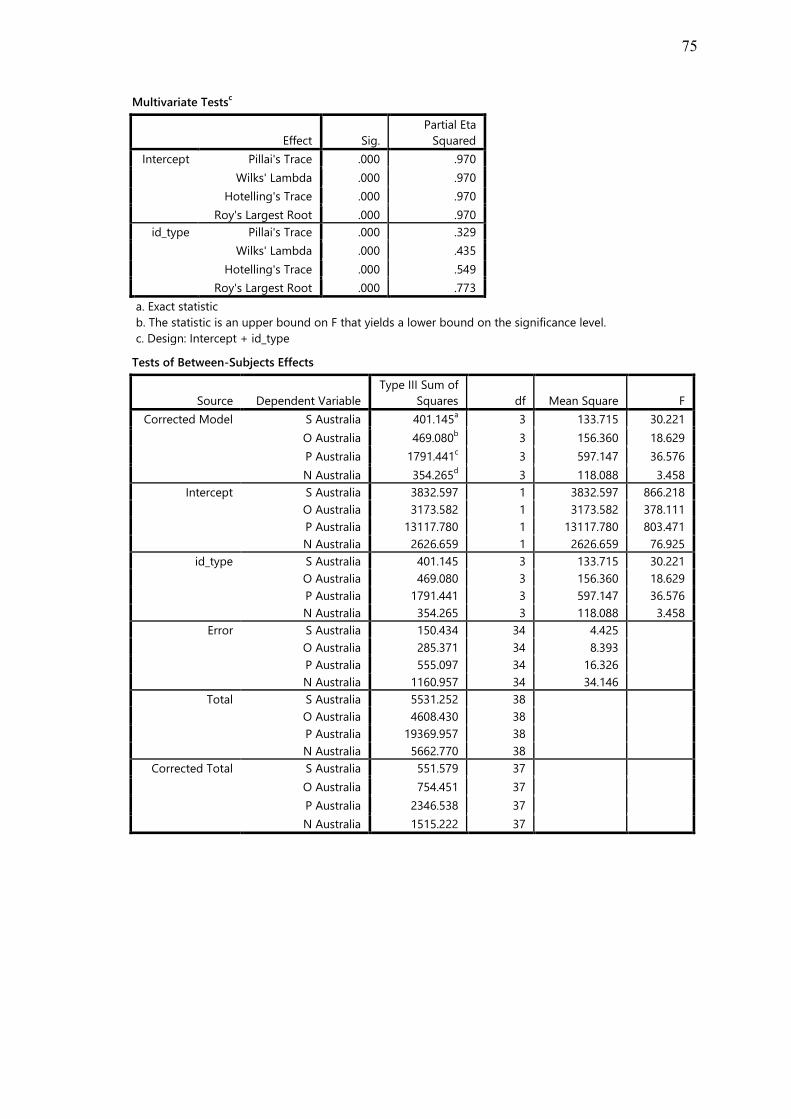
75
Multivariate Testsc
Effect Sig.
Partial Eta
Squared
Intercept Pillai's Trace .000 .970
Wilks' Lambda .000 .970
Hotelling's Trace .000 .970
Roy's Largest Root .000 .970
id_type Pillai's Trace .000 .329
Wilks' Lambda .000 .435
Hotelling's Trace .000 .549
Roy's Largest Root .000 .773
a. Exact statistic
b. The statistic is an upper bound on F that yields a lower bound on the significance level.
c. Design: Intercept + id_type
Tests of Between-Subjects Effects
Source Dependent Variable
Type III Sum of
Squares df Mean Square F
Corrected Model S Australia 401.145a 3 133.715 30.221
O Australia 469.080b 3 156.360 18.629
P Australia 1791.441c 3 597.147 36.576
N Australia 354.265d 3 118.088 3.458
Intercept S Australia 3832.597 1 3832.597 866.218
O Australia 3173.582 1 3173.582 378.111
P Australia 13117.780 1 13117.780 803.471
N Australia 2626.659 1 2626.659 76.925
id_type S Australia 401.145 3 133.715 30.221
O Australia 469.080 3 156.360 18.629
P Australia 1791.441 3 597.147 36.576
N Australia 354.265 3 118.088 3.458
Error S Australia 150.434 34 4.425
O Australia 285.371 34 8.393
P Australia 555.097 34 16.326
N Australia 1160.957 34 34.146
Total S Australia 5531.252 38
O Australia 4608.430 38
P Australia 19369.957 38
N Australia 5662.770 38
Corrected Total S Australia 551.579 37
O Australia 754.451 37
P Australia 2346.538 37
N Australia 1515.222 37

76
Tests of Between-Subjects Effects
Source Dependent Variable Sig.
Partial Eta
Squared
Corrected Model S Australia .000 .727
O Australia .000 .622
P Australia .000 .763
N Australia .027 .234
Intercept S Australia .000 .962
O Australia .000 .917
P Australia .000 .959
N Australia .000 .693
id_type S Australia .000 .727
O Australia .000 .622
P Australia .000 .763
N Australia .027 .234
Error S Australia
O Australia
P Australia
N Australia
Total S Australia
O Australia
P Australia
N Australia
Corrected Total S Australia
O Australia
P Australia
N Australia
a. R Squared = .727 (Adjusted R Squared = .703)
b. R Squared = .622 (Adjusted R Squared = .588)
c. R Squared = .763 (Adjusted R Squared = .743)
d. R Squared = .234 (Adjusted R Squared = .166)
Post Hoc Tests
Type
Homogeneous Subsets
S Australia
Student-Newman-Keulsab
Type N
Subset
1 2
2 18 8.5187
4 6 10.5658
1 3 14.9167
3 11 15.7747
Sig. .096 .478
Means for groups in homogeneous subsets are
displayed.
Based on observed means.
The error term is Mean Square(Error) = 4.425.
a. Uses Harmonic Mean Sample Size = 6.188.
b. Alpha = .05.

77
O Australia
Student-Newman-Keulsab
Type N
Subset
1 2
2 18 6.8167
4 6 9.4673
1 3 14.4916
3 11 14.5191
Sig. .117 .987
Means for groups in homogeneous subsets are
displayed.
Based on observed means.
The error term is Mean Square(Error) = 8.393.
a. Uses Harmonic Mean Sample Size = 6.188.
b. Alpha = .05.
P Australia
Student-Newman-Keulsab
Type N
Subset
1 2
2 18 15.0724
4 6 19.0341
1 3 27.3761
3 11 30.6053
Sig. .094 .169
Means for groups in homogeneous subsets are
displayed.
Based on observed means.
The error term is Mean Square(Error) = 16.326.
a. Uses Harmonic Mean Sample Size = 6.188.
b. Alpha = .05.
N Australia
Student-Newman-Keulsab
Type N
Subset
1 2
1 3 6.5186
3 11 7.4270
2 18 11.0145 11.0145
4 6 16.2471
Sig. .376 .125
Means for groups in homogeneous subsets are
displayed.
Based on observed means.
The error term is Mean Square(Error) = 34.146.
a. Uses Harmonic Mean Sample Size = 6.188.
b. Alpha = .05.
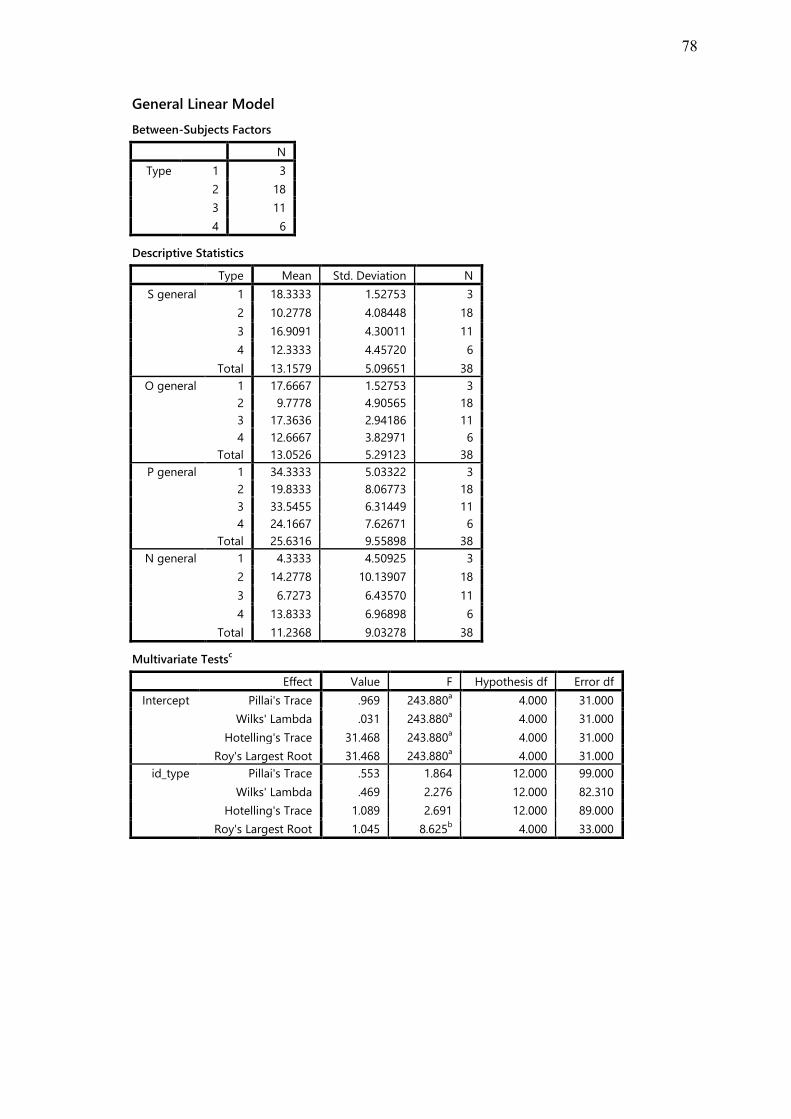
78
General Linear Model
Between-Subjects Factors
N
Type 1 3
2 18
3 11
4 6
Descriptive Statistics
Type Mean Std. Deviation N
S general 1 18.3333 1.52753 3
2 10.2778 4.08448 18
3 16.9091 4.30011 11
4 12.3333 4.45720 6
Total 13.1579 5.09651 38
O general 1 17.6667 1.52753 3
2 9.7778 4.90565 18
3 17.3636 2.94186 11
4 12.6667 3.82971 6
Total 13.0526 5.29123 38
P general 1 34.3333 5.03322 3
2 19.8333 8.06773 18
3 33.5455 6.31449 11
4 24.1667 7.62671 6
Total 25.6316 9.55898 38
N general 1 4.3333 4.50925 3
2 14.2778 10.13907 18
3 6.7273 6.43570 11
4 13.8333 6.96898 6
Total 11.2368 9.03278 38
Multivariate Testsc
Effect Value F Hypothesis df Error df
Intercept Pillai's Trace .969 243.880a 4.000 31.000
Wilks' Lambda .031 243.880a 4.000 31.000
Hotelling's Trace 31.468 243.880a 4.000 31.000
Roy's Largest Root 31.468 243.880a 4.000 31.000
id_type Pillai's Trace .553 1.864 12.000 99.000
Wilks' Lambda .469 2.276 12.000 82.310
Hotelling's Trace 1.089 2.691 12.000 89.000
Roy's Largest Root 1.045 8.625b 4.000 33.000
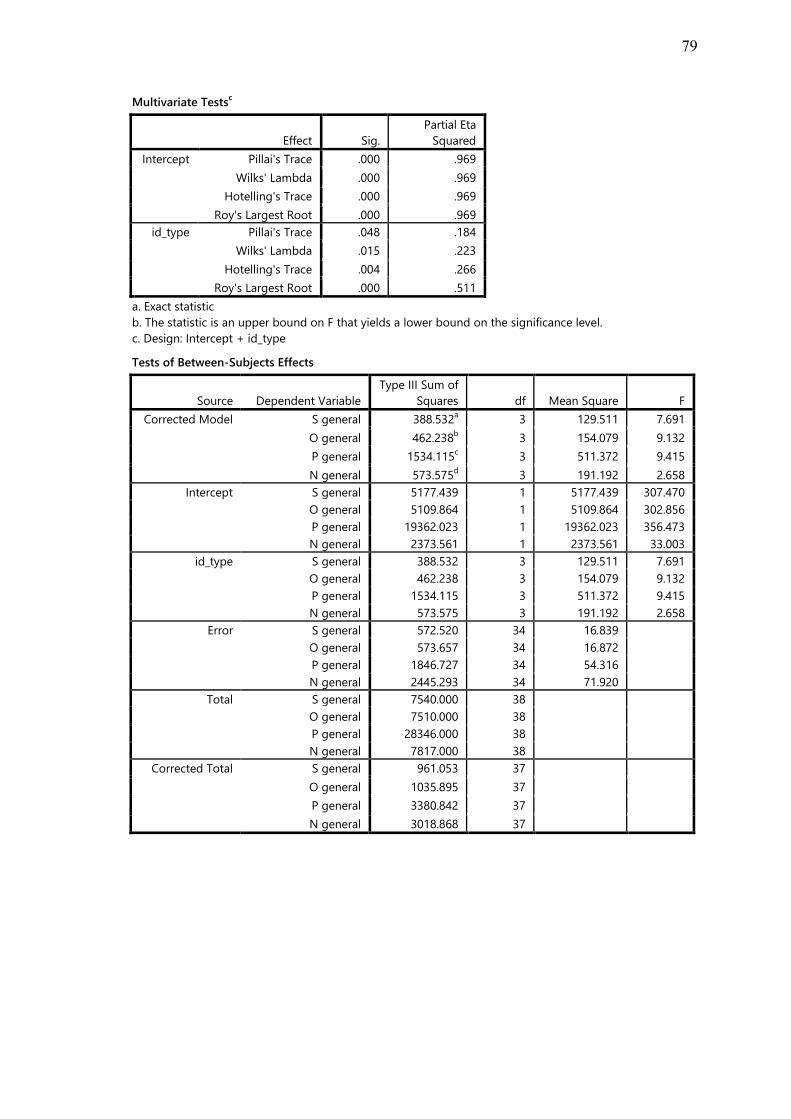
79
Multivariate Testsc
Effect Sig.
Partial Eta
Squared
Intercept Pillai's Trace .000 .969
Wilks' Lambda .000 .969
Hotelling's Trace .000 .969
Roy's Largest Root .000 .969
id_type Pillai's Trace .048 .184
Wilks' Lambda .015 .223
Hotelling's Trace .004 .266
Roy's Largest Root .000 .511
a. Exact statistic
b. The statistic is an upper bound on F that yields a lower bound on the significance level.
c. Design: Intercept + id_type
Tests of Between-Subjects Effects
Source Dependent Variable
Type III Sum of
Squares df Mean Square F
Corrected Model S general 388.532a 3 129.511 7.691
O general 462.238b 3 154.079 9.132
P general 1534.115c 3 511.372 9.415
N general 573.575d 3 191.192 2.658
Intercept S general 5177.439 1 5177.439 307.470
O general 5109.864 1 5109.864 302.856
P general 19362.023 1 19362.023 356.473
N general 2373.561 1 2373.561 33.003
id_type S general 388.532 3 129.511 7.691
O general 462.238 3 154.079 9.132
P general 1534.115 3 511.372 9.415
N general 573.575 3 191.192 2.658
Error S general 572.520 34 16.839
O general 573.657 34 16.872
P general 1846.727 34 54.316
N general 2445.293 34 71.920
Total S general 7540.000 38
O general 7510.000 38
P general 28346.000 38
N general 7817.000 38
Corrected Total S general 961.053 37
O general 1035.895 37
P general 3380.842 37
N general 3018.868 37

80
Tests of Between-Subjects Effects
Source Dependent Variable Sig.
Partial Eta
Squared
Corrected Model S general .000 .404
O general .000 .446
P general .000 .454
N general .064 .190
Intercept S general .000 .900
O general .000 .899
P general .000 .913
N general .000 .493
id_type S general .000 .404
O general .000 .446
P general .000 .454
N general .064 .190
Error S general
O general
P general
N general
Total S general
O general
P general
N general
Corrected Total S general
O general
P general
N general
a. R Squared = .404 (Adjusted R Squared = .352)
b. R Squared = .446 (Adjusted R Squared = .397)
c. R Squared = .454 (Adjusted R Squared = .406)
d. R Squared = .190 (Adjusted R Squared = .119)
Post Hoc Tests
Type
Homogeneous Subsets
S general
Student-Newman-Keulsab
Type N
Subset
1 2 3
2 18 10.2778
4 6 12.3333 12.3333
3 11 16.9091 16.9091
1 3 18.3333
Sig. .384 .058 .546
Means for groups in homogeneous subsets are displayed.
Based on observed means.
The error term is Mean Square(Error) = 16.839.
a. Uses Harmonic Mean Sample Size = 6.188.
b. Alpha = .05.
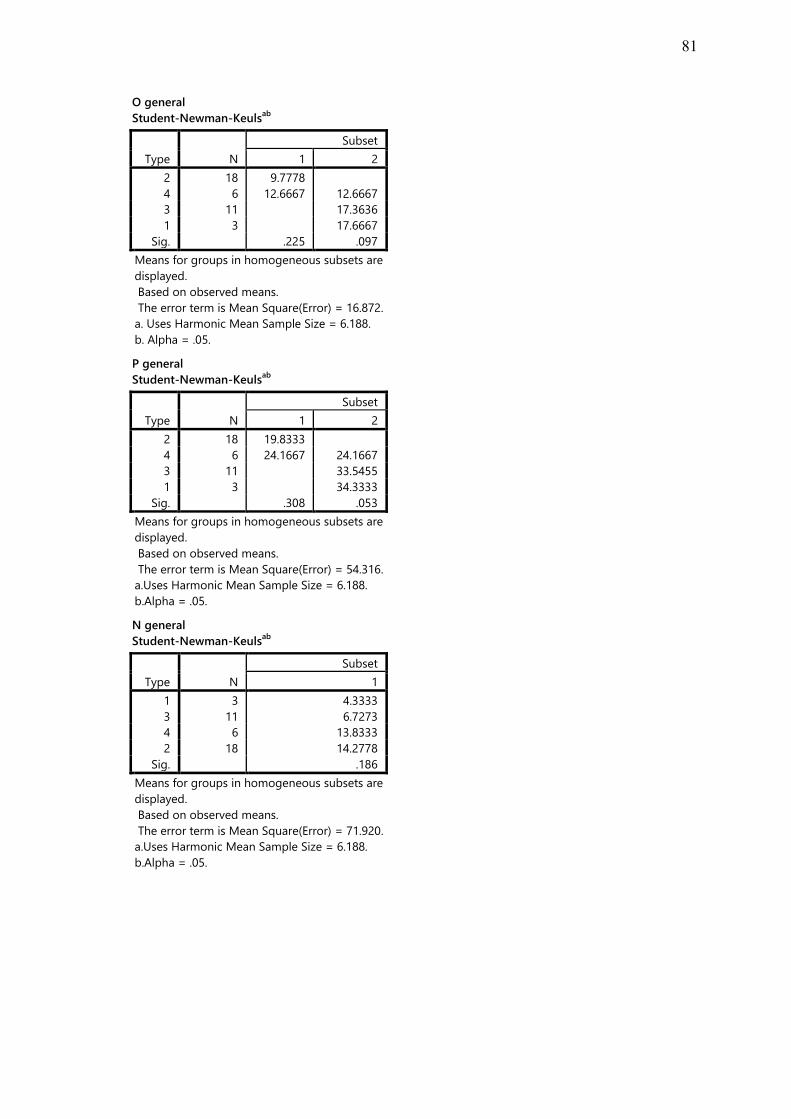
81
O general
Student-Newman-Keulsab
Type N
Subset
1 2
2 18 9.7778
4 6 12.6667 12.6667
3 11 17.3636
1 3 17.6667
Sig. .225 .097
Means for groups in homogeneous subsets are
displayed.
Based on observed means.
The error term is Mean Square(Error) = 16.872.
a. Uses Harmonic Mean Sample Size = 6.188.
b. Alpha = .05.
P general
Student-Newman-Keulsab
Type N
Subset
1 2
2 18 19.8333
4 6 24.1667 24.1667
3 11 33.5455
1 3 34.3333
Sig. .308 .053
Means for groups in homogeneous subsets are
displayed.
Based on observed means.
The error term is Mean Square(Error) = 54.316.
a.Uses Harmonic Mean Sample Size = 6.188.
b.Alpha = .05.
N general
Student-Newman-Keulsab
Type N
Subset
1
1 3 4.3333
3 11 6.7273
4 6 13.8333
2 18 14.2778
Sig. .186
Means for groups in homogeneous subsets are
displayed.
Based on observed means.
The error term is Mean Square(Error) = 71.920.
a.Uses Harmonic Mean Sample Size = 6.188.
b.Alpha = .05.
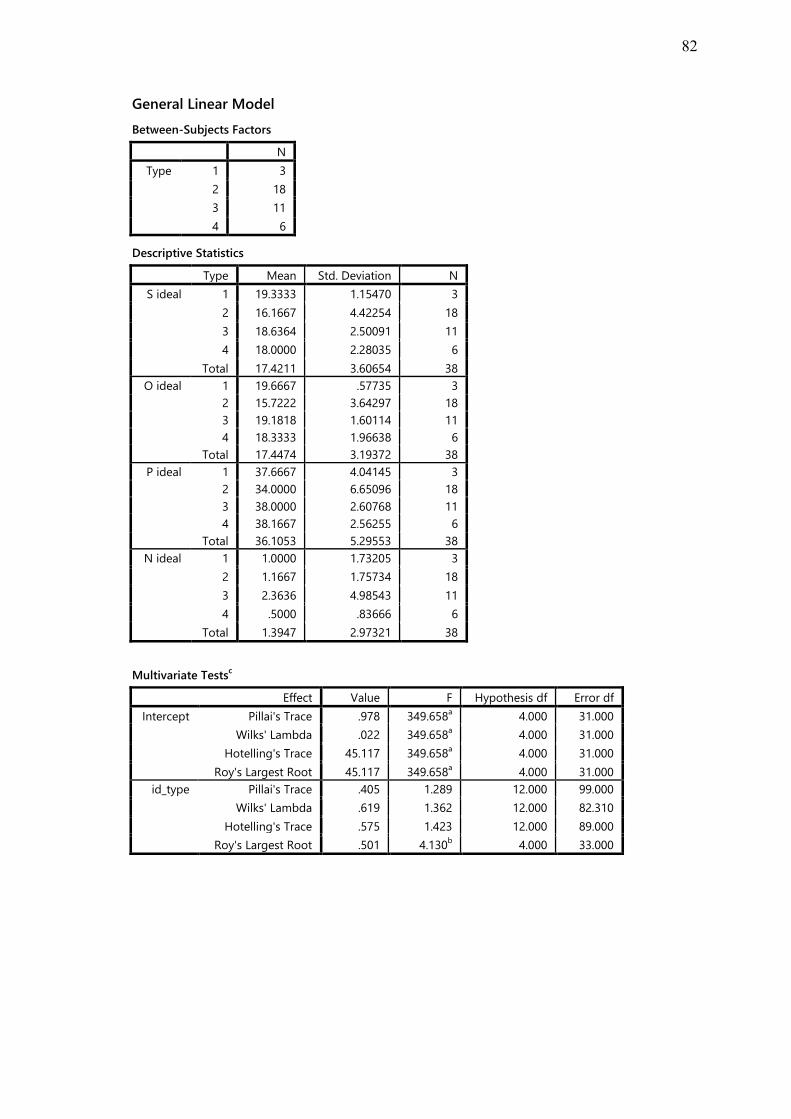
82
General Linear Model
Between-Subjects Factors
N
Type 1 3
2 18
3 11
4 6
Descriptive Statistics
Type Mean Std. Deviation N
S ideal 1 19.3333 1.15470 3
2 16.1667 4.42254 18
3 18.6364 2.50091 11
4 18.0000 2.28035 6
Total 17.4211 3.60654 38
O ideal 1 19.6667 .57735 3
2 15.7222 3.64297 18
3 19.1818 1.60114 11
4 18.3333 1.96638 6
Total 17.4474 3.19372 38
P ideal 1 37.6667 4.04145 3
2 34.0000 6.65096 18
3 38.0000 2.60768 11
4 38.1667 2.56255 6
Total 36.1053 5.29553 38
N ideal 1 1.0000 1.73205 3
2 1.1667 1.75734 18
3 2.3636 4.98543 11
4 .5000 .83666 6
Total 1.3947 2.97321 38
Multivariate Testsc
Effect Value F Hypothesis df Error df
Intercept Pillai's Trace .978 349.658a 4.000 31.000
Wilks' Lambda .022 349.658a 4.000 31.000
Hotelling's Trace 45.117 349.658a 4.000 31.000
Roy's Largest Root 45.117 349.658a 4.000 31.000
id_type Pillai's Trace .405 1.289 12.000 99.000
Wilks' Lambda .619 1.362 12.000 82.310
Hotelling's Trace .575 1.423 12.000 89.000
Roy's Largest Root .501 4.130b 4.000 33.000

83
Multivariate Testsc
Effect Sig.
Partial Eta
Squared
Intercept Pillai's Trace .000 .978
Wilks' Lambda .000 .978
Hotelling's Trace .000 .978
Roy's Largest Root .000 .978
id_type Pillai's Trace .237 .135
Wilks' Lambda .201 .148
Hotelling's Trace .171 .161
Roy's Largest Root .008 .334
a. Exact statistic
b. The statistic is an upper bound on F that yields a lower bound on the significance level.
c. Design: Intercept + id_type
Tests of Between-Subjects Effects
Source Dependent Variable
Type III Sum of
Squares df Mean Square F
Corrected Model S ideal 57.551a 3 19.184 1.539
O ideal 106.147b 3 35.382 4.435
P ideal 152.079c 3 50.693 1.946
N ideal 16.533d 3 5.511 .603
Intercept S ideal 8049.404 1 8049.404 645.910
O ideal 8221.639 1 8221.639 1030.556
P ideal 33806.480 1 33806.480 1298.047
N ideal 39.142 1 39.142 4.285
id_type S ideal 57.551 3 19.184 1.539
O ideal 106.147 3 35.382 4.435
P ideal 152.079 3 50.693 1.946
N ideal 16.533 3 5.511 .603
Error S ideal 423.712 34 12.462
O ideal 271.247 34 7.978
P ideal 885.500 34 26.044
N ideal 310.545 34 9.134
Total S ideal 12014.000 38
O ideal 11945.000 38
P ideal 50574.000 38
N ideal 401.000 38
Corrected Total S ideal 481.263 37
O ideal 377.395 37
P ideal 1037.579 37
N ideal 327.079 37
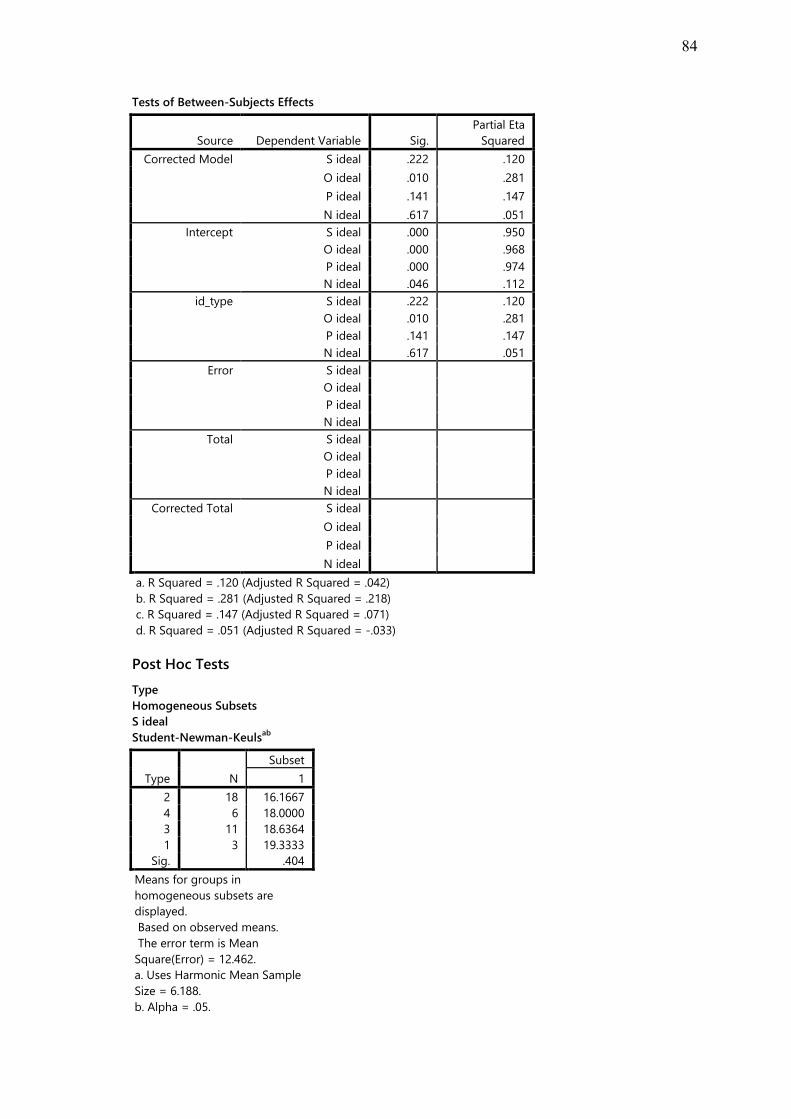
84
Tests of Between-Subjects Effects
Source Dependent Variable Sig.
Partial Eta
Squared
Corrected Model S ideal .222 .120
O ideal .010 .281
P ideal .141 .147
N ideal .617 .051
Intercept S ideal .000 .950
O ideal .000 .968
P ideal .000 .974
N ideal .046 .112
id_type S ideal .222 .120
O ideal .010 .281
P ideal .141 .147
N ideal .617 .051
Error S ideal
O ideal
P ideal
N ideal
Total S ideal
O ideal
P ideal
N ideal
Corrected Total S ideal
O ideal
P ideal
N ideal
a. R Squared = .120 (Adjusted R Squared = .042)
b. R Squared = .281 (Adjusted R Squared = .218)
c. R Squared = .147 (Adjusted R Squared = .071)
d. R Squared = .051 (Adjusted R Squared = -.033)
Post Hoc Tests
Type
Homogeneous Subsets
S ideal
Student-Newman-Keulsab
Type N
Subset
1
2 18 16.1667
4 6 18.0000
3 11 18.6364
1 3 19.3333
Sig. .404
Means for groups in
homogeneous subsets are
displayed.
Based on observed means.
The error term is Mean
Square(Error) = 12.462.
a. Uses Harmonic Mean Sample
Size = 6.188.
b. Alpha = .05.

85
O ideal
Student-Newman-Keulsab
Type N
Subset
1
2 18 15.7222
4 6 18.3333
3 11 19.1818
1 3 19.6667
Sig. .086
Means for groups in
homogeneous subsets are
displayed.
Based on observed means.
The error term is Mean
Square(Error) = 7.978.
a. Uses Harmonic Mean Sample
Size = 6.188.
b. Alpha = .05.
P ideal
Student-Newman-Keulsab
Type N
Subset
1
2 18 34.0000
1 3 37.6667
3 11 38.0000
4 6 38.1667
Sig. .486
Means for groups in
homogeneous subsets are
displayed.
Based on observed means.
The error term is Mean
Square(Error) = 26.044.
a. Uses Harmonic Mean Sample
Size = 6.188.
b. Alpha = .05.
N ideal
Student-Newman-Keulsab
Type N
Subset
1
4 6 .5000
1 3 1.0000
2 18 1.1667
3 11 2.3636
Sig. .701
Means for groups in
homogeneous subsets are
displayed.
Based on observed means.
The error term is Mean
Square(Error) = 9.134.
a. Uses Harmonic Mean Sample
Size = 6.188.
b. Alpha = .05.
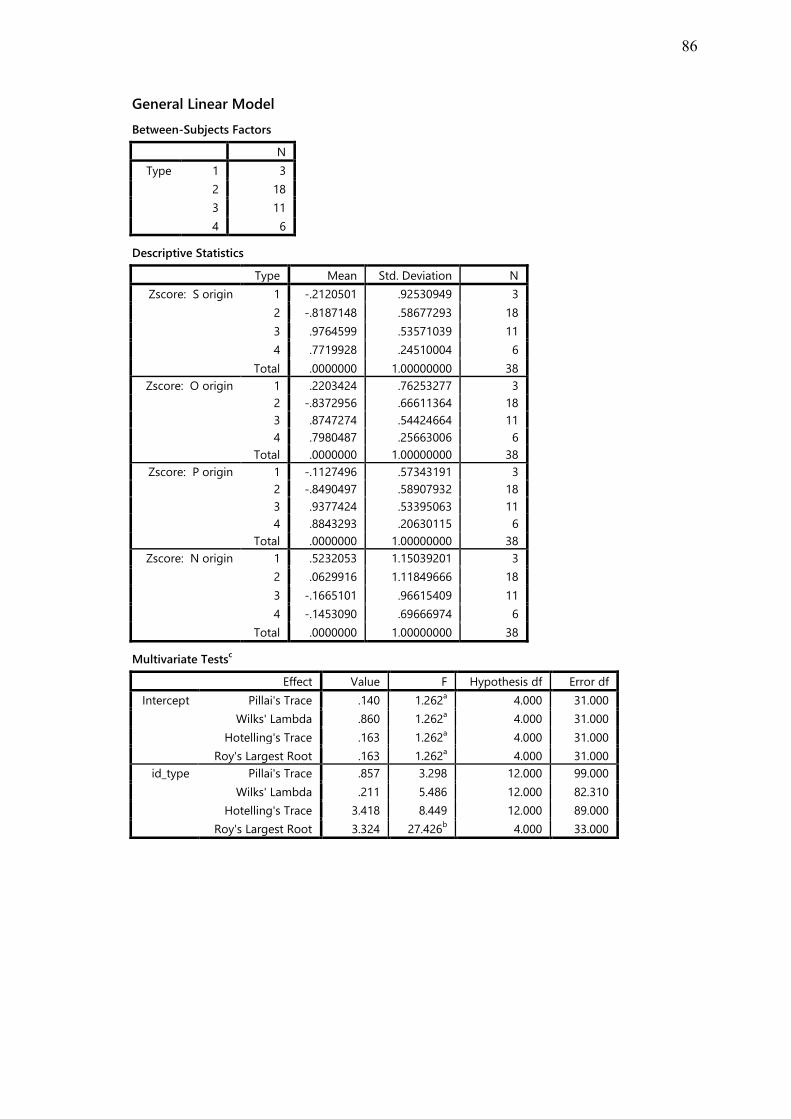
86
General Linear Model
Between-Subjects Factors
N
Type 1 3
2 18
3 11
4 6
Descriptive Statistics
Type Mean Std. Deviation N
Zscore: S origin 1 -.2120501 .92530949 3
2 -.8187148 .58677293 18
3 .9764599 .53571039 11
4 .7719928 .24510004 6
Total .0000000 1.00000000 38
Zscore: O origin 1 .2203424 .76253277 3
2 -.8372956 .66611364 18
3 .8747274 .54424664 11
4 .7980487 .25663006 6
Total .0000000 1.00000000 38
Zscore: P origin 1 -.1127496 .57343191 3
2 -.8490497 .58907932 18
3 .9377424 .53395063 11
4 .8843293 .20630115 6
Total .0000000 1.00000000 38
Zscore: N origin 1 .5232053 1.15039201 3
2 .0629916 1.11849666 18
3 -.1665101 .96615409 11
4 -.1453090 .69666974 6
Total .0000000 1.00000000 38
Multivariate Testsc
Effect Value F Hypothesis df Error df
Intercept Pillai's Trace .140 1.262a 4.000 31.000
Wilks' Lambda .860 1.262a 4.000 31.000
Hotelling's Trace .163 1.262a 4.000 31.000
Roy's Largest Root .163 1.262a 4.000 31.000
id_type Pillai's Trace .857 3.298 12.000 99.000
Wilks' Lambda .211 5.486 12.000 82.310
Hotelling's Trace 3.418 8.449 12.000 89.000
Roy's Largest Root 3.324 27.426b 4.000 33.000

87
Multivariate Testsc
Effect Sig.
Partial Eta
Squared
Intercept Pillai's Trace .306 .140
Wilks' Lambda .306 .140
Hotelling's Trace .306 .140
Roy's Largest Root .306 .140
id_type Pillai's Trace .000 .286
Wilks' Lambda .000 .404
Hotelling's Trace .000 .533
Roy's Largest Root .000 .769
a. Exact statistic
b. The statistic is an upper bound on F that yields a lower bound on the significance level.
c. Design: Intercept + id_type
Tests of Between-Subjects Effects
Source Dependent Variable
Type III Sum of
Squares df Mean Square F
Corrected Model Zscore: S origin 26.264a 3 8.755 27.726
Zscore: O origin 25.003b 3 8.334 23.619
Zscore: P origin 27.379c 3 9.126 32.253
Zscore: N origin 1.324d 3 .441 .421
Intercept Zscore: S origin .797 1 .797 2.523
Zscore: O origin 1.724 1 1.724 4.887
Zscore: P origin 1.145 1 1.145 4.046
Zscore: N origin .116 1 .116 .111
id_type Zscore: S origin 26.264 3 8.755 27.726
Zscore: O origin 25.003 3 8.334 23.619
Zscore: P origin 27.379 3 9.126 32.253
Zscore: N origin 1.324 3 .441 .421
Error Zscore: S origin 10.736 34 .316
Zscore: O origin 11.997 34 .353
Zscore: P origin 9.621 34 .283
Zscore: N origin 35.676 34 1.049
Total Zscore: S origin 37.000 38
Zscore: O origin 37.000 38
Zscore: P origin 37.000 38
Zscore: N origin 37.000 38
Corrected Total Zscore: S origin 37.000 37
Zscore: O origin 37.000 37
Zscore: P origin 37.000 37
Zscore: N origin 37.000 37
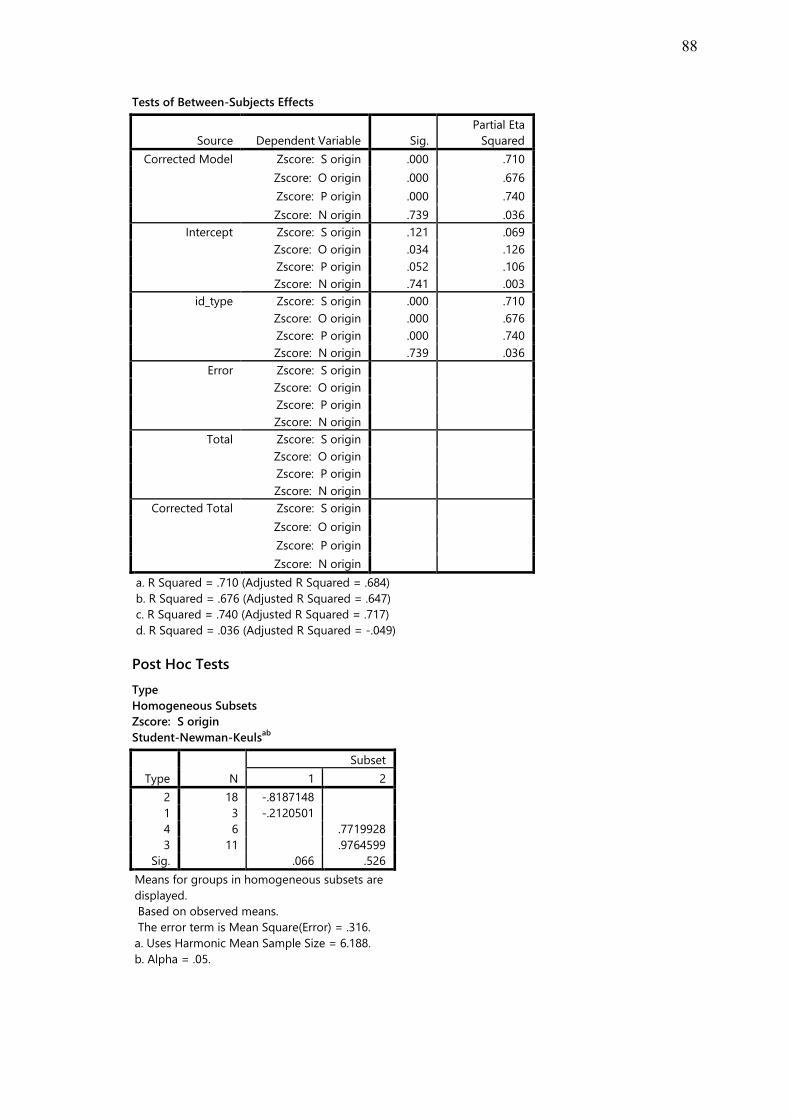
88
Tests of Between-Subjects Effects
Source Dependent Variable Sig.
Partial Eta
Squared
Corrected Model Zscore: S origin .000 .710
Zscore: O origin .000 .676
Zscore: P origin .000 .740
Zscore: N origin .739 .036
Intercept Zscore: S origin .121 .069
Zscore: O origin .034 .126
Zscore: P origin .052 .106
Zscore: N origin .741 .003
id_type Zscore: S origin .000 .710
Zscore: O origin .000 .676
Zscore: P origin .000 .740
Zscore: N origin .739 .036
Error Zscore: S origin
Zscore: O origin
Zscore: P origin
Zscore: N origin
Total Zscore: S origin
Zscore: O origin
Zscore: P origin
Zscore: N origin
Corrected Total Zscore: S origin
Zscore: O origin
Zscore: P origin
Zscore: N origin
a. R Squared = .710 (Adjusted R Squared = .684)
b. R Squared = .676 (Adjusted R Squared = .647)
c. R Squared = .740 (Adjusted R Squared = .717)
d. R Squared = .036 (Adjusted R Squared = -.049)
Post Hoc Tests
Type
Homogeneous Subsets
Zscore: S origin
Student-Newman-Keulsab
Type N
Subset
1 2
2 18 -.8187148
1 3 -.2120501
4 6 .7719928
3 11 .9764599
Sig. .066 .526
Means for groups in homogeneous subsets are
displayed.
Based on observed means.
The error term is Mean Square(Error) = .316.
a. Uses Harmonic Mean Sample Size = 6.188.
b. Alpha = .05.
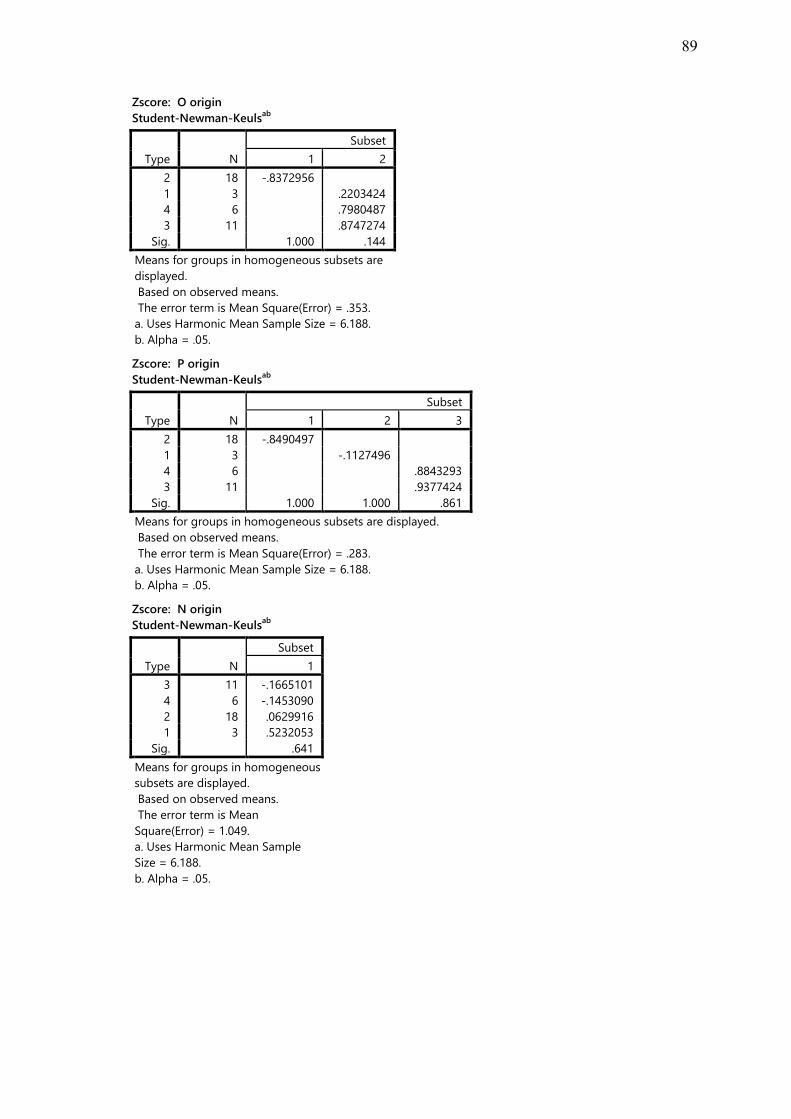
89
Zscore: O origin
Student-Newman-Keulsab
Type N
Subset
1 2
2 18 -.8372956
1 3 .2203424
4 6 .7980487
3 11 .8747274
Sig. 1.000 .144
Means for groups in homogeneous subsets are
displayed.
Based on observed means.
The error term is Mean Square(Error) = .353.
a. Uses Harmonic Mean Sample Size = 6.188.
b. Alpha = .05.
Zscore: P origin
Student-Newman-Keulsab
Type N
Subset
1 2 3
2 18 -.8490497
1 3 -.1127496
4 6 .8843293
3 11 .9377424
Sig. 1.000 1.000 .861
Means for groups in homogeneous subsets are displayed.
Based on observed means.
The error term is Mean Square(Error) = .283.
a. Uses Harmonic Mean Sample Size = 6.188.
b. Alpha = .05.
Zscore: N origin
Student-Newman-Keulsab
Type N
Subset
1
3 11 -.1665101
4 6 -.1453090
2 18 .0629916
1 3 .5232053
Sig. .641
Means for groups in homogeneous
subsets are displayed.
Based on observed means.
The error term is Mean
Square(Error) = 1.049.
a. Uses Harmonic Mean Sample
Size = 6.188.
b. Alpha = .05.
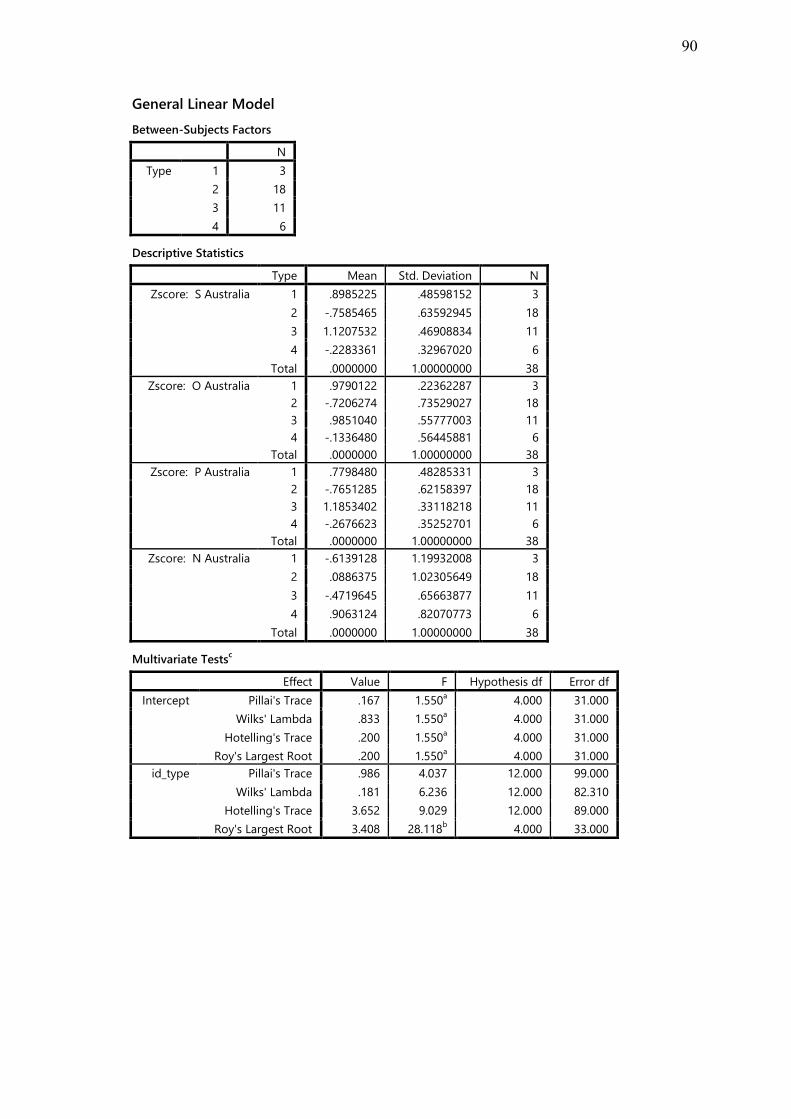
90
General Linear Model
Between-Subjects Factors
N
Type 1 3
2 18
3 11
4 6
Descriptive Statistics
Type Mean Std. Deviation N
Zscore: S Australia 1 .8985225 .48598152 3
2 -.7585465 .63592945 18
3 1.1207532 .46908834 11
4 -.2283361 .32967020 6
Total .0000000 1.00000000 38
Zscore: O Australia 1 .9790122 .22362287 3
2 -.7206274 .73529027 18
3 .9851040 .55777003 11
4 -.1336480 .56445881 6
Total .0000000 1.00000000 38
Zscore: P Australia 1 .7798480 .48285331 3
2 -.7651285 .62158397 18
3 1.1853402 .33118218 11
4 -.2676623 .35252701 6
Total .0000000 1.00000000 38
Zscore: N Australia 1 -.6139128 1.19932008 3
2 .0886375 1.02305649 18
3 -.4719645 .65663877 11
4 .9063124 .82070773 6
Total .0000000 1.00000000 38
Multivariate Testsc
Effect Value F Hypothesis df Error df
Intercept Pillai's Trace .167 1.550a 4.000 31.000
Wilks' Lambda .833 1.550a 4.000 31.000
Hotelling's Trace .200 1.550a 4.000 31.000
Roy's Largest Root .200 1.550a 4.000 31.000
id_type Pillai's Trace .986 4.037 12.000 99.000
Wilks' Lambda .181 6.236 12.000 82.310
Hotelling's Trace 3.652 9.029 12.000 89.000
Roy's Largest Root 3.408 28.118b 4.000 33.000
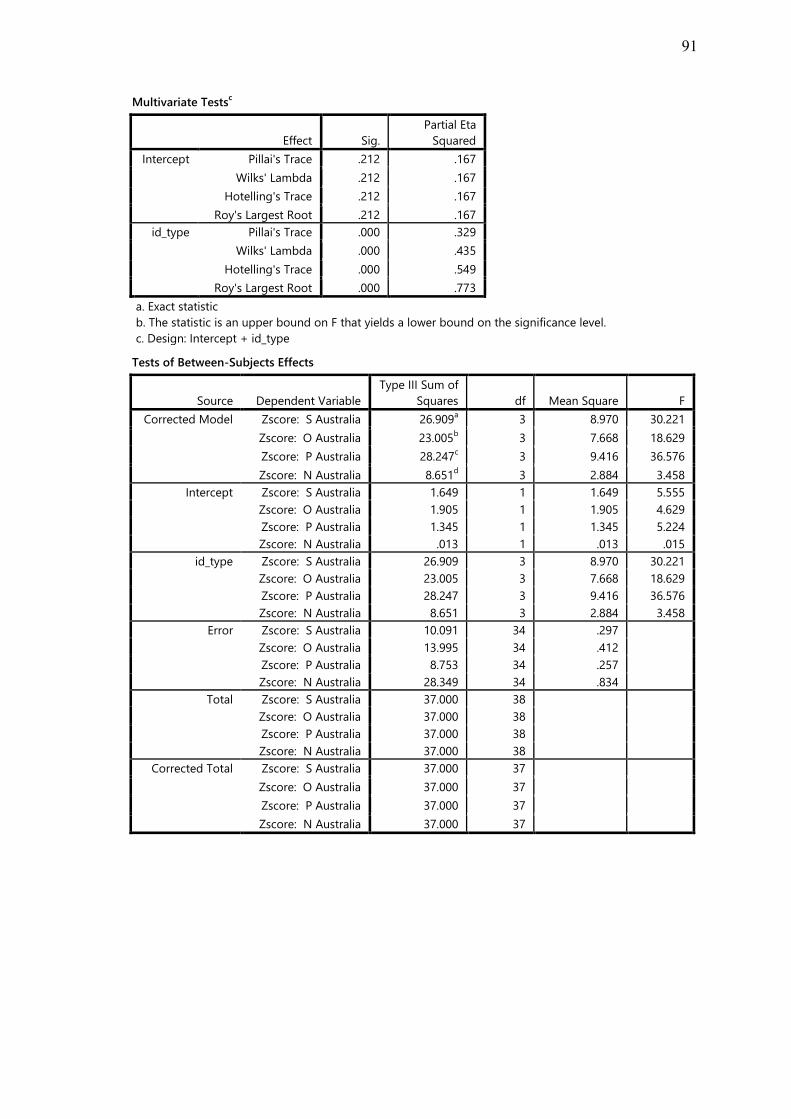
91
Multivariate Testsc
Effect Sig.
Partial Eta
Squared
Intercept Pillai's Trace .212 .167
Wilks' Lambda .212 .167
Hotelling's Trace .212 .167
Roy's Largest Root .212 .167
id_type Pillai's Trace .000 .329
Wilks' Lambda .000 .435
Hotelling's Trace .000 .549
Roy's Largest Root .000 .773
a. Exact statistic
b. The statistic is an upper bound on F that yields a lower bound on the significance level.
c. Design: Intercept + id_type
Tests of Between-Subjects Effects
Source Dependent Variable
Type III Sum of
Squares df Mean Square F
Corrected Model Zscore: S Australia 26.909a 3 8.970 30.221
Zscore: O Australia 23.005b 3 7.668 18.629
Zscore: P Australia 28.247c 3 9.416 36.576
Zscore: N Australia 8.651d 3 2.884 3.458
Intercept Zscore: S Australia 1.649 1 1.649 5.555
Zscore: O Australia 1.905 1 1.905 4.629
Zscore: P Australia 1.345 1 1.345 5.224
Zscore: N Australia .013 1 .013 .015
id_type Zscore: S Australia 26.909 3 8.970 30.221
Zscore: O Australia 23.005 3 7.668 18.629
Zscore: P Australia 28.247 3 9.416 36.576
Zscore: N Australia 8.651 3 2.884 3.458
Error Zscore: S Australia 10.091 34 .297
Zscore: O Australia 13.995 34 .412
Zscore: P Australia 8.753 34 .257
Zscore: N Australia 28.349 34 .834
Total Zscore: S Australia 37.000 38
Zscore: O Australia 37.000 38
Zscore: P Australia 37.000 38
Zscore: N Australia 37.000 38
Corrected Total Zscore: S Australia 37.000 37
Zscore: O Australia 37.000 37
Zscore: P Australia 37.000 37
Zscore: N Australia 37.000 37

92
Tests of Between-Subjects Effects
Source Dependent Variable Sig.
Partial Eta
Squared
Corrected Model Zscore: S Australia .000 .727
Zscore: O Australia .000 .622
Zscore: P Australia .000 .763
Zscore: N Australia .027 .234
Intercept Zscore: S Australia .024 .140
Zscore: O Australia .039 .120
Zscore: P Australia .029 .133
Zscore: N Australia .902 .000
id_type Zscore: S Australia .000 .727
Zscore: O Australia .000 .622
Zscore: P Australia .000 .763
Zscore: N Australia .027 .234
Error Zscore: S Australia
Zscore: O Australia
Zscore: P Australia
Zscore: N Australia
Total Zscore: S Australia
Zscore: O Australia
Zscore: P Australia
Zscore: N Australia
Corrected Total Zscore: S Australia
Zscore: O Australia
Zscore: P Australia
Zscore: N Australia
a. R Squared = .727 (Adjusted R Squared = .703)
b. R Squared = .622 (Adjusted R Squared = .588)
c. R Squared = .763 (Adjusted R Squared = .743)
d. R Squared = .234 (Adjusted R Squared = .166)
Post Hoc Tests
Type
Homogeneous Subsets
Zscore: S Australia
Student-Newman-Keulsab
Type N
Subset
1 2
2 18 -.7585465
4 6 -.2283361
1 3 .8985225
3 11 1.1207532
Sig. .096 .478
Means for groups in homogeneous subsets are
displayed.
Based on observed means.
The error term is Mean Square(Error) = .297.
a. Uses Harmonic Mean Sample Size = 6.188.
b. Alpha = .05.

93
Zscore: O Australia
Student-Newman-Keulsab
Type N
Subset
1 2
2 18 -.7206274
4 6 -.1336480
1 3 .9790122
3 11 .9851040
Sig. .117 .987
Means for groups in homogeneous subsets are
displayed.
Based on observed means.
The error term is Mean Square(Error) = .412.
a. Uses Harmonic Mean Sample Size = 6.188.
b. Alpha = .05.
Zscore: P Australia
Student-Newman-Keulsab
Type N
Subset
1 2
2 18 -.7651285
4 6 -.2676623
1 3 .7798480
3 11 1.1853402
Sig. .094 .169
Means for groups in homogeneous subsets are
displayed.
Based on observed means.
The error term is Mean Square(Error) = .257.
a. Uses Harmonic Mean Sample Size = 6.188.
b. Alpha = .05.
Zscore: N Australia
Student-Newman-Keulsab
Type N
Subset
1 2
1 3 -.6139128
3 11 -.4719645
2 18 .0886375 .0886375
4 6 .9063124
Sig. .376 .125
Means for groups in homogeneous subsets are
displayed.
Based on observed means.
The error term is Mean Square(Error) = .834.
a. Uses Harmonic Mean Sample Size = 6.188.
b. Alpha = .05.

94
General Linear Model
Between-Subjects Factors
N
Type 1 3
2 18
3 11
4 6
Descriptive Statistics
Type Mean Std. Deviation N
SADS 1 2.00 1.732 3
2 9.11 7.661 18
3 7.82 6.145 11
4 10.33 8.733 6
Total 8.37 7.205 38
FNES 1 10.00 10.149 3
2 15.72 10.448 18
3 8.45 6.393 11
4 16.33 9.331 6
Total 13.26 9.526 38
BDI2 1 11.33 9.074 3
2 10.61 11.653 18
3 4.91 4.742 11
4 10.83 7.333 6
Total 9.05 9.349 38
Multivariate Testsc
Effect Value F Hypothesis df Error df
Intercept Pillai's Trace .591 15.444a 3.000 32.000
Wilks' Lambda .409 15.444a 3.000 32.000
Hotelling's Trace 1.448 15.444a 3.000 32.000
Roy's Largest Root 1.448 15.444a 3.000 32.000
id_type Pillai's Trace .280 1.167 9.000 102.000
Wilks' Lambda .738 1.150 9.000 78.030
Hotelling's Trace .329 1.122 9.000 92.000
Roy's Largest Root .212 2.400b 3.000 34.000
Multivariate Testsc
Effect Sig.
Partial Eta
Squared
Intercept Pillai's Trace .000 .591
Wilks' Lambda .000 .591
Hotelling's Trace .000 .591
Roy's Largest Root .000 .591
id_type Pillai's Trace .324 .093
Wilks' Lambda .339 .096
Hotelling's Trace .355 .099
Roy's Largest Root .085 .175
a. Exact statistic
b. The statistic is an upper bound on F that yields a lower bound on the significance level.
c. Design: Intercept + id_type

95
Tests of Between-Subjects Effects
Source Dependent Variable
Type III Sum of
Squares df Mean Square F
Corrected Model SADS 158.095a 3 52.698 1.016
FNES 451.697b 3 150.566 1.762
BDI2 267.208c 3 89.069 1.021
Intercept SADS 1324.591 1 1324.591 25.549
FNES 3946.496 1 3946.496 46.179
BDI2 2197.027 1 2197.027 25.179
id_type SADS 158.095 3 52.698 1.016
FNES 451.697 3 150.566 1.762
BDI2 267.208 3 89.069 1.021
Error SADS 1762.747 34 51.846
FNES 2905.672 34 85.461
BDI2 2966.687 34 87.255
Total SADS 4582.000 38
FNES 10042.000 38
BDI2 6348.000 38
Corrected Total SADS 1920.842 37
FNES 3357.368 37
BDI2 3233.895 37
Tests of Between-Subjects Effects
Source Dependent Variable Sig.
Partial Eta
Squared
Corrected Model SADS .397 .082
FNES .173 .135
BDI2 .396 .083
Intercept SADS .000 .429
FNES .000 .576
BDI2 .000 .425
id_type SADS .397 .082
FNES .173 .135
BDI2 .396 .083
Error SADS
FNES
BDI2
Total SADS
FNES
BDI2
Corrected Total SADS
FNES
BDI2
a. R Squared = .082 (Adjusted R Squared = .001)
b. R Squared = .135 (Adjusted R Squared = .058)
c. R Squared = .083 (Adjusted R Squared = .002)
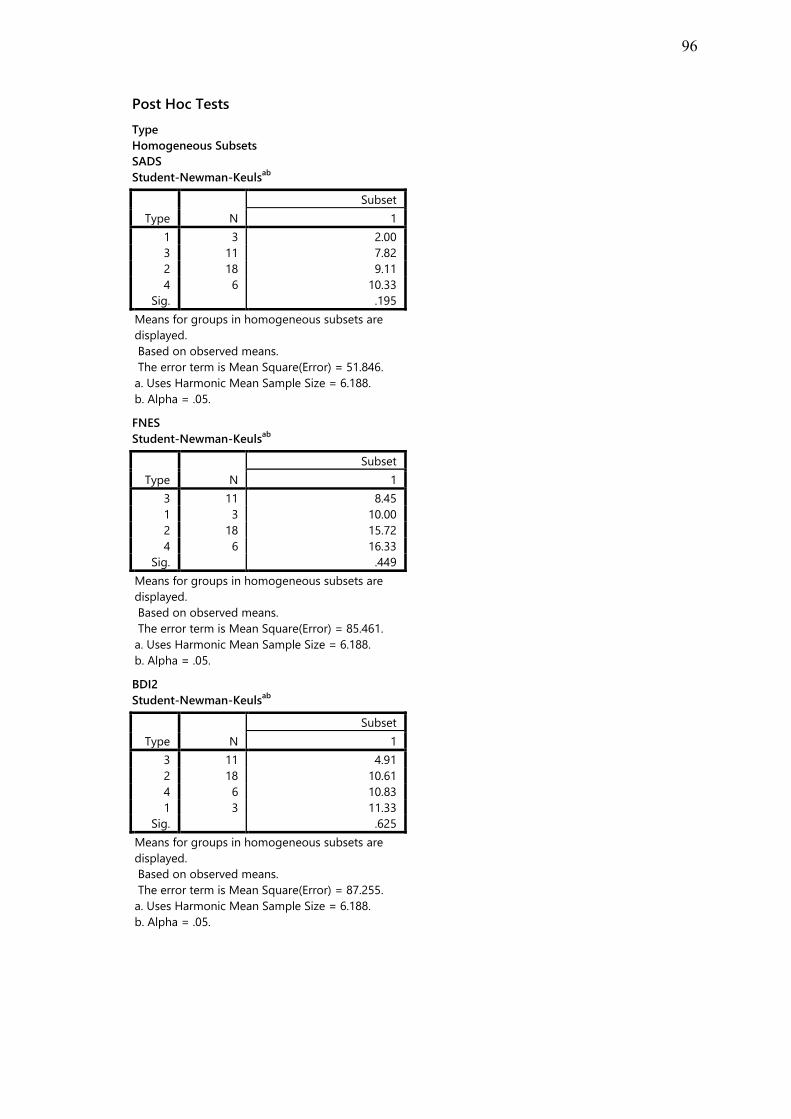
96
Post Hoc Tests
Type
Homogeneous Subsets
SADS
Student-Newman-Keulsab
Type N
Subset
1
1 3 2.00
3 11 7.82
2 18 9.11
4 6 10.33
Sig. .195
Means for groups in homogeneous subsets are
displayed.
Based on observed means.
The error term is Mean Square(Error) = 51.846.
a. Uses Harmonic Mean Sample Size = 6.188.
b. Alpha = .05.
FNES
Student-Newman-Keulsab
Type N
Subset
1
3 11 8.45
1 3 10.00
2 18 15.72
4 6 16.33
Sig. .449
Means for groups in homogeneous subsets are
displayed.
Based on observed means.
The error term is Mean Square(Error) = 85.461.
a. Uses Harmonic Mean Sample Size = 6.188.
b. Alpha = .05.
BDI2
Student-Newman-Keulsab
Type N
Subset
1
3 11 4.91
2 18 10.61
4 6 10.83
1 3 11.33
Sig. .625
Means for groups in homogeneous subsets are
displayed.
Based on observed means.
The error term is Mean Square(Error) = 87.255.
a. Uses Harmonic Mean Sample Size = 6.188.
b. Alpha = .05.

97
General Linear Model
Between-Subjects Factors
N
Type 1 3
2 18
3 11
4 6
Descriptive Statistics
Type Mean Std. Deviation N
PWS1 1 60.00 8.660 3
2 59.44 13.263 18
3 71.00 10.714 11
4 61.17 5.492 6
Total 63.11 12.100 38
PWS2 1 75.00 7.000 3
2 63.94 12.317 18
3 75.00 8.922 11
4 57.83 8.472 6
Total 67.05 12.081 38
PWS3 1 64.33 9.504 3
2 59.50 12.655 18
3 70.73 10.479 11
4 61.00 8.050 6
Total 63.37 11.886 38
PWS4 1 76.33 4.163 3
2 70.89 9.003 18
3 76.18 6.911 11
4 69.67 6.439 6
Total 72.66 8.028 38
PWS5 1 63.67 7.638 3
2 62.33 11.596 18
3 73.09 9.115 11
4 65.83 7.139 6
Total 66.11 10.780 38
PWS6 1 62.33 10.970 3
2 62.17 12.678 18
3 71.45 12.469 11
4 60.17 9.109 6
Total 64.55 12.411 38
Multivariate Testsc
Effect Value F Hypothesis df Error df
Intercept Pillai's Trace .986 352.240a 6.000 29.000
Wilks' Lambda .014 352.240a 6.000 29.000
Hotelling's Trace 72.877 352.240a 6.000 29.000
Roy's Largest Root 72.877 352.240a 6.000 29.000
id_type Pillai's Trace .759 1.750 18.000 93.000
Wilks' Lambda .398 1.768 18.000 82.510
Hotelling's Trace 1.142 1.756 18.000 83.000
Roy's Largest Root .647 3.344b 6.000 31.000
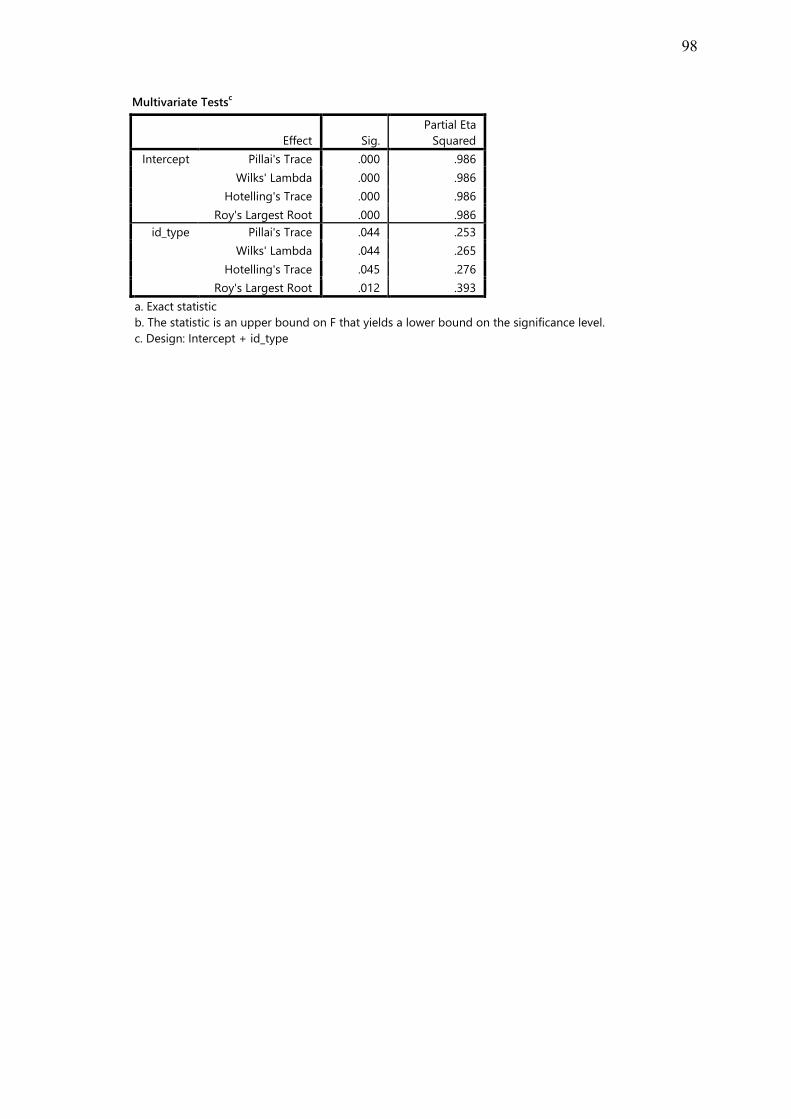
98
Multivariate Testsc
Effect Sig.
Partial Eta
Squared
Intercept Pillai's Trace .000 .986
Wilks' Lambda .000 .986
Hotelling's Trace .000 .986
Roy's Largest Root .000 .986
id_type Pillai's Trace .044 .253
Wilks' Lambda .044 .265
Hotelling's Trace .045 .276
Roy's Largest Root .012 .393
a. Exact statistic
b. The statistic is an upper bound on F that yields a lower bound on the significance level.
c. Design: Intercept + id_type

99
Tests of Between-Subjects Effects
Source Dependent Variable
Type III Sum of
Squares df Mean Square F
Corrected Model PWS1 978.301a 3 326.100 2.498
PWS2 1568.117b 3 522.706 4.638
PWS3 901.494c 3 300.498 2.362
PWS4 287.138d 3 95.713 1.552
PWS5 811.170e 3 270.390 2.635
PWS6 756.667f 3 252.222 1.735
Intercept PWS1 97929.796 1 97929.796 750.035
PWS2 114257.076 1 114257.076 1013.822
PWS3 101028.299 1 101028.299 794.147
PWS4 132861.773 1 132861.773 2153.747
PWS5 108567.196 1 108567.196 1058.157
PWS6 101472.023 1 101472.023 698.005
id_type PWS1 978.301 3 326.100 2.498
PWS2 1568.117 3 522.706 4.638
PWS3 901.494 3 300.498 2.362
PWS4 287.138 3 95.713 1.552
PWS5 811.170 3 270.390 2.635
PWS6 756.667 3 252.222 1.735
Error PWS1 4439.278 34 130.567
PWS2 3831.778 34 112.699
PWS3 4325.348 34 127.216
PWS4 2097.414 34 61.689
PWS5 3488.409 34 102.600
PWS6 4942.727 34 145.374
Total PWS1 156744.000 38
PWS2 176250.000 38
PWS3 157818.000 38
PWS4 202993.000 38
PWS5 170356.000 38
PWS6 164047.000 38
Corrected Total PWS1 5417.579 37
PWS2 5399.895 37
PWS3 5226.842 37
PWS4 2384.553 37
PWS5 4299.579 37
PWS6 5699.395 37
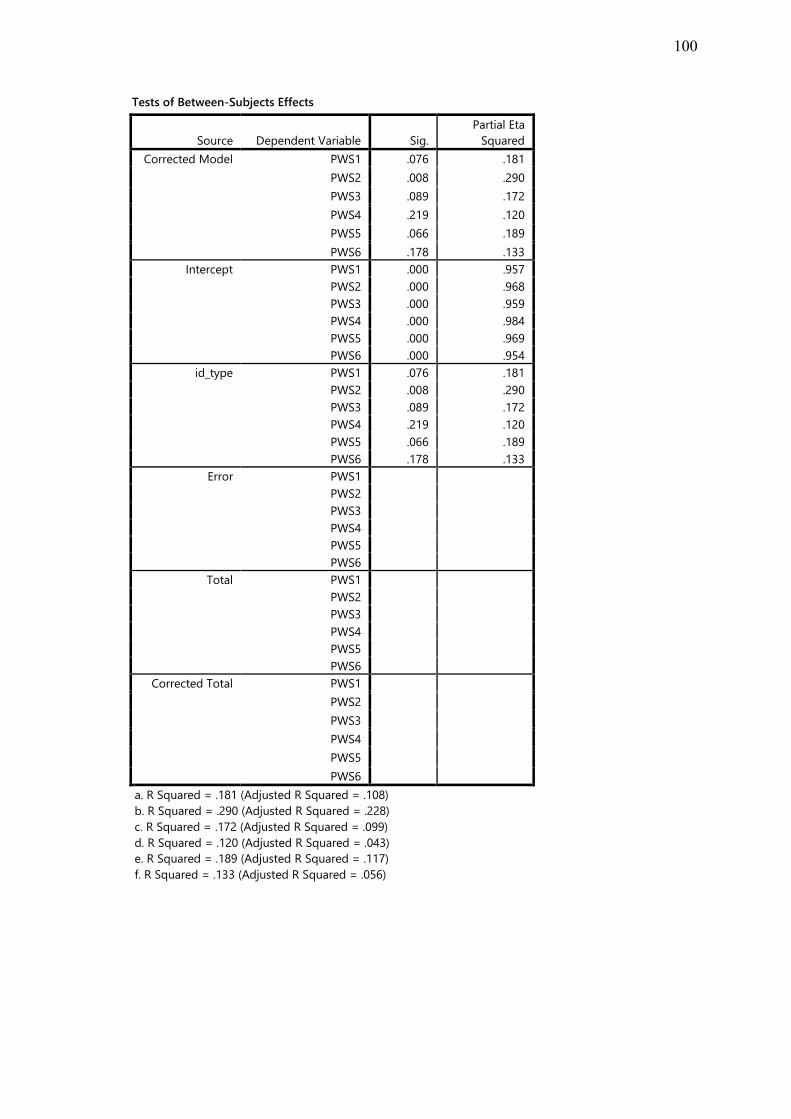
100
Tests of Between-Subjects Effects
Source Dependent Variable Sig.
Partial Eta
Squared
Corrected Model PWS1 .076 .181
PWS2 .008 .290
PWS3 .089 .172
PWS4 .219 .120
PWS5 .066 .189
PWS6 .178 .133
Intercept PWS1 .000 .957
PWS2 .000 .968
PWS3 .000 .959
PWS4 .000 .984
PWS5 .000 .969
PWS6 .000 .954
id_type PWS1 .076 .181
PWS2 .008 .290
PWS3 .089 .172
PWS4 .219 .120
PWS5 .066 .189
PWS6 .178 .133
Error PWS1
PWS2
PWS3
PWS4
PWS5
PWS6
Total PWS1
PWS2
PWS3
PWS4
PWS5
PWS6
Corrected Total PWS1
PWS2
PWS3
PWS4
PWS5
PWS6
a. R Squared = .181 (Adjusted R Squared = .108)
b. R Squared = .290 (Adjusted R Squared = .228)
c. R Squared = .172 (Adjusted R Squared = .099)
d. R Squared = .120 (Adjusted R Squared = .043)
e. R Squared = .189 (Adjusted R Squared = .117)
f. R Squared = .133 (Adjusted R Squared = .056)

101
Post Hoc Tests
Type
Homogeneous Subsets
PWS1
Student-Newman-Keulsab
Type N
Subset
1
2 18 59.44
1 3 60.00
4 6 61.17
3 11 71.00
Sig. .301
Means for groups in homogeneous subsets are
displayed.
Based on observed means.
The error term is Mean Square(Error) = 130.567.
a. Uses Harmonic Mean Sample Size = 6.188.
b. Alpha = .05.
PWS2
Student-Newman-Keulsab
Type N
Subset
1 2
4 6 57.83
2 18 63.94 63.94
1 3 75.00
3 11 75.00
Sig. .318 .175
Means for groups in homogeneous subsets are
displayed.
Based on observed means.
The error term is Mean Square(Error) = 112.699.
a. Uses Harmonic Mean Sample Size = 6.188.
b. Alpha = .05.
PWS3
Student-Newman-Keulsab
Type N
Subset
1
2 18 59.50
4 6 61.00
1 3 64.33
3 11 70.73
Sig. .314
Means for groups in homogeneous subsets are
displayed.
Based on observed means.
The error term is Mean Square(Error) = 127.216.
a. Uses Harmonic Mean Sample Size = 6.188.
b. Alpha = .05.
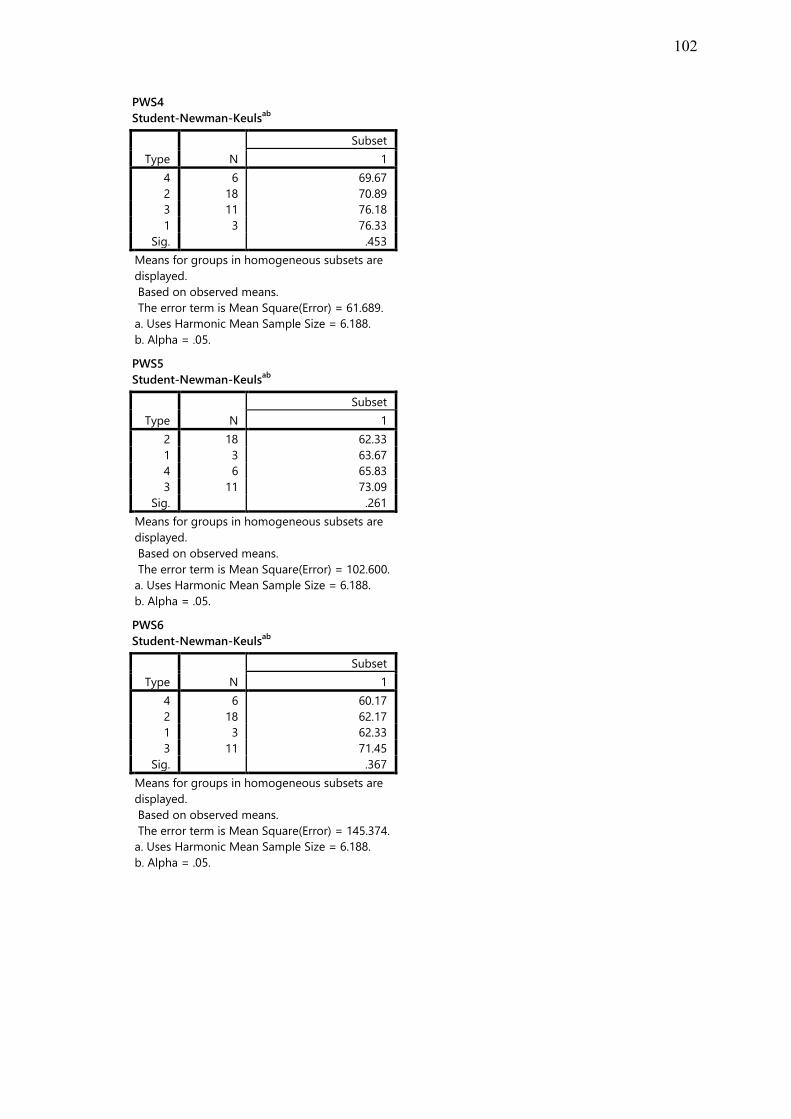
102
PWS4
Student-Newman-Keulsab
Type N
Subset
1
4 6 69.67
2 18 70.89
3 11 76.18
1 3 76.33
Sig. .453
Means for groups in homogeneous subsets are
displayed.
Based on observed means.
The error term is Mean Square(Error) = 61.689.
a. Uses Harmonic Mean Sample Size = 6.188.
b. Alpha = .05.
PWS5
Student-Newman-Keulsab
Type N
Subset
1
2 18 62.33
1 3 63.67
4 6 65.83
3 11 73.09
Sig. .261
Means for groups in homogeneous subsets are
displayed.
Based on observed means.
The error term is Mean Square(Error) = 102.600.
a. Uses Harmonic Mean Sample Size = 6.188.
b. Alpha = .05.
PWS6
Student-Newman-Keulsab
Type N
Subset
1
4 6 60.17
2 18 62.17
1 3 62.33
3 11 71.45
Sig. .367
Means for groups in homogeneous subsets are
displayed.
Based on observed means.
The error term is Mean Square(Error) = 145.374.
a. Uses Harmonic Mean Sample Size = 6.188.
b. Alpha = .05.

103
APPENDIX C
STATISTICAL ANALYSIS FOR STUDY 2
Variables in the dataset
Variable name Description
Descriptors id Unique identification number of valuation
name Name of participant to which valuation relates
type Type of participant to which valuation relates
location 1 I-position to which valuation relates
period 2 Period to which valuation relates
Affect scores aff01..24 Mean affect scores for 24 affects
Self-confrontation
indices 3
indexS Self-enhancement index indexO Union-with-the-other index
indexP Positive affect index
indexN Negative affect index
Correlation coefficients corrgen Correlation with General feeling affect scores
corride Correlation with Ideal feeling affect scores
Valuation details story Text of valuation
mandala Theme of valuation
Notes
1 Coded as: O = pertaining to I-position in country of origin; A = pertaining to I-position in
Australia; G = pertaining to general feeling; I = pertaining to ideal feeling.
2 Coded as: 1 = pertaining to the past; 2 = pertaining to the present; 3 = pertaining to the
future.
3 Computed from affect scores.

104
C.1 Analysis of Valuations by Theme
Cross-tabulations of valuations by theme, location and participant type.
Crosstabs
Case Processing Summary
Cases
Valid Missing Total
N Percent N Percent N Percent
Location * Mandala * Type 570 100.0% 0 .0% 570 100.0%

105
Location * Mandala * Type Crosstabulation
Type
Mandala
+HH +O +S -LL -O
1 Location A Count 11 0 5 1 0
Expected Count 7.0 1.6 3.3 3.3 2.5
% within Location 61.1% .0% 27.8% 5.6% .0%
% within Mandala 64.7% .0% 62.5% 12.5% .0%
O Count 6 4 3 7 6
Expected Count 10.0 2.4 4.7 4.7 3.5
% within Location 23.1% 15.4% 11.5% 26.9% 23.1%
% within Mandala 35.3% 100.0% 37.5% 87.5% 100.0%
Total Count 17 4 8 8 6
Expected Count 17.0 4.0 8.0 8.0 6.0
% within Location 38.6% 9.1% 18.2% 18.2% 13.6%
% within Mandala 100.0% 100.0% 100.0% 100.0% 100.0%
2 Location A Count 9 8 48 39 5
Expected Count 5.6 13.9 43.8 39.9 8.7
% within Location 7.7% 6.8% 41.0% 33.3% 4.3%
% within Mandala 69.2% 25.0% 47.5% 42.4% 25.0%
O Count 4 24 53 53 15
Expected Count 7.4 18.1 57.2 52.1 11.3
% within Location 2.6% 15.7% 34.6% 34.6% 9.8%
% within Mandala 30.8% 75.0% 52.5% 57.6% 75.0%
Total Count 13 32 101 92 20
Expected Count 13.0 32.0 101.0 92.0 20.0
% within Location 4.8% 11.9% 37.4% 34.1% 7.4%
% within Mandala 100.0% 100.0% 100.0% 100.0% 100.0%
3 Location A Count 40 3 17 2 1
Expected Count 34.3 3.7 16.8 4.5 3.0
% within Location 63.5% 4.8% 27.0% 3.2% 1.6%
% within Mandala 43.5% 30.0% 37.8% 16.7% 12.5%
O Count 52 7 28 10 7
Expected Count 57.7 6.3 28.2 7.5 5.0
% within Location 49.1% 6.6% 26.4% 9.4% 6.6%
% within Mandala 56.5% 70.0% 62.2% 83.3% 87.5%
Total Count 92 10 45 12 8
Expected Count 92.0 10.0 45.0 12.0 8.0
% within Location 54.4% 5.9% 26.6% 7.1% 4.7%
% within Mandala 100.0% 100.0% 100.0% 100.0% 100.0%
4 Location A Count 4 1 10 8 5
Expected Count 12.6 2.2 8.1 7.6 3.6
% within Location 10.3% 2.6% 25.6% 20.5% 12.8%
% within Mandala 14.3% 20.0% 55.6% 47.1% 62.5%
O Count 24 4 8 9 3
Expected Count 15.4 2.8 9.9 9.4 4.4
% within Location 50.0% 8.3% 16.7% 18.8% 6.3%
% within Mandala 85.7% 80.0% 44.4% 52.9% 37.5%
Total Count 28 5 18 17 8
Expected Count 28.0 5.0 18.0 17.0 8.0
% within Location 32.2% 5.7% 20.7% 19.5% 9.2%
% within Mandala 100.0% 100.0% 100.0% 100.0% 100.0%

106
Location * Mandala * Type Crosstabulation
Type
Mandala
-S Total
1 Location A Count 1 18
Expected Count .4 18.0
% within Location 5.6% 100.0%
% within Mandala 100.0% 40.9%
O Count 0 26
Expected Count .6 26.0
% within Location .0% 100.0%
% within Mandala .0% 59.1%
Total Count 1 44
Expected Count 1.0 44.0
% within Location 2.3% 100.0%
% within Mandala 100.0% 100.0%
2 Location A Count 8 117
Expected Count 5.2 117.0
% within Location 6.8% 100.0%
% within Mandala 66.7% 43.3%
O Count 4 153
Expected Count 6.8 153.0
% within Location 2.6% 100.0%
% within Mandala 33.3% 56.7%
Total Count 12 270
Expected Count 12.0 270.0
% within Location 4.4% 100.0%
% within Mandala 100.0% 100.0%
3 Location A Count 0 63
Expected Count .7 63.0
% within Location .0% 100.0%
% within Mandala .0% 37.3%
O Count 2 106
Expected Count 1.3 106.0
% within Location 1.9% 100.0%
% within Mandala 100.0% 62.7%
Total Count 2 169
Expected Count 2.0 169.0
% within Location 1.2% 100.0%
% within Mandala 100.0% 100.0%
4 Location A Count 11 39
Expected Count 4.9 39.0
% within Location 28.2% 100.0%
% within Mandala 100.0% 44.8%
O Count 0 48
Expected Count 6.1 48.0
% within Location .0% 100.0%
% within Mandala .0% 55.2%
Total Count 11 87
Expected Count 11.0 87.0
% within Location 12.6% 100.0%
% within Mandala 100.0% 100.0%
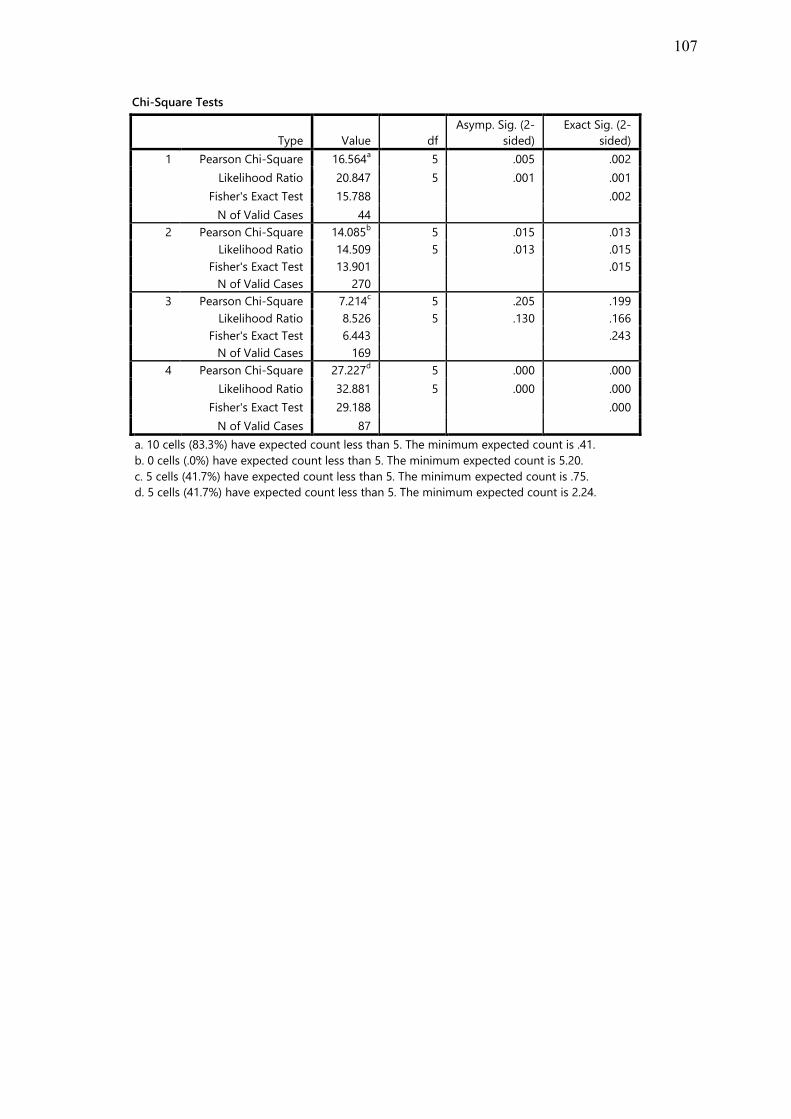
107
Chi-Square Tests
Type Value df
Asymp. Sig. (2-
sided)
Exact Sig. (2-
sided)
1 Pearson Chi-Square 16.564a 5 .005 .002
Likelihood Ratio 20.847 5 .001 .001
Fisher's Exact Test 15.788 .002
N of Valid Cases 44
2 Pearson Chi-Square 14.085b 5 .015 .013
Likelihood Ratio 14.509 5 .013 .015
Fisher's Exact Test 13.901 .015
N of Valid Cases 270
3 Pearson Chi-Square 7.214c 5 .205 .199
Likelihood Ratio 8.526 5 .130 .166
Fisher's Exact Test 6.443 .243
N of Valid Cases 169
4 Pearson Chi-Square 27.227d 5 .000 .000
Likelihood Ratio 32.881 5 .000 .000
Fisher's Exact Test 29.188 .000
N of Valid Cases 87
a. 10 cells (83.3%) have expected count less than 5. The minimum expected count is .41.
b. 0 cells (.0%) have expected count less than 5. The minimum expected count is 5.20.
c. 5 cells (41.7%) have expected count less than 5. The minimum expected count is .75.
d. 5 cells (41.7%) have expected count less than 5. The minimum expected count is 2.24.

108
C.2 T-tests
Performs t-tests for each participant separately, comparing indices for the country
of origin I-position with those for the Australian I-position.
Name = 03 Yoana
Group Statisticsa
Location N Mean Std. Deviation Std. Error Mean
IndexS O 12 5.17 5.524 1.595
A 12 13.00 5.222 1.508
IndexO O 12 9.08 6.640 1.917
A 12 13.58 5.775 1.667
IndexP O 12 13.67 12.280 3.545
A 12 25.00 12.519 3.614
IndexN O 12 13.50 8.469 2.445
A 12 2.50 4.011 1.158
a. Name = 03 Yoana
Independent Samples Testa
Levene's Test for Equality of
Variances
F Sig.
IndexS Equal variances assumed .376 .546
Equal variances not assumed
IndexO Equal variances assumed 1.783 .195
Equal variances not assumed
IndexP Equal variances assumed .113 .740
Equal variances not assumed
IndexN Equal variances assumed 5.016 .036
Equal variances not assumed
Independent Samples Testa
t-test for Equality of Means
t df Sig. (2-tailed) Mean Difference
IndexS Equal variances assumed -3.570 22 .002 -7.833
Equal variances not assumed -3.570 21.931 .002 -7.833
IndexO Equal variances assumed -1.771 22 .090 -4.500
Equal variances not assumed -1.771 21.586 .091 -4.500
IndexP Equal variances assumed -2.239 22 .036 -11.333
Equal variances not assumed -2.239 21.992 .036 -11.333
IndexN Equal variances assumed 4.066 22 .001 11.000
Equal variances not assumed 4.066 15.699 .001 11.000

109
Independent Samples Testa
t-test for Equality of Means
95% Confidence Interval of the
Difference
Std. Error
Difference Lower Upper
IndexS Equal variances assumed 2.194 -12.384 -3.282
Equal variances not assumed 2.194 -12.385 -3.281
IndexO Equal variances assumed 2.540 -9.768 .768
Equal variances not assumed 2.540 -9.774 .774
IndexP Equal variances assumed 5.062 -21.832 -.835
Equal variances not assumed 5.062 -21.832 -.835
IndexN Equal variances assumed 2.705 5.390 16.610
Equal variances not assumed 2.705 5.256 16.744
a. Name = 03 Yoana
Name = 22 Juan
Group Statisticsa
Location N Mean Std. Deviation Std. Error Mean
IndexS O 19 7.42 4.880 1.120
A 17 9.24 5.238 1.271
IndexO O 19 6.37 3.562 .817
A 17 4.82 3.245 .787
IndexP O 19 14.89 9.398 2.156
A 17 16.82 10.460 2.537
IndexN O 19 20.47 12.267 2.814
A 17 13.41 11.457 2.779
a. Name = 22 Juan
Independent Samples Testa
Levene's Test for Equality of
Variances
F Sig.
IndexS Equal variances assumed .623 .436
Equal variances not assumed
IndexO Equal variances assumed .003 .957
Equal variances not assumed
IndexP Equal variances assumed .493 .488
Equal variances not assumed
IndexN Equal variances assumed .976 .330
Equal variances not assumed
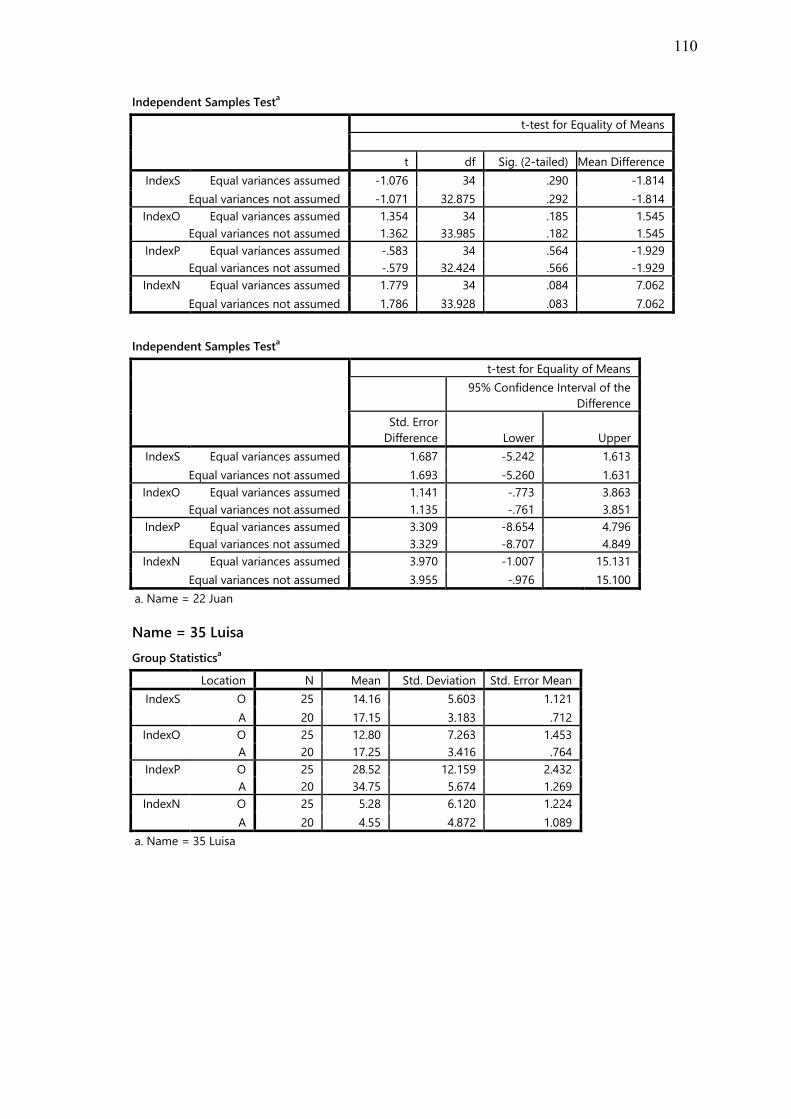
110
Independent Samples Testa
t-test for Equality of Means
t df Sig. (2-tailed) Mean Difference
IndexS Equal variances assumed -1.076 34 .290 -1.814
Equal variances not assumed -1.071 32.875 .292 -1.814
IndexO Equal variances assumed 1.354 34 .185 1.545
Equal variances not assumed 1.362 33.985 .182 1.545
IndexP Equal variances assumed -.583 34 .564 -1.929
Equal variances not assumed -.579 32.424 .566 -1.929
IndexN Equal variances assumed 1.779 34 .084 7.062
Equal variances not assumed 1.786 33.928 .083 7.062
Independent Samples Testa
t-test for Equality of Means
95% Confidence Interval of the
Difference
Std. Error
Difference Lower Upper
IndexS Equal variances assumed 1.687 -5.242 1.613
Equal variances not assumed 1.693 -5.260 1.631
IndexO Equal variances assumed 1.141 -.773 3.863
Equal variances not assumed 1.135 -.761 3.851
IndexP Equal variances assumed 3.309 -8.654 4.796
Equal variances not assumed 3.329 -8.707 4.849
IndexN Equal variances assumed 3.970 -1.007 15.131
Equal variances not assumed 3.955 -.976 15.100
a. Name = 22 Juan
Name = 35 Luisa
Group Statisticsa
Location N Mean Std. Deviation Std. Error Mean
IndexS O 25 14.16 5.603 1.121
A 20 17.15 3.183 .712
IndexO O 25 12.80 7.263 1.453
A 20 17.25 3.416 .764
IndexP O 25 28.52 12.159 2.432
A 20 34.75 5.674 1.269
IndexN O 25 5.28 6.120 1.224
A 20 4.55 4.872 1.089
a. Name = 35 Luisa
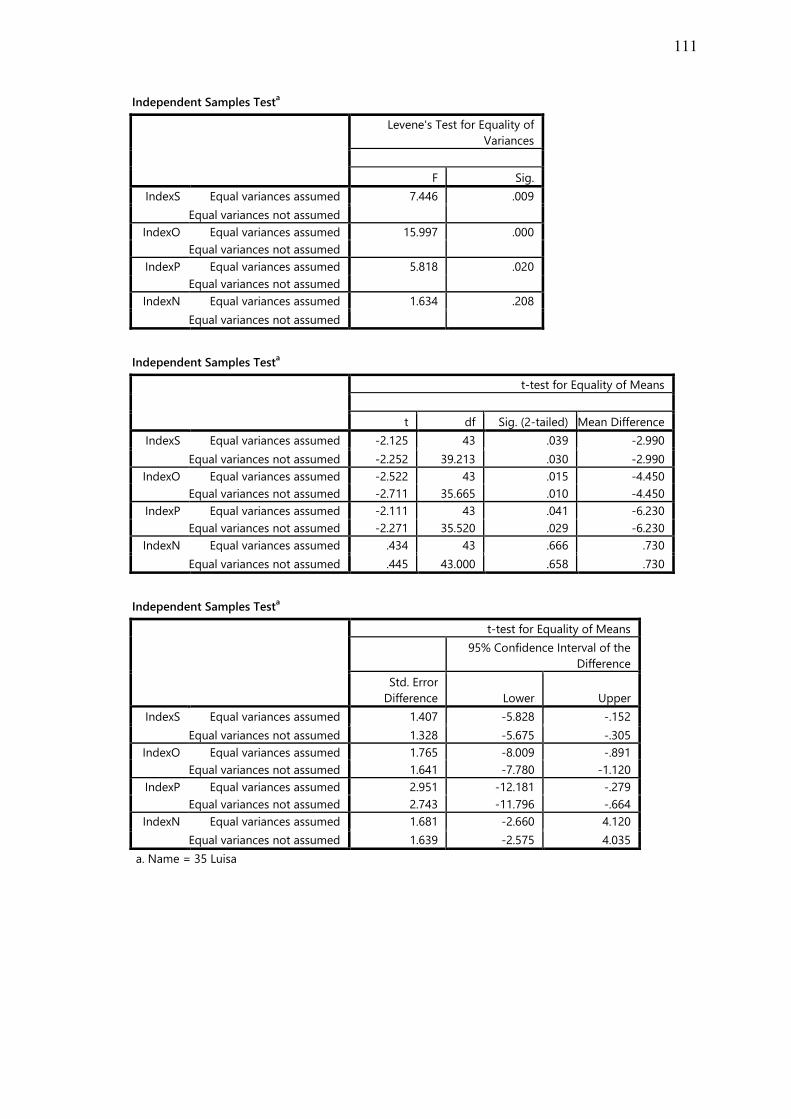
111
Independent Samples Testa
Levene's Test for Equality of
Variances
F Sig.
IndexS Equal variances assumed 7.446 .009
Equal variances not assumed
IndexO Equal variances assumed 15.997 .000
Equal variances not assumed
IndexP Equal variances assumed 5.818 .020
Equal variances not assumed
IndexN Equal variances assumed 1.634 .208
Equal variances not assumed
Independent Samples Testa
t-test for Equality of Means
t df Sig. (2-tailed) Mean Difference
IndexS Equal variances assumed -2.125 43 .039 -2.990
Equal variances not assumed -2.252 39.213 .030 -2.990
IndexO Equal variances assumed -2.522 43 .015 -4.450
Equal variances not assumed -2.711 35.665 .010 -4.450
IndexP Equal variances assumed -2.111 43 .041 -6.230
Equal variances not assumed -2.271 35.520 .029 -6.230
IndexN Equal variances assumed .434 43 .666 .730
Equal variances not assumed .445 43.000 .658 .730
Independent Samples Testa
t-test for Equality of Means
95% Confidence Interval of the
Difference
Std. Error
Difference Lower Upper
IndexS Equal variances assumed 1.407 -5.828 -.152
Equal variances not assumed 1.328 -5.675 -.305
IndexO Equal variances assumed 1.765 -8.009 -.891
Equal variances not assumed 1.641 -7.780 -1.120
IndexP Equal variances assumed 2.951 -12.181 -.279
Equal variances not assumed 2.743 -11.796 -.664
IndexN Equal variances assumed 1.681 -2.660 4.120
Equal variances not assumed 1.639 -2.575 4.035
a. Name = 35 Luisa
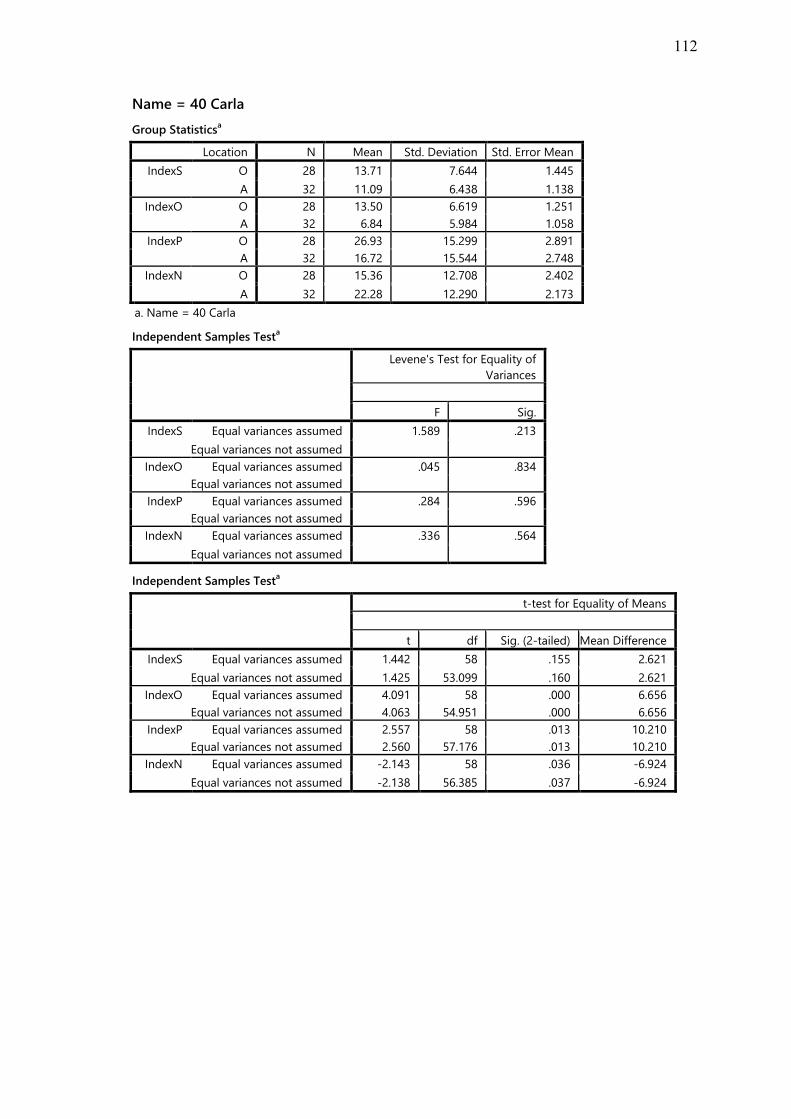
112
Name = 40 Carla
Group Statisticsa
Location N Mean Std. Deviation Std. Error Mean
IndexS O 28 13.71 7.644 1.445
A 32 11.09 6.438 1.138
IndexO O 28 13.50 6.619 1.251
A 32 6.84 5.984 1.058
IndexP O 28 26.93 15.299 2.891
A 32 16.72 15.544 2.748
IndexN O 28 15.36 12.708 2.402
A 32 22.28 12.290 2.173
a. Name = 40 Carla
Independent Samples Testa
Levene's Test for Equality of
Variances
F Sig.
IndexS Equal variances assumed 1.589 .213
Equal variances not assumed
IndexO Equal variances assumed .045 .834
Equal variances not assumed
IndexP Equal variances assumed .284 .596
Equal variances not assumed
IndexN Equal variances assumed .336 .564
Equal variances not assumed
Independent Samples Testa
t-test for Equality of Means
t df Sig. (2-tailed) Mean Difference
IndexS Equal variances assumed 1.442 58 .155 2.621
Equal variances not assumed 1.425 53.099 .160 2.621
IndexO Equal variances assumed 4.091 58 .000 6.656
Equal variances not assumed 4.063 54.951 .000 6.656
IndexP Equal variances assumed 2.557 58 .013 10.210
Equal variances not assumed 2.560 57.176 .013 10.210
IndexN Equal variances assumed -2.143 58 .036 -6.924
Equal variances not assumed -2.138 56.385 .037 -6.924
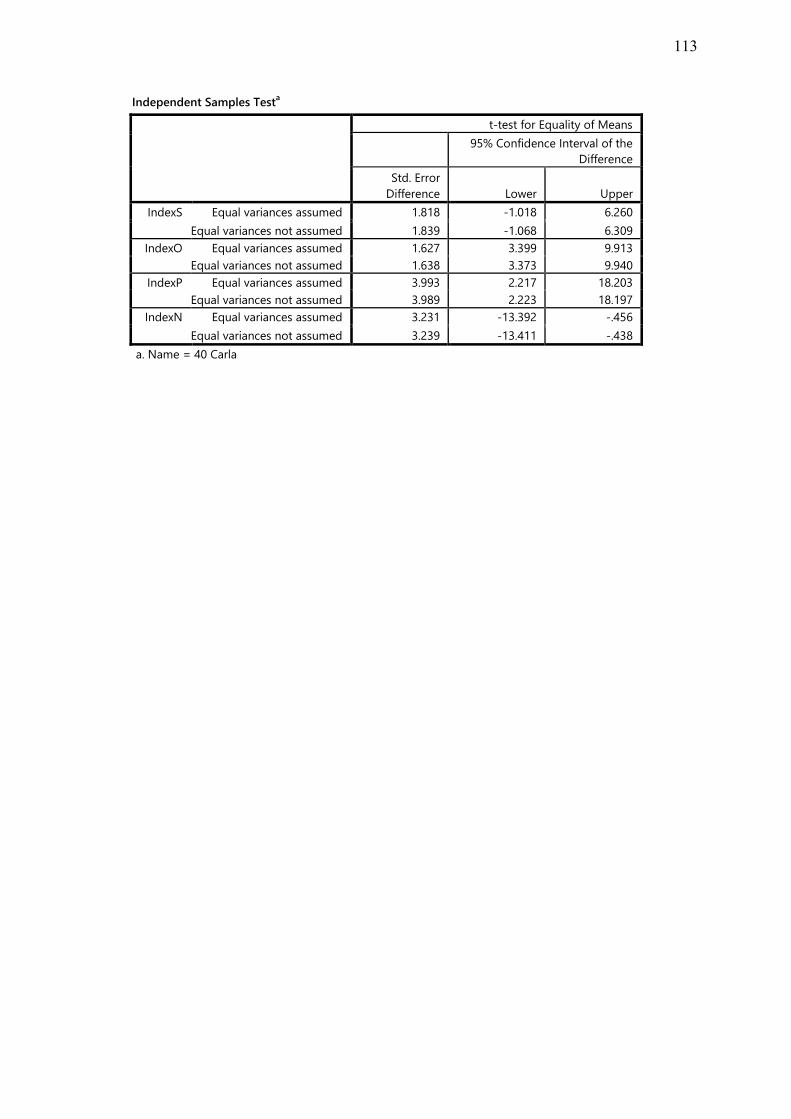
113
Independent Samples Testa
t-test for Equality of Means
95% Confidence Interval of the
Difference
Std. Error
Difference Lower Upper
IndexS Equal variances assumed 1.818 -1.018 6.260
Equal variances not assumed 1.839 -1.068 6.309
IndexO Equal variances assumed 1.627 3.399 9.913
Equal variances not assumed 1.638 3.373 9.940
IndexP Equal variances assumed 3.993 2.217 18.203
Equal variances not assumed 3.989 2.223 18.197
IndexN Equal variances assumed 3.231 -13.392 -.456
Equal variances not assumed 3.239 -13.411 -.438
a. Name = 40 Carla

114
APPENDIX D
SELF-NARRATIVES OF CASE-STUDY PARTICIPANTS
Indices are denoted as follows: S = Self-enhancement; O = Union-with-the-other;
P = Positive affect; N = Negative affect; G = Generalisation; I = Idealisation.
Themes are denoted as follows: Strength and unity = +HH, Unity and love = +O,
Unfulfilled longing = –O, Powerlessness and isolation = –LL, Aggression and anger = –
S, Autonomy and success = +S.
D.1 Participant 03 Yoana
Valuations in country of origin, by location and period
Self-narrative S O P N G I Theme
Past
1 A mark in my life is that at that time my mother used to see my father
as the centre of her universe. Now that I am married I refuse to see
my husband the same way. Instead, my kids are the centre of my life.
0 0 0 19 -0.69 -0.78 -LL
2 An episode I remember is my father visiting us. During that time my
mother used to prepare us the best possible way, we had to wear our
best clothes and our best behaviour before he arrived. But to our great
disappointment he will come and sit there for the whole afternoon
reading newspapers. He never talked to us, never took us to the park
or cinema, etc. My mother made us sit there with him, just watching
him. From that moment I always experience a sense of not being
good enough.
2 2 3 24 -0.71 -0.78 -LL
3 Even though my parents divorced when I was 7 I still remember
going to his apartment and admiring his tidy, clean and impeccable
place where you will find everything in order and the fragrance in the
environment was so delicious to breathe. Today I do the same at
home. Perhaps I inherited it from my father.
6 8 31 0 0.62 0.61
4 When I was 14 I clearly remember a scene like a scene from a movie
where we were in a party with very close friends. The son of one of
those friends was only 4 and I recall that alcohol was offered to him
and was encouraged to taste the delicious flavour and to my
amazement Leonardo took it. From that moment I look at alcohol as a
destructive drug.
0 13 0 18 -0.30 -0.33 -O
5 When I was 19 my sister and I went to our father because she wanted
his permission to go to live in Spain, but my father said to her what
about your sister? So she answered: I do not care about her. This
made me very sad.
16 15 18 10 0.33 0.37
6 When I was 21 I reached the point that I did not understand why I
was living in a world full of materialism, alcohol, sex, drugs,
violence, etc. And one day I was sitting down at the entrance of the
building I used to live in and I asked God whether that good life or
0 0 17 26 -0.42 -0.47

115
world ever existed? And my tears came down and then I started a
new spiritual commitment with myself. I decided to live a very pure
and spiritual life.
7 When I was 16 my only sister was my idol. We lived together away
from home and she would make every single decision about me. One
day she was getting ready for a party and I complimented her dress
and the way she looked. One of the friends present told me I was full
of complexes because I always complimented my sister and was so
proud of her. But another older friend responded that I was not a
“complex” girl. I was rather a pure and innocent person and my sister
was the complex one. This episode made me very sad and
unappreciated.
7 14 18 15 0.19 0.12
8 When my sister left I was 20 and I felt desolate and abandoned. I had
to learn everything from scratch to be on my own and standing on my
own feet.
9 14 17 13 0.32 0.21
Present
9 In my opinion my extended [Colombian] family is very significant.
There was an episode in my life that confronted me to this reality. My
son was operated on as an unexpected emergency and my daughter
was left at school with no one to look after her while I was with her
brother.
0 14 0 18 -0.27 -0.34 -O
10 My children were watching TV and I just learned on the phone that
my mum was flying to Australia to help us during my sickness. The
nice surprise was that my sister told me on the phone that my mother
was just one hour away before she landed in Melbourne.
5 13 26 5 0.48 0.46 +O
11 The same month I happened to be diagnosed with three lumps in my
breast. When I learned about it I was very upset and the doctor had to
comfort me. There I felt more than ever the ongoing importance of
having an extended family.
3 0 2 14 -0.36 -0.46 -LL
Future
12 My mother has influenced me a lot. Her strength and patience have
made a mark in my life. Also I hold onto her and won’t allow her to
go because I want my kids to experience not only a grandmother but
somehow an extended family.
14 16 32 0 0.77 0.83
Valuations in Australia, by location and period
Self-narrative S O P N G I Theme
Past
1 When I was 24 here in Melbourne I went to a Youth Baha’i party and
there were boys and girls all about the same age. I was so impressed
by the fact that the youth were not drinking alcohol and yet they were
enjoying themselves and having a good time. It impressed me a lot
the clear environment that surrounded me that night.
13 6 29 0 0.78 0.77 +S
2 Last year in December my children were to compete in swimming but
my son Habib was sick after the hard training because he suffers from
asthma. Close to the date of competition I suggested to him to think
about it and perhaps leave it till next year. He insisted he wanted to
compete, even though … he was still not breathing well. Yet the next
morning he was up, ready to compete. I talked to him and suggested
he should not go ahead… When it was his time to get in [to the
water] I was sitting down on the beach and when he walked towards
me I saw a very week face and dark rings around his eyes, but I also
noticed a great determination in those eyes—it was like a spark of
12 14 14 4 0.46 0.48
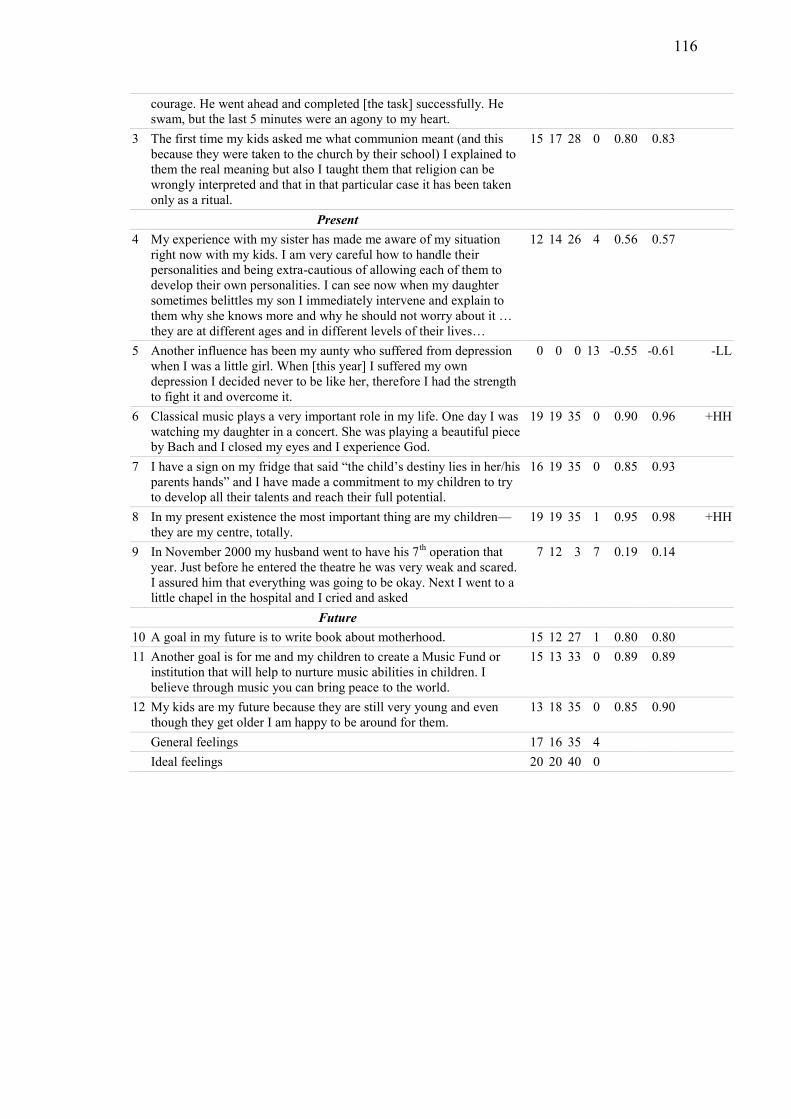
116
courage. He went ahead and completed [the task] successfully. He
swam, but the last 5 minutes were an agony to my heart.
3 The first time my kids asked me what communion meant (and this
because they were taken to the church by their school) I explained to
them the real meaning but also I taught them that religion can be
wrongly interpreted and that in that particular case it has been taken
only as a ritual.
15 17 28 0 0.80 0.83
Present
4 My experience with my sister has made me aware of my situation
right now with my kids. I am very careful how to handle their
personalities and being extra-cautious of allowing each of them to
develop their own personalities. I can see now when my daughter
sometimes belittles my son I immediately intervene and explain to
them why she knows more and why he should not worry about it …
they are at different ages and in different levels of their lives…
12 14 26 4 0.56 0.57
5 Another influence has been my aunty who suffered from depression
when I was a little girl. When [this year] I suffered my own
depression I decided never to be like her, therefore I had the strength
to fight it and overcome it.
0 0 0 13 -0.55 -0.61 -LL
6 Classical music plays a very important role in my life. One day I was
watching my daughter in a concert. She was playing a beautiful piece
by Bach and I closed my eyes and I experience God.
19 19 35 0 0.90 0.96 +HH
7 I have a sign on my fridge that said “the child’s destiny lies in her/his
parents hands” and I have made a commitment to my children to try
to develop all their talents and reach their full potential.
16 19 35 0 0.85 0.93
8 In my present existence the most important thing are my children—
they are my centre, totally.
19 19 35 1 0.95 0.98 +HH
9 In November 2000 my husband went to have his 7th
operation that
year. Just before he entered the theatre he was very weak and scared.
I assured him that everything was going to be okay. Next I went to a
little chapel in the hospital and I cried and asked
7 12 3 7 0.19 0.14
Future
10 A goal in my future is to write book about motherhood. 15 12 27 1 0.80 0.80
11 Another goal is for me and my children to create a Music Fund or
institution that will help to nurture music abilities in children. I
believe through music you can bring peace to the world.
15 13 33 0 0.89 0.89
12 My kids are my future because they are still very young and even
though they get older I am happy to be around for them.
13 18 35 0 0.85 0.90
General feelings 17 16 35 4
Ideal feelings 20 20 40 0
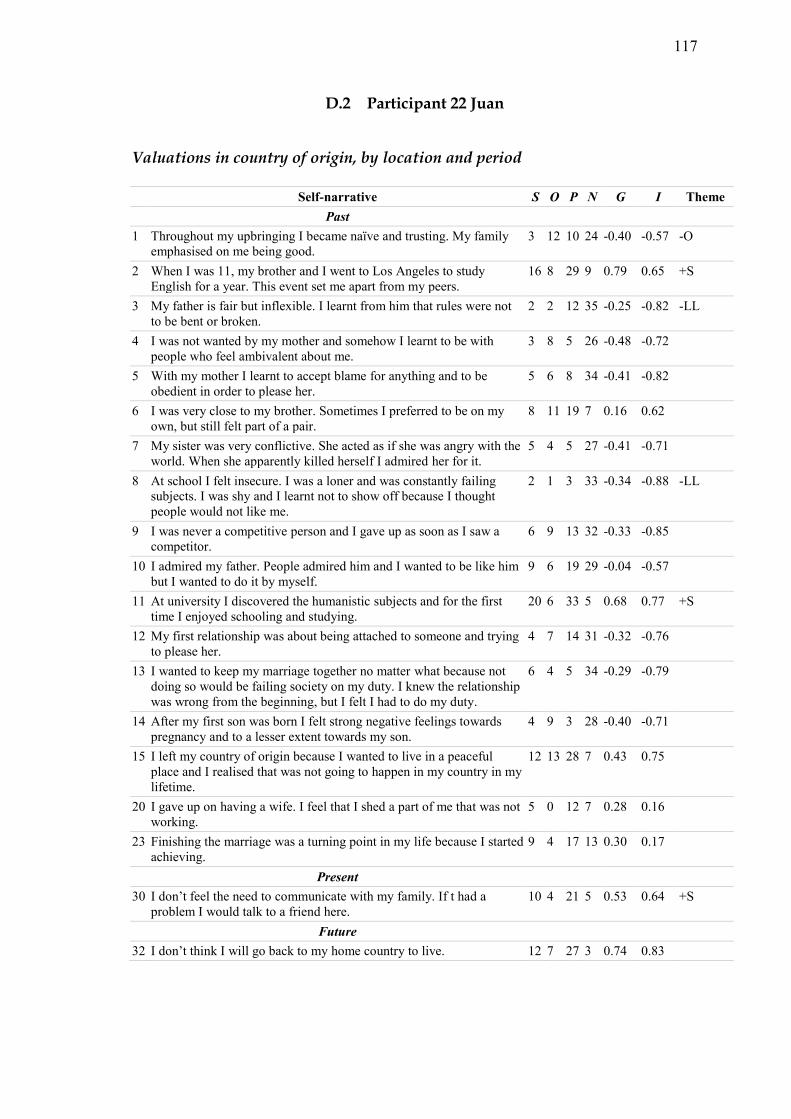
117
D.2 Participant 22 Juan
Valuations in country of origin, by location and period
Self-narrative S O P N G I Theme
Past
1 Throughout my upbringing I became naïve and trusting. My family
emphasised on me being good.
3 12 10 24 -0.40 -0.57 -O
2 When I was 11, my brother and I went to Los Angeles to study
English for a year. This event set me apart from my peers.
16 8 29 9 0.79 0.65 +S
3 My father is fair but inflexible. I learnt from him that rules were not
to be bent or broken.
2 2 12 35 -0.25 -0.82 -LL
4 I was not wanted by my mother and somehow I learnt to be with
people who feel ambivalent about me.
3 8 5 26 -0.48 -0.72
5 With my mother I learnt to accept blame for anything and to be
obedient in order to please her.
5 6 8 34 -0.41 -0.82
6 I was very close to my brother. Sometimes I preferred to be on my
own, but still felt part of a pair.
8 11 19 7 0.16 0.62
7 My sister was very conflictive. She acted as if she was angry with the
world. When she apparently killed herself I admired her for it.
5 4 5 27 -0.41 -0.71
8 At school I felt insecure. I was a loner and was constantly failing
subjects. I was shy and I learnt not to show off because I thought
people would not like me.
2 1 3 33 -0.34 -0.88 -LL
9 I was never a competitive person and I gave up as soon as I saw a
competitor.
6 9 13 32 -0.33 -0.85
10 I admired my father. People admired him and I wanted to be like him
but I wanted to do it by myself.
9 6 19 29 -0.04 -0.57
11 At university I discovered the humanistic subjects and for the first
time I enjoyed schooling and studying.
20 6 33 5 0.68 0.77 +S
12 My first relationship was about being attached to someone and trying
to please her.
4 7 14 31 -0.32 -0.76
13 I wanted to keep my marriage together no matter what because not
doing so would be failing society on my duty. I knew the relationship
was wrong from the beginning, but I felt I had to do my duty.
6 4 5 34 -0.29 -0.79
14 After my first son was born I felt strong negative feelings towards
pregnancy and to a lesser extent towards my son.
4 9 3 28 -0.40 -0.71
15 I left my country of origin because I wanted to live in a peaceful
place and I realised that was not going to happen in my country in my
lifetime.
12 13 28 7 0.43 0.75
20 I gave up on having a wife. I feel that I shed a part of me that was not
working.
5 0 12 7 0.28 0.16
23 Finishing the marriage was a turning point in my life because I started
achieving.
9 4 17 13 0.30 0.17
Present
30 I don’t feel the need to communicate with my family. If t had a
problem I would talk to a friend here.
10 4 21 5 0.53 0.64 +S
Future
32 I don’t think I will go back to my home country to live. 12 7 27 3 0.74 0.83

118
Valuations in Australia, by location and period
Self-narrative S O P N G I Theme
Past
16 The first three years was a real struggle. I felt I was going down- not
achieving academically or socially and with getting a proper job.
4 2 3 25 -0.27 -0.79
17 I felt that I did not belong to this society because people did not know
who I was.
4 0 1 19 -0.06 -0.58
18 I felt that I did not belong even to the groups I was participating in
(e.g. University).
2 0 1 30 -0.16 -0.82 -LL
19 During the first 6 year in Australia I did not do much for myself and
therefore achieved very little. I felt I was shutting down one aspect of
my life after another.
0 0 0 39 -0.37 -0.96 -LL
21 I have always felt very close to my children. 6 8 15 27 -0.32 -0.75
22 After 5 years of studying I was asked to withdraw from university
because I was failing, and I withdrew from my course and gave up. I
was very depressed and I had very low self-esteem.
1 1 5 24 -0.41 -0.85 -LL
24 Not having a partner I felt that I could make my own decision and I
started to live my own life and not a family group life.
15 6 21 8 0.56 0.70 +S
25 Getting my first professional job was a self-esteem boost for me. I
felt I finally belonged to a group of people that were similar to me.
15 7 23 3 0.62 0.83 +S
Present
26 I have a job. I’m still learning but I’m where I want to be. 13 4 25 7 0.75 0.71 +S
27 For the first time in my life I feel I am working for myself as an
individual.
15 6 26 6 0.71 0.82 +S
28 I am still working on being assertive at work. 11 8 18 8 0.38 0.75
29 I am able to express my feelings and thoughts more easily now. 12 4 29 1 0.57 0.84 +S
31 I am happy living in Australia for now. 13 8 28 7 0.67 0.79
Future
33 I want to go back to study to expand my professional horizon. 13 4 24 4 0.66 0.78 +S
34 I feel that I have the rest of my life in front of me, and I need to
discover it.
12 9 24 7 0.47 0.74
35 I want to remain unattached for a couple of years and then find
someone with whom I can be myself.
9 6 20 10 0.62 0.47
36 I would like to relate to my children as individuals. 12 9 23 3 0.55 0.89
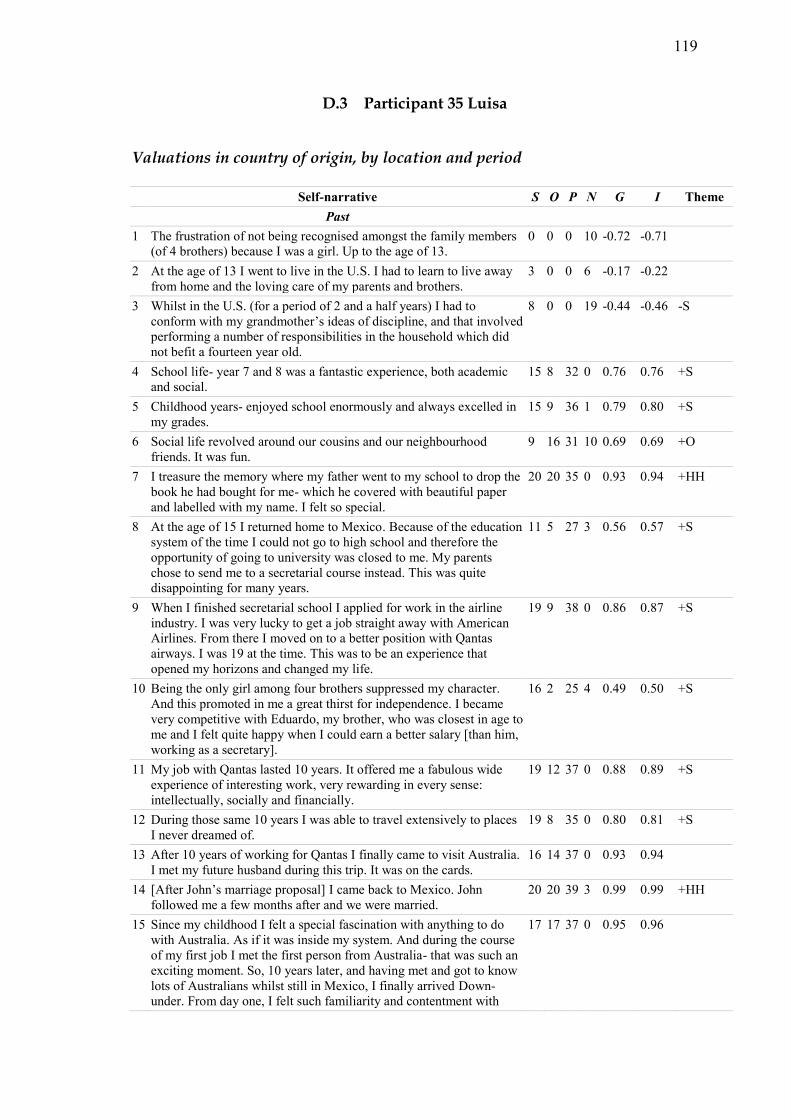
119
D.3 Participant 35 Luisa
Valuations in country of origin, by location and period
Self-narrative S O P N G I Theme
Past
1 The frustration of not being recognised amongst the family members
(of 4 brothers) because I was a girl. Up to the age of 13.
0 0 0 10 -0.72 -0.71
2 At the age of 13 I went to live in the U.S. I had to learn to live away
from home and the loving care of my parents and brothers.
3 0 0 6 -0.17 -0.22
3 Whilst in the U.S. (for a period of 2 and a half years) I had to
conform with my grandmother’s ideas of discipline, and that involved
performing a number of responsibilities in the household which did
not befit a fourteen year old.
8 0 0 19 -0.44 -0.46 -S
4 School life- year 7 and 8 was a fantastic experience, both academic
and social.
15 8 32 0 0.76 0.76 +S
5 Childhood years- enjoyed school enormously and always excelled in
my grades.
15 9 36 1 0.79 0.80 +S
6 Social life revolved around our cousins and our neighbourhood
friends. It was fun.
9 16 31 10 0.69 0.69 +O
7 I treasure the memory where my father went to my school to drop the
book he had bought for me- which he covered with beautiful paper
and labelled with my name. I felt so special.
20 20 35 0 0.93 0.94 +HH
8 At the age of 15 I returned home to Mexico. Because of the education
system of the time I could not go to high school and therefore the
opportunity of going to university was closed to me. My parents
chose to send me to a secretarial course instead. This was quite
disappointing for many years.
11 5 27 3 0.56 0.57 +S
9 When I finished secretarial school I applied for work in the airline
industry. I was very lucky to get a job straight away with American
Airlines. From there I moved on to a better position with Qantas
airways. I was 19 at the time. This was to be an experience that
opened my horizons and changed my life.
19 9 38 0 0.86 0.87 +S
10 Being the only girl among four brothers suppressed my character.
And this promoted in me a great thirst for independence. I became
very competitive with Eduardo, my brother, who was closest in age to
me and I felt quite happy when I could earn a better salary [than him,
working as a secretary].
16 2 25 4 0.49 0.50 +S
11 My job with Qantas lasted 10 years. It offered me a fabulous wide
experience of interesting work, very rewarding in every sense:
intellectually, socially and financially.
19 12 37 0 0.88 0.89 +S
12 During those same 10 years I was able to travel extensively to places
I never dreamed of.
19 8 35 0 0.80 0.81 +S
13 After 10 years of working for Qantas I finally came to visit Australia.
I met my future husband during this trip. It was on the cards.
16 14 37 0 0.93 0.94
14 [After John’s marriage proposal] I came back to Mexico. John
followed me a few months after and we were married.
20 20 39 3 0.99 0.99 +HH
15 Since my childhood I felt a special fascination with anything to do
with Australia. As if it was inside my system. And during the course
of my first job I met the first person from Australia- that was such an
exciting moment. So, 10 years later, and having met and got to know
lots of Australians whilst still in Mexico, I finally arrived Down-
under. From day one, I felt such familiarity and contentment with
17 17 37 0 0.95 0.96

120
everything here!
16 My relationship with my father was not a very close one due mainly
to his very strict upbringing- I never really related to him.
10 13 26 9 0.60 0.59
17 On the other hand I had a close relationship with my mother. As I
have got older I have discovered many of her traits in my personality.
19 20 30 14 0.52 0.54 +HH
18 As my children reached the age of 10 and 12 years we felt we would
like to move to Mexico for them to absorb the Mexican culture; for
all of us to live close to our extended family and cement our family
values along the Mexican traditions.
10 20 32 6 0.76 0.73 +O
19 The 8 years we spent in Mexico allowed us to enjoy a very rich
experience of family life. The joy of participating closely with the
family is hard to describe. The warmth of the people in general.
18 20 36 2 0.98 0.97 +HH
20 However, on the other hand, only 3 years after we arrived [in
Mexico] we encountered a series of very adverse circumstances
which had a very negative effect on our stability, financially and
emotionally. For my husband, a huge disappointment with the people.
The lack of principles and honesty. We had to be alert and defensive
at all times. So many circumstances totally beyond our control
weighed down the joy of being there.
10 10 12 20 -0.07 -0.09
Present
21 My bonding with my mother and brothers has not diminished for the
fact I live away. Our communication is rich and constant.
20 20 34 11 0.80 0.80 +HH
22 I share my Mexican culture with my children here in Australia. We
always speak Spanish amongst ourselves, enjoy our music, food,
drinks and the spirit of our connection with Mexico.
19 20 35 1 0.92 0.93 +HH
23 My mother is still the uniting force of my extended family. I regret at
times the physical distance.
13 17 30 11 0.49 0.51
Future
24 In the future there will always be a special bonding with my children
which comes from sharing our Mexican culture.
19 20 38 0 0.98 0.99 +HH
25 One of my important goals in the future is to continue visiting
Mexico and to keep in contact with my family, friends and culture.
9 20 31 2 0.71 0.72 +O
Valuations in Australia, by location and period
Self-narrative S O P N G I Theme
Past
1 My first arrival in Australia was almost like a homecoming.
Everything was more than I ever expected.
13 14 31 14 0.43 0.43
2 The great feeling I always had for Australia was a great influence in
the way I found myself so fulfilled when I came here. I had never felt
that way before.
19 18 35 1 0.95 0.96 +HH
3 I met John, my husband, on my first visit to Australia. This was an
encounter with a soul mate; we felt so happy in each other’s company
from the beginning and we fell in love.
20 20 39 1 1.00 1.00 +HH
4 John proposed marriage a few months later after that first visit. This
prompted a second trip to Australia. I met his friends and his family
and we in fact were getting to know each other better. All this while I
felt I was living an adventure.
19 16 39 2 0.93 0.93
5 [After our marriage in Mexico] we came back to Australia and I felt I
had migrated to a new country. I had taken a big step.
12 19 36 4 0.90 0.89 +O
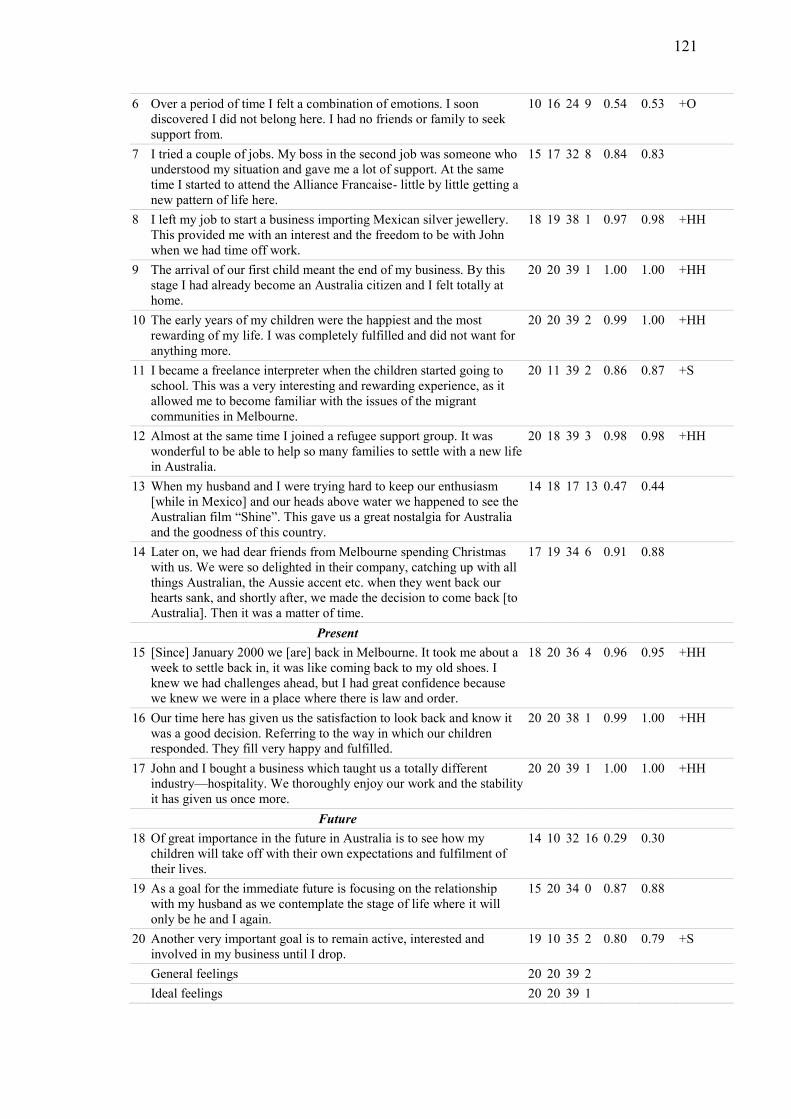
121
6 Over a period of time I felt a combination of emotions. I soon
discovered I did not belong here. I had no friends or family to seek
support from.
10 16 24 9 0.54 0.53 +O
7 I tried a couple of jobs. My boss in the second job was someone who
understood my situation and gave me a lot of support. At the same
time I started to attend the Alliance Francaise- little by little getting a
new pattern of life here.
15 17 32 8 0.84 0.83
8 I left my job to start a business importing Mexican silver jewellery.
This provided me with an interest and the freedom to be with John
when we had time off work.
18 19 38 1 0.97 0.98 +HH
9 The arrival of our first child meant the end of my business. By this
stage I had already become an Australia citizen and I felt totally at
home.
20 20 39 1 1.00 1.00 +HH
10 The early years of my children were the happiest and the most
rewarding of my life. I was completely fulfilled and did not want for
anything more.
20 20 39 2 0.99 1.00 +HH
11 I became a freelance interpreter when the children started going to
school. This was a very interesting and rewarding experience, as it
allowed me to become familiar with the issues of the migrant
communities in Melbourne.
20 11 39 2 0.86 0.87 +S
12 Almost at the same time I joined a refugee support group. It was
wonderful to be able to help so many families to settle with a new life
in Australia.
20 18 39 3 0.98 0.98 +HH
13
When my husband and I were trying hard to keep our enthusiasm
[while in Mexico] and our heads above water we happened to see the
Australian film “Shine”. This gave us a great nostalgia for Australia
and the goodness of this country.
14 18 17 13 0.47 0.44
14 Later on, we had dear friends from Melbourne spending Christmas
with us. We were so delighted in their company, catching up with all
things Australian, the Aussie accent etc. when they went back our
hearts sank, and shortly after, we made the decision to come back [to
Australia]. Then it was a matter of time.
17 19 34 6 0.91 0.88
Present
15 [Since] January 2000 we [are] back in Melbourne. It took me about a
week to settle back in, it was like coming back to my old shoes. I
knew we had challenges ahead, but I had great confidence because
we knew we were in a place where there is law and order.
18 20 36 4 0.96 0.95 +HH
16 Our time here has given us the satisfaction to look back and know it
was a good decision. Referring to the way in which our children
responded. They fill very happy and fulfilled.
20 20 38 1 0.99 1.00 +HH
17 John and I bought a business which taught us a totally different
industry—hospitality. We thoroughly enjoy our work and the stability
it has given us once more.
20 20 39 1 1.00 1.00 +HH
Future
18
Of great importance in the future in Australia is to see how my
children will take off with their own expectations and fulfilment of
their lives.
14 10 32 16 0.29 0.30
19 As a goal for the immediate future is focusing on the relationship
with my husband as we contemplate the stage of life where it will
only be he and I again.
15 20 34 0 0.87 0.88
20 Another very important goal is to remain active, interested and
involved in my business until I drop.
19 10 35 2 0.80 0.79 +S
General feelings 20 20 39 2
Ideal feelings 20 20 39 1

122
D.4 Participant 40 Carla
Valuations in country of origin, by location and period
Self-narrative S O P N G I Theme
Past
1 My extended family was important. I felt I had a place in the family.
That place was validated. I was the first girl born in the family. I was
doted on by all family members.
20 13 35 14 0.54 0.57 +S
2 I remember being 5 and starting prep at what was an all boys school.
Being one of the first girls I was chosen as a leader at school
assemblies and was chosen for main characters at school plays. I had
lots of friends. I remember I was well liked by all the kids.
20 18 40 5 0.62 0.89 +HH
3 I don’t recall any particular relative standing out for any particular
reason, or any relative being more important than any other. I
remember having a strong bond with all my family, in particular with
my mother’s side.
20 18 40 5 0.62 0.89 +HH
4 I remember feeling special and having lots of self-esteem, feeling
good about myself, being very out there, and being very affectionate
towards my relatives.
20 18 40 5 0.62 0.89 +HH
5 Going on lots of holidays with immediate family. 20 18 40 5 0.62 0.89 +HH
6 I have not got emotional attachment memories to either of my parents
while in Uruguay.
0 0 0 32 -0.57 -0.88 -LL
7 My brother was very close and we would walk to school together, and
play together after school (16 months apart in age).
9 8 27 18 0.24 0.15
8 My memories of my sister are when she was 8 months old and my
dad holding her on the frame of the new house.
10 16 22 18 0.36 0.27
9 My only other memories of my sister was on the plane trip to
Australia calling “socorro, socorro, llamen la policia” when the plane
was falling.
0 15 0 35 -0.61 -0.66 -O
10 I recall my dad saying we would go to live in Australia and I would
love it as we would go to school on a ferry and not wear school
uniform.
15 10 12 15 -0.11 0.09
29 I wanted to die If I could not go back to Uruguay at age 14. my
mother took me to Uruguay.
0 0 0 20 -0.19 -0.63 -LL
31 From the minute I stepped into Uruguay I felt whole, I felt I was
someone. I felt I was alive. I was 14. I lived with my maternal
grandmother for 3 months. I remember kissing, hugging and being
very affectionate with my gran and all my family.
20 18 40 5 0.37 0.89 +HH
32 Falling in love at 14, my grandma and mother did not speak to me.
They were angry with me, however I still felt whole. I was happy. I
felt I was important to someone. I was worth something.
20 20 40 5 0.32 0.91 +HH
33 At 15 I was again taken from Uruguay against my wishes. But I felt I
was loved and felt he would follow me to Australia and that the love
would be strong to conquer Australia. The plan was that when I was
old enough we would return to Uruguay.
1 5 1 35 -0.65 -0.80
34 I was preparing to save, to marry Freddy when he arrived in
Australia.
12 10 30 35 -0.16 -0.24
35 The relationship lasted over 1 year until news came from overseas
that he was in another relationship. Three months later he married.
There was closure to our relationship.
0 0 0 35 -0.50 -0.91 -LL
37 When he (Freddy) got married I made a conscious decision to stop
my connection with the Latin community and let go of my Latin self.
8 13 17 24 -0.30 -0.21
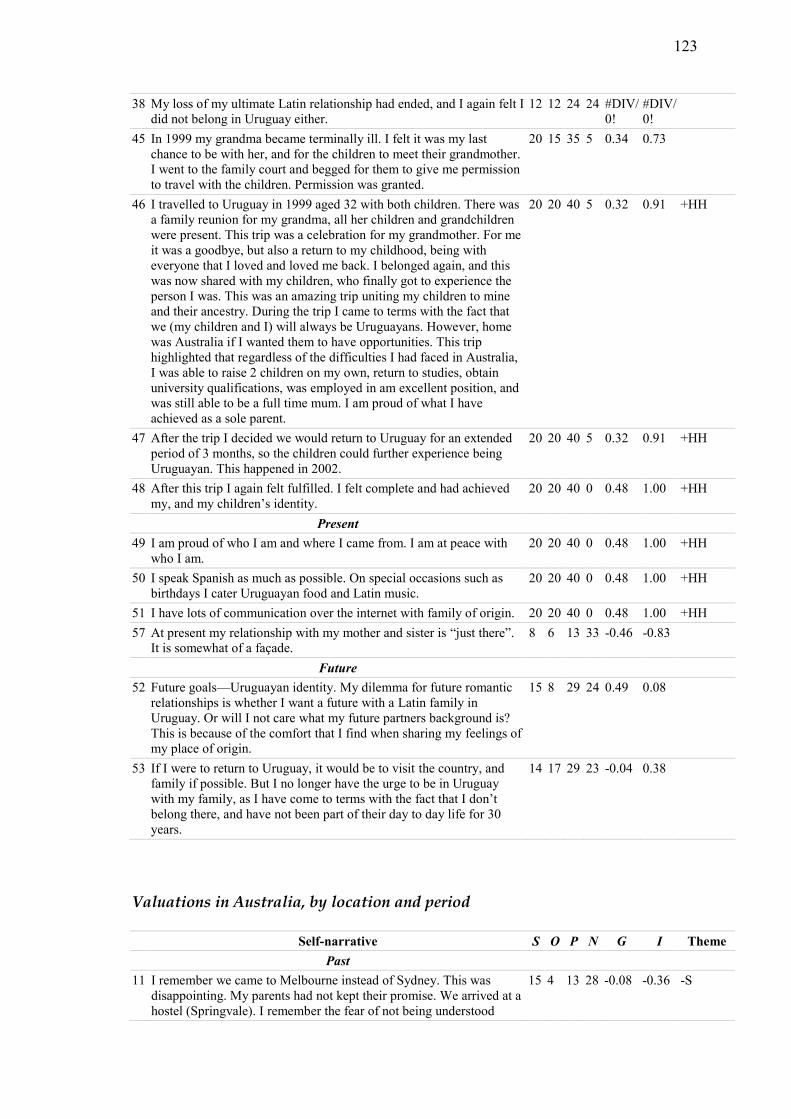
123
38 My loss of my ultimate Latin relationship had ended, and I again felt I
did not belong in Uruguay either.
12 12 24 24 #DIV/
0!
#DIV/
0!
45 In 1999 my grandma became terminally ill. I felt it was my last
chance to be with her, and for the children to meet their grandmother.
I went to the family court and begged for them to give me permission
to travel with the children. Permission was granted.
20 15 35 5 0.34 0.73
46 I travelled to Uruguay in 1999 aged 32 with both children. There was
a family reunion for my grandma, all her children and grandchildren
were present. This trip was a celebration for my grandmother. For me
it was a goodbye, but also a return to my childhood, being with
everyone that I loved and loved me back. I belonged again, and this
was now shared with my children, who finally got to experience the
person I was. This was an amazing trip uniting my children to mine
and their ancestry. During the trip I came to terms with the fact that
we (my children and I) will always be Uruguayans. However, home
was Australia if I wanted them to have opportunities. This trip
highlighted that regardless of the difficulties I had faced in Australia,
I was able to raise 2 children on my own, return to studies, obtain
university qualifications, was employed in am excellent position, and
was still able to be a full time mum. I am proud of what I have
achieved as a sole parent.
20 20 40 5 0.32 0.91 +HH
47 After the trip I decided we would return to Uruguay for an extended
period of 3 months, so the children could further experience being
Uruguayan. This happened in 2002.
20 20 40 5 0.32 0.91 +HH
48 After this trip I again felt fulfilled. I felt complete and had achieved
my, and my children’s identity.
20 20 40 0 0.48 1.00 +HH
Present
49 I am proud of who I am and where I came from. I am at peace with
who I am.
20 20 40 0 0.48 1.00 +HH
50 I speak Spanish as much as possible. On special occasions such as
birthdays I cater Uruguayan food and Latin music.
20 20 40 0 0.48 1.00 +HH
51 I have lots of communication over the internet with family of origin. 20 20 40 0 0.48 1.00 +HH
57 At present my relationship with my mother and sister is “just there”.
It is somewhat of a façade.
8 6 13 33 -0.46 -0.83
Future
52 Future goals—Uruguayan identity. My dilemma for future romantic
relationships is whether I want a future with a Latin family in
Uruguay. Or will I not care what my future partners background is?
This is because of the comfort that I find when sharing my feelings of
my place of origin.
15 8 29 24 0.49 0.08
53 If I were to return to Uruguay, it would be to visit the country, and
family if possible. But I no longer have the urge to be in Uruguay
with my family, as I have come to terms with the fact that I don’t
belong there, and have not been part of their day to day life for 30
years.
14 17 29 23 -0.04 0.38
Valuations in Australia, by location and period
Self-narrative S O P N G I Theme
Past
11 I remember we came to Melbourne instead of Sydney. This was
disappointing. My parents had not kept their promise. We arrived at a
hostel (Springvale). I remember the fear of not being understood
15 4 13 28 -0.08 -0.36 -S

124
when my dad told me to go and buy a coke at the milk bar.
12 I remember 2 days after arriving I had to organise my self, brother
and sister to go to breakfast in the large eating lounges, grab our own
food, take my sister to kinder and then my brother and I had to go on
a bus to school. I had to grow up and be independent in 2 days.
0 5 0 28 -0.58 -0.69
13 The 1rst day at school I screamed and cried for the teacher to go get
my brother. I hated Australia.
2 10 0 30 -0.46 -0.61 -O
14 I was responsible for taking my younger sister to kinder. One day I
forgot to pick her up. It was 5 pm when I remembered. The kinder
was closed and I was banging on the kinder doors. I was 7.
2 10 0 30 -0.46 -0.61 -O
15 We moved to South Yarra. All community members at hostel move
to South Yarra after a year too. All children went to the same school
so hostel friends were maintained.
16 12 36 8 0.45 0.75
16 School was difficult due to society identifying me as a wog. There
was lots of violence and lots of punch ups.
11 10 8 20 -0.20 -0.18
17 Home: parents worked. I was responsible for myself, sister and
brother to a degree. I had a key to our home and was responsible until
parents finished work. “latch key kids”, “just my job”. I still resented
coming here as I did not have this as my job in Uruguay.
10 0 9 34 -0.09 -0.66 -S
18 Academically, my teacher continuously reinforced that English was
my second language and I would need to improve to get ahead. This
also reinforced my wog mentality, that I did not fit in, that I was not
an “Aussie”.
12 4 12 31 -0.25 -0.56 -S
19 I was becoming more and more self-conscious, not belonging (8 to 10
years old).
12 4 12 31 -0.25 -0.56 -S
20 I had physical fights with my entire grade (year 5). Boys would hit
me for no reason. I always fought back as I was told in the hostel that
they (my parents) did not want me to come home crying because
someone had hit me. If I came home crying I would be hit by them.
10 0 0 36 -0.40 -0.82 -S
21 In grade 6 I became very popular. I was friends with most popular
kids in the school. I felt like I did in Uruguay.
17 11 31 7 0.68 0.80 +S
22 In year 7 and 8 I hated school. I felt like I did when I arrived in
Australia, out of place.
10 0 0 36 -0.40 -0.82 -S
23 Socially I had lots of friends. I had a best friend Virginia, and I had a
second best friend. We would do everything together as a group.
9 6 18 22 0.04 -0.22
24 In year 8 I hated school. I wagged and felt no connection with school. 10 0 0 36 -0.40 -0.82 -S
25 I had a feeling of belonging only with a group of Spanish speaking
kids.
15 11 34 13 0.70 0.64
26 My dad was physically abusive towards me. 0 0 0 30 -0.54 -0.82 -LL
27 I felt isolated within my family. I felt singled out in a negative way. I
had no one to turn to.
6 0 2 30 -0.30 -0.74 -S
28 I felt my mum did not protect me from my dad. 0 0 0 25 -0.37 -0.73 -LL
30 From the age of 7 to 14 I felt no sense of self. Other than year 6, I
didn’t belong anywhere. I was in limbo.
5 0 7 22 -0.19 -0.55
36 My job was very successful. I was very happy. I had a purpose. I felt
important. I was financially independent and was saving my money. I
bought our clothes, food etc. I no longer had to rely on my parents
other than for a roof over my head.
20 15 40 0 0.57 0.91
39 I focused on work and went back to school, and made a new group of
friends (17yearsold).
19 11 38 6 0.50 0.76 +S
40 At 17 and a half I entered my second major relationship. I felt I had to
prove that I could be loved and was worthy of that love. I had to
prove this to my parents.
13 12 24 23 0.00 0.18
41 I had 2 children from this relationship. With the 1rst child I was very 20 15 37 3 0.56 0.84
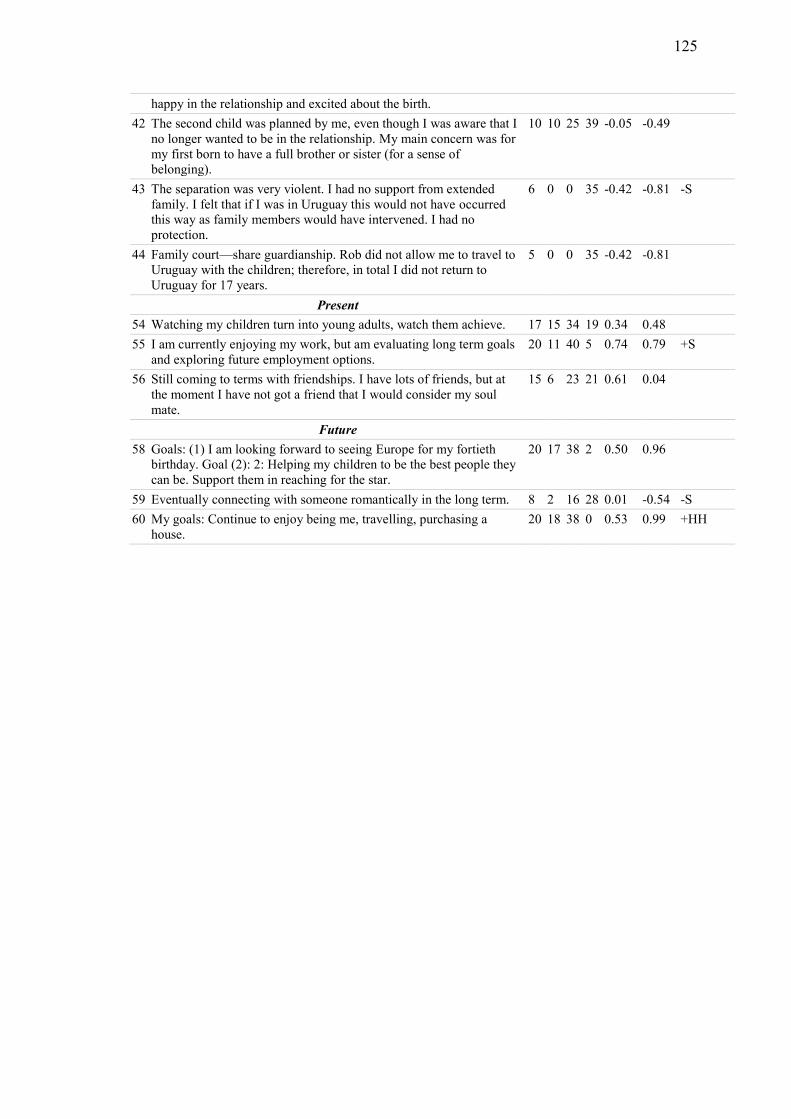
125
happy in the relationship and excited about the birth.
42 The second child was planned by me, even though I was aware that I
no longer wanted to be in the relationship. My main concern was for
my first born to have a full brother or sister (for a sense of
belonging).
10 10 25 39 -0.05 -0.49
43 The separation was very violent. I had no support from extended
family. I felt that if I was in Uruguay this would not have occurred
this way as family members would have intervened. I had no
protection.
6 0 0 35 -0.42 -0.81 -S
44 Family court—share guardianship. Rob did not allow me to travel to
Uruguay with the children; therefore, in total I did not return to
Uruguay for 17 years.
5 0 0 35 -0.42 -0.81
Present
54 Watching my children turn into young adults, watch them achieve. 17 15 34 19 0.34 0.48
55 I am currently enjoying my work, but am evaluating long term goals
and exploring future employment options.
20 11 40 5 0.74 0.79 +S
56 Still coming to terms with friendships. I have lots of friends, but at
the moment I have not got a friend that I would consider my soul
mate.
15 6 23 21 0.61 0.04
Future
58 Goals: (1) I am looking forward to seeing Europe for my fortieth
birthday. Goal (2): 2: Helping my children to be the best people they
can be. Support them in reaching for the star.
20 17 38 2 0.50 0.96
59 Eventually connecting with someone romantically in the long term. 8 2 16 28 0.01 -0.54 -S
60 My goals: Continue to enjoy being me, travelling, purchasing a
house.
20 18 38 0 0.53 0.99 +HH
Related Documents