The devolution of HRM practices - Does HRM add value from the perspective of line management? – - Master Thesis - Project theme: The added value of HRM from the perspective of the Line Manager Names of the supervisors: Prof. Dr. J. (Jaap) Paauwe Dr. K. (Kerstin) Alfes (second reader) Project period: January 2013 – March 2014 Student’s name : Annelies Buddingh ANR: 125818

Welcome message from author
This document is posted to help you gain knowledge. Please leave a comment to let me know what you think about it! Share it to your friends and learn new things together.
Transcript
The devolution of HRM practices - Does HRM add value from the perspective of line management? –
- Master Thesis -
Project theme: The added value of HRM from the perspective of the Line Manager
Names of the supervisors: Prof. Dr. J. (Jaap) Paauwe
Dr. K. (Kerstin) Alfes (second reader)
Project period: January 2013 – March 2014
Student’s name : Annelies Buddingh
ANR: 125818
2 Master Thesis Annelies Buddingh: The devolution of HRM practices
Preface Veenendaal 12th March
Dear Reader,
You have in front of you my master thesis. This thesis is the final part of my studies
at Tilburg University. In February 2013 I became very motivated to investigate the
topic which follows below. After following courses like ‘Performance Management’,
‘International HRM’, ‘Organizational Change’ I was triggered by the subject that Prof.
Dr. Jaap Paauwe presented for his thesis circle: Does HRM add value? A critical note
and more focused on practical affairs within organizations was totally my cup of tea.
Together with two co-students we went through the whole process of: specify the
topic, formulate a research question, develop a research model, create a theoretical
framework and last but not least collecting and analyzing data. Although the data
collection caused some delay and took a lot of energy, we noticed the relevance and
interest of a lot of practitioners in this subject. The devolution of HRM practices and
the role of line management in this process is really an urgent issue in many
organizations at the moment. That is why I am proud to present to you this ‘value
adding’ thesis for Human Resources.
This thesis would not have been created without the help of my supervisors: Prof.
Dr. J. (Jaap) Paauwe and Dr. K. (Kerstin) Alfes. It was inspiring to exchange thoughts
with Jaap since he is such a prominent person within the field of HR. I have learned a
lot from him about designing and executing proper research. I would also like to
express my appreciation for Kerstin, who was involved in my research from an early
stage. She was always willing to give feedback and answer my questions very quickly.
I would also like to thank all the HR-managers of several organizations who made it
possible to collect data and execute our research. Furthermore my thanks go to my
aunt Anne Marie who helped with the translation procedure and my friends Anke
and Jos who shared their expertise of SPSS with me.
I truly hope you will enjoy reading my thesis,
Annelies Buddingh
3 Master Thesis Annelies Buddingh: The devolution of HRM practices
Abstract
In this study a new concept in Human Resource theory is developed and
investigated: HRM strengths. HRM strengths are features which could determine the
degree of implementation of HRM practices in organizations. The effect of intended
HRM practices is examined on perceived HRM practices, added value and HRM
strengths from the perspective of Line-Managers and employees. Data was gathered
by means of three different surveys that were distributed among HR-managers, Line
Managers and employees in a variety of organizations within the Netherlands.
Results indicate that HRM practices are perceived by employees the way they are
intended by HR managers in most cases, and Line Managers rate overall HRM
practices to be valuable and in accordance with HRM strengths.
Keywords: implementation, devolution, line management, HRM strengths.
4 Master Thesis Annelies Buddingh: The devolution of HRM practices
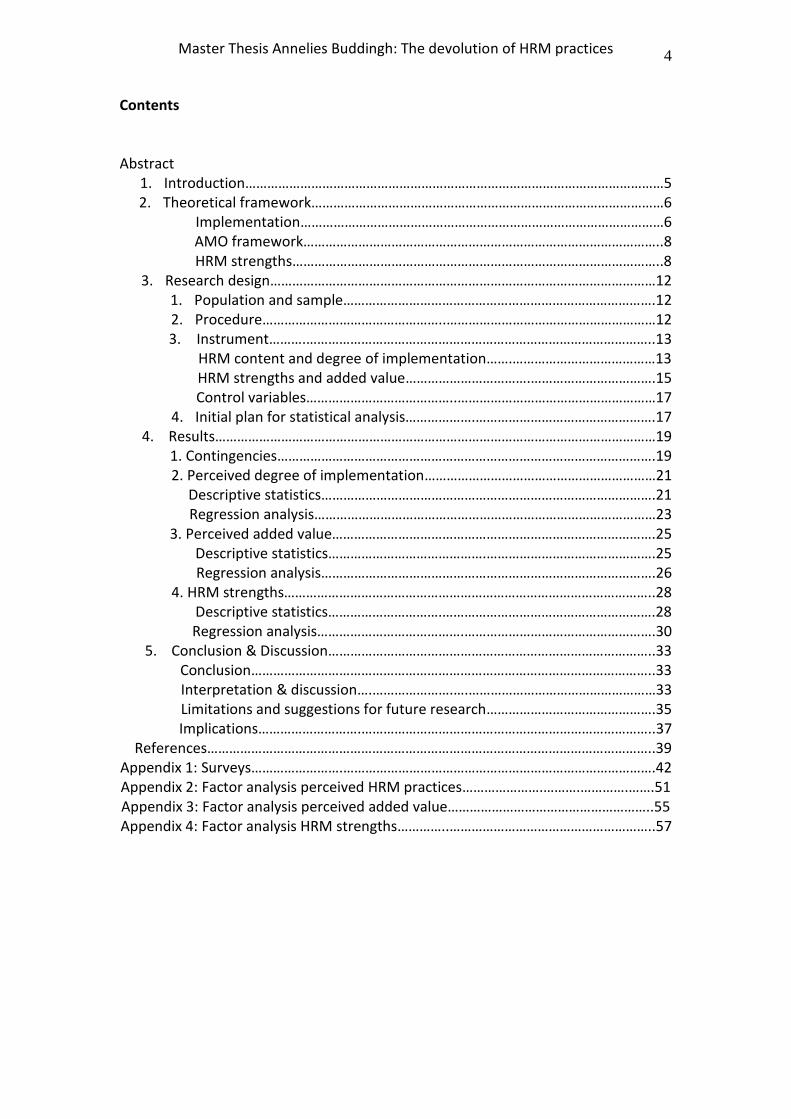
Contents
Abstract 1. Introduction……………………………………………………………………………………………………5 2. Theoretical framework……………………………………………………………………………………6
Implementation………………………………………………………………………………………6 AMO framework……………………………………………………………………………………..8 HRM strengths………………………………………………………………………………………..8
3. Research design……………………………………………………………………………………………12 1. Population and sample………………………………………………………………………….12 2. Procedure…………………………………………..…………………………………………………12 3. Instrument……….…………………………………………………………………………………..13
HRM content and degree of implementation…….…………………………………13 HRM strengths and added value…………………………….…………………………….15 Control variables…………………………………..………………………………………………17
4. Initial plan for statistical analysis……………….………………………………………….17 4. Results…………………………………………………………………………………………………………19
1. Contingencies………………………………………………………………………………………….19 2. Perceived degree of implementation………………………………………………………21 Descriptive statistics……………………………………………………………………………….21 Regression analysis…………………………………………………………………………………23 3. Perceived added value…………………………………………………………………………….25
Descriptive statistics…………………………………….……………………………………….25 Regression analysis……………………………………………………………………………….26
4. HRM strengths………………………………………………………………………………………..28 Descriptive statistics………………………….………………………………………………….28 Regression analysis………………………………….…………………………………………….30
5. Conclusion & Discussion……………………………………………………………………………..33 Conclusion………………………………………………………………………………………………..33 Interpretation & discussion….………………….….……………………………………………33 Limitations and suggestions for future research……………………………………….35
Implications……………………….……………………………………………………………………..37 References…………………………………………………………………………………………………………..39
Appendix 1: Surveys…………………….………………………………………………………………………….42 Appendix 2: Factor analysis perceived HRM practices………………….……….………….…….51 Appendix 3: Factor analysis perceived added value………………………………………………..55 Appendix 4: Factor analysis HRM strengths…………..………………………………………………..57
5 Master Thesis Annelies Buddingh: The devolution of HRM practices
1. Introduction
Human Resource Management (HRM) refers to the practices, policies, and systems
that influence employees’ attitudes, behaviour, and performance. Many
organizations refer to HRM as involving ‘people practices’ (Noe, Hollenbeck, Gerhart,
Wright, 2003). There are several important practices that organizations can use to
manage their employees such as: selective staffing, extensive training, result-
oriented appraisal, and incentive rewards (Sun, Aryee, Law, 2007).
Practitioners and academics alike acknowledge that Line Managers (LMs) are
responsible for the execution and implementation of HRM practices in the
organization (Bos-Nehles, 2010). Indirectly, LMs have been regarded as key for the
effectiveness of HRM and the achievement of positive employee and organizational
performance (Soens, 2012). The rationale of why line involvement in HRM has
emerged in recent years is, according to Brewster and Larsen (2000), due to five
elements: cost reduction, providing a more comprehensive approach to HRM,
placing responsibility for HRM with managers most responsible for it, speeding up
decision making, and as an alternative to outsourcing the HR function. Experience as
well as research in the field of devolution of HR responsibilities to the line has shown
that the implementation of HR tasks by LMs is not always executed the way HRM
policy makers intended it initially. This may be caused by several factors. Bos-Nehles
(2010) argues that LMs experience five possible constraints in implementing HRM
practices: lack of time, lack of relevant HRM competence, lack of support from the
HRM department, lack of clear policies and procedures, and lack of motivation to
execute HRM responsibilities.
On the other hand Bowen and Ostroff (2004) argue that the HRM process
and conditions under which HRM practices are (not) effective, need to be taken into
account. The authors state that the degree of implementation of HRM practices in
the organization depends on the ‘strength of the HRM system’. They explain that the
HRM system is a process where features send signals to employees that enable them
to understand the appropriate and desired responses. When this eventually leads to
a collective sense of what is expected, we can speak of a strong HRM system.
6 Master Thesis Annelies Buddingh: The devolution of HRM practices
Until now researchers have mainly examined the relationship between HRM
practices and HRM system effectiveness (Combs, Hall, Ketchen, 2006; Paauwe &
Boselie, 2005; Subramony 2009), whereas the implementation of HRM has only
received limited attention. The aim of the current study is to reduce this gap in our
knowledge by obtaining insights in the implementation process of HRM practices
focussing on the pivotal role of LMs. These insights can help to attempt to optimize
the relationship between HRM managers and LMs in order to accelerate the
implementation process. The research question can be formulated as follows: To
what degree do HRM strengths, perceived by line managers, influence the degree of
implementation and perceived added value of HRM practices?
The paper starts out by presenting a theoretical framework to determine the
relationship between intended HRM practices by policy makers and perceived HRM
practices by employees and the pivotal role of the line-manger in this process.
Derived from the theory, hypotheses will be formulated. Subsequently the research
design and statistical procedure will be described.
2. Theoretical Framework
Implementation
HRM implementation is defined as the application and execution of HRM practices
(HRM content) in the organization (Guest & Bos-Nehles, 2013). “HRM content
consists of specific implemented bundles of HRM practices and policies. It refers to
the set of practices adopted, preferably largely driven by the strategic goals and
values of the organization.” (p. 12, Vigna, 2012)
Effective implementation of HRM practices is seen as the result of a fit
between strategic choice and the HRM architecture (Guest & Bos-Nehles, 2013). In
the ‘process model of SHRM’ it is argued by Nisshi and Wright (2008) that actual
HRM practices should influence perceived HRM practices and subsequently the
performance outcome. Ideally, one would assume that implemented HRM practices
are perceived the way they are intended by decision makers.
An issue which has been raised by understanding performance as an outcome
of HRM practices is known as the black-box problem. This black box problem is
7 Master Thesis Annelies Buddingh: The devolution of HRM practices
explained as the mediating links of intended, actual, and perceived HR practices that
influence the effectiveness of HRM systems (Boxall & Purcell, 2011). It is often
noticed that there is a gap between intended HRM policies and what is actually
delivered by LMs (Purcell & Huchinson, 2007). This particular study focuses on the
link between the intended HRM practices (initiated by the HRM department) and the
perceived practices (experienced by employees) where the degree and way of
execution of HRM practices by the Line Manager determines the degree of
implementation.
LMs are defined as the lowest level of managers at the operational level, who
manage a team of operational employees on a daily basis and who are responsible
for executing HRM activities. For several reasons LMs may be the best source of
research (Wright, McMahan, Snell, Gerhart, 2001). Firstly, they are users of the HRM
practices both as employees who are subject to them, and as managers who have a
vested interest in these practices in order to have the maximal positive impact on
their subordinate employees. Secondly, LMs have more extensive knowledge of
what might be best for the organization and are in a unique position to evaluate the
tradeoffs between practices that might be desired by employees, but would put the
organization in financial disadvantage. LMs are in the ideal position to make
decisions concerning how to balance the desires of and returns to shareholders,
customers, and employees. In this way they are in the position to influence the
alignment between individual objectives and organizational objectives. Lastly, LMs
lead HRM’s most important customer: the employee. (Wright et all, 2001).
This in turn leads to the following hypotheses:
Hypothesis 1: The intended HRM practices defined by HR managers are positively
related to the perceived degree of implementation by employees.
Hypothesis 2: The intended HRM practices defined by HR managers are positively
related to the perceived added value by LMs.
Besides a direct relationship between intended- and perceived HRM practices
and added value a moderator is proposed which might influence these relations:
HRM strengths. Recent literature argues that implementation by line managers
8 Master Thesis Annelies Buddingh: The devolution of HRM practices
depends to a considerable extent on features of the broader organizational context
(Guest & Bos-Nehles, 2013). ‘HRM system strengths’ are regarded to be such a
feature. With the aid of AMO- theory (Appelbaum, 2000) and theory on HRM system
strengths (Bowen & Ostroff, 2004) the conditions are defined under which intended
HRM unfolds to influence perceived HRM and added value.
AMO framework
An important theory to determine the degree of implementation - and the added
value of HRM - is the AMO framework (Appelbaum, 2000). This framework explains
the three requirements for employee performance: the A stands for ability, which
means that employees can perform the job, because they have the necessary
knowledge, skills and abilities. M is for motivation, which explains that employees
will perform the job, because they feel interested and incentivised. The O is for
opportunity, which means that the work structure and the environment provide the
necessary support for the employee to perform the job. All three factors are
involved in creating employee performance.
HRM practices typically include the empowerment, motivational, and skill
domains and are likely to influence business performance by simultaneously
providing employees with the opportunity to contribute to the organization’s
success, motivating them to perform, and increasing the skills of the workforce
(Subramony, 2009). According to the AMO framework it seems plausible that LMs
especially value HRM practices which increase the ability, motivation, and
opportunity of employees. So that kind of HRM practices (furthering ability,
motivation and opportunity) will lead to a higher degree of implementation. In that
line of thinking the three meta-features derived from the AMO literature are: ability
[1], motivation [2] and opportunity [3]. Besides the AMO framework, also theory on
HRM system strengths, as indicated by Bowen and Ostroff (2004), is relevant to
indicate other features for HRM strengths.
HRM strengths
Bowen and Ostroff (2004) argue that the HRM system is one of the most important
components which enable an organization to become more effective and to gain
9 Master Thesis Annelies Buddingh: The devolution of HRM practices
competitive advantage. The HRM system is defined as a process where features send
signals to employees that permit them to understand the desired and appropriate
responses and form a common sense of what is expected. They explain how a
‘strong climate’ can be regarded as a ‘strong situation’, where employees share a
common interpretation of what behaviors are expected and rewarded within the
organization. They propose a set of characteristics, based on social influence and
social cognitive theories, which permit HRM systems to create strong situations
where unambiguous messages are communicated to employees about the
appropriate behavior. These characteristics refer to the process whereby consistent
messages about HRM content are send to the organization’s members.
HRM practices are considered as communications from the employer to the
employee. In order to ensure that a message has its desired effect, the two-step
process of ‘reception’, encoding of the message, and ‘yielding’, acceptance of the
message, is crucial (McGuire, 1972).
Bowen and Ostroff (2004) developed a number of meta-features -
characteristics that allow messages to be received and to be interpreted similarly
among employees - on the basis of the attribution theory. Attribution theory states
that individuals can make confident attributions about cause-effect relationships in
situations depending on the strength of the system. The strength of the HRM system
is determined by three different factors: the distinctiveness, consistency, and
consensus of the communicated message. Distinctiveness means that the message is
clear and can be distinguished from other messages. Consistency means that the
message is consistent over time and in different situations. Consensus means that all
HRM authorities, including line management, agree on the content of the HRM
message. These features of the HRM process allow for employees to interpret, react
to and distribute information from HRM practices in a correct and collective way. A
shared perception of the HRM system and climate occurs. Bowen and Ostroff (2004)
propose that when the HRM system is perceived as high in distinctiveness,
consistency, and consensus, it will generate a ‘strong situation’ that supports HRM
implementation.
Derived from the literature (Bowen & Ostroff, 2004; Delmotte et all, 2012;
Bos-Nehles, 2010) five constructs, next to the AMO constructs, are developed to give
10 Master Thesis Annelies Buddingh: The devolution of HRM practices
meaning to the concept ‘HRM strengths’. The selection is made taking the LMs
perspective into account, according to which features they would consider to be the
most relevant in order to execute HRM-practices. Proposed is that when HRM
practices are perceived high in personal relevance, organizational relevance, validity,
procedural justice and user friendliness it will generate a strong situation (Bowen &
Ostroff, 2004) and therefore support HRM implementation (Guest & Conway, 2011).
Relevance refers to HRM content that is designed in such a way that LMs
perceive it as relevant so that it generates support to achieve an important goal. For
that reason relevance is associated with the concept distinctiveness (Bowen &
Ostroff, 2004). A distinction is made between personal relevance [4], meeting the
goals of the LM, and organizational relevance [5], meeting the goals of the unit of
the LM. The next indicator, validity [6], is covered by the concept consistency and
investigates whether HRM practices are consistent with what they promise to do and
what they actually do. When HRM content is perceived as valid by the LM, the
construct will contribute to generate a strong situation (Bowen & Ostroff, 2004). The
feature procedural justice [7] has been chosen to be included to cover the concept
consensus. Procedural justice refers to the extent to which HRM content, and the
decisions based on this content, are perceived as fair (Bowen & Ostroff, 2004;
Delmotte, De Winne & Sels, 2012). Besides procedural justice there are two other
elements of justice in an organizational context: distributive and interactional justice.
Distributive justice, which reflects on the fairness of the outcome, and procedural
justice are strongly related. Indeed, the more an employee considers a process fair,
the more tolerant the employee is about the consequences of the process.
Interactional justice is focussing on how decisions are communicated instead of the
fairness of the decision itself (Boxall & Purcell, 2011). For these reasons the concept
procedural justice has been chosen to cover the concept. The last indicator for HRM
strengths is user friendliness [8]. An important requirement for implementation of
HRM practices are clear policies and procedures (Bos-Nehles, 2010), or in other
words the conditions that provide LMs with the knowledge of how to execute the
HRM practices. To recapitulate, the meta-features covering HRM strengths are: [1]
ability, [2] motivation, [3] opportunity, [4] personal relevance, [5] organizational
relevance, [6] validity, [7] procedural justice, and [8] user friendliness.
11 Master Thesis Annelies Buddingh: The devolution of HRM practices
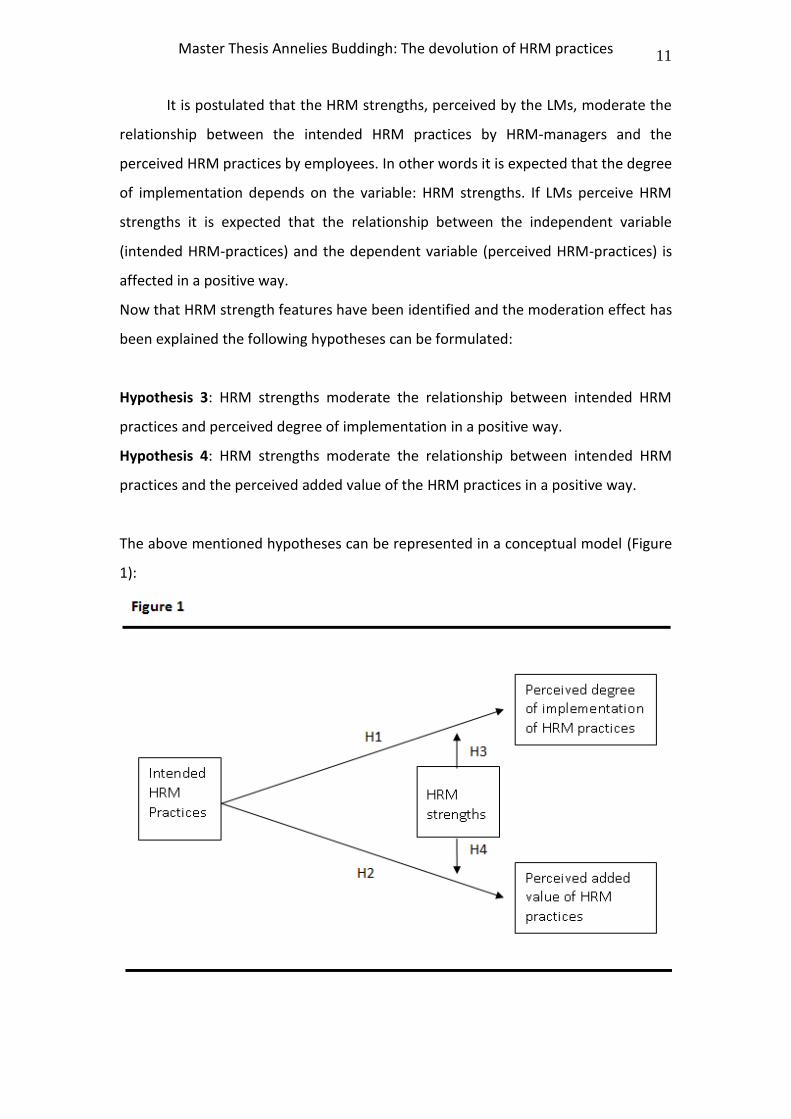
It is postulated that the HRM strengths, perceived by the LMs, moderate the
relationship between the intended HRM practices by HRM-managers and the
perceived HRM practices by employees. In other words it is expected that the degree
of implementation depends on the variable: HRM strengths. If LMs perceive HRM
strengths it is expected that the relationship between the independent variable
(intended HRM-practices) and the dependent variable (perceived HRM-practices) is
affected in a positive way.
Now that HRM strength features have been identified and the moderation effect has
been explained the following hypotheses can be formulated:
Hypothesis 3: HRM strengths moderate the relationship between intended HRM
practices and perceived degree of implementation in a positive way.
Hypothesis 4: HRM strengths moderate the relationship between intended HRM
practices and the perceived added value of the HRM practices in a positive way.
The above mentioned hypotheses can be represented in a conceptual model (Figure
1):
12 Master Thesis Annelies Buddingh: The devolution of HRM practices
3. Research Design
Quantitative data was collected with the aid of on-line questionnaires. The
questionnaires were distributed within different organizations in the Netherlands.
The design of the empirical research was cross-sectional with a multi-respondent
approach. The different respondents as sources for data were: HRM managers, Line-
Managers and employees. HRM managers determined the HRM content and
employees provided data about the perceived degree of implementation. LMs
provided the data to measure the HRM strengths as well as the data for the
perceived added value of the HRM function. The unit of analysis was the Line
Managers department in an organization (=N).
1. Population and Sample
Different kinds of organizations located in the Netherlands were approached. The
size of the organizations varied. The minimum requirement for participation was
however the presence of at least one person responsible for HRM. Ideally one HRM
manager filled in the questionnaire about the HRM content in the organization and
passed on the other questionnaires about HRM strengths and perceived added value
of the HRM function to five Line-Managers who respectively passed on the
questionnaire about the degree of implementation to five subordinate employees.
Some larger organizations participated with more than one HR manager, in that case
the amount of other respondent groups in that particular organization increased as
well.
2. Procedure
Questionnaires were a suitable research tool to collect large amounts of data. Taking
costs and time into account the use of online surveys was preferable.
Prior to the questionnaire a brief introduction and instructions were provided. The
subject and the composition of the questionnaire were explained. Information was
given about what the data will be used for, where the questionnaire came from and
the period of time for filling it in. Assurance was given that the collected data would
be treated confidentially and that anonymity was guaranteed.
13 Master Thesis Annelies Buddingh: The devolution of HRM practices
The choice was made to collect data from various actors (HRM managers,
LMs, and employees) to avoid the single source bias. This was done because the
reliability of a single rater is typically quite weak (Gerhart, Wright, McMahan & Snell,
2000). Furthermore, use was made of a multi-method approach to avoid the
common method bias. Various scales were adapted from previous research projects.
The surveys were available in English and Dutch. All the questions of the three
different surveys were translated and retranslated from English to Dutch by two
independent translators which ensured that the Dutch version was equivalent to the
English version (Brislin, 1970). It was estimated that each single respondent would
need 10 minutes to fill in the survey.
3. Instrument
The questionnaire measured different variables. The operationalization of the
variables in the study is shown below. For an overview of the items on the
questionnaires see Appendix 1. The items were to be measured on a six point Likert
scale from totally disagree (1) to totally agree (6).
HRM content and degree of implementation.
The sources of data to measure the ‘HRM content’ and the ‘degree of
implementation’ were respectively the HRM managers and employees. In order to
identify a certain degree of implementation there needed to be a match between
both questionnaires. Use was made of an adapted scale by Vigna (2012) to measure
eight different HRM practices. This scale was largely acquired from Sun, Aryee and
Law (2007), but Vigna formulated two additional items to increase the Cronbach’s
alpha for the dimensions ‘employment security’ and ‘incentive rewards’. The 28-item
scale from Vigna (2012) was adapted to the referent categories resulting in two
different surveys. The scale included eight dimensions, the first alpha was from the
scale of HR-managers, the second represented the alpha from the scale of
employees: ‘selective staffing’ (4 items, α.87 & α .86) with the example item: “great
effort is taken to select the right person”; ‘Extensive training’ (4 items, α .92 & α .87)
with the example item: “extensive training programs are provided”; ‘Internal
mobility’ (4 items, α .81 & α .83), with the example item: “Employees who desire
14 Master Thesis Annelies Buddingh: The devolution of HRM practices
promotion have more than one potential position they could be promoted to”;
“Employment security” (3 items, α .84 & α .89), with the example item: “Employees
can be expected to stay with this organization for as long as they wish”; ‘Clear job
description’ (3 items, α .83 & α .91), with the example item: “Jobs have an up-to-
date description”; ‘Result-oriented appraisal’ (3 items, α .81 & α .83), with the
example item: “Performance is measured with objective quantifiable results”;
‘Incentive rewards’ (3 items, α .76 & α .79), with the example item: “Employees are
rewarded based on their actual performance’; and ‘Participation’ (4 items, α .84 & α
.85), with the example item: “Employees are often asked by their supervisor to
participate in decisions”. According to DeVellis (2003), the minimum requirement for
an alpha to be acceptable is .7, however values above .8 are preferable. In the
current study the Cronbach alpha coefficients were > .766
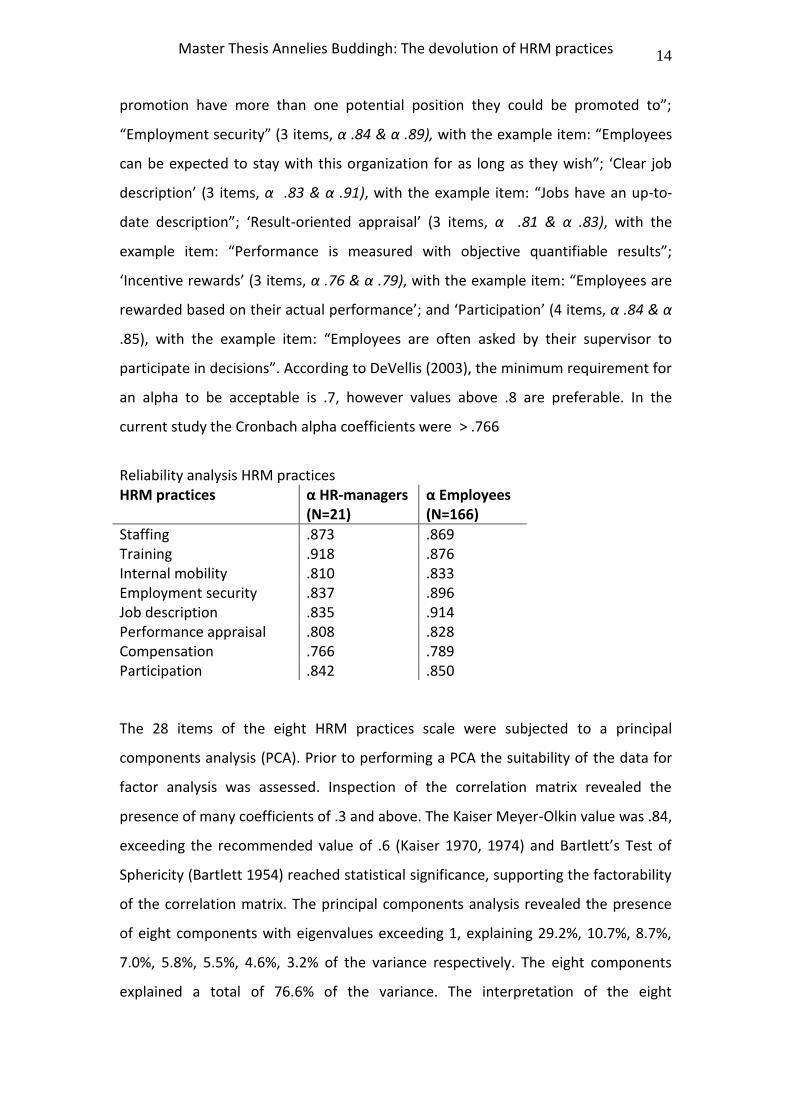
Reliability analysis HRM practices
The 28 items of the eight HRM practices scale were subjected to a principal
components analysis (PCA). Prior to performing a PCA the suitability of the data for
factor analysis was assessed. Inspection of the correlation matrix revealed the
presence of many coefficients of .3 and above. The Kaiser Meyer-Olkin value was .84,
exceeding the recommended value of .6 (Kaiser 1970, 1974) and Bartlett’s Test of
Sphericity (Bartlett 1954) reached statistical significance, supporting the factorability
of the correlation matrix. The principal components analysis revealed the presence
of eight components with eigenvalues exceeding 1, explaining 29.2%, 10.7%, 8.7%,
7.0%, 5.8%, 5.5%, 4.6%, 3.2% of the variance respectively. The eight components
explained a total of 76.6% of the variance. The interpretation of the eight
HRM practices α HR-managers (N=21)
α Employees (N=166)
Staffing .873 .869 Training .918 .876 Internal mobility .810 .833 Employment security .837 .896 Job description .835 .914 Performance appraisal .808 .828 Compensation .766 .789 Participation .842 .850
15 Master Thesis Annelies Buddingh: The devolution of HRM practices
components was consistent with previous research on the HRM practices Scale
(Vigna, 2012). The pattern and component matrix are presented in Appendix 2.
HRM strengths and added value
In order to measure HRM strengths and the perceived added value of the HR
function, data was gathered from LMs. The scale to measure the HRM strengths
consisted of eight meta-features of the HRM function and was based on existing
scales of Delmotte, Winne and Sels (2011), Bos-Nehles (2010), Guay, Vallerand, and
Blanchard (2000), Liao and Rupp (2005), and self-constructed items (Buddingh,
Ritzen & Yaneva, 2013). A confirmatory factor analysis was conducted to confirm
whether eight dimensions and 26 items were acceptable. The eight identified HRM
strengths were: ‘Abilities’ (3 items, α .81 ), with the example item: “HRM practices
help my unit to grow, improve and develop”; ‘motivation’ (4 items, α.73), with the
example item: “I carry out HRM practices, because I have good reasons to do so”;
‘Opportunity’ (3 items, α.86), with the example item: “HRM practices help my unit to
get involved in the organization”; ‘Personal relevance’ (4 items, α.70), with the
example item: “The HRM department develops HRM practices that I need”;
‘Organizational relevance’ (3 items, α.79), with the example item: “HRM practices
help me to reach the goals of my unit”; ‘Validity’ (3 items, α.82), with the example
item: “I can have faith that the HRM practices realize the intended purpose”;
‘Procedural justice’ (3 items, α.82), with the example item: “Procedures and
guidelines of HRM practices are fair”; and ‘User friendliness’ (3 items, α.83), with the
example item: “The HRM practices I am provided with are clear and
understandable”.
The reliability analysis was acceptable (DeVellis, 2003), because all the alpha’s were
> .7
Reliability analysis N = 54
HRM Strengths α
Ability .808 Motivation .735 Opportunity .856 Personal relevance .702
16 Master Thesis Annelies Buddingh: The devolution of HRM practices
The 26 items of the ‘HRM Strength’ scale were subjected to a principal
components analysis (PCA). Prior to performing the PCA the suitability of data for
factor analysis was assessed. The Kaiser-Meyer-Olkin value was .666, therefore
exceeding the recommended value of .6 (Kaiser 1970, 1974) and Bartlett’s Test of
Sphericity (Bartlett 1954) reached statistical significance, the correlation matrix
revealed barely coefficients of .3 and above. This did not support the factorability of
the correlation matrix. In some cases the items did load on the desired factor, e.g.
opportunity. Considering the limited sample size of LMs (N=54) a factor analysis was
not reliable. Ideally, the overall sample size should be more than 150 (Pallant, 2010).
The pattern and component matrix are shown in Appendix 4. Despite the limited
sample size, it was possible to identify quite some items which load on the desired
factor. It was plausible that a lager sample would generate an acceptable result. This
assumption and the theoretical foundation on HRM strengths led to the decision to
pursue the analysis with the eight initially designed ‘HRM strengths’.
The second part of the survey was also filled in by the Line-Managers. It
consisted of a 10-item scale to measure the perceived added value and was adopted
from Wright, McMahan, Snell and Gerhart (2001). The Cronbach’s alpha for this
‘added value’ scale was .919. According to DeVellis (2003), this is perfectly reliable.
An example question was “The HRM department is performing its job the way I
would like it to be performed”. The 10 items of the ‘perceived added value’ scale
were subjected to a principal components analysis (PCA). Beforehand the suitability
of data for the factor analysis was assessed. The correlation matrix revealed the
presence of many coefficients of .3 and above. The Kaiser-Meyer-Olkin value was
.87, exceeding the recommended value of .6 (Kaiser 1970, 1974) and Bartlett’s Test
of Sphericity (Bartlett 1954) reached statistical significance, supporting the
factorability of the correlation matrix. The PCA revealed, as expected, the presence
of 1 component with an eigenvalue exceeding 1, explaining 59,08% of the variance.
The component matrix is presented in Appendix 3.
Organizational relevance .793 Validity .819 Procedural Justice .816 User friendliness .830
17 Master Thesis Annelies Buddingh: The devolution of HRM practices
Control variables
Two control variables were taken into account to investigate possible spurious
effects and isolate the impact of the main independent variable. Organizational size
and organizational age were regarded to have an impact on HRM practices, because
large and well-established organizations have more access to resources (Boselie,
Diets & Boon, 2005). According to Boselie, Diets and Boon (2005) size in particular
does matter because they found this control variable in sixty-four studies. Age was
found in twenty-five studies. The size of the organization was measured by marking
the amount of employees working in de organization. The organizational age was
measured in years.
4. Initial plan for statistical analysis
After gathering the data the statistical analysis was executed with the use of SPSS.
Both exploratory and confirmatory factor analyses were conducted to test whether
the items and dimensions of the three different surveys were acceptable. Firsty, the
Bartlett’s test of sphericity (Bartlett, 1954) and the Kaiser-Meyer-Olkin (KMO)
(Kaiser, 1970) index was used to assess the factorability of the scales. Secondly,
Kaiser’s criterion and Catell’s scree (Catell, 1966) test were used to do factor
extraction in order to determine the smallest number of factors. Thirdly, to check
which items load onto which factors, oblimin rotation was performed. And finally,
the Cronbach’s alpha was determined to test the reliability of each factor. The
minimum requirement for an alpha to be acceptable is .7, however values above .8
are preferable (DeVellis, 2003)
Before conducting the regression analysis the intra-class correlation
coefficients, ICC(1), needed to be examined in order to justify multilevel data
analyses. The ICC(1) determines whether the data from employees can be
aggregated to the department level and can be analyzed as a group mean (LeBreton
& Senter, 2008). The data needed to be aggregated in order to compare the results
between the dataset from different respondent groups.
18 Master Thesis Annelies Buddingh: The devolution of HRM practices
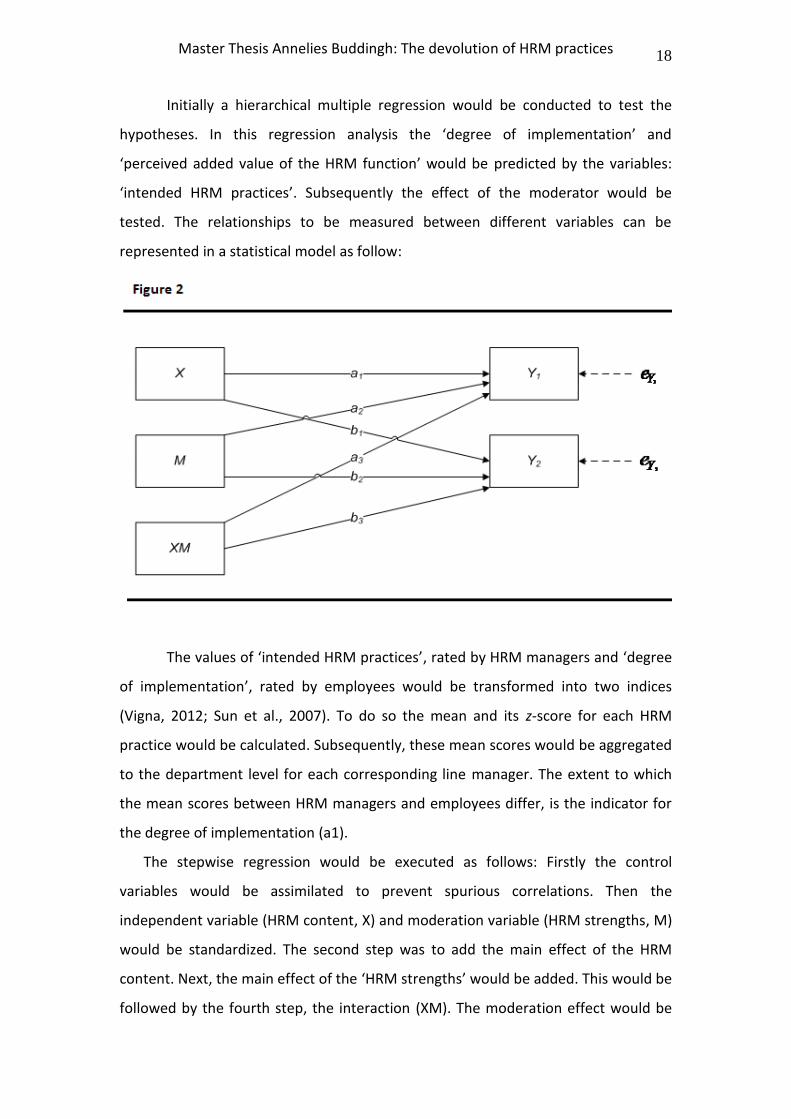
Initially a hierarchical multiple regression would be conducted to test the
hypotheses. In this regression analysis the ‘degree of implementation’ and
‘perceived added value of the HRM function’ would be predicted by the variables:
‘intended HRM practices’. Subsequently the effect of the moderator would be
tested. The relationships to be measured between different variables can be
represented in a statistical model as follow:
The values of ‘intended HRM practices’, rated by HRM managers and ‘degree
of implementation’, rated by employees would be transformed into two indices
(Vigna, 2012; Sun et al., 2007). To do so the mean and its z-score for each HRM
practice would be calculated. Subsequently, these mean scores would be aggregated
to the department level for each corresponding line manager. The extent to which
the mean scores between HRM managers and employees differ, is the indicator for
the degree of implementation (a1).
The stepwise regression would be executed as follows: Firstly the control
variables would be assimilated to prevent spurious correlations. Then the
independent variable (HRM content, X) and moderation variable (HRM strengths, M)
would be standardized. The second step was to add the main effect of the HRM
content. Next, the main effect of the ‘HRM strengths’ would be added. This would be
followed by the fourth step, the interaction (XM). The moderation effect would be
19 Master Thesis Annelies Buddingh: The devolution of HRM practices
measured by multiplying the ‘HRM content’ by ‘each standardized HRM strength’.
Consequently 16 regressions would appear: X * M * Y1 (perceived degree of
implementation) + X * M * Y2 (added value of HRM function). If the regressions
would be significant the moderation effect would be proved and in that case the
relationships a3 and b3 could be confirmed.
4. Results
1. Contingencies
The aim of this research was to investigate how the HRM content, implemented by
the HRM department, would effect the perceived degree of implementation of HRM
practices by employees and the perceived added value of the HRM function by line-
management. Subsequently the intention was to measure the moderation effect of
‘HRM strengths’ in these relationships. Unfortunately, derived from the collected
data it was not possible to measure these moderation effects, since we experienced
difficulties clustering the data. After the data was collected it was in most cases not
possible to define which LMs belonged to which HR-manager and which employee
belonged to which LM. Apparently the majority of our respondents did not
understand what to fill in when we asked for ‘division’/‘department’/’department
code’. However it was possible to create clusters of respondents per organization, so
it was decided to analyze merely direct effects.
Theoretical underpinning
Bowen and Ostroff (2004) describe how HRM practices influence employee
perceptions of climate at the individual level. In a strong situation, variability among
employees, or in this case line managers’ perceptions, of the meaning of the
situation will be small and will reflect a common desired content. In turn,
organizational climate will show a significant association with employee behaviors
and attitudes. This occurs because a strong HRM system can foster similar
viewpoints in such a way that the situation leads every employee or LM to see the
situation similarly, causes uniform expectancies about reactions, provides clear
expectations about rewards for the desired reactions and behaviors and induces
compliance and conformity through social influences.
20 Master Thesis Annelies Buddingh: The devolution of HRM practices
If the HRM system is weak, HRM practices will send messages that are
ambiguous and subject to individual interpretation. In that case variability and
unintended making sense may happen, because LMs will not experience the HRM
practices to be in line with a HRM system where distinctiveness, consistency and
consensus are paramount (Bowen & Ostroff, 2004).
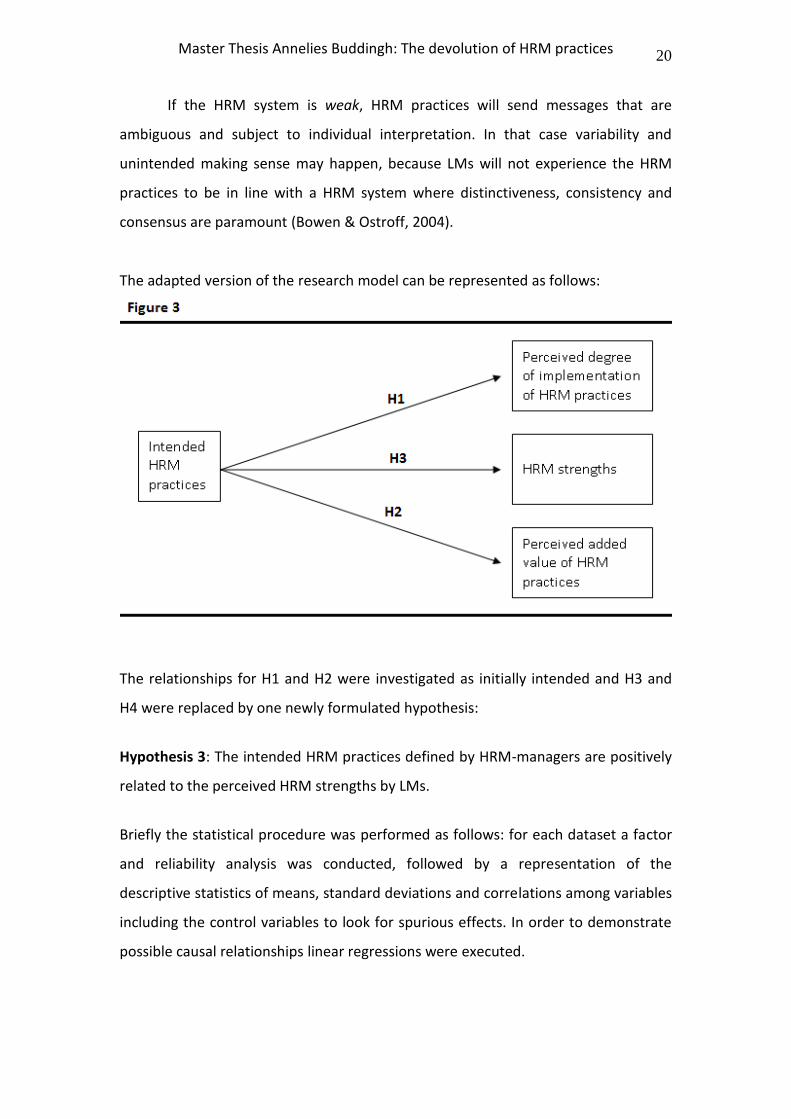
The adapted version of the research model can be represented as follows:
The relationships for H1 and H2 were investigated as initially intended and H3 and
H4 were replaced by one newly formulated hypothesis:
Hypothesis 3: The intended HRM practices defined by HRM-managers are positively
related to the perceived HRM strengths by LMs.
Briefly the statistical procedure was performed as follows: for each dataset a factor
and reliability analysis was conducted, followed by a representation of the
descriptive statistics of means, standard deviations and correlations among variables
including the control variables to look for spurious effects. In order to demonstrate
possible causal relationships linear regressions were executed.
21 Master Thesis Annelies Buddingh: The devolution of HRM practices
2. Perceived degree of implementation of HRM practices (Hypothesis 1)
Descriptive statistics
In Table 1 the means, standard deviations and correlations of all the variables are
presented, and also the control variables organizational age and size are included.
The values are calculated for respondents of all organizations together. Table 1
represents as expected several positive correlations between intended HRM-
practices and perceived HRM-practices. Significant relationships (p < .01) are
identified for six out of eight practices: Staffing (r=.265), Training (r=.563),
Employment security (r=.284), Clear job description (r=.354), Performance appraisal
(r=.246), Compensation (r=.481). For the practices ‘Internal mobility’ and ‘Employee
participation’ no significant relationships are found.
The control variables ‘Organizational age’ and ‘Organizational size’ show significant
correlations with multiple HRM practices. These variables are therefore included in
the regression analysis.
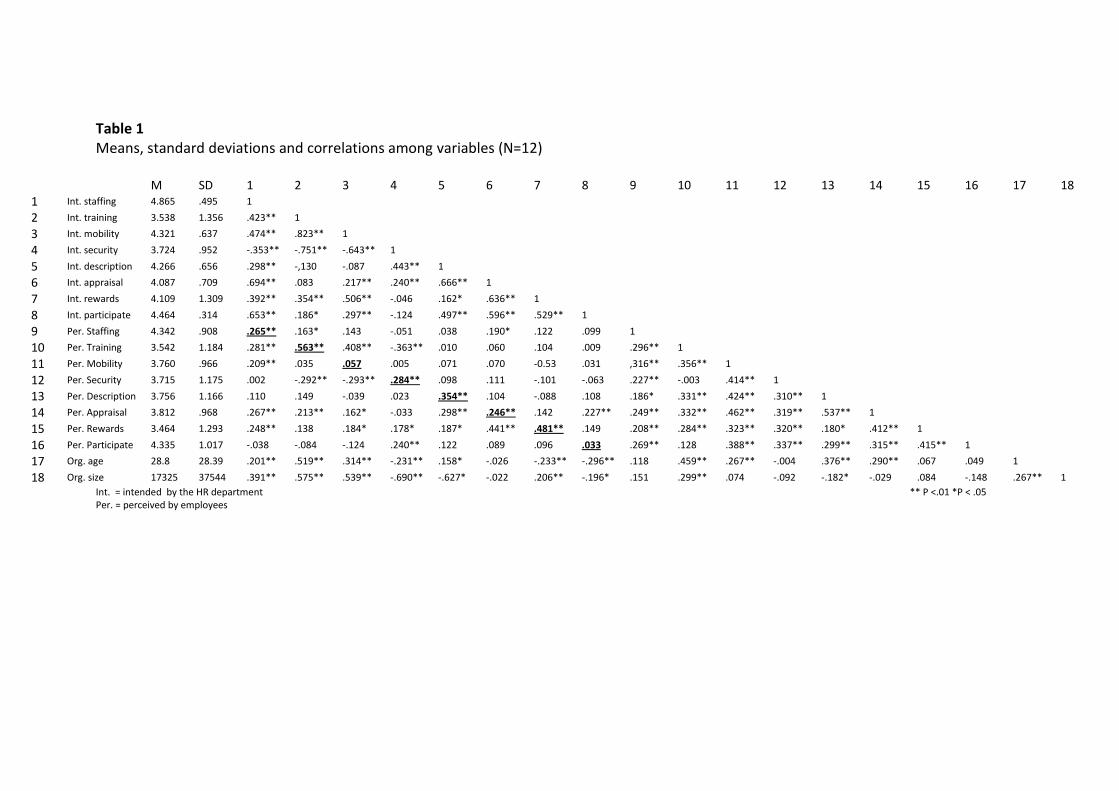
Table 1 Means, standard deviations and correlations among variables (N=12)
M SD 1 2 3 4 5 6 7 8 9 10 11 12 13 14 15 16 17 18 1 Int. staffing 4.865 .495 1
2 Int. training 3.538 1.356 .423** 1
3 Int. mobility 4.321 .637 .474** .823** 1
4 Int. security 3.724 .952 -.353** -.751** -.643** 1
5 Int. description 4.266 .656 .298** -,130 -.087 .443** 1
6 Int. appraisal 4.087 .709 .694** .083 .217** .240** .666** 1
7 Int. rewards 4.109 1.309 .392** .354** .506** -.046 .162* .636** 1
8 Int. participate 4.464 .314 .653** .186* .297** -.124 .497** .596** .529** 1
9 Per. Staffing 4.342 .908 .265** .163* .143 -.051 .038 .190* .122 .099 1
10 Per. Training 3.542 1.184 .281** .563** .408** -.363** .010 .060 .104 .009 .296** 1
11 Per. Mobility 3.760 .966 .209** .035 .057 .005 .071 .070 -0.53 .031 ,316** .356** 1
12 Per. Security 3.715 1.175 .002 -.292** -.293** .284** .098 .111 -.101 -.063 .227** -.003 .414** 1
13 Per. Description 3.756 1.166 .110 .149 -.039 .023 .354** .104 -.088 .108 .186* .331** .424** .310** 1
14 Per. Appraisal 3.812 .968 .267** .213** .162* -.033 .298** .246** .142 .227** .249** .332** .462** .319** .537** 1
15 Per. Rewards 3.464 1.293 .248** .138 .184* .178* .187* .441** .481** .149 .208** .284** .323** .320** .180* .412** 1
16 Per. Participate 4.335 1.017 -.038 -.084 -.124 .240** .122 .089 .096 .033 .269** .128 .388** .337** .299** .315** .415** 1
17 Org. age 28.8 28.39 .201** .519** .314** -.231** .158* -.026 -.233** -.296** .118 .459** .267** -.004 .376** .290** .067 .049 1
18 Org. size 17325 37544 .391** .575** .539** -.690** -.627* -.022 .206** -.196* .151 .299** .074 -.092 -.182* -.029 .084 -.148 .267** 1
Int. = intended by the HR department ** P <.01 *P < .05 Per. = perceived by employees
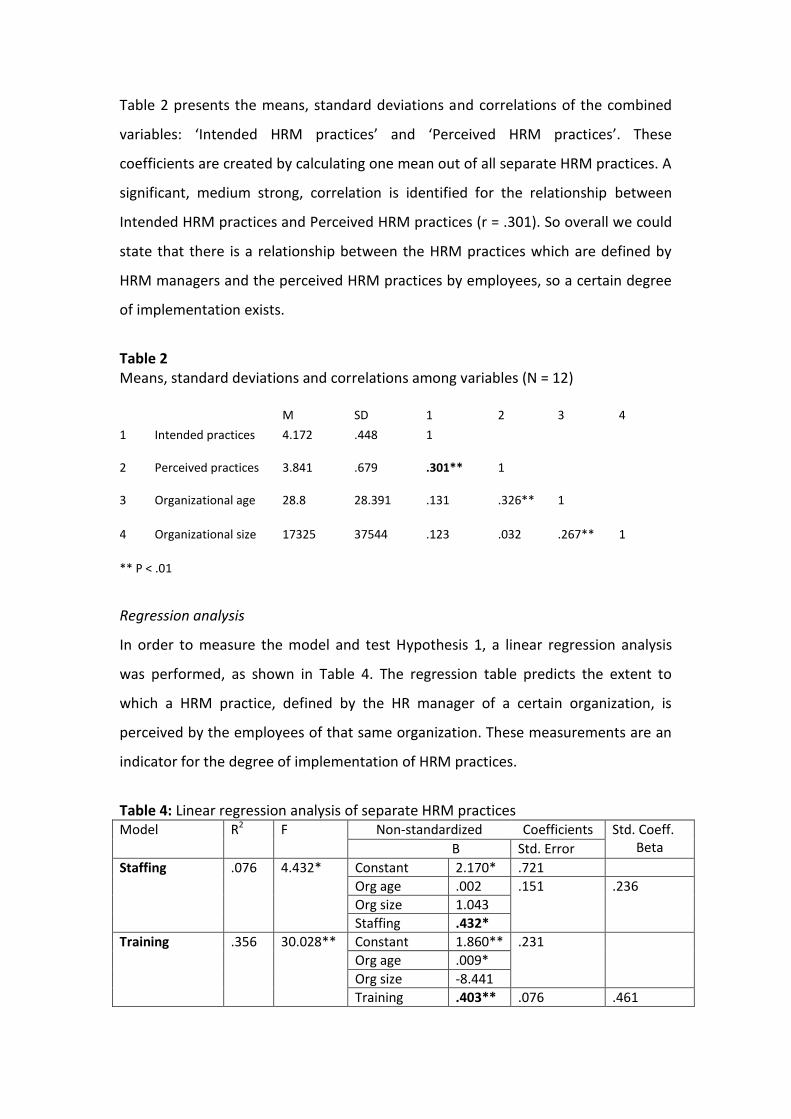
Table 2 presents the means, standard deviations and correlations of the combined
variables: ‘Intended HRM practices’ and ‘Perceived HRM practices’. These
coefficients are created by calculating one mean out of all separate HRM practices. A
significant, medium strong, correlation is identified for the relationship between
Intended HRM practices and Perceived HRM practices (r = .301). So overall we could
state that there is a relationship between the HRM practices which are defined by
HRM managers and the perceived HRM practices by employees, so a certain degree
of implementation exists.
Table 2 Means, standard deviations and correlations among variables (N = 12) M SD 1 2 3 4
1 Intended practices 4.172 .448 1
2 Perceived practices 3.841 .679 .301** 1
3 Organizational age 28.8 28.391 .131 .326** 1
4 Organizational size 17325 37544 .123 .032 .267** 1
** P < .01
Regression analysis
In order to measure the model and test Hypothesis 1, a linear regression analysis
was performed, as shown in Table 4. The regression table predicts the extent to
which a HRM practice, defined by the HR manager of a certain organization, is
perceived by the employees of that same organization. These measurements are an
indicator for the degree of implementation of HRM practices.
Table 4: Linear regression analysis of separate HRM practices Model R2 F Non-standardized Coefficients Std. Coeff.
Beta B Std. Error
Staffing .076 4.432* Constant 2.170* .721
Org age .002 .151 .236
Org size 1.043
Staffing .432*
Training .356 30.028** Constant 1.860** .231
Org age .009*
Org size -8.441
Training .403** .076 .461
24 Master Thesis Annelies Buddingh: The devolution of HRM practices
** = p < .001 * = p < .05
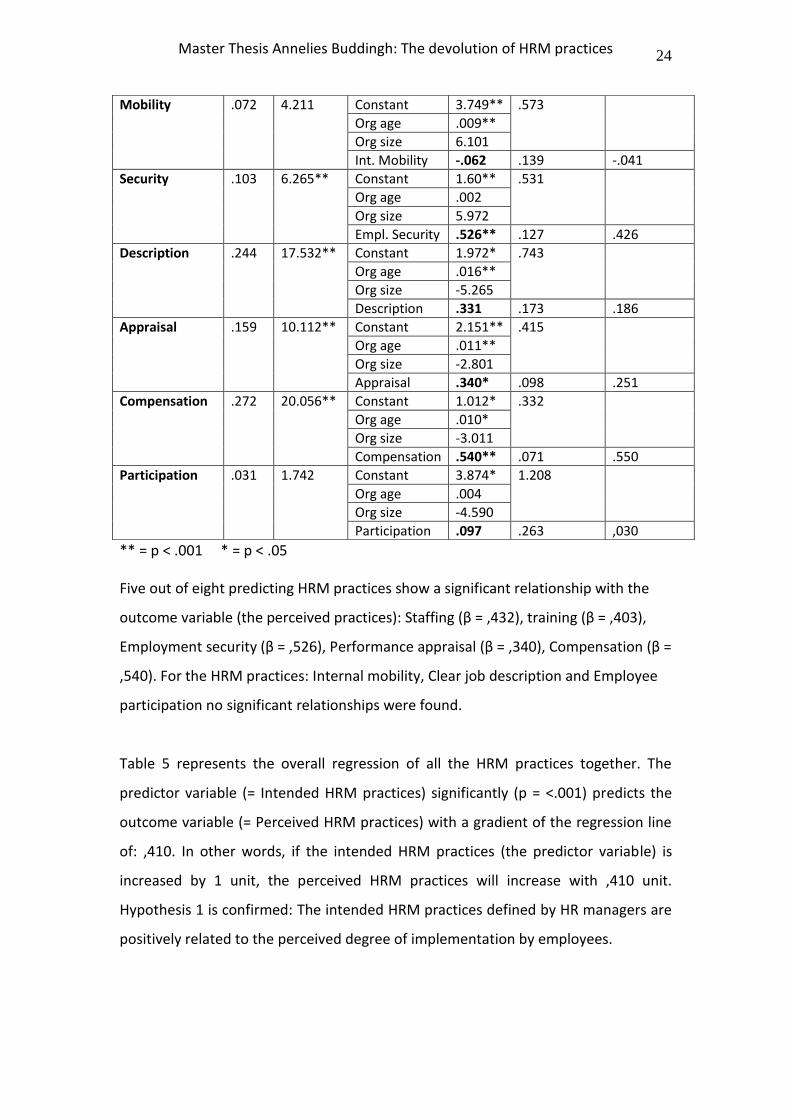
Five out of eight predicting HRM practices show a significant relationship with the
outcome variable (the perceived practices): Staffing (β = ,432), training (β = ,403),
Employment security (β = ,526), Performance appraisal (β = ,340), Compensation (β =
,540). For the HRM practices: Internal mobility, Clear job description and Employee
participation no significant relationships were found.
Table 5 represents the overall regression of all the HRM practices together. The
predictor variable (= Intended HRM practices) significantly (p = <.001) predicts the
outcome variable (= Perceived HRM practices) with a gradient of the regression line
of: ,410. In other words, if the intended HRM practices (the predictor variable) is
increased by 1 unit, the perceived HRM practices will increase with ,410 unit.
Hypothesis 1 is confirmed: The intended HRM practices defined by HR managers are
positively related to the perceived degree of implementation by employees.
Mobility .072 4.211 Constant 3.749** .573
Org age .009**
Org size 6.101
Int. Mobility -.062 .139 -.041
Security .103 6.265** Constant 1.60** .531
Org age .002
Org size 5.972
Empl. Security .526** .127 .426
Description .244 17.532** Constant 1.972* .743
Org age .016**
Org size -5.265
Description .331 .173 .186
Appraisal .159 10.112** Constant 2.151** .415
Org age .011**
Org size -2.801
Appraisal .340* .098 .251
Compensation .272 20.056** Constant 1.012* .332
Org age .010*
Org size -3.011
Compensation .540** .071 .550
Participation .031 1.742 Constant 3.874* 1.208
Org age .004
Org size -4.590
Participation .097 .263 ,030
25 Master Thesis Annelies Buddingh: The devolution of HRM practices
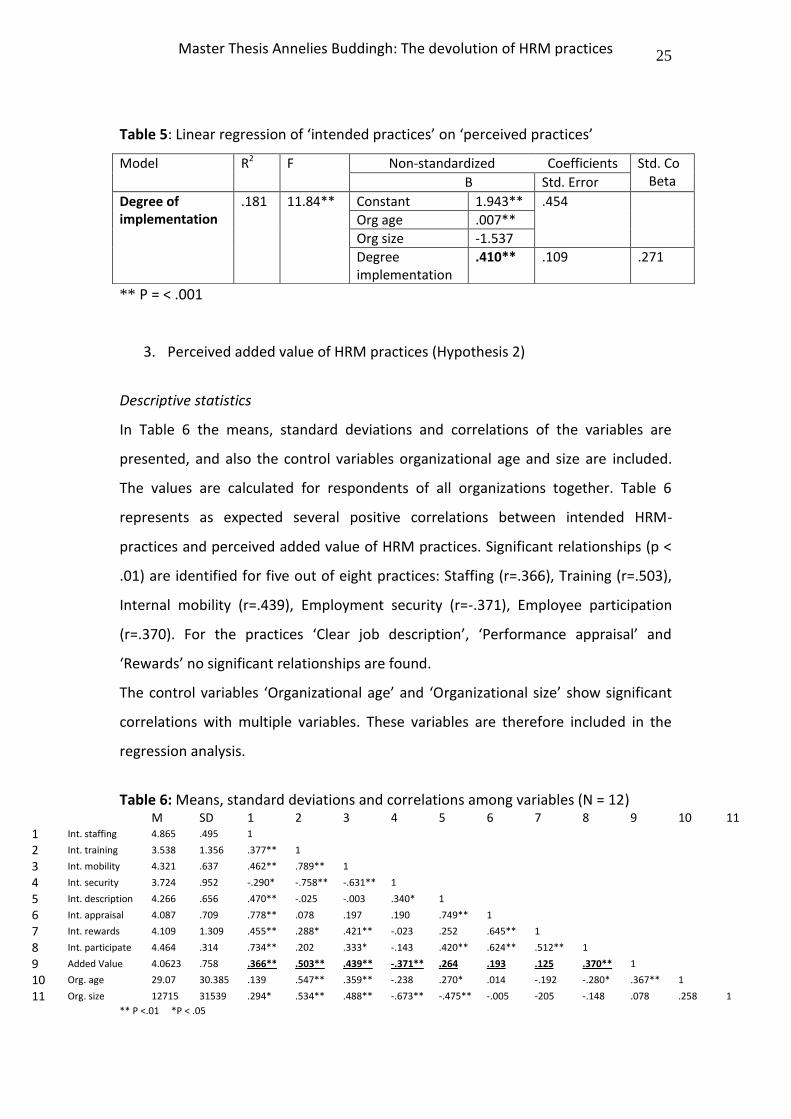
Table 5: Linear regression of ‘intended practices’ on ‘perceived practices’
** P = < .001
3. Perceived added value of HRM practices (Hypothesis 2)
Descriptive statistics
In Table 6 the means, standard deviations and correlations of the variables are
presented, and also the control variables organizational age and size are included.
The values are calculated for respondents of all organizations together. Table 6
represents as expected several positive correlations between intended HRM-
practices and perceived added value of HRM practices. Significant relationships (p <
.01) are identified for five out of eight practices: Staffing (r=.366), Training (r=.503),
Internal mobility (r=.439), Employment security (r=-.371), Employee participation
(r=.370). For the practices ‘Clear job description’, ‘Performance appraisal’ and
‘Rewards’ no significant relationships are found.
The control variables ‘Organizational age’ and ‘Organizational size’ show significant
correlations with multiple variables. These variables are therefore included in the
regression analysis.
Table 6: Means, standard deviations and correlations among variables (N = 12)
** P <.01 *P < .05
Model R2 F Non-standardized Coefficients Std. Co Beta B Std. Error
Degree of implementation
.181 11.84** Constant 1.943** .454
Org age .007**
Org size -1.537
Degree implementation
.410** .109 .271
M SD 1 2 3 4 5 6 7 8 9 10 11 1 Int. staffing 4.865 .495 1
2 Int. training 3.538 1.356 .377** 1
3 Int. mobility 4.321 .637 .462** .789** 1
4 Int. security 3.724 .952 -.290* -.758** -.631** 1
5 Int. description 4.266 .656 .470** -.025 -.003 .340* 1
6 Int. appraisal 4.087 .709 .778** .078 .197 .190 .749** 1
7 Int. rewards 4.109 1.309 .455** .288* .421** -.023 .252 .645** 1
8 Int. participate 4.464 .314 .734** .202 .333* -.143 .420** .624** .512** 1
9 Added Value 4.0623 .758 .366** .503** .439** -.371** .264 .193 .125 .370** 1
10 Org. age 29.07 30.385 .139 .547** .359** -.238 .270* .014 -.192 -.280* .367** 1
11 Org. size 12715 31539 .294* .534** .488** -.673** -.475** -.005 -205 -.148 .078 .258 1
26 Master Thesis Annelies Buddingh: The devolution of HRM practices
Table 7 presents the means, standard deviations and correlations of the combined
variables: ‘Intended HRM practices’ and ‘Perceived added value’. These coefficients
are created by calculating one mean out of all separate HRM practices. A significant,
medium strong, correlation is identified for the relationship between Intended HRM
practices and Perceived added value (r = .389). So we could state that there is a
relationship between the HRM practices which are defined by HRM managers and
the perceived added value of HRM practices by LMs.
Table 7: Means, standard deviations and correlations among combined constructs (N = 12) M SD 1 2 3 4
1 Intended practices 4.159 .459 1
2 Added value 4.062 .758 .389** 1
3 Organizational age 28.8 28.391 .176 .367** 1
4 Organizational size 17325 37544 .126 .078 .258 1
** P < .001
Regression analysis
In order to measure the model and test Hypothesis 2, a linear regression analysis
was performed, as shown in Table 8. The regression table predicts the extent to
which a HRM practice, defined by the HR manager of a certain organization, is
perceived by the LMs of that same organization as added value. These
measurements are an indicator for the degree of added value of HRM practices from
the perspective of LMs.
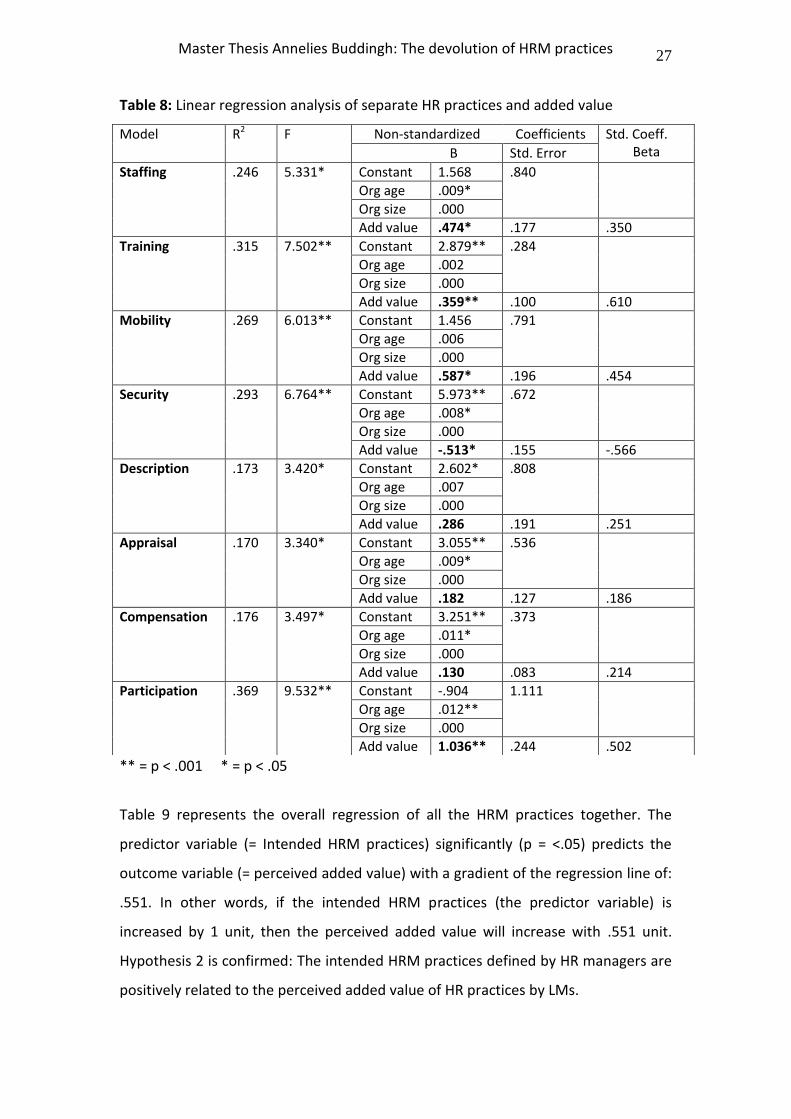
Five out of eight predicting HRM practices show a significant relationship with the
outcome variable (the perceived added value): Staffing (β = .474), Training (β = .359),
Internal mobility (β = .587), Employment security (β = -.513), Employee participation
(β = 1.036)
27 Master Thesis Annelies Buddingh: The devolution of HRM practices
Table 8: Linear regression analysis of separate HR practices and added value
** = p < .001 * = p < .05
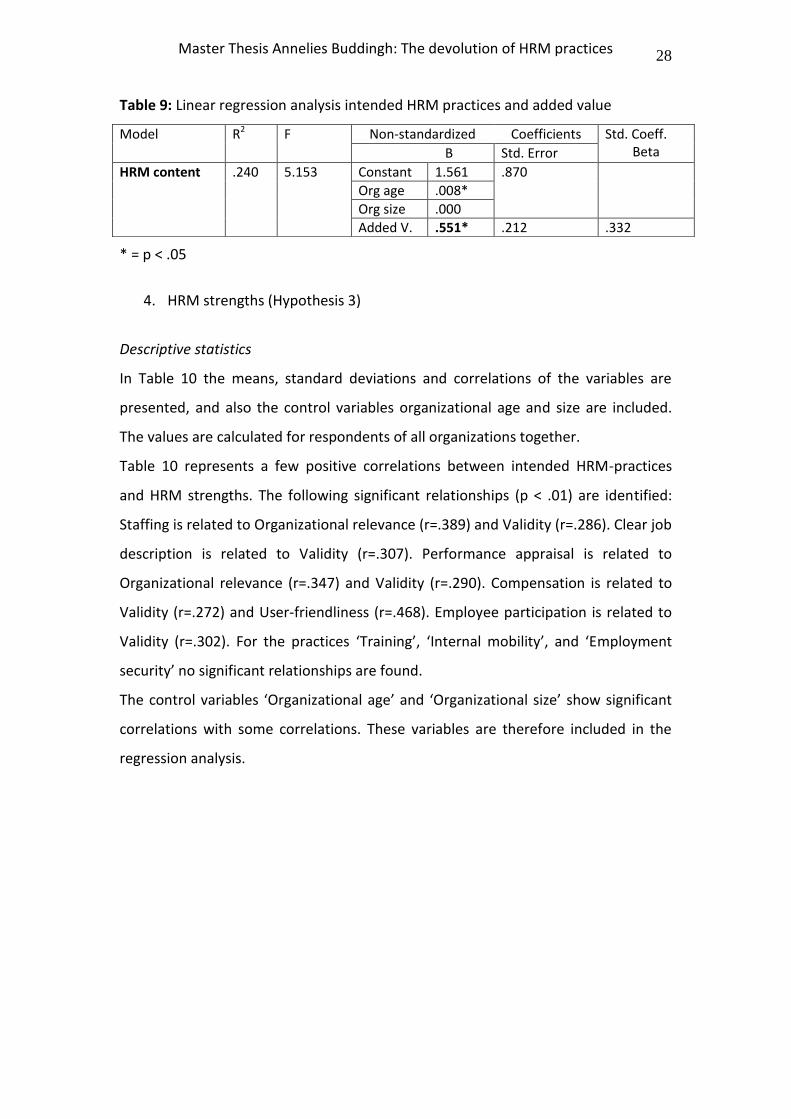
Table 9 represents the overall regression of all the HRM practices together. The
predictor variable (= Intended HRM practices) significantly (p = <.05) predicts the
outcome variable (= perceived added value) with a gradient of the regression line of:
.551. In other words, if the intended HRM practices (the predictor variable) is
increased by 1 unit, then the perceived added value will increase with .551 unit.
Hypothesis 2 is confirmed: The intended HRM practices defined by HR managers are
positively related to the perceived added value of HR practices by LMs.
Model R2 F Non-standardized Coefficients Std. Coeff. Beta B Std. Error
Staffing .246 5.331* Constant 1.568 .840
Org age .009*
Org size .000
Add value .474* .177 .350
Training .315 7.502** Constant 2.879** .284
Org age .002
Org size .000
Add value .359** .100 .610
Mobility .269 6.013** Constant 1.456 .791
Org age .006
Org size .000
Add value .587* .196 .454
Security .293 6.764** Constant 5.973** .672
Org age .008*
Org size .000
Add value -.513* .155 -.566
Description .173 3.420* Constant 2.602* .808
Org age .007
Org size .000
Add value .286 .191 .251
Appraisal .170 3.340* Constant 3.055** .536
Org age .009*
Org size .000
Add value .182 .127 .186
Compensation .176 3.497* Constant 3.251** .373
Org age .011*
Org size .000
Add value .130 .083 .214
Participation .369 9.532** Constant -.904 1.111
Org age .012**
Org size .000
Add value 1.036** .244 .502
28 Master Thesis Annelies Buddingh: The devolution of HRM practices
Table 9: Linear regression analysis intended HRM practices and added value
* = p < .05
4. HRM strengths (Hypothesis 3)
Descriptive statistics
In Table 10 the means, standard deviations and correlations of the variables are
presented, and also the control variables organizational age and size are included.
The values are calculated for respondents of all organizations together.
Table 10 represents a few positive correlations between intended HRM-practices
and HRM strengths. The following significant relationships (p < .01) are identified:
Staffing is related to Organizational relevance (r=.389) and Validity (r=.286). Clear job
description is related to Validity (r=.307). Performance appraisal is related to
Organizational relevance (r=.347) and Validity (r=.290). Compensation is related to
Validity (r=.272) and User-friendliness (r=.468). Employee participation is related to
Validity (r=.302). For the practices ‘Training’, ‘Internal mobility’, and ‘Employment
security’ no significant relationships are found.
The control variables ‘Organizational age’ and ‘Organizational size’ show significant
correlations with some correlations. These variables are therefore included in the
regression analysis.
Model R2 F Non-standardized Coefficients Std. Coeff. Beta B Std. Error
HRM content .240 5.153 Constant 1.561 .870
Org age .008*
Org size .000
Added V. .551* .212 .332
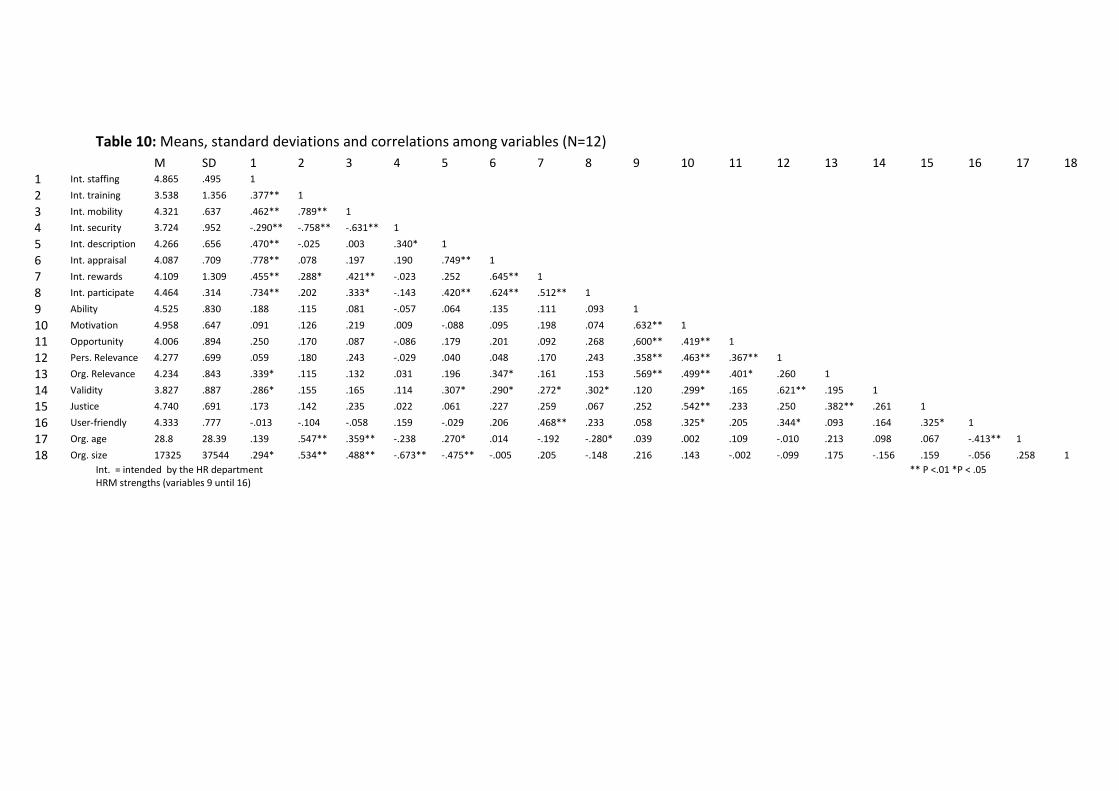
Table 10: Means, standard deviations and correlations among variables (N=12)
Int. = intended by the HR department ** P <.01 *P < .05 HRM strengths (variables 9 until 16)
M SD 1 2 3 4 5 6 7 8 9 10 11 12 13 14 15 16 17 18 1 Int. staffing 4.865 .495 1
2 Int. training 3.538 1.356 .377** 1
3 Int. mobility 4.321 .637 .462** .789** 1
4 Int. security 3.724 .952 -.290** -.758** -.631** 1
5 Int. description 4.266 .656 .470** -.025 .003 .340* 1
6 Int. appraisal 4.087 .709 .778** .078 .197 .190 .749** 1
7 Int. rewards 4.109 1.309 .455** .288* .421** -.023 .252 .645** 1
8 Int. participate 4.464 .314 .734** .202 .333* -.143 .420** .624** .512** 1
9 Ability 4.525 .830 .188 .115 .081 -.057 .064 .135 .111 .093 1
10 Motivation 4.958 .647 .091 .126 .219 .009 -.088 .095 .198 .074 .632** 1
11 Opportunity 4.006 .894 .250 .170 .087 -.086 .179 .201 .092 .268 ,600** .419** 1
12 Pers. Relevance 4.277 .699 .059 .180 .243 -.029 .040 .048 .170 .243 .358** .463** .367** 1
13 Org. Relevance 4.234 .843 .339* .115 .132 .031 .196 .347* .161 .153 .569** .499** .401* .260 1
14 Validity 3.827 .887 .286* .155 .165 .114 .307* .290* .272* .302* .120 .299* .165 .621** .195 1
15 Justice 4.740 .691 .173 .142 .235 .022 .061 .227 .259 .067 .252 .542** .233 .250 .382** .261 1
16 User-friendly 4.333 .777 -.013 -.104 -.058 .159 -.029 .206 .468** .233 .058 .325* .205 .344* .093 .164 .325* 1
17 Org. age 28.8 28.39 .139 .547** .359** -.238 .270* .014 -.192 -.280* .039 .002 .109 -.010 .213 .098 .067 -.413** 1
18 Org. size 17325 37544 .294* .534** .488** -.673** -.475** -.005 .205 -.148 .216 .143 -.002 -.099 .175 -.156 .159 -.056 .258 1
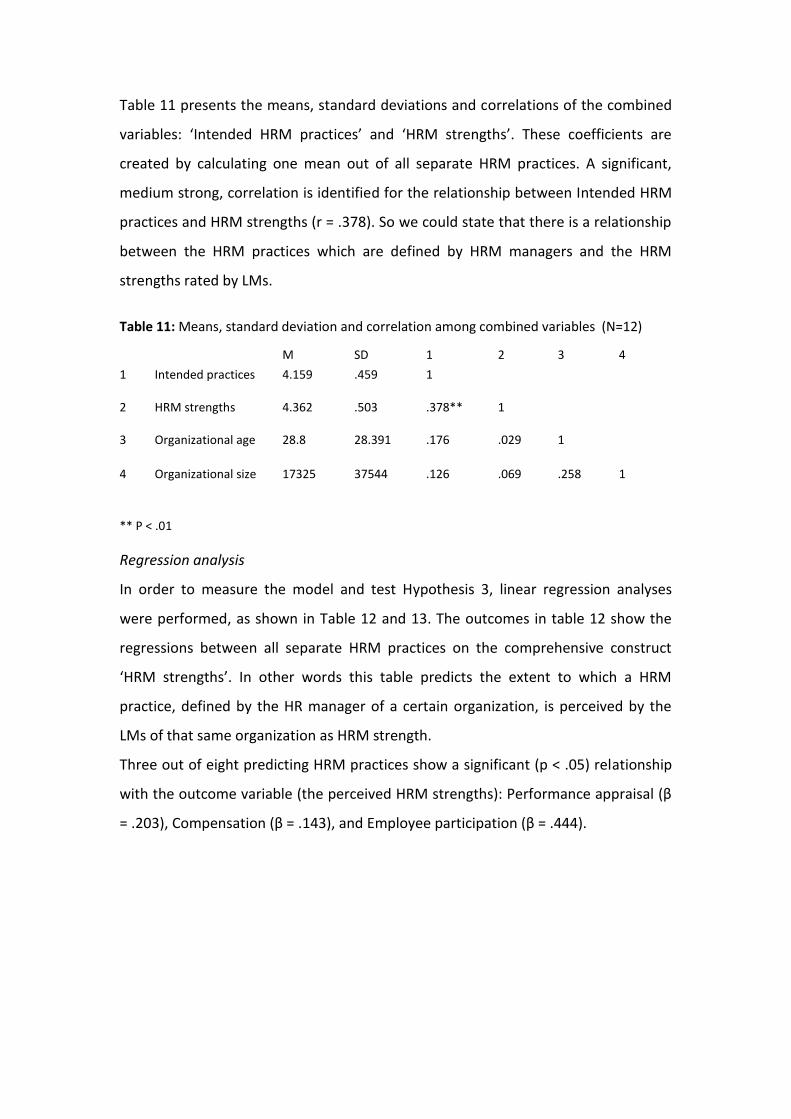
Table 11 presents the means, standard deviations and correlations of the combined
variables: ‘Intended HRM practices’ and ‘HRM strengths’. These coefficients are
created by calculating one mean out of all separate HRM practices. A significant,
medium strong, correlation is identified for the relationship between Intended HRM
practices and HRM strengths (r = .378). So we could state that there is a relationship
between the HRM practices which are defined by HRM managers and the HRM
strengths rated by LMs.
Table 11: Means, standard deviation and correlation among combined variables (N=12)
** P < .01
Regression analysis
In order to measure the model and test Hypothesis 3, linear regression analyses
were performed, as shown in Table 12 and 13. The outcomes in table 12 show the
regressions between all separate HRM practices on the comprehensive construct
‘HRM strengths’. In other words this table predicts the extent to which a HRM
practice, defined by the HR manager of a certain organization, is perceived by the
LMs of that same organization as HRM strength.
Three out of eight predicting HRM practices show a significant (p < .05) relationship
with the outcome variable (the perceived HRM strengths): Performance appraisal (β
= .203), Compensation (β = .143), and Employee participation (β = .444).
M SD 1 2 3 4
1 Intended practices 4.159 .459 1
2 HRM strengths 4.362 .503 .378** 1
3 Organizational age 28.8 28.391 .176 .029 1
4 Organizational size 17325 37544 .126 .069 .258 1
31 Master Thesis Annelies Buddingh: The devolution of HRM practices
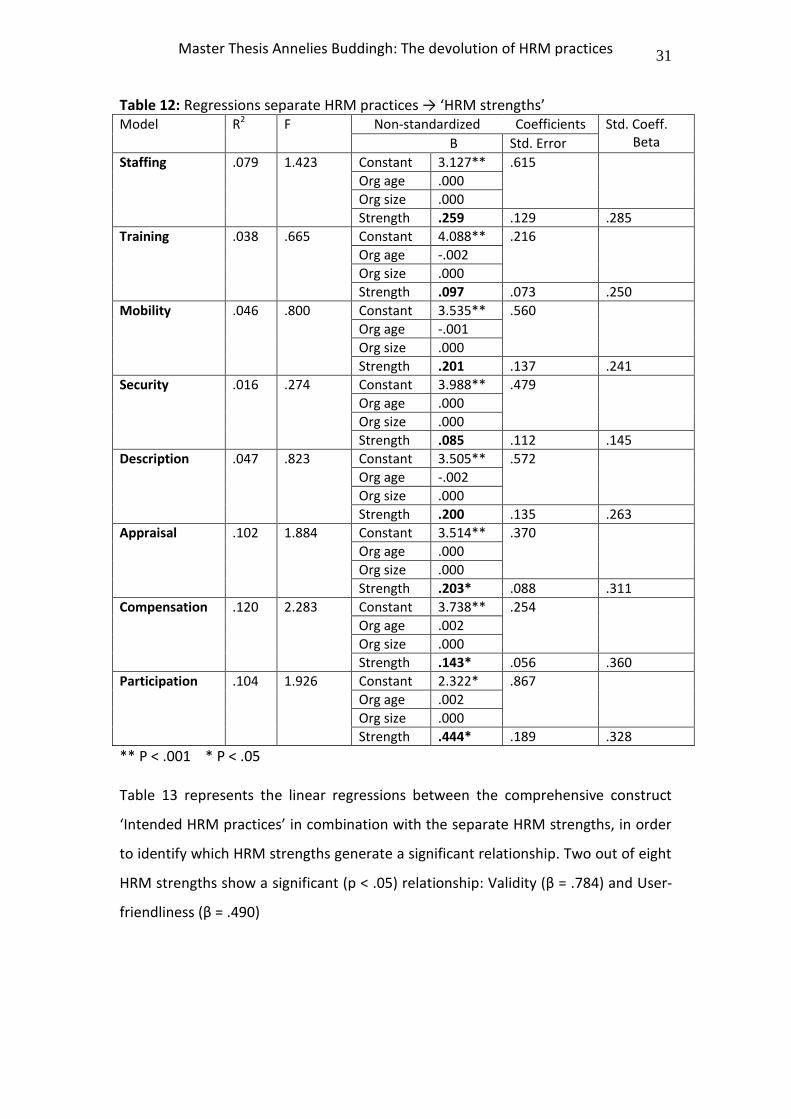
Table 12: Regressions separate HRM practices → ‘HRM strengths’ Model R2 F Non-standardized Coefficients Std. Coeff.
Beta B Std. Error
Staffing .079 1.423 Constant 3.127** .615
Org age .000
Org size .000
Strength .259 .129 .285
Training .038 .665 Constant 4.088** .216
Org age -.002
Org size .000
Strength .097 .073 .250
Mobility .046 .800 Constant 3.535** .560
Org age -.001
Org size .000
Strength .201 .137 .241
Security .016 .274 Constant 3.988** .479
Org age .000
Org size .000
Strength .085 .112 .145
Description .047 .823 Constant 3.505** .572
Org age -.002
Org size .000
Strength .200 .135 .263
Appraisal .102 1.884 Constant 3.514** .370
Org age .000
Org size .000
Strength .203* .088 .311
Compensation .120 2.283 Constant 3.738** .254
Org age .002
Org size .000
Strength .143* .056 .360
Participation .104 1.926 Constant 2.322* .867
Org age .002
Org size .000
Strength .444* .189 .328
** P < .001 * P < .05
Table 13 represents the linear regressions between the comprehensive construct
‘Intended HRM practices’ in combination with the separate HRM strengths, in order
to identify which HRM strengths generate a significant relationship. Two out of eight
HRM strengths show a significant (p < .05) relationship: Validity (β = .784) and User-
friendliness (β = .490)
32 Master Thesis Annelies Buddingh: The devolution of HRM practices
Table 13: Regressions ‘HRM practices’ → separate HRM strengths
** P < .001 * P < .05
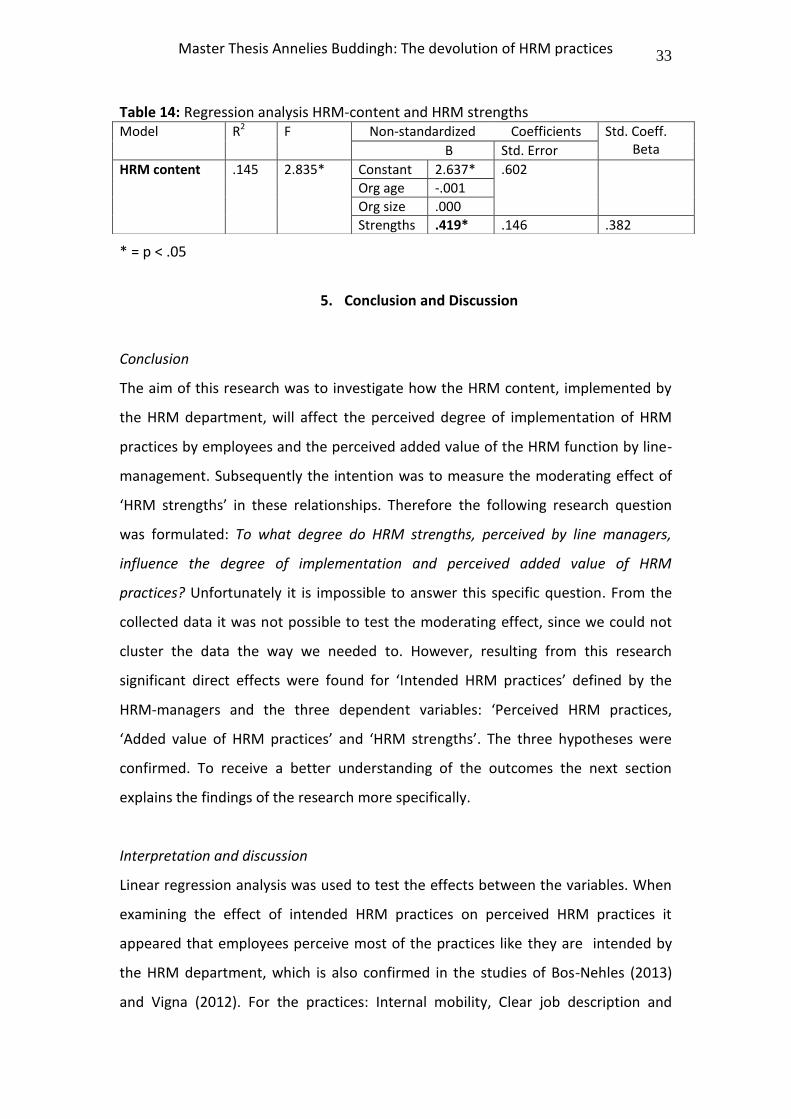
Table 14 represents the overall regression of the combined constructs ‘HRM
practices’ and ‘HRM strengths’. The predictor variable (= Intended HRM practices)
significantly (p = <.05) predicts the outcome variable (= HRM strengths) with a
gradient of the regression line of: .419. In other words, if the Intended HRM
practices (the predictor variable) is increased by 1 unit, then the HRM strengths
value will increase with .419 unit. Hypothesis 3 is confirmed: The intended HRM
practices defined by HR managers are positively related to the perceived HRM
strengths by LMs.
Model R2 F Non-standardized Coefficients Std. Coeff. Beta B Std. Error
Intended HRM practices
.059 1.053 Constant 3.633* 1.043
Org age -.001
Org size .000
Ability .204 .253 .113
Intended HRM practices
.050 .869 Constant 3.965** .216
Org age -.001
Org size .000
Motivation .240 .073 .250
Intended HRM practices
.058 1.029 Constant 2.198 1.122
Org age .002
Org size .000
Opportunity .422 .272 .217
Intended HRM practices
.059 1.038 Constant 2.900* .879
Org age .000
Org size .000
p.relevance .343 .213 .225
Intended HRM practices
.127 2.425 Constant 2.085* 1.020
Org age .004
Org size .000
o.relevance .481 .247 .262
Intended HRM practices
.203 4.254 Constant .576 1.025
Org age .003
Org size .000
Validity .784* .248 .406
Intended HRM practices
.091 1.672 Constant 3.107** .840
Org age .000
Org size .000
Justice .386 .204 .260
Intended HRM practices
.254 5.685 Constant 2.635* .868
Org age -.012*
Org size .000
User-friendly .490* .211 .290
33 Master Thesis Annelies Buddingh: The devolution of HRM practices
Table 14: Regression analysis HRM-content and HRM strengths
* = p < .05
5. Conclusion and Discussion
Conclusion
The aim of this research was to investigate how the HRM content, implemented by
the HRM department, will affect the perceived degree of implementation of HRM
practices by employees and the perceived added value of the HRM function by line-
management. Subsequently the intention was to measure the moderating effect of
‘HRM strengths’ in these relationships. Therefore the following research question
was formulated: To what degree do HRM strengths, perceived by line managers,
influence the degree of implementation and perceived added value of HRM
practices? Unfortunately it is impossible to answer this specific question. From the
collected data it was not possible to test the moderating effect, since we could not
cluster the data the way we needed to. However, resulting from this research
significant direct effects were found for ‘Intended HRM practices’ defined by the
HRM-managers and the three dependent variables: ‘Perceived HRM practices,
‘Added value of HRM practices’ and ‘HRM strengths’. The three hypotheses were
confirmed. To receive a better understanding of the outcomes the next section
explains the findings of the research more specifically.
Interpretation and discussion
Linear regression analysis was used to test the effects between the variables. When
examining the effect of intended HRM practices on perceived HRM practices it
appeared that employees perceive most of the practices like they are intended by
the HRM department, which is also confirmed in the studies of Bos-Nehles (2013)
and Vigna (2012). For the practices: Internal mobility, Clear job description and
Model R2 F Non-standardized Coefficients Std. Coeff. Beta B Std. Error
HRM content .145 2.835* Constant 2.637* .602
Org age -.001
Org size .000
Strengths .419* .146 .382
34 Master Thesis Annelies Buddingh: The devolution of HRM practices
Employee participation, perceived implementation was not proved. This could be
explained by the fact that those three practices are perhaps less tangible than the
other five practices. For example Training and Performance appraisal can be very
specific and visible in an organization; indeed employees can easily mark them as
present to a certain degree. More blurred HRM practices like Employee participation
and Internal mobility, are in that sense not tangible or visible, but are more or less
present in the background of an organization which makes them harder to identify.
The prediction that intended HRM practices are positively related to
perceived added value of HRM practices is confirmed by this study. Five out of eight
HRM practices have been proved to add value, from the perspective of line
management. Also the overall regression between these constructs shows a medium
strong significant relationship, which is in accordance with the theory (Wright,
McMahan, Snell, Gerhart, 2001). In line with those results the regression analysis
also proved that intended HRM practices are positively related to HRM strengths
measured by line-management. In particular, the HRM practices are experienced to
be valid and user-friendly. The importance of Validity in order to determine a ‘HRM
strength’ is adapted from research from Delmotte et al. (2012) and the concept of
User-friendliness is derived from the work of Bos-Nehles (2013).
For the relationship between intended HRM practices and the following HRM-
strengths no significance was found: Ability, Motivation, Opportunity, Personal
relevance, Organizational relevance and Procedural justice.
According to the AMO-constructs (Ability, Motivation and Opportunity) use was
made of the ‘big AMO model’ where the survey concerned questions about the unit
of the LMs. An example question was: HRM practices enhance the knowledge in my
unit (abilities). The possibility exists that if the questions were asked from the
perspective of the ‘small AMO-model’ significance was found. In that case the
questions had to be formulated from the perspective of the person him/her self (the
Line Manager): e.g. HRM practices enhance my knowledge. The choice was made to
investigate the big-AMO since this study focuses on the features that improve the
implementation process throughout the whole organization. For that reason the
expectation was that LMs would be inclined to implement HRM-practices in case
35 Master Thesis Annelies Buddingh: The devolution of HRM practices
they were convinced that the practices would contribute to the ability, motivation
and opportunity of their subordinate employees.
Referring to the relevance of HRM-practices, no significance was found. To
develop relevant HRM-practices HRM-managers need to know the business, both
the long-term objectives of the organization and the short-term goals of the LMs,
who will use the HRM practices and processes to steer their employees aligned with
the organizational strategy. The HRM-managers will be able to align the overall
strategy and HRM successfully when they have a mix of general knowledge. They
need to know how an organization functions, have expert knowledge on HRM
practices and processes, and they need to know for example under which conditions
individual performance-based pay is successful. Next, the empathic ability of an
HRM-manager should not be underestimated. An emphatic HRM manager is aware
of the LMs emotions and is able to use that emotional awareness to achieve results.
An emphatic HRM-manager is more likely to gain insight into employees’ individual
situations and line managers’ local context and is subsequently more likely to initiate
the necessary tools to motivate employees.
The HRM-strength procedural justice was, like relevance, absent in this study. To
increase procedural justice the HRM-department needs to create realistic
expectations by making sure that decision-making procedures are transparent and
clearly communicated. Moreover, it is important to align the decision making
process with organizational norms and values in order to enhance acceptability
among employees. Acceptability might be improved by engaging employees/LMs in
the decision making process, for example 360⁰ feedback, or afterwards by clearly
explaining why and how decisions were made. Furthermore, decisions should be
based on correct information and the procedures should apply in the same manner
to every employee. Another advice refers to the protest against a decision, and that
would be to make sure that there exists a procedure for handling and reporting
complaints.
Limitations and suggestions for future research
The current study has four limitations. The first has already been explained in the
results section and has to do with the lack of information to cluster the data bundles.
36 Master Thesis Annelies Buddingh: The devolution of HRM practices
The integrated questions to control this (e.g. which division do you work for? What is
your department code?) were not understood and/or filled in correctly by most of
the respondents. Afterwards it was impossible to define which LM belonged to
which HR manager and which employee belonged to which LM. This resulted in a
necessary change of the research model where only direct links could be tested. The
consequence was that the moderating effect of the LMs perceptions on the
implementation process was excluded from this research. To prevent this in the
future it is recommend that the questionnaires should be designed in such a way
that the researchers keep control of the coding of the separate surveys. Asking
names is not an option (e.g. what is the name of your manager?) as this would
compromise the confidentiality and anonymity of the study. The solution could be to
code every survey beforehand, and collect the data on hard-copy.
The second limitation has to do with the distribution of the surveys. Since the
HRM department was asked to distribute the questionnaires to five line-managers,
and the Line-Managers were asked to distribute the surveys to five employees, this
procedure could lead to a biased sample, as the respondents might be chosen based
on personal preference. It is possible to prevent this bias by giving instructions to
HRM managers and line-managers on how to choose their colleagues randomly, for
example alphabetically. However a longer/more complicated introduction may
restrain the respondent to complete the survey. So in this particular study the
benefits outweighed the disadvantages.
The third limitation is lack of data with regard to the hard performance
outcome measures, such as absenteeism, turnover etc. This makes it impossible to
draw conclusions concerning the actual added value of HRM. The findings of this
study are purely about the perceived added value of the HRM function.
The last limitation is the limited amount of data which was available in order
to generalize the outcomes to a lager population. Extensive research is needed in
order to investigate the concept of ‘HRM strengths’ more profoundly. In order to
make sure a reliable factor analysis is performed on the designed concept ‘HRM
strengths’ one should seek to collect data from at least 150 Line-Managers (Pallant,
2010).
37 Master Thesis Annelies Buddingh: The devolution of HRM practices
Implications
Even though this study has its limitations and brings new questions to the fore, the
results are useful and are definitely something which organizations and researchers
can build upon. The implications for research are the following:
Firstly, although previous research demonstrated difficulties and limitations
from Line Managers with the implementation process of HR-practices, this study
showed that the majority of HR-practices are well implemented. The practices:
Staffing, Training, Employment security, Performance appraisal and Compensation
are perceived by employees the way HR-decision makers intended it to implement.
Furthermore it is confirmed that Line Managers in general perceive HRM-practices to
be valuable. They determine HRM-practices to be valid and user-friendly.
Secondly, the developed scales to measure the degree of implementation
and added value are tested to be valid and reliable and provide the opportunity for
other researchers to measure these variables in organizations. The scale for HRM
strengths was tested reliably, however the validity was not proved since the sample
size of Line Managers was too small. It is expected that the scale will prove its
validity when a factor analysis is performed for a lager sample.
Thirdly, because of differences in organizational age and size it is possible
that the degree of implementation and perceived added value are experienced in a
different way by Line Managers and employees. For that reason the process of HRM
implementation can yield a positive result in one organization and a negative result
in another.
Furthermore there are a number of practical implications and
recommendations. First of all this study proved that Line Managers are able to
implement HR-responsibilities effectively because the majority of the intended HRM
practices are correctly perceived by employees. Secondly, organizations can be
reassured that LMs perceive most of the designed HRM-practices to be valuable,
witch will minimize the possible resistance in the implementation process. HRM
practices are in particular rated as ‘valid’ and ‘user-friendly’ by the line. In order to
improve the degree of implementation and perceived added value is it important
that LMs know for which HR-tasks they are responsible and why those tasks are
38 Master Thesis Annelies Buddingh: The devolution of HRM practices
valuable for the company. Organizations could include the HR-responsibilities in the
job descriptions or appraisals in order to communicate the importance.
39 Master Thesis Annelies Buddingh: The devolution of HRM practices
References
Appelbaum, E., Bailey, T., Berg, P, & Kalleberg, A. (2000). Manufacturing
Advantage: Why High-Performance Work Systems Pay Off, Ithaca: Cornell
University Press.
Barney, J. (1991). Firm resouces and competitive advantage. Journal of
Management, 17: 99-120.
Bos-Nehles, A. (2010). The line makes the difference: line managers as effective HR
partners. Enschede: University of Twente.
Boselie, P., Dietz, G., and Boon, C. (2005). Commonalities and contradictions in HRM
and research. Human Resource Management Journal, 15, 67-94.
Bowen, D. & Ostroff, C. (2004). Understanding HRM-firm performance linkages: the
role of the “strength” of the HRM system. Academy of Management
Review, 29:2, 203-221.
Boxall, P. and Purcell, J. (2011). Strategy and Human Resource Management (3rd ed.)
Basingstoke, UK: Palgrave Macmillan.
Brewster, C. and Larsen, H.H. (Eds) (2000), Human Resource Management in
Northern Europe: Trends, Dilemmas and Strategy, Blackwell, Oxford.
Brislin, R., W. (1970). Back translation for cross-cultural research. Journal of Cross-
Cultural Psychology, 1:3, 185-216.
Combs, J. Hall, A. Ketchen, D. (2006) How much do high-performance work practices
matter? A meta-analysis of their effects on organizational performance.
Personnel Psychology, 59, 501-528.
Delmotte, J, De Winne, S and Sels, L. (2011). Toward an assessment of perceived
hrm system strength: scale development and validation. The International
Journal of Human Resource Management, 23:7, 1481-1506.
Gilbert, C, De Winne, S. & Sels, L. (2011): The influence of line
managers and HR department on employees' affective commitment, The
International Journal of Human Resource Management, 22:8, 1618-1637.
Guay, F.,Vallerand, R. J. and Blanchard, C. (2000). On the assessment of situational
intrinsic and extrinsic motivation: the situational motivation scale (SIMS).
Motivation and Emotion, 24:3, 175-214.
40 Master Thesis Annelies Buddingh: The devolution of HRM practices
Guest, D., and Conway, N. (2011). The impact of HR practices, HR effectiveness and a
‘strong HR system’ on organizational outcomes: a stakeholder perspective.
The International Journal of Human Resource Management, 22, 1686-1702.
Guest, D. and Bos-Nehles, A. (2013). HRM and performance: the role of effective
implementation. In Paauwe, J., Guest, D., and Wright, P. (Eds.), HRM and
performance: Achievements and Challenges. London: Wiley Press.
LeBreton, J. M, and Senter, J. L. (2008). Answers to 20 questions about interrater
reliability and interrater agreement. Organizational Research Methods,
11:4, 815 – 852.
Liao, H. and Rupp, D.E. (2005). The impact of justice climate and justice orientation
on work outcomes: a cross-level multiforce framework. The Journal of
Applied Psychology, 90:2, 242-256.
McGuire, W. J. (1972). Attitude change: The information processing paradigm. In C.
G. McClintock (Ed.), Experimental social psychology: 108-141. New York:
Holt, Rinehart & Winston.
Noe, R. A., Hollenbeck, J. R., Gerhart, B., & Wright, P. M. (2003). Human resource
management: gaining a competitive advantage. New York: McGraw-Hill.
Paauwe, J. & Boselie, P. (2005) HRM and performance: what next? Human Resource
Management Journal, 15:4, 68-83.
Pallant, J. (2010). SPSS survival manual (4th ed). London , England: Mcgrawhill.
Perry, E. & Kulik, C. (2008). The devolution of HR to the line: Implications for
perceptions of people management effectiveness, The International Journal
of Human Resource Management, 19:2, 262-273.
Purcell, J. & Hutchinson, S. (2007). Front-line managers as agents in the HRM-
performance causal chain: theory, analysis and evidence. Human Resource
Management Journal, 17:1, 3-20.
Subramony, M. (2009) A meta-analytic investigation of the relationship between
HRM bundles and firm performance. Human Resource Management, 48:5,
745-768.
Sun, L., Aryee, S. and Law, K. (2007). High-performance human resource practices,
citizenship behaviour, and organizational performance: a relational
perspective. The Academy of Management Journal, 50:3, 558-577.
41 Master Thesis Annelies Buddingh: The devolution of HRM practices
Soens, N. (2012). Line managers’ contributions to high-performance work systems:
an empirical study of the agents, outcomes, and mediators of HRM
implementation (dissertation).
Takeuchi, R., Lepak, D., Wang, H, and Tekeuchi, K. (2007) An empirical examination
of the mechanisms mediating between high-performance work systems and
the performance of Japanese organizations. Journal of Applied Psychology,
92:4, 1069-1083.
Vigna, C. (2012). Employee perceptions of strategic human resource management:
considering HRM content and process. Antwerpen: University of
Antwerpen.
Wright, P. & Boswell, W. (2002) Desegregating HRM: a review and synthesis of micro
and macro human resource management research. Journal of
Management, 28:3, 247-276.
Wright, P. McMahan, G. Snell, S. and Gerhart, B. (2001). Comparing line and HR
executives’ perceptions of HR effectiveness: services, roles, and
contributions. Human Resource Management, 40:2, 111-123.
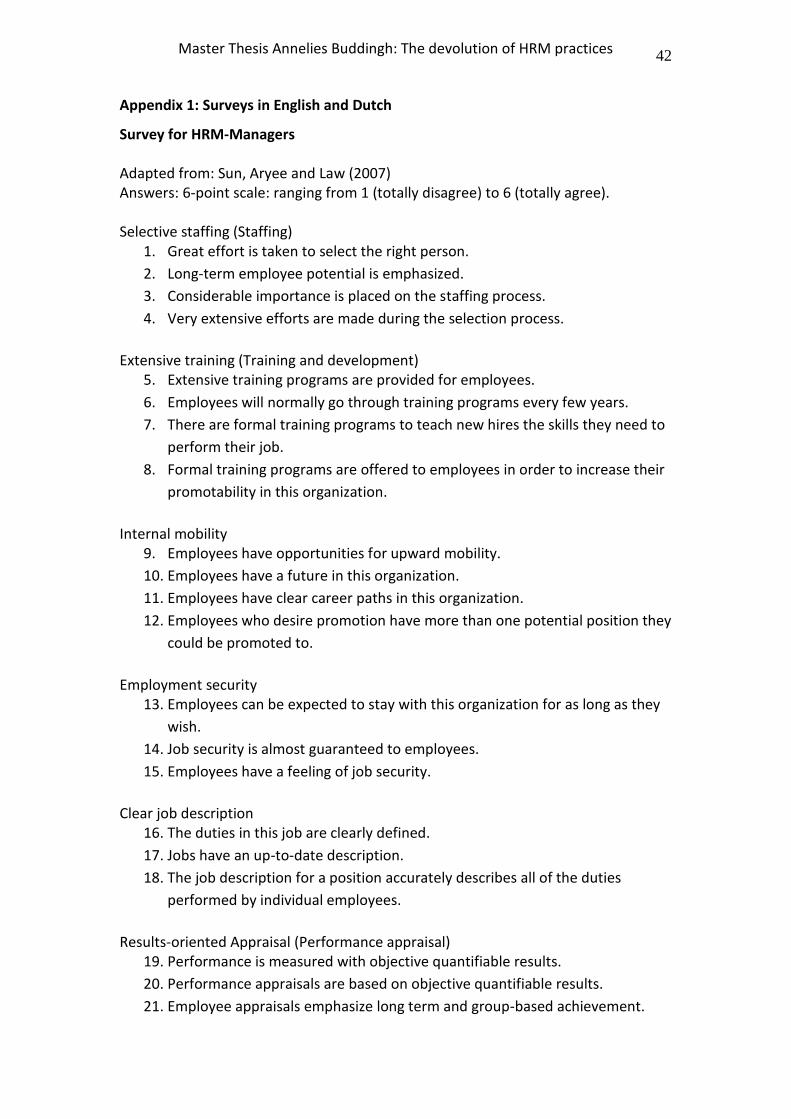
42 Master Thesis Annelies Buddingh: The devolution of HRM practices
Appendix 1: Surveys in English and Dutch
Survey for HRM-Managers
Adapted from: Sun, Aryee and Law (2007) Answers: 6-point scale: ranging from 1 (totally disagree) to 6 (totally agree).
Selective staffing (Staffing)
1. Great effort is taken to select the right person.
2. Long-term employee potential is emphasized.
3. Considerable importance is placed on the staffing process.
4. Very extensive efforts are made during the selection process.
Extensive training (Training and development)
5. Extensive training programs are provided for employees.
6. Employees will normally go through training programs every few years.
7. There are formal training programs to teach new hires the skills they need to
perform their job.
8. Formal training programs are offered to employees in order to increase their
promotability in this organization.
Internal mobility
9. Employees have opportunities for upward mobility.
10. Employees have a future in this organization.
11. Employees have clear career paths in this organization.
12. Employees who desire promotion have more than one potential position they
could be promoted to.
Employment security
13. Employees can be expected to stay with this organization for as long as they
wish.
14. Job security is almost guaranteed to employees.
15. Employees have a feeling of job security.
Clear job description
16. The duties in this job are clearly defined.
17. Jobs have an up-to-date description.
18. The job description for a position accurately describes all of the duties
performed by individual employees.
Results-oriented Appraisal (Performance appraisal)
19. Performance is measured with objective quantifiable results.
20. Performance appraisals are based on objective quantifiable results.
21. Employee appraisals emphasize long term and group-based achievement.
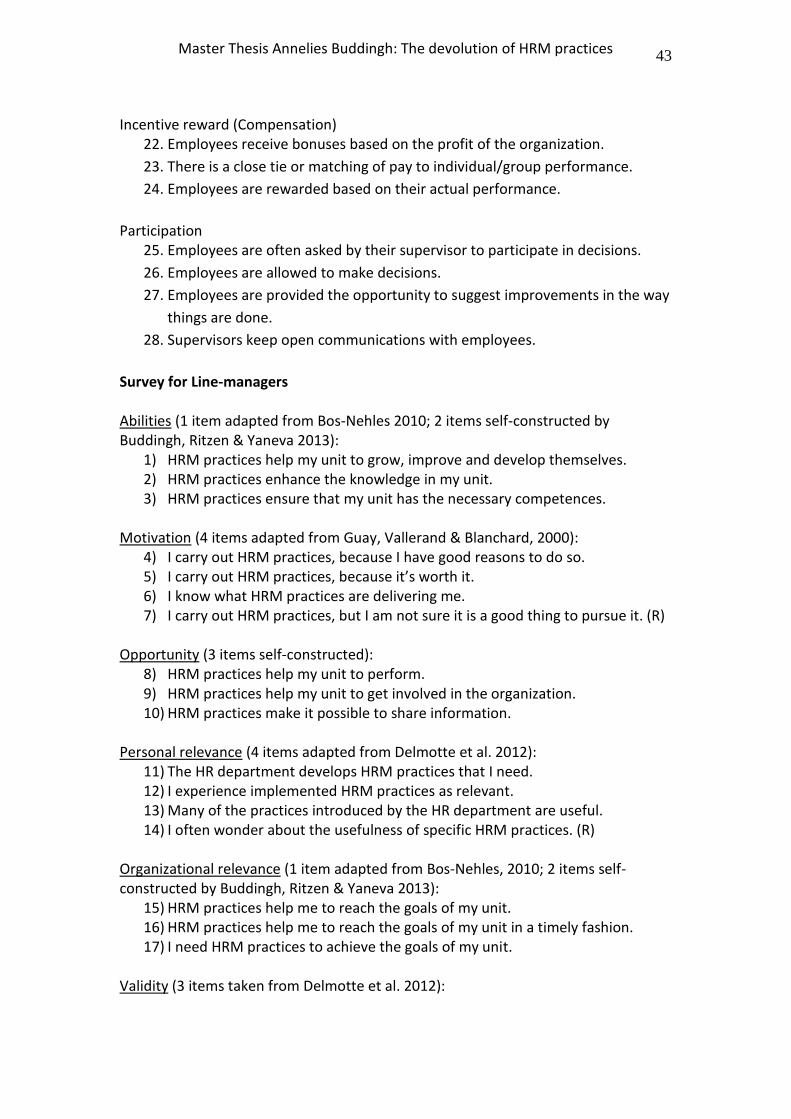
43 Master Thesis Annelies Buddingh: The devolution of HRM practices
Incentive reward (Compensation)
22. Employees receive bonuses based on the profit of the organization.
23. There is a close tie or matching of pay to individual/group performance.
24. Employees are rewarded based on their actual performance.
Participation
25. Employees are often asked by their supervisor to participate in decisions.
26. Employees are allowed to make decisions.
27. Employees are provided the opportunity to suggest improvements in the way
things are done.
28. Supervisors keep open communications with employees.
Survey for Line-managers Abilities (1 item adapted from Bos-Nehles 2010; 2 items self-constructed by Buddingh, Ritzen & Yaneva 2013):
1) HRM practices help my unit to grow, improve and develop themselves. 2) HRM practices enhance the knowledge in my unit. 3) HRM practices ensure that my unit has the necessary competences.
Motivation (4 items adapted from Guay, Vallerand & Blanchard, 2000):
4) I carry out HRM practices, because I have good reasons to do so. 5) I carry out HRM practices, because it’s worth it. 6) I know what HRM practices are delivering me. 7) I carry out HRM practices, but I am not sure it is a good thing to pursue it. (R)
Opportunity (3 items self-constructed):
8) HRM practices help my unit to perform. 9) HRM practices help my unit to get involved in the organization. 10) HRM practices make it possible to share information.
Personal relevance (4 items adapted from Delmotte et al. 2012):
11) The HR department develops HRM practices that I need. 12) I experience implemented HRM practices as relevant. 13) Many of the practices introduced by the HR department are useful. 14) I often wonder about the usefulness of specific HRM practices. (R)
Organizational relevance (1 item adapted from Bos-Nehles, 2010; 2 items self-constructed by Buddingh, Ritzen & Yaneva 2013):
15) HRM practices help me to reach the goals of my unit. 16) HRM practices help me to reach the goals of my unit in a timely fashion. 17) I need HRM practices to achieve the goals of my unit.
Validity (3 items taken from Delmotte et al. 2012):
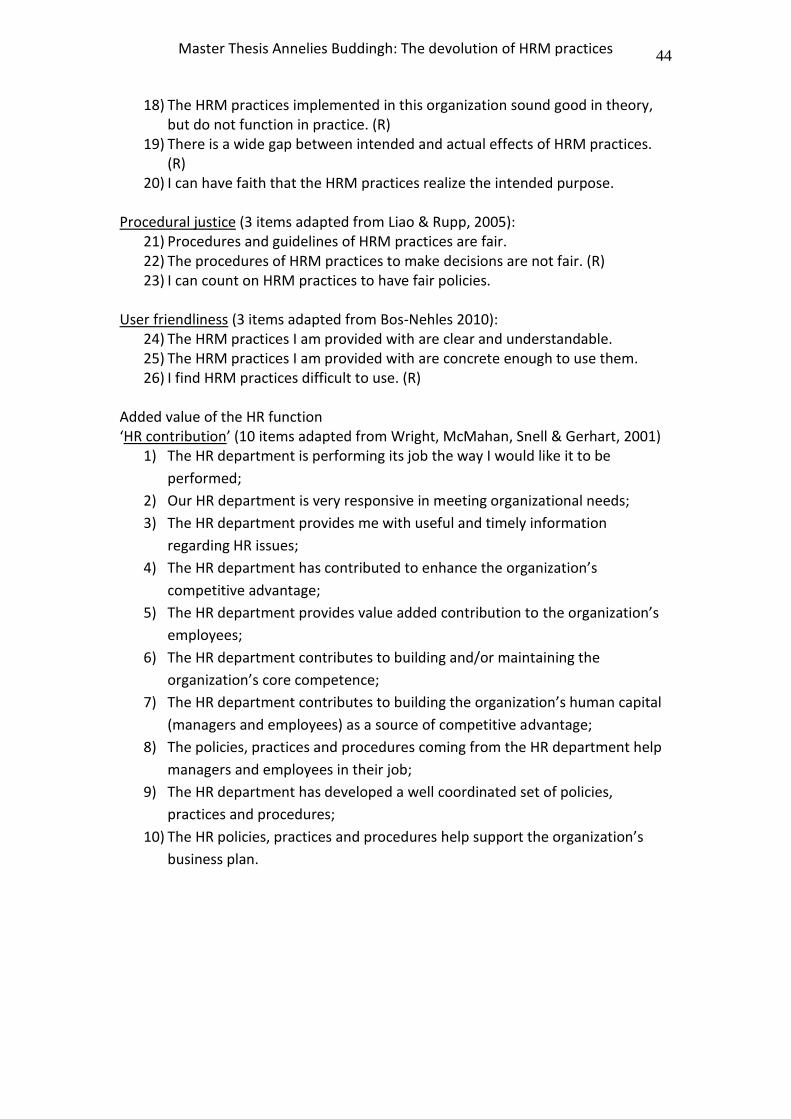
44 Master Thesis Annelies Buddingh: The devolution of HRM practices
18) The HRM practices implemented in this organization sound good in theory, but do not function in practice. (R)
19) There is a wide gap between intended and actual effects of HRM practices. (R)
20) I can have faith that the HRM practices realize the intended purpose. Procedural justice (3 items adapted from Liao & Rupp, 2005):
21) Procedures and guidelines of HRM practices are fair. 22) The procedures of HRM practices to make decisions are not fair. (R) 23) I can count on HRM practices to have fair policies.
User friendliness (3 items adapted from Bos-Nehles 2010):
24) The HRM practices I am provided with are clear and understandable. 25) The HRM practices I am provided with are concrete enough to use them. 26) I find HRM practices difficult to use. (R)
Added value of the HR function ‘HR contribution’ (10 items adapted from Wright, McMahan, Snell & Gerhart, 2001)
1) The HR department is performing its job the way I would like it to be
performed;
2) Our HR department is very responsive in meeting organizational needs;
3) The HR department provides me with useful and timely information
regarding HR issues;
4) The HR department has contributed to enhance the organization’s
competitive advantage;
5) The HR department provides value added contribution to the organization’s
employees;
6) The HR department contributes to building and/or maintaining the
organization’s core competence;
7) The HR department contributes to building the organization’s human capital
(managers and employees) as a source of competitive advantage;
8) The policies, practices and procedures coming from the HR department help
managers and employees in their job;
9) The HR department has developed a well coordinated set of policies,
practices and procedures;
10) The HR policies, practices and procedures help support the organization’s
business plan.
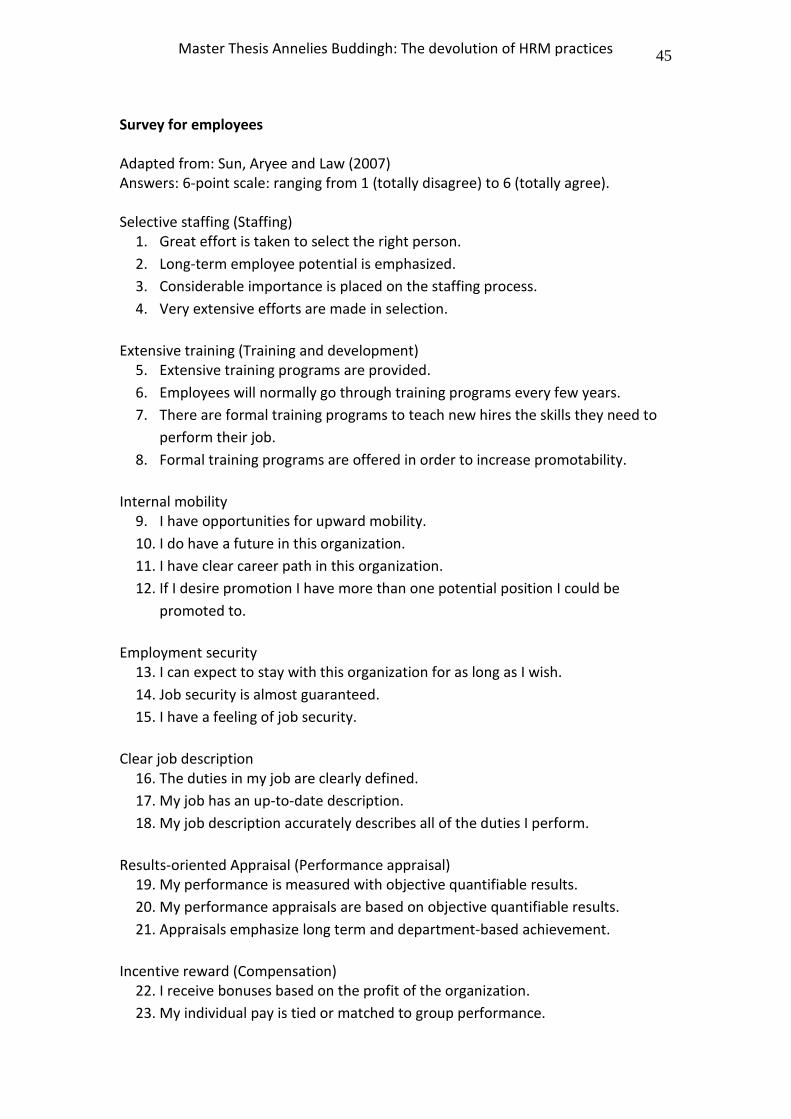
45 Master Thesis Annelies Buddingh: The devolution of HRM practices
Survey for employees Adapted from: Sun, Aryee and Law (2007) Answers: 6-point scale: ranging from 1 (totally disagree) to 6 (totally agree).
Selective staffing (Staffing)
1. Great effort is taken to select the right person.
2. Long-term employee potential is emphasized.
3. Considerable importance is placed on the staffing process.
4. Very extensive efforts are made in selection.
Extensive training (Training and development)
5. Extensive training programs are provided.
6. Employees will normally go through training programs every few years.
7. There are formal training programs to teach new hires the skills they need to
perform their job.
8. Formal training programs are offered in order to increase promotability.
Internal mobility
9. I have opportunities for upward mobility.
10. I do have a future in this organization.
11. I have clear career path in this organization.
12. If I desire promotion I have more than one potential position I could be
promoted to.
Employment security
13. I can expect to stay with this organization for as long as I wish.
14. Job security is almost guaranteed.
15. I have a feeling of job security.
Clear job description
16. The duties in my job are clearly defined.
17. My job has an up-to-date description.
18. My job description accurately describes all of the duties I perform.
Results-oriented Appraisal (Performance appraisal)
19. My performance is measured with objective quantifiable results.
20. My performance appraisals are based on objective quantifiable results.
21. Appraisals emphasize long term and department-based achievement.
Incentive reward (Compensation)
22. I receive bonuses based on the profit of the organization.
23. My individual pay is tied or matched to group performance.
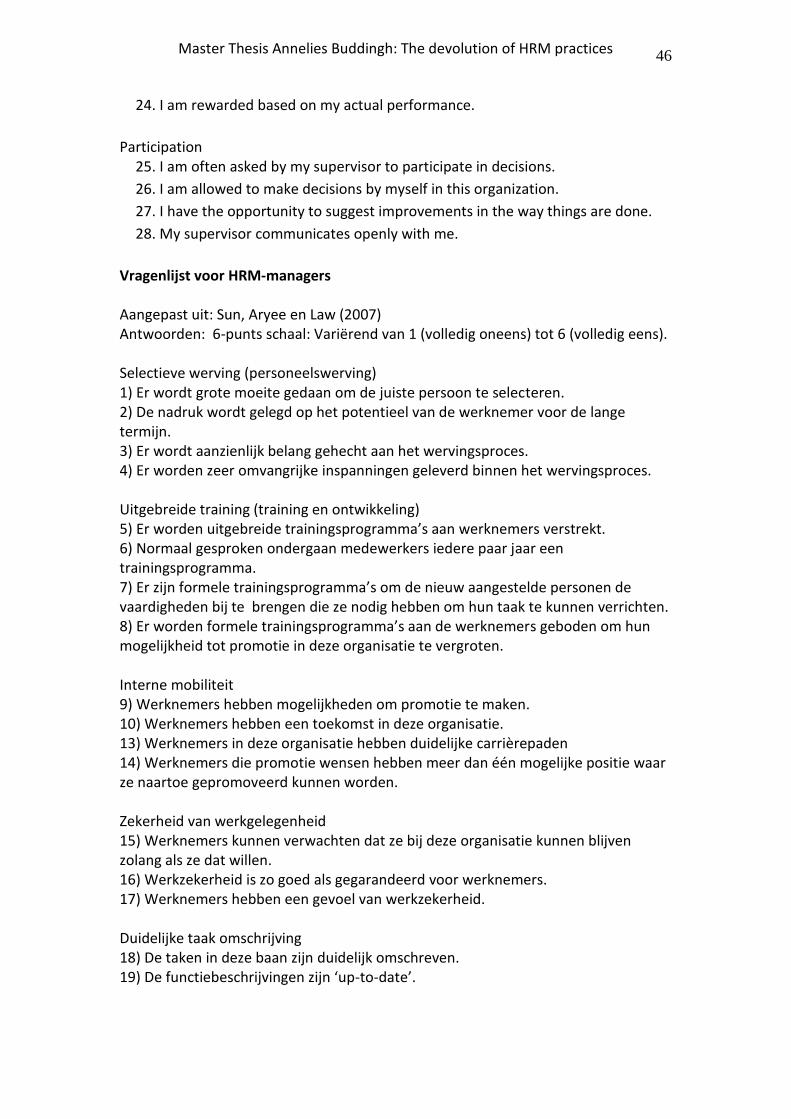
46 Master Thesis Annelies Buddingh: The devolution of HRM practices
24. I am rewarded based on my actual performance.
Participation
25. I am often asked by my supervisor to participate in decisions.
26. I am allowed to make decisions by myself in this organization.
27. I have the opportunity to suggest improvements in the way things are done.
28. My supervisor communicates openly with me.
Vragenlijst voor HRM-managers Aangepast uit: Sun, Aryee en Law (2007) Antwoorden: 6-punts schaal: Variërend van 1 (volledig oneens) tot 6 (volledig eens). Selectieve werving (personeelswerving) 1) Er wordt grote moeite gedaan om de juiste persoon te selecteren. 2) De nadruk wordt gelegd op het potentieel van de werknemer voor de lange termijn. 3) Er wordt aanzienlijk belang gehecht aan het wervingsproces. 4) Er worden zeer omvangrijke inspanningen geleverd binnen het wervingsproces. Uitgebreide training (training en ontwikkeling) 5) Er worden uitgebreide trainingsprogramma’s aan werknemers verstrekt. 6) Normaal gesproken ondergaan medewerkers iedere paar jaar een trainingsprogramma. 7) Er zijn formele trainingsprogramma’s om de nieuw aangestelde personen de vaardigheden bij te brengen die ze nodig hebben om hun taak te kunnen verrichten. 8) Er worden formele trainingsprogramma’s aan de werknemers geboden om hun mogelijkheid tot promotie in deze organisatie te vergroten. Interne mobiliteit 9) Werknemers hebben mogelijkheden om promotie te maken. 10) Werknemers hebben een toekomst in deze organisatie. 13) Werknemers in deze organisatie hebben duidelijke carrièrepaden 14) Werknemers die promotie wensen hebben meer dan één mogelijke positie waar ze naartoe gepromoveerd kunnen worden. Zekerheid van werkgelegenheid 15) Werknemers kunnen verwachten dat ze bij deze organisatie kunnen blijven zolang als ze dat willen. 16) Werkzekerheid is zo goed als gegarandeerd voor werknemers. 17) Werknemers hebben een gevoel van werkzekerheid. Duidelijke taak omschrijving 18) De taken in deze baan zijn duidelijk omschreven. 19) De functiebeschrijvingen zijn ‘up-to-date’.
47 Master Thesis Annelies Buddingh: The devolution of HRM practices
20) De functieomschrijving geeft op accurate wijze alle verplichte activiteiten weer die door de individuele werknemer verricht moeten worden. Op resultaten gebaseerde beoordeling 21) Prestatie wordt door middel van kwantificeerbare resultaten gemeten. 22) Prestatiebeoordeling is gebaseerd op objectieve kwantificeerbare resultaten. 23) Prestatiebeoordelingen leggen de nadruk op wat er op lange termijn en op basis van de groep is bereikt. Beloning door middel van een bonus (Compensatie) 24) Werknemers ontvangen bonussen gebaseerd op de winst van de organisatie. 25) Er is een nauw verband tussen of evenaring van het salaris voor individuele- en groepsprestatie. 26) Werknemers worden beloond op basis van hun werkelijke resultaten. Participatie 27) Werknemers worden regelmatig door hun leidinggevenden gevraagd om deel te nemen aan besluitvorming. 28) Werknemers mogen beslissingen nemen. 29) Werknemers worden in de gelegenheid gesteld om voorstellen te doen met betrekking tot verbeteringen in de manier waarop dingen worden gedaan. 30) Leidinggevenden handhaven open communicatie met hun werknemers. Vragenlijst voor medewerkers Aangepast uit: Sun, Aryee en Law (2007) Antwoorden: 6-punt schaal: variërend van 1 (volledig oneens) tot 6 (volledig eens). Selectieve werving (personeelswerving) 1) Er wordt grote moeite gedaan om de juiste persoon te selecteren. 2) De nadruk wordt gelegd op het potentieel van de werknemer voor de lange termijn. 3) Er wordt aanzienlijk belang gehecht aan het wervingsproces. 4) Er worden zeer omvangrijke inspanningen geleverd binnen het wervingsproces. Uitgebreide training (Training en ontwikkeling) 5) Er worden uitgebreide trainingsprogramma’s aan werknemers verstrekt. 6) Normaal gesproken ondergaan medewerkers iedere paar jaar een trainingsprogramma. 7) Er zijn formele trainingsprogramma’s om de nieuw aangestelde personen de vaardigheden bij te brengen die ze nodig hebben om hun taak te kunnen verrichten. 8) Er worden formele trainingsprogramma’s aan de werknemers geboden om hun mogelijkheid tot promotie in deze organisatie te vergroten. Interne mobiliteit 9) Ik heb promotiemogelijkheden. 10) Ik heb een toekomst in deze organisatie.
48 Master Thesis Annelies Buddingh: The devolution of HRM practices
11) Ik heb een duidelijk carrièrepad in deze organisatie. 12) Als ik een promotie zou wensen dan heb ik meer dan één mogelijke positie waarnaar ik kan promoveren. Werkgelegenheid zekerheid 13) Ik kan verwachten dat ik bij deze organisatie kan blijven voor zolang als ik wil. 14) Werkgelegenheid wordt bijna gegarandeerd. 15) Ik heb het gevoel van baanzekerheid. Duidelijke taakomschrijving 16) De taken in mijn baan zijn duidelijk omschreven. 17) Mijn baan heeft een ‘up-to-date’ beschrijving. 18) Mijn taakbeschrijving beschrijft op nauwkeurige wijze al de taken die ik doe. Op resultaten gebaseerde beoordeling (Beoordeling van taakvervulling) 19) Mijn prestatie wordt door middel van objectief kwantificeerbare resultaten gemeten. 20) Mijn prestatiebeoordeling is gebaseerd op objectieve kwantificeerbare resultaten. 21) Beoordelingen leggen de nadruk op wat er op lange termijn en op basis van de groep is bereikt. Beloning door middel van een bonus (Compensatie) 22) Ik ontvang bonussen gebaseerd op de winst van de organisatie. 23) Mijn individuele salaris is verbonden aan of hangt af van de groepsprestatie. 24) Ik word beloond op basis van mijn werkelijke prestatie. Participatie 25) Ik word regelmatig gevraagd door mijn leidinggevende om deel te nemen aan besluitvorming. 26) Ik mag zelf beslissingen nemen in deze organisatie. 27) Ik heb de gelegenheid om suggesties te maken over verbeteringen in de manier waarop dingen worden gedaan. 28) Mijn leidinggevende communiceert openlijk met mij. Vragenlijst voor lijn managers Sterke punten van het personeelsbeleid Vaardigheden (1 punt, aangepast uit Bos-Nehles 2010; 2 punten zelf opgesteld door Buddingh, Ritzen en Yaneva 2013): 1) HRM activiteiten helpen de mensen van mijn afdeling om te groeien, zichzelf te verbeteren en te ontwikkelen. 2) HRM activiteiten verhogen de kennis in mijn afdeling. 3) HRM activiteiten verzekeren dat mijn afdeling de noodzakelijke vaardigheden heeft. Motivering (4 punten aangepast uit Guay, Vallerand & Blanchard, 2000):
49 Master Thesis Annelies Buddingh: The devolution of HRM practices
4) Ik voer HRM activiteiten uit, omdat ik goede reden heb om dat te doen. 5) Ik voer HRM activiteiten uit, want het is het waard. 6) Ik weet wat HRM activiteiten me opleveren 7) Ik voer HRM activiteiten uit, maar ik weet niet of het iets goeds is om het na te streven. Gelegenheid (3 punten zelf opgesteld): 8) HRM activiteiten zorgen ervoor dat de mensen van mijn afdeling goed met elkaar kunnen omgaan. 9) HRM activiteiten helpen mijn afdeling betrokken te zijn in de organisatie. 10) HRM activiteiten maken het mogelijk om informatie te delen. Persoonlijk belang (4 punten aangepast uit Delmotte et al. 2012):
11) De HR afdeling ontwikkelt HRM activiteiten die ik nodig heb. 12) Ik ervaar toegepaste HRM activiteiten als relevant. 13) Veel van de activiteiten ingevoerd door de HR afdeling zijn nuttig. 14) Ik vraag me regelmatig af wat het nut is van specifieke HRM activiteiten. (R)
Relevantie voor de organisatie (1 punt aangepast uit Bos-Nehles, 2010; 2 punten zelf opgesteld door Buddingh, Ritzen & Yaneva 2013)
15) HRM activiteiten helpen mij om de doelstellingen van mijn afdeling te behalen. 16) HRM activiteiten helpen mij om de doelstellingen van mijn afdeling op tijd te behalen. 17) Ik heb HRM activiteiten nodig om de doelstellingen van mijn afdeling te behalen.
Deugdelijkheid (3 punten uit Delmotte et al. 2012):
18) De HRM activiteiten die in deze organisatie worden toegepast klinken goed in theorie, maar functioneren niet in de praktijk. (R) 19) Er is een kloof tussen de bedoelde uitvoering en de daadwerkelijke uitvoering van de HRM activiteiten. 20) Ik kan erop vertrouwen dat HRM activiteiten het beoogde doel realiseren.
Procedurele rechtvaardigheid (3 punten aangepast uit Liao & Rupp, 2005):
21) Procedures en richtlijnen van HRM activiteiten zijn eerlijk. 22) The procedures van HRM activiteiten om beslissingen te nemen zijn niet eerlijk (R) 23) Ik kan erop rekenen dat de HRM activiteiten een eerlijk beleid hebben.
Gebruiksgemak (3 punten aangepast uit Bos-Nehles 2010):
24) HRM activiteiten die aan mij worden aangeboden, zijn duidelijk en begrijpelijk. 25) HRM activiteiten die aan mij worden aangeboden, zijn concreet genoeg om te gebruiken. 26) Ik vind HRM activiteiten moeilijk om te gebruiken. (R)
50 Master Thesis Annelies Buddingh: The devolution of HRM practices
Personeelszaken contributie (10 punten, aangepast uit Wright, Snell & Gerhart, 2001): 1) De HR afdeling vervult haar baan op de manier waarop ik zou willen dat het wordt gedaan. 2) Onze HR afdeling voldoet aan de behoeften van de organisatie. 3) De HR afdeling verschaft me nuttige en actuele informatie met betrekking tot HR vraagstukken. 4) De HR afdeling heeft bijgedragen om het concurrerend vermogen van de organisatie te verbeteren. 5) De HR afdeling levert toegevoegde waarde aan de werknemers van de organisatie. 6) De HR afdeling draagt ertoe bij dat de kerncompetenties van de organisatie worden opgebouwd en/of gehandhaafd. 7) De HR afdeling draagt bij aan de opbouw van het menselijk kapitaal van de organisatie, met als doel het creëren van concurrentievoordeel. 8) Beleid, activiteiten en procedures die van de HR afdeling komen, helpen de managers en werknemers in hun werk. 9) De HR afdeling heeft goed gecoördineerde beleidstukken, activiteiten en procedures ontwikkelt. 10) De HR beleidstukken, activiteiten en procedures ondersteunen het bedrijfsplan van de organisatie.
51 Master Thesis Annelies Buddingh: The devolution of HRM practices
Appendix 2: Factor analysis perceived HRM practices measured by employees (N=166)
Pattern Matrixa
Component
1 2 3 4 5 6 7 8
My performance is measured
with objective, quantifiable
results
,908
My performance appraisals
are based on objective,
quantifiable results
,886
Appraisals emphasize long
term and department based
achievement
,642
Extensive training programs
are provided ,897
Employees will normally go
through training programs
every few years
,861
There are formal training
programs to teach new hires
the skills they need to
perform their job
,774
Formal training programs are
offered to increase
promotability
,767
Great effort is taken to select
the right person ,919
Considerable importance is
placed on the staffing
process
,912
Very extensive efforts are
made in selection ,865
Long term employee
potential is emphasized ,604
My individual pay is tied or
matched to group
performance
,851
I am rewarded based on my
actual performance ,836
I receive bonuses based on
the profit of the organization ,632
52 Master Thesis Annelies Buddingh: The devolution of HRM practices
My supervisor communicates
openly with me -,841
I am often asked by my
supervisor to participate in
decisions
-,823
I have the opportunity to
suggest improvements in the
way things are done
-,821
I am allowed to make
decisions by myself in this
organization
-,778
If I desire promotion I have
more than one potential
position I could be promoted
to
-,887
I have opportunities for
upward mobility -,784
I have a clear career path in
this organization -,706
I do have a future in this
organization -,460
Job security is almost
guaranteed ,910
I can expect to stay with this
organization for as long as I
wish
,890
I have a feeling of job
security ,837
The duties in my job are
clearly defined -,874
My job has an up to date
description -,817
My job description accurately
describes all of the duties I
perform
-,788
Extraction Method: Principal Component Analysis.
Rotation Method: Oblimin with Kaiser Normalization.
a. Rotation converged in 11 iterations.
53 Master Thesis Annelies Buddingh: The devolution of HRM practices
Structure Matrix
Component
1 2 3 4 5 6 7 8
My performance appraisals
are based on objective,
quantifiable results
,916 ,311 ,325 -,322 -,371
My performance is measured
with objective, quantifiable
results
,913 -,328 -,409
Appraisals emphasize long
term and department based
achievement
,732 -,310 ,419 -,314
Extensive training programs
are provided ,870
Employees will normally go
through training programs
every few years
,865
Formal training programs are
offered to increase
promotability
,390 ,837 -,362
There are formal training
programs to teach new hires
the skills they need to
perform their job
,821
Considerable importance is
placed on the staffing
process
,907
Great effort is taken to select
the right person ,890
Very extensive efforts are
made in selection ,866
Long term employee
potential is emphasized ,721 -,352 ,322
My individual pay is tied or
matched to group
performance
,368 ,366 ,903 -,347
I am rewarded based on my
actual performance ,404 ,891 -,318
I receive bonuses based on
the profit of the organization ,708 -,348 ,325
I have the opportunity to
suggest improvements in the
way things are done
,368 -,858
54 Master Thesis Annelies Buddingh: The devolution of HRM practices
My supervisor communicates
openly with me -,834
I am often asked by my
supervisor to participate in
decisions
-,832 ,301
I am allowed to make
decisions by myself in this
organization
-,797 ,340
I have opportunities for
upward mobility ,426 ,349 -,311 -,860
If I desire promotion I have
more than one potential
position I could be promoted
to
-,826
I have a clear career path in
this organization ,381 ,345 ,302 -,334 -,813 ,314
I do have a future in this
organization ,403 ,349 -,468 -,678 ,503 -,343
Job security is almost
guaranteed ,907
I can expect to stay with this
organization for as long as I
wish
-,318 ,901
I have a feeling of job
security -,306 -,364 ,891
The duties in my job are
clearly defined ,393 -,906
My job has an up to date
description ,476 ,306 -,349 -,900
My job description accurately
describes all of the duties I
perform
,503 ,313 -,305 -,884
Extraction Method: Principal Component Analysis.
Rotation Method: Oblimin with Kaiser Normalization.
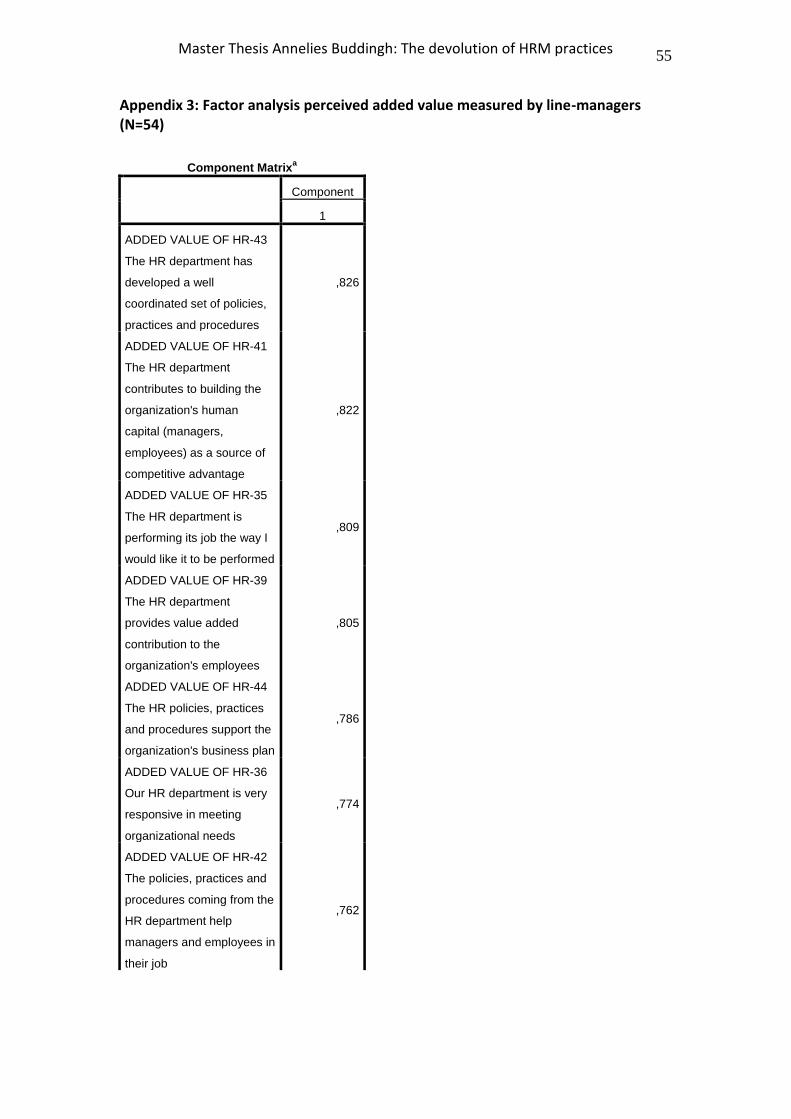
55 Master Thesis Annelies Buddingh: The devolution of HRM practices
Appendix 3: Factor analysis perceived added value measured by line-managers (N=54)
Component Matrixa
Component
1
ADDED VALUE OF HR-43
The HR department has
developed a well
coordinated set of policies,
practices and procedures
,826
ADDED VALUE OF HR-41
The HR department
contributes to building the
organization's human
capital (managers,
employees) as a source of
competitive advantage
,822
ADDED VALUE OF HR-35
The HR department is
performing its job the way I
would like it to be performed
,809
ADDED VALUE OF HR-39
The HR department
provides value added
contribution to the
organization's employees
,805
ADDED VALUE OF HR-44
The HR policies, practices
and procedures support the
organization's business plan
,786
ADDED VALUE OF HR-36
Our HR department is very
responsive in meeting
organizational needs
,774
ADDED VALUE OF HR-42
The policies, practices and
procedures coming from the
HR department help
managers and employees in
their job
,762
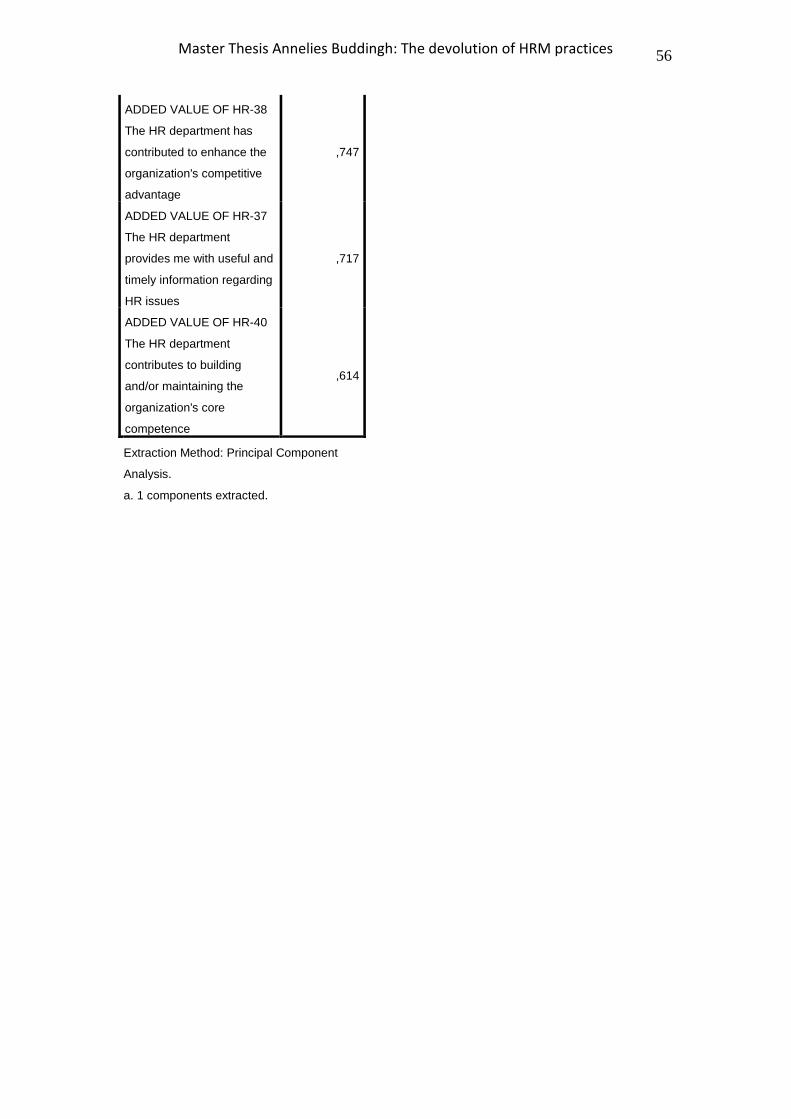
56 Master Thesis Annelies Buddingh: The devolution of HRM practices
ADDED VALUE OF HR-38
The HR department has
contributed to enhance the
organization's competitive
advantage
,747
ADDED VALUE OF HR-37
The HR department
provides me with useful and
timely information regarding
HR issues
,717
ADDED VALUE OF HR-40
The HR department
contributes to building
and/or maintaining the
organization's core
competence
,614
Extraction Method: Principal Component
Analysis.
a. 1 components extracted.
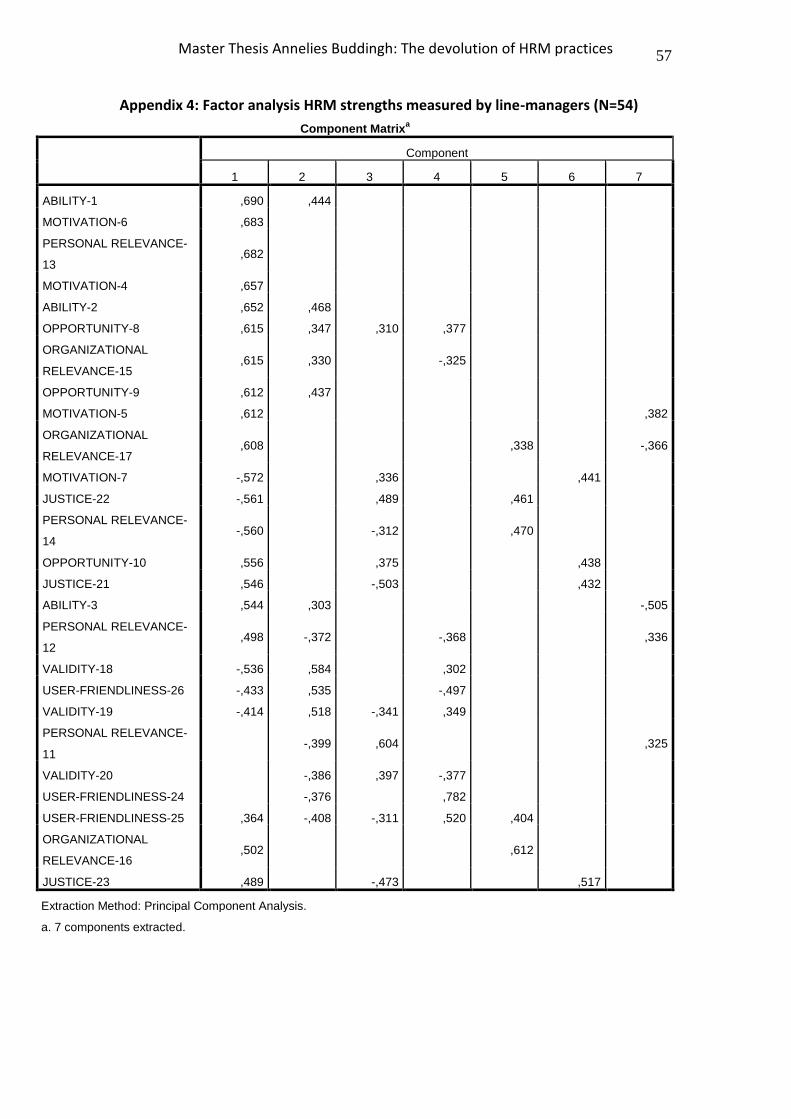
57 Master Thesis Annelies Buddingh: The devolution of HRM practices
Appendix 4: Factor analysis HRM strengths measured by line-managers (N=54)
Component Matrixa
Component
1 2 3 4 5 6 7
ABILITY-1 ,690 ,444
MOTIVATION-6 ,683
PERSONAL RELEVANCE-
13 ,682
MOTIVATION-4 ,657
ABILITY-2 ,652 ,468
OPPORTUNITY-8 ,615 ,347 ,310 ,377
ORGANIZATIONAL
RELEVANCE-15 ,615 ,330 -,325
OPPORTUNITY-9 ,612 ,437
MOTIVATION-5 ,612 ,382
ORGANIZATIONAL
RELEVANCE-17 ,608 ,338 -,366
MOTIVATION-7 -,572 ,336 ,441
JUSTICE-22 -,561 ,489 ,461
PERSONAL RELEVANCE-
14 -,560 -,312 ,470
OPPORTUNITY-10 ,556 ,375 ,438
JUSTICE-21 ,546 -,503 ,432
ABILITY-3 ,544 ,303 -,505
PERSONAL RELEVANCE-
12 ,498 -,372 -,368 ,336
VALIDITY-18 -,536 ,584 ,302
USER-FRIENDLINESS-26 -,433 ,535 -,497
VALIDITY-19 -,414 ,518 -,341 ,349
PERSONAL RELEVANCE-
11 -,399 ,604 ,325
VALIDITY-20 -,386 ,397 -,377
USER-FRIENDLINESS-24 -,376 ,782
USER-FRIENDLINESS-25 ,364 -,408 -,311 ,520 ,404
ORGANIZATIONAL
RELEVANCE-16 ,502 ,612
JUSTICE-23 ,489 -,473 ,517
Extraction Method: Principal Component Analysis.
a. 7 components extracted.
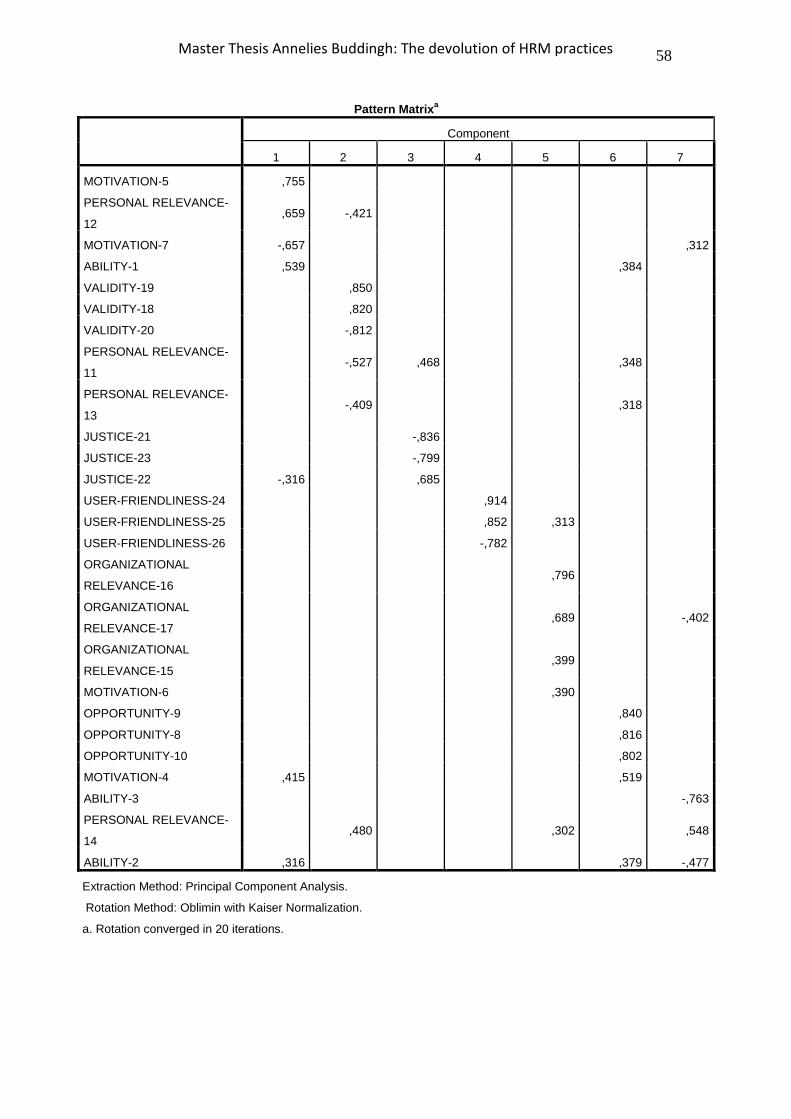
58 Master Thesis Annelies Buddingh: The devolution of HRM practices
Pattern Matrixa
Component
1 2 3 4 5 6 7
MOTIVATION-5 ,755
PERSONAL RELEVANCE-
12 ,659 -,421
MOTIVATION-7 -,657 ,312
ABILITY-1 ,539 ,384
VALIDITY-19 ,850
VALIDITY-18 ,820
VALIDITY-20 -,812
PERSONAL RELEVANCE-
11 -,527 ,468 ,348
PERSONAL RELEVANCE-
13 -,409 ,318
JUSTICE-21 -,836
JUSTICE-23 -,799
JUSTICE-22 -,316 ,685
USER-FRIENDLINESS-24 ,914
USER-FRIENDLINESS-25 ,852 ,313
USER-FRIENDLINESS-26 -,782
ORGANIZATIONAL
RELEVANCE-16 ,796
ORGANIZATIONAL
RELEVANCE-17 ,689 -,402
ORGANIZATIONAL
RELEVANCE-15 ,399
MOTIVATION-6 ,390
OPPORTUNITY-9 ,840
OPPORTUNITY-8 ,816
OPPORTUNITY-10 ,802
MOTIVATION-4 ,415 ,519
ABILITY-3 -,763
PERSONAL RELEVANCE-
14 ,480 ,302 ,548
ABILITY-2 ,316 ,379 -,477
Extraction Method: Principal Component Analysis.
Rotation Method: Oblimin with Kaiser Normalization.
a. Rotation converged in 20 iterations.
Related Documents