The Birchwood Hotel and Conference Centre Johannesburg, South Africa Accelerated and Shared Growth in South Africa: Determinants, Constraints and Opportunities 18 - 20 October 2006 The Developmental Impact of China and India on Ethiopia with Emphasis on Small Scale Footwear Producers. Tegegne GebreEgziabher Conference organised with support from the EU

Welcome message from author
This document is posted to help you gain knowledge. Please leave a comment to let me know what you think about it! Share it to your friends and learn new things together.
Transcript

The Birchwood Hotel and Conference CentreJohannesburg, South Africa
Accelerated and Shared Growth in South Africa:Determinants, Constraints and Opportunities
18 - 20 October 2006
The Developmental Impact of China and India onEthiopia with Emphasis on
Small Scale Footwear Producers.
Tegegne GebreEgziabher
Conference organised withsupport from the EU

The Developmental impact of China and India on Ethiopia with emphasis on small scale footwear producers.
Draft
By Tegegne GebreEgziabher Addis Abeba University
Paper prepared for OECD in the framework of “Development Impact of the economic ascendancy of China and India on
other developing countries’
September 2006

1
1.Introduction China and India are the two largest nations in Asia. Each has about 20% of the global population and each has seen a sustained economic growth exceeding 7% annually. These countries have become important players in the global economy particularly since 1990 (Jenkins and Edwards, 2006). The Asian drivers team (2006) at IDS pointed out that there are three major reasons for the Asian drivers to have a significant impact on the global economy. The first is their growing competitiveness, size and rapid growth (Asian drivers team, 2006). Different manifestations of this include their share in the global trade and their command over key strategic resources such as investment and foreign exchange. The second is their conduct as investors, buyers and their role in global governance institutions. Third is the shift in the attention of less developed countries towards Asia as sources of their future dynamism (Asian drivers team, 2006). The third reason amplifies the pervasive impacts of China and India on developing countries. These impacts occur through production and trade flows, financial flows, environmental spillovers, and global and regional governance (Asian drivers team, 2006). Kaplinsky et al (2006) emphasized trade, production and investment and aid as channels of transmission in identifying the impacts of China on Sub-Saharan Africa1. These could be seen in a direct and indirect relationships. Each of these impacts will have a far reaching consequences for developing countries in different policy areas. One clear consequence of Chinese and Indian production and trade flows is in the industrial policy and sectoral choice of developing countries2 (Kaplinsky et al 2006). The industrial sector in developing countries and particularly in Africa is extremely susceptible to Chinese and Indian exports. These exports can affect the industrial sector in two fronts: competition in internal markets for domestically oriented manufacturers and competition in external market for export oriented industries (Kaplinsky, et al, 2006). Producers in domestically oriented industries can easily be displaced as they cannot withstand the competition from the cheap imports from Asia. On the other hand, export oriented industries face competition in the world market or third country market as Chinese and Indian exports enter such markets. The potential for industrialization in developing countries can also be affected by Chinese and Indian competition which has the capacity to overcrowd the efforts of developing countries. On the other hand, competition does not always displace competitors but as classical economics tell us competition can enhance the productivity of those firms exposed to competitive environment. It, therefore, becomes interesting to identify which of these effects dominate in order to maximize the opportunities and minimize the threats. This paper primarily aims at examining the impacts of Chinese imports on the Ethiopian footwear sector with the view of understanding the impacts and identifying ways forward. It also provides a general perspective on the impacts of China and India on Ethiopia. Both secondary and primary data are collected in the study. Secondary data pertaining to trade relations, investment and aid (assistance) are collected from various 1 Other areas of interest to study Chinese and Indian impacts will be geo-strategic and political imperatives 2 Other policy area that are of relevance are commodity production, poverty and income distribution, good governance, global and regional links,

2
Ministries and Offices. Primary data were collected to provide firm level evidence on the impacts of Chinese imports on local producers. The data were collected using case study and survey methods. Sixty-six micro enterprise (20% of micro enterprises in the study area) and 30 small and medium enterprises (40% of firms in this category) chosen randomly were interviewed from a list of 330 micro enterprises and 75 small and medium enterprises3 prepared by census of the study area4. The study areas, kebeles5 5, 12 and 17, are chosen purposively since they represent the highest concentration of small scale footwear production in Addis Abeba. In addition an in depth interview was conducted with six information-rich case studies which were purposefully chosen from entrepreneurs who were willing to volunteer information. The paper is structured as follows. Section two provides an over view of the impact of Asian drivers namely China’s and India’s impact on Ethiopia along three main vectors: trade, investment and aid. Section three, provides the impact of Chinese imports on the Ethiopian small scale footwear sector. Section four is a concluding section in which the opportunities and challenges are highlighted. 2. The impact of China and India: Trade, FDI and Aid 2.1 China’s and India’s trade relations with Ethiopia The economic links between China and India on one hand and Ethiopia on the other hand can be seen in terms of trade relations. Figure 1 shows the growth of imports, exports and trade balance between Ethiopia and China. It is clearly evident from the figure that imports from China are expanding more rapidly than export to China. Ethiopia’s export to China was very minimal in the decade of the 1990s and started to pick up only in the first half of 2000. There is, however, a huge gap between imports and exports resulting in a trade balance that favors China.
3 This paper uses an operational definition of micro, small and medium enterprises. Micro enterprises are those with employees of up to 15 persons while small and medium are those above 15 employees. This definition closely follows that used by Knorringa and Pegler (2004) for Ethiopian shoe industries. 4 A total of 94 questionnaires were used since two questionnaires were found to have insufficient information 5 A kebele is the smallest administrative unit found within a city. Addis Abeba is divided into 128 kebeles

3
Figure 1: Balance of Trade Between Ethiopia and China, 1991-2004
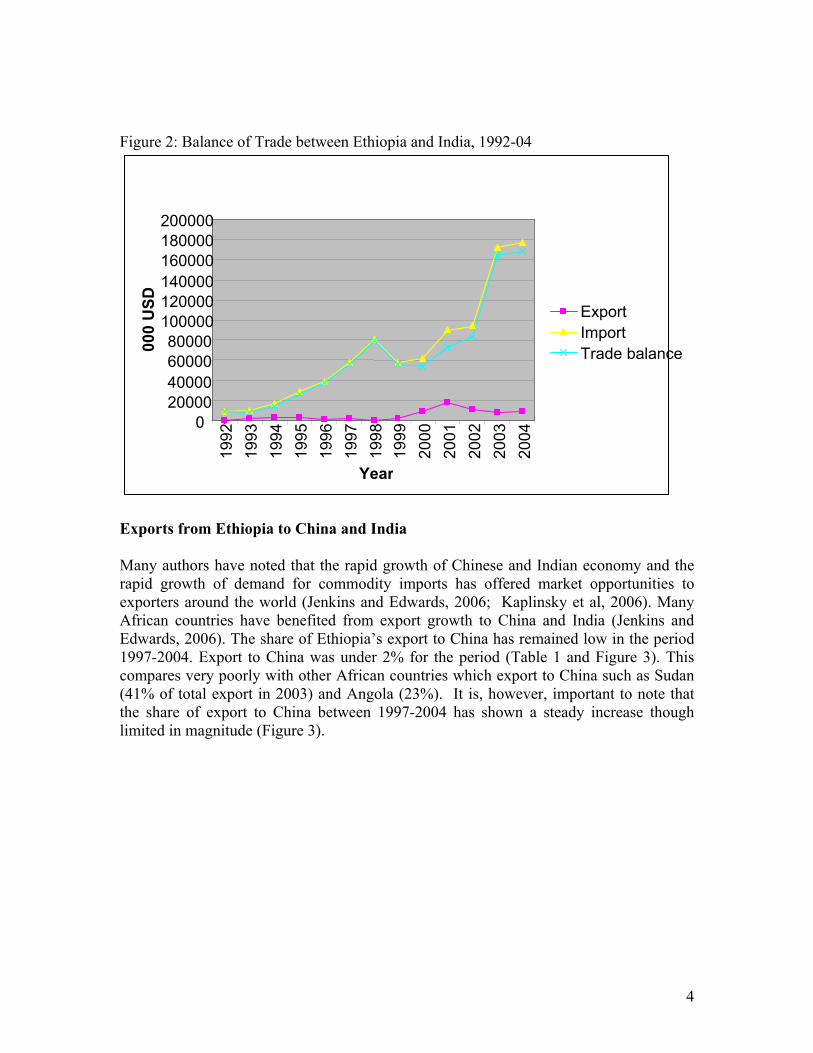
Source: Ministry of Trade and Industry Similarly, figure 2 shows that import from India has grown much higher than export to India with balance of trade favoring India. Imports from India has shown a constant increase with the highest jump being since 2002 onwards. The highest volume of export to India was in the year 2001 when it reached 17 million USD. Export since then has declined though it has a better performance than the period prior to 2001.
0
50000
100000
150000
200000
250000
300000
350000 19
91
1993
1995
1997
1999
2001
2003
Year
000
USD
ImportExport Trade Balance
4
Figure 2: Balance of Trade between Ethiopia and India, 1992-04
Exports from Ethiopia to China and India Many authors have noted that the rapid growth of Chinese and Indian economy and the rapid growth of demand for commodity imports has offered market opportunities to exporters around the world (Jenkins and Edwards, 2006; Kaplinsky et al, 2006). Many African countries have benefited from export growth to China and India (Jenkins and Edwards, 2006). The share of Ethiopia’s export to China has remained low in the period 1997-2004. Export to China was under 2% for the period (Table 1 and Figure 3). This compares very poorly with other African countries which export to China such as Sudan (41% of total export in 2003) and Angola (23%). It is, however, important to note that the share of export to China between 1997-2004 has shown a steady increase though limited in magnitude (Figure 3).
0 20000 40000 60000 80000
100000 120000 140000 160000 180000 200000
1992
1993
1994
1995
1996
1997
1998
1999
2000
2001
2002
2003
2004
Year
000
USD
Export ImportTrade balance

5
Table 1: Share of China and India in Ethiopia’s trade 1997-2005/6 and Value of total imports and exports Year China India Country % total
import % total export
% total import
% total export
Total import (USD)*
Total export (USD)*
1997 4.36 0.12 5.10 0.27 881,244,569 463,681,523.7 1998 3.82 0.14 5.44 0.05 1,221,804,693 466,586,801.3 1999 4.53 0.21 4.12 0.38 1,302,557,621.6 411,345,953.2 2000 6.96 0.22 5.10 1.72 1,497,124,323.6 465,759,959.2 2001 7.49 1.04 5.03 4.02 1,805,151,017.8 430,468,577.8 2002 9.16 1.64 5.75 2.38 1,591,593,341.7 454,557,998.1 2003 9.53 1.24 6.41 1.83 2,716,830,897.8 417,934,179.6 2004 13.21 1.98 6.50 1.50 2,190,680,002 517,513,706 2005/06 NA 13.34 NA 0.75 NA 1,008,567,383 Source: Ministry of trade and Industry * exchange rate used is 1USD= 8.5 birr Figure 3 : Share of Ethiopian imports and exports from and to China and India
0
2
4
6
8
10
12
14
1997 1998 1999 2000 2001 2002 2003 2004
Imports from ChinaImports from IndiaExports to ChinaExports to India

6
The most recent data of Ethiopian export, however, shows that there is a surge of Ethiopian export particularly to China. China becomes the number one trade partner for Ethiopian exports in the year 2005/06 (Table 2). The table shows that out of different destination countries for Ethiopian export (111 countries were listed as destination for export in 2005/06), China has the highest share (13.34%). China's share was only 0.22 % in the year 2000. Table 2: Value and share of Ethiopian exports by country of Destination, 2000 and 2005/06 Country 2000 2005/06 Value (USD) % share Value (USD) % share China 1,019,633.1 0.2 134,564,964 13.3% Germany 91,163,609.3 19.6 99,006,345 9.8 Japan 54,641,952.4 11.7 78,956,777 7.8 Switzerland 27,416,959.5 5.9 66,743,132 6.6 Djibouti 48,070,876.8 10.3 57,004,518 5.7 Italy 30,418,422.3 6.5 55,252,643 5.5 Saudi Arabia 37,335,524 7.9 54,780,588 5.4 USA 17,059,390 3.7 47,606,515 4.7 Somalia 29,201,681.8 6.3 38,410,549 3.8 Netherlands 9,839,312.2 2.1 38,110,477 3.8 Belgium 15,919,484.5 3.4 26,672,458 2.6 UK 10,468,463.4 2.2 26,161,167 2.6 Sudan 634,152.9 0.1 24,404,669 2.4 Yemen 6,082,840.2 1.3 23,449,411 2.3 Somaliland 21,851,659 2.2 UAE 2,722,243.0 0.6 21,670,515 2.1 France 14,020,886.7 3.0 20,419,006 2.0 Israel 16,110,392.5 3.5 20,055,691 2.0 Egypt 6,147,533.6 1.3 14,635,679 1.4 Turkey
130,003.1 0.03 14,406,292 1.4
Singapore 2,048,484.9 0.4 10,874,472 1.1 India 8,013,925.2 1.7 7,563,278 0.7 Other countries
37,294187.6 8.0 105,966,579 10.5
Total sum 465,759,959 100.0 1,008,567,383 100.0 Source: Ministry of trade and industry
7
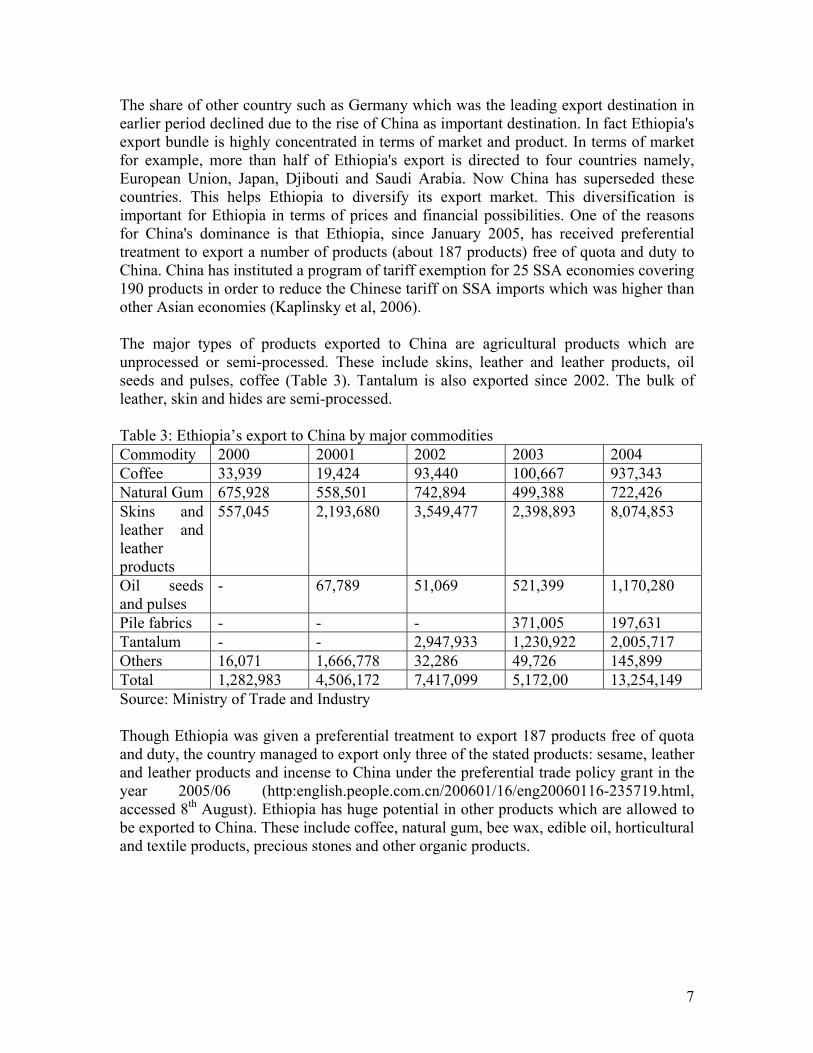
The share of other country such as Germany which was the leading export destination in earlier period declined due to the rise of China as important destination. In fact Ethiopia's export bundle is highly concentrated in terms of market and product. In terms of market for example, more than half of Ethiopia's export is directed to four countries namely, European Union, Japan, Djibouti and Saudi Arabia. Now China has superseded these countries. This helps Ethiopia to diversify its export market. This diversification is important for Ethiopia in terms of prices and financial possibilities. One of the reasons for China's dominance is that Ethiopia, since January 2005, has received preferential treatment to export a number of products (about 187 products) free of quota and duty to China. China has instituted a program of tariff exemption for 25 SSA economies covering 190 products in order to reduce the Chinese tariff on SSA imports which was higher than other Asian economies (Kaplinsky et al, 2006). The major types of products exported to China are agricultural products which are unprocessed or semi-processed. These include skins, leather and leather products, oil seeds and pulses, coffee (Table 3). Tantalum is also exported since 2002. The bulk of leather, skin and hides are semi-processed. Table 3: Ethiopia’s export to China by major commodities Commodity 2000 20001 2002 2003 2004 Coffee 33,939 19,424 93,440 100,667 937,343 Natural Gum 675,928 558,501 742,894 499,388 722,426 Skins and leather and leather products
557,045 2,193,680 3,549,477 2,398,893 8,074,853
Oil seeds and pulses
- 67,789 51,069 521,399 1,170,280
Pile fabrics - - - 371,005 197,631 Tantalum - - 2,947,933 1,230,922 2,005,717 Others 16,071 1,666,778 32,286 49,726 145,899 Total 1,282,983 4,506,172 7,417,099 5,172,00 13,254,149 Source: Ministry of Trade and Industry Though Ethiopia was given a preferential treatment to export 187 products free of quota and duty, the country managed to export only three of the stated products: sesame, leather and leather products and incense to China under the preferential trade policy grant in the year 2005/06 (http:english.people.com.cn/200601/16/eng20060116-235719.html, accessed 8th August). Ethiopia has huge potential in other products which are allowed to be exported to China. These include coffee, natural gum, bee wax, edible oil, horticultural and textile products, precious stones and other organic products.

8
Exports to India declined in 2002 and 2003 from the peak of 17 million USD in 2001 (Table 4). The major items exported are skins leather, leguminous vegetables and cotton though the latter has shown a decline in 2004. The share of exports to India has reached a peak of 4 % in the period 2001 but has remained mostly under 3 % for the period 1997-2004 (Table 1). As opposed to China, India’s share in 2005/06 export of the country was only 0.75 % ranking as 25th destination. This is a decline from its share of 1.7% in the year 2000 (Table 2). The volume of export during this period however has shown a limited decline. The reason for a declining share despite little change in the volume of export could be due to the rise in the total volume of Ethiopian export making India’s share to decrease significantly since there is no improvement in the volume of export to India. India does not have any preferential trade agreement with Ethiopia though the two countries have agreements to promote and facilitate trade, commercial and economic cooperation between them on a long term and stable basis. Table 4:Ethiopia's major export to India (Value in USD) Commodities 2000 2001 2002 2003 2004 Skin Leather 7,462,136 7,392,601 4,628,638 4,146,212 3,988,668 Leguminous vegetables
- 5,954,761 2,265,136 2,262,762 1,047,283
Cotton 1,049,918 3,888,736 2,686,305 599,643 - Oil seeds 63,074 543,233 152,287 613,763 Natural gum 87,153 30,537 17,183 77,642 - Scraps - 20,197 43,797 93,653 114,141 Ginger - 9,602 29,834 122,383 344,022 Coffee - -- - - 401,137 Chat - - - - 38,518 Others 8,376 45,749 764,488 148,455 2,443,929 Total 8,607,583 17,405,257 10,978,614 7,603,037 8,991,461 Source: Ministry of Trade and Industry ‘-‘ indicates very small amount or insignificant export. The values are included under the ‘other’ category. Imports from China and India Figure 3 shows that there is a steady increase in the share of imports from China and India. Imports from China, however, has shown a significant increase. The volume of imports from India has increased from 90 million USD in 2001 to 177.6 million USD in 2004 with a 78 percentage change (Table 5).

9
Table 5: Ethiopia's major imported commodities from India (value in USD) Commodities 2001 2002 2003 2004 Measuring instruments
846,608 1,437,867 2,143,999 2,042,825
Motor Vehicles 452,283 745,874 782,359 1,354,458 Electrical and electronic equipments
2,207,968 3,929,861 7,184,190 5,231,212
Machineries 4,238,995 8,253,741 15,186,405 12,751,274 Products of metal
50,099,502 48,044,018 74,077,015 68,639,442
Articles of glasses
1,852,267 1,382,916 1,987,464 2,232,011
Textile 8,010,443 5,423,480 6,711,962 6,651,932 Footwear 35,504 86,998 222,157 242,610 paper and paper products
4,443,679 4,757,327 11,322,770 11,809,218
Rubber, chemicals and mineral
14,915,990 15,288,421 27,603,556 29,087,257
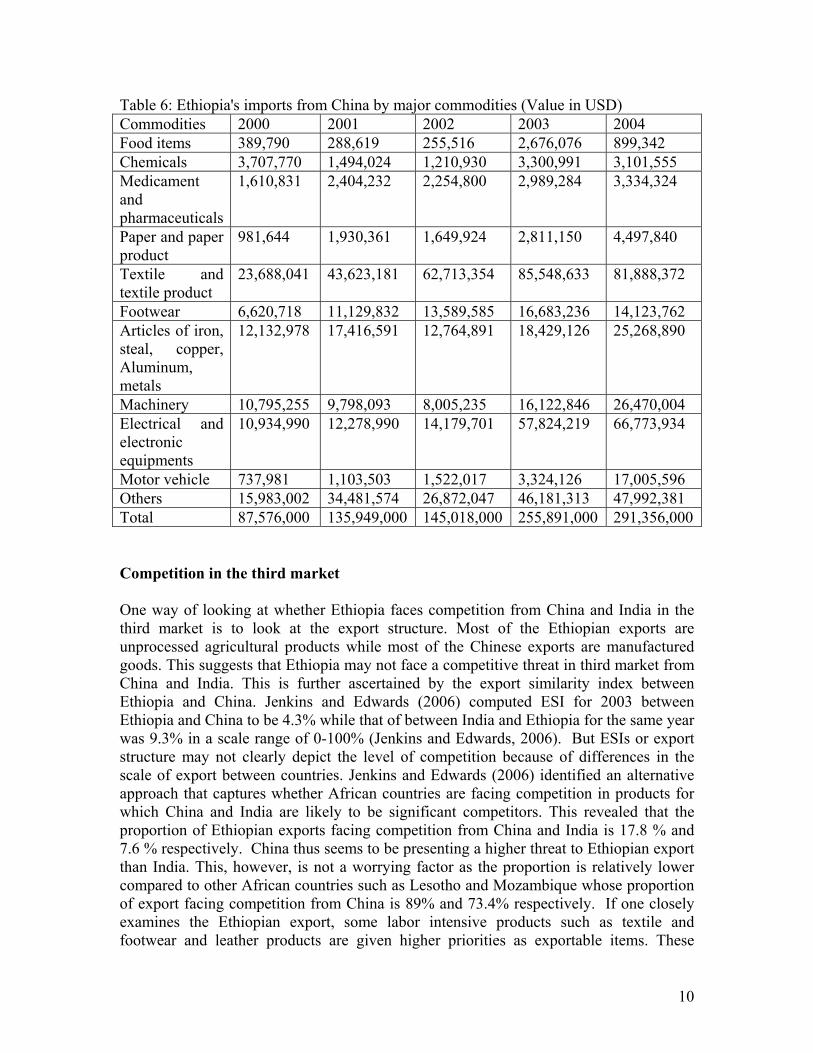
Others 3,032,774 4,313,948 24,840,956 37,554,956 Total 90,146,013 93,664,451 172,062,843 177,597,197 Source: Ministry of trade and industry The volume of Chinese imports rose from 87.5 million USD in 2000 to 291.4 million USD in 2004 showing a 233% increase (table 6). The share of China in Ethiopia’s total import has grown from less than 5% in the late 1990s to over 10% by 2004 (Table 1). This increment is not matched by imports from India which has remained around 5 % for most of the period and a little over 5% in 2003 and 2004. The major commodities imported from both India and China are manufactured goods which are both labor intensive and non-labor intensive products. Among labor intensive products, textile and textile products and footwear form the major types of goods. The value of footwear and textile imported from China (96 million in 2004) is much higher than those coming from India (6.9 million in 2004). Since these products are produced domestically, their effects on local producers are significant. The specific effects of Chinese imports particularly on footwear producers are discussed in section 3. On the other hand it is acknowledged that cheap Chinese and Indian goods will reduce prices to consumers (Jenkins and Edwards, 2006). The net welfare effects of Chinese and Indian imports in Ethiopia, however, are not known.
10
Table 6: Ethiopia's imports from China by major commodities (Value in USD) Commodities 2000 2001 2002 2003 2004 Food items 389,790 288,619 255,516 2,676,076 899,342 Chemicals 3,707,770 1,494,024 1,210,930 3,300,991 3,101,555 Medicament and pharmaceuticals
1,610,831 2,404,232 2,254,800 2,989,284 3,334,324
Paper and paper product
981,644 1,930,361 1,649,924 2,811,150 4,497,840
Textile and textile product
23,688,041 43,623,181 62,713,354 85,548,633 81,888,372
Footwear 6,620,718 11,129,832 13,589,585 16,683,236 14,123,762 Articles of iron, steal, copper, Aluminum, metals
12,132,978 17,416,591 12,764,891 18,429,126 25,268,890
Machinery 10,795,255 9,798,093 8,005,235 16,122,846 26,470,004 Electrical and electronic equipments
10,934,990 12,278,990 14,179,701 57,824,219 66,773,934
Motor vehicle 737,981 1,103,503 1,522,017 3,324,126 17,005,596 Others 15,983,002 34,481,574 26,872,047 46,181,313 47,992,381 Total 87,576,000 135,949,000 145,018,000 255,891,000 291,356,000 Competition in the third market One way of looking at whether Ethiopia faces competition from China and India in the third market is to look at the export structure. Most of the Ethiopian exports are unprocessed agricultural products while most of the Chinese exports are manufactured goods. This suggests that Ethiopia may not face a competitive threat in third market from China and India. This is further ascertained by the export similarity index between Ethiopia and China. Jenkins and Edwards (2006) computed ESI for 2003 between Ethiopia and China to be 4.3% while that of between India and Ethiopia for the same year was 9.3% in a scale range of 0-100% (Jenkins and Edwards, 2006). But ESIs or export structure may not clearly depict the level of competition because of differences in the scale of export between countries. Jenkins and Edwards (2006) identified an alternative approach that captures whether African countries are facing competition in products for which China and India are likely to be significant competitors. This revealed that the proportion of Ethiopian exports facing competition from China and India is 17.8 % and 7.6 % respectively. China thus seems to be presenting a higher threat to Ethiopian export than India. This, however, is not a worrying factor as the proportion is relatively lower compared to other African countries such as Lesotho and Mozambique whose proportion of export facing competition from China is 89% and 73.4% respectively. If one closely examines the Ethiopian export, some labor intensive products such as textile and footwear and leather products are given higher priorities as exportable items. These

11
sectors are identified as priority sectors to spearhead industrialization and generate employment in the country. As both China and India and particularly China are involved in the exporting of clothing and footwear products to the world markets, they pose some threats to Ethiopian drive along this line. In particular the rise of China in the clothing sector affects Ethiopia's effort to export to the US through the African Growth Opportunity Act (AGOA). So far Ethiopia has not benefited much from AGOA opportunity as other African countries such as Kenya did. Ethiopia has been able to export only a total of 4.9 million USD in the years 2001-2005 to the US. The corresponding figure for Kenya until 2005 June was 177.2 million USD (McCormick et al, 2006). Ethiopia is encouraging its entrepreneurs to make use of the opportunity. Ethiopian entrepreneurs wishing to pursue AGOA opportunity however will be under pressure to reduce cost because of the presence of China in the US market. 2.2 Investment Chinese and Indian private entrepreneurship is evident in Ethiopia. Chinese investment in the years 1992-2005 is higher than Indian investment in the same period (Table 7). During the period Chinese investment accounted for 8 % and 5% of the total number of projects and capital respectively. Indian investment accounted for 7% and 4% of the total projects and capital respectively. The average size of Chinese investment is 17.1 million birr while that of Indian investment is 15.7 million birr. Unlike other countries, investment does not come from naturalized Chinese and Indians or there is very little investment from Chinese-Ethiopian or Indian-Ethiopian. The sectoral distribution of investment by Chinese and Indian entrepreneurship is almost similar. Manufacturing, agriculture, real estate, renting and business and construction are the most important ones in their order of importance. Within agriculture, floriculture occupies the highest share. This is due to the recent boom of the flower industry in Ethiopia. Floriculture in Ethiopia has grown very quickly and it has been one of the recent attractions to foreign investors. Under construction investment, Chinese has been predominant in road construction while Indians seem to be present in water drilling projects. Table 7 : Chinese and India FDI, 1992-2005
China India No of
projects Capital (Million birr)
Permanent employment
temporary employment
No of projects
capital permanent employment
temporary employment
Wholly foreign
97 1,480 5,230 5,128 78 1255.1 6361 5,693
Joint with domestic
10 351 515 368 12 158.2 769 449
Total 107 1831 5,745 5,496 90 1413.2 7130 6,142 % of total country
8.2 4.8 4.0 4.7 6.9 3.7 5.0 5.3
Source: Ethiopia investment office,2006

12
The Chinese road construction investment has concentrated in Addis Abeba, the capital city, and across regions linking cities. Within Addis Abeba the Chinese company namely the Chinese Road and Bridge Construction company has been very active and is engaged in several projects (see table 8). As shown in table 8, some of the projects are grant6 projects though they are undertaken by the Chinese companies. Others are tendered and are financed by the Ethiopian Government. Table 8: Chinese road project investment in the city of Addis Abeba No Road segment Cost of construction
Remark
Birr USD* 1 Alert Hospital- keranio 32,346,000 3,805,411.7 2 Mekanisa square-Anbessa
Garage 38,070,000 455,294.1
3 Adwa square-CMC-Ayat 135,509,000 15,942,235.2 4 Lafto Libo-Mekanissa
settlement area 79,262,000 9,324,941.1
5. Winget square-Gojam road
380,838,000 44,804,470.5
6 Gotera interchange 108,900,000 12,811,764.7 Grant 7 Megenaga-British
Embassey 197,104,000 23,188,705 Partially
Grant 8 Yekatit 12 square-Afincho
ber-Semen Hotel 50,279,000 5,915,176
9 Ethio-China friendship road
33,426,201.96 3,932,494 Grant
10 Ring road phase 1 601,000,000 70,705,882 The cost of 601 million covers both phase 1 and phase 2 of the project
11 Ring road phase 2 Source: Addis Abeba road authority, unpublished *The exchange rate used in this paper is 1US= 8.5 birr 2.3 Aid The formal link between China and Ethiopia in economic and technical cooperation started in 1971. The cooperation includes provision of soft loans, grants and technical assistance. The technical assistance involves training of personnel, dispatching of medical doctors and supply of medical equipment and medicines. The aid vector between the two countries thus constitute financial and technical assistance. The financial assistance is
6 Grants are assistance and such projects come under aid (see below)

13
meant to implement projects and constitutes both grants and loans. So far the Chinese government has extended a total of 590 million RimbiYuan (RMBY) interest free loan to the Government of Ethiopia (MoFED, unpublished, undated). Out of this money 350 million RimbiYuan was allocated for the implementation of different projects. Since 1995 the total committed grant is 170 million RimbiYuan of which 53.09% is allocated while the total loan is 150 million RimbiYuan of which 73.3 % is allocated. The Chinese government is not a major financial donor to Ethiopia compared to other countries such as USA or European Union. The presence of Chinese government in financial assistance, however, is some how felt. In particular, the Chinese government is making its presence felt in the capital city, Addis Abeba by supporting different projects. For instance the Chinese government has allocated 80.29 million birr for the construction of model TVET in Addis Abeba and an interchange road project is to be supported with 110 million RimbiYuan in the city of Addis Abeba (see above)7. These are supposed to be flagship projects in the city. The second form of aid provided by China is technical cooperation which involves both support to the medical sector and short term training. The Chinese Government has extended medical experts for some hospitals for the last 20 years. The medical teams mainly work in Jimma and Debre Berhan hospitals and currently Chinese medical team are found in Adama hospital, Black lion hospital and the Addis Abeba University Dental health training center. In addition, short term training are offered by the Chinese Government. Though Ethio-India diplomatic relation started in 1949, the involvement of India in different components of aid in Ethiopia is limited. The two countries have signed technical, economic and scientific agreements in 1969 and trade agreements in 1982 and 1999. The trade agreement is used as basis to import and export items from and to India. Under its technical and economic cooperation programme launched in 1964 and known as ITEC (Indian technical and economic cooperation programme), Ethiopia has benefited from human resource development programme. Under this programme 20 people have been trained in 2003/04 and 30 have been trained in 2004/05 (MoFED, unpublished, undated). Other aspects of ITEC assisted projects in Ethiopia include feasibility study for Ejersa and Sewir projects, supply of equipment for Awash common facility center and pilot weaving center in Addis Abeba. In addition, the Indian Government has an intention of providing concessional loan for the development purpose for highly indebted poor countries (HIPC) countries. Under this arrangement, the Ethiopian Government has requested the Indian Government to finance a power transmission and distribution project with an estimated cost of 65 million USD.
7 There is a slight difference concerning the actual figure devoted for the interchange road project in Addis Abeba. The discrepancy is due to the different sources from where the data were collected.

14
3.0 Impacts of Chinese imports and coping strategies of small scale footwear producers The forgoing has provided a general perspective on the overall impacts of China and India on Ethiopia. China seems to have a larger impact than India particularly in the sphere of trade relations. One of the consequences of trade relations is its impact on local producers. The following closely examines such impacts with the view of understanding the extent of the impact and how local producers cope up with such influences. This is done by referring to small scale footwear producers. The leather master plan study classified the footwear industry in Ethiopia into two groups namely the large mechanized footwear industries and the micro, small and medium enterprises (UNIDO and Ministry of Trade and Industry, 2005). The mechanized footwear industries numbering about a dozen are those found in the formal sector and constitute large and medium industries. Most of the industries are private owned while there are a few state owned industries. The other group of industries constitute medium, small and informal producers. According to the Master plan (UNIDO and Ministry of Trade and Industry, 2005), the medium scale producers have about 30-40 workers and number about 3-40 units, the small scale producers have about 15-20 workers and number about 75-100 units. The informal producers are home based units and they are estimated to number about 400-500 units. Knorringa and Pegler (2004) also estimated these industries to number about 400. These factories are dominated mainly by a single ethnic group-the Guraghes who are poor and seasonally move between farm work or petty trading in their native areas and footwear production in Addis Abeba (Knorringa and Pegler 2004). They produce low quality cheap footwear using manual methods. The targets are rural traders and farmers. The small scale producers are semi-mechanized and produce for shops in the city. They have their own brand and some even attempt to enter the export market but lack capability to do so. The medium scale producers have better machines and workshop and better known product brands and mostly sell their products in their own shops (UNIDO and Ministry of Trade and Industry, 2005). Both informal and small scale industries cater for high level of employment, satisfy local demand and operate in a naturally (spontaneously) established cluster. International trade in the footwear sector shows that the country is a major importer. (Table 9). Export is only at its infancy or does not exist in the footwear sector. Poor quality of domestic leather and high cost of imported inputs are cited as possible reasons for not being competitive in the international market (Berhanu and Kibre, 2002). To this is added the stigmatisation of the country. As the country is prone to natural disaster and famine, it does not have an image of producing high quality shoe (Knorringa and Pegler, 2004).

15
Table 9: External trade in Leather products (million USD) Footwear Leather articles Country Import Export Import Export 1997 4.6 0.1 0.7 0.04 1998 9.1 0.1 0.9 0.08 1999 9.7 0.1 1.7 0.0 Source: Berhanu and Kibre 2002, p.13 Increased pressure from imported shoes is the major challenge the sector is currently facing. The overwhelming proportion of leather shoes are mainly imported from China and this has flooded the domestic market. Though the tariff that applies to imported shoes (35%) is highest given the present tariff structure, Chinese imports, however, compete in the domestic market. They have relegated informal firms to supplying the most basic traditional types of footwear and have forced them to desperately compete with the cheap imports (Knorringa and Pegler, 2004). The small scale factories which produce for the more expensive domestic market segment are also affected as the quality of imports improves (Knorringa and Pegler, 2004). On the other hand, firms faced with such disequilibrium have continued to survive and operate in the domestic market. This implies that firms develop coping strategies that enable them survive in the market or even grow. The following section examines the competitiveness of Chinese and local shoes in domestic market, the local impacts of Chinese shoes and coping strategies followed by local producers. The competitiveness of Chinese and local shoe in domestic markets Firms’ perception on the competitiveness of Chinese and local shoes in domestic markets were examined in the study. Price is a major advantage Chinese shoes have over local shoes (Table 10). Chinese shoes are available in the market at much lower price than domestic shoes. For instance, the average price for men’s shoe from China is 60-80 birr ($7-$9.4) while the average retail price for domestic shoe costs 100-110 birr ($12-$13). In principle, low prices can force those who cannot offer the same prices to go out of the market. The other major significant competitive advantage of Chinese shoes is the introduction of new products in the domestic market which have better and superior designs. This was confirmed by nearly one-third of the respondents. The case studies also reiterated that Chinese shoes are better designed and are more fashionable than domestic shoes. These advantages of price and superior design attract customers who like to have a better looking shoe for a reduced price. In addition, quality is mentioned by 15 % of the respondents as another important advantage of Chinese shoes. This refers to different aspects including the finishing quality of shoes.

16
Table 10: Producers perception about the competitive advantage of Chinese imports* Micro enterprises Small and medium
enterprises Total
Number Percentage
Number Percentage Number Percentage
Price (lower) 39 46.9 19 52.7 58 49.1 Introduction of new products and better design
26 31.3 14 38.8 40 33.8
Quality including better finishing
16 19.3 2 5.5 18 15.2
Reliability in delivery and supply
2 2.4
1 2.7
3 2.5
Total 83 100 36 100 118 100 Source: Own survey *Multiple answers possible On the other hand local firms’ perception of own competitiveness puts the different competitiveness variables at low level (Fig 4). Relatively speaking, local firms agree that they do not have competitive advantage in price and product quality. Similarly, innovative design is also rated very low indicating the poor design quality of local shoes. Punctual delivery and time from order to delivery have received a better rating in comparison to other factors. Fig 4: Assessment of own competitiveness by producers
All Enterprises
012345
Product quality
Price
Time from order to delivery
Punctual delivery
Innovative designs
Flexibility
All Enterprises

17
The competitiveness of Chinese imports and local shoe can be seen vis a vis domestic market requirement. The factors that were rated very high by producers in the domestic market are quality, delivery time and design. Price is also rated high. The three factors quality, design and price, are easily fulfilled by Chinese imports but not by local shoes. The only advantage local firms envisaged for themselves is punctual delivery which is instrumental only to meet the seasonality of demand in shoe market. But this advantage can easily be eroded if importers plan imports to match seasonal demand. Under this condition, it is only natural for the Chinese shoes to take over the domestic market and inflict heavy impacts on local firms. Impacts of Chinese Imports Chinese imports have affected all enterprises to a different degree and scale. Micro enterprises in particular are hard hit by the imports. Seventy eight percent of the micro enterprises stated that the impacts are very severe. The major impact of the Chinese import has been downsizing the activity of enterprises . This is reported by 32 % of the total enterprises with the highest of such impacts being felt by micro enterprises (Figure 5). Down sizing of activity refers to cutting back of production, reducing labor force, reducing working hours etc. Figure 5: Firms’ response on the impact of Chinese shoes
0
5
10
15
20
25
30
35
40
45
Went intobankruptcy
Closed downf irms and
returned licenefor a wihile
Down sizeact ivity
Resorted toshoe repair
f romproduct ion
Started towork without
license
Broughtmarket related
problems
No impact
M icro enterpriseSmall and medium enterpriseTotal
In terms of work force or employment, Chinese import has resulted in shrinking the labor force working in different firms. For instance, the mean number of employment per establishment has declined from 7 to 5 for micro enterprises and from 41 to 17 for small and medium enterprises. Similarly, the medium and small enterprises used to have a

18
maximum number of 99 employees compared to the current maximum employment of 22. Such reduction of the labor force results in massive lay offs affecting not only the firms but also the workers and their families who became the victims of the process. The other impact of the Chinese shoes reported by firms is bankruptcy or loss of assets and money. This is reported by about 28% of the respondents. The case studies reiterated that some firms were forced to sell their assets and machineries. In the extreme case, such impact caused firms to permanently exit the market8 while in other cases firms exited and re-entered the market. The case of firm 5 illustrates the latter situation (Box 1). More specifically a little over 10 % of the surveyed firms reported that they returned their license. Others stayed in the business but downgraded their activity to shoe mending and shoe repair (4%) or changed themselves to informal operators (6%).
Box 1: Firm 5 response on impacts of Chinese impact
Coping Strategies of enterprises to withstand negative impacts of Chinese competition Firms have followed a number of strategies to withstand the impacts of Chinese imports and stay in the market. Following the literature (Nadvi, 1995 ) these could be grouped into 'high road' and 'low road'. The former in general refers to ability to withstand competition through improving productivity via technically innovative and quality conscious strategy and the latter refers to maintain or increase market share by lowering prices, lowering profit margins, using cheap labor and technically stagnant strategy. High road of competition These strategies include improving design, improving quality, investing in machineries and product specialization. About 60% of the survey respondents indicated that they have been able to improve the design of their shoes following Chinese imports (Table 11). Design improvement is significantly confirmed by micro enterprise (59%) and small and medium enterprises (63%) operators as a critical strategy. This strategy emanates from the need to counter the design advantage Chinese shoes have over local shoes. Improving designs in response to import competition has two aspects. First, better designs are prepared by giving attention to different details that matter in designing. For instance, a respondent in the case study mentioned that he now uses compass to draw 8 Though it is difficult to contact those who have quitted the market, case studies have revealed that many firms have left the market for ever.
Firm 5 is a micro enterprise with 5 employees. The owner declared that he had stopped work for 4-5 years following Chinese imports to the country. He actually went bankrupt, sold his production assets and property and lost his capital which he mentioned had reached 200,000 Birr. He was engaged in different activity for those years. He now has resumed shoe production. His return to shoe production is facilitated by small amount of loan he was able to secure from micro finance institution.

19
parallel lines while previously he used free hand. This shows how competition has forced producers to pay attention to different issues relevant for the design of shoes. In addition, better designs are prepared by imitating some imported shoes and copying from catalogues. Producers, however, face difficulty in directly imitating imported shoes since they cannot acquire the necessary last, sole etc that matches the design requirement of the imported shoe. Secondly, firms have learned that they have to continuously change the design of their shoes in order to match the needs and demands of the market. A case study respondent reiterated that a frequent design change is necessary (Box 2). Box 2: Firm 5 response regarding design Though improving design is mentioned as one important strategy to compete in the market, shoe producers have not attained a high level of design capacity. The survey result showed that 100 % of the firms use manual method of designing. Respondents also mentioned that they have a serious capacity problem in designing. They reiterated that they need training on design (28.1%), access to design machineries (22.7%) and skill improvement for their manpower (22.7%) in order to improve their design capability. Table 11: Enterprise strategy to cope with the Chinese Shoes Micro enterprises Small and
medium enterprises
Total
Number Percentage
Number
Percentage
Number Percentage
Design superior 55 58.5 29 63.0 84 60 Improved quality of products
18 19.1 12 26.1
30 21.4
Increased average speed of response time
10 10.6 1 2.2 11 7.8
Lowered price and profit margin
8 8.5
0 0
8 5.7
Increased reliability in delivery and supply
1 1.1 4 8.6
5 3.6
Introduced new shoes 1 1.1 0 0 1 0.7 Shifted to lower products 1 1.1 0 0 1 0.7 Total 94 100 46 100 140 100 Source: Own survey Multiple answers
Firm 5 is a micro enterprise with 5 employees. Regarding design the owner mentioned that previously he used the same design over a long period of time. Now, however, one way of coping with the market by the firm is to frequently change designs so as to best suit the tastes and needs of the customers.

20
Quality improvement in finishing, use of accessories etc is pointed out as the other coping strategy by 21% of the enterprises. In particular, producers have realized the importance of finishing quality as key ingredient to become competitive in the domestic market. Some respondents from the case study mentioned that they have learned finishing quality from the Chinese shoes. Quality improvement, however, is given emphasis by small and medium enterprises compared to the micro enterprises. For instance, about 84.4 % of the micro enterprises rated quality improvement in their firm as low ( a score of 2 and less) in a scale of 1-5 as compared to about 46.7 % or nearly half of the small and medium enterprises who rated quality improvement in their firm with a score of 3 and above (Table 12). Table 12: Producers’ ratings of quality improvements in own firm (percentage) (rating scale 1-5) 1 2 3 4 5 Mean N Micro enterprise
56.3
28.1
10.9
3.1
1.6
1.65 64
Small and medium
20.0
33.3
13.3
26.7
6.7
2.67 30
Total 44.7
29.8
11.7
10.6
3.2
1.97 94
Source: own survey One of the ways to improve quality is innovation in the usage of materials and accessories. Nearly 60 % of the small and medium enterprises mentioned that they have introduced some kind of innovation while the overwhelming majority of micro enterprises (86%) have not introduced such innovation in the usage of material and accessories. Others less frequently mentioned coping strategies, shown in table 11, are increasing the speed of response time and reliability of delivery and supply. These are mentioned by nearly 8 % and 4 % of the producers. These strategies address the nature of shoe production in which orders tend increasingly to arrive at the last moment (Rabellotti, 1997). In addition to those strategies shown in table 11, producers have undertaken other activities in response to the domestic market requirement. Investment in machineries is a case in point. Slightly over half (53.3%) of the small and medium enterprises have bought new machineries since the Chinese imports. Among micro enterprises, however, it is only 3 % which reported the same. All those who have bought new machineries expressed that their investment is a significant investment and not a mere replacement. Domestic market requirement is considered as an important source of motivation for undertaking such investment by the small and medium enterprises. Chinese imports have forced local producers to concentrate on the production of shoes for which they seem to have a comparative advantage. About 92 % of the micro enterprise and 100 % of the small and medium enterprises reported that they mainly
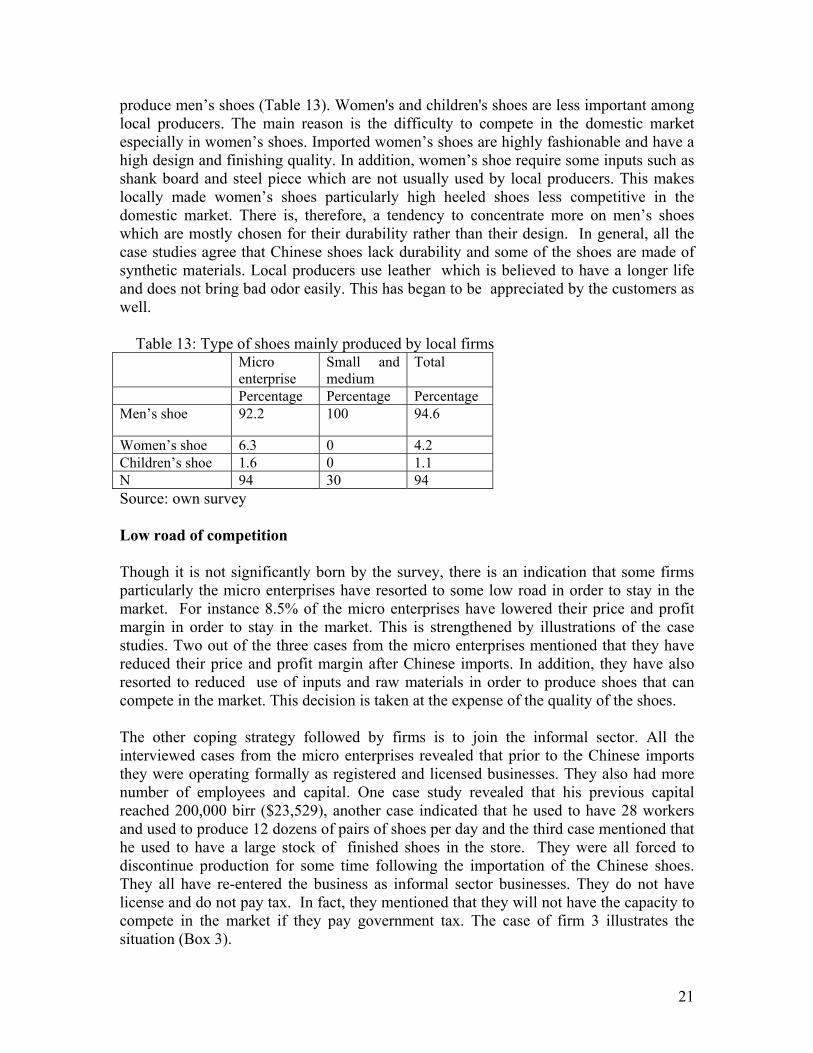
21
produce men’s shoes (Table 13). Women's and children's shoes are less important among local producers. The main reason is the difficulty to compete in the domestic market especially in women’s shoes. Imported women’s shoes are highly fashionable and have a high design and finishing quality. In addition, women’s shoe require some inputs such as shank board and steel piece which are not usually used by local producers. This makes locally made women’s shoes particularly high heeled shoes less competitive in the domestic market. There is, therefore, a tendency to concentrate more on men’s shoes which are mostly chosen for their durability rather than their design. In general, all the case studies agree that Chinese shoes lack durability and some of the shoes are made of synthetic materials. Local producers use leather which is believed to have a longer life and does not bring bad odor easily. This has began to be appreciated by the customers as well. Table 13: Type of shoes mainly produced by local firms Micro
enterprise Small and medium
Total
Percentage Percentage Percentage Men’s shoe 92.2 100 94.6
Women’s shoe 6.3 0 4.2 Children’s shoe 1.6 0 1.1 N 94 30 94 Source: own survey Low road of competition Though it is not significantly born by the survey, there is an indication that some firms particularly the micro enterprises have resorted to some low road in order to stay in the market. For instance 8.5% of the micro enterprises have lowered their price and profit margin in order to stay in the market. This is strengthened by illustrations of the case studies. Two out of the three cases from the micro enterprises mentioned that they have reduced their price and profit margin after Chinese imports. In addition, they have also resorted to reduced use of inputs and raw materials in order to produce shoes that can compete in the market. This decision is taken at the expense of the quality of the shoes. The other coping strategy followed by firms is to join the informal sector. All the interviewed cases from the micro enterprises revealed that prior to the Chinese imports they were operating formally as registered and licensed businesses. They also had more number of employees and capital. One case study revealed that his previous capital reached 200,000 birr ($23,529), another case indicated that he used to have 28 workers and used to produce 12 dozens of pairs of shoes per day and the third case mentioned that he used to have a large stock of finished shoes in the store. They were all forced to discontinue production for some time following the importation of the Chinese shoes. They all have re-entered the business as informal sector businesses. They do not have license and do not pay tax. In fact, they mentioned that they will not have the capacity to compete in the market if they pay government tax. The case of firm 3 illustrates the situation (Box 3).

22
Box 3: Firm 3 response on coping strategy
The above strategies are varied and they have been instrumental in helping firms stay in the market. In general, it appears that micro enterprises are following the low road of competition while the small and medium firms attempt to follow high road of competition. Those strategies labeled as high road represent a window of opportunity amid the negative impacts of Chinese shoes. Producers even perceive that they now have grips of the domestic market. For example 82 % of the producers believe that their shoes are now competitive with the Chinese shoes. This figure is higher for small and medium enterprises (93 %). There are two reasons for this. First local production as indicated above has entered into a learning stage particularly in terms of design and improving the quality of shoes. Second, customers have also gradually realized that the competitive advantage of Chinese shoes which were highly based on price and design have started to erode as they couldn’t outweigh their competitive disadvantage namely the durability of the product. Durability is mainly related to the materials used in producing the shoes. Case studies revealed that local shoes use better quality material and hence maintain durability. Though this is an indication of recovery, there is still no fundamental change in the domestic market as it continues to be flooded with imports. Local shoe makers continue to struggle to stay in the market. The micro enterprises in particular are staying in the market marginally given the disastrous consequences they have been subjected to. The internal capability of firms shows that local firms have major deficiencies due to their backward technology, lack of skill, poor support services, lack of working premises etc. These reduce their capacity to withstand the import. Local shoe production thus needs to be invigorated if it is to vie with imports.
Firm 3 is a micro enterprise with 8 employees. The impact of the Chinese imports has been very detrimental to the owner. He mentioned that prior to the Chinese imports, he used to stock shoes in huge quantity. But since the Chinese imports, the owner could not sell his stock and was forced to sell most of his shoes at a much reduced price in places where cheap shoes are sold. He was forced to return his license during this period. During the period 1992-1996 EC, he was operating at a much reduced level. Up until now the owner works informally because of lack of capacity to compete in the market if he pays government tax. He mentioned that the way to survive the Chinese shoes is to reduce the profit margin by selling at a very low price and reduce the quality. The owner admitted that Chinese shoes are superior in their design and finishing.

23
4. Conclusion The foregoing discussion has shown that the rapid expansion of the Chinese and Indian economy has found expression in Ethiopia. This is observed in the three vectors of trade, investment and aid. In terms of aid, though not as important as European countries or USA, Chinese aid is starting to be felt particularly in some flagship projects. In this regard the road projects and the envisaged TVET school in the capital city to be constructed by Chinese grant are worth mentioning. In addition, the technical support particularly in the health sector is a significant assistance though at lesser scale and coverage. The role of India in this respect is less pronounced. In terms of investment, both Chinese and Indian entrepreneurship have demonstrated significant presence. Manufacturing, floriculture and construction seem to be the preferred areas of investment. These foreign investments have a far reaching implication in employment creation and income generation. In particular, investment in the floriculture for which Ethiopia seems to have a nich market due to its comparative advantages will help in strengthening the country’s ability to earn foreign exchange. Both Chinese and Indian investors are engaged in infrastructural development. This will help the country recover and upgrade its infrastructural stock. The trade relation, however, is the one which has a far reaching implication. The trade relations between Ethiopia and these countries is asymmetric in that it disfavors Ethiopia as it suffers from a negative balance of trade. This has to be improved upon. This is due to the increase in imports from both countries compared to Ethiopia’s export to these countries. Despite this, China has created an opportunity for Ethiopian export. The preferential treatment Ethiopia is enjoying starting from 2005 has led Ethiopia to increase its export to China significantly. China has become the number one export destination for Ethiopia in recent year. This is an opportunity that Ethiopian investors and entrepreneurs should exploit. Ethiopia has a huge potential in producing and exporting products allowed to enter China free of tariff and quota. The export sector thus gets a boost from this relation. A significant implication of trade relation for Ethiopia is Chinese export of labor intensive products. In particular the importation of textile and footwear goods from China has both immediate and long term effects. The immediate effect is the displacement of local producers. In this regard this study has shown that small scale shoe producers have downsized their activity, lost assets and property and have resorted to informal operation. These will have negative consequences on the domestic growth and expansion of the sectors. Firms have followed both high and low road of competition in reaction to the Chinese imports. The high road strategies include improving designs, quality, and improving response time. Investment in machineries are also noted as part of such strategy. These strategies however are relatively common among small and medium enterprises compared to the micro enterprises. The latter seem to have resorted to lowering profit margins, reducing inputs and changing into informal operators or resorted to low road competition. The positive reaction hopefully will take the enterprises to a higher level and make them competitive while the low road is debilitating and damning. The continuation of the

24
flooding of Chinese shoes in Ethiopia and most micro enterprises’ engagement in the low road strategies are worrisome. The shoe sector needs to be invigorated to withstand the competition and even excel. Invigoration requires that both the producers and the government which are the main stakeholders in shoe production work together. The producers should collectively aim to improve their productivity and competitiveness particularly in the spirit of high road of competition. This is required mainly because firms in isolation will find it difficult to grow and prosper in the middle of fierce import competition. In this regard the local association namely the Leather International Association which embraces most of the small scale producers, retailers and wholesalers need to be buttressed and strengthened in order to promote collective efficiency to withstand the competition. In addition a package of interventions have to be designed to strengthen the shoe producers and minimize the negative effects of Chinese shoe imports. These intervention should focus on those aspects which improve the quality and competitiveness. Training, introduction of better technology, quality control, networking, benchmarking will strengthen shoe producers from the supply side. Besides these, the government should help minimize the negative effects of imports by putting in place mechanisms such as quality control of Chinese import. Quality control of imports may safeguard local producers from competing with substandard products which may find their way to the domestic market. On the demand side, the small scale producers are confined to local markets and they never tap the export market. Efforts to enter the regional and international market will help local producers access the more lucrative markets and can also be taken as a coping strategy of domestic competition. At policy level, the long term effects of the footwear imports (including textile) is that it will crowd out the local effort to use these sectors as the basis of industrialization. It was earlier mentioned that the government has identified the two sectors as priority sectors and intends to support them in order to influence their expansion and growth. The main purpose of supporting these sectors is not only to satisfy the local demand but also to export. These objectives however will be constrained both in the domestic and export market. In the export sector, Chinese and Indian export of the same item to the world market will present stiff competition and may even crowd out Ethiopia’s effort. The ascendancy of the Asian drivers in Ethiopia is stronger for China than India. The ascendancy has both an opportunity and a threat. Ethiopia should be able to maximize the opportunity and minimize the threat. For instance the opportunity of preferential trade agreement, the interest of Chinese and Indian entrepreneurs in the investment sector, the technical assistance and the grants the Chinese government provide need to be capitalized and exploited more vigourously. Ethiopia should look into the future to understand how the Chinese economy is evolving in order to cater to its needs by focusing on those areas for which the country has a niche market. The livestock and the meat sector could be a potential area to supply more leather and meat to the Chinese and Indian economy since the demand for these products will increase with the expansion of their economies. Ethiopia should also understand the trend of the Chinese economy that might affect it. For instance Kaplinski etal (2006) mentioned that China is importing soya from Latin
25
America which is used as animal feed. This has a knock on effects on Ethiopia’s exports of sesame (a substitute for soya). On the threat side, the effect of Chinese imports on local producers need to be understood carefully in order to counter the debilitating effects. References Asian Drivers Team (2006) “The impact of Asian drivers on the developing world” IDS
bulletin Vol 37 No 1, pp 3-11 Berhanu Nega and Kibre Moges (2002) Declining productivity and competitiveness in
the Ethiopian Leather Sector. Unpublished paper Ethiopian investment office (2006) Statistical bulletin, Addis Abeba. http://english.people.com.cn/200601/16/eng20060116-235719.html, accessed 8th August Jenkins Rhys and Edwards Chris (2006) “The Asian drivers and sub-saharan Africa” IDS
bulletin Vol 37 No 1, pp 23-32 Kaplinsky Raphael, McCormick Dorothy, Mike Morris (2006) “The impact of China on
Sub-Saharn Africa” Agenda setting paper prepared for DFID China office, Grant reference number AG4419, mimeo
Knorringa Peter and Pegler Lee (2204) Operationalzing social capital for industrial Development in Marginalized Countries: Field Studies on the Footwear Sub-sector in Ethiopia and Vietnam Institute of Social Studies, The Hague, August 2004.
McCormick Dorothy et al (2006) “Post-multifibre arrangement analysis of the textile and
garment sectors in Kenya” IDS bulletin Vol. 37, No. 1 pp 80-88
Nadvi Khalid (1995) ‘Industrial clusters and networks: case studies of SME growth and innovation’ http://www.unido.org/doc/4297
Rabellotti Roberta (1997) ‘Footwear industrial clusters in Italy and Mexico’ in Van Dike M.P and Rabellotti Roberta (eds)Enterprise clusters and networks in developing countries. London:Frank Cass
UNIDO and Ministry of Trade and Industry (2005) The Leather Master Plan study,
Addis Abeba Unpublished

26
Related Documents