HAL Id: tel-03506301 https://tel.archives-ouvertes.fr/tel-03506301 Submitted on 2 Jan 2022 HAL is a multi-disciplinary open access archive for the deposit and dissemination of sci- entific research documents, whether they are pub- lished or not. The documents may come from teaching and research institutions in France or abroad, or from public or private research centers. L’archive ouverte pluridisciplinaire HAL, est destinée au dépôt et à la diffusion de documents scientifiques de niveau recherche, publiés ou non, émanant des établissements d’enseignement et de recherche français ou étrangers, des laboratoires publics ou privés. The development of reliable and washable intelligent textiles : noms and characterization Shahood Uz Zaman To cite this version: Shahood Uz Zaman. The development of reliable and washable intelligent textiles: noms and charac- terization. Electronics. Université de Lille, 2021. English. NNT : 2021LILUI041. tel-03506301

Welcome message from author
This document is posted to help you gain knowledge. Please leave a comment to let me know what you think about it! Share it to your friends and learn new things together.
Transcript
HAL Id: tel-03506301https://tel.archives-ouvertes.fr/tel-03506301
Submitted on 2 Jan 2022
HAL is a multi-disciplinary open accessarchive for the deposit and dissemination of sci-entific research documents, whether they are pub-lished or not. The documents may come fromteaching and research institutions in France orabroad, or from public or private research centers.
L’archive ouverte pluridisciplinaire HAL, estdestinée au dépôt et à la diffusion de documentsscientifiques de niveau recherche, publiés ou non,émanant des établissements d’enseignement et derecherche français ou étrangers, des laboratoirespublics ou privés.
The development of reliable and washable intelligenttextiles : noms and characterization
Shahood Uz Zaman
To cite this version:Shahood Uz Zaman. The development of reliable and washable intelligent textiles : noms and charac-terization. Electronics. Université de Lille, 2021. English. NNT : 2021LILUI041. tel-03506301
École Doctorale Sciences Pour l’Ingénieur
Thèse de doctorat
Présentée en vue d’obtenir le grade de
Docteur
Dans le domaine de
Génie informatique, automatique et traitement du signal
Par
Shahood uz ZAMAN
Soutenue publiquement le 16 juin, 2021 devant le jury formé de :
Prof. Mireille Bayart Merchez Université de Lille Présidente
Prof. Henry Yi Li University of Manchester Rapporteur
Prof. Marie-Ange Bueno ENSISA, Université de Haute Alsace Rapporteur
Prof. Ahmed Rachid Université de Picardie Jules Verne Examinateur
Assoc. Prof. Senem Kurşun
Bahadir
Istanbul Technical University Examinatrice
Prof. Vladan Koncar ENSAIT, GEMTEX Laboratoire Directeur de thèse
Assoc. Prof. Xuyuan Tao ENSAIT, GEMTEX Laboratoire Encadrant de thèse
Assoc. Prof. Cédric Cochrane ENSAIT, GEMTEX Laboratoire Co-Directeur de thèse
THE DEVELOPMENT OF RELIABLE AND WASHABLE
INTELLIGENT TEXTILES; NORMS AND CHARACTERIZATION
CONTRIBUTION AU DEVELOPPEMENT DES TEXTILES
INTELLIGENTS FIABLES ET LAVABLES; STANDARDS ET
CARACTERISATION

“No two things have been combined together better than knowledge and patience.”
“hadith”

i
Acknowledgement
First of all, thanks to Almighty, who gave me the opportunity and enabled me to accomplish
my Ph.D. thesis. It was a great experience to work in the GEMTEX laboratory located in the
ENSAIT School. I was very comfortable and happy to be a part of it during my thesis. All the
staff members were very welcoming and supportive for all these years.
Then, all my gratitude and warm thanks to my supervisor and co-supervisors, Prof. Vladan
Koncar, Dr. Cedric Cochrane, and Dr. Xuyuan Tao, who helped me and enabled me to
complete my research. Special appreciation for their time, guidance, knowledge, and
experience, which empowered me to improve my skills. I was lucky to have such a supportive
team that was always available to guide me throughout these years.
I want to present my deep regards to Prof. Vladan Koncar, who managed to accept me for the
thesis research in GEMTEX laboratory and trusted me for this opportunity. He was very kind
and encouraging, and his valuable advice always helped to enrich my scientific abilities. I am
very thankful to him for giving me opportunities and confidence to present my research work
at various conferences.
I extend my thanks to Prof. Henry Yi Li from the University of Manchester and Prof. Marie-
Ange Beuno for ENSISA, Université de Haut Alsace, who accepted the request to be the
reviewer of my thesis report. I am very thankful for their time evaluating my work and giving
me valuable comments to enrich my knowledge. I want to give special thanks to Prof.
Mireille Bayart Merchez, Université de Lille, Prof. Ahmed Rachid, Université de Picardie
Jules Verne, and Associate professor Senem Kurşun Bahadir, Istanbul Technical University,
to show interest in my work and honored me by becoming the examiner of my thesis report. I
am thankful for their valuable time to study my work.
I present my regards to the laboratory staff who helped me during my experiments. I want to
say special thanks to Francois Dassonville and Christian Catel, who are always available
with some solutions whenever I was stuck during my experiments. I am thankful for their help
through the research work. I want to say thanks to Miss. Hayriye Gidik, Assistant professor,
who helped me to perform experiments in HEI, Lille. I am thankful to my colleagues and
other doctoral researchers who provided me with a good research atmosphere and helped me
complete these research activities. I am also thankful to Muzzamal Hussain, Ezgi Ismar,

ii
Baptiste Garnier, and Amale Ankhili. I am grateful to Dr. Yasir Nawab, who motivated me to
pursue my doctoral research and supported me throughout this journey.
I am thankful to National Textile University, Pakistan, for financial support and funding for
my Ph.D. work.
Finally, I want to pay my gratitude to my parents, wife, and family members, who supported
me throughout these years, and without them, it was impossible to reach this level.
iii
Table of Contents
1. Introduction ................................................................................................... 1
1.1 Smart textiles ............................................................................................................... 2
1.2 E-textile system ........................................................................................................... 3
1.3 E-textile types .............................................................................................................. 4
1.3.1 Wearable e-textile ......................................................................................................... 4
1.3.2 Non-wearable e-textiles ............................................................................................... 5
1.4 E-textile Market ........................................................................................................... 5
1.5 Reliability and washability .......................................................................................... 7
1.6 Recent achievements in standardization ...................................................................... 8
1.7 Objectives and target output ........................................................................................ 9
2. Literature review......................................................................................... 17
2.1 Standards related to textile wearable ......................................................................... 18
2.2 Standards for electronic functionality ........................................................................ 19
2.3 Standards related to textile mechanical properties .................................................... 20
2.4 Standards related to conductive functionality measurement ..................................... 24
2.5 Progress on e-textile standardization ......................................................................... 25
2.6 Wearable e-textile applications ................................................................................. 27
2.6.1 E-textile wearable in medical .................................................................................... 28
2.6.2 E-textile wearable in the military and protective clothing .................................... 31
2.6.3 E-textile wearable in sports and leisure ................................................................... 33
iv
2.6.4 E-textile wearable in aesthetic and fashion ............................................................. 34
2.7 E-textile components ................................................................................................. 36
2.7.1 Flexible sensors and electrodes ................................................................................. 36
2.7.2 Actuators ...................................................................................................................... 41
2.7.3 Antennas....................................................................................................................... 43
2.7.4 Energy harvesting, stockage, and transfer ............................................................... 44
2.7.5 Flexible circuits ........................................................................................................... 45
2.7.6 Component connections/ transmission lines ........................................................... 46
2.8 Washability ................................................................................................................ 49
2.9 Conclusion ................................................................................................................. 52
3. Materials and Methods ............................................................................... 71
3.1 Plan of experiments ................................................................................................... 72
3.2 Washing Analysis ...................................................................................................... 74
3.2.1 Washing parameters ................................................................................................... 74
3.2.2 Washing stresses ......................................................................................................... 76
3.2.2.1 Water and temperature Stresses ...................................................................... 77
3.2.2.2 Chemical stresses ............................................................................................ 77
3.2.2.3 Mechanical stresses ........................................................................................ 77
3.2.3 Post-washing processes .............................................................................................. 78
3.3 Washing programs analysis ....................................................................................... 79
3.3.1 Video Record Analysis Method ................................................................................ 80
3.4 Accelerometer Analysis method ................................................................................ 82
3.5 Samples preparations ................................................................................................. 83
3.5.1 Connection yarns/ Transmission lines ..................................................................... 84
3.5.2 ECG electrodes ............................................................................................................ 89
3.5.3 The flexible printed circuit board (PCBs) ............................................................... 92
v
3.5.4 Textile antennas .......................................................................................................... 97
3.6 Washing tests ............................................................................................................. 99
3.7 Washing simulation tests ......................................................................................... 100
3.7.1 Chemical and water tests ......................................................................................... 100
3.7.2 Martindale Abrasion test .......................................................................................... 101
3.7.3 Pilling box test ........................................................................................................... 104
3.7.4 Bending test ............................................................................................................... 106
3.8 Measuring techniques .............................................................................................. 107
3.8.1 Linear electrical resistance measurement .............................................................. 107
3.8.2 Four probe surface resistance measurement .......................................................... 107
3.8.3 Impedance meter ....................................................................................................... 108
3.8.4 ECG signal analysis .................................................................................................. 109
3.8.5 SEM and microscopic analysis ............................................................................... 109
4. Results and Discussion .............................................................................. 113
4.1 Accelerometer Analysis ........................................................................................... 113
4.1.1 Power Spectral Density (PSD) ................................................................................ 117
4.1.1.1 PSD analysis of washing phase (low-speed rotation action) ........................ 117
4.1.1.2 PSD analysis of tumbling phase (high-speed rotation action) ...................... 118
4.2 Connection yarns/ Transmission lines ..................................................................... 124
4.2.1 Washing tests ............................................................................................................. 124
4.2.2 Martindale abrasion resistance test ......................................................................... 129
4.2.3 Pilling Box tests ........................................................................................................ 133
4.2.4 Chemical tests ........................................................................................................... 134
4.3 Skin electrodes ......................................................................................................... 139
4.3.1 Washing tests ............................................................................................................. 139
4.3.2 Martindale abrasion resistance test ......................................................................... 150
vi
4.3.3 Pilling Box tests ........................................................................................................ 153
4.3.4 Chemical tests ........................................................................................................... 156
4.4 The Flexible Circuit Boards (PCBs) ........................................................................ 158
4.4.1 Washing tests ............................................................................................................. 158
4.4.2 Bending test ............................................................................................................... 173
4.5 Textile antennas ....................................................................................................... 177
4.5.1 Washing tests ............................................................................................................. 177
4.5.2 Martindale abrasion tests ......................................................................................... 179
4.5.3 Pilling Box test .......................................................................................................... 180
4.5.4 Chemical tests ........................................................................................................... 180
5. General Conclusion ................................................................................... 187
6. Proposed recommendations for e-textile wearable based on the
experimental findings ...................................................................................... 191
6.1 IPC-8981, Quality and reliability of e-textile wearable .......................................... 193
vii
List of Figures
Figure 1.1. E-textile system ------------------------------------------------------------------------------ 3
Figure 1.2. E-textile example (“Astroskin” shirt by Carre Technologies Inc. (Hexoskin)) ----- 4
Figure 1.3. Global Smart textile market forecast (Ameri Research Inc.) -------------------------- 6
Figure 1.4. Global electronic market by product category (Ameri Research Inc.) [42] --------- 6
Figure 1.5. Wearable technology revenue IDTechEX survey --------------------------------------- 7
Figure 1.6. E-textile manufacturing layout ------------------------------------------------------------ 8
Figure 2.1. Wearable e-textile application ------------------------------------------------------------ 27
Figure 2.2. Wearable e-textile categories ------------------------------------------------------------- 28
Figure 2.3. The BiliCocoon phototherapy system [96] --------------------------------------------- 29
Figure 2.4. Cardiac monitoring t-shirt, (a) Kymira [97] (b) Xiaomi Mijia [98] ----------------- 30
Figure 2.5. HealthWatch ECG t-shirt [99] ------------------------------------------------------------ 30
Figure 2.6. AiQ sports Bra [100] ----------------------------------------------------------------------- 31
Figure 2.7. EMGLARE smart t-shirt [101] ----------------------------------------------------------- 31
Figure 2.8. Warning system for fire fighter [86] ----------------------------------------------------- 32
Figure 2.9. Cityzen Sciences D-shirt ------------------------------------------------------------------- 32
Figure 2.10. The Smart Shirt by Sensatex, Inc., USA ----------------------------------------------- 33
Figure 2.11. Nike adapt lacing system ----------------------------------------------------------------- 34
Figure 2.12. Sensoria fitness products ----------------------------------------------------------------- 34
Figure 2.13. CuteCircuit smart textile projects ------------------------------------------------------- 35
Figure 2.14. Flexible wearable sensors [117] --------------------------------------------------------- 37
Figure 2.15. Textile based ECG sensors [128] ------------------------------------------------------- 39
Figure 2.16. Pressure Sensor [75] ---------------------------------------------------------------------- 41
Figure 2.17. Smart textile jacket [143] ---------------------------------------------------------------- 41
Figure 2.18. Textile based NFC antenna [154] ------------------------------------------------------- 44
Figure 2.19. Flexible batteries market share [165] --------------------------------------------------- 45
Figure 2.20. Flexible motherboards [123] ------------------------------------------------------------ 46
Figure 2.21. Different connection techniques, (a) soldering [171], (b) embroidering [175], (c)
flip-chip [177] --------------------------------------------------------------------------------------------- 47
Figure 2.22. Conductive wire strand in e-textile structure [172], functional LED yarn [184] 48
viii
Figure 3.1. Details of experimental work ------------------------------------------------------------- 73
Figure 3.2. Washing factors decomposition ---------------------------------------------------------- 74
Figure 3.3. Detailed washing factors analyses-------------------------------------------------------- 74
Figure 3.4. Washing parameters ------------------------------------------------------------------------ 75
Figure 3.5. Washing ballast ----------------------------------------------------------------------------- 76
Figure 3.6. Washing stresses in term of mechanical actions performed -------------------------- 78
Figure 3.7. Post-washing processes -------------------------------------------------------------------- 79
Figure 3.8. Miele W3268 machine washing programs ---------------------------------------------- 80
Figure 3.9. Screenshots from washing videos at different washing actions ---------------------- 80
Figure 3.10. Configuration of washing phases and actions ----------------------------------------- 81
Figure 3.11. Washing time configurations for different washing programs (percentage of total
time) -------------------------------------------------------------------------------------------------------- 82
Figure 3.12. (a) Accelerometer diagram (b) An accelerometer is sealed in an airtight envelope
--------------------------------------------------------------------------------------------------------------- 83
Figure 3.13. Working diagram of the accelerometer used for washing analysis ---------------- 83
Figure 3.14. ZSK embroidery machine ---------------------------------------------------------------- 85
Figure 3.15. Needle yarn and bobbin yarn composition -------------------------------------------- 85
Figure 3.16. Composition of single, two, and three-line stitched transmission lines ----------- 86
Figure 3.17. Conductive transmission lines without protection, with TPU protection, and with
embroidered protection ---------------------------------------------------------------------------------- 87
Figure 3.18. Transmission lines (a) silver paste on edge, (b) snap button mounted on the silver
paste -------------------------------------------------------------------------------------------------------- 87
Figure 3.19. Flow chart of experiments for transmission lines ------------------------------------ 88
Figure 3.20. Skin-dry electrode pattern [10] ---------------------------------------------------------- 89
Figure 3.21. Set of three skin electrodes embroidered on cotton fabric belt for ECG
measurement ---------------------------------------------------------------------------------------------- 89
Figure 3.22. Set of three skin electrodes prepared with the pieces of conductive fabrics for
ECG measurement ---------------------------------------------------------------------------------------- 91
Figure 3.23. Flow chart of experiments for ECG electrodes --------------------------------------- 92
Figure 3.24. Screenshot of PCB design prepared on Kicad software ----------------------------- 93
Figure 3.25. PCB preparation, (a) face to face placement of PNP sheet and copper sheet
before the heated press, (b) transfer of design on the copper sheet after heated press ---------- 93
Figure 3.26. Vertical etching tank ---------------------------------------------------------------------- 94
Figure 3.27. (a) Heated air pump, (b) attachment of SMDs in printed circuits ------------------ 94
ix
Figure 3.28. (a) Elkem silicon used for the protective layer, (b) vacuum pump with the airtight
jar to remove air bubble from solution ---------------------------------------------------------------- 95
Figure 3.29. Four sets of ready to use PCBs ---------------------------------------------------------- 96
Figure 3.30. (a) PCB with SMD resistor protected with silicon, (b) PCB completely protected
with a silicon-coated layer ------------------------------------------------------------------------------- 96
Figure 3.31. Flow chart of experiments for PCBs --------------------------------------------------- 96
Figure 3.32. Photography of the textile NFC antenna and (b) its electric diagram ------------- 97
Figure 3.33. Silicon protected textile antenna -------------------------------------------------------- 98
Figure 3.34. Flowchart of textile antenna experiments --------------------------------------------- 98
Figure 3.35. Detergent composition ----------------------------------------------------------------- 100
Figure 3.36. (a) Experimental set-up of chemical and water test, (b) Hot plate magnetic stirrer
------------------------------------------------------------------------------------------------------------- 101
Figure 3.37. Woven felt specifications used in experiments ------------------------------------- 102
Figure 3.38. Martindale abrasion test machine, (a) Configuration of upper arm movement, (b)
Sample placement unit, (c) Testing machine front panel ----------------------------------------- 103
Figure 3.39. Schematic overview of transmission lines samples prepared for Martindale test
(Three transmission lines per samples with 1 cm distance between them, (a) single-line stitch,
(b) three-line stitch ------------------------------------------------------------------------------------- 104
Figure 3.40. An Orbitor pilling box machine ------------------------------------------------------- 105
Figure 3.41. Set of four electrodes samples prepared for Pilling box test ---------------------- 105
Figure 3.42. Bending test machine ------------------------------------------------------------------- 106
Figure 3.43. Schematic diagram of bending test --------------------------------------------------- 106
Figure 3.44. Agilent digital multi-meter------------------------------------------------------------- 107
Figure 3.45. (a) Ossila four-probe device, (b) Close-up of measuring probes, (c) Schematic
diagram of the four-probe calculation --------------------------------------------------------------- 108
Figure 3.46. An overview of surface resistance measurement software tool ------------------ 108
Figure 3.47. Agilent 4294A Impedance analyzer -------------------------------------------------- 109
Figure 3.48. (a) SEM analyzing device, (b) sample preparation for SEM, (c) SEM results
display ---------------------------------------------------------------------------------------------------- 110
Figure 4.1. Coordinate system (X, Y, Z) of the accelerometer, fixed to the plain fabric that is
moving during the washing cycle, (a) at 0° position, (b) at 90° position [1] ------------------- 114
Figure 4.2. Accelerometer analysis in the washing phase (low-speed rotation), three separate
graphs for X, Y, and Z-axis [1] ----------------------------------------------------------------------- 115
x
Figure 4.3. Accelerometer analysis in the tumbling phase (400 RPM), three separate graphs
for X, Y, and Z-axis [1] -------------------------------------------------------------------------------- 116
Figure 4.4. Accelerometer analysis in the tumbling phase (600 RPM), three separate graphs
for X, Y, and Z-axis [1] -------------------------------------------------------------------------------- 116
Figure 4.5. PSD of the accelerometer outputs of washing phase (low-speed rotation action),
(a) in the X direction, (b) in the Y direction, (c) in the Z direction, and (d) the sum of all the
accelerations [1]----------------------------------------------------------------------------------------- 118
Figure 4.6. PSD of the accelerometer outputs from tumble phase (high-speed rotation 400
RPM), (a) in the X direction, (b) in the Y direction, (c) in the Z direction, and (d) the sum of
all the accelerations [1] -------------------------------------------------------------------------------- 119
Figure 4.7. PSD of the accelerometer outputs from tumble phase (high-speed rotation 600
RPM), (a) in the X direction, (b) in the Y direction, (c) in the Z direction, and (d) the sum of
all the accelerations [1] -------------------------------------------------------------------------------- 120
Figure 4.8. Tumble phase (400 RPM), removing initial acceleration phase, PSD of the
accelerometer outputs, (a) in the X direction, (b) in the Y direction, (c) in the Z direction, and
(d) the sum of all the accelerations [1] -------------------------------------------------------------- 121
Figure 4.9. Tumble phase (high-speed rotation 600 RPM), removing initial acceleration phase,
PSD of the accelerometer outputs, (a) in the X direction, (b) in the Y direction, (c) in the Z
direction, and (d) the sum of all the accelerations [1] --------------------------------------------- 122
Figure 4.10. The layout of the proposed model for washing predictions ----------------------- 123
Figure 4.11. Washing analyses for single-stitched transmission lines stitched on the plain
cotton fabric, Six samples for each type of yarns, (a) “Type A” yarn, (b) “Type B” yarn, (c)
“Type C” yarn ------------------------------------------------------------------------------------------- 125
Figure 4.12. Surface morphology for three yarns before and after washing was captured using
the SEM. (a) “Type A” yarn before washing, (b) “Type B” yarn before washing, (c) “Type C”
yarn before washing, (d) “Type A” yarn after washing, (e) “Type B” yarn after washing, (f)
“Type C” yarn after washing. ------------------------------------------------------------------------- 126
Figure 4.13. Ri/Ro values for “Type A” yarn with two and three-line stitch after 50 washing
cycles (a) type A (b) type B --------------------------------------------------------------------------- 127
Figure 4.14. SEM images for Type A and B yarns in a three-line stitched pattern after 50
washing cycles ------------------------------------------------------------------------------------------ 128
Figure 4.15. (b) R’/R values after 50 washing cycles, and 3000 abrasion cycles, (a) Type A
(b) Type B [2] ------------------------------------------------------------------------------------------- 129
Figure 4.16. R’/R values for Type A yarn after removing initial 500 abrasion cycles [2] --- 130
xi
Figure 4.17. Ri/Ro values for Type A and B yarn with a three-line stitch after 4500 abrasion
cycles ----------------------------------------------------------------------------------------------------- 132
Figure 4.18. SEM analysis for Type A and B yarns after Martindale abrasion testing, black
part shows the removal of conductive coating ----------------------------------------------------- 133
Figure 4.19. Ri/Ro values for yarns with a three-line stitch after 4000 pilling cycles, (a) Type
A (b) Type B [2] ---------------------------------------------------------------------------------------- 134
Figure 4.20. Schematic description of the experimental setup [3], (A) only water, (B) water,
and detergent [3] ---------------------------------------------------------------------------------------- 135
Figure 4.21. The electrical resistance of the “Type A” yarn, measured after 72 hours of
immersion in the water [3] ---------------------------------------------------------------------------- 135
Figure 4.22. Chemical structure of polyamide yarn [3], (a), FTIR-ATR results of silver-coated
PA yarns which are immersed in water detergent solution, (b) and immersed in water (c) - 137
Figure 4.23. Absorbance differences of the immersed yarns water with straight lines and the
detergent with the dashes [3] -------------------------------------------------------------------------- 137
Figure 4.24. SEM images of; (A) silver-coated PA yarn before treatments, (B) silver-coated
PA yarn after waiting for 72 h in water/detergent mixture, and (C) silver-coated PA yarn after
waiting for 72 h in water [3] -------------------------------------------------------------------------- 138
Figure 4.25. UV-Visible results of remained liquids (A) water with detergent and (B) water
after immersion of yarns [3] -------------------------------------------------------------------------- 139
Figure 4.26. Surface resistance analysis (Silk wash), six samples of each electrode were tested,
Fi.1 – Fi.6. The left Y-axis explains Ri/Ro, and the right Y-axis describes the actual surface
resistance for each sample [14]. (a)F1 electrodes (b) F2 electrodes (c) F3 electrodes (d) F4
electrodes ------------------------------------------------------------------------------------------------ 140
Figure 4.27. Surface resistance analysis (Silk wash). Evaluation of all samples (F1-F4)
together in one graph [14], (a) Comparison of Ri/Ro, (b) Comparison of actual surface
resistance ------------------------------------------------------------------------------------------------- 141
Figure 4.28. Surface resistance analysis (Express wash), six samples of each electrode were
tested, Fi.1 – Fi.6. Fi.1 – Fi.6. Left Y-axis explain Ri/Ro, right Y-axis describe the actual
surface resistance for each sample [14], (a)F1 electrodes (b) F2 electrodes (c) F3 electrodes
(d) F4 electrodes ---------------------------------------------------------------------------------------- 142
Figure 4.29. Surface resistance analysis (Express wash). Evaluation of all samples (F1-F4)
together in one graph [14], (a) Comparison of Ri/Ro (b) Comparison of actual resistance - 142
Figure 4.30. Normal ECG morphology-------------------------------------------------------------- 143
Figure 4.31. ECG recording belt --------------------------------------------------------------------- 143
xii
Figure 4.32. Power spectral density (Silk wash) before and after the 50 washing process [14],
(a) F1 (b) F2 (c) F3 (d) F4 ----------------------------------------------------------------------------- 144
Figure 4.33. ECGs measured (Silk wash) before and after the 50 washing process [14]. (a) F1
and F4 (b) F2 and F3 ----------------------------------------------------------------------------------- 144
Figure 4.34. Power spectral density (Express wash) before and after the 50 washing process
[14], (a) F1 (b) F2 (c) F3 (d) F4 ---------------------------------------------------------------------- 145
Figure 4.35. ECGs measured (Express wash) before and after the 50 washing process [14], (a)
F1 and F4 (b) F2 and F3 ------------------------------------------------------------------------------- 145
Figure 4.36. SEM analysis performed before and after the 50 Express washing processes, (a)
F3 before wash (b) F3 after wash (c) F2 before wash (d) F2 after wash ----------------------- 146
Figure 4.37. SEM analysis performed after the 50 Express washing processes, (a) F1 electrode
(b) F4 electrode (c) E1 electrode (d) E2 electrode ------------------------------------------------- 147
Figure 4.38. Surface resistance analysis (Express wash), six samples of each electrode were
tested, Left Y-axis explains Ri/Ro, right Y-axis (where applicable) describe the actual surface
resistance for each sample [14], (a) E1 electrode (b) E2 electrode (c) Comparison of Ri/Ro for
all samples (d) Comparison of actual surface resistance for all samples ----------------------- 148
Figure 4.39. Surface resistance analysis (Silk wash), six samples of each electrode were tested,
Left Y-axis explains Ri/Ro, right Y-axis (where applicable) describe the actual surface
resistance for each tested sample [14], (a) E1 electrode (b) E2 electrode (c) Comparison of
Ri/Ro for all samples (d) Comparison of actual surface resistance for all samples ----------- 149
Figure 4.40. ECGs measured (Express wash) before and after the 50 washing process for E1
and E2 electrodes [14]. --------------------------------------------------------------------------------- 150
Figure 4.41. Power spectral density (Express wash) before and after the 50 washing process
[14], (a) E1 electrode (b) E2 electrode. -------------------------------------------------------------- 150
Figure 4.42. Surface resistance analysis after 10,000 abrasion cycles, five samples of each
electrode were tested (Fi1-Fi5), Left Y-axis explains Ri/Ro, right Y-axis describe the actual
surface resistance for each sample (a) F1 (b) F2 (c) F3 (d) F4 ----------------------------------- 151
Figure 4.43. Surface resistance analysis after 10,000 Abrasion cycles, evaluation of all
samples together (F1-F4) (a) Comparison of Ri/Ro (b) comparison of actual surface resistance
------------------------------------------------------------------------------------------------------------- 152
Figure 4.44. The surface investigation by SEM images, Peel-off at random positioned is
circled ---------------------------------------------------------------------------------------------------- 152
Figure 4.45. Surface resistance analysis after abrasion cycles, five samples of each electrode
were tested (Ei1-Ei5), Left Y-axis explains Ri/Ro, right Y-axis (where applicable) describe the
xiii
actual surface resistance for each sample [14], (a) E1 electrodes (b) E2 electrodes, (c)
Comparison of Ri/Ro for E1 and E2, (d) comparison of actual surface resistance for E1 and
E2 --------------------------------------------------------------------------------------------------------- 153
Figure 4.46. Surface resistance analysis after 10,000 pilling cycles, four samples of each
electrode were tested (Fi1-Fi4), Left Y-axis explains Ri/Ro, right Y-axis describe the actual
surface resistance for each sample [14], (a) F1, (b) F2, (c) F3, (d) F4 -------------------------- 154
Figure 4.47. Surface resistance analysis after 10,000 Pilling cycles, evaluation of all samples
together (F1-F4) [14], (a) Comparison of Ri/Ro (b) comparison of actual surface resistance
------------------------------------------------------------------------------------------------------------- 155
Figure 4.48. Comparison of washing tests and mechanical tests performed in these
experiments, (a) F2 electrodes, (b) F3 electrodes -------------------------------------------------- 155
Figure 4.49. Comparison of washing tests and mechanical tests performed in these
experiments, (a) F1electrodes, (b) F4 electrodes, (c) E1 electrodes, (d) E2 electrodes ------ 156
Figure 4.50. Chemical test analyses for skin electrodes with water and water detergent
solution immersion for 72 hours at 40°C [14], (a) Fabric samples F1, F2, F3, and F4, (b)
Embroidered samples E1 and E2 --------------------------------------------------------------------- 157
Figure 4.51. SMD resistances mounted on the PCB, (a) parallel to tracks, (b) perpendicular to
tracks ----------------------------------------------------------------------------------------------------- 158
Figure 4.52. Flexible PCBs sample (without any protection) analyses after 40 Express
washing cycles, a total of 32 samples were tested, (a) No. of samples with R’/R values
increased above 2, 3, and ultimately damaged pieces on the left y-axis and percentage of
samples having R’/R value below 2 on the right y-axis, (b) average R’/R value of working
samples only, (c) percentage of samples with R’/R value above 2 described based on track
widths, (d) ratio of samples having R’/R values below and above 2 after complete washing
cycles based on track widths -------------------------------------------------------------------------- 159
Figure 4.53. Flexible PCBs sample (without any protection) analyses after 40 Express
washing cycles, a total of 32 samples were tested, (a) samples with SMDs mounted
perpendicular to tracks, (b) samples with SMDs mounted parallel to tracks ------------------ 160
Figure 4.54. Flexible PCBs sample (with silicone protection at SMD joints only) analyses
after 40 Express washing cycles, a total of 32 samples were tested, (a) No. of samples with
R’/R values increased above 2, 3, and ultimately damaged pieces on the left y-axis and
percentage of samples having R’/R value below 2 on the right y-axis, (b) average R’/R value
of working samples only, (c) percentage of samples with R’/R value above 2 described based
xiv
on track widths, (d) ratio of samples having R’/R values below and above 2 after complete
washing cycles based on track widths --------------------------------------------------------------- 161
Figure 4.55. Flexible PCBs sample (with silicone protection at SMD joints only) analyses
after 40 Express washing cycles, a total of 32 samples were tested, (a) samples with SMDs
mounted perpendicular to tracks, (b) samples with SMDs mounted parallel to tracks ------- 162
Figure 4.56. Flexible PCBs sample (with silicone protection completely) analyses after 50
Express washing cycles, a total of 32 samples were tested, (a) No. of samples with R’/R
values increased above 2, 3, and ultimately damaged pieces on the left y-axis and percentage
of samples having R’/R value below 2 on the right y-axis, (b) average R’/R value of working
samples only, (c) percentage of samples with R’/R value above 2 described based on track
widths, (d) ratio of samples having R’/R values below and above 2 after complete washing
cycles based on track widths -------------------------------------------------------------------------- 163
Figure 4.57. Flexible PCBs sample (with silicone protection completely) analyses after 40
Express washing cycles, a total of 32 samples were tested, (a) samples with SMDs mounted
perpendicular to tracks, (b) samples with SMDs mounted parallel to tracks ------------------ 164
Figure 4.58. Flexible PCBs sample (without any protection) analyses after 50 Silk washing
cycles, a total of 32 samples were tested, (a) No. of samples with R’/R values increased above
2, 3, and ultimately damaged pieces on the left y-axis and percentage of samples having R’/R
value below 2 on the right y-axis, (b) average R’/R value of working samples only, (c)
percentage of samples with R’/R value above 2 described based on track widths, (d) ratio of
samples having R’/R values below and above 2 after complete washing cycles based on track
widths. ---------------------------------------------------------------------------------------------------- 165
Figure 4.59. Flexible PCBs sample (without any protection) analyses after 50 Silk washing
cycles, a total of 32 samples were tested, (a) samples with SMDs mounted perpendicular to
tracks, (b) samples with SMDs mounted parallel to tracks --------------------------------------- 166
Figure 4.60. Flexible PCBs sample (with silicone protection at SMD joints only) analyses
after 50 Silk washing cycles, a total of 32 samples were tested, (a) No. of samples with R’/R
values increased above 2, 3, and ultimately damaged pieces on the left y-axis and percentage
of samples having R’/R value below 2 on the right y-axis, (b) average R’/R value of working
samples only, (c) percentage of samples with R’/R value above 2 described based on track
widths, (d) ratio of samples having R’/R values below and above 2 after complete washing
cycles based on track widths -------------------------------------------------------------------------- 167
xv
Figure 4.61. Flexible PCBs sample (with silicone protection at SMD joints only) analyses
after 50 Silk washing cycles, a total of 32 samples were tested, (a) samples with SMDs
mounted perpendicular to tracks, (b) samples with SMDs mounted parallel to tracks. ------ 168
Figure 4.62. Flexible PCBs sample (with silicone protection completely) analyses after 50 Silk
washing cycles, a total of 32 samples were tested, (a) No. of samples with R’/R values
increased above 2, 3, and ultimately damaged pieces on the left y-axis and percentage of
samples having R’/R value below 2 on the right y-axis, (b) average R’/R value of working
samples only, (c) percentage of samples with R’/R value above 2 described based on track
widths, (d) ratio of samples having R’/R values below and above 2 after complete washing
cycles based on track widths -------------------------------------------------------------------------- 169
Figure 4.63. Flexible PCBs sample (with silicone protection completely) analyses after 50 Silk
washing cycles, a total of 32 samples were tested, (a) samples with SMDs mounted
perpendicular to tracks, (b) samples with SMDs mounted parallel to tracks. ------------------ 170
Figure 4.64. Damage analyses of washed PCBs with an optical microscope (cracks in the
tracks of various widths) ------------------------------------------------------------------------------- 171
Figure 4.65. Damage analyses of washed PCBs with an optical microscope (cracks at surface
mismatch point between measurement connection pad and tracks) ----------------------------- 171
Figure 4.66. Damage analyses of washed PCBs with an optical microscope (cracks at surface
mismatch point between SMD pad and tracks) ---------------------------------------------------- 172
Figure 4.67. Flexible PCBs sample (without any protection) analyses after 20,000 bending
cycles, a total of 32 samples were tested, (a) No. of samples with R’/R values increased above
2, 3, and 5 on the left y-axis and percentage of samples having R’/R value below 2 on the
right y-axis, (b) average R’/R value of working samples only, (c) percentage of samples with
R’/R value above 2 described based on track widths, (d) ratio of samples having R’/R values
below and above 2 after complete washing cycles based on track widths --------------------- 174
Figure 4.68. Flexible PCBs sample (without any protection) analyses after 20,000 bending
cycles, a total of 32 samples were tested, (a) samples with SMDs mounted perpendicular to
tracks, (b) samples with SMDs mounted parallel to tracks --------------------------------------- 175
Figure 4.69. Flexible PCBs sample (with silicone protection) analyses after 20,000 bending
cycles, a total of 32 samples were tested, (a) No. of samples with R’/R values increased above
2, 3, and 5 on the left y-axis and percentage of samples having R’/R value below 2 on the
right y-axis, (b) ratio of samples having R’/R values below and above 2 after complete
washing cycles based on track widths. -------------------------------------------------------------- 176
Figure 4.70. Schematic presentation of the sample movement in bending test ---------------- 176
xvi
Figure 4.71. The comparison of all washed and bending test samples ------------------------- 177
Figure 4.72. Textile antennas after 50 Express washing cycles, (a) Average Resonance
frequency (fo), (b) Average Quality factor (Q) ----------------------------------------------------- 178
Figure 4.73. Textile antennas after 50 Silk washing cycles, (a) Average Resonance frequency
(fo), (b) Average Quality factor (Q) ------------------------------------------------------------------ 179
Figure 4.74. Impedance evolution for the real and imaginary part against the frequency after
10,000 abrasion cycles --------------------------------------------------------------------------------- 180
Figure 4.75. Impedance evolution for the real and imaginary part against the frequency after
72 hours immersion in the water solution ----------------------------------------------------------- 182
Figure 4.76. Impedance evolution for the real and imaginary part against the frequency after
72 hours immersion in the water-detergent solution----------------------------------------------- 182
Figure 6.1. IPC Survey results for possible characteristics required by different categories for
e-textile systems. Percentage of respondents who think these characteristics are important and
should be included -------------------------------------------------------------------------------------- 195
Figure 6.2. IPC Survey results for possible characteristics required by different categories for
e-textile systems. Percentage of respondents who think these characteristics are important and
should be included -------------------------------------------------------------------------------------- 195
Figure 6.3. IPC Survey results for proposed Classes and their division in different categories
------------------------------------------------------------------------------------------------------------- 196
Figure 6.4. IPC Surveys for cleaning of different Classes of e-textile systems. Percentage of
respondent who thinks cleaning is important for these Classes ---------------------------------- 197
xvii
List of Tables
Table 2.1. E-textile product washing instructions --------------------------------------------------- 36
Table 2.2. Wash details in different research articles ----------------------------------------------- 51
Table 3.1. Experiment plan ------------------------------------------------------------------------------ 73
Table 3.2. Washing stresses in washing process [5] ------------------------------------------------- 77
Table 3.3. Washing programs durations [5] ---------------------------------------------------------- 79
Table 3.4. Type of conductive yarns used. ------------------------------------------------------------ 84
Table 3.5. List of different materials used for skin-electrode preparation along with sample
coding ------------------------------------------------------------------------------------------------------ 90
Table 3.6. List of samples used for washing tests ---------------------------------------------------- 99
Table 3.7. List of samples used for water and chemical analysis -------------------------------- 101
Table 3.8. List of samples used for Martindale abrasion tests ----------------------------------- 103
Table 3.9. List of samples used for Pilling box test ----------------------------------------------- 105
Table 4.1. Regression equations and Adjacent R square values for Type A and B yarns after
washing, Abrasion testing, and Pilling box testing [2] -------------------------------------------- 131
Table 4.2. Resonance frequency and quality factor for textile antennas after 10,000 Abrasion
cycles ----------------------------------------------------------------------------------------------------- 180
Table 4.3. Resonance frequency and quality factor for textile antennas after 72 hours
immersion in water and water-detergent solution, Wi are samples with water solution, WDi
are samples with water-detergent solution ---------------------------------------------------------- 182
Table 6.1. Current progress of sub-groups and shortlisted standards --------------------------- 199

xviii
1
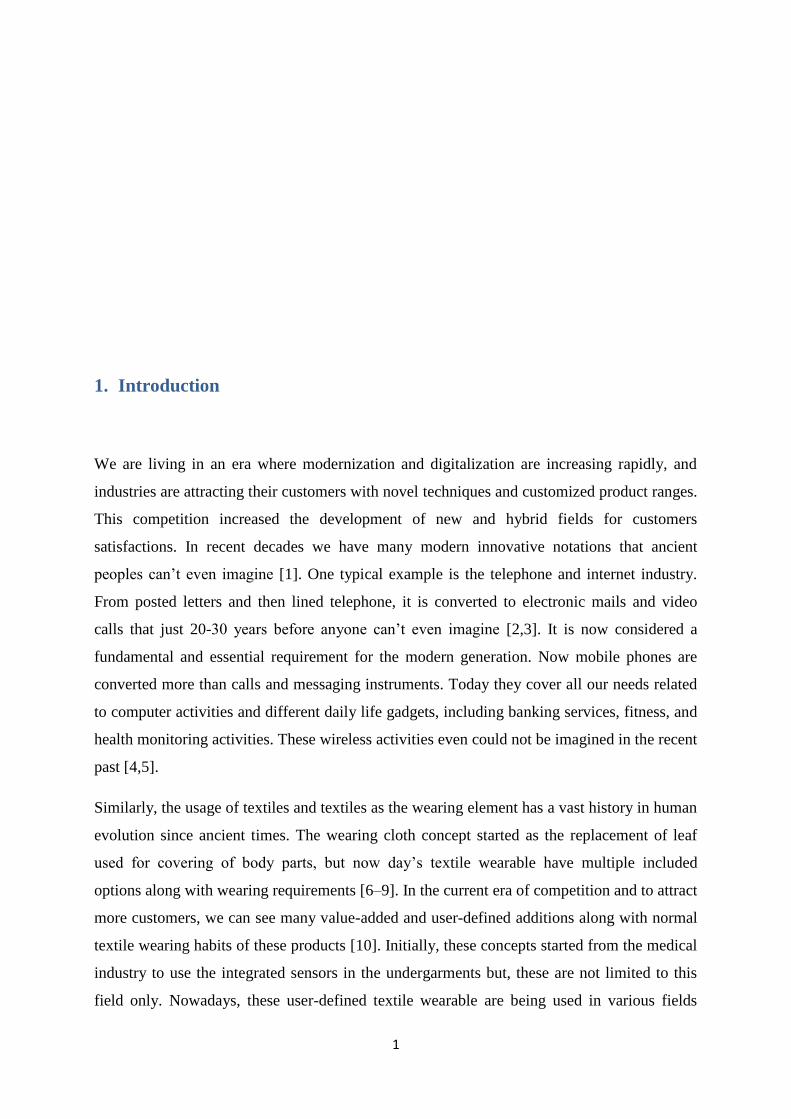
1. Introduction
We are living in an era where modernization and digitalization are increasing rapidly, and
industries are attracting their customers with novel techniques and customized product ranges.
This competition increased the development of new and hybrid fields for customers
satisfactions. In recent decades we have many modern innovative notations that ancient
peoples can’t even imagine [1]. One typical example is the telephone and internet industry.
From posted letters and then lined telephone, it is converted to electronic mails and video
calls that just 20-30 years before anyone can’t even imagine [2,3]. It is now considered a
fundamental and essential requirement for the modern generation. Now mobile phones are
converted more than calls and messaging instruments. Today they cover all our needs related
to computer activities and different daily life gadgets, including banking services, fitness, and
health monitoring activities. These wireless activities even could not be imagined in the recent
past [4,5].
Similarly, the usage of textiles and textiles as the wearing element has a vast history in human
evolution since ancient times. The wearing cloth concept started as the replacement of leaf
used for covering of body parts, but now day’s textile wearable have multiple included
options along with wearing requirements [6–9]. In the current era of competition and to attract
more customers, we can see many value-added and user-defined additions along with normal
textile wearing habits of these products [10]. Initially, these concepts started from the medical
industry to use the integrated sensors in the undergarments but, these are not limited to this
field only. Nowadays, these user-defined textile wearable are being used in various fields
Introduction
2
ranging from medical, sports, military, and different defense-related projects [11–13]. These
new add-ons completely changed the way to use and develop wearable textiles. That’s why
now textile has not remained an independent industry, but a mixture of different industries
working together subject to the integrated user-defined functionalities. Multipurpose and
improved functionality textiles may comprise one or several textile or non-textile smart
components that were woven, embroidered, sewed, integrated, or attached using different
available techniques [5]. Based on requirements, these components can include sensors,
actuators, antennas, processing units, energy storage, production and harvesting, and power
transmitting devices [14,15]. These advanced wearable textiles are usually named smart
textiles, wearable electronics, e-textiles, smart clothing, textronic, etc. [8,16]. They are
enlightened further in the following explanations.
1.1 Smart textiles
The word smart material was first introduced in Japan in 1989. The first textile material in
history that, in retroaction, was stated as a ‘smart textile’ was silk yarn having a shape
memory capacity. However, the discovery of shape-memory materials in the 60s and
intelligent polymeric gels in the 70s was generally accepted as the birth of real smart
materials. Although intelligent materials were first introduced in textiles in the late 90s, the
first textile electronic semiconductive components have been recognized in the early 2000s
[17].
Smart textiles can be defined as textiles that can sense and respond to simulation from the
external environment. They may be divided into two classes: passive and active smart textiles.
Passive smart textiles can change their properties according to environmental stimulation.
Shape memory materials, hydrophobic or hydrophilic textiles, etc. make part of this category
[16,18,19].
Active smart textiles generally contain sensors and actuators to connect internal parameters to
the transmitted message. They can detect different signals from the outer environment
(temperature, light intensity, pollution, etc.), choose how to react, and finally act using various
textile-based, flexible, or miniaturized actuators (textile displays, micro vibrating devices,
LED, etc.). This “decision” can be taken locally, e.g., electronic devices (textile electronics)
embedded in smart textile structures or perhaps remotely, if the smart textile is wirelessly
connected to external clouds containing the database. These servers may be connected with
Introduction
3
artificial intelligence software, etc., and could be a part of the Internet of Things (IoT) concept
[20].
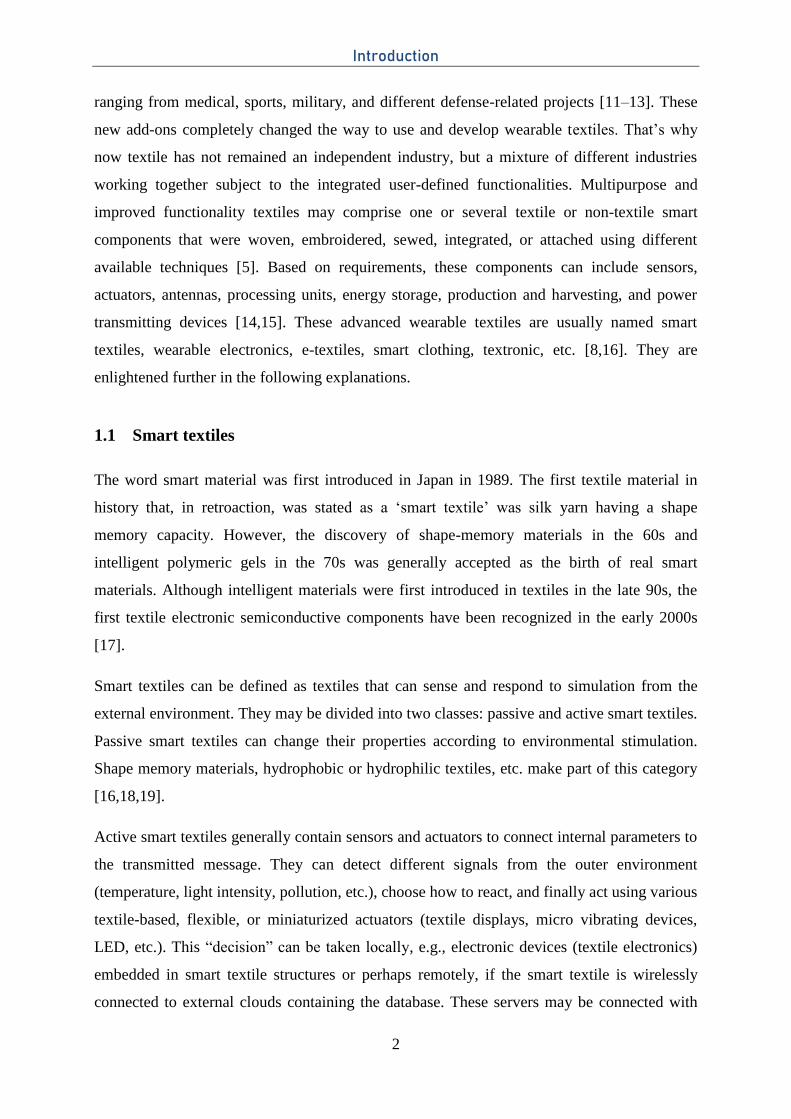
1.2 E-textile system
Categorically we can state that all e-textiles will be smart textiles, but not all smart textiles
need to be e-textiles. E-textile can be defined as “A textile structure (fiber, yarn, fabric or
finished product) permanently integrated, sewn or attached, etc. with electrical and/or
electronic functionality” (Figure 1.1).
Figure 1.1. E-textile system
Any electronic behavior added to normal textiles converts them into e-textile systems. These
electronic components can be textile-based, e.g., flexible textile sensors and antennas, or they
can be non-textile-based, e.g., flexible PCBs and LEDs. These electronic components may be
fabricated with the textile structure as a substrate or even entirely textile-based using various
available textile manufacturing techniques, including weaving, sewing, embedding,
embroidering, soldering, crimping, flip-chip, and magnetic, etc. [21–24]. The use of
conductive fibers, which have energy and data transmission capacity, for detecting, sensing,
monitoring, or communicating the external stimuli response based on specific requirements, is
the basic element of a textile integrated electronic system. Depending on the usage and
fabrication techniques, these textile integrated electronic systems can be classified as
integrated electronic textiles, fabricated electronic devices [25], or normal electronic devices
Wearable computing Wearable electronics
Textile
E-textile
Introduction
4
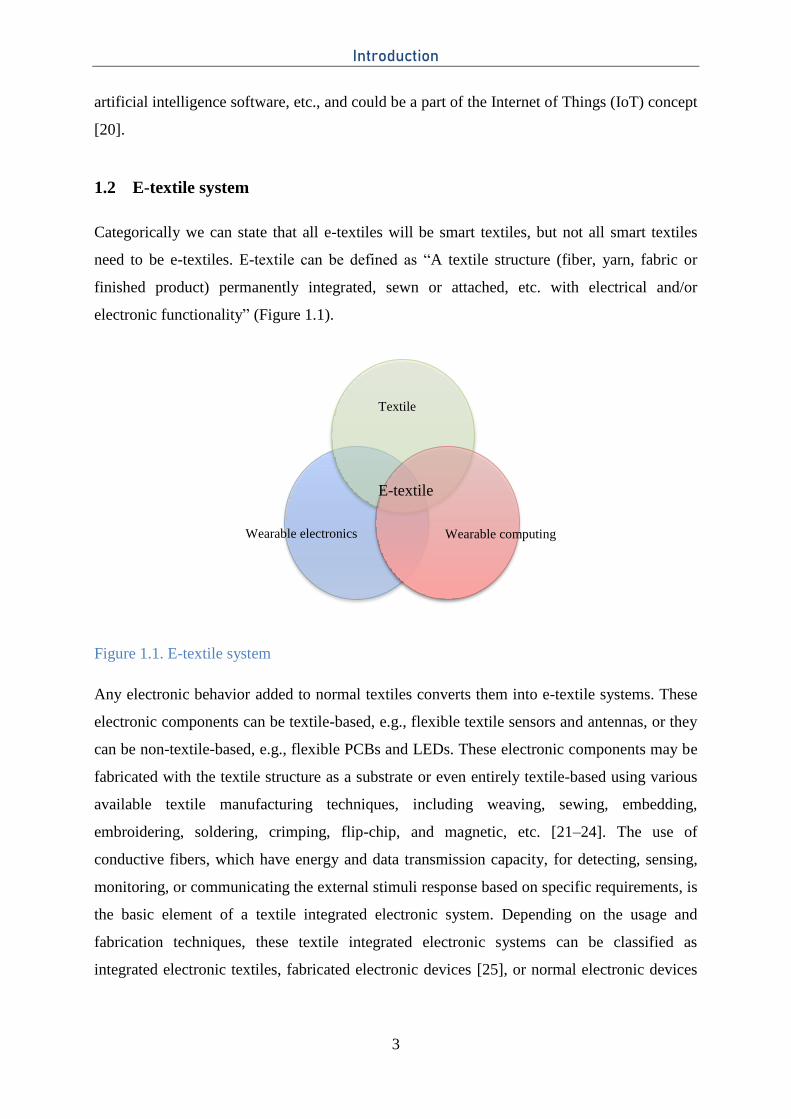
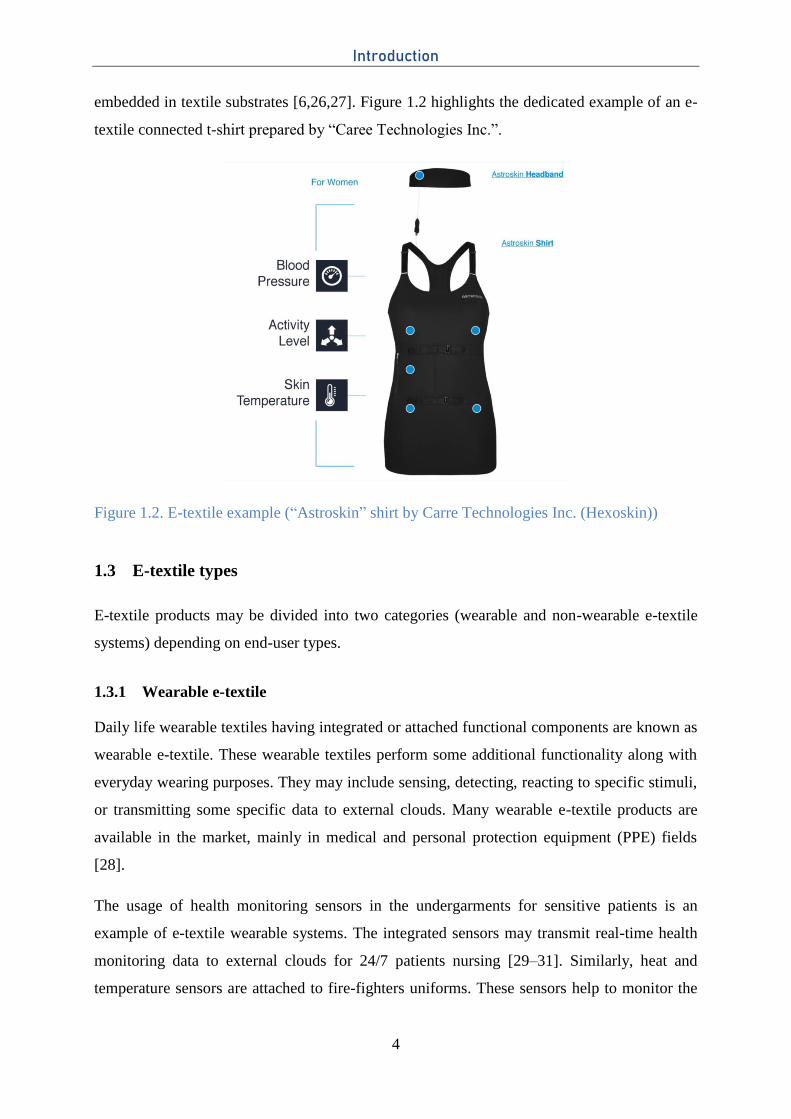
embedded in textile substrates [6,26,27]. Figure 1.2 highlights the dedicated example of an e-
textile connected t-shirt prepared by “Caree Technologies Inc.”.
Figure 1.2. E-textile example (“Astroskin” shirt by Carre Technologies Inc. (Hexoskin))
1.3 E-textile types
E-textile products may be divided into two categories (wearable and non-wearable e-textile
systems) depending on end-user types.
1.3.1 Wearable e-textile
Daily life wearable textiles having integrated or attached functional components are known as
wearable e-textile. These wearable textiles perform some additional functionality along with
everyday wearing purposes. They may include sensing, detecting, reacting to specific stimuli,
or transmitting some specific data to external clouds. Many wearable e-textile products are
available in the market, mainly in medical and personal protection equipment (PPE) fields
[28].
The usage of health monitoring sensors in the undergarments for sensitive patients is an
example of e-textile wearable systems. The integrated sensors may transmit real-time health
monitoring data to external clouds for 24/7 patients nursing [29–31]. Similarly, heat and
temperature sensors are attached to fire-fighters uniforms. These sensors help to monitor the
Introduction
5
outdoor and inner-body temperature of fire-fighters working on fire emergency sites. Hence,
the life of workers can be protected in the case of a rapid increase in inner temperature or
heartbeats rate [32,33].
1.3.2 Non-wearable e-textiles
Non-wearable e-textiles are used in our routine life for non-wearable purposes with additional
functionalities in them. They include bed sheets, curtains, seat covering for household
furniture and automobiles, textile usages in geotextile and construction industries, etc.
Electronic functionalities may be introduced into these textiles to convert them into non-
wearable e-textiles systems. For example, smart pressure sensors can be added to bedsheets to
analyze the sleep cycle for customers. Similarly, seat warming technologies and textile color-
changing dashboards are widely used in automobile industries [34,35]. Smart textile pressure
and temperature sensors can be used in construction industries to analyze and detect any
defects in sky-high buildings or underground constructions [36,37]. Photovoltaic and color-
changing textiles are also being used in disco and dancing clubs [38].
1.4 E-textile Market
The smart textile market is flourishing day by day. Change in human habits and demand for
user-defined facilities has increased the importance of the e-textile systems in the normal
textile market. Just five to seven years back, the healthcare sector was a major contributor to
the smart and wearable electronics market. Since then, the e-textile market is significantly
improving with many applications in fitness monitoring, wireless communications, and
defense purposes [4,17,39]. The progressive development and applications increased
consumer awareness in this newly emerging field which witnessed the growing investment in
e-textile and its associated industries. This progress ultimately reduced the manufacturing cost
and easy access to these emerging e-textile systems to customers [40]. However, it’s too early
to state that e-textile systems are comprehensively integrated into the “Internet of things
(IoT)” infrastructure. There is still room for improvements in terms of security, safety, and
reliability to guarantee the IoT nodes for wearable e-textile products. As we are progressing in
infrastructures and standardizations, we can see more and more products in the market and
ultimately a handy growth rate [41].
Introduction
6
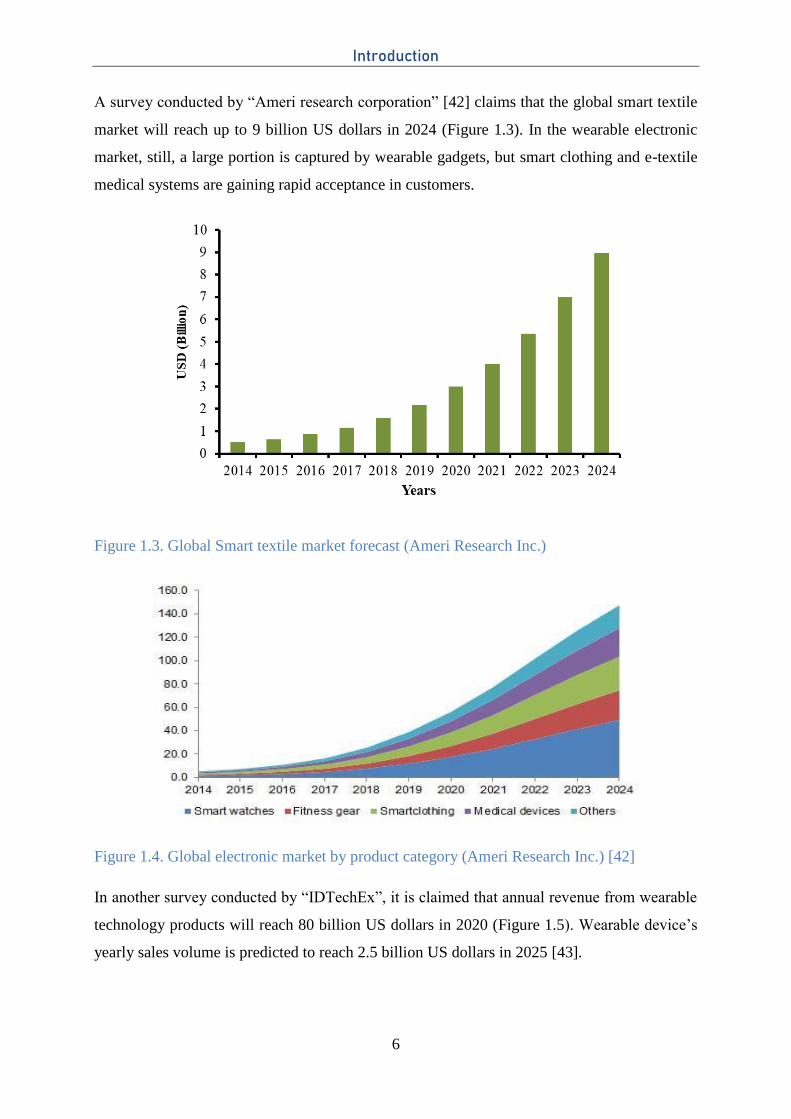
A survey conducted by “Ameri research corporation” [42] claims that the global smart textile
market will reach up to 9 billion US dollars in 2024 (Figure 1.3). In the wearable electronic
market, still, a large portion is captured by wearable gadgets, but smart clothing and e-textile
medical systems are gaining rapid acceptance in customers.
Figure 1.3. Global Smart textile market forecast (Ameri Research Inc.)
Figure 1.4. Global electronic market by product category (Ameri Research Inc.) [42]
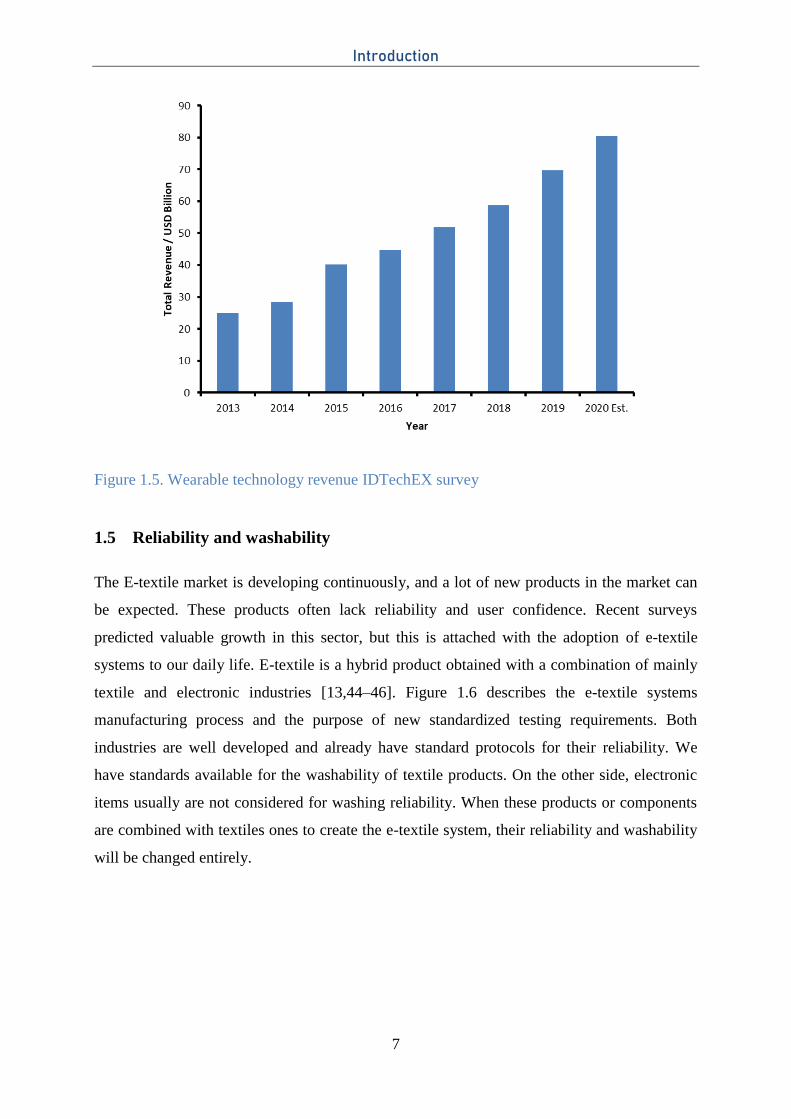
In another survey conducted by “IDTechEx”, it is claimed that annual revenue from wearable
technology products will reach 80 billion US dollars in 2020 (Figure 1.5). Wearable device’s
yearly sales volume is predicted to reach 2.5 billion US dollars in 2025 [43].
Introduction
7
Figure 1.5. Wearable technology revenue IDTechEX survey
1.5 Reliability and washability
The E-textile market is developing continuously, and a lot of new products in the market can
be expected. These products often lack reliability and user confidence. Recent surveys
predicted valuable growth in this sector, but this is attached with the adoption of e-textile
systems to our daily life. E-textile is a hybrid product obtained with a combination of mainly
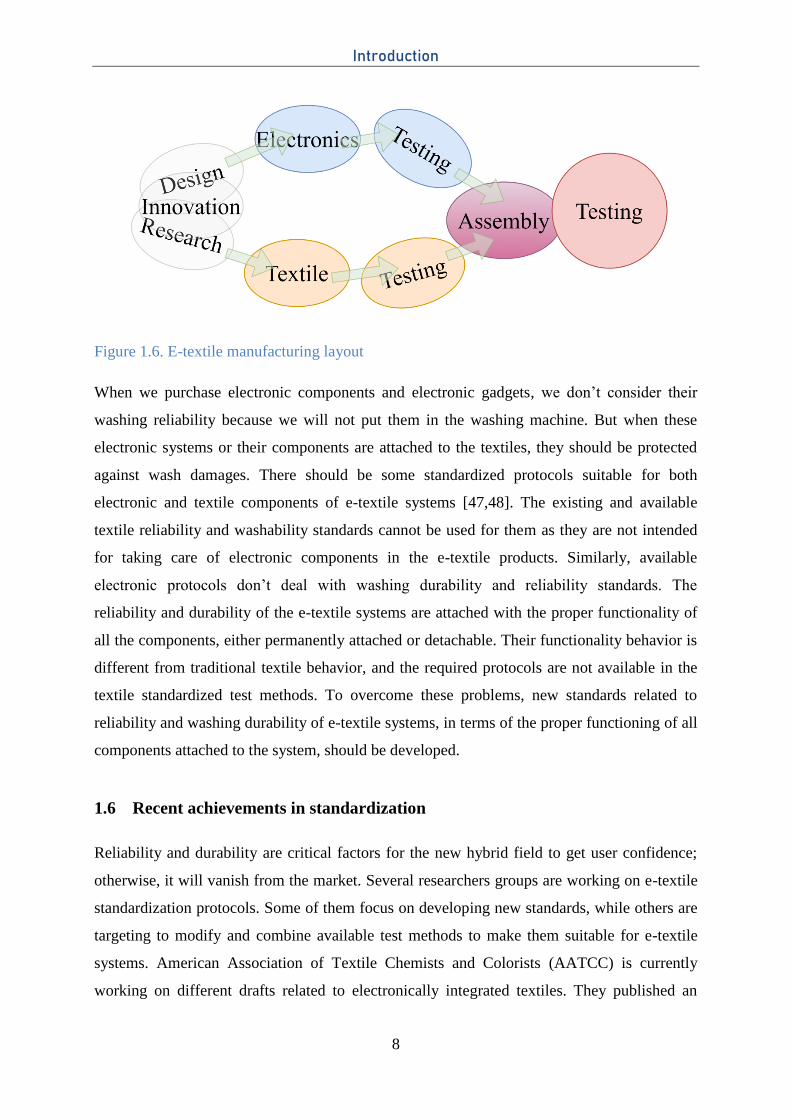
textile and electronic industries [13,44–46]. Figure 1.6 describes the e-textile systems
manufacturing process and the purpose of new standardized testing requirements. Both
industries are well developed and already have standard protocols for their reliability. We
have standards available for the washability of textile products. On the other side, electronic
items usually are not considered for washing reliability. When these products or components
are combined with textiles ones to create the e-textile system, their reliability and washability
will be changed entirely.
Introduction
8
Figure 1.6. E-textile manufacturing layout
When we purchase electronic components and electronic gadgets, we don’t consider their
washing reliability because we will not put them in the washing machine. But when these
electronic systems or their components are attached to the textiles, they should be protected
against wash damages. There should be some standardized protocols suitable for both
electronic and textile components of e-textile systems [47,48]. The existing and available
textile reliability and washability standards cannot be used for them as they are not intended
for taking care of electronic components in the e-textile products. Similarly, available
electronic protocols don’t deal with washing durability and reliability standards. The
reliability and durability of the e-textile systems are attached with the proper functionality of
all the components, either permanently attached or detachable. Their functionality behavior is
different from traditional textile behavior, and the required protocols are not available in the
textile standardized test methods. To overcome these problems, new standards related to
reliability and washing durability of e-textile systems, in terms of the proper functioning of all
components attached to the system, should be developed.
1.6 Recent achievements in standardization
Reliability and durability are critical factors for the new hybrid field to get user confidence;
otherwise, it will vanish from the market. Several researchers groups are working on e-textile
standardization protocols. Some of them focus on developing new standards, while others are
targeting to modify and combine available test methods to make them suitable for e-textile
systems. American Association of Textile Chemists and Colorists (AATCC) is currently
working on different drafts related to electronically integrated textiles. They published an
Introduction
9
evaluation procedure for electrical resistance as the outcome functionality of e-textile
systems. In another initial draft, “AATCC RA 111”, electronically integrated textile test
methods are discussed. ASTM international standard organization is working on the durability
of smart textile electrodes after laundering (ASTM WK-61480). This initial draft covers the
determination of electrical resistivity of textile materials that are generally categorized as
good or moderately conductive materials. International organization for standardization (ISO)
published a standard document report covering smart textile definitions, applications, and the
need for standardization (ISO/TR 23383:2020 [49]). Another organization specialized in
electronics and leading source of standards for the electronic industry, Association
Connecting Electronics Industries (IPC), is also working on different initial drafts related to
washability and reliability of wearable electronics. Recently they published the draft report
IPC-8921 [50] related to definitions of e-textile components. This report covers the
requirements for woven and knitted electronic textiles (E-textiles) integrated with conductive
fibers, conductive yarns, and/or wires. A working group under this organization is working on
quality and reliability for e-textiles wearable, and the initial draft IPC-8981 is due to be
finalized in June 2021. The European sub-group (D-75a-EU, E-textiles wearables standard
task group in Europe) of this committee is working on washability problems related to
wearable e-textiles, classifications of the products in terms of standard requirements, and
transition of available standards into e-textile standards with required modification and
addition. All these efforts are under process to streamline this new and emerging field in
terms of reliability and durability. Different organizations and research groups are progressing
in these achievements, and some initial drafts are available in the market. This is a collective
effort, and it can’t be quantified quickly. These developments surely confirm the pathway in
the right direction, and it may be expected the e-textile reliability and washability protocols
will be developed in the coming years.
1.7 Objectives and target output
My research is planned to investigate and highlight the difficulties the e-textile market is
facing in terms of reliability and washability. These problems directly impact the market
acceptance, user-confidence, and ultimately the success of the e-textile systems. The main
objectives of this study are highlighted below.
Introduction
10
Objective 1
Investigation of washability and reliability issues related to e-textiles and their importance in
this field. Study of different available washing options and highlight the differences among
them to better understand how to select the most suitable washing option for e-textile systems.
Identification of washing stresses during the different washing phases and their damage
intensity on the e-textile systems.
Objective 2
Categorization of different e-textile components, including detachable and permanently fixed
ones, for the investigation of the washing stresses separately on each of the components in
terms of their functionality. Use of the accelerometer device for stress analysis in washing
drum to highlight the available mechanical standardized test protocols that can be used as the
simulation of comparable damages, without the washing process.
Objective 3
Presentation of a washing simulation model based on the experimental analyses, which can be
exercised for wash damages and reliability predictions without actually washing the e-textile
systems. Shortlist the available test protocols that may be adapted, with some modifications,
to claim e-textile system reliability. Finally, preparation of standard protocol draft claiming
washability and functionality for wearable e-textile systems.
Different e-textile components are investigated separately in these experiments and the impact
of damages is studied. These details are further explained in the coming chapters. Chapter 2
presents some recent developments in the standardization of e-textile reliability along with a
literature review of current e-textile developments. E-textile wearable products available in
markets are discussed along with their functionality and washing instructions. Chapter 3
contains a detailed explanation of tests and materials used in this research work. The
experiment flow is explained in this chapter with all required information of instruments and
apparatus used for this investigation. Chapter 4 contains the outcomes from these experiments
and an in-depth discussion of the results. Proposed standards based on these results and
discussions are covered in chapter 5 and 6.
Introduction
11
References
1. Ankhili, A.; Tao, X.; Cochrane, C.; Coulon, D.; Koncar, V. Washable and Reliable
Textile Electrodes Embedded into Underwear Fabric for Electrocardiography (ECG)
Monitoring. Materials 2018, 11, 256, doi:10.3390/ma11020256.
2. Wu, H.; Huang, Y.; Xu, F.; Duan, Y.; Yin, Z. Energy Harvesters for Wearable and
Stretchable Electronics: From Flexibility to Stretchability. Adv. Mater. 2016, 28, 9881–9919,
doi:10.1002/adma.201602251.
3. Waqar, S.; Wang, L.; John, S. Piezoelectric energy harvesting from intelligent textiles.
In Electronic Textiles; Elsevier, 2015; pp. 173–197 ISBN 978-0-08-100201-8.
4. Bahru, R.; Hamzah, A.A.; Mohamed, M.A. Thermal Management of Wearable and
Implantable Electronic Healthcare Devices: Perspective and Measurement Approach. Int J
Energy Res 2020, er.6031, doi:10.1002/er.6031.
5. Hussain, M.M.; El-Atab, N. Handbook of Flexible and Stretchable Electronics. 551.
6. Wang, L.; Fu, X.; He, J.; Shi, X.; Chen, T.; Chen, P.; Wang, B.; Peng, H. Application
Challenges in Fiber and Textile Electronics. Adv. Mater. 2020, 32, 1901971,
doi:10.1002/adma.201901971.
7. Mecnika, V.; Scheulen, K.; Anderson, C.F.; Hörr, M.; Breckenfelder, C. Joining
technologies for electronic textiles. In Electronic Textiles; Elsevier, 2015; pp. 133–153 ISBN
978-0-08-100201-8.
8. Zaman, S. uz; Tao, X.; Cochrane, C.; Koncar, V. Understanding the Washing Damage
to Textile ECG Dry Skin Electrodes, Embroidered and Fabric-Based; Set up of Equivalent
Laboratory Tests. Sensors 2020, 20, 1272, doi:10.3390/s20051272.
9. Tseghai, G.B.; Malengier, B.; Fante, K.A.; Nigusse, A.B.; Langenhove, L.V.
Integration of Conductive Materials with Textile Structures, an Overview. 2020, 28.
10. Pang, Y.; Yang, Z.; Yang, Y.; Ren, T. Wearable Electronics Based on 2D Materials
for Human Physiological Information Detection. Small 2020, 16, 1901124,
doi:10.1002/smll.201901124.
11. Ismar, E.; Tao, X.; Rault, F.; Dassonville, F.; Cochrane, C. Towards Embroidered
Circuit Board From Conductive Yarns for E-Textiles. 2020, 8, 9.
12. Valentine, L.; Ballie, J.; Bletcher, J.; Robertson, S.; Stevenson, F. Design Thinking for
Textiles: Let’s Make It Meaningful. The Design Journal 2017, 20, S964–S976,
doi:10.1080/14606925.2017.1353041.
13. Scataglini, S.; Andreoni, G.; Gallant, J. A Review of Smart Clothing in Military. In
Introduction
12
Proceedings of the Proceedings of the 2015 workshop on Wearable Systems and Applications
- WearSys ’15; ACM Press: Florence, Italy, 2015; pp. 53–54.
14. Abed, A.; Cochrane, C.; Boussu, F.; Cherkaoui, O.; Elmoznine, R. Design and
Development of a Piezo-Resistive Sensor Based on PEDOT: PSS Applied to Sisal’s Natural
Fiber for Monitoring of 3D Warp Interlock Fabric. IOP Conf. Ser.: Mater. Sci. Eng. 2020,
827, 012019, doi:10.1088/1757-899X/827/1/012019.
15. Kim, G.; Vu, C.C.; Kim, J. Single-Layer Pressure Textile Sensors with Woven
Conductive Yarn Circuit. Applied Sciences 2020, 10, 2877, doi:10.3390/app10082877.
16. Park, S.; Jayaraman, S. Smart Textiles: Wearable Electronic Systems. MRS Bulletin
2003, 28, 585–591, doi:10.1557/mrs2003.170.
17. Sungmee Park; Jayaraman, S. Enhancing the Quality of Life through Wearable
Technology. IEEE Engineering in Medicine and Biology Magazine 2003, 22, 41–48,
doi:10.1109/MEMB.2003.1213625.
18. Tao, X. Smart technology for textiles and clothing – introduction and overview. In
Smart Fibres, Fabrics and Clothing; Elsevier, 2001; pp. 1–6 ISBN 978-1-85573-546-0.
19. Koncar, V. Introduction to smart textiles and their applications. In Smart Textiles and
their Applications; Elsevier, 2016; pp. 1–8 ISBN 978-0-08-100574-3.
20. Koncar, V. Smart textiles for monitoring and measurement applications. In Smart
Textiles for In Situ Monitoring of Composites; Elsevier, 2019; pp. 1–151 ISBN 978-0-08-
102308-2.
21. Linz, T.; Kallmayer, C.; Aschenbrenner, R.; Reichl, H. Embroidering Electrical
Interconnects with Conductive Yarn for The Integration of Flexible Electronic Modules into
Fabric. In Proceedings of the Ninth IEEE International Symposium on Wearable Computers
(ISWC’05); IEEE: Osaka, Japan, 2005; pp. 86–91.
22. Linz, T.; von Krshiwoblozki, M.; Walter, H. Novel Packaging Technology for Body
Sensor Networks Based on Adhesive Bonding A Low Cost, Mass Producible and High
Reliability Solution. In Proceedings of the 2010 International Conference on Body Sensor
Networks; IEEE: Singapore, Singapore, June 2010; pp. 308–314.
23. Linz, T.; von Krshiwoblozki, M.; Walter, H.; Foerster, P. Contacting Electronics to
Fabric Circuits with Nonconductive Adhesive Bonding. Journal of The Textile Institute 2012,
103, 1139–1150, doi:10.1080/00405000.2012.664867.
24. Capineri, L. Resistive Sensors with Smart Textiles for Wearable Technology: From
Fabrication Processes to Integration with Electronics. Procedia Engineering 2014, 87, 724–
727, doi:10.1016/j.proeng.2014.11.748.
Introduction
13
25. Garnier, B.; Mariage, P.; Rault, F.; Cochrane, C.; Koncar, V. Textile NFC Antenna for
Power and Data Transmission across Clothes. Smart Mater. Struct. 2020, 29, 085017,
doi:10.1088/1361-665X/ab8a6d.
26. Ismar, E.; Kurşun Bahadir, S.; Kalaoglu, F.; Koncar, V. Futuristic Clothes: Electronic
Textiles and Wearable Technologies. Global Challenges 2020, 4, 1900092,
doi:10.1002/gch2.201900092.
27. Jansen, K.M.B. How to Shape the Future of Smart Clothing. In Proceedings of the
Proceedings of the 2019 ACM International Joint Conference on Pervasive and Ubiquitous
Computing and Proceedings of the 2019 ACM International Symposium on Wearable
Computers - UbiComp/ISWC ’19; ACM Press: London, United Kingdom, 2019; pp. 1037–
1039.
28. Ferraro, V.; Pasold, A. Emerging Materials et Technologies: New Approaches in
Design Teaching Methods on Four Exemplified Areas 2020.
29. Bystricky, T.; Moravcova, D.; Kaspar, P.; Soukup, R.; Hamacek, A. A Comparison of
Embroidered and Woven Textile Electrodes for Continuous Measurement of ECG. In
Proceedings of the 2016 39th International Spring Seminar on Electronics Technology
(ISSE); IEEE: Pilsen, Czech Republic, May 2016; pp. 7–11.
30. Jin, H.; Matsuhisa, N.; Lee, S.; Abbas, M.; Yokota, T.; Someya, T. Enhancing the
Performance of Stretchable Conductors for E‐Textiles by Controlled Ink Permeation. Adv.
Mater. 2017, 29, 1605848, doi:10.1002/adma.201605848.
31. Ankhili, A.; Zaman, S.U.; Tao, X.; Cochrane, C.; Koncar, V.; Coulon, D. How to
Connect Conductive Flexible Textile Tracks to Skin Electrocardiography Electrodes and
Protect Them Against Washing. IEEE Sensors Journal 2019, 19, 11995–12002,
doi:10.1109/JSEN.2019.2938333.
32. Sandulescu, V.; Dobrescu, R. Wearable System for Stress Monitoring of Firefighters
in Special Missions. In Proceedings of the 2015 E-Health and Bioengineering Conference
(EHB); IEEE: Iasi, Romania, November 2015; pp. 1–4.
33. Caya, M.V.C.; Casaje, J.S.; Catapang, G.B.; Dandan, R.A.V.; Linsangan, N.B.
Warning System for Firefighters Using E-Textile. In Proceedings of the 2018 3rd
International Conference on Computer and Communication Systems (ICCCS); IEEE:
Nagoya, April 2018; pp. 362–366.
34. Nanjappan, V.; Shi, R.; Liang, H.-N.; Lau, K.K.-T.; Yue, Y.; Atkinson, K. Towards a
Taxonomy for In-Vehicle Interactions Using Wearable Smart Textiles: Insights from a User-
Elicitation Study. MTI 2019, 3, 33, doi:10.3390/mti3020033.
Introduction
14
35. Textile Advances in the Automotive Industry; Shishoo, R.L., Textile Institute, Eds.;
Woodhead publishing in textiles; CRC Press [u.a.]: Boca Raton, Fla., 2008; ISBN 978-1-
84569-331-2.
36. Zangani, D.; Fuggini, C.; Loriga, G. Electronic textiles for geotechnical and civil
engineering. In Electronic Textiles; Elsevier, 2015; pp. 275–300 ISBN 978-0-08-100201-8.
37. Rowley, E. Lighting Up Your Garments: An Investigation into Methods of Making
Fabrics Glow. 5.
38. Stylios, G.K.; Yang, D.Y. The Concept of Mood Changing Garments Made from
Luminescent Woven Fabrics and Flexible Photovoltaics “MoodWear.” AST 2012, 80, 22–29,
doi:10.4028/www.scientific.net/AST.80.22.
39. Smart Textiles and Their Applications | Request PDF;
40. Gopalsamy, C.; Park, S.; Rajamanickam, R.; Jayaraman, S. (ARTS)
MedicalApplications. 17.
41. Tao, X.; Huang, T.-H.; Shen, C.-L.; Ko, Y.-C.; Jou, G.-T.; Koncar, V. Bluetooth Low
Energy-Based Washable Wearable Activity Motion and Electrocardiogram Textronic
Monitoring and Communicating System. Advanced Materials Technologies 2018, 3,
1700309, doi:10.1002/admt.201700309.
42. Smart Textiles Market To 2024 Available online:
https://www.ameriresearch.com/product/smart-textiles-market/.
43. James Hayward E-Textiles and Smart Clothing 2020-2030: Technologies, Markets and
Players Available online: https://www.idtechex.com/en/research-report/e-textiles-and-smart-
clothing-2020-2030-technologies-markets-and-players/735.
44. Flexible, Wearable, and Stretchable Electronics. 373.
45. Li, R.-W.; Liu, G. Flexible and Stretchable Electronics. 409.
46. Ojstršek, A.; Gorgieva, S. Tailoring of Durable Conductive and UV-Shielding
Properties on Cotton and Polyester Fabrics by PEDOT:PSS Screen-Printing. Polymers 2020,
12, 2356, doi:10.3390/polym12102356.
47. Guibert, M.; Massicart, A.; Chen, X.; He, H.; Torres, J.; Ukkonen, L.; Virkki, J.
Washing Reliability of Painted, Embroidered, and Electro-Textile Wearable RFID Tags. In
Proceedings of the 2017 Progress in Electromagnetics Research Symposium - Fall (PIERS -
FALL); IEEE: Singapore, November 2017; pp. 828–831.
48. Li, Y.; Yong, S.; Hillier, N.; Arumugam, S.; Beeby, S. Screen Printed Flexible Water
Activated Battery on Woven Cotton Textile as a Power Supply for E-Textile Applications.
IEEE Access 2020, 8, 206958–206965, doi:10.1109/ACCESS.2020.3038157.
Introduction
15
49. ISO/TR 23383:2020 Available online:
https://www.iso.org/cms/render/live/en/sites/isoorg/contents/data/standard/07/53/75383.html
(accessed on 21 December 2020).
50. IPC-8921: Requirements for Woven and Knitted Electronic Textiles (E-Textiles)
Integrated with Conductive Fibers, Conductive Yarns and/or Wires Available online:
https://shop.ipc.org/IPC-8921-English-D (accessed on 21 December 2020).
Introduction
16
17
2. Literature review
The reliability and durability of smart textile structures are key factors for market acceptance
and success to this new emerging portion of the textile industry. The electronic textile
structures are supposed to be in good functioning “as the whole” against various stresses
faced during the life span of this specific system [1]. These stresses depend on different
elements, including multiple types of the smart textile system, end-use, life cycle, etc. [2].
Among the stresses, washability is the major issue that most wearable electronic smart textiles
face during their life cycles. Various products are available in the market, and somehow, they
are successful in meeting the user requirements, but these products lack in terms of
washability and washing reliability. Different standards are available for textile washing
protocols, but these cannot work in the case of e-textile systems. These standards are specially
designed for textile structures and can’t be used for the electronics portion attached or
embedded in the e-textile system. Similarly, the standardized test protocols are available for
the electronic industry, but they are not designed to deal with textile wearable structures. We
don’t test the electronic functionality of wearable clothing or the washability behavior of
electronic gadgets. Special precautions should be adopted for these hybrid structures to claim
durability and washing reliability. Different available standards in the textile and electronic
industry along with recent work on the standardization of electronic wearable textiles, are
highlighted in detail.
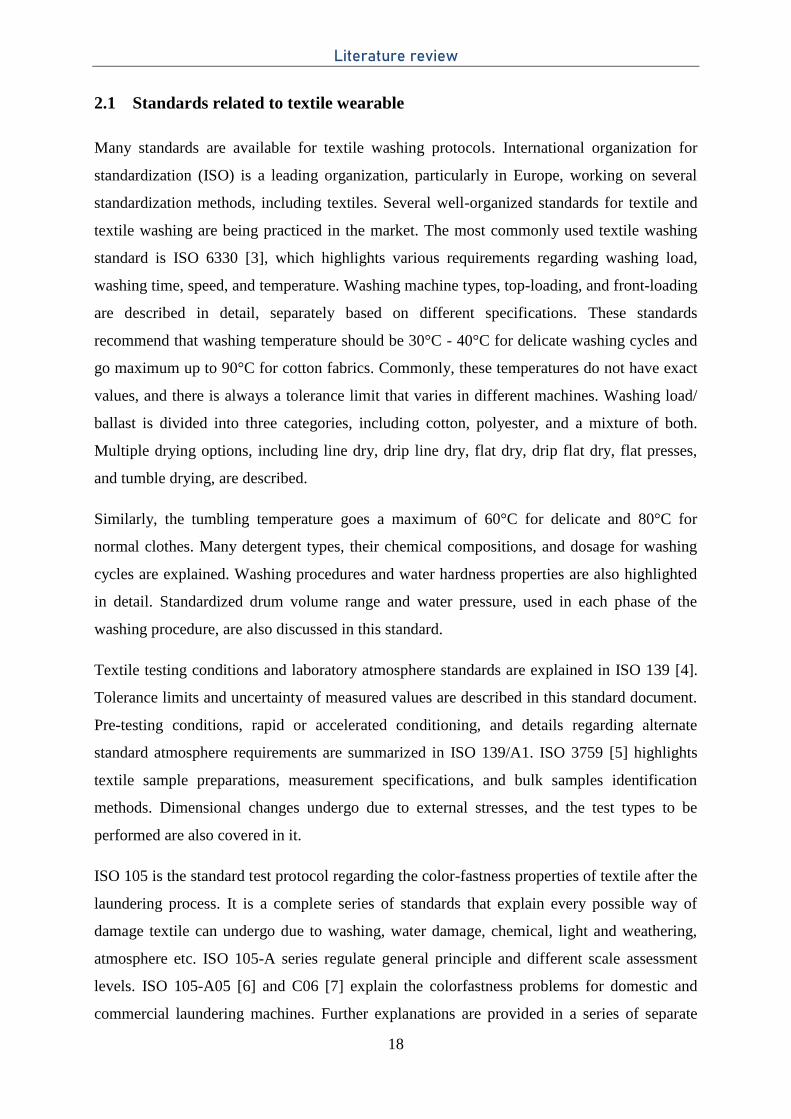
Literature review
18
2.1 Standards related to textile wearable
Many standards are available for textile washing protocols. International organization for
standardization (ISO) is a leading organization, particularly in Europe, working on several
standardization methods, including textiles. Several well-organized standards for textile and
textile washing are being practiced in the market. The most commonly used textile washing
standard is ISO 6330 [3], which highlights various requirements regarding washing load,
washing time, speed, and temperature. Washing machine types, top-loading, and front-loading
are described in detail, separately based on different specifications. These standards
recommend that washing temperature should be 30°C - 40°C for delicate washing cycles and
go maximum up to 90°C for cotton fabrics. Commonly, these temperatures do not have exact
values, and there is always a tolerance limit that varies in different machines. Washing load/
ballast is divided into three categories, including cotton, polyester, and a mixture of both.
Multiple drying options, including line dry, drip line dry, flat dry, drip flat dry, flat presses,
and tumble drying, are described.
Similarly, the tumbling temperature goes a maximum of 60°C for delicate and 80°C for
normal clothes. Many detergent types, their chemical compositions, and dosage for washing
cycles are explained. Washing procedures and water hardness properties are also highlighted
in detail. Standardized drum volume range and water pressure, used in each phase of the
washing procedure, are also discussed in this standard.
Textile testing conditions and laboratory atmosphere standards are explained in ISO 139 [4].
Tolerance limits and uncertainty of measured values are described in this standard document.
Pre-testing conditions, rapid or accelerated conditioning, and details regarding alternate
standard atmosphere requirements are summarized in ISO 139/A1. ISO 3759 [5] highlights
textile sample preparations, measurement specifications, and bulk samples identification
methods. Dimensional changes undergo due to external stresses, and the test types to be
performed are also covered in it.
ISO 105 is the standard test protocol regarding the color-fastness properties of textile after the
laundering process. It is a complete series of standards that explain every possible way of
damage textile can undergo due to washing, water damage, chemical, light and weathering,
atmosphere etc. ISO 105-A series regulate general principle and different scale assessment
levels. ISO 105-A05 [6] and C06 [7] explain the colorfastness problems for domestic and
commercial laundering machines. Further explanations are provided in a series of separate
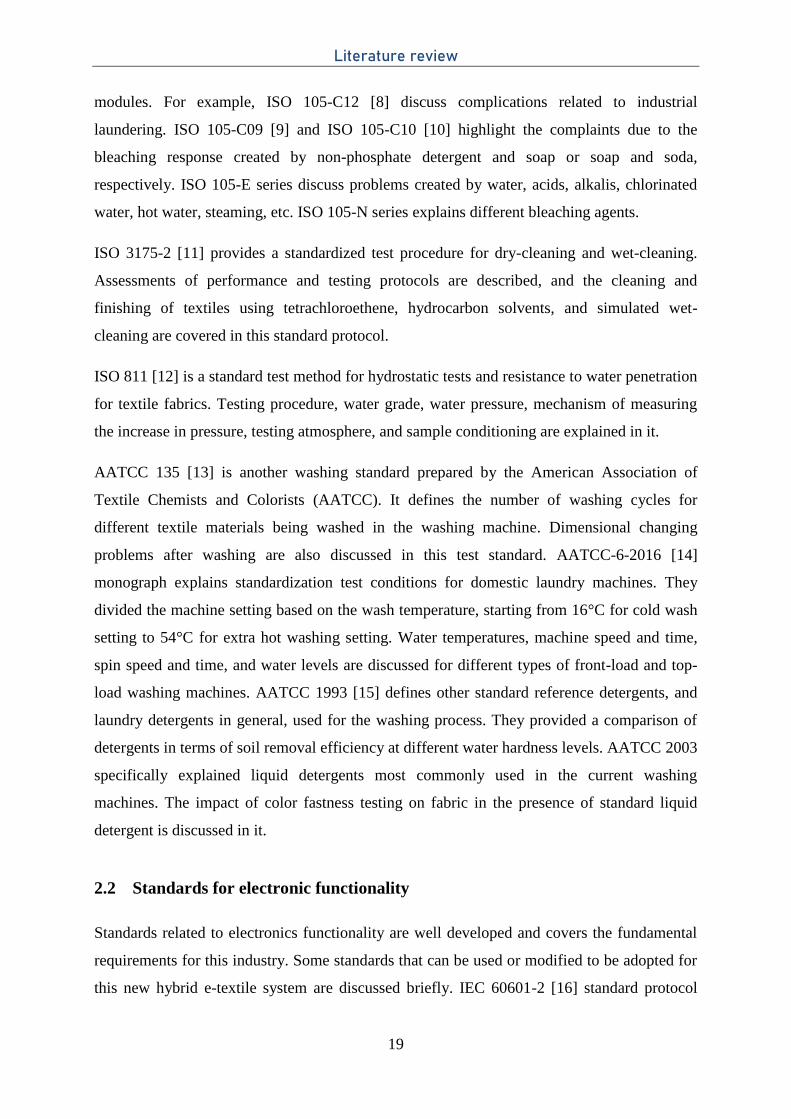
Literature review
19
modules. For example, ISO 105-C12 [8] discuss complications related to industrial
laundering. ISO 105-C09 [9] and ISO 105-C10 [10] highlight the complaints due to the
bleaching response created by non-phosphate detergent and soap or soap and soda,
respectively. ISO 105-E series discuss problems created by water, acids, alkalis, chlorinated
water, hot water, steaming, etc. ISO 105-N series explains different bleaching agents.
ISO 3175-2 [11] provides a standardized test procedure for dry-cleaning and wet-cleaning.
Assessments of performance and testing protocols are described, and the cleaning and
finishing of textiles using tetrachloroethene, hydrocarbon solvents, and simulated wet-
cleaning are covered in this standard protocol.
ISO 811 [12] is a standard test method for hydrostatic tests and resistance to water penetration
for textile fabrics. Testing procedure, water grade, water pressure, mechanism of measuring
the increase in pressure, testing atmosphere, and sample conditioning are explained in it.
AATCC 135 [13] is another washing standard prepared by the American Association of
Textile Chemists and Colorists (AATCC). It defines the number of washing cycles for
different textile materials being washed in the washing machine. Dimensional changing
problems after washing are also discussed in this test standard. AATCC-6-2016 [14]
monograph explains standardization test conditions for domestic laundry machines. They
divided the machine setting based on the wash temperature, starting from 16°C for cold wash
setting to 54°C for extra hot washing setting. Water temperatures, machine speed and time,
spin speed and time, and water levels are discussed for different types of front-load and top-
load washing machines. AATCC 1993 [15] defines other standard reference detergents, and
laundry detergents in general, used for the washing process. They provided a comparison of
detergents in terms of soil removal efficiency at different water hardness levels. AATCC 2003
specifically explained liquid detergents most commonly used in the current washing
machines. The impact of color fastness testing on fabric in the presence of standard liquid
detergent is discussed in it.
2.2 Standards for electronic functionality
Standards related to electronics functionality are well developed and covers the fundamental
requirements for this industry. Some standards that can be used or modified to be adopted for
this new hybrid e-textile system are discussed briefly. IEC 60601-2 [16] standard protocol
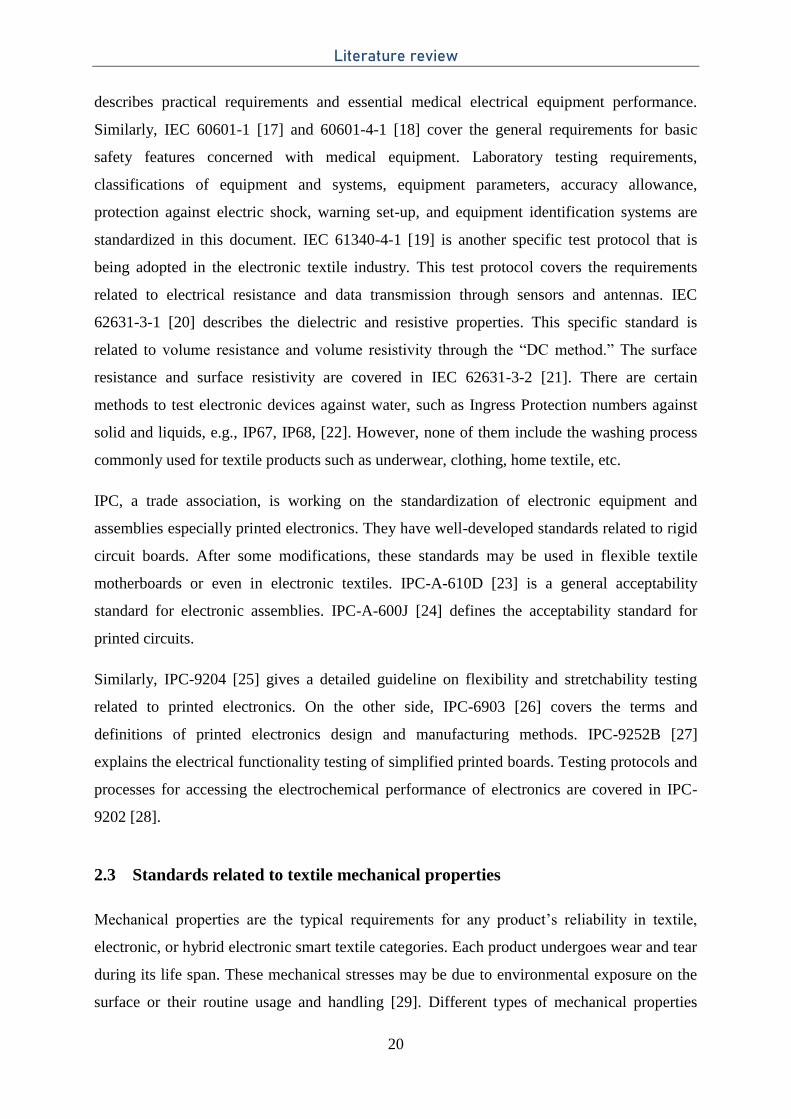
Literature review
20
describes practical requirements and essential medical electrical equipment performance.
Similarly, IEC 60601-1 [17] and 60601-4-1 [18] cover the general requirements for basic
safety features concerned with medical equipment. Laboratory testing requirements,
classifications of equipment and systems, equipment parameters, accuracy allowance,
protection against electric shock, warning set-up, and equipment identification systems are
standardized in this document. IEC 61340-4-1 [19] is another specific test protocol that is
being adopted in the electronic textile industry. This test protocol covers the requirements
related to electrical resistance and data transmission through sensors and antennas. IEC
62631-3-1 [20] describes the dielectric and resistive properties. This specific standard is
related to volume resistance and volume resistivity through the “DC method.” The surface
resistance and surface resistivity are covered in IEC 62631-3-2 [21]. There are certain
methods to test electronic devices against water, such as Ingress Protection numbers against
solid and liquids, e.g., IP67, IP68, [22]. However, none of them include the washing process
commonly used for textile products such as underwear, clothing, home textile, etc.
IPC, a trade association, is working on the standardization of electronic equipment and
assemblies especially printed electronics. They have well-developed standards related to rigid
circuit boards. After some modifications, these standards may be used in flexible textile
motherboards or even in electronic textiles. IPC-A-610D [23] is a general acceptability
standard for electronic assemblies. IPC-A-600J [24] defines the acceptability standard for
printed circuits.
Similarly, IPC-9204 [25] gives a detailed guideline on flexibility and stretchability testing
related to printed electronics. On the other side, IPC-6903 [26] covers the terms and
definitions of printed electronics design and manufacturing methods. IPC-9252B [27]
explains the electrical functionality testing of simplified printed boards. Testing protocols and
processes for accessing the electrochemical performance of electronics are covered in IPC-
9202 [28].
2.3 Standards related to textile mechanical properties
Mechanical properties are the typical requirements for any product’s reliability in textile,
electronic, or hybrid electronic smart textile categories. Each product undergoes wear and tear
during its life span. These mechanical stresses may be due to environmental exposure on the
surface or their routine usage and handling [29]. Different types of mechanical properties
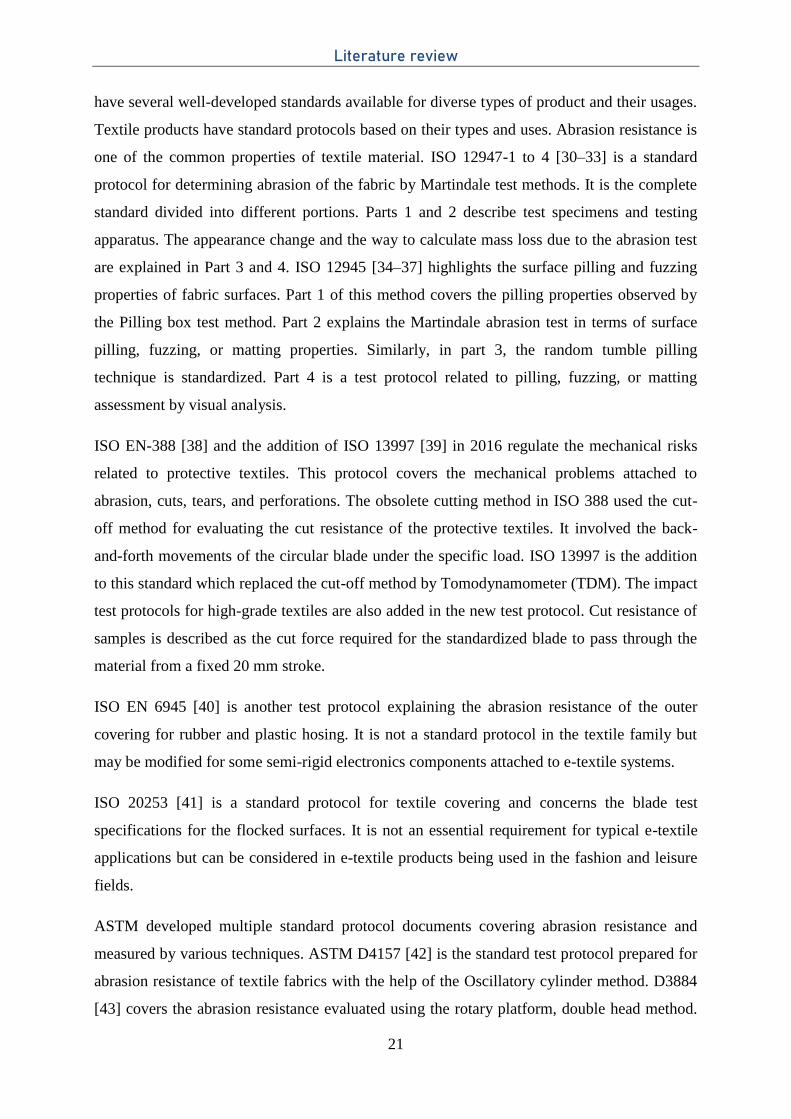
Literature review
21
have several well-developed standards available for diverse types of product and their usages.
Textile products have standard protocols based on their types and uses. Abrasion resistance is
one of the common properties of textile material. ISO 12947-1 to 4 [30–33] is a standard
protocol for determining abrasion of the fabric by Martindale test methods. It is the complete
standard divided into different portions. Parts 1 and 2 describe test specimens and testing
apparatus. The appearance change and the way to calculate mass loss due to the abrasion test
are explained in Part 3 and 4. ISO 12945 [34–37] highlights the surface pilling and fuzzing
properties of fabric surfaces. Part 1 of this method covers the pilling properties observed by
the Pilling box test method. Part 2 explains the Martindale abrasion test in terms of surface
pilling, fuzzing, or matting properties. Similarly, in part 3, the random tumble pilling
technique is standardized. Part 4 is a test protocol related to pilling, fuzzing, or matting
assessment by visual analysis.
ISO EN-388 [38] and the addition of ISO 13997 [39] in 2016 regulate the mechanical risks
related to protective textiles. This protocol covers the mechanical problems attached to
abrasion, cuts, tears, and perforations. The obsolete cutting method in ISO 388 used the cut-
off method for evaluating the cut resistance of the protective textiles. It involved the back-
and-forth movements of the circular blade under the specific load. ISO 13997 is the addition
to this standard which replaced the cut-off method by Tomodynamometer (TDM). The impact
test protocols for high-grade textiles are also added in the new test protocol. Cut resistance of
samples is described as the cut force required for the standardized blade to pass through the
material from a fixed 20 mm stroke.
ISO EN 6945 [40] is another test protocol explaining the abrasion resistance of the outer
covering for rubber and plastic hosing. It is not a standard protocol in the textile family but
may be modified for some semi-rigid electronics components attached to e-textile systems.
ISO 20253 [41] is a standard protocol for textile covering and concerns the blade test
specifications for the flocked surfaces. It is not an essential requirement for typical e-textile
applications but can be considered in e-textile products being used in the fashion and leisure
fields.
ASTM developed multiple standard protocol documents covering abrasion resistance and
measured by various techniques. ASTM D4157 [42] is the standard test protocol prepared for
abrasion resistance of textile fabrics with the help of the Oscillatory cylinder method. D3884
[43] covers the abrasion resistance evaluated using the rotary platform, double head method.
Literature review
22
D3885 [44] discusses the flexing and abrasion method for this functionality. D3886 [45] uses
the inflated diaphragm apparatus to calculate the abrasion resistance of textile fabrics. D4158
[46] standardized the abrasion resistance for textile fabrics using uniform abrasion methods.
ASTM D4966 [47] is one of the most commonly used standard procedures for abrasion
resistance testing. This standard test method measures the abrasion resistance of textile fabrics
using the Martindale abrasion tester method. AATCC 93 [48] is another test standard for
abrasion resistance of textile fabrics. This protocol discusses the accelerometer method for
this measurement.
ASTM F392 [49] is the standard practice used for flex durability of flexible materials. This
test method summarizes various test conditions, including full flex for one-hour, full flex for
20 minutes, full flex for 6 minutes, full flex for 20 cycles, and partial flex for 20 cycles.
Conditions suitable for the prototype may be decided based on the requirement. This test
method can be easily modified to adapt for e-textile prototypes by adjusting the cycle speed
and testing duration.
ISO 7854 [50] is a standard test method originally developed for measuring the flex resistance
of coated fabrics by the flexing method. Rubber and plastic-coated fabrics are discussed in
this document. ISO 2062 [51] is a standard protocol developed for measuring the single-end
breaking force and elongation at break using a constant rate of the extension test method. This
standard covers the textile yarns taken from ready-to-use packages by four different methods.
They are based on the way specimens taken from the packages. In the most commonly used
test method, specimens are taken directly from conditioned packages. It is also used for
stretching and stretch cycle measurement of textile fabrics.
ISO 13934 [52,53] is a detailed test protocol developed to measure the tensile properties. It is
generally used for woven fabrics and fabrics with elastomeric fibers. It does not apply to
geotextiles, nonwovens, coated fabrics, textile-glass woven fabrics, and fabrics made from
carbon fibers or polyolefin tape yarns. The method identifies the specimens in equilibrium
with the standard atmosphere for testing and test specimens in the wet state. It is restricted to
the use of a constant rate of extension (CRE) testing machines. This procedure is divided into
two parts. Part 1 covers the tensile properties in maximum force and elongation at maximum
textile fabrics force using a strip method. Part 2 determines the maximum force of textile
fabrics through the Grab test procedure.
Literature review
23
ASTM D 5034 [54] also explains the standard protocol for the tensile properties of textiles.
This method covers the breaking strength and elongation determined by the “Grab
procedure.” It applies to woven, nonwoven, and felted fabrics and is not recommended for
glass or knit fabrics. ASTM D 5035 [55] uses the strip method to measure the breaking
strength and tensile properties. This test method describes procedures for carrying out fabric
tensile tests using four types of specimens and three alternative types of testing machines.
Another test protocol, ASTM D5587 [56], covers the tearing strength of fabrics using the
TRAPEZOID procedure. It applies to most types of woven, non-woven, and knit fabrics. Tear
strength, as determined in this test method, requires the tear to be initiated before testing. It
may be reported either as the single-peak force or the average of the five highest peaks.
ISO 14704 [57] is a standard test protocol used to measure the flexural strength of fine
ceramic or ceramic-based composites having a grain size of less than 200 µm. This test
protocol is not related to the textile industry, but it can be used or modified for semi-flexible
electronic components attached to e-textile systems.
IPC 9204 [25] is a standard test protocol for flexibility and stretchability testing of printed
electronics used for stretchable electronics or wearable applications. This test method can be
used, with required modifications, for e-textile systems having semi-flexible / flexible
electronic circuits attached to them.
ASTM D 2594 [58] is a test protocol designed for a knitted fabric having low power
properties. This standard covers the measurement of fabric stretch and fabric growth of
knitted fabrics proposed for applications requiring low-power stretch properties. It includes
procedures for fabric growth and stretch and may be used individually when required by
individual specifications. Fabric growth usually is expressed as a percentage of the change in
length of the specimen after the tension application. It is a crucial test protocol because most
of the wearable textile clothing is made by knitting techniques, and the e-textile system
developed by these textiles can take guidelines from the existing standard.
ASTM D3107 [59] test protocol covers the tensile properties of woven textile fabrics. This
test method standardizes the fabric stretch procedure and material’s dimensional change after
a specified extension and is held for a specified time. This standard, along with D2594 [58]
for knitted fabrics, entertains the almost complete range of textile garments or fabrics that
may be used in wearable e-textile systems.
Literature review
24
2.4 Standards related to conductive functionality measurement
In the previous discussion, important test procedures related to or can be modified to adopt in
e-textile systems are highlighted. These test protocols should be discussed, and necessary
modifications may be planned for their use in the reliability development of e-textile systems.
Along with mechanical or washability test standards, protocols for conductive functionality
testing related to the acceptable performance of these e-textile systems, based on new
requirements, should also be developed. In the following discussion, some initially developed
drafts or previous standards that are being adopted to verify the e-textile functionality after
mechanical or washing stresses are discussed.
AATCC EP 13 [60] is a test procedure evaluating the electrical resistance of electronically
integrated textiles. E-textile fabrics or end products with incorporated conductive paths/tracks
may be assessed. This method is not for the evaluation of yarns or fibers. Electrical resistance
may be measured as received or after treatment, such as stretch or laundering, etc. The change
in resistance due to treatment may also be calculated. Electrical resistance is measured using
surface probes along with a digital multi-meter. It is the primary and most commonly used
method for e-textile systems electrical resistance measurements.
AATCC TM 76 [61] is the standard test protocol for surface resistivity measurement of textile
fabric. The surface resistivity is calculated using the measured electrical resistance, between
superficially positioned parallel plates or concentric rings and their spacing. Results are
reported as ohm per square. This is an effective test method for resistance measurement for
the flow of current between two electrodes. Concentric ring electrodes with a constant
distance from each other are generally used in this experiment. This test method is usually not
preferred for sensitive resistive fabrics.
CEN EN 16812 [62] is under publication test protocol. It explains a test method for
determining the linear electric resistance of conductive tracks for textile structures or intended
for application in/to textiles, e.g., yarns, printed or coated tracks, ropes, ribbons, and webbing.
Conductive behavior is calculated using Ohm’s law, and electrical resistance is expressed in
ohm / m. A detailed explanation regarding specimen preparation and pretension for non-
elastic fabrics is provided. Two different types of test set-up are covered in this protocol. Four
electrode-four wire method is a preferred test method, but two electrodes-four wire method
may also be used where the other method is not possible to use due to the specifications of the
tracks.
Literature review
25
ISO/CD 24584 [63] is under development test protocol dedicated for sheet resistance of
conductive textiles using non-contact type procedures. This standard is in its initial
development stage, and no further details are available.
ISO/TR 23383 [64] is also a new test protocol related to smart textile, and its initial draft is
published recently under the supervision of the ISO/TC 38 technical committee. This standard
highlights the smart textile definitions, their categorizations, and applications. Smart textiles
are mainly divided into functional textile products and interactive textile products. Based on
their categorization and application, requirements of new standards are pointed out in this
standard document.
IEC 61482 [65,66] is a test protocol currently under work for modifications. This standard
discusses the protective clothing against thermal hazards of an electric arc. This procedure is
more related to electrical properties instead of textile properties. But in the case of e-textile
systems, electronics components are attached with textiles, and there are chances for them to
be in direct contact with the body. In this case, thermal hazard properties will also be
important for an e-textile system.
2.5 Progress on e-textile standardization
Different available standards that can be used or modified are mentioned in the above
discussion. These standards are being adopted as the replacement, because standards
especially designed for e-textile systems are still not available in the market. Many groups are
working on it, and some initial drafts regarding definitions and classifications are available in
the market.
ASTM WK61480 [67] is a standard test draft related to the durability of textile electrodes
after laundering. AATCC RA111 [68] explains electrically integrated textiles after home
laundering. IEC 63203 [69] is under process working draft for wearable electronic devices in
the supervision of sub-committee TC124 in “International Electrotechnical Commission
(IEC).” It is a series of documents covering different portions related to wearable e-textile.
Part 204-1 is a working draft that describes the washability and durability of leisure and
sports-related wearable e-textile systems. Washing test conditions, pre-treatments, post
washing treatments, and test results protocols are discussed in it. However still, no
explanation related to different behavior for various e-textile components is added in this
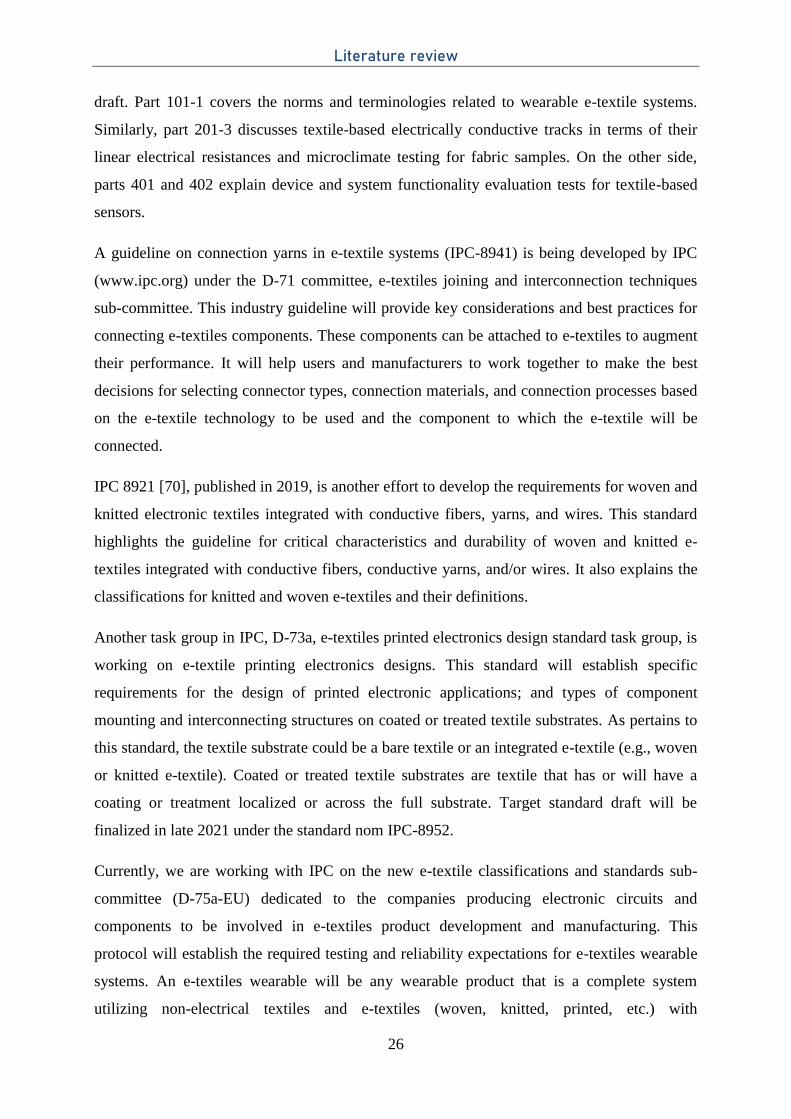
Literature review
26
draft. Part 101-1 covers the norms and terminologies related to wearable e-textile systems.
Similarly, part 201-3 discusses textile-based electrically conductive tracks in terms of their
linear electrical resistances and microclimate testing for fabric samples. On the other side,
parts 401 and 402 explain device and system functionality evaluation tests for textile-based
sensors.
A guideline on connection yarns in e-textile systems (IPC-8941) is being developed by IPC
(www.ipc.org) under the D-71 committee, e-textiles joining and interconnection techniques
sub-committee. This industry guideline will provide key considerations and best practices for
connecting e-textiles components. These components can be attached to e-textiles to augment
their performance. It will help users and manufacturers to work together to make the best
decisions for selecting connector types, connection materials, and connection processes based
on the e-textile technology to be used and the component to which the e-textile will be
connected.
IPC 8921 [70], published in 2019, is another effort to develop the requirements for woven and
knitted electronic textiles integrated with conductive fibers, yarns, and wires. This standard
highlights the guideline for critical characteristics and durability of woven and knitted e-
textiles integrated with conductive fibers, conductive yarns, and/or wires. It also explains the
classifications for knitted and woven e-textiles and their definitions.
Another task group in IPC, D-73a, e-textiles printed electronics design standard task group, is
working on e-textile printing electronics designs. This standard will establish specific
requirements for the design of printed electronic applications; and types of component
mounting and interconnecting structures on coated or treated textile substrates. As pertains to
this standard, the textile substrate could be a bare textile or an integrated e-textile (e.g., woven
or knitted e-textile). Coated or treated textile substrates are textile that has or will have a
coating or treatment localized or across the full substrate. Target standard draft will be
finalized in late 2021 under the standard nom IPC-8952.
Currently, we are working with IPC on the new e-textile classifications and standards sub-
committee (D-75a-EU) dedicated to the companies producing electronic circuits and
components to be involved in e-textiles product development and manufacturing. This
protocol will establish the required testing and reliability expectations for e-textiles wearable
systems. An e-textiles wearable will be any wearable product that is a complete system
utilizing non-electrical textiles and e-textiles (woven, knitted, printed, etc.) with
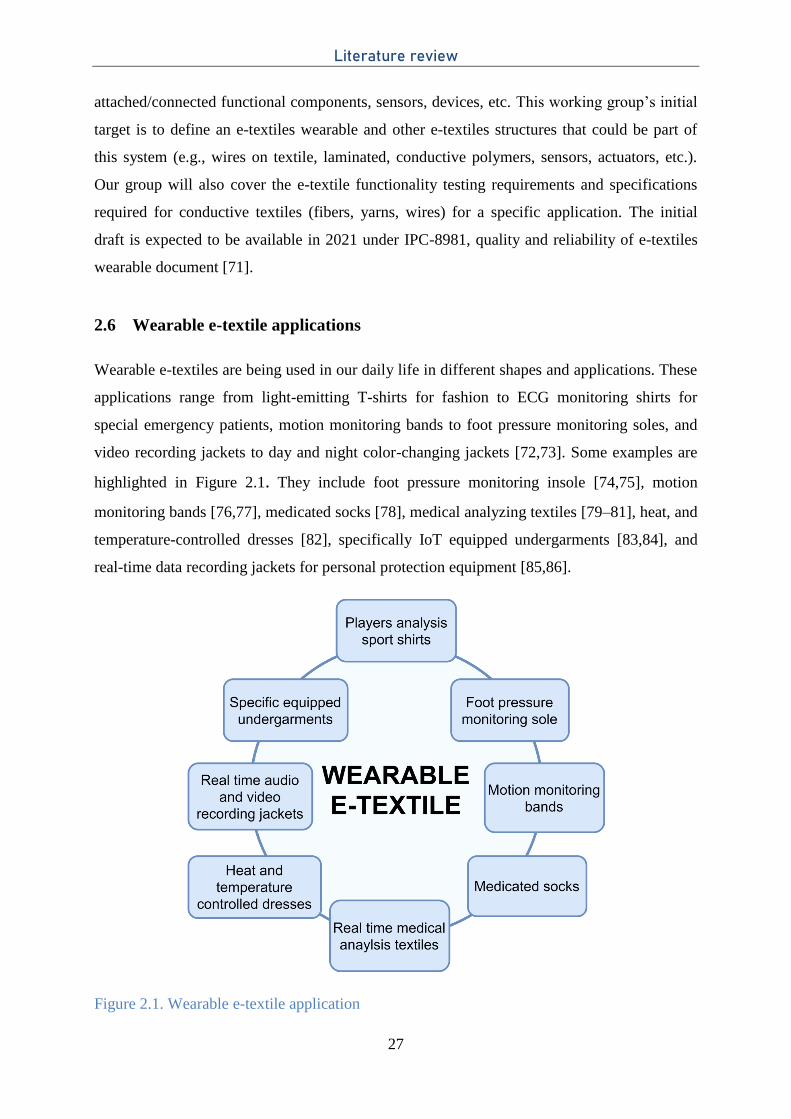
Literature review
27
attached/connected functional components, sensors, devices, etc. This working group’s initial
target is to define an e-textiles wearable and other e-textiles structures that could be part of
this system (e.g., wires on textile, laminated, conductive polymers, sensors, actuators, etc.).
Our group will also cover the e-textile functionality testing requirements and specifications
required for conductive textiles (fibers, yarns, wires) for a specific application. The initial
draft is expected to be available in 2021 under IPC-8981, quality and reliability of e-textiles
wearable document [71].
2.6 Wearable e-textile applications
Wearable e-textiles are being used in our daily life in different shapes and applications. These
applications range from light-emitting T-shirts for fashion to ECG monitoring shirts for
special emergency patients, motion monitoring bands to foot pressure monitoring soles, and
video recording jackets to day and night color-changing jackets [72,73]. Some examples are
highlighted in Figure 2.1. They include foot pressure monitoring insole [74,75], motion
monitoring bands [76,77], medicated socks [78], medical analyzing textiles [79–81], heat, and
temperature-controlled dresses [82], specifically IoT equipped undergarments [83,84], and
real-time data recording jackets for personal protection equipment [85,86].
Figure 2.1. Wearable e-textile application
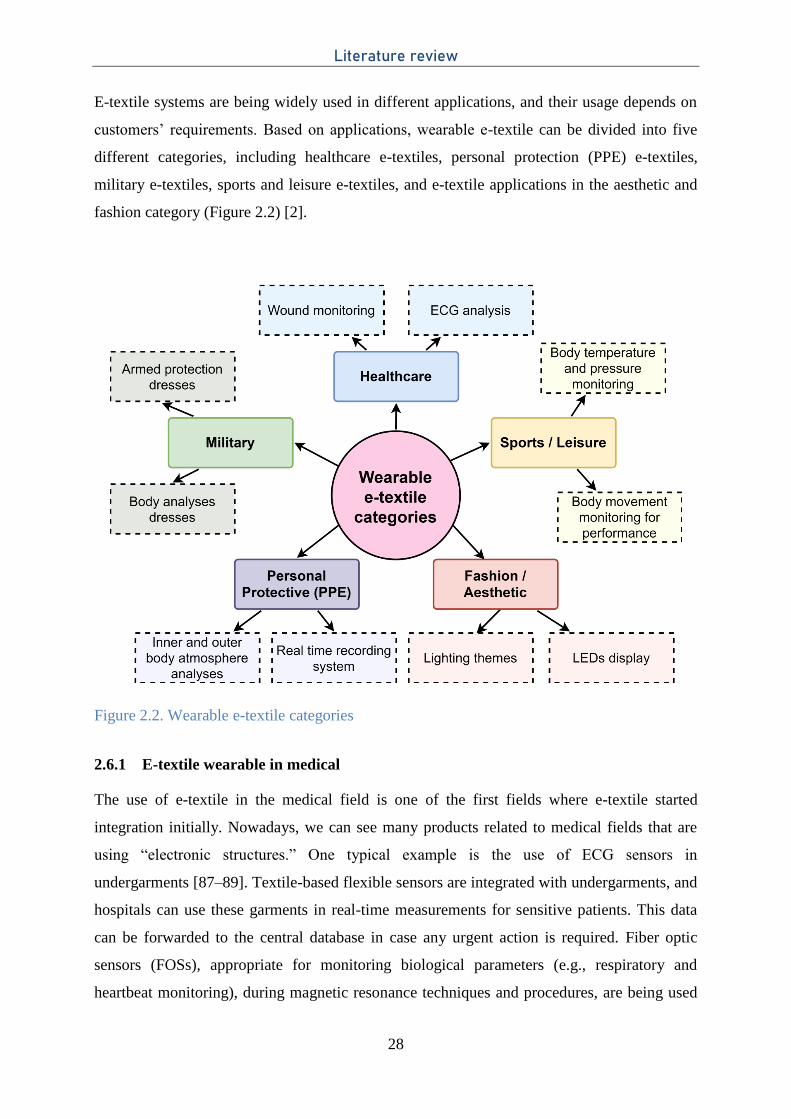
Literature review
28
E-textile systems are being widely used in different applications, and their usage depends on
customers’ requirements. Based on applications, wearable e-textile can be divided into five
different categories, including healthcare e-textiles, personal protection (PPE) e-textiles,
military e-textiles, sports and leisure e-textiles, and e-textile applications in the aesthetic and
fashion category (Figure 2.2) [2].
Figure 2.2. Wearable e-textile categories
2.6.1 E-textile wearable in medical
The use of e-textile in the medical field is one of the first fields where e-textile started
integration initially. Nowadays, we can see many products related to medical fields that are
using “electronic structures.” One typical example is the use of ECG sensors in
undergarments [87–89]. Textile-based flexible sensors are integrated with undergarments, and
hospitals can use these garments in real-time measurements for sensitive patients. This data
can be forwarded to the central database in case any urgent action is required. Fiber optic
sensors (FOSs), appropriate for monitoring biological parameters (e.g., respiratory and
heartbeat monitoring), during magnetic resonance techniques and procedures, are being used
Literature review
29
in the medical industry [72,90,91]. The wearable e-textile systems are also being used in lung
ventilation treatment and cardiac functions related to it [92]. Light-emitting wearable e-textile
systems are prepared with the help of optical fibers and they are being used normally for
photodynamic therapy [93,94]. Similarly, chemical sensors integrated into wearable textiles
are used for metabolic disorder investigations [95]. Smart textiles are also being used for
phototherapy. “NeoMedLight” [96] prepared a revolutionary “The BiliCocoon” Nest and Bag
system. The Nest system consists of a pad that allows wrapping and is used for kangaroo care
and incubator. The Bag system is adapted for cuddling and breastfeeding the baby.
Figure 2.3. The BiliCocoon phototherapy system [96]
The smart textile company “Kymira” [97] has developed the prototype of the cardiac
monitoring t-shirt to detect the risk of heart attack for athletes. It will transmit the heart
rhythm to the mobile phone via Bluetooth, and hence an unusual rhythm that leads to sudden
cardiac arrest can be detected.
Xiaomi Mijia [98] cardiogram t-shirt has integrated ECG sensors to monitor the patient’s
physical state. These shirts have a joint lightening system that can create an alert in the case of
dangerous heart rate values by changing the color according to the heart stroke intensity. The
resulting cardiogram can also be downloaded via Bluetooth.
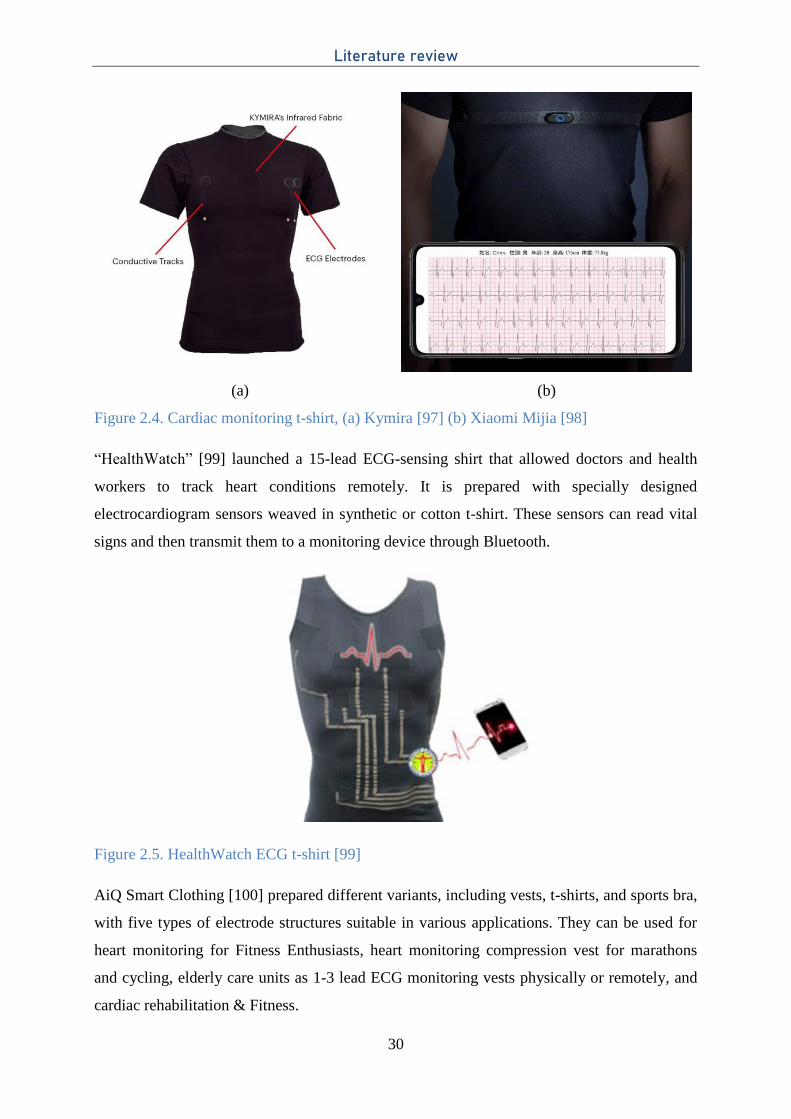
Literature review
30
(a) (b)
Figure 2.4. Cardiac monitoring t-shirt, (a) Kymira [97] (b) Xiaomi Mijia [98]
“HealthWatch” [99] launched a 15-lead ECG-sensing shirt that allowed doctors and health
workers to track heart conditions remotely. It is prepared with specially designed
electrocardiogram sensors weaved in synthetic or cotton t-shirt. These sensors can read vital
signs and then transmit them to a monitoring device through Bluetooth.
Figure 2.5. HealthWatch ECG t-shirt [99]
AiQ Smart Clothing [100] prepared different variants, including vests, t-shirts, and sports bra,
with five types of electrode structures suitable in various applications. They can be used for
heart monitoring for Fitness Enthusiasts, heart monitoring compression vest for marathons
and cycling, elderly care units as 1-3 lead ECG monitoring vests physically or remotely, and
cardiac rehabilitation & Fitness.
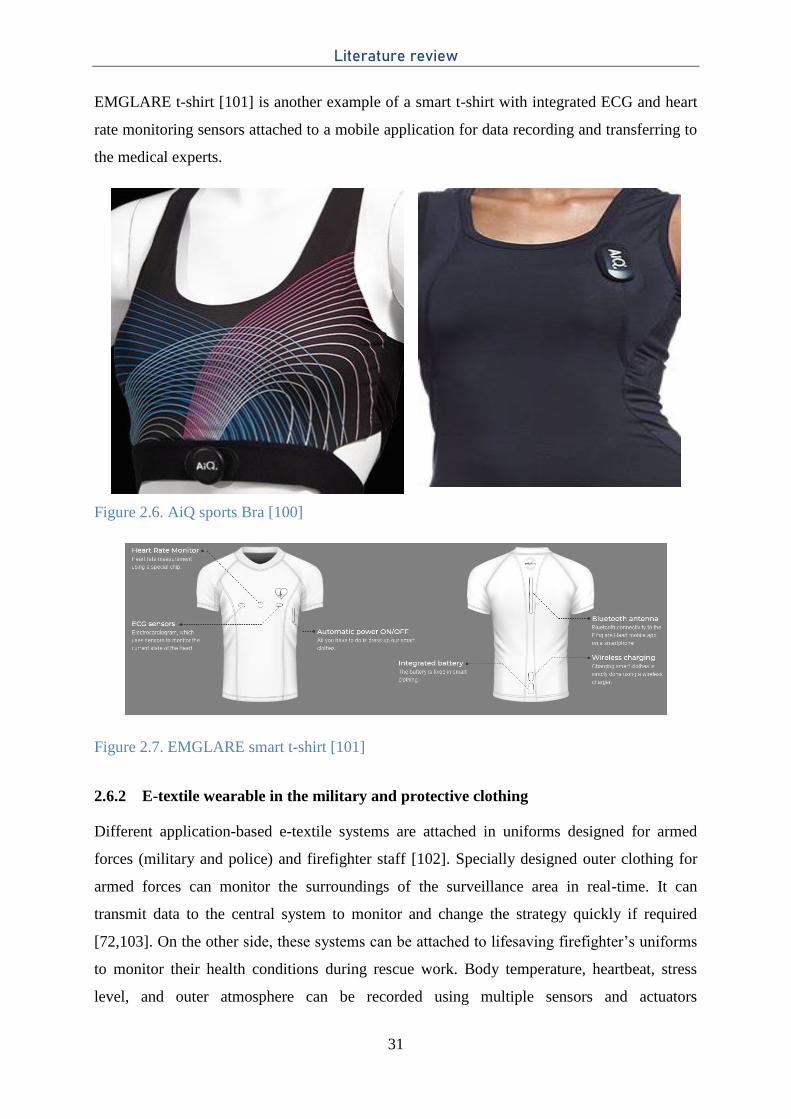
Literature review
31
EMGLARE t-shirt [101] is another example of a smart t-shirt with integrated ECG and heart
rate monitoring sensors attached to a mobile application for data recording and transferring to
the medical experts.
Figure 2.6. AiQ sports Bra [100]
Figure 2.7. EMGLARE smart t-shirt [101]
2.6.2 E-textile wearable in the military and protective clothing
Different application-based e-textile systems are attached in uniforms designed for armed
forces (military and police) and firefighter staff [102]. Specially designed outer clothing for
armed forces can monitor the surroundings of the surveillance area in real-time. It can
transmit data to the central system to monitor and change the strategy quickly if required
[72,103]. On the other side, these systems can be attached to lifesaving firefighter’s uniforms
to monitor their health conditions during rescue work. Body temperature, heartbeat, stress
level, and outer atmosphere can be recorded using multiple sensors and actuators
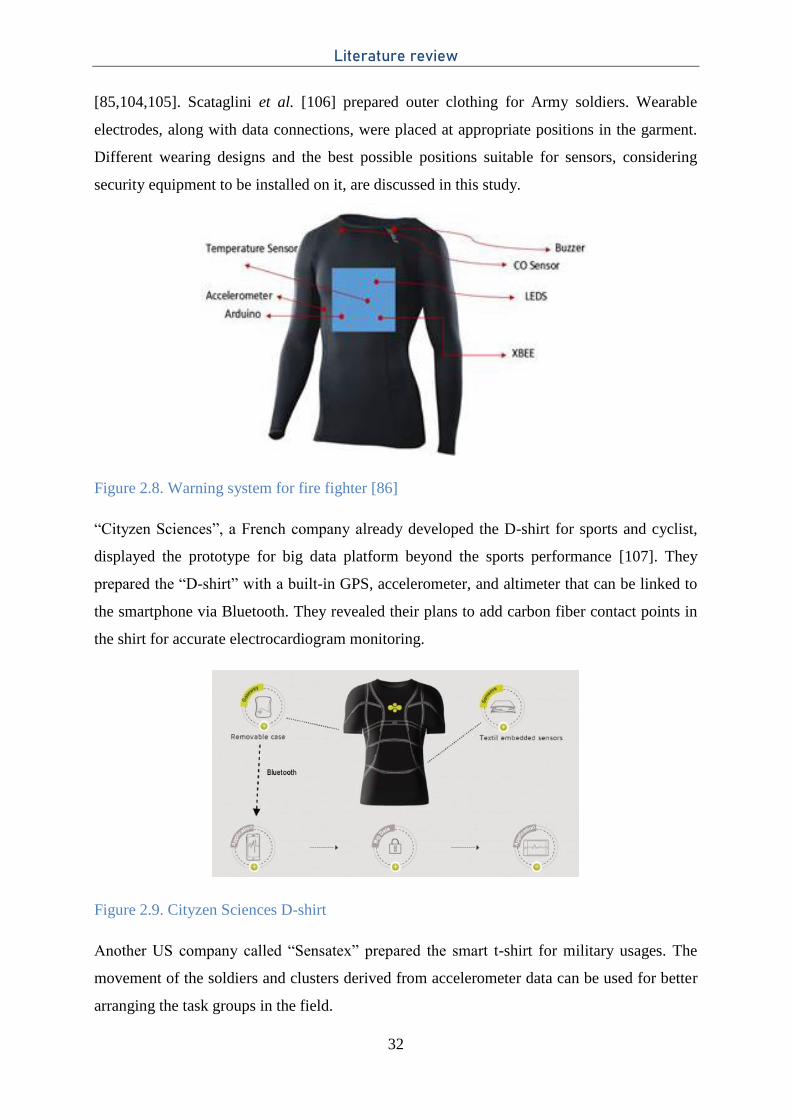
Literature review
32
[85,104,105]. Scataglini et al. [106] prepared outer clothing for Army soldiers. Wearable
electrodes, along with data connections, were placed at appropriate positions in the garment.
Different wearing designs and the best possible positions suitable for sensors, considering
security equipment to be installed on it, are discussed in this study.
Figure 2.8. Warning system for fire fighter [86]
“Cityzen Sciences”, a French company already developed the D-shirt for sports and cyclist,
displayed the prototype for big data platform beyond the sports performance [107]. They
prepared the “D-shirt” with a built-in GPS, accelerometer, and altimeter that can be linked to
the smartphone via Bluetooth. They revealed their plans to add carbon fiber contact points in
the shirt for accurate electrocardiogram monitoring.
Figure 2.9. Cityzen Sciences D-shirt
Another US company called “Sensatex” prepared the smart t-shirt for military usages. The
movement of the soldiers and clusters derived from accelerometer data can be used for better
arranging the task groups in the field.
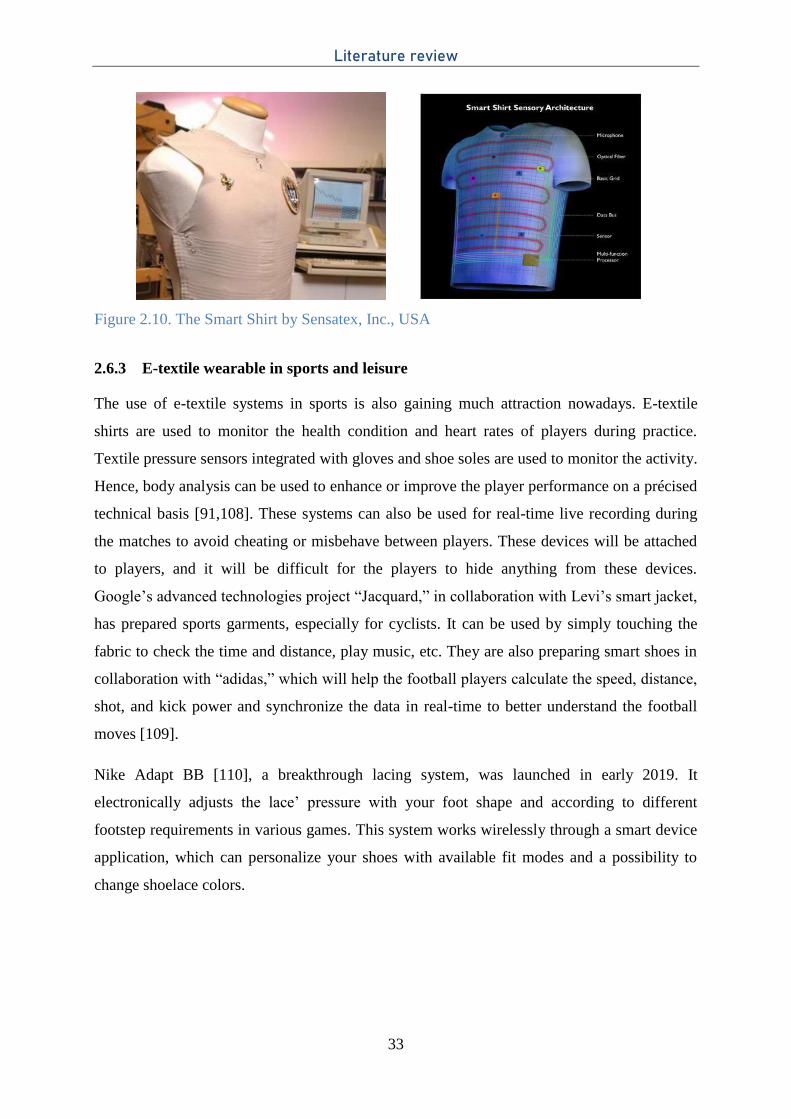
Literature review
33
Figure 2.10. The Smart Shirt by Sensatex, Inc., USA
2.6.3 E-textile wearable in sports and leisure
The use of e-textile systems in sports is also gaining much attraction nowadays. E-textile
shirts are used to monitor the health condition and heart rates of players during practice.
Textile pressure sensors integrated with gloves and shoe soles are used to monitor the activity.
Hence, body analysis can be used to enhance or improve the player performance on a précised
technical basis [91,108]. These systems can also be used for real-time live recording during
the matches to avoid cheating or misbehave between players. These devices will be attached
to players, and it will be difficult for the players to hide anything from these devices.
Google’s advanced technologies project “Jacquard,” in collaboration with Levi’s smart jacket,
has prepared sports garments, especially for cyclists. It can be used by simply touching the
fabric to check the time and distance, play music, etc. They are also preparing smart shoes in
collaboration with “adidas,” which will help the football players calculate the speed, distance,
shot, and kick power and synchronize the data in real-time to better understand the football
moves [109].
Nike Adapt BB [110], a breakthrough lacing system, was launched in early 2019. It
electronically adjusts the lace’ pressure with your foot shape and according to different
footstep requirements in various games. This system works wirelessly through a smart device
application, which can personalize your shoes with available fit modes and a possibility to
change shoelace colors.
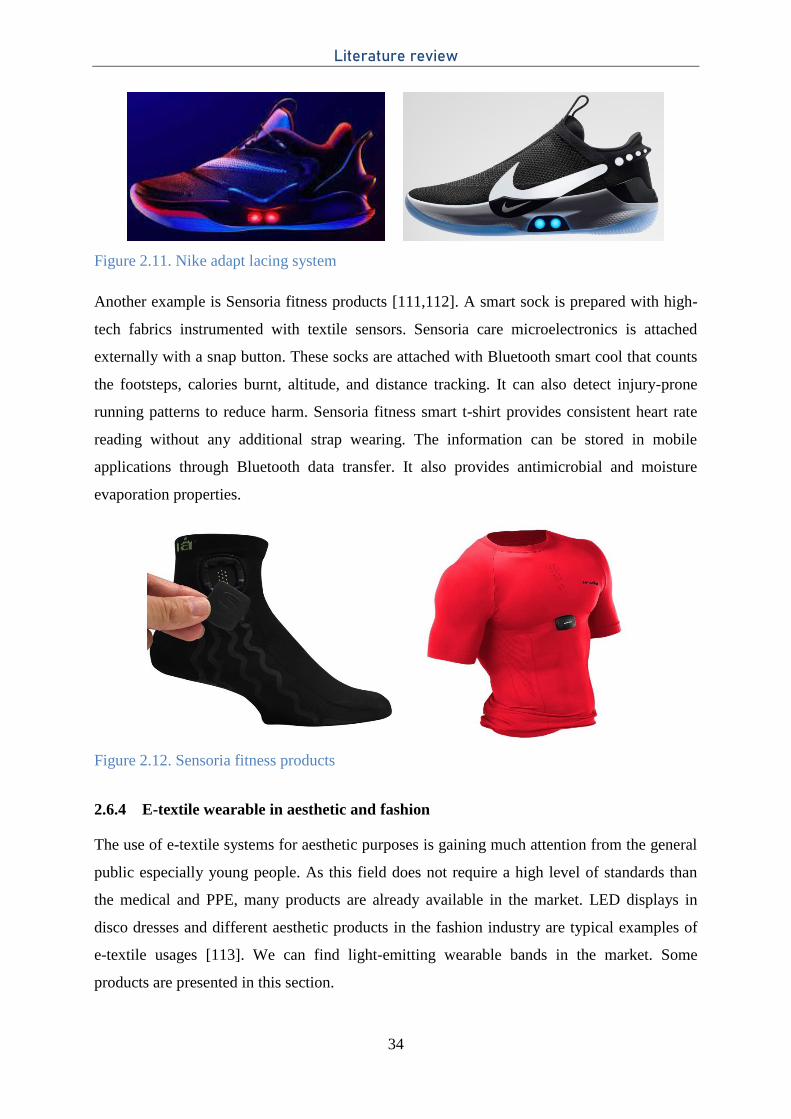
Literature review
34
Figure 2.11. Nike adapt lacing system
Another example is Sensoria fitness products [111,112]. A smart sock is prepared with high-
tech fabrics instrumented with textile sensors. Sensoria care microelectronics is attached
externally with a snap button. These socks are attached with Bluetooth smart cool that counts
the footsteps, calories burnt, altitude, and distance tracking. It can also detect injury-prone
running patterns to reduce harm. Sensoria fitness smart t-shirt provides consistent heart rate
reading without any additional strap wearing. The information can be stored in mobile
applications through Bluetooth data transfer. It also provides antimicrobial and moisture
evaporation properties.
Figure 2.12. Sensoria fitness products
2.6.4 E-textile wearable in aesthetic and fashion
The use of e-textile systems for aesthetic purposes is gaining much attention from the general
public especially young people. As this field does not require a high level of standards than
the medical and PPE, many products are already available in the market. LED displays in
disco dresses and different aesthetic products in the fashion industry are typical examples of
e-textile usages [113]. We can find light-emitting wearable bands in the market. Some
products are presented in this section.
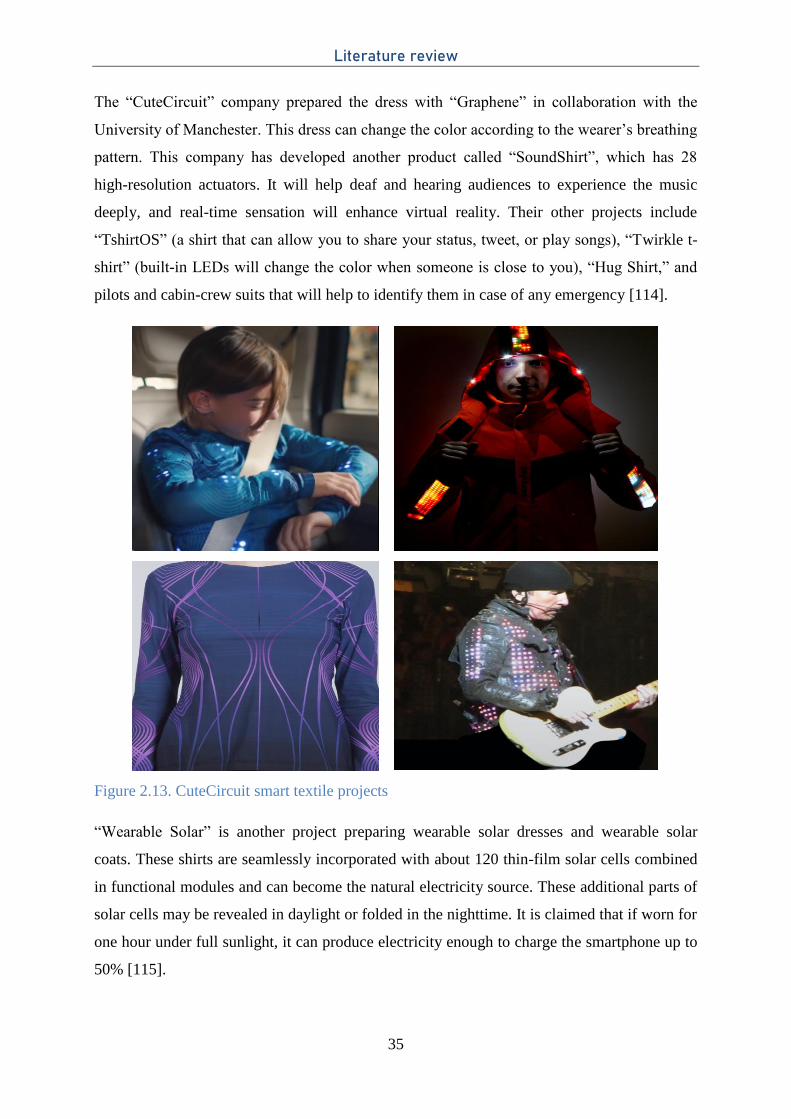
Literature review
35
The “CuteCircuit” company prepared the dress with “Graphene” in collaboration with the
University of Manchester. This dress can change the color according to the wearer’s breathing
pattern. This company has developed another product called “SoundShirt”, which has 28
high-resolution actuators. It will help deaf and hearing audiences to experience the music
deeply, and real-time sensation will enhance virtual reality. Their other projects include
“TshirtOS” (a shirt that can allow you to share your status, tweet, or play songs), “Twirkle t-
shirt” (built-in LEDs will change the color when someone is close to you), “Hug Shirt,” and
pilots and cabin-crew suits that will help to identify them in case of any emergency [114].
Figure 2.13. CuteCircuit smart textile projects
“Wearable Solar” is another project preparing wearable solar dresses and wearable solar
coats. These shirts are seamlessly incorporated with about 120 thin-film solar cells combined
in functional modules and can become the natural electricity source. These additional parts of
solar cells may be revealed in daylight or folded in the nighttime. It is claimed that if worn for
one hour under full sunlight, it can produce electricity enough to charge the smartphone up to
50% [115].
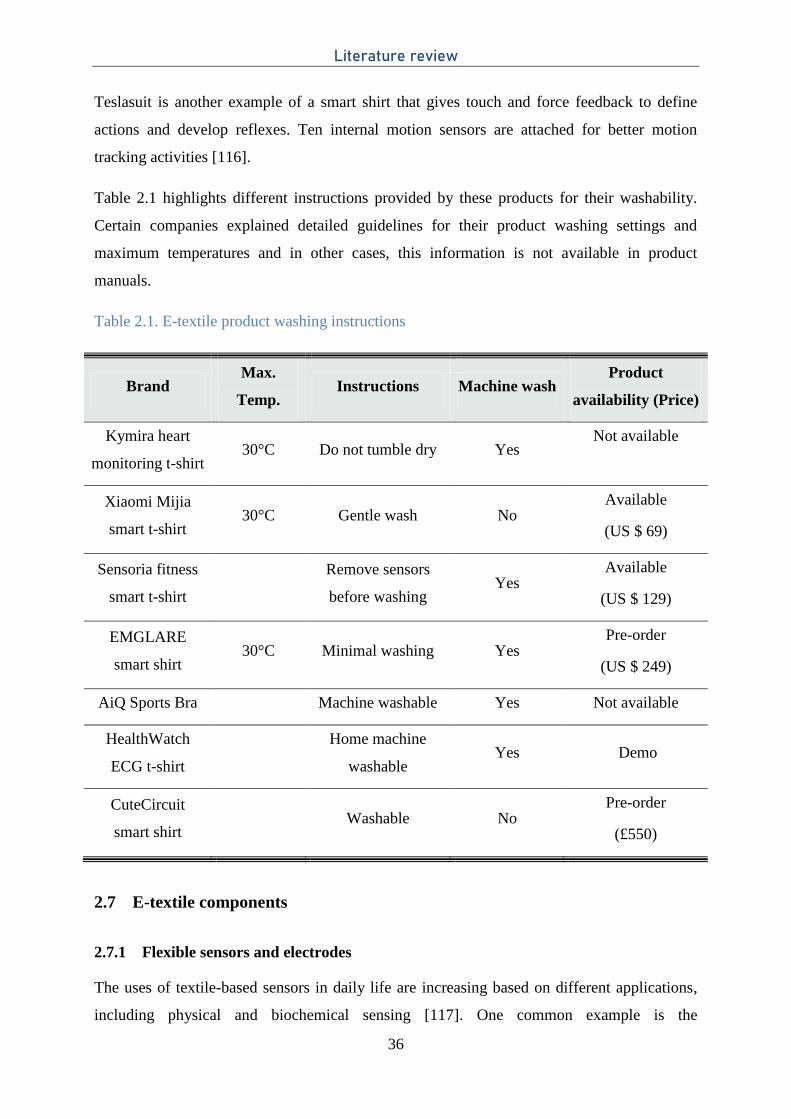
Literature review
36
Teslasuit is another example of a smart shirt that gives touch and force feedback to define
actions and develop reflexes. Ten internal motion sensors are attached for better motion
tracking activities [116].
Table 2.1 highlights different instructions provided by these products for their washability.
Certain companies explained detailed guidelines for their product washing settings and
maximum temperatures and in other cases, this information is not available in product
manuals.
Table 2.1. E-textile product washing instructions
Brand Max.
Temp. Instructions Machine wash
Product
availability (Price)
Kymira heart
monitoring t-shirt 30°C Do not tumble dry Yes
Not available
Xiaomi Mijia
smart t-shirt 30°C Gentle wash No
Available
(US $ 69)
Sensoria fitness
smart t-shirt
Remove sensors
before washing Yes
Available
(US $ 129)
EMGLARE
smart shirt 30°C Minimal washing Yes
Pre-order
(US $ 249)
AiQ Sports Bra Machine washable Yes Not available
HealthWatch
ECG t-shirt
Home machine
washable Yes Demo
CuteCircuit
smart shirt Washable No
Pre-order
(£550)
2.7 E-textile components
2.7.1 Flexible sensors and electrodes
The uses of textile-based sensors in daily life are increasing based on different applications,
including physical and biochemical sensing [117]. One common example is the
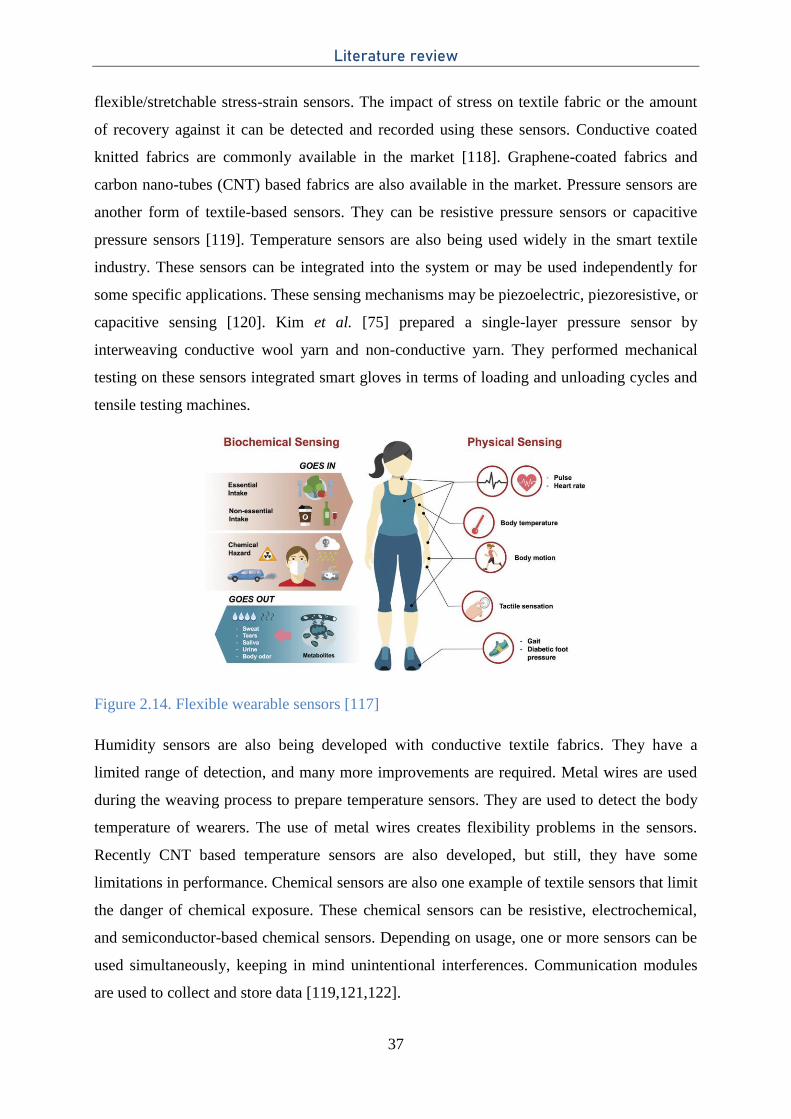
Literature review
37
flexible/stretchable stress-strain sensors. The impact of stress on textile fabric or the amount
of recovery against it can be detected and recorded using these sensors. Conductive coated
knitted fabrics are commonly available in the market [118]. Graphene-coated fabrics and
carbon nano-tubes (CNT) based fabrics are also available in the market. Pressure sensors are
another form of textile-based sensors. They can be resistive pressure sensors or capacitive
pressure sensors [119]. Temperature sensors are also being used widely in the smart textile
industry. These sensors can be integrated into the system or may be used independently for
some specific applications. These sensing mechanisms may be piezoelectric, piezoresistive, or
capacitive sensing [120]. Kim et al. [75] prepared a single-layer pressure sensor by
interweaving conductive wool yarn and non-conductive yarn. They performed mechanical
testing on these sensors integrated smart gloves in terms of loading and unloading cycles and
tensile testing machines.
Figure 2.14. Flexible wearable sensors [117]
Humidity sensors are also being developed with conductive textile fabrics. They have a
limited range of detection, and many more improvements are required. Metal wires are used
during the weaving process to prepare temperature sensors. They are used to detect the body
temperature of wearers. The use of metal wires creates flexibility problems in the sensors.
Recently CNT based temperature sensors are also developed, but still, they have some
limitations in performance. Chemical sensors are also one example of textile sensors that limit
the danger of chemical exposure. These chemical sensors can be resistive, electrochemical,
and semiconductor-based chemical sensors. Depending on usage, one or more sensors can be
used simultaneously, keeping in mind unintentional interferences. Communication modules
are used to collect and store data [119,121,122].
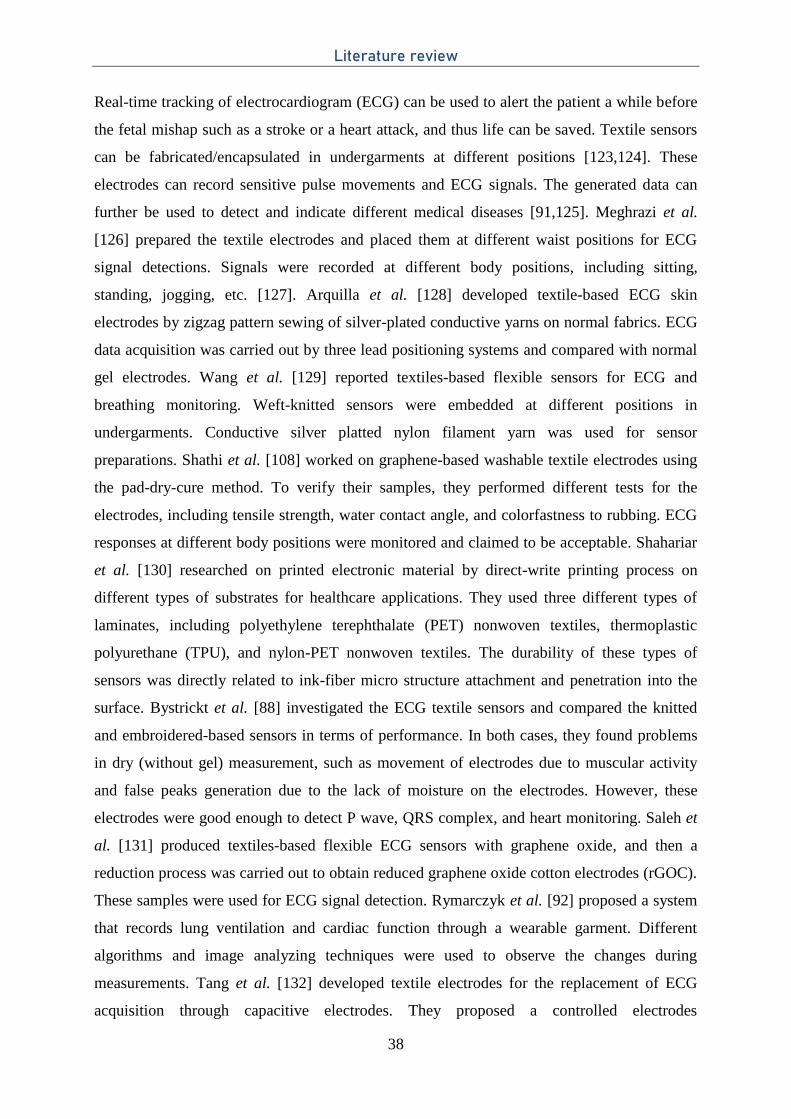
Literature review
38
Real-time tracking of electrocardiogram (ECG) can be used to alert the patient a while before
the fetal mishap such as a stroke or a heart attack, and thus life can be saved. Textile sensors
can be fabricated/encapsulated in undergarments at different positions [123,124]. These
electrodes can record sensitive pulse movements and ECG signals. The generated data can
further be used to detect and indicate different medical diseases [91,125]. Meghrazi et al.
[126] prepared the textile electrodes and placed them at different waist positions for ECG
signal detections. Signals were recorded at different body positions, including sitting,
standing, jogging, etc. [127]. Arquilla et al. [128] developed textile-based ECG skin
electrodes by zigzag pattern sewing of silver-plated conductive yarns on normal fabrics. ECG
data acquisition was carried out by three lead positioning systems and compared with normal
gel electrodes. Wang et al. [129] reported textiles-based flexible sensors for ECG and
breathing monitoring. Weft-knitted sensors were embedded at different positions in
undergarments. Conductive silver platted nylon filament yarn was used for sensor
preparations. Shathi et al. [108] worked on graphene-based washable textile electrodes using
the pad-dry-cure method. To verify their samples, they performed different tests for the
electrodes, including tensile strength, water contact angle, and colorfastness to rubbing. ECG
responses at different body positions were monitored and claimed to be acceptable. Shahariar
et al. [130] researched on printed electronic material by direct-write printing process on
different types of substrates for healthcare applications. They used three different types of
laminates, including polyethylene terephthalate (PET) nonwoven textiles, thermoplastic
polyurethane (TPU), and nylon-PET nonwoven textiles. The durability of these types of
sensors was directly related to ink-fiber micro structure attachment and penetration into the
surface. Bystrickt et al. [88] investigated the ECG textile sensors and compared the knitted
and embroidered-based sensors in terms of performance. In both cases, they found problems
in dry (without gel) measurement, such as movement of electrodes due to muscular activity
and false peaks generation due to the lack of moisture on the electrodes. However, these
electrodes were good enough to detect P wave, QRS complex, and heart monitoring. Saleh et
al. [131] produced textiles-based flexible ECG sensors with graphene oxide, and then a
reduction process was carried out to obtain reduced graphene oxide cotton electrodes (rGOC).
These samples were used for ECG signal detection. Rymarczyk et al. [92] proposed a system
that records lung ventilation and cardiac function through a wearable garment. Different
algorithms and image analyzing techniques were used to observe the changes during
measurements. Tang et al. [132] developed textile electrodes for the replacement of ECG
acquisition through capacitive electrodes. They proposed a controlled electrodes
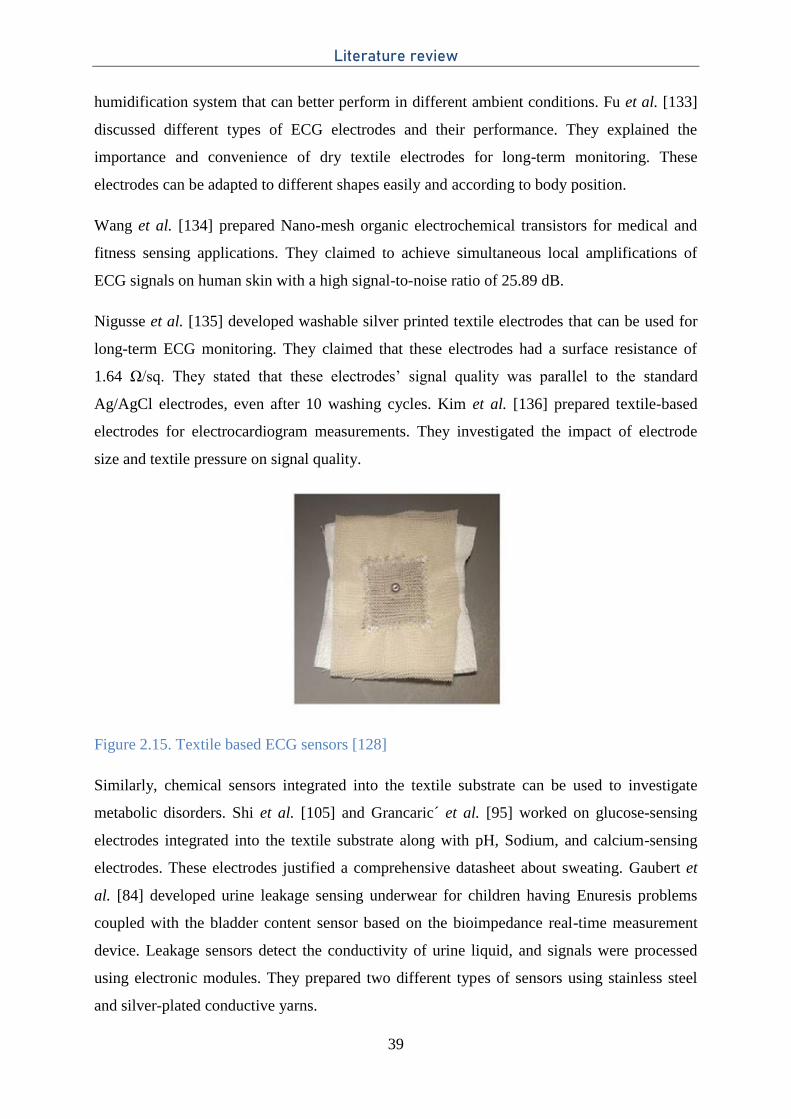
Literature review
39
humidification system that can better perform in different ambient conditions. Fu et al. [133]
discussed different types of ECG electrodes and their performance. They explained the
importance and convenience of dry textile electrodes for long-term monitoring. These
electrodes can be adapted to different shapes easily and according to body position.
Wang et al. [134] prepared Nano-mesh organic electrochemical transistors for medical and
fitness sensing applications. They claimed to achieve simultaneous local amplifications of
ECG signals on human skin with a high signal-to-noise ratio of 25.89 dB.
Nigusse et al. [135] developed washable silver printed textile electrodes that can be used for
long-term ECG monitoring. They claimed that these electrodes had a surface resistance of
1.64 Ω/sq. They stated that these electrodes’ signal quality was parallel to the standard
Ag/AgCl electrodes, even after 10 washing cycles. Kim et al. [136] prepared textile-based
electrodes for electrocardiogram measurements. They investigated the impact of electrode
size and textile pressure on signal quality.
Figure 2.15. Textile based ECG sensors [128]
Similarly, chemical sensors integrated into the textile substrate can be used to investigate
metabolic disorders. Shi et al. [105] and Grancaric´ et al. [95] worked on glucose-sensing
electrodes integrated into the textile substrate along with pH, Sodium, and calcium-sensing
electrodes. These electrodes justified a comprehensive datasheet about sweating. Gaubert et
al. [84] developed urine leakage sensing underwear for children having Enuresis problems
coupled with the bladder content sensor based on the bioimpedance real-time measurement
device. Leakage sensors detect the conductivity of urine liquid, and signals were processed
using electronic modules. They prepared two different types of sensors using stainless steel
and silver-plated conductive yarns.
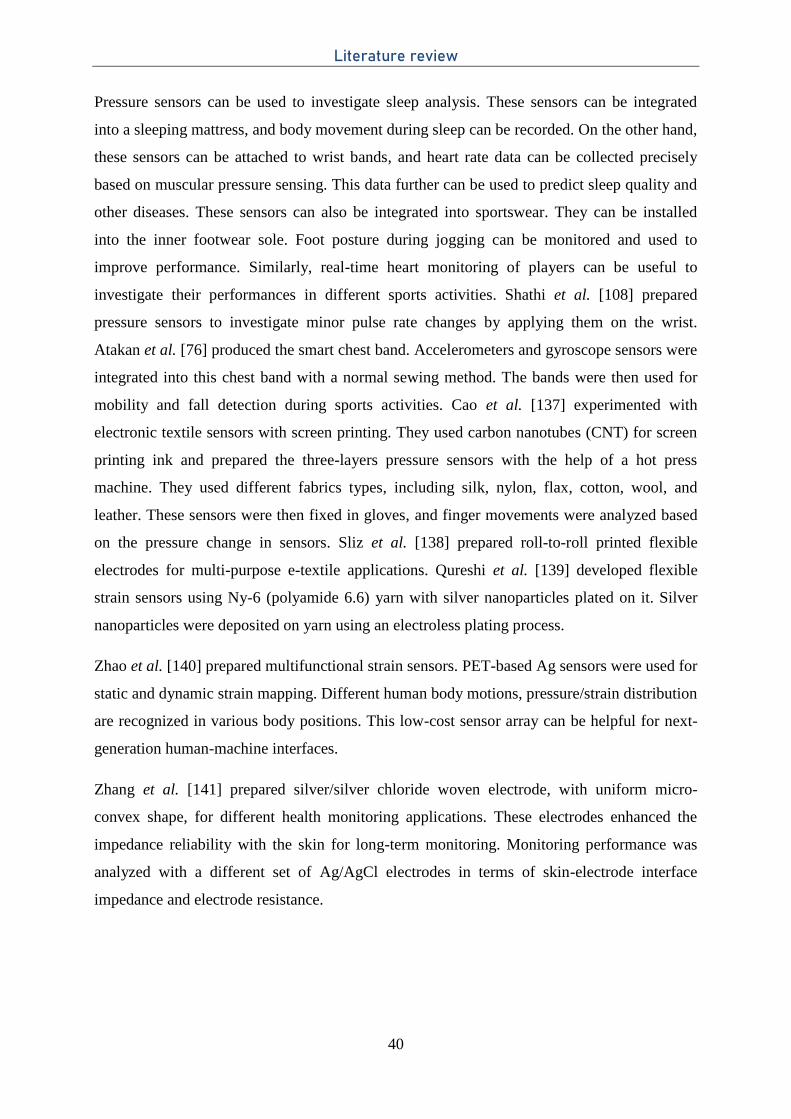
Literature review
40
Pressure sensors can be used to investigate sleep analysis. These sensors can be integrated
into a sleeping mattress, and body movement during sleep can be recorded. On the other hand,
these sensors can be attached to wrist bands, and heart rate data can be collected precisely
based on muscular pressure sensing. This data further can be used to predict sleep quality and
other diseases. These sensors can also be integrated into sportswear. They can be installed
into the inner footwear sole. Foot posture during jogging can be monitored and used to
improve performance. Similarly, real-time heart monitoring of players can be useful to
investigate their performances in different sports activities. Shathi et al. [108] prepared
pressure sensors to investigate minor pulse rate changes by applying them on the wrist.
Atakan et al. [76] produced the smart chest band. Accelerometers and gyroscope sensors were
integrated into this chest band with a normal sewing method. The bands were then used for
mobility and fall detection during sports activities. Cao et al. [137] experimented with
electronic textile sensors with screen printing. They used carbon nanotubes (CNT) for screen
printing ink and prepared the three-layers pressure sensors with the help of a hot press
machine. They used different fabrics types, including silk, nylon, flax, cotton, wool, and
leather. These sensors were then fixed in gloves, and finger movements were analyzed based
on the pressure change in sensors. Sliz et al. [138] prepared roll-to-roll printed flexible
electrodes for multi-purpose e-textile applications. Qureshi et al. [139] developed flexible
strain sensors using Ny-6 (polyamide 6.6) yarn with silver nanoparticles plated on it. Silver
nanoparticles were deposited on yarn using an electroless plating process.
Zhao et al. [140] prepared multifunctional strain sensors. PET-based Ag sensors were used for
static and dynamic strain mapping. Different human body motions, pressure/strain distribution
are recognized in various body positions. This low-cost sensor array can be helpful for next-
generation human-machine interfaces.
Zhang et al. [141] prepared silver/silver chloride woven electrode, with uniform micro-
convex shape, for different health monitoring applications. These electrodes enhanced the
impedance reliability with the skin for long-term monitoring. Monitoring performance was
analyzed with a different set of Ag/AgCl electrodes in terms of skin-electrode interface
impedance and electrode resistance.
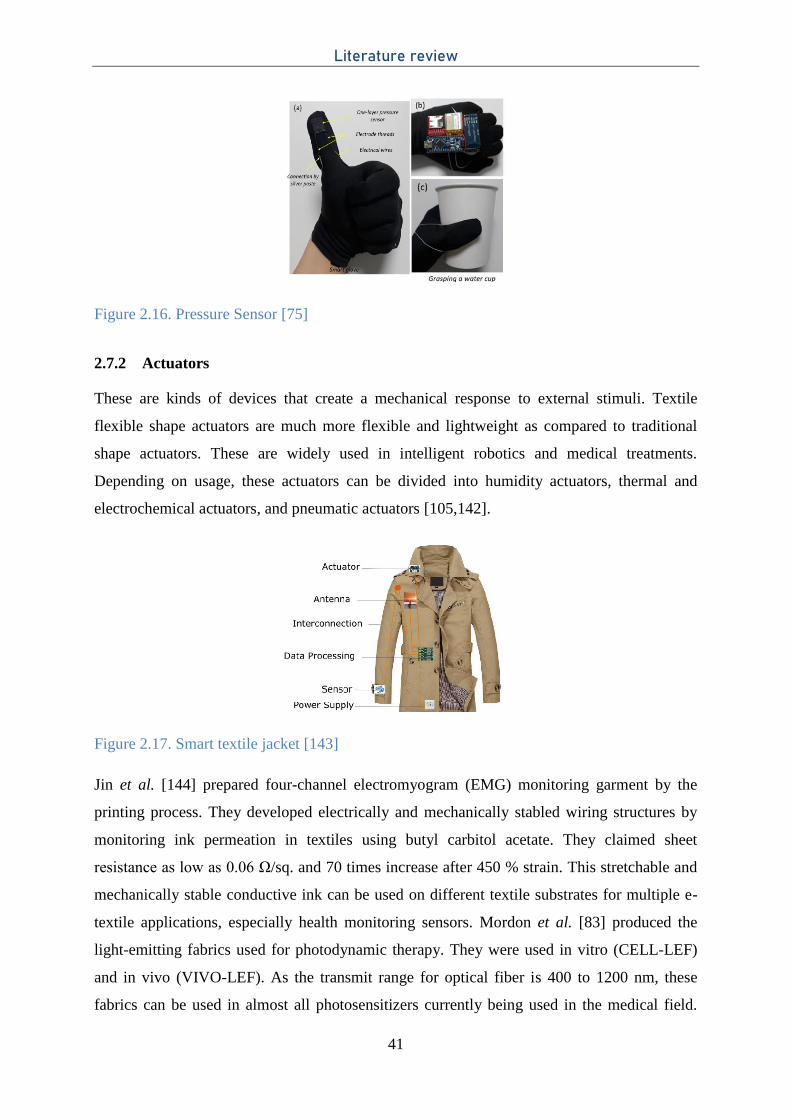
Literature review
41
Figure 2.16. Pressure Sensor [75]
2.7.2 Actuators
These are kinds of devices that create a mechanical response to external stimuli. Textile
flexible shape actuators are much more flexible and lightweight as compared to traditional
shape actuators. These are widely used in intelligent robotics and medical treatments.
Depending on usage, these actuators can be divided into humidity actuators, thermal and
electrochemical actuators, and pneumatic actuators [105,142].
Figure 2.17. Smart textile jacket [143]
Jin et al. [144] prepared four-channel electromyogram (EMG) monitoring garment by the
printing process. They developed electrically and mechanically stabled wiring structures by
monitoring ink permeation in textiles using butyl carbitol acetate. They claimed sheet
resistance as low as 0.06 Ω/sq. and 70 times increase after 450 % strain. This stretchable and
mechanically stable conductive ink can be used on different textile substrates for multiple e-
textile applications, especially health monitoring sensors. Mordon et al. [83] produced the
light-emitting fabrics used for photodynamic therapy. They were used in vitro (CELL-LEF)
and in vivo (VIVO-LEF). As the transmit range for optical fiber is 400 to 1200 nm, these
fabrics can be used in almost all photosensitizers currently being used in the medical field.
Literature review
42
Ryan et al. [145] and Yu et al. [146] prepared PEDOT: PSS coated fibers that can change
shape on external stimuli. Logothetis et al. [147] reported silver-plated e-textiles electrodes
for bioelectrical impedance analysis. The electrodes contain three different materials,
including silver plated thread, PES thread, and substrate. Cotton and polyester substrate with
different weaving techniques were used. The e-textiles were tested under different ambient
conditions, and a change in resistance was calculated.
Koo et al. [148] prepared an innovative tactile display device based on soft actuator
technology with the help of electroactive polymers. They claimed high flexibility, simple
manufacturing, and better simulation with human skin as the important advantages for this
device. But an extra protective layer is required for the safety of the actuator unit.
Likewise, motion sensors can be integrated into the textile substrate. Motion and strain
sensing gloves are available in the markets. These gloves can precisely detect the motion of
arms and fingers. LED displays can further be attached to these motion sensors, and thus
different motions can be highlighted with different colors on the textiles. One good example
can be traffic control officers. They can use their arm positions to blink different colors on
their jackets, and these signals can be seen from a distance. These sensors can also be used in
hospitals to detect patient movement either through their hospital gowns or through
centralized display in nurse restrooms. Kim et al. [75] produced single-layer pressure sensors
with conductive wool yarn. Gloves with encapsulated sensors at different finger positions
were prepared. Change in resistance with finger movements was recorded. Afroj et al. [149]
investigated graphene-based electronic textiles that can be used in ultra-flexible
supercapacitor and skin-mounted strain sensors. Graphene was encapsulated on textiles with a
scalable pad-dry-cure method and claimed surface resistance was 11.9 Ω /sq. Danova et al.
[150] worked on piezo-resistive elastic sensors for human breath analysis. They prepared a
commercially available t-shirt integrated with piezo-resistive elastic sensors prepared by
purified multiwall carbon nanotubes (MWCNTs) network synthesized with the help of a
chemical vapor deposition method and encapsulated by elastic silicon. Abed et al. [74]
prepared a piezoelectric sensor based on natural sisal fiber. The conductive layer on these
fibers is obtained by PEDOT: PSS coating on it. These sensors can be helpful in 3D interlock
fabric for monitoring the stress and elongation into the structure.
Literature review
43
2.7.3 Antennas
Currently, wireless communication is gaining much interest. Antennas are important
components of wireless communication devices. For electronic wearable textiles, the antennas
should also be flexible and properly integrated into wearable textiles [151,152]. Different
types of antennas are being developed for wearable and stretchable applications. They include
organic paper-based antennas, flexible optically transparent antennas, Printed magnetic
conductive antennas, circularly polarized wearable antennas, and textile-based Rectennas
[153]. Apart from communication, antennas can also be used for energy harvesting and
energy transfer. Shi et al. [105] developed the antennas having a triple band feature. They are
suitable for communication systems and military usages, but they face problems in terms of
proximity to the human body. Garnier et al. [154] prepared NFC textile antennas with highly
conductive yarn. These antennas can be used with mobile NFC powers to transmit the data or
energy to the source (Figure 2.18).
Lee et al. [155] prepared textile antennas with screen printing using flat yarn PET fabric as
the substrate. They claimed to achieve sheet resistance in the range of 16 mΩ/sq. These
antennas were designed to work at 2.4 GHz, largely used for local area networks. The textile
antennas were analyzed with different printing layers and the impact of the layer’s uniformity.
Guibert et al. [156] developed flexible textile antennas for wearable RFID applications. They
used different techniques, including embroidery, painted, and electro-textile for antenna
manufacturing. Reliability of RFID tags was performed with moisture testing by dipping the
samples in the tap water for an hour and then washing them in the domestic washing machine.
Kazani et al. [157] used conductive-based ink for screen printing in textile antennas. They
prepared antennas based on the 2.5-D EM field simulator Momentum of Agilent’s Advanced
Design System (ADS) by using Acheson and Dupont inks. Two types of substrates, 100 %
polyester and (20/80 %) cotton/polyester, were used in these experiments. Then, the antennas
were covered with a TPU layer to protect them during washing. They washed all these
samples at 40oC for five washing cycles, and finally, the reflection coefficient and the
radiation efficiency were measured. They claimed that all antennas showed stable
performance after five washing cycles.
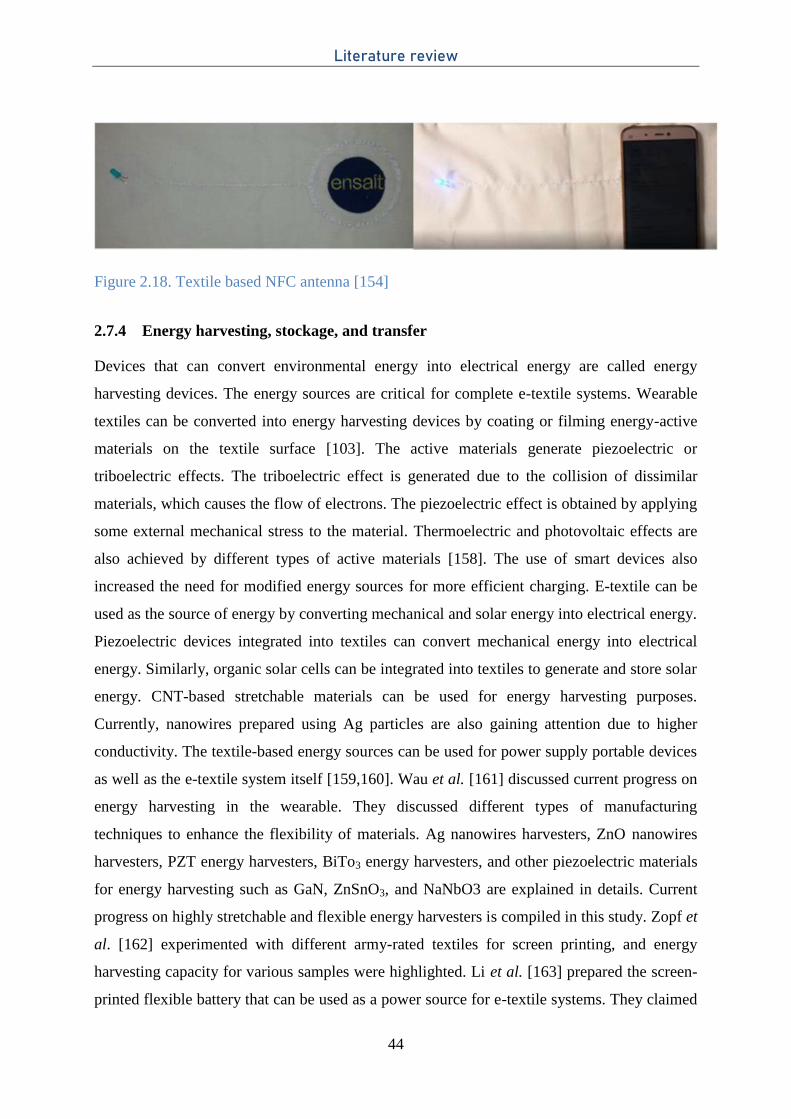
Literature review
44
Figure 2.18. Textile based NFC antenna [154]
2.7.4 Energy harvesting, stockage, and transfer
Devices that can convert environmental energy into electrical energy are called energy
harvesting devices. The energy sources are critical for complete e-textile systems. Wearable
textiles can be converted into energy harvesting devices by coating or filming energy-active
materials on the textile surface [103]. The active materials generate piezoelectric or
triboelectric effects. The triboelectric effect is generated due to the collision of dissimilar
materials, which causes the flow of electrons. The piezoelectric effect is obtained by applying
some external mechanical stress to the material. Thermoelectric and photovoltaic effects are
also achieved by different types of active materials [158]. The use of smart devices also
increased the need for modified energy sources for more efficient charging. E-textile can be
used as the source of energy by converting mechanical and solar energy into electrical energy.
Piezoelectric devices integrated into textiles can convert mechanical energy into electrical
energy. Similarly, organic solar cells can be integrated into textiles to generate and store solar
energy. CNT-based stretchable materials can be used for energy harvesting purposes.
Currently, nanowires prepared using Ag particles are also gaining attention due to higher
conductivity. The textile-based energy sources can be used for power supply portable devices
as well as the e-textile system itself [159,160]. Wau et al. [161] discussed current progress on
energy harvesting in the wearable. They discussed different types of manufacturing
techniques to enhance the flexibility of materials. Ag nanowires harvesters, ZnO nanowires
harvesters, PZT energy harvesters, BiTo3 energy harvesters, and other piezoelectric materials
for energy harvesting such as GaN, ZnSnO3, and NaNbO3 are explained in details. Current
progress on highly stretchable and flexible energy harvesters is compiled in this study. Zopf et
al. [162] experimented with different army-rated textiles for screen printing, and energy
harvesting capacity for various samples were highlighted. Li et al. [163] prepared the screen-
printed flexible battery that can be used as a power source for e-textile systems. They claimed
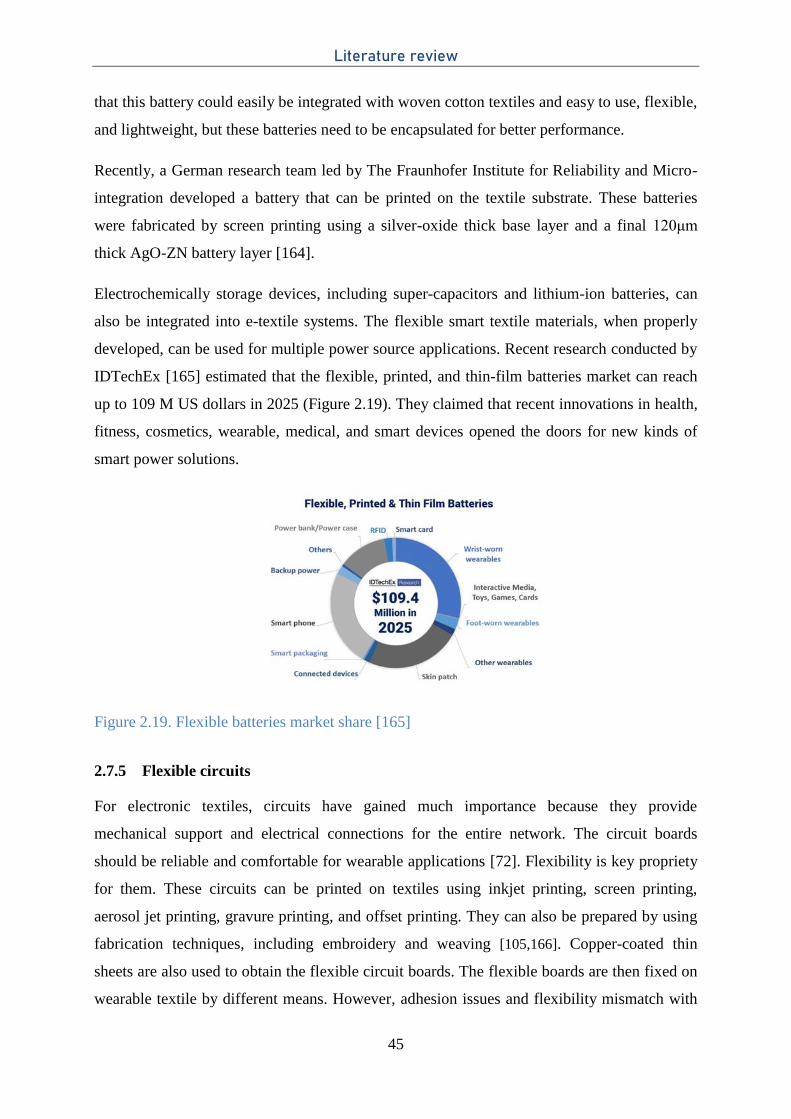
Literature review
45
that this battery could easily be integrated with woven cotton textiles and easy to use, flexible,
and lightweight, but these batteries need to be encapsulated for better performance.
Recently, a German research team led by The Fraunhofer Institute for Reliability and Micro-
integration developed a battery that can be printed on the textile substrate. These batteries
were fabricated by screen printing using a silver-oxide thick base layer and a final 120μm
thick AgO-ZN battery layer [164].
Electrochemically storage devices, including super-capacitors and lithium-ion batteries, can
also be integrated into e-textile systems. The flexible smart textile materials, when properly
developed, can be used for multiple power source applications. Recent research conducted by
IDTechEx [165] estimated that the flexible, printed, and thin-film batteries market can reach
up to 109 M US dollars in 2025 (Figure 2.19). They claimed that recent innovations in health,
fitness, cosmetics, wearable, medical, and smart devices opened the doors for new kinds of
smart power solutions.
Figure 2.19. Flexible batteries market share [165]
2.7.5 Flexible circuits
For electronic textiles, circuits have gained much importance because they provide
mechanical support and electrical connections for the entire network. The circuit boards
should be reliable and comfortable for wearable applications [72]. Flexibility is key propriety
for them. These circuits can be printed on textiles using inkjet printing, screen printing,
aerosol jet printing, gravure printing, and offset printing. They can also be prepared by using
fabrication techniques, including embroidery and weaving [105,166]. Copper-coated thin
sheets are also used to obtain the flexible circuit boards. The flexible boards are then fixed on
wearable textile by different means. However, adhesion issues and flexibility mismatch with
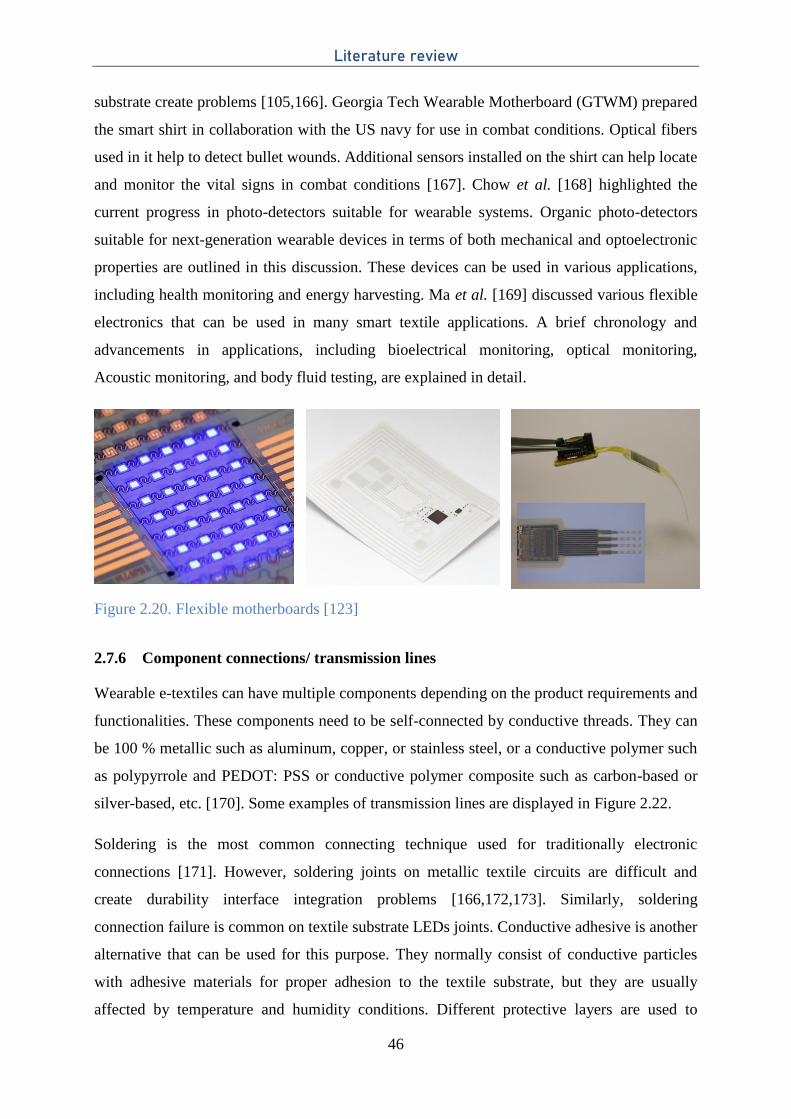
Literature review
46
substrate create problems [105,166]. Georgia Tech Wearable Motherboard (GTWM) prepared
the smart shirt in collaboration with the US navy for use in combat conditions. Optical fibers
used in it help to detect bullet wounds. Additional sensors installed on the shirt can help locate
and monitor the vital signs in combat conditions [167]. Chow et al. [168] highlighted the
current progress in photo-detectors suitable for wearable systems. Organic photo-detectors
suitable for next-generation wearable devices in terms of both mechanical and optoelectronic
properties are outlined in this discussion. These devices can be used in various applications,
including health monitoring and energy harvesting. Ma et al. [169] discussed various flexible
electronics that can be used in many smart textile applications. A brief chronology and
advancements in applications, including bioelectrical monitoring, optical monitoring,
Acoustic monitoring, and body fluid testing, are explained in detail.
Figure 2.20. Flexible motherboards [123]
2.7.6 Component connections/ transmission lines
Wearable e-textiles can have multiple components depending on the product requirements and
functionalities. These components need to be self-connected by conductive threads. They can
be 100 % metallic such as aluminum, copper, or stainless steel, or a conductive polymer such
as polypyrrole and PEDOT: PSS or conductive polymer composite such as carbon-based or
silver-based, etc. [170]. Some examples of transmission lines are displayed in Figure 2.22.
Soldering is the most common connecting technique used for traditionally electronic
connections [171]. However, soldering joints on metallic textile circuits are difficult and
create durability interface integration problems [166,172,173]. Similarly, soldering
connection failure is common on textile substrate LEDs joints. Conductive adhesive is another
alternative that can be used for this purpose. They normally consist of conductive particles
with adhesive materials for proper adhesion to the textile substrate, but they are usually
affected by temperature and humidity conditions. Different protective layers are used to
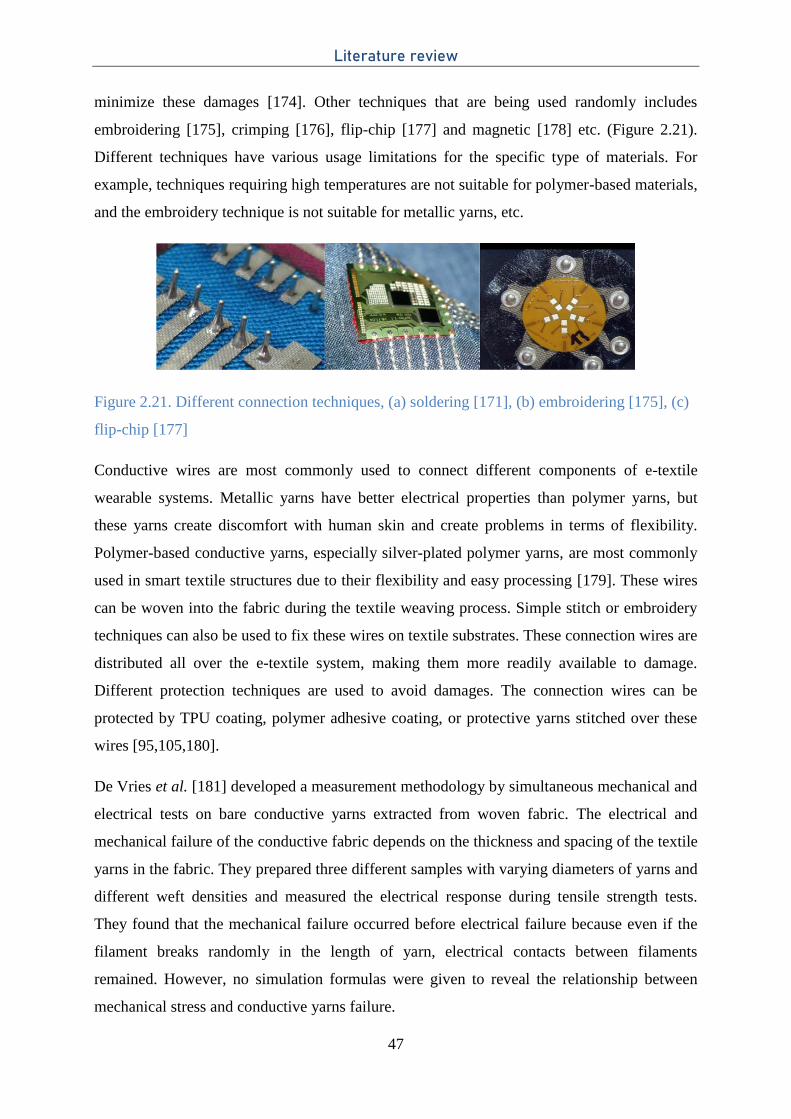
Literature review
47
minimize these damages [174]. Other techniques that are being used randomly includes
embroidering [175], crimping [176], flip-chip [177] and magnetic [178] etc. (Figure 2.21).
Different techniques have various usage limitations for the specific type of materials. For
example, techniques requiring high temperatures are not suitable for polymer-based materials,
and the embroidery technique is not suitable for metallic yarns, etc.
Figure 2.21. Different connection techniques, (a) soldering [171], (b) embroidering [175], (c)
flip-chip [177]
Conductive wires are most commonly used to connect different components of e-textile
wearable systems. Metallic yarns have better electrical properties than polymer yarns, but
these yarns create discomfort with human skin and create problems in terms of flexibility.
Polymer-based conductive yarns, especially silver-plated polymer yarns, are most commonly
used in smart textile structures due to their flexibility and easy processing [179]. These wires
can be woven into the fabric during the textile weaving process. Simple stitch or embroidery
techniques can also be used to fix these wires on textile substrates. These connection wires are
distributed all over the e-textile system, making them more readily available to damage.
Different protection techniques are used to avoid damages. The connection wires can be
protected by TPU coating, polymer adhesive coating, or protective yarns stitched over these
wires [95,105,180].
De Vries et al. [181] developed a measurement methodology by simultaneous mechanical and
electrical tests on bare conductive yarns extracted from woven fabric. The electrical and
mechanical failure of the conductive fabric depends on the thickness and spacing of the textile
yarns in the fabric. They prepared three different samples with varying diameters of yarns and
different weft densities and measured the electrical response during tensile strength tests.
They found that the mechanical failure occurred before electrical failure because even if the
filament breaks randomly in the length of yarn, electrical contacts between filaments
remained. However, no simulation formulas were given to reveal the relationship between
mechanical stress and conductive yarns failure.
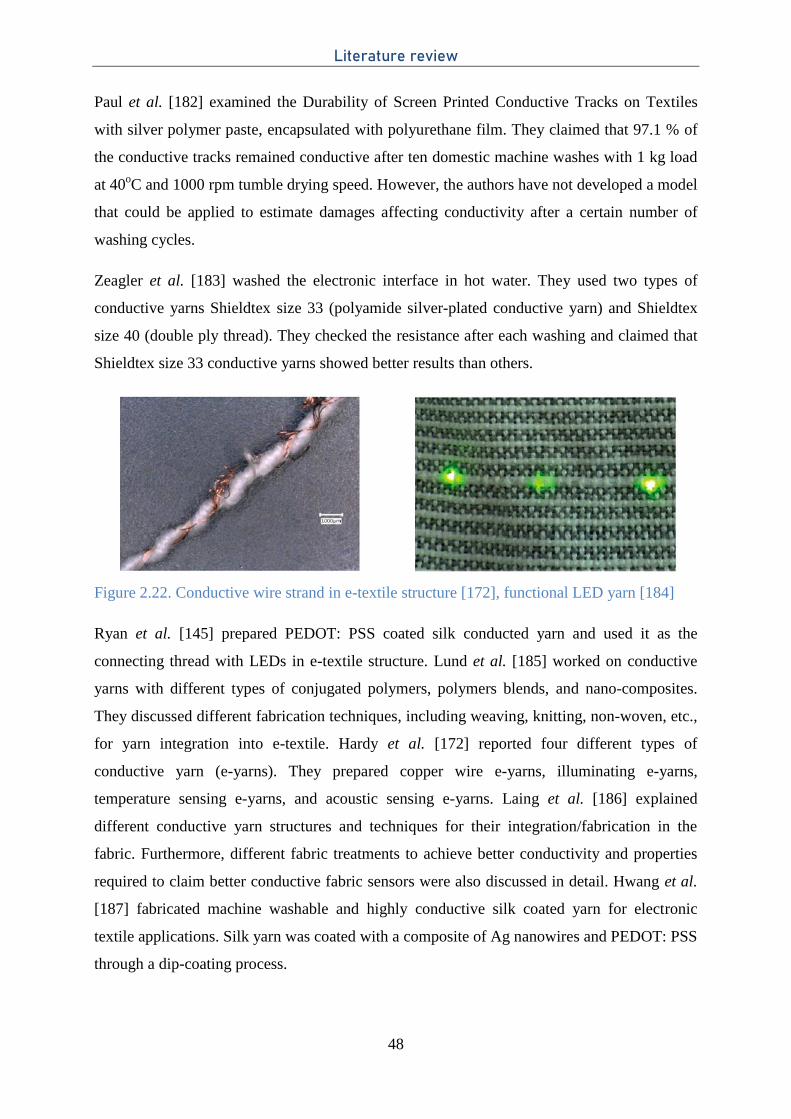
Literature review
48
Paul et al. [182] examined the Durability of Screen Printed Conductive Tracks on Textiles
with silver polymer paste, encapsulated with polyurethane film. They claimed that 97.1 % of
the conductive tracks remained conductive after ten domestic machine washes with 1 kg load
at 40oC and 1000 rpm tumble drying speed. However, the authors have not developed a model
that could be applied to estimate damages affecting conductivity after a certain number of
washing cycles.
Zeagler et al. [183] washed the electronic interface in hot water. They used two types of
conductive yarns Shieldtex size 33 (polyamide silver-plated conductive yarn) and Shieldtex
size 40 (double ply thread). They checked the resistance after each washing and claimed that
Shieldtex size 33 conductive yarns showed better results than others.
Figure 2.22. Conductive wire strand in e-textile structure [172], functional LED yarn [184]
Ryan et al. [145] prepared PEDOT: PSS coated silk conducted yarn and used it as the
connecting thread with LEDs in e-textile structure. Lund et al. [185] worked on conductive
yarns with different types of conjugated polymers, polymers blends, and nano-composites.
They discussed different fabrication techniques, including weaving, knitting, non-woven, etc.,
for yarn integration into e-textile. Hardy et al. [172] reported four different types of
conductive yarn (e-yarns). They prepared copper wire e-yarns, illuminating e-yarns,
temperature sensing e-yarns, and acoustic sensing e-yarns. Laing et al. [186] explained
different conductive yarn structures and techniques for their integration/fabrication in the
fabric. Furthermore, different fabric treatments to achieve better conductivity and properties
required to claim better conductive fabric sensors were also discussed in detail. Hwang et al.
[187] fabricated machine washable and highly conductive silk coated yarn for electronic
textile applications. Silk yarn was coated with a composite of Ag nanowires and PEDOT: PSS
through a dip-coating process.
Literature review
49
2.8 Washability
Washability and reliability are major issues wearable textiles are facing nowadays [188–190].
Various prototypes are available in the market, and they are much successful in meeting the
user requirements, but these products lack in terms of washability and wash reliability. Wash
reliability depends on the proper functioning of the complete e-textile system after the pre-
described number of wash cycles. Different standards are available for textile wash protocols,
but they cannot work for e-textile products. Special precautions should be adopted for
electronic textile washability [191,192].
To work on electronic textile wash issues, it is important first to analyze the wash procedure
and then prepare requirements that should be followed for this wash process. Almost every
household has a domestic wash machine, and it is not feasible to convince customers to buy a
separate machine for e-textile washing. These hybrid products should be adopted for the
currently available wash machine for routine household wash process.
Several research groups are working on e-textiles prototypes, and we can see so many
valuable products depending on requirements. There are no standards available for
washability and reliability for e-textile products. That’s why various groups used their locally
available wash processes to claim washability. Similarly, different people used different
temperatures and speed settings to wash their samples. Diverse research articles found
claiming the washability of their products for a different number of wash cycles. Some used
laboratory-based wash machines, and some preferred user-oriented wash processes.
Ryan et al. [145] worked with a household wash machine to wash dyed silk yarn samples.
These samples were washed at 30°C and 900 rpm up to four wash cycles. Kim et al. [15] used
a mini wash machine to wash textile sensors up to 50 wash cycles. Gaubert et al. [84]
prepared urine leakage sensors encapsulated into underwear and washed these sensors in the
household machine for 20 wash cycles. Cao et al. [137] developed electronic textile sensors
with screen printing and claimed washability after immersing in water for 15 hours. Afroj et
al. [149] investigated graphene-based electronic textiles and washed them up to 10 house-held
wash cycles using AATCC 105 standards and claimed no change after these washes. Jin et al.
[144] produced a multilayer color coated e-textile and washed them for 50 wash cycles
following AATCC 135. Hardy et al. [172] checked the washing behavior of conductive yarns.
They used a household machine for 25 wash cycles by following ISO 6330 wash standards.
Shahariar et al. [130] prepared printed electronic material by direct-write printing process on
Literature review
50
different types of substrates. These samples were washed for 25 wash cycles according to
AATCC 61-2a. Hwang et al. [187] claimed machine washable highly conductive silk coated
yarn for electronic textile applications. They washed the prototypes for 10 wash cycles, but no
further details are explained. Salavagione et al. [193] investigated conductive smart textiles
with graphene-based coating on the textile and washed them for 10 wash cycles, but here
again, no further explanation is provided. Gaubert et al. [93] observed the washing behavior
of silver-plated nylon yarn. The effects of bleaching agents on the morphology of silver
coating and loss of conductivity after certain wash cycles were discussed. These yarns were
investigated in household machines according to AATCC 135 standards. 30 wash cycles, with
a 60 min process for each cycle with 900 rpm speed and 30°C temperature, were used for this
experiment. Sliz et al. [138] checked roll-to-roll printed flexible electrodes for multi-purpose
e-textile applications. The mechanical behavior and wash properties of these electrodes were
investigated. They were washed at 40°C for 63 minutes and up to 10 wash cycles at 1000 rpm
in a normal household machine. Saleh et al. [131] produced textiles-based flexible ECG
sensors with graphene oxide and then a reduction process was carried out to obtain reduced
graphene oxide cotton electrodes (rGOC). The conductivity of these electrodes was above 70
% of the original value after 5 wash cycles. But again, no further details about the wash
process were provided. Liang et al. [194] developed different types of textile stretch sensors.
A washability test was performed for these samples in a front load washing machine for 3
washing cycles according to ISO 6330:2012 test protocols. Kellomäki et al. [152] developed
washable RFID antennas for tagging and washed them for laundry tests. These samples were
washed for 10 washing cycles with 1000 rpm spin speed and 40°C washing temperature.
Table 2.2 explains the different researchers’ approaches to the wash process. As no
standardized process is available, each experiment is performed based on feasibility. Hence,
each claim of washable and reliable e-textile is based on different scenarios, and in some
cases, no data regarding wash parameters are communicated. To obtain a centralized
statement and commercially accepted washable e-textile products, they should be claimed
washable and reliable based on the standardized functionality test and wash protocols.
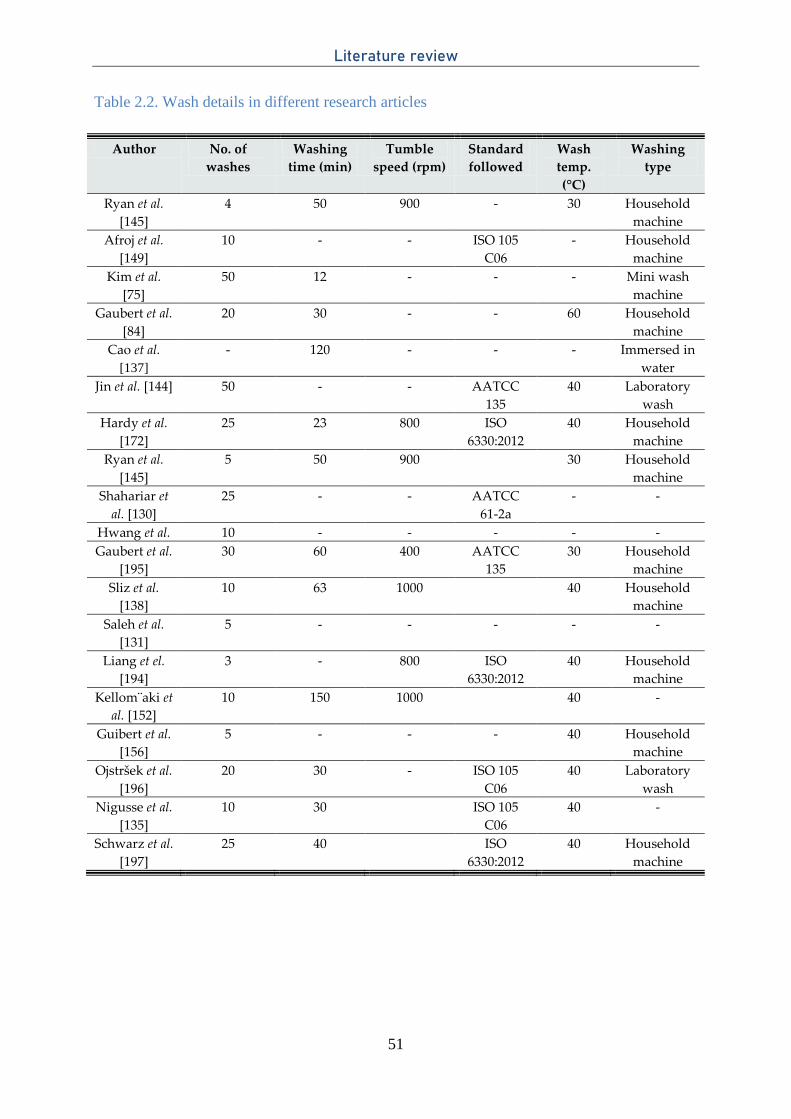
Literature review
51
Table 2.2. Wash details in different research articles
Author No. of
washes
Washing
time (min)
Tumble
speed (rpm)
Standard
followed
Wash
temp.
(°C)
Washing
type
Ryan et al.
[145]
4 50 900 - 30 Household
machine
Afroj et al.
[149]
10 - - ISO 105
C06
- Household
machine
Kim et al.
[75]
50 12 - - - Mini wash
machine
Gaubert et al.
[84]
20 30 - - 60 Household
machine
Cao et al.
[137]
- 120 - - - Immersed in
water
Jin et al. [144] 50 - - AATCC
135
40 Laboratory
wash
Hardy et al.
[172]
25 23 800 ISO
6330:2012
40 Household
machine
Ryan et al.
[145]
5 50 900 30 Household
machine
Shahariar et
al. [130]
25 - - AATCC
61-2a
- -
Hwang et al. 10 - - - - -
Gaubert et al.
[195]
30 60 400 AATCC
135
30 Household
machine
Sliz et al.
[138]
10 63 1000 40 Household
machine
Saleh et al.
[131]
5 - - - - -
Liang et el.
[194]
3 - 800 ISO
6330:2012
40 Household
machine
Kellom¨aki et
al. [152]
10 150 1000 40 -
Guibert et al.
[156]
5 - - - 40 Household
machine
Ojstršek et al.
[196]
20 30 - ISO 105
C06
40 Laboratory
wash
Nigusse et al.
[135]
10 30 ISO 105
C06
40 -
Schwarz et al.
[197]
25 40 ISO
6330:2012
40 Household
machine
Literature review
52
2.9 Conclusion
The textile industry is shifting its momentum from conventional textile to smart user-defined
functional textiles. Today’s textile became the platform for various functionalities as well as
normal textile usages. These e-textile systems are lacking of standardization and functional
reliability. Various available standard test protocols established for conventional textiles are
shortlisted here, along with recent progress to develop new norms dedicated to e-textile
systems. An overview of recent developments in wearable e-textile products and available
products in different fields based on their applications (medical, sports, military, etc.) is
presented in this chapter. Various e-textile system components (sensors, actuators, connection
threads, etc.) are discussed in detail, with some recent research progress ongoing in these
system developments.
In the later part, washability and reliability problems associated with these e-textile systems
are highlighted by discussing some current research progresses using various available textile
standard protocols. Various researchers claimed the washability of their prototypes using
different available standards. These problems enhance the importance of new standards
dedicated to wearable e-textile systems.
This research is targeted to investigate the washing problems related to e-textile systems.
Because to go forward in washing standardization, first, it is important to understand the wash
process and know what is going on in washing. Some basic development is under process and
different organizations are already working on it. Useful fundamental understanding is
already well developed in terms of definitions and categorization for basic understanding. For
example, IEC 63203-204-1 recently published test method for assessing washing reliability of
leisurewear and sportswear, explaining the basic definition of e-textile systems, conductive
textiles, washability test conditions, and after washing protocols. However, washing analyses
are not performed and it is only focused on already developed washing standards that are not
designed for e-textile system washability. There is a need to investigate the washing
characteristics and behavior of different e-textiles and their components separately for a better
understanding of their washing predictions. Therefore, we believe that a new washing
standard taking into account all the particularities of the e-textile systems should be defined to
improve the already existing standards such as ISO 6330, etc. Also, the objective of our work
is to better understand the types of damages provoked by washing on e-textile systems to be
Literature review
53
able to simulate them in laboratory conditions. For instance, mechanical damages could be
simulated by existing textile testing apparatuses.
For the washing of smart textiles, there are two possibilities. One is a laboratory standardized
washing procedure, and the other is washing in household washing machines. To be
successful in smart textiles, they should be able to withstand after washing in normal washing
machines as ultimately, they will be laundered at homes. For these reasons, the focus is given
to commercially available washing machines. Secondly, this research is dedicated to e-textile
systems developed by textile manufacturing methods. In other words, the major part of e-
textile systems should be textile structure. Although they can be prepared by other techniques,
they are not in the scope of this work. Only textile manufacturing methods are focused on,
keeping in mind that conventional textile products prepared by these techniques are widely
being replaced by e-textile systems, and there is a lot of discussion about their washability
issues.
Literature review
54
References
1. Chen, C.-Y.; Huang, S.Y.; Wan, H.-Y.; Chen, Y.-T.; Yu, S.-K.; Wu, H.-C.; Yang, T.-I.
Electrospun Hydrophobic Polyaniline/Silk Fibroin Electrochromic Nanofibers with
Low Electrical Resistance. Polymers 2020, 12, 2102, doi:10.3390/polym12092102.
2. Li, R.-W.; Liu, G. Flexible and Stretchable Electronics. 409.
3. ISO 6330:2012(En), Textiles — Domestic Washing and Drying Procedures for Textile
Testing Available online: https://www.iso.org/obp/ui#iso:std:iso:6330:ed-3:v1:en
(accessed on 11 September 2020).
4. BS EN ISO 139-2005+A1-2011--[2017-12-21--01-16-11 PM].Pdf.
5. ISO 3759:2011 Available online:
https://www.iso.org/cms/render/live/en/sites/isoorg/contents/data/standard/05/73/57309
.html (accessed on 21 December 2020).
6. ISO 105-A05:1996 Available online:
https://www.iso.org/cms/render/live/en/sites/isoorg/contents/data/standard/00/37/3789.
html (accessed on 21 December 2020).
7. ISO 105-C06:2010 Available online:
https://www.iso.org/cms/render/live/en/sites/isoorg/contents/data/standard/05/12/51276
.html (accessed on 21 December 2020).
8. ISO 105-C12:2004 Available online:
https://www.iso.org/cms/render/live/en/sites/isoorg/contents/data/standard/03/76/37645
.html (accessed on 21 December 2020).
9. ISO 105-C09:2001 Available online:
https://www.iso.org/cms/render/live/en/sites/isoorg/contents/data/standard/03/32/33204
.html (accessed on 21 December 2020).
10. ISO 105-C10:2006 Available online:
https://www.iso.org/cms/render/live/en/sites/isoorg/contents/data/standard/03/17/31775
.html (accessed on 21 December 2020).
11. ISO 3175-2:2017 Available online:
https://www.iso.org/cms/render/live/en/sites/isoorg/contents/data/standard/06/51/65154
.html (accessed on 21 December 2020).
12. ISO 811:2018 Available online:
https://www.iso.org/cms/render/live/en/sites/isoorg/contents/data/standard/06/51/65149
.html (accessed on 21 December 2020).
Literature review
55
13. AATCC - AATCC Available online: https://members.aatcc.org/store/tm135/543/
(accessed on 11 September 2020).
14. AATCC - AATCC Available online: https://members.aatcc.org/store/lp001/2212/
(accessed on 11 September 2020).
15. AATCC 1993 Standard Reference Detergent. AATCC.
16. IEC 60601-2-31:2020 Available online:
https://www.iso.org/cms/render/live/en/sites/isoorg/contents/data/standard/07/24/72452
.html (accessed on 21 December 2020).
17. IEC 60601-1-12:2014 Available online:
https://www.iso.org/cms/render/live/en/sites/isoorg/contents/data/standard/05/95/59536
.html (accessed on 21 December 2020).
18. IEC/TR 60601-4-1:2017 Available online:
https://www.iso.org/cms/render/live/en/sites/isoorg/contents/data/standard/07/07/70755
.html (accessed on 21 December 2020).
19. IEC 61340-4-1:2003+AMD1:2015 CSV | IEC Webstore Available online:
https://webstore.iec.ch/publication/22337 (accessed on 21 December 2020).
20. IEC 62631-3-1:2016 | IEC Webstore Available online:
https://webstore.iec.ch/publication/24397 (accessed on 21 December 2020).
21. IEC 62631-3-2:2015 | IEC Webstore Available online:
https://webstore.iec.ch/publication/23875 (accessed on 21 December 2020).
22. IP Rating Chart.Pdf.
23. IPC-A-610D WAM1: Acceptability of Electronic Assemblies | IPC Store Available
online: https://shop.ipc.org/IPC-A-610D-WAM1-English-D (accessed on 21 December
2020).
24. IPC-A-600J: Acceptability of Printed Boards Available online:
https://shop.ipc.org/IPC-A-600J-English-MDL (accessed on 21 December 2020).
25. IPC-9204: Guideline on Flexibility and Stretchability Testing for Printed Electronics
Available online: https://shop.ipc.org/IPC-9204-English-D (accessed on 21 December
2020).
26. IPC-6903: Terms and Definitions for the Design and Manufacture of Printed
Electronics (Additive Circuitry) Available online: https://shop.ipc.org/IPC-6903-
English-D (accessed on 21 December 2020).
Literature review
56
27. IPC-9252B: Requirements for Electrical Testing of Unpopulated Printed Boards
Available online: https://shop.ipc.org/IPC-9252B-English-D (accessed on 21 December
2020).
28. IPC-9202: Material and Process Characterization/Qualification Test Protocol for
Assessing Electrochemical Performance Available online: https://shop.ipc.org/IPC-
9202-English-D (accessed on 21 December 2020).
29. Flexible, Wearable, and Stretchable Electronics.Pdf.
30. ISO 12947-1:1998 Available online:
https://www.iso.org/cms/render/live/en/sites/isoorg/contents/data/standard/00/19/1931.
html (accessed on 21 December 2020).
31. ISO 12947-2:2016 Available online:
https://www.iso.org/cms/render/live/en/sites/isoorg/contents/data/standard/06/10/61058
.html (accessed on 21 December 2020).
32. ISO 12947-3:1998 Available online:
https://www.iso.org/cms/render/live/en/sites/isoorg/contents/data/standard/02/36/23620
.html (accessed on 21 December 2020).
33. ISO 12947-4:1998/Cor 1:2002 Available online:
https://www.iso.org/cms/render/live/en/sites/isoorg/contents/data/standard/03/73/37375
.html (accessed on 21 December 2020).
34. ISO 12945-1:2020 Available online:
https://www.iso.org/cms/render/live/en/sites/isoorg/contents/data/standard/07/53/75374
.html (accessed on 21 December 2020).
35. ISO 12945-2:2020 Available online:
https://www.iso.org/cms/render/live/en/sites/isoorg/contents/data/standard/07/53/75375
.html (accessed on 21 December 2020).
36. ISO 12945-3:2020 Available online:
https://www.iso.org/cms/render/live/en/sites/isoorg/contents/data/standard/07/53/75376
.html (accessed on 21 December 2020).
37. ISO 12945-4:2020 Available online:
https://www.iso.org/cms/render/live/en/sites/isoorg/contents/data/standard/07/53/75377
.html (accessed on 21 December 2020).
38. ISO/R 388:1964 Available online:
https://www.iso.org/cms/render/live/en/sites/isoorg/contents/data/standard/00/43/4372.
html (accessed on 21 December 2020).
Literature review
57
39. ISO/CD 13997 Available online:
https://www.iso.org/cms/render/live/en/sites/isoorg/contents/data/standard/07/11/71111
.html (accessed on 21 December 2020).
40. ISO 6945:1991/Amd 1:1998 Available online:
https://www.iso.org/cms/render/live/en/sites/isoorg/contents/data/standard/02/90/29091
.html (accessed on 21 December 2020).
41. ISO 20253:2016 Available online:
https://www.iso.org/cms/render/live/en/sites/isoorg/contents/data/standard/06/74/67423
.html (accessed on 21 December 2020).
42. D13 Committee Test Method for Abrasion Resistance of Textile Fabrics (Oscillatory
Cylinder Method); ASTM International;
43. D13 Committee Guide for Abrasion Resistance of Textile Fabrics (Rotary Platform,
Double-Head Method); ASTM International;
44. D13 Committee Test Method for Abrasion Resistance of Textile Fabrics (Flexing and
Abrasion Method); ASTM International;
45. D13 Committee Test Method for Abrasion Resistance of Textile Fabrics (Inflated
Diaphragm Apparatus); ASTM International;
46. D13 Committee Guide for Abrasion Resistance of Textile Fabrics (Uniform Abrasion);
ASTM International;
47. D13 Committee Test Method for Abrasion Resistance of Textile Fabrics (Martindale
Abrasion Tester Method); ASTM International;
48. AATCC - AATCC Available online: https://members.aatcc.org/store/tm93/508/
(accessed on 21 December 2020).
49. F02 Committee Practice for Conditioning Flexible Barrier Materials for Flex
Durability; ASTM International;
50. ISO 7854:1995 Available online:
https://www.iso.org/cms/render/live/en/sites/isoorg/contents/data/standard/01/47/14777
.html (accessed on 21 December 2020).
51. ISO 2062:2009 Available online:
https://www.iso.org/cms/render/live/en/sites/isoorg/contents/data/standard/04/56/45642
.html (accessed on 21 December 2020).
52. ISO 13934-1:2013 Available online:
https://www.iso.org/cms/render/live/en/sites/isoorg/contents/data/standard/06/06/60676
.html (accessed on 21 December 2020).
Literature review
58
53. ISO 13934-2:2014 Available online:
https://www.iso.org/cms/render/live/en/sites/isoorg/contents/data/standard/06/06/60677
.html (accessed on 21 December 2020).
54. D13 Committee Test Method for Breaking Strength and Elongation of Textile Fabrics
(Grab Test); ASTM International;
55. D13 Committee Test Method for Breaking Force and Elongation of Textile Fabrics
(Strip Method); ASTM International;
56. D13 Committee Test Method for Tearing Strength of Fabrics by Trapezoid Procedure;
ASTM International;
57. ISO 14704:2016 Available online:
https://www.iso.org/cms/render/live/en/sites/isoorg/contents/data/standard/06/54/65411
.html (accessed on 21 December 2020).
58. D13 Committee Test Method for Stretch Properties of Knitted Fabrics Having Low
Power; ASTM International;
59. D13 Committee Test Methods for Stretch Properties of Fabrics Woven from Stretch
Yarns; ASTM International;
60. AATCC - AATCC.
61. AATCC - AATCC.
62. BS EN 16812:2016 - Textiles and Textile Products. Electrically Conductive Textiles.
Determination of the Linear Electrical Resistance of Conductive Tracks Available
online: https://shop.bsigroup.com/ProductDetail/?pid=000000000030293513 (accessed
on 21 December 2020).
63. ISO/CD 24584 Available online:
https://www.iso.org/cms/render/live/en/sites/isoorg/contents/data/standard/07/89/78999
.html (accessed on 21 December 2020).
64. ISO/TR 23383:2020 Available online:
https://www.iso.org/cms/render/live/en/sites/isoorg/contents/data/standard/07/53/75383
.html (accessed on 21 December 2020).
65. IEC 61482-1-1:2019 | IEC Webstore Available online:
https://webstore.iec.ch/publication/26682 (accessed on 21 December 2020).
66. IEC 61482-1-2:2014 | IEC Webstore Available online:
https://webstore.iec.ch/publication/5498 (accessed on 21 December 2020).
67. WK61480 New Test Method for Durability of Smart Garment Textile Electrodes after
Laundering Available online:
Literature review
59
https://www.astm.org/DATABASE.CART/WORKITEMS/WK61480.htm (accessed on
21 December 2020).
68. RA111, Electronically Integrated Textiles Test Methods. AATCC.
69. IEC - TC 124 Dashboard > Projects: Work Programme, Publications, Maintenance
Cycle, Project Files, TC/SC in Figures Available online:
https://www.iec.ch/dyn/www/f?p=103:38:0::::FSP_ORG_ID,FSP_APEX_PAGE,FSP_
PROJECT_ID:20537,109,101883 (accessed on 5 January 2021).
70. IPC-8921: Requirements for Woven and Knitted Electronic Textiles (E-Textiles)
Integrated with Conductive Fibers, Conductive Yarns and/or Wires Available online:
https://shop.ipc.org/IPC-8921-English-D (accessed on 21 December 2020).
71. IPC E-Textiles Initiative - Join the Effort Available online: https://www.ipc.org/ipc-e-
textiles-initiative-join-effort (accessed on 21 December 2020).
72. Hussain, M.M.; El-Atab, N. Handbook of Flexible and Stretchable Electronics. 551.
73. Bahru, R.; Hamzah, A.A.; Mohamed, M.A. Thermal Management of Wearable and
Implantable Electronic Healthcare Devices: Perspective and Measurement Approach.
Int J Energy Res 2020, er.6031, doi:10.1002/er.6031.
74. Abed, A.; Cochrane, C.; Boussu, F.; Cherkaoui, O.; Elmoznine, R. Design and
Development of a Piezo-Resistive Sensor Based on PEDOT: PSS Applied to Sisal’s
Natural Fiber for Monitoring of 3D Warp Interlock Fabric. IOP Conf. Ser.: Mater. Sci.
Eng. 2020, 827, 012019, doi:10.1088/1757-899X/827/1/012019.
75. Kim, G.; Vu, C.C.; Kim, J. Single-Layer Pressure Textile Sensors with Woven
Conductive Yarn Circuit. Applied Sciences 2020, 10, 2877, doi:10.3390/app10082877.
76. Atakan, R.; Acikgoz Tufan, H.; Baskan, H.; Eryuruk, S.H.; Akalin, N.; Kose, H.; Li,
Y.; Kursun Bahadir, S.; Kalaoglu, F. Design of an Electronic Chest-Band. IOP Conf.
Ser.: Mater. Sci. Eng. 2017, 254, 072002, doi:10.1088/1757-899X/254/7/072002.
77. Yang, C.-M.; Wu, C.-C.; Chou, C.-M.; Yang, C.-W. Textile-Based Monitoring System
for Biker. In Proceedings of the 2009 9th International Conference on Information
Technology and Applications in Biomedicine; IEEE: Larnaka, Cyprus, November
2009; pp. 1–4.
78. Rachel, M.D.A. HEALTHCARE TEXTILE DYED NATURAL SOCKS. 2019, 4, 6.
79. Edmison, J.; Lehn, D.; Jones, M.; Martin, T. E-Textile Based Automatic Activity Diary
for Medical Annotation and Analysis. In Proceedings of the International Workshop on
Wearable and Implantable Body Sensor Networks (BSN’06); IEEE: Cambridge, MA,
USA, 2006; pp. 131–134.
Literature review
60
80. De jonckheere, J.; Narbonneau, F.; Jeanne, M.; Kinet, D.; Witt, J.; Krebber, K.; Paquet,
B.; Depre, A.; Logier, R. OFSETH: Smart Medical Textile for Continuous Monitoring
of Respiratory Motions under Magnetic Resonance Imaging. In Proceedings of the
2009 Annual International Conference of the IEEE Engineering in Medicine and
Biology Society; IEEE: Minneapolis, MN, September 2009; pp. 1473–1476.
81. Witt, J.; Narbonneau, F.; Schukar, M.; Krebber, K.; De Jonckheere, J.; Jeanne, M.;
Kinet, D.; Paquet, B.; Depre, A.; D’Angelo, L.T.; et al. Medical Textiles With
Embedded Fiber Optic Sensors for Monitoring of Respiratory Movement. IEEE
Sensors J. 2012, 12, 246–254, doi:10.1109/JSEN.2011.2158416.
82. Ferrara, M. Smart Experience in Fashion Design: A Speculative Analysis of Smart
Material Systems Applications. Arts 2018, 8, 4, doi:10.3390/arts8010004.
83. Mordon, S.; Thécua, E.; Ziane, L.; Lecomte, F.; Deleporte, P.; Baert, G.; Vignion‐
Dewalle, A. Light Emitting Fabrics for Photodynamic Therapy: Technology,
Experimental and Clinical Applications. Translational Biophotonics 2020, 2,
doi:10.1002/tbio.202000005.
84. Gaubert, V.; Gidik, H.; Koncar, V. Boxer Underwear Incorporating Textile Moisture
Sensor to Prevent Nocturnal Enuresis. Sensors 2020, 20, 3546, doi:10.3390/s20123546.
85. Sandulescu, V.; Dobrescu, R. Wearable System for Stress Monitoring of Firefighters in
Special Missions. In Proceedings of the 2015 E-Health and Bioengineering Conference
(EHB); IEEE: Iasi, Romania, November 2015; pp. 1–4.
86. Caya, M.V.C.; Casaje, J.S.; Catapang, G.B.; Dandan, R.A.V.; Linsangan, N.B.
Warning System for Firefighters Using E-Textile. In Proceedings of the 2018 3rd
International Conference on Computer and Communication Systems (ICCCS); IEEE:
Nagoya, April 2018; pp. 362–366.
87. Zaman, S. uz; Tao, X.; Cochrane, C.; Koncar, V. Understanding the Washing Damage
to Textile ECG Dry Skin Electrodes, Embroidered and Fabric-Based; Set up of
Equivalent Laboratory Tests. Sensors 2020, 20, 1272, doi:10.3390/s20051272.
88. Bystricky, T.; Moravcova, D.; Kaspar, P.; Soukup, R.; Hamacek, A. A Comparison of
Embroidered and Woven Textile Electrodes for Continuous Measurement of ECG. In
Proceedings of the 2016 39th International Spring Seminar on Electronics Technology
(ISSE); IEEE: Pilsen, Czech Republic, May 2016; pp. 7–11.
89. Ankhili, A.; Tao, X.; Cochrane, C.; Koncar, V.; Coulon, D.; Tarlet, J.-M. Ambulatory
Evaluation of ECG Signals Obtained Using Washable Textile-Based Electrodes Made
Literature review
61
with Chemically Modified PEDOT:PSS. Sensors 2019, 19, 416,
doi:10.3390/s19020416.
90. Medical Smart Textile Market Scope And Challenges 2018-2027 by Players,
Technology and Applications | MarketResrarchFuture.Com | Medgadget.
91. Scataglini, S.; Moorhead, A.P.; Feletti, F. A Systematic Review of Smart Clothing in
Sports: Possible Applications to Extreme Sports. Muscle Ligaments and Tendons J
2020, 10, 333, doi:10.32098/mltj.02.2020.19.
92. Rymarczyk, T.; Vejar, A.; Nita, P.; Stefaniak, B.; Wos, M.; Oleszek, M. Using
Electrical Tomography for Remote Monitoring Cardiopulmonary State of Patients by
Complementary Investigation Techniques. In Proceedings of the 2019 19th
International Symposium on Electromagnetic Fields in Mechatronics, Electrical and
Electronic Engineering (ISEF); IEEE: Nancy, France, August 2019; pp. 1–2.
93. Gaubert, V.; Gidik, H.; Bodart, N.; Koncar, V. Quantification of the Silver Content of a
Silver-Plated Nylon Electrode According to the Nature of the Laundering Detergent.
IOP Conf. Ser.: Mater. Sci. Eng. 2020, 827, 012033, doi:10.1088/1757-
899X/827/1/012033.
94. Quandt, B.M.; Scherer, L.J.; Boesel, L.F.; Wolf, M.; Bona, G.-L.; Rossi, R.M. Body-
Monitoring and Health Supervision by Means of Optical Fiber-Based Sensing Systems
in Medical Textiles. Adv. Healthcare Mater. 2015, 4, 330–355,
doi:10.1002/adhm.201400463.
95. Grancarić, A.M.; Jerković, I.; Koncar, V.; Cochrane, C.; Kelly, F.M.; Soulat, D.;
Legrand, X. Conductive Polymers for Smart Textile Applications. Journal of Industrial
Textiles 2018, 48, 612–642, doi:10.1177/1528083717699368.
96. NeoMedLight Bilicocoon® Available online:
https://www.neomedlight.com/bilicocoon/ (accessed on 22 December 2020).
97. Andrew Cohen Heart-Monitoring T-Shirt Available online:
https://www.sporttechie.com/smart-textile-company-kymira-cardiac-monitoring-tshirt-
athletes/.
98. Xiaomi Mijia Cardiogram T-Shirt: Smart T-Shirt with ECG Measurement. Xiaomi
Planet 2020.
99. Daniely, H. A T-Shirt That Monitors Your Heart. HealthWatch Ltd.| Healthcare
Wearables 2017.
100. Products & Services. AiQ Smart Clothing.
Literature review
62
101. Inc, E. Sport T-Shirt Available online: https://emglare.com/products/sport-tshirt
(accessed on 21 December 2020).
102. Bonato, P. Advances in Wearable Technology for Rehabilitation. 17.
103. Scataglini, S.; Andreoni, G.; Gallant, J. A Review of Smart Clothing in Military. In
Proceedings of the Proceedings of the 2015 workshop on Wearable Systems and
Applications - WearSys ’15; ACM Press: Florence, Italy, 2015; pp. 53–54.
104. Nayak, R.; Wang, L.; Padhye, R. Electronic textiles for military personnel. In
Electronic Textiles; Elsevier, 2015; pp. 239–256 ISBN 978-0-08-100201-8.
105. Shi, J.; Liu, S.; Zhang, L.; Yang, B.; Shu, L.; Yang, Y.; Ren, M.; Wang, Y.; Chen, J.;
Chen, W.; et al. Smart Textile‐Integrated Microelectronic Systems for Wearable
Applications. Adv. Mater. 2020, 32, 1901958, doi:10.1002/adma.201901958.
106. Scataglini, S.; Andreoni, G.; Truyen, E.; Warnimont, L.; Gallant, J.; Van, D.; di
Milano, P. Design of Smart Clothing for Belgian Soldiers through a Preliminary
Anthropometric Approach. 6.
107. Cityzen Sciences : Champion Français Du Textile Connecté Available online:
https://www.inpi.fr/fr/innovation-la-galerie/talents/citizen-sciences-champion-francais-
du-textile-connecte (accessed on 22 December 2020).
108. Shathi, M.A.; Chen, M.; Khoso, N.A.; Rahman, M.T.; Bhattacharjee, B. Graphene
Coated Textile Based Highly Flexible and Washable Sports Bra for Human Health
Monitoring. Materials & Design 2020, 193, 108792,
doi:10.1016/j.matdes.2020.108792.
109. Jacquard by Google - Adidas Available online:
https://atap.google.com/jacquard/products/gmr/ (accessed on 19 March 2021).
110. Nike Adapt. Self-Lacing Shoes Available online: https://www.nike.com/adapt
(accessed on 21 December 2020).
111. Sensoria Core Pair Available online: https://store.sensoriafitness.com/sensoria-core-
pair/ (accessed on 21 December 2020).
112. T-Shirt Short Sleeve + HRM Available online: https://store.sensoriafitness.com/t-shirt-
short-sleeve-hrm/ (accessed on 21 December 2020).
113. Deng, H.-Y.; Cui, Y.-M. The Application of Smart Textiles in the Brand Fashion
Design. MATEC Web of Conferences 2016, 61, 04022,
doi:10.1051/matecconf/20166104022.
114. CUTECIRCUIT | Special Projects Available online: https://cutecircuit.com/special-
projects/ (accessed on 22 December 2020).
Literature review
63
115. Wearable Solar Dress Available online:
http://www.paulinevandongen.nl/project/wearable-solar/ (accessed on 22 December
2020).
116. Full Body Haptic Feedback & Motion Capture Tracking VR Suit Available online:
https://teslasuit.io/ (accessed on 22 March 2021).
117. Gao, Y.; Yu, L.; Yeo, J.C.; Lim, C.T. Flexible Hybrid Sensors for Health Monitoring:
Materials and Mechanisms to Render Wearability. Adv. Mater. 2020, 32, 1902133,
doi:10.1002/adma.201902133.
118. Nag, A.; Mukhopadhyay, S.C.; Kosel, J. Wearable Flexible Sensors: A Review. IEEE
Sensors J. 2017, 17, 3949–3960, doi:10.1109/JSEN.2017.2705700.
119. Bosowski, P.; Hoerr, M.; Mecnika, V.; Gries, T.; Jockenhövel, S. Design and
manufacture of textile-based sensors. In Electronic Textiles; Elsevier, 2015; pp. 75–107
ISBN 978-0-08-100201-8.
120. Trung, T.Q.; Lee, N.-E. Flexible and Stretchable Physical Sensor Integrated Platforms
for Wearable Human-Activity Monitoringand Personal Healthcare. Adv. Mater. 2016,
28, 4338–4372, doi:10.1002/adma.201504244.
121. Dias, T.; Ratnayake, A. Integration of micro-electronics with yarns for smart textiles. In
Electronic Textiles; Elsevier, 2015; pp. 109–116 ISBN 978-0-08-100201-8.
122. Waqar, S.; Wang, L.; John, S. Piezoelectric energy harvesting from intelligent textiles.
In Electronic Textiles; Elsevier, 2015; pp. 173–197 ISBN 978-0-08-100201-8.
123. van den Brand, J.; de Kok, M.; Koetse, M.; Cauwe, M.; Verplancke, R.; Bossuyt, F.;
Jablonski, M.; Vanfleteren, J. Flexible and Stretchable Electronics for Wearable Health
Devices. Solid-State Electronics 2015, 113, 116–120, doi:10.1016/j.sse.2015.05.024.
124. Fukuma, N.; Hasumi, E.; Fujiu, K.; Waki, K.; Toyooka, T.; Komuro, I.; Ohe, K.
Feasibility of a T-Shirt-Type Wearable Electrocardiography Monitor for Detection of
Covert Atrial Fibrillation in Young Healthy Adults. Sci Rep 2019, 9, 11768,
doi:10.1038/s41598-019-48267-1.
125. Hong, Y.J.; Jeong, H.; Cho, K.W.; Lu, N.; Kim, D. Wearable and Implantable Devices
for Cardiovascular Healthcare: From Monitoring to Therapy Based on Flexible and
Stretchable Electronics. Adv. Funct. Mater. 2019, 29, 1808247,
doi:10.1002/adfm.201808247.
126. Meghrazi, M.A.; Tian, Y.; Mahnam, A.; Bhattachan, P.; Eskandarian, L.; Kakhki, S.T.;
Popovic, M.R. Multichannel ECG Recording from Waist Using Textile Sensors. 26.
Literature review
64
127. Heo, J.S.; Hossain, M.F.; Kim, I. Challenges in Design and Fabrication of
Flexible/Stretchable Carbon- and Textile-Based Wearable Sensors for Health
Monitoring: A Critical Review. Sensors 2020, 20, 3927, doi:10.3390/s20143927.
128. Arquilla, K.; Webb, A.; Anderson, A. Textile Electrocardiogram (ECG) Electrodes for
Wearable Health Monitoring. Sensors 2020, 20, 1013, doi:10.3390/s20041013.
129. Wang, J.; Soltanian, S.; Servati, P.; Ko, F.; Weng, M. A Knitted Wearable Flexible
Sensor for Monitoring Breathing Condition. Journal of Engineered Fibers and Fabrics
2020, 15, 155892502093035, doi:10.1177/1558925020930354.
130. Shahariar, H.; Kim, I.; Bhakta, R.; Jur, J.S. Direct-Write Printing Process of
Conductive Paste on Fiber Bulks for Wearable Textile Heaters. Smart Mater. Struct.
2020, 29, 085018, doi:10.1088/1361-665X/ab8c25.
131. Saleh, S.Md.; Jusob, S.Md.; Harun, F.K.C.; Yuliati, L.; Wicaksono, D.H.B.
Optimization of Reduced GO-Based Cotton Electrodes for Wearable
Electrocardiography. IEEE Sensors J. 2020, 20, 7774–7782,
doi:10.1109/JSEN.2020.2981262.
132. Tang, Y.; Chang, R.; Zhang, L.; Yan, F.; Ma, H.; Bu, X. Electrode Humidification
Design for Artifact Reduction in Capacitive ECG Measurements. Sensors 2020, 20,
3449, doi:10.3390/s20123449.
133. Fu, Y.; Zhao, J.; Dong, Y.; Wang, X. Dry Electrodes for Human Bioelectrical Signal
Monitoring. Sensors 2020, 20, 3651, doi:10.3390/s20133651.
134. Wang, J.; Lee, S.; Yokota, T.; Jimbo, Y.; Wang, Y.; Nayeem, M.O.G.; Nishinaka, M.;
Someya, T. Nanomesh Organic Electrochemical Transistor for Comfortable On-Skin
Electrodes with Local Amplifying Function. ACS Appl. Electron. Mater. 2020, 2,
3601–3609, doi:10.1021/acsaelm.0c00668.
135. Nigusse, A.B.; Malengier, B.; Mengistie, D.A.; Tseghai, G.B.; Van Langenhove, L.
Development of Washable Silver Printed Textile Electrodes for Long-Term ECG
Monitoring. Sensors 2020, 20, 6233, doi:10.3390/s20216233.
136. Kim, S.; Lee, S.; Jeong, W. EMG Measurement with Textile-Based Electrodes in
Different Electrode Sizes and Clothing Pressures for Smart Clothing Design
Optimization. Polymers 2020, 12, 2406, doi:10.3390/polym12102406.
137. Cao, R.; Pu, X.; Du, X.; Yang, W.; Wang, J.; Guo, H.; Zhao, S.; Yuan, Z.; Zhang, C.;
Li, C.; et al. Screen-Printed Washable Electronic Textiles as Self-Powered
Touch/Gesture Tribo-Sensors for Intelligent Human–Machine Interaction. ACS Nano
2018, 12, 5190–5196, doi:10.1021/acsnano.8b02477.
Literature review
65
138. Sliz, R.; Huttunen, O.-H.; Jansson, E.; Kemppainen, J.; Schroderus, J.; Kurkinen, M.;
Fabritius, T. Reliability of R2R-Printed, Flexible Electrodes for e-Clothing
Applications. npj Flex Electron 2020, 4, 12, doi:10.1038/s41528-020-0076-y.
139. Qureshi, Y.; Tarfaoui, M.; Lafdi, K.; Lafdi, K. A Flexible Strain Sensor Design Based
on Ny-6 Yarn Coated with Ag Nanoparticles for Real Time Strain Monitoring
Application. 5.
140. Zhao, X.; Hua, Q.; Yu, R.; Zhang, Y.; Pan, C. Flexible, Stretchable and Wearable
Multifunctional Sensor Array as Artificial Electronic Skin for Static and Dynamic
Strain Mapping. Adv. Electron. Mater. 2015, 1, 1500142,
doi:10.1002/aelm.201500142.
141. Zhang, X.; Zhong, Y. A Silver/Silver Chloride Woven Electrode with Convex Based
on Electrical Impedance Tomography. The Journal of The Textile Institute 2020, 1–13,
doi:10.1080/00405000.2020.1800926.
142. Islam, G.M.N.; Ali, A.; Collie, S. Textile Sensors for Wearable Applications: A
Comprehensive Review. Cellulose 2020, 27, 6103–6131, doi:10.1007/s10570-020-
03215-5.
143. Tseghai, G.B.; Malengier, B.; Fante, K.A.; Nigusse, A.B.; Langenhove, L.V.
Integration of Conductive Materials with Textile Structures, an Overview. 2020, 28.
144. Jin, H.; Matsuhisa, N.; Lee, S.; Abbas, M.; Yokota, T.; Someya, T. Enhancing the
Performance of Stretchable Conductors for E‐Textiles by Controlled Ink Permeation.
Adv. Mater. 2017, 29, 1605848, doi:10.1002/adma.201605848.
145. Ryan, J.D.; Mengistie, D.A.; Gabrielsson, R.; Lund, A.; Müller, C. Machine-Washable
PEDOT:PSS Dyed Silk Yarns for Electronic Textiles. ACS Appl. Mater. Interfaces
2017, 9, 9045–9050, doi:10.1021/acsami.7b00530.
146. Yu, X. Piezoelectric Materials and Devices Based Flexible Bio‐integrated Electronics.
In Flexible and Wearable Electronics for Smart Clothing; Wang, G., Hou, C., Wang,
H., Eds.; Wiley, 2020; pp. 237–251 ISBN 978-3-527-34534-2.
147. Logothetis, I.; Vatansever Bayramol, D.; Gil, I.; Dabnichki, P.; Pirogova, E. Evaluating
Silver-Plated Nylon (Ag/PA66) e-Textiles for Bioelectrical Impedance Analysis (BIA)
Application. Meas. Sci. Technol. 2020, 31, 075101, doi:10.1088/1361-6501/ab78c3.
148. Ig Mo Koo; Kwangmok Jung; Ja Choon Koo; Jae-Do Nam; Young Kwan Lee; Hyouk
Ryeol Choi Development of Soft-Actuator-Based Wearable Tactile Display. IEEE
Trans. Robot. 2008, 24, 549–558, doi:10.1109/TRO.2008.921561.
Literature review
66
149. Afroj, S.; Tan, S.; Abdelkader, A.M.; Novoselov, K.S.; Karim, N. Highly Conductive,
Scalable, and Machine Washable Graphene‐Based E‐Textiles for Multifunctional
Wearable Electronic Applications. Adv. Funct. Mater. 2020, 30, 2000293,
doi:10.1002/adfm.202000293.
150. Daňová, R.; Olejnik, R.; Slobodian, P.; Matyas, J. The Piezoresistive Highly Elastic
Sensor Based on Carbon Nanotubes for the Detection of Breath. Polymers 2020, 12,
713, doi:10.3390/polym12030713.
151. Wang, Z.; Volakis, J.L.; Kiourti, A. Embroidered antennas for communication systems.
In Electronic Textiles; Elsevier, 2015; pp. 201–237 ISBN 978-0-08-100201-8.
152. Kellomäki, T.; Virkki, J.; Merilampi, S.; Ukkonen, L. Towards Washable Wearable
Antennas: A Comparison of Coating Materials for Screen-Printed Textile-Based UHF
RFID Tags. International Journal of Antennas and Propagation 2012, 2012, 1–11,
doi:10.1155/2012/476570.
153. Innovation in Wearable and Flexible Antennas; Khaleel, H.R., Ed.; Wit Press:
Southampton, UK ; Billerica, MA, 2015; ISBN 978-1-84564-986-9.
154. Garnier, B.; Mariage, P.; Rault, F.; Cochrane, C.; Koncar, V. Textile NFC Antenna for
Power and Data Transmission across Clothes. Smart Mater. Struct. 2020, 29, 085017,
doi:10.1088/1361-665X/ab8a6d.
155. Lee, J.H.; Dzagbletey, P.A.; Jang, M.; Chung, J.-Y.; So, J.-H. Flat Yarn Fabric
Substrates for Screen‐Printed Conductive Textiles. Adv. Eng. Mater. 2020, 22,
2000722, doi:10.1002/adem.202000722.
156. Guibert, M.; Massicart, A.; Chen, X.; He, H.; Torres, J.; Ukkonen, L.; Virkki, J.
Washing Reliability of Painted, Embroidered, and Electro-Textile Wearable RFID
Tags. In Proceedings of the 2017 Progress in Electromagnetics Research Symposium -
Fall (PIERS - FALL); IEEE: Singapore, November 2017; pp. 828–831.
157. Kazani, I.; Scarpello, M.L.; Hertleer, C.; Rogier, H.; de Mey, G.; Guxho, G.; Van
Langenhove, L. Washable Screen Printed Textile Antennas. AST 2012, 80, 118–122,
doi:10.4028/www.scientific.net/AST.80.118.
158. Liu, Z.; Li, H.; Shi, B.; Fan, Y.; Wang, Z.L.; Li, Z. Wearable and Implantable
Triboelectric Nanogenerators. Adv. Funct. Mater. 2019, 29, 1808820,
doi:10.1002/adfm.201808820.
159. Weng, W.; Chen, P.; He, S.; Sun, X.; Peng, H. Smart Electronic Textiles. Angew.
Chem. Int. Ed. 2016, 55, 6140–6169, doi:10.1002/anie.201507333.
Literature review
67
160. Wilson, J.I.B.; Mather, R.R. Photovoltaic energy harvesting for intelligent textiles. In
Electronic Textiles; Elsevier, 2015; pp. 155–171 ISBN 978-0-08-100201-8.
161. Wu, H.; Huang, Y.; Xu, F.; Duan, Y.; Yin, Z. Energy Harvesters for Wearable and
Stretchable Electronics: From Flexibility to Stretchability. Adv. Mater. 2016, 28, 9881–
9919, doi:10.1002/adma.201602251.
162. Zopf, S.F.; Manser, M. Screen-Printed Military Textiles for Wearable Energy Storage.
Journal of Engineered Fibers and Fabrics 2016, 11, 155892501601100,
doi:10.1177/155892501601100303.
163. Li, Y.; Yong, S.; Hillier, N.; Arumugam, S.; Beeby, S. Screen Printed Flexible Water
Activated Battery on Woven Cotton Textile as a Power Supply for E-Textile
Applications. IEEE Access 2020, 8, 206958–206965,
doi:10.1109/ACCESS.2020.3038157.
164. Stoppa, M.; Chiolerio, A. Wearable Electronics and Smart Textiles: A Critical Review.
Sensors 2014, 14, 11957–11992, doi:10.3390/s140711957.
165. IDTechEx Research Available online: https://printpackmea.com/2020/08/24/future-
opportunities-for-thin-film-flexible-and-printed-batteries/.
166. Ismar, E.; Tao, X.; Rault, F.; Dassonville, F.; Cochrane, C. Towards Embroidered
Circuit Board From Conductive Yarns for E-Textiles. 2020, 8, 9.
167. Das, S.C.; Paul, D.; Hasan, S.M.; Chowdhury, N.; Nizam, E.H.; Student, M. Smart
Textiles- New Possibilities in Textile Engineering. 7.
168. Chow, P.C.Y.; Someya, T. Organic Photodetectors for Next‐Generation Wearable
Electronics. Adv. Mater. 2020, 32, 1902045, doi:10.1002/adma.201902045.
169. Ma, Y.; Zhang, Y.; Cai, S.; Han, Z.; Liu, X.; Wang, F.; Cao, Y.; Wang, Z.; Li, H.;
Chen, Y.; et al. Flexible Hybrid Electronics for Digital Healthcare. Adv. Mater. 2020,
32, 1902062, doi:10.1002/adma.201902062.
170. Wang, B.; Facchetti, A. Materials and Processes for Stretchable and Wearable e‐Textile
Devices. In Flexible and Wearable Electronics for Smart Clothing; Wang, G., Hou, C.,
Wang, H., Eds.; Wiley, 2020; pp. 305–334 ISBN 978-3-527-34534-2.
171. Buechley, L.; Eisenberg, M. Fabric PCBs, Electronic Sequins, and Socket Buttons:
Techniques for e-Textile Craft. Pers Ubiquit Comput 2009, 13, 133–150,
doi:10.1007/s00779-007-0181-0.
172. Hardy, D.A.; Rahemtulla, Z.; Satharasinghe, A.; Shahidi, A.; Oliveira, C.;
Anastasopoulos, I.; Nashed, M.N.; Kgatuke, M.; Komolafe, A.; Torah, R.; et al. Wash
Testing of Electronic Yarn. Materials 2020, 13, 1228, doi:10.3390/ma13051228.
Literature review
68
173. Cherenack, K.; Zysset, C.; Kinkeldei, T.; Münzenrieder, N.; Tröster, G. Woven
Electronic Fibers with Sensing and Display Functions for Smart Textiles. Adv. Mater.
2010, 22, 5178–5182, doi:10.1002/adma.201002159.
174. Locher, I.; Troster, G. Fundamental Building Blocks for Circuits on Textiles. IEEE
Trans. Adv. Packag. 2007, 30, 541–550, doi:10.1109/TADVP.2007.898636.
175. Linz, T.; Kallmayer, C.; Aschenbrenner, R.; Reichl, H. Embroidering Electrical
Interconnects with Conductive Yarn for The Integration of Flexible Electronic Modules
into Fabric. In Proceedings of the Ninth IEEE International Symposium on Wearable
Computers (ISWC’05); IEEE: Osaka, Japan, 2005; pp. 86–91.
176. Linz, T.; von Krshiwoblozki, M.; Walter, H. Novel Packaging Technology for Body
Sensor Networks Based on Adhesive Bonding A Low Cost, Mass Producible and High
Reliability Solution. In Proceedings of the 2010 International Conference on Body
Sensor Networks; IEEE: Singapore, Singapore, June 2010; pp. 308–314.
177. Linz, T.; von Krshiwoblozki, M.; Walter, H.; Foerster, P. Contacting Electronics to
Fabric Circuits with Nonconductive Adhesive Bonding. Journal of The Textile Institute
2012, 103, 1139–1150, doi:10.1080/00405000.2012.664867.
178. Capineri, L. Resistive Sensors with Smart Textiles for Wearable Technology: From
Fabrication Processes to Integration with Electronics. Procedia Engineering 2014, 87,
724–727, doi:10.1016/j.proeng.2014.11.748.
179. Scarpello, M.L.; Kazani, I.; Hertleer, C.; Rogier, H.; Vande Ginste, D. Stability and
Efficiency of Screen-Printed Wearable and Washable Antennas. Antennas Wirel.
Propag. Lett. 2012, 11, 838–841, doi:10.1109/LAWP.2012.2207941.
180. Miao, M. Carbon nanotube yarns for electronic textiles. In Electronic Textiles; Elsevier,
2015; pp. 55–72 ISBN 978-0-08-100201-8.
181. de Vries, H.; Peerlings, R. Predicting Conducting Yarn Failure in Woven Electronic
Textiles. Microelectronics Reliability 2014, 54, 2956–2960,
doi:10.1016/j.microrel.2014.07.008.
182. Paul, G.; Torah, R.; Yang, K.; Beeby, S.; Tudor, J. An Investigation into the Durability
of Screen-Printed Conductive Tracks on Textiles. Meas. Sci. Technol. 2014, 25,
025006, doi:10.1088/0957-0233/25/2/025006.
183. Zeagler, C.; Gilliland, S.; Audy, S.; Starner, T. Can i Wash It?: The Effect of Washing
Conductive Materials Usedin Making Textile Based Wearable Electronic Interfaces. In
Proceedings of the Proceedings of the 17th annual international symposium on
Literature review
69
International symposium on wearable computers - ISWC ’13; ACM Press: Zurich,
Switzerland, 2013; p. 143.
184. Hughes-Riley, T.; Dias, T.; Cork, C. A Historical Review of the Development of
Electronic Textiles. Fibers 2018, 6, 34, doi:10.3390/fib6020034.
185. Lund, A.; van der Velden, N.M.; Persson, N.-K.; Hamedi, M.M.; Müller, C.
Electrically Conducting Fibres for E-Textiles: An Open Playground for Conjugated
Polymers and Carbon Nanomaterials. Materials Science and Engineering: R: Reports
2018, 126, 1–29, doi:10.1016/j.mser.2018.03.001.
186. Wilson; Laing Fabrics and Garments as Sensors: A Research Update. Sensors 2019, 19,
3570, doi:10.3390/s19163570.
187. Hwang, B.; Lund, A.; Tian, Y.; Darabi, S.; Müller, C. Machine-Washable Conductive
Silk Yarns with a Composite Coating of Ag Nanowires and PEDOT:PSS. ACS Appl.
Mater. Interfaces 2020, 12, 27537–27544, doi:10.1021/acsami.0c04316.
188. Ismar, E.; Zaman, S. uz; Tao, X.; Cochrane, C.; Koncar, V. Effect of Water and
Chemical Stresses on the Silver Coated Polyamide Yarns. Fibers and Polymers 2019,
20, 2604–2610, doi:10.1007/s12221-019-9266-4.
189. uz Zaman, S.; Tao, X.; Cochrane, C.; Koncar, V. Launderability of Conductive
Polymer Yarns Used for Connections of E-Textile Modules: Mechanical Stresses.
Fibers and Polymers 2019, 20, 2355–2366, doi:10.1007/s12221-019-9325-x.
190. Rotzler, S.; Kallmayer, C.; Dils, C.; von Krshiwoblozki, M.; Bauer, U.; Schneider-
Ramelow, M. Improving the Washability of Smart Textiles: Influence of Different
Washing Conditions on Textile Integrated Conductor Tracks. The Journal of The
Textile Institute 2020, 1–12, doi:10.1080/00405000.2020.1729056.
191. Kazani, I.; De Mey, G.; Klepacko, R.; Hertleer, C.; Guxho, G.; Van Langenhove, L.;
Napieralski, A. Influence of Dry Cleaning on the Electrical Resistance of Screen
Printed Conductors on Textiles. Autex Research Journal 2016, 16, 146–153,
doi:10.1515/aut-2015-0019.
192. Kazani, I.; Declercq, F.; Scarpello, M.L.; Hertleer, C.; Rogier, H.; Vande Ginste, D.;
De Mey, G.; Guxho, G.; Van Langenhove, L. Performance Study of Screen-Printed
Textile Antennas after Repeated Washing. Autex Research Journal 2014, 14, 47–54,
doi:10.2478/v10304-012-0049-x.
193. Salavagione, H.J.; Shuttleworth, P.S.; Fernández-Blázquez, J.P.; Ellis, G.J.; Gómez-
Fatou, M.A. Scalable Graphene-Based Nanocomposite Coatings for Flexible and
Literature review
70
Washable Conductive Textiles. Carbon 2020, 167, 495–503,
doi:10.1016/j.carbon.2020.05.108.
194. Liang, A.; Stewart, R.; Freire, R.; Bryan-Kinns, N. Effect of Bonding and Washing on
Electronic Textile Stretch Sensor Properties. In Proceedings of the Proceedings of the
2019 ACM International Joint Conference on Pervasive and Ubiquitous Computing and
Proceedings of the 2019 ACM International Symposium on Wearable Computers -
UbiComp/ISWC ’19; ACM Press: London, United Kingdom, 2019; pp. 121–124.
195. Gaubert, V.; Gidik, H.; Bodart, N.; Koncar, V. Investigating the Impact of Washing
Cycles on Silver-Plated Textile Electrodes: A Complete Study. Sensors 2020, 20, 1739,
doi:10.3390/s20061739.
196. Ojstršek, A.; Gorgieva, S. Tailoring of Durable Conductive and UV-Shielding
Properties on Cotton and Polyester Fabrics by PEDOT:PSS Screen-Printing. Polymers
2020, 12, 2356, doi:10.3390/polym12102356.
197. Schwarz, A.; Kazani, I.; Cuny, L.; Hertleer, C.; Ghekiere, F.; De Clercq, G.; De Mey,
G.; Van Langenhove, L. Electro-Conductive and Elastic Hybrid Yarns – The Effects of
Stretching, Cyclic Straining and Washing on Their Electro-Conductive Properties.
Materials & Design 2011, 32, 4247–4256, doi:10.1016/j.matdes.2011.04.021.
Materials and Methods
71
3. Materials and Methods
Introduction
The early-stage e-textile products are yet far from being integrated into a comprehensive
Internet-of-Things infrastructure, with standard protocols for secure data access from/to the
cloud and as platforms for smart textiles. A lack of the possibility exists, for both the users
and development communities, to build innovative solutions by integrating them with new
functionalities, still guaranteeing the elevated level of security and safety that is essential to
secure user acceptance. From that perspective, there is still room for improvement to build an
entirely new industry of smart e-textiles. It will constitute the future IoT nodes for wearable
electronics, smart and communicating composite parts, and integrate fully with existing IoT
infrastructures, standardized interfaces, and open tools for application developers. Solving this
dilemma and unlocking the IoT of smart wearable e-textiles and smart technical textiles is
exactly the future vision. Once this is done and validated in the use-case scenarios that may be
envisaged, the market opportunity seems enormous under the condition that all new exciting
smart textile connected devices are reliable and washable, if necessary.
This study is designed first to understand the different types of washing processes for home
laundry and then to finalize the effect of different washing cycles on smart textile components
Materials and Methods
72
in terms of their conductivity. The second part is to co-relate available textile testing methods
with the washability behavior of smart textile components. Preparing the samples repeatedly
and destroying them in the washing is a difficult task and not budget-friendly. Therefore,
there should be a better way to understand washing cycles, separate different washing factors,
and co-relate them with available testing methods. As a result, we can predict some
statements that specific smart textiles will work up to a certain number of washing cycles.
Many researchers had worked on e-textile standards. The previous chapter explained the
usage of available standards by various groups according to their local requirements and how
to follow these standards. They claimed the washability and reliability of their prototypes with
different washing standards and the various washing cycles according to their availability. For
example, some of them can state the product reliability based on some specific standard, but it
may not be a good nom to follow for others. As those standards are not designed for e-textile
systems, their abusive adoption for e-textile systems may raise questions regarding market
adaptability issues. The need for well-developed standards or procedures is essential to
produce reliable e-textile systems acceptable for customers worldwide.
3.1 Plan of experiments
Different experiments were performed on various e-textile components depending on the
component requirements. Table 3.1 and Figure 3.1 explain in detail information about these
experiments. Experimental work is divided into three main portions: washing programs
analysis, washing actions analysis, and e-textile system components damage analysis. In the
first portion of the experiments, six different washing programs available in the household
washing machine were investigated using their running time, stop time, and high-speed
tumbling time. Different washing stresses experienced in the process were also studied. In the
second phase, various washing actions undergo in the washing machines were investigated
using the accelerometer placed in the washing machine. In the last portion, various e-textile
system components were examined for washing stresses triggered during the washing process.
Finally, alternate available test methods were experimented on the e-textile systems to predict
the washing stress damages without actually washing the products.
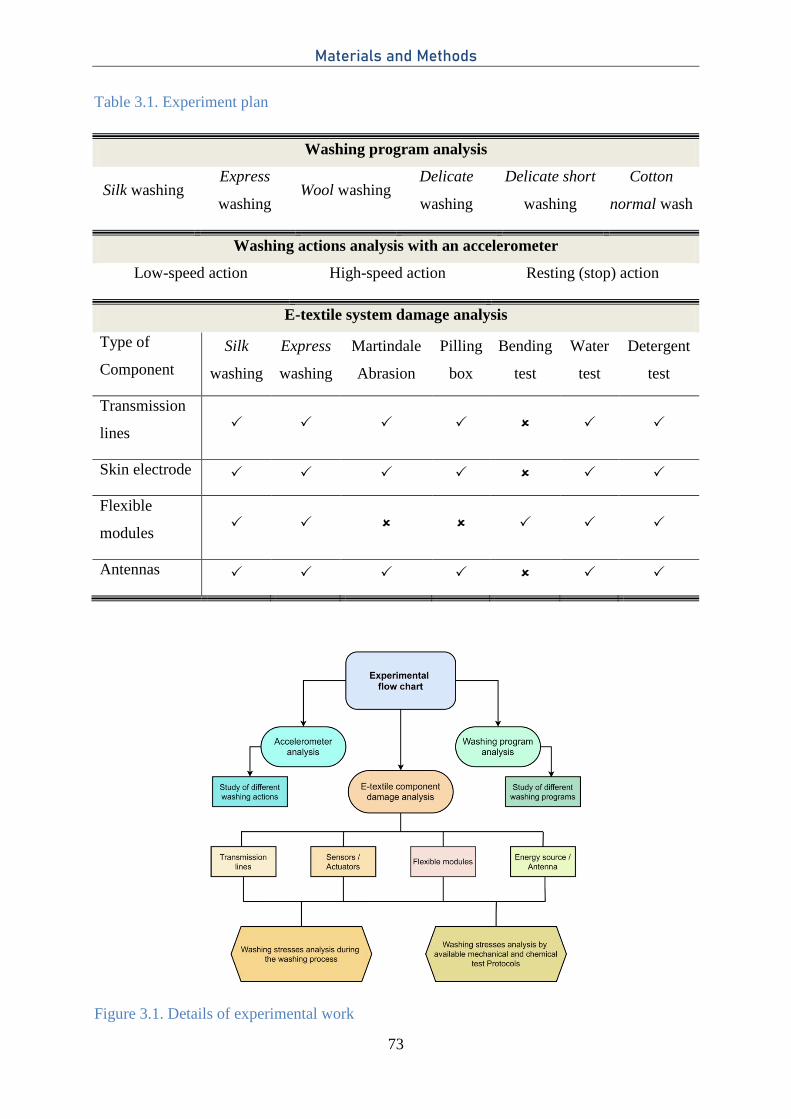
Materials and Methods
73
Table 3.1. Experiment plan
Washing program analysis
Silk washing Express
washing Wool washing
Delicate
washing
Delicate short
washing
Cotton
normal wash
Washing actions analysis with an accelerometer
Low-speed action High-speed action Resting (stop) action
E-textile system damage analysis
Type of
Component
Silk
washing
Express
washing
Martindale
Abrasion
Pilling
box
Bending
test
Water
test
Detergent
test
Transmission
lines
Skin electrode
Flexible
modules
Antennas
Figure 3.1. Details of experimental work
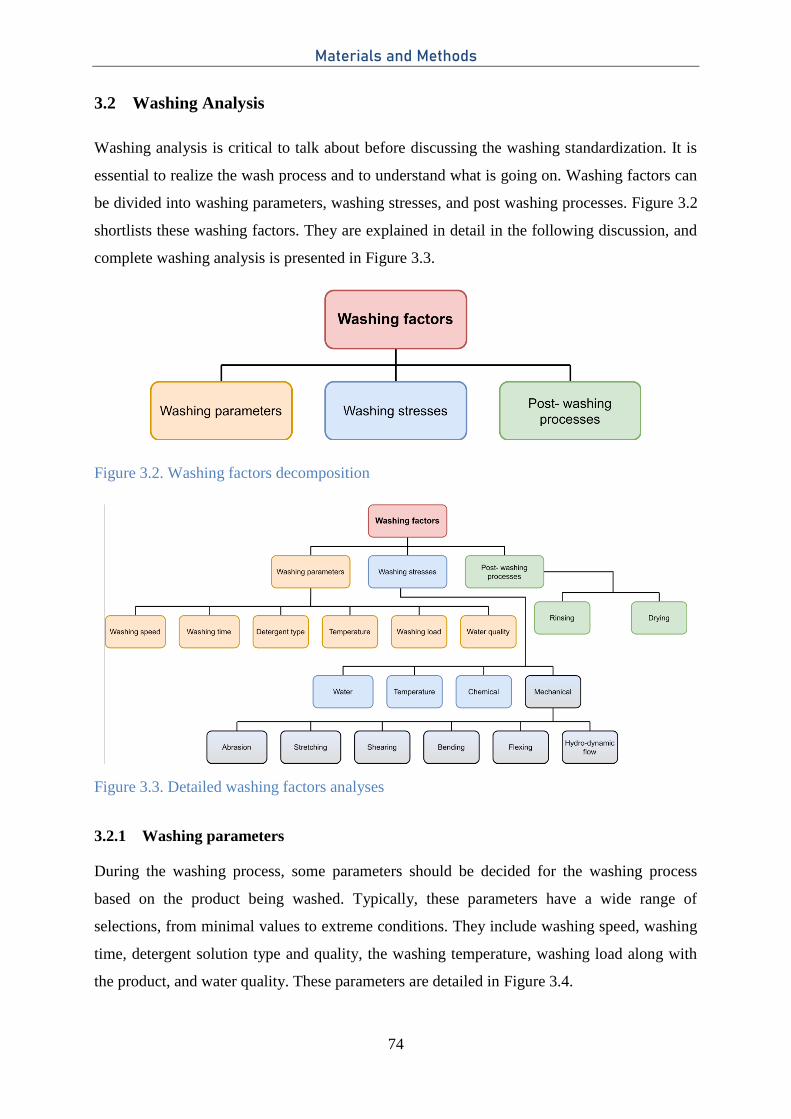
Materials and Methods
74
3.2 Washing Analysis
Washing analysis is critical to talk about before discussing the washing standardization. It is
essential to realize the wash process and to understand what is going on. Washing factors can
be divided into washing parameters, washing stresses, and post washing processes. Figure 3.2
shortlists these washing factors. They are explained in detail in the following discussion, and
complete washing analysis is presented in Figure 3.3.
Figure 3.2. Washing factors decomposition
Figure 3.3. Detailed washing factors analyses
3.2.1 Washing parameters
During the washing process, some parameters should be decided for the washing process
based on the product being washed. Typically, these parameters have a wide range of
selections, from minimal values to extreme conditions. They include washing speed, washing
time, detergent solution type and quality, the washing temperature, washing load along with
the product, and water quality. These parameters are detailed in Figure 3.4.
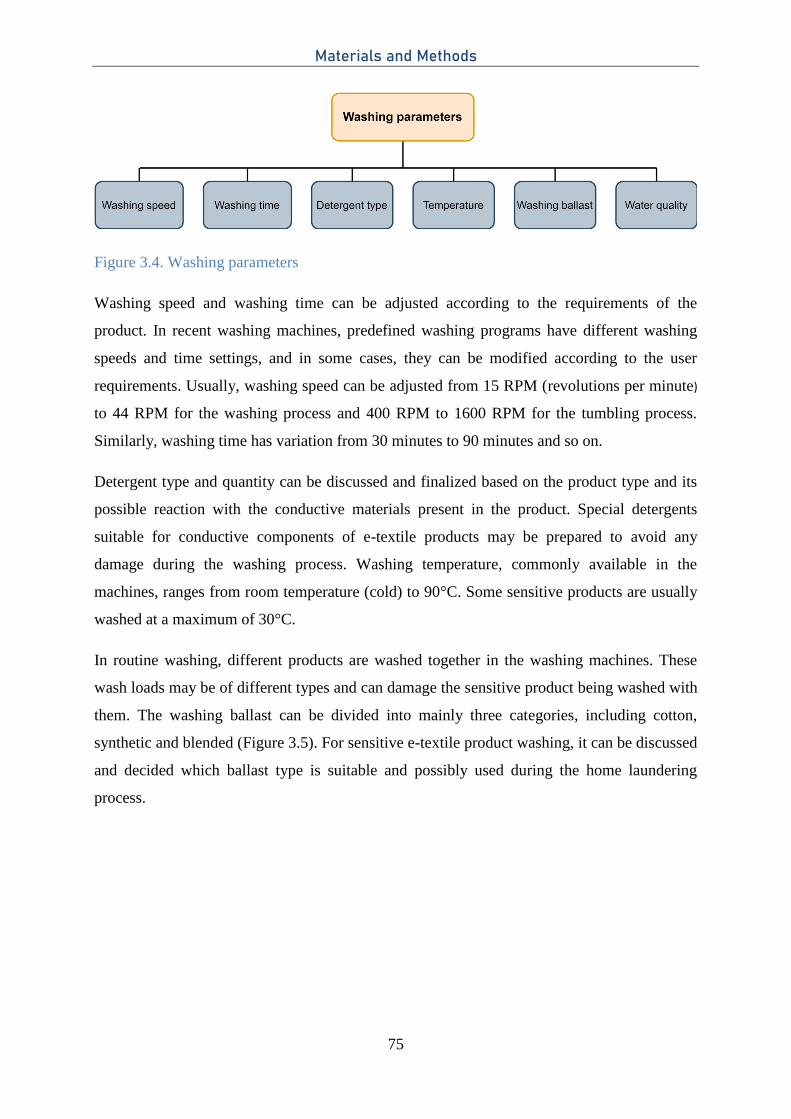
Materials and Methods
75
Figure 3.4. Washing parameters
Washing speed and washing time can be adjusted according to the requirements of the
product. In recent washing machines, predefined washing programs have different washing
speeds and time settings, and in some cases, they can be modified according to the user
requirements. Usually, washing speed can be adjusted from 15 RPM (revolutions per minute)
to 44 RPM for the washing process and 400 RPM to 1600 RPM for the tumbling process.
Similarly, washing time has variation from 30 minutes to 90 minutes and so on.
Detergent type and quantity can be discussed and finalized based on the product type and its
possible reaction with the conductive materials present in the product. Special detergents
suitable for conductive components of e-textile products may be prepared to avoid any
damage during the washing process. Washing temperature, commonly available in the
machines, ranges from room temperature (cold) to 90°C. Some sensitive products are usually
washed at a maximum of 30°C.
In routine washing, different products are washed together in the washing machines. These
wash loads may be of different types and can damage the sensitive product being washed with
them. The washing ballast can be divided into mainly three categories, including cotton,
synthetic and blended (Figure 3.5). For sensitive e-textile product washing, it can be discussed
and decided which ballast type is suitable and possibly used during the home laundering
process.
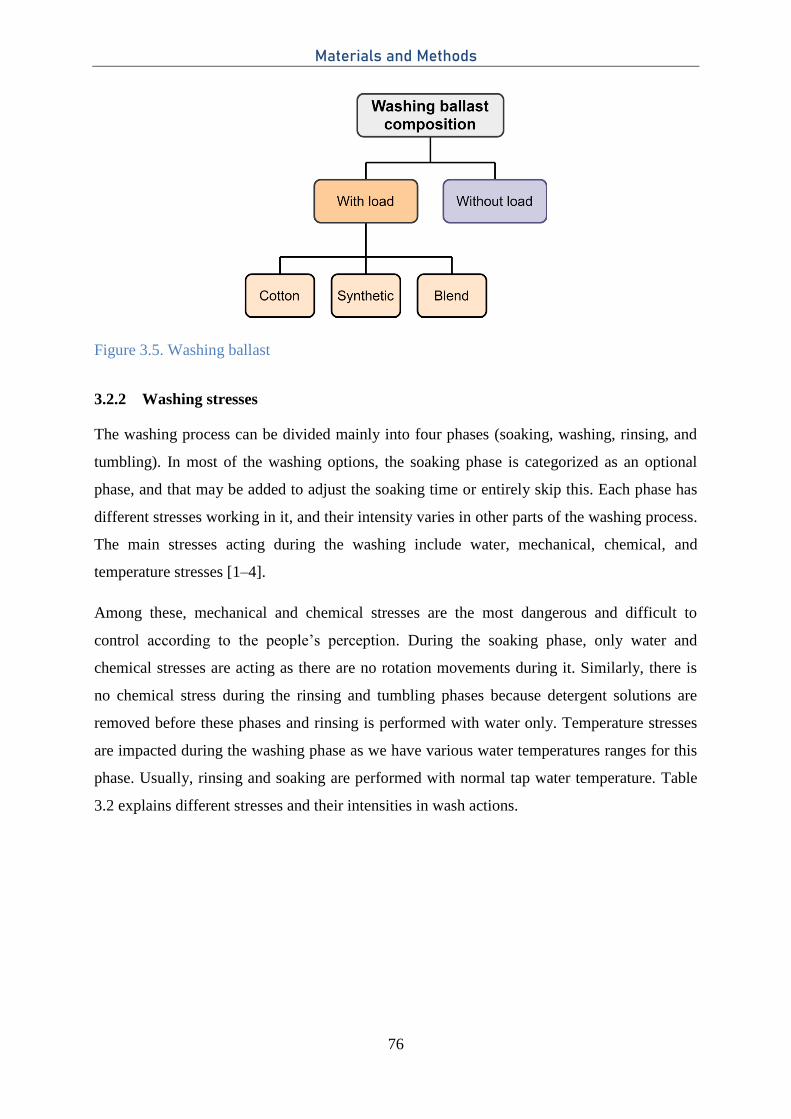
Materials and Methods
76
Figure 3.5. Washing ballast
3.2.2 Washing stresses
The washing process can be divided mainly into four phases (soaking, washing, rinsing, and
tumbling). In most of the washing options, the soaking phase is categorized as an optional
phase, and that may be added to adjust the soaking time or entirely skip this. Each phase has
different stresses working in it, and their intensity varies in other parts of the washing process.
The main stresses acting during the washing include water, mechanical, chemical, and
temperature stresses [1–4].
Among these, mechanical and chemical stresses are the most dangerous and difficult to
control according to the people’s perception. During the soaking phase, only water and
chemical stresses are acting as there are no rotation movements during it. Similarly, there is
no chemical stress during the rinsing and tumbling phases because detergent solutions are
removed before these phases and rinsing is performed with water only. Temperature stresses
are impacted during the washing phase as we have various water temperatures ranges for this
phase. Usually, rinsing and soaking are performed with normal tap water temperature. Table
3.2 explains different stresses and their intensities in wash actions.
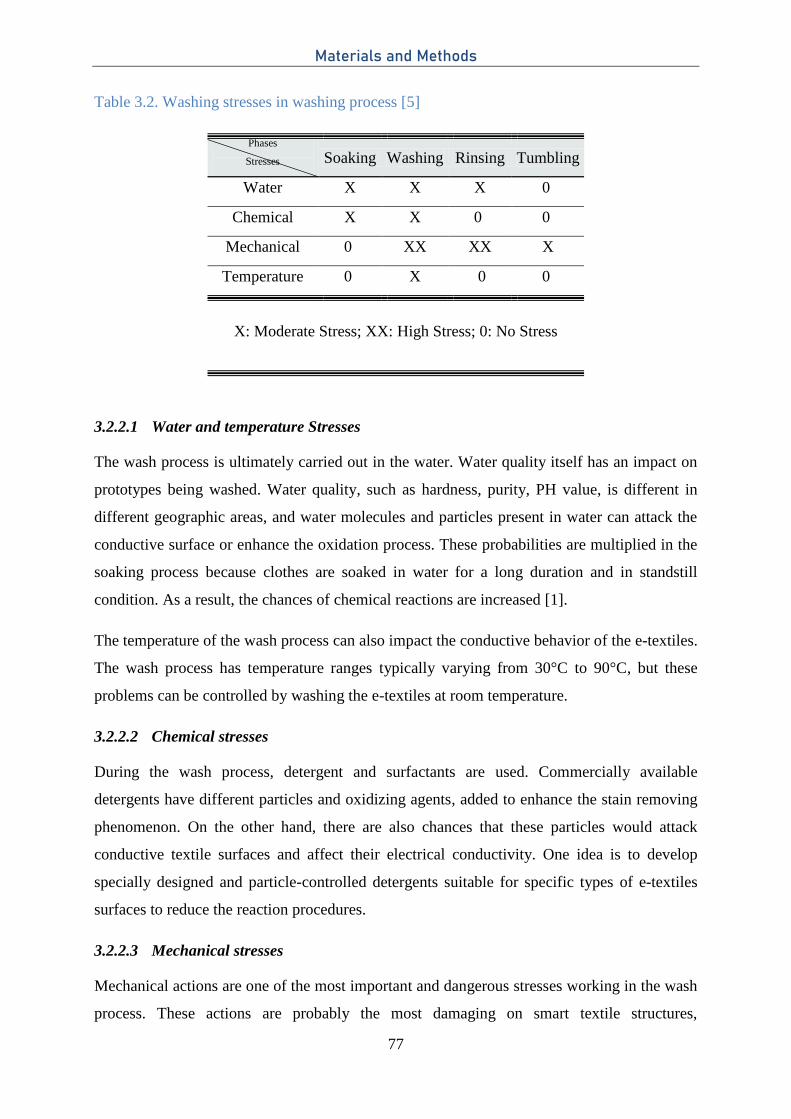
Materials and Methods
77
Table 3.2. Washing stresses in washing process [5]
Phases
Stresses
Soaking Washing Rinsing Tumbling
Water X X X 0
Chemical X X 0 0
Mechanical 0 XX XX X
Temperature 0 X 0 0
X: Moderate Stress; XX: High Stress; 0: No Stress
3.2.2.1 Water and temperature Stresses
The wash process is ultimately carried out in the water. Water quality itself has an impact on
prototypes being washed. Water quality, such as hardness, purity, PH value, is different in
different geographic areas, and water molecules and particles present in water can attack the
conductive surface or enhance the oxidation process. These probabilities are multiplied in the
soaking process because clothes are soaked in water for a long duration and in standstill
condition. As a result, the chances of chemical reactions are increased [1].
The temperature of the wash process can also impact the conductive behavior of the e-textiles.
The wash process has temperature ranges typically varying from 30°C to 90°C, but these
problems can be controlled by washing the e-textiles at room temperature.
3.2.2.2 Chemical stresses
During the wash process, detergent and surfactants are used. Commercially available
detergents have different particles and oxidizing agents, added to enhance the stain removing
phenomenon. On the other hand, there are also chances that these particles would attack
conductive textile surfaces and affect their electrical conductivity. One idea is to develop
specially designed and particle-controlled detergents suitable for specific types of e-textiles
surfaces to reduce the reaction procedures.
3.2.2.3 Mechanical stresses
Mechanical actions are one of the most important and dangerous stresses working in the wash
process. These actions are probably the most damaging on smart textile structures,
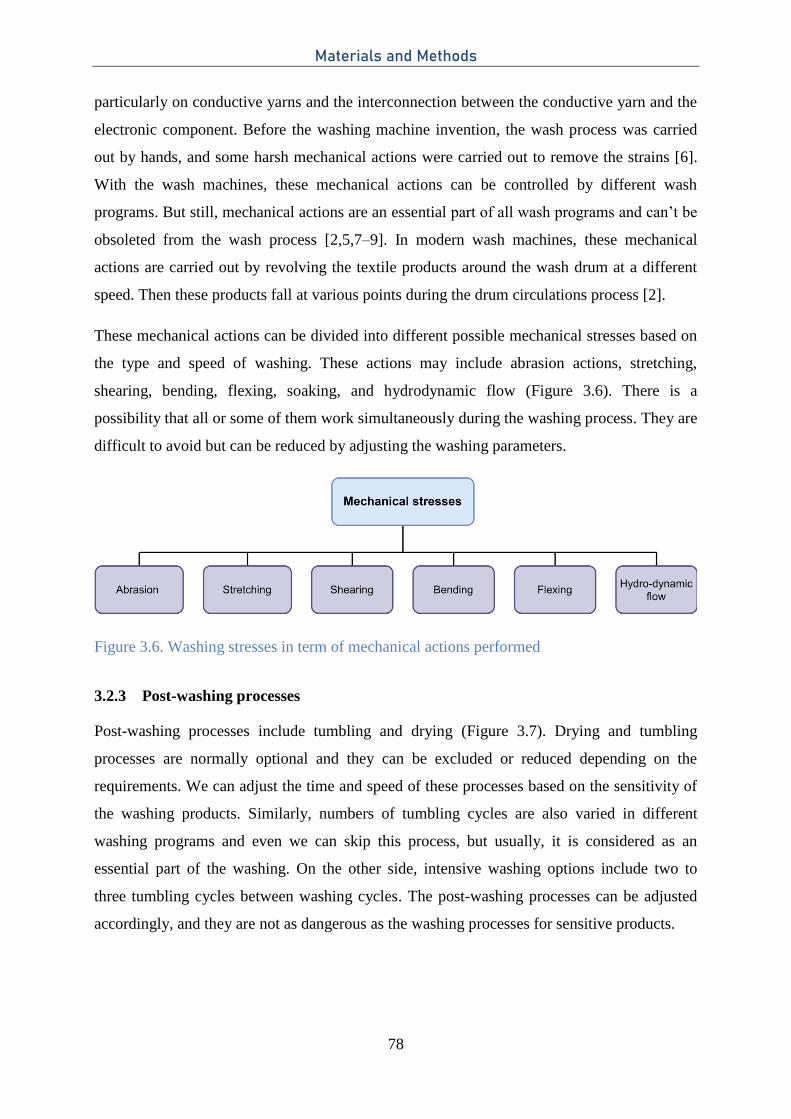
Materials and Methods
78
particularly on conductive yarns and the interconnection between the conductive yarn and the
electronic component. Before the washing machine invention, the wash process was carried
out by hands, and some harsh mechanical actions were carried out to remove the strains [6].
With the wash machines, these mechanical actions can be controlled by different wash
programs. But still, mechanical actions are an essential part of all wash programs and can’t be
obsoleted from the wash process [2,5,7–9]. In modern wash machines, these mechanical
actions are carried out by revolving the textile products around the wash drum at a different
speed. Then these products fall at various points during the drum circulations process [2].
These mechanical actions can be divided into different possible mechanical stresses based on
the type and speed of washing. These actions may include abrasion actions, stretching,
shearing, bending, flexing, soaking, and hydrodynamic flow (Figure 3.6). There is a
possibility that all or some of them work simultaneously during the washing process. They are
difficult to avoid but can be reduced by adjusting the washing parameters.
Figure 3.6. Washing stresses in term of mechanical actions performed
3.2.3 Post-washing processes
Post-washing processes include tumbling and drying (Figure 3.7). Drying and tumbling
processes are normally optional and they can be excluded or reduced depending on the
requirements. We can adjust the time and speed of these processes based on the sensitivity of
the washing products. Similarly, numbers of tumbling cycles are also varied in different
washing programs and even we can skip this process, but usually, it is considered as an
essential part of the washing. On the other side, intensive washing options include two to
three tumbling cycles between washing cycles. The post-washing processes can be adjusted
accordingly, and they are not as dangerous as the washing processes for sensitive products.
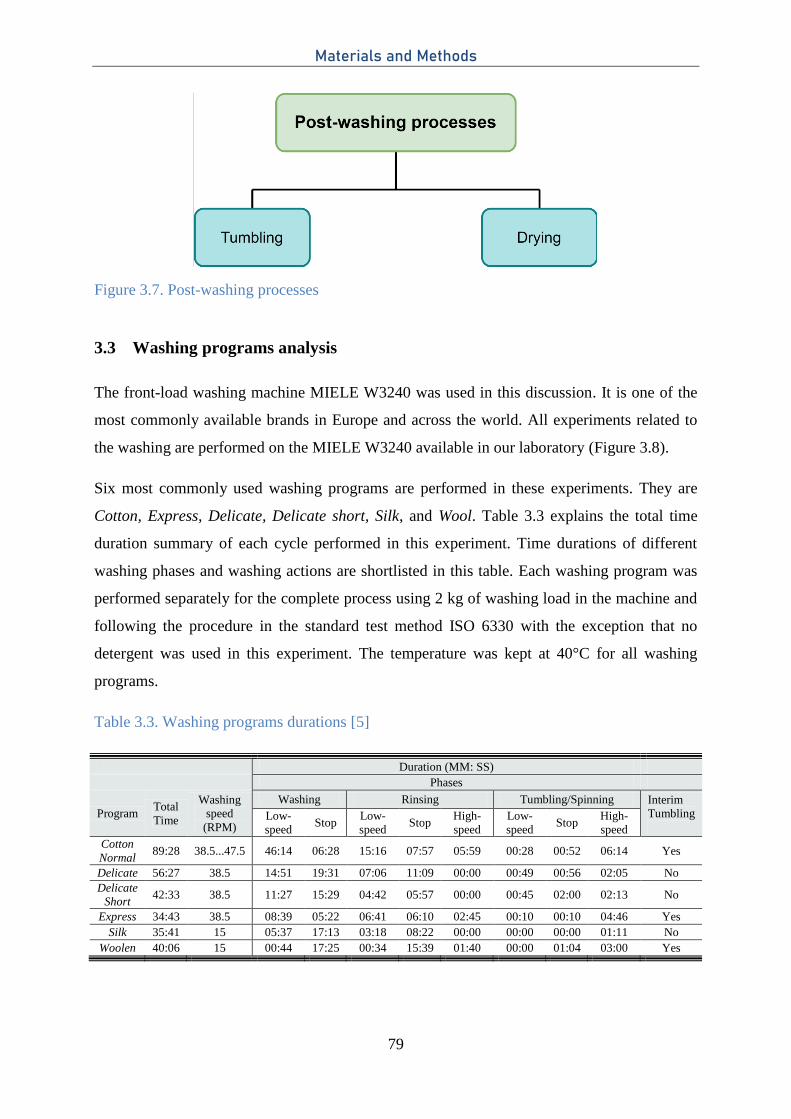
Materials and Methods
79
Figure 3.7. Post-washing processes
3.3 Washing programs analysis
The front-load washing machine MIELE W3240 was used in this discussion. It is one of the
most commonly available brands in Europe and across the world. All experiments related to
the washing are performed on the MIELE W3240 available in our laboratory (Figure 3.8).
Six most commonly used washing programs are performed in these experiments. They are
Cotton, Express, Delicate, Delicate short, Silk, and Wool. Table 3.3 explains the total time
duration summary of each cycle performed in this experiment. Time durations of different
washing phases and washing actions are shortlisted in this table. Each washing program was
performed separately for the complete process using 2 kg of washing load in the machine and
following the procedure in the standard test method ISO 6330 with the exception that no
detergent was used in this experiment. The temperature was kept at 40°C for all washing
programs.
Table 3.3. Washing programs durations [5]
Duration (MM: SS)
Phases
Program Total
Time
Washing
speed
(RPM)
Washing Rinsing Tumbling/Spinning Interim
Tumbling
Low-
speed Stop
Low-
speed Stop
High-
speed
Low-
speed Stop
High-
speed
Cotton
Normal 89:28 38.5...47.5 46:14 06:28 15:16 07:57 05:59 00:28 00:52 06:14 Yes
Delicate 56:27 38.5 14:51 19:31 07:06 11:09 00:00 00:49 00:56 02:05 No
Delicate
Short 42:33 38.5 11:27 15:29 04:42 05:57 00:00 00:45 02:00 02:13 No
Express 34:43 38.5 08:39 05:22 06:41 06:10 02:45 00:10 00:10 04:46 Yes
Silk 35:41 15 05:37 17:13 03:18 08:22 00:00 00:00 00:00 01:11 No
Woolen 40:06 15 00:44 17:25 00:34 15:39 01:40 00:00 01:04 03:00 Yes
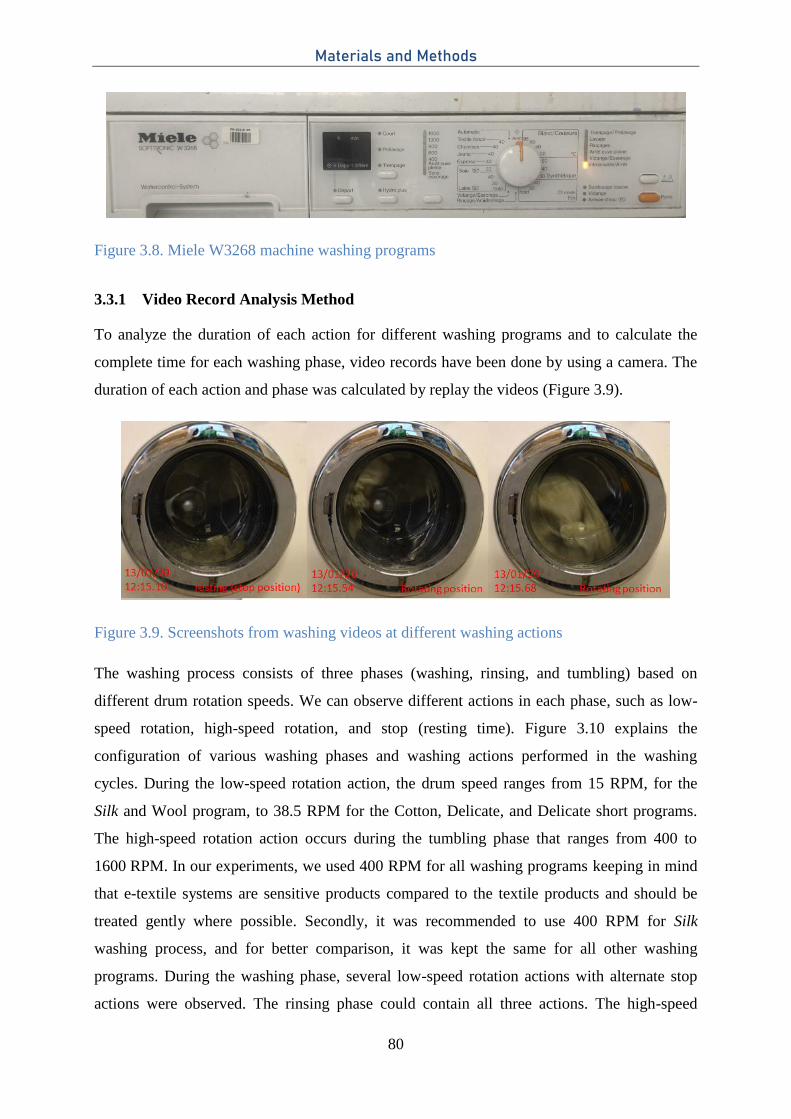
Materials and Methods
80
Figure 3.8. Miele W3268 machine washing programs
3.3.1 Video Record Analysis Method
To analyze the duration of each action for different washing programs and to calculate the
complete time for each washing phase, video records have been done by using a camera. The
duration of each action and phase was calculated by replay the videos (Figure 3.9).
Figure 3.9. Screenshots from washing videos at different washing actions
The washing process consists of three phases (washing, rinsing, and tumbling) based on
different drum rotation speeds. We can observe different actions in each phase, such as low-
speed rotation, high-speed rotation, and stop (resting time). Figure 3.10 explains the
configuration of various washing phases and washing actions performed in the washing
cycles. During the low-speed rotation action, the drum speed ranges from 15 RPM, for the
Silk and Wool program, to 38.5 RPM for the Cotton, Delicate, and Delicate short programs.
The high-speed rotation action occurs during the tumbling phase that ranges from 400 to
1600 RPM. In our experiments, we used 400 RPM for all washing programs keeping in mind
that e-textile systems are sensitive products compared to the textile products and should be
treated gently where possible. Secondly, it was recommended to use 400 RPM for Silk
washing process, and for better comparison, it was kept the same for all other washing
programs. During the washing phase, several low-speed rotation actions with alternate stop
actions were observed. The rinsing phase could contain all three actions. The high-speed
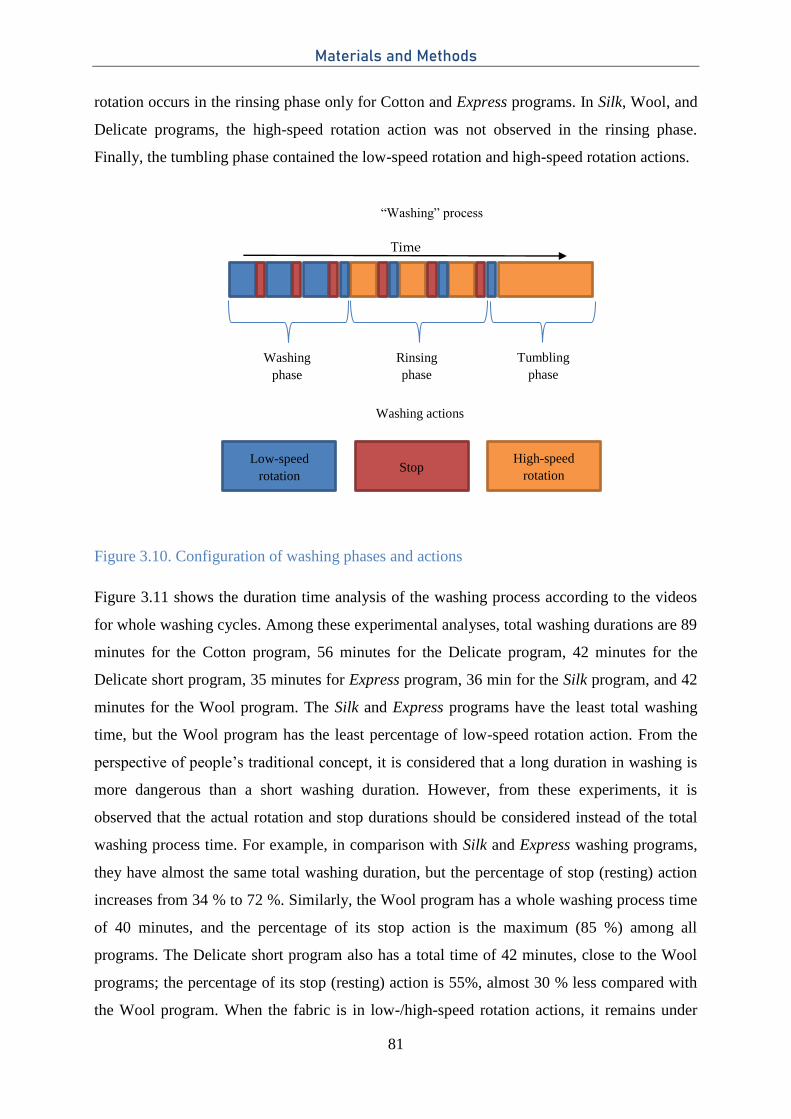
Materials and Methods
81
rotation occurs in the rinsing phase only for Cotton and Express programs. In Silk, Wool, and
Delicate programs, the high-speed rotation action was not observed in the rinsing phase.
Finally, the tumbling phase contained the low-speed rotation and high-speed rotation actions.
Figure 3.10. Configuration of washing phases and actions
Figure 3.11 shows the duration time analysis of the washing process according to the videos
for whole washing cycles. Among these experimental analyses, total washing durations are 89
minutes for the Cotton program, 56 minutes for the Delicate program, 42 minutes for the
Delicate short program, 35 minutes for Express program, 36 min for the Silk program, and 42
minutes for the Wool program. The Silk and Express programs have the least total washing
time, but the Wool program has the least percentage of low-speed rotation action. From the
perspective of people’s traditional concept, it is considered that a long duration in washing is
more dangerous than a short washing duration. However, from these experiments, it is
observed that the actual rotation and stop durations should be considered instead of the total
washing process time. For example, in comparison with Silk and Express washing programs,
they have almost the same total washing duration, but the percentage of stop (resting) action
increases from 34 % to 72 %. Similarly, the Wool program has a whole washing process time
of 40 minutes, and the percentage of its stop action is the maximum (85 %) among all
programs. The Delicate short program also has a total time of 42 minutes, close to the Wool
programs; the percentage of its stop (resting) action is 55%, almost 30 % less compared with
the Wool program. When the fabric is in low-/high-speed rotation actions, it remains under
High-speed
rotation
Low-speed
rotation Stop
Time
“Washing” process
Tumbling
phase
Rinsing
phase
Washing actions
Washing
phase
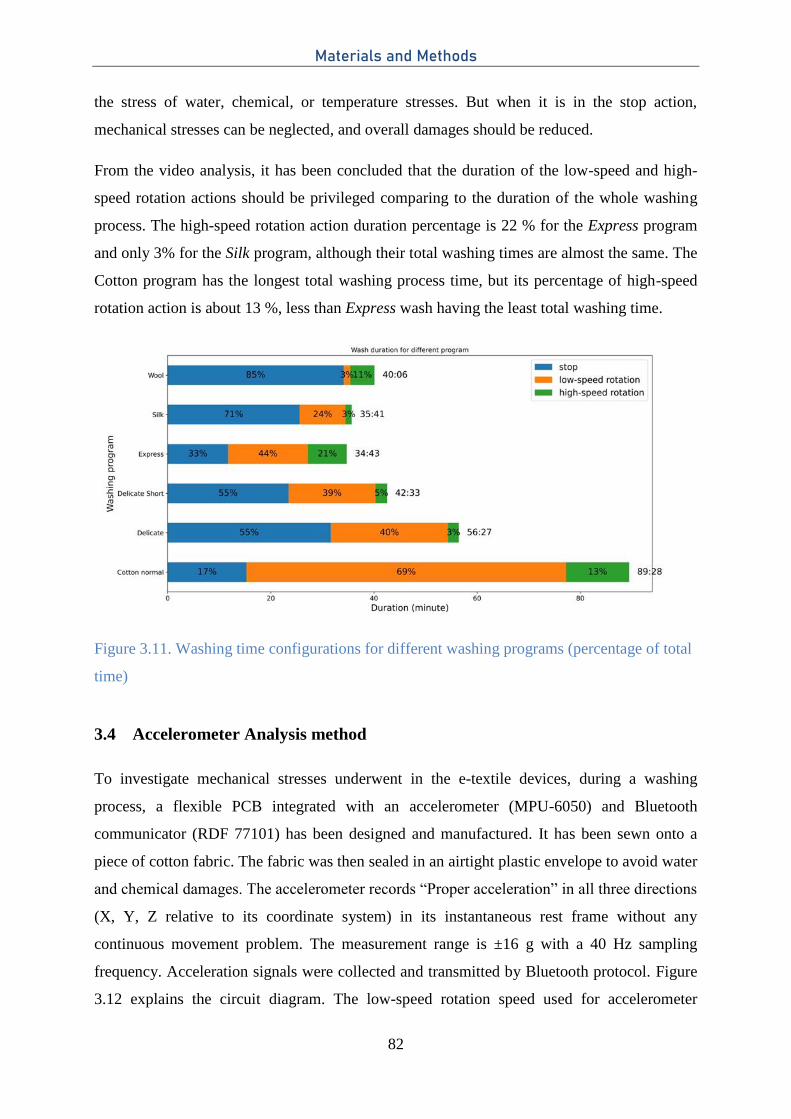
Materials and Methods
82
the stress of water, chemical, or temperature stresses. But when it is in the stop action,
mechanical stresses can be neglected, and overall damages should be reduced.
From the video analysis, it has been concluded that the duration of the low-speed and high-
speed rotation actions should be privileged comparing to the duration of the whole washing
process. The high-speed rotation action duration percentage is 22 % for the Express program
and only 3% for the Silk program, although their total washing times are almost the same. The
Cotton program has the longest total washing process time, but its percentage of high-speed
rotation action is about 13 %, less than Express wash having the least total washing time.
Figure 3.11. Washing time configurations for different washing programs (percentage of total
time)
3.4 Accelerometer Analysis method
To investigate mechanical stresses underwent in the e-textile devices, during a washing
process, a flexible PCB integrated with an accelerometer (MPU-6050) and Bluetooth
communicator (RDF 77101) has been designed and manufactured. It has been sewn onto a
piece of cotton fabric. The fabric was then sealed in an airtight plastic envelope to avoid water
and chemical damages. The accelerometer records “Proper acceleration” in all three directions
(X, Y, Z relative to its coordinate system) in its instantaneous rest frame without any
continuous movement problem. The measurement range is ±16 g with a 40 Hz sampling
frequency. Acceleration signals were collected and transmitted by Bluetooth protocol. Figure
3.12 explains the circuit diagram. The low-speed rotation speed used for accelerometer
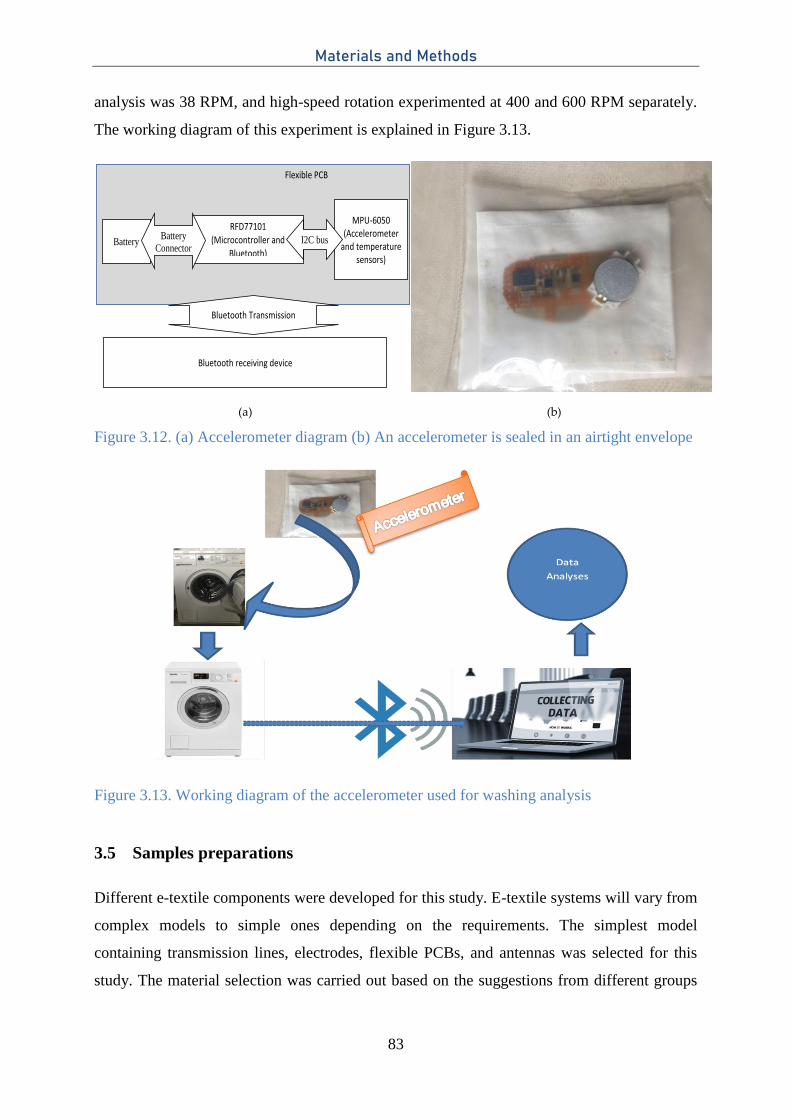
Materials and Methods
83
analysis was 38 RPM, and high-speed rotation experimented at 400 and 600 RPM separately.
The working diagram of this experiment is explained in Figure 3.13.
(a) (b)
Figure 3.12. (a) Accelerometer diagram (b) An accelerometer is sealed in an airtight envelope
Figure 3.13. Working diagram of the accelerometer used for washing analysis
3.5 Samples preparations
Different e-textile components were developed for this study. E-textile systems will vary from
complex models to simple ones depending on the requirements. The simplest model
containing transmission lines, electrodes, flexible PCBs, and antennas was selected for this
study. The material selection was carried out based on the suggestions from different groups
RFD77101
(Microcontroller and Bluetooth)
MPU-6050 (Accelerometer
and temperature sensors)
I2C bus Battery Battery
Connector
Bluetooth receiving device
Bluetooth Transmission
Flexible PCB
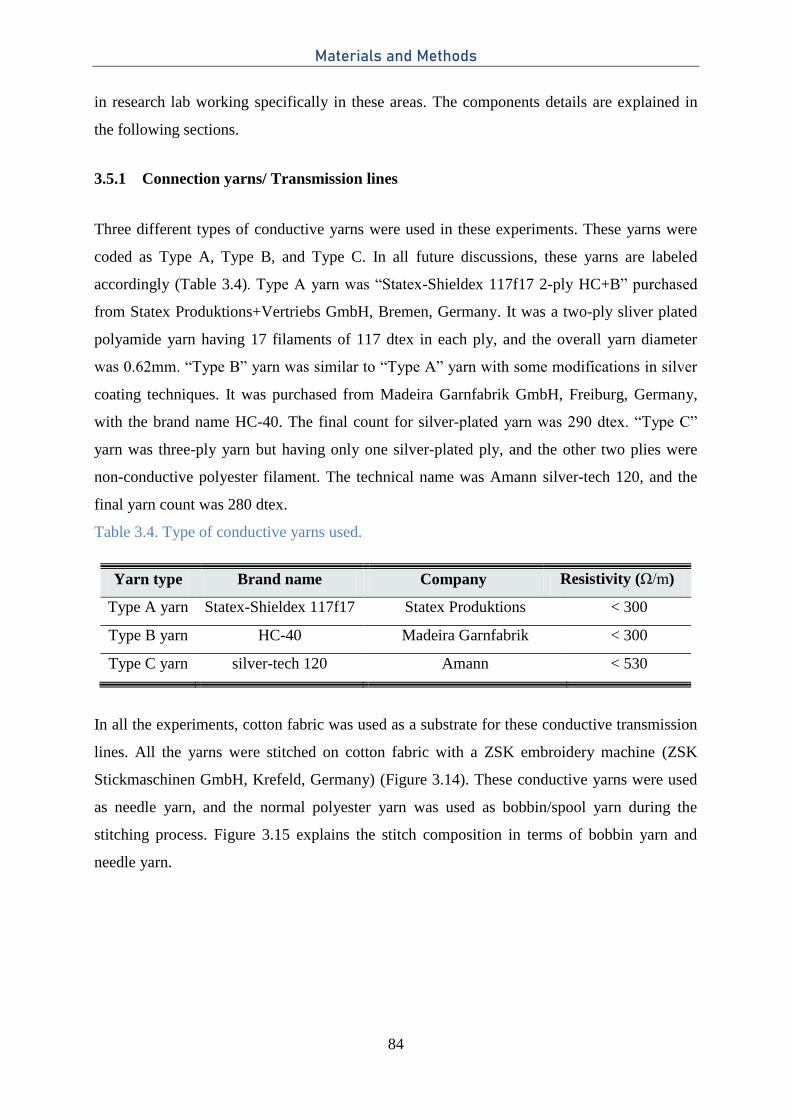
Materials and Methods
84
in research lab working specifically in these areas. The components details are explained in
the following sections.
3.5.1 Connection yarns/ Transmission lines
Three different types of conductive yarns were used in these experiments. These yarns were
coded as Type A, Type B, and Type C. In all future discussions, these yarns are labeled
accordingly (Table 3.4). Type A yarn was “Statex-Shieldex 117f17 2-ply HC+B” purchased
from Statex Produktions+Vertriebs GmbH, Bremen, Germany. It was a two-ply sliver plated
polyamide yarn having 17 filaments of 117 dtex in each ply, and the overall yarn diameter
was 0.62mm. “Type B” yarn was similar to “Type A” yarn with some modifications in silver
coating techniques. It was purchased from Madeira Garnfabrik GmbH, Freiburg, Germany,
with the brand name HC-40. The final count for silver-plated yarn was 290 dtex. “Type C”
yarn was three-ply yarn but having only one silver-plated ply, and the other two plies were
non-conductive polyester filament. The technical name was Amann silver-tech 120, and the
final yarn count was 280 dtex.
Table 3.4. Type of conductive yarns used.
Yarn type Brand name Company Resistivity (Ω/m)
Type A yarn Statex-Shieldex 117f17 Statex Produktions < 300
Type B yarn HC-40 Madeira Garnfabrik < 300
Type C yarn silver-tech 120 Amann < 530
In all the experiments, cotton fabric was used as a substrate for these conductive transmission
lines. All the yarns were stitched on cotton fabric with a ZSK embroidery machine (ZSK
Stickmaschinen GmbH, Krefeld, Germany) (Figure 3.14). These conductive yarns were used
as needle yarn, and the normal polyester yarn was used as bobbin/spool yarn during the
stitching process. Figure 3.15 explains the stitch composition in terms of bobbin yarn and
needle yarn.
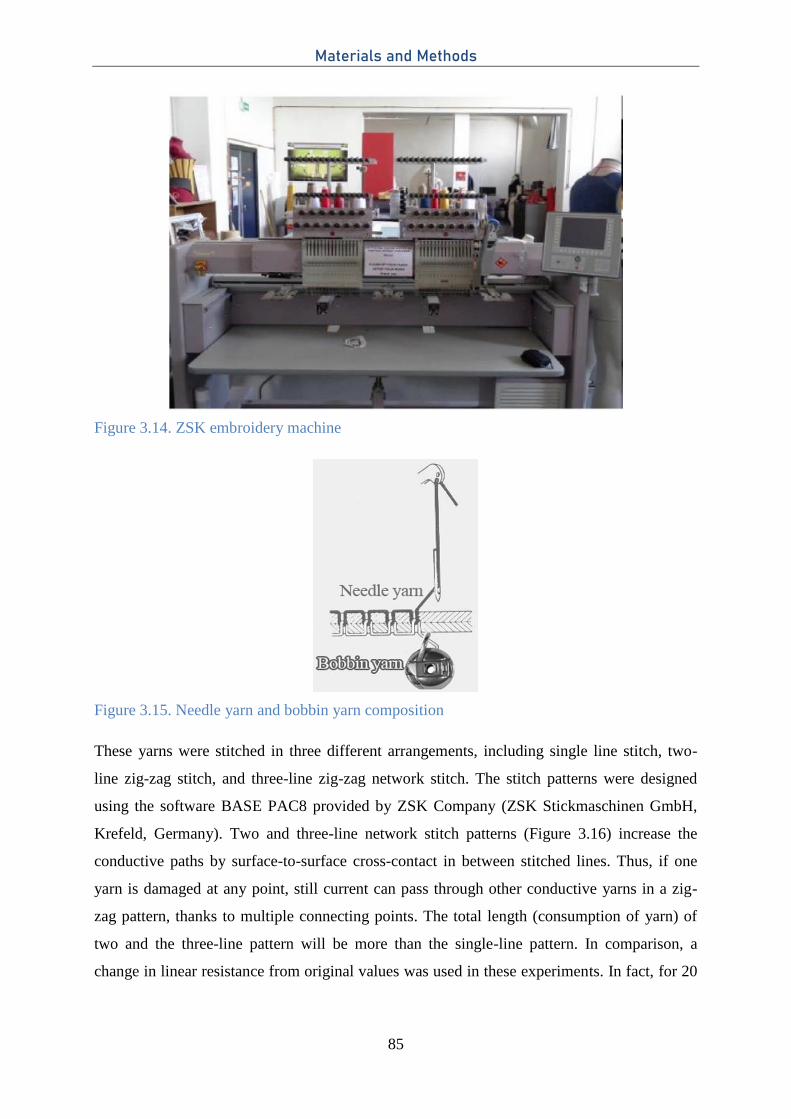
Materials and Methods
85
Figure 3.14. ZSK embroidery machine
Figure 3.15. Needle yarn and bobbin yarn composition
These yarns were stitched in three different arrangements, including single line stitch, two-
line zig-zag stitch, and three-line zig-zag network stitch. The stitch patterns were designed
using the software BASE PAC8 provided by ZSK Company (ZSK Stickmaschinen GmbH,
Krefeld, Germany). Two and three-line network stitch patterns (Figure 3.16) increase the
conductive paths by surface-to-surface cross-contact in between stitched lines. Thus, if one
yarn is damaged at any point, still current can pass through other conductive yarns in a zig-
zag pattern, thanks to multiple connecting points. The total length (consumption of yarn) of
two and the three-line pattern will be more than the single-line pattern. In comparison, a
change in linear resistance from original values was used in these experiments. In fact, for 20
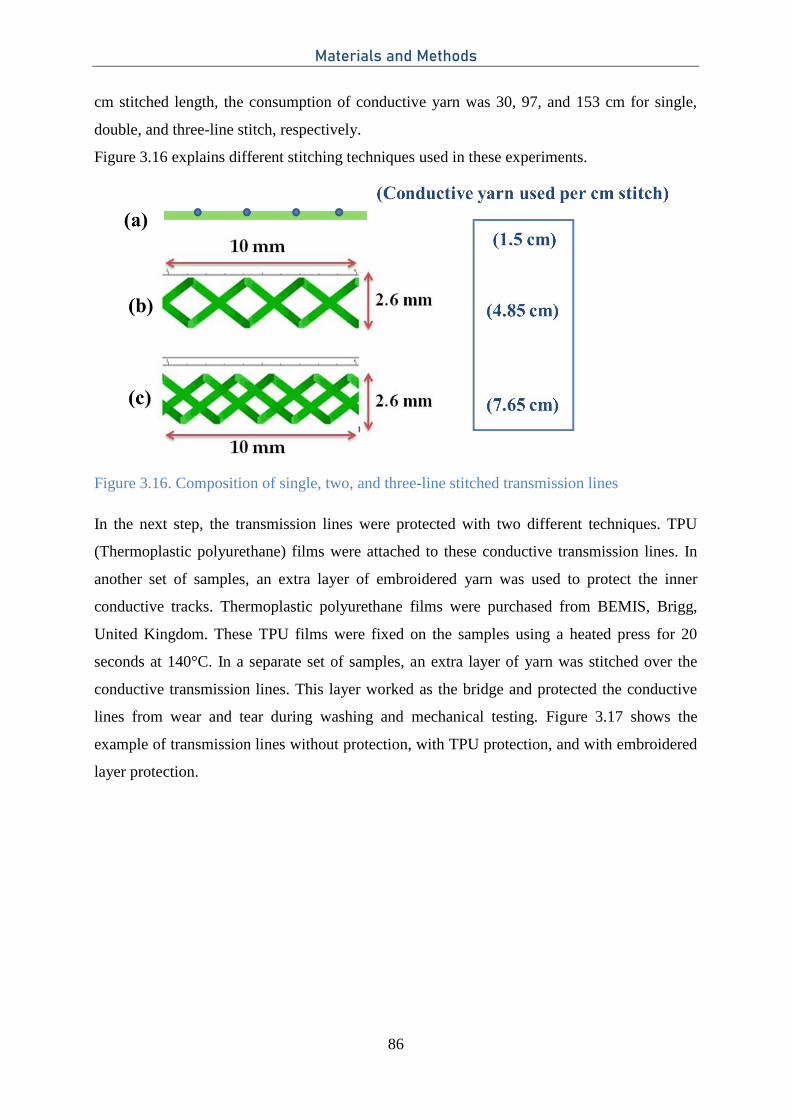
Materials and Methods
86
cm stitched length, the consumption of conductive yarn was 30, 97, and 153 cm for single,
double, and three-line stitch, respectively.
Figure 3.16 explains different stitching techniques used in these experiments.
Figure 3.16. Composition of single, two, and three-line stitched transmission lines
In the next step, the transmission lines were protected with two different techniques. TPU
(Thermoplastic polyurethane) films were attached to these conductive transmission lines. In
another set of samples, an extra layer of embroidered yarn was used to protect the inner
conductive tracks. Thermoplastic polyurethane films were purchased from BEMIS, Brigg,
United Kingdom. These TPU films were fixed on the samples using a heated press for 20
seconds at 140°C. In a separate set of samples, an extra layer of yarn was stitched over the
conductive transmission lines. This layer worked as the bridge and protected the conductive
lines from wear and tear during washing and mechanical testing. Figure 3.17 shows the
example of transmission lines without protection, with TPU protection, and with embroidered
layer protection.
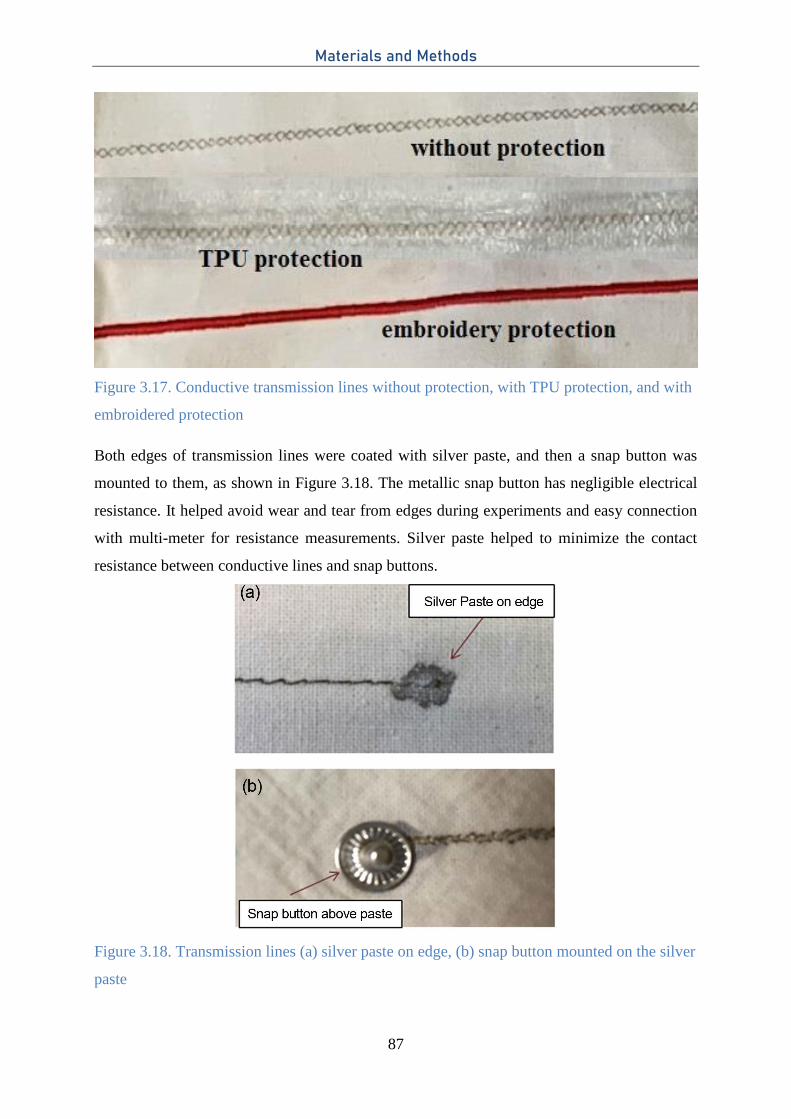
Materials and Methods
87
Figure 3.17. Conductive transmission lines without protection, with TPU protection, and with
embroidered protection
Both edges of transmission lines were coated with silver paste, and then a snap button was
mounted to them, as shown in Figure 3.18. The metallic snap button has negligible electrical
resistance. It helped avoid wear and tear from edges during experiments and easy connection
with multi-meter for resistance measurements. Silver paste helped to minimize the contact
resistance between conductive lines and snap buttons.
Figure 3.18. Transmission lines (a) silver paste on edge, (b) snap button mounted on the silver
paste
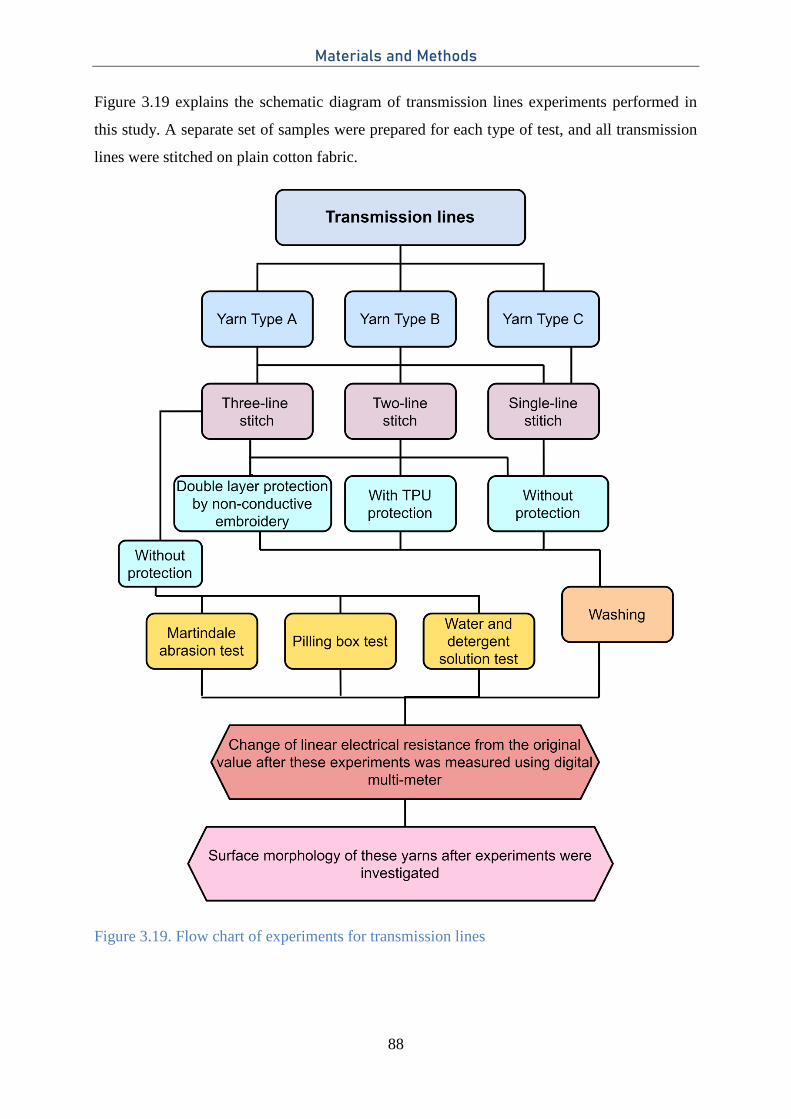
Materials and Methods
88
Figure 3.19 explains the schematic diagram of transmission lines experiments performed in
this study. A separate set of samples were prepared for each type of test, and all transmission
lines were stitched on plain cotton fabric.
Figure 3.19. Flow chart of experiments for transmission lines
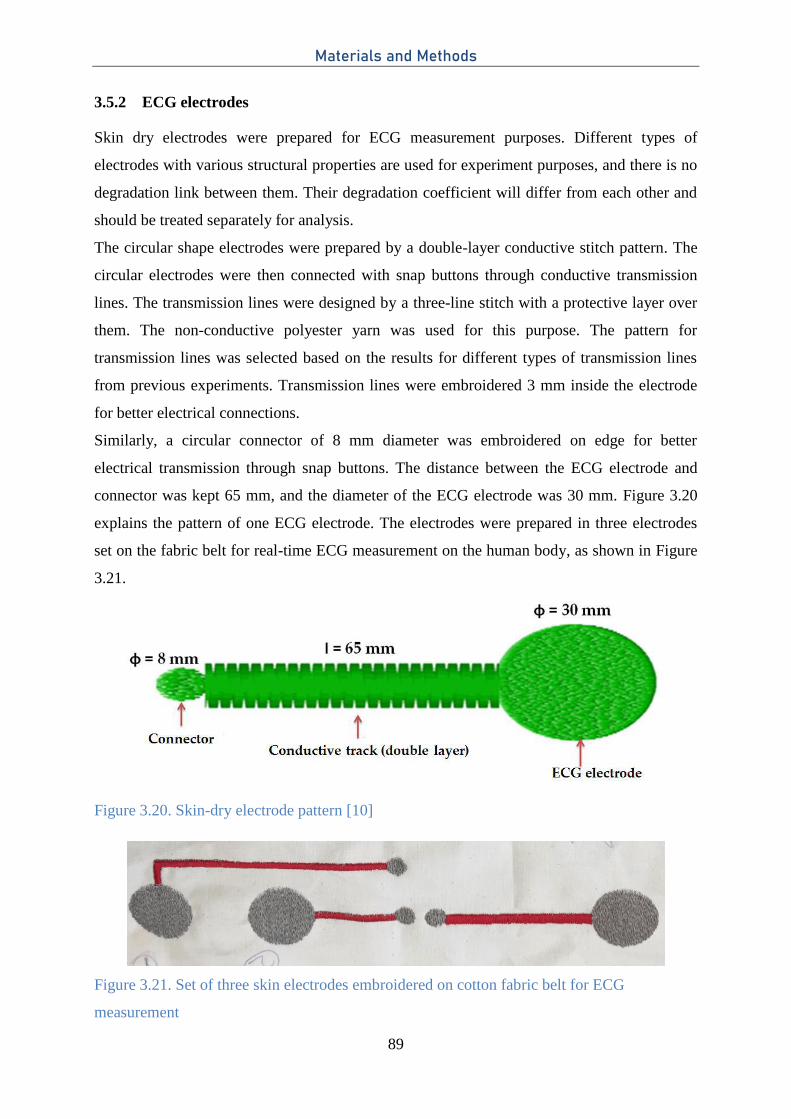
Materials and Methods
89
3.5.2 ECG electrodes
Skin dry electrodes were prepared for ECG measurement purposes. Different types of
electrodes with various structural properties are used for experiment purposes, and there is no
degradation link between them. Their degradation coefficient will differ from each other and
should be treated separately for analysis.
The circular shape electrodes were prepared by a double-layer conductive stitch pattern. The
circular electrodes were then connected with snap buttons through conductive transmission
lines. The transmission lines were designed by a three-line stitch with a protective layer over
them. The non-conductive polyester yarn was used for this purpose. The pattern for
transmission lines was selected based on the results for different types of transmission lines
from previous experiments. Transmission lines were embroidered 3 mm inside the electrode
for better electrical connections.
Similarly, a circular connector of 8 mm diameter was embroidered on edge for better
electrical transmission through snap buttons. The distance between the ECG electrode and
connector was kept 65 mm, and the diameter of the ECG electrode was 30 mm. Figure 3.20
explains the pattern of one ECG electrode. The electrodes were prepared in three electrodes
set on the fabric belt for real-time ECG measurement on the human body, as shown in Figure
3.21.
Figure 3.20. Skin-dry electrode pattern [10]
Figure 3.21. Set of three skin electrodes embroidered on cotton fabric belt for ECG
measurement
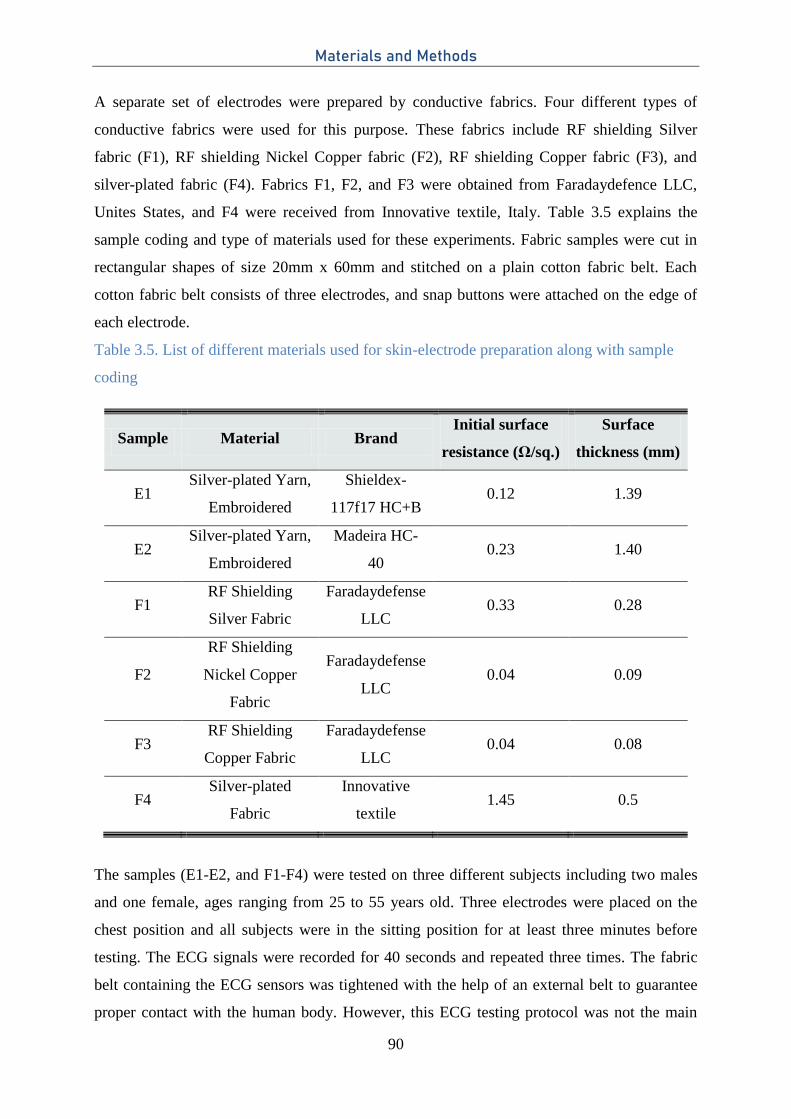
Materials and Methods
90
A separate set of electrodes were prepared by conductive fabrics. Four different types of
conductive fabrics were used for this purpose. These fabrics include RF shielding Silver
fabric (F1), RF shielding Nickel Copper fabric (F2), RF shielding Copper fabric (F3), and
silver-plated fabric (F4). Fabrics F1, F2, and F3 were obtained from Faradaydefence LLC,
Unites States, and F4 were received from Innovative textile, Italy. Table 3.5 explains the
sample coding and type of materials used for these experiments. Fabric samples were cut in
rectangular shapes of size 20mm x 60mm and stitched on a plain cotton fabric belt. Each
cotton fabric belt consists of three electrodes, and snap buttons were attached on the edge of
each electrode.
Table 3.5. List of different materials used for skin-electrode preparation along with sample
coding
Sample Material Brand Initial surface
resistance (Ω/sq.)
Surface
thickness (mm)
E1 Silver-plated Yarn,
Embroidered
Shieldex-
117f17 HC+B 0.12 1.39
E2 Silver-plated Yarn,
Embroidered
Madeira HC-
40 0.23 1.40
F1 RF Shielding
Silver Fabric
Faradaydefense
LLC 0.33 0.28
F2
RF Shielding
Nickel Copper
Fabric
Faradaydefense
LLC 0.04 0.09
F3 RF Shielding
Copper Fabric
Faradaydefense
LLC 0.04 0.08
F4 Silver-plated
Fabric
Innovative
textile 1.45 0.5
The samples (E1-E2, and F1-F4) were tested on three different subjects including two males
and one female, ages ranging from 25 to 55 years old. Three electrodes were placed on the
chest position and all subjects were in the sitting position for at least three minutes before
testing. The ECG signals were recorded for 40 seconds and repeated three times. The fabric
belt containing the ECG sensors was tightened with the help of an external belt to guarantee
proper contact with the human body. However, this ECG testing protocol was not the main
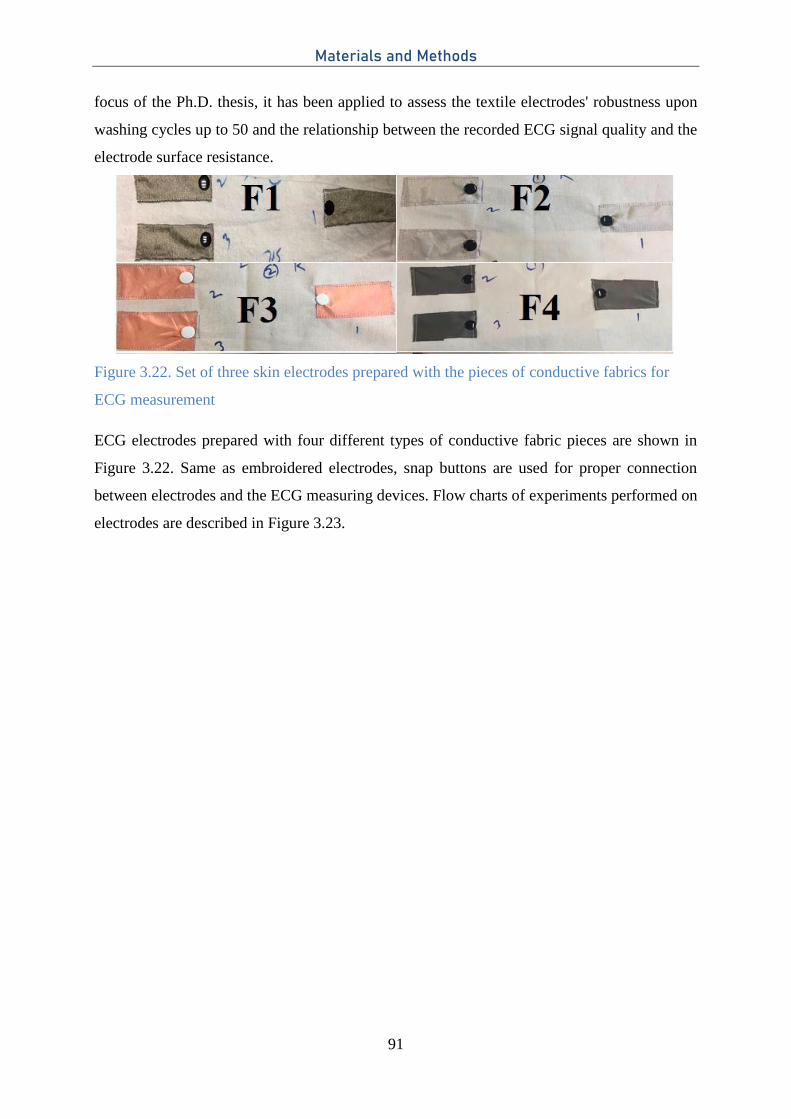
Materials and Methods
91
focus of the Ph.D. thesis, it has been applied to assess the textile electrodes' robustness upon
washing cycles up to 50 and the relationship between the recorded ECG signal quality and the
electrode surface resistance.
Figure 3.22. Set of three skin electrodes prepared with the pieces of conductive fabrics for
ECG measurement
ECG electrodes prepared with four different types of conductive fabric pieces are shown in
Figure 3.22. Same as embroidered electrodes, snap buttons are used for proper connection
between electrodes and the ECG measuring devices. Flow charts of experiments performed on
electrodes are described in Figure 3.23.
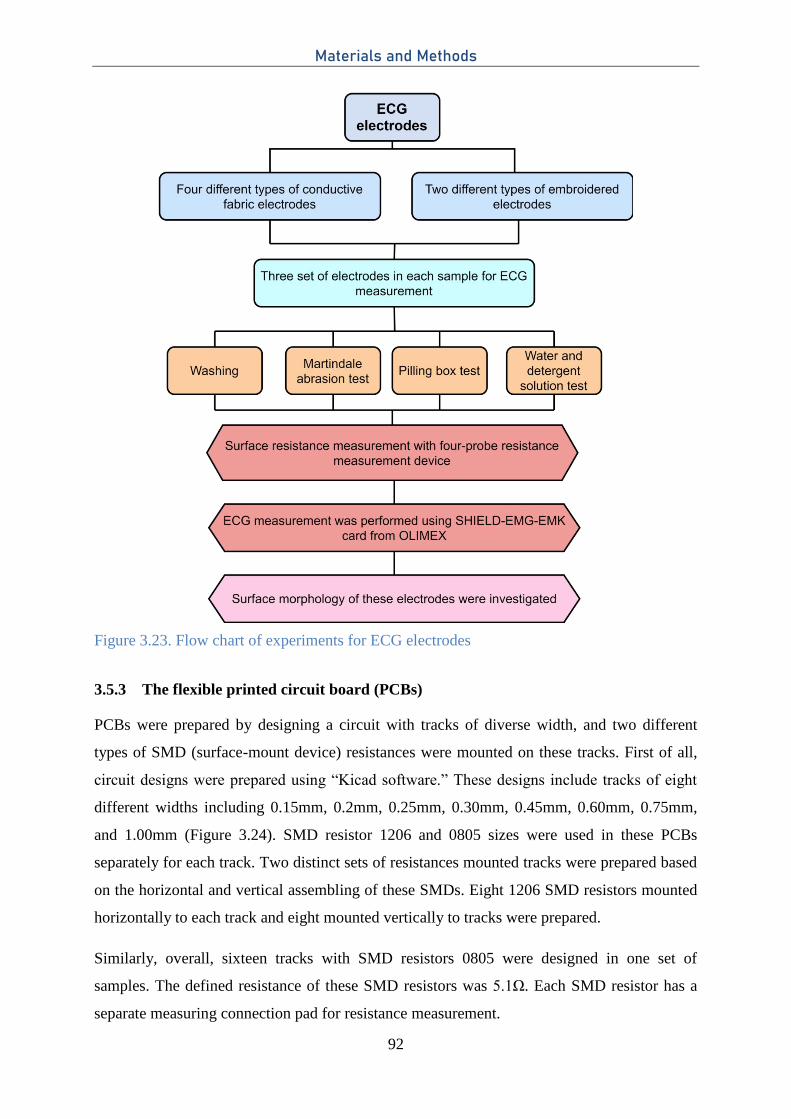
Materials and Methods
92
Figure 3.23. Flow chart of experiments for ECG electrodes
3.5.3 The flexible printed circuit board (PCBs)
PCBs were prepared by designing a circuit with tracks of diverse width, and two different
types of SMD (surface-mount device) resistances were mounted on these tracks. First of all,
circuit designs were prepared using “Kicad software.” These designs include tracks of eight
different widths including 0.15mm, 0.2mm, 0.25mm, 0.30mm, 0.45mm, 0.60mm, 0.75mm,
and 1.00mm (Figure 3.24). SMD resistor 1206 and 0805 sizes were used in these PCBs
separately for each track. Two distinct sets of resistances mounted tracks were prepared based
on the horizontal and vertical assembling of these SMDs. Eight 1206 SMD resistors mounted
horizontally to each track and eight mounted vertically to tracks were prepared.
Similarly, overall, sixteen tracks with SMD resistors 0805 were designed in one set of
samples. The defined resistance of these SMD resistors was 5.1Ω. Each SMD resistor has a
separate measuring connection pad for resistance measurement.
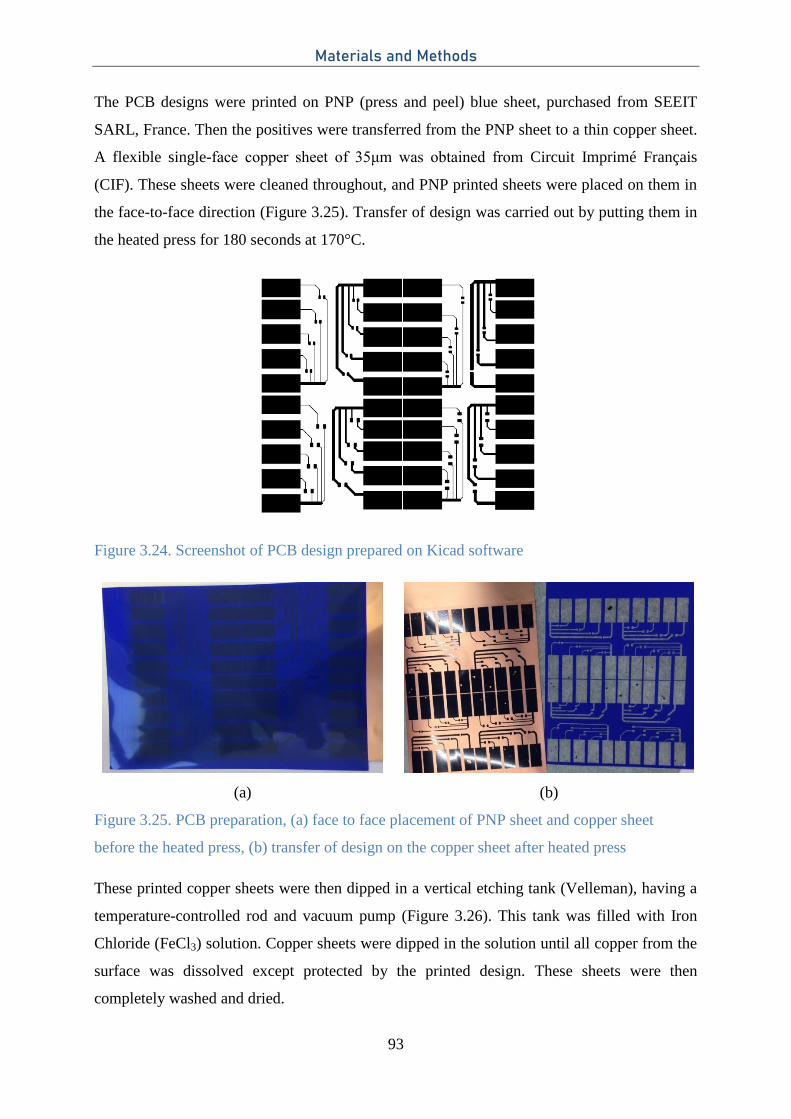
Materials and Methods
93
The PCB designs were printed on PNP (press and peel) blue sheet, purchased from SEEIT
SARL, France. Then the positives were transferred from the PNP sheet to a thin copper sheet.
A flexible single-face copper sheet of 35μm was obtained from Circuit Imprimé Français
(CIF). These sheets were cleaned throughout, and PNP printed sheets were placed on them in
the face-to-face direction (Figure 3.25). Transfer of design was carried out by putting them in
the heated press for 180 seconds at 170°C.
Figure 3.24. Screenshot of PCB design prepared on Kicad software
(a) (b)
Figure 3.25. PCB preparation, (a) face to face placement of PNP sheet and copper sheet
before the heated press, (b) transfer of design on the copper sheet after heated press
These printed copper sheets were then dipped in a vertical etching tank (Velleman), having a
temperature-controlled rod and vacuum pump (Figure 3.26). This tank was filled with Iron
Chloride (FeCl3) solution. Copper sheets were dipped in the solution until all copper from the
surface was dissolved except protected by the printed design. These sheets were then
completely washed and dried.
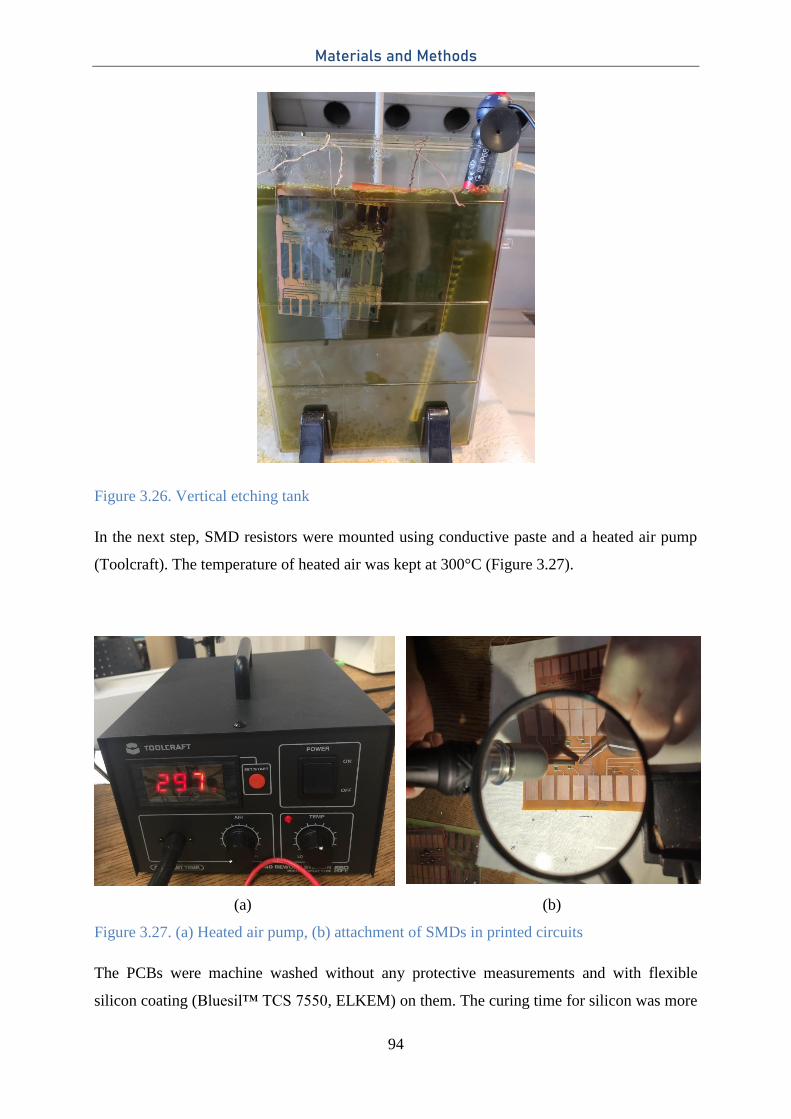
Materials and Methods
94
Figure 3.26. Vertical etching tank
In the next step, SMD resistors were mounted using conductive paste and a heated air pump
(Toolcraft). The temperature of heated air was kept at 300°C (Figure 3.27).
(a) (b)
Figure 3.27. (a) Heated air pump, (b) attachment of SMDs in printed circuits
The PCBs were machine washed without any protective measurements and with flexible
silicon coating (Bluesil™ TCS 7550, ELKEM) on them. The curing time for silicon was more
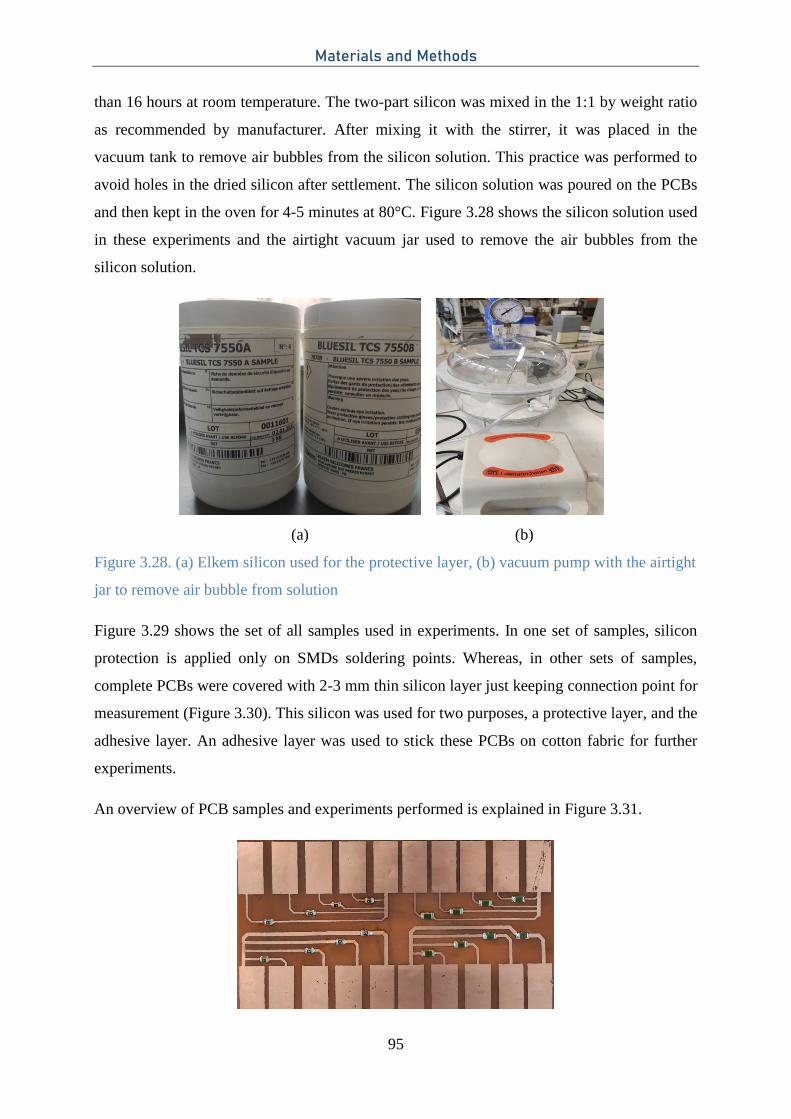
Materials and Methods
95
than 16 hours at room temperature. The two-part silicon was mixed in the 1:1 by weight ratio
as recommended by manufacturer. After mixing it with the stirrer, it was placed in the
vacuum tank to remove air bubbles from the silicon solution. This practice was performed to
avoid holes in the dried silicon after settlement. The silicon solution was poured on the PCBs
and then kept in the oven for 4-5 minutes at 80°C. Figure 3.28 shows the silicon solution used
in these experiments and the airtight vacuum jar used to remove the air bubbles from the
silicon solution.
(a) (b)
Figure 3.28. (a) Elkem silicon used for the protective layer, (b) vacuum pump with the airtight
jar to remove air bubble from solution
Figure 3.29 shows the set of all samples used in experiments. In one set of samples, silicon
protection is applied only on SMDs soldering points. Whereas, in other sets of samples,
complete PCBs were covered with 2-3 mm thin silicon layer just keeping connection point for
measurement (Figure 3.30). This silicon was used for two purposes, a protective layer, and the
adhesive layer. An adhesive layer was used to stick these PCBs on cotton fabric for further
experiments.
An overview of PCB samples and experiments performed is explained in Figure 3.31.
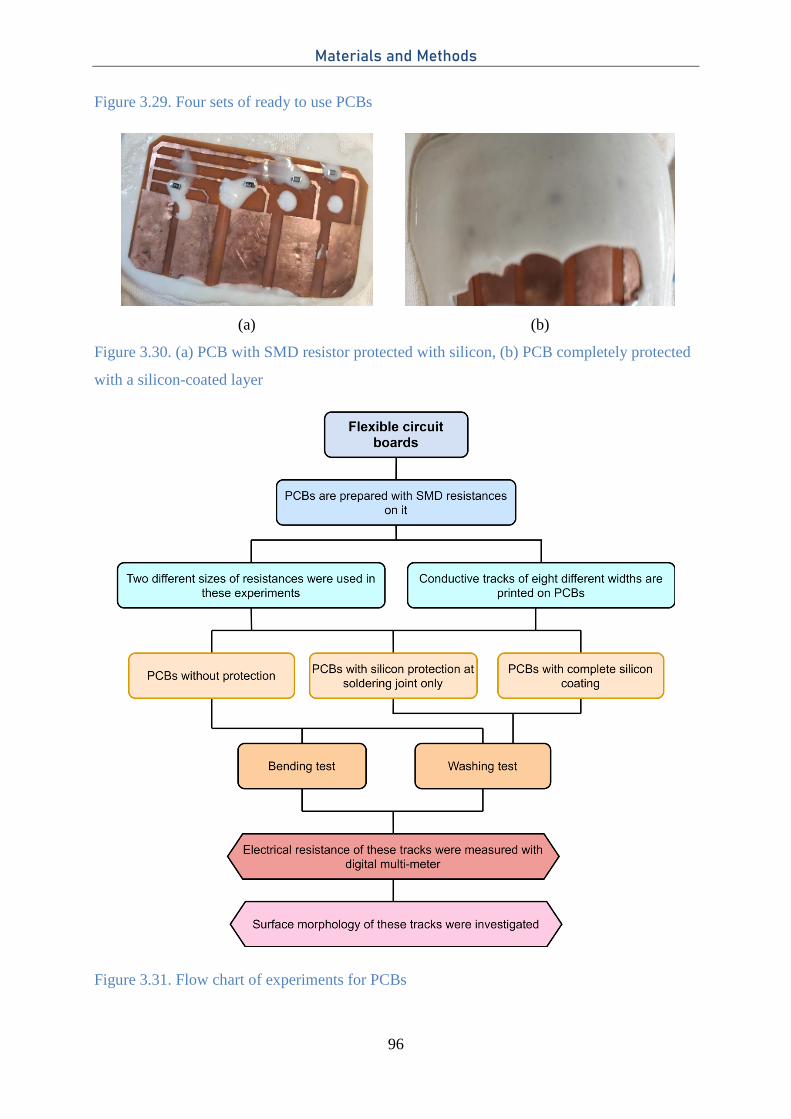
Materials and Methods
96
Figure 3.29. Four sets of ready to use PCBs
(a) (b)
Figure 3.30. (a) PCB with SMD resistor protected with silicon, (b) PCB completely protected
with a silicon-coated layer
Figure 3.31. Flow chart of experiments for PCBs
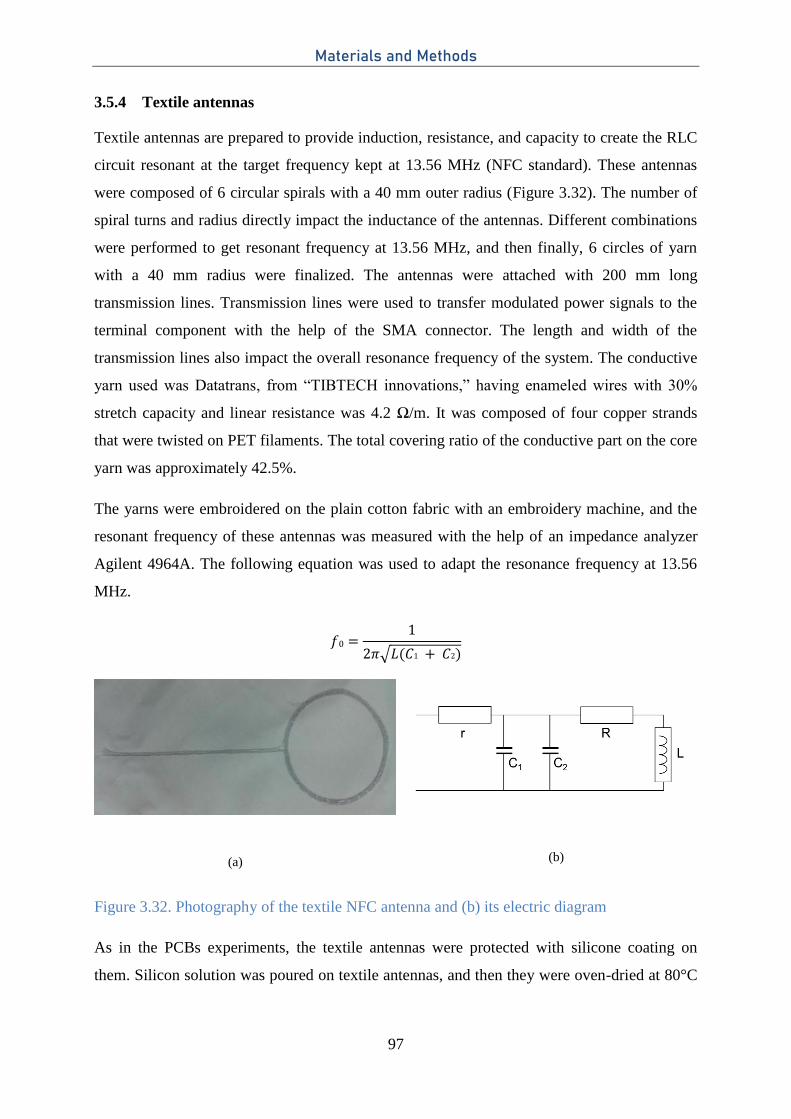
Materials and Methods
97
3.5.4 Textile antennas
Textile antennas are prepared to provide induction, resistance, and capacity to create the RLC
circuit resonant at the target frequency kept at 13.56 MHz (NFC standard). These antennas
were composed of 6 circular spirals with a 40 mm outer radius (Figure 3.32). The number of
spiral turns and radius directly impact the inductance of the antennas. Different combinations
were performed to get resonant frequency at 13.56 MHz, and then finally, 6 circles of yarn
with a 40 mm radius were finalized. The antennas were attached with 200 mm long
transmission lines. Transmission lines were used to transfer modulated power signals to the
terminal component with the help of the SMA connector. The length and width of the
transmission lines also impact the overall resonance frequency of the system. The conductive
yarn used was Datatrans, from “TIBTECH innovations,” having enameled wires with 30%
stretch capacity and linear resistance was 4.2 Ω/m. It was composed of four copper strands
that were twisted on PET filaments. The total covering ratio of the conductive part on the core
yarn was approximately 42.5%.
The yarns were embroidered on the plain cotton fabric with an embroidery machine, and the
resonant frequency of these antennas was measured with the help of an impedance analyzer
Agilent 4964A. The following equation was used to adapt the resonance frequency at 13.56
MHz.
√
Figure 3.32. Photography of the textile NFC antenna and (b) its electric diagram
As in the PCBs experiments, the textile antennas were protected with silicone coating on
them. Silicon solution was poured on textile antennas, and then they were oven-dried at 80°C
L
(a) (b)
C
R
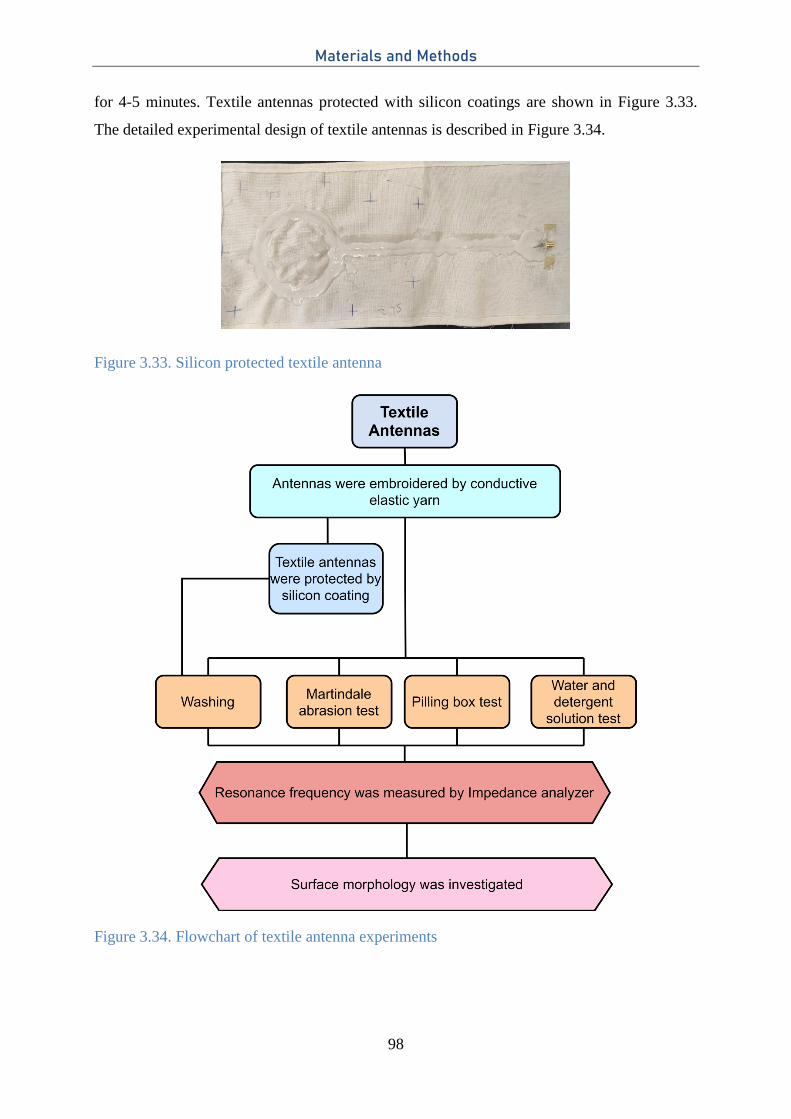
Materials and Methods
98
for 4-5 minutes. Textile antennas protected with silicon coatings are shown in Figure 3.33.
The detailed experimental design of textile antennas is described in Figure 3.34.
Figure 3.33. Silicon protected textile antenna
Figure 3.34. Flowchart of textile antenna experiments
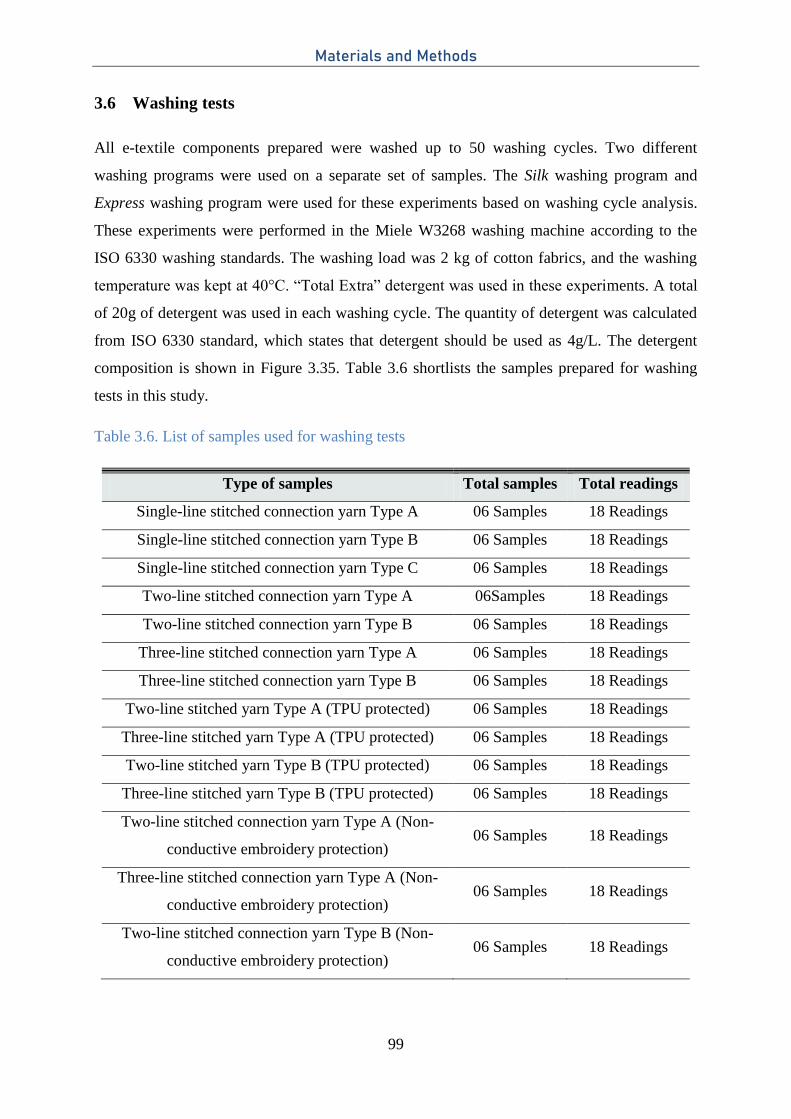
Materials and Methods
99
3.6 Washing tests
All e-textile components prepared were washed up to 50 washing cycles. Two different
washing programs were used on a separate set of samples. The Silk washing program and
Express washing program were used for these experiments based on washing cycle analysis.
These experiments were performed in the Miele W3268 washing machine according to the
ISO 6330 washing standards. The washing load was 2 kg of cotton fabrics, and the washing
temperature was kept at 40°C. “Total Extra” detergent was used in these experiments. A total
of 20g of detergent was used in each washing cycle. The quantity of detergent was calculated
from ISO 6330 standard, which states that detergent should be used as 4g/L. The detergent
composition is shown in Figure 3.35. Table 3.6 shortlists the samples prepared for washing
tests in this study.
Table 3.6. List of samples used for washing tests
Type of samples Total samples Total readings
Single-line stitched connection yarn Type A 06 Samples 18 Readings
Single-line stitched connection yarn Type B 06 Samples 18 Readings
Single-line stitched connection yarn Type C 06 Samples 18 Readings
Two-line stitched connection yarn Type A 06Samples 18 Readings
Two-line stitched connection yarn Type B 06 Samples 18 Readings
Three-line stitched connection yarn Type A 06 Samples 18 Readings
Three-line stitched connection yarn Type B 06 Samples 18 Readings
Two-line stitched yarn Type A (TPU protected) 06 Samples 18 Readings
Three-line stitched yarn Type A (TPU protected) 06 Samples 18 Readings
Two-line stitched yarn Type B (TPU protected) 06 Samples 18 Readings
Three-line stitched yarn Type B (TPU protected) 06 Samples 18 Readings
Two-line stitched connection yarn Type A (Non-
conductive embroidery protection) 06 Samples 18 Readings
Three-line stitched connection yarn Type A (Non-
conductive embroidery protection) 06 Samples 18 Readings
Two-line stitched connection yarn Type B (Non-
conductive embroidery protection) 06 Samples 18 Readings
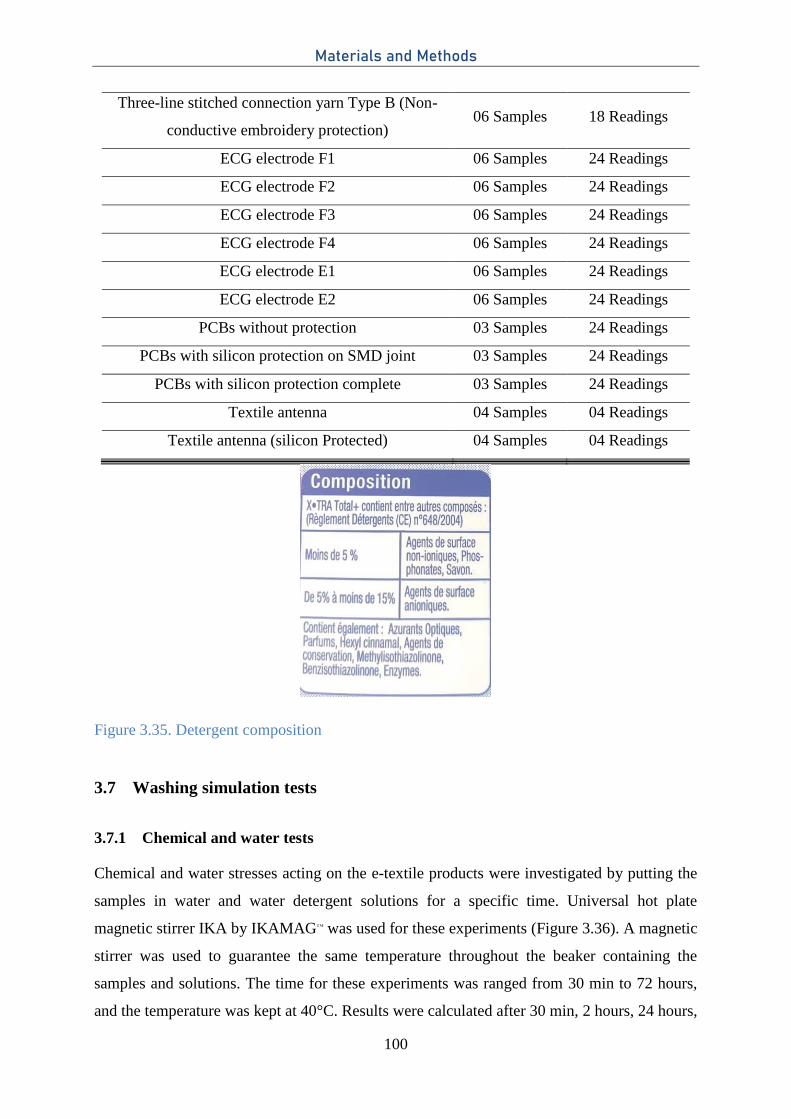
Materials and Methods
100
Three-line stitched connection yarn Type B (Non-
conductive embroidery protection) 06 Samples 18 Readings
ECG electrode F1 06 Samples 24 Readings
ECG electrode F2 06 Samples 24 Readings
ECG electrode F3 06 Samples 24 Readings
ECG electrode F4 06 Samples 24 Readings
ECG electrode E1 06 Samples 24 Readings
ECG electrode E2 06 Samples 24 Readings
PCBs without protection 03 Samples 24 Readings
PCBs with silicon protection on SMD joint 03 Samples 24 Readings
PCBs with silicon protection complete 03 Samples 24 Readings
Textile antenna 04 Samples 04 Readings
Textile antenna (silicon Protected) 04 Samples 04 Readings
Figure 3.35. Detergent composition
3.7 Washing simulation tests
3.7.1 Chemical and water tests
Chemical and water stresses acting on the e-textile products were investigated by putting the
samples in water and water detergent solutions for a specific time. Universal hot plate
magnetic stirrer IKA by IKAMAG™ was used for these experiments (Figure 3.36). A magnetic
stirrer was used to guarantee the same temperature throughout the beaker containing the
samples and solutions. The time for these experiments was ranged from 30 min to 72 hours,
and the temperature was kept at 40°C. Results were calculated after 30 min, 2 hours, 24 hours,
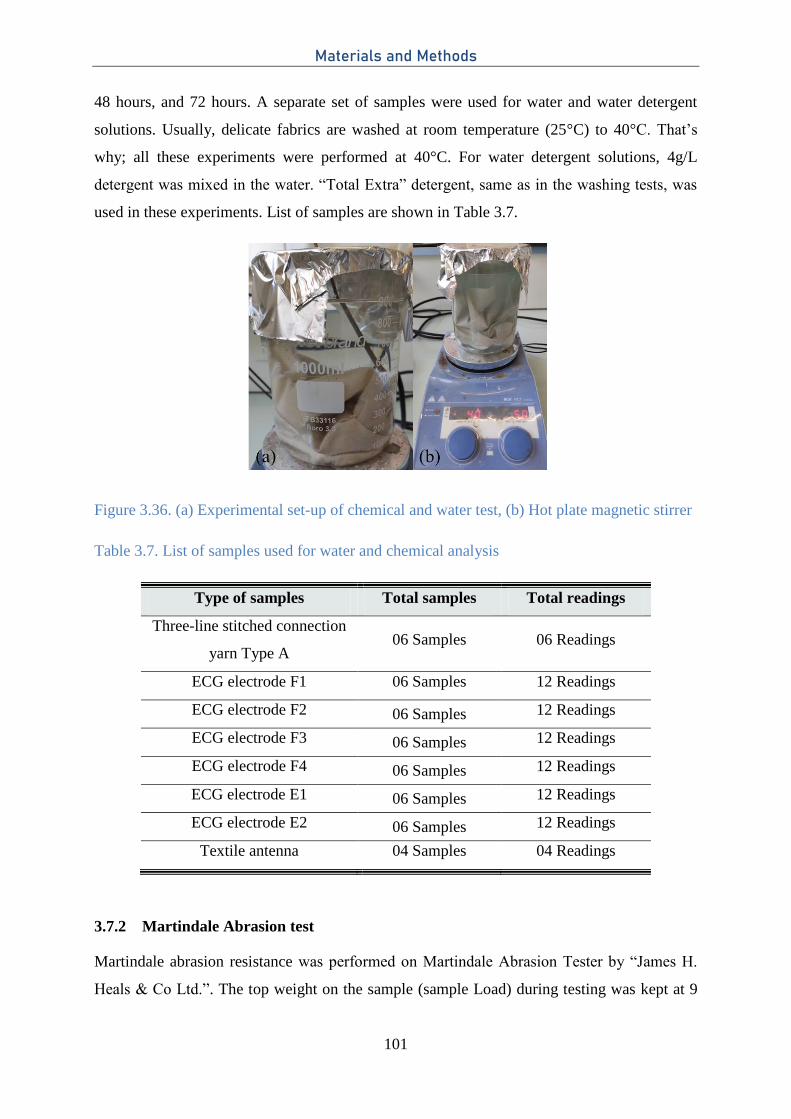
Materials and Methods
101
48 hours, and 72 hours. A separate set of samples were used for water and water detergent
solutions. Usually, delicate fabrics are washed at room temperature (25°C) to 40°C. That’s
why; all these experiments were performed at 40°C. For water detergent solutions, 4g/L
detergent was mixed in the water. “Total Extra” detergent, same as in the washing tests, was
used in these experiments. List of samples are shown in Table 3.7.
Figure 3.36. (a) Experimental set-up of chemical and water test, (b) Hot plate magnetic stirrer
Table 3.7. List of samples used for water and chemical analysis
Type of samples Total samples Total readings
Three-line stitched connection
yarn Type A 06 Samples 06 Readings
ECG electrode F1 06 Samples 12 Readings
ECG electrode F2 06 Samples 12 Readings
ECG electrode F3 06 Samples 12 Readings
ECG electrode F4 06 Samples 12 Readings
ECG electrode E1 06 Samples 12 Readings
ECG electrode E2 06 Samples 12 Readings
Textile antenna 04 Samples 04 Readings
3.7.2 Martindale Abrasion test
Martindale abrasion resistance was performed on Martindale Abrasion Tester by “James H.
Heals & Co Ltd.”. The top weight on the sample (sample Load) during testing was kept at 9
Materials and Methods
102
K.Pa as defined in the testing manual. Standard woven felt (140 mm diameter) was placed as
the lower surface for abrasion resistance testing. These woven felt were prepared by James H.
Heals under ISO-129471 testing standards (Figure 3.37).
Figure 3.37. Woven felt specifications used in experiments
Unidirectional movement of Martindale top motion plate was selected for tests. The speed of
the top motion plate was 0.8 sec/cycle, and the total distance covered in each cycle was 5.5
cm.
Martindale abrasion test was used to investigate the mechanical damages on different
components of e-textile systems. Table 3.8 presents the various sampling components used
for Martindale testing. Depending on the type of samples, different numbers of readings were
obtained, and then mean values were calculated. Six samples can be tested on this specific
machine at the same time. Samples related to transmission lines were stitched with three lines
on each sample. These lines were 7 cm long and 1cm away from each other. Figure 3.39
shows the schematic diagram of these samples used for abrasion testing. ECG electrodes and
textile antennas were tested as one specimen on each sample, and four output readings from
four different points were calculated for each sample. All these experiments were performed
under standard testing conditions 20 ± 2°C and 65 ± 5 % R.H. After Martindale abrasion
testing, these samples were conditioned for 24 hours under room temperature before final
output readings.
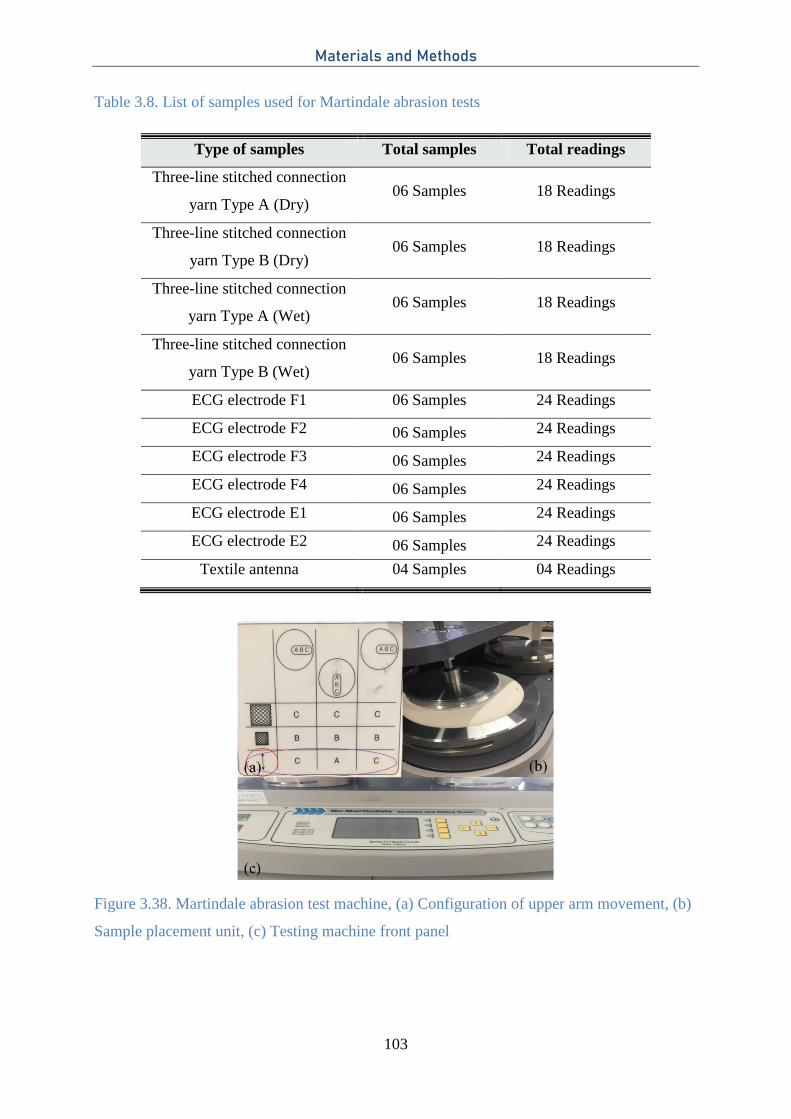
Materials and Methods
103
Table 3.8. List of samples used for Martindale abrasion tests
Type of samples Total samples Total readings
Three-line stitched connection
yarn Type A (Dry) 06 Samples 18 Readings
Three-line stitched connection
yarn Type B (Dry) 06 Samples 18 Readings
Three-line stitched connection
yarn Type A (Wet) 06 Samples 18 Readings
Three-line stitched connection
yarn Type B (Wet) 06 Samples 18 Readings
ECG electrode F1 06 Samples 24 Readings
ECG electrode F2 06 Samples 24 Readings
ECG electrode F3 06 Samples 24 Readings
ECG electrode F4 06 Samples 24 Readings
ECG electrode E1 06 Samples 24 Readings
ECG electrode E2 06 Samples 24 Readings
Textile antenna 04 Samples 04 Readings
Figure 3.38. Martindale abrasion test machine, (a) Configuration of upper arm movement, (b)
Sample placement unit, (c) Testing machine front panel
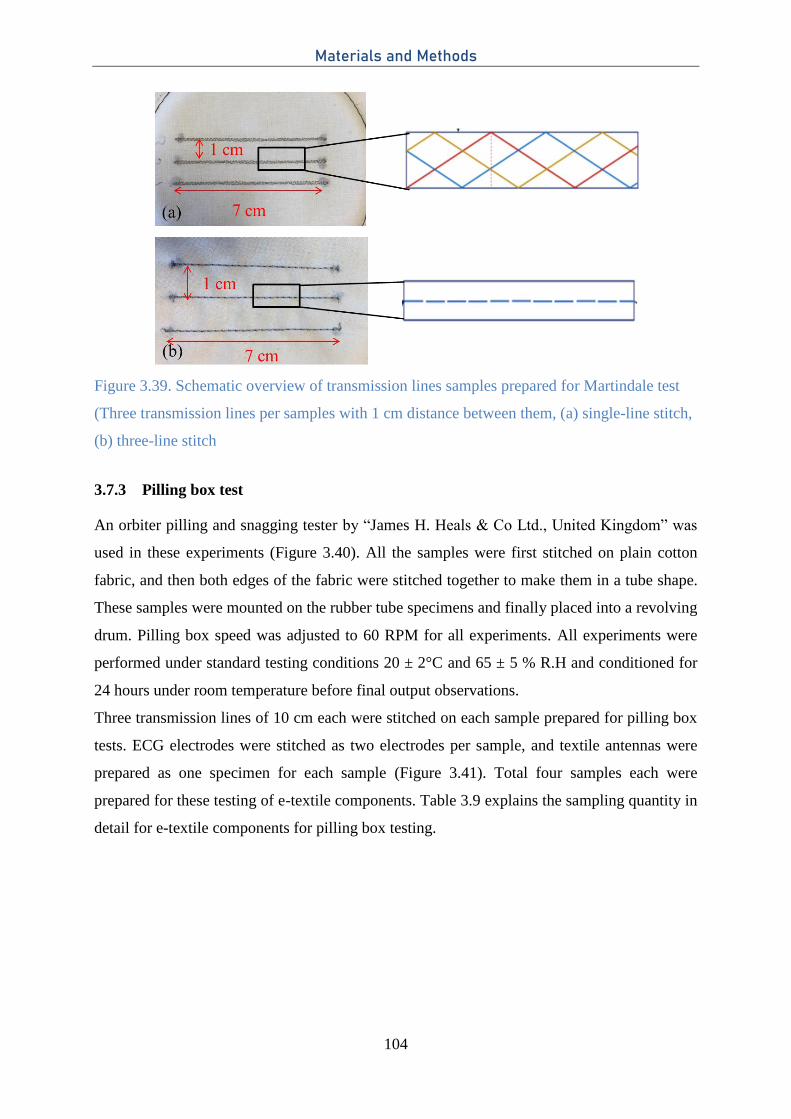
Materials and Methods
104
Figure 3.39. Schematic overview of transmission lines samples prepared for Martindale test
(Three transmission lines per samples with 1 cm distance between them, (a) single-line stitch,
(b) three-line stitch
3.7.3 Pilling box test
An orbiter pilling and snagging tester by “James H. Heals & Co Ltd., United Kingdom” was
used in these experiments (Figure 3.40). All the samples were first stitched on plain cotton
fabric, and then both edges of the fabric were stitched together to make them in a tube shape.
These samples were mounted on the rubber tube specimens and finally placed into a revolving
drum. Pilling box speed was adjusted to 60 RPM for all experiments. All experiments were
performed under standard testing conditions 20 ± 2°C and 65 ± 5 % R.H and conditioned for
24 hours under room temperature before final output observations.
Three transmission lines of 10 cm each were stitched on each sample prepared for pilling box
tests. ECG electrodes were stitched as two electrodes per sample, and textile antennas were
prepared as one specimen for each sample (Figure 3.41). Total four samples each were
prepared for these testing of e-textile components. Table 3.9 explains the sampling quantity in
detail for e-textile components for pilling box testing.
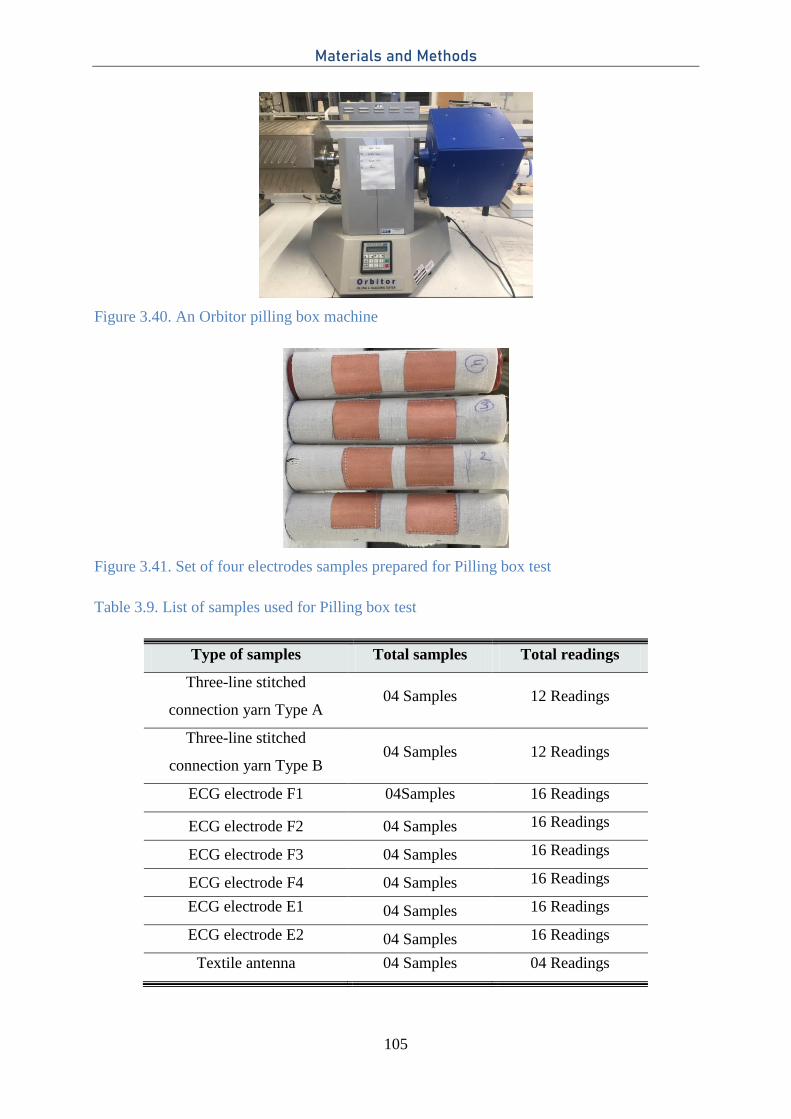
Materials and Methods
105
Figure 3.40. An Orbitor pilling box machine
Figure 3.41. Set of four electrodes samples prepared for Pilling box test
Table 3.9. List of samples used for Pilling box test
Type of samples Total samples Total readings
Three-line stitched
connection yarn Type A 04 Samples 12 Readings
Three-line stitched
connection yarn Type B 04 Samples 12 Readings
ECG electrode F1 04Samples 16 Readings
ECG electrode F2 04 Samples 16 Readings
ECG electrode F3 04 Samples 16 Readings
ECG electrode F4 04 Samples 16 Readings
ECG electrode E1 04 Samples 16 Readings
ECG electrode E2 04 Samples 16 Readings
Textile antenna 04 Samples 04 Readings
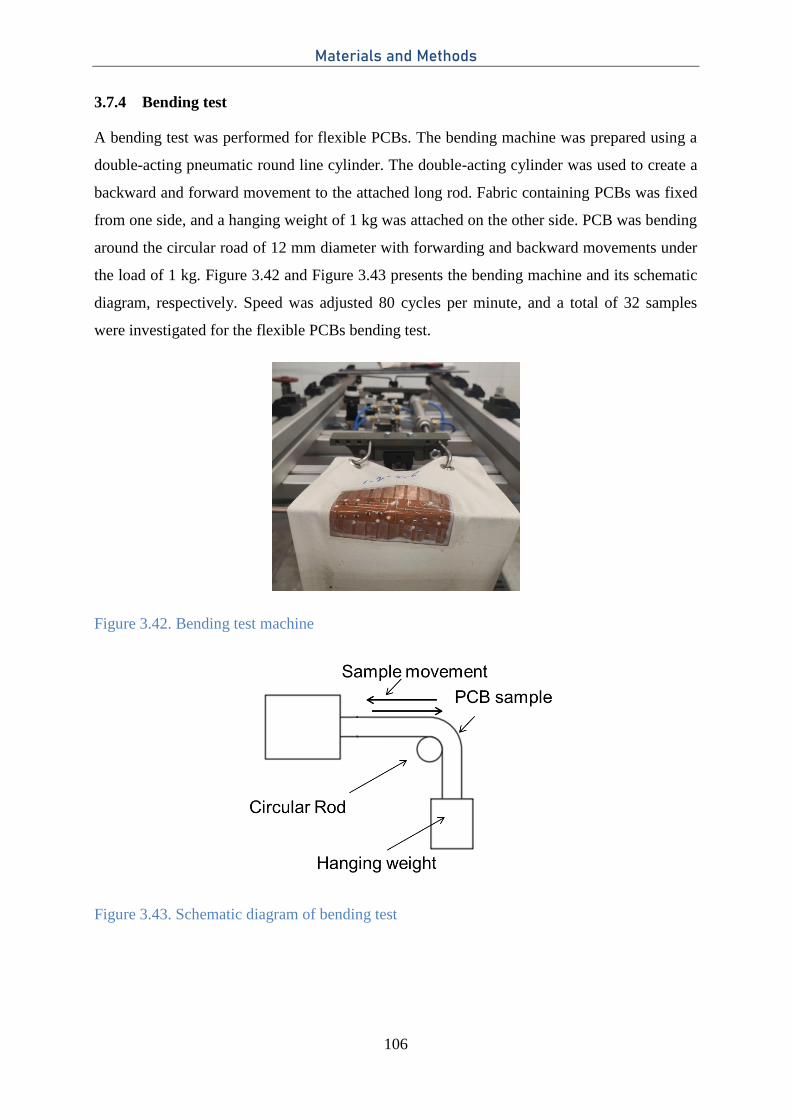
Materials and Methods
106
3.7.4 Bending test
A bending test was performed for flexible PCBs. The bending machine was prepared using a
double-acting pneumatic round line cylinder. The double-acting cylinder was used to create a
backward and forward movement to the attached long rod. Fabric containing PCBs was fixed
from one side, and a hanging weight of 1 kg was attached on the other side. PCB was bending
around the circular road of 12 mm diameter with forwarding and backward movements under
the load of 1 kg. Figure 3.42 and Figure 3.43 presents the bending machine and its schematic
diagram, respectively. Speed was adjusted 80 cycles per minute, and a total of 32 samples
were investigated for the flexible PCBs bending test.
Figure 3.42. Bending test machine
Figure 3.43. Schematic diagram of bending test
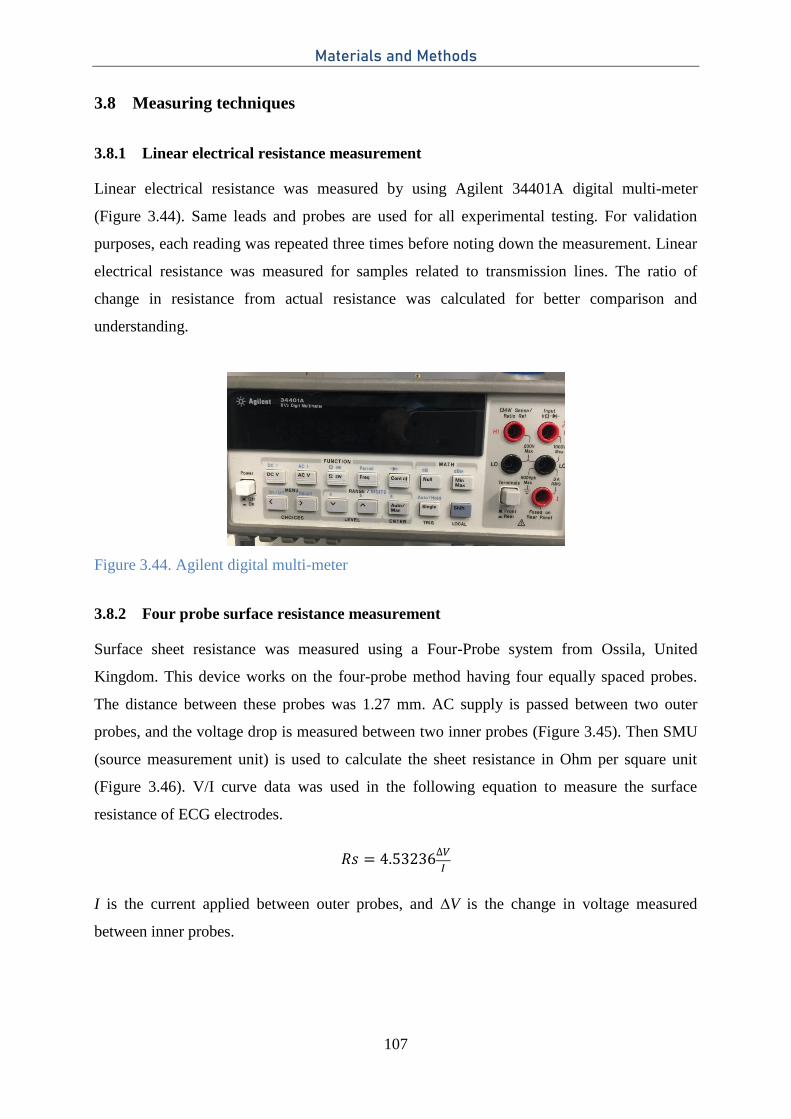
Materials and Methods
107
3.8 Measuring techniques
3.8.1 Linear electrical resistance measurement
Linear electrical resistance was measured by using Agilent 34401A digital multi-meter
(Figure 3.44). Same leads and probes are used for all experimental testing. For validation
purposes, each reading was repeated three times before noting down the measurement. Linear
electrical resistance was measured for samples related to transmission lines. The ratio of
change in resistance from actual resistance was calculated for better comparison and
understanding.
Figure 3.44. Agilent digital multi-meter
3.8.2 Four probe surface resistance measurement
Surface sheet resistance was measured using a Four-Probe system from Ossila, United
Kingdom. This device works on the four-probe method having four equally spaced probes.
The distance between these probes was 1.27 mm. AC supply is passed between two outer
probes, and the voltage drop is measured between two inner probes (Figure 3.45). Then SMU
(source measurement unit) is used to calculate the sheet resistance in Ohm per square unit
(Figure 3.46). V/I curve data was used in the following equation to measure the surface
resistance of ECG electrodes.
I is the current applied between outer probes, and ∆V is the change in voltage measured
between inner probes.
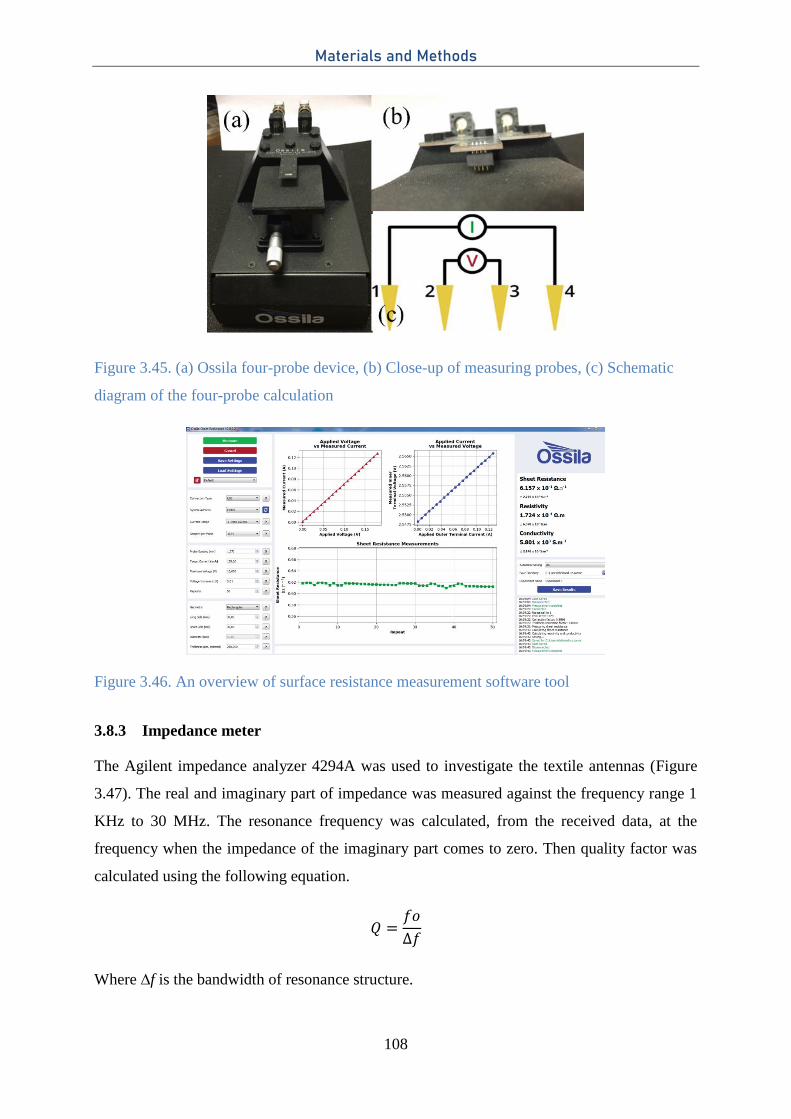
Materials and Methods
108
Figure 3.45. (a) Ossila four-probe device, (b) Close-up of measuring probes, (c) Schematic
diagram of the four-probe calculation
Figure 3.46. An overview of surface resistance measurement software tool
3.8.3 Impedance meter
The Agilent impedance analyzer 4294A was used to investigate the textile antennas (Figure
3.47). The real and imaginary part of impedance was measured against the frequency range 1
KHz to 30 MHz. The resonance frequency was calculated, from the received data, at the
frequency when the impedance of the imaginary part comes to zero. Then quality factor was
calculated using the following equation.
Where ∆f is the bandwidth of resonance structure.
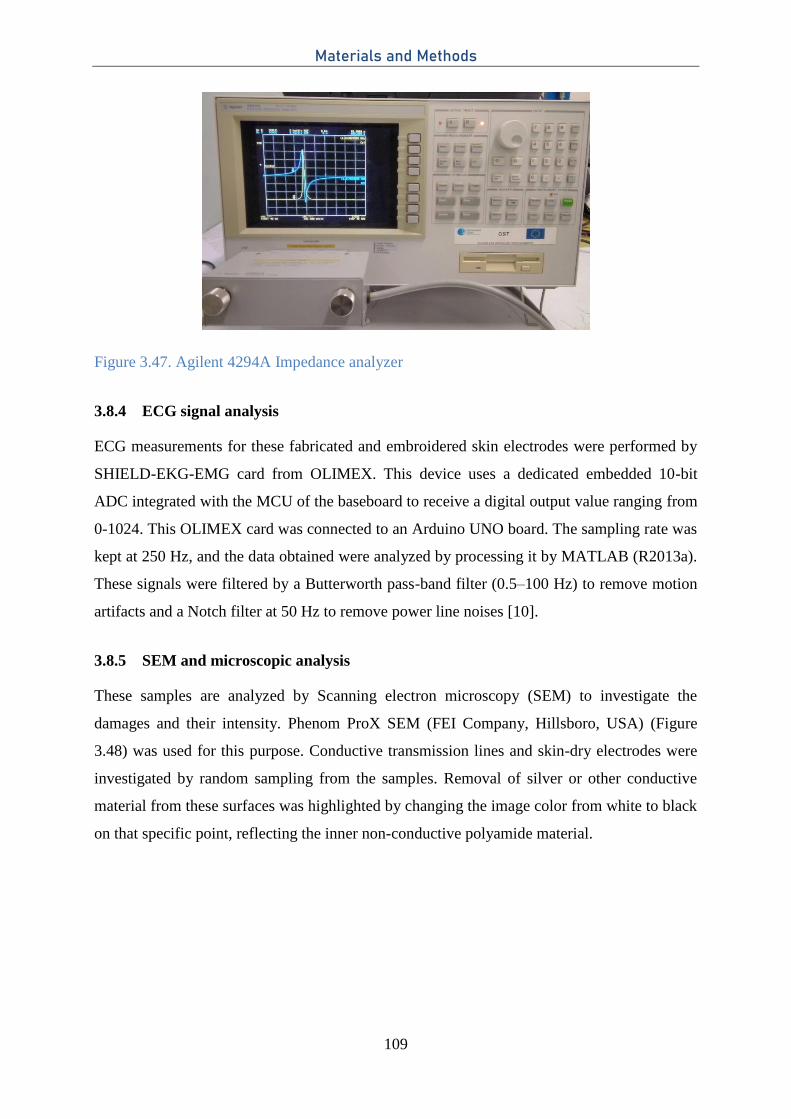
Materials and Methods
109
Figure 3.47. Agilent 4294A Impedance analyzer
3.8.4 ECG signal analysis
ECG measurements for these fabricated and embroidered skin electrodes were performed by
SHIELD-EKG-EMG card from OLIMEX. This device uses a dedicated embedded 10-bit
ADC integrated with the MCU of the baseboard to receive a digital output value ranging from
0-1024. This OLIMEX card was connected to an Arduino UNO board. The sampling rate was
kept at 250 Hz, and the data obtained were analyzed by processing it by MATLAB (R2013a).
These signals were filtered by a Butterworth pass-band filter (0.5–100 Hz) to remove motion
artifacts and a Notch filter at 50 Hz to remove power line noises [10].
3.8.5 SEM and microscopic analysis
These samples are analyzed by Scanning electron microscopy (SEM) to investigate the
damages and their intensity. Phenom ProX SEM (FEI Company, Hillsboro, USA) (Figure
3.48) was used for this purpose. Conductive transmission lines and skin-dry electrodes were
investigated by random sampling from the samples. Removal of silver or other conductive
material from these surfaces was highlighted by changing the image color from white to black
on that specific point, reflecting the inner non-conductive polyamide material.
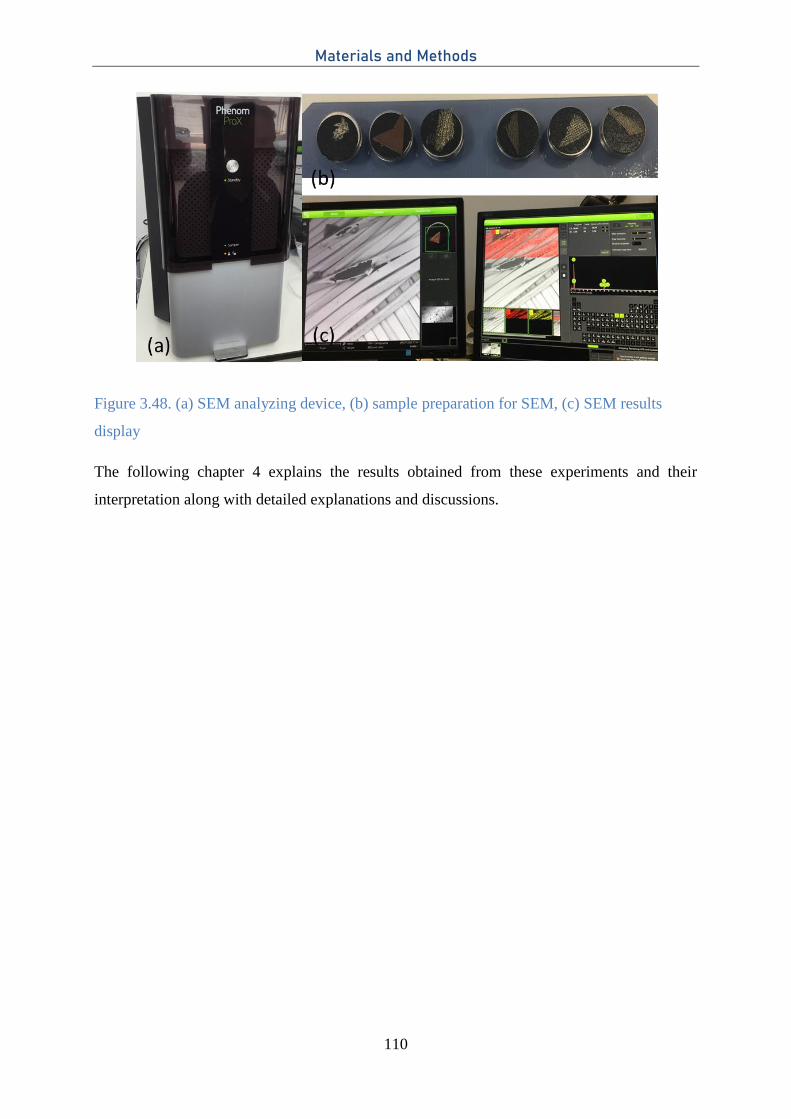
Materials and Methods
110
Figure 3.48. (a) SEM analyzing device, (b) sample preparation for SEM, (c) SEM results
display
The following chapter 4 explains the results obtained from these experiments and their
interpretation along with detailed explanations and discussions.
Materials and Methods
111
References
1. Ismar, E.; Zaman, S. uz; Tao, X.; Cochrane, C.; Koncar, V. Effect of Water and
Chemical Stresses on the Silver Coated Polyamide Yarns. Fibers and Polymers 2019,
20, 2604–2610, doi:10.1007/s12221-019-9266-4.
2. Kim, H.; Yun, C.; Park, C.H. Fabric Movement and Washing Performance in a Front-
Loading Washer with a Built-in Pulsator. Textile Research Journal 2019, 89, 4732–
4745, doi:10.1177/0040517519835757.
3. Yun, C.; Choi, H.R.; Park, S.; Park, C.H. The Effect of Fabric Movement on Washing
Performance in a Front-Loading Washer V: Focusing on the Role and Shape of the
Lifter. Textile Research Journal 2019, 89, 364–374, doi:10.1177/0040517517743741.
4. Yu, X.; Li, Y.; Ding, X. Dynamics of Cotton Textile Motion in a Domestic Tumble
Dryer and Its Effect on Drying Performance. Textile Research Journal 2020,
004051752096075, doi:10.1177/0040517520960751.
5. uz Zaman, S.; Tao, X.; Cochrane, C.; Koncar, V. Launderability of Conductive
Polymer Yarns Used for Connections of E-Textile Modules: Mechanical Stresses.
Fibers and Polymers 2019, 20, 2355–2366, doi:10.1007/s12221-019-9325-x.
6. Merilampi, S.; Björninen, T.; Haukka, V.; Ruuskanen, P.; Ukkonen, L.; Sydänheimo,
L. Analysis of Electrically Conductive Silver Ink on Stretchable Substrates under
Tensile Load. Microelectronics Reliability 2010, 50, 2001–2011,
doi:10.1016/j.microrel.2010.06.011.
7. Ryan, J.D.; Mengistie, D.A.; Gabrielsson, R.; Lund, A.; Müller, C. Machine-Washable
PEDOT:PSS Dyed Silk Yarns for Electronic Textiles. ACS Appl. Mater. Interfaces
2017, 9, 9045–9050, doi:10.1021/acsami.7b00530.
8. Gaubert, V.; Gidik, H.; Bodart, N.; Koncar, V. Investigating the Impact of Washing
Cycles on Silver-Plated Textile Electrodes: A Complete Study. Sensors 2020, 20, 1739,
doi:10.3390/s20061739.
9. Rotzler, S.; Kallmayer, C.; Dils, C.; von Krshiwoblozki, M.; Bauer, U.; Schneider-
Ramelow, M. Improving the Washability of Smart Textiles: Influence of Different
Washing Conditions on Textile Integrated Conductor Tracks. The Journal of The
Textile Institute 2020, 1–12, doi:10.1080/00405000.2020.1729056.
10. Ankhili, A.; Zaman, S.U.; Tao, X.; Cochrane, C.; Koncar, V.; Coulon, D. How to
Connect Conductive Flexible Textile Tracks to Skin Electrocardiography Electrodes
Materials and Methods
112
and Protect Them Against Washing. IEEE Sensors Journal 2019, 19, 11995–12002,
doi:10.1109/JSEN.2019.2938333.
113
4. Results and Discussion
Detailed analyses of damages provoked during the washing process on e-textile systems’
components have been explained with results. Different textile testing techniques have been
performed on these components. Relations between different damages from washing process
and from textile testing techniques have been investigated, and projected outputs have been
discussed. These experiments were performed in standard working conditions following all
available standard protocols.
4.1 Accelerometer Analysis
Accelerometer analysis was performed to understand the washing behavior during the process
and calculate the stresses on the e-textile components. As described previously, the washing
process may be divided into three main phases, including washing, rinsing, and tumbling.
During these phases, three washing actions are carried out that are low-speed rotation, stop
(resting), and high-speed rotation action. An accelerometer was used to investigate the impact
of different washing actions during various washing phases. It was attached to a flexible PCB
sewn on cotton fabric, sealed in a plastic bag, and then placed in the washing machine.
The accelerometer measures its proper acceleration, which is not the same as coordinate
acceleration. The X, Y, and Z directions of the accelerometer were fixed with itself. The X
(left/right) and Y (forward/backward) directions are on the PCB surface, and the Z (up/down)
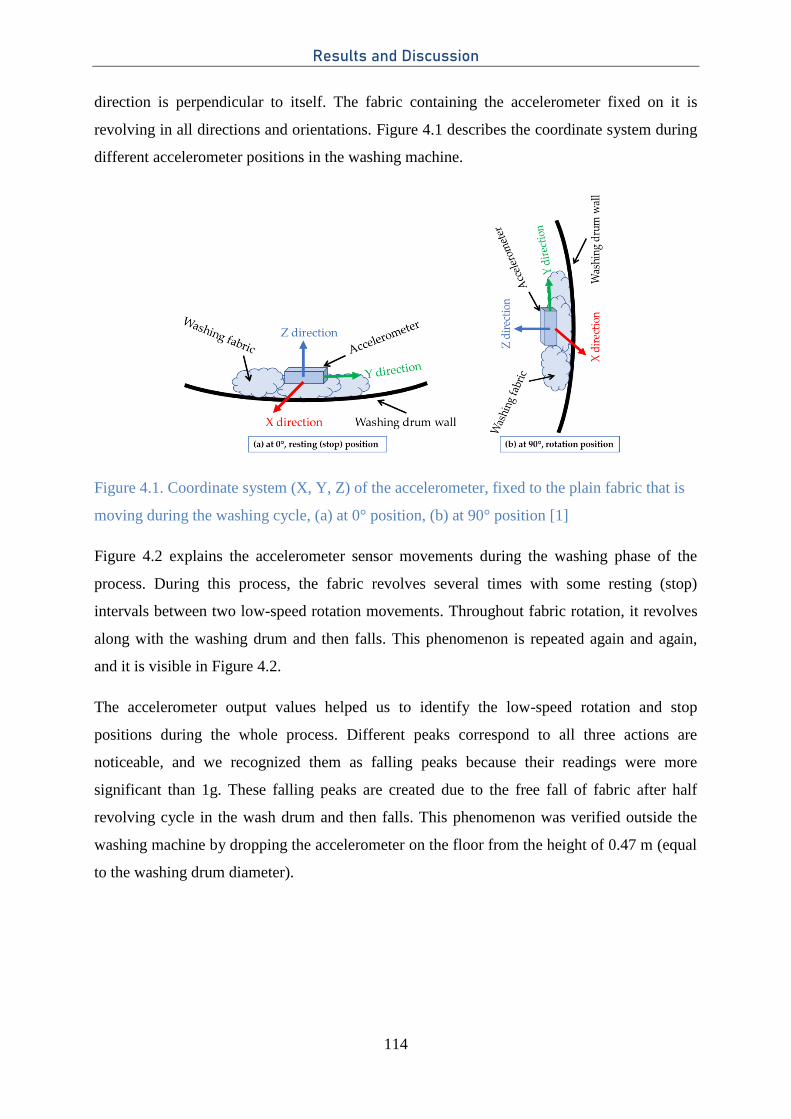
Results and Discussion
114
direction is perpendicular to itself. The fabric containing the accelerometer fixed on it is
revolving in all directions and orientations. Figure 4.1 describes the coordinate system during
different accelerometer positions in the washing machine.
Figure 4.1. Coordinate system (X, Y, Z) of the accelerometer, fixed to the plain fabric that is
moving during the washing cycle, (a) at 0° position, (b) at 90° position [1]
Figure 4.2 explains the accelerometer sensor movements during the washing phase of the
process. During this process, the fabric revolves several times with some resting (stop)
intervals between two low-speed rotation movements. Throughout fabric rotation, it revolves
along with the washing drum and then falls. This phenomenon is repeated again and again,
and it is visible in Figure 4.2.
The accelerometer output values helped us to identify the low-speed rotation and stop
positions during the whole process. Different peaks correspond to all three actions are
noticeable, and we recognized them as falling peaks because their readings were more
significant than 1g. These falling peaks are created due to the free fall of fabric after half
revolving cycle in the wash drum and then falls. This phenomenon was verified outside the
washing machine by dropping the accelerometer on the floor from the height of 0.47 m (equal
to the washing drum diameter).
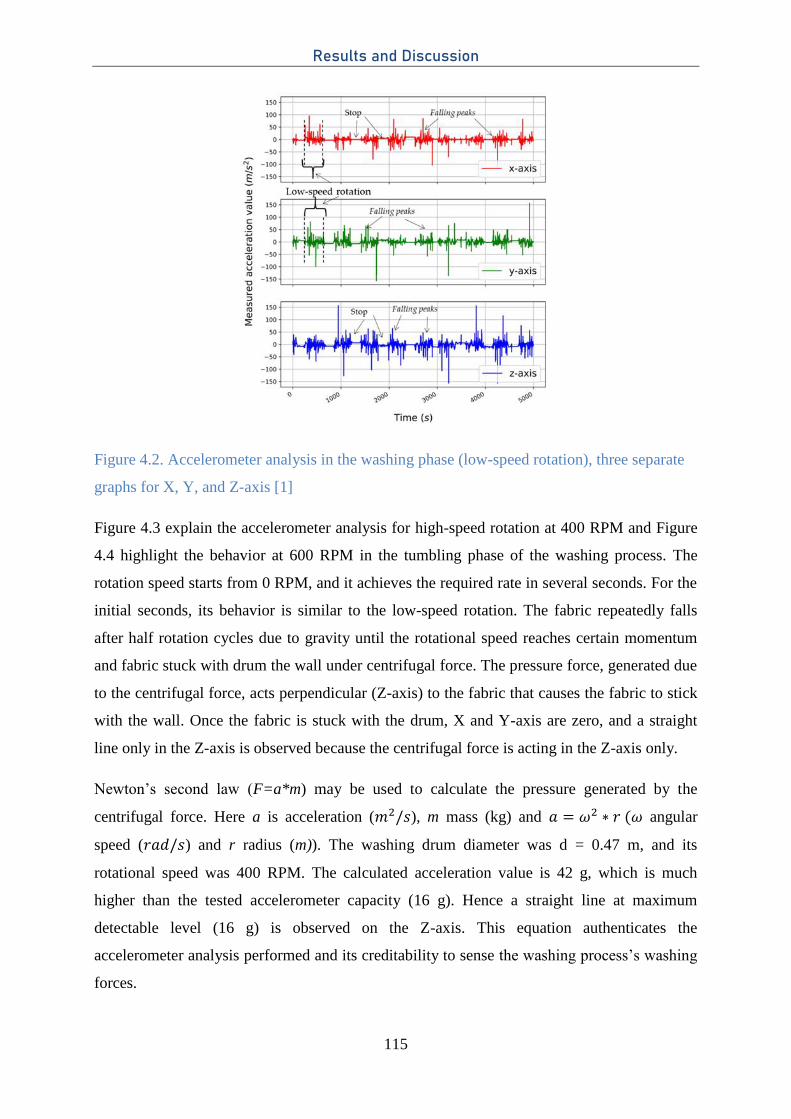
Results and Discussion
115
Figure 4.2. Accelerometer analysis in the washing phase (low-speed rotation), three separate
graphs for X, Y, and Z-axis [1]
Figure 4.3 explain the accelerometer analysis for high-speed rotation at 400 RPM and Figure
4.4 highlight the behavior at 600 RPM in the tumbling phase of the washing process. The
rotation speed starts from 0 RPM, and it achieves the required rate in several seconds. For the
initial seconds, its behavior is similar to the low-speed rotation. The fabric repeatedly falls
after half rotation cycles due to gravity until the rotational speed reaches certain momentum
and fabric stuck with drum the wall under centrifugal force. The pressure force, generated due
to the centrifugal force, acts perpendicular (Z-axis) to the fabric that causes the fabric to stick
with the wall. Once the fabric is stuck with the drum, X and Y-axis are zero, and a straight
line only in the Z-axis is observed because the centrifugal force is acting in the Z-axis only.
Newton’s second law (F=a*m) may be used to calculate the pressure generated by the
centrifugal force. Here a is acceleration ( ), m mass (kg) and angular
speed ( ) and r radius (m)). The washing drum diameter was d = 0.47 m, and its
rotational speed was 400 RPM. The calculated acceleration value is 42 g, which is much
higher than the tested accelerometer capacity (16 g). Hence a straight line at maximum
detectable level (16 g) is observed on the Z-axis. This equation authenticates the
accelerometer analysis performed and its creditability to sense the washing process’s washing
forces.
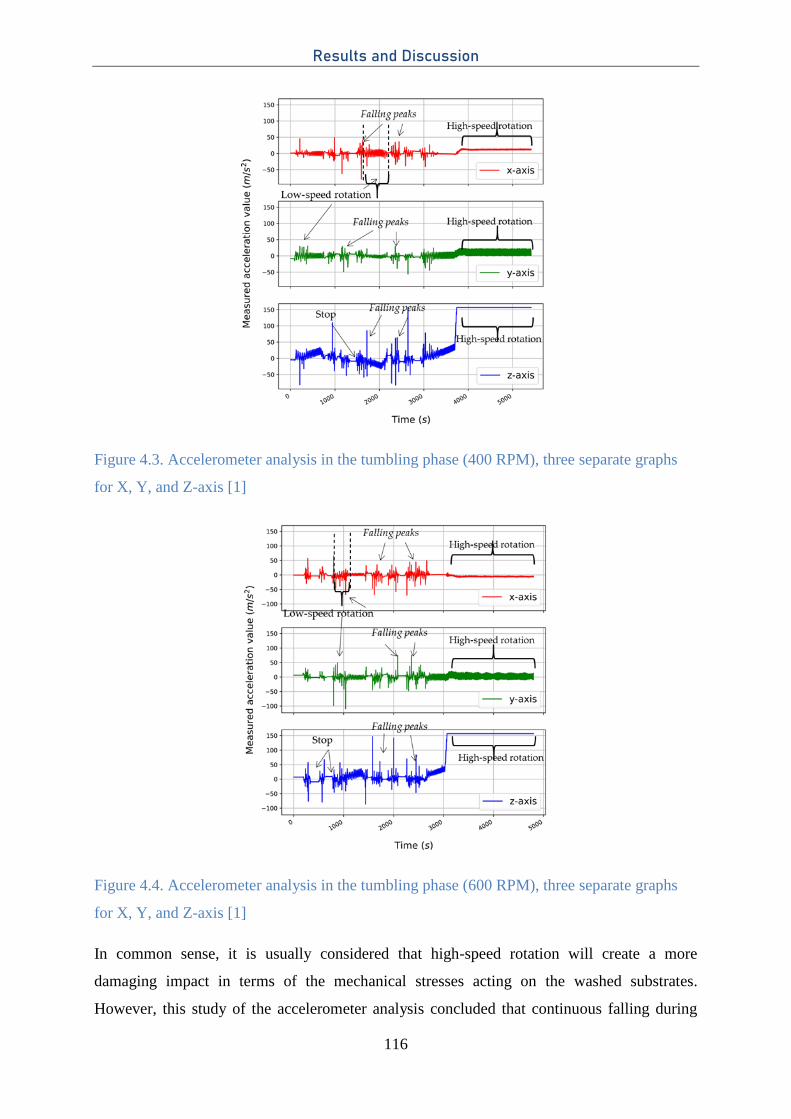
Results and Discussion
116
Figure 4.3. Accelerometer analysis in the tumbling phase (400 RPM), three separate graphs
for X, Y, and Z-axis [1]
Figure 4.4. Accelerometer analysis in the tumbling phase (600 RPM), three separate graphs
for X, Y, and Z-axis [1]
In common sense, it is usually considered that high-speed rotation will create a more
damaging impact in terms of the mechanical stresses acting on the washed substrates.
However, this study of the accelerometer analysis concluded that continuous falling during
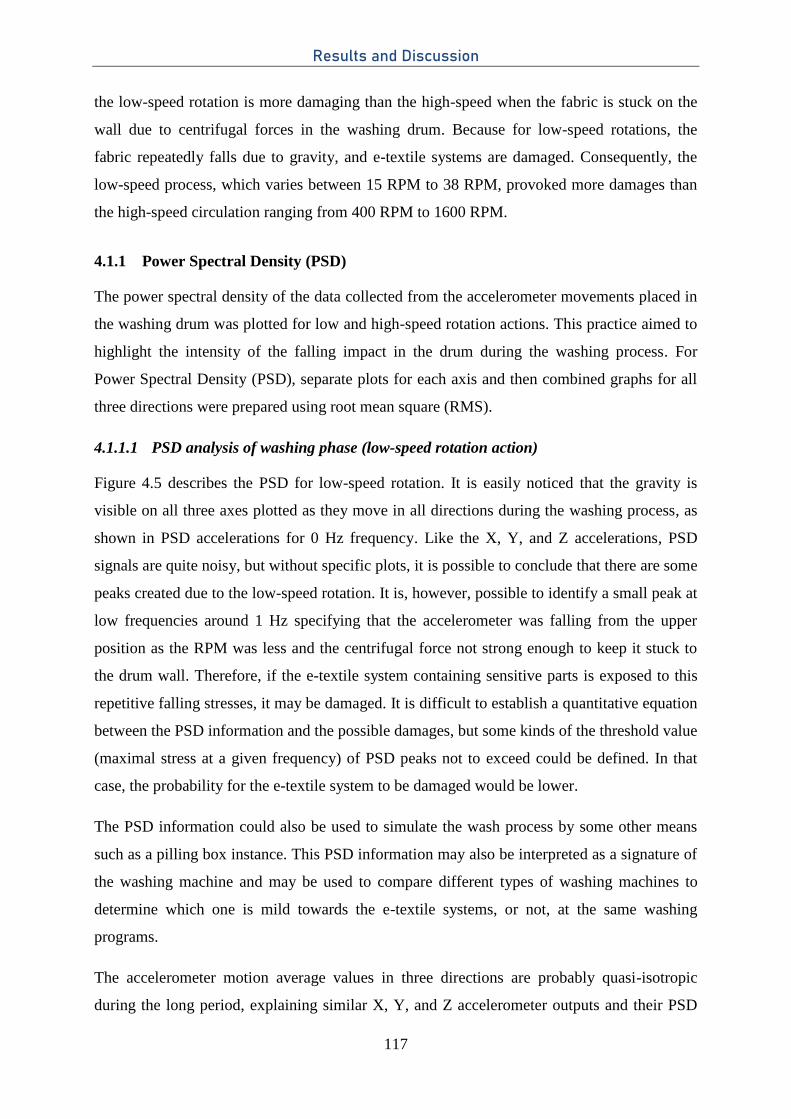
Results and Discussion
117
the low-speed rotation is more damaging than the high-speed when the fabric is stuck on the
wall due to centrifugal forces in the washing drum. Because for low-speed rotations, the
fabric repeatedly falls due to gravity, and e-textile systems are damaged. Consequently, the
low-speed process, which varies between 15 RPM to 38 RPM, provoked more damages than
the high-speed circulation ranging from 400 RPM to 1600 RPM.
4.1.1 Power Spectral Density (PSD)
The power spectral density of the data collected from the accelerometer movements placed in
the washing drum was plotted for low and high-speed rotation actions. This practice aimed to
highlight the intensity of the falling impact in the drum during the washing process. For
Power Spectral Density (PSD), separate plots for each axis and then combined graphs for all
three directions were prepared using root mean square (RMS).
4.1.1.1 PSD analysis of washing phase (low-speed rotation action)
Figure 4.5 describes the PSD for low-speed rotation. It is easily noticed that the gravity is
visible on all three axes plotted as they move in all directions during the washing process, as
shown in PSD accelerations for 0 Hz frequency. Like the X, Y, and Z accelerations, PSD
signals are quite noisy, but without specific plots, it is possible to conclude that there are some
peaks created due to the low-speed rotation. It is, however, possible to identify a small peak at
low frequencies around 1 Hz specifying that the accelerometer was falling from the upper
position as the RPM was less and the centrifugal force not strong enough to keep it stuck to
the drum wall. Therefore, if the e-textile system containing sensitive parts is exposed to this
repetitive falling stresses, it may be damaged. It is difficult to establish a quantitative equation
between the PSD information and the possible damages, but some kinds of the threshold value
(maximal stress at a given frequency) of PSD peaks not to exceed could be defined. In that
case, the probability for the e-textile system to be damaged would be lower.
The PSD information could also be used to simulate the wash process by some other means
such as a pilling box instance. This PSD information may also be interpreted as a signature of
the washing machine and may be used to compare different types of washing machines to
determine which one is mild towards the e-textile systems, or not, at the same washing
programs.
The accelerometer motion average values in three directions are probably quasi-isotropic
during the long period, explaining similar X, Y, and Z accelerometer outputs and their PSD
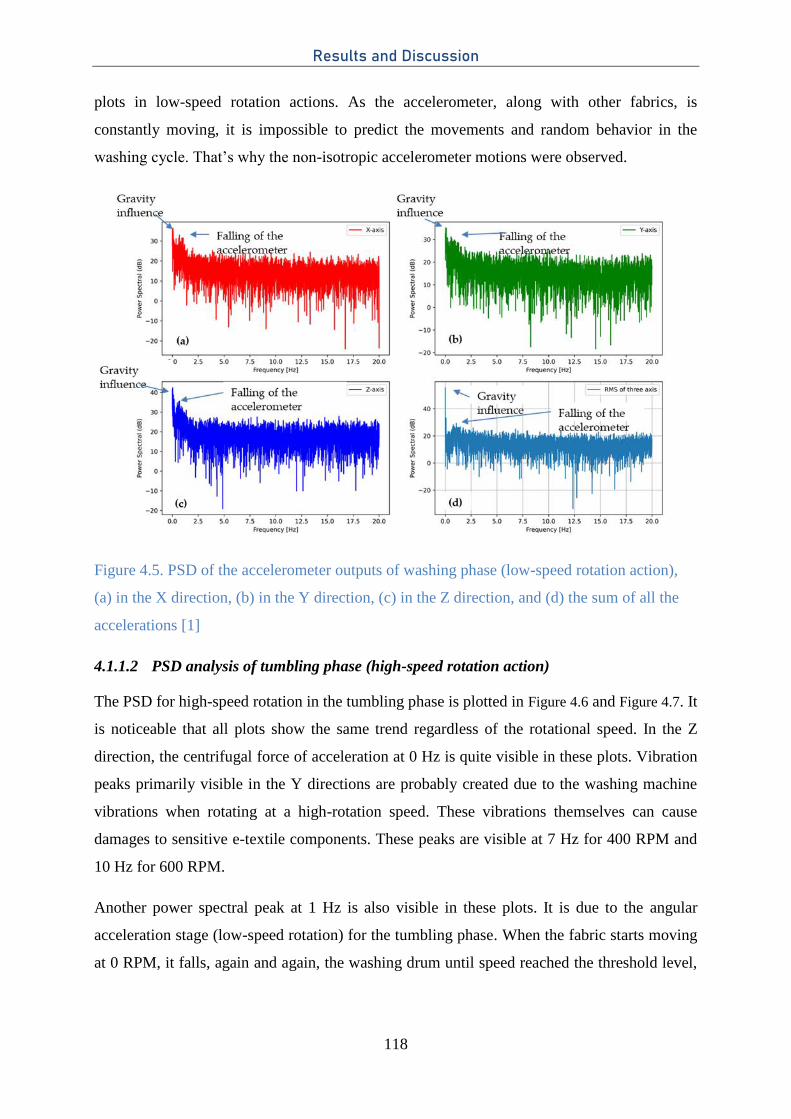
Results and Discussion
118
plots in low-speed rotation actions. As the accelerometer, along with other fabrics, is
constantly moving, it is impossible to predict the movements and random behavior in the
washing cycle. That’s why the non-isotropic accelerometer motions were observed.
Figure 4.5. PSD of the accelerometer outputs of washing phase (low-speed rotation action),
(a) in the X direction, (b) in the Y direction, (c) in the Z direction, and (d) the sum of all the
accelerations [1]
4.1.1.2 PSD analysis of tumbling phase (high-speed rotation action)
The PSD for high-speed rotation in the tumbling phase is plotted in Figure 4.6 and Figure 4.7. It
is noticeable that all plots show the same trend regardless of the rotational speed. In the Z
direction, the centrifugal force of acceleration at 0 Hz is quite visible in these plots. Vibration
peaks primarily visible in the Y directions are probably created due to the washing machine
vibrations when rotating at a high-rotation speed. These vibrations themselves can cause
damages to sensitive e-textile components. These peaks are visible at 7 Hz for 400 RPM and
10 Hz for 600 RPM.
Another power spectral peak at 1 Hz is also visible in these plots. It is due to the angular
acceleration stage (low-speed rotation) for the tumbling phase. When the fabric starts moving
at 0 RPM, it falls, again and again, the washing drum until speed reached the threshold level,
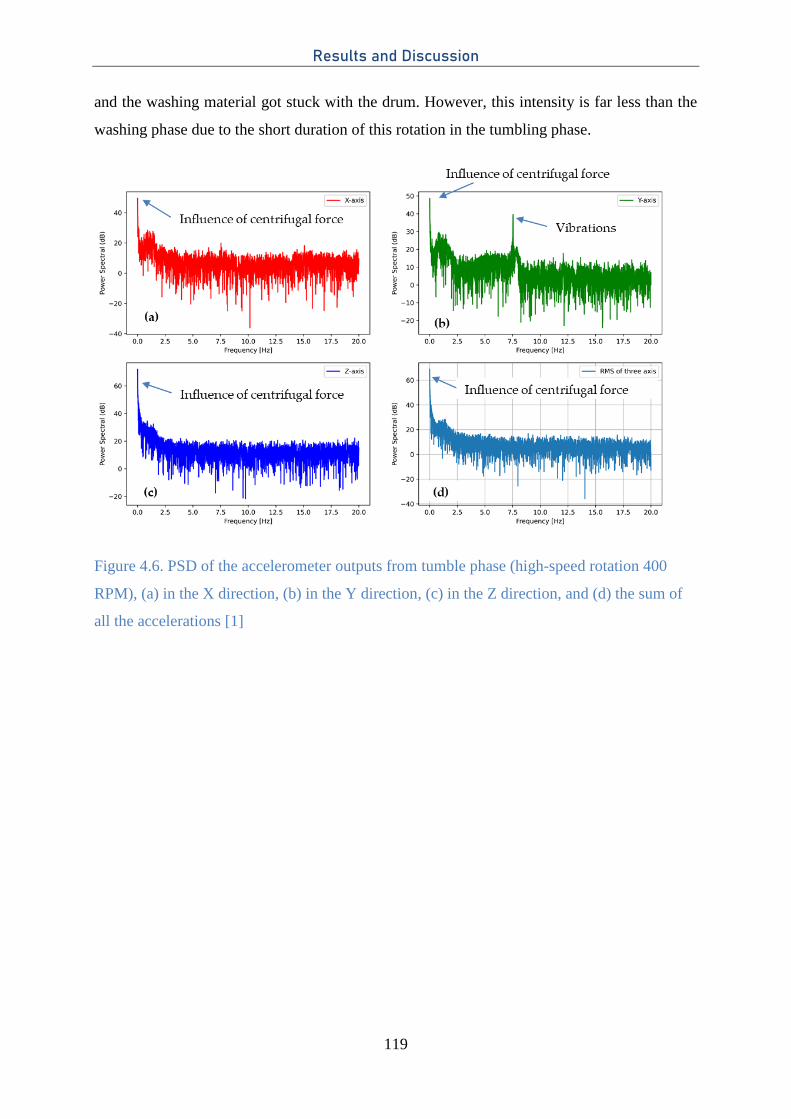
Results and Discussion
119
and the washing material got stuck with the drum. However, this intensity is far less than the
washing phase due to the short duration of this rotation in the tumbling phase.
Figure 4.6. PSD of the accelerometer outputs from tumble phase (high-speed rotation 400
RPM), (a) in the X direction, (b) in the Y direction, (c) in the Z direction, and (d) the sum of
all the accelerations [1]
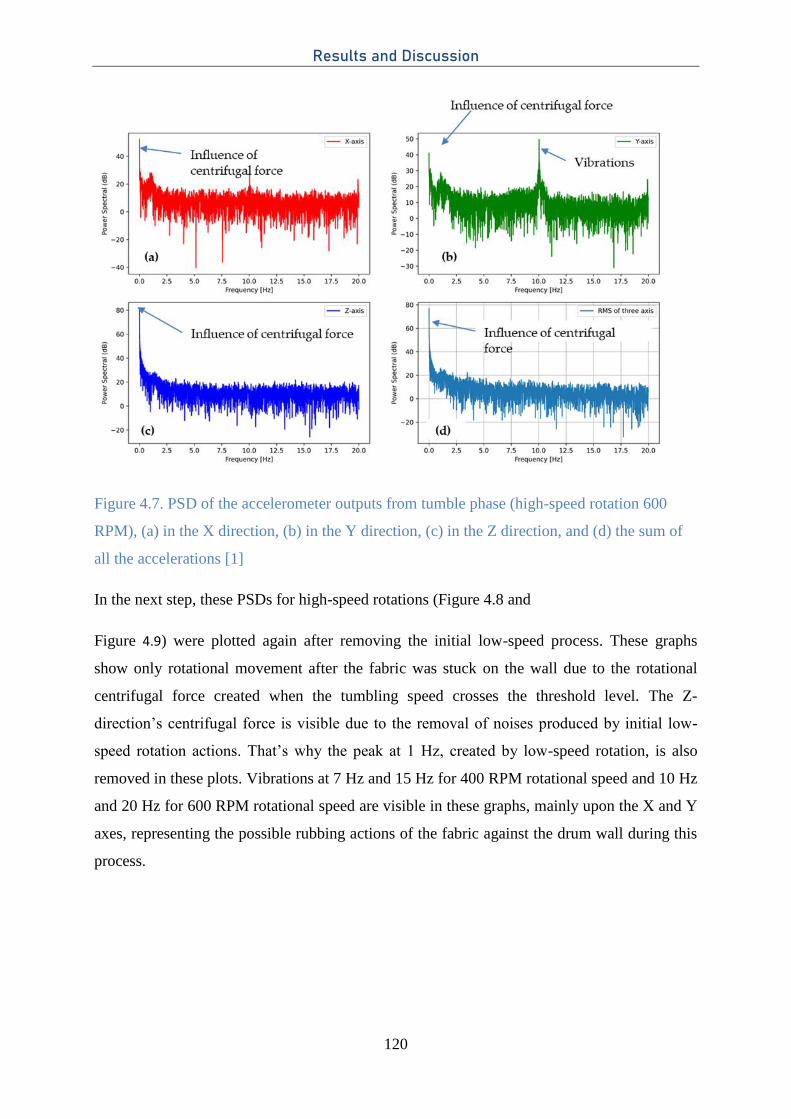
Results and Discussion
120
Figure 4.7. PSD of the accelerometer outputs from tumble phase (high-speed rotation 600
RPM), (a) in the X direction, (b) in the Y direction, (c) in the Z direction, and (d) the sum of
all the accelerations [1]
In the next step, these PSDs for high-speed rotations (Figure 4.8 and
Figure 4.9) were plotted again after removing the initial low-speed process. These graphs
show only rotational movement after the fabric was stuck on the wall due to the rotational
centrifugal force created when the tumbling speed crosses the threshold level. The Z-
direction’s centrifugal force is visible due to the removal of noises produced by initial low-
speed rotation actions. That’s why the peak at 1 Hz, created by low-speed rotation, is also
removed in these plots. Vibrations at 7 Hz and 15 Hz for 400 RPM rotational speed and 10 Hz
and 20 Hz for 600 RPM rotational speed are visible in these graphs, mainly upon the X and Y
axes, representing the possible rubbing actions of the fabric against the drum wall during this
process.
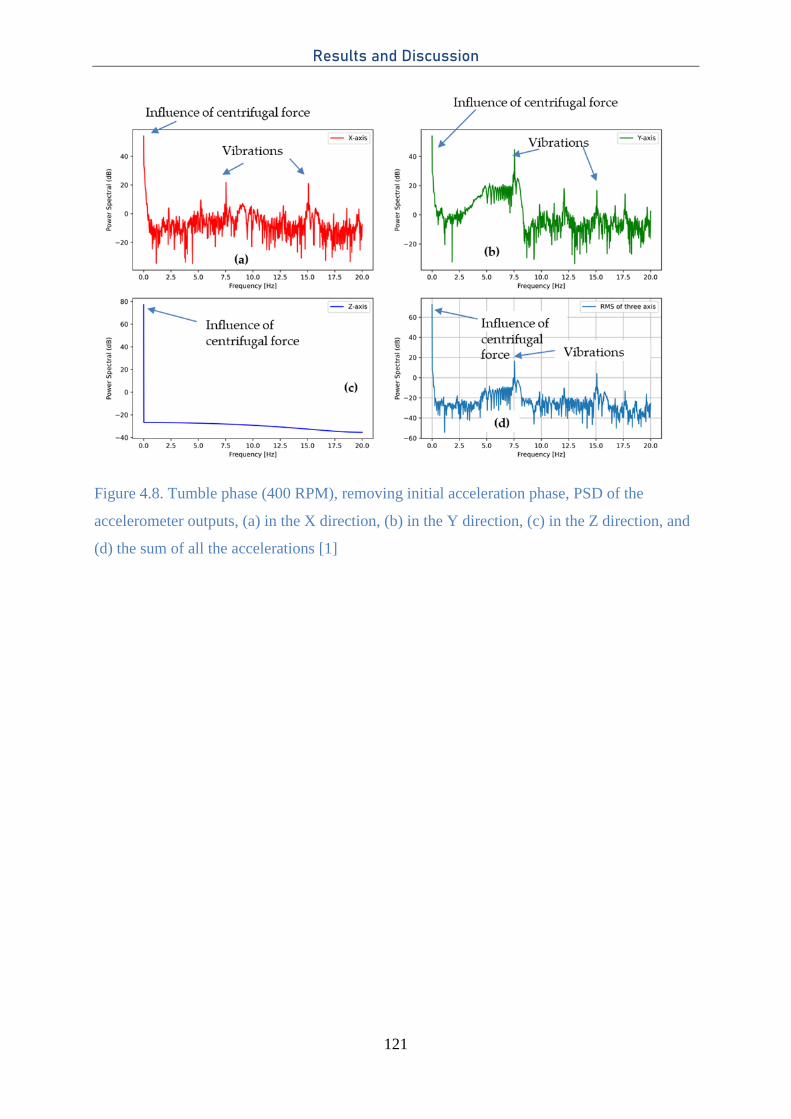
Results and Discussion
121
Figure 4.8. Tumble phase (400 RPM), removing initial acceleration phase, PSD of the
accelerometer outputs, (a) in the X direction, (b) in the Y direction, (c) in the Z direction, and
(d) the sum of all the accelerations [1]
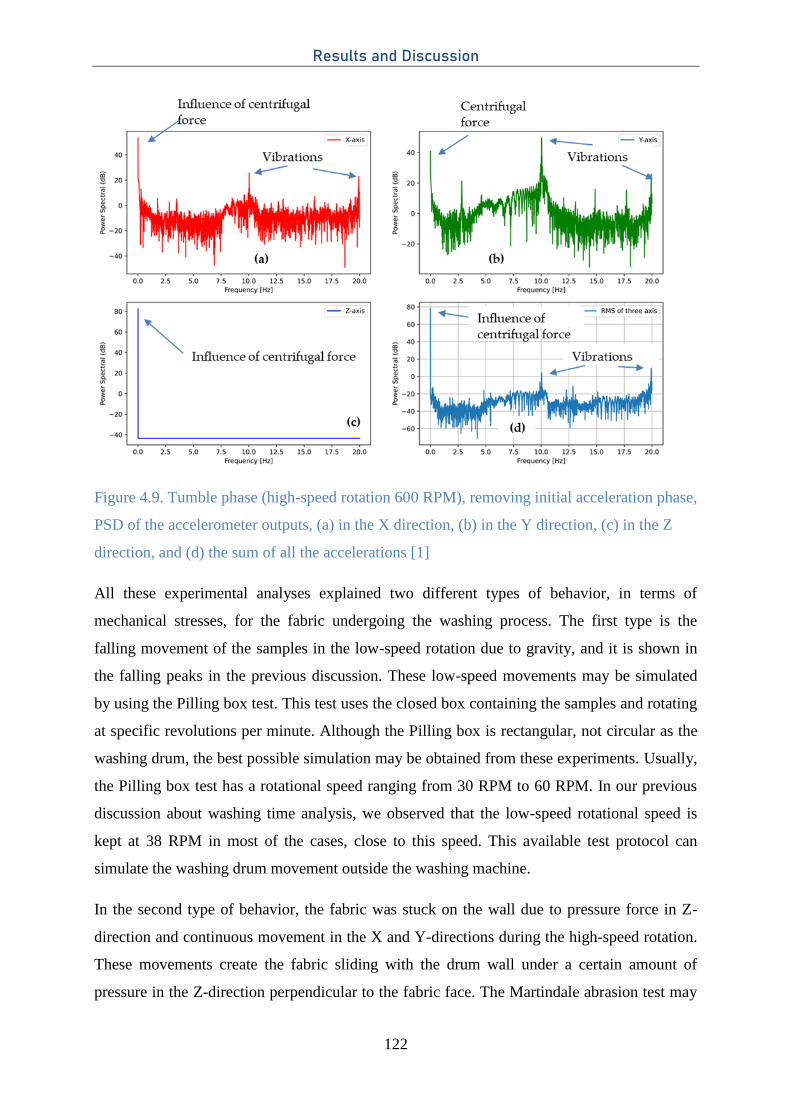
Results and Discussion
122
Figure 4.9. Tumble phase (high-speed rotation 600 RPM), removing initial acceleration phase,
PSD of the accelerometer outputs, (a) in the X direction, (b) in the Y direction, (c) in the Z
direction, and (d) the sum of all the accelerations [1]
All these experimental analyses explained two different types of behavior, in terms of
mechanical stresses, for the fabric undergoing the washing process. The first type is the
falling movement of the samples in the low-speed rotation due to gravity, and it is shown in
the falling peaks in the previous discussion. These low-speed movements may be simulated
by using the Pilling box test. This test uses the closed box containing the samples and rotating
at specific revolutions per minute. Although the Pilling box is rectangular, not circular as the
washing drum, the best possible simulation may be obtained from these experiments. Usually,
the Pilling box test has a rotational speed ranging from 30 RPM to 60 RPM. In our previous
discussion about washing time analysis, we observed that the low-speed rotational speed is
kept at 38 RPM in most of the cases, close to this speed. This available test protocol can
simulate the washing drum movement outside the washing machine.
In the second type of behavior, the fabric was stuck on the wall due to pressure force in Z-
direction and continuous movement in the X and Y-directions during the high-speed rotation.
These movements create the fabric sliding with the drum wall under a certain amount of
pressure in the Z-direction perpendicular to the fabric face. The Martindale abrasion test may
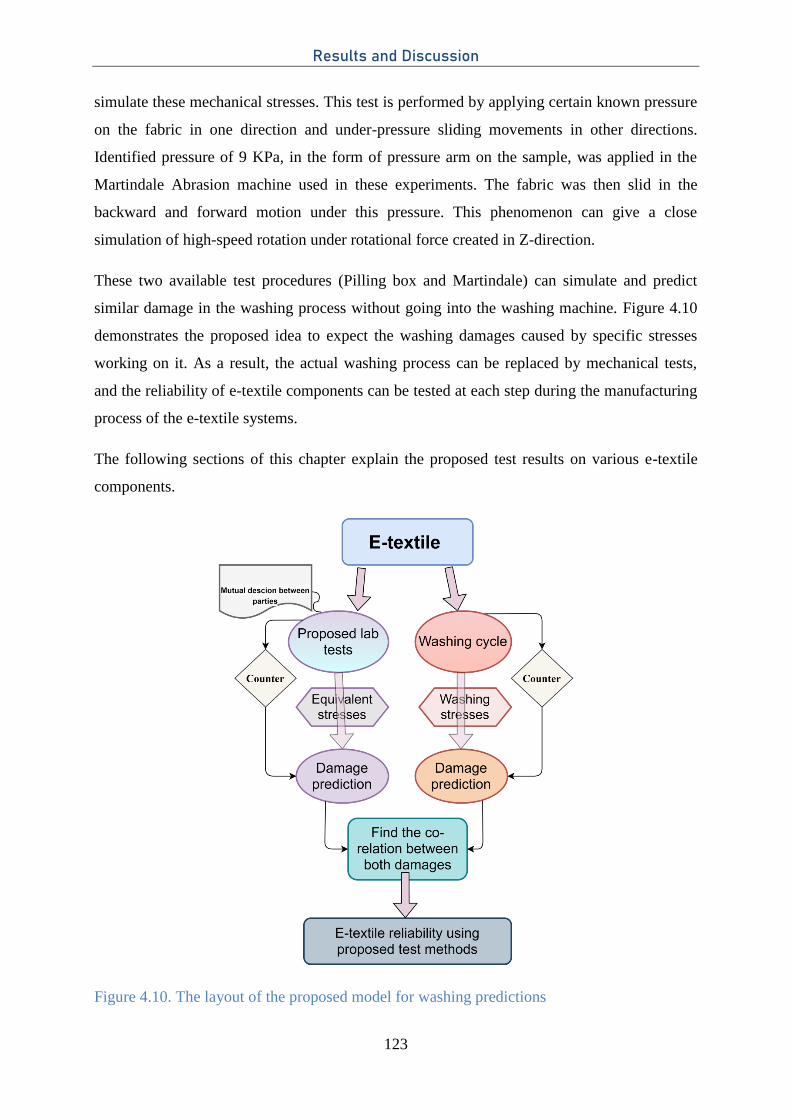
Results and Discussion
123
simulate these mechanical stresses. This test is performed by applying certain known pressure
on the fabric in one direction and under-pressure sliding movements in other directions.
Identified pressure of 9 KPa, in the form of pressure arm on the sample, was applied in the
Martindale Abrasion machine used in these experiments. The fabric was then slid in the
backward and forward motion under this pressure. This phenomenon can give a close
simulation of high-speed rotation under rotational force created in Z-direction.
These two available test procedures (Pilling box and Martindale) can simulate and predict
similar damage in the washing process without going into the washing machine. Figure 4.10
demonstrates the proposed idea to expect the washing damages caused by specific stresses
working on it. As a result, the actual washing process can be replaced by mechanical tests,
and the reliability of e-textile components can be tested at each step during the manufacturing
process of the e-textile systems.
The following sections of this chapter explain the proposed test results on various e-textile
components.
Figure 4.10. The layout of the proposed model for washing predictions
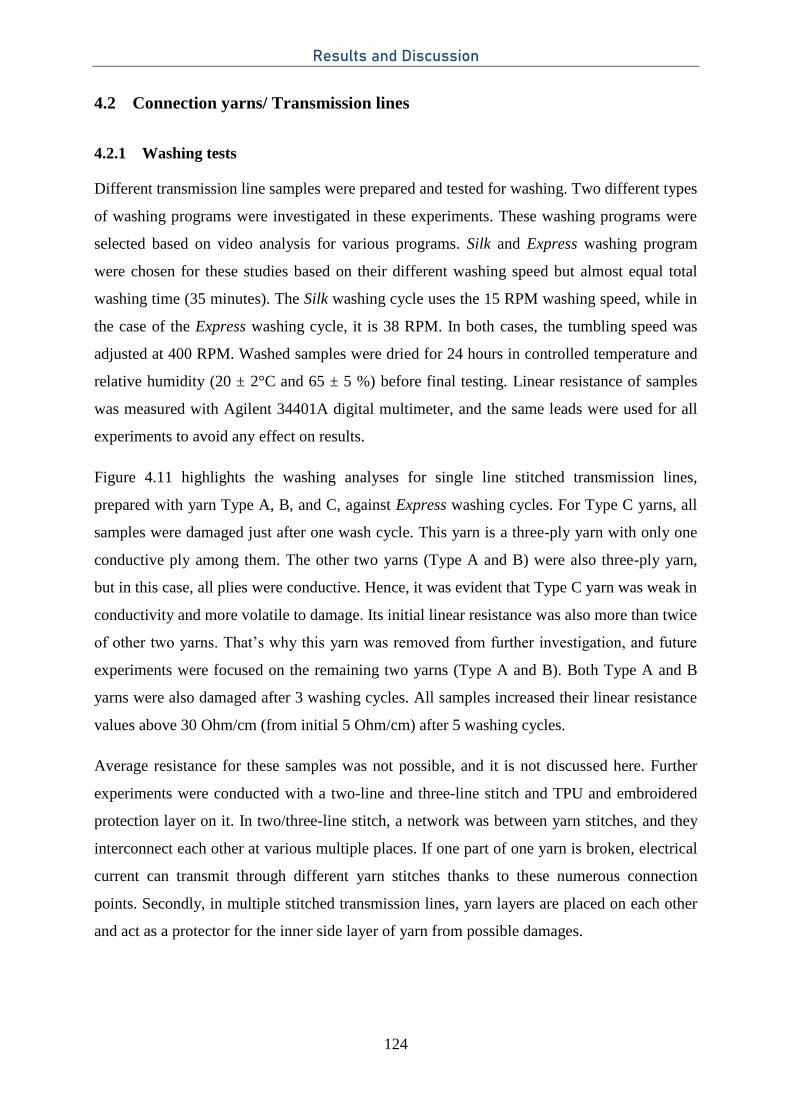
Results and Discussion
124
4.2 Connection yarns/ Transmission lines
4.2.1 Washing tests
Different transmission line samples were prepared and tested for washing. Two different types
of washing programs were investigated in these experiments. These washing programs were
selected based on video analysis for various programs. Silk and Express washing program
were chosen for these studies based on their different washing speed but almost equal total
washing time (35 minutes). The Silk washing cycle uses the 15 RPM washing speed, while in
the case of the Express washing cycle, it is 38 RPM. In both cases, the tumbling speed was
adjusted at 400 RPM. Washed samples were dried for 24 hours in controlled temperature and
relative humidity (20 ± 2°C and 65 ± 5 %) before final testing. Linear resistance of samples
was measured with Agilent 34401A digital multimeter, and the same leads were used for all
experiments to avoid any effect on results.
Figure 4.11 highlights the washing analyses for single line stitched transmission lines,
prepared with yarn Type A, B, and C, against Express washing cycles. For Type C yarns, all
samples were damaged just after one wash cycle. This yarn is a three-ply yarn with only one
conductive ply among them. The other two yarns (Type A and B) were also three-ply yarn,
but in this case, all plies were conductive. Hence, it was evident that Type C yarn was weak in
conductivity and more volatile to damage. Its initial linear resistance was also more than twice
of other two yarns. That’s why this yarn was removed from further investigation, and future
experiments were focused on the remaining two yarns (Type A and B). Both Type A and B
yarns were also damaged after 3 washing cycles. All samples increased their linear resistance
values above 30 Ohm/cm (from initial 5 Ohm/cm) after 5 washing cycles.
Average resistance for these samples was not possible, and it is not discussed here. Further
experiments were conducted with a two-line and three-line stitch and TPU and embroidered
protection layer on it. In two/three-line stitch, a network was between yarn stitches, and they
interconnect each other at various multiple places. If one part of one yarn is broken, electrical
current can transmit through different yarn stitches thanks to these numerous connection
points. Secondly, in multiple stitched transmission lines, yarn layers are placed on each other
and act as a protector for the inner side layer of yarn from possible damages.
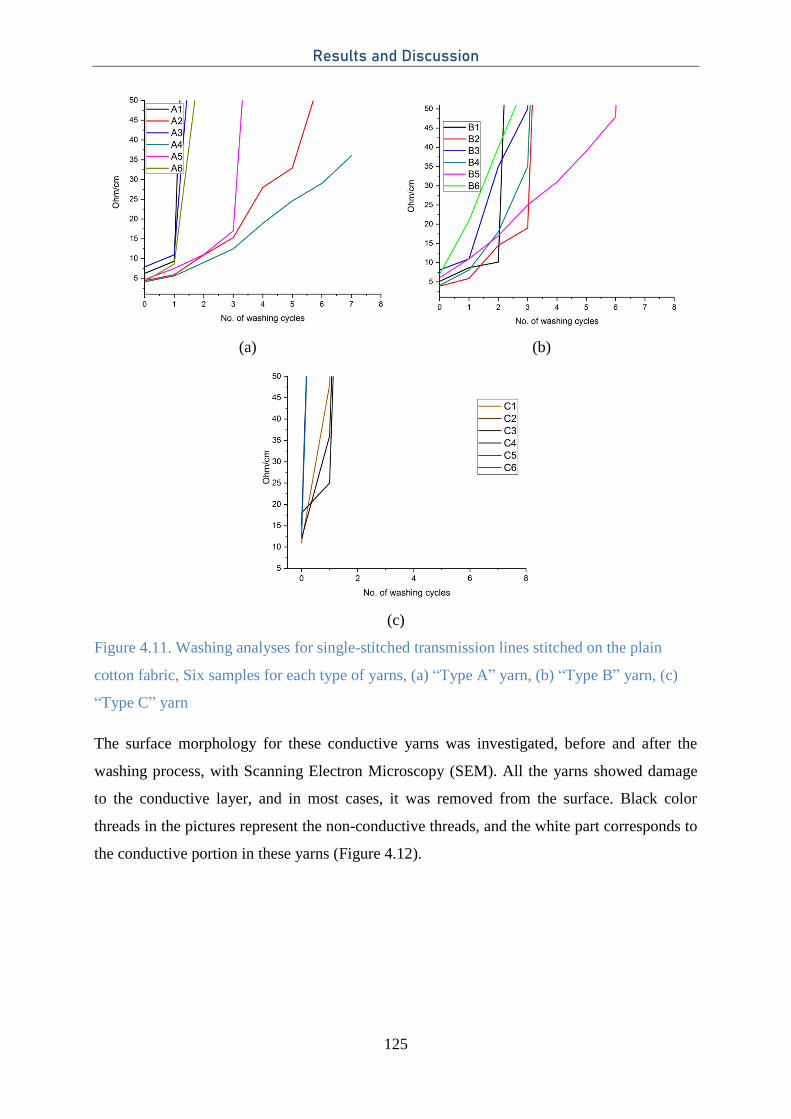
Results and Discussion
125
(a) (b)
(c)
Figure 4.11. Washing analyses for single-stitched transmission lines stitched on the plain
cotton fabric, Six samples for each type of yarns, (a) “Type A” yarn, (b) “Type B” yarn, (c)
“Type C” yarn
The surface morphology for these conductive yarns was investigated, before and after the
washing process, with Scanning Electron Microscopy (SEM). All the yarns showed damage
to the conductive layer, and in most cases, it was removed from the surface. Black color
threads in the pictures represent the non-conductive threads, and the white part corresponds to
the conductive portion in these yarns (Figure 4.12).
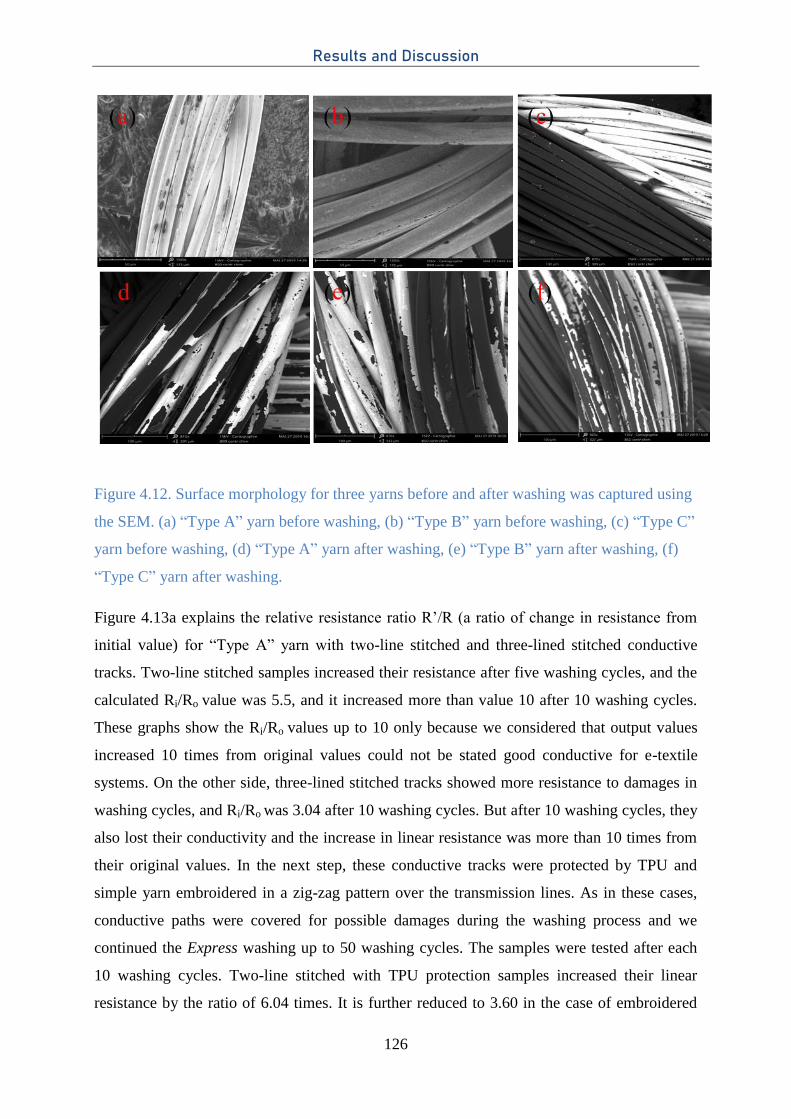
Results and Discussion
126
Figure 4.12. Surface morphology for three yarns before and after washing was captured using
the SEM. (a) “Type A” yarn before washing, (b) “Type B” yarn before washing, (c) “Type C”
yarn before washing, (d) “Type A” yarn after washing, (e) “Type B” yarn after washing, (f)
“Type C” yarn after washing.
Figure 4.13a explains the relative resistance ratio R’/R (a ratio of change in resistance from
initial value) for “Type A” yarn with two-line stitched and three-lined stitched conductive
tracks. Two-line stitched samples increased their resistance after five washing cycles, and the
calculated Ri/Ro value was 5.5, and it increased more than value 10 after 10 washing cycles.
These graphs show the Ri/Ro values up to 10 only because we considered that output values
increased 10 times from original values could not be stated good conductive for e-textile
systems. On the other side, three-lined stitched tracks showed more resistance to damages in
washing cycles, and Ri/Ro was 3.04 after 10 washing cycles. But after 10 washing cycles, they
also lost their conductivity and the increase in linear resistance was more than 10 times from
their original values. In the next step, these conductive tracks were protected by TPU and
simple yarn embroidered in a zig-zag pattern over the transmission lines. As in these cases,
conductive paths were covered for possible damages during the washing process and we
continued the Express washing up to 50 washing cycles. The samples were tested after each
10 washing cycles. Two-line stitched with TPU protection samples increased their linear
resistance by the ratio of 6.04 times. It is further reduced to 3.60 in the case of embroidered
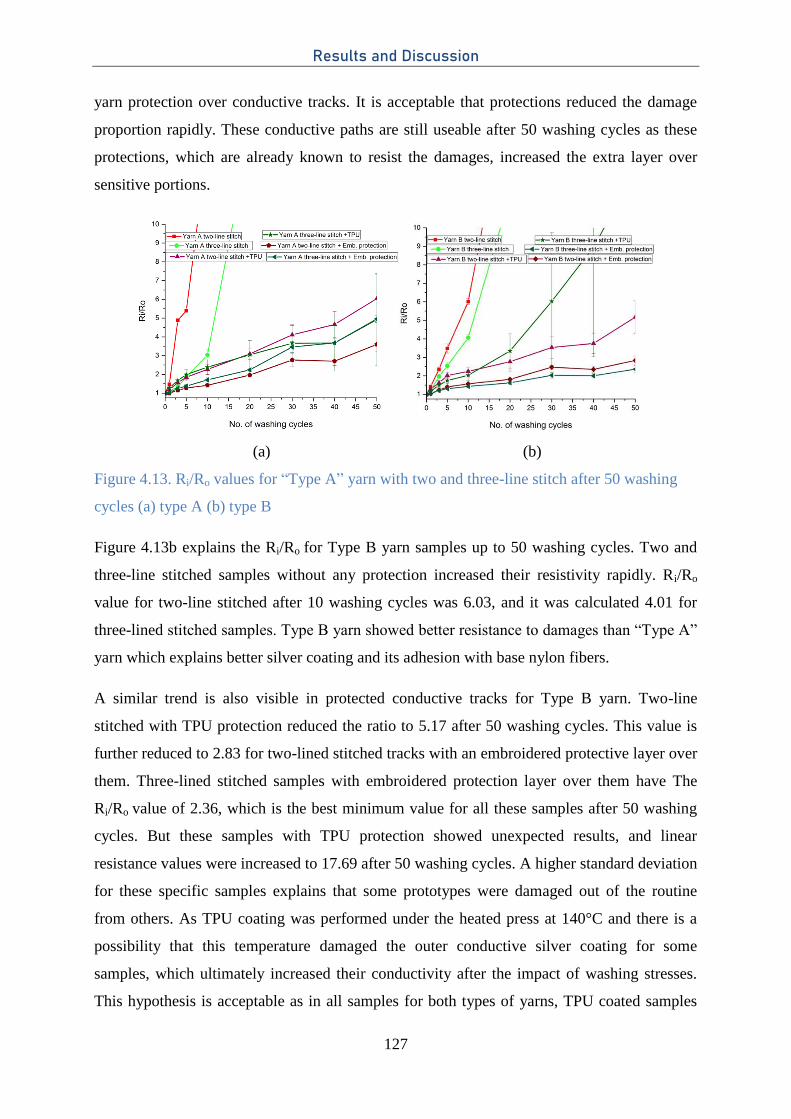
Results and Discussion
127
yarn protection over conductive tracks. It is acceptable that protections reduced the damage
proportion rapidly. These conductive paths are still useable after 50 washing cycles as these
protections, which are already known to resist the damages, increased the extra layer over
sensitive portions.
(a) (b)
Figure 4.13. Ri/Ro values for “Type A” yarn with two and three-line stitch after 50 washing
cycles (a) type A (b) type B
Figure 4.13b explains the Ri/Ro for Type B yarn samples up to 50 washing cycles. Two and
three-line stitched samples without any protection increased their resistivity rapidly. Ri/Ro
value for two-line stitched after 10 washing cycles was 6.03, and it was calculated 4.01 for
three-lined stitched samples. Type B yarn showed better resistance to damages than “Type A”
yarn which explains better silver coating and its adhesion with base nylon fibers.
A similar trend is also visible in protected conductive tracks for Type B yarn. Two-line
stitched with TPU protection reduced the ratio to 5.17 after 50 washing cycles. This value is
further reduced to 2.83 for two-lined stitched tracks with an embroidered protective layer over
them. Three-lined stitched samples with embroidered protection layer over them have The
Ri/Ro value of 2.36, which is the best minimum value for all these samples after 50 washing
cycles. But these samples with TPU protection showed unexpected results, and linear
resistance values were increased to 17.69 after 50 washing cycles. A higher standard deviation
for these specific samples explains that some prototypes were damaged out of the routine
from others. As TPU coating was performed under the heated press at 140°C and there is a
possibility that this temperature damaged the outer conductive silver coating for some
samples, which ultimately increased their conductivity after the impact of washing stresses.
This hypothesis is acceptable as in all samples for both types of yarns, TPU coated samples
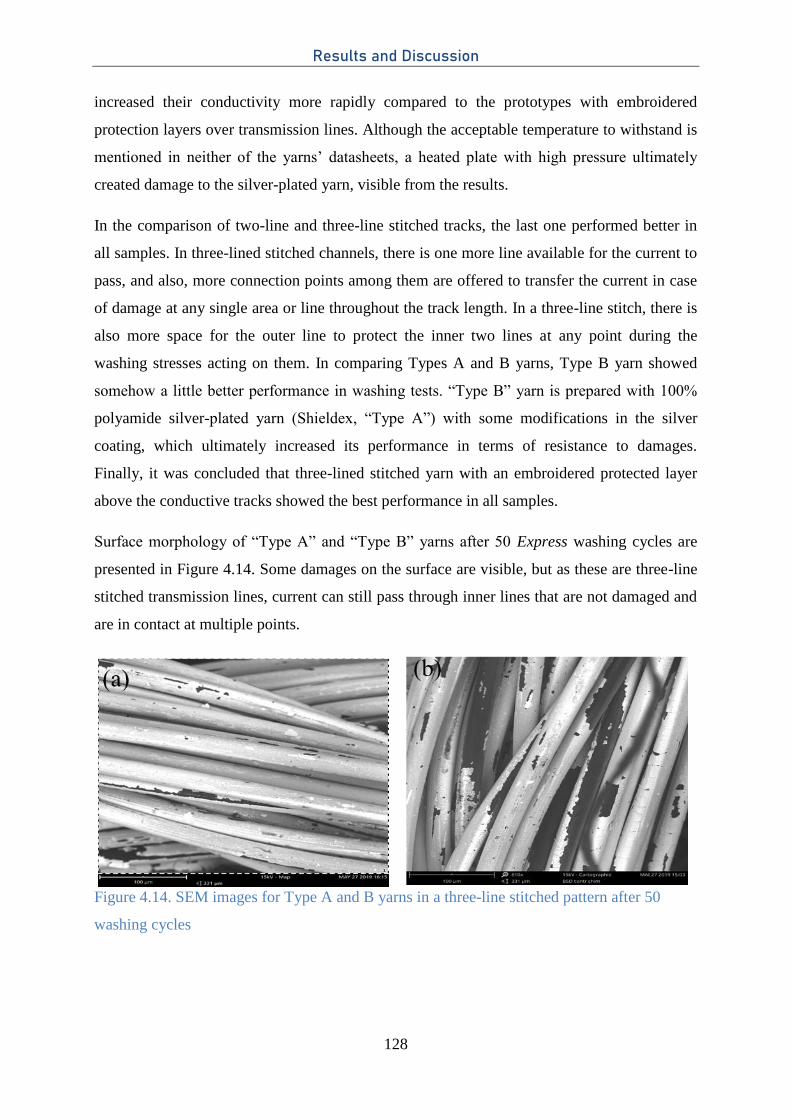
Results and Discussion
128
increased their conductivity more rapidly compared to the prototypes with embroidered
protection layers over transmission lines. Although the acceptable temperature to withstand is
mentioned in neither of the yarns’ datasheets, a heated plate with high pressure ultimately
created damage to the silver-plated yarn, visible from the results.
In the comparison of two-line and three-line stitched tracks, the last one performed better in
all samples. In three-lined stitched channels, there is one more line available for the current to
pass, and also, more connection points among them are offered to transfer the current in case
of damage at any single area or line throughout the track length. In a three-line stitch, there is
also more space for the outer line to protect the inner two lines at any point during the
washing stresses acting on them. In comparing Types A and B yarns, Type B yarn showed
somehow a little better performance in washing tests. “Type B” yarn is prepared with 100%
polyamide silver-plated yarn (Shieldex, “Type A”) with some modifications in the silver
coating, which ultimately increased its performance in terms of resistance to damages.
Finally, it was concluded that three-lined stitched yarn with an embroidered protected layer
above the conductive tracks showed the best performance in all samples.
Surface morphology of “Type A” and “Type B” yarns after 50 Express washing cycles are
presented in Figure 4.14. Some damages on the surface are visible, but as these are three-line
stitched transmission lines, current can still pass through inner lines that are not damaged and
are in contact at multiple points.
Figure 4.14. SEM images for Type A and B yarns in a three-line stitched pattern after 50
washing cycles
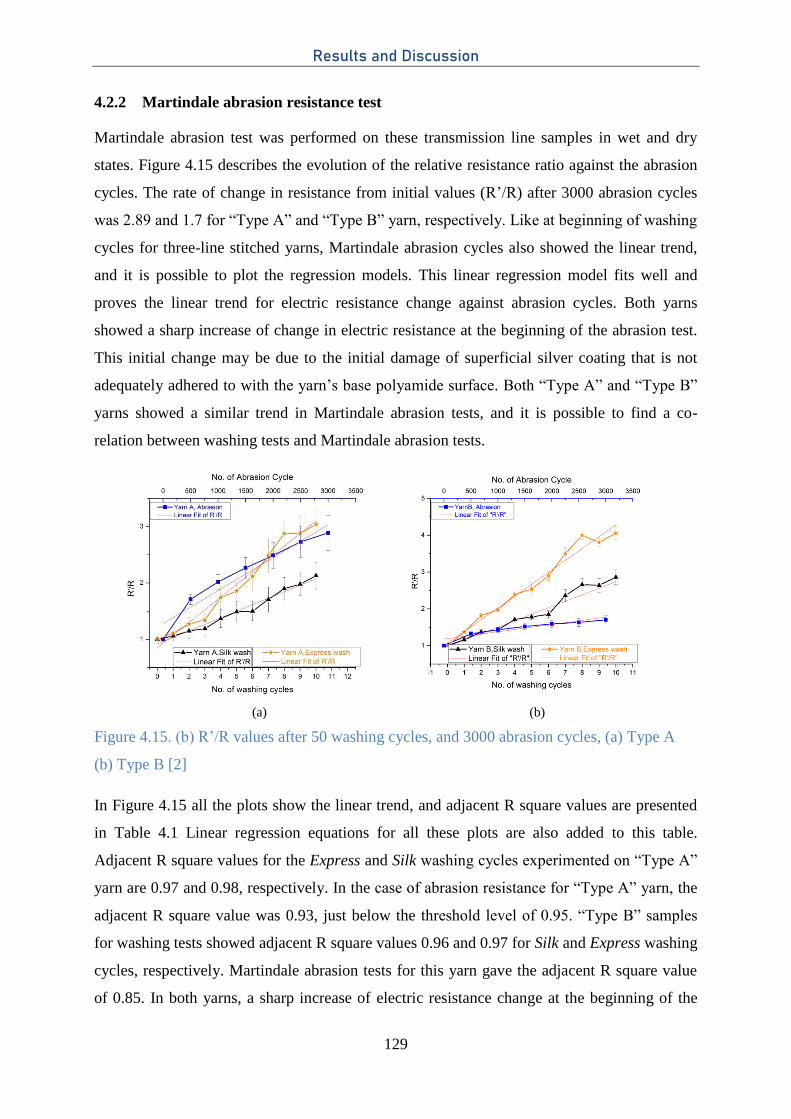
Results and Discussion
129
4.2.2 Martindale abrasion resistance test
Martindale abrasion test was performed on these transmission line samples in wet and dry
states. Figure 4.15 describes the evolution of the relative resistance ratio against the abrasion
cycles. The rate of change in resistance from initial values (R’/R) after 3000 abrasion cycles
was 2.89 and 1.7 for “Type A” and “Type B” yarn, respectively. Like at beginning of washing
cycles for three-line stitched yarns, Martindale abrasion cycles also showed the linear trend,
and it is possible to plot the regression models. This linear regression model fits well and
proves the linear trend for electric resistance change against abrasion cycles. Both yarns
showed a sharp increase of change in electric resistance at the beginning of the abrasion test.
This initial change may be due to the initial damage of superficial silver coating that is not
adequately adhered to with the yarn’s base polyamide surface. Both “Type A” and “Type B”
yarns showed a similar trend in Martindale abrasion tests, and it is possible to find a co-
relation between washing tests and Martindale abrasion tests.
(a) (b)
Figure 4.15. (b) R’/R values after 50 washing cycles, and 3000 abrasion cycles, (a) Type A
(b) Type B [2]
In Figure 4.15 all the plots show the linear trend, and adjacent R square values are presented
in Table 4.1 Linear regression equations for all these plots are also added to this table.
Adjacent R square values for the Express and Silk washing cycles experimented on “Type A”
yarn are 0.97 and 0.98, respectively. In the case of abrasion resistance for “Type A” yarn, the
adjacent R square value was 0.93, just below the threshold level of 0.95. “Type B” samples
for washing tests showed adjacent R square values 0.96 and 0.97 for Silk and Express washing
cycles, respectively. Martindale abrasion tests for this yarn gave the adjacent R square value
of 0.85. In both yarns, a sharp increase of electric resistance change at the beginning of the
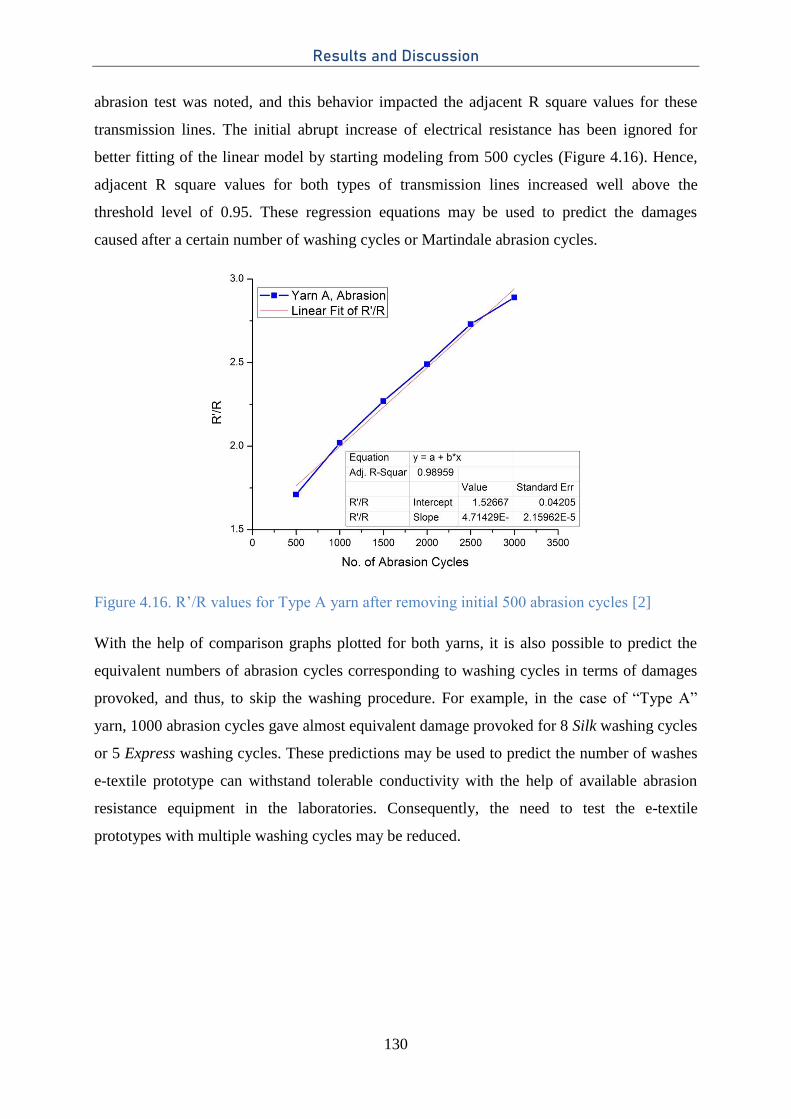
Results and Discussion
130
abrasion test was noted, and this behavior impacted the adjacent R square values for these
transmission lines. The initial abrupt increase of electrical resistance has been ignored for
better fitting of the linear model by starting modeling from 500 cycles (Figure 4.16). Hence,
adjacent R square values for both types of transmission lines increased well above the
threshold level of 0.95. These regression equations may be used to predict the damages
caused after a certain number of washing cycles or Martindale abrasion cycles.
Figure 4.16. R’/R values for Type A yarn after removing initial 500 abrasion cycles [2]
With the help of comparison graphs plotted for both yarns, it is also possible to predict the
equivalent numbers of abrasion cycles corresponding to washing cycles in terms of damages
provoked, and thus, to skip the washing procedure. For example, in the case of “Type A”
yarn, 1000 abrasion cycles gave almost equivalent damage provoked for 8 Silk washing cycles
or 5 Express washing cycles. These predictions may be used to predict the number of washes
e-textile prototype can withstand tolerable conductivity with the help of available abrasion
resistance equipment in the laboratories. Consequently, the need to test the e-textile
prototypes with multiple washing cycles may be reduced.
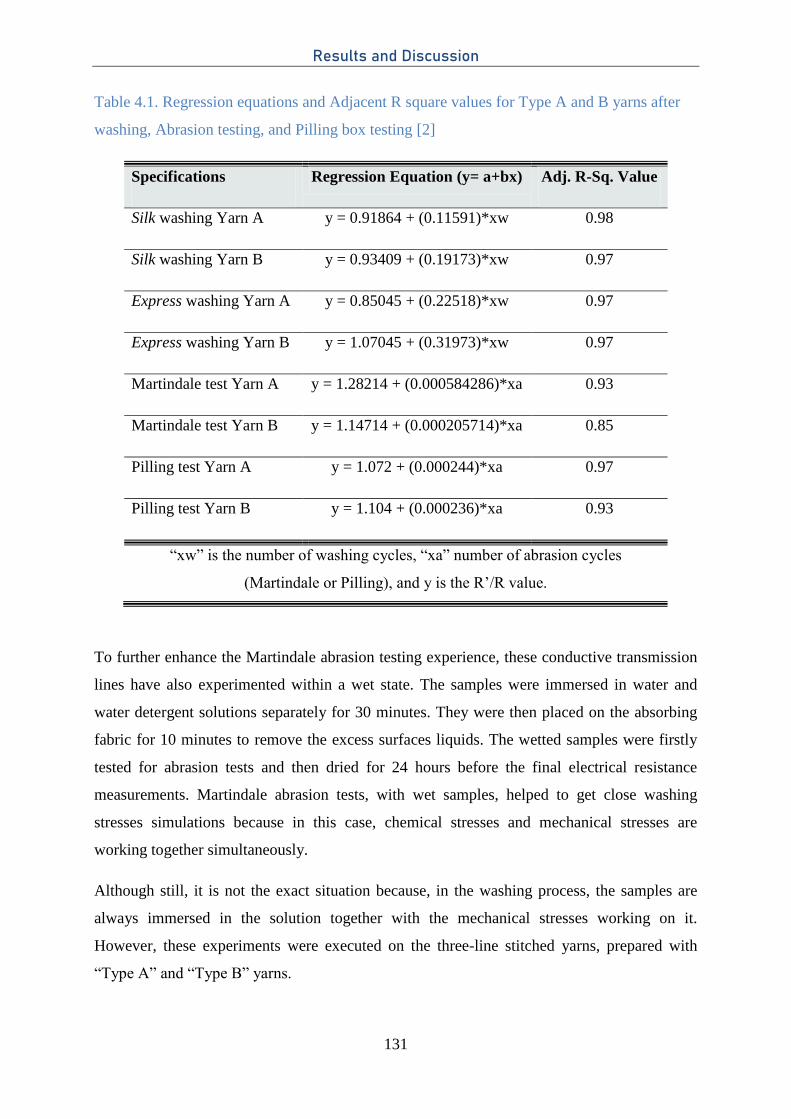
Results and Discussion
131
Table 4.1. Regression equations and Adjacent R square values for Type A and B yarns after
washing, Abrasion testing, and Pilling box testing [2]
Specifications Regression Equation (y= a+bx) Adj. R-Sq. Value
Silk washing Yarn A y = 0.91864 + (0.11591)*xw 0.98
Silk washing Yarn B y = 0.93409 + (0.19173)*xw 0.97
Express washing Yarn A y = 0.85045 + (0.22518)*xw 0.97
Express washing Yarn B y = 1.07045 + (0.31973)*xw 0.97
Martindale test Yarn A y = 1.28214 + (0.000584286)*xa 0.93
Martindale test Yarn B y = 1.14714 + (0.000205714)*xa 0.85
Pilling test Yarn A y = 1.072 + (0.000244)*xa 0.97
Pilling test Yarn B y = 1.104 + (0.000236)*xa 0.93
“xw” is the number of washing cycles, “xa” number of abrasion cycles
(Martindale or Pilling), and y is the R’/R value.
To further enhance the Martindale abrasion testing experience, these conductive transmission
lines have also experimented within a wet state. The samples were immersed in water and
water detergent solutions separately for 30 minutes. They were then placed on the absorbing
fabric for 10 minutes to remove the excess surfaces liquids. The wetted samples were firstly
tested for abrasion tests and then dried for 24 hours before the final electrical resistance
measurements. Martindale abrasion tests, with wet samples, helped to get close washing
stresses simulations because in this case, chemical stresses and mechanical stresses are
working together simultaneously.
Although still, it is not the exact situation because, in the washing process, the samples are
always immersed in the solution together with the mechanical stresses working on it.
However, these experiments were executed on the three-line stitched yarns, prepared with
“Type A” and “Type B” yarns.
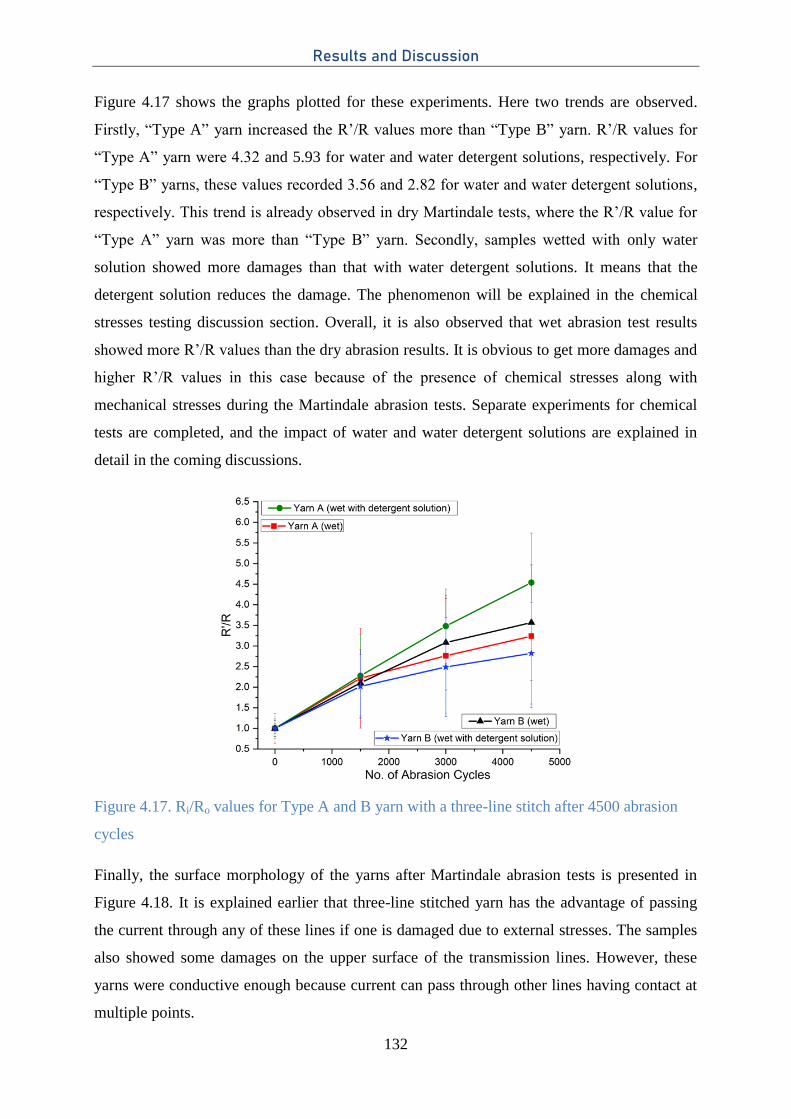
Results and Discussion
132
Figure 4.17 shows the graphs plotted for these experiments. Here two trends are observed.
Firstly, “Type A” yarn increased the R’/R values more than “Type B” yarn. R’/R values for
“Type A” yarn were 4.32 and 5.93 for water and water detergent solutions, respectively. For
“Type B” yarns, these values recorded 3.56 and 2.82 for water and water detergent solutions,
respectively. This trend is already observed in dry Martindale tests, where the R’/R value for
“Type A” yarn was more than “Type B” yarn. Secondly, samples wetted with only water
solution showed more damages than that with water detergent solutions. It means that the
detergent solution reduces the damage. The phenomenon will be explained in the chemical
stresses testing discussion section. Overall, it is also observed that wet abrasion test results
showed more R’/R values than the dry abrasion results. It is obvious to get more damages and
higher R’/R values in this case because of the presence of chemical stresses along with
mechanical stresses during the Martindale abrasion tests. Separate experiments for chemical
tests are completed, and the impact of water and water detergent solutions are explained in
detail in the coming discussions.
Figure 4.17. Ri/Ro values for Type A and B yarn with a three-line stitch after 4500 abrasion
cycles
Finally, the surface morphology of the yarns after Martindale abrasion tests is presented in
Figure 4.18. It is explained earlier that three-line stitched yarn has the advantage of passing
the current through any of these lines if one is damaged due to external stresses. The samples
also showed some damages on the upper surface of the transmission lines. However, these
yarns were conductive enough because current can pass through other lines having contact at
multiple points.
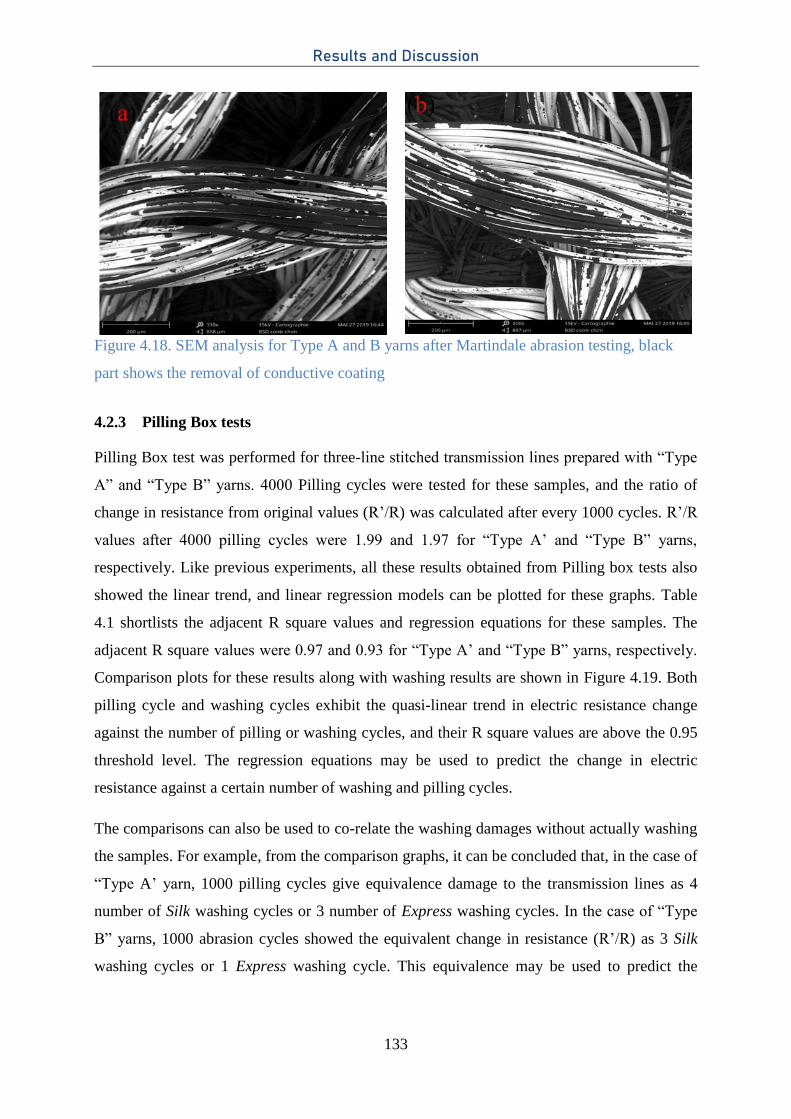
Results and Discussion
133
Figure 4.18. SEM analysis for Type A and B yarns after Martindale abrasion testing, black
part shows the removal of conductive coating
4.2.3 Pilling Box tests
Pilling Box test was performed for three-line stitched transmission lines prepared with “Type
A” and “Type B” yarns. 4000 Pilling cycles were tested for these samples, and the ratio of
change in resistance from original values (R’/R) was calculated after every 1000 cycles. R’/R
values after 4000 pilling cycles were 1.99 and 1.97 for “Type A’ and “Type B” yarns,
respectively. Like previous experiments, all these results obtained from Pilling box tests also
showed the linear trend, and linear regression models can be plotted for these graphs. Table
4.1 shortlists the adjacent R square values and regression equations for these samples. The
adjacent R square values were 0.97 and 0.93 for “Type A’ and “Type B” yarns, respectively.
Comparison plots for these results along with washing results are shown in Figure 4.19. Both
pilling cycle and washing cycles exhibit the quasi-linear trend in electric resistance change
against the number of pilling or washing cycles, and their R square values are above the 0.95
threshold level. The regression equations may be used to predict the change in electric
resistance against a certain number of washing and pilling cycles.
The comparisons can also be used to co-relate the washing damages without actually washing
the samples. For example, from the comparison graphs, it can be concluded that, in the case of
“Type A’ yarn, 1000 pilling cycles give equivalence damage to the transmission lines as 4
number of Silk washing cycles or 3 number of Express washing cycles. In the case of “Type
B” yarns, 1000 abrasion cycles showed the equivalent change in resistance (R’/R) as 3 Silk
washing cycles or 1 Express washing cycle. This equivalence may be used to predict the
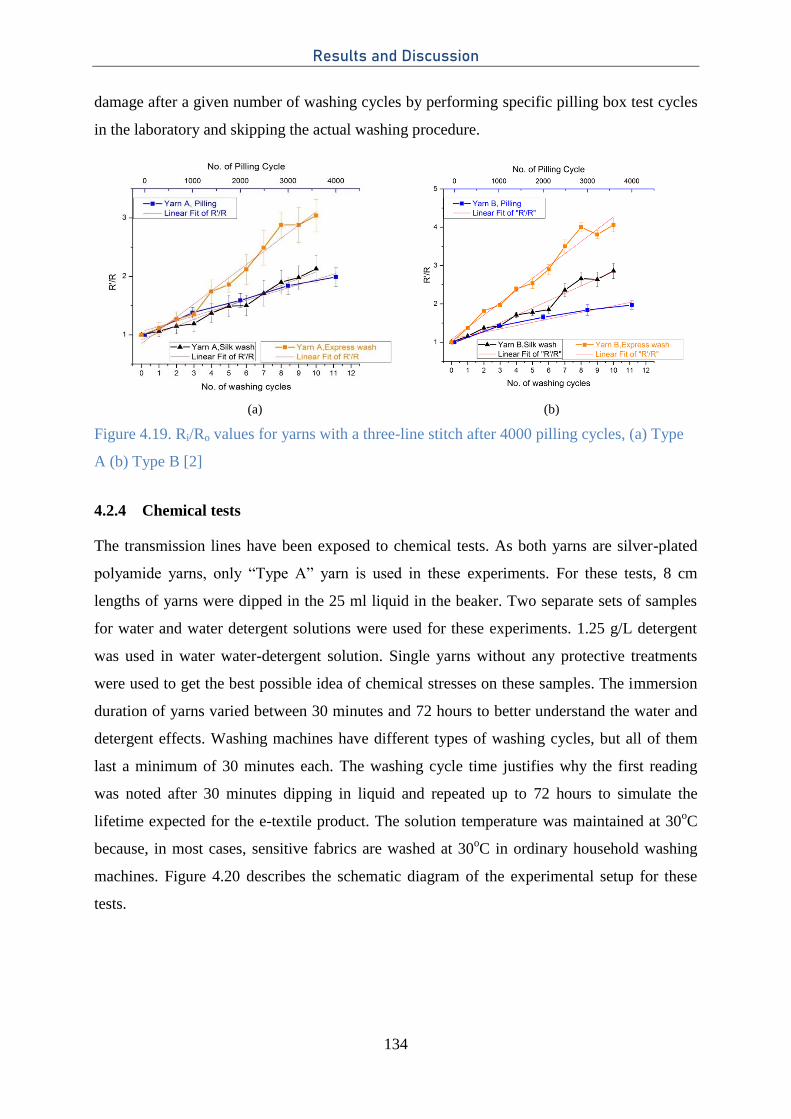
Results and Discussion
134
damage after a given number of washing cycles by performing specific pilling box test cycles
in the laboratory and skipping the actual washing procedure.
(a) (b)
Figure 4.19. Ri/Ro values for yarns with a three-line stitch after 4000 pilling cycles, (a) Type
A (b) Type B [2]
4.2.4 Chemical tests
The transmission lines have been exposed to chemical tests. As both yarns are silver-plated
polyamide yarns, only “Type A” yarn is used in these experiments. For these tests, 8 cm
lengths of yarns were dipped in the 25 ml liquid in the beaker. Two separate sets of samples
for water and water detergent solutions were used for these experiments. 1.25 g/L detergent
was used in water water-detergent solution. Single yarns without any protective treatments
were used to get the best possible idea of chemical stresses on these samples. The immersion
duration of yarns varied between 30 minutes and 72 hours to better understand the water and
detergent effects. Washing machines have different types of washing cycles, but all of them
last a minimum of 30 minutes each. The washing cycle time justifies why the first reading
was noted after 30 minutes dipping in liquid and repeated up to 72 hours to simulate the
lifetime expected for the e-textile product. The solution temperature was maintained at 30oC
because, in most cases, sensitive fabrics are washed at 30oC in ordinary household washing
machines. Figure 4.20 describes the schematic diagram of the experimental setup for these
tests.
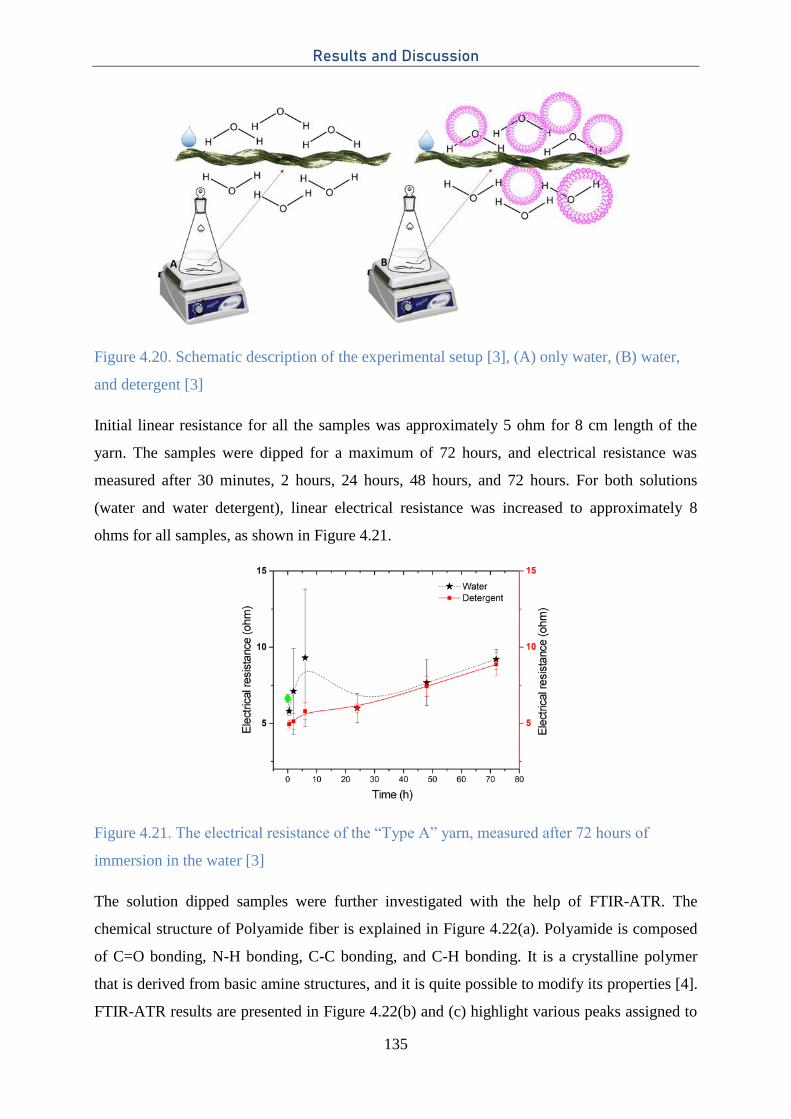
Results and Discussion
135
Figure 4.20. Schematic description of the experimental setup [3], (A) only water, (B) water,
and detergent [3]
Initial linear resistance for all the samples was approximately 5 ohm for 8 cm length of the
yarn. The samples were dipped for a maximum of 72 hours, and electrical resistance was
measured after 30 minutes, 2 hours, 24 hours, 48 hours, and 72 hours. For both solutions
(water and water detergent), linear electrical resistance was increased to approximately 8
ohms for all samples, as shown in Figure 4.21.
Figure 4.21. The electrical resistance of the “Type A” yarn, measured after 72 hours of
immersion in the water [3]
The solution dipped samples were further investigated with the help of FTIR-ATR. The
chemical structure of Polyamide fiber is explained in Figure 4.22(a). Polyamide is composed
of C=O bonding, N-H bonding, C-C bonding, and C-H bonding. It is a crystalline polymer
that is derived from basic amine structures, and it is quite possible to modify its properties [4].
FTIR-ATR results are presented in Figure 4.22(b) and (c) highlight various peaks assigned to
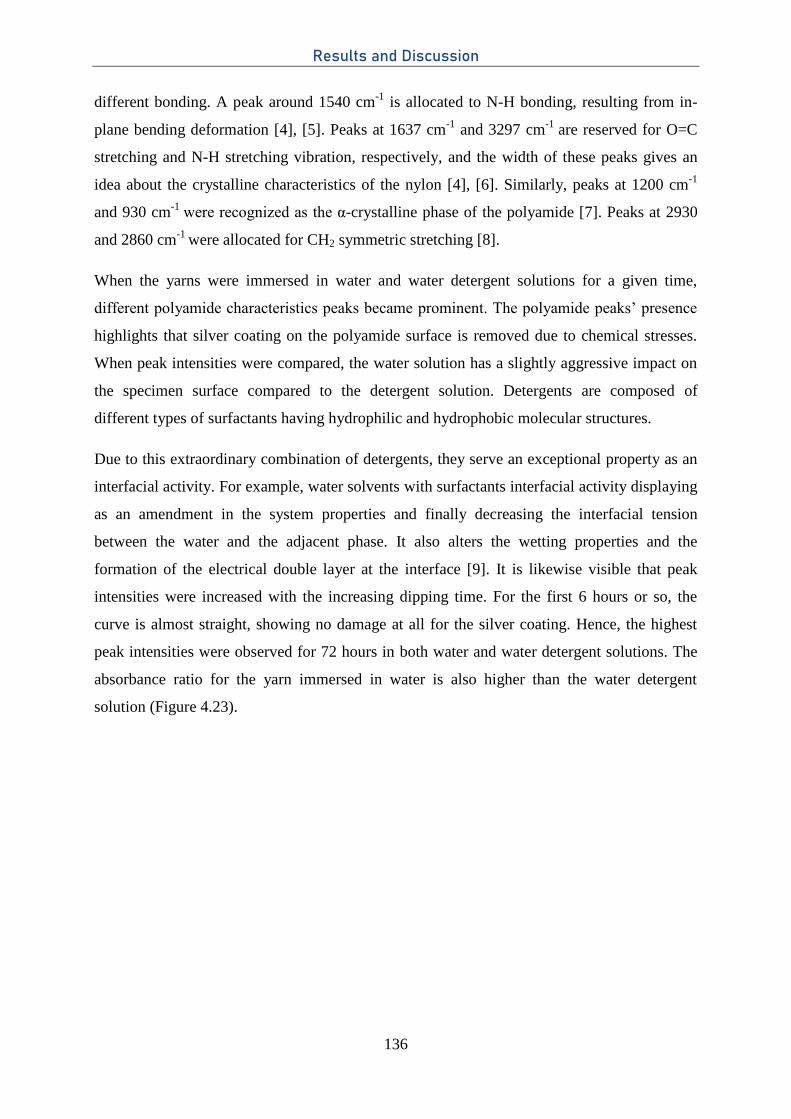
Results and Discussion
136
different bonding. A peak around 1540 cm-1
is allocated to N-H bonding, resulting from in-
plane bending deformation [4], [5]. Peaks at 1637 cm-1
and 3297 cm-1
are reserved for O=C
stretching and N-H stretching vibration, respectively, and the width of these peaks gives an
idea about the crystalline characteristics of the nylon [4], [6]. Similarly, peaks at 1200 cm-1
and 930 cm-1
were recognized as the α-crystalline phase of the polyamide [7]. Peaks at 2930
and 2860 cm-1
were allocated for CH2 symmetric stretching [8].
When the yarns were immersed in water and water detergent solutions for a given time,
different polyamide characteristics peaks became prominent. The polyamide peaks’ presence
highlights that silver coating on the polyamide surface is removed due to chemical stresses.
When peak intensities were compared, the water solution has a slightly aggressive impact on
the specimen surface compared to the detergent solution. Detergents are composed of
different types of surfactants having hydrophilic and hydrophobic molecular structures.
Due to this extraordinary combination of detergents, they serve an exceptional property as an
interfacial activity. For example, water solvents with surfactants interfacial activity displaying
as an amendment in the system properties and finally decreasing the interfacial tension
between the water and the adjacent phase. It also alters the wetting properties and the
formation of the electrical double layer at the interface [9]. It is likewise visible that peak
intensities were increased with the increasing dipping time. For the first 6 hours or so, the
curve is almost straight, showing no damage at all for the silver coating. Hence, the highest
peak intensities were observed for 72 hours in both water and water detergent solutions. The
absorbance ratio for the yarn immersed in water is also higher than the water detergent
solution (Figure 4.23).
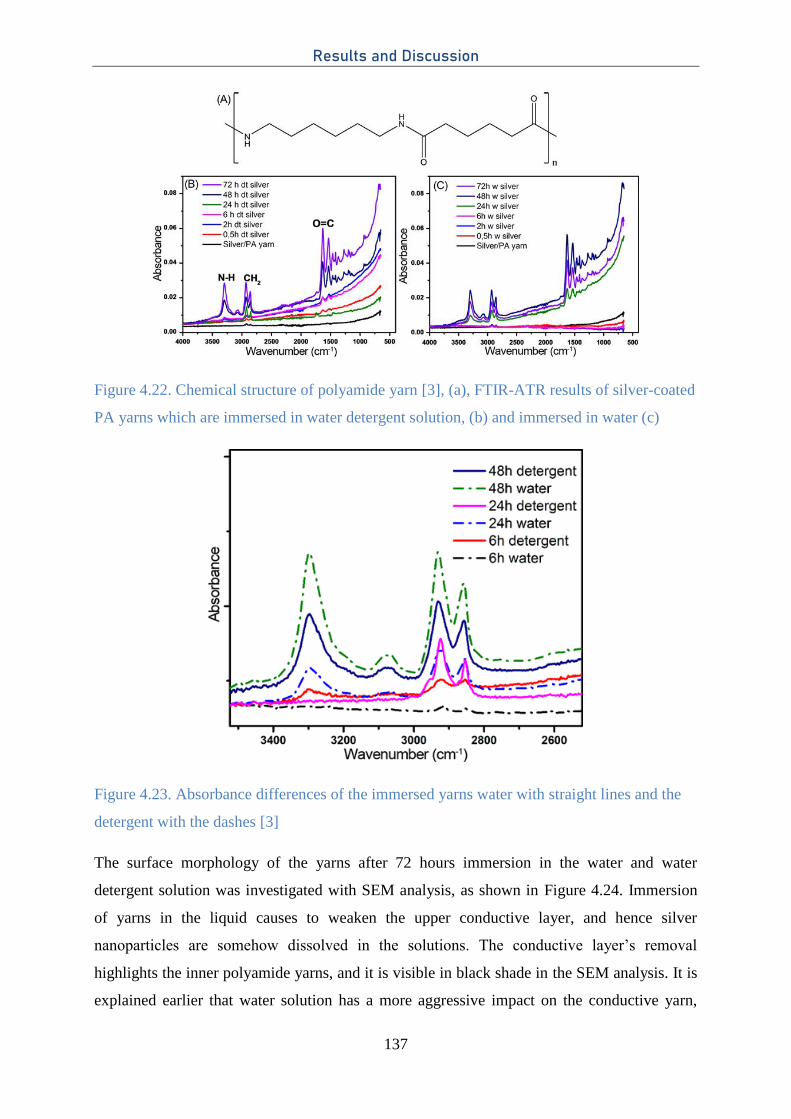
Results and Discussion
137
Figure 4.22. Chemical structure of polyamide yarn [3], (a), FTIR-ATR results of silver-coated
PA yarns which are immersed in water detergent solution, (b) and immersed in water (c)
Figure 4.23. Absorbance differences of the immersed yarns water with straight lines and the
detergent with the dashes [3]
The surface morphology of the yarns after 72 hours immersion in the water and water
detergent solution was investigated with SEM analysis, as shown in Figure 4.24. Immersion
of yarns in the liquid causes to weaken the upper conductive layer, and hence silver
nanoparticles are somehow dissolved in the solutions. The conductive layer’s removal
highlights the inner polyamide yarns, and it is visible in black shade in the SEM analysis. It is
explained earlier that water solution has a more aggressive impact on the conductive yarn,
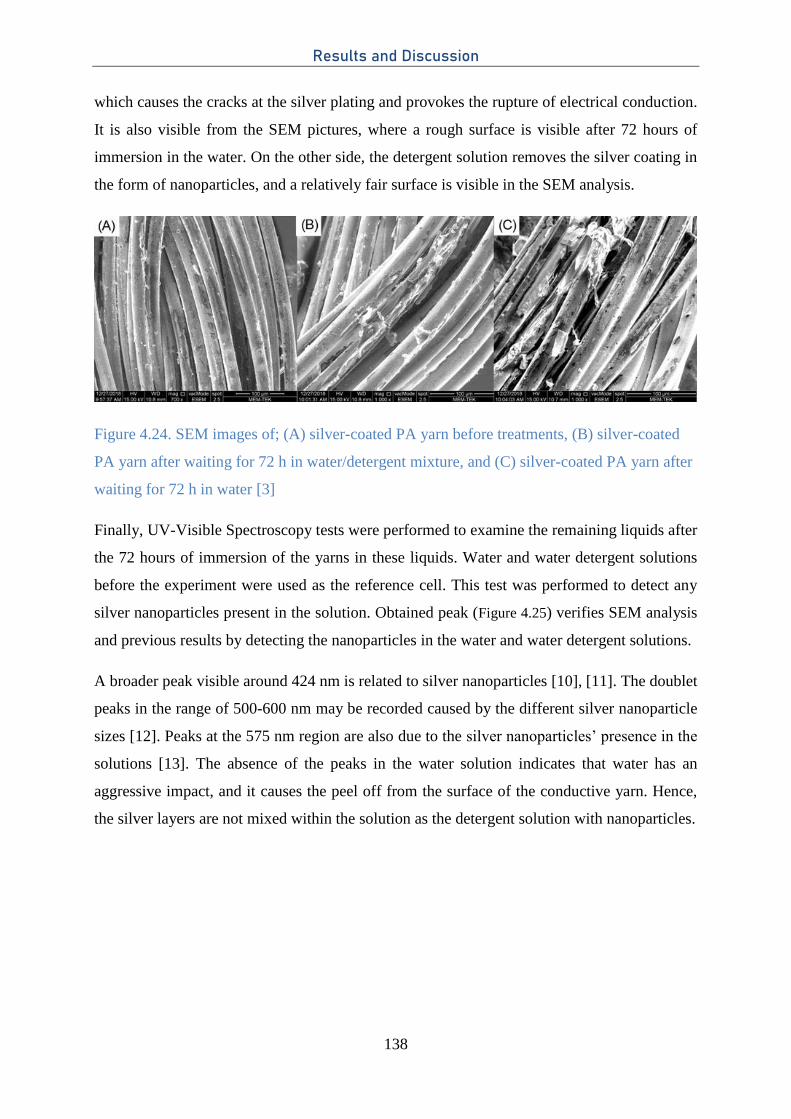
Results and Discussion
138
which causes the cracks at the silver plating and provokes the rupture of electrical conduction.
It is also visible from the SEM pictures, where a rough surface is visible after 72 hours of
immersion in the water. On the other side, the detergent solution removes the silver coating in
the form of nanoparticles, and a relatively fair surface is visible in the SEM analysis.
Figure 4.24. SEM images of; (A) silver-coated PA yarn before treatments, (B) silver-coated
PA yarn after waiting for 72 h in water/detergent mixture, and (C) silver-coated PA yarn after
waiting for 72 h in water [3]
Finally, UV-Visible Spectroscopy tests were performed to examine the remaining liquids after
the 72 hours of immersion of the yarns in these liquids. Water and water detergent solutions
before the experiment were used as the reference cell. This test was performed to detect any
silver nanoparticles present in the solution. Obtained peak (Figure 4.25) verifies SEM analysis
and previous results by detecting the nanoparticles in the water and water detergent solutions.
A broader peak visible around 424 nm is related to silver nanoparticles [10], [11]. The doublet
peaks in the range of 500-600 nm may be recorded caused by the different silver nanoparticle
sizes [12]. Peaks at the 575 nm region are also due to the silver nanoparticles’ presence in the
solutions [13]. The absence of the peaks in the water solution indicates that water has an
aggressive impact, and it causes the peel off from the surface of the conductive yarn. Hence,
the silver layers are not mixed within the solution as the detergent solution with nanoparticles.
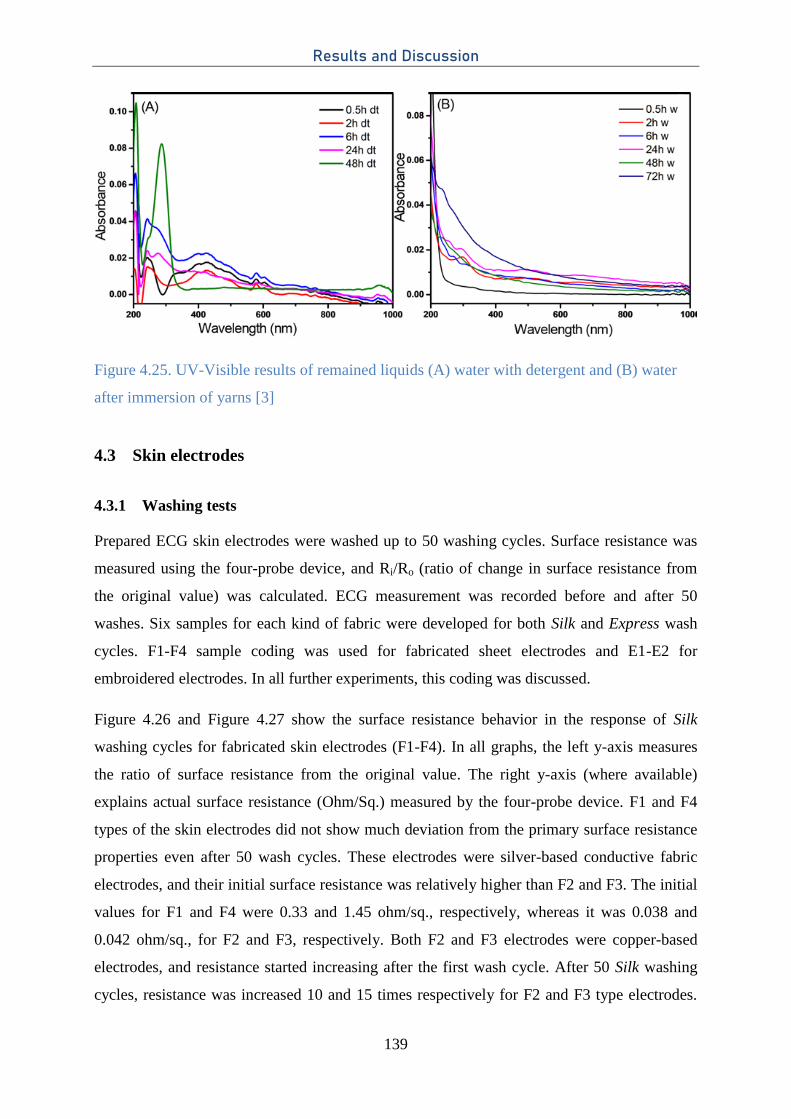
Results and Discussion
139
Figure 4.25. UV-Visible results of remained liquids (A) water with detergent and (B) water
after immersion of yarns [3]
4.3 Skin electrodes
4.3.1 Washing tests
Prepared ECG skin electrodes were washed up to 50 washing cycles. Surface resistance was
measured using the four-probe device, and Ri/Ro (ratio of change in surface resistance from
the original value) was calculated. ECG measurement was recorded before and after 50
washes. Six samples for each kind of fabric were developed for both Silk and Express wash
cycles. F1-F4 sample coding was used for fabricated sheet electrodes and E1-E2 for
embroidered electrodes. In all further experiments, this coding was discussed.
Figure 4.26 and Figure 4.27 show the surface resistance behavior in the response of Silk
washing cycles for fabricated skin electrodes (F1-F4). In all graphs, the left y-axis measures
the ratio of surface resistance from the original value. The right y-axis (where available)
explains actual surface resistance (Ohm/Sq.) measured by the four-probe device. F1 and F4
types of the skin electrodes did not show much deviation from the primary surface resistance
properties even after 50 wash cycles. These electrodes were silver-based conductive fabric
electrodes, and their initial surface resistance was relatively higher than F2 and F3. The initial
values for F1 and F4 were 0.33 and 1.45 ohm/sq., respectively, whereas it was 0.038 and
0.042 ohm/sq., for F2 and F3, respectively. Both F2 and F3 electrodes were copper-based
electrodes, and resistance started increasing after the first wash cycle. After 50 Silk washing
cycles, resistance was increased 10 and 15 times respectively for F2 and F3 type electrodes.
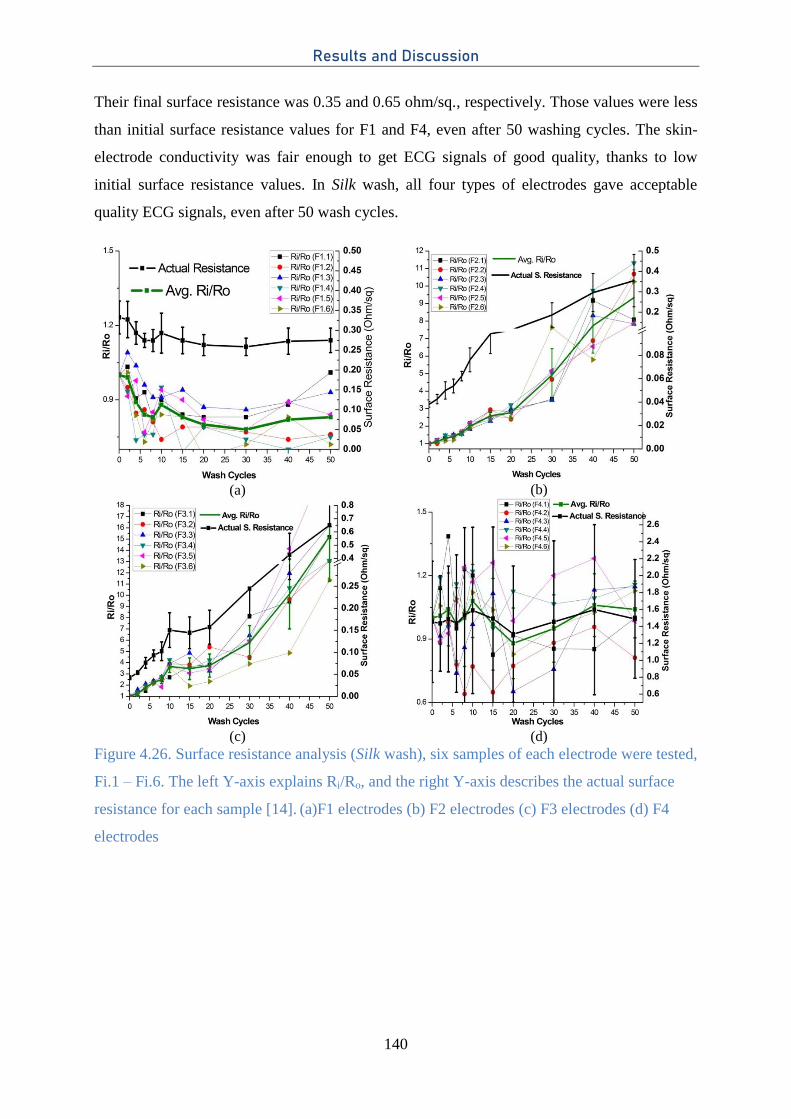
Results and Discussion
140
Their final surface resistance was 0.35 and 0.65 ohm/sq., respectively. Those values were less
than initial surface resistance values for F1 and F4, even after 50 washing cycles. The skin-
electrode conductivity was fair enough to get ECG signals of good quality, thanks to low
initial surface resistance values. In Silk wash, all four types of electrodes gave acceptable
quality ECG signals, even after 50 wash cycles.
(a)
(b)
(c)
(d)
Figure 4.26. Surface resistance analysis (Silk wash), six samples of each electrode were tested,
Fi.1 – Fi.6. The left Y-axis explains Ri/Ro, and the right Y-axis describes the actual surface
resistance for each sample [14]. (a)F1 electrodes (b) F2 electrodes (c) F3 electrodes (d) F4
electrodes
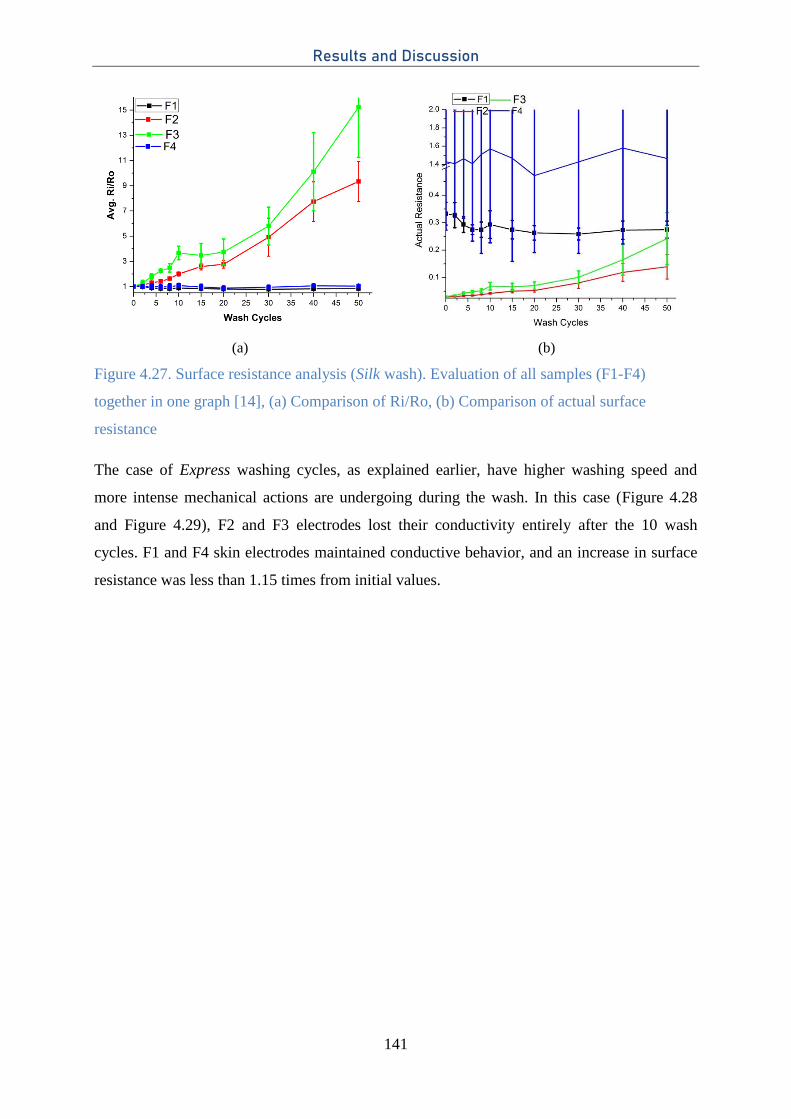
Results and Discussion
141
(a) (b)
Figure 4.27. Surface resistance analysis (Silk wash). Evaluation of all samples (F1-F4)
together in one graph [14], (a) Comparison of Ri/Ro, (b) Comparison of actual surface
resistance
The case of Express washing cycles, as explained earlier, have higher washing speed and
more intense mechanical actions are undergoing during the wash. In this case (Figure 4.28
and Figure 4.29), F2 and F3 electrodes lost their conductivity entirely after the 10 wash
cycles. F1 and F4 skin electrodes maintained conductive behavior, and an increase in surface
resistance was less than 1.15 times from initial values.
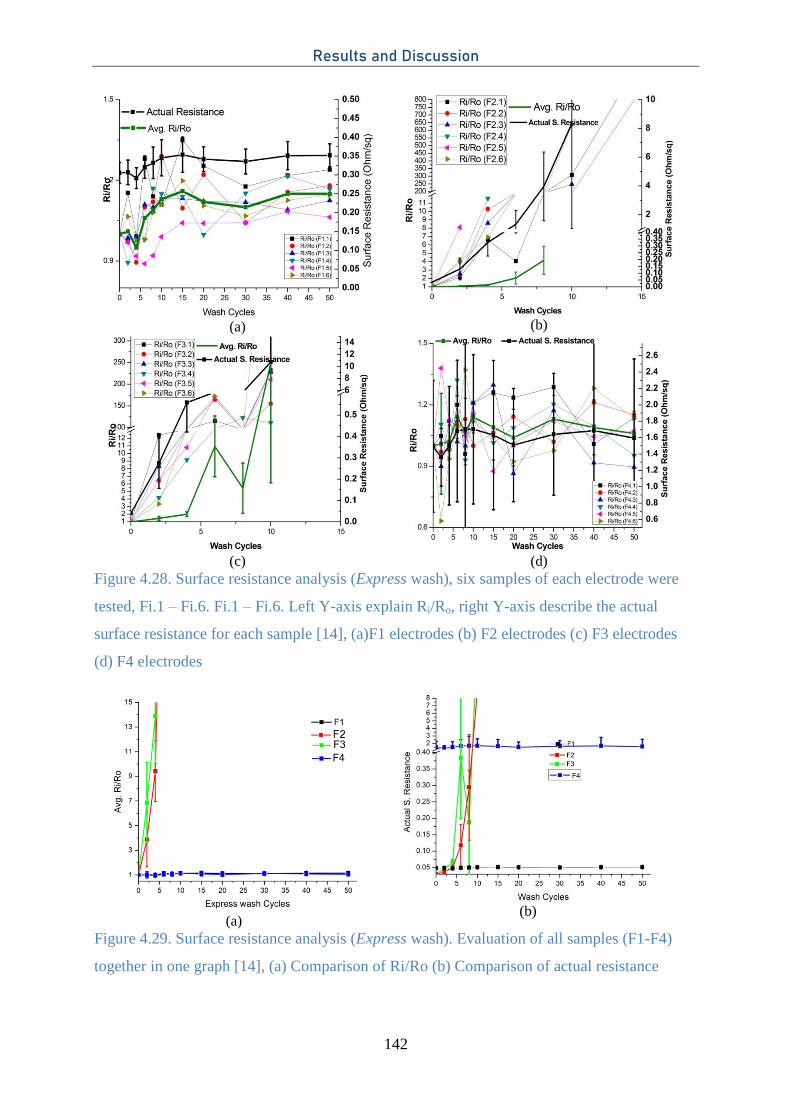
Results and Discussion
142
(a)
(b)
(c)
(d)
Figure 4.28. Surface resistance analysis (Express wash), six samples of each electrode were
tested, Fi.1 – Fi.6. Fi.1 – Fi.6. Left Y-axis explain Ri/Ro, right Y-axis describe the actual
surface resistance for each sample [14], (a)F1 electrodes (b) F2 electrodes (c) F3 electrodes
(d) F4 electrodes
(a)
(b)
Figure 4.29. Surface resistance analysis (Express wash). Evaluation of all samples (F1-F4)
together in one graph [14], (a) Comparison of Ri/Ro (b) Comparison of actual resistance
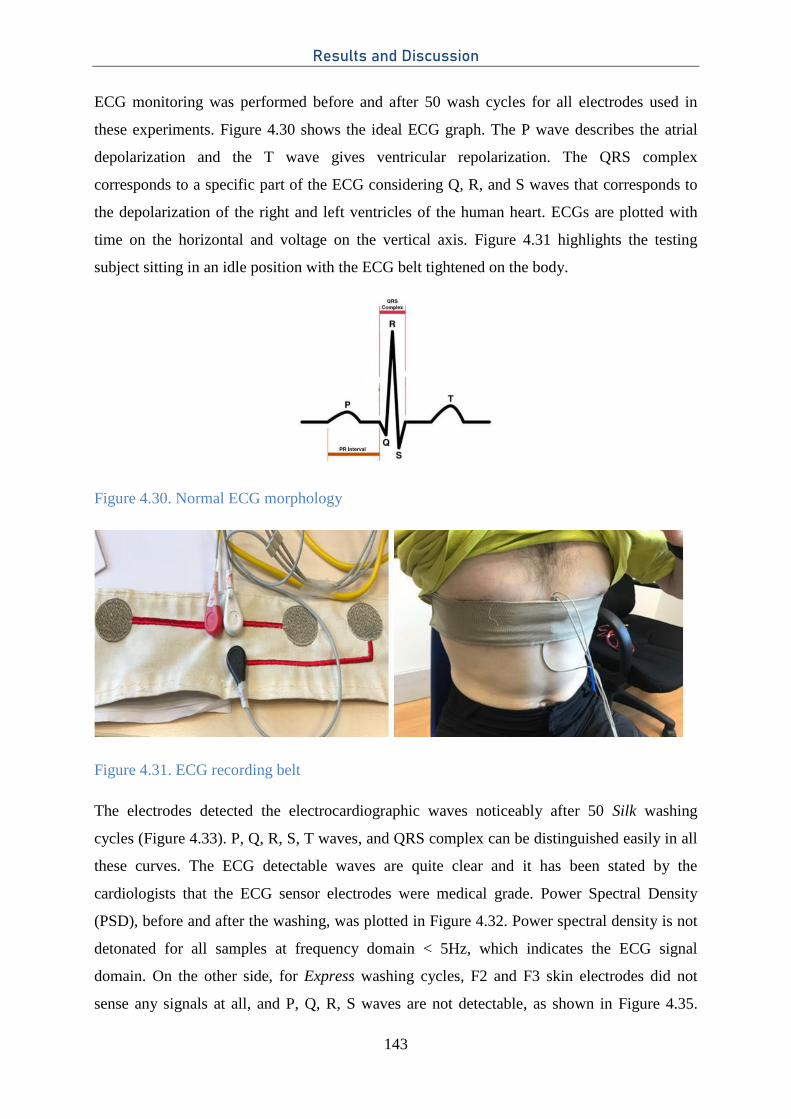
Results and Discussion
143
ECG monitoring was performed before and after 50 wash cycles for all electrodes used in
these experiments. Figure 4.30 shows the ideal ECG graph. The P wave describes the atrial
depolarization and the T wave gives ventricular repolarization. The QRS complex
corresponds to a specific part of the ECG considering Q, R, and S waves that corresponds to
the depolarization of the right and left ventricles of the human heart. ECGs are plotted with
time on the horizontal and voltage on the vertical axis. Figure 4.31 highlights the testing
subject sitting in an idle position with the ECG belt tightened on the body.
Figure 4.30. Normal ECG morphology
Figure 4.31. ECG recording belt
The electrodes detected the electrocardiographic waves noticeably after 50 Silk washing
cycles (Figure 4.33). P, Q, R, S, T waves, and QRS complex can be distinguished easily in all
these curves. The ECG detectable waves are quite clear and it has been stated by the
cardiologists that the ECG sensor electrodes were medical grade. Power Spectral Density
(PSD), before and after the washing, was plotted in Figure 4.32. Power spectral density is not
detonated for all samples at frequency domain < 5Hz, which indicates the ECG signal
domain. On the other side, for Express washing cycles, F2 and F3 skin electrodes did not
sense any signals at all, and P, Q, R, S waves are not detectable, as shown in Figure 4.35.
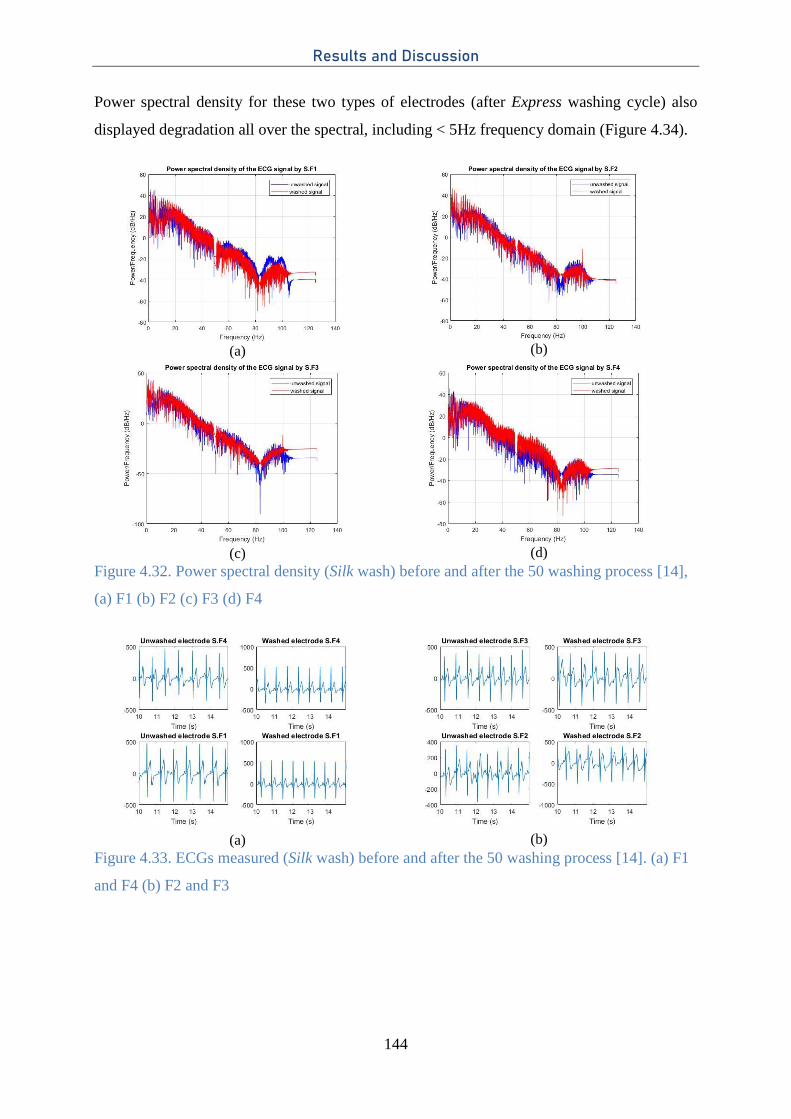
Results and Discussion
144
Power spectral density for these two types of electrodes (after Express washing cycle) also
displayed degradation all over the spectral, including < 5Hz frequency domain (Figure 4.34).
(a)
(b)
(c)
(d)
Figure 4.32. Power spectral density (Silk wash) before and after the 50 washing process [14],
(a) F1 (b) F2 (c) F3 (d) F4
(a)
(b)
Figure 4.33. ECGs measured (Silk wash) before and after the 50 washing process [14]. (a) F1
and F4 (b) F2 and F3
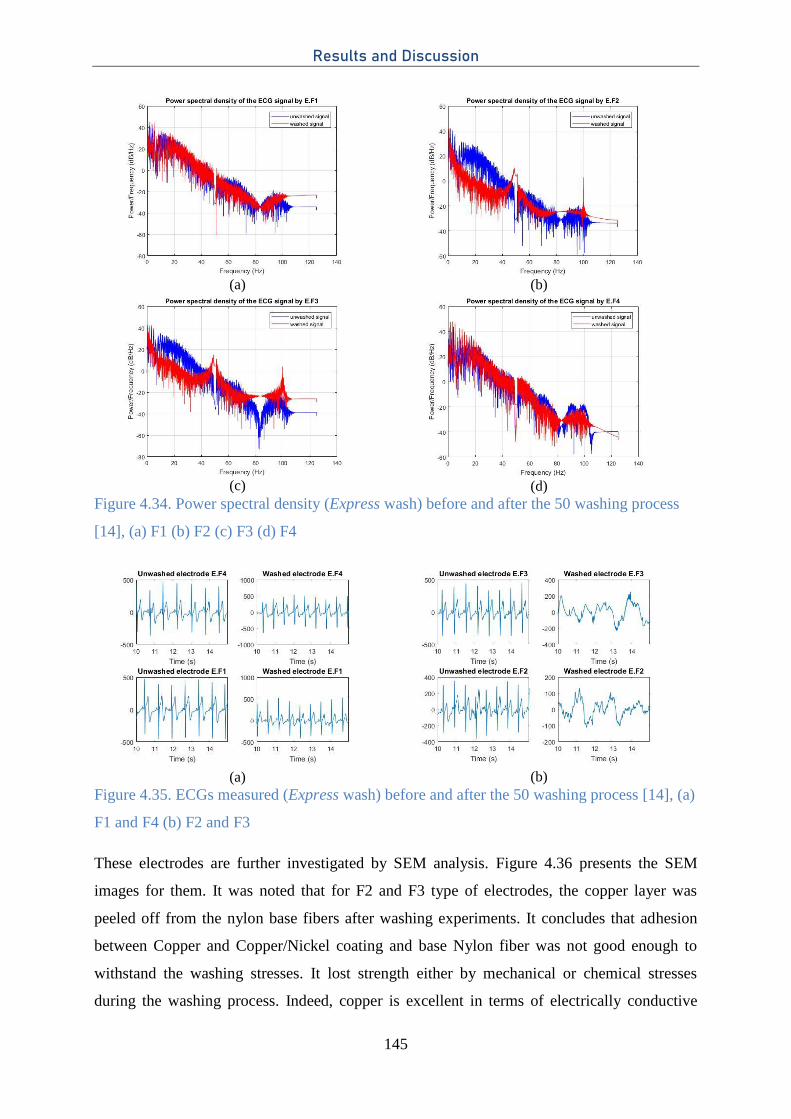
Results and Discussion
145
(a)
(b)
(c)
(d)
Figure 4.34. Power spectral density (Express wash) before and after the 50 washing process
[14], (a) F1 (b) F2 (c) F3 (d) F4
(a)
(b)
Figure 4.35. ECGs measured (Express wash) before and after the 50 washing process [14], (a)
F1 and F4 (b) F2 and F3
These electrodes are further investigated by SEM analysis. Figure 4.36 presents the SEM
images for them. It was noted that for F2 and F3 type of electrodes, the copper layer was
peeled off from the nylon base fibers after washing experiments. It concludes that adhesion
between Copper and Copper/Nickel coating and base Nylon fiber was not good enough to
withstand the washing stresses. It lost strength either by mechanical or chemical stresses
during the washing process. Indeed, copper is excellent in terms of electrically conductive
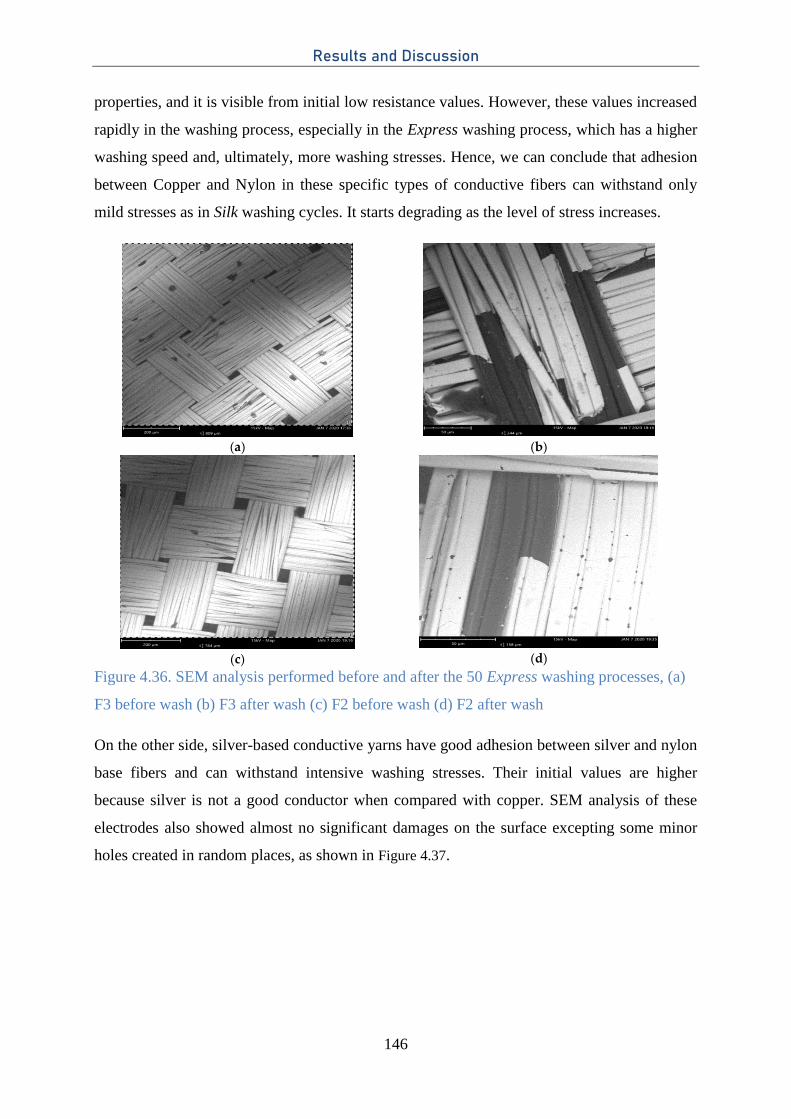
Results and Discussion
146
properties, and it is visible from initial low resistance values. However, these values increased
rapidly in the washing process, especially in the Express washing process, which has a higher
washing speed and, ultimately, more washing stresses. Hence, we can conclude that adhesion
between Copper and Nylon in these specific types of conductive fibers can withstand only
mild stresses as in Silk washing cycles. It starts degrading as the level of stress increases.
(a)
(b)
(c)
(d)
Figure 4.36. SEM analysis performed before and after the 50 Express washing processes, (a)
F3 before wash (b) F3 after wash (c) F2 before wash (d) F2 after wash
On the other side, silver-based conductive yarns have good adhesion between silver and nylon
base fibers and can withstand intensive washing stresses. Their initial values are higher
because silver is not a good conductor when compared with copper. SEM analysis of these
electrodes also showed almost no significant damages on the surface excepting some minor
holes created in random places, as shown in Figure 4.37.
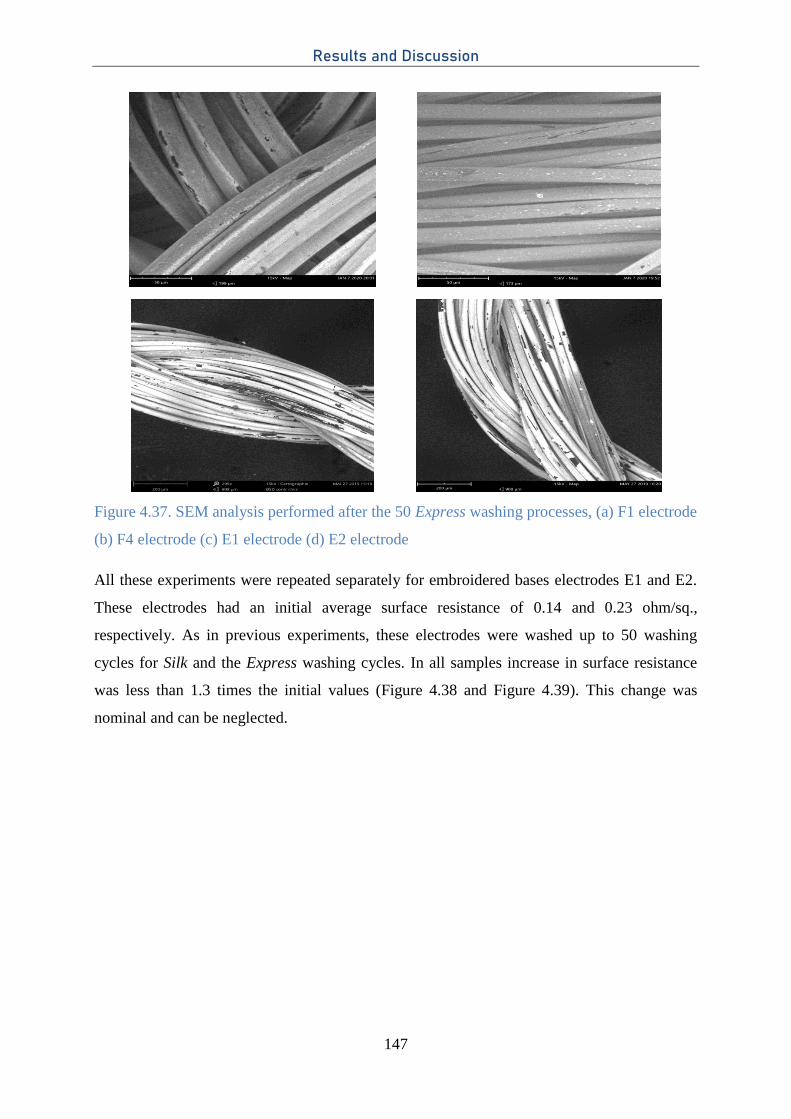
Results and Discussion
147
Figure 4.37. SEM analysis performed after the 50 Express washing processes, (a) F1 electrode
(b) F4 electrode (c) E1 electrode (d) E2 electrode
All these experiments were repeated separately for embroidered bases electrodes E1 and E2.
These electrodes had an initial average surface resistance of 0.14 and 0.23 ohm/sq.,
respectively. As in previous experiments, these electrodes were washed up to 50 washing
cycles for Silk and the Express washing cycles. In all samples increase in surface resistance
was less than 1.3 times the initial values (Figure 4.38 and Figure 4.39). This change was
nominal and can be neglected.
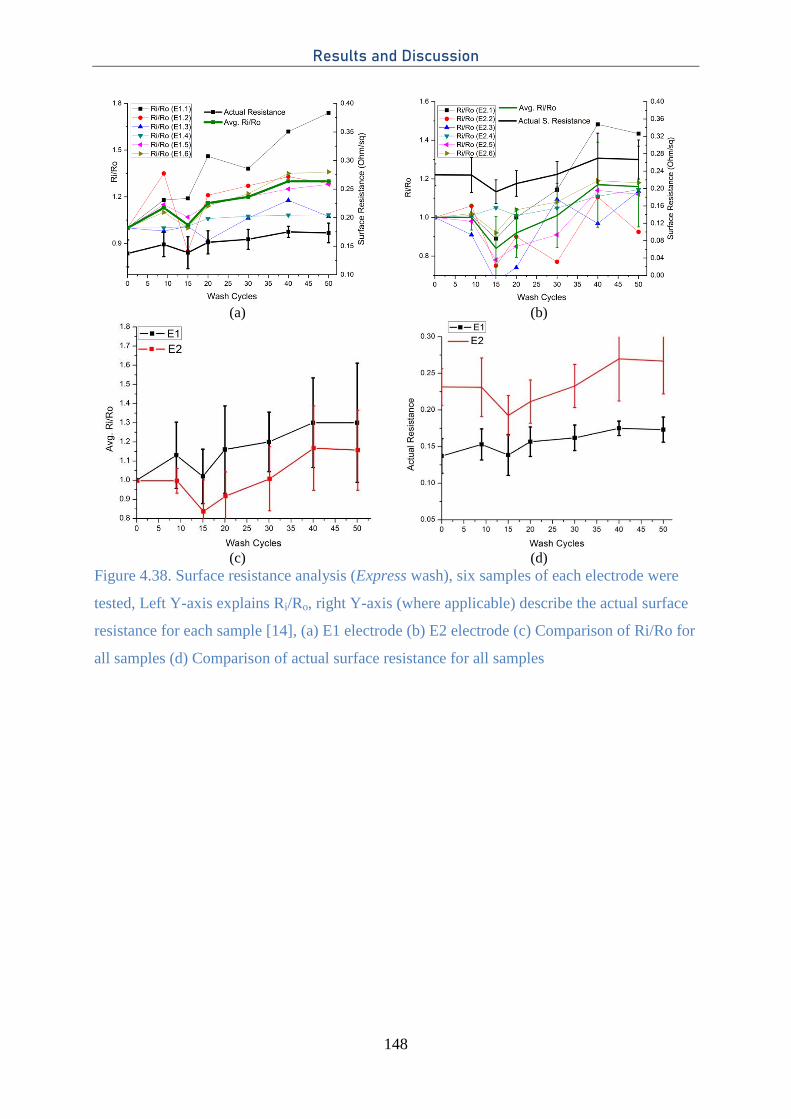
Results and Discussion
148
(a)
(b)
(c)
(d)
Figure 4.38. Surface resistance analysis (Express wash), six samples of each electrode were
tested, Left Y-axis explains Ri/Ro, right Y-axis (where applicable) describe the actual surface
resistance for each sample [14], (a) E1 electrode (b) E2 electrode (c) Comparison of Ri/Ro for
all samples (d) Comparison of actual surface resistance for all samples
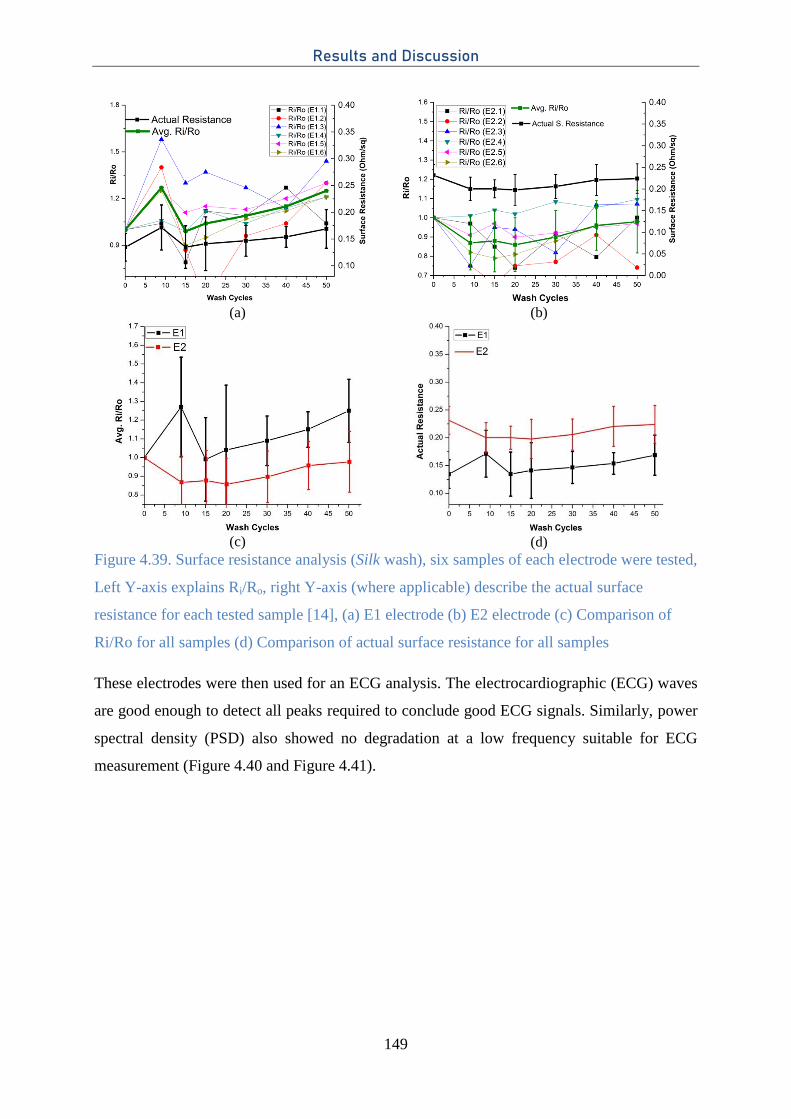
Results and Discussion
149
(a)
(b)
(c)
(d)
Figure 4.39. Surface resistance analysis (Silk wash), six samples of each electrode were tested,
Left Y-axis explains Ri/Ro, right Y-axis (where applicable) describe the actual surface
resistance for each tested sample [14], (a) E1 electrode (b) E2 electrode (c) Comparison of
Ri/Ro for all samples (d) Comparison of actual surface resistance for all samples
These electrodes were then used for an ECG analysis. The electrocardiographic (ECG) waves
are good enough to detect all peaks required to conclude good ECG signals. Similarly, power
spectral density (PSD) also showed no degradation at a low frequency suitable for ECG
measurement (Figure 4.40 and Figure 4.41).
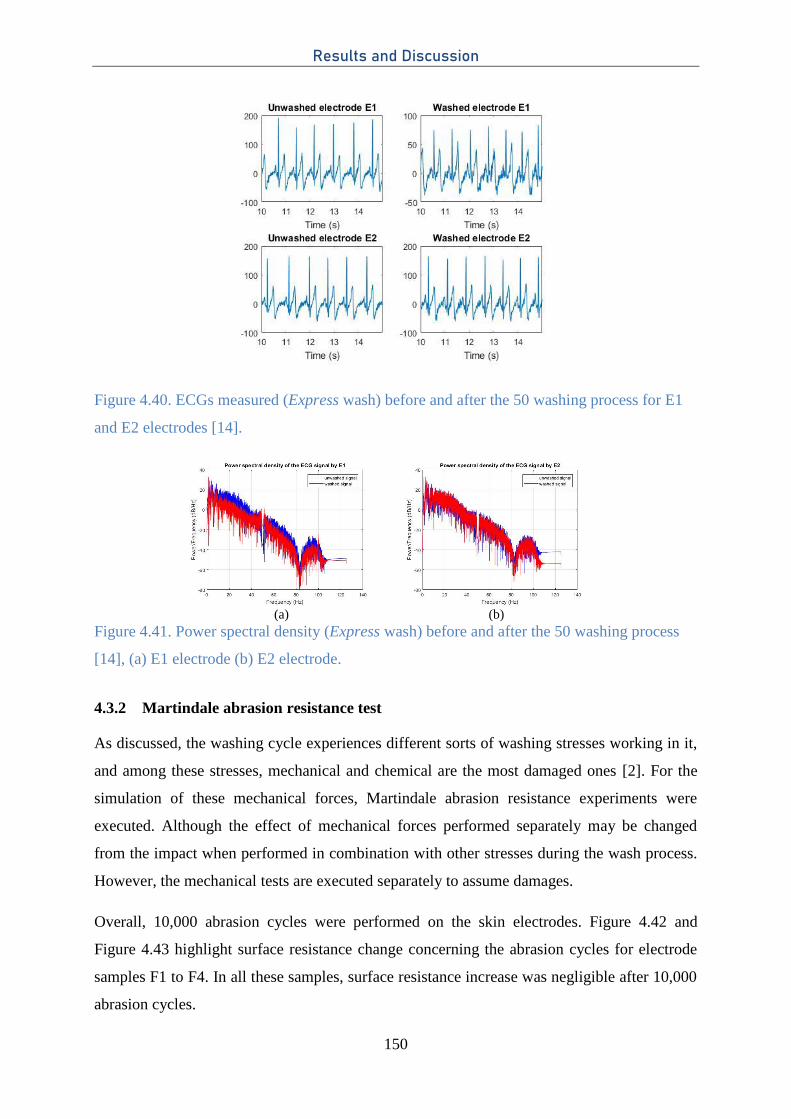
Results and Discussion
150
Figure 4.40. ECGs measured (Express wash) before and after the 50 washing process for E1
and E2 electrodes [14].
(a)
(b)
Figure 4.41. Power spectral density (Express wash) before and after the 50 washing process
[14], (a) E1 electrode (b) E2 electrode.
4.3.2 Martindale abrasion resistance test
As discussed, the washing cycle experiences different sorts of washing stresses working in it,
and among these stresses, mechanical and chemical are the most damaged ones [2]. For the
simulation of these mechanical forces, Martindale abrasion resistance experiments were
executed. Although the effect of mechanical forces performed separately may be changed
from the impact when performed in combination with other stresses during the wash process.
However, the mechanical tests are executed separately to assume damages.
Overall, 10,000 abrasion cycles were performed on the skin electrodes. Figure 4.42 and
Figure 4.43 highlight surface resistance change concerning the abrasion cycles for electrode
samples F1 to F4. In all these samples, surface resistance increase was negligible after 10,000
abrasion cycles.
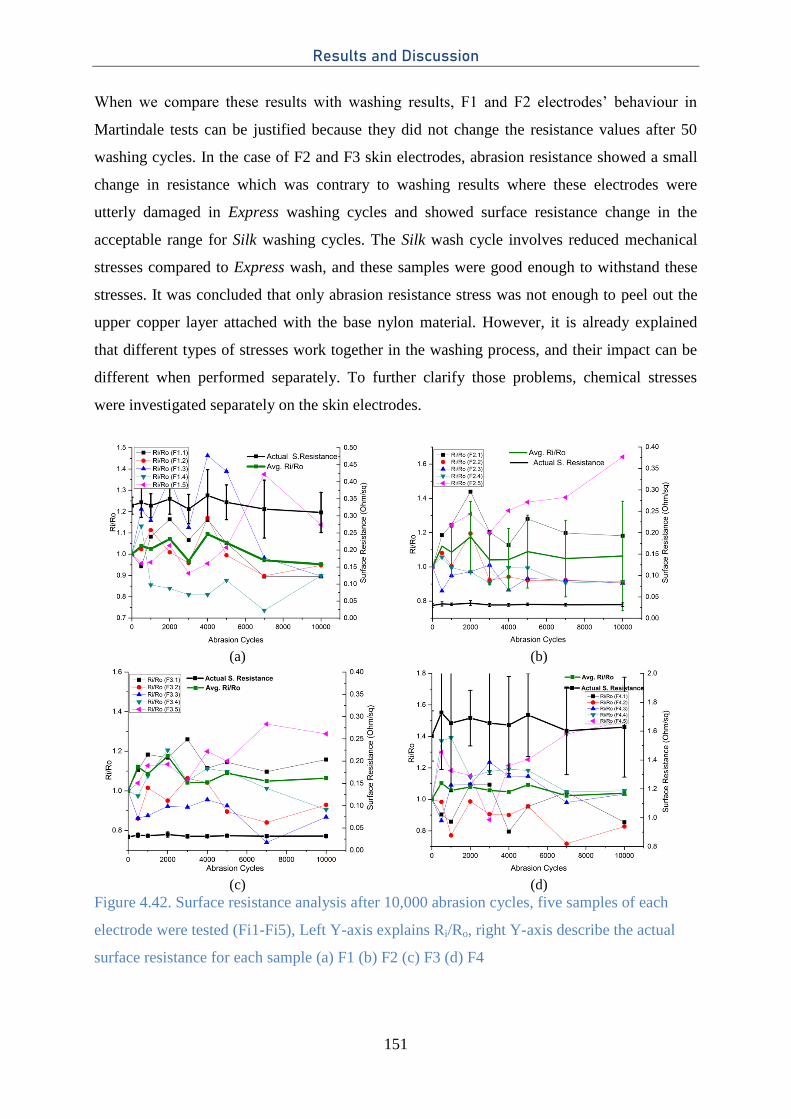
Results and Discussion
151
When we compare these results with washing results, F1 and F2 electrodes’ behaviour in
Martindale tests can be justified because they did not change the resistance values after 50
washing cycles. In the case of F2 and F3 skin electrodes, abrasion resistance showed a small
change in resistance which was contrary to washing results where these electrodes were
utterly damaged in Express washing cycles and showed surface resistance change in the
acceptable range for Silk washing cycles. The Silk wash cycle involves reduced mechanical
stresses compared to Express wash, and these samples were good enough to withstand these
stresses. It was concluded that only abrasion resistance stress was not enough to peel out the
upper copper layer attached with the base nylon material. However, it is already explained
that different types of stresses work together in the washing process, and their impact can be
different when performed separately. To further clarify those problems, chemical stresses
were investigated separately on the skin electrodes.
(a)
(b)
(c)
(d)
Figure 4.42. Surface resistance analysis after 10,000 abrasion cycles, five samples of each
electrode were tested (Fi1-Fi5), Left Y-axis explains Ri/Ro, right Y-axis describe the actual
surface resistance for each sample (a) F1 (b) F2 (c) F3 (d) F4
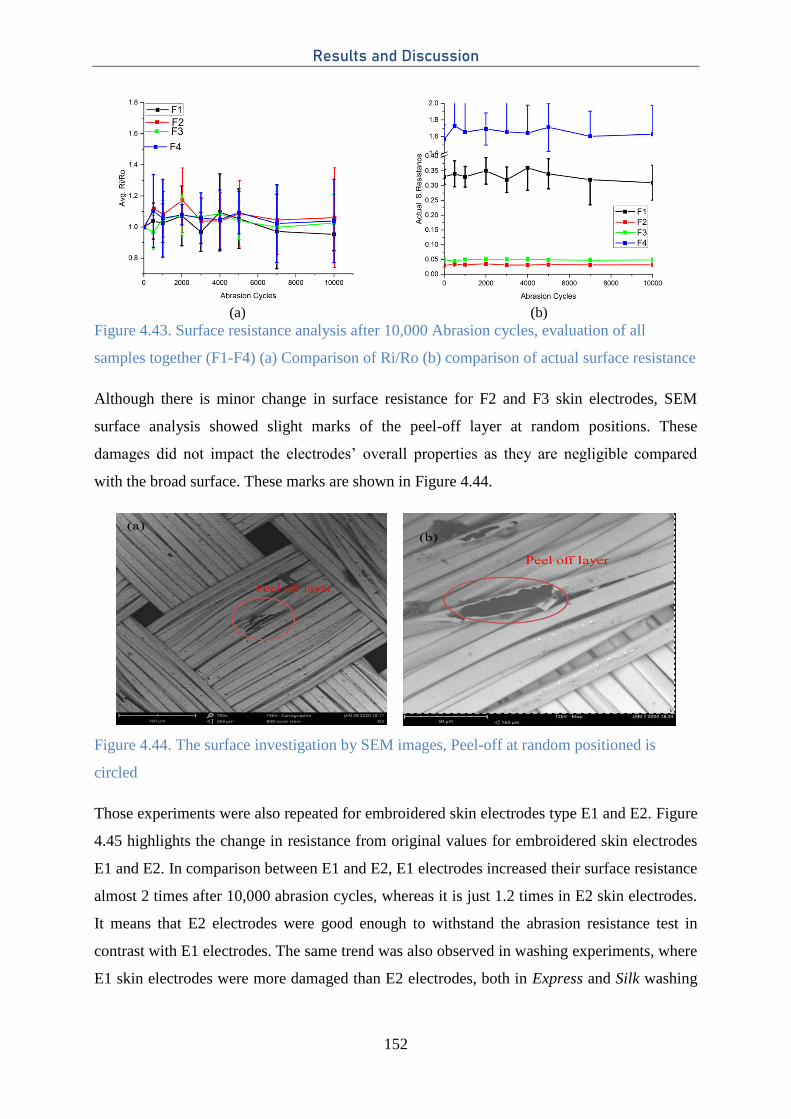
Results and Discussion
152
(a)
(b)
Figure 4.43. Surface resistance analysis after 10,000 Abrasion cycles, evaluation of all
samples together (F1-F4) (a) Comparison of Ri/Ro (b) comparison of actual surface resistance
Although there is minor change in surface resistance for F2 and F3 skin electrodes, SEM
surface analysis showed slight marks of the peel-off layer at random positions. These
damages did not impact the electrodes’ overall properties as they are negligible compared
with the broad surface. These marks are shown in Figure 4.44.
Figure 4.44. The surface investigation by SEM images, Peel-off at random positioned is
circled
Those experiments were also repeated for embroidered skin electrodes type E1 and E2. Figure
4.45 highlights the change in resistance from original values for embroidered skin electrodes
E1 and E2. In comparison between E1 and E2, E1 electrodes increased their surface resistance
almost 2 times after 10,000 abrasion cycles, whereas it is just 1.2 times in E2 skin electrodes.
It means that E2 electrodes were good enough to withstand the abrasion resistance test in
contrast with E1 electrodes. The same trend was also observed in washing experiments, where
E1 skin electrodes were more damaged than E2 electrodes, both in Express and Silk washing
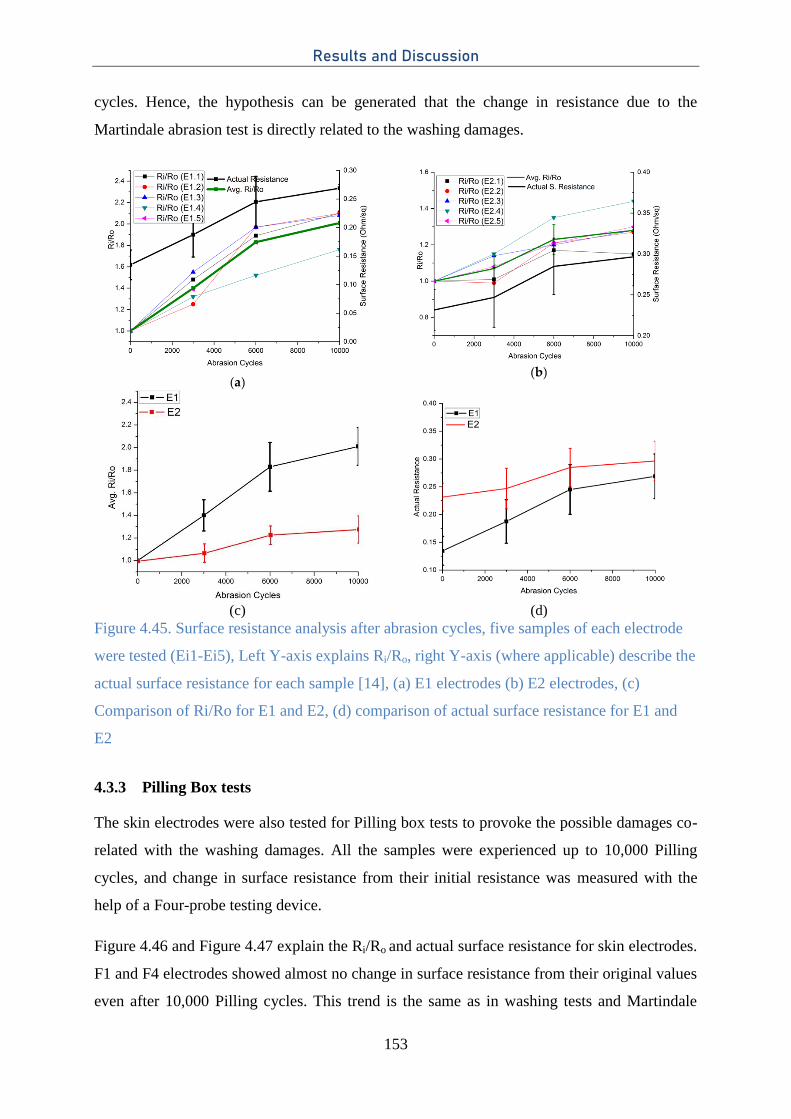
Results and Discussion
153
cycles. Hence, the hypothesis can be generated that the change in resistance due to the
Martindale abrasion test is directly related to the washing damages.
(a)
(b)
(c)
(d)
Figure 4.45. Surface resistance analysis after abrasion cycles, five samples of each electrode
were tested (Ei1-Ei5), Left Y-axis explains Ri/Ro, right Y-axis (where applicable) describe the
actual surface resistance for each sample [14], (a) E1 electrodes (b) E2 electrodes, (c)
Comparison of Ri/Ro for E1 and E2, (d) comparison of actual surface resistance for E1 and
E2
4.3.3 Pilling Box tests
The skin electrodes were also tested for Pilling box tests to provoke the possible damages co-
related with the washing damages. All the samples were experienced up to 10,000 Pilling
cycles, and change in surface resistance from their initial resistance was measured with the
help of a Four-probe testing device.
Figure 4.46 and Figure 4.47 explain the Ri/Ro and actual surface resistance for skin electrodes.
F1 and F4 electrodes showed almost no change in surface resistance from their original values
even after 10,000 Pilling cycles. This trend is the same as in washing tests and Martindale
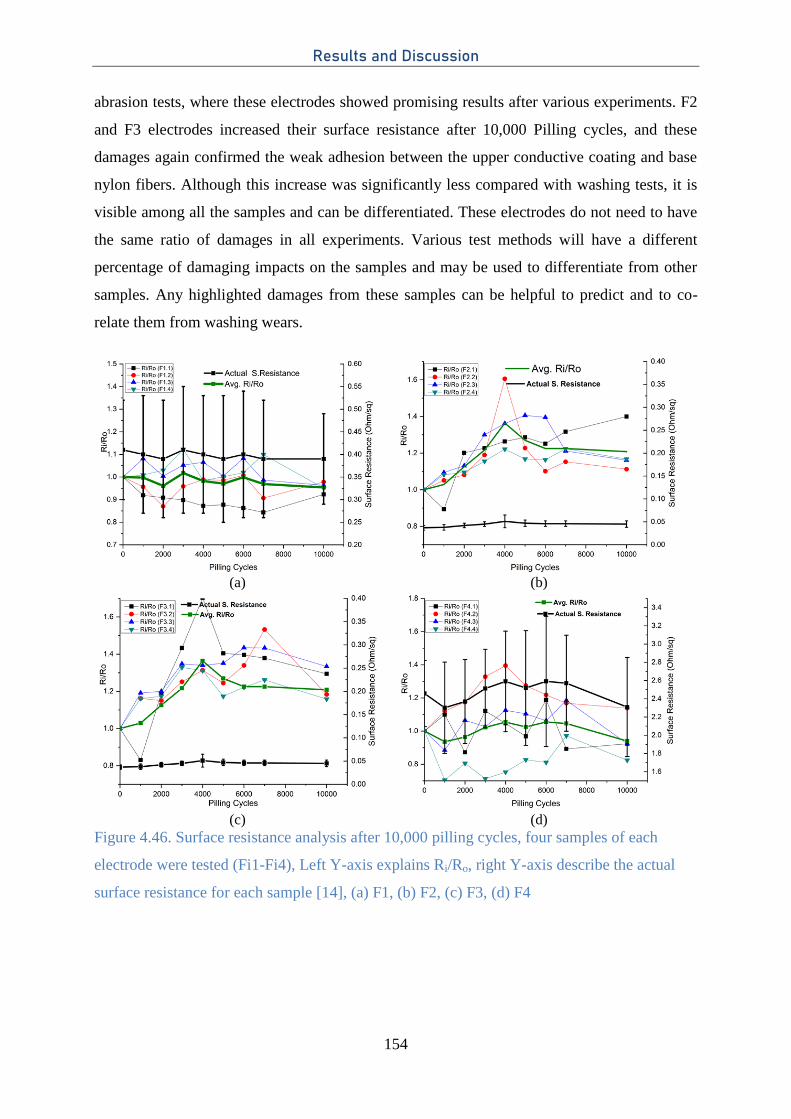
Results and Discussion
154
abrasion tests, where these electrodes showed promising results after various experiments. F2
and F3 electrodes increased their surface resistance after 10,000 Pilling cycles, and these
damages again confirmed the weak adhesion between the upper conductive coating and base
nylon fibers. Although this increase was significantly less compared with washing tests, it is
visible among all the samples and can be differentiated. These electrodes do not need to have
the same ratio of damages in all experiments. Various test methods will have a different
percentage of damaging impacts on the samples and may be used to differentiate from other
samples. Any highlighted damages from these samples can be helpful to predict and to co-
relate them from washing wears.
(a)
(b)
(c)
(d)
Figure 4.46. Surface resistance analysis after 10,000 pilling cycles, four samples of each
electrode were tested (Fi1-Fi4), Left Y-axis explains Ri/Ro, right Y-axis describe the actual
surface resistance for each sample [14], (a) F1, (b) F2, (c) F3, (d) F4
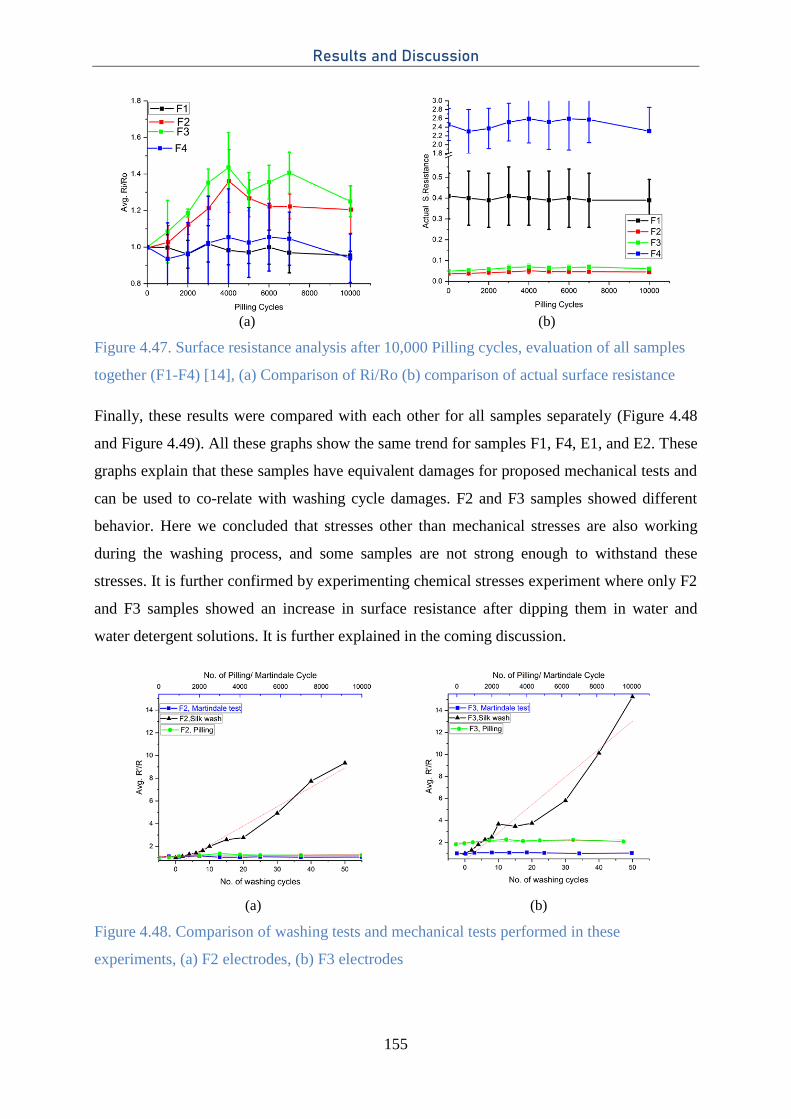
Results and Discussion
155
(a)
(b)
Figure 4.47. Surface resistance analysis after 10,000 Pilling cycles, evaluation of all samples
together (F1-F4) [14], (a) Comparison of Ri/Ro (b) comparison of actual surface resistance
Finally, these results were compared with each other for all samples separately (Figure 4.48
and Figure 4.49). All these graphs show the same trend for samples F1, F4, E1, and E2. These
graphs explain that these samples have equivalent damages for proposed mechanical tests and
can be used to co-relate with washing cycle damages. F2 and F3 samples showed different
behavior. Here we concluded that stresses other than mechanical stresses are also working
during the washing process, and some samples are not strong enough to withstand these
stresses. It is further confirmed by experimenting chemical stresses experiment where only F2
and F3 samples showed an increase in surface resistance after dipping them in water and
water detergent solutions. It is further explained in the coming discussion.
(a) (b)
Figure 4.48. Comparison of washing tests and mechanical tests performed in these
experiments, (a) F2 electrodes, (b) F3 electrodes
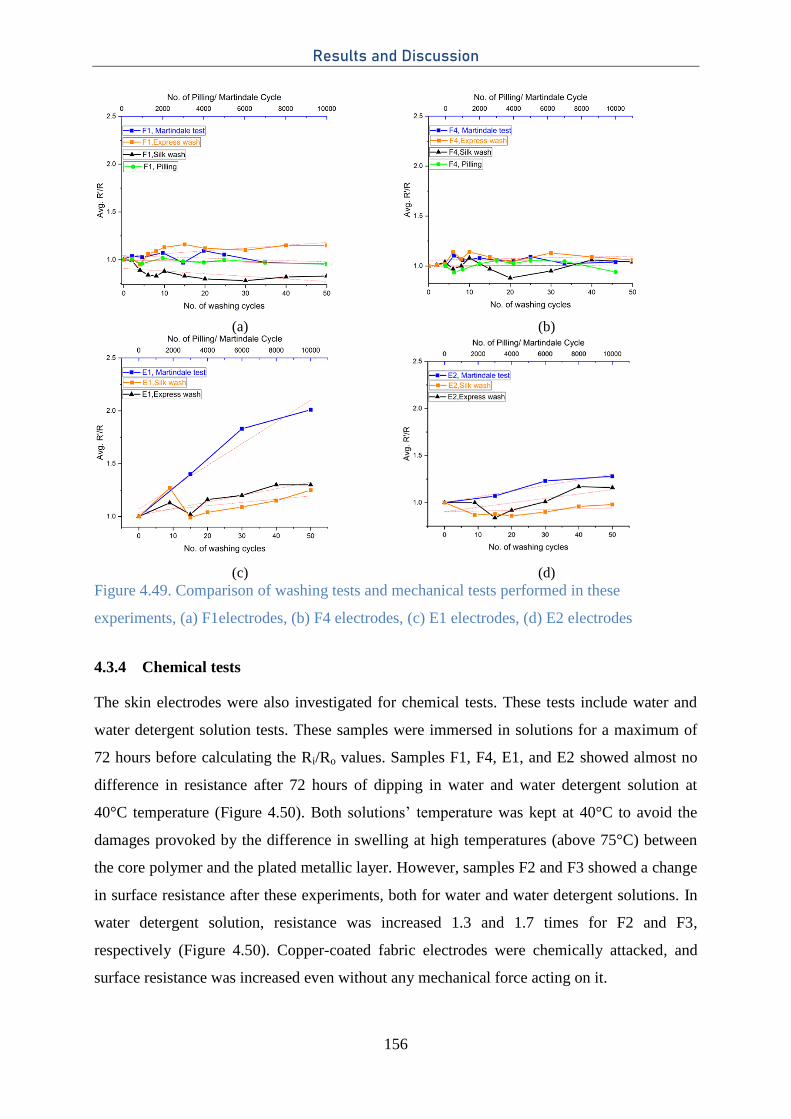
Results and Discussion
156
(a) (b)
(c) (d)
Figure 4.49. Comparison of washing tests and mechanical tests performed in these
experiments, (a) F1electrodes, (b) F4 electrodes, (c) E1 electrodes, (d) E2 electrodes
4.3.4 Chemical tests
The skin electrodes were also investigated for chemical tests. These tests include water and
water detergent solution tests. These samples were immersed in solutions for a maximum of
72 hours before calculating the Ri/Ro values. Samples F1, F4, E1, and E2 showed almost no
difference in resistance after 72 hours of dipping in water and water detergent solution at
40°C temperature (Figure 4.50). Both solutions’ temperature was kept at 40°C to avoid the
damages provoked by the difference in swelling at high temperatures (above 75°C) between
the core polymer and the plated metallic layer. However, samples F2 and F3 showed a change
in surface resistance after these experiments, both for water and water detergent solutions. In
water detergent solution, resistance was increased 1.3 and 1.7 times for F2 and F3,
respectively (Figure 4.50). Copper-coated fabric electrodes were chemically attacked, and
surface resistance was increased even without any mechanical force acting on it.
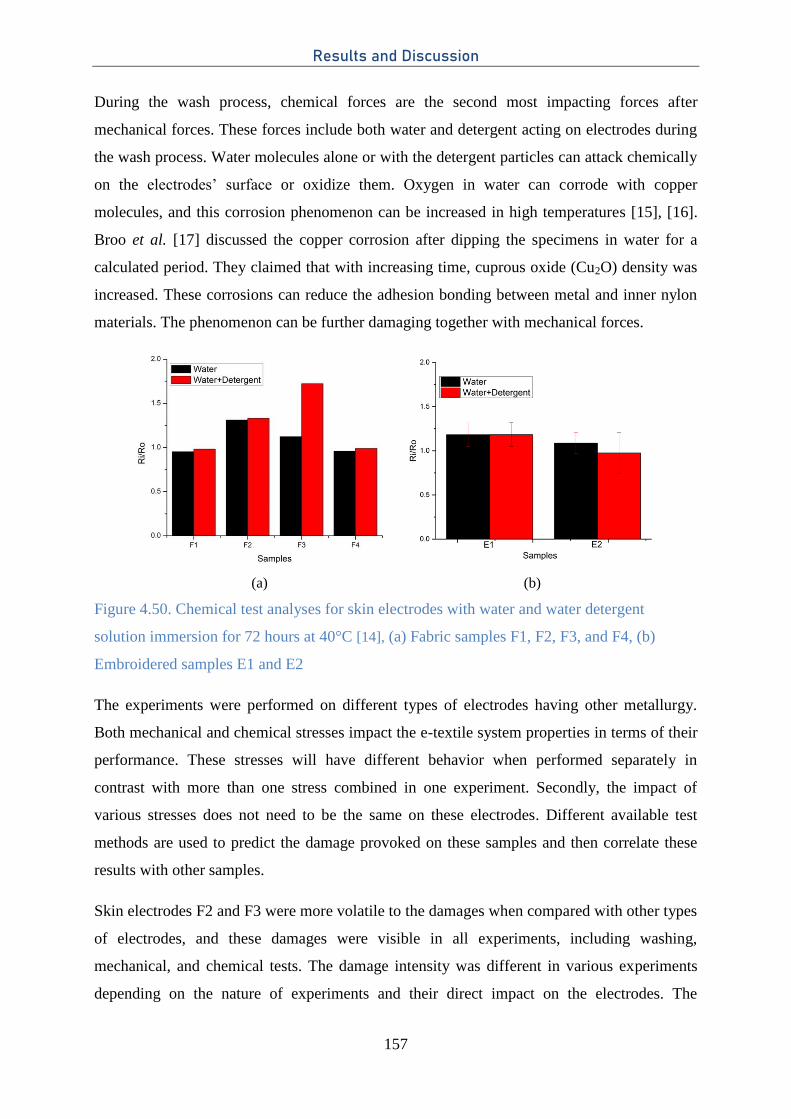
Results and Discussion
157
During the wash process, chemical forces are the second most impacting forces after
mechanical forces. These forces include both water and detergent acting on electrodes during
the wash process. Water molecules alone or with the detergent particles can attack chemically
on the electrodes’ surface or oxidize them. Oxygen in water can corrode with copper
molecules, and this corrosion phenomenon can be increased in high temperatures [15], [16].
Broo et al. [17] discussed the copper corrosion after dipping the specimens in water for a
calculated period. They claimed that with increasing time, cuprous oxide (Cu2O) density was
increased. These corrosions can reduce the adhesion bonding between metal and inner nylon
materials. The phenomenon can be further damaging together with mechanical forces.
(a) (b)
Figure 4.50. Chemical test analyses for skin electrodes with water and water detergent
solution immersion for 72 hours at 40°C [14], (a) Fabric samples F1, F2, F3, and F4, (b)
Embroidered samples E1 and E2
The experiments were performed on different types of electrodes having other metallurgy.
Both mechanical and chemical stresses impact the e-textile system properties in terms of their
performance. These stresses will have different behavior when performed separately in
contrast with more than one stress combined in one experiment. Secondly, the impact of
various stresses does not need to be the same on these electrodes. Different available test
methods are used to predict the damage provoked on these samples and then correlate these
results with other samples.
Skin electrodes F2 and F3 were more volatile to the damages when compared with other types
of electrodes, and these damages were visible in all experiments, including washing,
mechanical, and chemical tests. The damage intensity was different in various experiments
depending on the nature of experiments and their direct impact on the electrodes. The
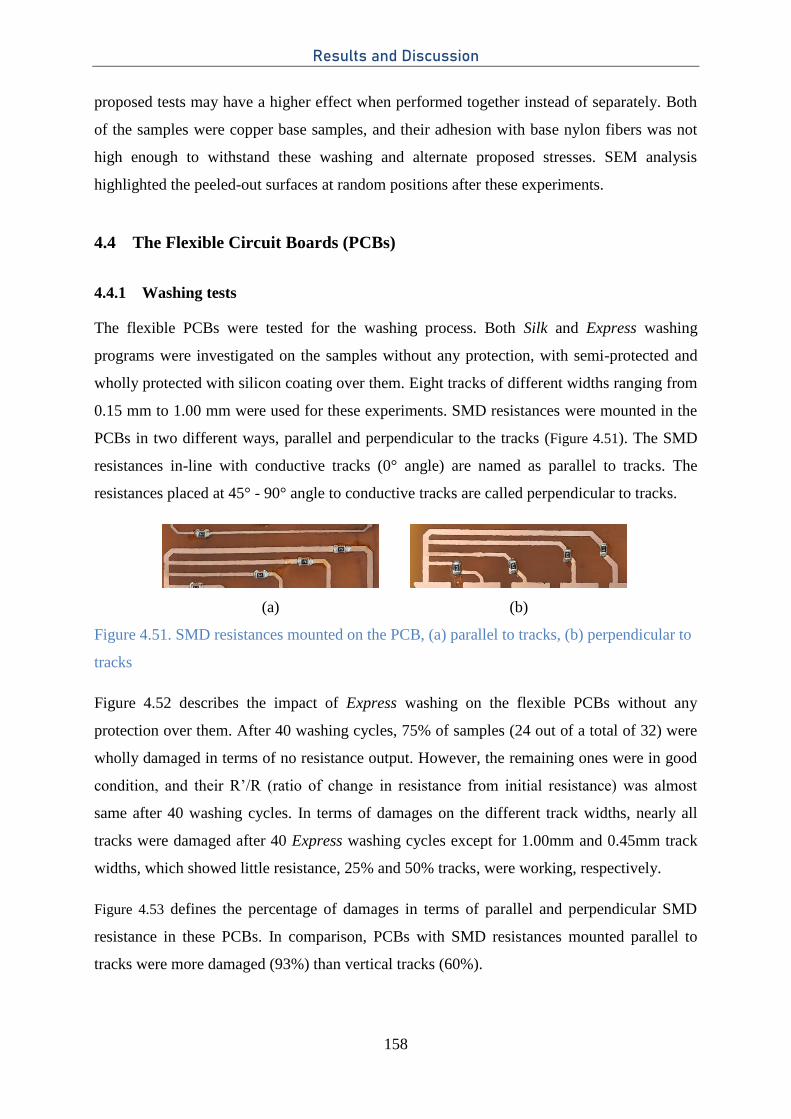
Results and Discussion
158
proposed tests may have a higher effect when performed together instead of separately. Both
of the samples were copper base samples, and their adhesion with base nylon fibers was not
high enough to withstand these washing and alternate proposed stresses. SEM analysis
highlighted the peeled-out surfaces at random positions after these experiments.
4.4 The Flexible Circuit Boards (PCBs)
4.4.1 Washing tests
The flexible PCBs were tested for the washing process. Both Silk and Express washing
programs were investigated on the samples without any protection, with semi-protected and
wholly protected with silicon coating over them. Eight tracks of different widths ranging from
0.15 mm to 1.00 mm were used for these experiments. SMD resistances were mounted in the
PCBs in two different ways, parallel and perpendicular to the tracks (Figure 4.51). The SMD
resistances in-line with conductive tracks (0° angle) are named as parallel to tracks. The
resistances placed at 45° - 90° angle to conductive tracks are called perpendicular to tracks.
(a) (b)
Figure 4.51. SMD resistances mounted on the PCB, (a) parallel to tracks, (b) perpendicular to
tracks
Figure 4.52 describes the impact of Express washing on the flexible PCBs without any
protection over them. After 40 washing cycles, 75% of samples (24 out of a total of 32) were
wholly damaged in terms of no resistance output. However, the remaining ones were in good
condition, and their R’/R (ratio of change in resistance from initial resistance) was almost
same after 40 washing cycles. In terms of damages on the different track widths, nearly all
tracks were damaged after 40 Express washing cycles except for 1.00mm and 0.45mm track
widths, which showed little resistance, 25% and 50% tracks, were working, respectively.
Figure 4.53 defines the percentage of damages in terms of parallel and perpendicular SMD
resistance in these PCBs. In comparison, PCBs with SMD resistances mounted parallel to
tracks were more damaged (93%) than vertical tracks (60%).
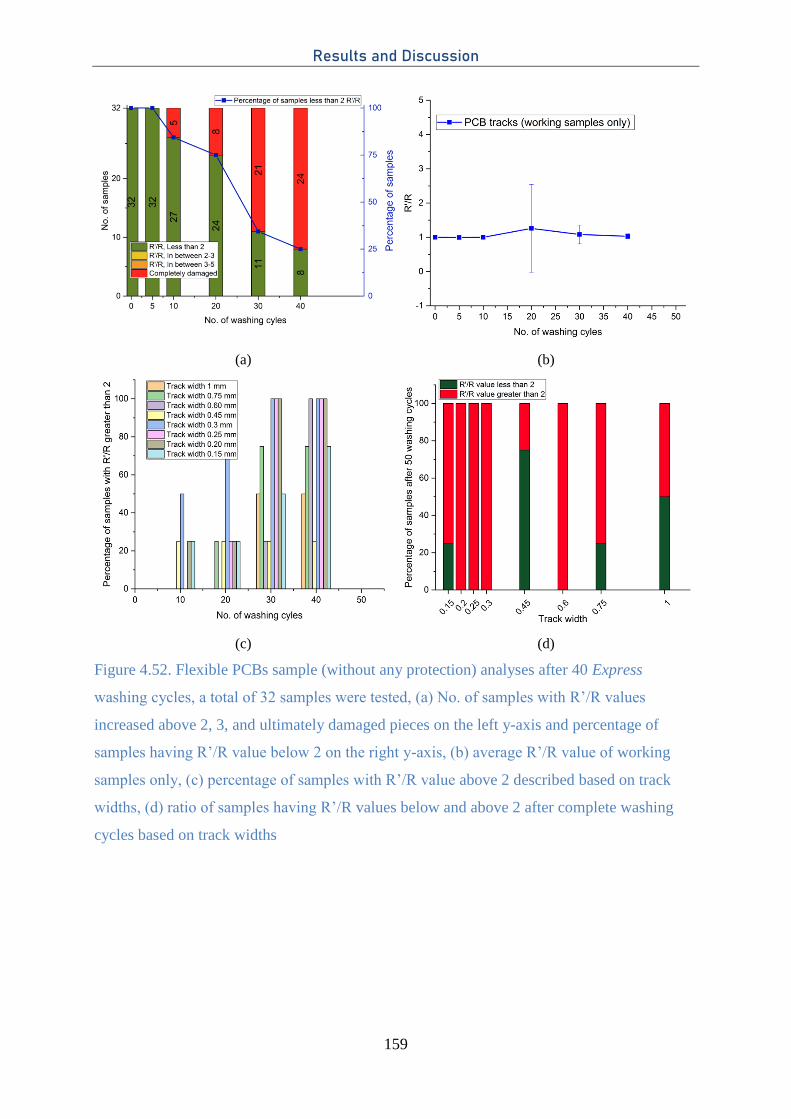
Results and Discussion
159
(a) (b)
(c) (d)
Figure 4.52. Flexible PCBs sample (without any protection) analyses after 40 Express
washing cycles, a total of 32 samples were tested, (a) No. of samples with R’/R values
increased above 2, 3, and ultimately damaged pieces on the left y-axis and percentage of
samples having R’/R value below 2 on the right y-axis, (b) average R’/R value of working
samples only, (c) percentage of samples with R’/R value above 2 described based on track
widths, (d) ratio of samples having R’/R values below and above 2 after complete washing
cycles based on track widths
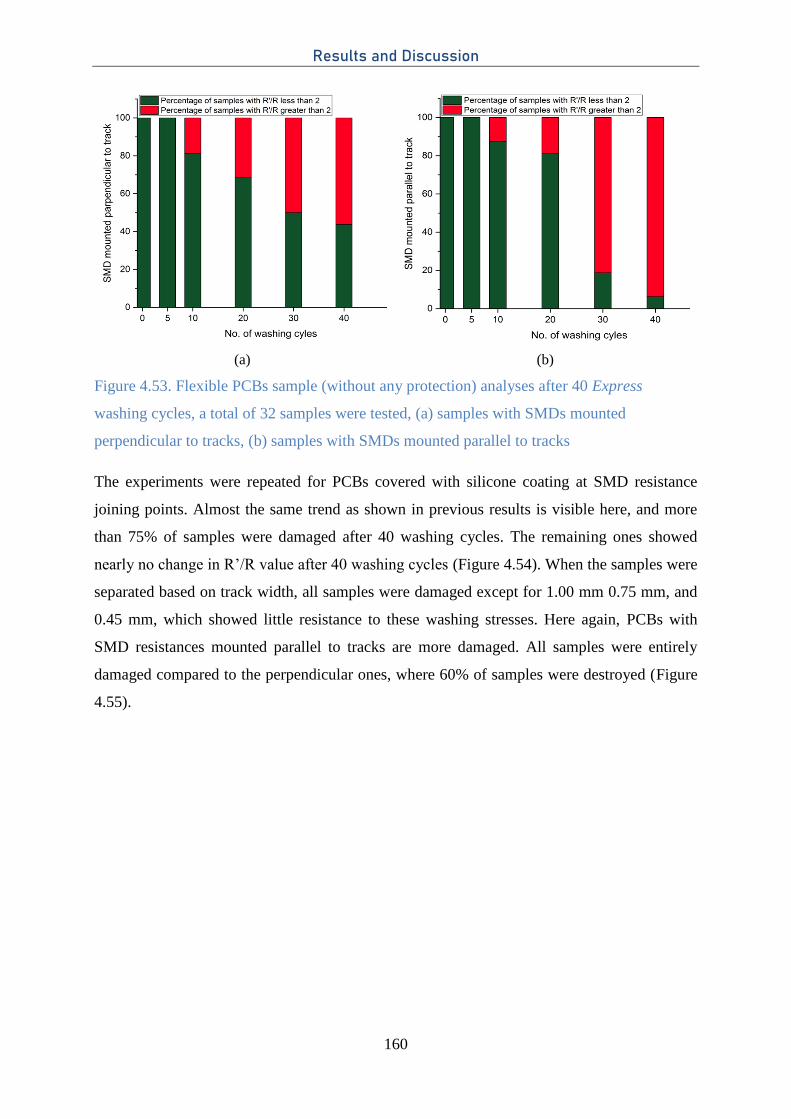
Results and Discussion
160
(a) (b)
Figure 4.53. Flexible PCBs sample (without any protection) analyses after 40 Express
washing cycles, a total of 32 samples were tested, (a) samples with SMDs mounted
perpendicular to tracks, (b) samples with SMDs mounted parallel to tracks
The experiments were repeated for PCBs covered with silicone coating at SMD resistance
joining points. Almost the same trend as shown in previous results is visible here, and more
than 75% of samples were damaged after 40 washing cycles. The remaining ones showed
nearly no change in R’/R value after 40 washing cycles (Figure 4.54). When the samples were
separated based on track width, all samples were damaged except for 1.00 mm 0.75 mm, and
0.45 mm, which showed little resistance to these washing stresses. Here again, PCBs with
SMD resistances mounted parallel to tracks are more damaged. All samples were entirely
damaged compared to the perpendicular ones, where 60% of samples were destroyed (Figure
4.55).
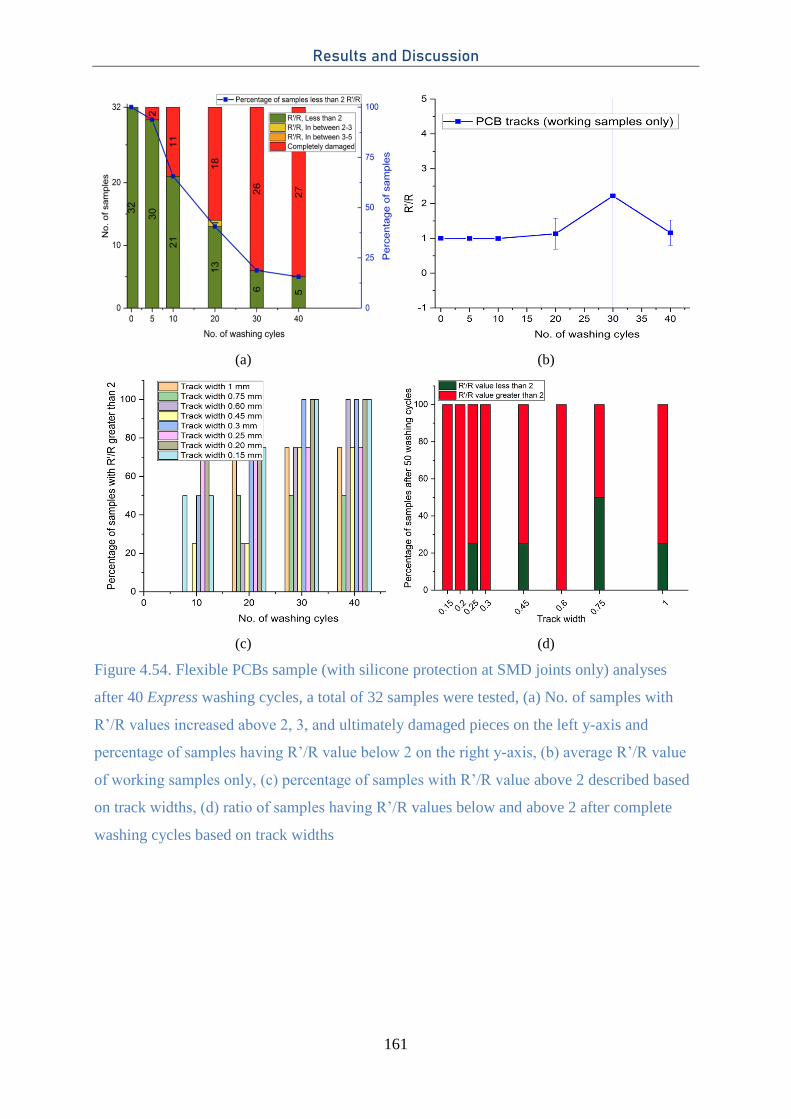
Results and Discussion
161
(a) (b)
(c) (d)
Figure 4.54. Flexible PCBs sample (with silicone protection at SMD joints only) analyses
after 40 Express washing cycles, a total of 32 samples were tested, (a) No. of samples with
R’/R values increased above 2, 3, and ultimately damaged pieces on the left y-axis and
percentage of samples having R’/R value below 2 on the right y-axis, (b) average R’/R value
of working samples only, (c) percentage of samples with R’/R value above 2 described based
on track widths, (d) ratio of samples having R’/R values below and above 2 after complete
washing cycles based on track widths
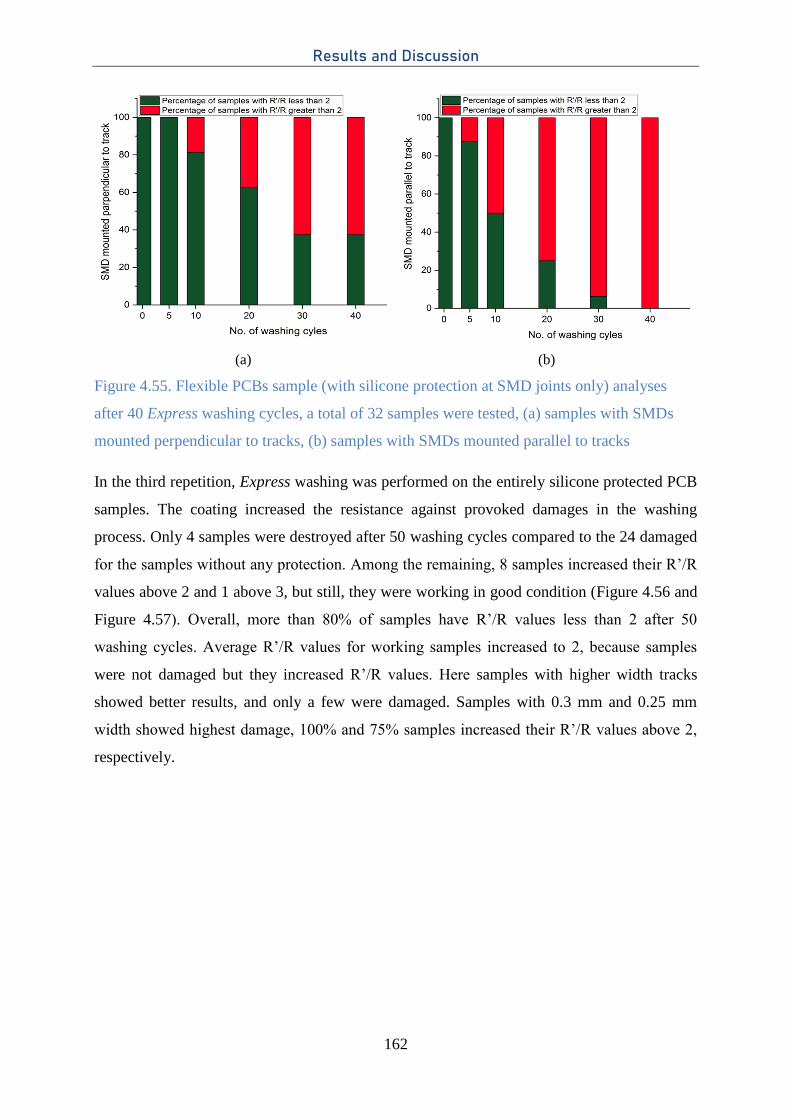
Results and Discussion
162
(a) (b)
Figure 4.55. Flexible PCBs sample (with silicone protection at SMD joints only) analyses
after 40 Express washing cycles, a total of 32 samples were tested, (a) samples with SMDs
mounted perpendicular to tracks, (b) samples with SMDs mounted parallel to tracks
In the third repetition, Express washing was performed on the entirely silicone protected PCB
samples. The coating increased the resistance against provoked damages in the washing
process. Only 4 samples were destroyed after 50 washing cycles compared to the 24 damaged
for the samples without any protection. Among the remaining, 8 samples increased their R’/R
values above 2 and 1 above 3, but still, they were working in good condition (Figure 4.56 and
Figure 4.57). Overall, more than 80% of samples have R’/R values less than 2 after 50
washing cycles. Average R’/R values for working samples increased to 2, because samples
were not damaged but they increased R’/R values. Here samples with higher width tracks
showed better results, and only a few were damaged. Samples with 0.3 mm and 0.25 mm
width showed highest damage, 100% and 75% samples increased their R’/R values above 2,
respectively.
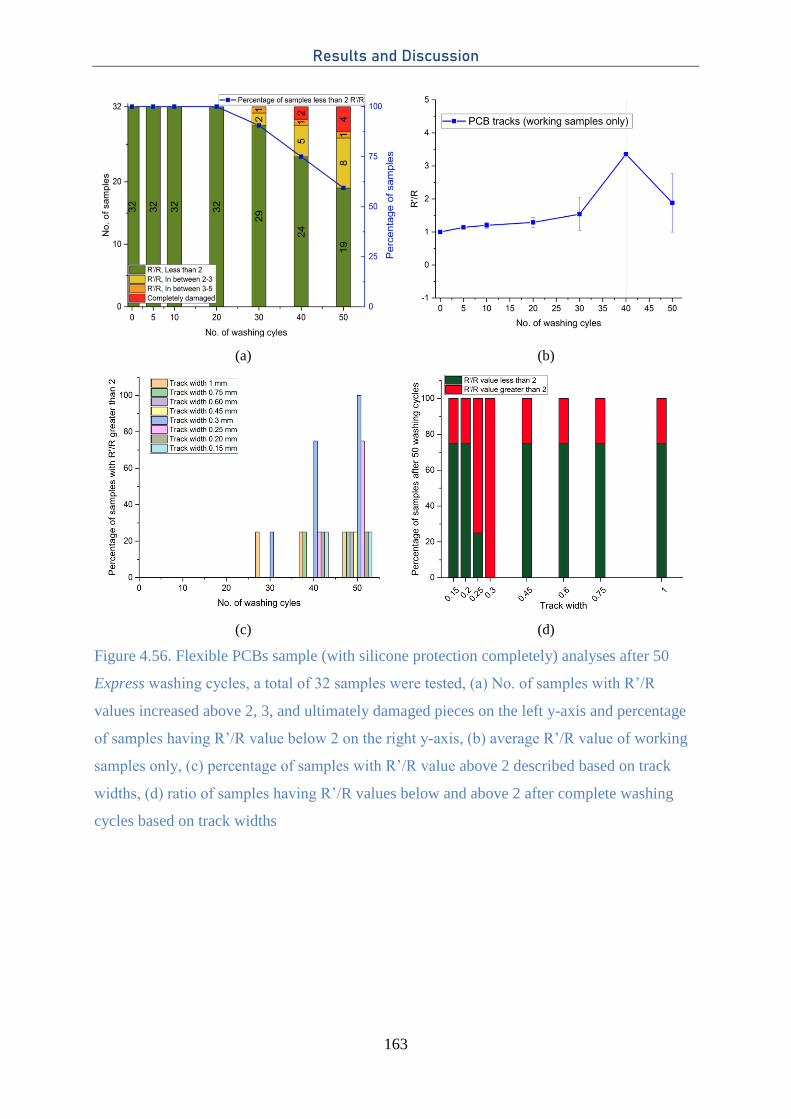
Results and Discussion
163
(a) (b)
(c) (d)
Figure 4.56. Flexible PCBs sample (with silicone protection completely) analyses after 50
Express washing cycles, a total of 32 samples were tested, (a) No. of samples with R’/R
values increased above 2, 3, and ultimately damaged pieces on the left y-axis and percentage
of samples having R’/R value below 2 on the right y-axis, (b) average R’/R value of working
samples only, (c) percentage of samples with R’/R value above 2 described based on track
widths, (d) ratio of samples having R’/R values below and above 2 after complete washing
cycles based on track widths
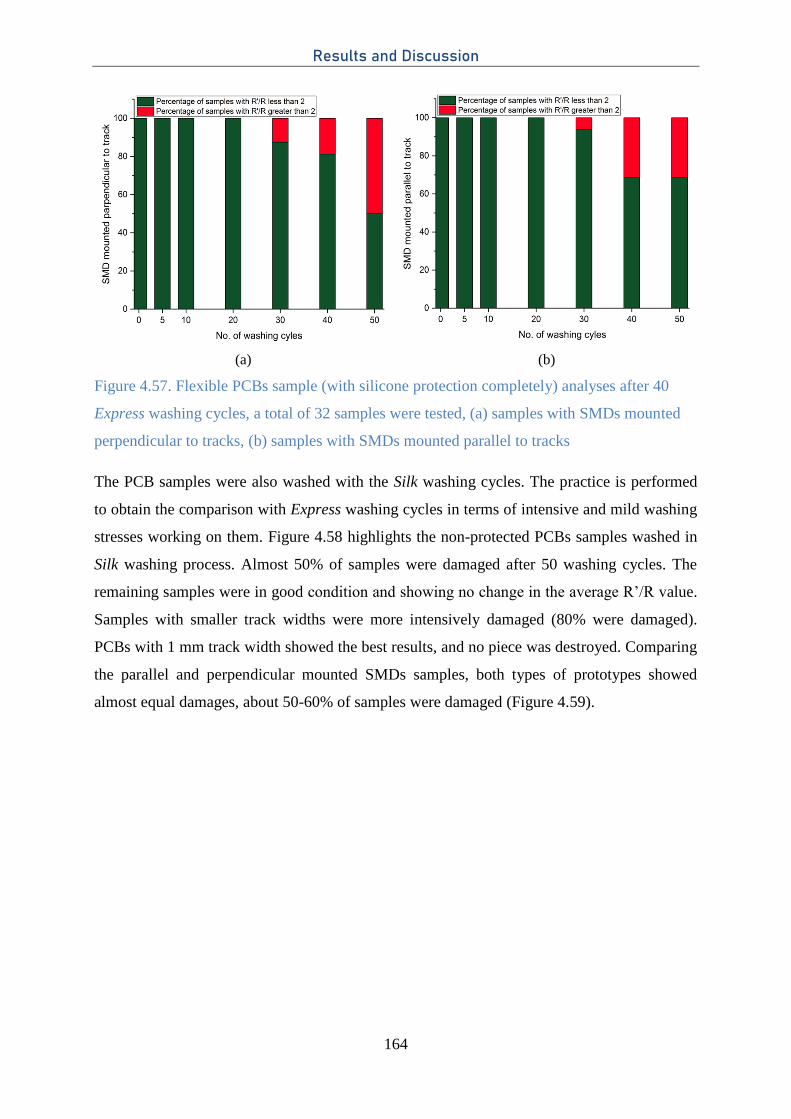
Results and Discussion
164
(a) (b)
Figure 4.57. Flexible PCBs sample (with silicone protection completely) analyses after 40
Express washing cycles, a total of 32 samples were tested, (a) samples with SMDs mounted
perpendicular to tracks, (b) samples with SMDs mounted parallel to tracks
The PCB samples were also washed with the Silk washing cycles. The practice is performed
to obtain the comparison with Express washing cycles in terms of intensive and mild washing
stresses working on them. Figure 4.58 highlights the non-protected PCBs samples washed in
Silk washing process. Almost 50% of samples were damaged after 50 washing cycles. The
remaining samples were in good condition and showing no change in the average R’/R value.
Samples with smaller track widths were more intensively damaged (80% were damaged).
PCBs with 1 mm track width showed the best results, and no piece was destroyed. Comparing
the parallel and perpendicular mounted SMDs samples, both types of prototypes showed
almost equal damages, about 50-60% of samples were damaged (Figure 4.59).
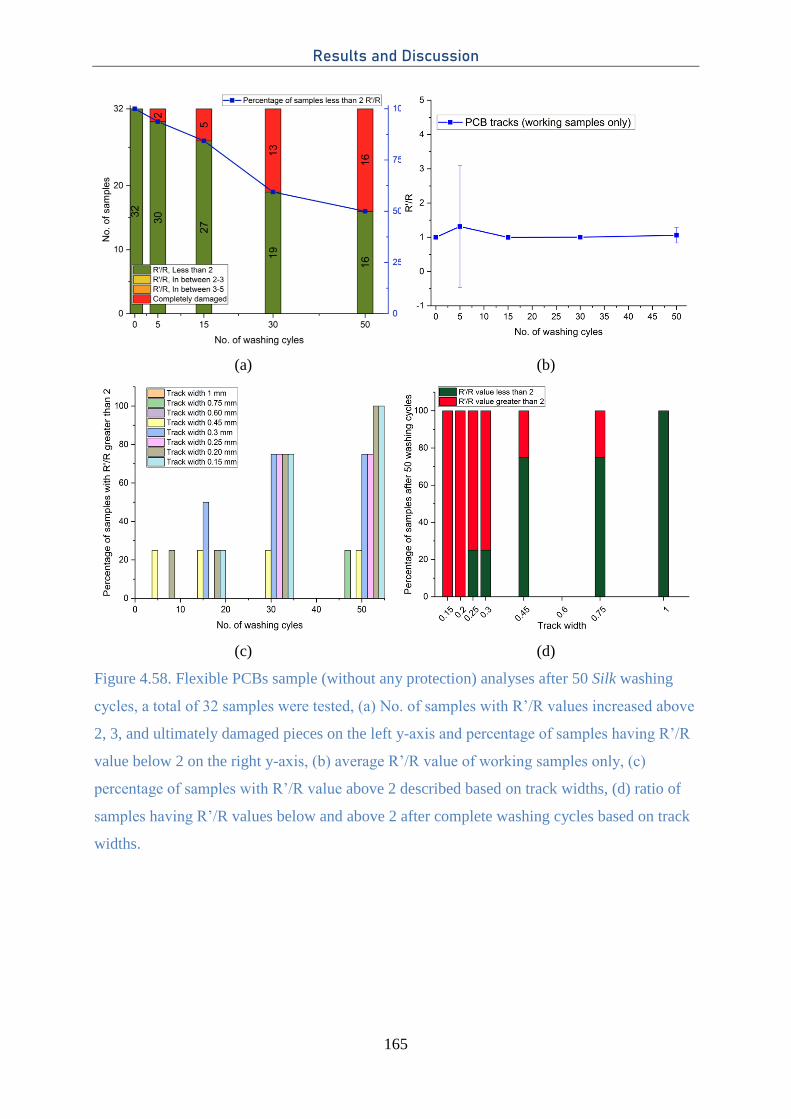
Results and Discussion
165
(a) (b)
(c) (d)
Figure 4.58. Flexible PCBs sample (without any protection) analyses after 50 Silk washing
cycles, a total of 32 samples were tested, (a) No. of samples with R’/R values increased above
2, 3, and ultimately damaged pieces on the left y-axis and percentage of samples having R’/R
value below 2 on the right y-axis, (b) average R’/R value of working samples only, (c)
percentage of samples with R’/R value above 2 described based on track widths, (d) ratio of
samples having R’/R values below and above 2 after complete washing cycles based on track
widths.
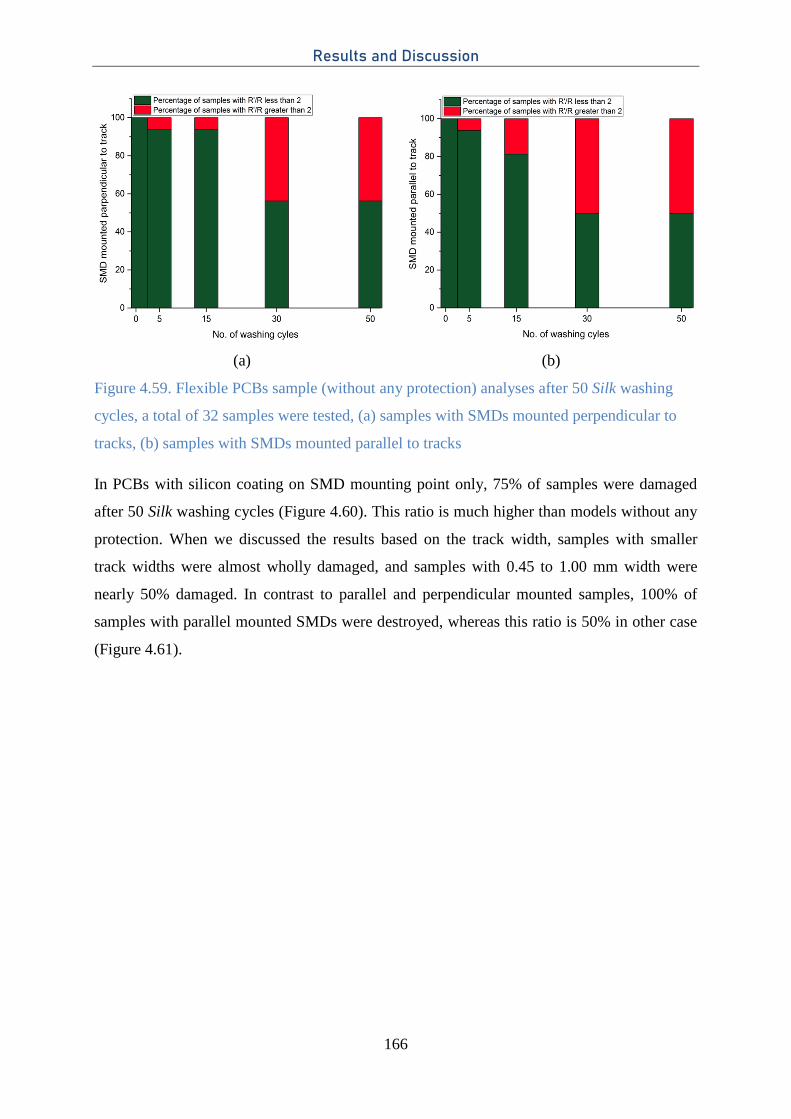
Results and Discussion
166
(a) (b)
Figure 4.59. Flexible PCBs sample (without any protection) analyses after 50 Silk washing
cycles, a total of 32 samples were tested, (a) samples with SMDs mounted perpendicular to
tracks, (b) samples with SMDs mounted parallel to tracks
In PCBs with silicon coating on SMD mounting point only, 75% of samples were damaged
after 50 Silk washing cycles (Figure 4.60). This ratio is much higher than models without any
protection. When we discussed the results based on the track width, samples with smaller
track widths were almost wholly damaged, and samples with 0.45 to 1.00 mm width were
nearly 50% damaged. In contrast to parallel and perpendicular mounted samples, 100% of
samples with parallel mounted SMDs were destroyed, whereas this ratio is 50% in other case
(Figure 4.61).
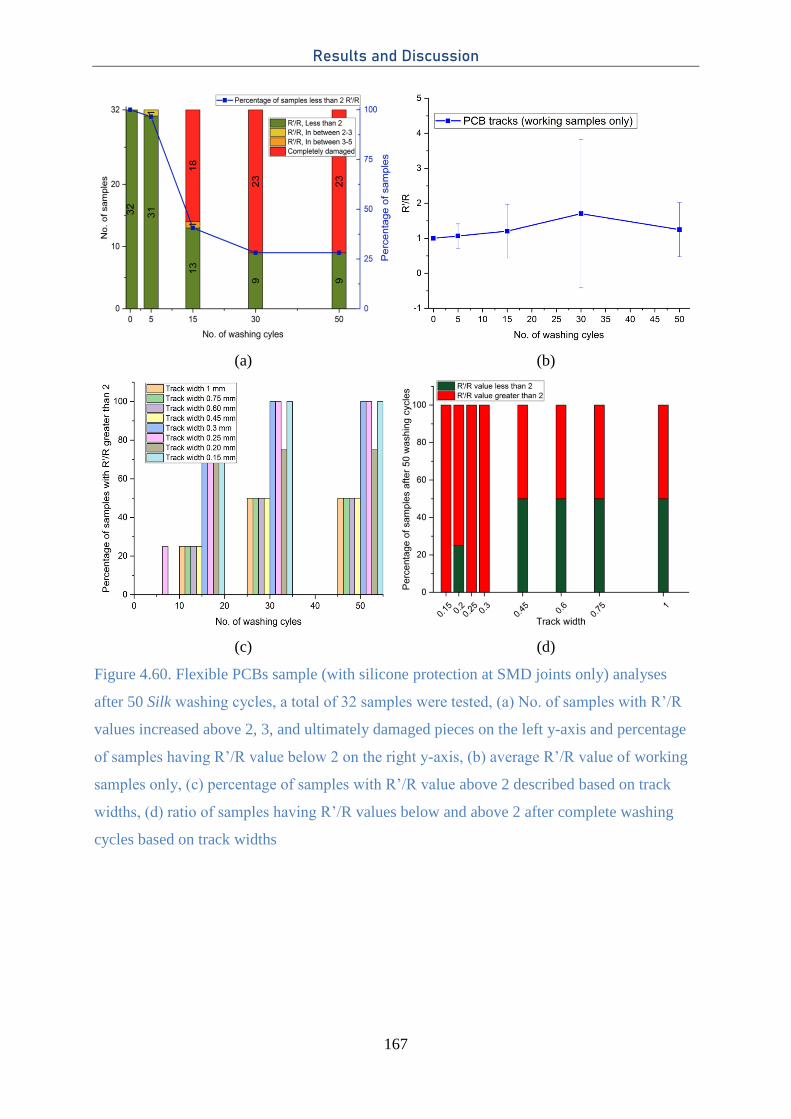
Results and Discussion
167
(a) (b)
(c) (d)
Figure 4.60. Flexible PCBs sample (with silicone protection at SMD joints only) analyses
after 50 Silk washing cycles, a total of 32 samples were tested, (a) No. of samples with R’/R
values increased above 2, 3, and ultimately damaged pieces on the left y-axis and percentage
of samples having R’/R value below 2 on the right y-axis, (b) average R’/R value of working
samples only, (c) percentage of samples with R’/R value above 2 described based on track
widths, (d) ratio of samples having R’/R values below and above 2 after complete washing
cycles based on track widths
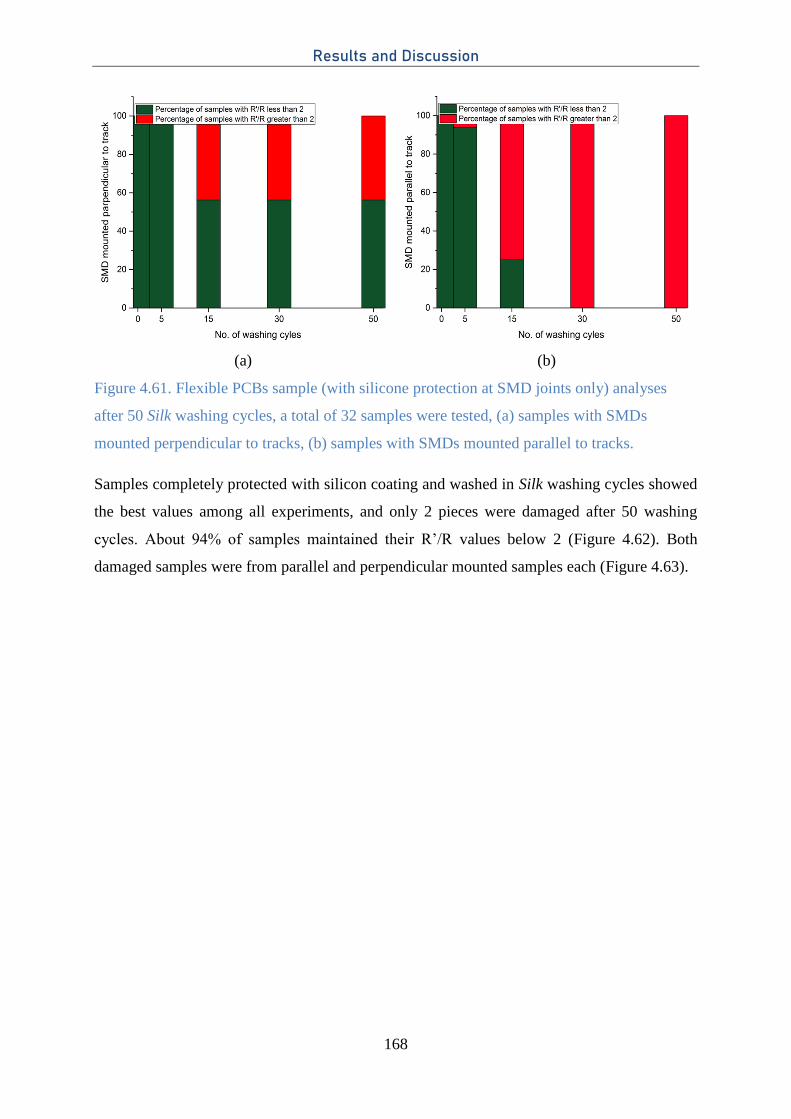
Results and Discussion
168
(a) (b)
Figure 4.61. Flexible PCBs sample (with silicone protection at SMD joints only) analyses
after 50 Silk washing cycles, a total of 32 samples were tested, (a) samples with SMDs
mounted perpendicular to tracks, (b) samples with SMDs mounted parallel to tracks.
Samples completely protected with silicon coating and washed in Silk washing cycles showed
the best values among all experiments, and only 2 pieces were damaged after 50 washing
cycles. About 94% of samples maintained their R’/R values below 2 (Figure 4.62). Both
damaged samples were from parallel and perpendicular mounted samples each (Figure 4.63).
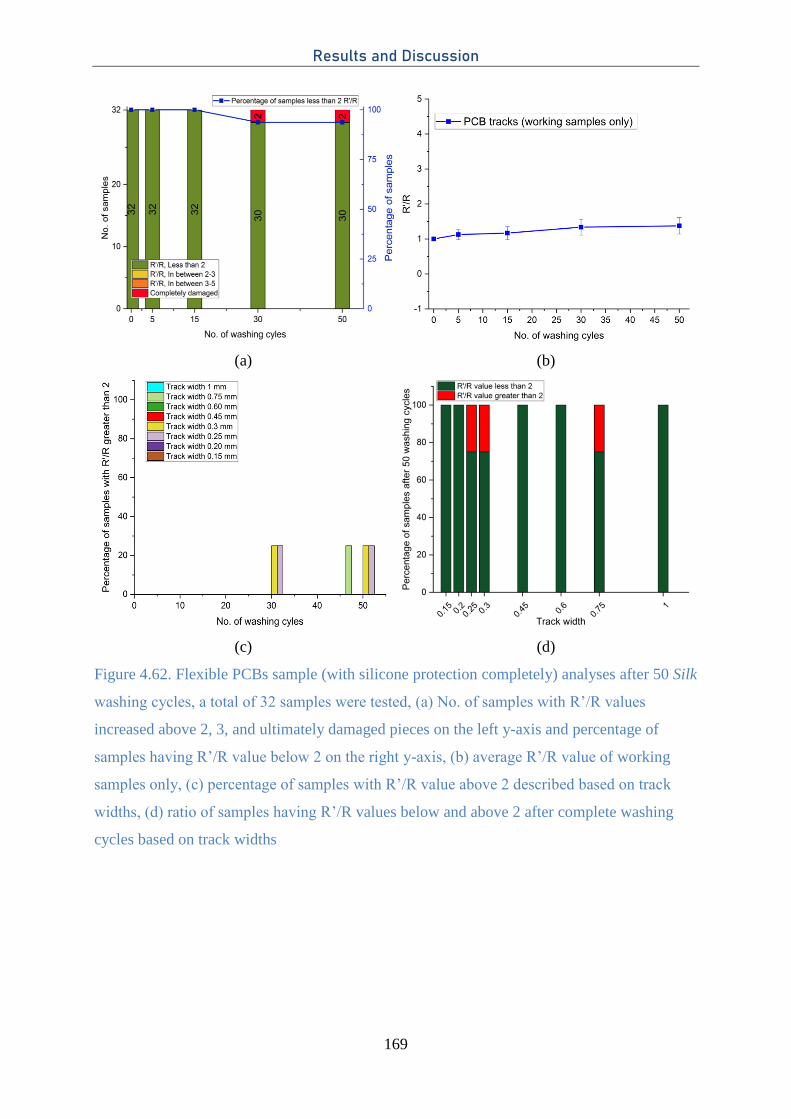
Results and Discussion
169
(a) (b)
(c) (d)
Figure 4.62. Flexible PCBs sample (with silicone protection completely) analyses after 50 Silk
washing cycles, a total of 32 samples were tested, (a) No. of samples with R’/R values
increased above 2, 3, and ultimately damaged pieces on the left y-axis and percentage of
samples having R’/R value below 2 on the right y-axis, (b) average R’/R value of working
samples only, (c) percentage of samples with R’/R value above 2 described based on track
widths, (d) ratio of samples having R’/R values below and above 2 after complete washing
cycles based on track widths
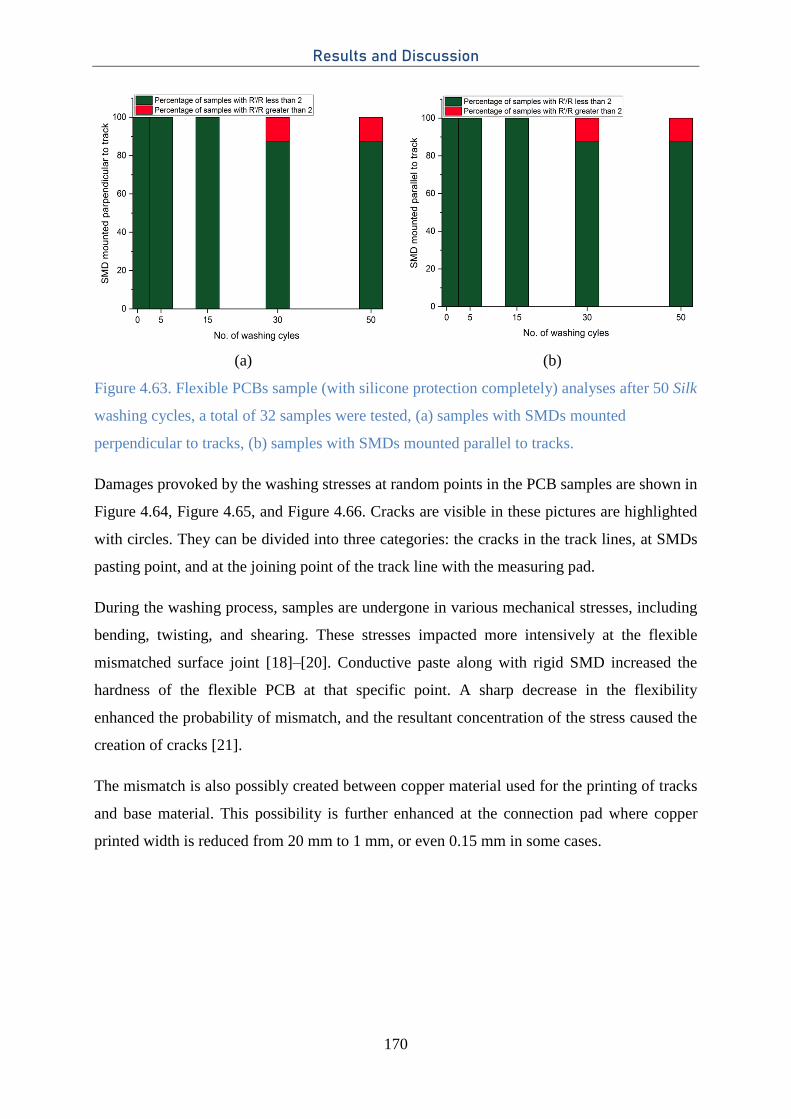
Results and Discussion
170
(a) (b)
Figure 4.63. Flexible PCBs sample (with silicone protection completely) analyses after 50 Silk
washing cycles, a total of 32 samples were tested, (a) samples with SMDs mounted
perpendicular to tracks, (b) samples with SMDs mounted parallel to tracks.
Damages provoked by the washing stresses at random points in the PCB samples are shown in
Figure 4.64, Figure 4.65, and Figure 4.66. Cracks are visible in these pictures are highlighted
with circles. They can be divided into three categories: the cracks in the track lines, at SMDs
pasting point, and at the joining point of the track line with the measuring pad.
During the washing process, samples are undergone in various mechanical stresses, including
bending, twisting, and shearing. These stresses impacted more intensively at the flexible
mismatched surface joint [18]–[20]. Conductive paste along with rigid SMD increased the
hardness of the flexible PCB at that specific point. A sharp decrease in the flexibility
enhanced the probability of mismatch, and the resultant concentration of the stress caused the
creation of cracks [21].
The mismatch is also possibly created between copper material used for the printing of tracks
and base material. This possibility is further enhanced at the connection pad where copper
printed width is reduced from 20 mm to 1 mm, or even 0.15 mm in some cases.
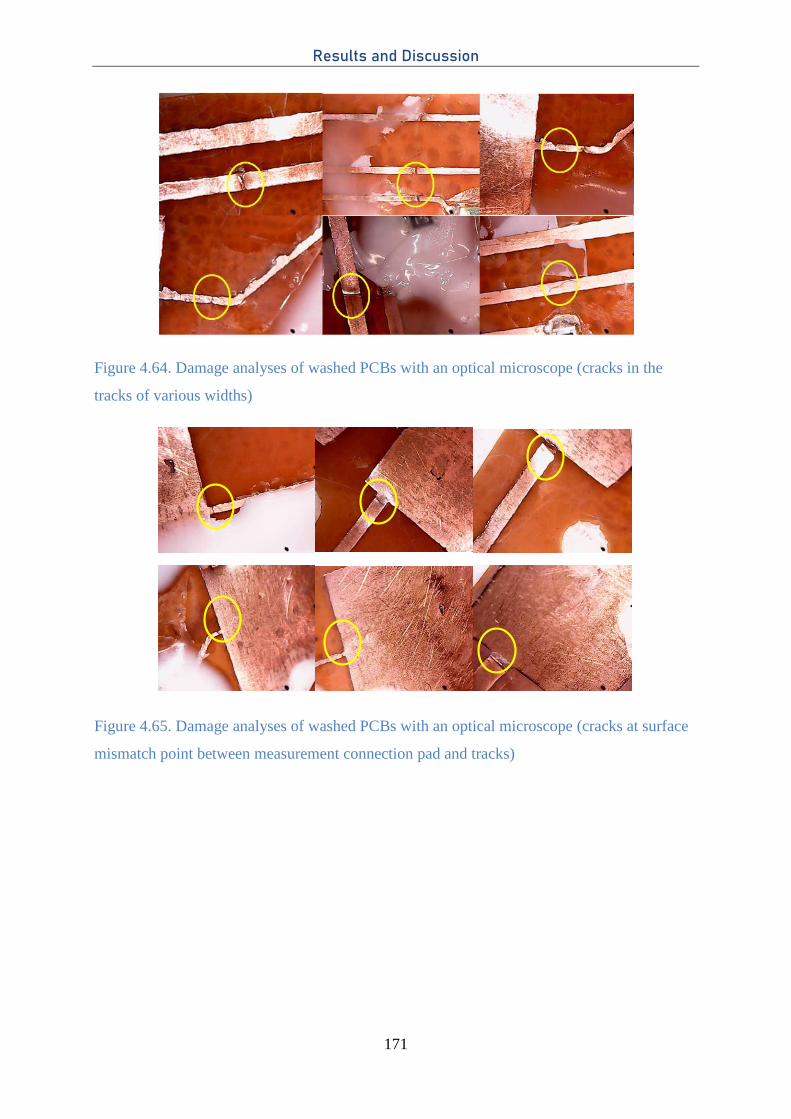
Results and Discussion
171
Figure 4.64. Damage analyses of washed PCBs with an optical microscope (cracks in the
tracks of various widths)
Figure 4.65. Damage analyses of washed PCBs with an optical microscope (cracks at surface
mismatch point between measurement connection pad and tracks)
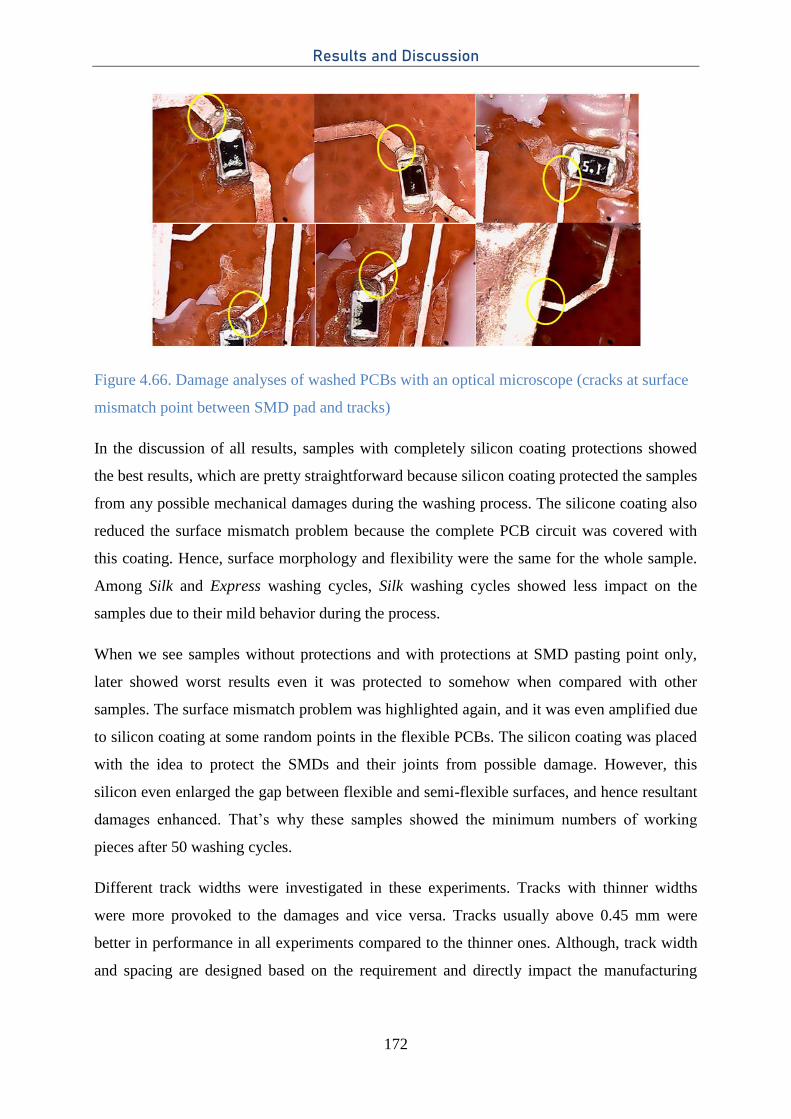
Results and Discussion
172
Figure 4.66. Damage analyses of washed PCBs with an optical microscope (cracks at surface
mismatch point between SMD pad and tracks)
In the discussion of all results, samples with completely silicon coating protections showed
the best results, which are pretty straightforward because silicon coating protected the samples
from any possible mechanical damages during the washing process. The silicone coating also
reduced the surface mismatch problem because the complete PCB circuit was covered with
this coating. Hence, surface morphology and flexibility were the same for the whole sample.
Among Silk and Express washing cycles, Silk washing cycles showed less impact on the
samples due to their mild behavior during the process.
When we see samples without protections and with protections at SMD pasting point only,
later showed worst results even it was protected to somehow when compared with other
samples. The surface mismatch problem was highlighted again, and it was even amplified due
to silicon coating at some random points in the flexible PCBs. The silicon coating was placed
with the idea to protect the SMDs and their joints from possible damage. However, this
silicon even enlarged the gap between flexible and semi-flexible surfaces, and hence resultant
damages enhanced. That’s why these samples showed the minimum numbers of working
pieces after 50 washing cycles.
Different track widths were investigated in these experiments. Tracks with thinner widths
were more provoked to the damages and vice versa. Tracks usually above 0.45 mm were
better in performance in all experiments compared to the thinner ones. Although, track width
and spacing are designed based on the requirement and directly impact the manufacturing
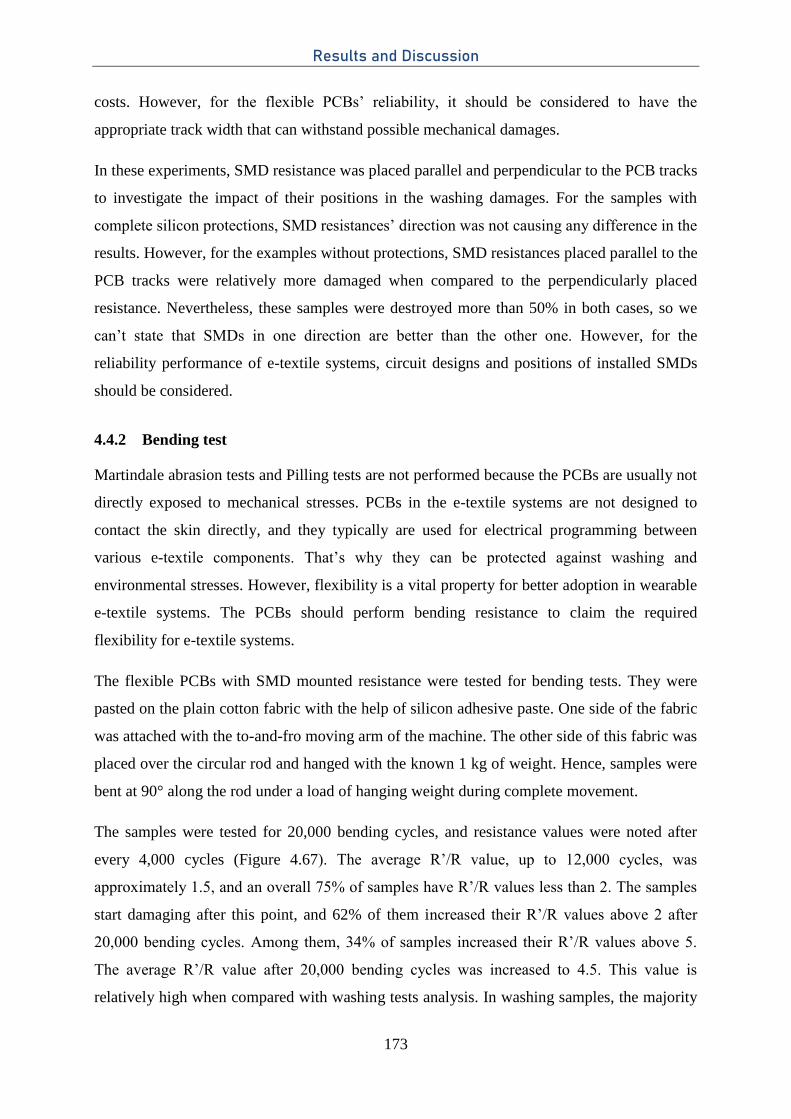
Results and Discussion
173
costs. However, for the flexible PCBs’ reliability, it should be considered to have the
appropriate track width that can withstand possible mechanical damages.
In these experiments, SMD resistance was placed parallel and perpendicular to the PCB tracks
to investigate the impact of their positions in the washing damages. For the samples with
complete silicon protections, SMD resistances’ direction was not causing any difference in the
results. However, for the examples without protections, SMD resistances placed parallel to the
PCB tracks were relatively more damaged when compared to the perpendicularly placed
resistance. Nevertheless, these samples were destroyed more than 50% in both cases, so we
can’t state that SMDs in one direction are better than the other one. However, for the
reliability performance of e-textile systems, circuit designs and positions of installed SMDs
should be considered.
4.4.2 Bending test
Martindale abrasion tests and Pilling tests are not performed because the PCBs are usually not
directly exposed to mechanical stresses. PCBs in the e-textile systems are not designed to
contact the skin directly, and they typically are used for electrical programming between
various e-textile components. That’s why they can be protected against washing and
environmental stresses. However, flexibility is a vital property for better adoption in wearable
e-textile systems. The PCBs should perform bending resistance to claim the required
flexibility for e-textile systems.
The flexible PCBs with SMD mounted resistance were tested for bending tests. They were
pasted on the plain cotton fabric with the help of silicon adhesive paste. One side of the fabric
was attached with the to-and-fro moving arm of the machine. The other side of this fabric was
placed over the circular rod and hanged with the known 1 kg of weight. Hence, samples were
bent at 90° along the rod under a load of hanging weight during complete movement.
The samples were tested for 20,000 bending cycles, and resistance values were noted after
every 4,000 cycles (Figure 4.67). The average R’/R value, up to 12,000 cycles, was
approximately 1.5, and an overall 75% of samples have R’/R values less than 2. The samples
start damaging after this point, and 62% of them increased their R’/R values above 2 after
20,000 bending cycles. Among them, 34% of samples increased their R’/R values above 5.
The average R’/R value after 20,000 bending cycles was increased to 4.5. This value is
relatively high when compared with washing tests analysis. In washing samples, the majority
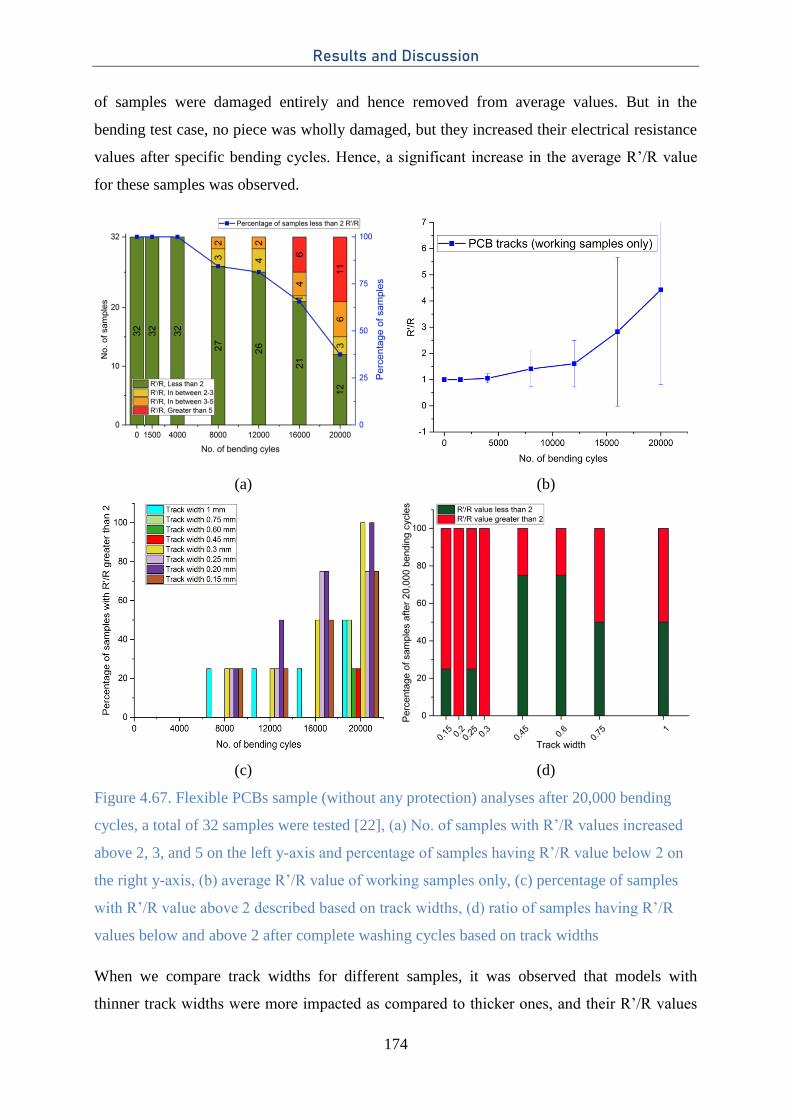
Results and Discussion
174
of samples were damaged entirely and hence removed from average values. But in the
bending test case, no piece was wholly damaged, but they increased their electrical resistance
values after specific bending cycles. Hence, a significant increase in the average R’/R value
for these samples was observed.
(a) (b)
(c) (d)
Figure 4.67. Flexible PCBs sample (without any protection) analyses after 20,000 bending
cycles, a total of 32 samples were tested [22], (a) No. of samples with R’/R values increased
above 2, 3, and 5 on the left y-axis and percentage of samples having R’/R value below 2 on
the right y-axis, (b) average R’/R value of working samples only, (c) percentage of samples
with R’/R value above 2 described based on track widths, (d) ratio of samples having R’/R
values below and above 2 after complete washing cycles based on track widths
When we compare track widths for different samples, it was observed that models with
thinner track widths were more impacted as compared to thicker ones, and their R’/R values
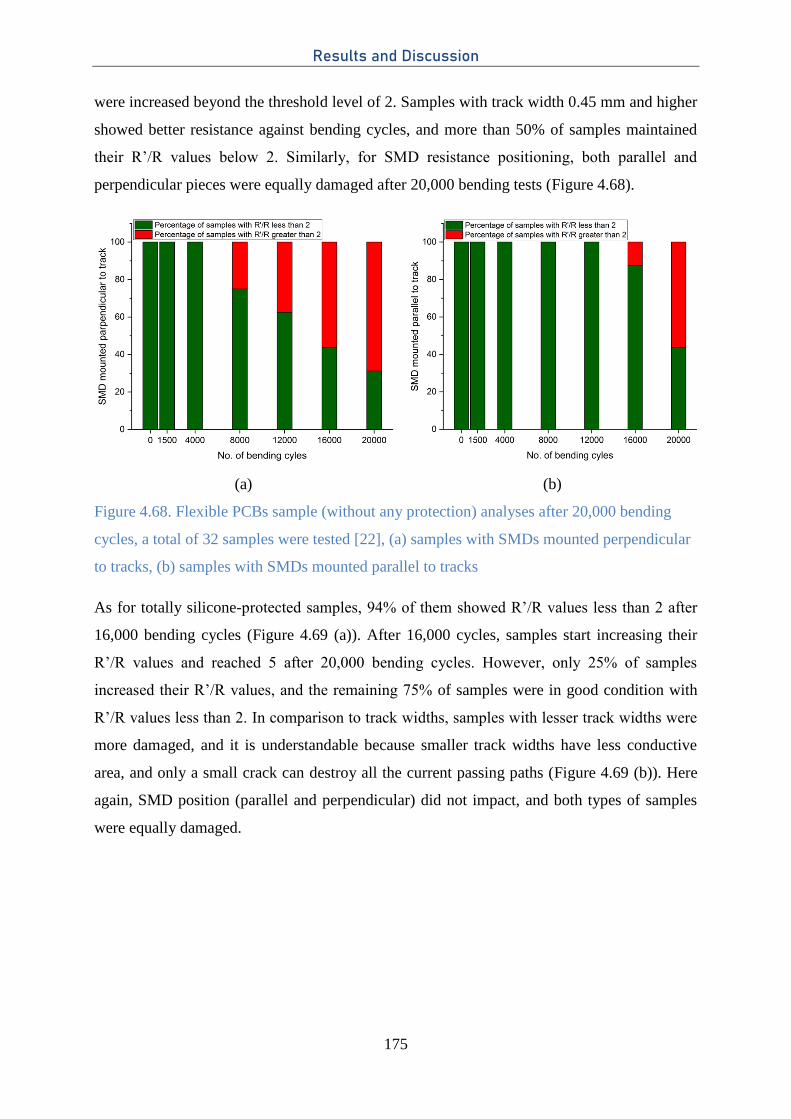
Results and Discussion
175
were increased beyond the threshold level of 2. Samples with track width 0.45 mm and higher
showed better resistance against bending cycles, and more than 50% of samples maintained
their R’/R values below 2. Similarly, for SMD resistance positioning, both parallel and
perpendicular pieces were equally damaged after 20,000 bending tests (Figure 4.68).
(a) (b)
Figure 4.68. Flexible PCBs sample (without any protection) analyses after 20,000 bending
cycles, a total of 32 samples were tested [22], (a) samples with SMDs mounted perpendicular
to tracks, (b) samples with SMDs mounted parallel to tracks
As for totally silicone-protected samples, 94% of them showed R’/R values less than 2 after
16,000 bending cycles (Figure 4.69 (a)). After 16,000 cycles, samples start increasing their
R’/R values and reached 5 after 20,000 bending cycles. However, only 25% of samples
increased their R’/R values, and the remaining 75% of samples were in good condition with
R’/R values less than 2. In comparison to track widths, samples with lesser track widths were
more damaged, and it is understandable because smaller track widths have less conductive
area, and only a small crack can destroy all the current passing paths (Figure 4.69 (b)). Here
again, SMD position (parallel and perpendicular) did not impact, and both types of samples
were equally damaged.
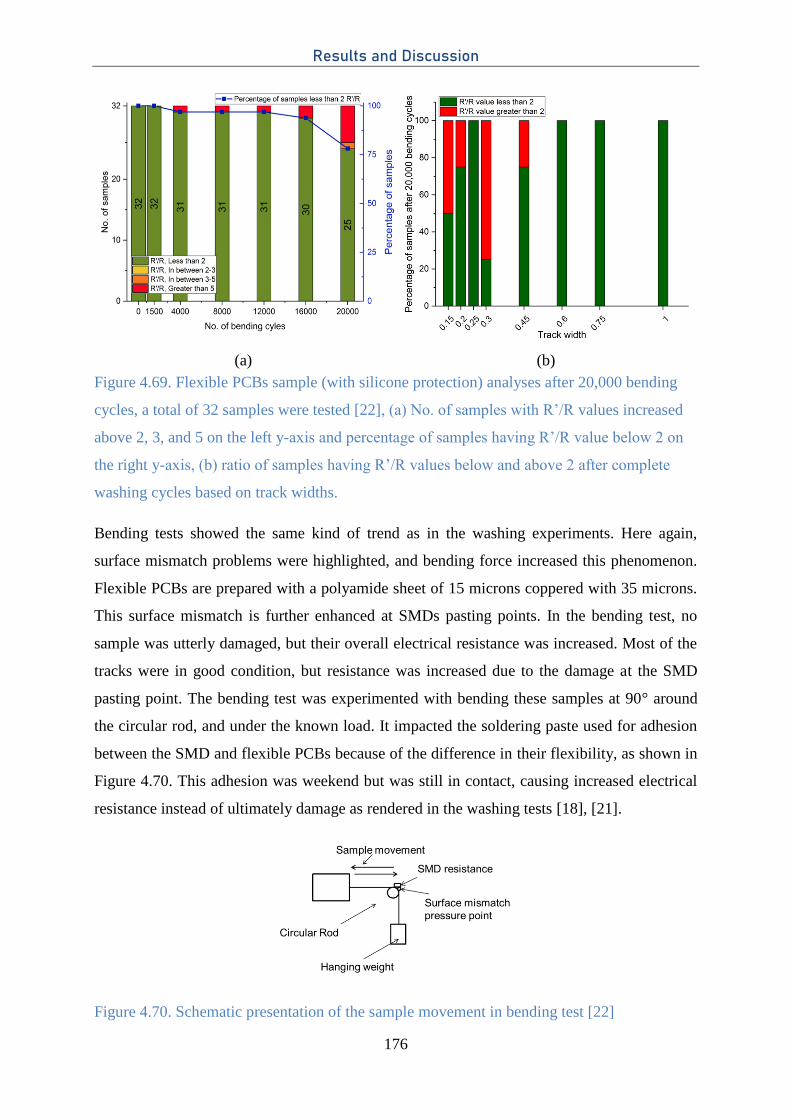
Results and Discussion
176
(a) (b)
Figure 4.69. Flexible PCBs sample (with silicone protection) analyses after 20,000 bending
cycles, a total of 32 samples were tested [22], (a) No. of samples with R’/R values increased
above 2, 3, and 5 on the left y-axis and percentage of samples having R’/R value below 2 on
the right y-axis, (b) ratio of samples having R’/R values below and above 2 after complete
washing cycles based on track widths.
Bending tests showed the same kind of trend as in the washing experiments. Here again,
surface mismatch problems were highlighted, and bending force increased this phenomenon.
Flexible PCBs are prepared with a polyamide sheet of 15 microns coppered with 35 microns.
This surface mismatch is further enhanced at SMDs pasting points. In the bending test, no
sample was utterly damaged, but their overall electrical resistance was increased. Most of the
tracks were in good condition, but resistance was increased due to the damage at the SMD
pasting point. The bending test was experimented with bending these samples at 90° around
the circular rod, and under the known load. It impacted the soldering paste used for adhesion
between the SMD and flexible PCBs because of the difference in their flexibility, as shown in
Figure 4.70. This adhesion was weekend but was still in contact, causing increased electrical
resistance instead of ultimately damage as rendered in the washing tests [18], [21].
Figure 4.70. Schematic presentation of the sample movement in bending test [22]
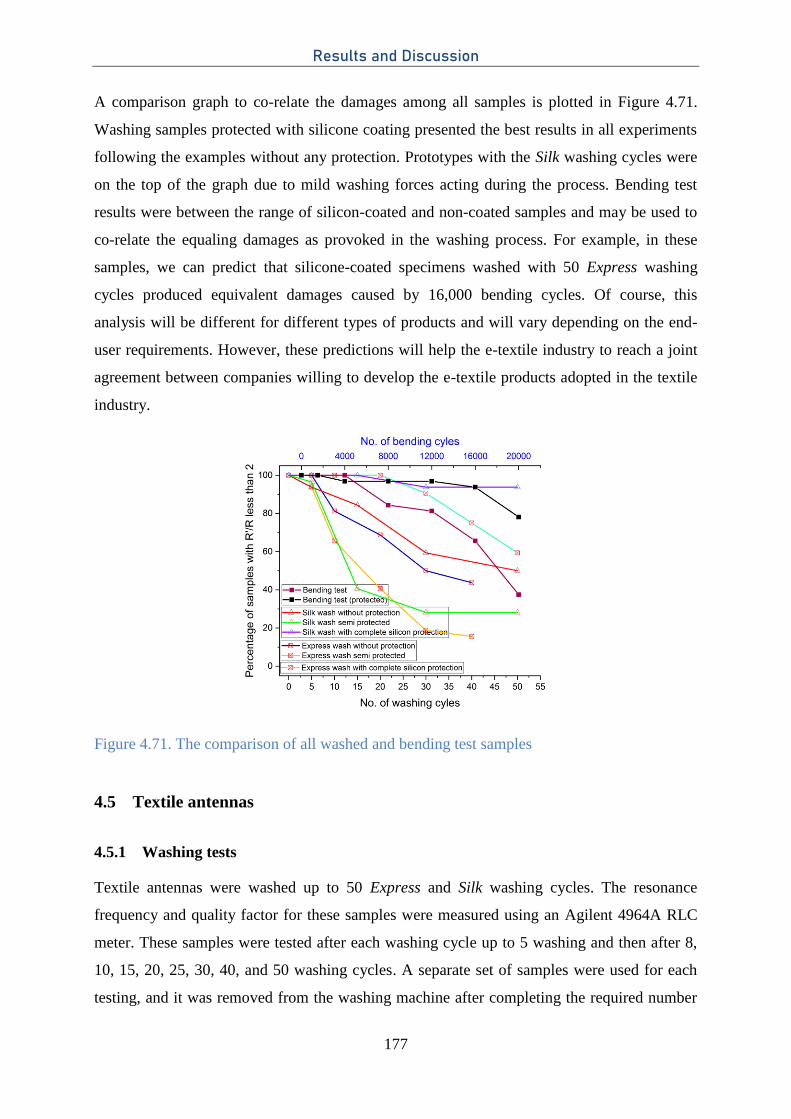
Results and Discussion
177
A comparison graph to co-relate the damages among all samples is plotted in Figure 4.71.
Washing samples protected with silicone coating presented the best results in all experiments
following the examples without any protection. Prototypes with the Silk washing cycles were
on the top of the graph due to mild washing forces acting during the process. Bending test
results were between the range of silicon-coated and non-coated samples and may be used to
co-relate the equaling damages as provoked in the washing process. For example, in these
samples, we can predict that silicone-coated specimens washed with 50 Express washing
cycles produced equivalent damages caused by 16,000 bending cycles. Of course, this
analysis will be different for different types of products and will vary depending on the end-
user requirements. However, these predictions will help the e-textile industry to reach a joint
agreement between companies willing to develop the e-textile products adopted in the textile
industry.
Figure 4.71. The comparison of all washed and bending test samples
4.5 Textile antennas
4.5.1 Washing tests
Textile antennas were washed up to 50 Express and Silk washing cycles. The resonance
frequency and quality factor for these samples were measured using an Agilent 4964A RLC
meter. These samples were tested after each washing cycle up to 5 washing and then after 8,
10, 15, 20, 25, 30, 40, and 50 washing cycles. A separate set of samples were used for each
testing, and it was removed from the washing machine after completing the required number
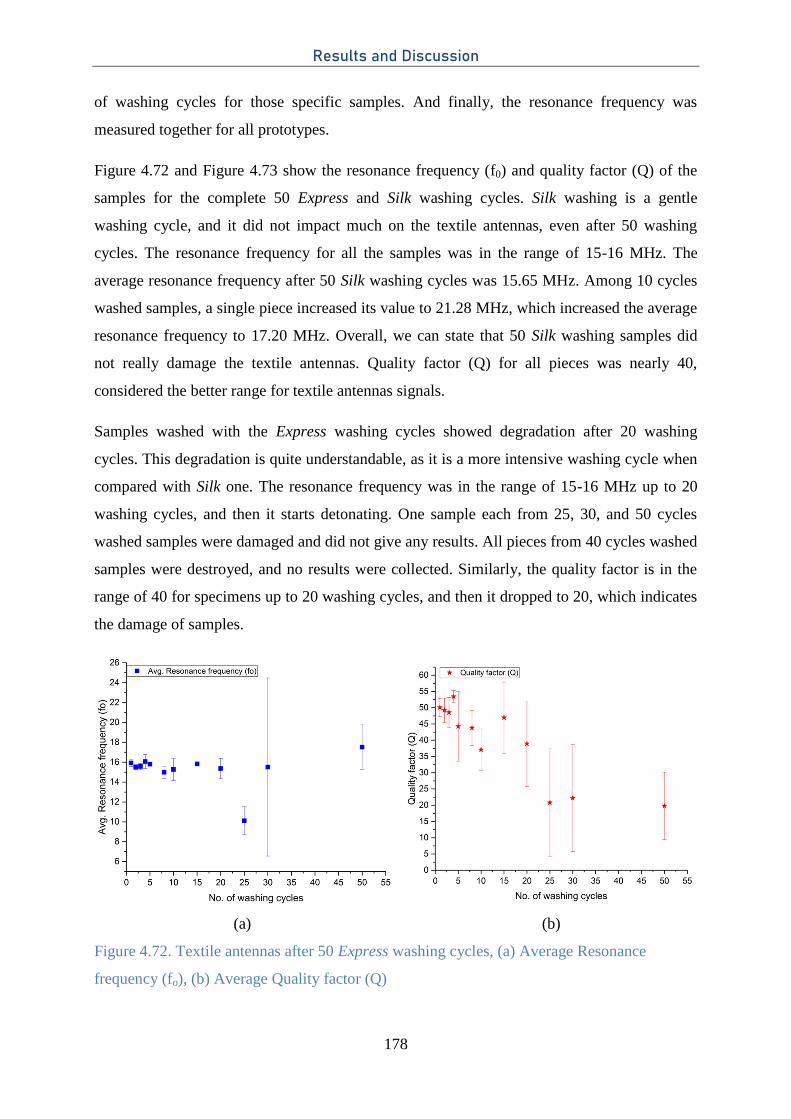
Results and Discussion
178
of washing cycles for those specific samples. And finally, the resonance frequency was
measured together for all prototypes.
Figure 4.72 and Figure 4.73 show the resonance frequency (f0) and quality factor (Q) of the
samples for the complete 50 Express and Silk washing cycles. Silk washing is a gentle
washing cycle, and it did not impact much on the textile antennas, even after 50 washing
cycles. The resonance frequency for all the samples was in the range of 15-16 MHz. The
average resonance frequency after 50 Silk washing cycles was 15.65 MHz. Among 10 cycles
washed samples, a single piece increased its value to 21.28 MHz, which increased the average
resonance frequency to 17.20 MHz. Overall, we can state that 50 Silk washing samples did
not really damage the textile antennas. Quality factor (Q) for all pieces was nearly 40,
considered the better range for textile antennas signals.
Samples washed with the Express washing cycles showed degradation after 20 washing
cycles. This degradation is quite understandable, as it is a more intensive washing cycle when
compared with Silk one. The resonance frequency was in the range of 15-16 MHz up to 20
washing cycles, and then it starts detonating. One sample each from 25, 30, and 50 cycles
washed samples were damaged and did not give any results. All pieces from 40 cycles washed
samples were destroyed, and no results were collected. Similarly, the quality factor is in the
range of 40 for specimens up to 20 washing cycles, and then it dropped to 20, which indicates
the damage of samples.
(a) (b)
Figure 4.72. Textile antennas after 50 Express washing cycles, (a) Average Resonance
frequency (fo), (b) Average Quality factor (Q)
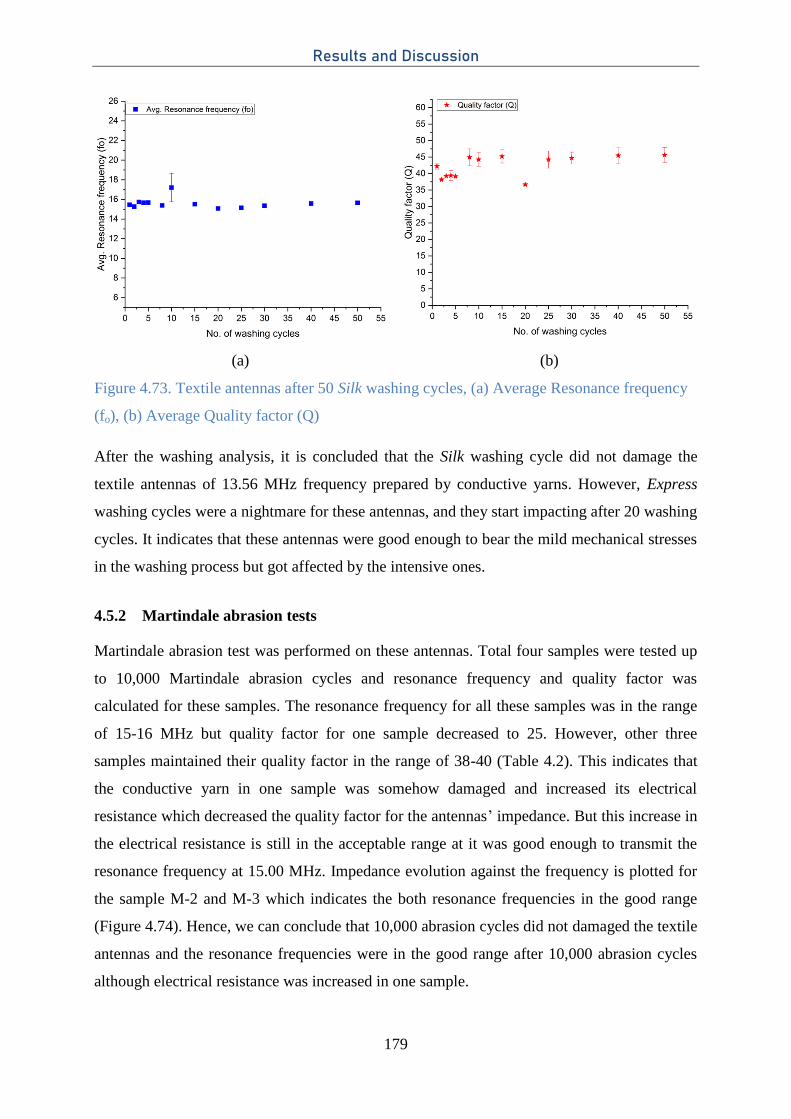
Results and Discussion
179
(a) (b)
Figure 4.73. Textile antennas after 50 Silk washing cycles, (a) Average Resonance frequency
(fo), (b) Average Quality factor (Q)
After the washing analysis, it is concluded that the Silk washing cycle did not damage the
textile antennas of 13.56 MHz frequency prepared by conductive yarns. However, Express
washing cycles were a nightmare for these antennas, and they start impacting after 20 washing
cycles. It indicates that these antennas were good enough to bear the mild mechanical stresses
in the washing process but got affected by the intensive ones.
4.5.2 Martindale abrasion tests
Martindale abrasion test was performed on these antennas. Total four samples were tested up
to 10,000 Martindale abrasion cycles and resonance frequency and quality factor was
calculated for these samples. The resonance frequency for all these samples was in the range
of 15-16 MHz but quality factor for one sample decreased to 25. However, other three
samples maintained their quality factor in the range of 38-40 (Table 4.2). This indicates that
the conductive yarn in one sample was somehow damaged and increased its electrical
resistance which decreased the quality factor for the antennas’ impedance. But this increase in
the electrical resistance is still in the acceptable range at it was good enough to transmit the
resonance frequency at 15.00 MHz. Impedance evolution against the frequency is plotted for
the sample M-2 and M-3 which indicates the both resonance frequencies in the good range
(Figure 4.74). Hence, we can conclude that 10,000 abrasion cycles did not damaged the textile
antennas and the resonance frequencies were in the good range after 10,000 abrasion cycles
although electrical resistance was increased in one sample.
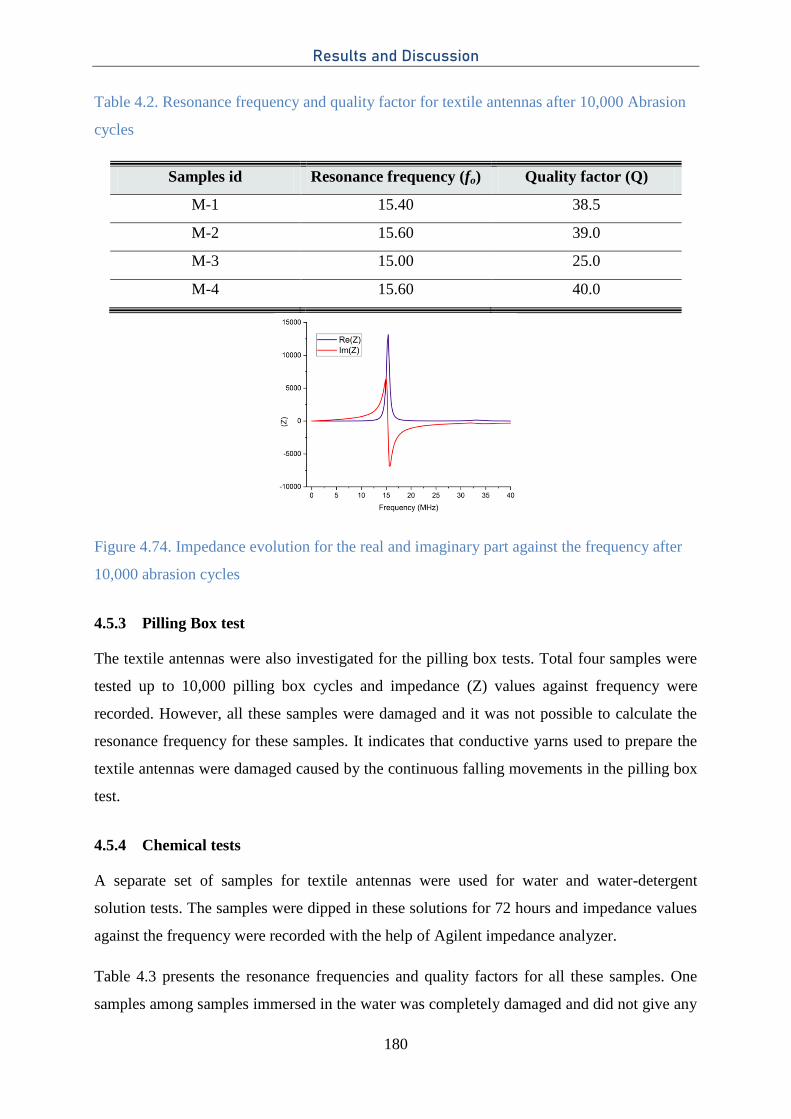
Results and Discussion
180
Table 4.2. Resonance frequency and quality factor for textile antennas after 10,000 Abrasion
cycles
Samples id Resonance frequency (fo) Quality factor (Q)
M-1 15.40 38.5
M-2 15.60 39.0
M-3 15.00 25.0
M-4 15.60 40.0
Figure 4.74. Impedance evolution for the real and imaginary part against the frequency after
10,000 abrasion cycles
4.5.3 Pilling Box test
The textile antennas were also investigated for the pilling box tests. Total four samples were
tested up to 10,000 pilling box cycles and impedance (Z) values against frequency were
recorded. However, all these samples were damaged and it was not possible to calculate the
resonance frequency for these samples. It indicates that conductive yarns used to prepare the
textile antennas were damaged caused by the continuous falling movements in the pilling box
test.
4.5.4 Chemical tests
A separate set of samples for textile antennas were used for water and water-detergent
solution tests. The samples were dipped in these solutions for 72 hours and impedance values
against the frequency were recorded with the help of Agilent impedance analyzer.
Table 4.3 presents the resonance frequencies and quality factors for all these samples. One
samples among samples immersed in the water was completely damaged and did not give any
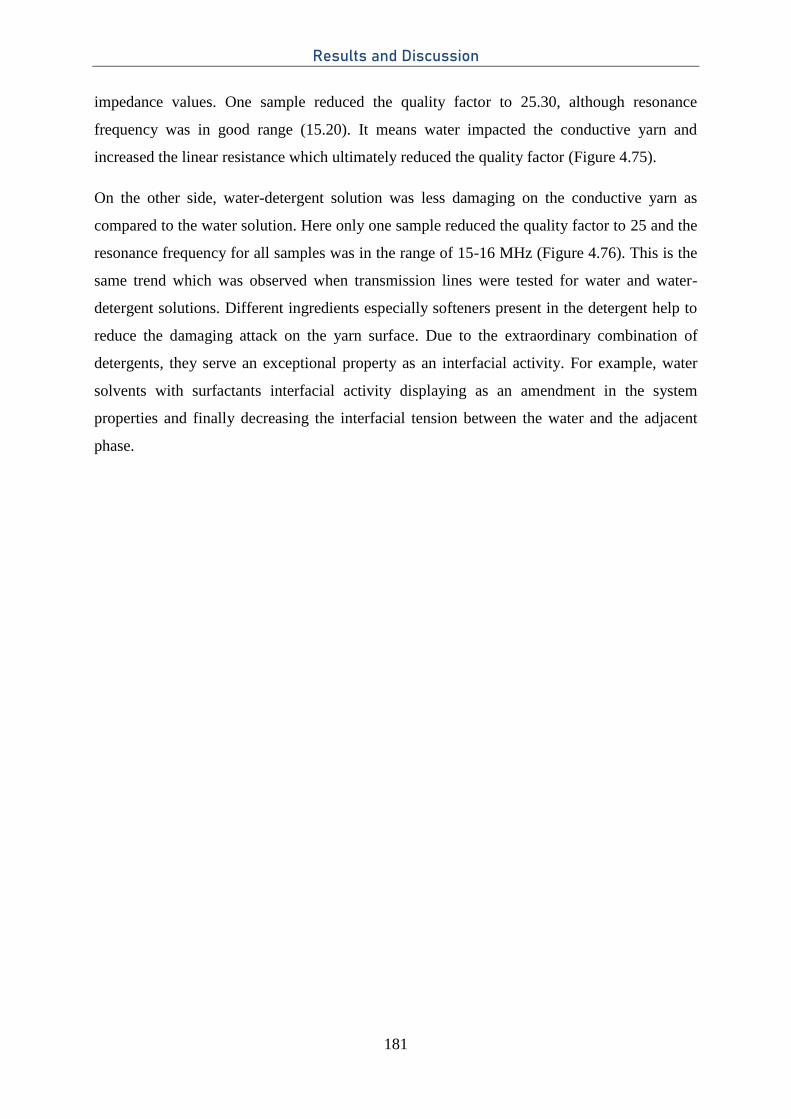
Results and Discussion
181
impedance values. One sample reduced the quality factor to 25.30, although resonance
frequency was in good range (15.20). It means water impacted the conductive yarn and
increased the linear resistance which ultimately reduced the quality factor (Figure 4.75).
On the other side, water-detergent solution was less damaging on the conductive yarn as
compared to the water solution. Here only one sample reduced the quality factor to 25 and the
resonance frequency for all samples was in the range of 15-16 MHz (Figure 4.76). This is the
same trend which was observed when transmission lines were tested for water and water-
detergent solutions. Different ingredients especially softeners present in the detergent help to
reduce the damaging attack on the yarn surface. Due to the extraordinary combination of
detergents, they serve an exceptional property as an interfacial activity. For example, water
solvents with surfactants interfacial activity displaying as an amendment in the system
properties and finally decreasing the interfacial tension between the water and the adjacent
phase.
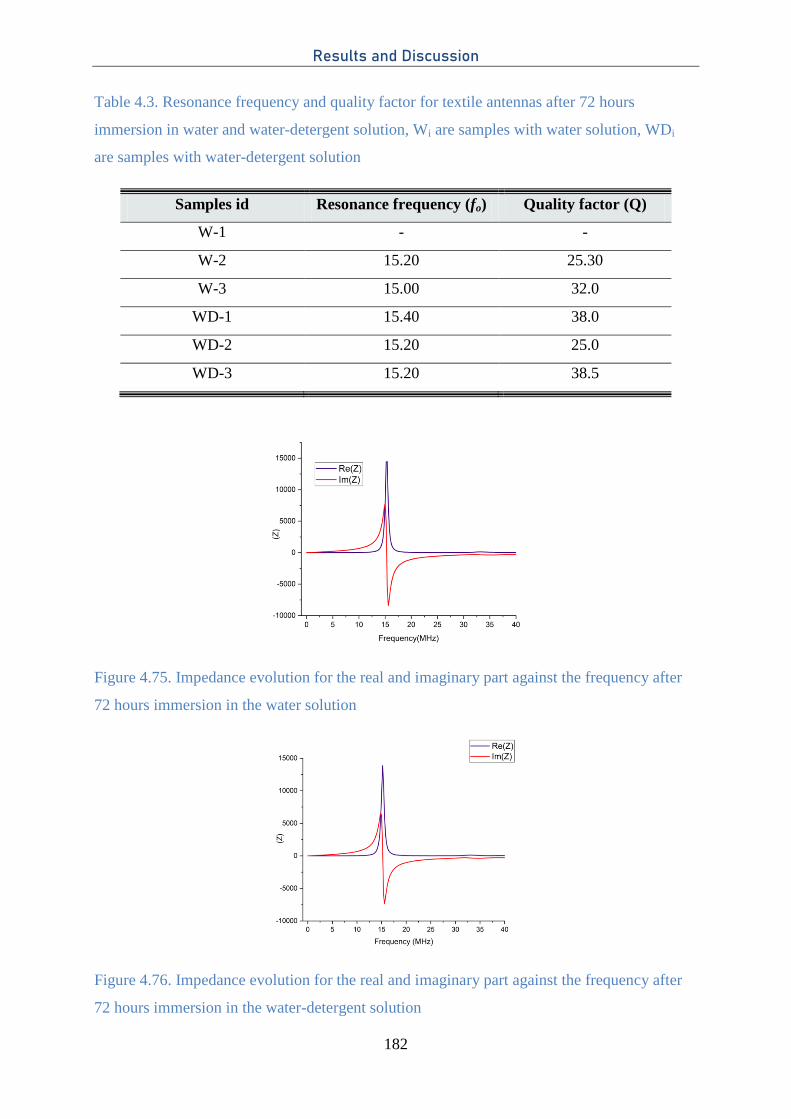
Results and Discussion
182
Table 4.3. Resonance frequency and quality factor for textile antennas after 72 hours
immersion in water and water-detergent solution, Wi are samples with water solution, WDi
are samples with water-detergent solution
Samples id Resonance frequency (fo) Quality factor (Q)
W-1 - -
W-2 15.20 25.30
W-3 15.00 32.0
WD-1 15.40 38.0
WD-2 15.20 25.0
WD-3 15.20 38.5
Figure 4.75. Impedance evolution for the real and imaginary part against the frequency after
72 hours immersion in the water solution
Figure 4.76. Impedance evolution for the real and imaginary part against the frequency after
72 hours immersion in the water-detergent solution
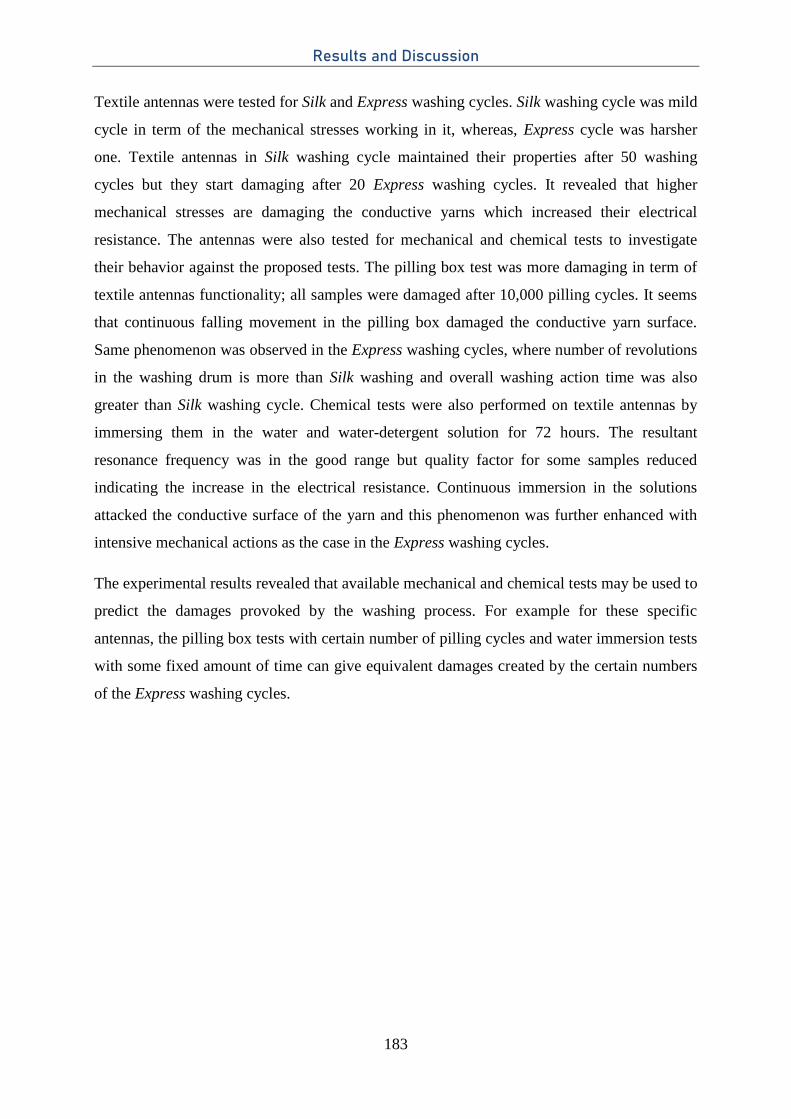
Results and Discussion
183
Textile antennas were tested for Silk and Express washing cycles. Silk washing cycle was mild
cycle in term of the mechanical stresses working in it, whereas, Express cycle was harsher
one. Textile antennas in Silk washing cycle maintained their properties after 50 washing
cycles but they start damaging after 20 Express washing cycles. It revealed that higher
mechanical stresses are damaging the conductive yarns which increased their electrical
resistance. The antennas were also tested for mechanical and chemical tests to investigate
their behavior against the proposed tests. The pilling box test was more damaging in term of
textile antennas functionality; all samples were damaged after 10,000 pilling cycles. It seems
that continuous falling movement in the pilling box damaged the conductive yarn surface.
Same phenomenon was observed in the Express washing cycles, where number of revolutions
in the washing drum is more than Silk washing and overall washing action time was also
greater than Silk washing cycle. Chemical tests were also performed on textile antennas by
immersing them in the water and water-detergent solution for 72 hours. The resultant
resonance frequency was in the good range but quality factor for some samples reduced
indicating the increase in the electrical resistance. Continuous immersion in the solutions
attacked the conductive surface of the yarn and this phenomenon was further enhanced with
intensive mechanical actions as the case in the Express washing cycles.
The experimental results revealed that available mechanical and chemical tests may be used to
predict the damages provoked by the washing process. For example for these specific
antennas, the pilling box tests with certain number of pilling cycles and water immersion tests
with some fixed amount of time can give equivalent damages created by the certain numbers
of the Express washing cycles.
Results and Discussion
184
References
[1] S. uz Zaman, X. Tao, C. Cochrane, and V. Koncar, “E-Textile Systems Reliability
Assessment—A Miniaturized Accelerometer Used to Investigate Damage during Their
Washing,” Sensors, vol. 21, no. 2, Art. no. 2, Jan. 2021, doi: 10.3390/s21020605.
[2] S. uz Zaman, X. Tao, C. Cochrane, and V. Koncar, “Launderability of Conductive
Polymer Yarns Used for Connections of E-textile Modules: Mechanical Stresses,”
Fibers and Polymers, vol. 20, no. 11, pp. 2355–2366, Nov. 2019, doi: 10.1007/s12221-
019-9325-x.
[3] E. Ismar, S. uz Zaman, X. Tao, C. Cochrane, and V. Koncar, “Effect of Water and
Chemical Stresses on the Silver Coated Polyamide Yarns,” Fibers and Polymers, vol.
20, no. 12, pp. 2604–2610, Dec. 2019, doi: 10.1007/s12221-019-9266-4.
[4] M. Wei et al., “Manipulation of Nylon-6 Crystal Structures with Its α-Cyclodextrin
Inclusion Complex,” Macromolecules, vol. 35, no. 21, pp. 8039–8044, Oct. 2002, doi:
10.1021/ma020765m.
[5] D. Garcia and H. W. Starkweather, “Hydrogen bonding in nylon 66 and model
compounds,” Journal of Polymer Science: Polymer Physics Edition, vol. 23, no. 3, pp.
537–555, 1985, doi: https://doi.org/10.1002/pol.1985.180230310.
[6] S. Periyasamy, G. K. Prasad, S. K. Chattopadhyay, A. S. M. Raja, K. R. Kumar, and S.
Jagadale, “Micro-roughening of polyamide fabric using protease enzyme for improving
adhesion strength of rubber-polyamide composite,” Journal of Polymer Engineering,
vol. 37, no. 3, pp. 297–306, Mar. 2017, doi: 10.1515/polyeng-2015-0541.
[7] N. Vasanthan and D. R. Salem, “FTIR spectroscopic characterization of structural
changes in polyamide-6 fibers during annealing and drawing,” Journal of Polymer
Science Part B: Polymer Physics, vol. 39, no. 5, pp. 536–547, 2001, doi:
https://doi.org/10.1002/1099-0488(20010301)39:5<536::AID-POLB1027>3.0.CO;2-8.
[8] G. Rotter and H. Ishida, “FTIR separation of nylon-6 chain conformations:
Clarification of the mesomorphous and γ-crystalline phases,” Journal of Polymer
Science Part B: Polymer Physics, vol. 30, no. 5, pp. 489–495, 1992, doi:
https://doi.org/10.1002/polb.1992.090300508.
[9] J. Falbe, Surfactants in Consumer Products: Theory, Technology and Application.
Springer Science & Business Media, 2012.
[10] D. K. Bhui, H. Bar, P. Sarkar, G. P. Sahoo, S. P. De, and A. Misra, “Synthesis and UV–
vis spectroscopic study of silver nanoparticles in aqueous SDS solution,” Journal of
Results and Discussion
185
Molecular Liquids, vol. 145, no. 1, pp. 33–37, Mar. 2009, doi:
10.1016/j.molliq.2008.11.014.
[11] N. Vigneshwaran, A. A. Kathe, P. V. Varadarajan, R. P. Nachane, and R. H.
Balasubramanya, “Functional Finishing of Cotton Fabrics Using Silver Nanoparticles,”
Journal of Nanoscience and Nanotechnology, vol. 7, no. 6, pp. 1893–1897, Jun. 2007,
doi: 10.1166/jnn.2007.737.
[12] D. D. Evanoff and G. Chumanov, “Synthesis and Optical Properties of Silver
Nanoparticles and Arrays,” ChemPhysChem, vol. 6, no. 7, pp. 1221–1231, 2005, doi:
https://doi.org/10.1002/cphc.200500113.
[13] S. Pal, Y. K. Tak, and J. M. Song, “Does the Antibacterial Activity of Silver
Nanoparticles Depend on the Shape of the Nanoparticle? A Study of the Gram-
Negative Bacterium Escherichia coli,” Appl. Environ. Microbiol., vol. 73, no. 6, pp.
1712–1720, Mar. 2007, doi: 10.1128/AEM.02218-06.
[14] S. uz Zaman, X. Tao, C. Cochrane, and V. Koncar, “Understanding the Washing
Damage to Textile ECG Dry Skin Electrodes, Embroidered and Fabric-Based; set up of
Equivalent Laboratory Tests,” Sensors, vol. 20, no. 5, p. 1272, Feb. 2020, doi:
10.3390/s20051272.
[15] P. Szakálos, G. Hultquist, and G. Wikmark, “Corrosion of Copper by Water,”
Electrochem. Solid-State Lett., vol. 10, no. 11, p. C63, Aug. 2007, doi:
10.1149/1.2772085.
[16] Dils, Werft, Walter, Zwanzig, von Krshiwoblozki, and Schneider-Ramelow,
“Investigation of the Mechanical and Electrical Properties of Elastic Textile/Polymer
Composites for Stretchable Electronics at Quasi-Static or Cyclic Mechanical Loads,”
Materials, vol. 12, no. 21, p. 3599, Nov. 2019, doi: 10.3390/ma12213599.
[17] A. E. Broo, B. Berghult, and T. Hedberg, “Copper corrosion in drinking water
distribution systems — the influence of water quality,” Corrosion Science, vol. 39, no.
6, pp. 1119–1132, Jun. 1997, doi: 10.1016/S0010-938X(97)00026-7.
[18] L. Mao, Q. Meng, A. Ahmad, and Z. Wei, “Mechanical Analyses and Structural Design
Requirements for Flexible Energy Storage Devices,” Advanced Energy Materials, vol.
7, no. 23, p. 1700535, 2017, doi: https://doi.org/10.1002/aenm.201700535.
[19] N. Singh et al., “Paintable Battery,” Scientific Reports, vol. 2, no. 1, Art. no. 1, Jun.
2012, doi: 10.1038/srep00481.
Results and Discussion
186
[20] S.-R. Kim and J. A. Nairn, “Fracture mechanics analysis of coating/substrate systems:
Part I: Analysis of tensile and bending experiments,” Engineering Fracture Mechanics,
vol. 65, no. 5, pp. 573–593, Mar. 2000, doi: 10.1016/S0013-7944(99)00141-1.
[21] S.-I. Park, J.-H. Ahn, X. Feng, S. Wang, Y. Huang, and J. A. Rogers, “Theoretical and
Experimental Studies of Bending of Inorganic Electronic Materials on Plastic
Substrates,” Advanced Functional Materials, vol. 18, no. 18, pp. 2673–2684, 2008, doi:
https://doi.org/10.1002/adfm.200800306.
[22] S. uz Zaman, X. Tao, C. Cochrane, and V. Koncar, “Wash analyses of flexible and
wearable printed circuits for e-textiles and their prediction of damages,” electronics,
vol. 10, pp. 1362, Jun. 2021, doi: https://doi.org/10.3390/electronics10111362.
General Conclusion
187
5. General Conclusion
The research activities within my Ph.D. thesis were conducted with a focus on the washing
reliability and standardization required for e-textile systems. This research was focused to
create a clear picture regarding e-textile system reliability issues. The original intellectual
contributions of this Ph.D. thesis are presented below:
Understanding of the washing process and the contents of different programs
including possible damages actions towards e-textile systems;
Analyses of the damaging actions on different parts of e-textile systems (transmission
lines, sensors/ actuators, electronic modules, textile antennas, etc.;
Simulation of damages provoked by washing process using existing textile testing
apparatuses such as chemical tests and mechanical tests (Martindale abrasion, pilling
box, and bending tests, etc.);
Proposal of the strategy to better protect e-textile systems against washing damages
helping them to become acceptable by the market for industries;
Definition of five categories for e-textile systems based on their fields of application
including fashion, sports and leisure, PPE, medical, and military, and three classes
based on their robustness and way of use. These categories include e-textile systems
reliability related to the following characteristics (Figure 6.1, Figure 6.2, and Figure
6.3).
General Conclusion
188
Different well-developed textile and electronic standards are available for guidelines. They
should be modified for proper adoption with e-textile systems, or new norms should be
developed based on these existing standards. The washing behavior of domestic washing
machines was investigated to understand better the washing parameters and possible forces
acting in the washing process. A novel technique of putting the waterproof sealed
accelerometer in the washing drum was used to investigate the substrate behavior during the
washing process carried out in the domestic washing machine. Based on these analyses, low-
and high-speed movements and running and stop time for the washing substrate was
highlighted for different washing programs. Diverse stresses involved in these washing
processes were shortlisted in four primary categories: mechanical, chemical, temperature, and
water stresses.
Different components of e-textile systems, including transmission lines/motherboards,
sensors, flexible PCBs, and textile antennas, were investigated for the washing process, and
their reliability against the washability was discussed. Several possible techniques that can be
used to protect these e-textile components for the possible damages in the washing process
were also presented in this study. Some e-textile system components can be covered entirely
against environmental damages, e.g., transmission lines. However, others don’t have these
possibilities, e.g., ECG sensors that should contact the body and cannot be covered.
Therefore, their washing reliability is an essential factor for market acceptance. These e-
textile components were washed for 50 washing cycles for almost all types of samples. The
50 times washing threshold level was selected based on the idea that an e-textile system has at
least one year of life and will be washed once a week.
A method for e-textile system reliability evaluation was presented in this study. Various
available test methods can be used, based on the forces working in the washing process, to
predict the washing damages without actually washing the product. For example, Martindale
abrasion tests, Pilling box tests, and bending tests can simulate the washing machines’
mechanical forces during the washing process. Similarly, water and detergent solution tests
may be used as the alternative to the chemical stresses. Selected examples for e-textile
components are tested with these alternate test methods, but it is not easy to cover all possible
e-textile parts. These tests are performed to give the idea of how they may be adopted for e-
textile reliability evaluation. Of course, the forces generated by test methods may react
differently from the combined effect when performed separately. However, a general trend
will be helpful to predict the overall behavior against the washing reliability. These alternate
General Conclusion
189
test methods can be used at different stages during the e-textile system development and on
separate components before installing them in the final e-textile system.
These approaches can help the electronic industry, mainly because these industries are
essential for e-textile system development, but they don’t have any standards for textile
behavior. We all use electronics products in our life, but we don’t wash them in the washing
machines. On the other side, products prepared for the e-textile systems should be washable
because e-textiles will ultimately be washed in the washing machine. Hence, the electronic
industry should have some guidelines to design e-textile components and test their reliability
at each step during the manufacturing process. In this way, they can integrate their products
into the textile without any fear of rejection in the market.
General Conclusion
190
191
6. Proposed recommendations for e-textile wearable based on the
experimental findings
Based on the research outcomes, some useful recommendations to develop testing methods
and proceed with the e-textile system reliability assessment are presented below.
Different e-textile system components will have different washing reliability
requirements. Each component should be treated separately for washing reliability and
the only e-textile system should be focused on reliability instead of the complete
wearable product.
Available washing test protocol may be adapted to the e-textile system after required
modification in them. For example, washing and tumbling temperature for these
systems should be reduced as compared to the normal textile clothing.
The e-textile systems can be washed in the available washing machine but the washing
program should be adjusted carefully. A short washing program does not always mean
less damaging and there is the possibility that long washing programs have very little
running time as compared to the short program. Similarly, it was observed that
tumbling speed is not damaging much on the e-textile systems.
It is possible to protect some components against washing damages with particular
treatments or an extra layer of protective coatings. The treatments should be adopted
separately for each component as there is the possibility that they can further damage
the product instead of protecting it. For example, TPU film attached to the
Proposed recommendations for e-textile wearable based on the experimental findings
192
transmission lines with the heated press may degrade the conductive coating from the
surface due to higher temperature.
E-textile reliability will depend on the product usage e.g., e-textile products being used
in the medical, military, or PPE will need a high level of reliability and so norms for
these products should according to their level. One possibility is to prepare the
reliability standards with some sub-classes to differentiate the different levels of
reliability. Maybe Class A reliability be reserved for military or medical standards and
so on.
Similarly, cheaper versions of these products can be developed with a lower reliability
class for customers who want to use them but don’t have the purchasing powers.
These classes can be mentioned on the products and people can use a different level of
reliability according to their requirements.
The e-textile products should also be divided based on the user requirements. For
example, maybe 50 washing cycles will be not enough for military-grade products but
it can be more than enough for some other category products. In this case, Class A
products for military usage will have a different level of reliability than Class A
products for sports or any other category. So, either these classes should be divided
into different sub-categories based on the usage or the required reliability level should
be reduced in the general category classes.
It is also possible that products used in the outer wearing need harsh washing cycles as
compared to the inner wears where mild washing cycles will be enough. Hence, they
will need a different level of reliability.
When we talk about washing reliability, this definition may be different for different
categories. This will directly be attached to the damage acceptance level. Products
related to sensitive categories will have a narrow margin of damage acceptance and
vice versa. For example, e-textile systems related to the medical fields may accept
damage level 5%, which means they need 95% samples working in the good condition
after approaching the required level of reliability. On the other side, if one product is
designed for the fashion or leisure industry, maybe they will consider it reliable if 80%
of samples are working after the required level of reliability.
If we go further in detail, there should also be the definition of working samples. For
example, if transmission lines are washed according to their reliability level, and
resistance is increased to 2-3 times but still it is conductive. For one product category,
Proposed recommendations for e-textile wearable based on the experimental findings
193
this increase can be acceptable and they can state it reliable but for the other category,
maybe their requirement is a maximum 1.5-time increase from original values and
hence they will not consider it reliable after certain washings.
Another question was raised in the experiments, which characteristics should be
considered important for reliability definitions.
Overall, it is very complex to develop standards and divide them into multiple sub-
categories. Some basic requirements should be included in the standards and others
should be discussed on a product-to-product basis and mutual agreement should be
prepared for stating the product reliability.
6.1 IPC-8981, Quality and reliability of e-textile wearable
IPC (International association of Printed Circuits), (www.ipc.org) is trade association working
on the standards especially in the electronic industry. It is well developed standard association
and currently standards covering almost all aspects of electronic industry is available under
IPC umbrella.
E-textile systems have major role of electronics and many electronic industries are willing to
take the opportunity for becoming the part of e-textile systems. However, lack of standards
causing the problems because electronic industries don not have in depth knowledge for
textiles and there should be some guideline for them to follow. IPC is leading this role to
develop some basic standards and definitions for e-textile systems. The aim of their work is to
give some pre-defined basic definitions related to e-textile systems and components related to
it. IPC is working to develop reliability standards focused on e-textile components so that
electronic industries can be integrated into e-textile systems without any hurdle.
The research outcomes are being applied for the development of the possibly first detailed
draft of standard “Quality and reliability of e-textile wearable” IPC-8981, by the IPC Europe
group (IPC D-75eu) chaired by Prof. Vladan Koncar (https://www.ipc.org/ipc-e-textiles-
initiative-join-effort). IPC D-75eu is joint effort from various research laboratories and
industries across the world to share their recommendations and expertise for the possible
standard development.
Group is working since January 2020 and an initial draft is planned to be developed by
December 2021. Some key details of this work are explained here. The discussion is divided
into 5 different tasks that have to be discussed for the preparation of the initial draft. Some
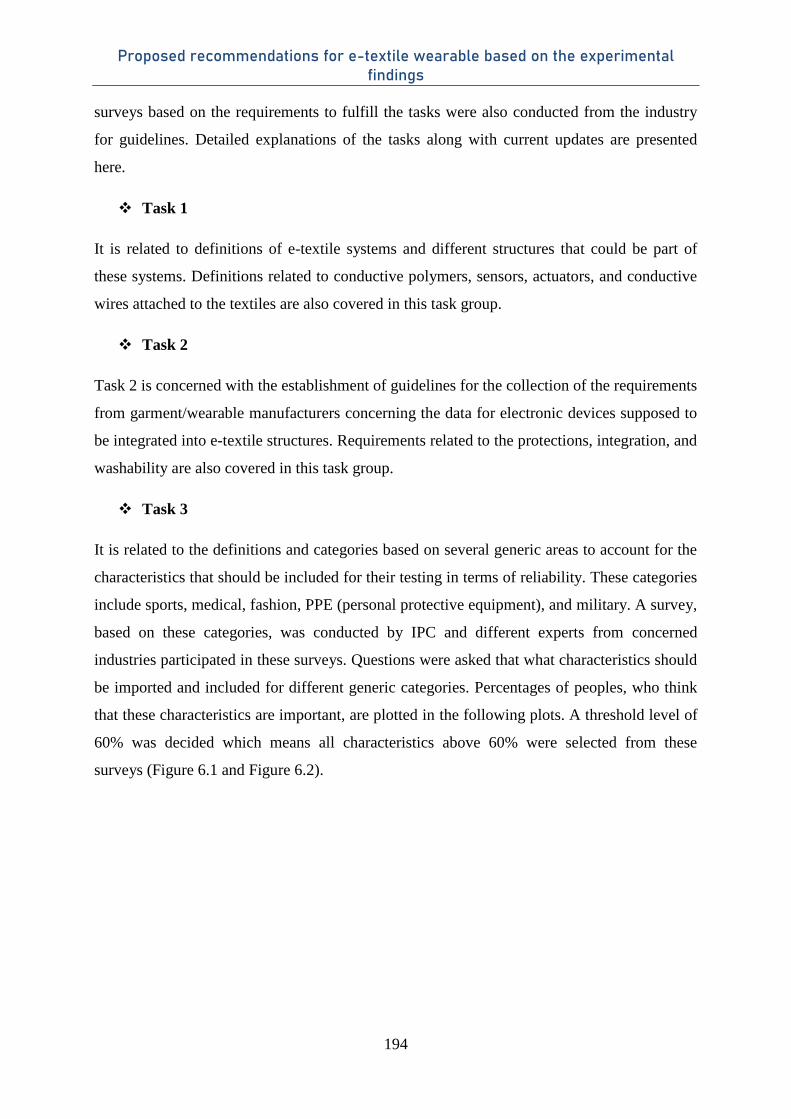
Proposed recommendations for e-textile wearable based on the experimental findings
194
surveys based on the requirements to fulfill the tasks were also conducted from the industry
for guidelines. Detailed explanations of the tasks along with current updates are presented
here.
Task 1
It is related to definitions of e-textile systems and different structures that could be part of
these systems. Definitions related to conductive polymers, sensors, actuators, and conductive
wires attached to the textiles are also covered in this task group.
Task 2
Task 2 is concerned with the establishment of guidelines for the collection of the requirements
from garment/wearable manufacturers concerning the data for electronic devices supposed to
be integrated into e-textile structures. Requirements related to the protections, integration, and
washability are also covered in this task group.
Task 3
It is related to the definitions and categories based on several generic areas to account for the
characteristics that should be included for their testing in terms of reliability. These categories
include sports, medical, fashion, PPE (personal protective equipment), and military. A survey,
based on these categories, was conducted by IPC and different experts from concerned
industries participated in these surveys. Questions were asked that what characteristics should
be imported and included for different generic categories. Percentages of peoples, who think
that these characteristics are important, are plotted in the following plots. A threshold level of
60% was decided which means all characteristics above 60% were selected from these
surveys (Figure 6.1 and Figure 6.2).
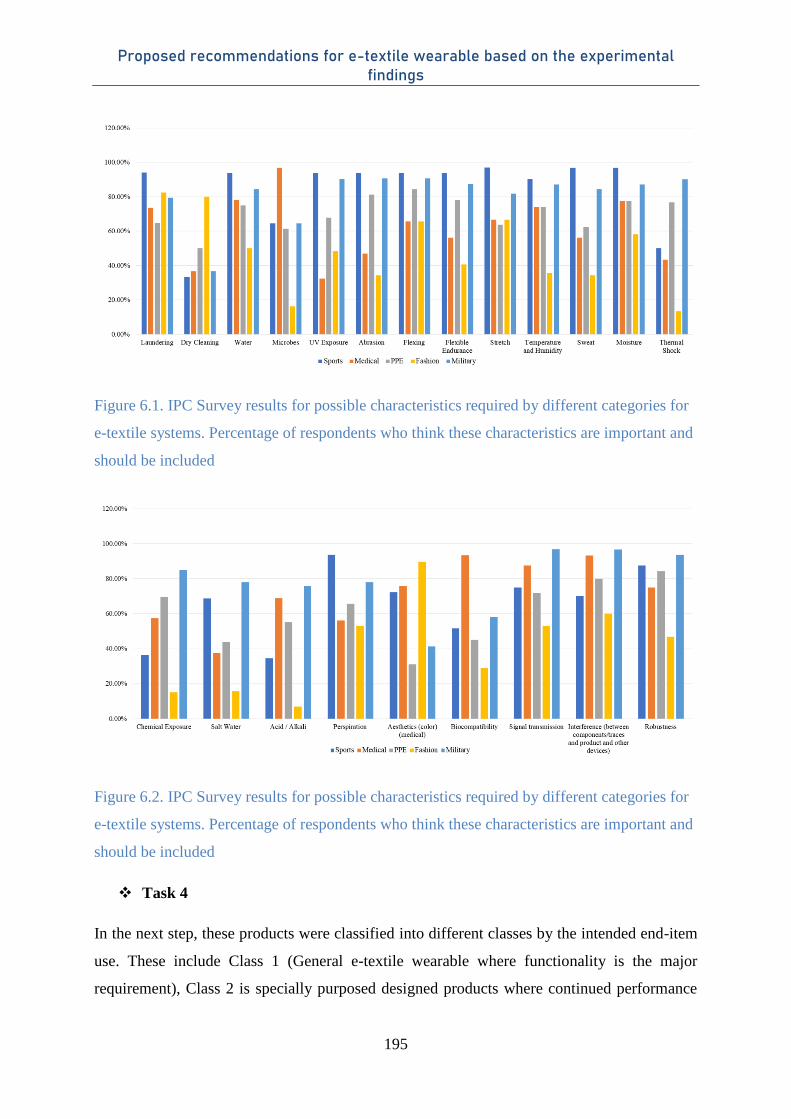
Proposed recommendations for e-textile wearable based on the experimental findings
195
Figure 6.1. IPC Survey results for possible characteristics required by different categories for
e-textile systems. Percentage of respondents who think these characteristics are important and
should be included
Figure 6.2. IPC Survey results for possible characteristics required by different categories for
e-textile systems. Percentage of respondents who think these characteristics are important and
should be included
Task 4
In the next step, these products were classified into different classes by the intended end-item
use. These include Class 1 (General e-textile wearable where functionality is the major
requirement), Class 2 is specially purposed designed products where continued performance
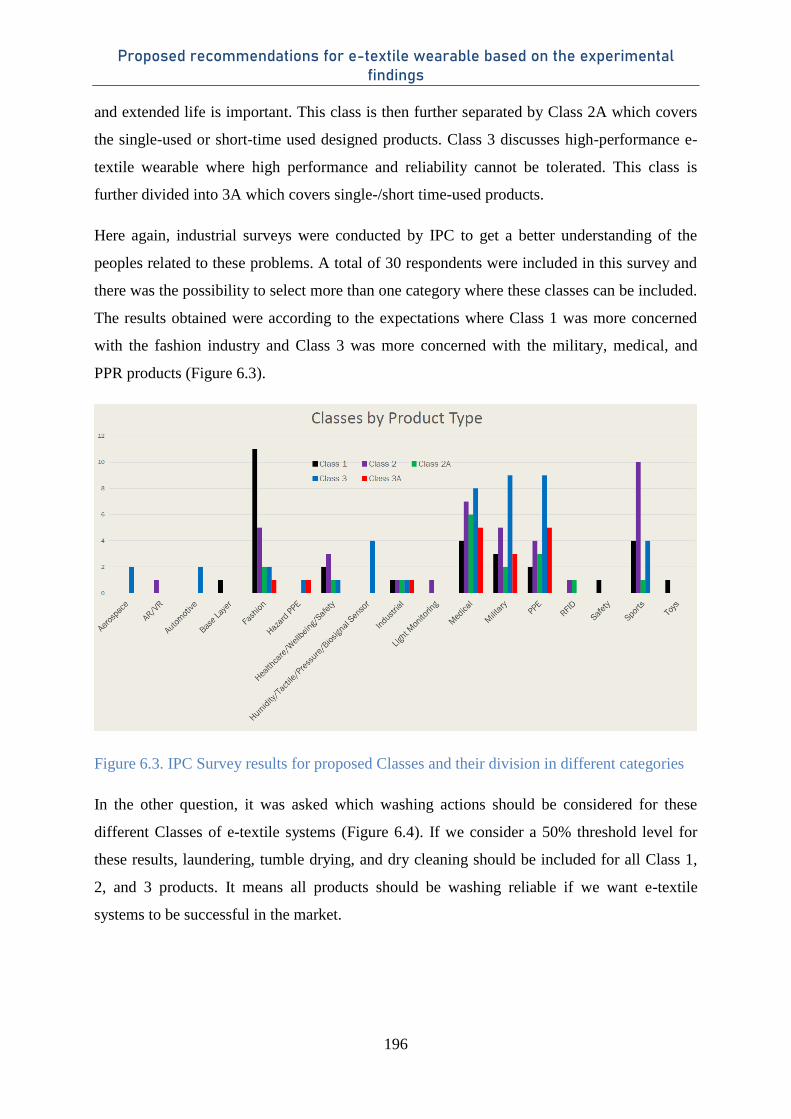
Proposed recommendations for e-textile wearable based on the experimental findings
196
and extended life is important. This class is then further separated by Class 2A which covers
the single-used or short-time used designed products. Class 3 discusses high-performance e-
textile wearable where high performance and reliability cannot be tolerated. This class is
further divided into 3A which covers single-/short time-used products.
Here again, industrial surveys were conducted by IPC to get a better understanding of the
peoples related to these problems. A total of 30 respondents were included in this survey and
there was the possibility to select more than one category where these classes can be included.
The results obtained were according to the expectations where Class 1 was more concerned
with the fashion industry and Class 3 was more concerned with the military, medical, and
PPR products (Figure 6.3).
Figure 6.3. IPC Survey results for proposed Classes and their division in different categories
In the other question, it was asked which washing actions should be considered for these
different Classes of e-textile systems (Figure 6.4). If we consider a 50% threshold level for
these results, laundering, tumble drying, and dry cleaning should be included for all Class 1,
2, and 3 products. It means all products should be washing reliable if we want e-textile
systems to be successful in the market.
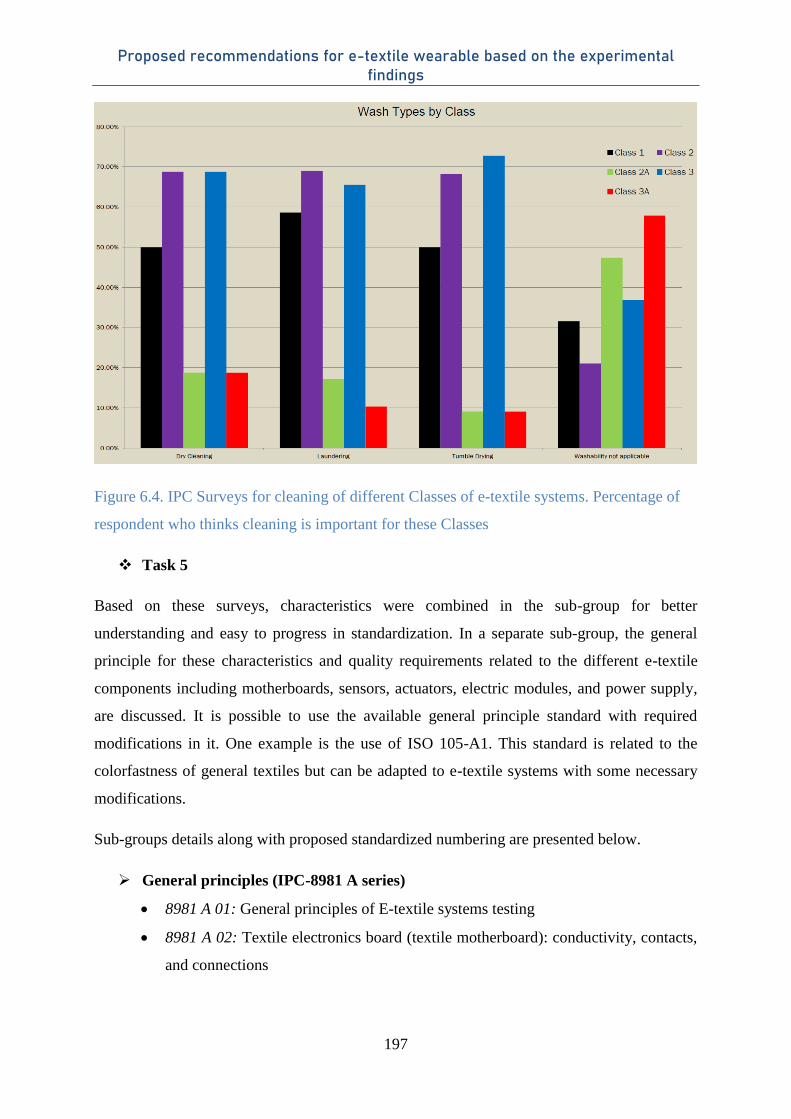
Proposed recommendations for e-textile wearable based on the experimental findings
197
Figure 6.4. IPC Surveys for cleaning of different Classes of e-textile systems. Percentage of
respondent who thinks cleaning is important for these Classes
Task 5
Based on these surveys, characteristics were combined in the sub-group for better
understanding and easy to progress in standardization. In a separate sub-group, the general
principle for these characteristics and quality requirements related to the different e-textile
components including motherboards, sensors, actuators, electric modules, and power supply,
are discussed. It is possible to use the available general principle standard with required
modifications in it. One example is the use of ISO 105-A1. This standard is related to the
colorfastness of general textiles but can be adapted to e-textile systems with some necessary
modifications.
Sub-groups details along with proposed standardized numbering are presented below.
General principles (IPC-8981 A series)
8981 A 01: General principles of E-textile systems testing
8981 A 02: Textile electronics board (textile motherboard): conductivity, contacts,
and connections
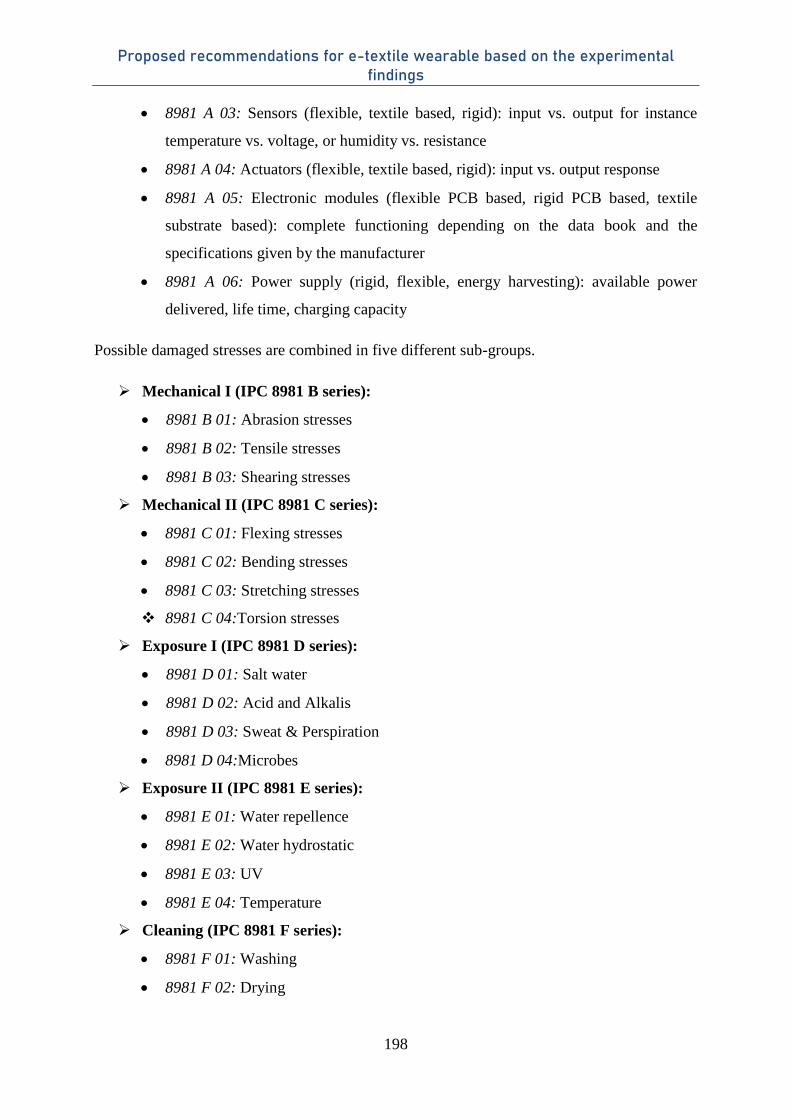
Proposed recommendations for e-textile wearable based on the experimental findings
198
8981 A 03: Sensors (flexible, textile based, rigid): input vs. output for instance
temperature vs. voltage, or humidity vs. resistance
8981 A 04: Actuators (flexible, textile based, rigid): input vs. output response
8981 A 05: Electronic modules (flexible PCB based, rigid PCB based, textile
substrate based): complete functioning depending on the data book and the
specifications given by the manufacturer
8981 A 06: Power supply (rigid, flexible, energy harvesting): available power
delivered, life time, charging capacity
Possible damaged stresses are combined in five different sub-groups.
Mechanical I (IPC 8981 B series):
8981 B 01: Abrasion stresses
8981 B 02: Tensile stresses
8981 B 03: Shearing stresses
Mechanical II (IPC 8981 C series):
8981 C 01: Flexing stresses
8981 C 02: Bending stresses
8981 C 03: Stretching stresses
8981 C 04:Torsion stresses
Exposure I (IPC 8981 D series):
8981 D 01: Salt water
8981 D 02: Acid and Alkalis
8981 D 03: Sweat & Perspiration
8981 D 04:Microbes
Exposure II (IPC 8981 E series):
8981 E 01: Water repellence
8981 E 02: Water hydrostatic
8981 E 03: UV
8981 E 04: Temperature
Cleaning (IPC 8981 F series):
8981 F 01: Washing
8981 F 02: Drying
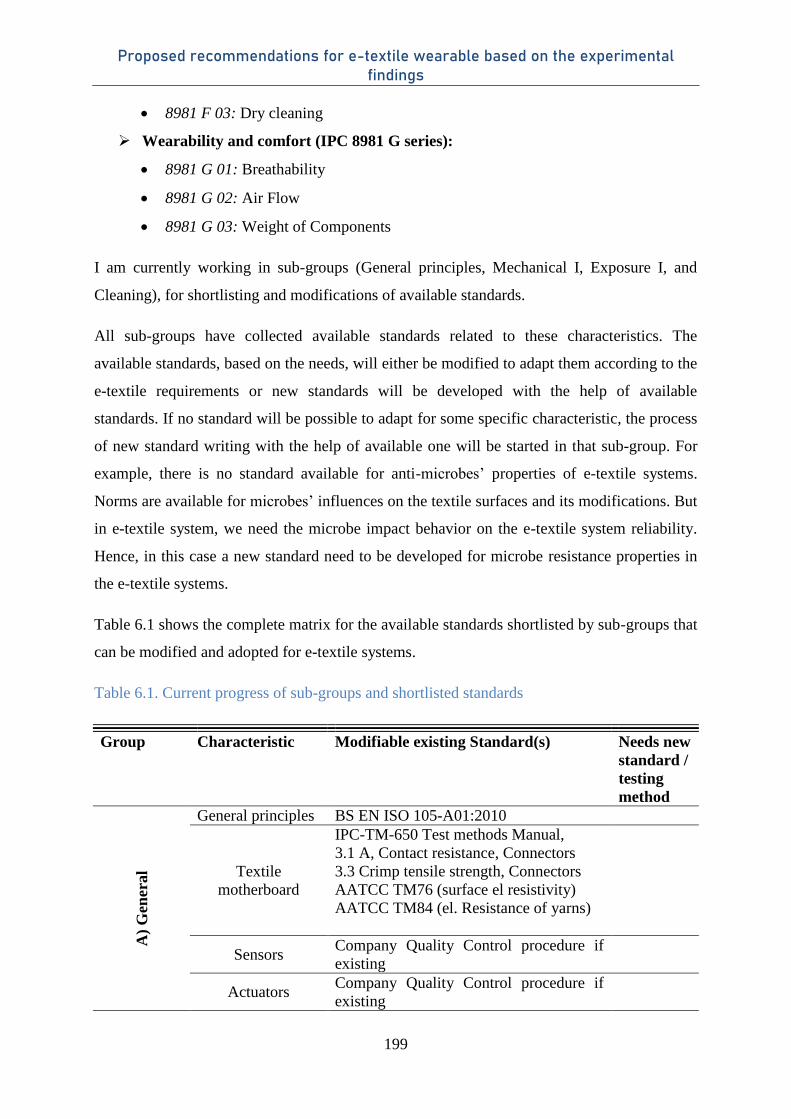
Proposed recommendations for e-textile wearable based on the experimental findings
199
8981 F 03: Dry cleaning
Wearability and comfort (IPC 8981 G series):
8981 G 01: Breathability
8981 G 02: Air Flow
8981 G 03: Weight of Components
I am currently working in sub-groups (General principles, Mechanical I, Exposure I, and
Cleaning), for shortlisting and modifications of available standards.
All sub-groups have collected available standards related to these characteristics. The
available standards, based on the needs, will either be modified to adapt them according to the
e-textile requirements or new standards will be developed with the help of available
standards. If no standard will be possible to adapt for some specific characteristic, the process
of new standard writing with the help of available one will be started in that sub-group. For
example, there is no standard available for anti-microbes’ properties of e-textile systems.
Norms are available for microbes’ influences on the textile surfaces and its modifications. But
in e-textile system, we need the microbe impact behavior on the e-textile system reliability.
Hence, in this case a new standard need to be developed for microbe resistance properties in
the e-textile systems.
Table 6.1 shows the complete matrix for the available standards shortlisted by sub-groups that
can be modified and adopted for e-textile systems.
Table 6.1. Current progress of sub-groups and shortlisted standards
Group Characteristic Modifiable existing Standard(s) Needs new
standard /
testing
method
A)
Gen
eral
General principles BS EN ISO 105-A01:2010
Textile
motherboard
IPC-TM-650 Test methods Manual,
3.1 A, Contact resistance, Connectors
3.3 Crimp tensile strength, Connectors
AATCC TM76 (surface el resistivity)
AATCC TM84 (el. Resistance of yarns)
Sensors Company Quality Control procedure if
existing
Actuators Company Quality Control procedure if
existing
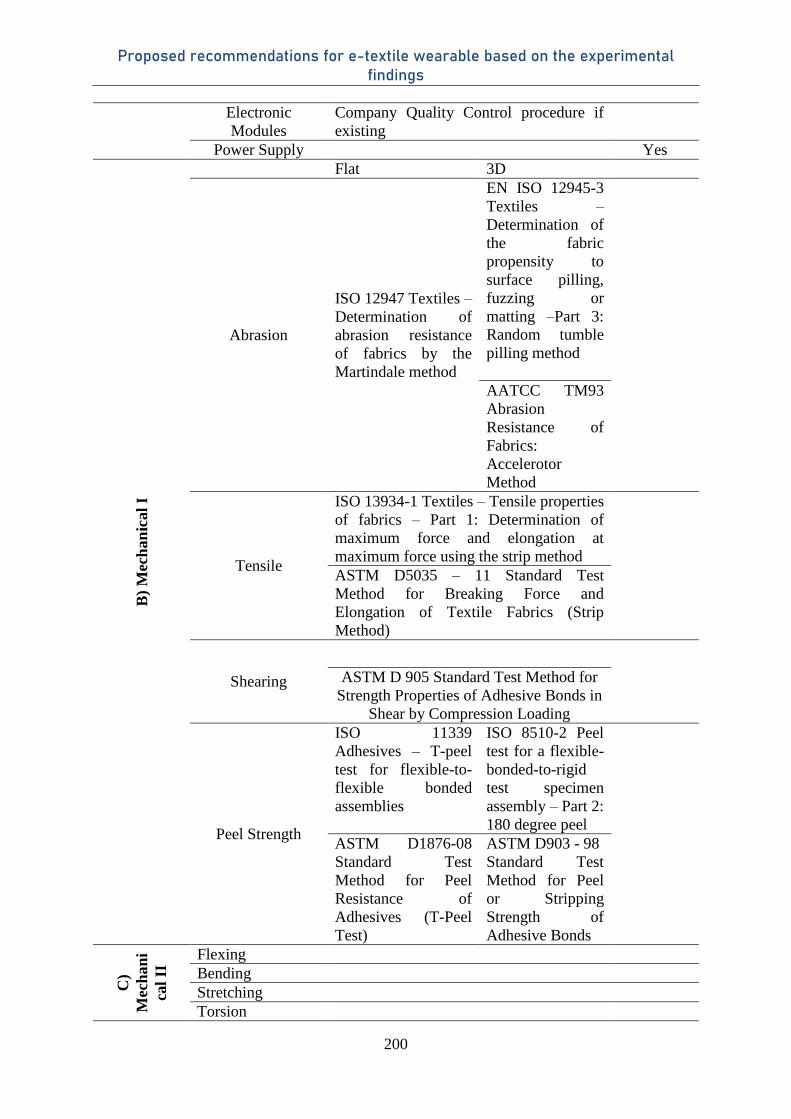
Proposed recommendations for e-textile wearable based on the experimental findings
200
Electronic
Modules
Company Quality Control procedure if
existing
Power Supply Yes B
) M
ech
an
ical
I
Flat 3D
Abrasion
ISO 12947 Textiles –
Determination of
abrasion resistance
of fabrics by the
Martindale method
EN ISO 12945-3
Textiles –
Determination of
the fabric
propensity to
surface pilling,
fuzzing or
matting –Part 3:
Random tumble
pilling method
AATCC TM93
Abrasion
Resistance of
Fabrics:
Accelerotor
Method
Tensile
ISO 13934-1 Textiles – Tensile properties
of fabrics – Part 1: Determination of
maximum force and elongation at
maximum force using the strip method
ASTM D5035 – 11 Standard Test
Method for Breaking Force and
Elongation of Textile Fabrics (Strip
Method)
Shearing
ASTM D 905 Standard Test Method for
Strength Properties of Adhesive Bonds in
Shear by Compression Loading
Peel Strength
ISO 11339
Adhesives – T-peel
test for flexible-to-
flexible bonded
assemblies
ISO 8510-2 Peel
test for a flexible-
bonded-to-rigid
test specimen
assembly – Part 2:
180 degree peel
ASTM D1876-08
Standard Test
Method for Peel
Resistance of
Adhesives (T-Peel
Test)
ASTM D903 - 98
Standard Test
Method for Peel
or Stripping
Strength of
Adhesive Bonds
C)
Mec
han
i
cal
II Flexing
Bending
Stretching
Torsion
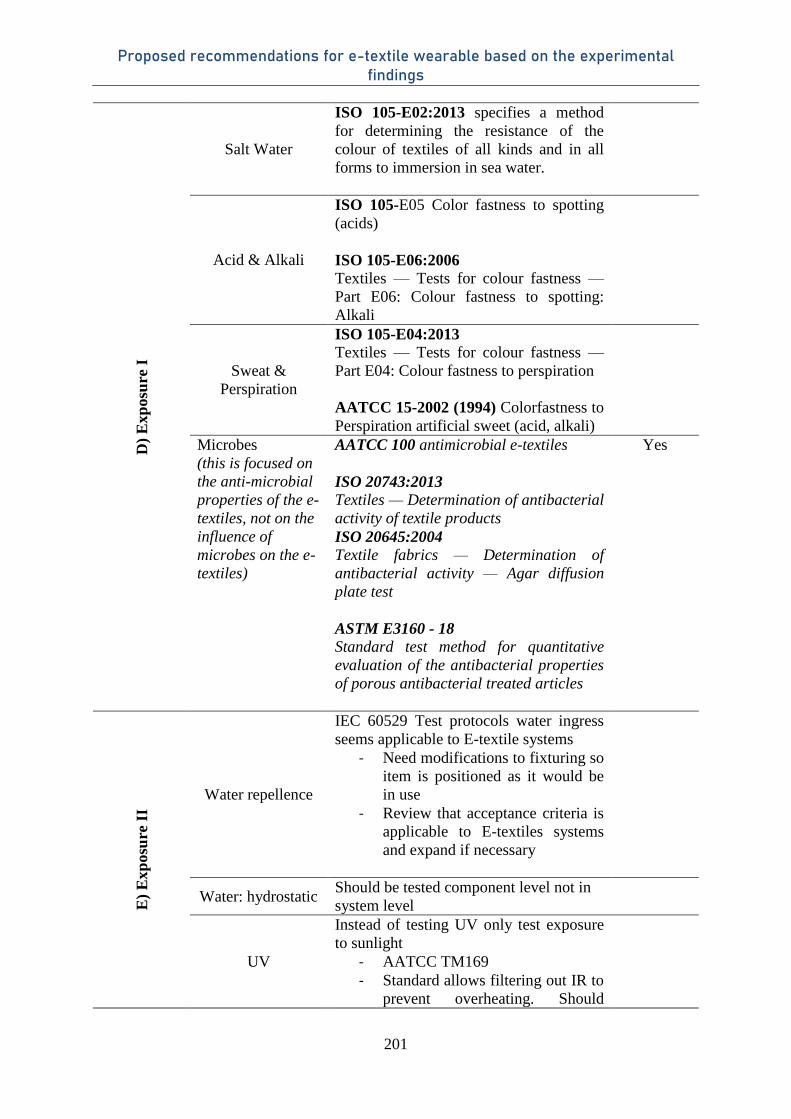
Proposed recommendations for e-textile wearable based on the experimental findings
201
D)
Exp
osu
re I
Salt Water
ISO 105-E02:2013 specifies a method
for determining the resistance of the
colour of textiles of all kinds and in all
forms to immersion in sea water.
Acid & Alkali
ISO 105-E05 Color fastness to spotting
(acids)
ISO 105-E06:2006
Textiles — Tests for colour fastness —
Part E06: Colour fastness to spotting:
Alkali
Sweat &
Perspiration
ISO 105-E04:2013
Textiles — Tests for colour fastness —
Part E04: Colour fastness to perspiration
AATCC 15-2002 (1994) Colorfastness to
Perspiration artificial sweet (acid, alkali)
Microbes
(this is focused on
the anti-microbial
properties of the e-
textiles, not on the
influence of
microbes on the e-
textiles)
AATCC 100 antimicrobial e-textiles
ISO 20743:2013
Textiles — Determination of antibacterial
activity of textile products
ISO 20645:2004
Textile fabrics — Determination of
antibacterial activity — Agar diffusion
plate test
ASTM E3160 - 18
Standard test method for quantitative
evaluation of the antibacterial properties
of porous antibacterial treated articles
Yes
E)
Exp
osu
re I
I
Water repellence
IEC 60529 Test protocols water ingress
seems applicable to E-textile systems
- Need modifications to fixturing so
item is positioned as it would be
in use
- Review that acceptance criteria is
applicable to E-textiles systems
and expand if necessary
Water: hydrostatic Should be tested component level not in
system level
UV
Instead of testing UV only test exposure
to sunlight
- AATCC TM169
- Standard allows filtering out IR to
prevent overheating. Should
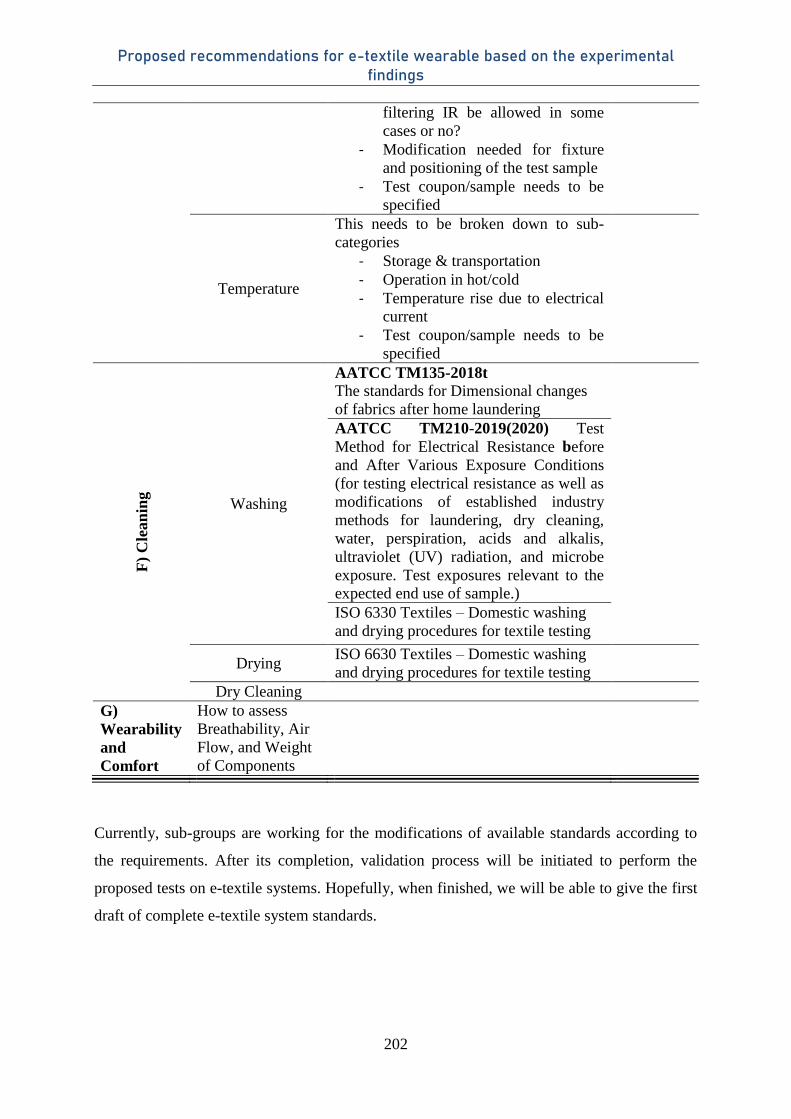
Proposed recommendations for e-textile wearable based on the experimental findings
202
filtering IR be allowed in some
cases or no?
- Modification needed for fixture
and positioning of the test sample
- Test coupon/sample needs to be
specified
Temperature
This needs to be broken down to sub-
categories
- Storage & transportation
- Operation in hot/cold
- Temperature rise due to electrical
current
- Test coupon/sample needs to be
specified
F)
Cle
an
ing
Washing
AATCC TM135-2018t The standards for Dimensional changes
of fabrics after home laundering
AATCC TM210-2019(2020) Test
Method for Electrical Resistance before
and After Various Exposure Conditions
(for testing electrical resistance as well as
modifications of established industry
methods for laundering, dry cleaning,
water, perspiration, acids and alkalis,
ultraviolet (UV) radiation, and microbe
exposure. Test exposures relevant to the
expected end use of sample.)
ISO 6330 Textiles – Domestic washing
and drying procedures for textile testing
Drying ISO 6630 Textiles – Domestic washing
and drying procedures for textile testing
Dry Cleaning
G)
Wearability
and
Comfort
How to assess
Breathability, Air
Flow, and Weight
of Components
Currently, sub-groups are working for the modifications of available standards according to
the requirements. After its completion, validation process will be initiated to perform the
proposed tests on e-textile systems. Hopefully, when finished, we will be able to give the first
draft of complete e-textile system standards.


Résumé
Nous vivons une époque où la modernisation et la numérisation se développent rapidement.
Les entreprises attirent leurs clients grâce à des techniques nouvelles et des gammes de
produits personnalisés. Cette concurrence a favorisé le développement de secteurs nouveaux
et hybrides pour améliorer la satisfaction des clients. Au cours des dernières décennies, de
nouveaux produits, impossibles à imaginer dans le passé, ont emargé. En même temps,
l'utilisation des vêtements a suivi l'évolution de l’humanité, depuis son apparition. Le concept
de vêtement a débuté par le remplacement des feuilles utilisées pour couvrir certaines parties
du corps. Aujourd'hui, ces vêtements sont beaucoup mieux adaptés à l'utilisateur et sont
utilisés dans divers domaines, tels que la médecine, le sport, l'armée et différents projets liés à
la défense. Ces nouveaux vêtements, avec des fonctions additionnelles, ont complètement
changé la façon d'utiliser et de développer des textiles et c'est la raison pour laquelle le textile
n'est plus une industrie indépendante, mais un mélange de différentes industries travaillant
ensemble sous réserve des fonctionnalités intégrées définies par l'utilisateur. Les textiles
polyvalents et à fonctionnalités améliorées peuvent contenir un ou plusieurs composants
intelligents, textiles ou non textiles, tissés, brodés, cousus, intégrés ou attachés à l'aide de
différentes techniques disponibles. En fonction des besoins, ces composants sont des capteurs,
des actionneurs et des antennes, des unités de traitement, des dispositifs de collecte d'énergie
et de transmission de puissance. Ces textiles portables avancés sont appelés textiles
intelligents, électronique portable, e-textiles, vêtements intelligents, textroniques, etc.
Pour progresser dans cette nouvelle partie immergée de l'industrie textile, il est important de
comprendre les exigences et les problèmes liés à cette approche hybride. Les textiles
intelligents sont constitués de composants provenant principalement des industries textile et
électronique. Ces deux industries sont bien développées et disposent déjà de normes et de
standards liés à chaque problème. Cependant, ces normes ne peuvent pas être appliquées aux
systèmes e-textiles tels quels et une modification, ou le développement de nouvelles normes,
est nécessaire pour rendre ces e-textiles fiables et acceptables pour les clients.
Cette thèse de doctorat est consacrée à l’étude et à la mise en évidence des difficultés
auxquelles le marché des textiles électroniques est confronté en termes de fiabilité et de
lavabilité. Les différentes options de lavage disponibles sont analysées avec la mise en
évidence des différences entre elles, afin de mieux comprendre comment sélectionner l'option
de lavage la plus appropriée pour les systèmes e-textiles. Un accéléromètre a également été
utilisé pour des analyses de contraintes dans le tambour de machine à laver pour de mettre en
évidence les protocoles de tests mécaniques standardisés disponibles qui peuvent être utilisés
comme simulation de dommages équivalents, sans le processus de lavage. Différents
composants des e-textiles, y compris les composants détachables et les composants fixes, sont
étudiés séparément pour déterminer les contraintes de lavage sur chacun de ces composants en
termes de fonctionnalité. Enfin, un modèle de simulation a été proposé pouvant être utilisé
pour identifier les dommages causés par le lavage et les prévisions de fiabilité, sans avoir à
laver les systèmes e-textiles. Les protocoles standards requis pour leur adaptabilité chez les
clients sont discutés et la modification des normes actuelles ainsi que les modifications
nécessaires sont présentés dans cette étude.
Mots clés : Textiles intelligents, Composants électroniques, Normalisation, Nettoyage,
Fiabilité
Abstract
We live in an era where modernization and digitalization are increasing rapidly, and industries
attract their customers with novel techniques and customized product ranges. This
competition increased the development of new and hybrid fields for customers satisfactions.
In recent decades we have a lot of modern innovative notations that ancient peoples can’t
even imagine. Similarly, textiles usage, especially as the wearing element, has a vast history
in human evolution since ancient times. The wearing cloth concept started as the replacement
of leaf used for covering body parts, but now day’s textile wearable have multiple included
options along with wearing requirements. Nowadays these user-defined textile wearable are
being used in diverse fields ranging from medical, sports, military, and different defense-
related projects. These new add-ons completely changed the way to use and develop wearable
textiles. That’s why now textile has not remained an independent industry but a mixture of
different sectors working together subject to the integrated user-defined functionalities.
Multipurpose and improved functionality textiles may comprise one or several textile or non-
textile smart components that were weaved, embroidered, sewed, integrated, or attached using
different available techniques. Based on requirements, these components can include sensors,
actuators, and antennas, processing units, energy harvesting, and power transmitting devices.
These advanced wearable textiles are usually named smart textiles, wearable electronics, e-
textiles, smart clothing, textronic, etc.
It is essential to understand the requirements and problems related to this hybrid industry if
we want to progress in this new immerging part of the textile industry. The electronic textile
consists the components mainly from the textile and electronic industry. Both sectors are
well-developed and already have norms and standards related to each problem. But these
standards can’t be applied to the e-textile systems as it is, and modification in these standards
or development of new standards is required to make these e-textile products reliable and
acceptable for customers.
This research is planned to investigate and highlight the difficulties the e-textile market faces
in terms of reliability and washability. Different available washing options were studied to
highlight the differences among them and understand the most suitable washing option for e-
textile systems. The accelerometer device was used for stress analyses in the washing drum to
highlight the available mechanical standardized test protocols that can be used as the
simulation of equivalent damages without the washing process. Different e-textile

components, including detachable and permanently fixed ones, are investigated for the
washing stresses separately in terms of their functionality. Finally, a simulation model was
proposed that can be exercised for wash damages and reliability predictions without actually
washing the e-textile systems. Standard protocols required for their customers' adaptability are
discussed, and necessary additions are presented in this study.
Keywords: Smart textiles, E-textile, Washing, Characterization, Standardization
Related Documents