504 The Determination of the Specific Heat of Gases at High Temperatures by the Sound Velocity Method II—Carbon Dioxide By G. G. S herratt and E zer G riffiths, F.R.S., Physics Department, National Physical Laboratory ( R e c e i v e d2 1 April, 1936) I ntroduction In a previous paper* an account was given of experiments to determine the specific heats of carbon monoxide up to a temperature of 1800° C. by the sound velocity method. The principle of the method employed was the setting up in a heated tube of a stationary train of sound waves; the source of the wave system being a quartz crystal vibrating piezo-electrically at a known frequency. A movable reflector traversed the tube and the half wave-lengths were determined by recording the distance moved through by the piston from one resonance point to the next. These points could be determined with considerable accuracy since the plate current of the oscillator operating the crystal had a sharply defined maximum at resonance. Two frequencies were employed and it was found that the velocity of sound was not independent of frequency, so that a correction to reduce the observed velocities to correspond to zero frequency was necessary before true specific heats could be evaluated. The correction was made on the basis of a theory proposed by Kneser which explained the variation of sound velocity with frequency in terms of the time lag in the transfer of energy between the vibrational and the other energy states of a molecule. As a continuation of this work on carbon monoxide it was decided to attempt the determination of the specific heat of carbon dioxide by the same method. Several modifications were introduced in the apparatus. Provision was made for the production of six different frequencies instead of the two hitherto employed. The carbon tube was replaced by a tube of “ pythagoras ” partly on account of the reaction which takes place between carbon dioxide and heated carbon and partly because a high degree of gas-tightness was desirable in the tube containing the gas* under test. The use of a refractory oxide tube set an upper limit to the maximum * Sherratt and Griffiths, ‘ Proc. Roy. Soc.,’ A, vol. 147, p. 292 (1934). on June 18, 2018 http://rspa.royalsocietypublishing.org/ Downloaded from

Welcome message from author
This document is posted to help you gain knowledge. Please leave a comment to let me know what you think about it! Share it to your friends and learn new things together.
Transcript

504
The Determination of the Specific Heat of Gases at High Temperatures by the Sound Velocity Method
II—Carbon Dioxide
By G. G. Sherratt and Ezer G riffiths, F.R.S., Physics Department,National Physical Laboratory
(Received21 April, 1936)
Introduction
In a previous paper* an account was given of experiments to determine the specific heats of carbon monoxide up to a temperature of 1800° C. by the sound velocity method.
The principle of the method employed was the setting up in a heated tube of a stationary train of sound w aves; the source of the wave system being a quartz crystal vibrating piezo-electrically a t a known frequency.
A movable reflector traversed the tube and the half wave-lengths were determined by recording the distance moved through by the piston from one resonance point to the next. These points could be determined with considerable accuracy since the plate current o f the oscillator operating the crystal had a sharply defined maximum at resonance.
Two frequencies were employed and it was found that the velocity of sound was not independent of frequency, so that a correction to reduce the observed velocities to correspond to zero frequency was necessary before true specific heats could be evaluated. The correction was made on the basis of a theory proposed by Kneser which explained the variation o f sound velocity with frequency in terms of the time lag in the transfer of energy between the vibrational and the other energy states of a molecule.
As a continuation of this work on carbon monoxide it was decided to attempt the determination of the specific heat of carbon dioxide by the same method. Several modifications were introduced in the apparatus. Provision was made for the production of six different frequencies instead of the two hitherto employed. The carbon tube was replaced by a tube of “ pythagoras ” partly on account of the reaction which takes place between carbon dioxide and heated carbon and partly because a high degree of gas-tightness was desirable in the tube containing the gas* under test. The use of a refractory oxide tube set an upper limit to the maximum
* Sherratt and Griffiths, ‘ Proc. Roy. Soc.,’ A, vol. 147, p. 292 (1934).
on June 18, 2018http://rspa.royalsocietypublishing.org/Downloaded from

505
temperature attainable; this was not a serious disadvantage with carbon dioxide as measurements on this gas at temperatures much above 1000° C. would have been impracticable on account of dissociation.
The Specific Heat o f Gases
F ixed p la tec a r r y in g s c a le
Thermocouple
E bon ite p la te
P in io n
R a c kColumns su pportin g f ix e d p la te
V ernier
Therm ocouples p ir a l
P la t in u mth erm ocou p le le a d s
Copper b lock •"
actin g as cola ju n ctio n
F le x ib le ^ m e ta l tu b in gS tee l tu b e
R eflector W ood s m e ta l
F u rn ace tu b e
D escription of A pparatus
The furnace consists of a tube of pythagoras of 1 • 5 cm. internal diameter and 130 cm. in length wound with nichrome tape. The lower end is held rigidly whilst the upper end is soldered by a fusible metal joint to an extension tube with corrugated walls giving flexibility for expansion with temperature (see fig. 1). The corrugated tube is soldered to a rectangular
on June 18, 2018http://rspa.royalsocietypublishing.org/Downloaded from

506 G. G. Sherratt and E. Griffiths
brass tube with a glass front and this tube is rigidly supported by the framework carrying the furnace. Close to the glass front is a graduated scale over which travels a vernier attached to the end of the piston rod carrying the reflector.
The movement of the latter is effected by a rack and pinion, the pinion being operated through an accurately made cone jo in t to ensure gas- tightness. A section through this portion of the apparatus is shown in fig. 2.
The piston rod and reflector consist of a pythagoras tube, the lower end of which is closed and enlarged to form a disc. The diameter of the disc is slightly less than the bore of the furnace tube in order to allow of easy movement.
Fixed p la te and. sca le
W in dow
Vernier
Cone j o i n t
Thermocouple sp ira l
Column su p p o rtin gf ix e d p l a t e
Fig. 2.
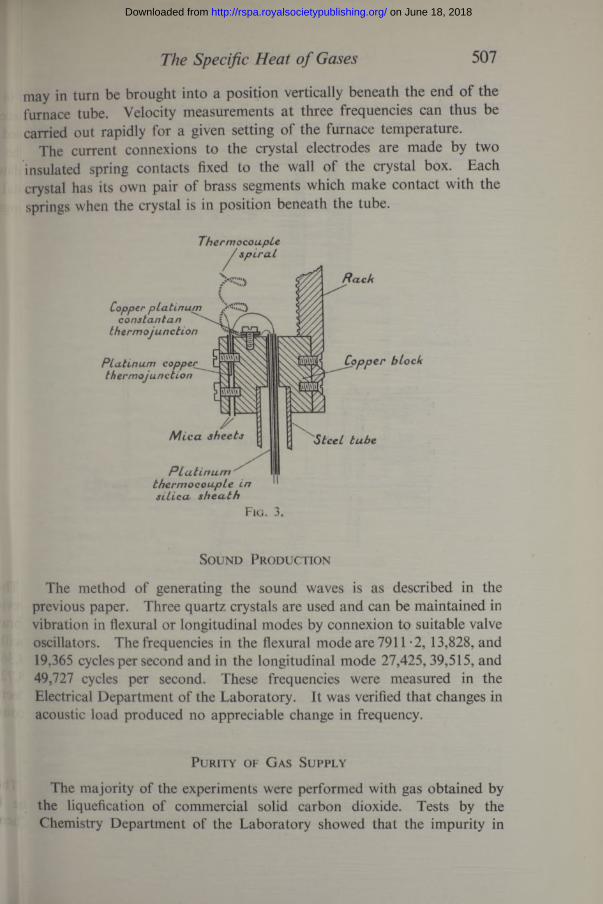
Temperature measurement is by means of a platinum-platinum rhodium thermocouple, the hot junction being situated close to the reflecting face of the piston. A copper block attached to the end of the tube carrying the reflector serves as a cold junc tion : the temperature of this block being measured by means of a copper-constantan thermocouple. The construction will be evident from fig. 3 which gives an enlarged view of the cold junction arrangement. The three thermo-element wires are supported on the spirals of a spring, one end of which is attached to the cold junction block and the other to the top of the enclosure. The wires are taken out of the apparatus through small holes in an ebonite plate in which they are sealed with wax.
The lower end of the furnace tube is shown in fig. 4, together with the box containing the quartz crystals. A gas-tight joint between the pythagoras tube and box is ensured by the use of W ood’s metal. A feature of the crystal box is an accurately made cone joint by means of which a disc supporting three quartz crystals* can be rotated so that the crystals
* One of which is shown.
on June 18, 2018http://rspa.royalsocietypublishing.org/Downloaded from
507The Specific Heat o f Gases
may in turn be brought into a position vertically beneath the end of the furnace tube. Velocity measurements at three frequencies can thus be carried out rapidly for a given setting of the furnace temperature.
The current connexions to the crystal electrodes are made by two insulated spring contacts fixed to the wall of the crystal box. Each crystal has its own pair of brass segments which make contact with the springs when the crystal is in position beneath the tube.
Thermocouple ^ s p ir a l
Copper p la tinum constantan "
thermojunction
Platinum copper ̂thermojunction
M ic a sh eets
R a ck
Copper block
S tee l tu be
P la t in u m ' therm ocouple in 11 s i l ic a sh e a th
Fig. 3.
Sound Production
The method of generating the sound waves is as described in the previous paper. Three quartz crystals are used and can be maintained in vibration in flexural or longitudinal modes by connexion to suitable valve oscillators. The frequencies in the flexural mode are 7911 -2, 13,828, and 19,365 cycles per second and in the longitudinal mode 27,425, 39,515, and 49,727 cycles per second. These frequencies were measured in the Electrical Department of the Laboratory. It was verified that changes in acoustic load produced no appreciable change in frequency.
Purity of Gas Supply
The majority of the experiments were performed with gas obtained by the liquefication of commercial solid carbon dioxide. Tests by the Chemistry Department of the Laboratory showed that the impurity in
on June 18, 2018http://rspa.royalsocietypublishing.org/Downloaded from

508 G. G. Sherratt and E. Griffiths
the gas from the liquefier consisted mainly of oxygen and nitrogen and amounted to 1 part in 6000 parts of carbon dioxide by volume.
The remainder of the experiments were carried out on carbon dioxide
Fig. 4.
generated in a K ipp’s apparatus charged with pure marble and dilute hydrochloric acid.
N o difference could be detected between the results of the sound velocity measurements in the two sets of experiments.
on June 18, 2018http://rspa.royalsocietypublishing.org/Downloaded from

509The Specific Heat o f Gases
Experimental D ata
The results obtained at the two lower frequencies are presented in Table 1. The tube velocity is given in metres per second together with the mean temperature of the region over which the measurements weremade.
Table 1Frequency 7911-2 cycles/sec. Frequency 13828 cycles/sec.
Temperature Velocity Temperature Velocity°c. m./sec. °C. m./sec.
14-2 264-6 14-4 264-02 0 0 267-4 18-4 265-922-3 266-5 22-3 266-390-2 293-3 91 -3 293-491 *3 294-0 92-0 295-4
230 343-3 231-5 339-5233 338-8 233 341-6244 345-7 400 390-4394 386-5 586 437-9403 388-7 657 455-2593 438-6 659 454-0607 440-1 661 454-7659 451-6 771 481-2662 456-6 773 478-2666 454-1 914 508-9763 475-0 941 513-4767 475-2 1021 530-7882 502-7 1032 532-1914 509-5923 507-9
1012 526-31020 530-51037 534-0
It was found that the absorption of sound in carbon dioxide increases so considerably with frequency that it was only with difficulty that measurements were made at a frequency of 19 kilocycles per second, and then only when experimental conditions were at their best, i.e., when the galvanometer deflexion was exceptionally steady. However, some reliable results were obtained at this frequency and they are given in Table II. Also included are the free-space velocities derived as described later.
Measurements at the three highest frequencies proved to be impossible, the sound absorption being sufficiently great to prevent any change in galvanometer deflexion as the reflector was moved along the tube. This
on June 18, 2018http://rspa.royalsocietypublishing.org/Downloaded from

510 G. G. Sherratt and E. Griffiths
question of absorption is discussed at greater length in a subsequent paragraph.
Returning to the results given in Table I, the velocities there tabulated were measured in a tube, and therefore show a diminution from the free- space velocities. The correction which it is necessary to apply to the
T able IIFrequency 19,365 cycles/sec.
Temperature Tube velocity Free-space velocity°C. m./sec. m./sec.150 265-3 265-623*1 267-0 267-391-3 294-0 294-5
241 347-6 348-5399 387-3 388-7660 454-6. 457-0914 509-9 513-3
tabulated velocities in order to obtain free-space velocities was described in detail in the previous paper* and takes the form
V = V 0 (1 — *! c),
where V and V 0 are the tube and free space velocities respectively, Ay is a constant for a given tube and frequency and must be determined by experiment, and c is the Kirchhoff constant. The latter constant is characteristic of the gas in the tube and the values of the viscosity, density, and thermal conductivity required in its evaluation were taken from the International Critical Tables.
The values of Ay for the two lower frequencies were derived from experiments on the velocity of sound in dry air free from CO a. They are respectively = 0 0045 and Ay = 0-0034. The value of Ay at 19,365 cycles per second can be derived from these in virtue of the fact that Ay is inversely proportional to the square root of the frequency. The free- space velocities in Table II are accordingly based on a value of 0 -0029 for Ay.
Tables III and IV contain the smoothed values of the tube-velocity V at the two lower frequencies at intervals of 200° C., together with the corrections required to give free-space velocities V0.
It will be seen that the agreement between the results at the two frequencies is good and that there is no evidence of dispersion.
* Loc. cit.
on June 18, 2018http://rspa.royalsocietypublishing.org/Downloaded from

The mean values of the free-space velocities at the two lower frequencies ire given in Table V. Also included is the correction necessary to take account of the expansion of the piston rod carrying the reflector. The coefficient of linear expansion of pythagoras is given by the manufacturers
The Specific Heat o f Gases 511
as 3-5 X 10-6.J J ATable III
Frequency 7911 -2 cycles/sec. k ± = 0-0045Temperature V
°C. m./sec. k\C X 104 V&iC Vo0 258-3 16 0-4 258-7
200 330-5 26 0-9 331-4400 388-3 35 1-4 389-7600 439-2 43 1-9 441-1800 484-2 50 2*4 486-6
1000 526-3 57 3-0 529-3
T able IV
Frequency 13,828 cycles/sec. k ± = 0-0034Temperature V
°C. m./sec. kxc x 104 Vkxc Vo0 257-6 12 0-3 257-9
200 330-5 20 0-7 331-2400 389-3 26 1-0 390-3600 440-3 32 1-4 441-7800 485-9 38 1-8 487-7
1000 526-1 43 2-3 528-4
The values of velocity given in the last column are final values and need no further correction as the effect of the impurities in the carbon dioxide is negligible. They are graphed in fig. 5 and for the purpose of demonstrating the absence of appreciable dispersion even at 19 kilocycles per second, we have also shown in the same graph the free-space velocities of that frequency taken from Table II.
T able V
Temperature Mean V0Correction for expansion of V0 corrected
°C. m./sec. reflector m./sec.0 258-3 0 258-3
200 331-3 0-2 331-5400 390-0 0-5 390-5600 441-4 0-9 442*3800 487*2 1-4 488*6
1000 528*8 1*8 530-6
on June 18, 2018http://rspa.royalsocietypublishing.org/Downloaded from

512 G. G. Sherratt and E. Griffiths
The velocity of sound is connected with y, the ratio of the specific heats by the formula
V2 = — v2y ( •
The Beattie-Bridgeman equation o f state* has been used for the evaluation of v2 (dpi dv)T.
The equation isP = R T ( l - ^ , 3) ( i + | » - M ) - A 0 l
V2
600
200 400 600 800 1000
Temperature ° C.mean of free-space velocities at 791T 2 and 13828 cycles/sec.;Fig. 5—
+ free-space velocity at 19365 cycles/sec.
For carbon dioxide R = 0-08206, A 0 = 5-0065, a — 0-07132, B0 = 0-10476, b = 0-07235, and c = 66-00 xl O4 when the pressure is expressed in atmospheres and the volume in litres/gm. mol.
The resulting values o f y are given in Table VI, together with the values of Cv derived therefrom.
For comparison with these values of C„ the data for C„ given in the International Critical Tables have been takenf and the corresponding
* ‘ Proc. Amer. Acad. Sci.,’ vol. 63, p. 229 (1928-29).Cp =* 36-33, 40-18, 43-82, 46-60, 49-01, 50-89 Joules/gm. mol. at the above
temperatures, ‘ I.C.T.,’ vol. 5, p. 83.
on June 18, 2018http://rspa.royalsocietypublishing.org/Downloaded from

The Specific Heat o f Gases 513
%’s are quoted in column three of Table VII. It will be seen that the liscrepancy between the values obtained in the present investigation and hose quoted in the I.C.T. is of the order of 15%.
A comparison can also be made with specific heats calculated from pectroscopic data. The vibrational specific heat is given by
vhere T is the absolute temperature and 0X, 02, and 03 are the character- stic temperatures of the gas.
TemperatureTable VI
Velocity Y C„°C. m./sec. cals./gm. mol.
0 258*3 1*310 6*62200 331*5 1*231 8*65400 390*5 1*198 1006600 442*3 1*184 10-81800 488*6 1*176 11*30
1000 530*6 1*169 11*76
E (x) represents the Planck-Einstein function, given by
E (x) = xV(e* - 1 ) 2 ‘
The characteristic temperatures are derived from the infra-red and Raman spectra and are given by
0 i — . -jr» e t c ->
where vx, v2, and v3 are the three fundamental oscillation frequencies of the triatomic molecule and h and k are Planck’s and Boltzmann’s constants respectively.
Of the three frequencies vx and v3 are derived from the infra-red absorption spectrum; the numerical values being 673 and 2295 cm.-1 respectively.* The remaining frequency v2 is given by Rasetti as approximately 1280 cm.-1 from a study of the Raman effect in gases.f The resulting values of 0X, 02, and 03 are 960, 1830, and 3280° K. respectively.
The specific heats given by the above expression require a small correction to take account of the effect of pressure since the spectroscopic values are for zero pressure and the experimental values for 1 atmosphere.
* A. Eucken, ‘ Z. Physik,’ vol. 37, p. 714 (1926); also Eucken and Liide, ‘ Z. phys. Chem.,’ B, vol. 5, p. 413 (1929).
t Rasetti, ‘ Nature,’ vol. 123, pp. 205, 757 (1929).
on June 18, 2018http://rspa.royalsocietypublishing.org/Downloaded from

514 G. G. Sherratt and E. Griffiths
The spectroscopic values after allowing for the effects of pressure are given in column 4 of Table VII.
The small difference between the present experimental and the spectroscopic values may be due to the neglect in the latter of the energy associated with the stretching of the molecule.
At the same time it is not desirable to place too much weight on the differences between the two sets of values since the determination of the specific heats by the present method demands high accuracy in the sound velocity measurements.
T able VIICv cals./gm. mol. at 1 atmosphere pressure.
Temperature ^ ~ --------------------------------- v° c . Present
investigation I.C.T. Spectroscopic0 6-62 6*63 6-67
200 8-65 7*60 8-49400 10-06 8-48 9*80600 10-81 9*15 10*64800 11-30 9*72 11*21
1000 11-76 1017 11*61
E xperiments w ith A rgon
In order to have a check on the functioning of the apparatus as a whole, a supply of argon was obtained in which the impurity was stated to be 0 • 5% nitrogen.
Experiments were carried out on this gas at the three lower frequencies and at temperatures of 9 • 1, 657, and 1027° C. The velocity of sound was found to be independent of frequency and the values of y, the ratio of the specific heats, were derived from the mean velocities. After correction for departures from perfect gas laws and for the impurity present, y had the values 1 -664, 1 -669, and 1 -664 at the temperatures above mentioned.
As argon is a monatomic gas and therefore has neither rotational nor vibrational specific heat, the ratio of its specific heats should have the value 5/3 and be independent of temperature. The agreement of the experimental with the theoretical value is satisfactory.
A bsorption of So und
The difficulty experienced on account of absorption in making measure ments at a frequency or 19 kilocycles/sec. has already been mentione •
on June 18, 2018http://rspa.royalsocietypublishing.org/Downloaded from

515
■urthermore, measurements at still higher frequencies proved to be quite mpossible with the existing apparatus.
A satisfactory theoretical explanation of the observed increase in sound bsorption above the classical value which occurs in most gases has been >rovided by Kneser.* The theory supposes the failure of part of the 'ibrational energy of the gas to follow the acoustic cycle at certain fre- luencies. At these frequencies, excessive sound absorption should be ivident and also an increase in sound velocity above the limiting low requency velocity.
It is of interest, therefore, to examine the phenomena encountered in the present work in the light of this theory—namely, the increase in sound ibsorption which is found to occur at 19,365 cycles per second while no ncrease in velocity above that at lower frequencies could be detected at his frequency.
Information on the absorption occurring at the three lower frequencies was obtained during the experiments which have been described in this paper. The absorption coefficients were derived from the ratios of the galvanometer deflexions at various nodes. They were found to be independent of temperature and the mean values were 0 010, 0-020, and 0-031 cm.-1 in increasing order of frequency. Part of this absorption occurs at the walls of the tube and part in the gas itself. The former may be estimated by application of the Helmholtz-Kirchhoff formula.t Evidence as to the applicability of this formula for the absorption at the walls of a tube is forthcoming from the absorption measurements on argon. Since argon itself is not appreciably absorptive, the measured absorption coefficients should agree with those derived from the formula. Actually, the former were found on the average to be 75% of the latter.
This discrepancy between the observed and the theoretical coefficients may be due to the fact that the variation in the galvanometer deflexion as the length of the gas column is varied does not depend solely on the absorption of the gas but also to some extent on the circuit constants.
The assumption is made that the absorption occurring at the walls of the tube when the latter is filled with carbon dioxide will be given approximately by taking 75% of the value predicted by the Helmholtz-Kirchhoff equation.
The absorption coefficients at the wall calculated in this manner are given in Table VIII, the gas in the tube being carbon dioxide. The absorption in the gas itself is obtained by subtracting these absorption coefficients from the experimental values given above.
* ‘ Ann. Physik,’ vol. 11, p. 761 (1931).t Rayleigh, “ Theory of Sound,” vol. 2, p. 325.
The Specific Heat o f Gases
on June 18, 2018http://rspa.royalsocietypublishing.org/Downloaded from

516 G. G. Sherratt and E. Griffiths
From the sound dispersion theory the absorption coefficient in the gas is given by
4 ^ PR (C , - CB)_________a =V {C„ (C„ + R) + 4nWp«Ca (Ca + R)}
where n is the frequency, V the velocity of sound, C„ and Ca represent respectively the specific heat at constant volume and that part of the specific heat due to translation and rotation only, and p is a time constant, the period of relaxation, which determines the time lag in the transfer of energy between the vibrational and the other energy states.
T able VIIIAbsorption coefficients
Frequencycycles/sec.
7911-2
Temperature ° C.
At walls' 0
0-0043600
0*00671000
0-0075In the gas 0-0057 0 0033 0-0025
13828 At walls 0-0056 0 0090 0 0099In the gas 0-0144 0*0110 00101
19365 At walls 0 0066 0*0106 0-0117In the gas 0-0244 0*0204 0-0193
Calculation shows that satisfactory agreement is obtained with the experimental values of the absorption coefficient if the period of relaxation is taken as 0-79, 0-82, and 0-76 x 10“6 seconds at the three frequencies. It would therefore appear that for carbon dioxide the period of relaxation can be regarded as of the order of 0-8 X 10~6 seconds with a reasonable degree of certainty.
Having found the value o f p an estimate can be made of the increase in velocity of sound over the limiting low frequency velocity that might be expected at a frequency of 19,365 cycles per second. Taking p = 0-8 X 10~6 seconds it is found that the increase at that frequency is of the order of 1 part in 5000 and is therefore negligibly small.
Conclusions
The agreement between the results obtained for carbon dioxide in the present investigation and those deduced from spectroscopic data is further evidence that the spectroscopic method affords a simple and reliable means for the evaluation of the specific heats of gases at high temperatures.
on June 18, 2018http://rspa.royalsocietypublishing.org/Downloaded from

The Specific Heat o f Gases 517
The results of the sound absorption measurements are evidence of the ' lidity of the Kneser theory and the time of relaxation of the carbon toxide molecule is found to be of the order of 0-8 x 10~6 seconds.
Summary
The specific heat of carbon dioxide up to 1000° C. has been determined y the sound velocity method using a modified form of the apparatus escribed in a previous paper.*Frequencies of 8, 14, and 19 kilocycles/sec. were used, and no appreci-
ele dispersion was found over this range, although a greater increase in )und absorption with frequency was observed than would be expected rom classical theory.The absorption was so considerable at a frequency of 27 kilocycles/sec.
lat measurements became impossible. The observed increase of sound bsorption with frequency is, however, accounted for satisfactorily by le theory which ascribes the effect to the time lag in the transfer of nergy between the vibrational and the other energy states of a molecule.
Furthermore, the increase above the classical value of the sound absorp- ion which is observed at a frequency of 19 kilocycles/sec. is shown, in he light of that theory, to be consistent with the absence of any increase n velocity at that frequency.
The specific heat values obtained are given below:
C„ cals./gm. mol. at 1 atmosphere pressure Temperature ,---------------------------------------- ----------------------------------------
c . Presentinvestigation I.C.T. Spectroscopic
0 6*62 6-63 6*67200 8*65 7*60 8*49400 1006 8*48 9*80600 10*81 9*15 10*64800 11*30 9*72 11*21
1000 11*76 1017 11*61
The figures in the column denoted by I.C.T. are based on data given n the International Critical Tables.
* Sherratt and Griffiths, ‘ Proc. Roy. Soc.,’ A, vol. 147, p. 292 (1934).
on June 18, 2018http://rspa.royalsocietypublishing.org/Downloaded from
Related Documents