ENVIRONMENT AGENCY An inter-laboratory trial on chemical oxygen demand determinations (2007) Methods for the Examination of Waters and Associated Materials

Welcome message from author
This document is posted to help you gain knowledge. Please leave a comment to let me know what you think about it! Share it to your friends and learn new things together.
Transcript

ENVIRONMENT AGENCY
An inter-laboratory trial on chemical oxygen demand determinations (2007)
Methods for the Examination of Waters and Associated Materials

2

An inter-laboratory trial on chemical oxygen demand determinations (2007) Methods for the Examination of Waters and Associated Materials This booklet contains information on an inter-laboratory trial on chemical oxygen demand determinations using some of the methods described in the previous booklet in this series.
Throughout the booklet, the term chemical oxygen demand (COD) is used to express the amount of oxygen consumed during oxidation of a sample with hot acid dichromate solution under defined conditions; the test provides an estimate of the oxidisable matter present in the sample. The result is usually expressed as milligrams of oxygen consumed per litre of sample (mg l-1).
Whilst this booklet may report details of the materials actually used, this does not constitute an endorsement of these products but serves only as an illustrative example. Equivalent products are available and it should be understood that the performance characteristics of the method might differ when other materials are used. It is left to users to evaluate methods in their own laboratories.
3

4

Contents About this series 6 Warning to users 6 An inter-laboratory trial on chemical oxygen demand determinations 7 1 Introduction 7 2 details of samples circulated 8 3 Protocol adopted 8 4 Results 9 5 Effects of chlorine 9 6 Basic performance characteristics of the methods 9 7 Oxidation of refractory substances 10 8 Experienced analyst versus in-experienced analyst 10 9 Conclusions 10 10 References 10 Tables 0 - 22 11 Address for correspondence 50
5

6
About this seriesIntroductionThis booklet is part of a series intended to provideauthoritative guidance on recommended methods ofsampling and analysis for determining the quality ofdrinking water, ground water, river water and seawater, waste water and effluents as well as sewagesludges, sediments, soil (including contaminatedland) and biota. In addition, short reviews of themost important analytical techniques of interest tothe water and sewage industries are included.
Performance of methodsIdeally, all methods should be fully evaluated withresults from performance tests. These methodsshould be capable of establishing, within specifiedor pre-determined and acceptable limits of deviationand detection, whether or not any sample containsconcentrations of parameters above those ofinterest.
For a method to be considered fully evaluated,individual results from at least three laboratoriesshould be reported. The specifications ofperformance generally relate to maximum tolerablevalues for total error (random and systematic errors)systematic error (bias) total standard deviation andlimit of detection. Often, full evaluation is notpossible and only limited performance data may beavailable.
In addition, good laboratory practice and analyticalquality control are essential if satisfactory results areto be achieved.
Standing Committee of AnalystsThe preparation of booklets within the series“Methods for the Examination of Waters andAssociated Materials”
and their continuing revision is the responsibility of theStanding Committee of Analysts. This committee wasestablished in 1972 by the Department of theEnvironment and is now managed by the EnvironmentAgency. At present, there are nine working groups,each responsible for one section or aspect of waterquality analysis. They are
1 General principles of sampling and accuracy ofresults2 Microbiological methods3 Empirical and physical methods4 Metals and metalloids5 General non-metallic substances6 Organic impurities7 Biological methods8 Biodegradability and inhibition methods9 Radiochemical methods
The actual methods and reviews are produced bysmaller panels of experts in the appropriate field, in co-operation with the working group and main committee.The names of those members principally associatedwith these methods are listed at the back of thebooklet.
Publication of new or revised booklets will be notified tothe technical press. If users wish to receive copies oradvance notice of forthcoming publications, or obtaindetails of the index of methods then contact theSecretary on the Agency’s internet web-site(www.environment-agency.gov.uk/nls) or by post.
Every effort is made to avoid errors appearing in thepublished text. If, however, any are found, please notifythe Secretary.
Dr D Westwood SecretaryAugust 2006
__________________________________________________________________________Warning to users
The analytical procedures described in this bookletshould only be carried out under the propersupervision of competent, trained analysts inproperly equipped laboratories.
All possible safety precautions should be followedand appropriate regulatory requirements compliedwith. This should include compliance with the Healthand Safety at Work etc Act 1974 and regulationsmade under this Act, and the Control of SubstancesHazardous to Health Regulations 2002 (SI2002/2677). Where particular or exceptional hazardsexist in carrying out the procedures described in thisbooklet, then specific attention is
noted. Numerous publications are available givingpractical details on first aid and laboratory safety. Theseshould be consulted and be readily accessible to allanalysts. Amongst such publications are; “SafePractices in Chemical Laboratories” and “Hazards in theChemical Laboratory”, 1992, produced by the RoyalSociety of Chemistry; “Guidelines for MicrobiologicalSafety”, 1986, Portland Press, Colchester, produced byMember Societies of the Microbiological ConsultativeCommittee; and “Safety Precautions, Notes forGuidance” produced by the Public Health LaboratoryService. Another useful publication is “Good LaboratoryPractice” produced by the Department of Health.

Inter-laboratory trial on chemical oxygen demand determinations This booklet is based on a DOE funded report prepared by Yorkshire Environmental LabServices. 1 Introduction 1.1 An inter-laboratory study, funded by the Department of the Environment, was set up to test new proposed chemical oxygen demand (COD) methods. These low level (0-160 mg l-1) COD small scale open- and closed-tube methods use mercury suppression of chloride interference. 1.2 Results(1) (from three laboratories) indicated that earlier bluebook methods produced by the Standing Committee of Analysts (SCA) using mercury-free methods for the determination of low levels of COD (closed-tube method B and open-tube method C in the 1986 publication(2), i.e. methods D and E of the previous booklet) produced positive bias in the presence of low concentrations of chloride. This bias was shown to be very variable. The chloride concentration in many final effluents was found to be sufficient to cause biased results in COD determinations. This bias could be significant with respect to monitoring compliance with the Urban Wastewater Treatment Regulations 1994(3). 1.3 Analysts were asked to analyse prepared samples in duplicate over a period of five days using either (or both) procedures described in method B of the previous booklet. In addition, analysts were also requested to compare these methods with any existing methods used in their own laboratories. 1.4 Two previous SCA COD methods(2, 4), the 1977 method and the 1986 (method A) method, i.e. methods A and C respectively of the previous booklet, have never been properly tested using an inter-laboratory trial of this sort. It was hoped that using a single set of (16) samples the performance characteristics determined would provide a robust test of the new proposed methods and possibly previously published methods. 1.5 Twelve laboratories participated in the inter-laboratory trial (Table 0). Only six laboratories (marked **) carried out the main part of the trial using the proposed procedures in method B of the previous booklet. Five laboratories used the closed tube variation, and one laboratory used both the closed and the open tube variations. 1.6 Six laboratories used their current in-house methods and/or commercial test kit methods. Five participating laboratories reported results using commercially available closed tube test kits. These test kits measure the light absorption (at 420 nm) of the dichromate ion as a means of determining COD instead of the titration procedure. The sealed digestion tube also acts as a cuvette which allows light absorption measurements to be carried out. 1.7 One laboratory used the original 1977 full scale (10 ml sample volume) mercury-suppressed method(4), i.e. method A of the previous booklet. 1.8 The types of samples distributed to laboratories are described in Table 2. Table 3 lists the symbols used in the raw data and statistical tables. 1.9 It is important to note that each method was not, in general, carried out by the same number of laboratories, or in some cases, to the same degree of replication. Hence
7

8
the simple statistical treatment employed is not completely rigorous, but is consideredadequate to indicate the typical performance of the methods.
2 Details of samples circulated
2.1 The pH of all samples, except the one containing humic acid was adjusted to 2.0 ± 0.1 by the addition of 4 M sulphuric acid. The humic acid solution was stabilised with0.01 M sodium hydroxide to a pH value of 12.
2.2 Participants were asked to commence the analysis as soon as possible afterreceipt of the samples, but that if this was not possible to store the samples at 4 oC beforeanalysis.
2.3 Sewage works final effluent samples were distributed with COD levels rangingfrom about 40 to 230 mg l-1. Participants were requested to dilute sample 16 with water inthe ratio 1:1 prior to analysis..
2.4 The effect of chloride was assessed with synthetic chloride solutions (see Table 2) at concentrations of 500 and 2000 mg l-1 as chloride and with sewage effluentsthat naturally contained up to about 440 mg l-1 chloride.
2.5 Potassium hydrogen phthalate (KHP) was used to prepare the primary CODstandard solutions.
2.6 A complete set of samples was reserved for duplicate analysis to be carried outafter 74 days storage at 4oC. The results, expressed as a percentage of the original resultare shown in Table 4. The determination was carried out using a commercial test kit in therange 0 - 160 mg l-1.
3 Protocol adopted
3.1 The samples were not identified to the participants. Laboratories were requestedto analyse each sample in duplicate over a 5 day period.
3.2 An analysis of variance was carried out(5) and outliers were rejected (marked # intables) using Dixon's Q test (two tailed at the 5 % significance level). It is noted that forsome laboratories, a result is rejected that may be a consequence of the good precisionshown for that laboratory, and not because of the variation shown between laboratories.
3.3 When only one result, instead of the duplicate result requested, was submitted,the result for that day was not included in the statistical treatment, except when theestimated standard deviation was calculated.
3.4 Many laboratories submitted insufficient data for an analysis of variance to becarried out. Consequently, in order to give more information in these cases estimatedstandard deviations and relative standard deviations were calculated. These values weredetermined using all the data submitted for a given sample excluding outlier results andresults reported as “less than”. This procedure was considered useful as a means ofcomparing the data.
3.5 Table 0 lists the laboratories taking part. Table 1 lists the laboratory and methodcode numbers; the basis of the methods used by each laboratory; the top COD calibration

9
standard; the volume of sample used in each determination, and in addition whethermercury suppression was used.
3.6 Used in this study were the closed and open tube versions respectively ofmethod B in the previous booklet. Method D was as an example of the closed tube methodsthat do not use mercury to suppress chloride interference. The 2-ml sample volume is similarto that of method B of the 1986 reference. Method A is the original 1977 full scalereference SCA method(4) using 10 ml sample volume and mercury suppression of chloride.Method G was an in-house method with a range of calibration standards between 0 - 1600 mg l-1. Methods F1, F2 and F3 were sealed-tube proprietary test kits that used mercury to suppress chloride interference.
4 Results
4.1 The results for the 16 samples are summarised by sample number in Tables 5 - 20.The first table (for example Table 5A) for each sample shows the raw data, thesecond table (i.e. Table 5B) for each sample shows the statistical analysis of the datapresented in the first table.
4.2 The bias is calculated for standard solutions only where the theoretical COD isknown. It is calculated as the difference between the mean result obtained by a givenlaboratory for a specified method and the theoretical COD of the sample. Table 21 showsthe limits of detection calculated for the “effective” blank samples (i.e. the blank, thesamples containing 500 and 2000 mg l-1 as chloride respectively) and the lowest CODsample with a theoretical value of 25 mg l-1.
4.3 Although four laboratories reported results for Method D, three of the laboratoriesreported four or less results per sample, whilst one laboratory reported eight results persample.
4.4 One laboratory reported full data for method A.
4.5 In addition, results from an experienced analyst were reported for comparisonwith those reported by an in-experienced analyst (marked * in tables).
5 Effect of chloride
5.1 Overall, insufficient data were provided to ensure that a statistical comparison ofresults by different methods would be valid.
5.2 However, whilst it is difficult to generalise, it can be seen from Table 22 that inthe presence of chloride, the results for method D (the existing mercury-free basedmethod) show higher COD results than methods A, B, or F1 which all used mercurysuppression of chloride.
6 Basic performance characteristics of the methods
6.1 Limit of detection
Table 21 shows the limit of detection obtained by the participating laboratories calculatedfrom the results of the blank (sample 9), the 500 and 2000 mg l-1 chloride standard solutions(samples 13 and 3 respectively) and the lowest COD standard of 25 mg l-1 (sample 1).

10
7 Oxidation of refractory substances
7.1 Table 22 also shows the mean results for the COD standard solutions and thesolutions of sodium acetate (nominal COD 128 mg l-1) (sample 5) and humic acid (sample 15) for all methods. The total carbon content of the sodium acetate solution(sample 5) was determined using an OI total organic carbon analyser and found to bewithin 1% of the theoretical value.
8 Experienced versus inexperienced analysts
8.1 Laboratory 7 submitted results for methods B and F1 using an experiencedanalyst (two years experience of COD determinations) and an in-experienced graduateanalyst (two days training in carrying out COD tests, marked *). These results can becompared by examination of individual tables.
9 Conclusions
9.1 Six of the twelve participating laboratories submitted results for the small scaleclosed-tube COD procedure of method B of the previous booklet. One laboratory submittedresults for the small scale open-tube COD procedure of method B) of the previous booklet. Bothof these procedures utilise mercury suppression of chloride. The other six laboratoriessubmitted results for their existing methods and/or commercial small scale test kits, alsoutilising mercury suppression.
9.2 Overall, the precision of the results for method B (open-tube and closed-tubeprocedures) were similar to method D (closed-tube procedure). However, in the presenceof chloride, the results for method D (closed-tube procedure) were in general higher thanthe corresponding values obtained by method B of the previous booklet. This could have asignificant effect with respect to monitoring compliance with the Urban Waste WaterDirective(3)
10 References
1. Unpublished studies carried out by Yorkshire Environmental, LabServices(Rotherham Laboratory), Thames Water, (Docklands Laboratory) and National RiversAuthority (Leeds Laboratory).
2. Standing Committee of Analysts, Chemical Oxygen Demand (Dichromate Value) ofPolluted and Waste Waters, 1986 (Second Edition), Methods for the Examination ofWaters and Associated Materials, in this series, ISBN 0117519154.
3. The Urban Waste Water Treatment (England and Wales) Regulations 1994,Statutory Instrument 1994/2481.
4. Standing Committee of Analysts, Chemical Oxygen Demand (Dichromate Value) ofPolluted and Waste Waters 1977, Methods for the Examination of Waters and AssociatedMaterials, in this series, ISBN 0117512494.
5. A Manual of Analytical Quality Control for the Water Industry, Water ResearchCentre, NS30, R V Cheeseman and A L Wilson, revised by M J Gardner, 1989.

11
Table 0 Participating laboratories
Analytical and Environmental Services (Wallsend)Anglian Water Services Limited (Norwich)DOE (Northern Ireland) Water Executive (East Division) **Essex Analytical (Hanningfield)A.H. Marks and Company (Bradford)North West Water (Warrington) **National Rivers Authority (Leeds)National Rivers Authority (Nottingham) **Severn Trent Laboratories (Coventry) **South West Water (Exeter)Thames Water (Docklands) **Yorkshire Environmental, LabServices (Rotherham) **
Grateful acknowledgement is made to all laboratories which participated in the inter-laboratorytrial, and especially those (marked **) that reported results for method B of the previous booklet.

12
Table 1 Summary of laboratories and methods
Laboratory Method Sample Mercury Method COD of top calibrationcode volume suppression code in this standard (mg/l)
(ml) (Y/N) booklet1 Closed-tube procedure of method B 2 Y BC-T 1604 Closed-tube procedure of method B 2 Y BC-T 1605 Closed-tube procedure of method B 2 Y BC-T 1606 Closed-tube procedure of method B 2 Y BC-T 1607 Closed-tube procedure of method B 2 Y BC-T 1608 Closed-tube procedure of method B 2 Y BC-T 1607 Open-tube procedure of method B (experienced analyst) 2 Y BO-T 1607 Open-tube procedure of method B (in-experienced analyst) 2 Y BO-T* 1601 Closed-tube based on SCA 1986 (method D) 10 N D 4002 Closed-tube SCA 1986(method D) 2 N D 4005 Closed-tube SCA 1986(method D) 2 N D 4006 Closed-tube SCA 1986(method D) 2 N D 40011 Open-tube SCA 1977 (0 - 400 mg/l) (method A) 10 Y A 4003 Laboratory’s own method (0 - 1600 mg/l) 2 Y G 16007 Test kit A (0 - 160 mg/l), experienced analyst 2 Y F1 1607 Test kit A (0 - 160 mg/l), in-experienced analyst 2 Y F1* 1609 Test kit A (0 - 160 mg/l) 2 Y F1 16012 Test kit A (0 - 160 mg/l) 2 Y F1 1601 Test kit B (0 - 150 mg/l) 2 Y F2 1501 Test kit C (0 - 150 mg/l) 2 Y F3 15010 Test kit C (0 - 150 mg/l) 2 Y F3 150
Note: Calibration standard solutions prepared using potassium hydrogen phthalate (KHP). Methods are described in the previous booklet.

13
Table 2 Sample identification
Samplenumber
Sample Chlorideconcentration
(mg/l)
Table number
Raw data Statistical treatment1 COD (KHP) standard, 25 mg/l. < 10 6A 6B2 Sewage final effluent 1 80 14A 14B3 2000 mg/l chloride standard 2000 13A 13B4 Sewage final effluent 2 80 15A 15B5 Sodium acetate; nominal COD 128 mg/l < 10 9A 9B6 Sewage final effluent 3 209 16A 16B7 COD (KHP) standard, 160 mg/l < 10 8A 8B8 COD (KHP) standard, 125 mg/l with 500 mg/l chloride 500 12A 12B9 Blank < 10 5A 5B10 Sewage final effluent 4 350 17A 17B11 COD (KHP) standard, 125 mg/l < 10 7A 7B12 Sewage final effluent 5 106 18A 18B13 500 mg/l chloride 500 11A 11B14 Sewage final effluent 6 368 19A 19B15 Humic acid solution < 10 10A 10B16 Sewage final effluent 7 440 20A 20B

14
Table 3 Summary of symbols and abbreviations used in tables
A blank cell indicates that a result was not submitted, or that the result is not relevant, orthat insufficient data points are available to calculate the within and between batchstandard deviations, or that statistics were unavailable since the between batch meansquare is less than the within batch mean square for these data.
# Indicates that this result has been rejected as an outlier using Dixon’s Q test,two tailed, at the 5% significance level; any result obtained on this day is notincluded in the calculation of within and between batch standard deviations.It is noted that for some laboratories, a result has been rejected probably asa consequence of the excellent precision shown for the batch of results.
Sw Within batch standard deviation.St Total standard deviation.Sb Between batch standard deviation.RSD % Relative standard deviation as percent.DoF Degrees of freedom.Est SD Estimated standard deviation. (This is to be compared with the total standard
deviation).Est RSD % Estimated relative standard deviation as percent.
Results for laboratory 3 (method G) have not been included in combined statisticalcalculations.
All values are given in mg/l, unless otherwise stated.
Where appropriate, the results in the final three columns of the statistical analysis tablesare based on an estimated total standard deviation calculated for all results, exceptoutliers and results reported as “less than”.

15
Table 4 Stability tests performed on samples stored for 74 days at 4 0C
Samplenumber
Mean CODBefore storage
value (mg/l)After storage
1 24.4 25.52 55.4 62.53 8 10.54 74.7 77.55 114.5 118.06 111.7 117.57 161.2 161.58 126.3 128.59 1 2.010 73.7 82.511 127.4 128.012 142 126.013 2.6 2.514 105.6 109.515 118..7 121.016 228.6 225.0

16
Table 5A Comparison results for sample 9 (blank, chloride concentration <10 mg/l)
Methodcode
Laboratorynumber
Day 1 Day 2 Day 3 Day 4 Day 5
BC-T 1 -6.8 -4.5 -7 -3.2 -7.7 -2.7 12.9 6.6 -19.6 -15.4BC-T 4 -4 -4 -4 -4.7 18.1 10.2 0.5 -1.6 -0.7 -0.9BC-T 5 8.2 8.2 19.5 14.9 3.6 12.3 5.7 4.3 2.6 4BC-T 6 2 2 11 3 13 13 44# 16 4BC-T 7 4 2 1 1 0.4 1.4BC-T 8 2.6 6.4 6.5 0.4 7.5 8.9 11.2 5.5 4.3 4.3BO-T 7 1 1 0.3 0 0 0 2 1 2 2BO-T* 7 1.9 0.3 -0.7 0.5 0.8 -3 -0.8 -2.1
D 1 4 0 -12D 2 2 0 -3 -2 0 5 5 3D 5 8.8 6.6D 6 -2 -5 -6 -9A 11 2.1 1.1 2 2 -2 2 1.7 1.8 2 -2G 3 < 5 < 5F1 7 4 3 0 0 0 0 1 0 2 0F1* 7 8 4 0 3 8 1 0 0 4 0F1 9 0 4 0 0 0 0 4 0 9# 3F1 12 < 5 5F2 1 3.3 10 8F3 1 < 5 < 5 < 5 < 5 < 5 < 5
F3 10 < 10 < 10 < 10 < 10 < 10 12.8 < 10 < 10 10.8 15.3

17
Table 5B Statistical analysis of results for sample 9 (blank, chloride concentration <10 mg/l)
Methodcode
Laboratorynumber
Mean Max Min Sw Sb St RSD % DoF Number ofoutlier results
Est SD Number of resultsused
BC-T 1 -4.74 12.9 -19.6 3.19 9.40 9.93 -209.48 4 0 10BC-T 4 0.89 18.1 -4.7 2.60 7.39 7.84 880.42 4 0 10BC-T 5 8.33 19.5 2.6 3.17 4.88 5.82 69.84 5 0 10BC-T 6 8.00 16.0 2.0 7.36 1 5.8 8BC-T 7 1.63 4.0 0.4 0.91 0.99 1.35 82.60 5 0 6BC-T 8 5.76 11.2 0.4 2.93 1.06 3.12 54.17 9 0 10BO-T 7 0.93 2.0 0.0 0.33 0.83 0.89 95.66 5 0 10BO-T* 7 -0.39 1.9 -3.0 1.59 0.23 1.60 -413.61 7 0 8
D 1 -2.67 4.0 -12.0 0 8.3 3D 2 1.25 5.0 -3.0 2.06 2.37 3.14 251.40 5 0 8D 5 7.70 8.8 6.6 0 1.6 2D 6 -5.50 -2.0 -9.0 2.12 2.40 3.20 -58.21 2 0 4A 11 1.07 2.1 -2.0 1.82 0 1.6 10G 3 < 5F1 7 1.00 4.0 0.0 0.77 1.35 1.56 155.72 5 0 10F1* 7 2.80 8.0 0.0 3.00 1.15 3.21 114.76 9 0 10F1 9 1.22 4.0 0.0 2.00 1 1.9 9F1 12 5.00 5.0 < 5 1F2 1 7.10 10.0 3.3 0 3.4 3F3 1 < 5 < 5 < 5
F3 10 7.39 15.3 < 10 2.3 3
The overall mean of method B is 3.0 ± 3.5.

18
Table 6A Comparison of results for sample 1 (KHP COD standard, 25 mg/l)
Methodcode
Laboratorynumber
Day 1 Day 2 Day 3 Day 4 Day 5
BC-T 1 39.3 25 24.8 9.4 14.6 15 20.1 27.3 10.9 14.5BC-T 4 42.8 34.8 29.5 22.3 25.2 22.7 33 26.2 29.9 23.7BC-T 5 23.8 20.3 36.5 24.1 31.9 42.2 30.7 30.7 29.6 33.3BC-T 6 56 30 23 21 27 26 48 26 37 47BC-T 7 26 26 22 25 23 25BC-T 8 25.2 25.7 28.8 34.5 32.9 33.6 30.3 40.3 30.3 29.9BO-T 7 21_ 24 24 26 26 25 25 25 25 25BO-T* 7 32.3 25.9 29 27.5 26.7 22.6 24.5 23.5
D 1 25 30 29D 2 25 27 21 23 25 30 30 32D 5 27.4 23.2D 6 46 22 21 15A 11 25.6 26 26 26.6 26.7 24 26.6 27 25.7 23.7G 3 120 116F1 7 26 18 21 23 28 26 23 28 28 23F1* 7 30 32 27 25 27 24 25 24 28 23F1 9 27 30 21 26 28 24 29 24 32 27F1 12 17 28F2 1 23 8.2 14.3F3 1 < 5 < 5 < 5 26 24 26F3 10 24.4 27.6 18.6 44.2 28.2 34.6 32.1 32.1 33.3 37.8
19
Table 6B Statistical analysis of results for sample 1 (KHP COD standard, 25 mg/l)
Methodcode
Laboratorynumber
Mean Bias Max Min Sw Sb St RSD %
DoF Number ofoutlier results Est SD Est RSD % Number of
results usedBC-T 1 20.09 -4.91 39.3 9.4 7.12 6.10 9.37 46.65 7 0 10BC-T 4 29.01 4.01 42.8 22.3 4.55 4.87 6.67 22.98 6 0 10BC-T 5 30.31 5.31 42.2 20.3 5.35 3.81 6.56 21.65 7 0 10BC-T 6 34.10 9.10 56.0 21.0 11.25 5.03 12.32 36.13 8 0 10BC-T 7 24.50 -0.50 26.0 22.0 1.47 0.82 1.68 6.87 6 0 6BC-T 8 31.41 6.41 40.3 25.2 3.65 2.68 4.53 14.43 7 0 10BO-T 7 25.00 0.00 26.0 24.0 0.79 1 0.7 2.8 9BO-T* 7 26.50 1.50 32.3 22.6 2.76 1.64 3.21 12.12 6 0 8
D 1 28.00 3.00 30.0 25.0 0 2.6 9.4 3D 2 26.63 1.63 32.0 21.0 2.15 3.40 4.03 15.12 4 0 8D 5 25.30 0.30 27.4 23.2 0 3.0 11.7 2D 6 26.00 1.00 46.0 15.0 12.37 7.18 14.30 55.00 2 0 4A 11 26.06 1.06 27.0 23.7 1.09 0.26 1.12 4.31 9 0 10G 3 118.00 93.00 120.0 116.0 0 2.8 2.4 2F1 7 24.40 -0.60 28.0 18.0 3.49 0 3.4 13.8 10F1* 7 26.50 1.50 32.0 23.0 2.07 2.12 2.96 11.18 6 0 10F1 9 26.13 1.13 32.0 21.0 3.16 0.67 3.23 12.37 9 0 10F1 12 22.50 -2.50 28.0 17.0 0 7.8 34.6 2F2 1 15.17 -9.83 23.0 8.2 0 7.4 49.0 3F3 1 25.33 0.33 26.0 24.0 3 1.2 4.6 3F3 10 30.23 5.23 44.2 18.6 8.53 0 7.1 23.6 10
The overall mean for method B is 27.8 ± 4.8.

20
Table 7A Comparison of results for sample 11 (KHP COD standard, 125 mg/l)
Methodcode
Laboratorynumber
Day 1 Day 2 Day 3 Day 4 Day 5
BC-T 1 112.4 109 107.9 108.5 109.1 101.9 107.9 120.1 98.1 105.9BC-T 4 115.9 124 113.6 116.1 135.3 142.2 118.6 118.7 116.8 122.5BC-T 5 124.9 127 147.8 124 137.8 134.5 132.1 135.7 142.9 134.9BC-T 6 125 128 126 128 127 122 128 118 114 159#BC-T 7 130 129 133 137 130 129BC-T 8 114.3 128.6 120.9 111.1 130.8 121.1 123.9 131.4 123.9 125.9BO-T 7 126 123 123 119 120 121 124 122 121 121BO-T* 7 116 117.6 116.9 117.2 99.6 115.7
D 1 121 120 112D 2 124 122 123 124 130 129 124 119D 5 113.7 118.6D 6 125 121 117 116A 11 127.5 131.3 127.9 122.9 124.9 129.9 120.4 120.4 128.7 124.7G 3 < 5 < 5F1 7 134 128 126 123 124 120 131 135 126 127F1* 7 132 134 126 123 126 122 127 125 130 126F1 9 130 128 120 128 126 129 127 122 130 135F1 12 123 120F2 1 122 115 119F3 1 95 93 101 115 97 125F3 10 132.6 122.6 101.2 103.8 145.8 132.6 135.2 132.6 154.4 141.8

21
Table 7B Statistical analysis of results for sample 11 (KHP COD standard, 125 mg/l)
Methodcode
Laboratorynumber
Mean Bias Max Min Sw Sb St RSD % DoF Number of outlierresults
Est SD Est RSD % Number of results used
BC-T 1 108.08 -16.92 120.1 98.1 5.23 2.78 5.92 5.48 8 0 10BC-T 4 122.37 -2.63 142.2 113.6 3.90 8.97 9.78 7.99 5 0 10BC-T 5 134.16 9.16 147.8 124.0 8.12 0 7.6 5.7 10BC-T 6 124.00 -1.00 128.0 114.0 4.15 5.0 4.1 9BC-T 7 131.33 6.33 137.0 129.0 1.73 2.93 3.40 2.59 3 0 6BC-T 8 123.19 -1.81 131.4 111.1 6.74 0 6.6 5.4 10BO-T 7 122.00 -3.00 126.0 119.0 1.73 1.17 2.09 1.71 8 0 10BO-T* 7 113.83 -11.17 117.6 99.6 6.61 2.62 7.11 7.14 4 0 6
D 1 117.67 -7.33 121.0 112.0 0 4.9 4.2 3D 2 124.38 -0.63 130.0 119.0 1.97 3.23 3.79 3.04 4 0 8D 5 116.15 -8.85 118.6 113.7 0 3.5 3.0 2D 6 119.75 -5.25 125.0 116.0 2.06 4.36 4.82 4.03 1 0 4A 11 125.86 0.86 131.3 120.4 2.84 2.72 3.93 3.12 7 0 10G 3 < 5F1 7 127.40 2.40 135.0 120.0 2.79 4.10 4.96 3.89 5 0 10F1* 7 127.10 2.10 134.0 122.0 2.21 3.29 3.97 3.12 5 0 10F1 9 127.50 2.50 135.0 120.0 3.56 2.40 4.30 3.37 8 0 10F1 12 121.50 -3.50 123.0 120.0 0 2.1 1.7 2F2 1 118.67 -6.33 122.0 115.0 0 3.5 3.0 3F3 1 104.33 -20.67 125.0 93.0 0 12.8 12.3 6F3 10 130.26 5.26 154.4 101.2 6.68 16.58 17.88 13.72 5 0 10
The overall mean for method B is 123.6 ± 8.3.

22
Table 8A Comparison of results for sample 7 (KHP COD standard, 160 mg/l)
Method code Laboratorynumber
Day 1 Day 2 Day 3 Day 4 Day 5
BC-T 1 148.4 134.7 135.6 136 147.6 137.4 150.8 189.3# 146.8 137.6BC-T 4 154.4 157.6 143.3 147 144.1 157.1 149.5 150.7 150.8 147.4BC-T 5 173 156.2 168.5 164.7 173.8 176.7 172.8 170.6 167.1 169.3BC-T 6 154 160 160 164 163 161 173 90# 135BC-T 7 155 153 163 161 169 165BC-T 8 150.2 152.9 149.3 143.7 162.3 155.8 162.6 159.8 151.2 150.6BO-T 7 160 157 158 156 154 154 160 156 158 153BO-T* 7 159.4 151.1 149.5 149.2 156.6 161.7 152.3 150.1
D 1 154 156 154D 2 161 162 161 162 163 166 164 159D 5 152.3 173.4D 6 162 149 152 149A 11 160.6 165.9# 155.9 155.6 159.7 157.9 156.7 154.7 158.4 158.4G 3 80 130F1 7 164 161 163 158 160 157 165 159 163 162F1* 7 165 165 165 164 162 160 161 162 164 159F1 9 164 157 162 163 161 165 161 165F1 12 154 157F2 1 162 153 147F3 1 192 188 117# 182 190F3 10 163 178.6 122.6 125.2 177 180.2 178.6 184.8 184.8 187.6

23
Table 8B Statistical analysis of results for sample 7 (KHP COD standard, 160 mg/l)
Methodcode
Laboratorynumber
Mean Bias Max Min Sw Sb St RSD % DoF Number ofoutlier results
Est SD Est RSD % Number ofresults used
BC-T 1 141.66 -18.34 150.8 134.7 6.86 1 6.5 4.6 9BC-T 4 150.19 -9.81 157.6 143.3 4.54 2.20 5.04 3.36 8 0 10BC-T 5 169.27 9.27 176.7 156.2 5.61 1.48 5.80 3.43 9 0 10BC-T 6 158.75 -1.25 173.0 135.0 5.49 3.27 6.39 4.03 4 1 8BC-T 7 161.00 1.00 169.0 153.0 2.00 6.40 6.71 4.17 3 0 6BC-T 8 153.84 -6.16 162.6 143.7 2.99 5.73 6.46 4.20 5 0 10BO-T 7 156.60 -3.40 160.0 153.0 2.32 0.85 2.47 1.58 9 0 10BO-T* 7 153.74 -6.26 161.7 149.2 3.53 3.58 5.03 3.27 5 0 8
D 1 154.67 -5.33 156.0 154.0 0 1.2 0.7 3D 2 162.25 2.25 166.0 159.0 2.12 0 2.1 1.3 8D 5 162.85 2.85 173.4 152.3 0 14.9 9.2 2D 6 153.00 -7.00 162.0 149.0 6.67 0 6.2 4.0 4A 11 157.54 -2.46 160.6 154.7 0.96 1.52 1.80 1.14 4 1 9G 3 105.00 -55.00 130.0 80.0 0 35.4 33.7 2F1 7 161.20 1.20 165.0 157.0 2.83 0 2.7 1.6 10F1* 7 162.70 2.70 165.0 159.0 1.76 1.42 2.26 1.39 7 0 10F1 9 162.25 2.25 165.0 157.0 2.74 0 2.7 1.6 8F1 12 155.50 -4.50 157.0 154.0 0 2.1 1.4 2F2 1 154.00 -6.00 162.0 147.0 0 7.6 4.9 3F3 1 188.00 28.00 192.0 182.0 1 4.3 2.3 4F3 10 168.24 8.24 187.6 122.6 5.54 25.11 25.71 15.28 4 0 10
The overall mean for method B is 155.8 ± 8.7.

24
Table 9A Comparison of results for sample 5 (sodium acetate COD standard, 128 mg/l)
Methodcode
Laboratorynumber
Day 1 Day 2 Day 3 Day 4 Day 5
BC-T 1 93.9 84.8 70 77.6 100.5 90.9 91.2 108 97.3 84.7BC-T 4 80 106.2 103.7 114.6 87.9 104.1 86.3 102.5 82.6 87.8BC-T 5 117.1 89.3 120.9 100.2 114.9 127.2 119.2 106.4 113.7 82.2BC-T 6 114 110 118 112 113 114 112 100# 118BC-T 7 111 111 120 118 126 129BC-T 8 98.4 112.9 106.9 101.3 116.7 118.2 116 118.7 113.4 122.3BO-T 7 115 115 116 119 110 110 111 108 115 113BC-T* 7 100.9 114.3 111.3 107.3 112.8 111.5 104.6 106.5
D 1 123 114 120D 2 123 124 126 129 124 122 134 129D 5 51.3 134.9D 6 122 114 112 116A 11 92 101.6 94 91.4 102.9 102 99.3 104.6 97.1 95.1G 3 130 110F1 7 117 110 117 113 114 111 120 115 115 113F1* 7 124 124 120 121 121 117 114 112 120 116F1 9 120 118 111 121 115 118 120 115 124 118F1 12 96 119F2 1 110 110 108F3 1 86 88 85 91 120 120F3 10 116.4 115.2 88.4 100 131.4 132.6 130.2 125.2 135.2 132.6

25
Table 9B Statistical analysis of results for sample 5 (sodium acetate COD standard, 128 mg/l)
Methodcode
Laboratorynumber
Mean Bias Max Min Sw Sb St RSD % DoF Number of outlierresults
Est SD Est RSD % Number of resultsused
BC-T 1 89.89 -38.11 108.0 70.0 8.21 7.96 11.44 12.72 7 0 10BC-T 4 95.57 -32.43 114.6 80.0 11.65 2.65 11.95 12.50 9 0 10BC-T 5 109.11 -18.89 127.2 82.2 15.84 0 14.5 13.3 10BC-T 6 113.88 -14.13 118.0 110.0 1.62 1 2.9 2.5 8BC-T 7 119.17 -8.83 129.0 111.0 1.47 8.19 8.32 6.98 3 0 6BC-T 8 112.48 -15.52 122.3 98.4 5.75 5.66 8.07 7.17 7 0 10BO-T 7 113.20 -14.80 119.0 108.0 1.48 3.24 3.56 3.15 5 0 10BO-T* 7 108.65 -19.35 114.3 100.9 5.01 0 4.6 4.2 8
D 1 119.00 -9.00 123.0 114.0 0 4.6 3.9 3D 2 126.38 -1.63 134.0 122.0 2.21 3.65 4.26 3.37 4 0 8D 5 93.10 -34.90 134.9 51.3 0 59.1 63.5 2D 6 116.00 -12.00 122.0 112.0 4.47 0 4.3 3.7 4A 11 98.00 -30.00 104.6 91.4 3.63 3.25 4.87 4.97 7 0 10G 3 120.00 -8.00 130.0 110.0 0 14.1 11.8 2F1 7 114.50 -13.50 120.0 110.0 3.21 0 3.0 2.6 10F1* 7 118.90 -9.10 124.0 112.0 1.92 3.77 4.23 3.56 5 0 10F1 9 118.00 -10.00 124.0 111.0 4.17 0 3.7 3.1 10F1 12 107.50 -20.50 119.0 96.0 0 16.3 15.1 2F2 1 109.33 -18.67 110.0 108.0 0 1.2 1.1 3F3 1 98.33 -29.67 120.0 85.0 0 16.9 17.2 6F3 10 120.72 -7.28 135.2 88.4 4.11 16.15 16.67 13.81 4 0 10
The overall mean for method B is 107.6 ± 10.7. (The negative bias from all laboratories may suggest incomplete oxidation).

26
Table 10A Comparison of results for sample 15 (humic acid solution)
Methodcode
Laboratorynumber
Day 1 Day 2 Day 3 Day 4 Day 5
BC-T 1 94 89.2 101.2 99.6 106.6 105.6 101.9 120.9 88.6 92.5BC-T 4 105.7 106.9 101.8 101.5 112.5 106.7 118 110.7 114.3 107.6BC-T 5 133.5 129.9 118.7 117.9 127.9 116.3 124.2 126.4 125.4 109.3BC-T 6 112 111 101 114 107 110 87 105 119 89BC-T 7 106 109 124 124 125 121BC-T 8 110.1 100.7# 111.3 109.2 114.4 111.8 116.1 116.8 109.6 116.8BO-T 7 118 115 114 114 114 111 116 112 114 112BO-T* 7 106.7 105.7 109.8 110.4 110.5 109.2 111.6 109.1
D 1 116 117 108D 2 121 121 123 121 122 118 117 119D 5 136.7 130.1D 6 117 109 113 117A 11 115.1 122.9 115.9 110.6 122.9 119.9 120.4 116.5 116.8 116.8G 3 190 170F1 7 123 119 118 117 114 114 123 120 119 120F1* 7 118 118 117 116 118 115 118 120 122 120F1 9 124 118 121 114 116 120 121 118 122 125F1 12 111 124F2 1 112 109 113F3 1 88 101 115 89 120F3 10 117.8 117.8 119 94.8 193.2 177 130.2 131.4 114.6 140.4

27
Table 10B Statistical analysis of results for sample 15 (humic acid solution)
Methodcode
Laboratorynumber
Mean Max Min Sw Sb St RSD % DoF Number of outlierresults
Est SD Est RSD % Number ofresults used
BC-T 1 100.01 120.9 88.6 6.35 7.85 10.10 10.10 6 0 10BC-T 4 108.57 118.0 101.5 3.65 4.08 5.47 5.04 6 0 10BC-T 5 122.95 133.5 109.3 6.42 3.65 7.39 6.01 8 0 10BC-T 6 105.50 119.0 87.0 11.84 0 10.5 9.9 10BC-T 7 118.17 125.0 106.0 2.04 9.14 9.36 7.92 2 0 6BC-T 8 112.90 116.8 109.2 2.82 1.57 3.22 2.86 6 1 9BO-T 7 114.00 118.0 111.0 1.95 0.69 2.07 1.81 9 0 10BO-T* 7 109.13 111.6 105.7 1.08 1.81 2.10 1.93 4 0 8
D 1 113.67 117.0 108.0 0 4.9 4.3 3D 2 120.25 123.0 117.0 1.73 1.19 2.10 1.75 6 0 8D 5 133.40 136.7 130.1 0 4.7 3.5 2D 6 114.00 117.0 109.0 4.47 0 3.8 3.4 4A 11 117.78 122.9 110.6 3.36 1.86 3.85 3.27 8 0 10G 3 180.00 190.0 170.0 0 14.1 7.9 2F1 7 118.70 123.0 114.0 1.64 2.82 3.27 2.75 5 0 10F1* 7 118.20 122.0 115.0 1.34 1.64 2.12 1.79 6 0 10F1 9 119.90 125.0 114.0 3.45 0 3.4 2.9 10F1 12 117.50 124.0 111.0 0 9.2 7.8 2F2 1 111.33 113.0 109.0 0 2.1 1.9 3F3 1 102.60 120.0 88.0 0 14.6 14.3 5F3 10 133.62 193.2 94.8 12.31 28.97 31.48 23.56 5 0 10
The overall mean for method B is 111.7 ± 7.8.
28
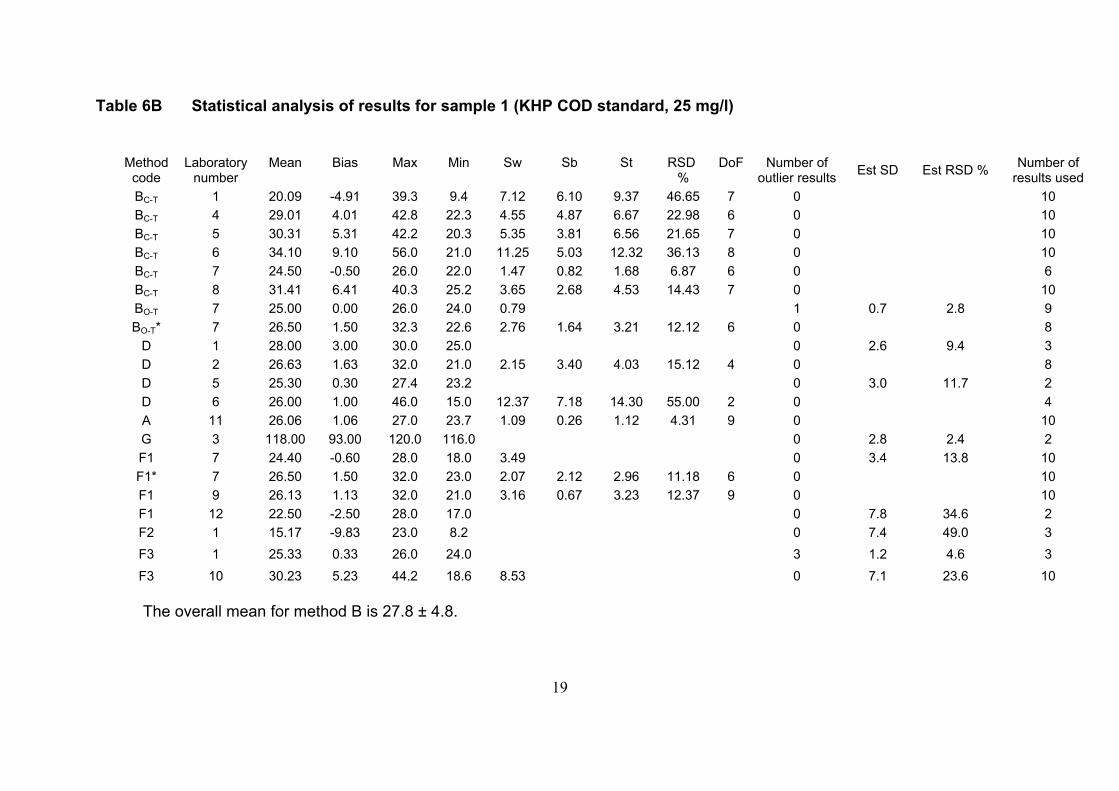
Table 11A Comparison of results for sample 13 (chloride concentration 500 mg/l)
Methodcode
Laboratorynumber
Day 1 Day 2 Day 3 Day 4 Day 5
BC-T 1 -7.3 -8.9 0.6 -4.9 -4.5 3.3 7.2 15.7 -18.3 -13.3BC-T 4 -3.4 -3 -0.5 1.3 0.5 0.6 10.4 0 8BC-T 5 19.6 12.5 15.7 8.1 17.4 6.5 16.4 8.5 12.8 6.9BC-T 6 16 -2 4 5 1 9 20 32 37BC-T 7 0.3 0.3 4 3 0.4 2.5BC-T 8 10.2 -2.5 7.2 -2.8 7.7 13.9 15.1 12.7 5.4 5.8BO-T 7 4 2 4 6 4 2 8 8 6 5BO-T* 7 6.1 0.3 3.7 5.6 11.4 8.2 0.2 4.6
D 1 15 16 0.26D 2 13 23 5 13 57 48 48 48D 5 21 18.2D 6 8 5 3 3A 11 4.2 1.2 0 4.3 0 0 4.6 4.7 4 4.9G 3 130 160F1 7 4 1 3 1 0 0 5 2 7 3F1* 7 7 8 0 0 7 2 5 4 5 0F1 9 4 2 6 2 6 1 3 3 12 11F1 12 < 5 13F2 1 1.3 8.2 11F3 1 < 5 < 5 < 5 < 5 < 5 < 5
F3 10 < 10 < 10 < 10 < 10 < 10 10.2 < 10 < 10 14.1 16

29
Table 11B Statistical analysis of results for sample 13 (chloride concentration 500 mg/l)
Methodcode
Laboratorynumber
Mean Max Min Sw Sb St RSD % DoF Number of outlierresults
Est SD Number ofresults used
BC-T 1 -3.04 15.7 -18.3 4.37 9.58 10.53 -346.30 5 0 10BC-T 4 1.54 10.4 -3.4 4.48 2.17 4.98 322.65 6 0 9BC-T 5 12.44 19.6 6.5 5.69 0 4.7 10BC-T 6 13.56 37.0 -2.0 7.79 12.87 15.05 111.01 4 0 9BC-T 7 1.75 4.0 0.3 0.95 1.48 1.75 100.26 3 0 6BC-T 8 7.27 15.1 -2.8 5.53 2.98 6.28 86.38 8 0 10BO-T 7 4.90 8.0 2.0 1.14 1.91 2.22 45.41 5 0 10BO-T* 7 5.01 11.4 0.2 2.89 2.62 3.90 77.86 5 0 8
D 1 10.42 16.0 0.3 0 8.8 3D 2 31.88 57.0 5.0 5.53 21.25 21.96 68.90 3 0 8D 5 19.60 21.0 18.2 0 2.0 2D 6 4.75 8.0 3.0 1.50 2.24 2.69 56.69 1 0 4A 11 2.79 4.9 0.0 1.68 1.48 2.24 80.30 7 0 10G 3 145.00 160.0 130.0 0 21.2 2F1 7 2.60 7.0 0.0 1.95 1.23 2.31 88.75 8 0 10F1* 7 3.80 8.0 0.0 2.28 2.26 3.21 84.46 7 0 10F1 9 5.00 12.0 1.0 2.14 3.33 3.96 79.18 5 0 10F1 12 13.00 13.0 < 5 1F2 1 6.83 11.0 1.3 0 5.0 3F3 1 < 5 < 5 < 5
F3 10 13.43 16.0 < 10 0 3.0 3
The overall mean for method B is 5.5 ± 6.1.

30
Table 12A Comparison of results for sample 8 (KHP COD standard 125 mg/l, chloride concentration 500mg/l)
Method code Laboratorynumber
Day 1 Day 2 Day 3 Day 4 Day 5
BC-T 1 109.1 109.2 106.9 109.2 108 111.4 114 113.4 106 98.6#BC-T 4 118.5 113.6 112.6 113.8 116.6 115.8 117 116.8 115.7 116BC-T 5 131.3 132.7 137.1 145.9 138.9 147.6 136.4 138.5 136.4 140BC-T 6 130 126 120 128 133 133 125 117 91#BC-T 7 124 117 137 132 123 127BC-T 8 128.5 121.9 111.1# 120.9 124.5 123 127 122.8 126 120.3BO-T 7 137# 125 124 121 121 121 125 125 121 121BO-T* 7 121.4 118.2 113.8 118.2 123.6 115 119.5 117.9
D 1 132 136 115D 2 139 171 129 140 166 189 145 162D 5 126.4 126.7D 6 143 119 124A 11 130.7 120.7 123.9 124 122.9 127.9 122.3 122.3 122.6 124.7G 3 210 170F1 7 133 121 126 124 122 124 129 126 130 128F1* 7 136 133 131 130 130 122 132 125F1 9 128 132 122 130 149# 131 131 126 129 134F1 12 127 131F2 1 121 123 119F3 1 98 102 97 115 94 130F3 10 127.6 140.4 128.8 105.2# 144.6 147.2 141.8 139.2 152.8 151.4

31
Table 12B Statistical analysis of results for sample 8 (KHP COD standard 125 mg/l, chloride concentration 500 mg/l)
Methodcode
Laboratorynumber
Mean Bias Max Min Sw Sb St RSD % DoF Number ofoutlier results
Est SD Est RSD % Number ofresults used
BC-T 1 109.69 -15.31 114.0 106.0 1.47 2.24 2.67 2.44 5 1 9BC-T 4 115.64 -9.36 118.5 112.6 1.62 0.84 1.82 1.58 8 0 10BC-T 5 138.48 13.48 147.6 131.3 4.15 3.18 5.23 3.78 7 0 10BC-T 6 126.50 1.50 133.0 117.0 4.24 4.24 6.00 4.74 5 1 8BC-T 7 126.67 1.67 137.0 117.0 0 7.1 5.6 6BC-T 8 123.88 -1.12 128.5 120.3 3.46 1 2.8 2.3 9BO-T 7 122.67 -2.33 125.0 121.0 1.06 1.73 2.03 1.66 4 1 9BO-T* 7 118.45 -6.55 123.6 113.8 3.64 0 3.2 2.7 8
D 1 127.67 2.67 136.0 115.0 0 11.2 8.7 3D 2 155.13 30.13 189.0 129.0 15.66 13.67 20.79 13.40 5 0 8D 5 126.55 1.55 126.7 126.4 0 0.2 0.2 2D 6 128.67 3.67 143.0 119.0 0 12.7 9.8 3A 11 124.20 -0.80 130.7 120.7 3.60 0 3.0 2.4 10G 3 190.00 65.00 210.0 170.0 0 28.3 14.9 2F1 7 126.30 1.30 133.0 121.0 4.06 0 3.7 3.0 10F1* 7 129.88 4.88 136.0 122.0 3.92 2.28 4.54 3.49 2 0 8F1 9 129.22 4.22 134.0 122.0 4.03 1 3.6 2.8 9F1 12 129.00 4.00 131.0 127.0 0 2.8 2.2 2F2 1 121.00 -4.00 123.0 119.0 0 2.0 1.7 3F3 1 106.00 -19.00 130.0 94.0 0 13.9 13.1 6F3 10 141.53 16.53 152.8 127.6 4.73 6.95 8.41 5.94 4 1 9
The overall mean for methods A and B is 123.4 ± 9.1.

32
Table 13A Comparison of results for sample 3 (chloride concentration 2000 mg/l)
Methodcode
Laboratorynumber
Day 1 Day 2 Day 3 Day 4 Day 5
BC-T 1 3.7 -1.3 -7 -10.2 -0.3 0.2 17.2 15.7 1.9 0.2BC-T 4 -1 0.7 7.1 11.3 9.6 16.6 5.6 3.2 5.7 -2.9BC-T 5 19.6 37.3 22.7 12.6 7.9 15.2 17.8 25.7 31.1 5.4BC-T 6 14 7 13 21 12 20 2 44# 12 11BC-T 7 11 12 12 10 10 9BC-T 8 2.9 6.4 10.3 8.2 12.3 7.5 24 20.8 8.5 7.7BO-T 7 12 10 10 11 6 9 8 10 11 7BO-T* 7 14.7 16.6 16.5 16.8 4.6 6.6 11.5 9.3
D 1 18 7 12D 2 48 54 22 24 36 110# 50 53D 5 21.8 10.4D 6 5 21 7A 11 2.3 2.3 8 4.3 8.4 8 4.4 7.6 3.8 7.6G 3 150 180F1 7 12 8 8 9 5 2 12 6 11 7F1* 7 19 2 20 10 14 14 9 7 13 8F1 9 25 27 0 0 17 34 27 26 55 60F1 12 < 5 < 38F2 1 6.9 44.5 2F3 1 < 5 < 5 < 5 14 < 5 22
F3 10 14.1 12.8 < 10 11.5 19.9 19.9 10.2 16 23.7 19.9

33
Table 13B Statistical analysis of results for sample 3 (chloride concentration 2000 mg/l)
Methodcode
Laboratorynumber
Mean Max Min Sw Sb St RSD % DoF Number of outlierresults
Est SD Number of resultsused
BC-T 1 2.01 17.2 -10.2 2.02 8.93 9.15 455.32 4 0 10BC-T 4 5.59 16.6 -2.9 3.86 4.78 6.15 109.99 6 0 10BC-T 5 19.53 37.3 5.4 10.92 0 10.0 10BC-T 6 12.44 21.0 2.0 4.72 1 5.9 9BC-T 7 10.67 12.0 9.0 1.00 0.76 1.26 11.80 6 0 6BC-T 8 10.86 24.0 2.9 2.25 6.57 6.95 63.96 4 0 10BO-T 7 9.40 12.0 6.0 1.84 0.47 1.90 20.25 9 0 10BO-T* 7 12.08 16.8 4.6 1.25 5.04 5.19 42.98 3 0 8
D 1 12.33 18.0 7.0 0 5.5 3D 2 41.00 54.0 22.0 2.86 16.19 16.44 40.09 3 1 7D 5 16.10 21.8 10.4 0 8.1 2D 6 11.00 21.0 5.0 0 8.7 3A 11 5.67 8.4 2.3 1.96 1.61 2.54 44.80 7 0 10G 3 165.00 180.0 150.0 0 21.2 2F1 7 8.00 12.0 2.0 2.79 1.65 3.24 40.55 8 0 10F1* 7 11.60 20.0 2.0 6.47 0 5.5 10F1 9 27.10 60.0 0.0 5.65 19.99 20.78 76.66 4 0 10F1 12F2 1 17.80 44.5 2.0 0 23.3 3F3 1 18.00 22.0 < 5 0 4.0 2
F3 10 15.30 23.7 < 10 3.03 5.07 5.91 38.64 5 0 5.3 9
The overall mean for method B is 10.1 ± 5.5.

34
Table 14A Comparison of results for sample 2 (final sewage effluent1)
Methodcode
Laboratorynumber
Day 1 Day 2 Day 3 Day 4 Day 5
BC-T 1 38.1 40.6 41.3 38.7 47.2 41.9 49.7 45.1 48.4 41.2BC-T 4 61.6 48 42.4 40.8 54.5 54.5 53 62.5 49 60.7BC-T 5 51.6 74.4 56.4 67.9 56.7 64.7 54.9 62.8 60.3 58.8BC-T 6 49 54 53 46 50 50 76 60 67 44BC-T 7 57 52 55 55 54 57BC-T 8 40.8 53.2 57.5 76.4 60.1 54.7 62.3 61.8 59.2 54.6BO-T 7 54 54 52 54 53 54 53 53 56 56BO-T* 7 54.6 57.8 41.9 36.9 46.9 42.1 49.1 44.7
D 1 75 65 74D 2 80 70 68 72 84 83 85 82D 5 59.1 63.5D 6 77 59 67 59A 11 59.6 57.3 57 59.2 61.4 60 59.2 55.4 58.4 55.4G 3 130 110F1 7 57 50 56 54 54 53 60 56 59 55F1* 7 59 62 47 43 47 45 46 43 67 58F1 9 52 55 59 53 61 55 59 57 64 64F1 12 55 60F2 1 52 45.8 48F3 1 21 19 19 59 54 63F3 10 56.3 49.4 51.3 50 66.3 66.3 65.1 58.9 67.6 67.6

35
Table 14B Statistical analysis of results for sample 2 (final sewage effluent 1)
Methodcode
Laboratorynumber
Mean Max Min Sw Sb St RSD % DoF Number of outlierresults
Est SD Est RSD (%)
Number ofresults used
BC-T 1 43.22 49.7 38.1 3.38 2.46 4.18 9.67 7 0 10BC-T 4 52.70 62.5 40.8 6.44 4.42 7.81 14.82 8 0 10BC-T 5 60.85 74.4 51.6 8.84 0 6.8 11.2 10BC-T 6 54.90 76.0 44.0 9.27 4.03 10.11 18.41 8 0 10BC-T 7 55.00 57.0 52.0 2.38 0 1.9 3.5 6
BC-T 8 58.06 76.4 40.8 7.49 5.17 9.10 15.68 8 0 10
BO-T 7 53.90 56.0 52.0 0.71 1.14 1.34 2.49 5 0 10
BO-T* 7 46.75 57.8 36.9 3.12 6.68 7.37 15.77 4 0 8
D 1 71.33 75.0 65.0 0 5.5 7.7 3
D 2 78.00 85.0 68.0 3.97 6.05 7.24 9.28 4 0 8
D 5 61.30 63.5 59.1 0 3.1 5.1 2
D 6 65.50 77.0 59.0 9.85 0 8.5 13.0 4
A 11 58.29 61.4 55.4 1.88 0.65 1.99 3.42 9 0 10
G 3 120.00 130.0 110.0 0 14.1 11.8 2
F1 7 55.40 60.0 50.0 2.93 0 2.9 5.3 10
F1* 7 51.70 67.0 43.0 3.45 8.65 9.32 18.02 5 0 10
F1 9 57.90 64.0 52.0 2.92 3.29 4.39 7.59 6 0 10
F1 12 57.50 60.0 55.0 0 3.5 6.1 2
F2 1 48.60 52.0 45.8 0 3.1 6.5 3
F3 1 39.17 63.0 19.0 0 21.6 55.1 6
F3 10 59.88 67.6 49.4 2.96 7.46 8.02 13.40 5 0 10
The overall mean for method B is 54.1 ± 5.5.

36
Table 15A Comparison of results for sample 4 (final sewage effluent 2)
Method code Laboratorynumber
Day 1 Day 2 Day 3 Day 4 Day 5
BC-T 1 54.4 55.5 54 57.6 58.4 60.7 60 63.4 75.8 77.3BC-T 4 73.8 61.3 55.7 58.1 69.4 64.3 62.4 64.5 69.3 59.4BC-T 5 71.6 77.9 77.1 65.6 79.9 74.1 77.8 77.8 67.6 72.7BC-T 6 85 79 78 77 71 75 71 95 104 99BC-T 7 69 69 77 77 75 78BC-T 8 68.5 63.3 71.8 69 80.2 77.3 81.3 77.8 75.3 74.7BO-T 7 74 73 75 77 72 72 72 71 72 72BO-T* 7 75.7 62.3 53.1 56.9 52.9 55.2 68.3 68
D 1 92 90 89D 2 105 99 113 106 95 113 102 98D 5 64.2 94D 6 91 79 76 77A 11 78.1 65.3 64 71.7 75.8 72 74.5 76.4 69.3 65.3G 3 80 70F1 7 76 71 76 76 72 71 76 76 78 75F1* 7 75 72 61 65 64 60 63 56 79 76F1 9 73 67 76 69 72 76 76 73 80 81F1 12 64 72F2 1 70 65 82F3 1 44 45 40 69 71 86F3 10 76.4 74.3 70.2 70.9 87 80.1 77.9 82.3 83.8 86.2

37
Table 15B Statistical analysis of results for sample 4 (final sewage effluent 2)
Methodcode
Laboratorynumber
Mean Max Min Sw Sb St RSD % DoF Number of outlierresults
Est SD Est RSD (%)
Number ofresults used
BC-T 1 61.71 77.3 54.0 1.82 8.64 8.83 14.32 4 0 10BC-T 4 63.82 73.8 55.7 5.39 1.82 5.69 8.92 9 0 10BC-T 5 74.21 79.9 65.6 4.81 0 4.8 6.5 10BC-T 6 84.40 104.0 71.0 8.09 9.25 12.28 14.73 6 0 10BC-T 7 74.17 78.0 69.0 1.22 4.40 4.56 6.15 3 0 6
BC-T 8 73.92 81.3 63.3 2.36 5.52 6.00 8.12 5 0 10
BO-T 7 73.00 77.0 71.0 0.77 1.75 1.92 2.63 5 0 10
BO-T* 7 61.55 75.7 52.9 4.99 7.32 8.86 14.40 4 0 8
D 1 90.33 92.0 89.0 0 1.5 1.7 3
D 2 103.88 113.0 95.0 7.29 0 6.7 6.4 8
D 5 79.10 94.0 64.2 0 21.1 26.6 2
D 6 80.75 91.0 76.0 6.02 4.24 7.37 9.12 2 0 4
A 11 71.24 78.1 64.0 5.07 0.38 5.09 7.14 9 0 10
G 3 75.00 80.0 70.0 0 7.1 9.4 2
F1 7 74.70 78.0 71.0 1.87 1.68 2.52 3.37 7 0 10
F1* 7 67.10 79.0 56.0 3.15 7.58 8.21 12.23 5 0 10
F1 9 74.30 81.0 67.0 3.33 3.09 4.54 6.11 7 0 10
F1 12 68.00 72.0 64.0 0 5.7 8.3 2
F2 1 72.33 82.0 65.0 0 8.7 12.1 3
F3 1 59.17 86.0 40.0 0 18.7 31.7 6
F3 10 78.91 87.0 70.2 2.79 5.64 6.29 7.97 5 0 10
The overall mean for method B is 72.0 ± 7.3.

38
Table 16A Comparison of results for sample 6 (final sewage effluent 3)
Methodcode
Laboratorynumber
Day 1 Day 2 Day 3 Day 4 Day 5
BC-T 1 96.3 91.5 82 84.9 91.3 98.1 102 101.9 79 85.2BC-T 4 107.7 102.6 96.8 87.9 114.6 105.2 127.6 103.3 102.3 106.7BC-T 5 106.4 95.1 129.4 110.2 108.3 109.8 113.6 110.7 107.8 105.7BC-T 6 109 109 108 106 109 139 108 132 112 105BC-T 7 109 104 117 113 112 114BC-T 8 106.5 102.5 108.1 100.9 109.1 109 114.6 116.5 107.9BO-T 7 112 109 110 106 105 102 109 109 107 105BO-T* 7 89.4 85.6 103.2 102.3 107.3 105.1 97.7 103.1
D 1 129 127 128D 2 123 170 128 132 153 149 136 161D 5 104.1 117.4D 6 140 137 142 115A 11 119.2 127 116 114.7 112.6 117.9 120.8 120.8 118.9 113G 3 160 150F1 7 116 113 112 111 110 111 114 111 108 111F1* 7 120 125 119 115 109 110 107 104 120 115F1 9 118 113 108 113 112 114 114 113 120 119F1 12 105 113F2 1 107 109 102F3 1 82 81 76 92 120 125F3 10 109 126.4 77 77 157.2 132.6 120.2 141.8 133.8 132.6

39
Table 16B Statistical analysis of results for sample 6 (final sewage effluent 3)
Methodcode
Laboratorynumber
Mean Max Min Sw Sb St RSD % DoF Number of outlierresults
Est SD Est RSD (%)
Number ofresults used
BC-T 1 91.22 102.0 79.0 3.41 7.98 8.68 9.51 5 0 10BC-T 4 105.47 127.6 87.9 8.96 5.74 10.64 10.09 8 0 10BC-T 5 109.70 129.4 95.1 7.15 4.87 8.65 7.89 8 0 10BC-T 6 113.70 139.0 105.0 12.37 0 11.8 10.3 10BC-T 7 111.50 117.0 104.0 2.74 4.00 4.85 4.35 4 0 6
BC-T 8 108.34 116.5 100.9 2.99 4.78 5.64 5.20 5 0 9
BO-T 7 107.40 112.0 102.0 1.95 2.35 3.05 2.84 6 0 10
BO-T* 7 99.21 107.3 85.6 2.48 7.97 8.35 8.42 3 0 8
D 1 128.00 129.0 127.0 0 1.0 0.8 3
D 2 144.00 170.0 123.0 18.93 0 16.8 11.7 8
D 5 110.75 117.4 104.1 0 9.4 8.5 2
D 6 133.50 142.0 115.0 13.58 0 12.5 9.4 4
A 11 118.09 127.0 112.6 3.54 2.62 4.41 3.73 7 0 10
G 3 155.00 160.0 150.0 0 7.1 4.6 2
F1 7 111.70 116.0 108.0 1.70 1.50 2.27 2.03 7 0 10
F1* 7 114.40 125.0 104.0 2.76 6.52 7.08 6.19 5 0 10
F1 9 114.40 120.0 108.0 2.37 2.92 3.76 3.28 6 0 10
F1 12 109.00 113.0 105.0 0 5.7 5.2 2
F2 1 106.00 109.0 102.0 0 3.6 3.4 3
F3 1 96.00 125.0 76.0 0 21.2 22.1 6
F3 10 120.76 157.2 77.0 11.73 24.96 27.58 22.84 5 0 10
The overall mean for method B is 106.8 ± 9.7.

40
Table 17A Comparison of results for sample 10 (final sewage effluent 4)
Methodcode
Laboratorynumber
Day 1 Day 2 Day 3 Day 4 Day 5
BC-T 1 58.1 52.5 52.2 55.4 51.6 62.4 77.4 65.6 60.8 47.9BC-T 4 81.1 63.9 48.4 48.4 66.4 62.6 68 68.3 63 63BC-T 5 67.2 68.7 72.6 74.1 71.9 78.5 75.7 74.9 76.4 69.8BC-T 6 59 72 75 69 70 68 78 104# 77 75BC-T 7 75 75 80 70 69 75BC-T 8 72 68.5 72.9 71.2 70.2 70.7 77.4 77.7 71.9 72.4BO-T 7 71 71 72 71 70 65 72 68 72 70BO-T* 7 51.7 53.3 72.2 118.8# 51.3 53.9 67.7 70.9
D 1 81 85 74D 2 117 100 87 90 97 142 102 107D 5 66.4 68.6D 6 91 84 74 78A 11 77.8 80.4 78 81.9 77.8 78 76.4 72.6 79 77.4G 3 180 80F1 7 78 73 74 75 73 71 72 70 76 75F1* 7 83 81 63 55 60 60 78 77 87 78F1 9 72 77 71 69 70 73 75 72 79 80F1 12 68 67F2 1 69 69 65F3 1 42 40 37 67 41 71F3 10 72.3 73.6 61.3 57 93.8 84.6 80.8 84.6 82.3 84.6

41
Table 17B Statistical analysis of results for sample 10 (final sewage effluent 4)
Methodcode
Laboratorynumber
Mean Max Min Sw Sb St RSD % DoF Number of outlierresults
Est SD Est RSD (%)
Number ofresults used
BC-T 1 58.39 77.4 47.9 6.81 5.66 8.85 15.16 7 0 10BC-T 4 63.31 81.1 48.4 5.57 8.21 9.92 15.67 5 0 10BC-T 5 72.98 78.5 67.2 3.04 2.08 3.68 5.04 8 0 10BC-T 6 71.44 78.0 59.0 5.16 2.57 5.76 8.07 6 1 9BC-T 7 74.00 80.0 69.0 4.76 0 4.0 5.4 6
BC-T 8 72.49 77.7 68.5 1.25 2.83 3.09 4.27 5 0 10
BO-T 7 70.20 72.0 65.0 2.14 0.52 2.21 3.15 9 0 10
BO-T* 7 60.14 72.2 51.3 1.81 9.59 9.75 16.22 2 1 7
D 1 80.00 85.0 74.0 0 5.6 7.0 3
D 2 105.25 142.0 87.0 17.13 4.26 17.65 16.77 7 0 8
D 5 67.50 68.6 66.4 0 1.6 2.3 2
D 6 81.75 91.0 74.0 4.03 7.62 8.62 10.54 1 0 4
A 11 77.93 81.9 72.6 1.98 1.54 2.50 3.21 7 0 10
G 3 130.00 180.0 80.0 0 70.7 54.4 2
F1 7 73.70 78.0 70.0 1.87 1.60 2.46 3.34 7 0 10
F1* 7 72.20 87.0 55.0 3.87 11.44 12.08 16.73 4 0 10
F1 9 73.80 80.0 69.0 2.19 3.29 3.95 5.35 5 0 10
F1 12 67.50 68.0 67.0 0 0.7 1.0 2
F2 1 67.67 69.0 65.0 0 2.3 3.4 3
F3 1 49.67 71.0 37.0 0 15.1 30.4 6
F3 10 77.49 93.8 57.0 3.53 11.53 12.06 15.56 4 0 11.4 14.8 10
The overall mean for method B is 69.0 ± 5.9.

42
Table 18A Comparison of results for sample 12 (final sewage effluent 5)
Methodcode
Laboratorynumber
Day 1 Day 2 Day 3 Day 4 Day 5
BC-T 1 106.9 117.9 110.6 118.5 113.7 125.2 141.3 178.3 91.3 78.8BC-T 4 131.7 151.2 136.1 121.4 131.4 129.8 130 125.9 125.9 142BC-T 5 143.5 142 151.7 153.2 142.5 135.9 139.9 142.8 137.8 127.5BC-T 6 137 135 137 138 134 117 124 140BC-T 7 141 140 151 152 137 141BC-T 8 131.6 130.1 129.1 133.6 140.3 136.5 128.2 137.5 129.2 128.4BO-T 7 129 135 132 137 134 130 137 137 132 133BO-T* 7 115.9 98.7 121.4 117.3 116 126.2 109.1 109.1
D 1 153 169 148D 2 180 177 167 179 175 183 172 169D 5 136.4 133.8D 6 158 151 152 157A 11 146 140.4 137.9 143.4 145.4 143.9 135.6 137.5 138.7 136.8G 3 150 210F1 7 144 143 139 141 136 138 145 144 146 144F1* 7 106 105 94 92 97 91 110 115 127 125F1 9 143 143 136 141 143 143 144 138 146 147F1 12 134 143F2 1 145 143 138F3 1 156 144 160 152 156 154F3 10 122.6 120.2 115.2 116.4 154.4 167.6 151.4 164.6 160.2 164.6

43
Table 18B Statistical analysis of results for sample 12 (final sewage effluent 5)
Methodcode
Laboratorynumber
Mean Max Min Sw Sb St RSD % DoF Number ofoutlier results
Est SD Est RSD % Number of resultsused
BC-T 1 118.25 178.3 78.8 13.57 25.05 28.49 24.09 5 0 10BC-T 4 132.54 151.2 121.4 9.35 0 8.7 6.6 10BC-T 5 141.68 153.2 127.5 4.03 6.57 7.70 5.44 5 0 10BC-T 6 132.75 140.0 117.0 3.39 8.62 9.26 6.98 2 0 8BC-T 7 143.67 152.0 137.0 1.73 6.71 6.93 4.83 2 0 6BC-T 8 132.45 140.3 128.2 3.52 2.64 4.40 3.32 7 0 10BO-T 7 133.60 137.0 129.0 2.79 0.88 2.93 2.19 9 0 10BO-T* 7 114.21 126.2 98.7 7.22 4.82 8.68 7.60 6 0 8
D 1 156.67 169.0 148.0 0 11.0 7.0 3D 2 175.25 183.0 167.0 5.32 1.81 5.62 3.20 7 0 8D 5 135.10 136.4 133.8 0 1.8 1.4 2D 6 154.50 158.0 151.0 4.30 0 3.5 2.3 4A 11 140.56 146.0 135.6 2.67 2.89 3.93 2.80 6 0 10G 3 180.00 210.0 150.0 0 42.4 23.6 2F1 7 142.00 146.0 136.0 1.18 3.31 3.51 2.47 4 0 10F1* 7 106.20 127.0 91.0 2.65 13.61 13.87 13.06 4 0 10F1 9 142.40 147.0 136.0 2.49 2.36 3.43 2.41 7 0 10F1 12 138.50 143.0 134.0 0 6.4 4.6 2F2 1 142.00 145.0 138.0 0 3.6 2.5 3F3 1 153.67 160.0 144.0 0 5.4 3.5 6F3 10 143.72 167.6 115.2 6.12 22.66 23.47 16.33 4 0 10
The overall mean for method B is 133.6 ± 8.2.

44
Table 19A Comparison of results for sample 14 (final sewage effluent 6)
Methodcode
Laboratorynumber
Day 1 Day 2 Day 3 Day 4 Day 5
BC-T 1 81.6 84.4 88.5 86.8 85.4 86.9 109.8 117.1 72 79BC-T 4 96 93.2 87.3 84.1 91.3 94.7 107.3 94.9 106.3 93BC-T 5 106.4 95.4 129.4 119.4 105.4 106.9 118.6 108.6 120.2 102BC-T 6 105 96 116 99 101 111 95 118 111BC-T 7 95 96 109 110 108 109BC-T 8 97.7 95.8 99.1 95.2 105.6 96.3 102.2 102 93.1 103.7BO-T 7 103 105 103 101 97 97 102 100 101 100BO-T* 7 96.4 85.9 99.8 100.1 96.8 104.4 85.1 95.8
D 1 120 116 100D 2 159 158 141 165 145 161 164 159D 5 112.7 97.4D 6 130 118 117 115A 11 109 114.7 104 112.6 117.2 111.9 107 103.2 111 109.1G 3 190 210F1 7 107 104 105 103 100 104 110 105 110 108F1* 7 108 107 88 93 93 91 102 104 112 107F1 9 110 108 105 102 108 105 101 106 111 114F1 12 92 99F2 1 98 101 97F3 1 74 110 72 110 82 110F3 10 98.8 107.6 92.4 101.2 111.4 131.4 122.6 110.2 132.6 130.2

45
Table 19B Statistical analysis of results for sample 14 (final sewage effluent 6)
Methodcode
Laboratorynumber
Mean Max Min Sw Sb St RSD % DoF Number ofoutlier results
Est SD Est RSD % Number ofresults used
BC-T 1 89.15 117.1 72.0 3.40 14.17 14.57 16.34 4 0 10BC-T 4 94.81 107.3 84.1 6.00 4.39 7.44 7.85 7 0 10BC-T 5 111.23 129.4 95.4 8.09 6.72 10.52 9.46 7 0 10BC-T 6 105.78 118.0 95.0 9.41 0 8.6 8.1 9BC-T 7 104.50 110.0 95.0 0.71 7.79 7.83 7.49 2 0 6BC-T 8 99.07 105.6 93.1 4.67 0 4.1 4.2 10BO-T 7 100.90 105.0 97.0 1.14 2.43 2.68 2.66 5 0 10BO-T* 7 95.54 104.4 85.1 5.94 3.52 6.91 7.23 6 0 8
D 1 112.00 120.0 100.0 0 10.6 9.4 3D 2 156.50 165.0 141.0 10.36 0 8.8 5.6 8D 5 105.05 112.7 97.4 0 10.8 10.3 2D 6 120.00 130.0 115.0 6.08 3.67 7.11 5.92 2 0 4A 11 109.97 117.2 103.2 3.91 2.26 4.52 4.11 8 0 10G 3 200.00 210.0 190.0 0 14.1 7.1 2F1 7 105.60 110.0 100.0 2.41 2.19 3.25 3.08 7 0 10F1* 7 100.50 112.0 88.0 2.43 8.61 8.95 8.90 4 0 10F1 9 107.00 114.0 101.0 2.37 3.46 4.19 3.92 6 0 10F1 12 95.50 99.0 92.0 0 5.0 5.2 2F2 1 98.67 101.0 97.0 0 2.1 2.1 3F3 1 93.00 110.0 72.0 0 18.9 20.3 6F3 10 113.84 132.6 92.4 8.45 12.58 15.15 13.31 5 0 14.6 12.8 10
The overall mean for method B is 100.8 ± 7.3.

46
Table 20A Comparison of results for sample 16 (final sewage effluent 7)
Methodcode
Laboratorynumber
Day 1 Day 2 Day 3 Day 4 Day 5
BC-T 1 205.5 183 192.4 201.7 195.2 200.1 213.1 182.8 158BC-T 4 230.3 216.4 206.1 206.1 211.7 228.1 204.6 246.9 198.9 195.5BC-T 5 197.4 185 208 203.4 255.9 242.8 258.5 221.4 231.8 233.3BC-T 6 227 230 227 236 229 234 239 263 201 243BC-T 7 200 206 230 236 234 230BC-T 8 201.5 216.2 195.3 196.9 218.1 217 226 217.1 204 218.5BO-T 7 216 220 216 210 212 212 210 206 208 214BO-T* 7 233.8 266.3 200.1 197.6 213.4 209.5 217.5 220.6
D 1 243 259 228D 2 246 268 254 278 236 250 276 294D 5 263.9 236.8D 6 262 238 232 235A 11 220 221.2 215.9 233.5 231.4 227.9 217.8 214 219.9 214.2G 3 230 200F1 7 228 234 236 230 236 234 222 222 220 224F1* 7 236 236 212 210 214 216 226 222 228 222F1 9 232 234 228 222 224 220 222 220 250 256F1 12 220 234F2 1 224 254 226F3 1 170 188 189 180 184 240#F3 10 251.2 260.6 257.6 238 272.8 272.8

47
Table 20B Statistical analysis of results for sample 16 (final sewage effluent 7)
Methodcode
Laboratorynumber
Mean Max Min Sw Sb St RSD % DoF Number of outlierresults
Est SD Est RSD (%)
Number ofresults used
BC-T 1 192.42 213.1 158.0 12.41 9.65 15.72 8.17 5 0 9BC-T 4 214.46 246.9 195.5 15.04 6.15 16.25 7.58 8 0 10BC-T 5 223.75 258.5 185.0 13.13 22.56 26.10 11.67 5 0 10BC-T 6 232.90 263.0 201.0 15.67 0 15.5 6.7 10BC-T 7 222.67 236.0 200.0 3.83 16.82 17.25 7.75 2 0 6
BC-T 8 211.06 226.0 195.3 7.14 8.35 10.99 5.21 6 0 10
BO-T 7 212.40 220.0 206.0 3.22 2.85 4.30 2.03 7 0 10
BO-T* 7 219.85 266.3 197.6 11.66 20.17 23.30 10.60 4 0 8
D 1 243.33 259.0 228.0 0 15.5 6.4 3
D 2 262.75 294.0 236.0 14.05 14.52 20.21 7.69 5 0 8
D 5 250.35 263.9 236.8 0 19.2 7.7 2
D 6 241.75 262.0 232.0 12.09 7.94 14.47 5.98 2 0 4
A 11 221.58 233.5 214.0 6.09 3.69 7.12 3.21 8 0 10
G 3 215.00 230.0 200.0 0 21.2 9.9 2
F1 7 228.60 236.0 220.0 3.03 5.81 6.55 2.87 5 0 10
F1* 7 222.20 236.0 210.0 2.45 9.58 9.88 4.45 4 0 10
F1 9 230.8 256.0 220.0 3.10 13.09 13.45 5.83 4 0 10
F1 12 227.00 234.0 220.0 0 9.9 4.4 2
F2 1 234.67 254.0 224.0 0 16.8 7.1 3
F3 1 182.20 189.0 170.0 1 7.7 4.2 5
F3 10 258.83 272.8 238.0 8.87 11.11 14.22 5.49 4 0 6
The overall mean for method B is 215.7 ± 12.8.

48
Table 21 Limits of detection
Methodcode
Laboratorynumber Sample 9
(blank)(4.65 x Sw)
Sample 13(500 mg/l chloride)
(4.65 x Sw)
Sample 3 (2000 mg/l chloride)
(4.65 x Sw)
Sample 1(KHP COD standard, 25 mg/l)
(4.65 x Sw)
BC-T 1 15 20 9 33BC-T 4 12 21 18 21BC-T 5 15 26 51 25BC-T 6 34 36 22 52BC-T 7 4 4 5 7BC-T 8 14 26 10 17BO-T 7 2 5 9 4BO-T* 7 7 13 6 13
D 1D 2 10 26 13 10D 5D 6 10 7 58A 11 8 8 9 5G 3F1 7 4 9 13 16F1* 7 14 11 30 10F1 9 9 10 26 15F1 12F2 1F3 1F3 10 14 40

49
Table 22 Summary of the mean COD results for all methods (mg/l)
Samplenumber
COD (chloride)
Method BC-T(6 labs)
Method BO-T(1 lab)
Method D(4 labs)
Method A(1 lab)
Method G(1 lab)
Method F1(3 labs)
Method F2(1 lab)
Method F3(2 labs)
13 (500) 6 5 17 3 145 7 7 133 (2000) 10 9 20 6 165 18 18 172 (80) 54 54 69 58 120 57 49 504 (80) 72 73 89 71 75 72 72 696 (209) 107 107 129 118 155 112 106 10810 (350) 69 70 84 78 130 72 68 6412 (106) 134 134 155 141 141 141 142 14914 (368) 101 101 123 110 200 103 99 10316 (440) 216 212 250 222 215 229 235 2218 125 (500) 124 123 135 124 190 128 121 1249 blank (<10) 3 1 0 1 < 5 2 7 71 25 28 25 27 26 118 24 15 2811 125 124 122 120 126 < 5 126 119 1175 128 107 113 114 98 120 113 109 1107 160 156 157 158 158 105 160 154 17815 (<10) 111 114 120 118 180 119 111 118

Address for correspondence However well procedures may be tested, there is always the possibility of discovering hitherto unknown problems. Analysts with such information are requested to contact the Secretary of the Standing Committee of Analysts at the address given below. In addition, if users would like to receive advanced notice of forthcoming publications please contact the Secretary on the Agency’s web-page. Standing Committee of Analysts Environment Agency (National Laboratory Service) 56 Town Green Street Rothley Leicestershire, LE7 7NW http://www.environment-agency.gov.uk/nls
50

CONTACTS:ENVIRONMENT AGENCY HEAD OFFICE
Rio House, Waterside Drive, Aztec West, Almondsbury, Bristol BS32 4UD
www.environment-agency.gov.ukwww.environment-agency.wales.gov.uk
ENVIRONMENT AGENCY REGIONAL OFFICESANGLIANKingfisher HouseGoldhay WayOrton GoldhayPeterborough PE2 5ZR
MIDLANDSSapphire East550 Streetsbrook RoadSolihull B91 1QT
NORTH EASTRivers House21 Park Square SouthLeeds LS1 2QG
NORTH WESTPO Box 12Richard Fairclough HouseKnutsford RoadWarrington WA4 1HG
SOUTHERNGuildbourne HouseChatsworth RoadWorthingWest Sussex BN11 1LD
SOUTH WESTManley HouseKestrel WayExeter EX2 7LQ
THAMESKings Meadow HouseKings Meadow RoadReading RG1 8DQ
WALESCambria House29 Newport RoadCardiff CF24 0TP
NORTH EAST
Leeds
Warrington
Solihull
MIDLANDSANGLIAN
Peterborough
SOUTHERNSOUTH WEST
Exeter
Cardiff
BristolTHAMES London
Worthing
Reading
WALES
NORTH WEST
E N V I R O N M E N T A G E N C YG E N E R A L E N Q U I R Y L I N E
08708 506 506
E N V I R O N M E N T A G E N C YE M E R G E N C Y H O T L I N E
0800 80 70 60
E N V I R O N M E N T A G E N C YF L O O D L I N E
0845 988 1188

Related Documents