International Journal of Economics, Commerce and Management United Kingdom ISSN 2348 0386 Vol. VII, Issue 8, August 2019 Licensed under Creative Common Page 608 http://ijecm.co.uk/ THE DETERMINANTS OF STOCK RETURNS ON BUILDING CONSTRUCTION COMPANIES LISTED ON STOCK EXCHANGE: CASE IN INDONESIA Rina Erfina Magister of Management, Mercu Buana University, Jakarta, Indonesia [email protected] Augustina Kurniasih Lecturer, Faculty Business and Economic, Mercu Buana University, Jakarta, Indonesia [email protected] Abstract The purpose of this research is to analyze the effect of macroeconomics (economic growth, inflation, exchange rate and interest rate) and corporate financial performance (leverage and profitability) on stock returns of Building construction companies in Indonesia. The research uses annual data taken from the Indonesia Stock Exchange, Bank of Indonesia and the Central Bureau of Statistics for the period 2013 to 2017. Populations of this research are 17 building construction companies listed on the IDX. The companies that meet the sample criteria are 9 companies. The analytical method used is the panel data regression method. The results showed that economic growth, inflation, exchange rate, interest rate, and debt to equity ratio have a positive and significant effect on stock returns, while return on equity has negative and insignificant effect. Keywords: Stock return; macroeconomics; return on equity; debt to equity ratio INTRODUCTION The property, real estate and building construction sectors are one of the sectors that has stock price movements tend to increase, but the stock return experienced not stable fluctuations and tended to decline. The property, real estate and building construction sector consists of two sub-

Welcome message from author
This document is posted to help you gain knowledge. Please leave a comment to let me know what you think about it! Share it to your friends and learn new things together.
Transcript
International Journal of Economics, Commerce and Management United Kingdom ISSN 2348 0386 Vol. VII, Issue 8, August 2019
Licensed under Creative Common Page 608
http://ijecm.co.uk/
THE DETERMINANTS OF STOCK RETURNS ON BUILDING
CONSTRUCTION COMPANIES LISTED ON STOCK
EXCHANGE: CASE IN INDONESIA
Rina Erfina
Magister of Management, Mercu Buana University, Jakarta, Indonesia
Augustina Kurniasih
Lecturer, Faculty Business and Economic, Mercu Buana University, Jakarta, Indonesia
Abstract
The purpose of this research is to analyze the effect of macroeconomics (economic growth,
inflation, exchange rate and interest rate) and corporate financial performance (leverage and
profitability) on stock returns of Building construction companies in Indonesia. The research
uses annual data taken from the Indonesia Stock Exchange, Bank of Indonesia and the Central
Bureau of Statistics for the period 2013 to 2017. Populations of this research are 17 building
construction companies listed on the IDX. The companies that meet the sample criteria are 9
companies. The analytical method used is the panel data regression method. The results
showed that economic growth, inflation, exchange rate, interest rate, and debt to equity ratio
have a positive and significant effect on stock returns, while return on equity has negative and
insignificant effect.
Keywords: Stock return; macroeconomics; return on equity; debt to equity ratio
INTRODUCTION
The property, real estate and building construction sectors are one of the sectors that has stock
price movements tend to increase, but the stock return experienced not stable fluctuations and
tended to decline. The property, real estate and building construction sector consists of two sub-
International Journal of Economics, Commerce and Management, United Kingdom
Licensed under Creative Common Page 609
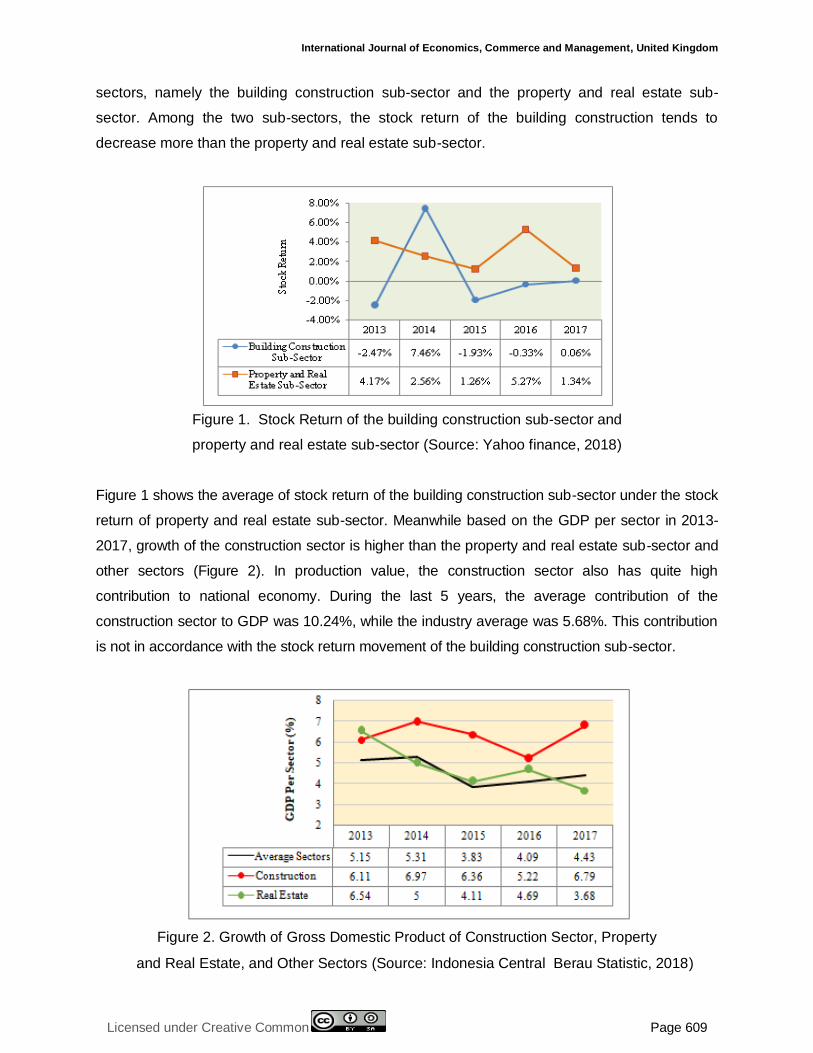
sectors, namely the building construction sub-sector and the property and real estate sub-
sector. Among the two sub-sectors, the stock return of the building construction tends to
decrease more than the property and real estate sub-sector.
Figure 1. Stock Return of the building construction sub-sector and
property and real estate sub-sector (Source: Yahoo finance, 2018)
Figure 1 shows the average of stock return of the building construction sub-sector under the stock
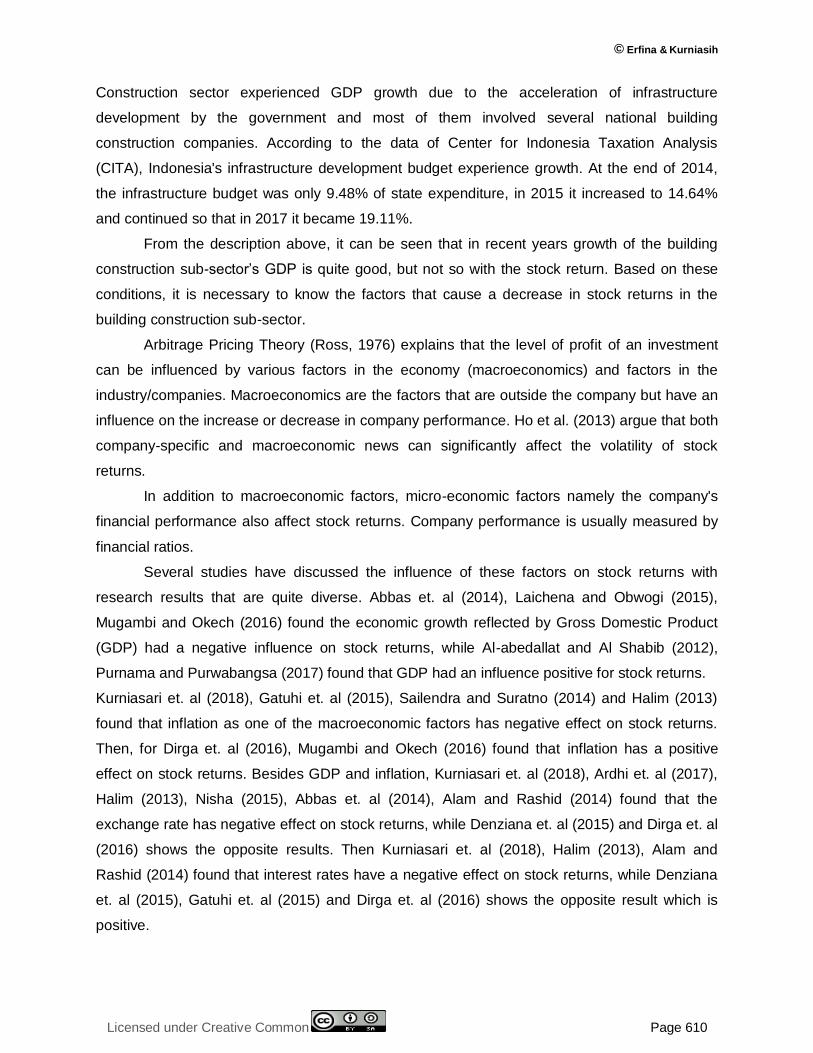
return of property and real estate sub-sector. Meanwhile based on the GDP per sector in 2013-
2017, growth of the construction sector is higher than the property and real estate sub-sector and
other sectors (Figure 2). In production value, the construction sector also has quite high
contribution to national economy. During the last 5 years, the average contribution of the
construction sector to GDP was 10.24%, while the industry average was 5.68%. This contribution
is not in accordance with the stock return movement of the building construction sub-sector.
Figure 2. Growth of Gross Domestic Product of Construction Sector, Property
and Real Estate, and Other Sectors (Source: Indonesia Central Berau Statistic, 2018)
© Erfina & Kurniasih
Licensed under Creative Common Page 610
Construction sector experienced GDP growth due to the acceleration of infrastructure
development by the government and most of them involved several national building
construction companies. According to the data of Center for Indonesia Taxation Analysis
(CITA), Indonesia's infrastructure development budget experience growth. At the end of 2014,
the infrastructure budget was only 9.48% of state expenditure, in 2015 it increased to 14.64%
and continued so that in 2017 it became 19.11%.
From the description above, it can be seen that in recent years growth of the building
construction sub-sector’s GDP is quite good, but not so with the stock return. Based on these
conditions, it is necessary to know the factors that cause a decrease in stock returns in the
building construction sub-sector.
Arbitrage Pricing Theory (Ross, 1976) explains that the level of profit of an investment
can be influenced by various factors in the economy (macroeconomics) and factors in the
industry/companies. Macroeconomics are the factors that are outside the company but have an
influence on the increase or decrease in company performance. Ho et al. (2013) argue that both
company-specific and macroeconomic news can significantly affect the volatility of stock
returns.
In addition to macroeconomic factors, micro-economic factors namely the company's
financial performance also affect stock returns. Company performance is usually measured by
financial ratios.
Several studies have discussed the influence of these factors on stock returns with
research results that are quite diverse. Abbas et. al (2014), Laichena and Obwogi (2015),
Mugambi and Okech (2016) found the economic growth reflected by Gross Domestic Product
(GDP) had a negative influence on stock returns, while Al-abedallat and Al Shabib (2012),
Purnama and Purwabangsa (2017) found that GDP had an influence positive for stock returns.
Kurniasari et. al (2018), Gatuhi et. al (2015), Sailendra and Suratno (2014) and Halim (2013)
found that inflation as one of the macroeconomic factors has negative effect on stock returns.
Then, for Dirga et. al (2016), Mugambi and Okech (2016) found that inflation has a positive
effect on stock returns. Besides GDP and inflation, Kurniasari et. al (2018), Ardhi et. al (2017),
Halim (2013), Nisha (2015), Abbas et. al (2014), Alam and Rashid (2014) found that the
exchange rate has negative effect on stock returns, while Denziana et. al (2015) and Dirga et. al
(2016) shows the opposite results. Then Kurniasari et. al (2018), Halim (2013), Alam and
Rashid (2014) found that interest rates have a negative effect on stock returns, while Denziana
et. al (2015), Gatuhi et. al (2015) and Dirga et. al (2016) shows the opposite result which is
positive.
International Journal of Economics, Commerce and Management, United Kingdom
Licensed under Creative Common Page 611
In addition to macroeconomic factors, internal factors, namely the company's financial
performance also have an effect on stock returns. One of indicator of company performance is
profitability and leverage. ROE is one of the profitability ratios that show management efficiency
in managing its capital to be a profit. Therefore, ROE is one of the factors that are highly
considered by potential investors and shareholders. The DER is one of the debt ratios that
investors need to pay attention to.
Denziana et. al (2015) and Ardhi et. al (2017) found that ROE had a significant positive
effect on stock returns. While Mulya and Turisna (2016) dan Anwaar (2016) found that ROE had
no significant effect. Sudiyatno and Suharmanto (2011) found that ROE had a negative and
significant effect on stock returns. Previous research on the influence of DER on stock returns
also showed different results. Bustami and Heikal (2019), Purwitajati and Putra (2016) show that
DER has a positive effect on stock returns. While Borhan and Ghazali (2017) concluded that
DER has a significant negative effect on stock returns.
Based on the phenomenon that occurs in the stock returns of the building construction
sub-sector as well as the results of previous studies, it is necessary to conduct further research
on the effects of macroeconomics (economic growth, inflation, exchange rate and interest rates)
and the effect of corporate financial performance (return on equity and debt to equity ratio) on
the stock return of building construction companies in Indonesia.
REVIEW OF THE LITERATURE
Arbitration Pricing was introduced by Ross in 1976 who states that the price of an asset can
be influenced by various factors. The application of the APT model includes various risk factors
because in reality systematic risk is not only caused by one source, but also by economic
factors which some of these factors are called Multifactor. Multifactor model is a model of the
securities rate of return that puts the rate of return in order to react to several systematic factors
(Bodie et al, 2004).
Macroeconomics is an overall economic study, which is useful both to explain
economic events and to formulate economic policies. Macroeconomic factors are factors that
are outside the company but have an influence on the increase or decrease in company
performance both directly and indirectly (Samsul, 2015).
Economic growth is defined as an increase in the output of goods or materials and
services in a certain period of time (Hasyim, 2016). According to Mankiw (2010), Gross
Domestic Product is often considered a benchmark for how well the economy is performing.
According to the Central Statistics Agency/BPS (2018), GDP is the amount of added value
for goods and services produced by various production units in a country's territory within a
© Erfina & Kurniasih
Licensed under Creative Common Page 612
certain period of time (usually one year). The GDP growth is the percentage of growth in the
amount of added value for goods and services produced by production units.
Interest Rate The interest rate states the rate of payment on a loan or other
investment, over and above principal repayment, in terms of an annual percentage.
(Dornbusch, et. al, 2008). According to Sukirno (2011) interest is expressed as a percentage
of capital. The interest rate is one indicator in determining whether someone will invest or
save.
Exchange Rate is the price of foreign currency (Dornbusch, et. al, 2008). Companies
that have transactions and foreign debt must provide payments in the form of foreign
currencies. The US Dollar has become the currency used in international trade. Theoretically
the difference in direction of the relationship between exchange rates and stock prices can be
explained by traditional approaches and balance portfolio models (Granger et. al, 1998). The
traditional approach says that the relationship between exchange rates and stock prices is
positive where changes in exchange rates affect the company's income and operating costs.
While the portfolio balance approach states that the exchange rate of the local currency will
appreciate the foreign exchange rate and show a negative relationship with the direction of
causality from the stock market to the money market, in accordance with very fast financial
market interactions.
Inflation is one of the macroeconomic aspects that can be used to configure national
economic conditions which are marked by price increases. According to Sukirno (2011), inflation
is an increase in prices of goods that are general in nature and constantly. The inflation rate can
have a positive or negative effect depending on the degree of inflation itself. Excessive inflation
can harm the economy as a whole and reduce stock prices in the market, as well as very low
inflation can cause stock prices to move slowly (Samsul, 2015).
Signaling Theory, the signal is an action taken by company management in giving
instructions to investors regarding management's views on the company's prospects (Brigham
and Houston, 2014). Signaling theory originated from the writings of George Akerlof (1970) who
introduced the term asymmetric information. Brigham and Houston (2014) explain that
asymmetric information is a situation where managers have different (better) information about
company prospects than investors. One type of information issued by companies that can be a
signal to parties outside the company is an annual report that contains information on company
performance.
Return On Equity (ROE) is a ratio to measure net income after tax with own capital
(Kasmir, 2013). This ratio emphasizes how the efficiency of the company's operations is
transformed into profits for the company owners. ROE is used to assess the amount of
International Journal of Economics, Commerce and Management, United Kingdom
Licensed under Creative Common Page 613
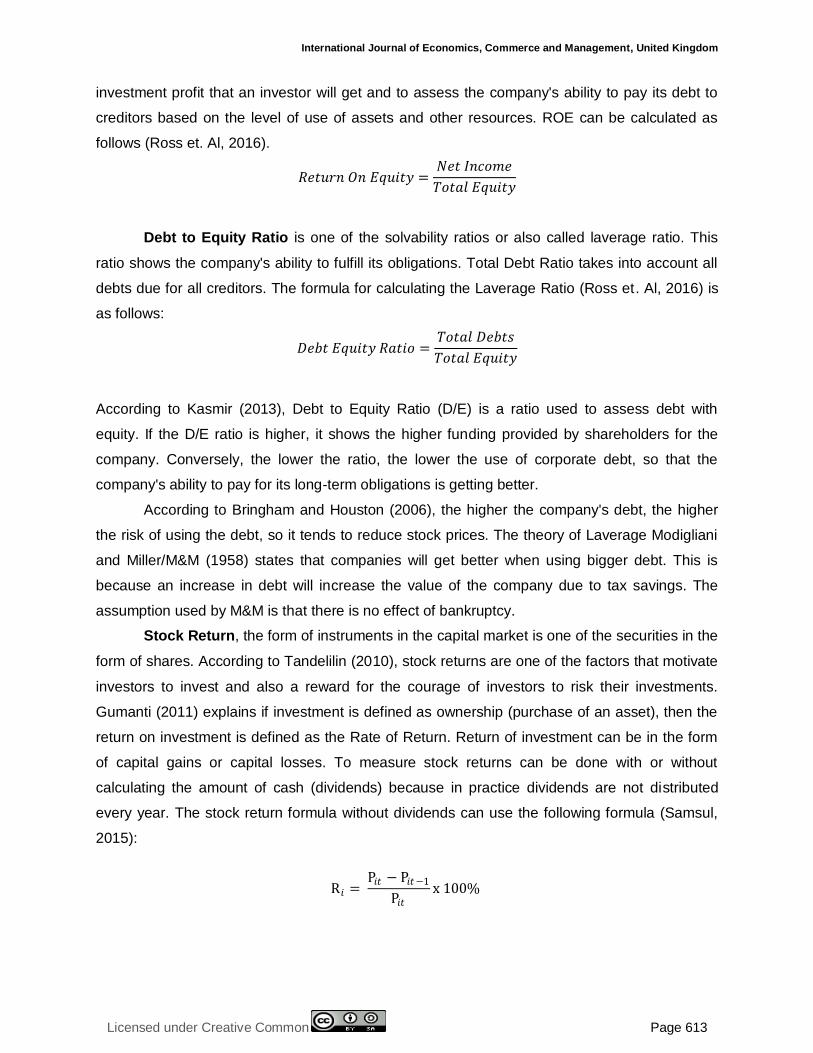
investment profit that an investor will get and to assess the company's ability to pay its debt to
creditors based on the level of use of assets and other resources. ROE can be calculated as
follows (Ross et. Al, 2016).
𝑅𝑒𝑡𝑢𝑟𝑛 𝑂𝑛 𝐸𝑞𝑢𝑖𝑡𝑦 =𝑁𝑒𝑡 𝐼𝑛𝑐𝑜𝑚𝑒
𝑇𝑜𝑡𝑎𝑙 𝐸𝑞𝑢𝑖𝑡𝑦
Debt to Equity Ratio is one of the solvability ratios or also called laverage ratio. This
ratio shows the company's ability to fulfill its obligations. Total Debt Ratio takes into account all
debts due for all creditors. The formula for calculating the Laverage Ratio (Ross et. Al, 2016) is
as follows:
𝐷𝑒𝑏𝑡 𝐸𝑞𝑢𝑖𝑡𝑦 𝑅𝑎𝑡𝑖𝑜 =𝑇𝑜𝑡𝑎𝑙 𝐷𝑒𝑏𝑡𝑠
𝑇𝑜𝑡𝑎𝑙 𝐸𝑞𝑢𝑖𝑡𝑦
According to Kasmir (2013), Debt to Equity Ratio (D/E) is a ratio used to assess debt with
equity. If the D/E ratio is higher, it shows the higher funding provided by shareholders for the
company. Conversely, the lower the ratio, the lower the use of corporate debt, so that the
company's ability to pay for its long-term obligations is getting better.
According to Bringham and Houston (2006), the higher the company's debt, the higher
the risk of using the debt, so it tends to reduce stock prices. The theory of Laverage Modigliani
and Miller/M&M (1958) states that companies will get better when using bigger debt. This is
because an increase in debt will increase the value of the company due to tax savings. The
assumption used by M&M is that there is no effect of bankruptcy.
Stock Return, the form of instruments in the capital market is one of the securities in the
form of shares. According to Tandelilin (2010), stock returns are one of the factors that motivate
investors to invest and also a reward for the courage of investors to risk their investments.
Gumanti (2011) explains if investment is defined as ownership (purchase of an asset), then the
return on investment is defined as the Rate of Return. Return of investment can be in the form
of capital gains or capital losses. To measure stock returns can be done with or without
calculating the amount of cash (dividends) because in practice dividends are not distributed
every year. The stock return formula without dividends can use the following formula (Samsul,
2015):
R𝑖 = P𝑖𝑡 − P𝑖𝑡−1
P𝑖𝑡x 100%
© Erfina & Kurniasih
Licensed under Creative Common Page 614
The answer to the research question is based on the hypothesis. The hypothesis in this study is
as follows:
H1: Economic growth has positive effect on stock returns of building construction subs
sector.
H2: Inflation Economic growth has negative effect on stock returns of building construction
subs sector.
H3: Exchange rate has positive effect on stock returns of building construction subs sector.
H4: Interest rate has negative effect on stock returns of building construction subs sector.
H5: Return On Equity (ROE) has positive effect on stock returns of building construction
subs sector.
H6: Debt to Equity Ratio (D/E) has negative effect on stock returns of building construction
subs sector.
RESEARCH METHOD
Research is a causality study which aims to find the influence of independent variables
(economic growth, inflation, rupiah exchange rate and interest rate, return on equity and debt to
equity ratio) to the dependent variable (stock return). The study population is all building
construction sub-sector companies listed on the Indonesia Stock Exchange which in 2019 were
17 companies. The research sample was determined purposively, with the criteria that the
company is continuously listed on the Indonesia stock exchange in 2013-2017 and the
company's financial statements available and accessible. There are 9 companies that meet the
sample criteria.
The research data is panel data (pooled data). Based on the source data, the data used
is secondary data. Source data from the website finance.yahoo.com, www.bps.go.id, Bank
Indonesia, which is downloaded from the website www.bi.go.id, company reports on the
Indonesia Stock Exchange which are downloaded from the website www.idx.co.id.
The data analyzed were obtained descriptively and inferentially. Descriptive analysis is
carried out to explain the research variables, inferential analysis is used to answer research
problems, using panel data multiple regression. The equation used is as follows:
𝑌𝑖𝑡 = 𝛼 + 𝛽1𝑋1𝑖𝑡 + 𝛽2𝑋2𝑖𝑡 + 𝛽3𝑋3𝑖𝑡 + 𝛽4𝑋4𝑖𝑡 + 𝛽5𝑋5𝑖𝑡 + 𝛽6𝑋6𝑖𝑡 + 𝑊𝑖𝑡 …….. (1)
Where:
𝑌𝑖𝑡 : Dependent variable (stock return)
𝛼 : Constanta
𝛽𝑛 : Regression coefficients
International Journal of Economics, Commerce and Management, United Kingdom
Licensed under Creative Common Page 615
𝑋𝑖𝑡 : Independent variable (economic growth, inflation, exchange rate, interest rate, return
on equity, debt to equity ratio)
i : Entity -i
t : Period -t
𝑊𝑖𝑡 : Joint error rate
RESULTS AND DISCUSSION
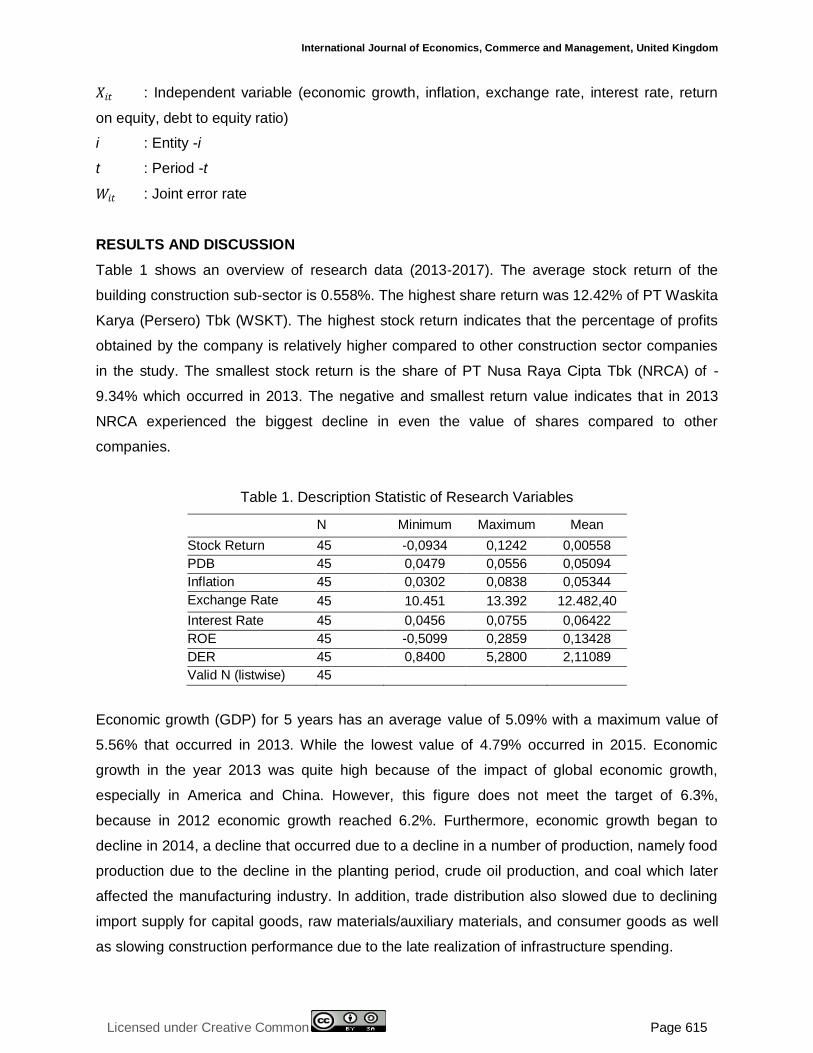
Table 1 shows an overview of research data (2013-2017). The average stock return of the
building construction sub-sector is 0.558%. The highest share return was 12.42% of PT Waskita
Karya (Persero) Tbk (WSKT). The highest stock return indicates that the percentage of profits
obtained by the company is relatively higher compared to other construction sector companies
in the study. The smallest stock return is the share of PT Nusa Raya Cipta Tbk (NRCA) of -
9.34% which occurred in 2013. The negative and smallest return value indicates that in 2013
NRCA experienced the biggest decline in even the value of shares compared to other
companies.
Table 1. Description Statistic of Research Variables
N Minimum Maximum Mean
Stock Return 45 -0,0934 0,1242 0,00558
PDB 45 0,0479 0,0556 0,05094
Inflation 45 0,0302 0,0838 0,05344
Exchange Rate 45 10.451 13.392 12.482,40
Interest Rate 45 0,0456 0,0755 0,06422
ROE 45 -0,5099 0,2859 0,13428
DER 45 0,8400 5,2800 2,11089
Valid N (listwise) 45
Economic growth (GDP) for 5 years has an average value of 5.09% with a maximum value of
5.56% that occurred in 2013. While the lowest value of 4.79% occurred in 2015. Economic
growth in the year 2013 was quite high because of the impact of global economic growth,
especially in America and China. However, this figure does not meet the target of 6.3%,
because in 2012 economic growth reached 6.2%. Furthermore, economic growth began to
decline in 2014, a decline that occurred due to a decline in a number of production, namely food
production due to the decline in the planting period, crude oil production, and coal which later
affected the manufacturing industry. In addition, trade distribution also slowed due to declining
import supply for capital goods, raw materials/auxiliary materials, and consumer goods as well
as slowing construction performance due to the late realization of infrastructure spending.
© Erfina & Kurniasih
Licensed under Creative Common Page 616
The average value of inflation is 5.34%. The highest inflation occurred in 2013 (8.4%), one of
which was due to increases in food prices and subsidized fuel oil prices. Inflation declined and
the lowest occurred in 2016 (i.e. 3%) due to the decline in prices of several strategic energy
commodities such as subsidized fuel oil, electricity tariffs for customers of 1,300 VA and above,
and 12kg LPG.
The average exchange rate of the US dollar during 2013-2017 was Rp. 12,482. The
lowest exchange rate in 2010 was Rp. 10,451 and the highest occurred in 2015, Rp. 13,392. In
2015 the rupiah declined due to speculation of rising interest rates in the US and the
devaluation of the yuan, as well as large stock selling (hot money). Hot money caused the
Jakarta Composite Index to decline and the rupiah obtained from the sale was bought by the
dollar so that there was a high demand for the dollar and the dollar's value increased. In 2016
the rupiah exchange rate fell, meaning the rupiah strengthened 0.7% compared to the condition
in 2015. Strengthening of the rupiah in accordance with the capital allocation into Indonesia and
improving the structure of foreign exchange demand.
The interest rate in this study uses the Bank Indonesia (BI) Rate for the period 2013 to
2015 and the BI 7-Day Repo Rate for 2016 and 2017. This is because since August 19 2016 the
BI 7-Day Repo Rate has been implemented as the benchmark interest rate. During the period
2013-2017 the average interest rate was 6.42%. The highest interest rate occurred in 2014
which was 7.55%. The BI policy is in line with stabilization measures to control the current
account deficit and also the policy of the National Non-Cash Movement. The lowest interest
rates occur in 2017 with a value of 4.56%. Low interest rates can increase investment through
cheap credit expansion.
The average ROE of the building construction sub-sector is 13.43%. This means that
every hundred rupiah shareholders' equity can be generated by 13.43 rupiah in net income. The
highest ROE occurred at PT Surya Semesta Internusa Tbk (SSIA) at 28.59% which occurred in
2013. The lowest is the ROE of PT Nusa Konstruksi Enjiniring Tbk (DGIK) -50.99% which
occurred in 2016, meaning the company suffered a loss.
The average D/E of the building construction sub-sector is 2.11 times, which means that
the company is in an unsolvable condition because every hundred rupiah of equity covers 211
rupiah in total debt. The smallest D/E occurred in PT Nusa Raya Cipta Tbk (NRCA), which was
0.84 which occurred in 2015. This shows that the composition of debt is lower than the equity. It
means that the company's ability to pay its debt is better than other companies in this study.
The highest D/E is PT Adhi Karya (Persero) Tbk (ADHI) which is 5.28 which shows that the
composition of total debt is 5.28 times greater than the total equity.
International Journal of Economics, Commerce and Management, United Kingdom
Licensed under Creative Common Page 617
Regression approaches need to fulfill the classical assumptions so that the resulting equation is
the best linear unbiased estimator. Classic assumption tests include normality, autocorrelation,
and multicollinearity tests.
Normality test was carried out by Jarque-Bera test. The data processing output shows
the Jarque-Bera value is 1.7475 with a probability value > 0.05. Thus it can be concluded that
the research data is normally distributed.
Multicollinearity test was carried out by correlation test. The results of data
processing show the correlation coefficient of the independent variable Inflat ion (X2) and
Exchange Rate (X3) worth more than 0.9, which indicates there are symptoms of
multicollinearity. Therefore the transformation is done using natural logarithms for the
Exchange Rate (X3) variable.
Autocorrelation Test results show Dubrin-Watson (DW) value = 1.9531. The value of dU
= 1.8378 in the DW table for sample n = 44 and k (number of variables) = 6. Thus it can be
concluded that there is no problem of autocorrelation in this research regression model because
du <DW <4-du (1,8378 < 1.9531 <2.1622.
This study uses panel data analysis. There are three alternative panel models, namely
methods with common effect models, fixed effect models and random effect models. The
selection of the best model is done by doing three tests, namely Chow Test, Hausman Test and
Lagrange Multiflier Test. Based on the results of the chow test, because the Common Effect
Model is selected, the Langrange Multiplier test is conducted so that the exact estimation for the
panel data regression model is the random effect method.
Table 2. Test Results of the Effect of Macroeconomic Factors and Internal Factors on Stock
Returns of Building Construction Company Listed on the Indonesia
Stock Exchange with Random Effect Model
Variable Coefficient Std. Error t-Statistic Prob.
C -28.5602 8.3732 -3.4109 0.0016
PDB 54.6117 21.2537 2.5695 0.0143
INFLATION 5.6049 1.0026 5.5907 0.0000
LN EXCHANGE 2.6663 0.7550 3.5317 0.0011
INTEREST 5.0535 2.0923 2.4153 0.0208
ROE -0.0347 0.0708 -0.4896 0.6273
DER 0.0134 0.0038 3.4977 0.0012
R-Squared 0.7137 Mean dependent var 0.0055
Adjusted R-Squared 0.6673 S.D. dependent var 0.0466
F-Statistic 15.3718 Sum squared resid 0.0267
Prob(F-Statistic) 0.0000 Durbin-Watson stat 1.9531
© Erfina & Kurniasih
Licensed under Creative Common Page 618
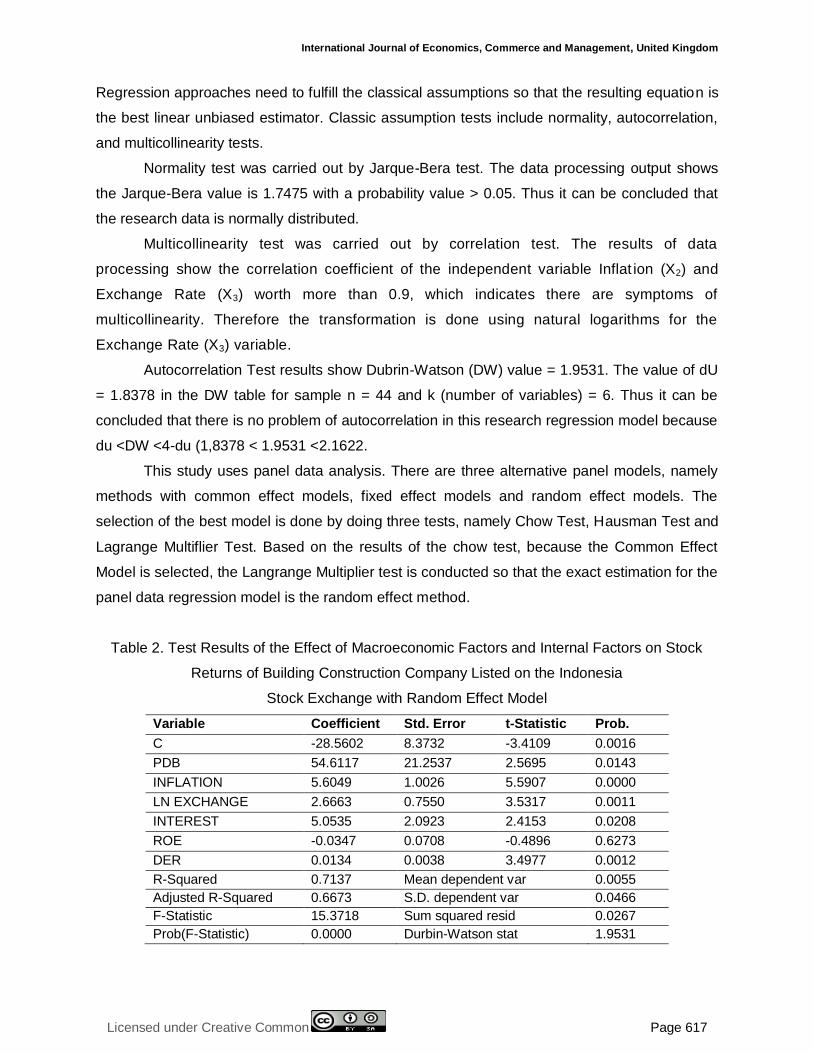
Table 2 shows that the regression model built is fit. This conclusion is taken because the
probability of the F-statistic is 0.0000. The determination coefficient of 0.7137 shows the ability
of independent variables to explain the variability of stock returns is 71.37%.
From the estimation results using the Random Effect Model test, the panel data
regression equation is obtained as follows:
STOCK RETURN=-28.0732 + 54,6117P DB + 5.6049 INFLATION + 2.6663 LN EXCHANGE +
5.0535 INTEREST -0.0347 ROE + 0.0134 DER ................................. (2)
Referring to Table 2 is presented equation (2). The equation shows:
Constants have a coefficient of -28,5602 with a probability of 0.0016 (<0.05) so that the
constant is significant. This shows that when the independent variable is 0, then the
stock return (Y) is -28.0732. This shows that investors experience capital loss.
GDP has a coefficient of 54.6117 positive value with a probability of 0.0143 (<0.05), then
GDP has a significant effect. Regression coefficient value shows that if there is an
increase in GDP of 1 unit, then the Stock Return variable (Y) increases by 54.6117
assuming the other variables are constant.
Inflation has a coefficient of 5.6049 positive with a probability of 0.000 (<0.05) so that
inflation has a significant effect. Regression coefficient value shows that if there is an
increase in GDP of one unit, then the Stock Return variable (Y) increases by 5.6049
assuming the other variables are constant.
Exchange Rate has a coefficient of 2.6663 positive with a significance of 0.0011 (<0.05),
the Exchange Rate has a significant effect. The regression coefficient shows that if there
is an increase in the Exchange Rate of one unit, then the Stock Return variable (Y)
increases by 2.6663, assuming the other variables are constant.
Interest Rate has a coefficient value of 5.0535 positive with a probability of 0.0208
(<0.05), Interest Rate has a significant effect on stock returns. Regression coefficient
value shows that if there is an increase in Interest Rate by one unit, then the Stock
Return variable (Y) increases by 5.0535, assuming the other variables are constant.
ROE has a regression coefficient of -0.0134 with a probability of 0.6273 (> 0.05) then
ROE has no significant effect.
DER has a coefficient of 0.0134 with a probability of 0.0012 (<0.05), meaning that DER
has a significant effect. Regression coefficient value shows that if there is an increase in
DER of one unit, then the Stock Return variable (Y) increases by 0.0134, assuming the
other variables are constant.
International Journal of Economics, Commerce and Management, United Kingdom
Licensed under Creative Common Page 619
Economic growth (GDP) has a significant positive effect on stock returns. These results are in
accordance with the H1 hypothesis and in line with the research of Kibria et. al (2014), as well as
Purnama and Purbawangsa (2017). Economic growth illustrates how much national income is
generated by the industrial sector. The higher the economic growth of a country shows that the
demand for goods is increasing, including demand in the field of building construction. Good
economic conditions will facilitate development activities, so that active construction activities
can foster investor interest in buying stock which in turn can affect stock returns.
Inflation has a significant positive effect on stock returns. The results of this study are not
in accordance with the H2 hypothesis, that is inflation has a negative effect on stock returns.
However, the results of this study are in line with the research of Dirga et.al (2016) and
Mugambi and Okech (2016). Inflation has a positive effect on stock returns indicating that when
there is inflation the stock returns still increase, it mean that the performance of the company is
not disturbed because the development project continues. As is known that the majority of
construction companies, especially those listed on the IDX, are companies that run
infrastructure projects. Therefore, despite inflation which causes the price of goods to rise, the
demand for construction services continues. When costs rise due to inflation, the company can
charge the increase in costs to users of construction services. In this case, the relatively stable
business margin is an indicator that can support the performance of the company. The results of
this study are different from the results of research by Laichena and Obwogi (2015), Sailendra
and Suratno (2014) and Dirga et. al (2016), that is inflation has a negative and significant effect
on stock returns. Dirga et. al (2016) explains that investors will tend to release their stocks if
there is an increase in inflation because the return received by investors will decrease in value,
thus causing the stock price to fall. But the opposite can happen when an increase in inflation
can increase the profitability of a company if the increase in factor production costs is lower than
the increase in output prices that can be obtained by the company.
The exchange rate has a significant positive effect on stock returns. These results are in
accordance with the H3 hypothesis and in line with the research of Laichena and Obwogi (2015),
Mugambi and Okech (2016), and Dirga et.al (2016) which showed that the rupiah exchange rate
had a positive effect. This condition is caused by the pattern of data distribution of stock returns
which tends to rise when the exchange rate increases. The rupiah exchange rate has a positive
effect on stock returns indicated because the transactions of construction companies use more
rupiah than US dollars. This is related to the Program for Increasing the Use of Domestic
Products (P3DN), including in infrastructure and construction projects. Different results are
shown by the research of Kurniasari and Yusuf (2018); Ardhi et. al (2017); and Nisha (2015)
which shows that the exchange rate has a negative effect on stock returns. The increase in the
© Erfina & Kurniasih
Licensed under Creative Common Page 620
rupiah exchange rate is directly proportional to the loss of consumer goods issuers. When the
exchange rate rises, the price of goods will increase, especially imported goods so that
purchasing power decreases and people prefer to save money rather than spending it.
Interest Rate has a significant positive effect on Stock Return. This is not in accordance
with the hypothesis H4 where the interest rate has a negative effect on stock returns. However,
the results of this study are in line with the results of Dirga et. al (2016) and Gatuhi et. al (2015).
The effect of interest rate trends on construction companies will be related to the capital
structure, which in general high interest rates will cause investors to be reluctant to fund
development, especially through debt. However, the influence of positive interest rates indicates
that the shares of building construction companies listed on the Indonesia Stock Exchange in
the period 2013 - 2017 are not a problem with the increase in interest rates. This is related to
government policy in accelerating development programs with the existence of infrastructure
guarantee institutions, which one of the benefits the agency is reducing infrastructure costs with
a lower interest expense on loans, to reduce tariffs paid by the community (IIGF, 2018). In
addition, banking policies to increase the flow of development funds with competitive interest
rates also had an impact on development progress. The findings of this study are different from
the results of the study by Kurniasari et. al (2018), Halim (2013), and Alam and Rashin (2014)
that interest rates negatively affect stock returns.
Return On Equity (ROE) shows a negative but not significant effect on stock returns. The
results of this study are not in accordance with the hypothesis proposed. This condition is
caused by the data distribution pattern of stock returns which tends to rise even though the ROE
decreases. The results of the testing mean that it is not in accordance with the estimates,
especially the concept of signaling theory. This shows that information about ROE is not taken
into consideration by investors when investing in the building construction sector. Other
research results that are in accordance with this study are Sailendra dan Suratno (2014), Mulya
and Turisna (2016) who found that ROE had no significant effect. The results of this study are
not in line with Ghi (2015) and Ardhi et.al (2017) research which shows that ROE has a
significant positive effect.
Debt to Equity Ratio (D/E) has a significant positive effect on stock returns. The results
of this study are incompatible with the hypothesis H6. The results of this study are in line with the
research of Bustami and Heikal (2019), Purwitajati and Putra (2016) who found that DER had a
positive effect on stock returns. This finding supports the theory of Modigliani and Miller (1958)
which states that companies will get better when using bigger debt. This M&M theory states that
increasing debt will increase the value of the company due to tax savings. Borhan and Ghazali
(2017) found different results, namely DER which negatively affected stock returns.
International Journal of Economics, Commerce and Management, United Kingdom
Licensed under Creative Common Page 621
The results showed that GDP is a macroeconomic factor that has the greatest influence on
stock returns in the building construction sub-sector. This needs to be a concern for managers
of building construction sub-sector companies, stockholders and potential investors who will
invest in stocks of this sector.
CONCLUSION
The results showed that GDP, inflation, exchange rate, interest rates, and leverage had a
positive and significant effect on stock returns, while ROE has no significant effect on stock
returns. Among all variables, GDP is the most influential factor on stock returns in the building
construction sub sector. Therefore, managers of building construction sub-sectors as well as
investors and prospective investors who invest in shares of this sector, they need to pay
attention to Indonesia's GDP, so they can get returns as expected. However, GDP growth also
needs to be supported by government policies in strengthening the openness of the investment
climate so as to increase development in various industries that have an impact on improving
the prospects of the building construction sector.
From the research side, to get the maximum research results, especially information
about factors that affect stock returns in the building construction sub-sector, the regression
model in this study can also be supplemented by other variables such as company’s liquidity or
activities ratios so that the model's ability to explain the variability of stock returns is increasingly
well. In addition, future researchers can conduct similar studies in other industrial sectors,
because each sector has a different sensitivity to both external and internal factors of the
company.
REFERENCES
Abbas, Safdar; Safdar H. Tahir, dan Shahid Raza. (2014). Impact of Macroeconomic Variables on Stock Returns: Evidence from KSE-100 Index of Pakistan. The International Journal’s Research Journal of Economics & Business Studies. Vol. 03 (7), 70-77.
Al-abedallat, A. Zuhair dan Duraid Kamel Al Shabib. (2012). Impact of the investment and gross domestic product (GDP) on the Amman stock exchange index. Investment Management and Financial Innovations. Volume 9, Issue 3: 130-136.
Anwaar, Maryyam. (2016). “Impact of Firms’ Performance on Stock Returns (Evidence from Listed Companies of FTSE-100 Index London, UK). Global Journals Inc. (USA), Volume 16, Issue 1 ,Version 1.0, 31-39.
Ardhi, HS, Amir H, Yulia E, Andewi R, and Gusnardi. (2017). Pengaruh Variabel Makro Ekonomi Dan Kinerja Keuangan Terhadap Return Saham Pada Industri Otomotif Di Bursa Efek Indonesia. KURS, Vol. 2, No. 1, 111-118.
Akerlof, George A. (1970). The Market for 'Lemons': Quality Uncertainty and the Market Mechanism. Quarterly Journal of Economics (The MIT Press), 84 (3): 488–500.
Alam, Zaheer and Kashif Rashid. (2014). Time Series Analysis of the Relationship between Macroeconomic Factors and the Stock Market Returns in Pakistan. Journal of Yasar University, 9 (36), 6261-6370.
Brigham, Eugene F and Joel F. Houston. (2006). Dasar-dasar Manajemen Keuangan. Penerjemah: Ali Akbar Yulianto. Edisi 10. Buku 1. Jakarta: Salemba Empat.

© Erfina & Kurniasih
Licensed under Creative Common Page 622
Brigham, Eugene F and Joel F. Houston. (2014). Fundamentals of Financial Management, 14th Edition. Mason: South-Western Cengange Learning.
Bodie, Zvi; Alex Kane; Alan J. Marcus. (2004). Essential of Investment. Sixth Edition. Irwin McGraw Hill International Edtion. Singapore.
Bustami, Fauzie and Jerry Heikal. (2019). Determinants of Return Stock Company Real Estate and Property Located in Indonesia Stock Exchange. International Journal of Economics and Financial Issues. Vol 9, Issue 1, 79- 86.
Denziana, Angrita; Haninun, and Hepiana Patmarina. (2015). The Influence of the Financial Performance and Macroeconomic Factors to Stock Return. The 3rd International Multidisciplinary Conference on Social Sciences (IMCoSS 2015) Bandar Lampung University (UBL). Bandar Lampung, 5-7 June 2015.
Dirga, S. Prawira; Hermanto Siregar, and Bonar M Sinaga. (2016). Analisis Pengaruh Variabel Makro ekonomi terhadap Return Kelompok Saham Subsektor Perkebunan. Jurnal Aplikasi Manajemen (JAM), Vol. 14 (3), 595-607.
Dornbusch, Rudiger; Fischer. S; and Richard Starz. (2008). Macroeconomics. Eleventh Edition. The McGraw-Hill Companies, Inc. New York.
Gatuhi, Simon; Mouni Gekara, Willy Muturi.(2015). Effect of Macroeconomic Environment on Stock Market Returns of Firms in the Agricultural Sector in Kenya. IJMBS, Vol. 5, 9-23.
Granger C.W., Huang B. and Yang C. (1998) A Bivariate Causality Between Stock Prices and Exchange Rates: Evidence from Recent Asian Flu. The Quarterly Review of Economics and Finance. Vol. 40, 337-354.
Gumanti, Tatang A. (2011). Manajemen Investasi Konsep Teori dan Aplikasi. Edisi 1. Mitra Wacana Media. Jakarata.
Halim, Livia. (2013). Pengaruh Makro Ekonomi terhadap Return Saham Kapitalisasi Besar di Bursa Efek Indonesia. FINESTA, Vol. 1 (2), 108-113.
Hasyim, Ali Ibrahim. (2016). Ekonomi Makro. Prenadamedia Grup. Jakarta.
Ho, Kin Yip; Yanlin Shi, and Zhaoyong Zhang. (2014). A Regime-Switching Analysis of Asian Bank Stocks in Handbook of Asian Finance: Financial Markets and Sovereign Wealth Funds.Vol I. Elsevier Inc. United States.
Kasmir.(2013). Analisis Laporan Keuangan. Edisi Kelima. Penerbit PT Bumi Aksara. Jakarta.
Kurniasari, Wulan; Adi Wiratno, and Muhammad Yusuf (2018). Pengaruh Inflasi dan Suku Bunga Terhadap Return Saham Dengan Profitabilitas Sebagai Variabel Intervening di Perbankan Yang Terdaftar Di Bursa Efek Indonesia Tahun 2013-2015. Journal of Accounting Science, Vol. 2 (1), 67-90.
Laichena, K. Eliud, and Tabitha Nasieku Obwogi. (2015). Effects Of Macroeconomic Variables On Stock Returns In The East African Community Stock Exchange Market. International Journal of Education and Research, Vol. 3 (10), 305-320.
Mankiw, N. Gregory. (2010). Macroeconomics. Seventh Edition.Worth Publishers. New York.
Modigliani, Franco and Merton H. Miller (1958). The Cost of Capital, Corporation Finance and The Theory of Investment. American Economic Association. Vol. 48 (3), 261-297.
Mugambi, Mike and Timothy C. Okech. (2016). Effect of Macroeconomic Variables on Stock Returns of Listed Commercial Banks in Kenya. International Journal of Economics, Commerce and Management United Kingdom, Vol. I, 390-418.
Mulya, Yudhia and Ririn Turisna. (2016). Pengaruh Kinerja Keuangan Terhadap Return Saham Pada Perusahaan Sub Sektor Otomotif yang Terdaftar di Bursa Efek Indonesia. Jurnal Ilmiah Manajemen Fakultas Ekonomi (JIMFE), Vol. 2 (1), Edition 2, 41-52.
Nisha, Nabila. (2015). Impact of Macroeconomic Variables on Stock Returns: Evidence from Bombay Stock Exchange (BSE). Journal of Investment and Management, 4 (5), 162-170.
Purnama, Ida Bagus Adytiem and Ida Bagus Anom Purbawangsa. (2017). Pengaruh Kinerja Keuangan dan Variabel Makro Ekonomi Terhadap Harga Saham Perusahaan Pertambangan. E-Jurnal Manajemen Unud, Vol. 6 (4), 1729-1760.
Purwitajati and Putra. (2016). Pengaruh Debt to Equity Ratio Pada Return Saham Dengan Ukuran Perusahaan Sebagai Pemoderasi. E-Jurnal Akuntansi Universitas Udayana, Vol. 15.2, 1086-1114.
Ross, Stephen A; Randolph W. Westerfield; Bradford D. Jordan; Joseph Lim; and Ruth Tan. (2016). 2th edition, Fundamentals of Corporate Finance, McGraw-Hill Education. Asia Edition.
Ross, Stephen A. (1976). The Arbitrage Theory of Capital Asset Pricing. Journal of Economic Theory. Vol 13, Issue 3, 341-360.

International Journal of Economics, Commerce and Management, United Kingdom
Licensed under Creative Common Page 623
Sailendra and Suratno. (2014). Faktor-Faktor Fundamental, Kondisi Makro Ekonomi dan Return Saham Perusahaan Pertambangan di Bursa Efek Indonesia. Jurnal Riset Akuntansi dan Perpajakan (JRAP), Vol. 1 (1), 1-14.
Samsul, Mohamad. (2015). Pasar Modal & Manajemen Portofolio. Second Edition. Penerbit Erlangga. Jakarta.
Sayedy, Borhan and Mohd Zulkifli Ghazali. (2017). The Impact of Microeconomic Variables on Stock Return by Moderating of Money Supply. Asian Social Science, Vol.13 (12), 191-200.
Sudiyatno, Bambang and Toto Suharmanto, (2011). Kinerja Keuangan Konvensional, Economic Value Added, dan return Saham. Jurnal Dinamika Manajemen, Vol. 2 (2), 153-161.
Sukirno, Sadono. (2011). Makro Ekonomi Teori Pengantar. Third Edition. Rajawali Pers. Jakarta.
Tandelilin, Eduardus. (2010). Analisis Investasi dan Manajemen Portfolio. First Edition. BPFE. Yogyakarta.
Related Documents