The Determinants of Resistance to Change Management Process: The Case of CBE, Addis Ababa District A Thesis Submitted As a Partial Requirement for the Degree Master of Business Administration (MBA) Adama Science and Technology University School of Business & Economics By: G/Egziabher G/Tsadik Advisor: Ayele Abebe (PhD) January, 2013 Adama, Ethiopia

Welcome message from author
This document is posted to help you gain knowledge. Please leave a comment to let me know what you think about it! Share it to your friends and learn new things together.
Transcript
The Determinants of Resistance to Change Management Process The Case
of CBE Addis Ababa District
A Thesis Submitted As a Partial Requirement for the Degree Master of
Business Administration (MBA)
Adama Science and Technology University
School of Business amp Economics
By GEgziabher GTsadik
Advisor Ayele Abebe (PhD)
January 2013
Adama Ethiopia
i
DECLARATION
II GGeebbrreeiiggzziiaabbhheerr GGeebbrreettssaaddiikk hheerreebbyy ddeeccllaarree tthhaatt tthhee tthheessiiss wwoorrkk eennttiittlleedd ldquoldquoTThhee
DDeetteerrmmiinnaannttss OOff RReessiissttaannccee TToo CChhaannggee MMaannaaggeemmeenntt PPrroocceessss TThhee CCaassee OOff CCBBEE AAddddiiss
AAbbaabbaa DDiissttrriiccttrdquordquo ssuubbmmiitttteedd ttoo AAddaammaa sscciieennccee aanndd tteecchhnnoollooggyy UUnniivveerrssiittyy ddeeppaarrttmmeenntt ooff
bbuussiinneessss aaddmmiinniissttrraattiioonn iinn ppaarrttiiaall ffuullffiillllmmeenntt ooff tthhee ddeeggrreeee ooff MMaasstteerrss ooff BBuussiinneessss
AAddmmiinniissttrraattiioonn iiss mmyy oorriiggiinnaall wwoorrkk aanndd hhaass nnoott bbeeeenn pprreesseenntteedd ffoorr aannyy ppuurrppoossee iinn aannyy ootthheerr
eedduuccaattiioonnaall iinnssttiittuuttiioonnss MMeeaannwwhhiillee aallll ssoouurrcceess ooff mmaatteerriiaall uusseedd ffoorr tthhee tthheessiiss hhaavvee bbeeeenn dduullyy
aacckknnoowwlleeddggeedd
NNaammee GGeebbrreeiiggzziiaabbhheerr GGeebbrreettssaaddiikk
SSiiggnnaattuurree ______________________________
DDaattee ________________________________________
PPllaaccee AAddaammaa SScciieennccee AAnndd TTeecchhnnoollooggyy UUnniivveerrssiittyy AAddaammaa EEtthhiiooppiiaa
ii
Thesis Approval Form
Studentrsquos name Gebreigziabher Gebretsadik
Degree sought Masters in Business Administration
Thesis title Determinants of Resistance to Change Management Process
The Case of Commercial Bank of Ethiopia Addis Ababa District
Affiliation Adama Science and Technology University
We the undersigned recommend that the thesis stated above be accepted in partial
fulfillment of the degree requirement
Approved by Thesis advisor
AAyyeellee AAbbeebbee ((PPhhDD)) ____________________ ___________
Advisorrsquos Name Signature Date
Approved by Board of Examiners
_____________________ ____________________ ______________
Chairman Signature Date
_____________________ ____________________ _____________
Internal Examinerrsquos Name Signature Date
_____________________ ____________________ _____________
External Examinerrsquos Name Signature Date
Approved by the department
_____________________ ___________________ _____________
Head of the department signature Date
The signature of the department head or an authorized signatory is an assertion of the
authenticity of the committeersquos signature and the acceptability of the thesis to the department
therefore the sign of the signatory must be original
iii
To my beloved parents and families
To all those who are devoting their life in academic research to serve
humanity and are persevering to make the world a better ground to live
through discovery of new dimensional constructs of life
iv
Acknowledgment
I am very thankful to the almighty God for He turned my dreams in to reality
I would like to express my sincere gratefulness to my advisor Ayele Abebe (PhD) for his
incalculable suggestions comments and guidance in preparation of this thesis My special
appreciation also goes to Ato Nigus K for his astonishing and limitless support in this work
I thank you all those who had any hand in any way to the success of this study
v
TABLE OF CONTENTS
DECLARATION i
Thesis Approval Formhelliphelliphelliphelliphelliphelliphelliphelliphelliphelliphelliphelliphelliphelliphelliphelliphelliphelliphelliphelliphelliphelliphelliphelliphelliphelliphelliphelliphelliphelliphelliphelliphelliphelliphelliphelliphelliphelliphelliphelliphelliphelliphelliphelliphelliphellipii
Dedication helliphelliphelliphelliphelliphelliphelliphelliphelliphelliphelliphelliphelliphelliphelliphelliphelliphelliphelliphelliphelliphelliphelliphelliphelliphellipiii
Acknowledgment iivi
Table of Contentshelliphelliphelliphelliphelliphelliphelliphelliphelliphelliphelliphelliphelliphelliphelliphelliphelliphelliphelliphelliphelliphelliphelliphelliphelliphelliphelliphelliphelliphelliphelliphelliphelliphelliphelliphelliphelliphelliphelliphelliphelliphelliphelliphelliphelliphelliphelliphellipiv
List of Tables helliphelliphelliphelliphelliphelliphelliphelliphelliphelliphelliphelliphelliphelliphelliphelliphelliphelliphelliphelliphelliphelliphelliphelliphelliphelliphelliphelliphelliphelliphelliphelliphelliphelliphelliphelliphelliphelliphelliphelliphelliphelliphelliphelliphelliphelliphelliphelliphelliphellipv
List of Diagramshelliphelliphelliphelliphelliphelliphelliphelliphelliphelliphelliphelliphelliphelliphelliphelliphelliphelliphelliphelliphelliphelliphelliphelliphelliphelliphelliphelliphelliphelliphelliphelliphelliphelliphelliphelliphelliphelliphelliphelliphelliphelliphelliphelliphelliphelliphelliphellipviii
Acronyms helliphelliphelliphelliphelliphelliphelliphelliphelliphelliphelliphelliphelliphelliphelliphelliphelliphelliphelliphelliphelliphelliphelliphelliphelliphelliphelliphelliphelliphelliphelliphelliphelliphelliphelliphelliphelliphelliphelliphelliphelliphelliphelliphelliphelliphelliphelliphelliphelliphelliphelliphellipix
Abstaract helliphelliphelliphelliphelliphelliphelliphelliphelliphelliphelliphelliphelliphelliphelliphelliphelliphelliphelliphelliphelliphelliphelliphelliphelliphelliphelliphelliphelliphelliphelliphelliphelliphelliphelliphelliphelliphelliphelliphelliphelliphelliphelliphelliphelliphelliphelliphelliphelliphelliphelliphellipx
CHAPTER ONE INTRODUCTION 1
11Background of the Studyhelliphelliphelliphelliphelliphelliphelliphelliphelliphelliphelliphelliphelliphelliphelliphelliphelliphelliphelliphelliphelliphelliphelliphelliphelliphelliphelliphelliphelliphellip1
12 Statement of the Problem 2
13 Objectives of the Study 4
14 Hypothesis of the Study 4
15 Scope of the Study 5
16 Limitations of the Study 5
17 Significance of the Study 6
CHAPTER TWO LITERATURE REVIEW 8
21 Theoretical Backgrounds of Change Management 8
22 Backgrounds of Resistance to Organizational Change Management 10
221 Theoretical Backgrounds of Resistance to Change Management 11
222 Empirical Backgrounds of Resistance to Change Management 14
23 Theoretical Framework of the Study 18
CHAPTER THREE METHODOLOGY 20
31 Research Design 20
32 Sample Design 20
vi
321 Target Population 20
322 Sample Frame 21
323 Sample Size Determination 21
324 Sample Selection 22
33 Type of Data 22
34 Methods of Data Collection 22
35 Method of Data Analysis and Statistical Treatment 23
351 Method of Data Analysis 23
352 Statistical Treatment And Modeling 24
CHAPTER FOUR DATA PRESENTATION AND ANALYSIS 28
41 Analysis on the Demographic Attributes Driven Factors of Resistance 29
42 Vulnerability versus managerial incapability driven factors 34
53A Single Variable Impact Consistency through the Lewinrsquos Three Phase Model of Change Process
35
CHAPTER FIVE CONCLUSION AND RECOMMENDATION 39
51 Conclusions 39
52 Recommendation 40
REFERENCES 412
ANNEX 416
vii
List of Tables
1 The Main Variableshelliphelliphelliphelliphelliphelliphelliphelliphelliphelliphelliphelliphelliphelliphelliphelliphelliphelliphelliphelliphelliphelliphelliphelliphelliphelliphellip28
2 The Variable Relationship helliphelliphelliphelliphelliphelliphelliphelliphelliphelliphelliphelliphelliphelliphelliphelliphelliphelliphelliphelliphelliphelliphelliphelliphellip29
3 Profile Of Respondentshelliphelliphelliphelliphelliphelliphelliphelliphelliphelliphelliphelliphelliphelliphelliphelliphelliphelliphelliphelliphelliphelliphelliphelliphelliphelliphelliphellip40
4 Marginal Functions Of The Predictors In All The Phases helliphelliphelliphelliphelliphelliphelliphelliphelliphelliphelliphelliphelliphellip41
5 Coefficient Analysis Of The Predictors In All Of The Phaseshelliphelliphelliphelliphelliphelliphelliphelliphellip hellip46
6 Predictor Ranking Through Ratio Of The Occurrence = 1 Given A Predictor Is 1 and Occurrence
=1 Given A Predictor Is 0 In The Unfreezing Phasehelliphelliphelliphelliphelliphelliphelliphelliphelliphelliphelliphelliphelliphelliphelliphellip 50
7 Predictor Ranking Through Ratio Of The Occurrence = 1 Given A Predictor Is 1 and Occurrence
=1 Given A Predictor Is 0 In The Moving Phase helliphelliphelliphelliphelliphelliphelliphelliphelliphelliphelliphelliphelliphelliphelliphelliphellip 51
8 Predictor Ranking Through Ratio Of The Occurrence = 1 Given A Predictor Is 1 and Occurrence
=1 Given A Predictor Is 0 In The Refreezing Phasehelliphelliphelliphelliphelliphelliphelliphelliphelliphelliphelliphelliphelliphelliphelliphellip 52
viii
Diagrams
1 The relationship between the predictors and the dependent variable helliphellip 29
ix
AAccrroonnyymmss
AAss ppeerr tthheeiirr uussee iinn tthhiiss ppaappeerr
11 BBPPRR BBuussiinneessss pprroocceessssiinngg rreeeennggiinneeeerriinngg
22 IIVV IInnddeeppeennddeenntt VVaarriiaabblleess
33 DDVV DDeeppeennddeenntt VVaarriiaabbllee
44 CCBBEE CCoommmmeerrcciiaall BBaannkk OOff EEtthhiiooppiiaa
55 VV aa ssiinnggllee pprreeddiiccttoorr
x
Abstract
In this paper the determinants of resistance to organizational change are studied in view of the
Kurt Lewinrsquos three phase model of change management process The coefficient of fifteen sources
of resistance is the critical concerns of this study and are weighed against which aspect of
sources of resistance presents a higher disparity of impact considering the phases of the change
process as well as which has lower significance orand no significance at all Questionnaires
were distributed randomly to a sample of 150 in the 27 branches of Commercial Bank of Ethiopia
found in Addis Ababa A unidirectional logit regression of odds ratio and marginal function
analysis was used to get a finding that age and gender are not predictors to resistance while
education and experience are negatively and positively predictors to resistance respectively It is
also found that a single variable factor of resistance can have varied significance level on the
unfreezing moving and refreezing phases of a change process found by two way tables of column
and row statistics with chi square measure of their association In this regard vulnerability driven
factor was the highest significant factor in the first two phases while managerial incapability
driven factor in the last phase of change management process
1
CHAPTER ONE
INTRODUCTION
11 Background of the Study
Nowadays many literatures about organizational change like for example (Rumenet 1995
Frankwick 1995 Freeze B1998) make their introductory paragraph as an obligation to
underscore change as a steady state of the contemporary organizations) This thesis is no
exception Organizations have to change to adapt to the new demands of their environments But
implementing change is so difficult that it is a miracle if it is enhanced easily One major traced
barrier for implementing change is resistance from employees (Schein(19950)) Many
psychological and management literature describe resistance as a normal or even natural
psychological response to change (Rumenet (1995))
Some scholars like Rumenet (1995) say that the stability of human behavior is based on a quasi-
stationary equilibrium maintained by a complex field of driving and restraining forces For
change to be accepted then the equilibrium needs to be destabilized before old behavior can be
discarded (unlearnt) and the future should promise to be better For others like Lewin (1947a)
humanrsquos sense of self is defined by onersquos context of the known and learning Change which
represents the unknown then forces to redefine oneself and onersquos world Resistance is then a
result of this fear Still others like Gebriel(2002) extrapolate resistance to come from the
combination of managerial problems level of social placement and vulnerability issues which is
the focal interest of this study
The Ethiopian Civil Service which was formally established during the reign of Menelik II in
1907 underwent a series of structural and strategic changes commensurable with new needs and
global imperatives Getachew H amp Richard K (2006)
The organ which is currently operating as ministry of Capacity Building is practicing change
management principles and knowledge in the public organizations In the recent five years
change is a day to day agenda to almost all public organizations of Ethiopia Almost all public
organizations of the country have tried Business Processing Reengineering (BPR) since 2003
(Tilaye 2007 amp Yetimgeta 2007)
While many failed to successfully practice BPR (Tilaye 2007) the following public
organizations were the first successful ones Commercial Bank of Ethiopia (CBE) Transport
2
Office Ethiopian Customs and Revenue Authority Ministry of Trade and Investment Ministry of
Agriculture and Rural Development (Tesfaye 2009)
Important question that must be posed now is how these organizations were successful to practice
BPR While so many factors can contribute for the failure or success of a change effort for it is
not manageable to exhaust all resistance to change is separately taken for this study while the
Commercial Bank of Ethiopia (CBE) is the population of the study
The study is focuses on identifying the most significant issues that managers leading any change
process at any phase should be aware of meaning to note that which source of resistance at what
phase of change presents the highest impact on change effort and determine which aspects should
be specially considered at an organizational change
Then what possible spring points of resistance are there in employees to downpour or secrete
confrontation during managerial change effort so that possible counter avoiding can be designed
12 Statement of the Problem
This study follows firmly the three phase model classification of change process of Lewin (1947)
which is a well distinguished model by a well known scholarly in the field of management and
takes backups and extrapolations from many other authors whom arguments and principles circle
around the Lewinrsquos model
In this study all sources of resistance are grouped in to three ie demographic attributes of
employees driven personal vulnerability driven as well as managersrsquo incapability driven factors
for which their theoretical underpinnings can be seen in the literature review part The coefficient
of all sources of resistance are the critical concerns of this study and are weighed against which
aspect of sources of resistance presents a higher disparity of impact considering the phases of the
change process The specific areas that this study assumed need to be empirically investigated are
The strength and distribution of vulnerability driven factors of resistance and factors
related to the managerial incapability regarding in the Lewinrsquos three phases of the change
process (Unfreezing Moving and Refreezing)
The significance level of the effect of specific factor under vulnerability driven and the
same under managerial incapability driven factors over the phases
3
The existence and distribution of resistance over the demographic attributes of an
individual within an organization how is distributed over age gender over experience
and educational level if any
Resistance to change is a topic of interest for researchers in the field of management and business
administration Pardo et al (1999) for example made an empirical study on resistance to change
wanted
To observe if resistance is higher in strategic than in evolutionary change and found the
more radical and transformational the change is the more powerful resistance to change
is
To know which sources of resistance present a higher disparity considering evolutionary
and strategic changes and found the source related to deep rooted values followed by
conflict of interests between employees and managers and the existence of change values
that are against organizational values that hinder change are highly inconsistent
To compare the degree of importance of the sources of resistance in general in
evolutionary and in strategic changes and found that in evolutionary changes the
progression of the importance of the sources of resistance is almost the same as in changes
in general Conversely in strategic changes such hierarchy was found altered For
example the lack of a creative response was eleventh in general changes and thirteenth in
evolutionary changes but it moved up to the fourth place of importance in strategic
changes
The following paragraphs are some characteristics that set this study apart from the previous
researches conducted on the issue They entail which problems were covered so far and which
was not which specific problem is to be covered now from among the universe of the issue and
which is not
1 While the above study Pardo et al (1999) focuses on the disparity of resistant to changes
compared between evolutionary and strategic types of changes whether the strength of the
factors of resistance is similar or not on all the phases of the change process (unfreezing
moving and refreezing) is not on its domain for which the current study is interested to
cover this gap
2 Even if there are consensuses on the theoretical underpinnings on the relationship between
demographic characteristics of an employee and the tendency to resist changes this study
4
aims at verifying their relationship based on empirical results This contributes not only on
adding new knowledge but also on the confirmation of the existing knowledge if the
theories are confirmed
However while each resistance variablersquos statistical significance at different level of the change
process (individual group and organizational level) for the inertia to change are not determined
by Pardo et al (1999) the current study has not also covered it but believes this perspective is
part of the universe of the issue and need to be covered despite the fact that decision is not made
to cover this specific problem on this endeavor
Generally the need to get depth amp scale in some cases and verify the issues that the scientific
community has theoretically agreed on other cases thereby to reach evidenced conclusion backed
by compendium of empirical studies constitute the basis for undertaking this move
13 Objectives of the Study
The main objective of the study is to determine the factors that attribute to the resistance of
change management in the Commercial Bank of Ethiopia Specifically it aims
To find out the degree of significance of each of the agreed sources of resistance to
change with respect to the Kurt Lewinrsquos three phases of change management process
To determine whether demographic attributes of an employee like age gender
education and experience have any significance to resistance to change management
To determine the significance level of personal vulnerability on resistance to change
management
14 Hypothesis of the Study
The following three debatable points were considered in tradeoff to one another then which one
is declined and which other one accepted are put after the statistical tests
H1 A single factor of change resistance can have varied significance level on different
phases of the Lewinrsquos three phasersquos model of change process
H0 A single factor of change resistance cannot have varied significance level on different
phases of the Lewinrsquos three phasersquos model of change process
H1 Demographic attributes of an employee can significantly cause the tendency to resist an
organizational change effortrdquo
5
H0 Demographic attributes of an employee cannot significant cause the tendency to resist
an organizational change effortrdquo
H1 Personal vulnerability presents highest significance level on resistance to change
throughout all the phases of the change management process
H0 Personal vulnerability doesnrsquot presents highest significance level on resistance to
change throughout all the phases of the change management process
15 Scope of the Study
This study is conceptually delimited to the determinants of change resistance on selected types of
changes that have happened in the Commercial Bank of Ethiopia Literally two perspectives
change types and change processes are the major concepts covered
From magnitude perspective resistance on transformational type of change as many considers
BPR to be transformational eg Stephen amp Godwin (2010) are covered But there will always be
incremental and major changes as a subset of transformational changes So the study also
covered these small changes too The same is true from focus wise it is mainly strategic but
operational and evolutionary changes are also there But resistances according to the level of
change meaning individual teamunit as well as organizational levels are not seen prospectively
Hoping to observe a variable factorrsquos significance in different phases of the change process the
Lewinrsquos (1947) three phasersquos model of change process (unfreezing moving and refreezing) is
exhaustively dealt with
For reasons to be explained in the methodology part the study is geographically delimited to the
internal environment of the Commercial Bank of Ethiopia in the 27 branches of Addis Ababa a
governmental financial institution in Ethiopia The study time is confined for the period August
2012 to January 2013 Findings and results of the hypothesis of the research would therefore be
expected to hold true only for the subjects concerned and for the stated period
16 Limitations of the Study
The study dwells to the unidirectional simple logit regression analysis While some may expect
the simultaneous or bidirectional two way effects of the dependent and independent variables
for the simultaneous relationship of the variables in this topic would make no sense the
simultaneous model is out of reach of this study
6
According to Geoffrey M et al (2005) any research has to comply with the following reliability
and validity indexes external constructive and statistical validity indexes as well as test-retest
reliability indexes
Accordingly this study lacks external validity meaning the results of the study may not
generalize to conditions participants times and places other than the stated one
However the rest validity indexes are fulfilled in that construct validity is maintained because any
question and variable factor indexing element is guided by strong theoretical underpinnings which
serve as base for the causal relationship and empirical test of variables
Statistical validity is also fulfilled in that any aspect of the data quantification and data processing
modeling is logit model that is well distinguished in realms of research as a powerful model to
analyze a data with a binary categorization
From reliability angle this study lacks the Test-Retest reliability in that stability of test scores
over time is not known because this action is not repeated on another occasion or time
Another limitation is that the data is as true as the honesty of the respondents assumption is
respondents will be honest Besides to this individualrsquos decision to behave in some way is an
amalgamated result of various inner processes that no researcher can comprehend and exhaust the
inner process rather what is seen is the final decision of the person only which has unavoidable
impact on the accuracy of the study
Generally under the unavoidable limitations using the aforementioned tactics the study has tried
to get data that helps support or reject the established hypothesis
17 Significance of the Study
This study is worth of time effort and expenses that require priority and urgency of answer This
is because other than other small beneficiaries the knowledge obtained from this study may serve
mainly two major target groups for the academic world and the business community
For the academic world it may contribute to the knowledge of resistance to change from
perspectives like the phases of the change process typology of changes as well as drivers of
resistance by a large compendium of empirical study and different theoretical underpinnings
existed separately in discretion forms
7
For the business community it may provide an analytical reflections on which possible source of
resistance should be specially considered and which to need customized focus according the
phases by showing which concern to increase with what phase type and level of change it is
Besides to that it can be taken as reference for other researchers to conduct deepened research on
the topic or others can refer on the methodology of this study
8
CHAPTER TWO
LITERATURE REVIEW
This chapter by putting the following two major issues to the fore forms the theoretical framework
by wholly basing the theoretical and empirical underpinnings show the relationship
The theoretical and empirical backgrounds of the what of change management its types and
phases and the why of change management
The theoretical and empirical backgrounds of the what of resistance to change management
the sources to resistance in relation with the phases of the process
21 Theoretical Backgrounds of Change Management
Organizational Change management is an important aspect of the discipline management that tries to
ensure that a business or any organization of people and asset responds to the environment in which
it operates (Van de Ven and Poole 1995) by a conscious introduction of new ways of thinking and
operating that suit the demand of the changing world for better future ( Freese 1998) Change
management occurs when you need to adapt to the environment (Child and Smith 1987 Leana and
Barry 2000) or when you are dissatisfied with where you are (Boeker 1997)
Dealing with change is inescapable
Change management has got different typologies Changes can be defined along a continuum
starting in magnitude (incremental major changes and transformational) by Focus of change
(strategic or operational) by Level of change (individual team organizational) (Bernard 2004
Strebel1994) and by phase of change( unfreezing moving and refreezing) (Kurt lewin 1947)
a In magnitude perspective
1 Incremental changes are small changes that alter certain small aspects looking for an
improvement in the present situation but keeping the general working framework (Levy 1986)
Major changes are substantial changes in an organization and its operations (Nadler and Tushman
1989) Examples include organizational restructuring producing new product lines opening new
branches or sites of operation etc
2 Transformational changes are radical changes where the organization completely changes its
essential frameworks and values (Ghoshal and Bartlett 1996) looking generally for a new
9
competitive advantage in the market (Frankwick 1995) and affecting the core concepts of the
organization (Ruiz and Lorenzo 1999)
b From Phases of the change process perspective
Lewinrsquos Three Phase Theory of change management process
Kurt Lewin is often cited for his key contribution to organizational change (Burnes 2004 Rumelt
1995) A successful change project Lewin (1947) argued involved three steps which is known as
the unfreezing-change-refreeze model (Burnes(2004) These are
Stage 1 ndash Unfreezing
According to Lewinrsquos(1947) argument the stability of human behavior was based on a quasi-
stationary equilibrium supported by a complex field of driving and restraining forces He argued that
the equilibrium needs to be destabilized (unfrozen) before old behavior can be discarded (unlearnt)
and new behavior successfully adopted It means getting motivated to change this phase of change is
built on the theory that human behavior is established by Past observational learning and cultural
influences Change requires adding new forces for change or removal of some of the existing factors
that are at play in perpetuating the behavior The unfreezing process has three sub-processes that
relate to a readiness and motivation to change for proper unfreezing to occur
1 Disconfirmation of the validity of the status quo where present conditions lead to
dissatisfaction However the larger the gap between what is believed and what needs to be
believed for change to occur the more likely the new information will be ignored
2 The induction of guilt or survival anxiety previous beliefs now being seen as invalid
creates ldquosurvival anxietyrdquo However survival anxiety may not be sufficient to prompt
change if learning anxiety is present
3 Creating psychological safety learning anxiety triggers defensiveness and resistance due to
the pain of having to unlearn what had been previously accepted Three stages occur in
response to learning anxiety denial scapegoating amp passing the buck and maneuvering amp
bargaining
It is necessary to move past the possible anxieties for change to progress This can be accomplished
by either having the survival anxiety be greater than the learning anxiety or preferably learning
anxiety could be reduced Schein (1996)
Stage 2 ndash Changing (Moving)
Once there is sufficient dissatisfaction with the current conditions and a real desire to make some
change exists it is necessary to identify exactly what needs to be changed Three possible impacts
from processing new information are words take on new or expanded meaning concepts are
1 0
interpreted within a broader context and there is an adjustment in the scale used in evaluating new
input
A concise view of the new state is required to clearly identify the gap between the present state and
that being proposed Activities that aid in making the change include imitation of role models and
looking for personalized solutions through trial-and-error learning
As Schein (1996) unfreezing creates motivation to learn but does not necessarily control or predict
the directionrsquo This echoes Lewinrsquos view that any attempt to predict or identify a specific outcome
from planned change is very difficult because of the complexity of the forces concerned Instead
one should seek to take into account all the forces at work and identify and evaluate on a trial and
error basis all the available options (Lewin 1947)
Stage 3 ndash Refreezing
Refreezing is the final stage where new behavior becomes habitual and the change permanent which
includes developing a new self-concept amp identity and establishing new interpersonal relationships
It seeks to stabilize the group at a new quasi-stationary equilibrium in order to ensure that the new
behaviors are relatively safe from regression The main point about refreezing is that new behavior
must be to some degree congruent with the rest of the behavior personality and environment of the
learner or it will simply lead to a new round of disconfirmation (Schein 1996) This is why Lewin
saw successful change as a group activity because unless group norms and routines are also
transformed changes to individual behavior will not be sustained In organizational terms refreezing
often requires changes to organizational culture norms policies and practices (Cummings and Huse
1989)
22 Backgrounds of Resistance to Organizational Change Management
Different authors have classified sources to resistance from different perspectives
After wide ranged assessments of the various sources of resistance under different names and angle
of looking this research heavily followed Rumelt (1995) but divides the sources of resistance into
three groups To entertain different perspectives from other authors other sources of resistance are
added to Rumeltrsquos proposal Some sources of resistance which were treated separately by Rumlet
(1995) are mingled with other similar sources and gained another general name The names of the
groups are also altered in order to include the new sources insights and perspectives
1 1
Accordingly in this study all the factors of resistance stated by different authors are made to lay
under three general factors mainly demographic attributes driven factors Vulnerability driven
factors or Managerial incapability driven factors
221 Theoretical Backgrounds of Resistance to Change Management
A Demographic Attributes Driven Factors
For reasons not reached orand covered in this study individual level characteristics or person
oriented issues which are equally crucial for the success of change (Maria V et al (2003) ) have
been neglected in many of the scientific studies on organizational change despite organizational
characteristics in change process has been extensively discussed in realms of management
literatures Therefore the purpose of the present study is to add a different way of looking and
working with organizational change by focusing on individualsrsquo demographic attributes but
personal traits are not also failing under the scope of this study despite the fact that they are personal
factors This paper explores how individualsrsquo demographic attributes can hinder or rather facilitate
organizational change at an individual level by exploring the relationship between these attributes
and attitudes toward organizational change
After a through revision of literatures the study has got it more sounding to concentrate on the
following employeesrsquo demographic attributes as highly pronounced by Rumelt (1995) for the
empirical to be detailed under each subsection of the attributes Age gender Educational status and
Experience are brought to debate for many scholars on their significance level to resistance to
change
B Vulnerability Driven Factors
According to Marc (2008) change affects the various boundaries within an organization Boundaries
to Mark are the technical formal and informal structures that an individual will assume in his or her
job position and summarized them into three groups They are
Roles (the place a person is assigned in an organization)
Tasks (is the act required by an individual to work for achieving an output
Authority (how the above roles and tasks are authorized what decision-making authority an
individual or group has)
During any change process the alignment of these boundaries becomes skewed then impacts role
task and authority Resistance then is the way the employees protect themselves from the tilting
1 2
operational unfamiliarity work load and regulatory tightening and the emotions connected to these
losses that come from boundary shifts
As Peter (2007) stated resistance is tied to our belief systems culture familiarity in our own and the
tension of loosing future general benefits or not meeting our future goal He assumes that our fear
of loss is at the heart of change Resistance is a result of this fear an expression of how people feel
about the change effort at hand When things change people begin to worry about what they might
lose including Job and position Income and benefits and work place social destructions
According to William (1980) humanrsquos sense of self is defined by his or her roles his or her
responsibilities and his or her context of the known and learning Change then forces to redefine
oneself and onersquos world Change represents the unknown Change could mean the possibility of
failure the surrender or diminishing of onersquos span of control and authority or anything of that sort
for that matter Employees do not want to lose the familiar safe routine ways of life in favor of the
unknown and possibly unsafe area As humans one tends to prefer routines and accumulate habits
easily since humans behavior which is the function of learning is shaped by rehearsal and usualness
Any one of these possibilities can cause fear then causing resistance however fear of change may
be attributed to or can engulf even more than the mere tendency towards regularity or adaptation
C Managerial Incapability Driven Factors
According to SACD (2000) the factors that can be brought to this category of sources of resistance
were
- Knowledge and skills of the leader change will be resisted if the change agent cannot
effect change and does not have the appropriate knowledge and skills to practice if cannot
educate the implementers on what the change is all about cannot communicate the objectives
that should be achieved and if any doubts and questions the population has is not dispelled
and answered promptly
- Poor communication (lack of information misinformation) workers carrying out the
change are not informed about the aims of the change the requirements to introduce the
change and how the change will be introduced are not communicated If incorrect
information is given and the usefulness of the change is not well taught
- Organizational climate with low trust If there is mistrust in the organization
- Weak relationships When relations between the change agent and the employees are not
plain
1 3
- Fear of failure If they are not sure of the results
Resistance pertaining to the phases of change
a Sources of Resistance in the unfreezing Stage
The following sources of resistances are the sources that are mainly proposed by Rumnet (1995) but
have got many supports from others too These are taken as a basis to formulate the theoretical
framework of the current study but are manipulated in a way that can entertain other way of looking
from for example listed in the above theoretical and empirical underpinnings When the frame work
is constructed it has got some sort of new name general inclusive phrase in a very short way but for
now let directly go to Rumnetrsquos proposal
1 Managerial incapability driven factors It includes
Myopia inability of the company to look into the future with clarity (Rumnet1995 Barr et
al 1992
Communication barriers information distortion or misinterpretations (Hutt et al 1995
Rumnet (1995)
Organizational silence individuals who do not express their thoughts meaning (Rumnet
1995 2000 Nemeth 1997)
Past failures which leave a pessimistic image for future changes (Rumnet 1995 Lorenzo
2000) and
2 Vulnerability driven factors
direct costs of change (Rumelt 1995)
cannibalization costs change that brings success to a product but at the same time brings
losses to others(Rumelt 1995)
cross subsidy comforts because the need for a change is compensated through the high rents
obtained without change with another different factor(Rumelt 1995)
Different interests among employees and management employees value change results less
than managers value them (Rumelt 199 Waddell amp Sohal 1998)
complex environmental changes do not allow a proper situation analysis (Ansoff 1990
Rumelt 1995)
b Sources of Resistance in the moving phase
1 4
This phase is phase of implementation which is the critical step between the decision to change and
state of stability in the new world (Klein and Sorra 1996) In this stage also two sources of
resistance can be found mainly
1 Vulnerability driven factors
Implementation climate relation between personal change values and organizational values
(Klein and Sorra 1996 Rumnet 1995)
denial refusal to accept any information that is not desired (Rumenet 1995)
departmental politics or resistance from those departments that will suffer with the change
implementation (Rumenet 1995)
Incommensurable beliefs definitive disagreement and conflict among groups of workers
about the nature of the problem and its consequent alternative solutions (Klein and Sorra
1996 Rumelt 1995)
Forgetfulness of the social dimension of changes (Lawrence 1954 Rumelt 1995)
2 Change agentrsquos incapability driven factors According to Rument (1995) the factors that fall
under this category are
Leadership inaction leaders are afraid of uncertainty
collective action problems difficulty to decide who is going to move first
Lack of the necessary technical capabilities to implement change ndash capabilities gap
c Sources of resistance in the refreezing phase
Perpetuation of ideas the tendency to go on with the past thoughts even after the situation
has changed
deep rooted values and emotional loyalty
Inadequate strategic vision Lack of clear commitment of top management to changes
(Rumelt1995 Waddell and Sohal 1998)
NB Demographic driven factors are not listed in this phase based division because one thing they
are not under the proposal of Rumnet (1995) and second thing demographic attributes will not
basically change in the phases of change process
222 Empirical Backgrounds of Resistance to Change Management
A Vulnerability Driven Factors
1 5
Tesfaye (2009) who made his studies in the then Ethiopian Ministry Of Capacity Building and the
then Ethiopian Road Authority about resistance to change reveals that change resistors were due to
fear of losing their jobs while many were waiting to see group that feel indifference about the
change and few tried to protect their friends or subordinates He also found that the acronym
ldquoBPRrdquo the phrase ldquoResult Based Performance Managementrdquo and the word ldquoreengineeringrdquo were
associated with downsizing thereby had become the sources of fear and insecurity for many of the
civil service employees It was also assumed that according to the same author these words are
meant for eliminating non-value adding activities then automating the previous manual activities
lead to at least cost reshuffling of employees or downsizing the workers unless the volume of work
remained same otherwise
He further found that assumed that horizontal integration leads to the combination of two or three
functional processes into one which resistance was not to abandon their status and benefits while
BPR was presumed to cause obsolescence of their knowledge
Finally he gave a concluding remark of his research by stating the major causes of resistance are
fear of losing position jobs benefits status and obsolescence of skills and knowledge while he
found that resistance of change could come from all managerial levels(lower middle and the top
level managers
According to SACD (2000) which made its study in South African companies the reasons that can
be brought to this category of sources of resistance were Fear of the unknown (uncertainty about
causes and effects of the change) Threat to status (Reduction in the size of an organization then to
lose their top posts or positions) and threat to power base (reduce the influence one has if resisted by
the affected persons)
B Managerial Incapability Driven Factors
According to SACD (2000) which made its study in South African companies the factors that can
be brought to this category of sources of resistance were
- Knowledge and skills of the leader (if the change agent cannot effect change and does not
have the appropriate knowledge and skills to practice if cannot educate the implementers on
what the change is all about cannot communicate the objectives that should be achieved and
if any doubts and questions the population has is not dispelled and answered promptly)
change will be resisted
1 6
- Then Poor communication which seems the same with the above but differs in that it
concentrates in one lack of information (workers carrying out the change are not informed
about the aims of the change the requirements to introduce the change and how the change
will be introduced are not communicated Second when misinformation (If incorrect
information is given and the usefulness of the change is not well taught) happens
- Organizational climate with low trust If there is mistrust in the organization
- Weak relationships When relations between the change agent and the employees are not
plain
- Fear of failure If they are not sure of the results
- Unclear benefits If the benefits to be gained out of the change are not clear if there is no any
motive to go forward
- Fear of looking stupid when the procedures for implementing the change are not well
clarified or are unfamiliar to the employees
According to Beer and Nohria (2000) seventy percent of change efforts fail because of the in
capabilities of the top and middle level managers of change mainly the absence of clear strategy and
foreseeable vision miscommunication and trust lack of top management commitment lack of
resources needed fully practice the change lack of managerial skills on change management and
lack of managing resistance to change
C Demographic Attributes Driven Factors
i Age
According to Bouti (2010) who studied the relationship between employees age and their resistance
to change by considering organizational tenure as moderators in explaining the ageresistance to
change association a negative relationship between age and the tendency to resist change was found
that implies that younger employees were more resistant to change than older one He extrapolated
his study to find out the behind why of the observation then stipulated that having a longer work
tenure are identified as positive boundary conditions for the observations on the relationship of the
two to be opposite
But according to Maria amp Ioannis (2005) no differences were identified among the four age groups
of their samples
ii Educational Attainment
1 7
Maria V et al (2003) studied on the relationship between personal variables and attitudes towards
organizational change To identify whether educational attainment affects employees attitude
towards organizational change he put four levels basic education further education degree
university degree and post graduate degree Then found that there is a significant effect of
educational attainments on resistance to change In that university graduates express less positive
attitudes than both the postgraduate and further education graduates
But according to Maria and Ioannis 2005) education showed a positive impact on attitudes towards
change in that employees with higher education are better equipped to meet new challenges at work
then supported their ideas that Iverson (1996) confirms their finding
iii Gender
Maria V et al (2003) studied on the relationship between personal variables and attitudes towards
organizational change He wanted to examine whether there is significant difference between males
and females regarding their attitudes towards organizational change The result of his study revealed
that there was no gender difference regarding attitudes towards organizational change Sverdlik amp
Oreg (2009) also observed no significant difference between men and women in terms of resistance
to change management if gender is treated independently But through interaction effect of the
combination of gender and experiance males who had held a position of authority at an earlier
employer were less likely to resist change than those who did not fit those criteria (both being male
and previous position)
But according to Maria and Ioannis (2005) aiming to investigate whether gender affects both
attitudes to change and stress at work they conducted independent t-tests and consequently females
scored higher than males on attitudes towards organizational change suggesting that males tend to be
more reluctant than females toward organizational change In terms of occupational stress they
reported that males also scored significantly higher than females on a number of scales that they
used to as indexing mainly work relationships overload and the overall job stress indexes that they
believed that change would bring them demonstrating thus higher levels of occupational stress is
found in males compared to females
Identifying the difference between men and women in change process is also complex since there
are feminist men and non feminist women (Sverdlik and Oreg (2009)
iv Experience
1 8
According to Sverdlik and Oreg (2009) while all of the demographic variables treated individually
have not predicted resistance to change three interactions (combination) of the variables mainly
gender faculty experience and administrative responsibilities at a previous place of employment
together negatively predicted the outcome variable (resistance to change) but not until the
interaction was observed a significant change
23 Theoretical Framework of the Study
The following sources of resistances are the sources that are extracted from the whole review of
literature The base is Rumnet (1995) but has got many supports from others too These are taken as
a basis to formulate the theoretical framework of the current study but are manipulated in a way that
can entertain other way of looking from for example listed in the beginning document titled as
theoretical and empirical underpinnings When the frame work is constructed it has got some sort of
new name general inclusive phrase in a very short way A summary of this literature review of
resistance results in the following sketch of the common view of the concept
Table 21 Main Variables
Demographic attributes driven factors Age
Gender
Educational status
Experience
Vulnerability
driven factors
Future Work load
Future Job security and position
Future Income and Fringe benefits
Social destruction and operational unfamiliarity
Future Rules and regulations
Managerial incapability
driven factors
Myopiashortsightedness
Interpretation communication barriers
Organizational silence apathy
Existing investment
past failure and uncertainty anxiety
Implementation capabilityrsquos gap
Source compiled from literature review
Table 22 The Variable Relationship
Independent Variable Dependent Variable
Managerial Incapability Driven Factors Resistance to organizational change
1 9
Demographic Attributes Driven Factors management
Vulnerability Driven Factors Driven Factors
Source compiled from literature review
Source summary of literatures
Diagram1 A relationship that shows the variable prediction
After this theoretical exposition if the sources of resistance resulting from the literature review agree
with the ones observed in business practice are checked Finally the relationship between sources of
resistance in the theoretical framework and the dependent variables are analyzed
RESISTANCE TO CHANGE
MANAGMENT
2 0
CHAPTER THREE
METHODOLOGY
31 Research Design
This research is interested to study the cause and effect relationship of each of the independent
variables and the dependent variable on resistance to change So apparently it follows causal
research design A causal type of design suits for this study because it has the following features
It is concerned with describing the causal relationships of the variables
It believes that variations in the independent variable will be followed by variations in the
dependent variable when all other things are equal and so do the hypothesis of the current
study
The study has therefore assumed a causal type of research design where the above causational
features of the variables can be exhaustively dealt with
32 Sample Design
321 Target Population
The population taken for this study is the employees of the Commercial Bank of Ethiopia It had
two criteria for selecting this case
As of Levy amp Merry (1986) to make a clear and successful research on resistance the
organization had to be involved in a major or second-order change process This kind of change
processes affects the strategy structure hierarchy culture technology and work processes of an
organization It is more likely to find resistance in second-order change processes than in
situations where little improvement is sufficient to deal with external demands or to solve internal
problems So the first criterion for selecting Commercial Bank of Ethiopia (CBE) as a population
was due to that the bank has made a second order or major change by BPR
As of Seashore (1987) an appropriate population to be targeted to work with the feedback
method is that the population of the case would be medium-sized (ie has 100 to 500 respondents
as the author defines medium sized) So this was the second criterion for selecting the
Commercial Bank of Ethiopia as the needed amount of sample can be gained in the bank
2 1
322 Sample Frame
For a reason to be explained in the sample size determination from among the 570 branches of
the commercial bank of Ethiopia 27 branches were taken that are found in Addis Ababa
Selecting Addis Ababa district has the following scientific and cost advantages
Its reputation for better implementation of the reform programs and thereby for better
practice of the designed second order change process as resistance to change process can
be better observed in second order changes like strategy culture structural hierarchical
and operational changes (as of Levy amp Merry (1986))
Due to proximity of branch banks significant time and cost reduction can be achieved
323 Sample Size Determination
According to Miller amp Kunce (1973) and Halinski amp Feldt (1970) as cited by Jamess B et al
(2001) not to face the risk of over or under fitting in using logit regression analysis an optimal
sample size must consist of ten observations per an independent variable
Then theoretically there are fifteen causing variables for which their variations thought to be
followed by variations in the dependent variable of resistance Their detail is well covered in
chapter two of this document
Thus taking in to account the idea of the above scholarly people conservatively the study uses
150 as a sample size of the study which is the multiplied output of ten observations and fifteen
independent variables of the study According to Levy amp Merry (1986) the top level and middle
level managers would have better sight of the problems during the change process Then in the
piloted pre data collection it is found that on average seven respondents can be found in this
position By dividing 150 (the multiplication of ten observations and 15 variables) to seven it
came 22 branches to be approached for data to entertain these ideas of the scholarly
The concept of sample penalty is dully applied here as some rigidity is required that data
from150 should be collected excluding incomplete answers and unfilled questionnaires
According to Jamess B et al (2001) it can be assumed that about 75 percent of the distributed
would be collected back correct and therefore in this study it was decided that25 more be
distributed Therefore 200 questionnaires were distributed and the number of bank branches to
be approached was raised up to 27 while collection was conducted up to the needed correct
2 2
amount is gained Response rate was not determined as collection was stopped after complete
150 was collected
324 Sample Selection
The sampling used is hierarchical meaning non probability sampling methods in taking profile
but probability sampling to observe a case This is because according to Levy amp Merry (1986)
those who found in higher organizational structure of the bank may have better sight of the
situation in change process and are better part of the change as it will affect the hierarchy strategy
and role of the position that they work at But from among the same profile probability sample
selection is used
Code was given to avoid bias on the selection of a case or sample unit Each sample unit in the
population had to get a numerical code according the name fetched from the organization The
numerical code was submitted to excel which case to select then to be produced objectively in
lottery method
33 Type of Data
A retrospective dataset but a snapshot from cross section of the population consisting of current
single observations on variables at earlier continued points in time was taken Time is an
important dimension in a causal research design and so do the data set taken for this study It
believes that respondents asked at a single point can give reliable retrospective reports of what
continuously happened to them or what they thought at some earlier continuous points of time
designed in a way of making time series analysis
Apparently quantitative type of data was required for the study But to entertain qualitative ideas
a qualitative questionnaire was designed in such a way that it can be changed in to quantifiable
one during analysis so that the data could be processed in inferential statistics The data taken
constituted primary only as it has something to do with the behavioral science and this study
believes that behaviors better be studied primarily in person not from documents
34 Methods of Data Collection
The research was carried out based on questionnaire distributed to respondents Respondents had
to answer questions dealing with a change process and the tendency to resist that had happened in
2 3
their respective departments and subordinates The questions that are expected to allow establish
the planned comparison included a list describing the factors that are considered previously as
sources of resistance to change Respondents were asked to give their confirmation or
disconfirmation on indirect statements that talk about how much the before-mentioned sources of
resistance had affected their tendency to resist Respondents had to indicate their position among
two points on that continuum Scoring 0 to indirectly talk that it was not a source of resistance at
all and 1 to mean that such source of resistance had contributions to the tendency to resist but not
necessarily that it either made the change agents to rethink on the change strategy and process or
had slowing effect on implementation The questionnaire was designed as flexible enough as
possible which can allow respondents to include other sources of resistance that was not on the
sight of the study with their respective relative impact on the change effort Unfortunately
however none of them added another new factor leading to a conclusion that the factors taken
were not only appropriate but also complete
35 Method of Data Analysis and Statistical Treatment
351 Method of Data Analysis
For the reason that the hub and title of the study is binary categorical in its very nature applying
logit regression model of data analysis seems meaningful and appropriate than other analysis and
regression models A binary dependent variable is a dependent variable whose range of values is
substantively restricted to two zero and one (yes or no) Geoffrey M et al (2005) Thus the
study used logit to explain the determinant factors for enhancing change management effort
successful or hindering change management efforts Besides to this the study used descriptive
statistics to describe the sample characteristics
Descriptive analyses were also used to summarize a study sample and single variable factor prior
to analyzing the studyrsquos primary hypotheses by amalgamating all sub-variables together To draw
conclusions beyond the immediate samples and data on a single variable inferential statistics was
used in an attempt to draw inferences about the populations from which the samples were drawn
as well as about the relative effect of the one variable among others
2 4
352 STATISTICAL TREATMENT AND MODELING
3521 THE LOGISTIC REGRESSION FUNCTION
The binary logit regression modeling used for this study is based on the theoretical backgrounds
that resistance is a function of demographic characteristics driven factors vulnerability driven
factors and managerial incapability driven factors This is found after so many clash of theories
and studies of so many angles then all combined and concluded by the current researcher in the
following way The theories are well covered in chapter two of this document
The function is
R = f (H M V)
Where
R = the tendency to resist
H = Demographic attributes driven factors
M = Managerial incapability driven factors
V = Vulnerability driven factors
Then the model is put as follow
The model is Logit (R) = α + β1 X1 + β2X2 + hellip +β6X6
logit [p(x)] = log P
1-p
Where
X1 to x6 are the explaining variables
p = the probability that a case is in a resistant category 1-p= the probability not to resist
The intercept α is the predicted value of R when the x1 through xn equal zero when (xi= 0)
ie the disturbance associated with it contains factors other than x1 x2 up to x6 that affect
R It is the log odds of a person with zero value of the current explaining variables but to
be in the resistant category
β1 is the parameter associated with the predictor variable x1 while β2 is the parameter
associated with the independent variable x2 and so on through β6 and x6
3522 Odds Ratio and Marginal Function Analysis
The following section that shows the statistical tools are brought from
Geoffrey M et al (2005) and Jamess B et al (2001)
2 5
For a binary event R (ie the event either occurs (R = 1) or doesnt (R = 0)) let
P is the P (R= 1)
P1 = P(R = 1V = 1)
P0 = P(R= 1V= 0) where
V is some binary characteristic that is thought to play a role in the conditional distribution of R
(resistance) V could be gender vulnerability managerial incapability age education or
experience
Onersquos one of these predictors are found that they have some influence on the probability of the
event R to happen then these result are presented and interpreted in the following potential
parameters of interest
1 Computing Odds Ratio From Logistic Regression Coefficient
Odds
Odds are ratios defined as the ratio of the probability to its complement or the ratio of favorable
to unfavorable cases If the probability of an event is a half the odds are one-to-one or even If
the probability is 13 the odds are one- to-two
Odds =
Log Odds
Natural log of the odds are also known as logit log odds = logit = logit(p) = log
To see this
point note that as the probability goes down to zero the odds approach zero and the logit
approaches At the other extreme as the probability approaches one the odds approach to
and so does the logit Note that if the probability is 12 the odds are even and the logit is
zero Negative logits represent probabilities below one half and positive logits correspond to
probabilities above one half If for example there are 30 vulnerable among the 150 respondents
so we estimate the probability as 30150 = 02 The odds are 30120 or 025 to one so non-
vulnerable outnumber vulnerable by roughly four to one The logit is log (025) = -0602 In the
vulnerable data the estimated logit was -0602 Conducting exponentiation on this value one can
obtain odds of exp (-0602) = 025 and from this one can obtain a probability of
= 02
Odds Ratio The standard way of interpreting a coefficient in logistic regression is using the
conversion of it to an odds ratio using the corresponding exp (coefficient) value Jamess B et al
2 6
(2001) This is ratio of ratios Odds ratio (OR) estimates the change in the odds of membership in
the target group for a one unit increase in the predictor It is calculated by using the regression
coefficient of the predictor as the exponent or exp
Odds Ratio =
=
= P(R=1V=1 x)
1-P(R=1V=1 x)
P(R=1V=0 x)
1-P(R=1V=0 x)
If coefficient is equal to 269 the odds ratio is exp269 or 1473 Therefore the odds of
incorporating is 1473 times greater for a case for example which had a one unit greater value
If the logit b =15 then the corresponding odds ratio ( exp(B) will be 448 One can then say that
when the independent variable increases one unit the odds that the case can be predicted
increase by a factor of around 45 times when other variables are controlled
A 1 unit increase in education for example increases the odds of resistance about 45 times
The idea here is that we want to evaluate everyones probability of being resistant in two states of
the world when V = 1 and when V= 0 One should thus compute P(R= 1V = 1 x) and P(R =
1V= 0 x) for each observation in the sample
Presenting the results of odds ratio in percentage the decimal number is reported For instance if
the odds ratio is 12 then one can say on average the vulnerable are 20 percent probable to be
incorporated in the resistant category It means for a one unit increase or decrease in one
variable we expect to see about 20 percent decrease or increase in the odds of being in the
resistant category
Coefficient = Lan
It means holding other things at a fixed value what is the odds of getting a resistant category for
a person possessing x variable over the odds of getting in to resistant category for a person not
possessing x variable
Mfx (marginal function) = keeping other things constant what is the probability of a person to
incorporate in to resistant category due to one unit increase or decrease of a variablersquos value from
its mean value
2 7
It is the difference of R occurring for those for whom V = 1 over those for whom V= 0 for
dummy variables and the difference between V= x and V= x-1 or x+1for continuous variables
where x is the mean)
It is the relative risk of R occurring for those for whom V = 1 over those for whom V = 0 It is
not the difference in risks Rather it is the
Marginal Effects in the Logit
The marginal effect is the difference in the probability of the event occurring between those for
whom V = 1 and V = 0
The Marginal Effect of V on the probability of R ME = p1 ndash p0
= P(R = 1V= 1 x) - P(R = 1V = 0 x)
2 8
CHAPTER FOUR
DATA PRESENTATION AND ANALYSIS
Table 41 Profile of respondents
variable obs mean StdDev
Age 150 3497 410
Education 150 1589 130
Experience 150 679 281
Source primary data produced by stata
It is too hard to exhaustively put the profile of respondents as age experience education were
put in a continuous way year after year So to just give a glimpse of the profile mean value and
standard deviation are taken Accordingly the mean of the age of the respondents is 3497 years
while on average a single individualrsquos age deviates from this value by 4 Years Then the mean
value of the years of experience of the respondents is 679 and the standard deviation of this
experience value is 28 while on average an individual respondent has 1589 numbers of formal
educational years Gender wise 52 of the respondents are female
Assumptions of this analysis
1 This study assumes that attitudes towards organizational change that will enable a person to
decide for accepting or resisting a change is a bi-dimensional construct with a two opposite
poles (one positive and one negative) It is in this assumption that the questionnaire is
developed
2 The impact of education for completing one more year of school is considered same no
matter which grade year one completes
3 The impacts of age are considered to give the same per one year older or younger across
entire range of ages no matter which age level
NB These assumptions can be rejected at any time other than this research
Table 42 Marginal Functions of the Predictors in All the Phases
Phases Predictors
Std Err z Pgt|z| [95 Conf CI Interval]
unfreezi
ng
Gender -0071179 05132 -014 0890 -0107703 093467 052
Vulnerabilit
y
4790161 11565 414 0000 25234 705692 28
2 9
() dydx is for discrete change of dummy variable from 0 to 1
Source primary data
41 Analysis on the Demographic Attributes Driven Factors of Resistance
To determine the significance level of the general variables that affect the tendency to resists an
organizational change effort a logistic regression analysis was conducted to predict resistance
for 150 respondents using vulnerability managerial incapability and demographic attributes
driven factors as predictors The results of the logistic regression are interpreted using the
conversion of it to an odds ratio and marginal functions Analysis of the odds ratio estimates the
change in the odds of membership in the target group (resistant group) for a one unit increase or
decrease in the predictor The marginal function is the difference in the probability of the event
occurring between those for whom IV= x and IV = x-1 for continuous variables and for whom
those IV= 1 and IV= 0 for demy variables
Managerial
incapability
1426356 0742 192 0055 -002787 288058 333333
Education -0626887 02558 -245 0014 -112816 -012561 158933
Age 0080302 00927 087 0386 -010137 026197 349667
Experience 0321467 01552 207 0038 00172 062573 679333
Moving
Gender 0284055 07184 040 0693 -112395 169206 52
Vulnerabilit
y
5257476 09301 565 0000 343446 708049 426667
Managerial
incapability
1966289 08061 244 0015 038642 354616 54
Education -1128887 03482 -324 0001 -181129 -044649 158933
Age -0103804 01303 -080 0426 -035918 015157 349667
Experience 045889 02069 222 0027 005334 086444 679333
Refreez
ing
Gender 0244118 03418 071 0475 -042588 091411 52
Vulnerabilit
y
1053151 05667 186 0063 -005749 21638 366667
Managerial
incapability
4338297 09431 460 0000 248984 618675 366667
Education -0438404 01938 -226 0024 -08182 -00586 158933
Age -0070984 00632 -112 0262 -019489 005292 349667
Experience 0212898 0107 199 0047 000324 042256 679333
3 0
Education
Refer Annex 21-4 and table 42 for detail about the following
To investigate whether educational level affects the tendency to resist or accept a change logit
analysis with conversions of it in to odds ratio and marginal function was performed The
independent variable was the educational attainment counted the number of formal school years
and the dependent variable was the tendency to resist while the other predictors were age
experience managerial incapability gender and vulnerability
The marginal function analysis shows that if educational level is increased by one year from its
mean value keeping other things constant the response probability to resist for a change
decreases by 0626887 in the unfreezing phase by 01128887 in the moving phase and by
0438404 in the refreezing phase all in the p ndash value lower than the usual threshold of 005(95
significance) An odds ratio analysis provided that when other factors are controlled the odds of
getting in to a resistant category for people with lower educational level over the odds of getting
in to a resistant category for people with higher educational level is 05058056 per one formal
school year educational level in the unfreezing 05490948 in the moving and 05228659 in the
refreezing phase of a change process In percentage for a one formal school year increase in
education it is expected to see 51 decreases in the odds of being in the resistant category in the
unfreezing 55 in the moving and 53 in the refreezing phases of a change process
This finding is consistent with the finding of Maria V et al (2003) who found that there is a
significant effect of educational attainments on resistance to change in that university under
graduates expressed less positive attitudes than the postgraduate
It is also consistent with the finding of Maria and Loannis (2005) who even extrapolated their
findings by stating employees with higher education are better equipped to meet new challenges
at work which is also confirmed by Iverson (1996)
Therefore it can be tentatively (as an experimental not explanatory and single study the
findings should be considered tentative until verified by additional research on the why of the
relationship) concluded that educational attainment negatively predicts the tendency to resist to
an organizational change effort
3 1
Experience
Refer Annex 21-4 and table 42 for detail about the following
The marginal function analysis shows that if experience is increased by one year from its mean
value keeping other things constant the response probability to resist for a change increases by
0321467 in the unfreezing phase by 045889 in the moving phase and by0212898 in the
refreezing phase all in the p lt005 (95 significance) The odds ratio analysis provided that
holding other factors at a fixed value the odds of getting in to a resistant category for people
with lower experience level over the odds of getting in to a resistant category for people with
higher experience is 0435387 per one year experience level in the unfreezing 0382336 in the
moving and 0432382 in the refreezing phase of a change process In percentage for a one year
increase in experience it is expected to see 3823 increases in the odds of being in the resistant
category in the unfreezing 4354 in the moving and 4323 in the refreezing phases
The finding is consistent with the finding of Maria V et al (2003) in that they found experience
positively predicting the outcome variable They also extrapolated their finding to the fact that
the more the employees have internal experience the more they get a strong quasi-stationary
equilibrium of the self maintained by restraining force in a context of the known and learning
They underlined that the equilibrium to be destabilized needs a strong devastating force before
old behavior can be discarded (unlearnt) and the days to come should promise to be better
otherwise change which represents the unknown as well as which forces to redefine oneself and
onersquos world would be resisted for granted
This finding is inconsistent with the finding of Sverdlik and Oreg (2009) in that all of the
demographic variables treated individually have not predicted resistance to change in their study
It is also inconsistent because in theirs the three interactions of the variables mainly gender
faculty experience and administrative responsibilities at a previous place of employment
together negatively predicted the outcome variable (resistance to change) for which predictions
are positive in the current study
For the odds ratio coefficient and marginal function analysis presented a very strong relationship
of the variables in this study as well as for the interaction effect analysis is not conducted in the
current study (it is not statistically valid to compare two different tests) it seems plausible to
tentatively conclude that experience positively and strongly predicts resistance by sticking to the
current outcome
3 2
Table 43 Coefficient analysis of the predictors in all of the phases
Predictors Coef Std Err z Pgt|z| [95 Conf Interval]
Unfreezing obs = 150
LR chi2(6) = 7249
Prob gt chi2 =
00000
Log likelihood = -
45247594
Pseudo R2 =
04448
Gender_1 -0799158 5762905 -014 0890 -1209424 1049593 Vulnerab~1 3193757 7429257 430 0000 1737649 4649865
Imanaginc~1 131748 5465013 241 0016 2463566 2388602 Education -7048263 2574858 -274 0006 -1209489 -2001634 Age 0902853 1038507 087 0385 -1132583 2938289
Experience 3614344 1776071 204 0042 0133308 709538 _cons 2085881 4961242 042 0674 -7637974 1180974
Moving obs = 150
LR chi2(6) = 7517
Prob gt chi2 =00000
Log likelihood = -
53179678
Pseudo R2 =04141
Gender_1 2008976 5106137 039 0694 -7998869 1201682 Vulnerab~1 3275679 6460872 507 0000 2009371 4541986 Imanaginc~1 1421709 6031327 236 0018 2395901 2603827 Education -7964982 2298409 -347 0001 -1246978 -3460183 Age -0732399 0922177 -079 0427 -2539833 1075035 Experience 3237748 1460756 222 0027 0374719 6100778 _cons 917179 4201067 218 0029 9378503 1740573
Refreezing obs=150
LR chi2(6) = 6030
Prob gt chi2=00000
Log likelihood = -
42052758
Pseudo R2=04176
Gender_1 4131202 5685308 073 0467 -7011797 152742 Vulnerab~1 143697 6080867 236 0018 2451422 2628798 Imanaginc~1 3935963 8177563 481 0000 233319 5538736 Education -7399578 2713833 -273 0006 -1271859 -2080563 Age -11981 1073626 -112 0264 -3302368 0906167 Experience 3593389 1797309 200 0046 0070728 7116049 _cons 8628381 500873 172 0085 -118855 1844531
Source primary data
Age
Refer table 43 for detail about the following
Hoping to know how resistance to organizational change is distributed over the different age
levels of employees the same analysis was conducted
The result revealed that the impact of age on the tendency to resist was not statistically
significant in all phases and in all p values (plt1 plt5 and plt 10)
This is in contrast with the finding of Bouti (2010) who found a negative relationship between
age and the tendency to resist change which implies that younger employees were more resistant
to change than older one He extrapolated his study to find out the behind why of the
observations and then stipulated that having longer work tenure was identified as positive
3 3
boundary conditions or moderators for the observations on the relationship of the two to be
opposite
But this study is consistent with the findings of Maria and Loannis (2005) as no differences
were identified among the four age groups of their samples
It is possible that the dependence is observed in Boutrsquos finding because Bouti used experience as
moderator for that the prediction probability came in age might have come through experience in
an invisible root It may have resulted from the fact that age and experience are conceptually
overlapping items though the items were generated based on different theoretical underpinnings
in the literature But in here predictors are analyzed independently together So without
neglecting the findings of Bouti but dedicating to the current one as interaction analysis was not
reached seems plausible for that the tendency of age to predict resistance for an organizational
change is tentatively not accepted or is declined
Gender
Refer table 43 for detail about the following
To investigate the distribution of resistance over the male and female groups coefficient
analysis marginal function and odds ratio analysis methods were conducted While the results of
three of the above presented some gender wise variations with regards to the tendency to resist
over the phases they were reject able in which those values were not statistically significant to
predict the tendency in all p values (plt1 plt5 and plt 10)
This finding is consistent with the finding of Maria V et al (2003) who found that there was no
gender wise varied impact on resistance Sverdlik and Oreg (2009) also observed no significant
difference between men and women in terms of resistance to change management if gender is
treated independently But through interaction effect of the combination of gender and
experience males who had held a position of authority at an earlier employer were less likely to
resist change than those who did not fit those criteria (both being male and previous position)
But the current finding is not consistent with the finding of Maria Vakola and Ioannis Nikolaou
(2005) who conducted independent t-tests and consequently suggesting that males tend to be
more reluctant than females toward organizational change
To get gender predicting resistance Sverdlik and Oreg (2009) conducted interactional effect
analysis and Vakola and Ioannis Nikolaou (2005) conducted independent t-test These tests and
analysis were not conducted in here Statistically it makes sense to dedicate to the type of model
3 4
used Therefore by sticking to the current result of the logit regression analysis tentatively it is
concluded that the dummy variable gender (maleness or femaleness) doesnrsquot predict resistance to
an organizational change
The analysis conducted up to this point helps to consider the alternative hypothesis 2
ldquoDemographic attributes of an employee are significant to the tendency to resist an
organizational change effortrdquo This alternative hypothesis is partially accepted as education and
experience negatively and positively predicted the tendency to resist a change respectively The
null hypothesis of it (ldquoDemographic attributes of an employee are not significant to the
tendency to resist an organizational change effortrdquo) is also partially accepted because both
age and gender independently have not predicted the outcome variable (tendency to resist)
42 Vulnerability versus managerial incapability driven factors
Odds Ratio and Marginal Function Analysis
Insert both annex 2 and table 42 together about here
That fitted model presented that holding other things at a fixed value the odds of getting in to
resistant category for vulnerable over the odds of getting in to resistant category for non
vulnerable is equal to 2437985 in unfreezing phase 2646118 in moving and 4207927 in the
refreezing phase all in the p ndash value lower than the upper threshold of 005(95 significance)
Besides to this the marginal function analysis shows that the probability of getting resistance
from the vulnerable people due to a change plan is higher than the probability of getting resistant
people from the non vulnerable group of the change plan by 4790161 in the unfreezing by
5257476 in the moving and by1053151 in the refreezing
This result happened at plt001 significance level in the first two phases but came down in to
plt005 in the refreezing phase The coefficients and significance levels of personal vulnerability
driven factors in the first two phases are the highest coefficients and significance levels from the
factors studied in this study but managerial incapability driven factors took the position in the
refreezing phase at plt001(99 significance) which was only at 5 that it was significant in the
first two phases
Therefore tentatively it can be concluded that resistance that come from personal vulnerability
factors are more strong and significant in the plan formulation and implementation phases then
this get reduced during the close up phase and resistance due to the problem that come from
3 5
managerial incapability gets stronger and more significant at the close up phase of a change
process
In this sense the alternative hypothesis 1 which says ldquopersonal vulnerability presents
highest significance level in all the phases of the change processrdquo is rejected or declined In
other words the null hypothesis of it (ldquopersonal vulnerability doesnrsquot present highest
significance level in all the phases of the change processrdquo) is accepted
53 A Single Variable Impact Consistency through the Lewinrsquos Three Phase
Model of Change Process
Table 44Predictor Ranking Through Ratio of the Occurrence = 1 Given A Predictor Is 1
and Occurrence =1 Given A Predictor Is 0 in the Unfreezing Phase Derived From the
Column and Row Statistics of Annex 3
Independent
Variable fr(R= 1IV = 1 x) fr(R = 1IV= 0 x)
Rank of
ratio Pr
Work Load 20 15 1333 4 0000
Position 23 12 1925 2 0000 Income And
Benefits
19 16 1200 5 0001
Operational
Unfamiliarity
20 15 1333 4 0023
Job Rules 18 17 1100 6 0000
Myopia 21 14 1500 3 0000
Communication
Barrier
26 9 2900 1 0000
Organizational
Silence
19 16 1200 5 0000
Existing
Investment
26 9 2900 1 0000
Past Failure 26 9 2900 1 0000
Skill Gap 11 24 0800 7 0007
Source primary data
Table 45 Predictor Ranking Through Ratio of the Occurrence = 1 Given A Predictor Is 1
and Occurrence =1 Given A Predictor Is 0 in the Moving Phase Derived From the Column
and Row Statistics of Annex 3
3 6
Independent
Variable fr(R= 1IV = 1 x) fr(R = 1IV= 0 x) fr R 1IV 1 x
fr R 1IV 0 x
Rank of
ratio
Pr
Work Load 32 11 2910 4 0000
Position 34 9 3800 2 0000 Income And
Benefits
30 13 2310 7 0000
Operational
Unfamiliarity
32 11 2910 4 0000
Job Rules 26 17 1530 9 0000 Myopia 31 12 2600 6 0000 Communication
Barrier
29 14 2100 8 0000
Organizational
Silence
33 10 3300 3 0000
Existing
Investment
31 12 2600 6 0000
Past Failure 34 9 2800 5 0000 Skill Gap 37 6 6211 1 0000
Source primary data
Table 46 Predictor Ranking Through Ratio of the Occurrence = 1 Given A Predictor Is 1
and Occurrence =1 Given A Predictor Is 0 In The Refreezing Phase Derived From The
Column And Row Statistics Of Annex 3
Independent
Variable fr(R= 1IV = 1 x) fr(R = 1IV= 0 x) fr R 1IV 1 x
fr R 1IV 0 x
Rank of
ratio Pr
Work Load 21 7 3 3 0000
Position 21 7 3 3 0000
Income And
Benefits
21 7 3 3 0000
Operational
Unfamiliarity
13 15 0910 7 0004
Job Rules 20 8 2500 4 0000
Myopia 23 5 4600 2 0000
Communication
Barrier
25 3 8333 1 0000
Organizational
Silence
21 7 3 3 0000
Existing
Investment
17 11 1610 5 0000
Past Failure 14 14 1 6 0002
Skill Gap 21 7 3 3 0000
Source primary data
3 7
Insert tables 44-46 altogether about here
This analysis is aimed to observe if resistance is same or not in the three phases of the change
process as well as if a single factor has varied impact to resistance over these phases or not This
result makes it fundamental for organizations to identify which source of resistance at which
phase deserve special attention to successfully manage resistance for change recurrently
In so doing a ratio analysis of the frequency of individuals who are expressed by the predictor
and are on the resistant category (fr(R= 1IV = 1 x)) over the frequency of individuals who are
expressed by the predictor but not part of the resistant category (fr(R= 1IV = 0 x)) with a chi2
test showing the real significant association of the variables is run distinguishing the three phases
of a change process
As can be observed every factor that is previously considered to lay in the vulnerability driven
or managerial incapability driven indicates that it has had an influence more or less (all at p
value less than 5) and as such the theoretical exposition is supported The questionnaire also
allowed respondents to include other sources of resistance None of the respondents added any
significant factor so the list can not only be taken as appropriate but also as complete
Demographic attributes driven variables are not considered here because these attributes
apparently remain same throughout all the phases more or less
Though all the lists that were taken for test were significant(at p value less than 5 percent) no
single source was pointed out as the most severe difficulty to achieve the change plan throughout
all the phases of the change process one moves up and the other moves down with the phases
In the unfreezing phase the sources of resistance to change with the highest ratio are
communication barrier existing investment and past failure (all with 2900) It is followed by the
fear to lose position (2) and then myopia (15) In this phase change agentsrsquo implementation skill
gap (0800) and job rules (1100) presented the first and second least important factors
respectively
However in the moving phase such hierarchy is altered change agentsrsquo implementation skill gap
moved up to the first place on the list (with a ratio of 6211) which was the least in the
unfreezing phase Communication barrier existing investment and past failure which were the
first important factors in the unfreezing phase moved down to more or less least place of
importance in the moving phase(8th
6th
5th
with a ratio of 21 26 and 28 all respectively) A
similar variation happened with almost all of the rest except of the resistance associated with fear
3 8
to lose position which remained the same in rank in both phases but with a higher ratio on the
second phase (3800)
Similarly in the refreezing phase the source of resistance to change with the highest ratio was
communication barrier (8333) followed by myopia (4600) A tight job rule which was the least
important factor in the moving phase was moved up to 4th
in the refreezing phase with 25 ratios
In this phase operational unfamiliarity past failure and existing investment presented the first
second and third least important factors with a ratio of 0910 1 and 1610 respectively
The resistance related to losing position came down to third in this phase which was a second in
both moving and in the unfreezing phases indicating its important effect and that effect
increasing the more at the start up the change phase is
Communication barrier is also found to be more devastating the more in the plan formulation and
closing the change process is
In this case the guiding alternative hypothesis that says ldquoA single variable factor may have
a varied significance level over the three phases of a change processrdquo is accepted
Likewise the null hypothesis of it (ldquoA single variable factor cannot have a varied
significance level over the three phases of a change processrdquo) is declined
3 9
CHAPTER FIVE
CONCLUSION AND RECOMMENDATION
51 Conclusions
The followings are the conclusions drawn
- Resistance factors significance level present variations considering the phase of change
process
- Vulnerability driven factors present highest significance level for resistance to change in
the unfreezing and moving phases of a change process while managerial incapability
driven in the refreezing one
- Educational attainment negatively predicts resistance to organizational change process
- Experience positively predicts resistance to organizational change process
- Age and gender donrsquot predict resistance to organizational change process
From hypothesis perspective
The alternative hypothesis ldquoDemographic attributes of an employee are significant to the
tendency to resist an organizational change effortrdquo is partially accepted as education and
experience negatively and positively predicted the tendency to resist a change respectively
Likewise the null hypothesis of it (ldquoDemographic attributes of an employee are not significant
to the tendency to resist an organizational change effortrdquo) is partially accepted because both age
and gender independently have not predicted the outcome variable (tendency to resist)
The alternative hypothesis that says ldquoA single variable factor may have a varied significance
level over the three phases of a change processrdquo is accepted Likewise the null hypothesis of it
(ldquoA single variable factor cannot have a varied significance level over the three phases of a
change processrdquo) is rejected
At last the alternative hypothesis which says ldquopersonal vulnerability presents highest significance
level in all the phases of the change processrdquo is rejected or declined In other words the null
hypothesis of it (ldquopersonal vulnerability doesnrsquot present highest significance level in all the
phases of the change processrdquo) is accepted
4 0
52 Recommendation
It is recommended that an interactional effect analysis of the predictors be conducted to disintegrate
overlapping concepts(if any) which was not covered here
This study restricts itself from prescribing anything to the business world as it considers it is
inappropriate to do so before it is verified by another extensive research
4 1
REFERENCES
Ansoff IH (1990) Implanting Strategic Management Prentice Hall International Ltd
London
Atkilt A (1996) Civil Service Reform and Administrative Modernisation Merit A Quarterly
Bulletin of the Ethiopian Civil Service Commission 5 15-21 Addis Ababa Ethiopia
Barr P Stimpert J amp Huff A (1992) Cognitive Change Strategic Action and Organizational
Renewalrdquo Strategic Management Journal 13 (Special Issue)
pp 15-36
Beer Z and Nohria B (2000) Why Change Programs Donrsquot Produce Change Harvard
Business Review 68 (6) pp 158-166
Belachew Kebede (2011) Analysis Of Bank Service Delivery In Ethiopia Addis Ababa
Ethiopia
Bernard B (2004) Kurt Lewin And The Planned Approach To Change A Re-Appraisal
Manchester UK
Boeker W (1997) Strategic change The influence of managerial characteristics and
organizational growth Academy of Management Journal 40 (1) pp 152-170
Bouti J (2010) Rethinking resistance and recognizing ambivalence a multidimensional view of
attitudes toward an organizational changerdquo Academy of Management Review 25 (4) pp
783-794
Burdett J (1999) Leadership in change and the wisdom of a gentleman Participation amp
Empowerment an International Journal 7 (1) pp 5-14
Child J and Smith C (1987) The context and process of organizational transformation -
Cadbury Limited in its sector Journal of Management Studies 24 (6) pp 565-593
Commercial Bank of Ethiopia (CBE)(2010) annual report of the bank of the year 200910 page
8-9 Addis Ababa
Cummings H amp Huse P (1989) Evolution and revolution as organizations growrdquo Harvard
Business Review (JulyAug) pp 37-46
Frankwick B (1995) Toward a Definition of Corporate Transformation Sloan Management
Review 35 (3) pp 101-106
Freeze B (1998) Developing an organization capable of implementing strategy and learning
Human Relations 49 (5) pp 597-617
4 2
Gebriel A (2002) Building Civil Service Capacity through Tertiary Level Education the
Ethiopian Experience Paper presented to the Development Management Institute Addis
Ababa E thiopia
Geoffrey M Roben F Zuarg T (2005) Essentials Of Research Design And Methodology
New Jersy USA
Getachew H amp Richard K (2006) Civil Service Reform In Ethiopia Success In Two
Ministries Research Memorandum August 2006 Addis Ababa Ethiopia
Ghoshal S amp Bartlett C (1996) Rebuilding Behavioral Context A Blueprint for
Corporate Renewal Sloan Management Review 37 (2) pp 23-36
Ghoshal S amp Bartlett C (1996) Rebuilding Behavioral Context A Blueprint For Goodstein
LD New York USA
Hutt M Walker B amp Frankwick G (1995) Hurdle the Cross-Functional Barriers to Strategic
Change Sloan Management Review 36 (3) pp 22-30
Iverson B (1996) How to Deal with Resistance to Change Harvard Business Review
(MayJune) pp 49-57
Jamess B Sofger T amp John K (2001) Organizational Research Determining Appropriate
Sample Size in Survey Research Muncie Indiana the Verge Publisher
Kilian M Bennebroek G (2003) A Different View on Resistance To Change Paper For
ldquoPower Dynamics And Organizational Change IVrdquo Symposium At The 11th EAWOP
Conference In Lisbon Portugal 14-17 May 2003 Lisbon Portugal
Klein K and Sorra J (1996) The challenge of innovation implementation Academy of
Management Review 21 (4) pp 22-42
Lawrence P (1954) How to Deal with Resistance to Changerdquo Harvard Business Review
Leana C amp Barry B (2000) Stability and Change as Simultaneous Experiences in
Organizational Life Academy of Management Review 25 (4) pp 753-759
Levy A (1986) Second-Order Planned Change Definition and Conceptualization
Organizational Dynamics (May) pp 5-20
Levy A amp Merry U (1986) Organizational Transformation Approaches Strategies
Theories New York
4 3
Lewin K (1947) Frontiers In Group Dynamics Concept Method And Reality In Social
Science Social Equilibria And Social Change London Management Review 25 (4) Pp
783-794
Lewin K (1946) Action research and minority problems In Lewin G W (Ed) Resolving
Social Conflict London Harper amp Row
Lewin K (1947a) Frontiers in group dynamics In Cartwright D (Ed) Field Theory in Social
Science London Social Science Paperbacks
Lewin K (1947b) Group decisions and social change In Newcomb TM and Hartley E L
(Eds) Readings in Social Psychology New York Henry Holt
Lorenzo F (2000) Structural Inertia and Organizational Change American Sociological
Review 49 pp 149-164
Marc M amp Frank B (1997) Managing Resistance to Change Hiam HRD Press
Marc M( 2008) Managing Resistance To Change In TRIAD Consulting Group LLC
Ministry Of Capacity Building (2006) Business Process Reengineering Study Final
Report Addis Ababa
Maria V Ioannis N amp Suanger B (2005) Creating Successful Organization Change
Organizational Dynamics 19 (4) pp 5-17
Maria V Loannis N amp Loannis T (2003) The role of emotional intelegnece and personality
variables on attitudes towards organizational change Athens Greece
Mengistu B amp Vogel E (2006) Bureaucratic Neutrality among Competing Bureaucratic
Values in an Ethnic Federalism The Case of Ethiopia Public Administration Review
Addis Ababa Ethiopia
Miller D amp Kunce T (1973) Prediction and statistical overkill revisited Measurement and
Evaluation in Guidance 6(3) 157-163 In Jamess B Sofger T amp John K (2001)
Organizational Research Determining Appropriate Sample Size in Survey Research
Muncie Indiana the Verge Publisher
Miller L amp Smith K (1983) Handling Non response issues Journal of Extension 21 45-
50 In Jamess B Sofger T amp John K (2001) Organizational Research Determining
Appropriate Sample Size in Survey Research Muncie Indiana the Verge Publisher
Morrison E amp Milliken F (2000) Organizational Silence A Barrier To Change
4 4
Multidimensional View Of Attitudes Toward An Organizational Changerdquo Academy Of
Notes Toward A Model Of Managed Learning [WWW Document] (74 Paragraphs)
URL HttpWwwSol-NeOrgResWp10006Html [2002 March 20]
Nadler D and Tushman M (1990) Beyond the Charismatic Leader Leadership and
Organizational Change California Management Review 32 (2) pp 77-97
Nemeth C (1997) Managing innovation When less is more California Management Review
40 (1) pp 59-74
Paul L (2005) How To Deal With Resistance To Change Belgium kespi Publisher
Peter S (2007) Change and Employee Behaviorrdquo Leadership amp Organization Development
Journal 19 (3) pp 157-163
Piderit S (2000) Rethinking Resistance And Recognizing Ambivalence New Delhi India
Ross A (2004) Scheinrsquos Change Theory New York USA
Ruiz G amp Lorenzo H ( 1999) A Far-from-Equilibrium Systems Approach to Resistance to
Change Organizational Dynamics (Autumn) pp 16-26
Rumenet R (1995) Inertia and transformation in Montgomery CA Resource-
Based and Evolutionary Theories of the Firm Kluwer Academic Publishers
Massachusetts pp 101-132
Schein E (1995) Kurt Lewinrsquos Change Theory In The Field And In The Classroom San
Francisco Jossey-Bass Publishers
Schein E (1999) The Corporate Culture Survival Guide Sense And Nonsense About Culture
Change San Francisco Jossey-Bass Publishers
Schuler D (2004) Overcoming Resistance To Change Top Ten Reasons For Chang
Resistance Manchester UK
Seashore S (1987) Surveys in Organizations In J W Lorsch (Ed) Handbook Of
Organizational Behavior (Pp 140-154) Prentice-Hall
Smith M (2001) Kurt Lewin Groups Experiential Learning And Action Research [WWW
Document] URL HttpWwwInfedOrgThinkersEt-LewinHtm [2004September 9]
Southern African Development Community (SADC)(200) A Theoretical Framework On
Innovations In Education Canada
Stephen O amp Godwin K (2010) Business Process Reengineering For Competitive
Advantage Nairobi AIBUMA Publishing
4 5
Strebel P (1994) Choosing the right change path California Management Review 36 (2) pp
29-51
Sverdlik N amp Oreg S (2009) Personal values and conflicting motivational forces in the
Context of imposed change Journal of Personality 77 1437ndash1466
Tesfaye D (2009) Business Process Reengineering In Ethiopian Public Organizations The
Relationship Between Theory And Practice Addis Ababa Ethiopia
Tilaye K (2007) Civil Service Reform In Ethiopia Achievements Problems And Possible
Solutions The Proceedings Of The First National Conference On The Achievements
Challenges And Prospects Of The Ethiopian Civil Service Reform Program
Implementation In Ethiopia Addis Ababa Ethiopia May 31 2007AddisAbaba
URLHttp Www A2 zpsychology ComArticles Kurt_Lewins_Change_ TheoryHtm)
Tilaye K (2010) Rethinking Institutional Excellence In Ethiopia Adapting And Adopting The
Balanced Scorecard (BSC) Model Addis Ababa Ethiopia
Van de Ven A amp Poole S (1995) Explaining development and change in Organizations
Academy of Management Review 20 (3) pp 510-540
Waddell D amp Sohal A (1998) Resistance a constructive tool for change Management
Management Decision 36 (8) pp 543-548
Williams B (1980) Formal structures and social reality In D Gambetta (Ed) Trust
Making and breaking of cooperative relations (pp 3-13) Oxford UK Blackwell Ltd
Yetimgeta A (2007) Approaches To Change Management In The Ethiopian Civil Service
Emphasis On Ethiopian Roads AuthorityThe Proceedings Of The First National
Conference On The Achievements of Civil Service Reform Program Implementation In
Ethiopia May 31-June 1 2007 Addis Ababa Ethiopia
Seashore S (1987) Surveys in organizations In J W Lorsch (Ed) Handbook of
Organizational behavior (pp 140-154) Englewood Cliffs NY Prentice-Hall
Levy A amp Merry U (1986) Organizational transformation Approaches strategies
Theories New York Praeger
4 6
Annex 1 Questionnaire
Adama Science and Technology University
A Thesis on Organizational Change Management
Questionnaire Prepared For Employees of the Commercial Bank of Ethiopia
Dear respondents
I am conducting a research entitled as ldquoThe Determinants of Resistance to Change
Management Processrdquo I therefore need your complete response for the questions provided
hereunder The data and information obtained will be confidential and will be exclusively used for
this study only
BPR = Business Processing Reengineering
Thank you very much
1 Sex Female Male
For question 2 ndash 4 state your answer as observed during the beginning year of BPR
implementation in the branch where you worked in
2 Age ______ (the specific age is needed not in range)
3 Total years of school _____( school years counted from your elementary up to highest
education)
4 Number of years of work experience
Internal (in CBE) ________
External (before CBE) _____
5 Did you have any sense of discontent discomfort or disagreement with the practice of
BPR
Yes No
6 If your answer to question number 5 is ldquoyesrdquo in which of the following phases of BPR
implementation process was your disagreement expressed or expressible
Note if your answer is in two or all of them please state so they are quite essential for
the study
It doesnrsquot matter whether you expressed your discomfort or not and it doesnrsquot matter how small the extent or
degree of your discomfort was
Announcement planning phase implementation phase completion phase
4 7
7 In the following phases of BPR implementation there are statements that need your
agreement or disagreement If you agree with the statement Encircle 1 If you do not agree
encircle 0
Announcement Planning
phase
Implementation phase
Completion or close up phase
You expected higher work
load if BPR is implemented
1 0 Functions or tasks were
merged and working hour was
increased
1 0 There was higher work load than
before BPR
1 0
You were afraid of your job
continuity or position
1 0 New positions were created
and the existed one was
distorted
1 0 You were asked to leave the
existed position
1 0
You expected that you may be
changed to another branch or
another department
1 0 Functions shift reached up to
changing to another
department or branch
1 0 You were changed to another
branch or another department
1 0
You were afraid that Your job
team will be collapsed or
disturbed
1 0 Your job team was collapsed
or disturbed
1 0 You could not mingle with new
staff members or you could not
build up team sprit
1 0
You felt the change will bring
factors to reduce fringe
benefits or your income
1 0 Incomes and benefits started
to change with regards to a
change in task or new policy
1 0 Your fringe benefits or your
income was reduced
1 0
You thought BPR would
change the organizational
culture
1 0 Organizational cultures like
dressing code started to be
changed
1 0 You were confronting with new
organizational culture
1 0
You thought new operational
skills will be required or your
current knowledge will
obsolete
1 0 New technologies were
introduced which require new
operational skills
1 0 New operational skills was
required in your job
1 0
you thought BPR would bring
new job rules regulations and
1 0 BPR brought new job rules
regulations and
1 0 You could not fit with new job
rules regulations and
1 0
4 8
sophistications sophistications sophistications
Change agents have not
created the long term vision
of the bank to you
1 0
Change agents have not
created image of long term
vision of the bank to you
1 0
You could not capture the long
term vision or picture of the
bank
1 0
There was communication
problem of what BPR really is
1 0 There was miscommunication
between the change agents
and you
1 0 You were not as well informed
about BPR as the change agents
1 0
It was not such concerning to
you practice BPR
1 0 It was not such concerning to
you to practice BPR
1 0 You were not involved as an active
part of the change effort
1 0
You thought BPR would
require another new investment
or changing the exiting one
1 0 BPR required another new
investment or changed the
exiting one
1 0 Adding new investment or
changing the exiting one was not
right decision
1 0
You had negative experiences
with previous change processes
1 0 Changes were started with
confusions that have to do with
your past experience of failure
1 0 The conclusion was not as smooth
as which is guaranteed not to slide
back as possible
1 0
you thought change agents have
Implementation skill gap
1 0 Change agents were confused in
sequencing tasks budgeting
capital departmentation and
hiring technology amp all other
tasks
1 0 The skill gap of the change agents
was not overcome
1 0
Any other problems that you
expected BPR would bring
__________________________
_________________________
__________________________
__________________________
__________________________
_____________________
Any other problems of both
personal and organizational
that were brought with the
introduction of BPR
__________________________
__________________________
__________________________
_________________________
Any other problems of both
personal and organizational that
you faced after BPR
introduction
__________________________
__________________________
________________
4 9
Annex 2
The Pearsonian Chi-Square Correlation and Linear Dependence Measure of Variables
ANNEX 21 Coefficient Wise Logit Result and Odds Ratio in the Unfreezing Phase
a Coefficient phase 1
Iteration 0 log likelihood = -81490917
Iteration 1 log likelihood = -50638714
Iteration 2 log likelihood = -45874858
Iteration 3 log likelihood = -45268845
Iteration 4 log likelihood = -45247631
Iteration 5 log likelihood = -45247594
Logistic regression (
Number of obs = 150
LR chi2(6) = 7249
Prob gt chi2 = 00000
Log likelihood = -45247594 Pseudo R2 = 04448
------------------------------------------------------------------------------
resistance | Coef Std Err z Pgt|z| [95 Conf Interval]
-------------+----------------------------------------------------------------
_IGender_1 | -0799158 5762905 -014 0890 -1209424 1049593
_IVulnerab~1 | 3193757 7429257 430 0000 1737649 4649865
_Imanaginc~1 | 131748 5465013 241 0016 2463566 2388602
Education | -7048263 2574858 -274 0006 -1209489 -2001634
Age | 0902853 1038507 087 0385 -1132583 2938289
Experiance | 3614344 1776071 204 0042 0133308 709538
_cons | 2085881 4961242 042 0674 -7637974 1180974
------------------------------------------------------------------------------
b Odds Ratio Phase 1
Iteration 0 log likelihood = -81490917
Iteration 1 log likelihood = -50638714
Iteration 2 log likelihood = -45874858
Iteration 3 log likelihood = -45268845
Iteration 4 log likelihood = -45247631
Iteration 5 log likelihood = -45247594
Logistic regression Number of obs = 150
LR chi2(6) = 7249
Prob gt chi2 = 00000
Log likelihood = -45247594 Pseudo R2 = 04448
------------------------------------------------------------------------------
5 0
resistance | Odds Ratio Std Err z Pgt|z| [95 Conf Interval]
-------------+----------------------------------------------------------------
_IGender_1 | 9231941 532028 -014 0890 298369 2856488
_IVulnerab~1 | 2437985 1811242 430 0000 5683968 1045708
_Imanaginc~1 | 3733998 2040635 241 0016 1279356 1089825
Education | 4941944 127248 -274 0006 2983496 8185969
Age | 1094487 1136632 087 0385 89292 1341554
Experiance | 1435387 254935 204 0042 101342 2033052
------------------------------------------------------------------------------
ANNEX 22 Coefficient Wise Logit Result and Odds Ratio in the Moving
Phases
a Coefficient phase 2
Iteration 0 log likelihood = -90766406
Iteration 1 log likelihood = -57362338
Iteration 2 log likelihood = -53548876
Iteration 3 log likelihood = -53185697
Iteration 4 log likelihood = -5317968
Iteration 5 log likelihood = -53179678
Logistic regression Number of obs = 150
LR chi2(6) = 7517
Prob gt chi2 = 00000
Log likelihood = -53179678 Pseudo R2 = 04141
------------------------------------------------------------------------------
resistance | Coef Std Err z Pgt|z| [95 Conf Interval]
-------------+----------------------------------------------------------------
_IGender_1 | 2008976 5106137 039 0694 -7998869 1201682
_IVulnerab~1 | 3275679 6460872 507 0000 2009371 4541986
_Imanaginc~1 | 1421709 6031327 236 0018 2395901 2603827
Education | -7964982 2298409 -347 0001 -1246978 -3460183
Age | -0732399 0922177 -079 0427 -2539833 1075035
Experiance | 3237748 1460756 222 0027 0374719 6100778
_cons | 917179 4201067 218 0029 9378503 1740573
------------------------------------------------------------------------------
b Odds Ratio in Phase 2
Iteration 0 log likelihood = -90766406
Iteration 1 log likelihood = -57362338
Iteration 2 log likelihood = -53548876
Iteration 3 log likelihood = -53185697
Iteration 4 log likelihood = -5317968
5 1
Iteration 5 log likelihood = -53179678
Logistic regression Number of obs = 150
LR chi2(6) = 7517
Prob gt chi2 = 00000
Log likelihood = -53179678 Pseudo R2 = 04141
------------------------------------------------------------------------------
resistance | Odds Ratio Std Err z Pgt|z| [95 Conf Interval]
-------------+----------------------------------------------------------------
_IGender_1 | 12225 6242251 039 0694 4493798 3325707
_IVulnerab~1 | 2646118 1709623 507 0000 7458625 938771
_Imanaginc~1 | 4144195 24995 236 0018 1270728 1351536
Education | 4509052 1036364 -347 0001 2873719 7074995
Age | 9293778 0857051 -079 0427 7757048 1113495
Experiance | 1382336 2019256 222 0027 1038183 1840575
ANNEX 23 Coefficient Wise Logit Result and Odds Ratio in the Refreezing
Phases
a Coefficient phase 3
Iteration 0 log likelihood = -72203
Iteration 1 log likelihood = -47853706
Iteration 2 log likelihood = -42709416
Iteration 3 log likelihood = -42079849
Iteration 4 log likelihood = -42052829
Iteration 5 log likelihood = -42052758
Logistic regression Number of obs = 150
LR chi2(6) = 6030
Prob gt chi2 = 00000
Log likelihood = -42052758 Pseudo R2 = 04176
------------------------------------------------------------------------------
resistance | Coef Std Err z Pgt|z| [95 Conf Interval]
-------------+----------------------------------------------------------------
_IGender_1 | 4131202 5685308 073 0467 -7011797 152742
_IVulnerab~1 | 143697 6080867 236 0018 2451422 2628798
_Imanaginc~1 | 3935963 8177563 481 0000 233319 5538736
Education | -7399578 2713833 -273 0006 -1271859 -2080563
Age | -11981 1073626 -112 0264 -3302368 0906167
Experiance | 3593389 1797309 200 0046 0070728 7116049
_cons | 8628381 500873 172 0085 -118855 1844531
------------------------------------------------------------------------------
5 2
b Odds Ratio in phase 3
Iteration 0 log likelihood = -72203
Iteration 1 log likelihood = -47853706
Iteration 2 log likelihood = -42709416
Iteration 3 log likelihood = -42079849
Iteration 4 log likelihood = -42052829
Iteration 5 log likelihood = -42052758
Logistic regression Number of obs = 150
LR chi2(6) = 6030
Prob gt chi2 = 00000
Log likelihood = -42052758 Pseudo R2 = 04176
------------------------------------------------------------------------------
resistance | Odds Ratio Std Err z Pgt|z| [95 Conf Interval]
-------------+----------------------------------------------------------------
_IGender_1 | 1511527 8593496 073 0467 4959998 4606278
_IVulnerab~1 | 4207927 2558785 236 0018 1277803 1385711
_Imanaginc~1 | 5121144 4187848 481 0000 1031078 2543562
Education | 4771341 1294862 -273 0006 28031 8121613
Age | 8870889 0952401 -112 0264 7187535 1094849
Experiance | 1432382 2574433 200 0046 1007098 2037258
------------------------------------------------------------------------------
() dydx is for discrete change of dummy variable from 0 to 1
ANNEX 3 Column and Row Statistics of the Predictors with Their Pearsonian Chi2
Association and Significance in Three of the Phases Respectively
5 3
5 4
5 5
5 6
ANNE 4 Banks Approached For Data
1 Addisu Gebeya
2 Africa Union Branch
3 Anwar Mesgid Branch
4 Arada Ghiorgis Branch Piassa
5 Arat Killo Branch
6 Asko Branch
7 Bole Branch
8 Enqulal Fabirka
9 Ferensay Legasionl
10 Finfine Branch
11 Gofa Sefer Branch
12 Gotera Branch
13 Gurd Shola Branch
14 Kidist Mariam
15 Kirkos Branch
16 Lideta Branch
17 Mahteme Ghandi Branch
18 Megenagna Branch
5 7
19 Mehal Ketema Branch
20 Meskel Square Branch
21 Nifas silk Branch
22 Selassie Branch Arat
23 Sengatera Branch
24 Sheger Branch
25 Shiro Meda
26 Tekle Haimanot Branch
27 Tewodros Branch
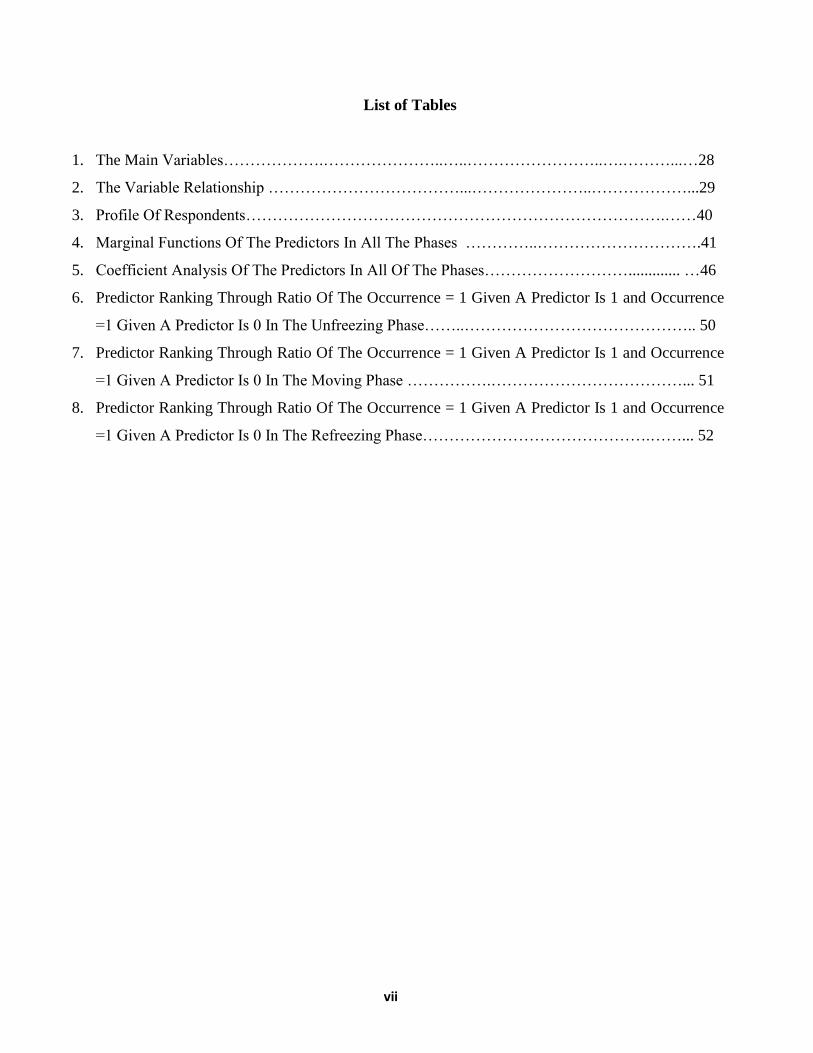
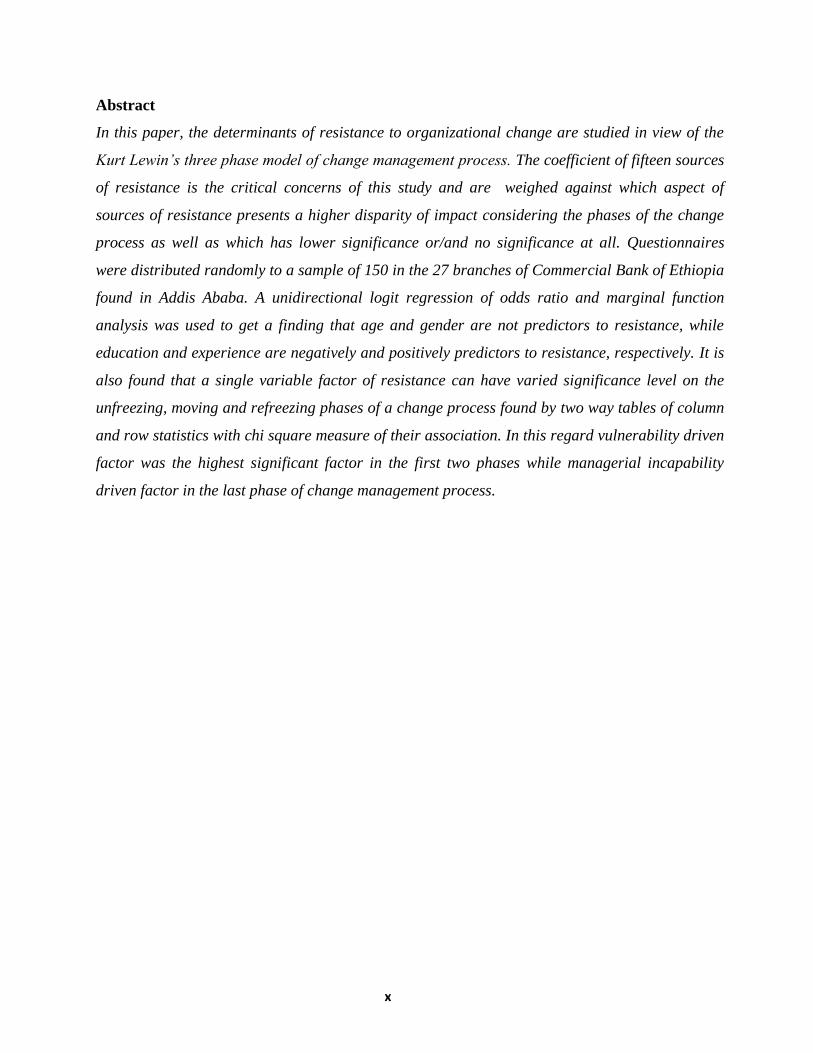
1 0
interpreted within a broader context and there is an adjustment in the scale used in evaluating new
input
A concise view of the new state is required to clearly identify the gap between the present state and
that being proposed Activities that aid in making the change include imitation of role models and
looking for personalized solutions through trial-and-error learning
As Schein (1996) unfreezing creates motivation to learn but does not necessarily control or predict
the directionrsquo This echoes Lewinrsquos view that any attempt to predict or identify a specific outcome
from planned change is very difficult because of the complexity of the forces concerned Instead
one should seek to take into account all the forces at work and identify and evaluate on a trial and
error basis all the available options (Lewin 1947)
Stage 3 ndash Refreezing
Refreezing is the final stage where new behavior becomes habitual and the change permanent which
includes developing a new self-concept amp identity and establishing new interpersonal relationships
It seeks to stabilize the group at a new quasi-stationary equilibrium in order to ensure that the new
behaviors are relatively safe from regression The main point about refreezing is that new behavior
must be to some degree congruent with the rest of the behavior personality and environment of the
learner or it will simply lead to a new round of disconfirmation (Schein 1996) This is why Lewin
saw successful change as a group activity because unless group norms and routines are also
transformed changes to individual behavior will not be sustained In organizational terms refreezing
often requires changes to organizational culture norms policies and practices (Cummings and Huse
1989)
22 Backgrounds of Resistance to Organizational Change Management
Different authors have classified sources to resistance from different perspectives
After wide ranged assessments of the various sources of resistance under different names and angle
of looking this research heavily followed Rumelt (1995) but divides the sources of resistance into
three groups To entertain different perspectives from other authors other sources of resistance are
added to Rumeltrsquos proposal Some sources of resistance which were treated separately by Rumlet
(1995) are mingled with other similar sources and gained another general name The names of the
groups are also altered in order to include the new sources insights and perspectives
1 1
Accordingly in this study all the factors of resistance stated by different authors are made to lay
under three general factors mainly demographic attributes driven factors Vulnerability driven
factors or Managerial incapability driven factors
221 Theoretical Backgrounds of Resistance to Change Management
A Demographic Attributes Driven Factors
For reasons not reached orand covered in this study individual level characteristics or person
oriented issues which are equally crucial for the success of change (Maria V et al (2003) ) have
been neglected in many of the scientific studies on organizational change despite organizational
characteristics in change process has been extensively discussed in realms of management
literatures Therefore the purpose of the present study is to add a different way of looking and
working with organizational change by focusing on individualsrsquo demographic attributes but
personal traits are not also failing under the scope of this study despite the fact that they are personal
factors This paper explores how individualsrsquo demographic attributes can hinder or rather facilitate
organizational change at an individual level by exploring the relationship between these attributes
and attitudes toward organizational change
After a through revision of literatures the study has got it more sounding to concentrate on the
following employeesrsquo demographic attributes as highly pronounced by Rumelt (1995) for the
empirical to be detailed under each subsection of the attributes Age gender Educational status and
Experience are brought to debate for many scholars on their significance level to resistance to
change
B Vulnerability Driven Factors
According to Marc (2008) change affects the various boundaries within an organization Boundaries
to Mark are the technical formal and informal structures that an individual will assume in his or her
job position and summarized them into three groups They are
Roles (the place a person is assigned in an organization)
Tasks (is the act required by an individual to work for achieving an output
Authority (how the above roles and tasks are authorized what decision-making authority an
individual or group has)
During any change process the alignment of these boundaries becomes skewed then impacts role
task and authority Resistance then is the way the employees protect themselves from the tilting
1 2
operational unfamiliarity work load and regulatory tightening and the emotions connected to these
losses that come from boundary shifts
As Peter (2007) stated resistance is tied to our belief systems culture familiarity in our own and the
tension of loosing future general benefits or not meeting our future goal He assumes that our fear
of loss is at the heart of change Resistance is a result of this fear an expression of how people feel
about the change effort at hand When things change people begin to worry about what they might
lose including Job and position Income and benefits and work place social destructions
According to William (1980) humanrsquos sense of self is defined by his or her roles his or her
responsibilities and his or her context of the known and learning Change then forces to redefine
oneself and onersquos world Change represents the unknown Change could mean the possibility of
failure the surrender or diminishing of onersquos span of control and authority or anything of that sort
for that matter Employees do not want to lose the familiar safe routine ways of life in favor of the
unknown and possibly unsafe area As humans one tends to prefer routines and accumulate habits
easily since humans behavior which is the function of learning is shaped by rehearsal and usualness
Any one of these possibilities can cause fear then causing resistance however fear of change may
be attributed to or can engulf even more than the mere tendency towards regularity or adaptation
C Managerial Incapability Driven Factors
According to SACD (2000) the factors that can be brought to this category of sources of resistance
were
- Knowledge and skills of the leader change will be resisted if the change agent cannot
effect change and does not have the appropriate knowledge and skills to practice if cannot
educate the implementers on what the change is all about cannot communicate the objectives
that should be achieved and if any doubts and questions the population has is not dispelled
and answered promptly
- Poor communication (lack of information misinformation) workers carrying out the
change are not informed about the aims of the change the requirements to introduce the
change and how the change will be introduced are not communicated If incorrect
information is given and the usefulness of the change is not well taught
- Organizational climate with low trust If there is mistrust in the organization
- Weak relationships When relations between the change agent and the employees are not
plain
1 3
- Fear of failure If they are not sure of the results
Resistance pertaining to the phases of change
a Sources of Resistance in the unfreezing Stage
The following sources of resistances are the sources that are mainly proposed by Rumnet (1995) but
have got many supports from others too These are taken as a basis to formulate the theoretical
framework of the current study but are manipulated in a way that can entertain other way of looking
from for example listed in the above theoretical and empirical underpinnings When the frame work
is constructed it has got some sort of new name general inclusive phrase in a very short way but for
now let directly go to Rumnetrsquos proposal
1 Managerial incapability driven factors It includes
Myopia inability of the company to look into the future with clarity (Rumnet1995 Barr et
al 1992
Communication barriers information distortion or misinterpretations (Hutt et al 1995
Rumnet (1995)
Organizational silence individuals who do not express their thoughts meaning (Rumnet
1995 2000 Nemeth 1997)
Past failures which leave a pessimistic image for future changes (Rumnet 1995 Lorenzo
2000) and
2 Vulnerability driven factors
direct costs of change (Rumelt 1995)
cannibalization costs change that brings success to a product but at the same time brings
losses to others(Rumelt 1995)
cross subsidy comforts because the need for a change is compensated through the high rents
obtained without change with another different factor(Rumelt 1995)
Different interests among employees and management employees value change results less
than managers value them (Rumelt 199 Waddell amp Sohal 1998)
complex environmental changes do not allow a proper situation analysis (Ansoff 1990
Rumelt 1995)
b Sources of Resistance in the moving phase
1 4
This phase is phase of implementation which is the critical step between the decision to change and
state of stability in the new world (Klein and Sorra 1996) In this stage also two sources of
resistance can be found mainly
1 Vulnerability driven factors
Implementation climate relation between personal change values and organizational values
(Klein and Sorra 1996 Rumnet 1995)
denial refusal to accept any information that is not desired (Rumenet 1995)
departmental politics or resistance from those departments that will suffer with the change
implementation (Rumenet 1995)
Incommensurable beliefs definitive disagreement and conflict among groups of workers
about the nature of the problem and its consequent alternative solutions (Klein and Sorra
1996 Rumelt 1995)
Forgetfulness of the social dimension of changes (Lawrence 1954 Rumelt 1995)
2 Change agentrsquos incapability driven factors According to Rument (1995) the factors that fall
under this category are
Leadership inaction leaders are afraid of uncertainty
collective action problems difficulty to decide who is going to move first
Lack of the necessary technical capabilities to implement change ndash capabilities gap
c Sources of resistance in the refreezing phase
Perpetuation of ideas the tendency to go on with the past thoughts even after the situation
has changed
deep rooted values and emotional loyalty
Inadequate strategic vision Lack of clear commitment of top management to changes
(Rumelt1995 Waddell and Sohal 1998)
NB Demographic driven factors are not listed in this phase based division because one thing they
are not under the proposal of Rumnet (1995) and second thing demographic attributes will not
basically change in the phases of change process
222 Empirical Backgrounds of Resistance to Change Management
A Vulnerability Driven Factors
1 5
Tesfaye (2009) who made his studies in the then Ethiopian Ministry Of Capacity Building and the
then Ethiopian Road Authority about resistance to change reveals that change resistors were due to
fear of losing their jobs while many were waiting to see group that feel indifference about the
change and few tried to protect their friends or subordinates He also found that the acronym
ldquoBPRrdquo the phrase ldquoResult Based Performance Managementrdquo and the word ldquoreengineeringrdquo were
associated with downsizing thereby had become the sources of fear and insecurity for many of the
civil service employees It was also assumed that according to the same author these words are
meant for eliminating non-value adding activities then automating the previous manual activities
lead to at least cost reshuffling of employees or downsizing the workers unless the volume of work
remained same otherwise
He further found that assumed that horizontal integration leads to the combination of two or three
functional processes into one which resistance was not to abandon their status and benefits while
BPR was presumed to cause obsolescence of their knowledge
Finally he gave a concluding remark of his research by stating the major causes of resistance are
fear of losing position jobs benefits status and obsolescence of skills and knowledge while he
found that resistance of change could come from all managerial levels(lower middle and the top
level managers
According to SACD (2000) which made its study in South African companies the reasons that can
be brought to this category of sources of resistance were Fear of the unknown (uncertainty about
causes and effects of the change) Threat to status (Reduction in the size of an organization then to
lose their top posts or positions) and threat to power base (reduce the influence one has if resisted by
the affected persons)
B Managerial Incapability Driven Factors
According to SACD (2000) which made its study in South African companies the factors that can
be brought to this category of sources of resistance were
- Knowledge and skills of the leader (if the change agent cannot effect change and does not
have the appropriate knowledge and skills to practice if cannot educate the implementers on
what the change is all about cannot communicate the objectives that should be achieved and
if any doubts and questions the population has is not dispelled and answered promptly)
change will be resisted
1 6
- Then Poor communication which seems the same with the above but differs in that it
concentrates in one lack of information (workers carrying out the change are not informed
about the aims of the change the requirements to introduce the change and how the change
will be introduced are not communicated Second when misinformation (If incorrect
information is given and the usefulness of the change is not well taught) happens
- Organizational climate with low trust If there is mistrust in the organization
- Weak relationships When relations between the change agent and the employees are not
plain
- Fear of failure If they are not sure of the results
- Unclear benefits If the benefits to be gained out of the change are not clear if there is no any
motive to go forward
- Fear of looking stupid when the procedures for implementing the change are not well
clarified or are unfamiliar to the employees
According to Beer and Nohria (2000) seventy percent of change efforts fail because of the in
capabilities of the top and middle level managers of change mainly the absence of clear strategy and
foreseeable vision miscommunication and trust lack of top management commitment lack of
resources needed fully practice the change lack of managerial skills on change management and
lack of managing resistance to change
C Demographic Attributes Driven Factors
i Age
According to Bouti (2010) who studied the relationship between employees age and their resistance
to change by considering organizational tenure as moderators in explaining the ageresistance to
change association a negative relationship between age and the tendency to resist change was found
that implies that younger employees were more resistant to change than older one He extrapolated
his study to find out the behind why of the observation then stipulated that having a longer work
tenure are identified as positive boundary conditions for the observations on the relationship of the
two to be opposite
But according to Maria amp Ioannis (2005) no differences were identified among the four age groups
of their samples
ii Educational Attainment
1 7
Maria V et al (2003) studied on the relationship between personal variables and attitudes towards
organizational change To identify whether educational attainment affects employees attitude
towards organizational change he put four levels basic education further education degree
university degree and post graduate degree Then found that there is a significant effect of
educational attainments on resistance to change In that university graduates express less positive
attitudes than both the postgraduate and further education graduates
But according to Maria and Ioannis 2005) education showed a positive impact on attitudes towards
change in that employees with higher education are better equipped to meet new challenges at work
then supported their ideas that Iverson (1996) confirms their finding
iii Gender
Maria V et al (2003) studied on the relationship between personal variables and attitudes towards
organizational change He wanted to examine whether there is significant difference between males
and females regarding their attitudes towards organizational change The result of his study revealed
that there was no gender difference regarding attitudes towards organizational change Sverdlik amp
Oreg (2009) also observed no significant difference between men and women in terms of resistance
to change management if gender is treated independently But through interaction effect of the
combination of gender and experiance males who had held a position of authority at an earlier
employer were less likely to resist change than those who did not fit those criteria (both being male
and previous position)
But according to Maria and Ioannis (2005) aiming to investigate whether gender affects both
attitudes to change and stress at work they conducted independent t-tests and consequently females
scored higher than males on attitudes towards organizational change suggesting that males tend to be
more reluctant than females toward organizational change In terms of occupational stress they
reported that males also scored significantly higher than females on a number of scales that they
used to as indexing mainly work relationships overload and the overall job stress indexes that they
believed that change would bring them demonstrating thus higher levels of occupational stress is
found in males compared to females
Identifying the difference between men and women in change process is also complex since there
are feminist men and non feminist women (Sverdlik and Oreg (2009)
iv Experience
1 8
According to Sverdlik and Oreg (2009) while all of the demographic variables treated individually
have not predicted resistance to change three interactions (combination) of the variables mainly
gender faculty experience and administrative responsibilities at a previous place of employment
together negatively predicted the outcome variable (resistance to change) but not until the
interaction was observed a significant change
23 Theoretical Framework of the Study
The following sources of resistances are the sources that are extracted from the whole review of
literature The base is Rumnet (1995) but has got many supports from others too These are taken as
a basis to formulate the theoretical framework of the current study but are manipulated in a way that
can entertain other way of looking from for example listed in the beginning document titled as
theoretical and empirical underpinnings When the frame work is constructed it has got some sort of
new name general inclusive phrase in a very short way A summary of this literature review of
resistance results in the following sketch of the common view of the concept
Table 21 Main Variables
Demographic attributes driven factors Age
Gender
Educational status
Experience
Vulnerability
driven factors
Future Work load
Future Job security and position
Future Income and Fringe benefits
Social destruction and operational unfamiliarity
Future Rules and regulations
Managerial incapability
driven factors
Myopiashortsightedness
Interpretation communication barriers
Organizational silence apathy
Existing investment
past failure and uncertainty anxiety
Implementation capabilityrsquos gap
Source compiled from literature review
Table 22 The Variable Relationship
Independent Variable Dependent Variable
Managerial Incapability Driven Factors Resistance to organizational change
1 9
Demographic Attributes Driven Factors management
Vulnerability Driven Factors Driven Factors
Source compiled from literature review
Source summary of literatures
Diagram1 A relationship that shows the variable prediction
After this theoretical exposition if the sources of resistance resulting from the literature review agree
with the ones observed in business practice are checked Finally the relationship between sources of
resistance in the theoretical framework and the dependent variables are analyzed
RESISTANCE TO CHANGE
MANAGMENT
2 0
CHAPTER THREE
METHODOLOGY
31 Research Design
This research is interested to study the cause and effect relationship of each of the independent
variables and the dependent variable on resistance to change So apparently it follows causal
research design A causal type of design suits for this study because it has the following features
It is concerned with describing the causal relationships of the variables
It believes that variations in the independent variable will be followed by variations in the
dependent variable when all other things are equal and so do the hypothesis of the current
study
The study has therefore assumed a causal type of research design where the above causational
features of the variables can be exhaustively dealt with
32 Sample Design
321 Target Population
The population taken for this study is the employees of the Commercial Bank of Ethiopia It had
two criteria for selecting this case
As of Levy amp Merry (1986) to make a clear and successful research on resistance the
organization had to be involved in a major or second-order change process This kind of change
processes affects the strategy structure hierarchy culture technology and work processes of an
organization It is more likely to find resistance in second-order change processes than in
situations where little improvement is sufficient to deal with external demands or to solve internal
problems So the first criterion for selecting Commercial Bank of Ethiopia (CBE) as a population
was due to that the bank has made a second order or major change by BPR
As of Seashore (1987) an appropriate population to be targeted to work with the feedback
method is that the population of the case would be medium-sized (ie has 100 to 500 respondents
as the author defines medium sized) So this was the second criterion for selecting the
Commercial Bank of Ethiopia as the needed amount of sample can be gained in the bank
2 1
322 Sample Frame
For a reason to be explained in the sample size determination from among the 570 branches of
the commercial bank of Ethiopia 27 branches were taken that are found in Addis Ababa
Selecting Addis Ababa district has the following scientific and cost advantages
Its reputation for better implementation of the reform programs and thereby for better
practice of the designed second order change process as resistance to change process can
be better observed in second order changes like strategy culture structural hierarchical
and operational changes (as of Levy amp Merry (1986))
Due to proximity of branch banks significant time and cost reduction can be achieved
323 Sample Size Determination
According to Miller amp Kunce (1973) and Halinski amp Feldt (1970) as cited by Jamess B et al
(2001) not to face the risk of over or under fitting in using logit regression analysis an optimal
sample size must consist of ten observations per an independent variable
Then theoretically there are fifteen causing variables for which their variations thought to be
followed by variations in the dependent variable of resistance Their detail is well covered in
chapter two of this document
Thus taking in to account the idea of the above scholarly people conservatively the study uses
150 as a sample size of the study which is the multiplied output of ten observations and fifteen
independent variables of the study According to Levy amp Merry (1986) the top level and middle
level managers would have better sight of the problems during the change process Then in the
piloted pre data collection it is found that on average seven respondents can be found in this
position By dividing 150 (the multiplication of ten observations and 15 variables) to seven it
came 22 branches to be approached for data to entertain these ideas of the scholarly
The concept of sample penalty is dully applied here as some rigidity is required that data
from150 should be collected excluding incomplete answers and unfilled questionnaires
According to Jamess B et al (2001) it can be assumed that about 75 percent of the distributed
would be collected back correct and therefore in this study it was decided that25 more be
distributed Therefore 200 questionnaires were distributed and the number of bank branches to
be approached was raised up to 27 while collection was conducted up to the needed correct
2 2
amount is gained Response rate was not determined as collection was stopped after complete
150 was collected
324 Sample Selection
The sampling used is hierarchical meaning non probability sampling methods in taking profile
but probability sampling to observe a case This is because according to Levy amp Merry (1986)
those who found in higher organizational structure of the bank may have better sight of the
situation in change process and are better part of the change as it will affect the hierarchy strategy
and role of the position that they work at But from among the same profile probability sample
selection is used
Code was given to avoid bias on the selection of a case or sample unit Each sample unit in the
population had to get a numerical code according the name fetched from the organization The
numerical code was submitted to excel which case to select then to be produced objectively in
lottery method
33 Type of Data
A retrospective dataset but a snapshot from cross section of the population consisting of current
single observations on variables at earlier continued points in time was taken Time is an
important dimension in a causal research design and so do the data set taken for this study It
believes that respondents asked at a single point can give reliable retrospective reports of what
continuously happened to them or what they thought at some earlier continuous points of time
designed in a way of making time series analysis
Apparently quantitative type of data was required for the study But to entertain qualitative ideas
a qualitative questionnaire was designed in such a way that it can be changed in to quantifiable
one during analysis so that the data could be processed in inferential statistics The data taken
constituted primary only as it has something to do with the behavioral science and this study
believes that behaviors better be studied primarily in person not from documents
34 Methods of Data Collection
The research was carried out based on questionnaire distributed to respondents Respondents had
to answer questions dealing with a change process and the tendency to resist that had happened in
2 3
their respective departments and subordinates The questions that are expected to allow establish
the planned comparison included a list describing the factors that are considered previously as
sources of resistance to change Respondents were asked to give their confirmation or
disconfirmation on indirect statements that talk about how much the before-mentioned sources of
resistance had affected their tendency to resist Respondents had to indicate their position among
two points on that continuum Scoring 0 to indirectly talk that it was not a source of resistance at
all and 1 to mean that such source of resistance had contributions to the tendency to resist but not
necessarily that it either made the change agents to rethink on the change strategy and process or
had slowing effect on implementation The questionnaire was designed as flexible enough as
possible which can allow respondents to include other sources of resistance that was not on the
sight of the study with their respective relative impact on the change effort Unfortunately
however none of them added another new factor leading to a conclusion that the factors taken
were not only appropriate but also complete
35 Method of Data Analysis and Statistical Treatment
351 Method of Data Analysis
For the reason that the hub and title of the study is binary categorical in its very nature applying
logit regression model of data analysis seems meaningful and appropriate than other analysis and
regression models A binary dependent variable is a dependent variable whose range of values is
substantively restricted to two zero and one (yes or no) Geoffrey M et al (2005) Thus the
study used logit to explain the determinant factors for enhancing change management effort
successful or hindering change management efforts Besides to this the study used descriptive
statistics to describe the sample characteristics
Descriptive analyses were also used to summarize a study sample and single variable factor prior
to analyzing the studyrsquos primary hypotheses by amalgamating all sub-variables together To draw
conclusions beyond the immediate samples and data on a single variable inferential statistics was
used in an attempt to draw inferences about the populations from which the samples were drawn
as well as about the relative effect of the one variable among others
2 4
352 STATISTICAL TREATMENT AND MODELING
3521 THE LOGISTIC REGRESSION FUNCTION
The binary logit regression modeling used for this study is based on the theoretical backgrounds
that resistance is a function of demographic characteristics driven factors vulnerability driven
factors and managerial incapability driven factors This is found after so many clash of theories
and studies of so many angles then all combined and concluded by the current researcher in the
following way The theories are well covered in chapter two of this document
The function is
R = f (H M V)
Where
R = the tendency to resist
H = Demographic attributes driven factors
M = Managerial incapability driven factors
V = Vulnerability driven factors
Then the model is put as follow
The model is Logit (R) = α + β1 X1 + β2X2 + hellip +β6X6
logit [p(x)] = log P
1-p
Where
X1 to x6 are the explaining variables
p = the probability that a case is in a resistant category 1-p= the probability not to resist
The intercept α is the predicted value of R when the x1 through xn equal zero when (xi= 0)
ie the disturbance associated with it contains factors other than x1 x2 up to x6 that affect
R It is the log odds of a person with zero value of the current explaining variables but to
be in the resistant category
β1 is the parameter associated with the predictor variable x1 while β2 is the parameter
associated with the independent variable x2 and so on through β6 and x6
3522 Odds Ratio and Marginal Function Analysis
The following section that shows the statistical tools are brought from
Geoffrey M et al (2005) and Jamess B et al (2001)
2 5
For a binary event R (ie the event either occurs (R = 1) or doesnt (R = 0)) let
P is the P (R= 1)
P1 = P(R = 1V = 1)
P0 = P(R= 1V= 0) where
V is some binary characteristic that is thought to play a role in the conditional distribution of R
(resistance) V could be gender vulnerability managerial incapability age education or
experience
Onersquos one of these predictors are found that they have some influence on the probability of the
event R to happen then these result are presented and interpreted in the following potential
parameters of interest
1 Computing Odds Ratio From Logistic Regression Coefficient
Odds
Odds are ratios defined as the ratio of the probability to its complement or the ratio of favorable
to unfavorable cases If the probability of an event is a half the odds are one-to-one or even If
the probability is 13 the odds are one- to-two
Odds =
Log Odds
Natural log of the odds are also known as logit log odds = logit = logit(p) = log
To see this
point note that as the probability goes down to zero the odds approach zero and the logit
approaches At the other extreme as the probability approaches one the odds approach to
and so does the logit Note that if the probability is 12 the odds are even and the logit is
zero Negative logits represent probabilities below one half and positive logits correspond to
probabilities above one half If for example there are 30 vulnerable among the 150 respondents
so we estimate the probability as 30150 = 02 The odds are 30120 or 025 to one so non-
vulnerable outnumber vulnerable by roughly four to one The logit is log (025) = -0602 In the
vulnerable data the estimated logit was -0602 Conducting exponentiation on this value one can
obtain odds of exp (-0602) = 025 and from this one can obtain a probability of
= 02
Odds Ratio The standard way of interpreting a coefficient in logistic regression is using the
conversion of it to an odds ratio using the corresponding exp (coefficient) value Jamess B et al
2 6
(2001) This is ratio of ratios Odds ratio (OR) estimates the change in the odds of membership in
the target group for a one unit increase in the predictor It is calculated by using the regression
coefficient of the predictor as the exponent or exp
Odds Ratio =
=
= P(R=1V=1 x)
1-P(R=1V=1 x)
P(R=1V=0 x)
1-P(R=1V=0 x)
If coefficient is equal to 269 the odds ratio is exp269 or 1473 Therefore the odds of
incorporating is 1473 times greater for a case for example which had a one unit greater value
If the logit b =15 then the corresponding odds ratio ( exp(B) will be 448 One can then say that
when the independent variable increases one unit the odds that the case can be predicted
increase by a factor of around 45 times when other variables are controlled
A 1 unit increase in education for example increases the odds of resistance about 45 times
The idea here is that we want to evaluate everyones probability of being resistant in two states of
the world when V = 1 and when V= 0 One should thus compute P(R= 1V = 1 x) and P(R =
1V= 0 x) for each observation in the sample
Presenting the results of odds ratio in percentage the decimal number is reported For instance if
the odds ratio is 12 then one can say on average the vulnerable are 20 percent probable to be
incorporated in the resistant category It means for a one unit increase or decrease in one
variable we expect to see about 20 percent decrease or increase in the odds of being in the
resistant category
Coefficient = Lan
It means holding other things at a fixed value what is the odds of getting a resistant category for
a person possessing x variable over the odds of getting in to resistant category for a person not
possessing x variable
Mfx (marginal function) = keeping other things constant what is the probability of a person to
incorporate in to resistant category due to one unit increase or decrease of a variablersquos value from
its mean value
2 7
It is the difference of R occurring for those for whom V = 1 over those for whom V= 0 for
dummy variables and the difference between V= x and V= x-1 or x+1for continuous variables
where x is the mean)
It is the relative risk of R occurring for those for whom V = 1 over those for whom V = 0 It is
not the difference in risks Rather it is the
Marginal Effects in the Logit
The marginal effect is the difference in the probability of the event occurring between those for
whom V = 1 and V = 0
The Marginal Effect of V on the probability of R ME = p1 ndash p0
= P(R = 1V= 1 x) - P(R = 1V = 0 x)
2 8
CHAPTER FOUR
DATA PRESENTATION AND ANALYSIS
Table 41 Profile of respondents
variable obs mean StdDev
Age 150 3497 410
Education 150 1589 130
Experience 150 679 281
Source primary data produced by stata
It is too hard to exhaustively put the profile of respondents as age experience education were
put in a continuous way year after year So to just give a glimpse of the profile mean value and
standard deviation are taken Accordingly the mean of the age of the respondents is 3497 years
while on average a single individualrsquos age deviates from this value by 4 Years Then the mean
value of the years of experience of the respondents is 679 and the standard deviation of this
experience value is 28 while on average an individual respondent has 1589 numbers of formal
educational years Gender wise 52 of the respondents are female
Assumptions of this analysis
1 This study assumes that attitudes towards organizational change that will enable a person to
decide for accepting or resisting a change is a bi-dimensional construct with a two opposite
poles (one positive and one negative) It is in this assumption that the questionnaire is
developed
2 The impact of education for completing one more year of school is considered same no
matter which grade year one completes
3 The impacts of age are considered to give the same per one year older or younger across
entire range of ages no matter which age level
NB These assumptions can be rejected at any time other than this research
Table 42 Marginal Functions of the Predictors in All the Phases
Phases Predictors
Std Err z Pgt|z| [95 Conf CI Interval]
unfreezi
ng
Gender -0071179 05132 -014 0890 -0107703 093467 052
Vulnerabilit
y
4790161 11565 414 0000 25234 705692 28
2 9
() dydx is for discrete change of dummy variable from 0 to 1
Source primary data
41 Analysis on the Demographic Attributes Driven Factors of Resistance
To determine the significance level of the general variables that affect the tendency to resists an
organizational change effort a logistic regression analysis was conducted to predict resistance
for 150 respondents using vulnerability managerial incapability and demographic attributes
driven factors as predictors The results of the logistic regression are interpreted using the
conversion of it to an odds ratio and marginal functions Analysis of the odds ratio estimates the
change in the odds of membership in the target group (resistant group) for a one unit increase or
decrease in the predictor The marginal function is the difference in the probability of the event
occurring between those for whom IV= x and IV = x-1 for continuous variables and for whom
those IV= 1 and IV= 0 for demy variables
Managerial
incapability
1426356 0742 192 0055 -002787 288058 333333
Education -0626887 02558 -245 0014 -112816 -012561 158933
Age 0080302 00927 087 0386 -010137 026197 349667
Experience 0321467 01552 207 0038 00172 062573 679333
Moving
Gender 0284055 07184 040 0693 -112395 169206 52
Vulnerabilit
y
5257476 09301 565 0000 343446 708049 426667
Managerial
incapability
1966289 08061 244 0015 038642 354616 54
Education -1128887 03482 -324 0001 -181129 -044649 158933
Age -0103804 01303 -080 0426 -035918 015157 349667
Experience 045889 02069 222 0027 005334 086444 679333
Refreez
ing
Gender 0244118 03418 071 0475 -042588 091411 52
Vulnerabilit
y
1053151 05667 186 0063 -005749 21638 366667
Managerial
incapability
4338297 09431 460 0000 248984 618675 366667
Education -0438404 01938 -226 0024 -08182 -00586 158933
Age -0070984 00632 -112 0262 -019489 005292 349667
Experience 0212898 0107 199 0047 000324 042256 679333
3 0
Education
Refer Annex 21-4 and table 42 for detail about the following
To investigate whether educational level affects the tendency to resist or accept a change logit
analysis with conversions of it in to odds ratio and marginal function was performed The
independent variable was the educational attainment counted the number of formal school years
and the dependent variable was the tendency to resist while the other predictors were age
experience managerial incapability gender and vulnerability
The marginal function analysis shows that if educational level is increased by one year from its
mean value keeping other things constant the response probability to resist for a change
decreases by 0626887 in the unfreezing phase by 01128887 in the moving phase and by
0438404 in the refreezing phase all in the p ndash value lower than the usual threshold of 005(95
significance) An odds ratio analysis provided that when other factors are controlled the odds of
getting in to a resistant category for people with lower educational level over the odds of getting
in to a resistant category for people with higher educational level is 05058056 per one formal
school year educational level in the unfreezing 05490948 in the moving and 05228659 in the
refreezing phase of a change process In percentage for a one formal school year increase in
education it is expected to see 51 decreases in the odds of being in the resistant category in the
unfreezing 55 in the moving and 53 in the refreezing phases of a change process
This finding is consistent with the finding of Maria V et al (2003) who found that there is a
significant effect of educational attainments on resistance to change in that university under
graduates expressed less positive attitudes than the postgraduate
It is also consistent with the finding of Maria and Loannis (2005) who even extrapolated their
findings by stating employees with higher education are better equipped to meet new challenges
at work which is also confirmed by Iverson (1996)
Therefore it can be tentatively (as an experimental not explanatory and single study the
findings should be considered tentative until verified by additional research on the why of the
relationship) concluded that educational attainment negatively predicts the tendency to resist to
an organizational change effort
3 1
Experience
Refer Annex 21-4 and table 42 for detail about the following
The marginal function analysis shows that if experience is increased by one year from its mean
value keeping other things constant the response probability to resist for a change increases by
0321467 in the unfreezing phase by 045889 in the moving phase and by0212898 in the
refreezing phase all in the p lt005 (95 significance) The odds ratio analysis provided that
holding other factors at a fixed value the odds of getting in to a resistant category for people
with lower experience level over the odds of getting in to a resistant category for people with
higher experience is 0435387 per one year experience level in the unfreezing 0382336 in the
moving and 0432382 in the refreezing phase of a change process In percentage for a one year
increase in experience it is expected to see 3823 increases in the odds of being in the resistant
category in the unfreezing 4354 in the moving and 4323 in the refreezing phases
The finding is consistent with the finding of Maria V et al (2003) in that they found experience
positively predicting the outcome variable They also extrapolated their finding to the fact that
the more the employees have internal experience the more they get a strong quasi-stationary
equilibrium of the self maintained by restraining force in a context of the known and learning
They underlined that the equilibrium to be destabilized needs a strong devastating force before
old behavior can be discarded (unlearnt) and the days to come should promise to be better
otherwise change which represents the unknown as well as which forces to redefine oneself and
onersquos world would be resisted for granted
This finding is inconsistent with the finding of Sverdlik and Oreg (2009) in that all of the
demographic variables treated individually have not predicted resistance to change in their study
It is also inconsistent because in theirs the three interactions of the variables mainly gender
faculty experience and administrative responsibilities at a previous place of employment
together negatively predicted the outcome variable (resistance to change) for which predictions
are positive in the current study
For the odds ratio coefficient and marginal function analysis presented a very strong relationship
of the variables in this study as well as for the interaction effect analysis is not conducted in the
current study (it is not statistically valid to compare two different tests) it seems plausible to
tentatively conclude that experience positively and strongly predicts resistance by sticking to the
current outcome
3 2
Table 43 Coefficient analysis of the predictors in all of the phases
Predictors Coef Std Err z Pgt|z| [95 Conf Interval]
Unfreezing obs = 150
LR chi2(6) = 7249
Prob gt chi2 =
00000
Log likelihood = -
45247594
Pseudo R2 =
04448
Gender_1 -0799158 5762905 -014 0890 -1209424 1049593 Vulnerab~1 3193757 7429257 430 0000 1737649 4649865
Imanaginc~1 131748 5465013 241 0016 2463566 2388602 Education -7048263 2574858 -274 0006 -1209489 -2001634 Age 0902853 1038507 087 0385 -1132583 2938289
Experience 3614344 1776071 204 0042 0133308 709538 _cons 2085881 4961242 042 0674 -7637974 1180974
Moving obs = 150
LR chi2(6) = 7517
Prob gt chi2 =00000
Log likelihood = -
53179678
Pseudo R2 =04141
Gender_1 2008976 5106137 039 0694 -7998869 1201682 Vulnerab~1 3275679 6460872 507 0000 2009371 4541986 Imanaginc~1 1421709 6031327 236 0018 2395901 2603827 Education -7964982 2298409 -347 0001 -1246978 -3460183 Age -0732399 0922177 -079 0427 -2539833 1075035 Experience 3237748 1460756 222 0027 0374719 6100778 _cons 917179 4201067 218 0029 9378503 1740573
Refreezing obs=150
LR chi2(6) = 6030
Prob gt chi2=00000
Log likelihood = -
42052758
Pseudo R2=04176
Gender_1 4131202 5685308 073 0467 -7011797 152742 Vulnerab~1 143697 6080867 236 0018 2451422 2628798 Imanaginc~1 3935963 8177563 481 0000 233319 5538736 Education -7399578 2713833 -273 0006 -1271859 -2080563 Age -11981 1073626 -112 0264 -3302368 0906167 Experience 3593389 1797309 200 0046 0070728 7116049 _cons 8628381 500873 172 0085 -118855 1844531
Source primary data
Age
Refer table 43 for detail about the following
Hoping to know how resistance to organizational change is distributed over the different age
levels of employees the same analysis was conducted
The result revealed that the impact of age on the tendency to resist was not statistically
significant in all phases and in all p values (plt1 plt5 and plt 10)
This is in contrast with the finding of Bouti (2010) who found a negative relationship between
age and the tendency to resist change which implies that younger employees were more resistant
to change than older one He extrapolated his study to find out the behind why of the
observations and then stipulated that having longer work tenure was identified as positive
3 3
boundary conditions or moderators for the observations on the relationship of the two to be
opposite
But this study is consistent with the findings of Maria and Loannis (2005) as no differences
were identified among the four age groups of their samples
It is possible that the dependence is observed in Boutrsquos finding because Bouti used experience as
moderator for that the prediction probability came in age might have come through experience in
an invisible root It may have resulted from the fact that age and experience are conceptually
overlapping items though the items were generated based on different theoretical underpinnings
in the literature But in here predictors are analyzed independently together So without
neglecting the findings of Bouti but dedicating to the current one as interaction analysis was not
reached seems plausible for that the tendency of age to predict resistance for an organizational
change is tentatively not accepted or is declined
Gender
Refer table 43 for detail about the following
To investigate the distribution of resistance over the male and female groups coefficient
analysis marginal function and odds ratio analysis methods were conducted While the results of
three of the above presented some gender wise variations with regards to the tendency to resist
over the phases they were reject able in which those values were not statistically significant to
predict the tendency in all p values (plt1 plt5 and plt 10)
This finding is consistent with the finding of Maria V et al (2003) who found that there was no
gender wise varied impact on resistance Sverdlik and Oreg (2009) also observed no significant
difference between men and women in terms of resistance to change management if gender is
treated independently But through interaction effect of the combination of gender and
experience males who had held a position of authority at an earlier employer were less likely to
resist change than those who did not fit those criteria (both being male and previous position)
But the current finding is not consistent with the finding of Maria Vakola and Ioannis Nikolaou
(2005) who conducted independent t-tests and consequently suggesting that males tend to be
more reluctant than females toward organizational change
To get gender predicting resistance Sverdlik and Oreg (2009) conducted interactional effect
analysis and Vakola and Ioannis Nikolaou (2005) conducted independent t-test These tests and
analysis were not conducted in here Statistically it makes sense to dedicate to the type of model
3 4
used Therefore by sticking to the current result of the logit regression analysis tentatively it is
concluded that the dummy variable gender (maleness or femaleness) doesnrsquot predict resistance to
an organizational change
The analysis conducted up to this point helps to consider the alternative hypothesis 2
ldquoDemographic attributes of an employee are significant to the tendency to resist an
organizational change effortrdquo This alternative hypothesis is partially accepted as education and
experience negatively and positively predicted the tendency to resist a change respectively The
null hypothesis of it (ldquoDemographic attributes of an employee are not significant to the
tendency to resist an organizational change effortrdquo) is also partially accepted because both
age and gender independently have not predicted the outcome variable (tendency to resist)
42 Vulnerability versus managerial incapability driven factors
Odds Ratio and Marginal Function Analysis
Insert both annex 2 and table 42 together about here
That fitted model presented that holding other things at a fixed value the odds of getting in to
resistant category for vulnerable over the odds of getting in to resistant category for non
vulnerable is equal to 2437985 in unfreezing phase 2646118 in moving and 4207927 in the
refreezing phase all in the p ndash value lower than the upper threshold of 005(95 significance)
Besides to this the marginal function analysis shows that the probability of getting resistance
from the vulnerable people due to a change plan is higher than the probability of getting resistant
people from the non vulnerable group of the change plan by 4790161 in the unfreezing by
5257476 in the moving and by1053151 in the refreezing
This result happened at plt001 significance level in the first two phases but came down in to
plt005 in the refreezing phase The coefficients and significance levels of personal vulnerability
driven factors in the first two phases are the highest coefficients and significance levels from the
factors studied in this study but managerial incapability driven factors took the position in the
refreezing phase at plt001(99 significance) which was only at 5 that it was significant in the
first two phases
Therefore tentatively it can be concluded that resistance that come from personal vulnerability
factors are more strong and significant in the plan formulation and implementation phases then
this get reduced during the close up phase and resistance due to the problem that come from
3 5
managerial incapability gets stronger and more significant at the close up phase of a change
process
In this sense the alternative hypothesis 1 which says ldquopersonal vulnerability presents
highest significance level in all the phases of the change processrdquo is rejected or declined In
other words the null hypothesis of it (ldquopersonal vulnerability doesnrsquot present highest
significance level in all the phases of the change processrdquo) is accepted
53 A Single Variable Impact Consistency through the Lewinrsquos Three Phase
Model of Change Process
Table 44Predictor Ranking Through Ratio of the Occurrence = 1 Given A Predictor Is 1
and Occurrence =1 Given A Predictor Is 0 in the Unfreezing Phase Derived From the
Column and Row Statistics of Annex 3
Independent
Variable fr(R= 1IV = 1 x) fr(R = 1IV= 0 x)
Rank of
ratio Pr
Work Load 20 15 1333 4 0000
Position 23 12 1925 2 0000 Income And
Benefits
19 16 1200 5 0001
Operational
Unfamiliarity
20 15 1333 4 0023
Job Rules 18 17 1100 6 0000
Myopia 21 14 1500 3 0000
Communication
Barrier
26 9 2900 1 0000
Organizational
Silence
19 16 1200 5 0000
Existing
Investment
26 9 2900 1 0000
Past Failure 26 9 2900 1 0000
Skill Gap 11 24 0800 7 0007
Source primary data
Table 45 Predictor Ranking Through Ratio of the Occurrence = 1 Given A Predictor Is 1
and Occurrence =1 Given A Predictor Is 0 in the Moving Phase Derived From the Column
and Row Statistics of Annex 3
3 6
Independent
Variable fr(R= 1IV = 1 x) fr(R = 1IV= 0 x) fr R 1IV 1 x
fr R 1IV 0 x
Rank of
ratio
Pr
Work Load 32 11 2910 4 0000
Position 34 9 3800 2 0000 Income And
Benefits
30 13 2310 7 0000
Operational
Unfamiliarity
32 11 2910 4 0000
Job Rules 26 17 1530 9 0000 Myopia 31 12 2600 6 0000 Communication
Barrier
29 14 2100 8 0000
Organizational
Silence
33 10 3300 3 0000
Existing
Investment
31 12 2600 6 0000
Past Failure 34 9 2800 5 0000 Skill Gap 37 6 6211 1 0000
Source primary data
Table 46 Predictor Ranking Through Ratio of the Occurrence = 1 Given A Predictor Is 1
and Occurrence =1 Given A Predictor Is 0 In The Refreezing Phase Derived From The
Column And Row Statistics Of Annex 3
Independent
Variable fr(R= 1IV = 1 x) fr(R = 1IV= 0 x) fr R 1IV 1 x
fr R 1IV 0 x
Rank of
ratio Pr
Work Load 21 7 3 3 0000
Position 21 7 3 3 0000
Income And
Benefits
21 7 3 3 0000
Operational
Unfamiliarity
13 15 0910 7 0004
Job Rules 20 8 2500 4 0000
Myopia 23 5 4600 2 0000
Communication
Barrier
25 3 8333 1 0000
Organizational
Silence
21 7 3 3 0000
Existing
Investment
17 11 1610 5 0000
Past Failure 14 14 1 6 0002
Skill Gap 21 7 3 3 0000
Source primary data
3 7
Insert tables 44-46 altogether about here
This analysis is aimed to observe if resistance is same or not in the three phases of the change
process as well as if a single factor has varied impact to resistance over these phases or not This
result makes it fundamental for organizations to identify which source of resistance at which
phase deserve special attention to successfully manage resistance for change recurrently
In so doing a ratio analysis of the frequency of individuals who are expressed by the predictor
and are on the resistant category (fr(R= 1IV = 1 x)) over the frequency of individuals who are
expressed by the predictor but not part of the resistant category (fr(R= 1IV = 0 x)) with a chi2
test showing the real significant association of the variables is run distinguishing the three phases
of a change process
As can be observed every factor that is previously considered to lay in the vulnerability driven
or managerial incapability driven indicates that it has had an influence more or less (all at p
value less than 5) and as such the theoretical exposition is supported The questionnaire also
allowed respondents to include other sources of resistance None of the respondents added any
significant factor so the list can not only be taken as appropriate but also as complete
Demographic attributes driven variables are not considered here because these attributes
apparently remain same throughout all the phases more or less
Though all the lists that were taken for test were significant(at p value less than 5 percent) no
single source was pointed out as the most severe difficulty to achieve the change plan throughout
all the phases of the change process one moves up and the other moves down with the phases
In the unfreezing phase the sources of resistance to change with the highest ratio are
communication barrier existing investment and past failure (all with 2900) It is followed by the
fear to lose position (2) and then myopia (15) In this phase change agentsrsquo implementation skill
gap (0800) and job rules (1100) presented the first and second least important factors
respectively
However in the moving phase such hierarchy is altered change agentsrsquo implementation skill gap
moved up to the first place on the list (with a ratio of 6211) which was the least in the
unfreezing phase Communication barrier existing investment and past failure which were the
first important factors in the unfreezing phase moved down to more or less least place of
importance in the moving phase(8th
6th
5th
with a ratio of 21 26 and 28 all respectively) A
similar variation happened with almost all of the rest except of the resistance associated with fear
3 8
to lose position which remained the same in rank in both phases but with a higher ratio on the
second phase (3800)
Similarly in the refreezing phase the source of resistance to change with the highest ratio was
communication barrier (8333) followed by myopia (4600) A tight job rule which was the least
important factor in the moving phase was moved up to 4th
in the refreezing phase with 25 ratios
In this phase operational unfamiliarity past failure and existing investment presented the first
second and third least important factors with a ratio of 0910 1 and 1610 respectively
The resistance related to losing position came down to third in this phase which was a second in
both moving and in the unfreezing phases indicating its important effect and that effect
increasing the more at the start up the change phase is
Communication barrier is also found to be more devastating the more in the plan formulation and
closing the change process is
In this case the guiding alternative hypothesis that says ldquoA single variable factor may have
a varied significance level over the three phases of a change processrdquo is accepted
Likewise the null hypothesis of it (ldquoA single variable factor cannot have a varied
significance level over the three phases of a change processrdquo) is declined
3 9
CHAPTER FIVE
CONCLUSION AND RECOMMENDATION
51 Conclusions
The followings are the conclusions drawn
- Resistance factors significance level present variations considering the phase of change
process
- Vulnerability driven factors present highest significance level for resistance to change in
the unfreezing and moving phases of a change process while managerial incapability
driven in the refreezing one
- Educational attainment negatively predicts resistance to organizational change process
- Experience positively predicts resistance to organizational change process
- Age and gender donrsquot predict resistance to organizational change process
From hypothesis perspective
The alternative hypothesis ldquoDemographic attributes of an employee are significant to the
tendency to resist an organizational change effortrdquo is partially accepted as education and
experience negatively and positively predicted the tendency to resist a change respectively
Likewise the null hypothesis of it (ldquoDemographic attributes of an employee are not significant
to the tendency to resist an organizational change effortrdquo) is partially accepted because both age
and gender independently have not predicted the outcome variable (tendency to resist)
The alternative hypothesis that says ldquoA single variable factor may have a varied significance
level over the three phases of a change processrdquo is accepted Likewise the null hypothesis of it
(ldquoA single variable factor cannot have a varied significance level over the three phases of a
change processrdquo) is rejected
At last the alternative hypothesis which says ldquopersonal vulnerability presents highest significance
level in all the phases of the change processrdquo is rejected or declined In other words the null
hypothesis of it (ldquopersonal vulnerability doesnrsquot present highest significance level in all the
phases of the change processrdquo) is accepted
4 0
52 Recommendation
It is recommended that an interactional effect analysis of the predictors be conducted to disintegrate
overlapping concepts(if any) which was not covered here
This study restricts itself from prescribing anything to the business world as it considers it is
inappropriate to do so before it is verified by another extensive research
4 1
REFERENCES
Ansoff IH (1990) Implanting Strategic Management Prentice Hall International Ltd
London
Atkilt A (1996) Civil Service Reform and Administrative Modernisation Merit A Quarterly
Bulletin of the Ethiopian Civil Service Commission 5 15-21 Addis Ababa Ethiopia
Barr P Stimpert J amp Huff A (1992) Cognitive Change Strategic Action and Organizational
Renewalrdquo Strategic Management Journal 13 (Special Issue)
pp 15-36
Beer Z and Nohria B (2000) Why Change Programs Donrsquot Produce Change Harvard
Business Review 68 (6) pp 158-166
Belachew Kebede (2011) Analysis Of Bank Service Delivery In Ethiopia Addis Ababa
Ethiopia
Bernard B (2004) Kurt Lewin And The Planned Approach To Change A Re-Appraisal
Manchester UK
Boeker W (1997) Strategic change The influence of managerial characteristics and
organizational growth Academy of Management Journal 40 (1) pp 152-170
Bouti J (2010) Rethinking resistance and recognizing ambivalence a multidimensional view of
attitudes toward an organizational changerdquo Academy of Management Review 25 (4) pp
783-794
Burdett J (1999) Leadership in change and the wisdom of a gentleman Participation amp
Empowerment an International Journal 7 (1) pp 5-14
Child J and Smith C (1987) The context and process of organizational transformation -
Cadbury Limited in its sector Journal of Management Studies 24 (6) pp 565-593
Commercial Bank of Ethiopia (CBE)(2010) annual report of the bank of the year 200910 page
8-9 Addis Ababa
Cummings H amp Huse P (1989) Evolution and revolution as organizations growrdquo Harvard
Business Review (JulyAug) pp 37-46
Frankwick B (1995) Toward a Definition of Corporate Transformation Sloan Management
Review 35 (3) pp 101-106
Freeze B (1998) Developing an organization capable of implementing strategy and learning
Human Relations 49 (5) pp 597-617
4 2
Gebriel A (2002) Building Civil Service Capacity through Tertiary Level Education the
Ethiopian Experience Paper presented to the Development Management Institute Addis
Ababa E thiopia
Geoffrey M Roben F Zuarg T (2005) Essentials Of Research Design And Methodology
New Jersy USA
Getachew H amp Richard K (2006) Civil Service Reform In Ethiopia Success In Two
Ministries Research Memorandum August 2006 Addis Ababa Ethiopia
Ghoshal S amp Bartlett C (1996) Rebuilding Behavioral Context A Blueprint for
Corporate Renewal Sloan Management Review 37 (2) pp 23-36
Ghoshal S amp Bartlett C (1996) Rebuilding Behavioral Context A Blueprint For Goodstein
LD New York USA
Hutt M Walker B amp Frankwick G (1995) Hurdle the Cross-Functional Barriers to Strategic
Change Sloan Management Review 36 (3) pp 22-30
Iverson B (1996) How to Deal with Resistance to Change Harvard Business Review
(MayJune) pp 49-57
Jamess B Sofger T amp John K (2001) Organizational Research Determining Appropriate
Sample Size in Survey Research Muncie Indiana the Verge Publisher
Kilian M Bennebroek G (2003) A Different View on Resistance To Change Paper For
ldquoPower Dynamics And Organizational Change IVrdquo Symposium At The 11th EAWOP
Conference In Lisbon Portugal 14-17 May 2003 Lisbon Portugal
Klein K and Sorra J (1996) The challenge of innovation implementation Academy of
Management Review 21 (4) pp 22-42
Lawrence P (1954) How to Deal with Resistance to Changerdquo Harvard Business Review
Leana C amp Barry B (2000) Stability and Change as Simultaneous Experiences in
Organizational Life Academy of Management Review 25 (4) pp 753-759
Levy A (1986) Second-Order Planned Change Definition and Conceptualization
Organizational Dynamics (May) pp 5-20
Levy A amp Merry U (1986) Organizational Transformation Approaches Strategies
Theories New York
4 3
Lewin K (1947) Frontiers In Group Dynamics Concept Method And Reality In Social
Science Social Equilibria And Social Change London Management Review 25 (4) Pp
783-794
Lewin K (1946) Action research and minority problems In Lewin G W (Ed) Resolving
Social Conflict London Harper amp Row
Lewin K (1947a) Frontiers in group dynamics In Cartwright D (Ed) Field Theory in Social
Science London Social Science Paperbacks
Lewin K (1947b) Group decisions and social change In Newcomb TM and Hartley E L
(Eds) Readings in Social Psychology New York Henry Holt
Lorenzo F (2000) Structural Inertia and Organizational Change American Sociological
Review 49 pp 149-164
Marc M amp Frank B (1997) Managing Resistance to Change Hiam HRD Press
Marc M( 2008) Managing Resistance To Change In TRIAD Consulting Group LLC
Ministry Of Capacity Building (2006) Business Process Reengineering Study Final
Report Addis Ababa
Maria V Ioannis N amp Suanger B (2005) Creating Successful Organization Change
Organizational Dynamics 19 (4) pp 5-17
Maria V Loannis N amp Loannis T (2003) The role of emotional intelegnece and personality
variables on attitudes towards organizational change Athens Greece
Mengistu B amp Vogel E (2006) Bureaucratic Neutrality among Competing Bureaucratic
Values in an Ethnic Federalism The Case of Ethiopia Public Administration Review
Addis Ababa Ethiopia
Miller D amp Kunce T (1973) Prediction and statistical overkill revisited Measurement and
Evaluation in Guidance 6(3) 157-163 In Jamess B Sofger T amp John K (2001)
Organizational Research Determining Appropriate Sample Size in Survey Research
Muncie Indiana the Verge Publisher
Miller L amp Smith K (1983) Handling Non response issues Journal of Extension 21 45-
50 In Jamess B Sofger T amp John K (2001) Organizational Research Determining
Appropriate Sample Size in Survey Research Muncie Indiana the Verge Publisher
Morrison E amp Milliken F (2000) Organizational Silence A Barrier To Change
4 4
Multidimensional View Of Attitudes Toward An Organizational Changerdquo Academy Of
Notes Toward A Model Of Managed Learning [WWW Document] (74 Paragraphs)
URL HttpWwwSol-NeOrgResWp10006Html [2002 March 20]
Nadler D and Tushman M (1990) Beyond the Charismatic Leader Leadership and
Organizational Change California Management Review 32 (2) pp 77-97
Nemeth C (1997) Managing innovation When less is more California Management Review
40 (1) pp 59-74
Paul L (2005) How To Deal With Resistance To Change Belgium kespi Publisher
Peter S (2007) Change and Employee Behaviorrdquo Leadership amp Organization Development
Journal 19 (3) pp 157-163
Piderit S (2000) Rethinking Resistance And Recognizing Ambivalence New Delhi India
Ross A (2004) Scheinrsquos Change Theory New York USA
Ruiz G amp Lorenzo H ( 1999) A Far-from-Equilibrium Systems Approach to Resistance to
Change Organizational Dynamics (Autumn) pp 16-26
Rumenet R (1995) Inertia and transformation in Montgomery CA Resource-
Based and Evolutionary Theories of the Firm Kluwer Academic Publishers
Massachusetts pp 101-132
Schein E (1995) Kurt Lewinrsquos Change Theory In The Field And In The Classroom San
Francisco Jossey-Bass Publishers
Schein E (1999) The Corporate Culture Survival Guide Sense And Nonsense About Culture
Change San Francisco Jossey-Bass Publishers
Schuler D (2004) Overcoming Resistance To Change Top Ten Reasons For Chang
Resistance Manchester UK
Seashore S (1987) Surveys in Organizations In J W Lorsch (Ed) Handbook Of
Organizational Behavior (Pp 140-154) Prentice-Hall
Smith M (2001) Kurt Lewin Groups Experiential Learning And Action Research [WWW
Document] URL HttpWwwInfedOrgThinkersEt-LewinHtm [2004September 9]
Southern African Development Community (SADC)(200) A Theoretical Framework On
Innovations In Education Canada
Stephen O amp Godwin K (2010) Business Process Reengineering For Competitive
Advantage Nairobi AIBUMA Publishing
4 5
Strebel P (1994) Choosing the right change path California Management Review 36 (2) pp
29-51
Sverdlik N amp Oreg S (2009) Personal values and conflicting motivational forces in the
Context of imposed change Journal of Personality 77 1437ndash1466
Tesfaye D (2009) Business Process Reengineering In Ethiopian Public Organizations The
Relationship Between Theory And Practice Addis Ababa Ethiopia
Tilaye K (2007) Civil Service Reform In Ethiopia Achievements Problems And Possible
Solutions The Proceedings Of The First National Conference On The Achievements
Challenges And Prospects Of The Ethiopian Civil Service Reform Program
Implementation In Ethiopia Addis Ababa Ethiopia May 31 2007AddisAbaba
URLHttp Www A2 zpsychology ComArticles Kurt_Lewins_Change_ TheoryHtm)
Tilaye K (2010) Rethinking Institutional Excellence In Ethiopia Adapting And Adopting The
Balanced Scorecard (BSC) Model Addis Ababa Ethiopia
Van de Ven A amp Poole S (1995) Explaining development and change in Organizations
Academy of Management Review 20 (3) pp 510-540
Waddell D amp Sohal A (1998) Resistance a constructive tool for change Management
Management Decision 36 (8) pp 543-548
Williams B (1980) Formal structures and social reality In D Gambetta (Ed) Trust
Making and breaking of cooperative relations (pp 3-13) Oxford UK Blackwell Ltd
Yetimgeta A (2007) Approaches To Change Management In The Ethiopian Civil Service
Emphasis On Ethiopian Roads AuthorityThe Proceedings Of The First National
Conference On The Achievements of Civil Service Reform Program Implementation In
Ethiopia May 31-June 1 2007 Addis Ababa Ethiopia
Seashore S (1987) Surveys in organizations In J W Lorsch (Ed) Handbook of
Organizational behavior (pp 140-154) Englewood Cliffs NY Prentice-Hall
Levy A amp Merry U (1986) Organizational transformation Approaches strategies
Theories New York Praeger
4 6
Annex 1 Questionnaire
Adama Science and Technology University
A Thesis on Organizational Change Management
Questionnaire Prepared For Employees of the Commercial Bank of Ethiopia
Dear respondents
I am conducting a research entitled as ldquoThe Determinants of Resistance to Change
Management Processrdquo I therefore need your complete response for the questions provided
hereunder The data and information obtained will be confidential and will be exclusively used for
this study only
BPR = Business Processing Reengineering
Thank you very much
1 Sex Female Male
For question 2 ndash 4 state your answer as observed during the beginning year of BPR
implementation in the branch where you worked in
2 Age ______ (the specific age is needed not in range)
3 Total years of school _____( school years counted from your elementary up to highest
education)
4 Number of years of work experience
Internal (in CBE) ________
External (before CBE) _____
5 Did you have any sense of discontent discomfort or disagreement with the practice of
BPR
Yes No
6 If your answer to question number 5 is ldquoyesrdquo in which of the following phases of BPR
implementation process was your disagreement expressed or expressible
Note if your answer is in two or all of them please state so they are quite essential for
the study
It doesnrsquot matter whether you expressed your discomfort or not and it doesnrsquot matter how small the extent or
degree of your discomfort was
Announcement planning phase implementation phase completion phase
4 7
7 In the following phases of BPR implementation there are statements that need your
agreement or disagreement If you agree with the statement Encircle 1 If you do not agree
encircle 0
Announcement Planning
phase
Implementation phase
Completion or close up phase
You expected higher work
load if BPR is implemented
1 0 Functions or tasks were
merged and working hour was
increased
1 0 There was higher work load than
before BPR
1 0
You were afraid of your job
continuity or position
1 0 New positions were created
and the existed one was
distorted
1 0 You were asked to leave the
existed position
1 0
You expected that you may be
changed to another branch or
another department
1 0 Functions shift reached up to
changing to another
department or branch
1 0 You were changed to another
branch or another department
1 0
You were afraid that Your job
team will be collapsed or
disturbed
1 0 Your job team was collapsed
or disturbed
1 0 You could not mingle with new
staff members or you could not
build up team sprit
1 0
You felt the change will bring
factors to reduce fringe
benefits or your income
1 0 Incomes and benefits started
to change with regards to a
change in task or new policy
1 0 Your fringe benefits or your
income was reduced
1 0
You thought BPR would
change the organizational
culture
1 0 Organizational cultures like
dressing code started to be
changed
1 0 You were confronting with new
organizational culture
1 0
You thought new operational
skills will be required or your
current knowledge will
obsolete
1 0 New technologies were
introduced which require new
operational skills
1 0 New operational skills was
required in your job
1 0
you thought BPR would bring
new job rules regulations and
1 0 BPR brought new job rules
regulations and
1 0 You could not fit with new job
rules regulations and
1 0
4 8
sophistications sophistications sophistications
Change agents have not
created the long term vision
of the bank to you
1 0
Change agents have not
created image of long term
vision of the bank to you
1 0
You could not capture the long
term vision or picture of the
bank
1 0
There was communication
problem of what BPR really is
1 0 There was miscommunication
between the change agents
and you
1 0 You were not as well informed
about BPR as the change agents
1 0
It was not such concerning to
you practice BPR
1 0 It was not such concerning to
you to practice BPR
1 0 You were not involved as an active
part of the change effort
1 0
You thought BPR would
require another new investment
or changing the exiting one
1 0 BPR required another new
investment or changed the
exiting one
1 0 Adding new investment or
changing the exiting one was not
right decision
1 0
You had negative experiences
with previous change processes
1 0 Changes were started with
confusions that have to do with
your past experience of failure
1 0 The conclusion was not as smooth
as which is guaranteed not to slide
back as possible
1 0
you thought change agents have
Implementation skill gap
1 0 Change agents were confused in
sequencing tasks budgeting
capital departmentation and
hiring technology amp all other
tasks
1 0 The skill gap of the change agents
was not overcome
1 0
Any other problems that you
expected BPR would bring
__________________________
_________________________
__________________________
__________________________
__________________________
_____________________
Any other problems of both
personal and organizational
that were brought with the
introduction of BPR
__________________________
__________________________
__________________________
_________________________
Any other problems of both
personal and organizational that
you faced after BPR
introduction
__________________________
__________________________
________________
4 9
Annex 2
The Pearsonian Chi-Square Correlation and Linear Dependence Measure of Variables
ANNEX 21 Coefficient Wise Logit Result and Odds Ratio in the Unfreezing Phase
a Coefficient phase 1
Iteration 0 log likelihood = -81490917
Iteration 1 log likelihood = -50638714
Iteration 2 log likelihood = -45874858
Iteration 3 log likelihood = -45268845
Iteration 4 log likelihood = -45247631
Iteration 5 log likelihood = -45247594
Logistic regression (
Number of obs = 150
LR chi2(6) = 7249
Prob gt chi2 = 00000
Log likelihood = -45247594 Pseudo R2 = 04448
------------------------------------------------------------------------------
resistance | Coef Std Err z Pgt|z| [95 Conf Interval]
-------------+----------------------------------------------------------------
_IGender_1 | -0799158 5762905 -014 0890 -1209424 1049593
_IVulnerab~1 | 3193757 7429257 430 0000 1737649 4649865
_Imanaginc~1 | 131748 5465013 241 0016 2463566 2388602
Education | -7048263 2574858 -274 0006 -1209489 -2001634
Age | 0902853 1038507 087 0385 -1132583 2938289
Experiance | 3614344 1776071 204 0042 0133308 709538
_cons | 2085881 4961242 042 0674 -7637974 1180974
------------------------------------------------------------------------------
b Odds Ratio Phase 1
Iteration 0 log likelihood = -81490917
Iteration 1 log likelihood = -50638714
Iteration 2 log likelihood = -45874858
Iteration 3 log likelihood = -45268845
Iteration 4 log likelihood = -45247631
Iteration 5 log likelihood = -45247594
Logistic regression Number of obs = 150
LR chi2(6) = 7249
Prob gt chi2 = 00000
Log likelihood = -45247594 Pseudo R2 = 04448
------------------------------------------------------------------------------
5 0
resistance | Odds Ratio Std Err z Pgt|z| [95 Conf Interval]
-------------+----------------------------------------------------------------
_IGender_1 | 9231941 532028 -014 0890 298369 2856488
_IVulnerab~1 | 2437985 1811242 430 0000 5683968 1045708
_Imanaginc~1 | 3733998 2040635 241 0016 1279356 1089825
Education | 4941944 127248 -274 0006 2983496 8185969
Age | 1094487 1136632 087 0385 89292 1341554
Experiance | 1435387 254935 204 0042 101342 2033052
------------------------------------------------------------------------------
ANNEX 22 Coefficient Wise Logit Result and Odds Ratio in the Moving
Phases
a Coefficient phase 2
Iteration 0 log likelihood = -90766406
Iteration 1 log likelihood = -57362338
Iteration 2 log likelihood = -53548876
Iteration 3 log likelihood = -53185697
Iteration 4 log likelihood = -5317968
Iteration 5 log likelihood = -53179678
Logistic regression Number of obs = 150
LR chi2(6) = 7517
Prob gt chi2 = 00000
Log likelihood = -53179678 Pseudo R2 = 04141
------------------------------------------------------------------------------
resistance | Coef Std Err z Pgt|z| [95 Conf Interval]
-------------+----------------------------------------------------------------
_IGender_1 | 2008976 5106137 039 0694 -7998869 1201682
_IVulnerab~1 | 3275679 6460872 507 0000 2009371 4541986
_Imanaginc~1 | 1421709 6031327 236 0018 2395901 2603827
Education | -7964982 2298409 -347 0001 -1246978 -3460183
Age | -0732399 0922177 -079 0427 -2539833 1075035
Experiance | 3237748 1460756 222 0027 0374719 6100778
_cons | 917179 4201067 218 0029 9378503 1740573
------------------------------------------------------------------------------
b Odds Ratio in Phase 2
Iteration 0 log likelihood = -90766406
Iteration 1 log likelihood = -57362338
Iteration 2 log likelihood = -53548876
Iteration 3 log likelihood = -53185697
Iteration 4 log likelihood = -5317968
5 1
Iteration 5 log likelihood = -53179678
Logistic regression Number of obs = 150
LR chi2(6) = 7517
Prob gt chi2 = 00000
Log likelihood = -53179678 Pseudo R2 = 04141
------------------------------------------------------------------------------
resistance | Odds Ratio Std Err z Pgt|z| [95 Conf Interval]
-------------+----------------------------------------------------------------
_IGender_1 | 12225 6242251 039 0694 4493798 3325707
_IVulnerab~1 | 2646118 1709623 507 0000 7458625 938771
_Imanaginc~1 | 4144195 24995 236 0018 1270728 1351536
Education | 4509052 1036364 -347 0001 2873719 7074995
Age | 9293778 0857051 -079 0427 7757048 1113495
Experiance | 1382336 2019256 222 0027 1038183 1840575
ANNEX 23 Coefficient Wise Logit Result and Odds Ratio in the Refreezing
Phases
a Coefficient phase 3
Iteration 0 log likelihood = -72203
Iteration 1 log likelihood = -47853706
Iteration 2 log likelihood = -42709416
Iteration 3 log likelihood = -42079849
Iteration 4 log likelihood = -42052829
Iteration 5 log likelihood = -42052758
Logistic regression Number of obs = 150
LR chi2(6) = 6030
Prob gt chi2 = 00000
Log likelihood = -42052758 Pseudo R2 = 04176
------------------------------------------------------------------------------
resistance | Coef Std Err z Pgt|z| [95 Conf Interval]
-------------+----------------------------------------------------------------
_IGender_1 | 4131202 5685308 073 0467 -7011797 152742
_IVulnerab~1 | 143697 6080867 236 0018 2451422 2628798
_Imanaginc~1 | 3935963 8177563 481 0000 233319 5538736
Education | -7399578 2713833 -273 0006 -1271859 -2080563
Age | -11981 1073626 -112 0264 -3302368 0906167
Experiance | 3593389 1797309 200 0046 0070728 7116049
_cons | 8628381 500873 172 0085 -118855 1844531
------------------------------------------------------------------------------
5 2
b Odds Ratio in phase 3
Iteration 0 log likelihood = -72203
Iteration 1 log likelihood = -47853706
Iteration 2 log likelihood = -42709416
Iteration 3 log likelihood = -42079849
Iteration 4 log likelihood = -42052829
Iteration 5 log likelihood = -42052758
Logistic regression Number of obs = 150
LR chi2(6) = 6030
Prob gt chi2 = 00000
Log likelihood = -42052758 Pseudo R2 = 04176
------------------------------------------------------------------------------
resistance | Odds Ratio Std Err z Pgt|z| [95 Conf Interval]
-------------+----------------------------------------------------------------
_IGender_1 | 1511527 8593496 073 0467 4959998 4606278
_IVulnerab~1 | 4207927 2558785 236 0018 1277803 1385711
_Imanaginc~1 | 5121144 4187848 481 0000 1031078 2543562
Education | 4771341 1294862 -273 0006 28031 8121613
Age | 8870889 0952401 -112 0264 7187535 1094849
Experiance | 1432382 2574433 200 0046 1007098 2037258
------------------------------------------------------------------------------
() dydx is for discrete change of dummy variable from 0 to 1
ANNEX 3 Column and Row Statistics of the Predictors with Their Pearsonian Chi2
Association and Significance in Three of the Phases Respectively
5 3
5 4
5 5
5 6
ANNE 4 Banks Approached For Data
1 Addisu Gebeya
2 Africa Union Branch
3 Anwar Mesgid Branch
4 Arada Ghiorgis Branch Piassa
5 Arat Killo Branch
6 Asko Branch
7 Bole Branch
8 Enqulal Fabirka
9 Ferensay Legasionl
10 Finfine Branch
11 Gofa Sefer Branch
12 Gotera Branch
13 Gurd Shola Branch
14 Kidist Mariam
15 Kirkos Branch
16 Lideta Branch
17 Mahteme Ghandi Branch
18 Megenagna Branch
5 7
19 Mehal Ketema Branch
20 Meskel Square Branch
21 Nifas silk Branch
22 Selassie Branch Arat
23 Sengatera Branch
24 Sheger Branch
25 Shiro Meda
26 Tekle Haimanot Branch
27 Tewodros Branch
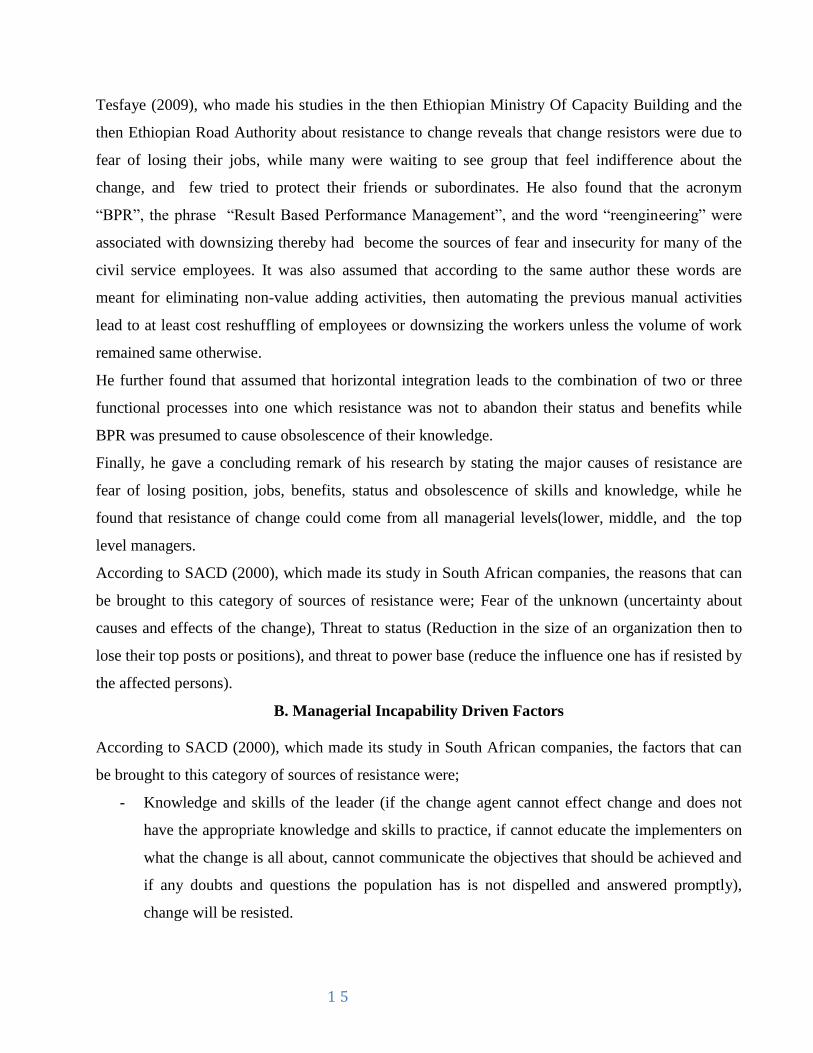
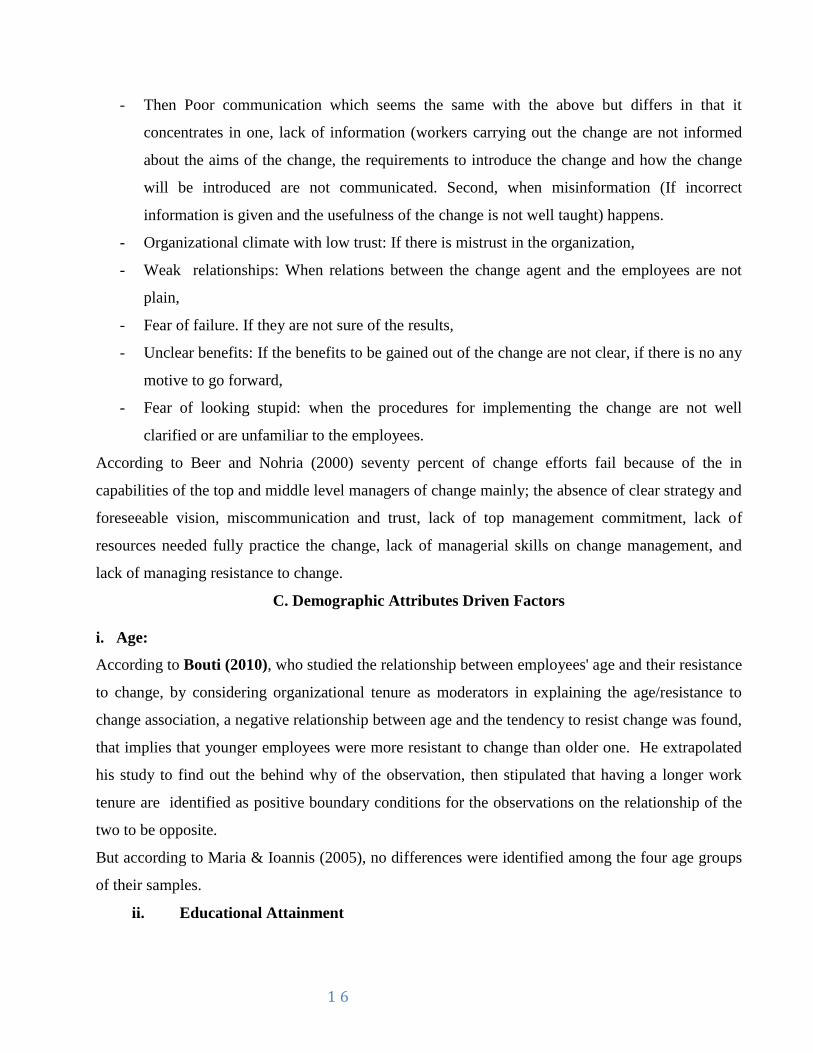
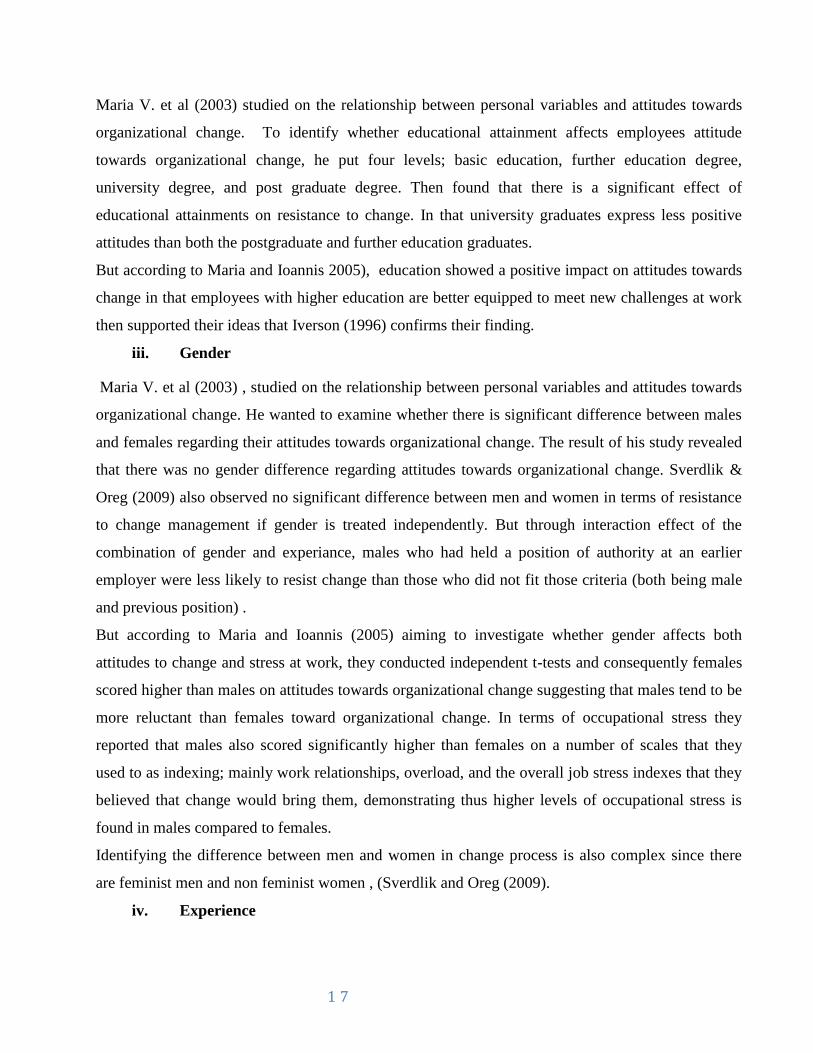
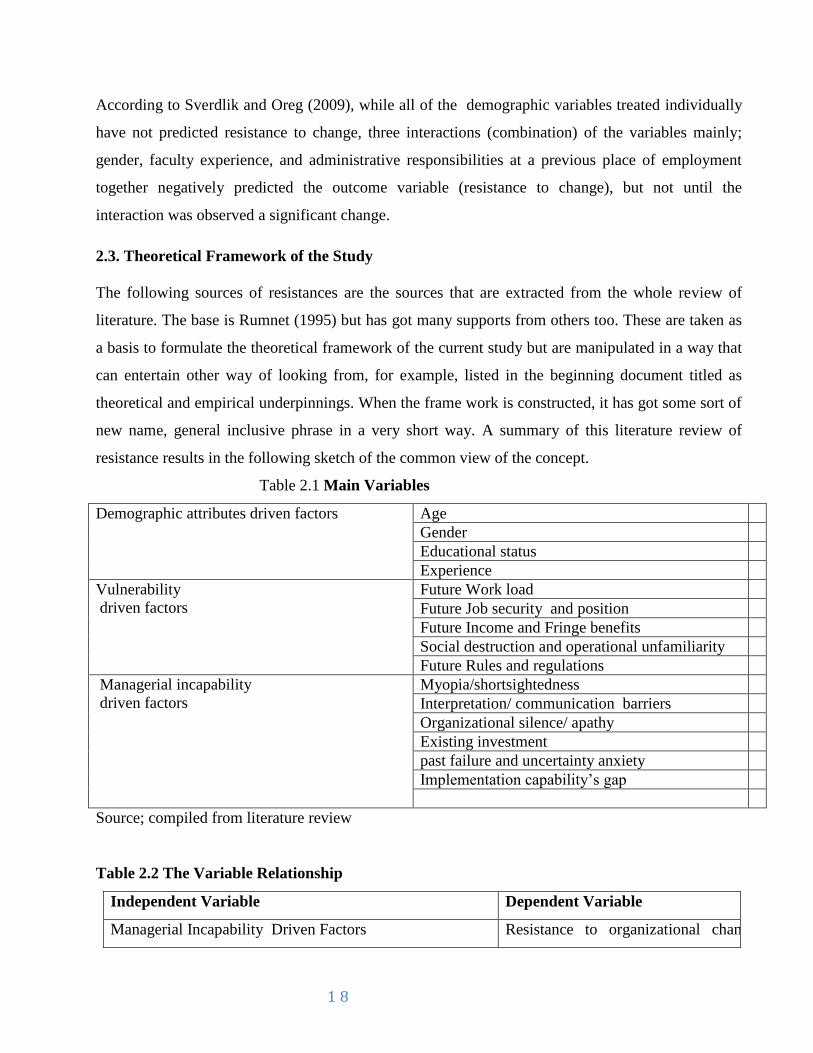
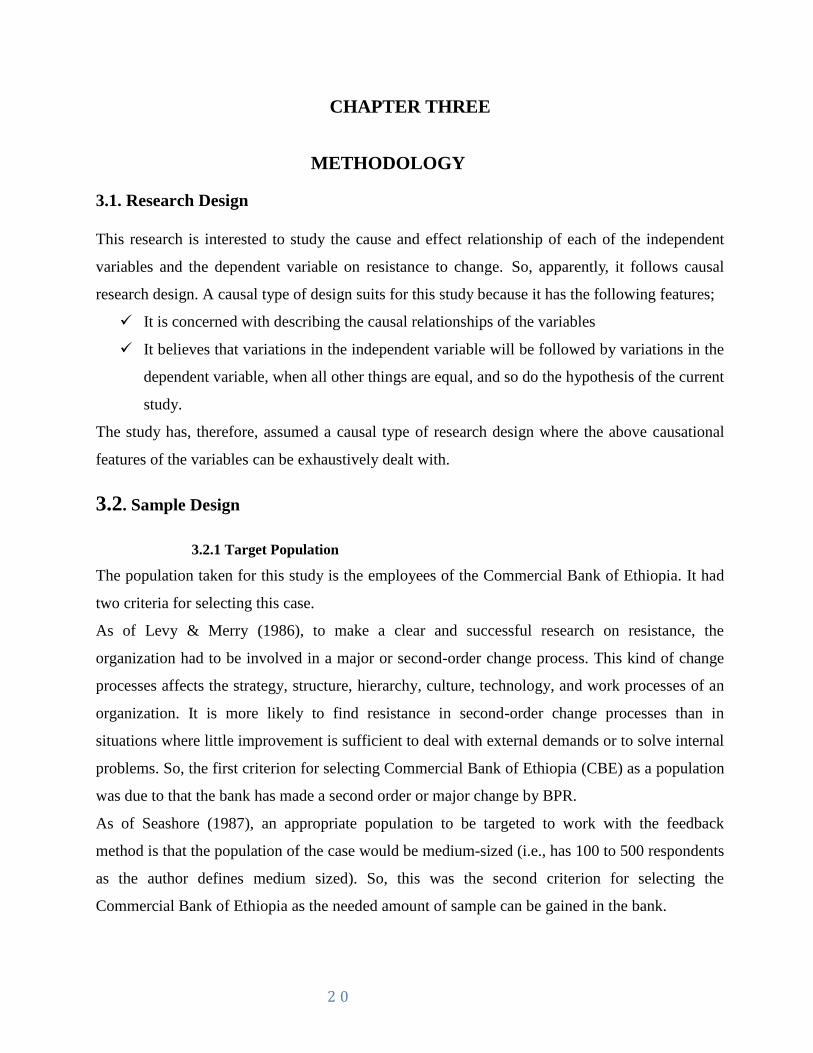
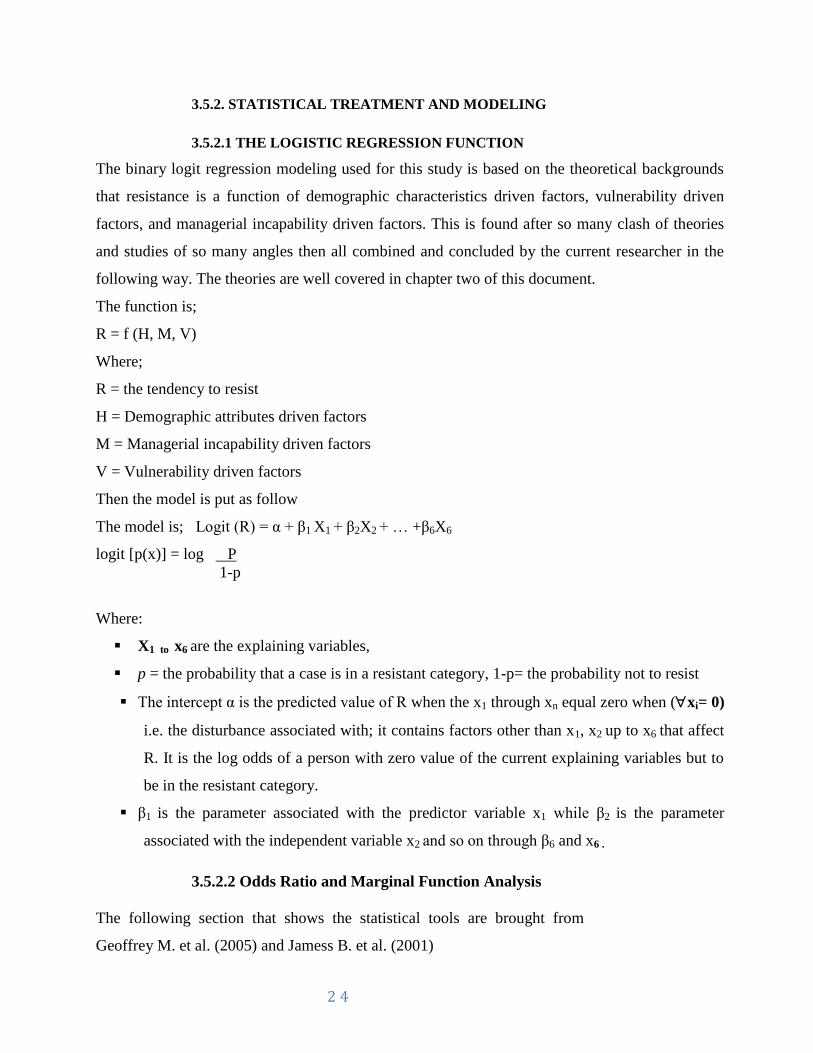
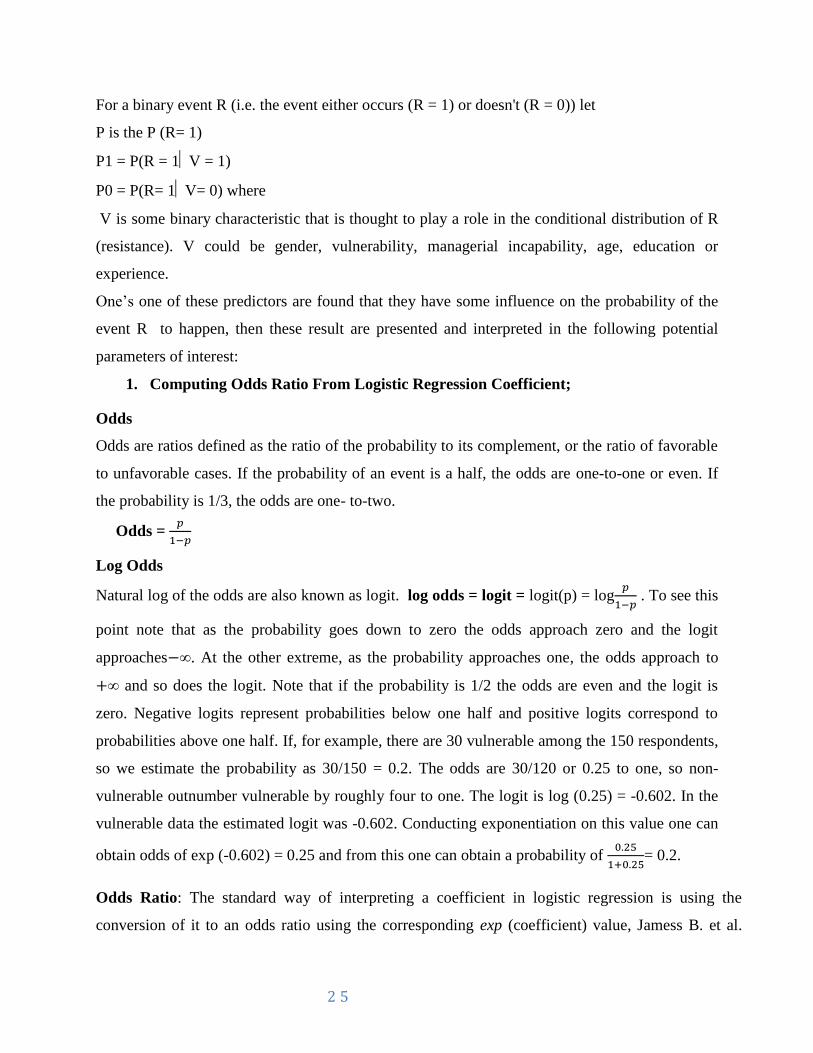
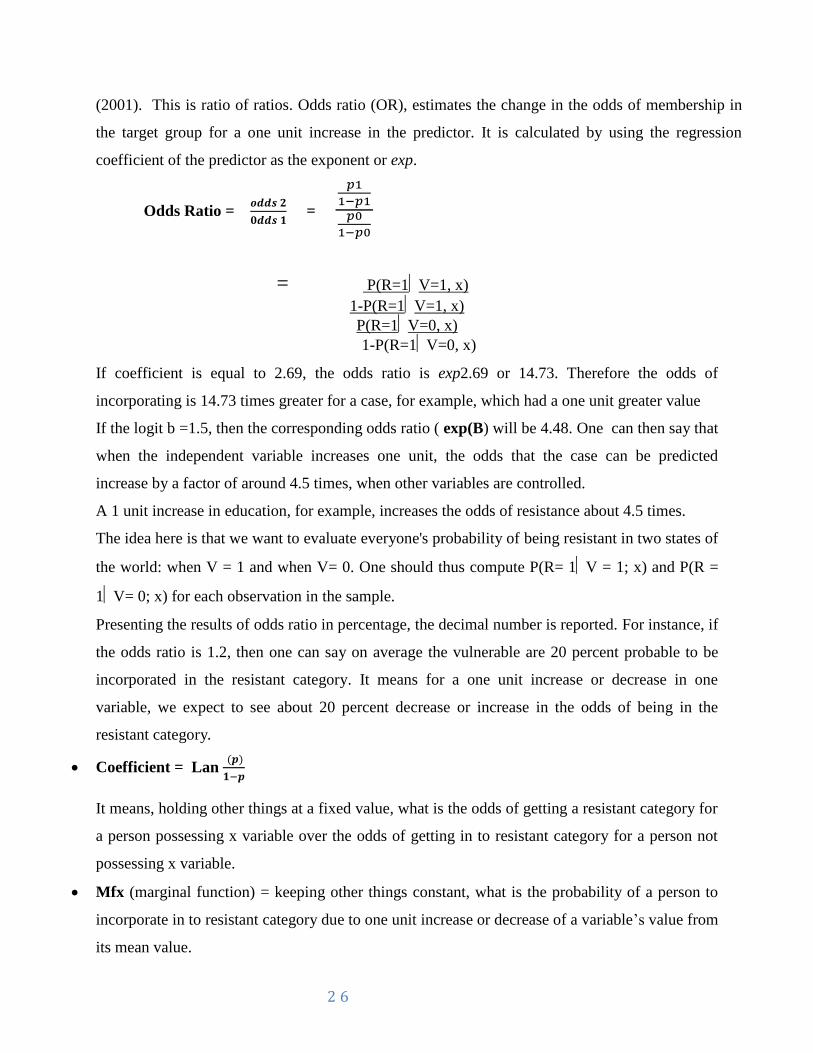
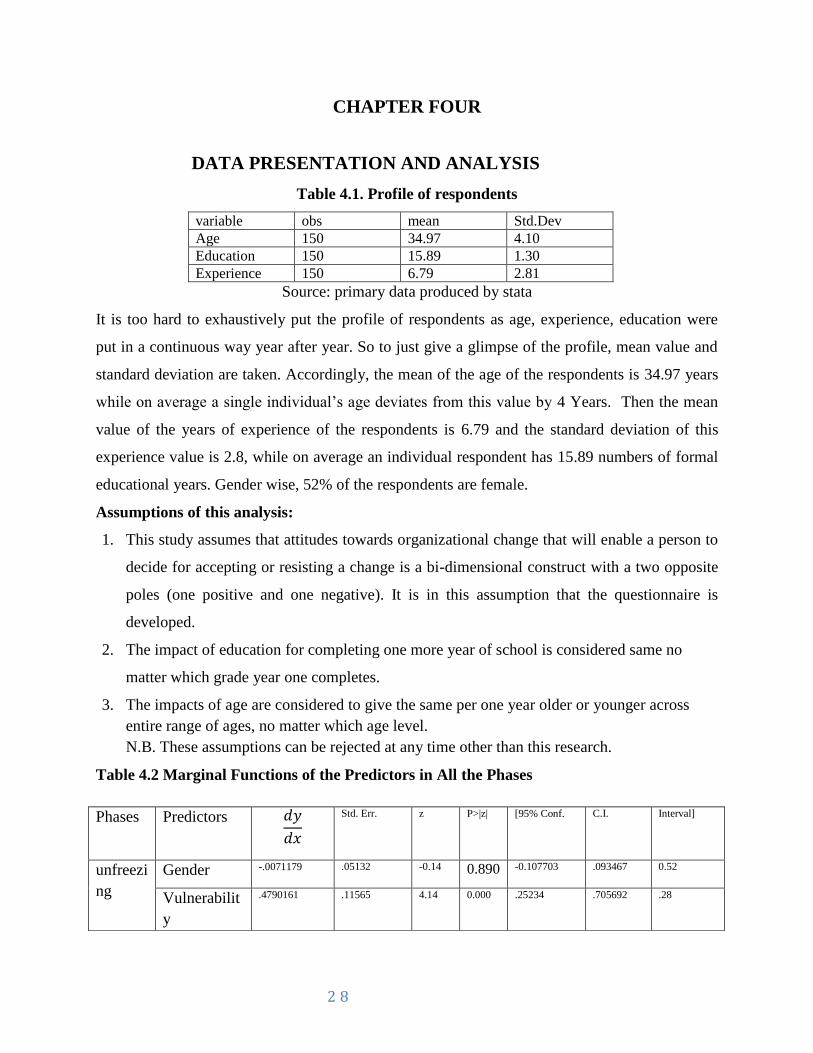
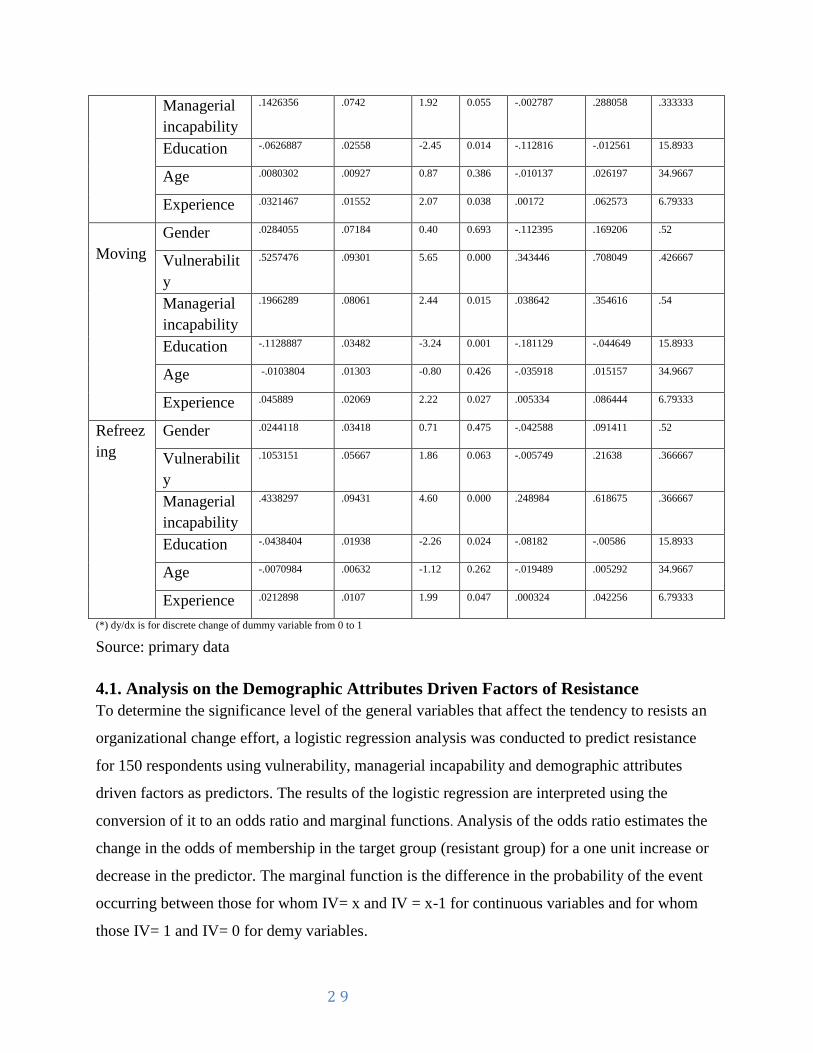
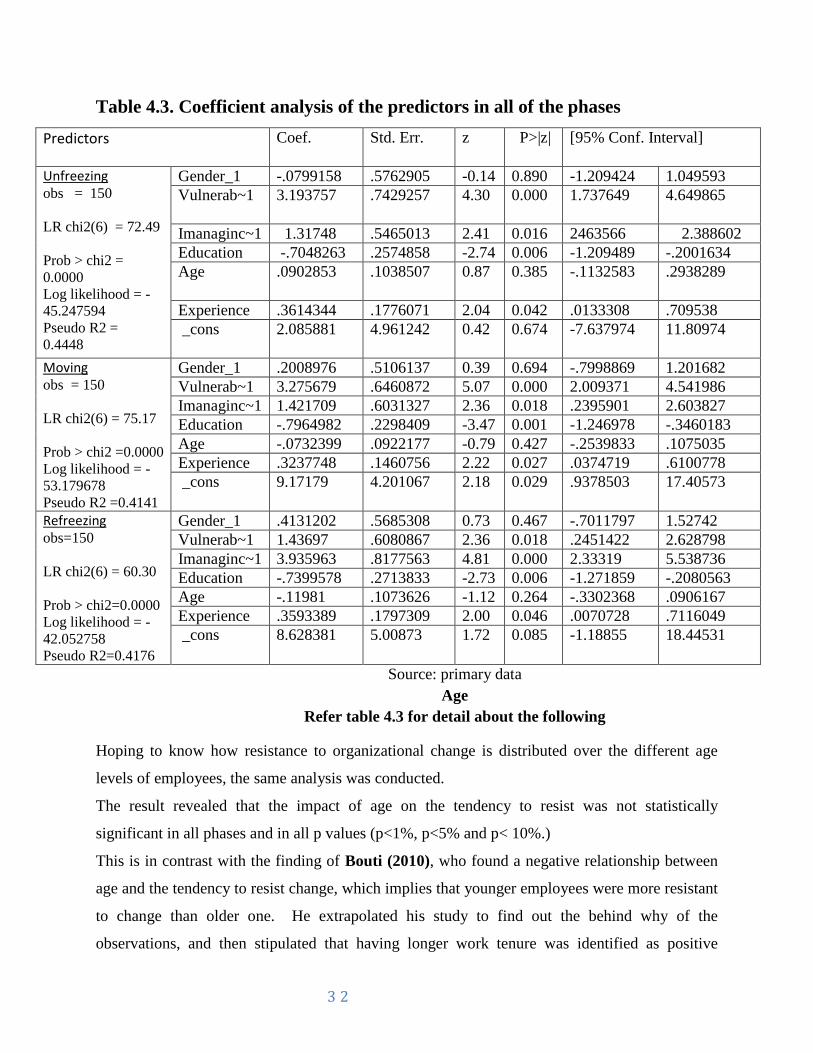
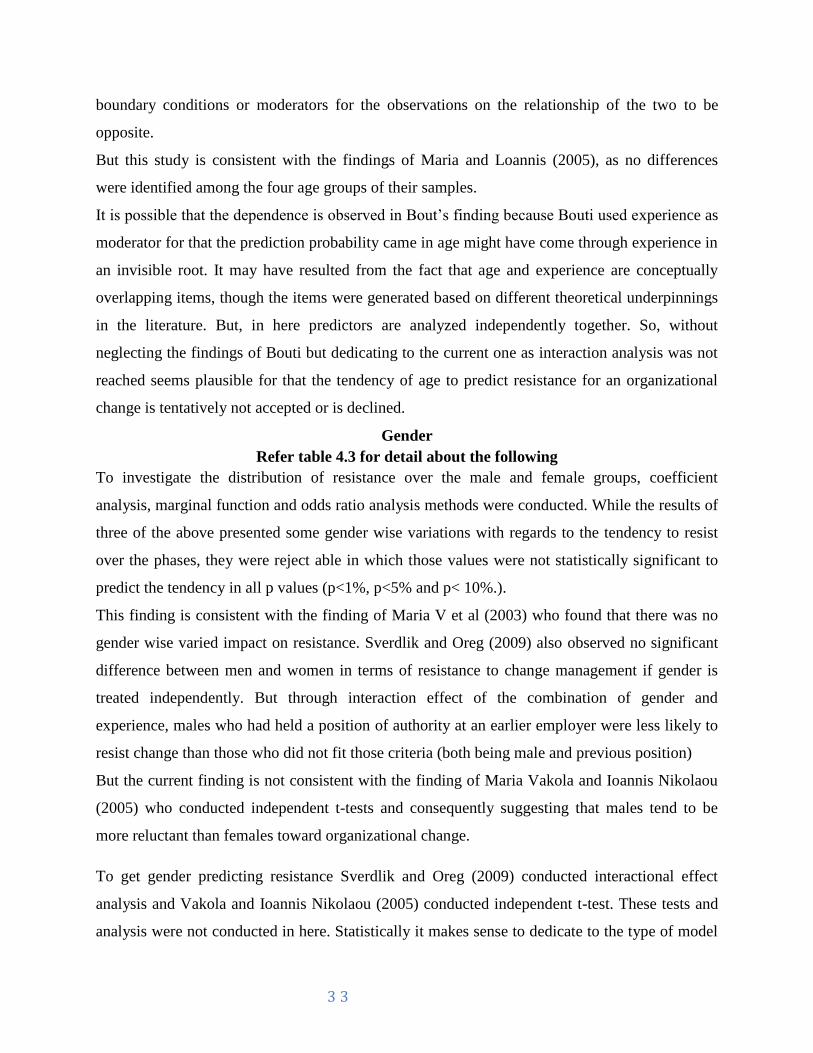
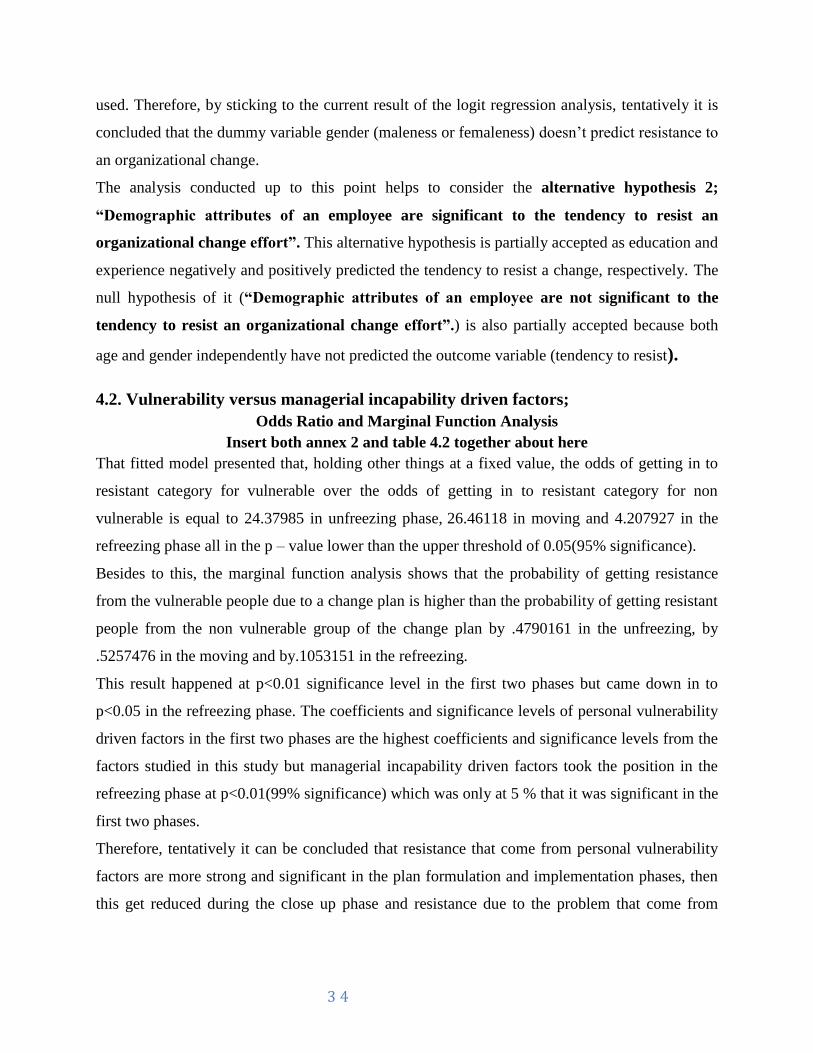
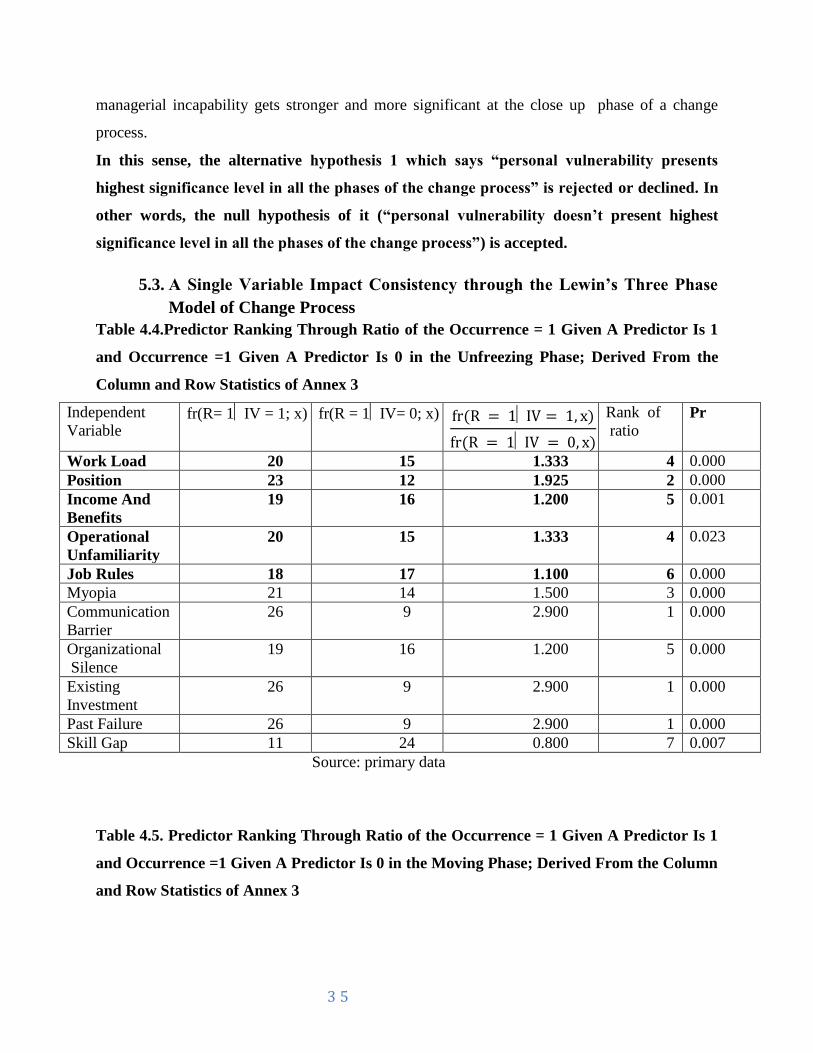
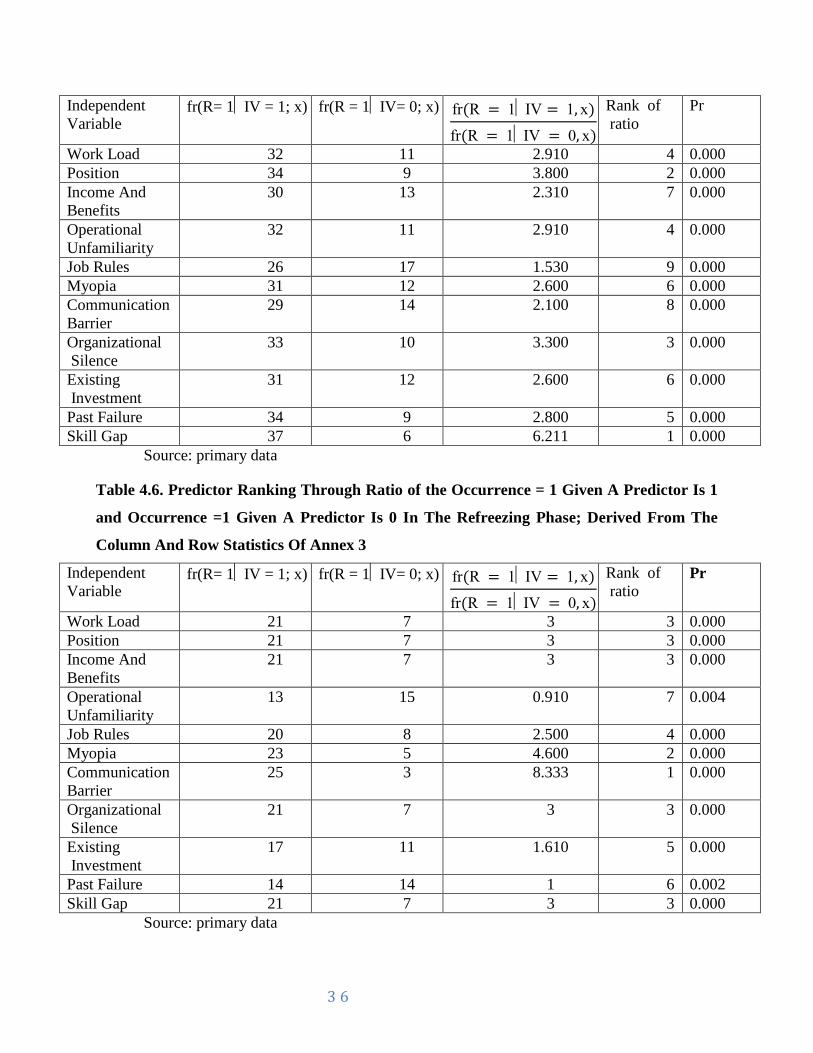
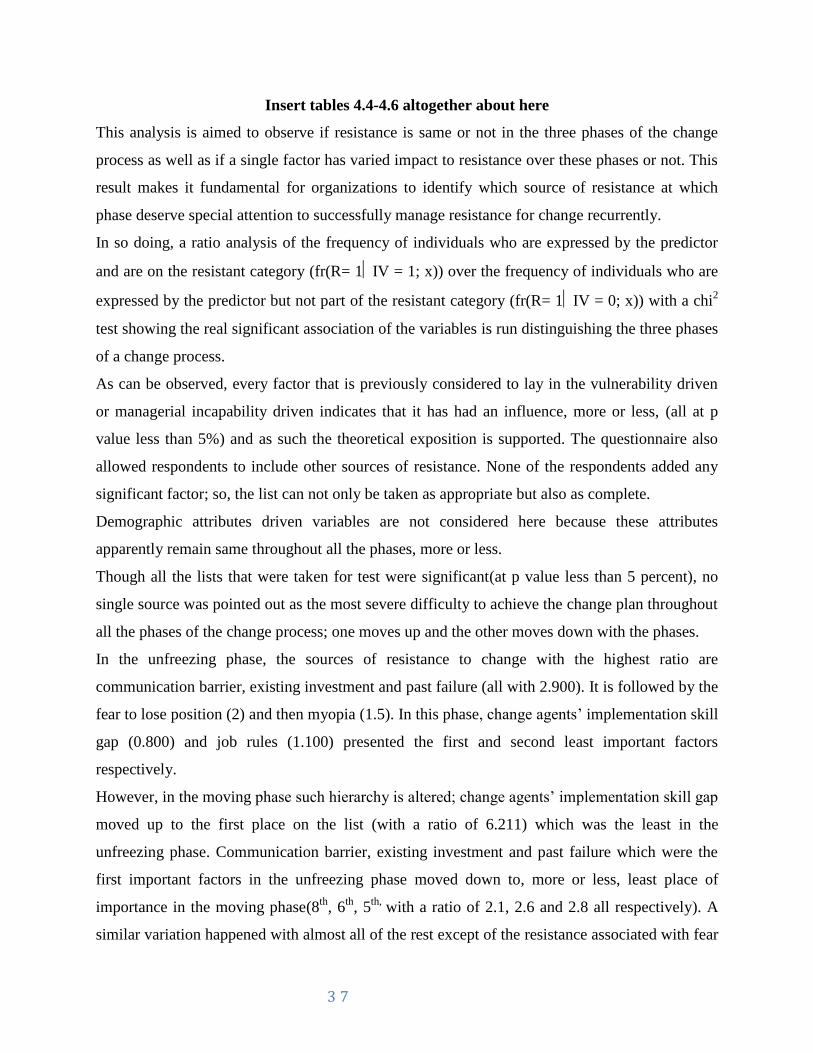
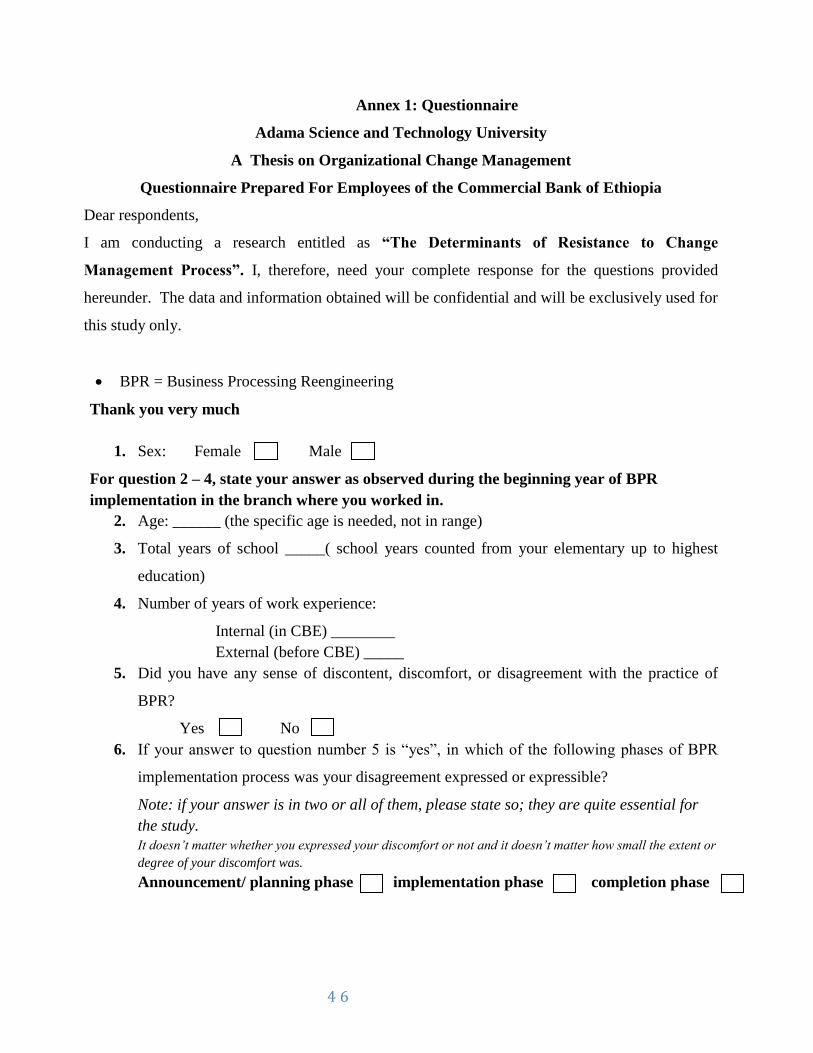
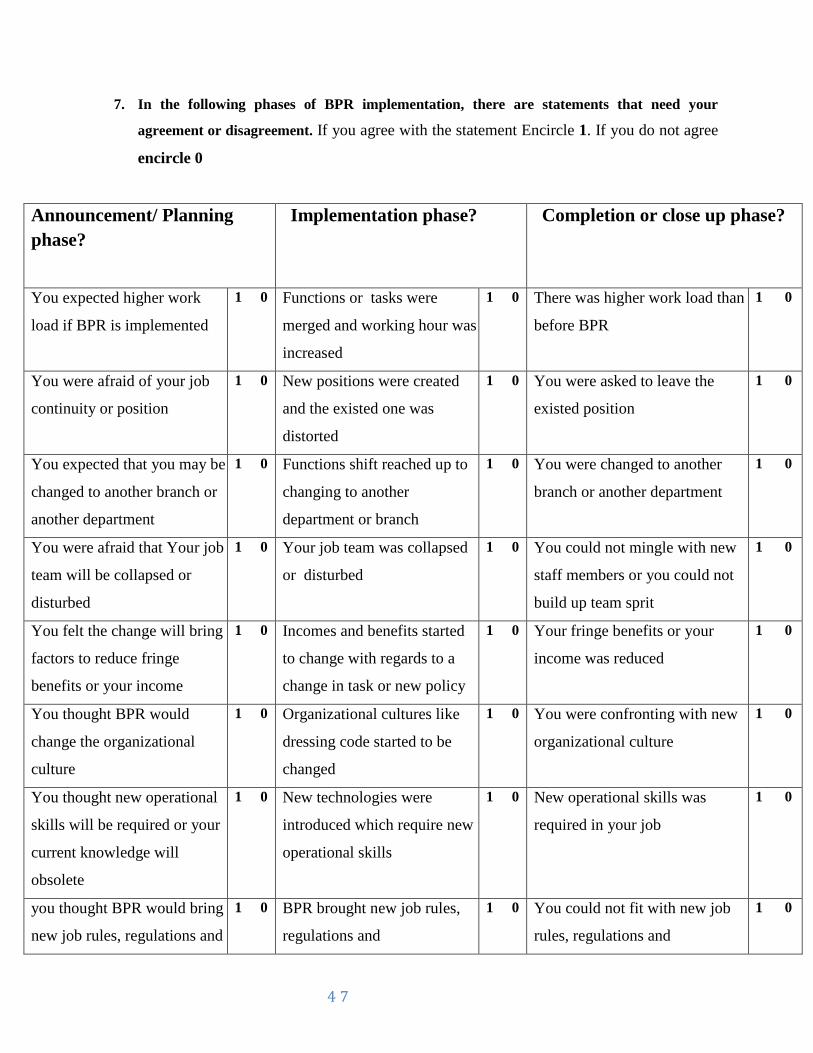
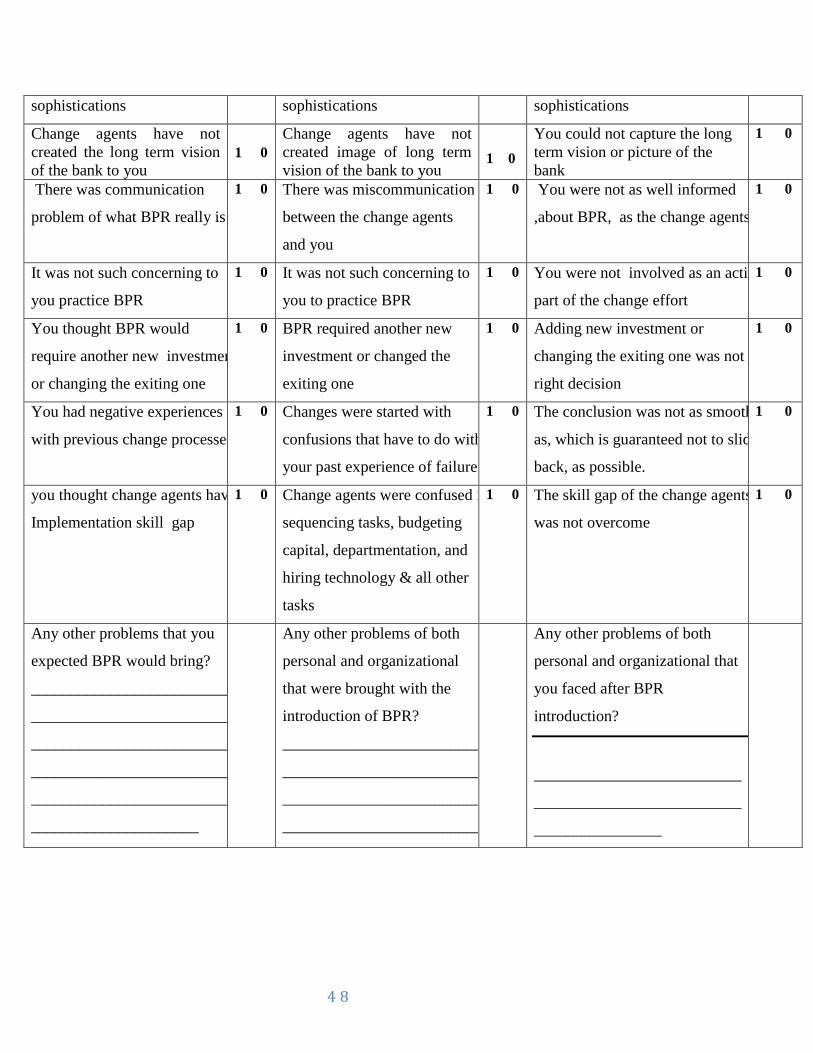
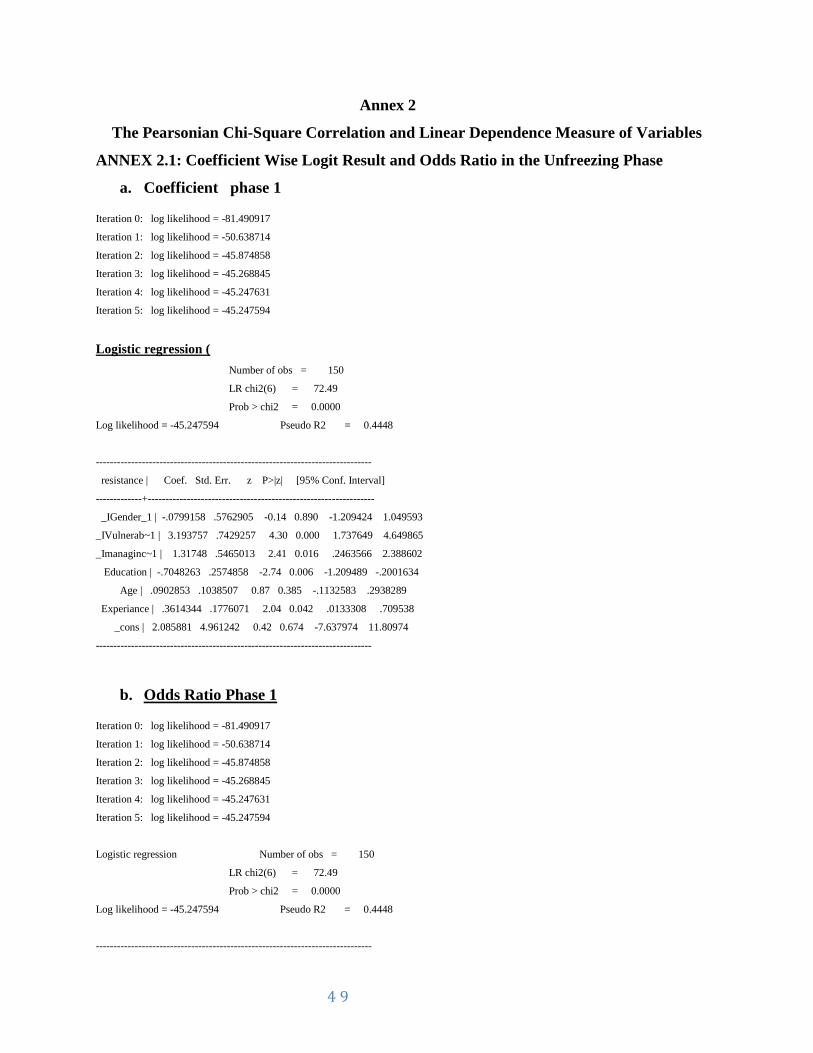
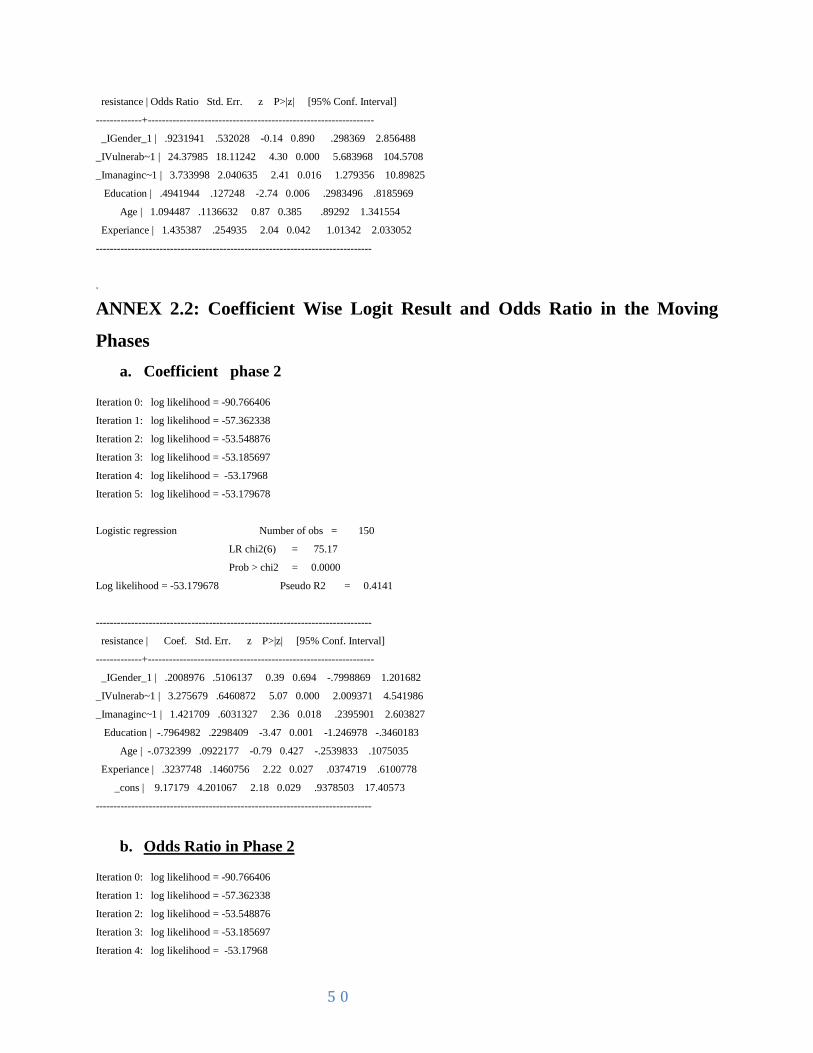
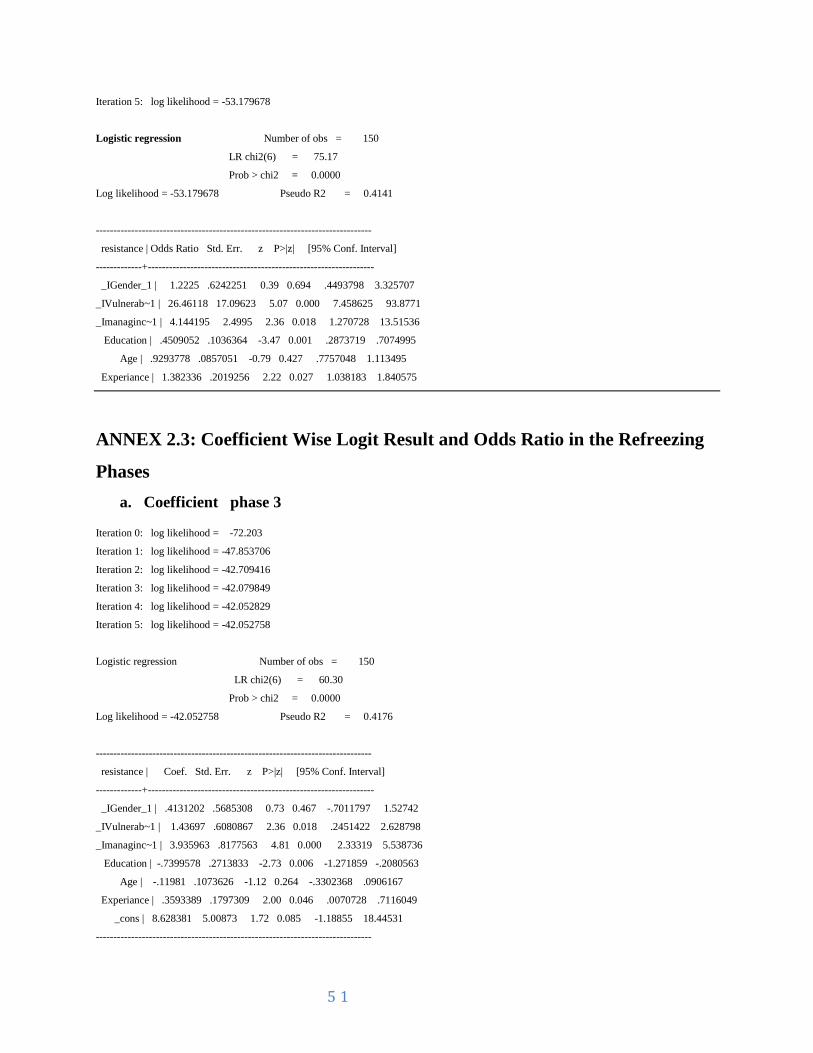
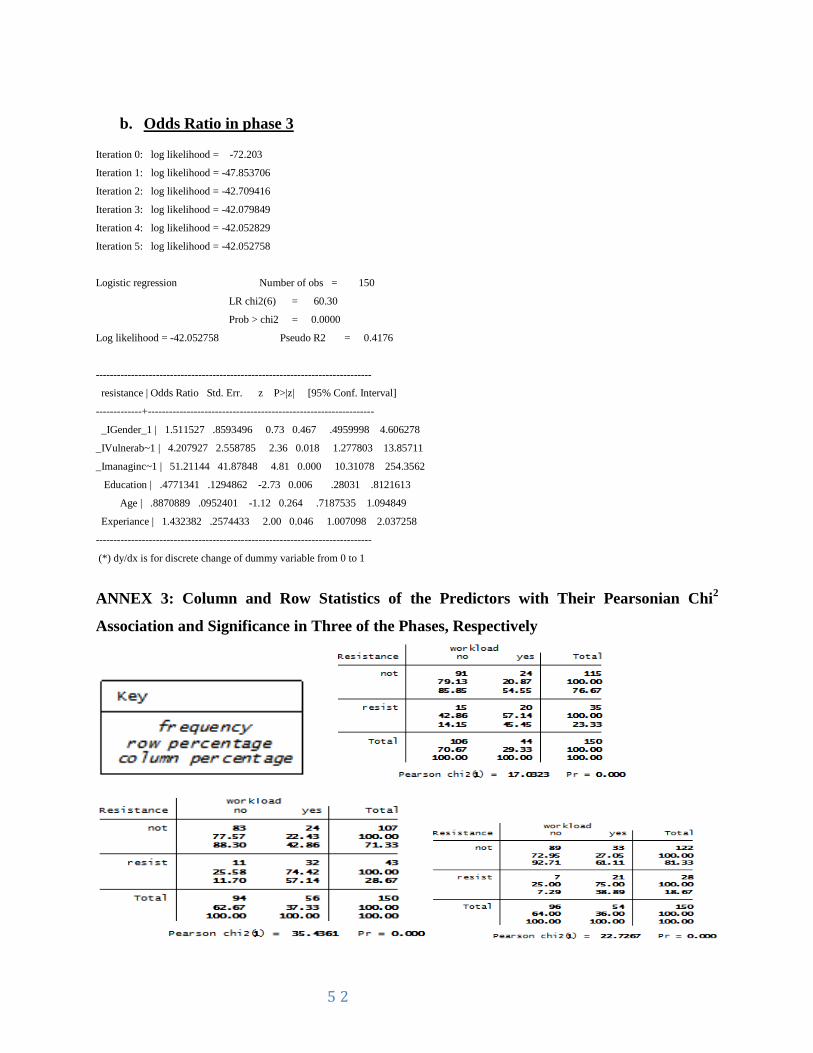
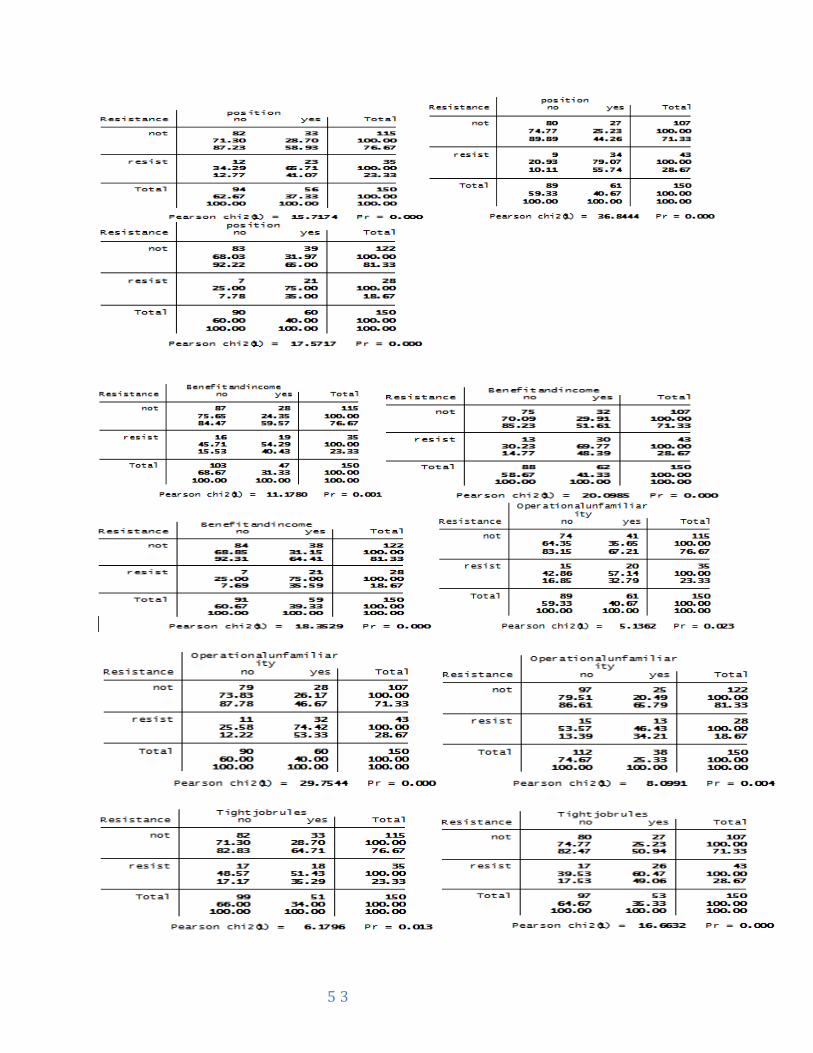
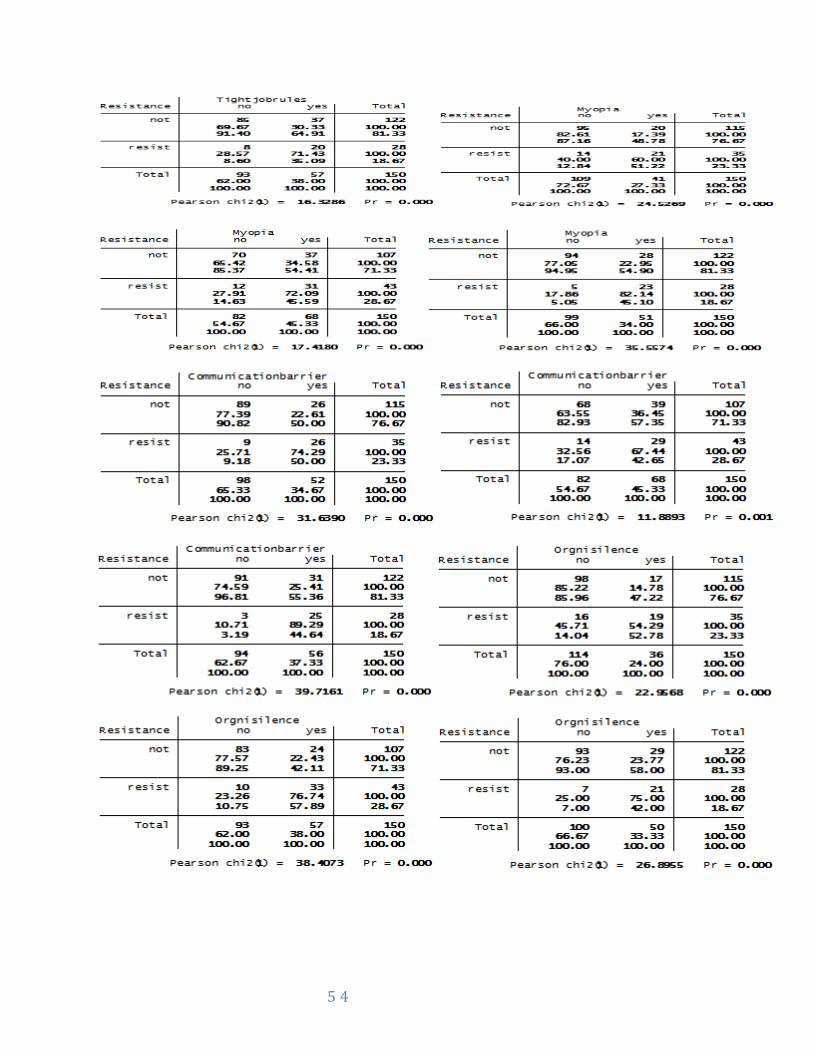
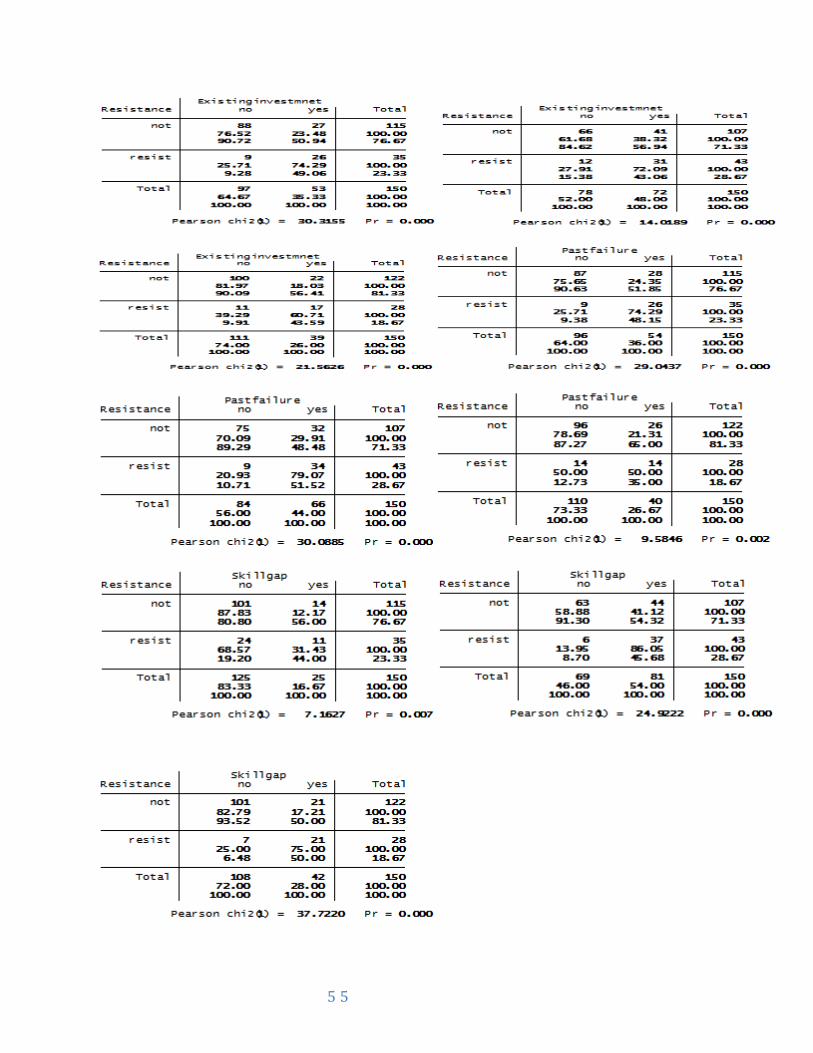
5 7
19 Mehal Ketema Branch
20 Meskel Square Branch
21 Nifas silk Branch
22 Selassie Branch Arat
23 Sengatera Branch
24 Sheger Branch
25 Shiro Meda
26 Tekle Haimanot Branch
27 Tewodros Branch
Related Documents


