JED No.214 October 2012 | 19 The Determinants of Customer Satisfaction with Damco Supply Chain Management Service VÕ THỊ QUÝ Doctor of Philosophy, University of Economics Hochiminh City Lecturer at CFVG - [email protected] NGUYỄN THỊ MAI THY MBA, Damco Supply Chain Service [email protected] ABSTRACT This quantitative research is conducted to identify factors influencing customer satisfaction in Damco Supply Chain Management Service. Data are collected by delivering survey questionnaires to customers currently using Damco Vietnam’s supply chain management service. The research resulted in seven dimensions for customer satisfaction – Tangibles, Reliability, Assurance, and Empathy, Perceived Price, Relationship Service and Relationship Quality spreading out in 21 measurement items. Being one of the leading service providers, Damco has been known by its standard service quality well beyond Vietnam market. However, throughout the economic downturn period several key customers restructured their supply chain and switched to other service providers, customer intimacy emerged as the most concerned issue. Figuring out factors driving customer satisfaction may help the company to build up a foundation of customers’ understanding and improve its service to enhance its customer satisfaction. Keywords: customer satisfaction, supply chain management, Vietnam

Welcome message from author
This document is posted to help you gain knowledge. Please leave a comment to let me know what you think about it! Share it to your friends and learn new things together.
Transcript
JED No.214 October 2012 | 19
The Determinants of Customer Satisfaction with
Damco Supply Chain Management Service
VÕ THỊ QUÝ
Doctor of Philosophy, University of Economics Hochiminh City
Lecturer at CFVG - [email protected]
NGUYỄN THỊ MAI THY
MBA, Damco Supply Chain Service
ABSTRACT
This quantitative research is conducted to identify factors influencing customer
satisfaction in Damco Supply Chain Management Service. Data are collected by
delivering survey questionnaires to customers currently using Damco Vietnam’s
supply chain management service. The research resulted in seven dimensions for
customer satisfaction – Tangibles, Reliability, Assurance, and Empathy, Perceived
Price, Relationship Service and Relationship Quality spreading out in 21 measurement
items. Being one of the leading service providers, Damco has been known by its
standard service quality well beyond Vietnam market. However, throughout the
economic downturn period several key customers restructured their supply chain and
switched to other service providers, customer intimacy emerged as the most concerned
issue. Figuring out factors driving customer satisfaction may help the company to
build up a foundation of customers’ understanding and improve its service to enhance
its customer satisfaction.
Keywords: customer satisfaction, supply chain management, Vietnam
20 | Võ Thị Quý The Determinants of Customer Satisfaction
1. INTRODUCTION
Vietnam has seen a robust economic recovery after being adversely impacted by the
2008global financial crisis. In spite of fluctuations in foreign exchange rate and gold
markets, as well as a double-digital inflation rate, GDP for the first time surpassed
US$100 billion in 2010 (http://thuongmai.vn). Both GDP and export growth were far
beyond forecast and expectations (respectively 6.78% and 25.5% -
http://www.gso.gov.vn). Within this context, logistics market in general and supply
chain management service in particular is not left behind. Michael Porter suggested to
strategically position HCMC as a logistics center in the first Vietnam Competitiveness
Report in 2011 and the field was identified as the main focus in 2010 ASEAN Summit.
An intensive investment in logistics infrastructure system and information technology
has been continuously carried out from both government and leading service providers
like Schenker, Damco, Agility, UPS. More than 20% of yearly growth rate
(http://www.sggp.org.vn) is really an achievement, and it was estimated to continue
that pace in the future. In such a dynamic and promising environment, customer
retention and satisfaction is one of the bottom-line strategies to which every business
has been giving priority. Customer satisfaction has been proved to be a key driver for
long-term profitability, shareholder value and sustainability of a business. Thus,
enhancing customer satisfaction has now become a mission of Damco supply chain
management service.
2. RESEARCH PROBLEM STATEMENT
From 2009 Damco Supply Chain Service (DSCS, or Damco for short) has designed
the customer satisfaction survey and conducted annually to evaluate Damco supply
chain management performance in terms of customer service quality, process
efficiency and system functionality. The customer satisfaction results varied across all
criteria. Customer service quality and document timeliness/accuracy had 98% and 95%
customer satisfaction. Less than 95% of customers were satisfied with invoicing
process and system. Less than 90% of customers were happy with counter service. In
general, it achieved 94.6% customer satisfaction, and 0.4% under the target (at least
95% level of customer satisfaction across all three criteria). Therefore, a question was
raised, “what are the factors influencing the customer satisfaction?” The answer could
provide a foundation of customers’ understanding for further analysis of customer
satisfaction for Damco.
JED No.214 October 2012 | 21
Being one of the leading service providers, Damco has been well known by its
standard service quality well beyond Vietnam market. However, throughout the
economic downturn period, when several key customers restructured their supply chain
and switched to other service providers, customer intimacy emerged as the most
concerned issue. Furthermore, side-by-side competition from international groups and
the agility of local players have posed more pressure than ever before on the
company’s strategy on how to retain and extend its customer base. And as the starting
point on the way to gain sustainable customer loyalty, insight into customer
satisfaction should be the first issue in the agenda. Figuring out customer expectations
toward the service, how customers perceive and evaluate Damco’s service and what
are service quality factors driving customer satisfaction will help the company to build
a foundation of customers’ understanding and from there position its service to better
satisfy the customers. Therefore, the research was conducted to identify elements
influencing customer satisfaction and recommend measures to enhance customer
satisfaction level of Damco supply chain management service.
3. OVERVIEW OF DAMCO VIETNAM AND SUPPLY CHAIN
MANAGEMENT SERVICE
Damco Vietnam, as a part of A.P. Moller – Maersk Group (APMM) and previously
named Maersk Logistics, is one of the largest third party logistics service providers in
Vietnam specializing in international supply chain management, freight forwarding
services, and domestic warehousing and distribution. Being present in Vietnam since
1995, today it operates in six main distribution centers/warehouses nationwide with
total area of 40,000sqm and employs over 400 workers. So far its customer base has
developed to about 1,000 local shippers and more than 200 global customers. Supply
chain management is one of Damco’s core products, accounting for 70% of the whole
business revenue, equivalent to about 95,000 twenty-foot equivalent units (TEU) of
export and import cargo annually (Damco Internal Reports 2011).
In general, supply chain management is the management of all movement and
storage of raw materials, work-in-process inventory, and finished goods from point of
origin to point of consumption. At Damco, the service is specifically offered to both
domestic and oversea cargo flows, where the supply chain might cover local areas or
span from domestic origin to overseas destination for consumption through sea
transportation. In details, the service starts from a document called Standard Operating
22 | Võ Thị Quý The Determinants of Customer Satisfaction
Procedure (SOP). As a bottom line of the supply chain management service, SOP is an
agreement between Damco and a specific customer, clearly stating the service scope
and activities mutually signed off. Thus the service could be customized to satisfy
individual customer’s requirements and demands.
The whole process then follow from purchase order level. Customer can send
(upload) purchase order details to Damco operation system, then Damco will have
visibility of all purchase order information like supplier details, quantity, destination,
and expected cargo delivery time, etc. Upon receipt of supplier’s booking, Damco will
verify with the uploaded purchase order and manage the discrepancy if any (called
exception handling) according to respective SOP. Then it comes to the consolidation
step, where accepted cargos can be consolidated at Damco warehouse. Damco will
arrange the transportation to make sure that cargo could be delivered to customer at the
requested time. This involves in doing customs house brokerage, coordination with
carriers, shipping documents handling. All the shipment milestones are recorded in the
operation system and transferred to customer and other parties per agreed timeline in
SOP. Both cargo flows and information flows are monitored to ensure customer is
updated of the shipment latest status in real time. Any deviation or ad-hoc incident will
be informed immediately to customer via Online Communication Tool (OCT) – a
communication channel specifically built for correspondence between customer and
Damco.
Being a value added service in supply chain management, Damco is responsible to
manage suppliers/carriers on a range of specific criteria. Key Performance Index (KPI)
will be set up, maintained and reported to customer as required. Supply chain
development and consultancy is considered as a high level of supply chain
management service. Depending on customer’s demand, SOP will be reviewed at least
twice a year to seek for possibility of development and improvement in the customer
supply chain system.
4. LITERATURE REVIEW
- Definition of customer satisfaction
Zineldin (2000) and Oliver 1999 defined satisfaction as an emotional reaction to the
difference between what customers anticipate and what they receive, regarding the
fulfillment of some need, goal or desire. Kotler (2001) elaborated more, the customers
JED No.214 October 2012 | 23
will be dissatisfied when they perceive that a product or service performance falls short
of their expectations; they are satisfied if the performance and their expectations match
with each other; when the performance exceeds what customers expect, they become
highly satisfied or delighted.
- Service quality and customer satisfaction
There are many conceptualizations of service quality. According to Zeithaml (1988)
and Parasuraman et al. (1988), service quality is defined as a form of attitude – a long-
run overall evaluation. Perceived service quality portrays a general and overall
appraisal of service (Sureshchandar et al., 2002). Lehtinen & Lehtinen (1982) assumed
that service quality included process quality and output quality while similarly,
Gronroos (1984) looked at service quality from two angles – technical quality (output
quality) and functional quality (process quality). Parasuraman et al. (1988), Juwaheer
and Ross (2003), and Walker et al. (2006) pointed out the main service quality aspects
as tangibles, reliability, responsiveness, assurance and empathy, in which:
+ Tangibles could be understood as appearance or physical elements of a service.
They might be either modern equipment or visually appealing facilities and premises.
Customer service employees who have a neat and professional appearance/uniform
contribute to the Tangibles aspect. Tangibles are also all visually appealing materials
and products associated with the service.
+ Reliability refers to the capability of a service provider to deliver the promised
service accurately and dependably. This reflects how trustworthy the business is in
service delivery, whether it provides the service as promised – in terms of good and
right quality, at the right time and in the right way. It also shows the business
dependability in handling customer service problems and maintaining error-free
records.
+ Responsiveness is the willingness of service provider to provide service quickly
and accurately. It is to proactively keep customers notified of when the service will be
performed. Beyond than that, how fast the business is in responding to customers’
requests to provide the prompt service and how flexible it is to help customers with
optimal solution for ad-hoc problems.
+ Assurance is defined as credibility, competence and security in delivering
services. Customer service employees play a key role here to assure customers about
the service to be delivered. With their profound knowledge and professional attitude,
24 | Võ Thị Quý The Determinants of Customer Satisfaction
they can make customers feel safe and confident during the transaction, showing their
courtesy and wise consultancy to customers. This is the expectation from any business
in all service industries to maintain the best assurance attribute in service quality.
+ Empathy is the customer needs of caring, attention and understanding along with
the service delivered by the service provider. One obvious example of empathy is
convenient working hours and easy access to customer service employees and facilities
whenever customers need. Again, customer service employees are the main players to
deliver this concept, including but not limit to give customers individual attention,
have thorough understanding of customer requirements, give the first priority to
customers interests, deal with customers in a caring fashion and customize the service
to their various demands.
Many research findings indicated a significant impact of service quality on
customer satisfaction, such as Gronroos (1984), Parasuraman et al. (1988), and Walker
et al. (2006). If a service possesses perceived value which meets or goes beyond
customer needs, that service is said to meet or exceed customer satisfaction
(Parasuraman et al., 1988; Foster, 2004; Walker et al., 2006). Bitner (1990) studied
145 tourists and discovered that service quality is an anticipant of customer
satisfaction. Doing personal interviews of 80 customers of an audit firm, Caruana et al.
(2000) revealed a positive correlation of service quality and perceived value and
customer satisfaction. Eggert and Ulaga (2002) researched on 301 employees in US
organizations and found that well performing service quality dimensions (i.e. tangibles,
reliability, responsiveness, assurance and empathy) increased perceived value about
the quality features leading to higher satisfaction.
- Price and customer satisfaction
Anderson, Fornell and Lehmann (1994) did highlight perceived price as one critical
factor of customer satisfaction, while Zeithaml and Bitner (1996) proved that the
customer satisfaction was not only linked with service quality assessment but also
subject to several factors, such as quality of related products, price, situation, and
personal attributes. It was also noted by Lee and Cunningham (1996) that service
quality alone was not a sufficient condition to obtain customer satisfaction and
establish customer loyalty because customers were always conscious of cost/benefit
trade-off relationships. In general, the lower the perceived price is, the more customers
are satisfied with the product/service price and the whole transaction (Zeithaml, 1988).
JED No.214 October 2012 | 25
On the other side, Oliver (1997) argued that customers usually judged price and service
quality by the concept of equity, then generated their satisfaction or dissatisfaction
level, therefore, a lower monetary price or perceived price does not guarantee higher
satisfaction.
- Relationship service, relationship quality and customer satisfaction
Good relationship service is a prerequisite for maintaining the customer
relationship. It “covers all sequences of service provision, i.e. service actions that take
place before, during and after a purchase” (wikipedia.org). It also can be defined as a
range of activities to enhance customer satisfaction level (Turban, 2002). Peck (1997)
identified certain activities of relationship service like personalized support,
responsiveness, speaking to appropriate people, follow-up after a sale, knowledge of
the customer's business, product knowledge, and new product information.
Relationship quality, on the other side, has been understood generally as the overall
depth and climate of a relationship (Johnson, 1999). According to Levitt (1986) it is a
bundle of intangible values which augment products or services and result in an
expected interchange between buyers and sellers. In other words, relationship quality
refers to a consumer’s perceptions of how well the whole relationship fulfills the
expectations, predictions, goals and desires the consumer has concerning the whole
relationship (Jarvelin and Lehtinen, 1996). Henning-Thurau and Klee (1997) defined
relationship quality between consumers and service providers as the degree of
appropriateness of a relationship to fulfill the needs of the customer associated with the
relationship. Gummesson (1987) saw relationship quality in two dimensions -
professional relations and social relations. Dwyer, Schurr, and Oh (1987) and Crosby,
Evans, and Cowles (1990) mentioned trust and relationship satisfaction as two
indicators of relationship quality and Henning-Thurau and Kelley (1998) further
argued to add relationship commitment as another dimension.
Storbacka et al. (1994) noticed that a satisfactory customer holds a strong
relationship with the business, resulting in relationship longevity, i.e. the length of a
relationship. Relationship longevity with customers is considered an important
indicator of efficiency and profitability performance of a business, and above all, it is
an implication of customer satisfaction and loyalty. Griffin (1995) pointed out that
building a lasting relationship is the bottom line as customers are keen to be satisfied
and even become loyal once they have developed a “personal relationship” with
26 | Võ Thị Quý The Determinants of Customer Satisfaction
customer service employee. This relationship can be symbiotic and beneficial for both
the customer and the supplier.
Relationship service, through effective interactions with customers, also helps
enhance customer satisfaction. Such interactions assist the business to find out what
are customers’ real needs and demands then reduce the risk of misunderstanding
customers. There are many scenarios that dissatisfaction originates from the fact that
the business does not tell correctly what is important to the customers. Thoroughly
understanding customer expectations is the first step reaching customer satisfaction,
and the best way to do is through mutual interactions.
It is more than critical to reinforce excellent relationships with existing customers,
which requires enormous effort and creativity in such a competitive market nowadays.
Smith (1999) strongly indicated that a good relationship through frequent interactions
with customers is essential to increase sales, retain customers and keep them
continuously satisfied.
5. RESEARCH MODEL AND RESEARCH DEVELOPMENT
a. Customer Satisfaction Model:
Customer satisfaction theories and previous research findings proved that customer
satisfaction has a close relationship with different factors, from service quality, service
attributes to service price. Customer relationship has been also taken into consideration
as one factor affecting customer satisfaction. Parasuraman et al. (1988), Gronroos
(1984), Walker et al. (2006) and Sureshchandar et al. (2002) all agreed that service
quality possesses a strong association with customer satisfaction. Perceived price has
been affirmed as one critical driver of customer satisfaction by Anderson, Fornell and
Lehmann (1994), Zeithaml and Bitner (1996) and Lee and Cunningham (1996).
Generally speaking, customers become more satisfied with lower price they perceive.
A strong relationship service and good relationship quality contribute to high customer
satisfaction level according to Griffin (1995), Smith (1999) and Storbacka et al.
(1994). They help boost customer satisfaction in the way to deepen customer intimacy,
gain insight into customer expectations and retain existing customers with the business.
Given aforementioned factors driving customer satisfaction, the dimensions of
service quality with five attributes of tangible, reliability, responsiveness, assurance
and empathy; perceived price; relationship service and relationship quality were
JED No.214 October 2012 | 27
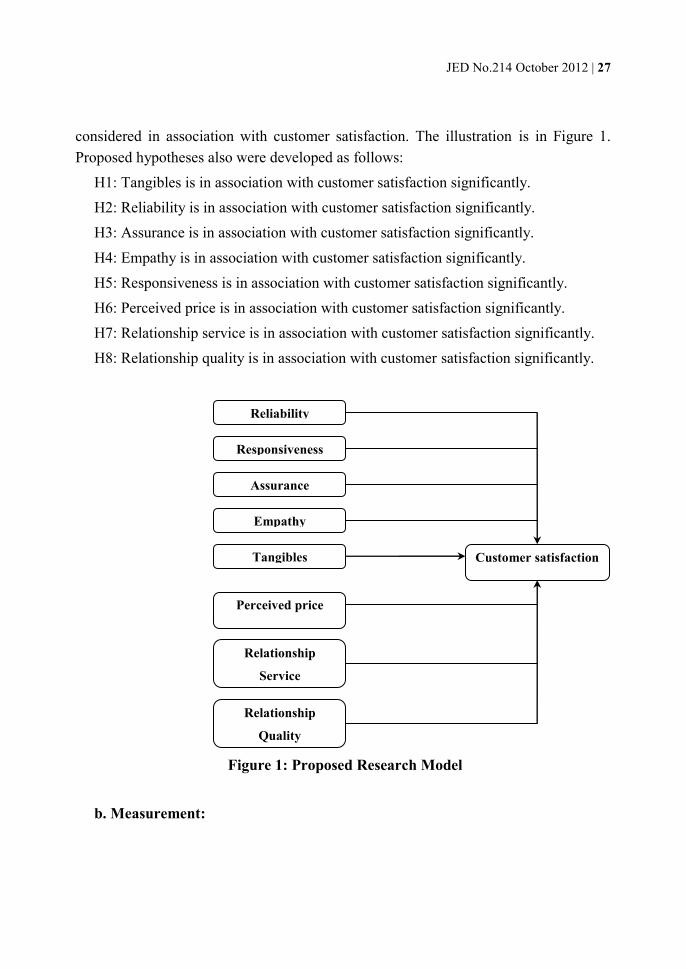
considered in association with customer satisfaction. The illustration is in Figure 1.
Proposed hypotheses also were developed as follows:
H1: Tangibles is in association with customer satisfaction significantly.
H2: Reliability is in association with customer satisfaction significantly.
H3: Assurance is in association with customer satisfaction significantly.
H4: Empathy is in association with customer satisfaction significantly.
H5: Responsiveness is in association with customer satisfaction significantly.
H6: Perceived price is in association with customer satisfaction significantly.
H7: Relationship service is in association with customer satisfaction significantly.
H8: Relationship quality is in association with customer satisfaction significantly.
Figure 1: Proposed Research Model
b. Measurement:
Customer satisfaction
Reliability
Assurance
Perceived price
Responsiveness
Empathy
Tangibles
Relationship
Service
Relationship
Quality
28 | Võ Thị Quý The Determinants of Customer Satisfaction
In-depth interviews were carried out and resulted in 25 items and measured on five-
point Likert scales from one (strongly disagree) to five (strongly agree). In order to
validate the measurement scale reliability, the questionnaire firstly was sent to 30
selected customers via email as a pilot test. Then reliability analysis was performed to
limit the irrelevant parameters, from there the questionnaire would be modified
accordingly for the official survey.
Tangibles dimension has four items with Corrected Item-Total Correlation above
0.3 and total alpha of 0.715, thus passes reliability test. Upon testing Responsiveness
attribute alone, its two items were not correlated. But when mixing with Reliability
dimension, it has found a positive average covariance among all items, except item
RES1 with Corrected Item-Total Correlation below 0.3. Therefore, it is decided to
leave out item RES1 and incorporate dimension Responsiveness into Reliability with
Cronbach’s alpha of 0.782 for five items. All three Assurance items have Corrected
Item-Total Correlation over 0.3 and total alpha of 0.700. They were kept in the
measurement scale for official survey. Cronbach’s alpha of Empathy dimension meet
the test’s requirement at 0.634 while all three items have Corrected Item-Total
Correlation more than 0.3. We have the same result for Perceived Price attribute –
total alpha is 0.719 and Corrected Item-Total Correlation of three items is all beyond
0.3. As for Relationship Service and Relationship Quality, total alpha are 0.833 and
0.896 respectively, all Corrected Item-Total Correlation are over 0.3.
From the Reliability test results, the measurement scale was modified with seven
dimensions Tangibles, Reliability, Assurance, Empathy, Perceived Price, Relationship
Service and Relationship Quality as follows:
Table 1: Measurement Scale
No. Code Items
TANGIBLES
1 TAN1 Counter design is convenient and supporting customers’ pick-up
of document.
2 TAN2 The Damco E-booking system (M*Power Shipper) is user-
friendly.
3 TAN3 It is easy to use Damco E-document system.
4 TAN4 Damco website can provide full visibility of customers’
JED No.214 October 2012 | 29
shipments.
RELIABILITY
5 RES2 I always receive timely guidance and support in case I have
problem with the shipments.
6 REL1 Damco staff always provides clear, accurate and timely feedback
to your questions or requests related to shipping procedure.
7 REL2 I trust Damco to provide timely and accurate documents.
8 REL3 Shipments are arranged/delivered in timely manner.
9 REL4 I receive draft Invoice for verification timely and accurately.
ASSURANCE
10 ASS1 Damco has flexible policies for special/ad-hoc requests from
customers.
11 ASS2 Damco staff demonstrates the required skills and knowledge
when attending to ad-hoc services/requests.
12 ASS3 Damco staff handles customers on phone politely and
professionally.
EMPATHY
13 EMP1 Damco staff is willing to handle my ad-hoc request/query after
working hours.
14 EMP2
Damco staff always notifies and informs customers of any issues
occurred with their shipments (delayed departure, late arrival,
etc.)
15 EMP3
Damco staff proactively keeps you informed of all changes
related to shipment process such as new requirements, contact
points, timeline etc.
PERCEIVED PRICE
16 PRI1 Damco offers competitive price for basic services.
17 PRI2 Damco's rates of additional services are reasonable.
18 PRI3 One-off requests are charged with reasonable offers.
RELATIONSHIP SERVICE
30 | Võ Thị Quý The Determinants of Customer Satisfaction
19 RELSER1 Damco staff keeps frequent contact with customers via meeting,
visit, workshop, etc.
20 RELSER2 In the event of complaint, I am satisfied with how Damco staff
handles it.
21 RELSER3 Damco takes into consideration my comments and give prompt
feedback and/or take proper action.
RELATIONSHIP QUALITY
22 RELQUA1 Damco staff has good understanding of customers' needs and
demands.
23 RELQUA2 Damco keeps constant care about customers' best interests.
24 RELQUA3 Damco appears to be a trustworthy partner.
c. Data Collection and Analysis:
Respondent profile
The customers in this report are defined as all customers currently using Damco
Vietnam’s supply chain management service. The customer database is frequently
updated with the active customers with repeated transactions and stable volume
throughout the year. Survey sample was taken from the 2010 customer list of 300
customers. With an effort to obtain reliable and objective responses, the respondents
have been picked up from various industries like retail, footwear, apparel, jewelry and
accessories, furniture and hardware and different seniority of business relationship
with Damco (less than one year, from one to three years, three to five years and longer
than five years).
Table 2: Profile of the Survey Respondents
Relationship
duration
Industry
Less than 1
year 1-3 years 3-5 years
More than 5
years Total
Retail 3 5 10 6 24
Footwear 6 10 9 11 36
Apparel 0 4 8 8 20
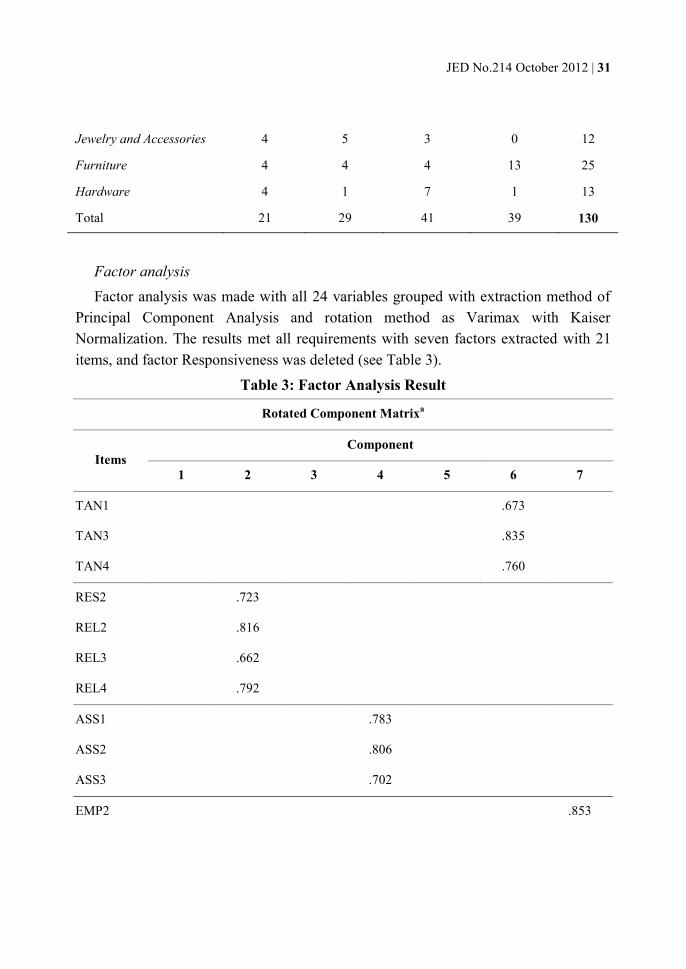
JED No.214 October 2012 | 31
Jewelry and Accessories 4 5 3 0 12
Furniture 4 4 4 13 25
Hardware 4 1 7 1 13
Total 21 29 41 39 130
Factor analysis
Factor analysis was made with all 24 variables grouped with extraction method of
Principal Component Analysis and rotation method as Varimax with Kaiser
Normalization. The results met all requirements with seven factors extracted with 21
items, and factor Responsiveness was deleted (see Table 3).
Table 3: Factor Analysis Result
Rotated Component Matrixa
Items
Component
1 2 3 4 5 6 7
TAN1 .673
TAN3 .835
TAN4 .760
RES2 .723
REL2 .816
REL3 .662
REL4 .792
ASS1 .783
ASS2 .806
ASS3 .702
EMP2 .853
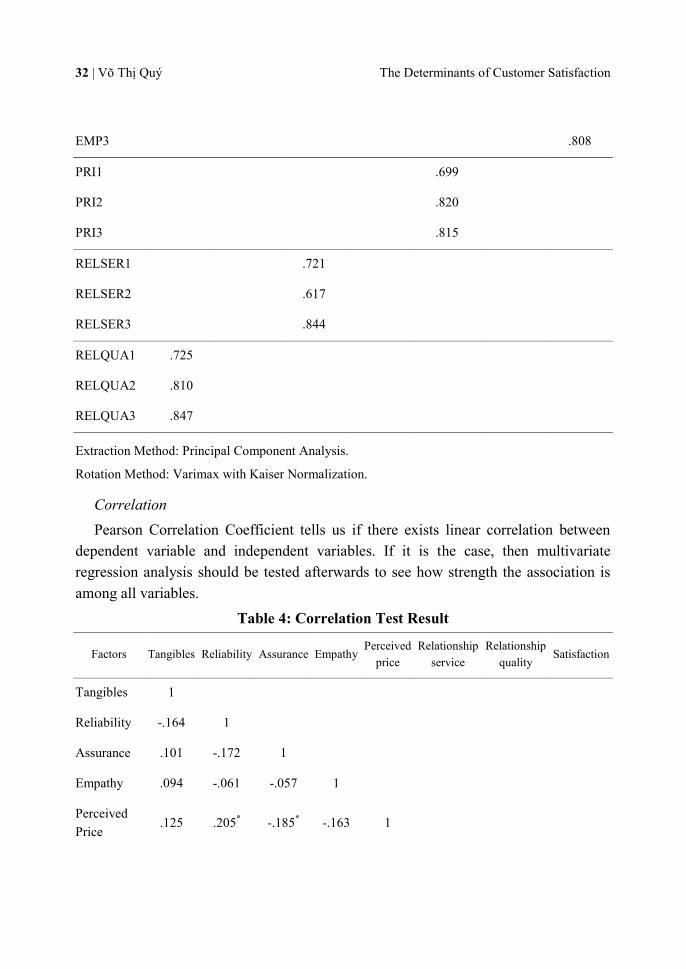
32 | Võ Thị Quý The Determinants of Customer Satisfaction
EMP3 .808
PRI1 .699
PRI2 .820
PRI3 .815
RELSER1 .721
RELSER2 .617
RELSER3 .844
RELQUA1 .725
RELQUA2 .810
RELQUA3 .847
Extraction Method: Principal Component Analysis.
Rotation Method: Varimax with Kaiser Normalization.
Correlation
Pearson Correlation Coefficient tells us if there exists linear correlation between
dependent variable and independent variables. If it is the case, then multivariate
regression analysis should be tested afterwards to see how strength the association is
among all variables.
Table 4: Correlation Test Result
Factors Tangibles Reliability Assurance Empathy Perceived
price
Relationship
service
Relationship
quality Satisfaction
Tangibles 1
Reliability -.164 1
Assurance .101 -.172 1
Empathy .094 -.061 -.057 1
Perceived
Price .125 .205
* -.185
* -.163 1
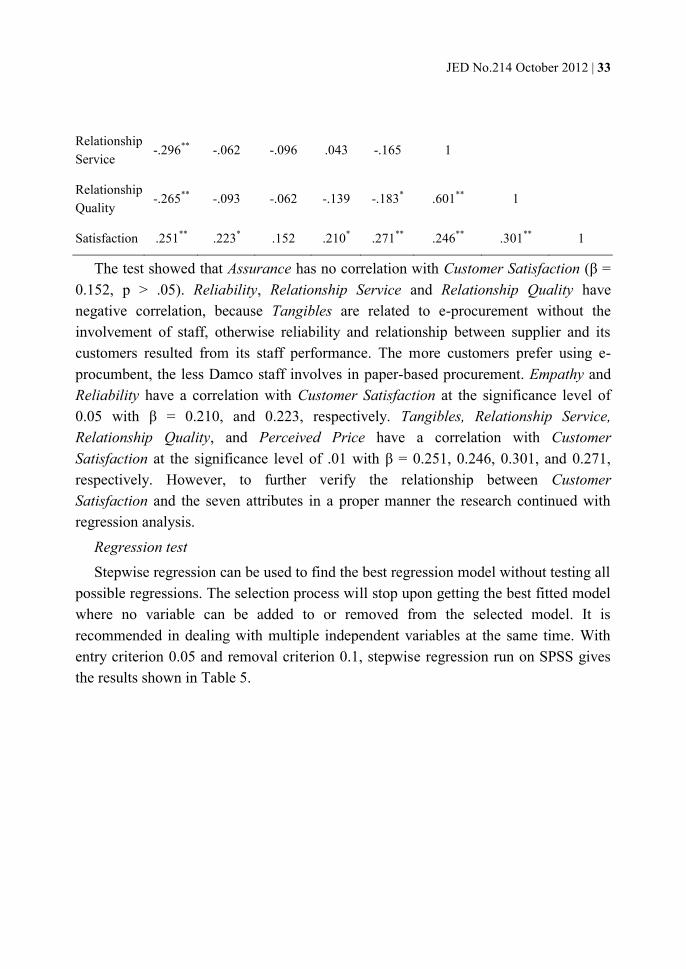
JED No.214 October 2012 | 33
Relationship
Service -.296
** -.062 -.096 .043 -.165 1
Relationship
Quality -.265
** -.093 -.062 -.139 -.183
* .601
** 1
Satisfaction .251**
.223* .152 .210
* .271
** .246
** .301
** 1
The test showed that Assurance has no correlation with Customer Satisfaction (β =
0.152, p > .05). Reliability, Relationship Service and Relationship Quality have
negative correlation, because Tangibles are related to e-procurement without the
involvement of staff, otherwise reliability and relationship between supplier and its
customers resulted from its staff performance. The more customers prefer using e-
procumbent, the less Damco staff involves in paper-based procurement. Empathy and
Reliability have a correlation with Customer Satisfaction at the significance level of
0.05 with β = 0.210, and 0.223, respectively. Tangibles, Relationship Service,
Relationship Quality, and Perceived Price have a correlation with Customer
Satisfaction at the significance level of .01 with β = 0.251, 0.246, 0.301, and 0.271,
respectively. However, to further verify the relationship between Customer
Satisfaction and the seven attributes in a proper manner the research continued with
regression analysis.
Regression test
Stepwise regression can be used to find the best regression model without testing all
possible regressions. The selection process will stop upon getting the best fitted model
where no variable can be added to or removed from the selected model. It is
recommended in dealing with multiple independent variables at the same time. With
entry criterion 0.05 and removal criterion 0.1, stepwise regression run on SPSS gives
the results shown in Table 5.
34 | Võ Thị Quý The Determinants of Customer Satisfaction
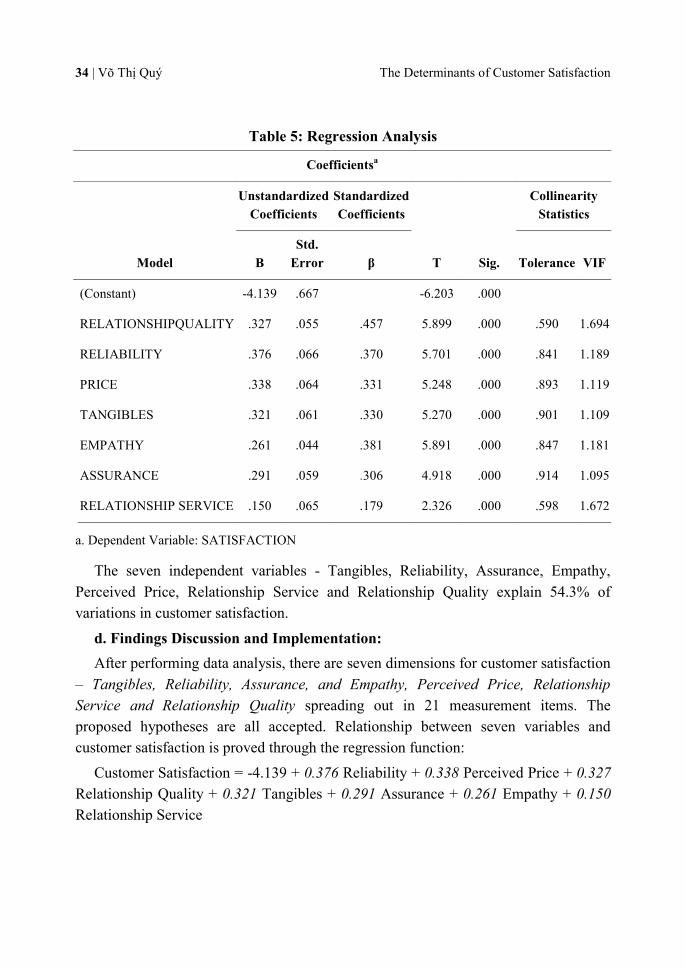
Table 5: Regression Analysis
Coefficientsa
Model
Unstandardized
Coefficients
Standardized
Coefficients
T Sig.
Collinearity
Statistics
B
Std.
Error β Tolerance VIF
(Constant) -4.139 .667 -6.203 .000
RELATIONSHIPQUALITY .327 .055 .457 5.899 .000 .590 1.694
RELIABILITY .376 .066 .370 5.701 .000 .841 1.189
PRICE .338 .064 .331 5.248 .000 .893 1.119
TANGIBLES .321 .061 .330 5.270 .000 .901 1.109
EMPATHY .261 .044 .381 5.891 .000 .847 1.181
ASSURANCE .291 .059 .306 4.918 .000 .914 1.095
RELATIONSHIP SERVICE .150 .065 .179 2.326 .000 .598 1.672
a. Dependent Variable: SATISFACTION
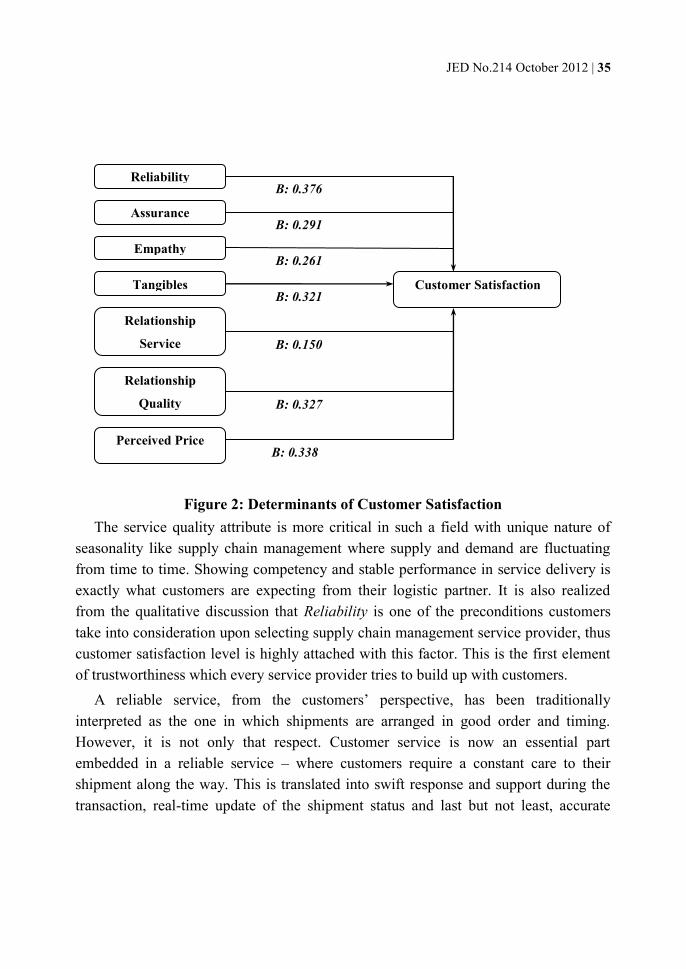
The seven independent variables - Tangibles, Reliability, Assurance, Empathy,
Perceived Price, Relationship Service and Relationship Quality explain 54.3% of
variations in customer satisfaction.
d. Findings Discussion and Implementation:
After performing data analysis, there are seven dimensions for customer satisfaction
– Tangibles, Reliability, Assurance, and Empathy, Perceived Price, Relationship
Service and Relationship Quality spreading out in 21 measurement items. The
proposed hypotheses are all accepted. Relationship between seven variables and
customer satisfaction is proved through the regression function:
Customer Satisfaction = -4.139 + 0.376 Reliability + 0.338 Perceived Price + 0.327
Relationship Quality + 0.321 Tangibles + 0.291 Assurance + 0.261 Empathy + 0.150
Relationship Service
JED No.214 October 2012 | 35
Figure 2: Determinants of Customer Satisfaction
The service quality attribute is more critical in such a field with unique nature of
seasonality like supply chain management where supply and demand are fluctuating
from time to time. Showing competency and stable performance in service delivery is
exactly what customers are expecting from their logistic partner. It is also realized
from the qualitative discussion that Reliability is one of the preconditions customers
take into consideration upon selecting supply chain management service provider, thus
customer satisfaction level is highly attached with this factor. This is the first element
of trustworthiness which every service provider tries to build up with customers.
A reliable service, from the customers’ perspective, has been traditionally
interpreted as the one in which shipments are arranged in good order and timing.
However, it is not only that respect. Customer service is now an essential part
embedded in a reliable service – where customers require a constant care to their
shipment along the way. This is translated into swift response and support during the
transaction, real-time update of the shipment status and last but not least, accurate
B: 0.338
B: 0.327
B: 0.150
B: 0.321
B: 0.291
B: 0.261
B: 0.376
Customer Satisfaction
Assurance
Reliability
Empathy
Tangibles
Relationship
Service
Perceived Price
Relationship
Quality
36 | Võ Thị Quý The Determinants of Customer Satisfaction
related documentation. Failing to take note of such requirements will definitely worsen
customer satisfaction.
Most of our local customers are of middle and small size companies, which are
known of high price consciousness. Additionally, logistics costs in general and supply
chain management costs in particular take a considerable share of a business’ total
expenditure, especially when the supply chain covers several geographical areas. In the
current context where inflation has reached two digital levels, cost cutting is always
put as top priority of every business. That is to say customers will seek for balance
between a quality service and a reasonable quotation. It’s not only the service price to
be mentioned, perceived price here should be understood as customers’ perception on
the whole cost package of core service, additional service and one-off request in ad-
hoc situation.
Beside costs, the good relation between customers and the service provider also
plays a critical role in their satisfaction. It involves not only the service provider’s
activities to set up and reinforce relation with customers, but also the service provider’s
good understandings of customer needs. This is especially obvious in Vietnam
business-to-business environment, where local customers practically incline to do
business with ones they are acquainted to or have close relationship with. Hence
maintaining strong intimacy and association with customers will successfully build a
stable foundation for customer retention, customer satisfaction and most importantly,
customer loyalty.
While customers recognize Damco’s effort in complaint handling and listening to
customers, they expect more on customer intimacy and understanding from Damco’s
employees. Beyond that, customer care is also known as the act of thoroughly
considering customers’ best interests during the transaction and relationship. That is,
customers are at the center of all business-related decisions; and above all, high
relationship quality comes from the commitment and pro-activeness of the service
provider in maintaining the continuity of that relation throughout the time.
Tangibles here are considered as the physical part of a service, including facility,
equipment, system and the most particular one, Information Technology (IT) solution
offered to customers. It is commonly known that we cannot control what we do not
have visibility, and nowadays, when more and more stakeholders participate in the
supply chain which spans over more and more countries, the need of that visibility still
JED No.214 October 2012 | 37
remains a challenge. Thus the advantage comes with service providers who are able to
provide customers with transparency and traceability so that they can track back where
their shipment is around-the-clock, and become more satisfied with the
service/business. For Damco, counter activities and interaction systems are highlighted
as two aspects of tangibles. While counter activities involve counter related stuffs like
counter design, document release process, counter staff’s attitude and productivity,
interaction systems include all systems used as tools of communication between
Damco and customers throughout the transaction like e-booking, e-document, and
Damco website, etc. Both receive customers’ attention as they play an interactive role
with customers through daily operations. Once the counter activities are not efficient
enough or the systems are not working in a stable manner, direct impact on the service
transaction is unavoidable. Thus, customers express their concern regarding tangibles
attribute as one important and basic element of customer satisfaction.
Assurance and Empathy are the two determinants to customer satisfaction in the
model. While Assurance measures the professional and knowledge employees
demonstrate to customers, Empathy refers to their attitude and constant care of
customers during transaction. Both attributes are delivered by the employee, and
perceived by customers, at the same time of service delivery, through day-to-day
interaction between employees and customers. Needless to say, customer satisfaction
will be adversely impacted when employees neither show their dedication/qualification
nor deliver professional service. Not surprisingly, this is more than correct when it
comes to unexpected issues or ad-hoc problems by which customers resort to
employees’ consultancy and flexibility to help them iron those troubles. Showing
Empathy towards customers is also a part of building and maintaining positive
relationship with them.
The two factors have one common characteristic – strongly bounded by the
customer service employees’ quality. Whether it is competency and courtesy in service
delivery or flexibility in problem solving or pro-activeness and consistence in customer
care, it all relies on the customer service staff who demonstrates those to the customers
through daily transactions. Their credentials are more than valuable when mishap
occurs and service failure recovery is required.
38 | Võ Thị Quý The Determinants of Customer Satisfaction
Relationship Service also contributes to customer satisfaction level. As being all
activities and investments a company conducts to build up and strengthen relationship
with customers, this element reflects its strategy to come closer and closer to its
customers. Without proper relationship services being performed consistently, the
company cannot have strong and fruitful relationship with its customers. Throughout
the survey results, we can see that customers show their concern on how well and in
what way the company does all interactive activities with them. And once their
expectation is not met, their satisfaction level will be definitely undermined.
In conclusion, customer satisfaction has been a critical concept in both academic
literature and marketing practice. Especially in the present environment of fierce
competition and globalization, customer satisfaction has been drawing more attention
than ever. In that respect, the research has given the readers deeper insights into
customer satisfaction in supply chain management service field, one of the young and
dynamic services in logistic market in Vietnam.
The study has several limitations. First, the data may not satisfy the assumptions of
linear regression relationship. Second, there exists the autocorrelation between factors
in the model which can be observed by the relationship between factors “Assurance”
and “Customer Satisfaction.” These limitations may reduce the reliability of the
estimates in the model
References
Anderson, E.W., C. Fornell & D.R. Lehmann (1994), “Customer Satisfaction, Market Share and
Profitability: Findings from Sweden”, Journal of Marketing, Vol.58(2), pp.112–122.
Bitner, M.J. (1990), “Evaluating Service Encounters: The Effects of Physical Surroundings and
Employee Responses”, Journal of Marketing, Vol.2, pp.69-82.
Caruana, A., A.H. Money & P.R. Berthon (2000), “Service Quality and Satisfaction – The
Moderating Role of Value”, European Journal of Marketing, Vol.34(11), pp.1338-1352.
Damco Internal Reports (2011) from Damco internal resources.
Eggert, A. & W. Ulaga (2002), “Customer Perceived Value: A Substitute for Satisfaction in
Business Markets?”, Journal of Business & Industrial Marketing, Vol.17 (2), pp.107-118.
Farris, Paul W. et al. (2010), Marketing Metrics: The Definitive Guide to Measuring Marketing
Performance, Upper Saddle River, New Jersey, Pearson Education.
JED No.214 October 2012 | 39
Foster, S. T. (2004), Managing Quality: An Integrative Approach, Prentice Hall.
Gitman, L.J. & C.D. McDaniel (2005), The Future of Business: The Essentials. Mason, Ohio,
South-Western.
Gronroos, C. (1984), “A Service Quality Model and its Market Implications”, European Journal
of Marketing, Vol.18(4), pp.36-44.
Ittner, C.D. & D.F. Larcker (1998), “Are Non-Financial Measures Leading Indicators of
Financial Performance? An Analysis of Customer Satisfaction”, Journal of Accounting Research,
Vol.36(3), pp.1–35.
Juwaheer, T.D. & D. L. Ross (2003), “A Study of Guest Perceptions in Mauritius”, International
Journal of Hospitality Management, Vol.15(2), pp.105-115.
Kotler, Philip (2001), Marketing Management, Prentice Hall, 11th edition.
Lê Văn Huy & Nguyễn Thị Hà My (2007), Xây dựng mô hình lý thuyết và phương pháp đo
lường về chỉ số hài lòng khách hàng ở Việt Nam.
Lovelock, C. (2004), Services Marketing – People, Technology, Strategy, Pearson Prentice Hall.
Matzler, K. et al. (2005), “The Relationship between Customer Satisfaction and Shareholder
Value”, Total Quality Management, Vol.16(5), pp.671-680.
Nek Kamal et al. (2009), “Service Quality Dimensions, Perceive Value and Customer
Satisfaction: ABC Relationship Model Testing”, IBEJ Vol.2(1), pp.1-18.
Porter, M.E. (1990), The Competitive Advantage of Nations, London: MacMillan.
Reichheld, F.F. & W.E. Sasser (1990), “Zero Defections: Quality Comes to Services”, Harvard
Business Review, Vol.68(4), pp.105–111.
Shostack, G.L. (1977), “Breaking Free from Product Marketing”, Journal of Marketing, Vol.41,
pp.73-80.
Sureshchandar, G.S., C. Rajendran & R.N. Anantharaman (2002), “The Relationship Between
Service Quality and Customer Satisfaction – A Factor Specific Approach”, Journal of Services
Marketing, Vol.16 (4), pp.363-379.
Vietnam Freight Transport Report Q2 2011, March 2011, Business Monitor International.
Võ Hải Thúy, Phương Pháp Thu Thập Dữ Liệu Sơ Cấp Trong Nghiên Cứu Các Hiện Tượng
Kinh Tế Xã Hội, from http://www.ntu.edu.vn/bomon/kinhtecs.
40 | Võ Thị Quý The Determinants of Customer Satisfaction
Walker, R. H., Johnson, L.W. & Leonard, S., (2006), “Re-Thinking the Conceptualization of
Customer Value and Service Quality Within the Service-Profit Chain”, Managing Service Quality,
Vol 16(1), pp.23-36.
Zeithaml, V., A. Parasuraman & L.L. Berry (1998), “SERVQUAL: A Multiple-Item Scale for
Measuring Consumer Perceptions of Service Quality”, Journal of Retailing, Vol.64(1), pp.12-37.
Websites:
http://www.emeraldinsight.com
http://www.informaworld.com
http://www.12manage.com
http://www.greenbook.org
http://www.thefreelibrary.com
http://www.atypon-link.com
http://research.smeal.psu.edu
http://vinase.com
http://tailieuhay.com
http://vietnam-logistics.com
http://supplychaininsight.vn
http://www.gso.gov.vn
Related Documents


