THE DETERMINANTS AND VALUE RELEVANCE OF RISK DISCLOSURE IN THE INDONESIAN BANKING SECTOR DWI NITA ARYANI A thesis submitted to the University of Gloucestershire in accordance with the requirements of the degree of Doctor of Philosophy in the Business School February 2016

Welcome message from author
This document is posted to help you gain knowledge. Please leave a comment to let me know what you think about it! Share it to your friends and learn new things together.
Transcript
THE DETERMINANTS AND VALUE
RELEVANCE OF RISK DISCLOSURE
IN THE INDONESIAN BANKING SECTOR
DWI NITA ARYANI
A thesis submitted to the University of Gloucestershire
in accordance with the requirements of the degree of Doctor of Philosophy
in the Business School
February 2016

ii

iii
I dedicate my thesis to
my beloved late husband, Achmad Harioseno,
and my lovely children Anindita, Anggito and Bagas

iv
I declare that the work in this thesis was carried out in accordance with the
regulations of the University of Gloucestershire and is original except where
indicated by specific reference in the text. No part of the thesis has been submitted
as part of any other academic award. The thesis has not been presented to any
other education institution in the United Kingdom or overseas.
Any views expressed in the thesis are those of the author and in no way represent
those of the University.
Signed Date: February 2016
v
ABSTRACT
The aim of the current study is to analyse the association between thedeterminants and the value relevance of risk disclosure in the Indonesian bankingsector. The purpose will be derived into four research objective: to measure theextent of risk disclosure in the Indonesian banking sector; to compare the riskdisclosure practice between listed and unlisted banks, and between Islamic andnon-Islamic banks; to study the determinants of risk disclosure and what factorsaffect a bank's decision to disclose risk information; and to analyse the valuerelevance information on risk disclosure of listed banks, unlisted banks, Islamicbanks, and non-Islamic banks.
Agency theory, signalling theory, stakeholder theory, and communication theorywere used for underpinning theory. The annual reports of 120 banks whichreleased between 2008 and 2012 were employed for testing in this research. Riskdisclosure was measured by the number of Indonesian risk keywords divided bythe number of Indonesian sentences in annual reports. Firm value for listed bankswas measured by Tobin’s Q. The Black Scholes Merton model was employed formeasuring firm value of unlisted banks.
The number of risk keywords, number of sentences, and risk disclosure in theIndonesian banks showed an upward trend. The delta of size, liquidity,profitability, leverage, and earnings reinvestment did not have association withthe delta of risk disclosure in all banks, LB IB, NIB. The delta of firm value in allbanks, LB, ULB, and NIB has an association with aggregate the delta of firmcharacteristics and the delta of risk disclosure. Risk disclosure in annual reportswas not value relevant for stakeholders.
This method will construct a new measurement of risk disclosure; and firm valuefor unlisted banks. The regulators, banks’ managers and bank supervisory shouldpay more attention to increasing the usefulness of disclosure, the completenessof the risk information, and how to deliver signals and information moreunderstandably and readably for stakeholders. This research adds to the limitedliterature relating to earnings reinvestment, new measurement of risk disclosure,and firm value for unlisted banks. The results enrich agency, signalling,stakeholder, communication and dividend theories.
Keywords: risk disclosure, value relevance, firm value, Black Scholes MertonModel

vi
ACKNOWLEDGMENT
First of all, I am extremely thankful to Almighty Allah for giving me the strength
and ability to complete my study.
I would like to thank with genuine gratitude and high appreciation to my best
supervisors, Professor Bob Ryan and Professor Khaled Hussainey, who have
given patient guidance and always gave brilliant ideas and advice; and
constructive comments for improving my thesis.
The highest honours and thanks to my examiners, Dr. Tracy Jones and Dr. Alaa
Mansoer Zalata, for their useful comments, suggestions, which considerably
improved my thesis
I also sincerely thank the Head of Malangkucecwara School of Economics, and
its staff and colleagues who gave me permission to take this opportunity. I would
not be here without their support and recommendation.
Special thanks to the Directorate General of Higher Education, Ministry of
National Education, Republic of Indonesia for the financial support. It would not
have been possible to finish my PhD in the UK without the scholarship.
I gratefully thank to the participants in SWAG Conference 2013 at the University
of Gloucestershire; Post Graduate Research Conference at University of

vii
Gloucestershire on 22nd -23rd of June 2015; and BAFA Conference at Bath
University on September 4th, 2015 for their comments and suggestions.
Even though you could not be beside me forever, I am grateful to thank from the
bottom of my heart my beloved late husband, Achmad Harioseno, for his sacrifice,
enormous love, encouragement; my lovely daughter, Anindita Hapsari, who
always cheered me up although I never accompanied her when she needed me;
my beloved sons, Anggito Haryo Pradipta and Bagas Haryo Rukmono, who made
me smile and feel happy during my busy time.
I would like to give my deep thanks to my mother (Sudewi), my late father
(Sarodja), my sisters (Evi Artsini and Ambar Lukitaningsih) and brothers (Haryo
Yudono and Heru Widyatmoko), who always gave affection, support, and their
prayers; also to my sisters in law, Ani Andarmilah and Endang Susetyowati, who
helped me in everything when I was away.
Special thanks to the academics and staff in the University of Gloucestershire,
and my best friends: Amina, Aasim, Bruhant, Dorojatun Prihandono, Dandy
Supriadi, Maryam, Nazahah, (late friend) Priyo Darmawan, Rosenia, Yan Huo,
and Vivian for sharing, discussing, helping me from the beginning and finishing
my study. I am thankful to the “Al Hijrah” family, mas Yopi, and mbak Anik, who
kindly help, love and support; also thank to Imelda who gave me a room to stay
in during my study.

viii
TABLE OF CONTENTS
ABSTRACT...................................................................................................................................................V
CHAPTER 1 INTRODUCTION.................................................................................................................. 1
1.1 BACKGROUND ............................................................................................................................ 11.2 RESEARCH MOTIVATION............................................................................................................ 51.3 RESEARCH AIM: ......................................................................................................................... 81.4 RESEARCH OBJECTIVES ............................................................................................................ 81.5 RESEARCH QUESTIONS AND RESEARCH HYPOTHESES ......................................................... 101.6 CONTRIBUTION TO KNOWLEDGE.............................................................................................. 141.7 EMPIRICAL RESULTS ................................................................................................................ 151.8 OVERVIEW OF THE THESIS....................................................................................................... 17
CHAPTER 2 BANKING IN INDONESIA ................................................................................................. 24
2.1 INTRODUCTION......................................................................................................................... 242.2 REGULATIONS RELATED TO DISCLOSURE .............................................................................. 24
2.2.1 The Bank of Indonesia’s Regulations ............................................................................ 252.2.2 The Indonesia Stock Exchange Regulations......................................................................... 282.2.3 Basel................................................................................................................................... 292.2.4 International Financial Reporting Standard (IFRS) ..................................................... 31
CHAPTER 3 THEORETICAL FRAMEWORKS ...................................................................................... 33
3.1 INTRODUCTION......................................................................................................................... 333.2 STAKEHOLDER THEORY........................................................................................................... 34
3.2.1 Definition of Stakeholder ................................................................................................. 343.2.2 The importance of stakeholder theory in this research ............................................... 353.2.3 The importance of stakeholders for a company........................................................... 363.2.4 Summary............................................................................................................................ 38
3.3 AGENCY THEORY ..................................................................................................................... 383.3.1 The importance of agency theory related to the research.......................................... 393.3.2 What is the Agency Theory?........................................................................................... 413.3.3 The agency problem ........................................................................................................ 433.3.4 Agency problem in banking............................................................................................. 443.3.5 Agency cost ....................................................................................................................... 473.3.6 How to minimise agency problems ................................................................................ 493.3.7 The relationship between agency theory and firm’s performance............................. 503.3.8 Summary............................................................................................................................ 51
3.4 COMMUNICATION THEORY....................................................................................................... 533.4.1 The importance of communication theory related to the research ............................ 533.4.2 Communication process .................................................................................................. 543.4.3 Summary............................................................................................................................ 55

ix
3.5 SIGNALLING THEORY ............................................................................................................... 563.5.1 The importance of signalling theory related to the research ...................................... 573.5.2 How did it start .................................................................................................................. 583.5.3 Relationship between Agency Theory and Information Asymmetry ......................... 603.5.4 The Importance of signalling theory for firms and investors....................................... 623.5.5 Signalling in different types of firms ............................................................................... 643.5.6 Problem with signalling .................................................................................................... 663.5.7 Conclusion ......................................................................................................................... 69
CHAPTER 4 LITERATURE REVIEW AND HYPOTHESES DEVELOPMENT ....................................... 72
4.1 INTRODUCTION ......................................................................................................................... 724.2 RISK DISCLOSURE ................................................................................................................... 72
4.2.1 What is disclosure?.............................................................................................................. 724.2.2 What is Risk? .................................................................................................................... 734.2.3 What is Risk Disclosure? ................................................................................................. 744.2.4 Types of disclosure........................................................................................................... 754.2.5 The quality of disclosure .................................................................................................. 774.2.6 The consequences of risk disclosure............................................................................. 78
4.3 THE DETERMINANTS OF RISK DISCLOSURE AND HYPOTHESES DEVELOPMENT....................... 834.4 VALUE RELEVANCE .................................................................................................................. 964.5 THE DIFFERENCES BETWEEN LISTED AND UNLISTED BANKS ................................................ 102
4.5.1 The benefit of listed companies .................................................................................... 1044.5.2 The hindrances of listed and unlisted companies ...................................................... 105
4.6 THE DIFFERENCES BETWEEN ISLAMIC AND NON-ISLAMIC BANKS ........................................ 1074.6.1 Shariah rules in transactions......................................................................................... 1074.6.2 Contracts in Islamic banks ............................................................................................ 1104.6.3 The Basic Law of Sharia Capital Market ..................................................................... 1144.6.4 The comparison between Islamic and non-Islamic banks ........................................ 116
CHAPTER 5 RESEARCH METHODOLOGY........................................................................................ 124
5.1 INTRODUCTION ....................................................................................................................... 1245.2 RESEARCH METHODOLOGY................................................................................................... 1245.3 RESEARCH METHODS ............................................................................................................ 1295.4 THE POPULATION AND DATA PERIODS COVERED................................................................... 1315.5 DEPENDENT AND INDEPENDENT VARIABLES.......................................................................... 132
5.5.1 Dependent variables ...................................................................................................... 1325.5.2 Independent variables.................................................................................................... 156
5.6 VALIDITY AND RELIABILITY TEST ........................................................................................... 1645.7 SUMMARY............................................................................................................................... 167
CHAPTER 6 EMPIRICAL RESULTS AND ANALYSIS ........................................................................ 170
6.1 INTRODUCTION ....................................................................................................................... 1706.2 THE RESEARCH POPULATION................................................................................................ 170
x
6.3 CLASSIC ASSUMPTION TESTS ............................................................................................... 1726.4 THE RESULTS OF RQ1: HOW CAN THE EXTENT OF RISK DISCLOSURE IN THE INDONESIAN
BANKING SECTOR BE EFFECTIVELY QUANTIFIED? .............................................................. 1736.5 THE RESULTS OF RQ 2: ARE THERE DIFFERENCES BETWEEN THE EXTENT OF RISK
DISCLOSURE PRACTICE BETWEEN LISTED BANKS AND UNLISTED BANKS, AND BETWEENISLAMIC BANKS AND NON-ISLAMIC BANKS? ........................................................................ 186
6.5.1 The Differences between Listed and Unlisted Banks ............................................... 1866.5.2 The differences between Islamic banks and non-Islamic banks ............................. 194
6.6 THE RESULTS OF RQ 3: WHAT FACTORS AFFECT A BANK’S DECISION TO DISCLOSE RISK?2006.6.1 RQ 3.1: The factors affecting banks’ decisions to disclose risk in all banks.......... 2016.6.2 RQ 3.2: The factors affecting banks’ decisions to disclose risks in listed banks .. 2106.6.3 RQ 3.3: The factors affecting banks’ decisions to disclose risks - unlisted banks 2176.6.4 RQ 3.4 The factors affecting a bank’s decision to disclose risk in Islamic banks . 2236.6.5 RQ 3.5 The factors affecting banks’ decision to disclose risk in non-Islamic banks
......................................................................................................................................... 2286.7 THE RESULTS OF RQ4 - THE VALUE RELEVANCE OF RISK DISCLOSURE ........................... 234
6.7.1 RQ 4.1: The value relevance of risk disclosure in all banks .................................... 2356.7.2 RQ 4.2 The value relevance of risk disclosure in listed banks ................................ 2456.7.3 RQ 4.3 The value relevance of risk disclosure in unlisted banks ............................ 2536.7.4 RQ 4.4 The value relevance of risk disclosure in Islamic banks ............................. 2616.7.5 RQ.4.5 The value relevance of risk disclosure in non-Islamic banks ..................... 267
6.8 SUMMARY............................................................................................................................... 278
CHAPTER 7 CONCLUSION ................................................................................................................. 279
7.1 CONCLUSION.......................................................................................................................... 2797.2 THEORETICAL IMPLICATIONS ................................................................................................. 2897.3 PRACTICAL IMPLICATIONS ..................................................................................................... 2917.4 LIMITATIONS ........................................................................................................................... 2937.5 SUGGESTIONS FOR FUTURE RESEARCH............................................................................... 295
REFERENCES .......................................................................................................................................... 297
APPENDIX A - PREVIOUS RESEARCH.................................................................................................. 311
APPENDIX B - VALIDITY AND RELIABILITY RISK KEYWORDS.......................................................... 316
APPENDIX C - THE BANKS AND THE DATA OF EACH VARIABLE .................................................... 319
APPENDIX D - FREE OF HETEROCEDASTICITY .................................................................................. 330
APPENDIX E - THE BANKS WERE EXCLUDED .................................................................................... 336
APPENDIX F - NORMALITY TEST FOR ISLAMIC BANKS VARIABLES............................................... 342
APPENDIX G – RESULTS OF LAGGED ................................................................................................. 343
APPENDIX H – THE RESULTS OF VALUE RELEVANT ........................................................................ 344
APPENDIX I – THE RESULTS OF SPSS................................................................................................. 349

xi
LIST OF TABLES
Table 4.1 Research Hypotheses and Predicted Signs ................................................................ 101Table 4.2 The advantages and weaknesses of listed companies ............................................ 106Table 4.3 The differences between listed and unlisted companies ........................................ 107Table 4.4 Summary of the differences between Islamic banks and non-Islamic banks .... 120Table 4.5 Summary of Listed banks, Unlisted banks, Islamic banks and Non-Islamic
banks ................................................................................................................................... 121Table 5.1 The valuation variable ....................................................................................................... 144Table 5.2 Volatility estimator ............................................................................................................. 146Table 5.3 The Merton structural debt model ................................................................................. 147Table 5.4 Black Scholes option pricing model for estimating value of equity ..................... 152Table 5.5 Daily share price................................................................................................................. 154Table 5.6 Relatives ............................................................................................................................... 154Table 5.7 The correlation .................................................................................................................... 155Table 6.1 Total banks in Indonesia over the period 2008 to 2012............................................ 171Table 6.2 Summary of tolerance and VIF for the correlation with risk disclosure .............. 173Table 6.3 Summary of tolerance and VIF for the correlation with firm value ....................... 173Table 6.4 The average number of Indonesian risk keywords in all annual reports ............ 174Table 6.5 The lowest and the highest number of risk keywords ............................................. 175Table 6.6 The average number of Indonesian sentences in any annual reports ................. 178Table 6.7 The lowest and the highest number of Indonesian sentences in all annual
reports ................................................................................................................................. 179Table 6.8 The average of risk disclosure in any annual reports .............................................. 181Table 6.9 The lowest and the highest number of risk disclosure in each year .................... 185Table 6.10 Listed and Unlisted Banks Group Statistics ............................................................ 187Table 6.11: Listed and Unlisted Banks - Independent Test ....................................................... 194Table 6.12 Islamic and Non-Islamic banks - Group Statistics ................................................. 197Table 6.13 Islamic and Non-Islamic banks - Independent Test Samples............................... 199Table 6.14 Pearson’s correlation between firm characteristics and risk disclosure and firm
value in all banks .............................................................................................................. 203Table 6.15 Summary of the Result of OLS Regression Risk Disclosure in all banks......... 204Table 6.16 The Pearson’s Correlation of listed banks ................................................................ 212Table 6.17 Summary of Regression Risk Disclosure in Listed Banks ................................... 213Table 6.18 The Pearson Correlation of unlisted banks .............................................................. 219Table 6.19 Summary of the Result of Regression Risk Disclosure in unlisted banks ....... 220Table 6.20 The Pearson’s correlation of firm characteristics, risk disclosure and firm
value in Islamic banks ..................................................................................................... 226Table 6.21 Summary of the Result of OLS Regression Risk Disclosure in Islamic banks 227Table 6.22 The Pearson’s correlation between the delta of firm characteristics, the delta of
risk disclosure and the delta of firm value in non-Islamic banks ........................ 232Table 6.23 Summary of the Result of OLS Regression Risk Disclosure in non-Islamic
banks ................................................................................................................................... 233Table 6.24 The Pearson correlation between firm characteristics, risk disclosure and firm
value..................................................................................................................................... 240Table 6.25. Summary of the Result of OLS Regression Firm Value in All Banks ................ 240Table 6.26 The Summary of Value Relevance ............................................................................... 241Table 6.27 The Pearson’s Correlation of listed banks ................................................................ 251Table 6.28 Summary of the Result of Multiple Regression for Firm Value in Listed
banks ................................................................................................................................... 251

xii
Table 6.29 The Pearson correlation between the delta of firm characteristics, the delta ofrisk disclosure and the delta of firm value in unlisted banks. .............................. 258
Table 6.30 Summary of the Result of Regression Firm Value in Unlisted Banks ............... 259Table 6.31 The Pearson’s correlation between firm characteristics, risk disclosure and
firm value of Islamic banks ............................................................................................ 262Table 6.32 Summary of the Result of OLS Regression Firm Value in Islamic banks ......... 263Table 6.33 The Pearson correlation between the delta of firm characteristics, the delta of
risk disclosure and the delta of firm value non-Islamic banks............................. 270Table 6.34 Summary of Regression between the delta of risk disclosure, the delta of firm
characteristics and the delta of firm value ................................................................ 270Table 6.35 The resume of hypotheses........................................................................................... 277
LIST OF FIGURES
Figure 3-1 The stakeholder of the corporation ............................................................................... 37Figure 3-2 Schematic diagram of a general communication system ....................................... 54Figure 3-3 The process of signals and noises ............................................................................... 71Figure 4-1 Dividend growth for two earnings reinvestment policies........................................ 92Figure 4-2 Islamic banks’ sources of funds and allocation of funds...................................... 113Figure 4-3 The business of banking ................................................................................................ 123Figure 5-1 The relationship between share price and fair value .............................................. 143Figure 5-2 The relationship between value of firm and value of assets ................................ 144Figure 6-1 The average number of total risk keywords.............................................................. 176Figure 6.2 The average number of Indonesian sentences in any annual reports ............... 178Figure 6.3 The number of risk disclosure in all annual reports in each year ....................... 182

1
CHAPTER 1INTRODUCTION
1.1 Background
A number of major failures of risk assessment contributed to the financial crises in 1997
and 2008, and the Financial Stability Forum (2008) suggested that these crises
happened since banks miscalculated their risks. In addition, the financial crisis was also
caused by a lack of transparency in the financial reports (Acharya, Richardson, Philipon,
& Roubini, 2009, p. 73). Based on previous financial crisis experiences, a growing
demand for better reporting of business risks has emerged in recent decades. This has
influenced a range of businesses, banks in particular, to improve their risk reporting
(ICAEW, 2011, p. iii). Furthermore, Ryan, Scapen, and Theobald (2002) asserted that
research in the corporate disclosure area has developed and has become essential, and
within this it is accepted that disclosure comprises mandatory and voluntary disclosure.
Stakeholders, investors notably, as users of annual reports need company risk
information in order to measure and minimise the risks before they make financial
decisions. Nevertheless, due to incomplete, scrappy and mutual exclusiveness of
information in financial reports, users cannot easily interpret risk disclosure (Papa &
Peters, 2011). The accounting literature also demonstrates that there is a significant risk
information gap between firms and their stakeholders. Linsley and Shrives (2006)
examined risk disclosure in the U.K. and stated that firms reported that quantitative risk
information and risk narratives were lacking in coherence. These arguments indicated a
gap in risk information; consequently, stakeholders are not able to accurately assess a
firm’s risk profile. Therefore, in order to help stakeholders to easily read firm performance
2
and to make good decisions, and to make financial reports more valuable for users,
companies have to report more detailed information and understand what users need.
In the emerging capital markets and banking sectors, investors need transparency and
accountability from a firm’s annual report. The disclosure within the annual report has
value relevance if companies give signals and report their performance more
transparently and usefully for investors; hence, investors can use the annual report for
consideration when they make financial decisions.
This research is focused in the banking sector because first, banks play a crucial role in
the business and economics of the country. Second, banking is an industry which is
highly confronted by risk. Third, it is an industry based on trust; therefore, banking is a
highly regulated industry. Along with that, stakeholders such as depositors, investors
and business partners will lose trust if a bank gives a bad impression. Finally, it should
be the main concern of banks to maintain the loyalty of customers and shareholders;
hence transparency and disclosure are important ingredients of banking sector stability.
Therefore, the disclosure of banks needs to be studied independently from other
industries (Linsley & Shrives, 2006).
Since banks deal with risks, they have an obligation to measure and manage the risks
associated with their business activities and risk exposure, and provide financial reports
for their stakeholders. Banks are required to submit financial statements and
supplementary management reports to the public and also banks must adhere to some
regulations in the delivery of information such as financial statements, referring to IFRS
(International Financial Reporting Standards), Basel II (pillar 3), and other regulations
3
such as reports for the Capital Market Agency, or supervisory banks such a national
central banks.
Agency theory asserted that the manager (agent) has access to internal information more
than stakeholders (principals). The manager has an obligation to send a company’s
performance signals to the stakeholders, albeit that occasionally the information is
misaligned with its actual condition. This condition induces asymmetric information. The
existence of information asymmetry leads to the possibility of conflict between the
principals and the agents. Companies that are transparent in reporting their performance
are able to minimise agency conflict. Signalling theory also mentions that disclosing their
condition and sending good signals to shareholders helps a firm increase its value.
Previous researches have exhibited either the factors affecting a firm’s decision to
disclose their performance or the association between firm characteristics and
disclosure, nevertheless the results were unclear and inconclusive. The directions might
be negative or positive, and the relationship could be significant or insignificant.
Elzahar and Hussainey (2012) and Linsley and Shrives (2006) demonstrated a positive
relationship between risk disclosure and firm size. Conversely, Aljifri and Hussainey
(2007) found a negative association between the level of disclosure and firm size.
Elshandidy, Fraser, and Hussainey (2011) revealed that firms with a high liquidity ratio
transmit signals to the market participants. Marshall and Weetman (2007) found a
significant relationship between disclosure and liquidity in UK firms. Nevertheless,
Elzahar and Hussainey (2012) mentioned that there is an insignificant association
between liquidity and risk disclosure.
4
Elzahar and Hussainey (2012) explained an insignificant relationship between profitability
and the level of disclosure in an interim report, meanwhile, Barako, Hancock, and Izan
(2007) found a negative association between profitability and level of disclosure. On the
other hand, Ibrahim (2011) asserted that profitability and disclosure have a positive
relationship.
A significant association between the leverage and the depth of information disclosure
level was found by (Naser, Al-Khatib, & Karbhari, 2002). Conversely, Elzahar and
Hussainey (2012) found leverage to be an insignificant determinant of narrative risk
disclosure in interim reports.
An examination of the association between risk disclosure and earnings reinvestment is
rarely done. Bank (2004) mentioned that earnings reinvestment is earnings that will not
be paid as dividends to the shareholders, but will be reinvested in the main business to
support a company’s growth opportunities. Moreover, with bank capital formation
through retention is necessary to support new lending. Baker and Powell (2012), who
surveyed the Indonesia Stock Exchange companies, mentioned that management pays
more attention to dividend policy because it can affect firm value and shareholder wealth.
The company which has a reinvestment policy should disclose more in order to make
sure the investors, by reinvesting the earnings, will give them higher earnings in the
future. Beside mandatory disclosure, companies should report their performance
voluntarily which is carried out by the company without regulatory stipulation. Voluntary
disclosure of the annual reports is value-relevant for users and impacts firm value (Uyar
& Kiliç, 2012). This is also supported by Al-Akra and Ali (2012) who highlight that
voluntary disclosure has a positive association with firm value; however, it also seems

5
that firm value can be affected by many factors, and various studies have exhibited
different results. Al-Akra and Ali (2012) found that liquidity and firm value do not have a
relationship. Furthermore, Hassan, Romilly, Giorgioni, and Power (2009) reported that
asset size and profitability are significant with mandatory disclosure but have a negative
association with firm value, and that voluntary disclosure has a positive, but insignificant
relationship with firm value. Meanwhile, leverage has an insignificant correlation with
firm value.
This study seeks to fill the gaps in the literature of these contradictory results, by
examining the factors affecting a bank’s decision to disclose risk in its annual report, and
distinguishes between listed, unlisted, Islamic, and non-Islamic banks in Indonesia.
1.2 Research Motivation
The motivation for choosing the banking sector as the population of this study has been
explained above. This study is focused on examining banks in Indonesia for several
reasons. First of all, Indonesia has a large total of banks, i.e 120 banks. Second,
Indonesia is a developing country, and has an emerging capital market that has good
potential economic growth, but deals with political and economic risk. The emerging
capital market could be described as having a high share price volatility and promises
to give high returns, but also represents high risks. Since banking itself is a high
risksector, more detailed company information is needed by investors in order to
consider, measure and minimise risks before making financial decisions. Therefore, it is
necessary to examine the extent of risk disclosure and the factors affecting Indonesian
listed banks’ decision to disclose risk.

6
Third, a survey by Pricewaterhouse Coopers (2000) showed that Indonesia scored very
low in the area of perception standards of disclosure and transparency in the material
information, being the lowest among Asian markets. It is interesting to examine whether
the extent of risk disclosure after their survey in 2000 shows an upward or downward
trend. Fourth, according to Kurniawan and Indriantoro (2000), in 1997 Indonesia
experienced a banking crisis and also felt the impact of the global crisis in 2008. The
factors that influenced and exacerbated the economic catastrophe in Indonesia were the
weaknesses of risk management practices and corporate governance. This suggests that
Indonesia still lacks transparency and disclosure.
Based on those experiences, investors should become more prudent in investing their
funds. However, if investors were easily able to predict risks through reading firms’
annual reports, risk disclosure would be perceived as valuable information to give to
stakeholders. Along with that, studying the value relevance of risk disclosure in the
Indonesian banks’ annual reports will be crucial area to examine.
In addition, this research has uniqueness, this research will explain the extent of
transparency in the banking sector in order to show how the trend of risk disclosure
changed in Indonesia in the period 2008 to 2012. Moreover, this is the first study to
measure the extent of risk disclosure by counting Indonesian risk keyword in annual
reports.
The seventh reason is that the development of the Islamic banking system in Indonesia
is still in emerging growth, which began in 1990 and has been carried out within the
framework of the dual-banking system, i.e. Islamic banks and Non-Islamic banks with
7
Islamic banking windows (Sharia Business Unit of Conventional Bank). Islamic banks
have particular characteristics, for example, they do not charge or pay interest, but
instead employ profit and loss sharing, and have to comply with Sharia law. The Islamic
banking system operates to provide an alternative banking system of mutual benefit to
the community and banks, as well as accentuate aspect of fairness in trade, ethical
investment, and avoiding speculative activities in financial transactions. For those
reasons, it is important for banks based on Shariah law to obey all of the laws, regulations
and guidelines. It is also important to ensure transparency in disclosing information
properly. Regulations, legal principles and guidelines are different between Islamic
banks and non-Islamic banks and there are also many differences in risk. In addition,
Hussain and Al-Ajmi (2012) concluded that Islamic banks in Bahrain had a higher level
on risk, liquidity, operational, residual and settlement risk than non-Islamic banks. There
has been no previous study in Indonesia that has investigated the differences between
risk disclosure in Islamic and non-Islamic banks, and the factors affecting Islamic banks’
decision to disclose risk.
Brounen, Hans Op 't, and Raitio (2007) examined non-listed companies in the European
market, and their result showed that the unlisted firms had many drawbacks such as an
absence of transparency, limited size and tradability and complicated structures. The
description of information that is conveyed in the annual report by listed and unlisted firms
suggests that there may be differences between listed and unlisted Indonesian banks
and between Islamic banks and non-Islamic banks; moreover, it will be pertinent to
investigate the extent of voluntary disclosure in these groups. This research is interesting
8
because it will explore the differences between the extent of risk disclosure in listed and
unlisted banks.
Previous studies have claimed a relationship between a firm’s characteristics and the
inconsistency of its voluntary and mandatory disclosure, which provides an opportunity
now to examine the determinants of risk disclosure in annual reports and what the value
relevance of risk disclosure is. There is no existing study that examines the value
relevance of risk disclosure and the determinants of banks' risk disclosure in Indonesia,
particularly among unlisted banks and Islamic banks. Moreover, in this study, the extent
of risk disclosure is measured by Indonesian risk keywords as a proportion of total
sentences in annual reports, with the purpose of adding to the literature related to
disclosure in unlisted banks and Islamic banks.
Very little previous research has focused on unlisted firm value. Sachs, Ruhli, and Kern
(2009); Wang, Ali, and Al-Akra (2013) mentioned that most studies in the field of firm
value related to disclosure have tended to focus on listed companies rather than unlisted
companies. Interestingly, this study provided additional evidence in examining firm value
for unlisted banks by using a new method, namely the Black Scholes Merton model.
1.3 Research Aim:
The aim of the current study is to analyse the association between the determinants and
the value relevance of risk disclosure in the Indonesian banking sector.
1.4 Research Objectives
Based on the research aim, the main purpose of this study is divided into four research
objectives (RO) as follow:

9
a. To measure the extent of risk disclosure in the Indonesian banking sector.
By knowing the extent of risk disclosure in the Indonesian banking sector, this research
will be able to demonstrate whether annual reports delivered by banks in Indonesia have
described risk disclosure transparently.
b. To compare the risk disclosure practice between listed and unlisted banks, and
between Islamic and non-Islamic banks.
Banks are mandated to provide their performance through annual reports to the central
bank (the Bank of Indonesia). Since the listed banks trade in the stock exchange market,
they have to adhere to capital market regulations to provide annual reports in order to
reveal their performance. Listed companies have more stakeholders than unlisted
banks, and the transparency of annual reports can be used to attract investors in order
to obtain external funds. It suggests that listed banks are more likely to be transparent
than unlisted banks.
Islamic banks in Indonesia just established in 1990, and deal with risks that are different
from non-Islamic banks; furthermore, they must obey Islamic law thereby Islamic banks
suppose more disclosure in reporting their performance than non-Islamic banks.
c. To study the determinants of risk disclosure and what factors affect a bank's decision
to disclose risk information.
Previous research has shown that some factors have an association with risk disclosure,
but the results have been different and sometimes contradictory. Related to risk, banks
should disclose more and be transparent in their financial reports, because users really

10
need the firm performance information. Therefore, it is salient to know what factors affect
banks’ decision to convey risk disclosure.
d. To analyse the value relevance information on risk disclosure of listed banks, unlisted
banks, Islamic banks, and non-Islamic banks.
The information in the annual reports is value relevant if it useful for investors and it can
increase firm value. This research will explore whether the risk disclosure in the annual
reports submitted by listed, unlisted, Islamic and non-Islamic banks is value relevant for
users, and whether it provides benefits for stakeholders that are reflected in increased
firm value.
1.5 Research Questions and Research Hypotheses
Following the research aim and objectives, this research has four specific research
questions to be answered.
To achieve the first Research Objective (RO), namely to measure the extent of risk
disclosure in the Indonesian banking sector, the following first research question is
formulated as:
RQ1: How can the extent of risk disclosure in the Indonesian banking sector be effectively
quantified?
In order to answer the above Research Question, the extent of risk disclosure is
measured by counting the number of Indonesian risk keywords employed in the report
and dividing that by the number of Indonesian sentences in the annual report, a task
aided by software called QSR Nudist 6.
11
To achieve the second RO, namely to compare the risk disclosure practice between listed
banks and unlisted banks, Islamic banks and non-Islamic Banks, the following second
RQ is formulated as:
RQ 2: Are there differences between the extent of risk disclosure practice between listed
banks and unlisted banks, and between Islamic banks and non-Islamic banks?
In order to answer the above RQ, Levene’s test was conducted to examine the
differences of the extent of risk disclosure between listed and unlisted banks, and
between Islamic and non-Islamic banks, using SPSS software.
To achieve the third RO, namely to study determinants of risk disclosure and what factors
affect a bank's decision to disclose risk information, the RQ is formulated as:
RQ 3: What factors affect a bank’s decision to disclose risk?
In order to answer the RQ above, the determinants of risk disclosure, namely: firm size,
liquidity, profitability, leverage, and earnings reinvestment will be extracted from the
banks’ annual reports and the correlation will be tested by Partial and Multiple Least
Square and aided by SPSS.
The association between the delta of firm characteristics (firm size, liquidity, profitability,
leverage, and earnings reinvestment) and the delta of risk disclosure as empirical Model
1 is formulated based on agency and signalling theories, and the results of previous
studies. The following hypotheses represent the concerns of these theories, as follow:
First hypothesis (H1): There is a positive association between the delta of risk disclosure
and the delta of firm size.

12
Second hypothesis (H2): There is a positive association between the delta of risk
disclosure and the delta of liquidity.
Third hypothesis (H3): There is a positive association between the delta of risk disclosure
and the delta of profitability.
Fourth hypothesis (H4): There is a positive association between the delta of risk
disclosure and the delta of leverage.
Fifth hypothesis (H5): There is a positive association between the delta of risk disclosure
and the delta of earnings reinvestment.
Sixth hypothesis (H6): There is an association between the delta of risk disclosure and
the delta of firm characteristics.
To achieve the fourth RO, namely to analyse the value relevance of information on risk
disclosure of listed banks, unlisted banks, Islamic banks, and non-Islamic banks, the RQ
is formulated as:
RQ 4: What is the value relevance of risk disclosure in listed banks, unlisted banks,
Islamic banks and non-Islamic banks?
In order to answer the above RQ, the value relevance is measured by the coefficient of
correlation between risk disclosure and firm value.
Value relevance is the ability of a firm to send signals and detailed firm information that
is useful for stakeholders and enables firm value to increase. Meanwhile, the association
between the delta of firm characteristics and the delta of risk disclosure and the delta of

13
firm value which is formulated in the empirical Model 2 is derived from agency, signalling
theories and reviewed from previous literatures. The hypotheses relates with this RQ as
follow:
Seventh hypothesis (H7): There is a positive association between the delta of firm size
and the delta of firm value.
Eighth hypothesis (H8): There is a positive association between the delta of liquidity and
the delta of firm value.
Ninth hypothesis (H9): There is a positive association between the delta of profitability
and the delta of firm value.
Tenth hypothesis (H10): There is a negative association between the delta of leverage
and the delta of firm value.
Eleventh hypothesis (H11): There is a positive association between the delta of earnings
reinvestment and the delta of firm value.
Twelfth hypothesis (H12): There is a positive association between the delta of risk
disclosure and the delta of firm value.
Thirteenth hypothesis (H13): There is an association between the delta of firm
characteristics and the delta of risk disclosure and the delta of firm value.
Fourteenth hypothesis (H14): Risk disclosure is value relevant for stakeholders.

14
1.6 Contribution to knowledge
Recent developments in disclosure have heightened public awareness of the need for
transparency in annual reports. Disclosure in the Indonesian banking sector deserves
special attention and needs a lot of improvement. The findings from this study are
expected to make several important contributions in areas outlined below:
First, this study makes a major contribution to the literature of methodology and empirical
contribution in measuring firm value for unlisted banks, including Islamic banks, because
this is the first research that has measured firm value by employing the Black Scholes
Merton Model.
Second, this research makes an original contribution to the literature of risk disclosure by
exploring a new method to measure the extent of risk disclosure through banks’ annual
reports by counting Indonesian risk keywords.
Third, the findings should represent an exciting opportunity to advance the knowledge on
earnings reinvestment and dividend theory, whereby previous studies have focused on
investigating dividends.
Fourth, there is no previous research has tested the determinant of risk disclosure and
compare it between listed and unlisted bank, Islamic and non-Islamic banks, hence this
study enriches the literature of disclosure.
Fifth, the results of this study also enrich the literature related to agency, signalling,
stakeholder, and communication theories.

15
1.7 Empirical results
The extent of risk disclosure in the Indonesia banking sector between the years 2008 and
2012 showed an upward trend. The average number of Indonesia risk keywords
increased for all banks and each sector, whereby listed banks had number of risk
keyword higher than unlisted banks and non-Islamic banks were always higher than
Islamic banks. The number of total Indonesian sentences in the annual reports also
exhibited an increased trend, whereby listed banks were greater than unlisted banks;
meanwhile non-Islamic banks were higher than Islamic banks. The average level of risk
disclosure demonstrated in the reports went up, whereby unlisted banks had a higher
average than listed banks meanwhile non-Islamic banks have a bigger average than
Islamic banks.
Even though the mean of the delta of risk disclosure in unlisted banks was higher than
listed banks, Levene’s test denoted that risk disclosure in the listed and unlisted banks
was the same. The mean of the delta of risk disclosure among Islamic banks was higher
than non-Islamic banks nevertheless; however, based on Levene’s test the result showed
there was no difference between them.
The H1 to H5, which suggested the delta of individual firm characteristic has a positive
correlation with the delta of risk disclosure for all banks and each sector were rejected,
except H4 and H6 in the unlisted banks, and H2 in non-Islamic banks. These results will
be clearly described in the empirical results chapter. The multiple regression results
demonstrated that the delta of firm characteristics, namely: firm size (assets), liquidity
(LDR), profitability (ROE), leverage, and earnings reinvestment did not affect banks to
reveal their risk more transparently in all banks, listed, Islamic, and non-Islamic banks’
16
annual reports. Model 1 of this study was not a fit model for examining the relationship
between firm characteristics and risk disclosure.
The positive association between the delta of assets and the delta of firm value, as
suggested in H7, was accepted for unlisted banks and Islamic banks. The H8 which
suggested a positive association between the delta of liquidity and the delta of firm value
was rejected for all banks and each sector. The positive association between the delta
of profitability and the delta of firm value as suggested in H9 was accepted for all banks,
listed and non-Islamic banks. The H10, which suggested a negative association between
the delta of leverage and the delta of firm value was rejected for all banks and each
sector. The positive association between the delta of earnings reinvestment and the delta
of firm value as mentioned in H11 was rejected for all banks and each sector. The H12
which suggested there was a positive association between the delta of risk disclosure
and the delta of firm value was rejected for all banks and each sector. The results of H7
to H12 are explained in more detail in the empirical results chapter.
The delta of firm value of all banks, listed, unlisted, and non-Islamic banks was found to
be determined by the delta of firm characteristics and the delta of risk disclosure when
those variables were aggregated as independent variables. Therefore, Model 2 was a fit
model for testing the effect of the delta of firm characteristics and the delta of risk
disclosure to the delta of firm value for all banks, listed, unlisted and non-Islamic banks.
Therefore, H13 that supposed there was an association between the delta of firm
characteristics and the delta of risk disclosure and the delta of firm value was accepted.
The adjusted R square of all banks, listed, unlisted, Islamic and non-Islamic banks were
0.709; 0.783; 0.218; 0.267; and 0.738 respectively.
17
The results show risk disclosure did not have an association with firm value in all banks
and each sector. These results showed that risk disclosure was not value relevant for
users and could not push firm value. Therefore, H14 that supposed risk disclosure to be
value relevant for stakeholders was rejected.
1.8 Overview of the thesis
The overall structure of the thesis takes the form of seven chapters, including this
introductory chapter which describes an outline of each chapter. The history of banking
in Indonesia and several regulations concerning disclosure for banking are described in
chapter two. The theoretical framework comprising the stakeholder theory, agency
theory, communication theory, signalling theory, will be written comprehensively in
chapter three. The literature review about risk disclosure, and hypotheses development
are explained in chapter four. The fifth chapter is concerned with research methodology
and the methods used for this study. The empirical analysis describes research finding
comprising the descriptive analysis, correlation analysis, accepting /rejecting hypotheses
and the discussion of the research findings and answer to the research questions are
presented in chapter six. Finally, the last chapter describes a critique of the key findings,
the conclusion, tying up the various theoretical and practical implications of the findings,
limitation of this research, and suggestions for future research. The over view of each
chapter is described below.
Chapter 1: Introduction
Chapter one briefly explains the overall content of the thesis. It highlights the background
of the importance of risk disclosure, the gap between determinants of risk disclosure in

18
previous research, and the development of risk disclosure in the Indonesian banking
sector. This chapter also explains the motivation for undertaking this study focusing on
Indonesian banking and contribution to knowledge. Moreover, this chapter states the
research aim, objectives, questions, and hypotheses.
Chapter 2: Banking in Indonesia
Due to using Indonesian banking as the object of the research, chapter two explains
several regulations regarding to disclosure in the annual report for banking in Indonesia,
and other international regulations such as Basel and IFRS which are also concern in
disclosure.
Chapter 3: Theoretical Frameworks
This chapter describes theories which have a relationship with developing the
hypotheses and interpreting the findings. The theories for underpinning this study
comprise Stakeholder, Agency, Communication, and Signalling theories.
Chapter 4: Literature Review and Hypotheses Development
This chapter describes a literature review which will criticise prior studies, identify gaps
between the previous results and how this thesis will fills some of the gaps. In this
chapter, the hypotheses will be developed based on the gap between theories and
literature review. The second part explains risk disclosure, type and quality of disclosure
and the consequences of disclosure. The third part describes the determinants of risk
disclosure in details about the variables of firm characteristics that have association with
risk disclosure and describe the relationship between the determinants, risk disclosure
19
and firm value. The next part explains value relevance of risk disclosure. Finally this
chapter is ended by the differences between risk disclosure in listed and unlisted banks,
Islamic and non-Islamic banks. Along with that, this chapter completely explains the
independent and dependent variables that will be examined and what the value
relevance is, as follows:
Firm Size
Based on agency theory, to minimize asymmetrical information between managers and
users and also to reduce agency costs, big companies will report their condition by
disclosing more information (Watts & Zimmerman, 1983) and (Inchausti, 1997).
Liquidity
Liquidity ratio is a measurement that demonstrates a firm’s ability to pay short term debt.
Based on signalling theory, a high liquidity firm will disclose more and show better signals
than firms with low liquidity (Elzahar & Hussainey, 2012).
Profitability
The profitability ratio is a measurement to demonstrate the persistence of a company to
generate profit. Signalling theory suggests that more profitable firms disclose more to
inform their stake-holders about their good performance, but based on agency cost
theory, less profitable firms disclose more to contextualize their worse financial
performance (Inchausti, 1997). Based on agency theory, companies with higher profit will
represent their performance to stakeholders by giving more information and disclose this
in their interim report (Elzahar & Hussainey, 2012).
20
Leverage
Leverage ratio is a measurement for demonstrating a firm’s capability to pay long term
debts. Agency theory states that firms with higher levels of financial leverage tend to
provide voluntary disclosure in order to fulfil creditors’ needs and remove the wealth
transfer to shareholders (Jensen & Meckling, 1976). According to Elzahar and Hussainey
(2012), high leverage firms will disclose more in their reports to indicate good signals in
order to show their ability to pay debts.
Earnings Reinvestment
Earnings reinvestment is an earning that will not be paid as dividends to the stakeholders
but will be reinvested in their main businesses to support the company’s growth. Bodie,
Kane, and Markus (2011) argued that firms with a high reinvestment policy will distribute
small dividends, nevertheless shareholders will receive high benefits in the future.
Companies will pay dividends to compensate investors equal to the level of risk
investment. Firms with low level disclosure will pay dividends higher than companies
with a high level of disclosure.
Firm Value
As a dependent variable, firm value for listed banks is measured by Tobins Q, while for
unlisted banks it is measured by Black Scholes Merton Model. Previous studies have
examined the association between firm characteristics with firm value, however the
results were vague. Companies which disclose more in mandatory and voluntary
reporting to stakeholders can minimise agency conflicts between managers and
21
stakeholders. This shows that they have a better governance system, hence increasing
the firm’s value (Sheu, Chung, & Liu, 2010). Big companies have a strong financial
motivation to disclose more in order to achieve a good ‘corporate standing and public
representation’ and finally it will increase the firm’s value (McKinnon, 1993). While Al-
Akra and Ali (2012) found that firm value does not have a relationship with liquidity. But,
asset and profitability has a negative association with firm value; meanwhile leverage
has insignificant correlation with firm value (Hassan et al., 2009) .
Value Relevance
There is one issue which has not been addressed sufficiently in previous studies; namely
value relevance of risk disclosure, particularly in the early stage of capital markets and
this is expected to grow rapidly. Disclosing of companies risk performance, providing
more detailed and accurate information to the public, it will be valuable and value relevant
for users.
Suadiye (2012, p. 302) asserted that “Value relevance is defined as the ability of financial
statement information to capture and summarize firm value”. According to Agostino,
Drago, and Silipo (2011) value relevance is estimated by the degree of explanatory power
of the model. In addition, Babaei, Shahveisi, and Jamshidinavid (2013) asserted that
value relevance can be reflected by the significance of the coefficients in regression
model.
Chapter 5: Research Methodology

22
This chapter explains the complete process regarding research methodology,
hypotheses and methods. To realize the research aim and objectives, this study applies
a quantitative research methodology. The first part of the chapter will explain an overview
of the chapter. The second part will explain the methodology of this research that
employs quantitative research methodology. The third part describes research methods
related to the procedures used to gather and analyses data. The population and data
period will be explained in the fourth part. While part five will briefly describe dependent
and independent variables. Moreover, the sixth part presents the validity and reliability
test, and explains how to measure the association between determinants and risk
disclosure. The measurement of firm value for listed and unlisted banks will be described
in the seventh part. The last part describes the measurement of value relevance. To
exhibit the hypotheses, the researcher uses quantitative research methods with statistical
analyses namely partial and multiple linear regressions.
Chapter 6: Empirical results and discussion
This chapter concludes the empirical research and discussion which has six parts. The
first part is the introduction, while part two will describe the development of banks in
Indonesia namely listed banks in the Indonesian Stock Exchange, unlisted, Islamic and
non-Islamic banks. The third part will present the data of the extent of risk disclosure in
listed and unlisted banks, Islamic and Non-Islamic banks. The fourth part describes the
differences between the extent of risk disclosure practices between listed and unlisted
banks, and Islamic and non-Islamic banks. The fifth part comprehensively describes the
factors affecting a bank’s decisions to disclose risk. The result of value relevance of risk
disclosure in the Indonesian banks will be presented in the sixth part. This chapter also

23
comprehensively answers the research questions and discusses the link between the
findings and theories and literature reviews. Finally, this chapter will end with a
conclusion.
Chapter 7: Conclusion
This chapter concludes this thesis, which highlights the research aim and followed by a
brief overview of the findings and answer the research questions, and conclusion.
Theoretical and practical implications will be described in the next part. The following
part describes the limitation of the research. This chapter will be closed by suggestions
for future research.

24
CHAPTER 2BANKING IN INDONESIA
2.1 Introduction
In order to set the context for the subsequent analysis and discussion, this chapter
focuses on regulations of the Indonesian banking industry. The first part explains several
regulations related to disclosure in the banking industry, which is divided into four
subparts, namely: the Bank of Indonesia, the Indonesia stock exchange board, Basel II,
and IFRS.
Some regulations, particularly regarding risk disclosure, were strengthened in Indonesia
after the financial crisis in 1997 and the global economic crisis in 2008. The Bank of
Indonesia (the BI) and the Indonesia Stock Exchange regulations asserted that every
bank must report their performance through the internet at least annually. Moreover,
banks have to disclose their risk to fulfil the adherence of Pillar III on Basel II.
Furthermore, IFRS 7 sets out the range of mandatory disclosure that has to be included
in a company’s annual report.
2.2 Regulations Related To Disclosure
The regulations related to disclosure state that annual reports must be timely, accurate,
relevance and appropriate, to simplify user information in assessing banks’ financial
condition, performance, risk profile, risk management and business activities. Along with
this, the BI obliges banks to constitute, provide and publish financial reports, consisting
of an annual report, financial report, consolidation, and other publications as well as self-

25
assessment. In addition, other regulations regarding banks sell their shares in the capital
market, they mandatorily have to publish annual reports.
2.2.1 The Bank of Indonesia’s Regulations
The BI has issued several regulations regarding transparency, such as Law number
10/1998 which states that a bank is obligated to report on its operations in order to control
the condition of banks by the public and the BI; BI regulation number 3/22/PBI/2001
concerning the transparency of banks’ financial condition; BI regulation number
5/8/PBI/2003 concerning risk management implementation for commercial banks and its
revision number 11/25/PBI/2009; BI regulation number 8/4/PBI/2006 concerning good
corporate governance implementation by commercial banks, which promoted
transparency in banks’ financial and non-financial conditions; BI regulation number
14/14/PBI/2012 concerning transparency and the publication of banks’ reports in order
to create market discipline in the banking system; to ensure they are in line with the
development of international standard; to improve transparency in reporting their
performance, and to provide quantitative and qualitative information in their annual
reports. Furthermore, the BI issued a risk disclosure regulation number 14/35/DPNP on
10th December 2012 to push banks to report their performance transparently. Banks
mandatorily report their performance by releasing annual reports and financial
statements every three months, six months and yearly. Banks are able to release their
annual report through magazines, newspapers or their websites.
Some regulations have been issued by the BI in order to minimise the risk for banks,
such as the Bank of Indonesia’s Regulation Number 5/PBI/2003 and 11/25/PBI/2009.

26
These regulations state that banks have to report eight (8) types of risk related to
financing, which are: operation, market, liquidity, strategic, legal, reputation and
compliance risk. The Bank of Indonesia’s Regulation Number 9/15/PBI/2007, concerns
Guidelines for Banks in Implementing and Conducting Risk Management in Integrated
Information Technology, including how to manage risk in accordance with the
regulations. These are: first, credit risk is the risk caused by the failure of the debtor
and/or other parties to meet its obligations to the bank. Second, market risk is the risk
on a bank’s balance sheet and an administrative account includes transactions of
derivatives, due to changes in its entirety from market conditions, including the risk of
price option. Third, operational risk is due to the insufficiency and/or malfunction of
internal process through human error, system failure, and/or external events affecting the
operations of bank. Fourth, liquidity risk is the risk resulting from the inability of a bank to
meet maturing obligations to funding sources with cash flow and/or a liquid asset, or high-
quality liquid assets that can be encumbered without disturbing the activities and financial
condition of the bank. Fifth, risk compliance is the risk resulting from banks that disobey
and/or do not abide by the rule of law and regulations. Sixth, legal risks are the risk
caused by lawsuits and/or weakness from the juridical aspect. Seventh, reputational risk
is the risk caused by declining confidence levels of stakeholders and loss of confidence
deriving from negative perception of banks. Eighth, strategic risk is caused by inaccuracy
in the acquisition and/or the implementation of a strategic decision as well as failures in
anticipation of changes in the business environment. Finally, Business Continuity Plans
(BCP) are policies and procedures which contain a series of planned and coordinated
actions regarding steps to reduce risks, the handling of the effects of problems/disasters

27
and recovery processes to ensure that the bank’s operational venture and service to
customers can still proceed.
In order to support the development of sharia (Islamic) banks, the BI issued several
regulations, namely the stipulations of the law of the Republic of Indonesia Number 21
(2008) concerning sharia banking. The circular letter number
SE 7/56/DPbS /2005 concerning Islamic banks states that such banks are obliged to
publish annual reports and quarterly reports in newspapers and on the Bank of
Indonesia’s home page. At the least they must report their rights and obligations to
related parties, to give a contribution to protecting the bank’s assets and to fulfil sharia
principles in all transactions, and to provide useful information about the business
development and bank’s performance to stakeholders.
BI regulation number 11/3/PBI/2009 in clause 35 concerning Sharia Supervisory Board,
in the first paragraph mentions that SSB’s duties and responsibilities are to give advice
and suggestions to the Board of Directors and oversee the activities of banks in order to
comply with Islamic principles. The second paragraph states: first, the duties and
responsibilities of SSB as referred to in paragraph 1 include: assessing and ensuring
compliance with Islamic principles on operational guidelines and products issued by
banks. Second, to oversee the process of the bank’s new product development. Third,
to ask for a fatwa to the national sharia council for a new product that does not yet have
an existing fatwa. Fourth, to conduct a review of fulfilment of Islamic principles in the
mechanisms of fund collection and distribution, and bank services and finally, to request
data and information related to sharia aspects of their work, in order to monitor banks in
the implementation of their duties.

28
2.2.2 The Indonesia Stock Exchange Regulations
Mandatory disclosure is an obligation for companies to release financial reports that are
regulated by the chairman of the capital market regulatory body. There are some
regulations related to financial report disclosure in Indonesia (particularly for listed
companies), namely circulars from the chairman of the capital market, such as number
17/PM/1995, and circular number 38/PM/1996. In addition, the Capital Market
Supervisory Agency and the Financial Institution already had a regulation related to
disclosure, namely Circular number 02/PM/2002 that listed companies which have to
release their performance in the annual report mandatorily. Moreover, the circulars
Chairman of Capital Market regulatory body Number SE-02/BL/2008 concerning
Guidelines for Presentment and Disclosure of Financial Statements for Public Listed
Companies in Mining, Oil and Gas, and Banking, which is designed to govern the
presentation and disclosure of financial statements of public listed companies. Another
regulation is the type of mandatory disclosure specified in the decision of the chairman
of capital market Supervisory Agency and Financial Institution number Kep-134/BL/2006
concerning an obligation to submit annual reports for public listed companies. Moreover,
the circulars of the Chairman of Capital Market regulatory body number SE-02/BL/2008
concerning the issuance of financial statements for Public Listed Companies in Mining,
Oil and Gas, and Banking. Furthermore, public offerings and public companies must
meet the standards of disclosure. Law number 8/1995 article 86 concerning the capital
market mentions that to improve transparency and ensure the protection of investors, a
company that sells its shares through the capital market shall disclose all the information
29
about their business, including their financial circumstances, the legal aspects of property
management and wealth to the public.
2.2.3 Basel
In order to enhance financial stability and the quality of banking supervision worldwide,
the governors of the central banks of the G10 countries in 1974 established The Basel
Committee on Banking Supervision (BCBS) under the Bank for International Settlements
(BIS), with its head office in Basel, Switzerland. The BCBS not only issues the standard
regulations for banks but also provides a forum related to banking supervision. Since
then the BSBC has been issuing regulations. They established Basel I concerning the
Basel capital accord in 1988, which stated that banks should have a minimum ratio of
capital to risk-weighted asset of 8%. In 1996, BSCB issued an amendment to set capital
requirements for market risks. After that, in 2008, BCBS released the final version Basel
II with three pillars.
The Bank of Indonesia, as a part of more than a hundred central banks in other countries
which defer to Basel, has implemented Basel I since 1993. For preparing the
implementation of Basel I and in order to promote banking stability, the Bank of Indonesia
issued regulation number 5/8/PBI/2003 on 19th of May 2003 concerning the application
of risk management for commercial banks. Every single bank in Indonesia mandatorily
implements Basel requirements.
Basel II has three “pillars”. The first Pillar is the minimum capital requirement for credit
risk in banking, which is calculated in a new way that reflects the credit ratings of
counterparties. The second pillar concerns the supervisory review process, and allows
30
regulators to have some discretion on how rules are applied but seeks to achieve overall
consistency in the application of the rules. Finally, the third pillar is concerned with market
discipline, and requires banks to increase disclosure to the market of their risk
assessment procedures and capital adequacy.
In addition, in some instances, banks have to increase their disclosure in order to be
allowed to use particular methodologies for calculating capital. Market discipline imposes
a strong incentive on the bank to conduct their business in a safe, sound, and efficient
manner. It can also provide a bank with an incentive to maintain a strong capital base as
a cushion against potential future losses arising from its risk exposures. To promote
market discipline, banks should publicly and in a timely fashion, disclose detailed
information about the process used to manage and control their operational risk and the
regulatory capital allocation technique they use (BIS, 2003).
Furthermore, the third Pillar is an integral part of the Basel II Capital Accord. It establishes
a list of required disclosures that helps investors to get a better picture of a banks’ true
risk profile. This should enable investors to make more informed investment decisions
and based on likely consequence, which creates additional pressure on banks’
management teams to monitor their risks closely. The Bank of Indonesia started to adopt
Basel II in 2008. In order to support the implementation of Basel II, the Bank of Indonesia
released regulation number 14/14/PBI/2012 concerning transparency and publication of
bank reports, under which banks must reveal their risks and risk management practices
to the public.
31
2.2.4 International Financial Reporting Standard (IFRS)
International Financial Reporting Standards are issued by the International Accounting
Standards Board (IASB). These standard were arranged by the (IASB), European
Commission (EC), International Organization of Securities Commissions (IOSOC), and
International Federation of Accountants (IFAC). Yuen, Liu, Zhang, and Lu (2009)
explained that Indonesia as a part of the IFAC suggests implementing IFRS in local
accounting standards.
The objectives of convergence are to make finance information as comparable as
possible, to facilitate competitiveness, make analysis easier and to forge good
relationships with customers, suppliers, investors and creditors. Implementation of IFRS
also helps companies which are listed on international stock markets to report their
performance using international standards, without reconciliation to IFRS. The purposes
of implementation of IFRS in Indonesia are to make financial reports both easy to be
understood and to be used by auditors, accountants, readers and other users. It is also
to increase international investors’ trust when they invest in Indonesia. It encourages
investors to invest in stock markets. With the standardisation of accounting and its
implementation by other countries, financial reports have a higher credibility, are more
accurate, and this more relevant. Starting from 1st January 2012, the Chartered
Accountants of Indonesia launched implementation of IFRS.
The objectives of IFRS 7 require entities to provide disclosure in their financial statements
that enables users to evaluate the following: first, the significance of financial instruments
for the entity’s financial position and performance. Second, the nature and extent of risk

32
arising from financial instruments to which the entity is exposed during the period and at
the end of the reporting period, and how the entity manages those risks. Qualitative
disclosure describes the bank’s management’s objectives, policies and processes for
managing those risks. Quantitative disclosure provides information about the extent to
which the entity is exposed to risk, based on information provided internally to the entity’s
key management personnel. Together, this disclosure provides an overview of the
entity’s use of financial instruments and its exposure to the risks they create (Mirza,
Orrell, & Holt, 2008).
All in all, since the experience of the October package in 1988, followed by the financial
crises of 1997 and 2008, the Capital Market Supervisory Agency and the BI have not
only made improvements and reforms, but also produced new regulations regarding
transparency for banks to require them to report their performance in more detail. To
make these financial reports compatible with international standards and comparability,
and easy to understand and use, the Bank of Indonesia has implemented IFRS for banks.
Moreover, in order to enhance financial stability, the Bank of Indonesia has produced
regulations which implement the requirements of Basel I-III.

33
CHAPTER 3THEORETICAL FRAMEWORKS
3.1 Introduction
This chapter begins by introducing stakeholder theory, and continues with agency theory
focusing on the problems its presents in the banking sector. There will be an explanation
of the importance of agency theory in relation to the research. It also considers agency
cost, how to minimise agency problems, and the relationship between agency theory and
a company’s performance, ending with a conclusion. The next theory to be considered
is communication theory, and the chapter will explain the importance of communication
theory for this thesis and the process of communication. Another theory is signalling
theory, and the chapter will describe the importance of signalling theory for this research
and how signalling started; there is also consideration of the relationship between agency
theory and information asymmetry, the importance of signalling theory for firms and
investors, signalling in the different types of firms, and problems with signalling. This
chapter will close with a conclusion.
Several theories could explain the disclosure phenomena, such as stakeholder theory,
agency theory, signalling theory, and communication theory. Nevertheless, in order to
explain disclosure supported by only a single theory is not comprehensively enough.
Linsley and shrives (2000) asserted that to explain the motivation of managers to disclose
more of the risks banks face, it would be more relevant when some of theories are
employed as an underpinning theory.

34
3.2 Stakeholder Theory
This section explains the importance of stakeholder theory in this research. It also
describes the definition of the stakeholders and the importance of stakeholders for a
company. Firms always deal with the stakeholders who play a crucial role in the
company's sustainability. Stakeholders are parties that have a relationship with
companies, and as part of this relationship communication with stakeholders must be
maintained.
3.2.1 Definition of Stakeholder
R. Edward Freeman was the pioneer of stakeholder theory. His idea was initiated when
he was arranging an executive education program in 1978. At that time he was trying to
find out how the relationship with stakeholders could be more effective. In their first
paper, he and Emshoff defined a stakeholder as “any group or individual that can affect
or is affected by the achievement of a corporation’s purpose” (Freeman, 2004, p.229).
Even though the definition has had some critiques, the idea of stakeholder theory has
been developed and it is always needed when scholars examine the relationship
between stakeholders and a company.
Post, Preston and Sachs (2002, p.8) stated “stakeholders in a firm are individuals and
constituencies that contribute, either voluntarily or involuntarily, to its wealth-creating
capacity and activities, and who are therefore its potential beneficiaries and / or risk
bearers”. In addition,Tencati, Perrini, and Pogutz (2004) argued that stakeholders
include employees, member/shareholders, the financial community, clients/customers,
suppliers, and financial partners such as banks, insurance companies, government, local
35
authorities and public administration, communities, even the competitors. In the banking
sector the stakeholders include depositors, investors, creditors, borrowers (debtors),
bank supervisors, and shariah supervisory boards. The view of a corporation of
stakeholders according to Post et al. (2002, p.10) and in combination with Freeman
(2010, p.55) is shown in figure 3.1.
Therese (2005) asserted that mass media is a crucial part in the communication between
stakeholders and companies. They can be a bridge to connect between companies and
stakeholders. Media are able to give information about the companies’ activities. Media
can even reveal if a company did something bad or lied to its stakeholders. In addition,
community has a power to force companies to disclose their performance if the
companies did something wrong. Along with that, companies must report their
performance honestly and transparently.
3.2.2 The importance of stakeholder theory in this research
In order to know whether the disclosure in annual reports can provide useful information
for stakeholders, and whether risk disclosure is value relevant for stakeholders or not, it
is necessary to clarify the definition of stakeholders and who they are. Stakeholders in
the listed and unlisted banks, Islamic and non-Islamic banks might not be the same;
hence, banks should consider who their stakeholders are. Because without
understanding who their stakeholders are, companies might not know how to provide the
information which meets stakeholders’ interests, what information is useful for investors,
suppliers, customers, creditors, regulators and other users, and what communication
medium is suitable for users.
36
This theory is useful for supporting the analysis in order to answer the fourth research
question, i.e. what is the value relevance of risk disclosure. If the information is fruitful
for stakeholders, it means information is value relevant for stakeholders and meets with
their interests.
3.2.3 The importance of stakeholders for a company
Sachs et al. (2009) asserted that stakeholders are important for a company; therefore, a
company should know the stakeholders’ interests. Stakeholders contribute benefit for
companies, and get profit from the firm, but stakeholders confront risks and can also
represent risks to the firm.
Companies cannot sustain without stakeholders; for example, firms cannot run their
operations without support by their staff or employees; firms cannot produce their
products if they do not have raw material because they did not have a good relationship
with suppliers. Banks cannot collect deposits if the stakeholders did not trust the bank.
When the company achieve a profit and has a plan to distribute dividends, the
shareholders might earn a profit from these dividends. Shareholders also can obtain
capital gains when the share price increases and vice versa. Nevertheless, when the
stakeholders are not satisfied with or do not trust the firm, they might complain and cause
harm for the company. They can loudly announce the issue to the public through the
mass media and cause a company to have a bad image. Post et al (2002) mentioned
that stakeholders are like assets of firms that must be managed and that are a source of
wealth to the company.

37
In figure 3.1, it can be seen that the company has thirteen groups of relationship, who
form the stakeholders. The association between company and each group is not only a
transactional linkage but also relational. A firm has to maintain and expand good
connection with stakeholders as the main link, in order to increase competitive
advantages for the firm’s sustainability in the future.
Source: Adopted from combination E. Freeman (2010, p. 55); Post et al. (2002, p. 10)
Figure 3-1 The stakeholder of the corporation
THECORPORATION
competitors
employees
financialcommunity,
investorsshare, owners
and lenders
tradeassociation,supply chainassociated
customersand users
unions
regulatoryauthorities
politicalgroups
prIvateorganisations
Governments
joint venturepartners and
alliance
localcommunities,
citizens
mass media

38
3.2.4 Summary
To sum up, the network of relationship with stakeholders is an important asset of firms
that must be maintained. There are thirteen kinds of stakeholders, which can be an
individual, company, group or organisation that can support the existence of a company;
without them a company cannot run well, and they are vital to the firm’s long term
sustainability. Conversely, they can harm the sustainability of the firm when they are
disappointed and do not trust the firm anymore. Along with that, a company should either
know what the stakeholders need or build a good relationship and communication with
stakeholders in order to ensure the survival of the firm.
3.3 Agency theory
This part explains the importance of agency theory related to the research, what agency
theory is, the agency problem, the agency problem in banking, agency costs, how to
minimise agency problems, the relationship between agency theory and company
performance, and it is closed by a conclusion.
Agency theory is widely used in economics for theorising the underlying relationship
between parties with a company or the business practices of the company. The main
principle of this theory is that there is a relationship between the parties who give authority
(the principals) to other parties who receive that authority (the agents). The shareholders,
as the principals, hire and give their authority to managers, as the agents, to manage the
company. Due to business development and keen competition, the managers have to
manage their companies professionally. In being given responsibility for the progress of
their company’s performance by their principals, the agents have to make reports

39
periodically. To measure the company’s performance, the principals use financial reports.
Hence, the agents are required to disclose financial performance and other relevant
information in their financial reports. The principals need more transparent information
because they will use the information for making decisions. Nevertheless, agency
problems can appear in the relationship between principals and agents.
3.3.1 The importance of agency theory related to the research
Agency theory will be an underpinning theory in this research, and the theory will be the
foundation for analysis in answering the research questions. Agency theory is very
important to clarify the extent and quality of risk disclosure in the annual reports that
provide information and that will be value relevant for users. Furthermore, this research
will employ agency theory to explain the association between the determinants of risk
disclosures in the banking sector. By disclosing the bank’s information, the stakeholders
get more information about firm’s performance and they are able to make good decisions.
Moreover, in describing voluntary risk disclosure, Linsley and Shrives (2006)
recommended that agency theory be employed as the underpinning theory.
In addition, Barako et al. (2007) stated that voluntary disclosure in financial reports can
be used as an example for the application of agency theory. Managers have more
information than users, and they are expected to deliver credible and reliable information
for the market. If agents offer complete information, the users can use the information to
make an investment decision and thus the information is value relevant for users and it
will ultimately increase firm value. Instead, because managers have their own interests,
they can sometimes withhold information and do not convey information more
40
transparently (nondisclosure). Thereby, the investors cannot obtain the necessary
information that would affect their investment decision.
Moreover, Healy and Palepu (2001) stated that asymmetric information between
principals and users in the agency problem can be minimised by disclosing voluntarily in
the financial reports. In addition, Fathi (2013) mentioned that in order to minimise agency
conflict, managers can deliver the company’s performance information to assure their
condition for shareholders and creditors by publishing financial reports transparently. In
other words, a conflict between principals and agents can be decreased by disclosing a
company’s information, meaning that stakeholders are able to employ more complete
information for making good decisions and ensuring that the firm’s information is value
relevant for principals. In addition, agency theory is expected to explain whether there is
a difference between the extent of disclosure in the annual reports in Islamic banks, non-
Islamic banks, listed and unlisted banks.
Agency and signalling theory are conceptually related, are coherent and able to be
amalgamated (Morris, 1987). By disclosing signals in the form of enhancement in the
communication of a company’s information, it is possible to decrease agency problem,
and increase the value relevance of the information supplied for stakeholders. Given this
agency and signalling theory will be used for reinforcing answers to the third and fourth
research questions.
By doing this research, the result can explain the importance of risk disclosure and
transparency in financial reports. By disclosing the financial reports, it will decrease the
agency problem between banks and stakeholders; hence shareholders can employ the

41
bank’s valid information in making a good financial decision. In addition, it will provide
input for regulators in order to encourage banks to make their performance reports
transparently and value relevant for users.
3.3.2 What is the Agency Theory?
Agency theory is one of the underlying theories of research on widespread voluntary
disclosure of information. This theory explains the relationship between two parties where
one party is an agent and the other is a principal.
Initially, the agency theory was based on Berle and Means (1932)‘s opinion. In the
corporation, there is a conflict of interest between managers and the owners. For aligning
the conflict, the government issues regulations for controlling their interest. The
managers have to report firm's performance and give information for the owners. Based
on the condition above, then the agency theory was developed by Michael C. Jensen
and William H. Meckling in 1976. Jensen and Meckling (1976) stated that agency theory
is an association between principals (for example shareholders) and agents (such as
managers of companies) where principals give the authority to managers in order to
manage the company and to make decisions.
The managers are agents of the shareholders, as owners of the company. The
shareholders expect the agents can be relied upon to act in their interests in accruing
wealth. Then, shareholders delegate their authority to the managers (agents) to perform
their function properly. Along with that, the managers receive incentives and should be
supervised appropriately. Supervision can be done through controlling their financial
statements, and restriction of management decisions. Those supervisions assure that
42
managers act consistently in accordance with the contractual agreement with the
company's creditors and shareholders.
The expected relationship is mutually beneficial to both parties and there is no conflict
between them, but in the process it is possible the agent does not act in accordance with
the wishes of the principals or principals do not give the benefit for agents. As the agent,
managers have a moral responsibility for optimizing the principals’ benefit by receiving
compensation as in the contract. Thereby, there are two different interests between
principals and agents where each party attempts to achieve their maximum wealth. As
the agent, the manager has internal information and a company’s prospects in the future
more than principals or shareholders. Hence, the manager has an obligation to send a
company’s performance signals to the shareholders, albeit that occasionally the
information is misaligned with its actual condition. This condition induces asymmetric
information.
The existence of information asymmetry leads to the possibility of conflict between the
principals and the agents. In the organisation, conflict between agents and principals
appears because they have different goals among members. It could happen because
of human nature. Eisenhardt (1989) highlighted basic assumptions of human nature,
namely first, humans in general are selfish (self-interest). Second, humans have limited
power of thought regarding future perception (bounded rationality), and finally, people
always avoid risk (risk averse). Based on the assumption of human nature, the resulting
information from the agent is questionable as to whether the information provided is
reliable or not.

43
3.3.3 The agency problem
The conflict between principals and agent has been explained in agency theory. A
relationship between agents and principals leads to conflicts. Agency problems arise
because there are different desires between two parties or among participants who have
cooperation, for example the managers and employees, bank with debtors and creditors,
or managers and shareholders. Jensen and Meckling (1976) argued that the
misalignment of interest between agents and principals can generate agency problems
because managers will do their jobs for their own interest and benefit and that outweighs
the requirement of the shareholders. The conflict could appear because the owners
always attempt to increase their wealth by increasing their shares, while agent will not
always act as the principals want. There is a separation function between owners and
managers hence they have different needs and objectives that will induce conflicts of
interest. Moreover, it will encourage information asymmetry in their relationship.
The agency relationship arises when one or more persons (the principals) employ
another person (agent) to provide a service and then delegate authority to the agent in
making decisions. Moreover, Healy and Palepu (2009), Morris (1987) stated that
information asymmetry and agency problems can appear in the relationship between
principals and agents. Asymmetrical information appears due to the managers having
more internal information about a firm’s condition than stakeholders because the
principals merely have access to information from financial reports.
Eisenhardt (1989) mentioned that problems in the relationships between principals and
agents arise when first, the agent has different interests than the principal, and each party
44
attempts to maximise their interests and wealth. Agents are supposed to carry out the
mandate from principal but they violate commitments by not always acting in the best
interest for the principal. Second, it is difficult and expensive for the principal to prove
what the agent has done in their business. Finally, the problem of risk sharing happens
when the principals and agents have different risks that have to be borne.
McAfee and McMillan (1987) maintained that adverse selection appears because agents
do not report the company’s performance transparently and hide the information. Along
with that, the principals do not have enough information and they are not sure whether
the information is accurate and credible or not. This could prevent the principals from
making good decisions. Furthermore, Arrow (1971) highlighted that the agency theory
could support the emergence of moral hazard. Moral hazard exists due to the agents’
reluctance conveying information to the principals transparently, even giving the wrong
information. The managers could also possess moral hazard because they deliberately
make wrong information available by exploiting information asymmetry for profit. The
managers’ attitude is one of the factors which affect the decision to make a firm’s
performance reports transparent. The agency problems in the communication theory are
illustrated in figure 3-3.
3.3.4 Agency problem in banking
A bank is an institution that acts as a financial intermediary accepting fund from
depositors (creditors) then lending money to other parties who lack funds as a loan
(debtors) or to invest in capital markets. Banks do not lend money deposited with them;
they create deposits through the act of lending. Werner (2014); McLeay, Radia, and

45
Thomas (2014); Tobin (1963) explained that a commercial bank also creates money
(see figure 4.3); when a bank makes a loan to a borrower and at the same time the money
is put in the borrower’s bank account. Banks must keep an amount of money as a reserve
in the central bank to serve when depositors withdraw their money (fractional reserve),
and the remaining money can be distributed as loans.
Conversely, Hasan (2011, p.16) mentioned that “Islamic banks have little option in the
matter of credit creation”. It is also supported by Papazian (n.d., p.19) who asserted that
“the methodology of money market and issuance in the Islamic banks still follow
conventional/ non-Islamic methodology”. He added that “the principles of Islamic finance
have not been applied to the very process of money creation and issuance”. Hassan
(n.d.) argues that sharia banks cannot create money through a fractional reserve.
Based on stakeholder theory, bank has a relationship not only with the shareholders but
also creditors and borrowers. Therefore, the bank faces more complex agency problems
which can appear between them. Based on the relationship between them, there are
potential agency problems namely asymmetric information, moral hazard and adverse
selection. Gow-Liang, Hsiu-Chen, and Chang-Hsi (2006) developed the concept of an
asymmetry bilateral information gap model between depositors, bank and debtors,
highlighting that agency problems appear both between creditors and the bank, and the
bank and debtors. Agency problems exist when creditors do not have enough
information for measuring the strength of the bank’s capital and it is therefore possible
that the bank may become insolvent. In addition, customers cannot intervene in
managing the bank; hence this induces the potential for emerging asymmetric
information. Creditors are only able to analyse the banks performance from previous
46
financial information and financial reports. They cannot find out about the banks current
performance, let alone future performance.
Due to the existence of information asymmetry, a moral hazard can arise. Moral hazard
is a situation where debtors tend to switch their investment. In addition, Jung (2000)
mentioned that agency problems exist between borrowers and lenders. Asymmetric
information appears in the bank when creditors cannot get information about debtors’
characters, quality and willingness to pay the debt. It means that a bank deals with risky
funding and credit defaults. Along with that, a bank’s actions lead to excessive risk taking
or underinvestment, asset depletion, or a decline in the value of collateral (Repullo &
Suarez, 2000).
According to Antonio (2001, p. 98) agency problem also appears in the relationship
between principals and agent in Islamic banks. The asymmetrical information exists in
the mudharabah contract when the creditors (shohibul maal/owner of the funds) have
different interest with the debtors (mudharib/enterpreneurs). The entrepreneur may
ignore the contract and may not act for the creditor’s interest, while the creditor is not
allowed to interfere in the management of her/his business and the creditors do not have
enough information access. Along with that, the entrepreneur has more information than
the creditors and induces asymmetrical information opportunities. In the mudarabah
contract, the risk may appear when the mudarib (entrepreneur) does not use the credit
appropriately for maximizing for both parties. Finally, it triggers the entrepreneur to
undertake moral hazards that are detrimental to the creditor. The risks in the mudarabah
contract are quite high. For example, first, side streaming exists when debtors do not
use the credit/funds as in the contract agreement. Second, debtors (mudharib) are

47
negligent and will fully use misconduct. Third, debtors are not honest and conceal the
profits. Along with that, in order to minimise the risk due to asymmetrical information,
Islamic banks make a clear contract before channelling the credit.
To sum up, banks deal with agency problems between stakeholders particularly in the
relationship between the creditors, depositors, banks, and debtors. In the Islamic banks,
agency problems can happen between mudharib (the entrepreneur) and shahibul maal
(the creditors).
3.3.5 Agency cost
Agency theory states that as the agent of shareholders, managers do not always have
the shareholders’ interests at heart. Hence, it requires monitors through binding agents,
examining financial statements, and restriction in making decisions by management.
Those supervisory activities induce agency costs. Moreover, Jensen and Meckling
(1976) stated that agency cost consists of first, the monitoring expenditure by the
principals. Monitoring costs incurred in principal for monitoring the agent’s behaviour,
include the cost for controlling agent’s behaviour through budget restriction and
compensation policy. Second, the bonding cost incurred by agent for ensuring that the
agent will not use actions that would harm the principal or to ensure that the principal will
be compensated if they do not take a lot of action. Finally, a residual loss is a decreasing
of welfare level of the principal after an agency relationship.
Agency costs are used to control manager’s activities to ensure the managers act
consistently in accordance with the contractual agreement between agents and
shareholders. In other words, agency costs arise because of a conflict of interest between
48
corporate managers, stock holders, and bond holders. Corporate governance
mechanism can reduce conflicts between principals and agents. Furthermore, agency
cost can be decreased by some mechanisms or manners. Chen, Lu, and Sougiannis
(2012) stated that by enhancing corporate governance, the firm is not only able to reduce
agency problems but also minimise agency cost. In addition, Sheu et al. (2010)
mentioned that differing information between managers and investors can be reduced by
disclosure in their annual reports. Companies which disclose more in mandatory and
voluntary reporting to stakeholders can minimise agency conflicts between managers
and stakeholders. This also shows that they have a better governance system, hence
increasing the firm’s value. As well as, Fama and Jensen (1983); Fama (1980)
highlighted that based on agency theory, best practice in corporate governance
implementation can reduce not only asymmetric information between managers and
stakeholders, but also mitigate information risk, agency risk and default risk.
Furthermore, Craswell and Taylor (1992) argued that in the agency problem, asymmetric
information appears because the agents have more information than the principals. It
can be reduced by corporate governance mechanism through disclosure and by making
reports transparent. This also induces a reducing agency cost and agency problem, and
increases firm value. Corroborating the statement above, Jensen and Meckling (1976)
found that agency cost of the companies with high leverage, when most of the equity is
from external sources is lower than companies which have low leverage. Furthermore,
by decreasing the border between owners and managers in the managerial ownership,
it will minimise agency cost. Likewise, Watts and Zimmerman (1983) reported that big

49
companies will more likely disclose than small firms in order to reduce asymmetric
information and agency cost.
3.3.6 How to minimise agency problems
Jensen and Meckling (1976) have explained that managers are the party that are
contracted by shareholders for managing the company in the shareholders’ interest.
Hereby, shareholders give the authority to the manager for making a decision. Along with
that, managers must be responsible for what they do for the shareholders.
In order to underpin the relationship between principals and agents, they may make a
contract which can bridge and accommodate their interests therefore they should not
hide the information which can be used in their interest. Kaplan and Stromberg (2003)
mentioned that to anticipate and regulate every potential situation that may arise over the
duration of the relationship, firm can make an agreement with a clear explanation of an
agents’ duties in the contract; however, bounded rationality makes it impossible for the
contracting parties to execute complete contacts. Theoretically, agency problems can
be eliminated by a complete contract that prescribes and describes each party’s rights
obligation and authority under all future circumstances.
In addition, differences in access to information between managers and investors can be
reduced by disclosure in organisation annual reports. Companies which disclose more
in mandatory and voluntary reporting to stakeholders can minimise agency conflicts
between managers and stakeholders. Based on agency theory, in order to minimise
asymmetrical information between managers and stakeholders and also to reduce
agency costs, big companies will report their condition by disclosing more information
50
(Watts & Zimmerman, 1983). Moreover, Holm and Laursen (2007) reported that
asymmetric information between principals and agents induces agency problems and it
can be reduced by commitment of managers to report their performance transparently.
Furthermore, in order to control if the managers do not act or act out of the contract, it
requires a supervision mechanism. In addition, Repullo and Suarez (2000) highlighted
that the moral hazard problem between debtors and creditors can be minimised by
monitoring the debtor’s finance. Voluntary disclosure is a part of the monitoring process.
All in all, agency problems such as information asymmetry, adverse selection and moral
hazard can be decreased not only by transparent contracts or agreements between
principals and agents, but also by commitment in making voluntary financial reports more
suited to disclosure and supervision.
3.3.7 The relationship between agency theory and firm’s performance
Despite researchers using agency theory to answer the riddle of the relationship between
managers and agents, the results are still in debate. Agency theory mentioned that in
order to minimise agency conflict between principals and agents, companies with higher
profit will represent their performance to stakeholders by giving more information and
disclose the information in their interim report (Elzahar & Hussainey, 2012). Furthermore,
Akhtaruddin, Hossain, Hossain, and Yao (2009) argued that agency theory posits a
positive correlation between profitability and disclosure. By contrast, Ho and Taylor
(2007) reported that disclosure and profitability have a negative relationship. Further, an
insignificant impact of profitability on the levels of disclosure was found by Aljifri (2008).
51
Hence, there are three different perspectives using the agency theory therefore, it is of
urgent importance to test the determinants of risk disclosure in the bank sector.
In addition, agency theory states that firms with higher levels of financial leverage tend
to provide voluntary disclosure in order to fulfil creditors’ needs and reduce the amount
of wealth transfer to shareholders (Jensen & Meckling, 1976). Moreover, agency theory
suggests a direct relationship between a company’s leverage and the
comprehensiveness of disclosure. They convey that to satisfy the desires of
stakeholders, companies with high leverage will reduce costs and will give more narrative
and meaningful information in their annual report. Companies with high leverage want
to show that they will not fail to meet their agreements and they therefore disclose more
voluntary information.
3.3.8 Summary
Agency problems appear in the banking sector between creditors, banks, debtors, even
shareholders. Agency conflict arises when creditors do not have valid information about
bank’s performance for measuring the strength of the bank’s capital and the possibility
of the bank’s insolvency. Conversely, banks deal with risk, when debtors are not honest
and invest their loan into risky businesses. Agency problems are able to appear in the
Islamic banks as well. The asymmetrical information exist in the mudarabah contract
when creditors (shahibul maal) have different interest to debtors (mudharib /
entrepreneurs). Even entrepreneurs ignore the contract and they switch the credit into a
risky business, and make a false report.
52
In order to minimize agency problems, it requires monitoring through binding agents,
examining of the financial statements, and restrictions in decision making by
management. Nevertheless, those supervisory activities induce agency costs, namely:
the monitoring expenditure by the principals, the bonding costs incurred by the agent,
and a residual loss. In other words, agency costs arise because of a conflict of interest
between corporate managers, stockholders, and bondholders.
Moreover, by reporting their performance with more disclosure, asymmetrical information
between managers and users can be minimised. That is why the managers must explain
their firm’s condition in the annual report more transparently. The companies which
report their financial performance transparently will give more information and value
relevance for stakeholders. Along with that, shareholders are able to employ the
company’s information for making a good decision. The companies have to maintain a
good relationship between agents and stakeholders as the core linkage, in order to
generate competitive advantages for a firm’s long term sustainability.
All things considered, due to signalling theory and agency theory having a relationship,
this research employs those theories as underpinning theory. The agency theory will be
used for explaining the extent and quality of the risk disclosure practice of listed banks,
unlisted banks, Islamic banks, and non-Islamic banks. Furthermore, this research gives
input for regulators in supporting the importance of risk disclosure to the banks by making
financial reports transparently.
53
3.4 Communication Theory
This part explains communication theory because it relates to delivering a company’s
information as signals for users through financial reports. But, in conveying information
from the agent (sender) to the principal (receiver), problems appear in associating
agency theory, signalling theory and asymmetric information (Oliveira, Rodrigues, &
Craig, 2011).
3.4.1 The importance of communication theory related to the research
Good communication between firm and stakeholders is essential, related to how the firm
sends signals, whether the firm communicates with stakeholders by appropriate
channels, whether stakeholders receive the information as what they need, and finally,
whether the information is useful for stakeholders. The information about the firm
performance can be delivered through annual reports, but in delivering the signals it can
be disturbed by noises. Thereby the information or messages could not be accepted by
users completely; therefore the information cannot meet what the stakeholders need.
This theory is useful to support the analysis in this study in order to answer the research
questions. From the result of the extent of risk disclosure in the annual reports, it can be
seen whether banks have sent the information more transparently or not. It means when
banks describe their performance with a small number of risk keywords it might connote
that they did not send signals and information in more detail, and it could be there is a
noise in their communication. Moreover, the information can be misinterpreted by
stakeholders and it is not useful for them, therefore it is not value relevant for users.

54
3.4.2 Communication process
The first mass communication theorist is Harold Lasswell (1948). He suggested a simple
theory that communication can be defined as : who, says what, in which channel, to
whom and what is that effect. If the theory is applied in this research, then the manager
is the ‘who’, representing the company reporting the firm's performance in the form of
annual and financial reports, this is the ‘what’; through the web site or regular reports to
regulators, this is the ‘channel’; financial statements issued for the needs of users, these
are the ‘whom’ which will be used as a material consideration in decision-making, this is
the ‘effect’. Corroborating with Harold Lasswell theory, Shannon and Weaver drew the
communication model as shown in figure 3-2.
Source: Shannon and Weaver (1948, p. 2)
Figure 3-2 Schematic diagram of a general communication system
Shannon and Weaver (1948) (SW) identified three levels of problems in the
communication theory. First, Level A (technical problem): how accurately messages can
be delivered? Second, Level B (semantic problem): how symbols can be delivered
INFORMATIONSOURCE TRANSMITTER RECEIVER DESTINATION
SIGNAL RECEIVEDSIGNAL
MESSAGE MESSAGE
NOISE SOURCE

55
precisely as the desired meaning. Finally, Level C (effectiveness problem): how the
effectiveness of the received meaning affects behaviour based on the desired manner.
The point of each level is to understand how to develop the accuracy and effectiveness
of a process. Nevertheless, in reality, there is noise in the communication process that
can interfere with the reception of messages. Noise is something contained in a signal
during the process of sending and receiving an unexpected message from a source. In
the broader concept, noise is anything that is able to make the expected signal more
difficult to interpret accurately and noise can affect the way the messages are received.
This theory is very important to clarify the extent and quality of risk disclosure in the
annual reports that provide information and that will be value relevant for users. Since
communication between company and stakeholders are delivered by many channels, the
mode of communication will induce different perceptions in different users, thereby firms
have to send information and signals transparently and in more detail. If companies can
send and deliver signals of risk information to the markets in more detail and more
transparently, it might help users to improve their decisions.
3.4.3 Summary
All in all, the communications are messages or signals delivered by the source (company)
to a receiver through channels either directly/indirectly, with the purpose of the source
influencing the receivers. Buser and Hess (1986) mentioned the certain elements need
to be fulfilled such as: who, says what, in which channel, to whom, with what effect.
However, in the delivering process, the communication might be disturbed by noise
resulting in different information being received and not in accordance with receiver’s

56
expectations. If the firm can deliver information in more detail, it might help users easily
to understand and improve their decisions.
3.5 Signalling Theory
Robert Jervis introduced the term “signals” in 1970 and then they were later defined by
Michael Spence (1973). Spence defined signals as manipulative attributes that convey
information about the characteristic of the agent (companies) in the market. A signal is
the information conveyed by the agent (sender) to the principals (receiver of information)
through signs that can give certain indications.
Pertaining to signals, Spence introduced the concept of signalling theory in 1973. The
main intention of the signalling theory was to determine whether a signal credibly delivers
information (Spence, 1973). Moreover, many studies employ signalling theory to explain
disclosure of the firm’s annual reports.
Signalling theory suggests how a company gives signals to users through financial
reports. This signal contains information about the results of managers’ activities to
realize the owner’s wishes. The signals can be a firm’s performance such as financial
and annual reports or other information, which states the company's prospects are better
than others. According to Oliveira, Rodrigues, and Craig (2006), signalling theory in
organisations will signal news to investors and other stakeholders through voluntary
disclosure.
The manager might send the information but not in accordance with the actual situation.
The statements used for camouflage are signals referred to as non-verifiable statements
Estrada (2011). Leshem (2012) mentioned that non-verifiable information is an example
57
of vague signals and a company's annual report delivers the information in the form of a
positive/negative signals, good/bad news. Companies deliver the information in order to
camouflage bad performance in relation to the firm’s condition. Managers convey the
signal in order to reject the commitments or promises to make dividends payments to
welfare shareholders, because the company has a duty to fulfil it. Although the company
has delivered signals through statements in the annual reports, it is very difficult for users
to know whether the manager has lied or not.
3.5.1 The importance of signalling theory related to the research
Signalling theory underlines that information is very important in the decision making
process for stakeholders. Users perceive that the information by the managers of
company will give signals that are essential, because the information provides notes,
opinions and explanations about the company’s previous, current and future situation.
Investors need accurate, relevant, complete and up to date information in the annual
reports as a tool for enabling them to consider which investment to choose to create a
diverse portfolio and combination of investment based on risk preference. Hence,
companies should report their financial statement more transparently.
Signalling will be an underpinning theory in this research, and the theory will be the
foundation for analysis in answering the research questions. Signalling theory is very
important to clarify the extent of risk disclosure in the annual reports that provide signals
and it will be value relevant for users. This research will employ signalling theory to
explain the association between the determinants of risk disclosures in banking sectors.
However, Linsley and Shrives (2006) recommend agency theory and signalling theory
58
as the underpinning theories for describing voluntary risk disclosures. This is
corroborated by the finding of previous researchers, Sheu et al. (2010) who used
signalling theory for explaining the reason why companies deliver voluntary information
to users.
In addition, the signalling theory is expected to explain whether there are different signals
related to risks in the annual reports of listed and unlisted banks, non-Islamic banks and
Islamic banks. Moreover, this theory became the study’s basis for explaining whether
mandatory and voluntary risk disclosure reported by the bank provide signals and are
relevant or valuable to users.
Furthermore, through the signalling theory, this research is expected to provide evidence
of the importance of transparency and disclosure in financial reports. Along with that, the
regulators will consider how to enhance the regulation related to the extent of risk
disclosure for banks’ financial statements. In addition, it will provide input to the
regulators in raising awareness of the importance of banks widening their disclosure in
financial reports, so reducing the information gap between users and managers.
3.5.2 How did it start
Spence explained the theory by observing the behavior of signalling between jobseeker
and employer. The essence of the job market signalling model is that the employer does
not have complete information about the ability of prospective employees, which will
affect their future productivity, because they add value for employer. The information gap
between two parties, employees and employers, generates an information asymmetry.

59
Spence was influenced by the seminal work done by Akerlof in 1970. Akerlof (1970)
explained the information asymmetry by conducting market research on the mechanisms
that explain quality and uncertainty. In his article, he used the example of buying and
selling new and used cars, dividing them into good and lemon (bad). The sellers have
more knowledge about the quality of a car than the buyers. Even though they sell new
cars and used cars, the cars can be sold at the same price. Buyers have the opportunity
to buy a good used car, depending on the ability of sellers to explain about the car. It
means, information is prominent for users not only customers but also firms,
stakeholders, investors, regulators, and competitors because information influences
them in making a decision.
Dobler (2008) mentioned that economics-shock threat and economic market growth in
line with capital market development generate the importance of a company's
performance information for investors and prospective investors. In the investment
decision-making process, it is assumed that investors employ rational considerations.
Therefore, investors require information both externally, such as economic and political
factors, and internally, such as financial statements and annual reports. Investors will
analyse financial reports through signals such as financial ratios and narrative reports
related to a company’s previous activities and their prospects in the future.
Studies involving economics and finance engage with signalling theory to explain the
reaction of managers, investors and other interested parties when receiving information
from the annual report. The signalling theory has interconnected with information
asymmetry. Information asymmetry arises when management has more information
about the company's prospects, those managers (insiders) generally have, not only more
60
and better information but also quicker access to a firm’s conditions and the outlook of
the company than investors. The firms deliver good or bad signals, clear or vague, for
users through mandatory and voluntary disclosure in annual reports. In order to minimise
asymmetric information, managers should convey information in the annual reports more
transparently and disclose to users. However, a firm can choose to disclose information
or not in an effort to reduce asymmetry. While a good performance company wants to
distinguish itself from a low performance company, they should deliver information more
transparently and build credibility through voluntary disclosure. Yet, if a bad performance
company delivers deceitful information, it can be uncovered and then users do not believe
the company and would consider the credibility of the report to be suspect. Interpretation
of the signal of information depends on individual perception and rational. The more
informative and transparent the information, the clearer the information will be received
and its value understood as relevant for stakeholders.
3.5.3 Relationship between Agency Theory and Information Asymmetry
Signalling theory has a relationship with agency theory and information asymmetry.
According to Morris (1987), there are assumptions that can show the relationship among
signalling theory, agency theory and information asymmetry. First of all is the need for
necessary condition. This condition describes that each person will try to achieve
maximum wealth and there is a separation of resource ownership and control. For
example here could be a conflict of interest between investors and managers in which
investors want to get high dividend whereas managers do not want to distribute their
profits because they want to reinvest in order to make more profit. A gap between agent
and principal as an agency problem would not appear if those assumptions were

61
compliant. Second, a separation of ownership and control between managers and
investors shows that there is information asymmetry. An occurrence of information
asymmetry will generate an agency problem.
Healy and Palepu (2001) argued if investors and managers do business together it
complicates and generates two problems: (a) information problems and (b) agency
problems. These problems have an impact on financial and annual reports. Therefore, in
order to improve these reports, the problems mentioned must be overcome. These two
problems can be defined as first, asymmetrical information. Vitezic (2011) asserted that
the conflict between managers and investors can appear because manager has internal
information more than stakeholders. The manager has an obligation to demonstrate the
company’s performance to shareholders clearly through the annual report. Nevertheless,
that information does not always reflect the firm’s real situation. Second, agency problem
arises because investors are not active in a management role and delegate too much to
the manager. This situation encourages managers prefer to fulfil their own aims rather
than do the company’s objectives. Consequently, the managers act their self-interest
and may make decisions which not accordance with investors’ interests.
Signalling theory is fundamentally concerned with reducing information asymmetry
between two parties (Spence, 2002). Signalling theory, by contrast, requires information
asymmetry. Signalling will appear if an agency problem exists and an agency problem
itself needs information asymmetry. The findings of Abraham and Cox (2007) agreed
with those of Elshandidy et al. (2011) who stated that managers present more voluntary
risk disclosure to decrease information asymmetry in accordance with agency and

62
signalling theory. To sum up, information asymmetry may appear as a signalling
phenomenon and can be minimised by disclosure.
3.5.4 The Importance of signalling theory for firms and investors
According to signalling theory, there are two parties that are interconnected i.e. the
company (agent/signaller/messengers) and the user (principal/receiver) as a recipient of
information. The essence of the theory is the relationship between the signaller that
delivers signals as an insider (such as executive or manager) and who has more
information about the company (Spence, 1973), with outsiders (users) who do not have
complete information about the company. The manager has good and bad information,
and the investor will assume the information is useful as a consideration in making a
decision (Connelly, Certo, Ireland, & Reutzel, 2011).
The annual report is one the information types released by a company that deliver signals
for users, especially for investors. The information in the annual report includes
accounting information relating to the financial statements and non-accounting
information that are not related to the financial statements. The annual reports should
contain relevant information and disclose information needed by users for taking a
decision. The information in the annual report is salient for investors to reduce uncertainty
and give reassurance about the prospects of the company’s performance in the future.
In turn, ensuring the usefulness of narrative information reduces the information
asymmetry that arises from an agency relationship between investors and managers.
Managers give signals by delivering good and bad news voluntarily. This reduces the
cost of reputation damage and prevents decline in share price (Skinner, 1994).
63
Annual reports provide fundamental information for investors before deciding to buy or
sell shares, because a company with a favourable financial condition is likely to see its
stock price rise so that the information gives a positive signal to shareholders. When
negative stock market shocks happen, firms will deliver information more transparently
(Fiechter & Zhou, 2013). The emphasis of signalling theory is on discussing good
information in order to deliver the positive characteristics of a firm. A good financial health
will ensure stock prices rise, providing the shareholder with a positive signal. However,
when the information is negative the stock price will fall providing a negative signal to the
shareholder. Connelly et al. (2011) mentioned that in making decisions, according to
signalling theory, investors gain an advantage after receiving the signal from the
company. For example, the investor will benefit when they buy the shares of a company’s
that signals good future performance.
Moreover, investors value the information because by getting information they can make
more valuable investment decisions. In addition, information can reduce asymmetric
information and agency conflicts between managers and investors. In other words,
voluntary disclosure provides value relevant information for investors. Signalling theory
argues that the company gives signals to the stakeholders in order to enhance its value.
Gordon, Loeb, and Sohail (2010) mentioned that by signalling, a company is able to
increase its value. The managers disclose voluntary information in the annual report to
send signals for investors, thus it is expected to affect stock market value and that is
consistent with increased firm value.

64
3.5.5 Signalling in different types of firms
Eccles (2001, p. 192) remarked that companies with more transparency will increase
their credibility in the view of users, because they feel confident with their capability and
strategy. Companies will not be afraid to describe their market plans and how well they
are doing. Along with that, signalling theory suggests that highly profitable companies will
send signals of their quality to investors (Watson, Shrives, & Marston, 2002). Highly
profitable firms disclose more and are prone to provide information more repeatedly in
their reports due to signalling for adverse selection. Signalling theory suggests that more
profitable firms disclose more to inform their stake-holders about their good performance,
but based on agency cost theory, less profitable firms disclose more to contextualize their
worse financial performance (Inchausti, 1997). Moreover, Elshandidy et al. (2011) stated
that large, lucrative companies provide more risk disclosure than small and less profitable
companies in order to signal their capability to identify and handle their risks. They found
that low profit growth companies reassure users about their prospects of profit and growth
through being more transparent in their voluntary disclosure.
In addition, Jensen and Meckling (1976) mentioned that to fulfil shareholders’ demand,
companies with high leverage provide deliver signals in more disclosure in the form of
narrative information in their annual reports. This is because such firms desire to
reassure the creditors and show their capability to pay debts.
Despite this, a company suffering from bad liquidity can disclose as much information as
possible in order to secure their financial condition by assuring users of their underlying
strength, even if they are reporting a poor performance for that year (Wallace, Naser, &

65
Mora, 1994). Based on the signalling theory, high liquidity firms will disclose more and
show better signals than firms with low liquidity. Marshall and Weetman (2007) asserted
that there is a positive correlation between disclosure and liquidity. In contrast, (Wallace
et al., 1994) revealed that companies with low liquidity will disclose more in order to
convince investors, while (Elzahar & Hussainey, 2012) mentioned that the relationship
between disclosure and liquidity was an insignificant association.
Fiechter and Zhou (2013) revealed that during turbulent times, small banks in Europe
provided more signals and produced longer financial statements as they had to adjust to
the big banks’ performance. Moreover, the benefit of increased disclosure on small banks
was higher than large banks. Based on signalling theory, a well performing company will
disclose more information than distressed firms (Ross, 1979). Big companies have a
strong financial motivation to disclose more in order to achieve a good corporate standing
and public representation and this also shows better news for stakeholders in big
companies than small firms.
Signalling theory can explain the relationship between information asymmetry and
dividend policy. Dividend payment is a signal for shareholders that illustrates the
company's future prospects. Nevertheless, it is possible that information asymmetry may
appear between shareholders and management because of changes in dividend
payments.
The change in dividend payments affects the stock price reaction in the market.
According to signalling theory, share price trends will move upward if dividends increase.
Conversely, the stock price will decline, if the announcement of a dividend is downward.

66
Increasing a dividend payment is a signal for investors that illustrates the company will
have better earnings in the future.
Furthermore, Hussainey and Walker (2009) mentioned that investors are able to predict
companies’ prospects in the future by using dividends as a signal as well as the level of
voluntary disclosure. In addition, they also mentioned that companies will pay dividends
to compensate investors equal to the level of risk involved in the investment. Firms with
low levels of disclosure will pay higher dividends than companies with high-level
disclosure. Therefore, based on signalling theory, dividends as a signal can be used to
predict a firm’s performance in the future and reduce asymmetry information between
companies and users. In addition, because of asymmetric information, when the firm in
conveying information about the company's prospects in the future, investors should
consider dividend information theory. If the companies increase the payment of
dividends, investors can assume those signals to be good news and vice versa.
3.5.6 Problem with signalling
Although signalling theory is widely used in finance and management studies, it has been
criticized and it has disadvantages. Gray, Owen, and Adams (1996) debated that
signalling theory is an example of when managers of companies disguise the fact that
the company they work for is not performing well. In addition, signalling theory is difficult
to explain when many principals are engaged.
Connelly et al. (2011) mentioned that companies and investors need each other, the
signal delivered by the company will be used by the users depending on the quality of
information and the extent of lying by the company in its annual reports.

67
Information asymmetry occurs when insiders or companies generally have more
information and quick access about current and future conditions than investors. Due to
asymmetric information, investors could find it difficult to assess a company's quality.
According to Spence (2002) investors on average perceived companies’ performance to
be lower when they were unable to understand information or felt it to be insufficient. This
condition is called pooling equilibrium because good and bad quality companies will be
pooled in the same rating. Moreover, a pooling equilibrium will occur if the users of
signals are not able to distinguish between companies, so that signals cease to be useful
as sources of information (Spence, 2002). Another drawback of signalling theory
according to Aburaya (2012) is that managers have attentiveness in disclosing
information.
Another problem with signalling is an agent’s failure to adequately pursue the interests
of the principles i.e. moral hazard and adverse selection. In providing such information,
signals mitigate the potential for moral hazard and adverse selection (Teece, 1996).
According to McAfee and McMillan (1987), adverse selection occurs when users cannot
perceive the quality of a firm they might invest in, and moral hazard exists when users
cannot detect the selected company’s actions. A moral hazard exists due to a lack of
effort on the part of the agent to convey signals, while adverse selection happen when
the agent does not behave in the manner preferred by the principal. Adverse selection
problems occur when there is "hidden information", hence users (principals) do not know
whether the information that was delivered was accurate or credible (Arrow, 1971). If the
signal is weak and principals do not realise, users will tend to assume all of the
companies as an average. This condition could lead to high-quality companies

68
withdrawing from the market rather than getting a negative view of the principals because
of such presumptions. Eventually investors will actually be harmed because they are only
able to access low quality firms.
Signalling theory could support the emergence of moral hazard. The managers could
possess moral hazard because they deliberately made wrong information available by
exploiting information asymmetry for profit (Arrow, 1971). Moral hazard is associated
with signalling theory when companies with good news disguise the signals. Instead
companies with bad news will only pass on information to ensure its condition, for fear of
the reaction of competitors (Dye, 1985). In addition, Penno (1997) mentioned that if a
company does not have good information they will not convey information, or because
they are not sure that the firm’s performance will not affect the reaction of users.
Furthermore, Okcabol (1993) suggested that in the conditions of competition, a company
may not disclose information in a transparent manner because it wants to protect itself
from the negative effects by covering or reducing the severity of bad news.
The managers’ attitude is the biggest factor affecting the decision to make a firm’s
performance public. The managers will think through the drawbacks and benefits before
delivering the information. They are reluctant to disclose the companies’ performance
because they worry that competitors will understand their competitive advantage. In
addition, Cerf (1961) mentioned when managers make their firm performance reports,
they might not understand what the users need.
69
3.5.7 Conclusion
Signalling theory was introduced by Spence in 1973 through his research on the
information gap between employee and employer. Signalling theory is beneficial for
explaining the behaviour of managers who have superior access to information
compared to investors. Researchers employ this theory to explain the behaviour between
agents (firms) and principals (investors) who access information, which is more
accessible to company managers.
The company’s annual reports contain information that serve as signals required by
investors. Investors employ signals as considerations in making a decision. Signalling
theory is valuable for companies and investors, because the information delivered by
firms provides signals that can reduce information asymmetry. However, the information
signs can be good or bad news, incomplete, less transparent or not in accordance with
actual performance. Furthermore, there are problems within signalling theory, namely
adverse selection and moral hazard. Adverse selection occurs when a company holds
information through which investors are unable to ascertain whether the signals are
accurate, credible or not. Likewise, moral hazard exists when a company withholds news
deliberately or does not convey full information.
A good or bad signal of information depends on the condition of the company. Companies
that have good performance may convey information more transparently than a firm with
a weaker condition. However, a company with poor conditions could also disclose more
in order to convince investors of its financial condition and prospects.
70
A corporate organization, with high profitability, will send more transparent signals to
show the quality of the company to investors. Low liquidity companies are also more
transparent in their delivery channels, seeking to guarantee investors of their future
performance levels through voluntary disclosure. In addition, companies with low
disclosure will pay greater dividends than firms that deliver information more
transparently because they consider that the information is employed by investors for
predicting the future performance of the company.
Signalling theory will be the theoretical basis of this study because it is used to explain
the different types of risk signals shown through mandatory and voluntary corporate
disclosure in the annual reports between listed and unlisted banks and between non-
Islamic banks and Islamic banks. Furthermore, signalling theory is expected to explain
the extent and quality of risk disclosure that conveys signals in the company's annual
report that are value relevant for investors. Finally, a company should provide mandatory
information and disclose more voluntary information to ensure that information
asymmetry between managers and investors is minimised.
Based on the understanding of signalling theory, the theory relies on rational thinking.
This implies investors should have the ability to adjust beliefs in order to respond to
information and signals in making decisions. In addition, this theory also relies heavily on
the receivers' sensitivity to understand signals properly as an opportunity or a challenge.
Furthermore, based on their understanding, investors should take a decisive stance in
making their financial decisions.
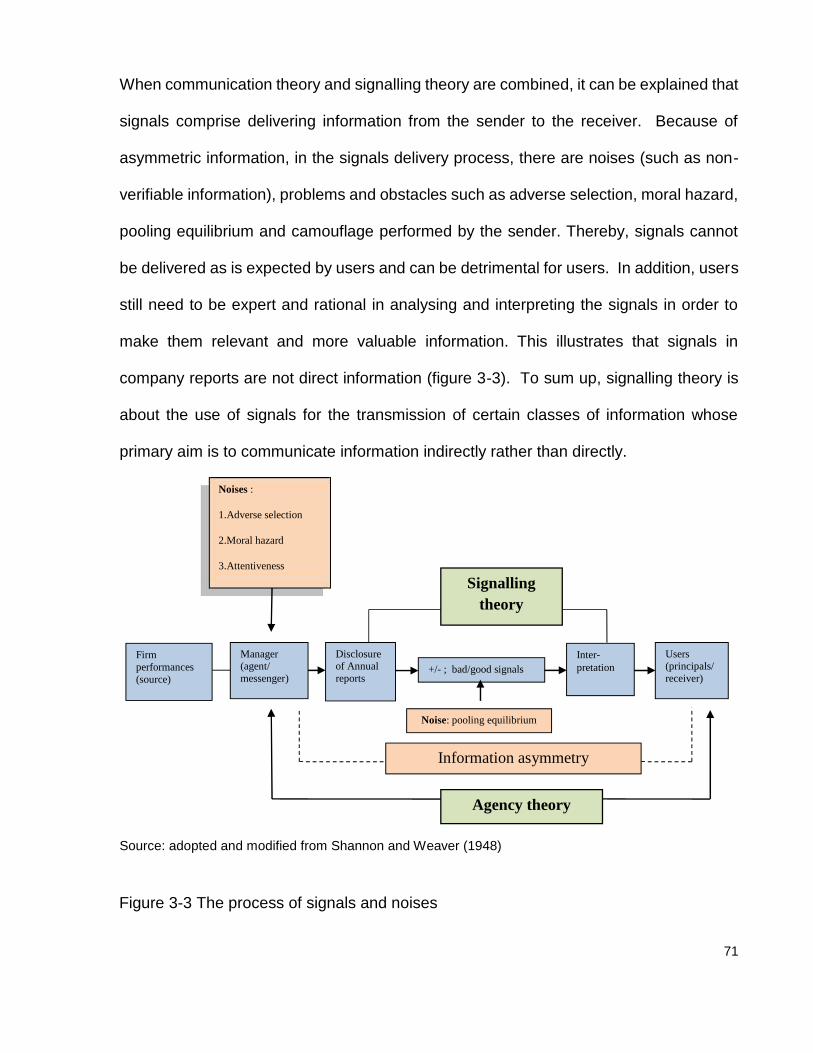
71
When communication theory and signalling theory are combined, it can be explained that
signals comprise delivering information from the sender to the receiver. Because of
asymmetric information, in the signals delivery process, there are noises (such as non-
verifiable information), problems and obstacles such as adverse selection, moral hazard,
pooling equilibrium and camouflage performed by the sender. Thereby, signals cannot
be delivered as is expected by users and can be detrimental for users. In addition, users
still need to be expert and rational in analysing and interpreting the signals in order to
make them relevant and more valuable information. This illustrates that signals in
company reports are not direct information (figure 3-3). To sum up, signalling theory is
about the use of signals for the transmission of certain classes of information whose
primary aim is to communicate information indirectly rather than directly.
Source: adopted and modified from Shannon and Weaver (1948)
Noises :
1.Adverse selection
2.Moral hazard
3.Attentiveness
Signallingtheory
Users(principals/receiver)
Inter-pretation+/- ; bad/good signals
Firmperformances(source)
Disclosureof Annualreports
Manager(agent/messenger)
Information asymmetry
Agency theory
Noise: pooling equilibrium
Figure 3-3 The process of signals and noises

72
CHAPTER 4LITERATURE REVIEW AND HYPOTHESES DEVELOPMENT
4.1 Introduction
This chapter has seven parts, consisting of an introduction, followed by description risk
disclosure, the determinants of risk disclosure, value relevance of risk disclosure, and
the differences between listed and unlisted banks, and Islamic and non-Islamic banks.
In the section on determinants and value relevance of risk disclosure, the hypotheses
are developed based on the gaps in the literature in terms of inconsistent results.
4.2 Risk Disclosure
The use of risk disclosure as the main variable will be described in this part, which
consists of six subparts i.e. describes what disclosure, risk, and risk disclosure are. The
type of disclosure, the quality of disclosure, and the consequences of risk disclosure.
4.2.1 What is disclosure?
The turbulence and uncertainty of economics mean that stakeholders require high quality
corporate information when considering investment decisions. In order to make a good
assessment, users need information to be detailed, accurate and transparent.
Subramanian and Reddy (2012) mentioned that disclosure occurs when information is
released for the public pertaining to companies’ activities and performance evaluation.
Moreover, disclosure reveals a company's performance as an evaluation of whether the
management manages its resources efficiently in the interests of stakeholders (Healy &
Palepu, 2001). All in all, disclosure is a kind of communication bridging companies,

73
managers, shareholders and other users - even competitors- regarding the evaluation of
company activities and transparent performance.
The BCBS (1998 p.15) defines transparency as public disclosure that must be
comprehensive and reflect the firm’s profile. Moreover, the firm information must be
relevant to market participants and supervisors. In addition, information must have
timeliness and be issued periodically in order for the information to be really fruitful when
it is needed by users. Furthermore, information must be reliable, valid, and not lead to
misconceptions, and the information in the reports should be easy to compare across
banks, countries and time. Finally, each part of the information must be material, and
useful as an input for consideration in making financial decisions. All of these criteria
must be applied in exploring the information necessary for stakeholders to be able to
evaluate and assess a bank’s financial performance and its activities, which enables
users to measure risks more precisely.
4.2.2 What is Risk?
Frank Knight was the first researcher who triggered a debate about a definition of risk,
after publishing his research into probability in 1921. Many definitions of risk can be
found. In the Financial Reporting Standard 5 (FRS 5, p. 9), risk is defined as “uncertainty
as to the amount of benefits. The term includes both potential for gain and exposure to
loss”. Risk can be perceived as uncertainty about the future that can make a loss or a
gain for somebody; however, it can be anticipated and mitigated. In accounting terms,
risk is the probability or unpredictability of loss. In addition, Shrand and Elliot (1998)
claimed that risk could be a kind of threat. Nevertheless risk could also involve
74
opportunities and all companies must be managed, including banks, because a bank is
a financial institution that deals with risks. So banks have to assess, control and manage
their risks. Banks and bank supervisors world-wide realize the importance of risk
management, because good risk management practices play an important role in the
efficacy of banks and the banking system as a whole.
The formal definition of risk, based on the finance perspective, is the volatility of the firm’s
underlying assets on its equity. The concept of risk from the accounting perception is
driven by the value of a firm. The investors are interested in how risky and how volatile
those assets of a firm are.
“Risk management is the process by which managers satisfy these needs by identifying
key risks, obtaining consistent, understandable, operational risk measures, choosing
which risk to reduce and which to increase and by what means, and establishing
procedures to monitor the resulting risk position” (Pyle, 1997, p. 2). In addition, according
to the Bank of Indonesia Regulation Number 11/25/PBI/2009 concerning risk
management is a set of methodologies and procedures used to identify, measure,
monitor, and control the risks arising from the business activities of a bank.
4.2.3 What is Risk Disclosure?
Companies, particularly banks as members of a financial industry, deal with risks. In order
to minimise risk, stakeholders need more risk information disclosure. By obtaining risk
information, users are more confident, less uncertain and able to minimise and mitigate
risks before making decisions. Some definitions of risk disclosure have been mentioned
by certain researchers. Risk disclosure, according to Linsley and Shrives (2006), is

75
happening if users receive information about opportunities, hazards, danger, harm,
threat, or exposure which has influenced the firm in the past, or this will affect the firm
performance in the future. While Miihkinen (2012) defines risk disclosure as information
that describes a firm’s major risks and their expected economic impact on future
performance. Risk disclosure is all the information that firms provide in their risk
exposure reviews, and they describe the firm’s performance and its risks and how it
copes with the risks in the annual report.
Moreover, the Basel Committee on Banking Supervision mentioned that in Pillar 3 of
Basel 2, risk disclosure has a positive effect on a bank’s performance, hence increasing
the banks’ competitive advantages in its industry (BIS, 2006).
4.2.4 Types of disclosure
In order to boost trustworthiness, and also to aid stakeholders to assess the firm’s
condition and strategies, companies have to provide information comprehensively. The
annual report is a prime medium for presenting information from the company to users.
The annual report consists of a finance ratios, analysis and report by management, and
financial report. In addition, an annual report communicates the financial condition and
other conditions (non-financial) for the shareholders, creditors, stakeholders and
potential shareholders to show the firm’s effectiveness in achieving its goals and the
corporate responsibility report of the organization (Healy & Palepu, 2001).
As sources of information, financial reports are needed by users for consideration in the
making of financial decisions. Providing sufficient information, accurately and fully, is an
integral part of financial reporting. However, for the well diversified equity investors, firm

76
specific risks are relatively unimportant in assessing the value of the firm. In addition,
even with the owners of unlisted firms they may well have substantial other equity
investments that are highly diversified. As a consequence they are as likely as investors
in listed banks to disregard firm specific risk.
Popova, Georgakopoulos, Sotiropoulos, and Vasileiou (2013) mentioned that there are
two types of disclosure related to the legal requirements: namely, mandatory and
voluntary disclosure. First, mandatory disclosure is the minimum disclosure required and
obligated by the regulations. Second, voluntary disclosure is a report which is carried
out voluntarily by the company without regulatory stipulation. The company willingly
explains other information exceeding the information which the company had already
described in the mandatory element of its disclosure report. Voluntary disclosure is
disclosure of information that offers more explanation over and above the minimum
requirements given in the regulations. Moreover, companies have discretion in
conducting voluntary disclosures within their annual reports; as a result, there is a
diversity of voluntary disclosure and wide variations between companies. Furthermore,
Diamond and Verrecchia (1991) asserted that mandatory disclosure is the revealing of
financial reports based on regulations; this disclosure is made by companies before they
know the substance of the information. By contrast, voluntary disclosure is the presenting
of firm information after a firm has paid attention to the contents and condition of their
performance, more than mandatory disclosure.
Extensive disclosures have evolved over time; these may have been influenced by a
range of factors: economic development, the social culture of a country, information
technology, corporate ownership, or regulations issued by competent authorities.

77
Stakeholders need additional information in the form of voluntary disclosure, for example:
a finance research paper that describes the main characteristics that affect the
company's performance, a corporate social responsibility report, or other added value
reports (Dragomir & Cristina, 2009).
To eliminate stakeholder doubts, they need additional information. Users therefore
increasingly demand that firms voluntarily disclose their resources to enable users to
judge a firm’s performance and value (Eccles, 2001). Along with that, by fulfilling users’
requirements, companies reveal their performance by disclosing voluntarily; hence
investors and creditors are able to measure investment risks.
4.2.5 The quality of disclosure
Disclosure of financial statements is a medium of corporate accountability for investors
that useful to consider when making decisions. In releasing information, a company has
to consider the quality of disclosure. Wallace and Naser (1995) stated that disclosure
should first align and be suitable for purpose. Second, information must be informative
for users. Third, the firm should convey not only good news but also bad conditions.
Fourth, the financial reports should have timelines or periodic reports. Fifth, the
information is able to be read easily and understandably by users. Sixth, the information
should be related to company risks, and analysis of performance. Finally, the company
should release the information completely and comprehensively.
Interestingly, when Muzahem (2011) was doing interviews with his respondents for his
thesis, there were some points of view about what constitutes good quality of disclosure,
such as: “full disclosure”, “relevant”, “accurate”, “understandable, fair, honest detailed,

78
complete, meet the need of the users”. In addition, Bagnoli and Watts (2005) argued that
the quality of disclosure is affected by the managers’ intentions, which affects whether
they will expose performance transparently or not. Before presenting with the firm’s
information transparently, the managers might consider what the contents of the
information that was reported will be: these contents may depend on the quality of the
information they choose to reveal, whether they are presenting bad or good news, and
whether it will trigger a firm’s value to decrease or increase.
Following the release of IFRS and Basel II, which detail requirements for disclosure in
the annual report, and also based on the experience of the financial crisis, conditions
support companies to be more transparent in revealing their performance (Höring &
Gründl, 2011). Nevertheless, although regulations generally require companies to report
their performance transparently, their descriptions sometimes still lack all of the firm’s
information (Oliveira, Rodrigues, & Craig, 2006). Moreover, Rajab and Handley-
Schachler (2009) insist that firms still lack full disclosure in reporting their conditions
hence the usefulness and relevance of risk disclosure in the annual reports were be
questionable. PricewaterhouseCoopers (2008) found that even though banks must
report their performance based on regulations, such as adopting IFRS and BASEL, they
still did not reveal their condition completely. Understandably, when there was difficulty
in reading and comparing their information it was not considered to be relevant for users.
4.2.6 The consequences of risk disclosure
Providing a disclosure of firm information in annual reports has some consequences,
which can be both benefits and disadvantages. Nevertheless, before deciding to release

79
firm information, managers will consider the costs and benefits of producing and
releasing the information, which will be in line with the magnitude of the benefits for the
company.
First, Cartwright (2006) stated that customers are able to get information such as
products, their prospect in the future, a bank’s condition and activities in more detail by
reading annual reports. Ariffin (2005) asserted that banks deal with many risks related
to their operations: these can be in their transactions, or even deceptive services such
bad behavior by their staff or customers, also risks caused by criminals. In doing so banks
have to explain their condition in more detail in order to ensure that banks can be trusted
and are safe for investing. Moreover, he also mentioned that banks which release risk
information more transparently not only help the stakeholders understand the bank’s risk
profile, but also makes it easier for shareholders to measure risks, so that they can
compare and choose banks with good performance and fewer risks.
Second, Botosan (1997) and Healy and Palepu (2001) asserted that by giving
transparent company information voluntarily, it is possible to minimise asymmetric
information between principals and agents. By disclosing risk information, the cost of
capital tends to decrease, which is good for risk management and corporate governance
improvement, besides which the users can use the information for exploring company
risks (Linsley & Shrives, 2006). Third, based on signalling theory, the company will
reveal private information voluntarily to convey bad or good signals, and this may be
relevant or irrelevant for investors or shareholders. Fourth, according to Elliott and
Jacobson (1994), exploring information more transparently meets investors’ needs in
80
order to give more detailed data and this creates less uncertainty for consideration before
making decisions; or a good prediction in the future.
Caruana (2011) asserted that disclosure is necessary not only because economic
conditions always change and there is economic turbulence, hence investors need risk
disclosure and accurate information for consideration before making a judgment for a
good financial decisions, but also because it is good for supervisory agencies in
overseeing the banks in order to create a stable financial system.
It has been shown that disclosure of firm performance can decrease the occurrence of
negligence that can result in banks failing or a failure in the future (Frolov, 2007).
Moreover, the advantage of disclosure is not only to allow investors to choose the bank
that has the most efficient portfolio credit, but also disclosure is relevant for reducing
uncertainty and making risk estimation low, therefore it can decrease the capital
requirements to cover risks (Poshakwale & Courtis 2005). Further, Ariffin (2005) also
highlighted that banks who report risks clearly and in detail with financial conditions, not
only make it easier for the supervisor to monitor and supervise them, but also to assure
that investors and depositors feel safe and confident.
Conveying information more transparently gives advantages for users and the company
itself. Abraham, Marstona, and Slack (2014) asserted the analysts can analyse the
information deeply and identify the outstanding companies by making forecasts as to
whatever they need, for example earnings growth and risks, in order to give
recommendations to their clients. While on the investors’ side, the information is the
most important source for making earnings predictions of profitability more accurate.
81
They interpret the data to portray a firm’s risk profile so that they can anticipate the risks
and consider them when making decisions.
On the company side, disclosure makes the cost of capital decrease. Besides, the
managers are able to depict what kind of risks they face and how and where the risk level
position is. By making a risk profile, companies are able to make risk strategies related
to their business strategies by considering the risk level of what they are taking on and
the tolerance level, or consider some aspects such as economics and financial
conditions, and the structure of organisation (Chakroun & Hussainey, 2013).
Campbell, Chen, & Lu, (2011) found that increased narrative risk disclosure in annual
report was associated with a number of market based risk measures. However, their
study also found that the usefulness of risk disclosure does not relate to company specific
information but to general industry disclosures. Miihkinen (2013) and Kravet & Muslu,
(2013) examined the value relevance of risk factor disclosure and found that risk factor
disclosure reduces information asymmetry and increases investor risk perception.
The disclosure information in the annual report decreases asymmetric information related
to share price (Elliott & Jacobson, 1994). . Declining asymmetric information encourages
the constriction of bid ask spread, and boosts trade volume, which results in an increase
in liquidity The higher the disclosure, the lower bid-ask spread is, leading to higher trade
volume and the higher liquidity, and vice versa.
Disclosure is also able to minimise litigation risk. Litigation risk is a risk that appears
because of legal action that can be brought by companies, debtors, creditors or investors.
Litigation risk happens due to the debtor/borrower company not acting as noted in the

82
contract, such as by delaying the payment or not being able to pay the debts. Litigation
risk could happen when a company does not give the truth or hides negative information
that causes the investors’ loss. Litigation risk can be reflected in share price and share
volume movement, and also can be measured by the liquidity and solvability ratio.
On the other hand, making information more transparent can also create disadvantages
for companies. Even though disclosure gives some pre-eminence, delivering information
transparently has drawbacks. First, by disclosing the company’s information, it could
expose their strategies to their competitors and even decrease their competitive
advantages (Darrough, 1993); Subramanian and Reddy (2012), such as technology
information (production process, marketing approach), plan and strategy (new target
market, product development), and the operation of firms (sales segments, production
costs) (Elliott & Jacobson, 1994). Moreover, competitors are able to produce similar
products or services or counter product even better, when they read product
development plans in the annual report (Elliott & Jacobson, 1994).
Second, reporting a company’s performance completely will increase costs and along
with that will result in increasing product prices and influencing profit and their
performance (Elliott & Jacobson, 1994). In addition, Bhasin (2012) mentioned that even
though disclosure in human resources or risk information is able to minimise
asymmetrical information, it puts a company at risk when it exposes its marketing
strategies, research and development or technology. Also disclosure leads to increased
product prices and competitors are able to read a company’s strategies.

83
Nevertheless, disclosing more information generally makes a positive image in the
stakeholders’ eye, declining asymmetric information, decreasing uncertainty, and it is
value relevant for stakeholders in making decisions; this can be achieved by minimising
litigation risk; increasing liquidity and supporting the stability of the financial system.
4.3 The determinants of risk disclosure and hypotheses development
The decision of managers to reveal the essence of firm performance means they might
consider firm characteristics. Previous research revealed the association between
disclosure and firm characteristics; nevertheless the results were mixed and had different
conclusions. The firm characteristics can be indicated by size, liquidity, profitability,
solvency and other indicators, but this research will employ five determinants that
potentially have a relationship with risk disclosure. They are as follows:
Firm Size
Cerf, in 1961, became the first researcher to assert that firm size affects the interim
disclosure (Cerf, 1961). Firm size is one of the most important factors impacting the level
of risk disclosure. The big companies have more stakeholders than small firms, and have
complicated business activities that drive disclosure in more detail. In addition, investors
in big companies therefore require more comprehensive reports than small companies’
reports, in particular to influence trading of their shares in the stock exchange market.
Based on agency theory, to minimise asymmetrical information between managers and
users and also to reduce agency costs, big companies will report their condition by
disclosing more information than smaller companies (Watts & Zimmerman, 1983;

84
Inchausti, 1997). Furthermore, a large company will be able to pay finance consultants
and analysts to write the company's report in more detail. Nevertheless, empirical studies
do not make a clear association between risk disclosure and firm size, although previous
research found a positive relationship between risk disclosure and firm size Höring and
Gründl (2011); Linsley and Shrives (2006); P. M. Linsley and Shrives (2005); Rajab and
Handley-Schachler (2009). Conversely, Aljifri and Hussainey (2007); Aljifri, Alzarouni,
Ng, and Tahir (2014) found a negative association between the level of disclosure and
firm size. While, Rajab and Handley-Schachler (2009); Popova et al. (2013) who tested
in the UK companies revealed that there is no correlation between risk disclosure and
firm size.
In this case, the association between risk disclosure and firm size remains unclear.
Based on agency theory, Watts and Zimmerman (1983) stated that big companies have
more complicated business hence they will disclose more than small firms in order to
minimize asymmetric information between managers and users. Along with that, this
research supposes larger firms have a strong motivation to disclose more information
and reduce risk uncertainty.
Based on those explanation, (H1): There is a positive association between the delta of
risk disclosure and the delta of firm size.
Liquidity
Liquidity is an ability of corporate management to generate liquid funds to meet
immediate obligations such as payments to suppliers and employees, and longer term,
for example debt repayments (Lee, 2006). In addition, liquidity ratio is a measurement
85
of a firm’s ability to pay short term debts and when the payments become due. A
company with a high liquidity means that the firm has a capability to pay short term debt
(Ward, 2009). Moreover, liquidity is also able for predicting asymmetric information
between managers and shareholders (Barakat, Chernobai, & Wahrenburg, 2014). They
also asserted that a company with a more transparent performance report not only
generates the increasing of liquidity, but also has a robust trustworthiness by
stakeholders such as supervisory board, regulators, shareholders and depositors. As a
generalisation, it can be calculated as current assets divided by current liabilities.
Appendix A shows some research relates to the association between disclosure and
liquidity, nevertheless it has different results. Espinosa, Tapia, and Trombetta (2005);
Marshall and Weetman (2007) found a positive significant correlation between liquidity
and disclosure.
By contrast, Bamber and McMeeking (2012) mentioned that when firms have lower
liquidity, they will disclose more and be aware of information in order to minimize
information costs. Furthermore, Wallace et al. (1994) asserted that the relationship
between disclosure and liquidity was negative significantly. While Agyei-Mensah (2012),
Elzahar and Hussainey (2012) asserted that the relationship between disclosure and
liquidity is insignificant. Thus, the association between risk disclosure and liquidity is not
clear. Yet, Marshall and Weetman (2007) highlighted that based on the signalling theory,
the high liquidity firms will disclose more and show better signals than the firms with low
liquidity.

86
Along with that, then this research supposes (H2): There is a positive association
between the delta of risk disclosure and the delta of liquidity.
Profitability
Profitability ratio is the persistence of a company to generate profit. Signalling theory
suggests that more profitable firms disclose more to inform their stakeholders about their
good performance, but based on agency cost theory, less profitable firms disclose more
to contextualise their worst financial performance (Inchausti, 1997). Moreover, a
profitable firm manager will show their capability to cope with risk by presenting risk
information (Elshandidy, Fraser, & Hussainey, 2013). Furthermore, Barako et al. (2007),
(Uyar & Kiliç, 2012) found profitability has a significant positive impact on disclosure level.
Mathuva (2012) corroborates the finding that profitability is also significant and is
positively related to disclosure, which seems to suggest that more profitable firms
disclose more. On the other hand, Elzahar and Hussainey (2012) explained that
profitability and disclosure of a firm’s information in the interim report has an insignificant
association. In addition, Aljifri et al. (2014) argued that there is no correlation between
disclosure and profitability. Thus, association between profitability and risk disclosure is
vague.
Meanwhile based on the signalling theory, companies with high profit will show their
performance by sending good signals to assure investors that the companies have good
finance (Watson et al., 2002). Moreover, Inchausti (1997) claimed that based on agency
theory, companies with high earning will disclose more in their annual report.

87
Referring to signalling theory then, this research supposes (H3): There is a positive
association between the delta of risk disclosure and the delta of profitability.
Leverage
Leverage or solvency is an ability of the firm to survive in the long run. Leverage is viewed
as a result of events that determines companies' source of financing to run the business.
Leverage or solvency is a term often used by companies to measure the company's
ability to meet their entire financial obligations if the company is liquidated. Leverage
describes the relationship between shareholders’ equity and long term debt and the
ability to indicate the degree of risk to shareholders by long term debt (Lee, 2006).
A company with a high leverage/gearing ratio indicates that total debt is higher than total
assets and that the company is not solvent (Horne, 1997). If there are companies that
have high asset and high leverage, it shows that such firms face high risk. In that
condition, investors would not invest in the company because they would be concerned
that higher asset is derived from debt, thereby increasing investment risk due to the
company being unable to pay debt on time. In addition, companies with small debt show
low leverage and tend to have low risk bankruptcy (Khan, Kaleem, Nazir, 2012) . This
may imply that a company with low leverage has the ability to survive longer and vice
versa. It is plausible that leverage is a signal that should be disclosed in the annual report
which can provide a company's business continuity information in the long run.
According to Jensen and Meckling (1976), agency theory suggests a direct relationship
between a company’s leverage and the comprehensiveness of disclosure. To satisfy the
desires of stakeholders, companies with high leverage will reduce costs and will give
88
more narrative and meaningful information in their annual report. Companies with high
leverage will show that they would not disobey their agreements and disclose more
voluntary information. In addition, agency theory states that firms with higher levels of
financial leverage tend to provide voluntary disclosure in order to fulfil creditors’ needs
and give a wealth to shareholders (Jensen & Meckling, 1976).
Naser et al. (2002) asserted that high leverage firms will disclose more in their reports to
indicate good signals in order to resolve their debts. Previous research on the association
between risk disclosure and leverage offers contradictory results. Rajab and Handley-
Schachler (2009); Elzahar and Hussainey (2012) corroborate the ideas of Linsley and
Shrives (2006) who suggested that leverage and risk disclosure has no significant
association. On the other hand a positive association between leverage and aggregated
risk disclosure have been found by Marshall and Weetman (2007); Ibrahim (2011);
Popova et al. (2013). Conversely, Dobler, Lajili, and Zéghal (2011) argued that leverage
and risk disclosure in the manufacturing sector in Germany has a negative relationship.
Thus, the association between disclosure and leverage is obscure. Nevertheless, agency
theory states that firms with higher levels of financial leverage tend to disclose more
information voluntarily in order to satisfy creditors and remove the suspicions of wealth
transfer to shareholders (Jensen and Meckling, 1976).
Referring to agency theory this research supposes (H4): There is a positive association
between the delta of risk disclosure and the delta of leverage.
Earnings Reinvestment
89
Dividends are payments from the company’s earnings to the shareholders either cash or
stock because they have invested their money in the company’s equity (S. Ross,
Westerfiled, & Jordan, 2008, p. 591). The investment objective of shareholders is to
improve wealth and to obtain returns. On the other hand, the company’s management
intends to increase corporate value. Dividends are still debated, the companies perceive
giving high dividends is good for shareholders and company, on the other hand paying
low dividends is good as well.
Dividend policy is the determination of the profit portion that will be paid to shareholders.
The amount of the dividend depends on the dividend policy of each company. If a
company has a high dividend it will increase the share price and finally increase the firm’s
value. Along with that, shareholders need dividend policy information to assess and
analyze the possibility of return that would be obtained if they invest in that company.
Roden and Stripling (1997) mentioned that a decision of dividend payments policy is an
important thing concerning whether cash flow will be paid to investors or will be retained
for reinvestment. A dividend reinvestment plan means that the firms will not pay
dividends but the company will reinvest the fund by issuing shares.
According to Bodie et al. (2011, p. 593), in the growth prospect, there are two dividend
policies. First, a low reinvestment rate plan, a dividend policy that the company pays a
higher dividend at the beginning of the period but the dividend growth will be lower in the
future. Second, a high reinvestment rate plan, the company will provide lower dividend
at the beginning of the period because the company will invest some of the profits for
expansion (reinvestment). However, with this policy, investors will receive a higher
dividend in the future.

90
Meanwhile, according to the dividend irrelevance theory by Miller and Modigliani (1961),
dividend policy does not have an effect on firm value and cost of capital. They believe
that a company's value will only be determined by the ability to generate profits and
business risk. Nevertheless, Baker & Powell (2012) mentioned that management pays
more attention to dividend policy because it can affect firm value and shareholder wealth.
The managers of Indonesia Stock Exchange companies perceived that dividend policy
influences firm value. Whereas, Lintner (1956) stated that dividends policy as “the bird
in the hand”, means investors prefer to receive dividends than capital gains. According
to them, investors perceive dividend yield as more certain than capital gains yield. On
the contrary, Litzenberger and Ramaswamy (1979) argued that due to the tax advantage
of dividends and capital gains, investors prefer capital gains because it can delay the
payment of taxes.
Another theory, the Clientele Effect states that the group (clientele) of shareholders has
different preferences on dividend policy. They mentioned that a group of shareholders
who need income now prefer a high dividend payout ratio. On the other hand a group of
shareholders who do not need money now prefer to hold the company's net profit.
Moreover, if there is a difference in taxes for individuals, the shareholders who are higher
taxed prefer to defer capital gains. It means that they prefer if the company pays small
dividends. Instead a group of shareholders who are taxed relatively low tends to prefer
to receive big dividends.
The signalling hypothesis states that if the dividends increase, it will be followed by a
rising of share prices and vice versa. According to Miller and Modigliani (1961),
increasing of dividends is usually a signal for investors to show the company is foreseen

91
to have a good income in the future. The investors believe that the decreasing or
increasing of dividends from the normal rate is a signal that the company will face
difficulties in the future.
An additional capital requirement is increasing in line with development of the company.
The company has alternatives to fulfil capital by increasing the number of shares by
issuing new shares or debt. If the company chooses the first alternative, there are several
ways it can be done, for example: selling shares to the existing shareholders, selling
shares to employees, issuing shares to the public in the stock market or adding stocks
from not shared dividends (dividend reinvestment plan).
Moreover, Bodie et al. (2011) stated that companies which distribute large dividends
initially will have low reinvestment opportunity and in the future dividend growth rate will
be low. Conversely, if the company has an earning reinvestment policy, while initially
investors will receive small earnings, in the long-term investors get benefits by receiving
high dividends thereby increasing the value of shares (figure 4.1). In other words, the
companies with a high reinvestment rate generate higher dividends. Finally it will boost
firm value.
Companies will pay dividends to compensate investors equal to the level of risk of their
investment. According to Baker and Powell (2012), to compensate for a high risk
investment, firms which have low disclosure are expected to pay higher dividends.
However while they expected that firms with low level disclosure will pay more dividends
than companies with a high level of disclosure, they actually found a positive relationship
between the quality of disclosure and dividend per share. Thereby, the company which
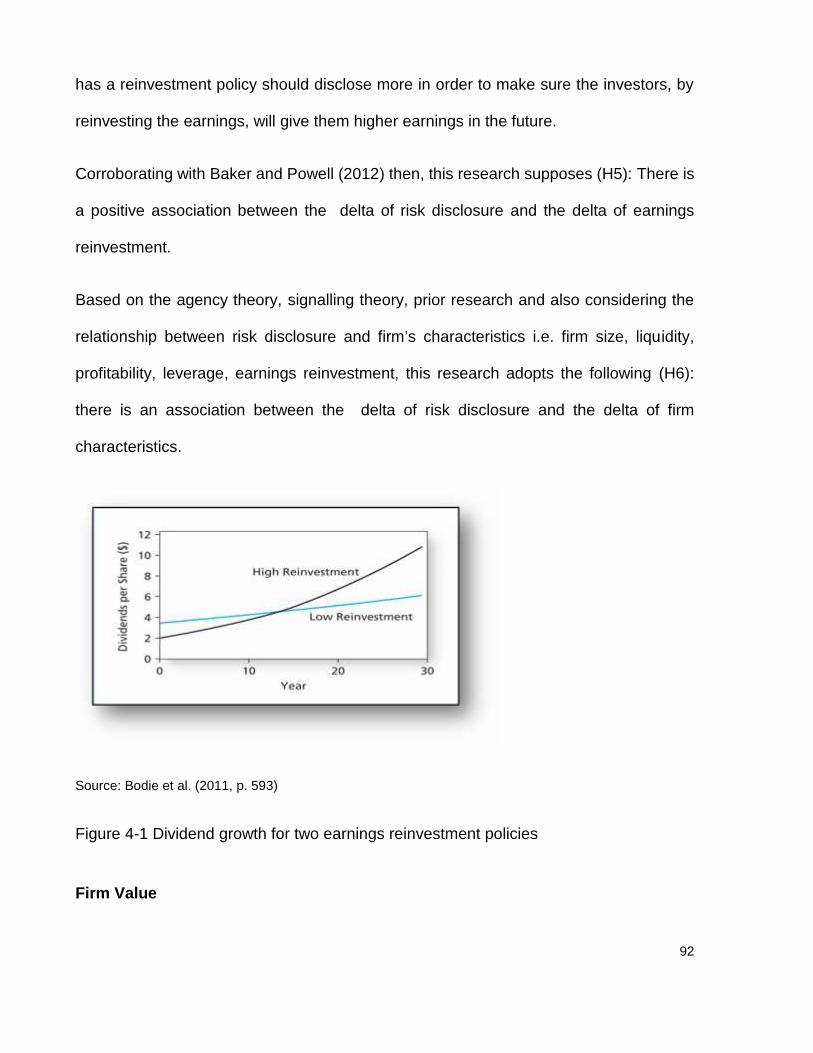
92
has a reinvestment policy should disclose more in order to make sure the investors, by
reinvesting the earnings, will give them higher earnings in the future.
Corroborating with Baker and Powell (2012) then, this research supposes (H5): There is
a positive association between the delta of risk disclosure and the delta of earnings
reinvestment.
Based on the agency theory, signalling theory, prior research and also considering the
relationship between risk disclosure and firm’s characteristics i.e. firm size, liquidity,
profitability, leverage, earnings reinvestment, this research adopts the following (H6):
there is an association between the delta of risk disclosure and the delta of firm
characteristics.
Source: Bodie et al. (2011, p. 593)
Figure 4-1 Dividend growth for two earnings reinvestment policies
Firm Value

93
The firm value of listed companies can be determined by the mechanism of demand and
supply in the market, which is reflected by share price. The higher stock price makes the
value of companies higher. In addition, the main goal of the company is to maximise the
wealth of shareholders or firm value. Hence, the business managers always try to
demonstrate their performance and to make sure that their companies are attractive for
a good alternative investment.
Differing information between managers and investors can be reduced by disclosure in
their annual reports. Companies which disclose more in mandatory and voluntary
reporting to stakeholders can minimise agency conflicts between managers and
stakeholders. In addition, if companies have a better governance system by revealing
firm performance more transparent, hence increasing the firm’s value (Sheu et al., 2010).
In addition, Jensen and Meckling (1976) asserted that firms with low transparency will
have a high level asymmetric information, and decrease the firm value.
McKinnon (1993) asserted that big companies have a strong financial motivation to
disclose more in order to achieve a good ‘corporate standing and public representation’
and this also means better news for shareholders in bigger companies rather than small
firms. Finally it will increase the firm’s value.
Firm size influences the value of the company, because big companies find it easier to
obtain sources of funding both internally and externally (Al-Akra & Ali, 2012). In addition,
big total assets can be used for financing the company's operations and the managers
have more flexibility in using assets in the company. If management is able to manage
the assets productively, it will improve company performance and finally increase firm
94
value. Along with that, the following (H7): There is a positive association between the
delta of firm size and the delta of firm value.
Agency theory asserted that liquidity has a positive relationship with firm value. A
company with high-liquidity increases a company’s value because the firm has high cash
reserves, which supports the capability to pay the company's short-term liabilities and
has a positive impact on firm value. Nevertheless, Al-Akra and Ali (2012) did not find that
liquidity has any association with firm value. Therefore, the following (H8): There is a
positive association between the delta of liquidity and the delta of firm value.
Moreover, firm value can be influenced by profitability Uyar and Kiliç (2012).
Stakeholders perceive that profit from sales and investment can generate a high
profitability ratio. Rising profit from year to year shows an increase in the company's net
income that indicates that the value of the company rises. If net income increases,
eventually stock price will increase and arguably it increases firm value. A company with
high profit can attract investors, generate the share price increase and finally increase
firm value.
Therefore (H9): There is a positive association between the delta of profitability and the
delta of firm value.
The amount of leverage can be considered as a predictor of company risk, it means that
the greater the leverage, the higher the debt, indicating a greater investment risk. Along
with that, leverage has a relationship with firm value. Companies with high leverage
convey a negative sign that supports a negative reaction for users which then ultimately
affects the value of the company. Accordingly, the firms with low leverage increase firm

95
value and the risks are smaller than the companies with high leverage. Nevertheless,
previous researchers had different results, such as Hassan et al. (2009); Uyar and Kiliç
(2012) who mentioned that there is no relationship between leverage and firm value.
Meanwhile, Babaei, Shahveisi, and Jamshidinavid (2013) found that leverage has a
negative correlation with firm value.
This research supposes that banks with high leverage show a high risk and convey a
negative sign to stakeholders and it will affect firm value decrease. Hence, leverage has
a negative correlation with firm value.
Therefore, the following (H10): There is a negative association between the delta of
leverage and the delta of firm value.
Bodie et al. (2011) stated that companies which distribute large dividends initially will
have low reinvestment opportunity and in the future dividend growth rate will be low.
Conversely, if the company has an earning reinvestment policy, while initially investors
will receive small earnings, in the long-term investors get benefits by receiving high
dividends thereby increasing the value of shares (figure 4.1). In other words, the
companies with a high reinvestment rate generate higher dividends in the future. Finally
it will boost firm value.
The following (H11): There is a positive association between the delta of earnings
reinvestment and the delta of firm value.
Previous research showed that there are determinant factors involved in the relationship
between disclosure and firm value. Some studies have shown different results with
96
regard to the relationship between disclosure and firm value based on signalling theory
in the banking sector. Hassan et al. (2009) concluded that voluntary disclosure has a
positive but insignificant association with firm value. They also asserted in their
conclusion that mandatory disclosure is significant but has a negative relationship with
firm value with controlling factors, namely asset size and profitability. Al-Akra and Ali
(2012) indicated that voluntary disclosure is positively associated with firm value.
Therefore, the following (H12): there is a positive association between the delta of risk
disclosure and the delta of firm value.
Agency theory predicts that firm characteristics namely firm size, liquidity, profitability,
leverage, earnings reinvestment influence firm value. In addition, signalling theory
asserted that disclosure has a relationship with firm value, then the following (H13): there
is an association between the delta of firm value and the delta of company characteristics
and the delta of risk disclosure.
4.4 Value Relevance
Previous research showed that there are determinant factors involved in the relationship
between disclosure and firm value. Some studies have shown different results with
regard to the relationship between disclosure and firm value based on signalling theory
in the banking sector.
Francis, LaFond, Olsson, and Schipper (2004) asserted that value relevance is one of
the basic attributes of the quality of financial statements. In addition, Suadiye (2012, p.
302) stated that “value relevance is defined as the ability of financial statement
information to capture and summarize firm value”. Moreover, Barth, Beaver & Landsman
97
(2001 p.4) stated that “an accounting amount will be value relevant, i.e. has a predicted
significant relation with share prices, only if the amount reflects information relevant to
investors in valuing the firm and is measured reliably enough to be reflected in share
prices”.
The earlier researchers, Anandarajan, Francis, Hasan, and John (2011); Uyar and Kiliç
(2012), mentioned that because voluntary disclosure influences firm value, it means
voluntary disclosure is value-relevant. In addition, Moumen, Othman, and Hussainey
(2013) asserted that transparency of a firm’s condition in the annual reports is valuable
and value relevant for investors, it can even be used for predicting the changes of
earnings in the following two years ahead. Moreover, they mentioned that companies
which voluntarily reveal more information and describe their performance transparently
by narrative explanation will give more information for users about a possibility to get
profit and firm’s risks. Furthermore, firm disclosure will be more fruitful for stakeholders
and more significant when it is supported by regulation such as adoption of IFRS (Karğın,
2013).
Based on agency theory, by providing a firm’s information about more disclosure,
asymmetric information between managers and users will decrease. In other words, by
disclosing voluntarily, companies provide more detailed and accurate information to the
public, hence this is valuable and value relevant for users. All in all, risk disclosure
through published financial statements is essential for users, it means it has value and
relevance for investors.

98
Based on the statement above then (H14) is risk disclosure is value relevant for
stakeholders.
Some prior studies in Middle East countries such as those by Hasan et al. (2009); Al Akra
and Ali (2012); Uyar and Kilic (2012) have examined the value relevance of disclosure,
and the association between disclosure and firm value, in the listed companies
In order to know the value relevance of voluntary disclosure, Uyar and Kilic (2012)
examines 131 listed manufacturing companies on the Istanbul Stock Exchange but only
used data for the year 2010. They tested control variables namely disclosure, size,
leverage, profit, growth with firm value, for which firm value were proxied by market
capitalization, market capitalization six months after year end, market capitalization to
book value of equity, and market value to book value of equity six months after year end.
Voluntary disclosure was measured by a disclosure index. Their result showed that
voluntary disclosure has a significant positive correlation with firm value, meaning that
voluntary disclosure is value relevant.
Hassan et al.(2009) examined the value relevance of non-financial firms in Egypt and
concluded that voluntary disclosure has a positive but insignificant association with firm
value. They also asserted in their conclusion that mandatory disclosure is significant but
has a negative relationship with firm value with controlling factors, namely asset size and
profitability. Their empirical results showed that voluntary disclosure has a positive
insignificant association with firm value.
Al-Akra and Ali (2012) indicated that voluntary disclosure is positively associated with
firm value, but it has a negative relationship with mandatorily disclosure; there research

99
was conducted in Jordan. They employed 243 non-financial listed companies in the
Amman Stock Exchange and compared the firms between before and after privatisation.
They also tested firm characteristics viz size, profitability, leverage, growth and industry
type. Firm value was measured by the market value of equity to the book value of equity,
meanwhile voluntary disclosure was measured by voluntary disclosure index. They
tested the relationship between firm value and disclosure in three criteria based on
mandatory disclosure; voluntary disclosure, and mandatory and voluntary disclosure.
This recent study differs from previous research because their sample comprised listed
companies in the Middle East, while this current study was done in Indonesia with
unlisted and listed companies as the population. We have the same independent
variables such as size, liquidity, profitability, leverage and disclosure, but they did not test
earnings reinvestment. This is the first study to have examined a relationship between
earnings reinvestment and disclosure and firm value, prior studies employed dividend.
Moreover, Uyar and Kilic (2012), Al-akra and Ali (2012), Hassan et.al. (2009) examined
the value relevance of mandatory and voluntary disclosure in the non-bank annual report
over the period in 2010; 1994-2004; 1995-2002 respectively, meanwhile this current
study tested risk disclosure of Indonesian banks’ annual report above the period 2008-
2012 and compared listed and unlisted banks, Islamic and non-Islamic banks. Moreover,
risk disclosure was measured by number of sentences which have at least one risk
keyword divided by total number of Indonesian sentences, whereas prior studies
employed disclosure index. The firm value for listed companies was measured by market
capitalisation (Uyar & Kilic, 2012) or market value of equity to the book value of equity
(Al-Akra & Ali, 2012); (Hassan et al., 2009), but this current study employed Tobins’ Q.
100
Due to none of previous study measuring firm value for unlisted banks, this is the first
research measured firm value for unlisted bank by Black Scholes Merton model.
Some researchers, Popova et.al. (2013), Elzahar and Hussainey (2012); Marshall and
Weetman (2007); Linsley and Shrives (2006) examined the determinant of disclosure in
the UK listed companies by using size, profitability, liquidity, and leverage as the same
as this current study. Nevertheless, they did not compare between listed and unlisted
companies and Islamic and non-Islamic companies, whereas this current study tested
those groups.
Popova et al. (2013) used disclosure index was used for measuring disclosure in annual
report; but Marshall and Weetman (2007) measured disclosure by counting sentences;
while, Elzahar and Hussainey (2012) employed content analysis. This current study is
different with those prior studies and this is the first researcher using Indonesian risk
keyword.
This study has some unique characteristics, which differ from prior studies in the following
ways: first, employing number of Indonesian risk keyword divided by total number of
Indonesian sentences in the Indonesia banks annual report for measuring risk disclosure.
Second, earnings reinvestment was used as the determinant of disclosure. Third,
employing Black Scholes Merton model for approaching firm value in the unlisted banks.
Four, comparing the determinant and value relevance of risk disclosure between listed
and unlisted, Islamic and non-Islamic banks.
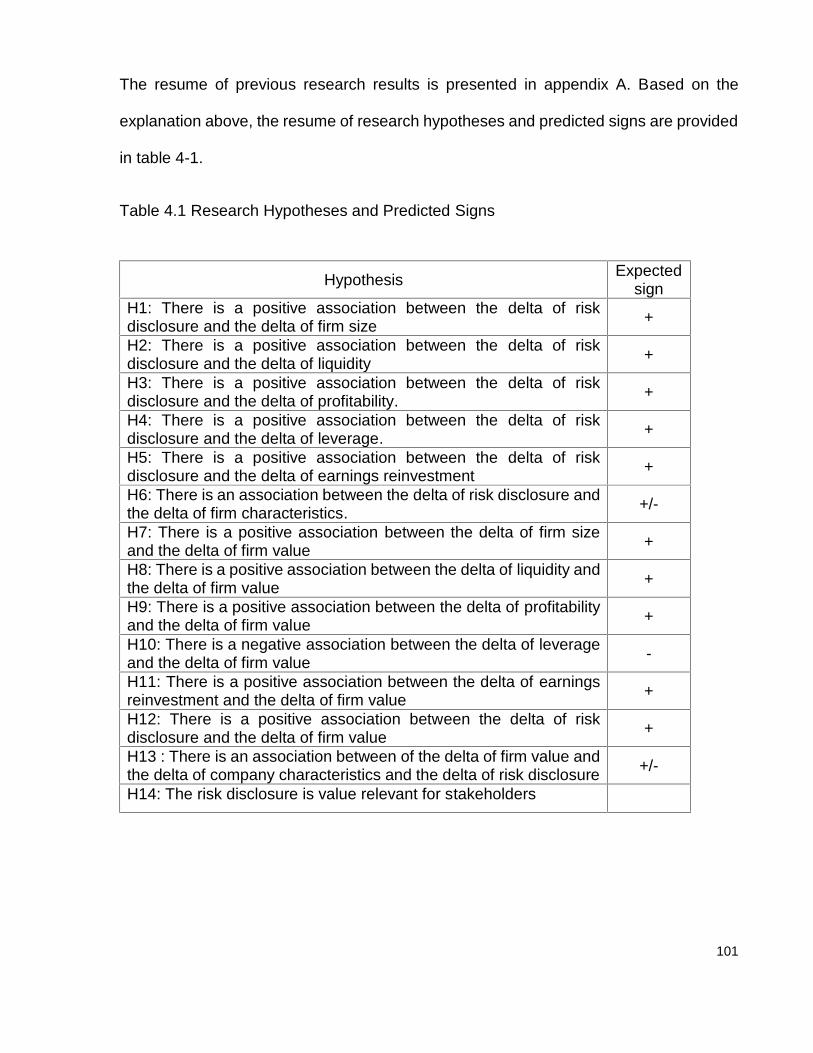
101
The resume of previous research results is presented in appendix A. Based on the
explanation above, the resume of research hypotheses and predicted signs are provided
in table 4-1.
Table 4.1 Research Hypotheses and Predicted Signs
Hypothesis Expectedsign
H1: There is a positive association between the delta of riskdisclosure and the delta of firm size +
H2: There is a positive association between the delta of riskdisclosure and the delta of liquidity +
H3: There is a positive association between the delta of riskdisclosure and the delta of profitability. +
H4: There is a positive association between the delta of riskdisclosure and the delta of leverage. +
H5: There is a positive association between the delta of riskdisclosure and the delta of earnings reinvestment +
H6: There is an association between the delta of risk disclosure andthe delta of firm characteristics. +/-
H7: There is a positive association between the delta of firm sizeand the delta of firm value +
H8: There is a positive association between the delta of liquidity andthe delta of firm value +
H9: There is a positive association between the delta of profitabilityand the delta of firm value +
H10: There is a negative association between the delta of leverageand the delta of firm value -
H11: There is a positive association between the delta of earningsreinvestment and the delta of firm value +
H12: There is a positive association between the delta of riskdisclosure and the delta of firm value +
H13 : There is an association between of the delta of firm value andthe delta of company characteristics and the delta of risk disclosure +/-
H14: The risk disclosure is value relevant for stakeholders

102
4.5 The differences between Listed and Unlisted banks
In order to raise funds, companies are able to finance from internal or external resources.
Based on Pecking Order theory, Myers and Majluf (1984) mentioned that firms prefer to
use internal sources from retained earnings for financing their business, but if these are
still not enough they will cover it from external debts. In order to get more funds, as the
last resort they can sell shares in the equity market which is organised through a stock
exchange.
When firms register and have a right to sell their shares to the public on the stock
exchange, their status changes from private companies to public companies, from whom
any individual or company or group is able to buy shares and thereby invest in and own
a part of a company. When shares are listed on the capital market, they become a public
company or listed company and their name is added by ‘”Tbk” (terbuka) for listed firms
in Indonesia.
In general, when companies decide to issue shares to the public, they have several
objectives: as a result, the benefits and consequences are borne by the company. Listed
companies must comply with regulations in order to protect shareholders. The
regulations provide governance of securities transactions on the capital market.
Moreover, listed companies must report their performance transparently through financial
reports regularly, at least every single year. In addition, listed firms face the consequence
of being monitored by stakeholders such as: shareholders, regulators, media. In addition,
Wallace et al. (1994) highlighted that listed companies will disclose more in revealing
their performance in the financial reports than unlisted firms.

103
Meanwhile, unlisted companies’ capital is funded from internal resources and their
investments depend on their internal resources, to a greater extent than listed firms.
Moreover, Schoubben and Rulle (2004) argued unlisted companies usually have a higher
debt financing and leverage than listed firms.
Most previous researchers have examined the disclosure in the listed companies, a very
little of research has used unlisted firms for their sample. Aljifri et al. (2014) employed
106 listed and 7 unlisted firms in UAE in 2005 to analyse the correlation between the
extent of financial disclosure and firm characteristics (appendix A). Nevertheless, the
prior study did not compare either the extent of disclosure or the relationship between
dependent and independent variables comparing listed and unlisted firms. The extent of
disclosure was proxied by disclosure index, and they asserted that disclosure index was
not an adequate measurement to capture the extent of disclosure. The result showed
that size (market capitalization), profitability (ROE) and liquidity (current asset/current
liabilities) had an insignificant association with disclosure. The listing status and type of
industry (i.e. banks), have positive relationship with disclosure. Meanwhile, the current
study distinctively used the number of sentences which have at least one Indonesian risk
keywords divided by number of Indonesian sentences in bank annual report over the
period 2008-2012. None of the previous researchers examined risk disclosure in listed
banks and unlisted banks, Islamic and non-Islamic banks, but this current study tested
the differences of risk disclosure in listed and unlisted banks, Islamic and non-Islamic
banks.
Ibrahim, Ismail and Zabaria (2011) described the interrelationship among disclosure, risk,
and Islamic banks performance in Malaysia, namely size, profit, leverage, total financing

104
(fin), and non performing finance (NPF) by equation approach. First, the determinant of
disclosure at time t. Second, the effect of disclosure, profit, fin, and NPF on Leverage.
Third, the effect of disclosure and leverage on profit. Disclosure was measured by
disclosure index. Their research used voluntary disclosure theory, legitimacy theory,
political economics theory and stakeholder theory, meanwhile this current research
employed agency, signalling, stakeholder, and communication theories as underpinning
theory. The result showed that independent variables in each equation could not explain
each dependent variable. This current study also tested the firm performances, however
its the uniqueness is to employ earning reinvestment as a new independent variable. A
firm might not distribute dividend but they will reinvest their earnings. The size of dividend
can reflect the level of risk. Baker and Powell (2012) mentioned that to compensate a
high risk investment, the firms that have low disclosure are expected to pay higher
dividend.
4.5.1 The benefit of listed companies
Listed companies obtain certain benefits even though they also deal with hindrances. In
the Indonesia Stock Exchange guideline book, Capasso et al. (2005), and Zdolsek and
Kolar (2013b), they explain that the advantages of public companies are: first, such
companies find it easier to get new funding resources from external sources and this may
increase their liquidity. Second, they can use these funds for further firm expansion and
to increase their competitive advantages. Third, by selling shares the cost of funds will
be cheaper than raising funds from debt. Fourth, the owners have opportunities to
manage the capital and invest in good portfolios in order to minimise risks. Fifth, they
often find it easier to market their products or services to an even wider or even
105
international scope. Sixth, it is easier for them to access banks to get another source of
funds, since they sell shares on the stock exchange market, such companies are more
transparent and banks can easily collect data and information related to company
performance. Moreover, listed companies can access funds by issuing short term or
stock market by issuing long term bonds. By getting more funds listed companies find it
easier to arrange mergers or acquisitions of other firms. Merger is a process which unites
companies with other companies, while acquisition is a takeover process or the purchase
of another company. Those processes are often used for the purpose of accelerating the
development of business and boosting firms’ scale. Furthermore, listed companies are
able to invite their partners such as customers or suppliers to be the potential
shareholders; therefore, they can develop companies together in the future. In addition,
as listed companies, they are expected to be more professional and have a good
operational management in order to achieve the best performance; hence, they are able
to offer high earnings to their shareholders. By becoming a public company, each
company is able to obtain a valuation of its own value. When they have a good financial
performance, it will have the impact of boosting the stock price, creating a good image
and prestige, and finally it will increase the value of the company
4.5.2 The hindrances of listed and unlisted companies
On the other hand, listing on the stock exchange market is a complex process as well as
an expensive one. The weaknesses of listed companies are: first, listed companies are
obliged to make periodical reports to the regulators while facing high pressure from
regulators such as the Capital Market Supervisory Agency. Second, the drawbacks
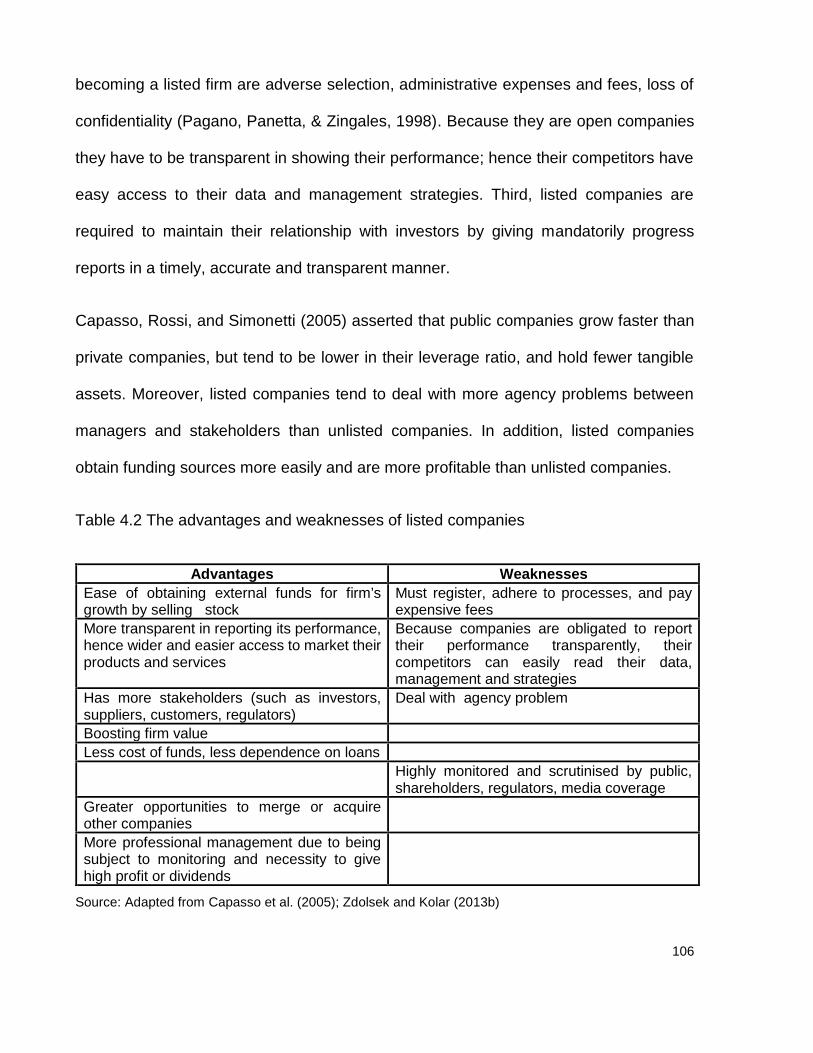
106
becoming a listed firm are adverse selection, administrative expenses and fees, loss of
confidentiality (Pagano, Panetta, & Zingales, 1998). Because they are open companies
they have to be transparent in showing their performance; hence their competitors have
easy access to their data and management strategies. Third, listed companies are
required to maintain their relationship with investors by giving mandatorily progress
reports in a timely, accurate and transparent manner.
Capasso, Rossi, and Simonetti (2005) asserted that public companies grow faster than
private companies, but tend to be lower in their leverage ratio, and hold fewer tangible
assets. Moreover, listed companies tend to deal with more agency problems between
managers and stakeholders than unlisted companies. In addition, listed companies
obtain funding sources more easily and are more profitable than unlisted companies.
Table 4.2 The advantages and weaknesses of listed companies
Advantages WeaknessesEase of obtaining external funds for firm’sgrowth by selling stock
Must register, adhere to processes, and payexpensive fees
More transparent in reporting its performance,hence wider and easier access to market theirproducts and services
Because companies are obligated to reporttheir performance transparently, theircompetitors can easily read their data,management and strategies
Has more stakeholders (such as investors,suppliers, customers, regulators)
Deal with agency problem
Boosting firm valueLess cost of funds, less dependence on loans
Highly monitored and scrutinised by public,shareholders, regulators, media coverage
Greater opportunities to merge or acquireother companiesMore professional management due to beingsubject to monitoring and necessity to givehigh profit or dividends
Source: Adapted from Capasso et al. (2005); Zdolsek and Kolar (2013b)

107
Table 4.3 The differences between listed and unlisted companies
Listed firms Unlisted firmsAre affected by asymmetric information
Are easier to get funds by selling shares orissuing bonds
Have fewer opportunities for raising funds(have a financial constraint)
Financial source : internal and external Depend on internal sourcesAdhere to the capital market and financialsupervisory regulations
Adhere to financial supervisory regulations
Grow faster and are lower in leverage Higher leverageHigher agency problem Fewer agency problemHigher liquidity Have more problems with liquidityHave more investors and stakeholders Fewer stakeholders and investorsEasier access to banks for raising debtsHighly monitored, scrutinised andmonitored by public, shareholders,regulators and even media coverageHigher firm value, good image and prestigeGreater opportunities for merger oracquisition of other companies.
Source: Adapted from Capasso et al. (2005) ; Zdolsek and Kolar (2013b)
4.6 The Differences between Islamic and Non-Islamic Banks
This chapter has five parts and explains the following concepts: shariah rules in
transactions; contracts in Islamic banks; the basic law of a shariah capital market; and
comparison between Islamic and non-Islamic banks.
4.6.1 Shariah rules in transactions
An Islamic bank is a bank which conducts its business in accordance with Islamic law to
follow the Qur’an’s rules. Lewis (2001) asserted that in order to comply with sharia,
Islamic banks must follow five rules in each transaction. First is riba, second is halal,
third is maysir/gharar (gambling), fourth is zakat, finally an Islamic banks has to be
monitored by a sharia supervisory board. Each religious feature will be explained in the
following text.

108
First, El-Gamal (2000) stated that Islamic banks are not allowed to employ interest (riba
or usury) in any transaction. In addition, Al-Baluchi (2006, p. 52) mentioned that riba is
”the addition in the amount of the principal of a loan at a rate decided depending upon
the risk, duration, and amount of the loan”. Islamic banks are not allowed to give fixed
interest to depositors and to take loan interest from borrowers. Moreover, according to
the stipulations of the law Republic of Indonesia number 21 in 2008 about Islamic
banking, “usury is the addition of illegal income (vanity), among others, in the transaction
exchange of goods that are of the same kind of quality, quantity and time of delivery
(Fadl) or in borrowing and lending transactions which require the Customer Receiver
Facility to return the funds received that exceeds the principal because of the passage
of time (nasi’ah)“ (author’s translation).
On the other hand, conventional banks employ a fixed rate return of interest in both
lending and funding transactions. Interest is decided in advance by the bank without
considering whether borrowers earn a profit or loss. Moreover, Usmani (1998) mentioned
that banks will charge a penalty to the debtors if they default in payment of their debts.
Employing interest in the business transaction could exploit poor borrowers and make
depositors wealthier. When the borrowers (mudarib) lose, they have to pay their debts
even the debt might increase because they must pay charges due to late payment. While
the depositors, (rabbulmaal) will receive fixed interest without doing anything and do not
have to face risks. It is allowed to get a rate of return fixed in advanced. In addition, Khan
and Mirakhor (1989) asserted that a trade or business deals with risk (for example loss
or low return), nevertheless in conventional banks, the interest is fixed and earnings can
be calculated in advance.

109
Second, Islamic banks are strictly not allowed to invest or finance activities in the ‘haram’
goods and businesses; their investment must be in halal (lawful/legal/permitted) business
activities. ‘Haram’ describes business activities that are forbidden or unlawful such as
investment in the pork meat business, beer and cigarette companies. Islamic banks are
encouraged to support ‘halal’ productions in basic things to meet the Muslim community’s
need, namely foods, clothing, housing, education and health (Hassan and Lewis, 2007).
Third, Islamic finance cannot accept transactions with gambling (maysir). According to
the Bank of Indonesia regulation number 7/46/PBI/2005 in explanation of article 2,
paragraph 3 mentions that ‘maysir’ is a transaction that contains elements of gambling
or highly speculative investment. ‘Maysir’ describes transactions which are undertaken
in an uncertain situation and are speculative; for example, foreign exchange trading. It
is categorised as gambling because the owner of the funds gives some money to the
agent to make a profit without buying and selling currency in real transactions, and no
goods are transacted. This transaction is therefore categorized as gambling and
unlawful. Nevertheless, a spot transaction in foreign exchange is allowed because it is
a transaction of purchase and sale of foreign exchange with delivery at the time (over the
counter) or the settlement within two days. It is permissible, because the transaction is in
cash, while the two days are considered to be the settlement process that cannot be
avoided as an international transaction.
Furthermore, Islamic banks are also not allowed to conduct ‘gharar’ transactions.
‘Gharar’ describes transactions in which the object is not clear / real, not owned, is
unknown or cannot be delivered when the transaction has been completed (Kiong, 2014).
One example is short sellling, whereby investors sell shares without actually owning the

110
shares at the time of the sale. In addition, ‘Gharar’ according to El-Gamal (2000) is risk
or uncertainty. .
Fourth, Lewis (2001) stated that in Islam people cannot exploit others, so in order to
distribute wealth from wealthy to the needy or less fortunate and for purifying wealth; they
must pay zakat as a compulsory levy. This zakat is also applied to the bank’s capital,
the reserve, and the profit. Islamic banks can collect and distribute zakat to the needy.
Finally, in order to assure that an Islamic bank’s operations and activities comply with
sharia law, they must have a Sharia Supervisory Board/ Committee. The supervisory
committee is an independent board and should be composed of members who are not
only qualified and expert in fatwa (religious rulings) but also have knowledge of
economics and finance, due to their responsibility to decide whether products, processes,
and systems in the Islamic bank obey Islamic law.
4.6.2 Contracts in Islamic banks
Some contracts are applied in Islamic banks as a substitute for charging interest. Hassan
and Lewis (2007) mentioned that Islamic banks employ ‘wadiah’, profit loss sharing
(mudarabah), joint venture (musyarakah), sales/mark up mode (murabaha), and ‘ijarah’
in their transactions. There are two kinds on ‘wadiah’. First, wadiah al amanah (act to
trust /custody or safekeeping) is a contract under which a bank undertakes to safely keep
the customer’s property, and the bank is not allowed to use that property, but the bank
does not refund in the of case loss or damage. Second, ‘wadiah al dammanah’ is a
contract which allows the bank to utilise the depositor’s funds and guarantees the

111
depositor’s funds intact, and in addition the bank is permitted to give a gift depending on
the management’s decision, without a contract in advance (Hassan and Lewis, 2007).
The profit and loss sharing (PLS) concept for banking was established for the first time
in Egypt in 1963 by Ahmed El Najjar. Chong and Liu (2009) explained that the first
commercial bank that applied saving deposit based on profit sharing was Nasir Social
bank in 1971, and after that Islamic banks grew rapidly worldwide and were established
in more than 50 countries, including Indonesia.
Ariffin (2005) mentioned that the PLS concept can be done either ‘mudarabah’
or‘musyaraka’ contract. ‘Mudarabah’ is a contract between an investor (rabbulmaal) with
entrepreneurs (mudarib) employing a PLS transaction. If a bank (mudarib), as a fund
manager, receives funds from depositors, the bank manages the funds and obtains a
profit or loss then the bank will share the profit or loss with depositors/investors
(rabbulmaal). On the other side, a bank (rabbulmaal) provides capital to finance the
borrowers/entrepreneurs (mudarib)’s business, then the ‘mudarib’ will share the profit or
loss with the bank (rabbulmaal). The profit or loss will be divided among them based on
agreed proportion.
Furthermore, Usmani (1998) mentioned that there are two kinds of mudarabah. First, al-
mudarabah al-muqayyadah (restricted mudarabah) is that the rabbul maal invests the
funds in the specific halal businesses and then shares the loss or profit. Second, al-
mudarabah al-mutlaqah is that the rabbul maal invests the funds in any halal businesses
(unrestricted mudarabah) and then share loss or profit between them.

112
Ariffin (2005) added that another contract with profit or loss sharing is musharaka (joint
venture/equity partnership). A bank can collaborate with other partners to share
expertise or capital in varying proportions in a long term investment project. Moreover,
each party will have representatives on a board of directors for managing the business.
They will share loss or profit depending on an agreement based on the portion of capital
contributions before the business materialised.
Sources of funds in Islamic banks comprise: current account with wadiah contract;
savings account; time deposit account; restricted investment account; and unrestricted
investment account with mudarabah contract (figure 4-2). For comparison, the sources
of funds of conventional banks are: current account, savings account and time deposit
based on interest.
Hassan and Lewis (2007) mentioned that in a mark-up (cost plus financing) scheme
(murabaha), a bank will buy assets or goods which are needed by a client from a third
party. The bank then sells the assets/goods plus mark up to the client and the client pays
in instalments. When the client defaults or delays the payment of the instalments, the
price of goods/assets and the mark-up will not increase. There are three kinds of
murabaha: first, salam is a scheme of murabaha for agriculture financing. Second,
istisnaa is a scheme for financing constructions and manufacturing projects. Third, bai
bi-thaminajiil (deferred payment financing) is a scheme under which the bank buys the
goods that the client needs, such as a house, and the bank sells it to the client. The client
is permitted to pay by deferring payment or as a lump sum.
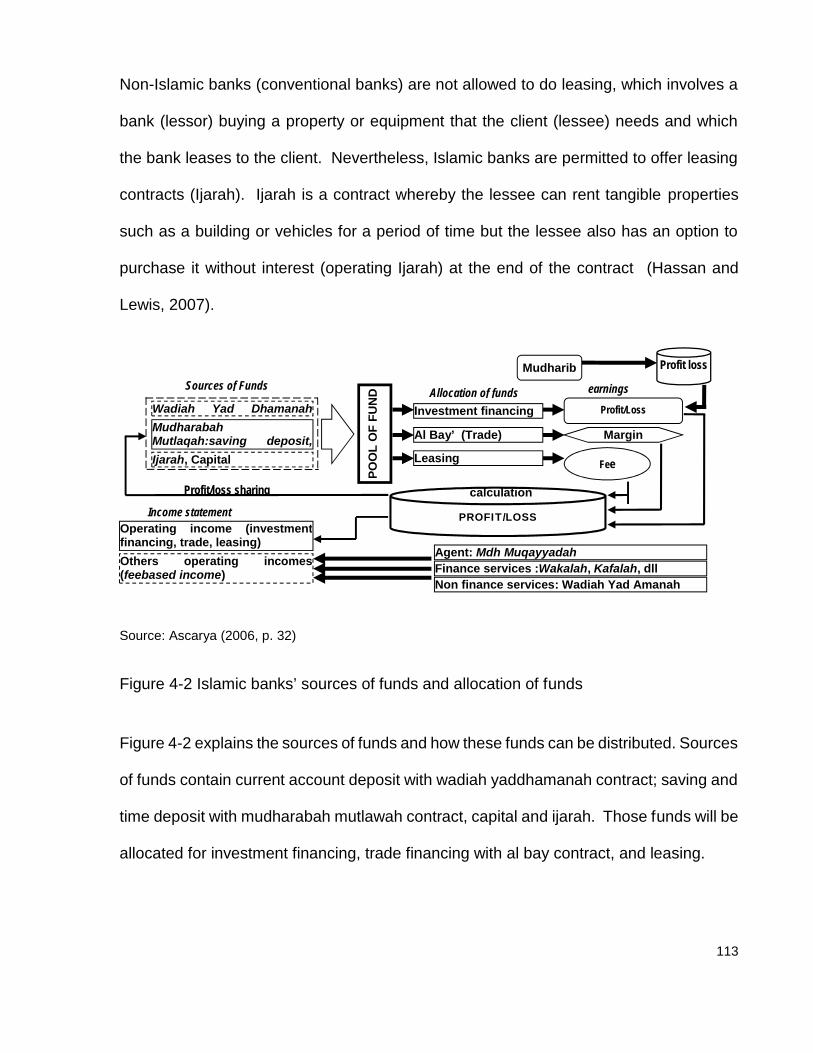
113
Non-Islamic banks (conventional banks) are not allowed to do leasing, which involves a
bank (lessor) buying a property or equipment that the client (lessee) needs and which
the bank leases to the client. Nevertheless, Islamic banks are permitted to offer leasing
contracts (Ijarah). Ijarah is a contract whereby the lessee can rent tangible properties
such as a building or vehicles for a period of time but the lessee also has an option to
purchase it without interest (operating Ijarah) at the end of the contract (Hassan and
Lewis, 2007).
Source: Ascarya (2006, p. 32)
Figure 4-2 Islamic banks’ sources of funds and allocation of funds
Figure 4-2 explains the sources of funds and how these funds can be distributed. Sources
of funds contain current account deposit with wadiah yaddhamanah contract; saving and
time deposit with mudharabah mutlawah contract, capital and ijarah. Those funds will be
allocated for investment financing, trade financing with al bay contract, and leasing.
Wadiah Yad DhamanahMudharabahMutlaqah:saving deposit,time depositIjarah, Capital
Investment financing
Al Bay’ (Trade)
Leasing
POO
LO
F FU
ND
Profit/Loss
Margin
Fee
Operating income (investmentfinancing, trade, leasing)Others operating incomes(feebased income) Finance services :Wakalah, Kafalah, dll
Agent: Mdh Muqayyadah
Mudharib
PROFIT/LOSS
calculation
Profit losssharingSources of Funds Allocation of funds earnings
Income statement
Profit/loss sharing
Non finance services: Wadiah Yad Amanah

114
Investment financing involves lending funds from a bank (rabiul maal) to (mudharib) as
entrepreneurs who have prospective business under a profit and loss sharing contract.
When mudharib earns profit or suffers a loss, they will share the profit or loss with the
bank as mentioned in the distribution contract before doing the business. Another
allocation of funds is for trading. The banks buy assets that the client needs, and then
sell the assets with mark up or margin by murabahah contract. The client pays in
instalments. The other possible allocation of funds is leasing. The Islamic bank as the
leaser leases the tangible assets and the client (lessee) pays the rent plus administration
fee.
From those transactions, the Islamic bank receives profit from sharing contract, margin
and fee as their earnings. The profit will be shared to the investors who invested their
funds in the wadiah contract and mudarabah contract.
The profit will be posted in the income statement as the operating income. As the Islamic
banks offer financial services such as an agent for investing funds in certain businesses,
object and time with mudarabah muqayyadah; remittance or transfer money by wakalah
contract; issues a guarantee bank and Letter of Credit by kafalah contract; foreign
exchange money by sharf contract. Another non-financial service is safe deposit box
with wadiah yadamanah. From those services, the Islamic bank receives a fee and it will
be posted as others operating income which will not be shared with the investors.
4.6.3 The Basic Law of Sharia Capital Market
Related to activities in the stock market, in general, the activities of Islamic Capital Market
do not have differences with conventional capital markets, but there are some special
115
characteristics of the Islamic Capital Market, namely products and transaction
mechanisms which are not contrary to the principles of sharia.
The activities in the capital market with sharia principles also become a part of the capital
market system which refers to Law No. 8 of 1995 concerning the Capital Market. Some
special rules are related to the Islamic capital market such as Rule Number II.K.1
concerning Criteria and Publishing List of Islamic Securities, Rule Number IX.A.13
concerning Islamic Securities Issuance, and Rule Number IX.A.14 about contracts in the
issuance of Islamic securities.
Some Islamic products in the capital market are: first, sharia stocks. Second, sukuk
(Islamic bonds). Third, sharia mutual funds. Sharia stock is an ownership of equity in a
company and adheres to sharia law. The sharia stock traded in capital market are not
allowed to contain a gambling; trading with non-deliverance of goods or services; trading
with counterfeit offering/demand; trading with conventional financial institutions such as
banks, leasing companies, insurance companies; trading that contains gambling (maisyr)
and uncertainty (gharar); trading with companies that produce any haram products and
services that stated by National Sharia Board; and dealing with bribes.
According to the Indonesian Ulama Council, Fatwa Number 32 / DSN-MUI / IX / 2002,
sukuk are long-term securities based on sharia principles issued by the providers of
Islamic bonds to the holders of the bonds. Sukuk requires the issuers to pay profit to the
holders of Islamic bonds based on a profit sharing margin / fee, and repay the bond at
maturity. Sukuk is issued based on underlying assets, while a bond in the conventional
term is categorized as a debt.

116
Sharia mutual funds, according to Indonesian Ulama Council Fatwa number 20/DSN-
MUI/IV/2001 are mutual funds operating in accordance with the provisions and principles
of Islamic Shariah, either in the form of a contract between the investor as the owner of
the funds (sahib almal / rabb al mal) and the investment manager as representative of
sahib al-mal, or between the investment manager as representative of sahib al-mal and
investment users. The contract between the investors and the Investment Manager is
wakalah, while the contract between the Investment Manager and the investment users
are mudaraba.
4.6.4 The comparison between Islamic and non-Islamic banks
Related to their operations, products and services, Islamic banks have to comply with
sharia law, which results in Islamic banks having more complex transactions than non-
Islamic banks. In doing so, Islamic banks incur higher monitoring and screening costs
leading to less efficiency (Beck, Demirguc-Kunt, & Merrouche, 2010). However, Islamic
banks are not allowed to do business and have transactions in risky trading activities,
therefore Islamic banks are more stable than non-Islamic banks.
When the crisis happened in 2008, Islamic banks showed a better performance in capital
asset ratio and had a higher liquidity reserve compared to non-Islamic banks. Moreover,
Beck, Demirgüç-Kunt, & Merrouche (2010) found that Islamic banks had a lower finance
to deposit ratio than non-Islamic banks. Moreover, Parashar and Venkatesh (2010)
asserted that in the period before the crisis (2006-2007) and during the crisis (2008-
2009), overall Islamic banks had higher capital ratio, profitability, and equity than
conventional banks.

117
One of the concepts of Islamic banks is that risk is shared between investors or
depositors with borrowers or entrepreneurs and it is seen to be fair: on the other hand
conventional banks just benefit one party and harm others. Due to Islamic banks
employing PLS, asymmetric information could appear in the transaction between
shahibul maal and mudarib. Each party is encouraged to be honest in doing business
hence transparency in the transactions and operations are crucial. In addition, investors
(rahibul maal) and Sharia Supervisory Board/Committee closely monitor and screen
profit and loss sharing concepts that need fairness and transparency in contributing profit,
therefore Islamic banks have fewer agency problems and moral hazards.
Baydoun and Willetts (2000) mentioned that there are two crucial kinds of financial
reports for companies that are operated based on Islamic laws compared with non-
Islamic companies. These reports are necessary and must be in addition to the normal
reports: the first important thing is that Islamic banks must make full disclosure regarding
the public benefit (such as charity donations – zakat), which requires fairness and
transparency in Islamic operations. Furthermore, an accountability report is the second
priority. In addition, Ariffin (2005) asserted that Islamic banks are required by supervisors
to be transparent about risk, and transparency in Islamic banks is more crucial compared
to conventional banks due to Islamic banks employing profit and loss sharing contracts.
He also mentioned that Islamic banks are still lacking in terms of the transparency with
which they release risk information, meaning that shareholders are not properly able to
monitor the banks’ risk profile.
Regarding risks, Zaidi (2003) stated that Islamic banks and conventional banks deal with
the same risks, namely credit, market, liquidity, operational, strategic and reputation risk.

118
Nevertheless, Islamic banks are often supposed to face additional risks that are not faced
by conventional banks, because the laws they operate under entail more risk.
Islamic and non-Islamic banks have state legal frameworks, but Islamic banks have
shariah legal. When two of frameworks are combined, it could make a new legal
framework. Non-Islamic banks must obey laws and regulations without concerning
Islamic law while Islamic banks must adhere laws and regulations and comply with
Islamic law.
Banking with dual window system will be in the middle of those frameworks. Bank with
dual window is under management of conventional bank (non-Islamic bank), but they
operate based on Islamic system. In other words, bank with dual window is a shariah
bank operates side by side with non-Islamic bank. In order to accommodate customers’
need who want sharia services but still do not want to leave conventional services, the
Bank of Indonesia issued a regulation (law number 21/2008) that allowed conventional
bank open or have shariah branches.
The consequence of dual windows is bank might be subject to interest rate risk, and their
funds could mix with non-Islamic bank’s funds which operate with interest. Along with
that, regulations and law are really needed in order to make their operation and contract
will not break the shariah law. Although structurally still a part of non-Islamic banks,
operationally it must has own rules that are tailored to the sharia law.
For establishing a new sharia bank, conventional bank, sharia business unit (SBU), a
rural bank or a branch of bank, a permit is required from the Financial Services Authority
(FSA). The role of Bank of Indonesia (BI) as a regulator and supervisor of the banks in
119
Indonesia has shifted to the FSA since 2014. Meanwhile, the BI has one single objective
that is to achieve and maintain the stability of Rupiah value. One of the main roles of the
BI is to encourage the maintenance of the stability of the financial system through the
macro prudential regulation and supervision. An example of macro prudential
instruments is an obligation for banks to provide a minimum reserve.
Each bank (Islamic and non-Islamic banks) has to keep 8% of their money in the BI
account as a minimum reserve in order to meet the creditors’ withdrawal. The rest of
money in non-Islamic banks can be distributed as loan that can create money (fiat money
and electronic money) that employs interest. Meanwhile, Islamic banks cannot create
money, because sharia banks employ 100% reserve banking system. Islamic banks are
allowed to distribute their money as much as they have in the deposit (Ascarya (2006) in
Gustiani, Ascarya, and Effendi (2010).
When a bank needs to get money in short term for liquidity, there is interbank money
market for non-Islamic and Islamic banks. Interbank money market is the activity of
lending and borrowing funds in Rupiah between the conventional with other conventional
banks, without the use of money market as underlying/collateral such as money market
securities with interest. While for Islamic banks, the transaction is based on Islamic law
and it is traded by Sharia repurchase agreement. The instruments that can be sold are
Interbank Mudharabah Investment Certificate (the BI regulation number 2/8/PBI/2000
about sharia Interbank money market) and Commodity Certificate based on Shariah
Principles issued by banks with maximum period is 90 days.

120
Table 4.4 Summary of the differences between Islamic banks and non-Islamic banks
Islamic banks Non-Islamic banksOperations and transactions based onsharia/Islamic law
No religious restrictions
The transactions, funding and lendingare not allowed to employ interest(usury/riba), but are based on profit andloss sharing (mudarabah), a jointventure (musyarakah) and mark upsales (murabaha)
Deposits and loans based on interest
Must have Sharia supervisory board/committee
Do not have religious supervision
The investments must be halal (lawful)businesses
Do not consider halal or haram (unlawful)businesses
The bank not only pay out zakat, but alsocollect and distribute zakat to the needy
Do not deal with zakat
The relationship is as partner, investorsand trader, buyer and seller
The relationship is debtors and depositors
Source of funds :
The bank does not guarantee alldeposits, except demand deposit /current account based on wadiahprinciple.
Savings accounts and time depositsbased on profit and loss sharing withmudarabah contract will not beguaranteed by bank.
Unrestricted investment account basedon mudarabah contract
Restricted investment account based onmudarabah contract
Banks guarantee all deposits
Banks and investors of time deposit andsaving deposit based on mudarabahconcept have to share the profit and lossportion in their transactions.
Conventional banks have to guarantee alldeposits
The transactions between Banks andentrepreneurs are based on mudarabahconcepts with profit and loss sharing.Islamic banks will not charge when theborrowers delay repayment
Debtors have to repay debts even thoughthey make a loss, and will be charged(penalised) when debtors cannot pay theirinstallments on time
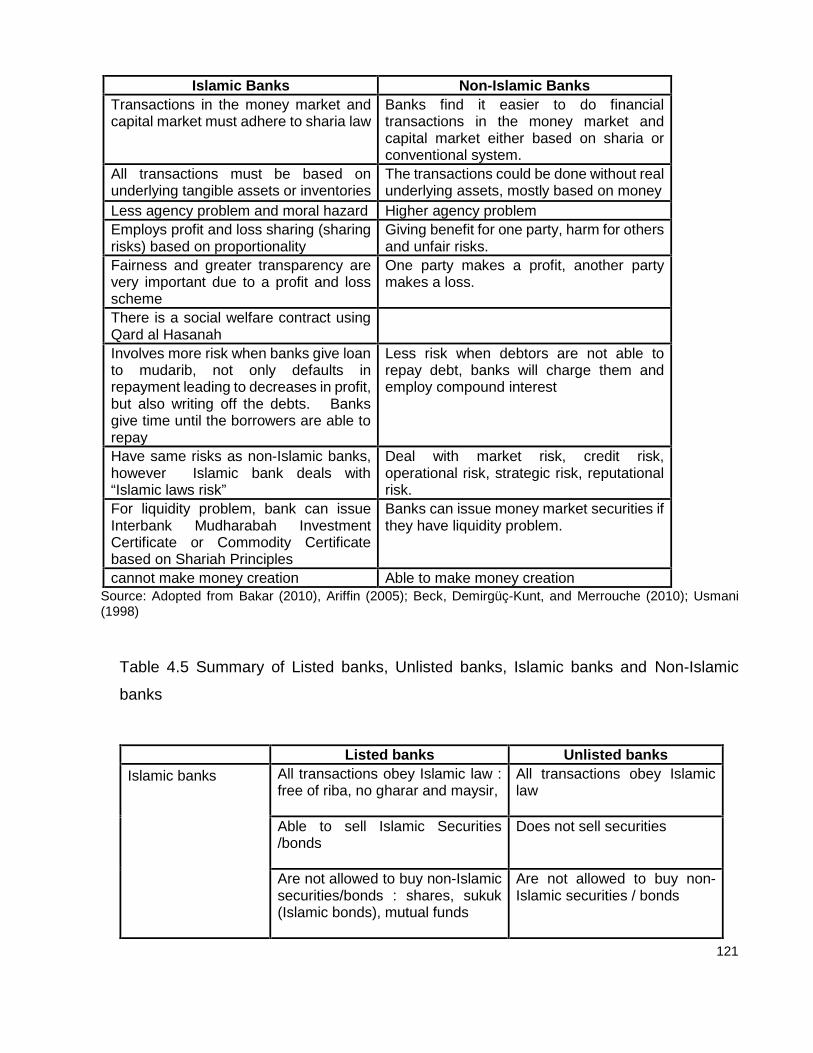
121
Source: Adopted from Bakar (2010), Ariffin (2005); Beck, Demirgüç-Kunt, and Merrouche (2010); Usmani(1998)
Table 4.5 Summary of Listed banks, Unlisted banks, Islamic banks and Non-Islamic
banks
Listed banks Unlisted banksIslamic banks All transactions obey Islamic law :
free of riba, no gharar and maysir,All transactions obey Islamiclaw
Able to sell Islamic Securities/bonds
Does not sell securities
Are not allowed to buy non-Islamicsecurities/bonds : shares, sukuk(Islamic bonds), mutual funds
Are not allowed to buy non-Islamic securities / bonds
Islamic Banks Non-Islamic BanksTransactions in the money market andcapital market must adhere to sharia law
Banks find it easier to do financialtransactions in the money market andcapital market either based on sharia orconventional system.
All transactions must be based onunderlying tangible assets or inventories
The transactions could be done without realunderlying assets, mostly based on money
Less agency problem and moral hazard Higher agency problemEmploys profit and loss sharing (sharingrisks) based on proportionality
Giving benefit for one party, harm for othersand unfair risks.
Fairness and greater transparency arevery important due to a profit and lossscheme
One party makes a profit, another partymakes a loss.
There is a social welfare contract usingQard al HasanahInvolves more risk when banks give loanto mudarib, not only defaults inrepayment leading to decreases in profit,but also writing off the debts. Banksgive time until the borrowers are able torepay
Less risk when debtors are not able torepay debt, banks will charge them andemploy compound interest
Have same risks as non-Islamic banks,however Islamic bank deals with“Islamic laws risk”
Deal with market risk, credit risk,operational risk, strategic risk, reputationalrisk.
For liquidity problem, bank can issueInterbank Mudharabah InvestmentCertificate or Commodity Certificatebased on Shariah Principles
Banks can issue money market securities ifthey have liquidity problem.
cannot make money creation Able to make money creation

122
Islamic banks Listed banks Unlisted banksSubject to Indonesia CapitalMarket Supervisory Agency andFinancial Institution regulations;Bank of Indonesia regulations;Financial Services Authorityregulation
Subject to Bank of Indonesiaregulations; Financial ServicesAuthority regulations
Must have a shariah supervisoryboard
Must have a shariahsupervisory board
Employ PLS Employ PLSFewer agency problems and moralhazardsAll transactions must be based onunderlying tangible assets
All transactions must be basedon underlying tangible assets
The relationship is as partner,investors and trader, buyer andseller
The relationship is as partner,investors and trader, buyer andseller
Transaction in the money marketand capital market must adhere tosharia lawTransactions are not allowed toemploy interest (usury/riba), butare based on profit and losssharing (mudarabah), a jointventure (musyarakah) and mark upsales (murabaha)
Transactions are not allowed toemploy interest (usury/riba),but are based on profit and losssharing (mudarabah), a jointventure (musyarakah) andmark up sales (murabaha)
Funding and lending are interestfree
Funding and lending areinterest free
Not only deal with market risks,operational risks, credit risks,strategic risks, reputational risk butalso deal with “shariah law”
Not only deal with market risks,operational risks, credit risks,strategic risks, reputational riskbut also deal with “shariah law
Non-Islamic banks
Subject to Indonesia CapitalMarket Supervisory Agency andFinancial Institution regulations;Bank of Indonesia regulations;Financial Services Authorityregulation
Subject to Bank of Indonesiaregulations; Financial ServicesAuthority regulations
Do not have religious supervisoryboard
Do not have religioussupervisory board
Allowed to buy Islamic and non-Islamic securities
Allowed to buy Islamic andnon-Islamic securities
Employ interest in lending andfunding
Employ interest in lending anfunding
Do Not Deal with “shariah law Do Not Deal with “shariah law
Source: Adopted from Capasso et al. (2005), Bakar (2010), Ariffin (2005); Beck et al. (2010); Usmani
(1998)

123
Figure 4-3 The business of banking
+ =LIABILITIESSHARECAPITAL
BUSINESS OF BANKING
ASSETS OFF BALANCE-SHEETACTIVITIES
“SOURCES”OF FUNDS
MONEYCREATION
“USES" OFFUNDS
DEPOSITS LOANS
CENTRALBANK
MONEY
LOANS:MARKETABLE
LOANS: NONMARKETABLE
Source: (Faure, 2013, p. 48)

124
CHAPTER 5RESEARCH METHODOLOGY
5.1 Introduction
It is necessary to decide what methodology and methods will be used in order to answer
the research aim, research questions and to test hypotheses, as well as how the data
will be collected and how to measure the variables. Along with that, this chapter gives
an overview of the research approach and contains seven parts, viz. introduction,
research methodology, methods, the population and data periods covered, the
dependent and independent variables, validity and reliability test, and it will be
summarised by a conclusion.
5.2 Research Methodology
In deciding the research methodology, it should be based on an epistemological point of
view. Crotty (1998, p. 3) states that epistemology is “the theory of knowledge embedded
in the theoretical perspective and thereby in the methodology”. He also mentioned that
“methodology is the strategy, plan of action, processes or design lying behind the choice
and use of particular methods and linking the choice and use of methods to desired
outcomes”. In addition, Gray et al. (2007, p. 14) mentioned that “research methodology
is the study of the research process itself – the principles, procedures, and strategies for
gathering information, analysing it, and interpreting it”.
In social science research methodologies are categorised into three general formats,
namely quantitative, qualitative and mixed. Quantitative research methodology according
to Gray et al., (2007, p.61) “emphasizes ordinal measures and number” but in particular,
a “quantitative research methodology attempts to establish formal relationships between
125
related variables. It is mostly guided by positivist philosophy”. A positivist philosophy
believes that social phenomena can be explained by numbers which represent such
conditions. Moreover, Creswell (2014) mentioned that quantitative research is a
research by collecting numerical data, identifying variables, predicting hypotheses, and
employing statistics tool for analysing hypotheses.
Qualitative research is “an approach for exploring and understanding the meaning
individuals or groups ascribe to a social or human problem” (Creswell, 2009, p.4 ). He
also mentioned that mixed methods research is an approach which use both quantitative
and qualitative data.
Research Methodology of this Thesis
This research examines the hypothesis of the determinants of risk disclosure; it also
examines the value relevance of the firm value of listed and unlisted banks, and Islamic
and non-Islamic banks. The data related to determinants, firm value and risk disclosure
are collected from annual reports, such as financial reports and ratios.
The annual reports were downloaded from each bank’s website, the Bank of Indonesia
and the Indonesia Stock Exchange’s website. According to Hakim (1982), data that are
collected from literature reviews, publications (such as: journals, newspapers), books,
and websites are categorised as secondary data.
The benefits of secondary data according to (Ghauri & Gronhaug, 2005); Churchill (2010)
are: first, the data already exists. Second, it is relatively easy to collect by searching the
internet, scanning newspapers, or by reading reports published by companies,

126
governments, stock exchanges, public databases, or related departments. Third, the
researcher does not gather data directly in the field because it has already been collected
by others. Fourth, the researcher can use the data in a variety of forms. Fifth, it is more
efficient and less expensive. Six, data can represent a national or international scope.
Finally, the data is easy to collect over a long time period and it is easy to process with
software. Nevertheless, secondary data has weaknesses, first, the data are already
given, meaning that they might be either not appropriate or not as detailed as the
researcher needs or proposes. Along with that it should be tested for validity. Second,
certain kinds of research require the newest data while secondary data is typically from
a previous time.
Annual reports are the most crucial sources of data in this research. The advantages of
using annual reports include that they are regularly issued by banks as a mandatory rule
from the Bank of Indonesia and the Indonesia Stock Exchange. Annual reports reflect
historical management activities and important information. Furthermore, annual reports
are able to explain company performance in both quantitative and qualitative ways and
provide more detail, including pictures, graph and tables. Finally, related to the research
objective, annual reports are the best sources to measure risk disclosure by counting
sentences with keywords. In addition, Aljifri (2008) asserted that reporting firm
performance through a website or online has some advantages. First at all, an online
annual report is more complete and wide-ranging than other forms. Second, it gives firms
the opportunity to report their performance more flexibly; an issue related to the
complexity of the report, as online they may want to explore more without the limitation
of paper based presentation. Third, it is more efficient, uses less paper and takes up

127
less space. In addition, it can be read by users around the world any time, who can
rapidly and easily search and download for any purposes. Finally, the firms are able to
make the reports more interesting by showing pictures, tables, or animation.
This study did not employ the online information from the bank’s website because each
bank has different model of website and the information itself could not be converted into
text. While the research question is to measure the extent of risk disclosure, hence
employing annual report in pdf format by downloading from bank’s website is more proper
to be converted into text and easy to be tested by QSRN6.
Based on the research aim, which is to analyse the association between the
determinants, namely: bank size: liquidity: profitability: leverage: and earnings
reinvestment, with risk disclosure and firm value, in addition to the value relevance of risk
disclosure, all of this requires numerical data from a bank’s financial report, which means
this research adopts a quantitative methodology and thus tends to a philosophical
position of positivism. Moreover, this study needs data covering a long time period (2008
to 2012) in order to provide valid generalisable results.
Communication theory suggested that a good communication is when the sender can
send the information through an appropriate channel in order to make receiver
understand what the sender has sent. Corroborating with communication theory,
signalling theory mentions that one party (sender) deliver a signal as an information to
the other party (receiver), nevertheless asymmetric information problem can interfere in
this process. Moreover, agency theory asserted that there is a correlation between
principals and agents, but asymmetric information can appear between them.

128
Disclosure of the annual report can reduce the agency problem. In other way, the
principal need firm performance in more detail in the annual report from the agent before
they make financial decision, and it will be value relevant if the information are useful for
stakeholders. In this research, banks send their performance information as the signal
to the stakeholders through annual report. By using annual reports, it can be measured
how the extent of the risk disclosure can be quantified, what is the determinants and the
factors affect a bank’s decision to disclose the risk and whether risk disclosure is value
relevant for stakeholders in Indonesian banking sector. In order to answer the research
questions, it should be more properly tested by quantitative methodology rather than
qualitative methodology, because it is easier to get the data from annual report and the
result can be generalised. In addition, the data can be tested by using statistical method
and even comparing between listed and unlisted, Islamic and non-Islamic banks.
Furthermore, agency theory is a neo classical or positive theory that experimentally test
its implications using quantitative methods. Signalling theory similarly adopt a
quantitative approach. Their implication on measurement of risk disclosure are as
follows:
1. The appropriate approach within the literature has used quantitative methodology
such as Hassan et al, (2009); Uyar and Kilic (2012). Hence, the reason why this
research employs a positivist approach is because it follows the approach of
previous research that has been done by quantitative methods.
2. The theories itself, agency and signalling theory, have positive implications which
testable that follow the quantitative approach. Agency theory that has discussed
in chapter 3 has positive implication which are tested through quantitative
129
methods. In positive theory empirically has tested in the literature. Hence, this
study has the most appropriate approach for study in Indonesia.
3. A justification in using quantitative methodology because this study stressed
measuring risk keywords and sentences in the annual reports in order to test
research hypotheses. Along with that quantitative approach is required.
The Ontology of Risk
There is an implicit assumption in the literature that the measurement of risk as reported
by a firm is targeting. Ryan (2007) mentioned that theory at least would suggest that the
concept of risk is the predominant concern of external investors. The reality of risk as
reported in the financial statement is one of a series of constructs which are believed to
have some relationship with underlying notions or concepts of risk relevant to investors.
The risk terms employed in this study have been adopted as broadly classified within the
literature. However, it is not clear that the accounting constructs used by financial reports,
reflects the reality of risk from an investor’s perspective. Ontologically, there appears to
be a distinction in the literature between a firm’s socially constructed reality and a more
realistic perspective contained within the statistical measures of asset volatility. Previous
research has tended to be based upon the former and the results need to be interpreted
accordingly.
5.3 Research Methods
Methods, according to Crotty (1998, p. 3) are “the techniques or procedures used to
gather and analyze data related to some research questions or hypothesis”. In addition,
Williams (2007, pp.66-67) declared that “a quantitative research method involve a

130
numeric or statistical approach to research design. As a result, data is used to objectively
measure reality” while a “qualitative method involves purposeful use for describing,
explaining and interpreting collected data“. In other words, quantitative method is a
method which employs statistical data and makes the data into tables and or graphs.
After gathering data and all relevant information on mandatory and voluntary risk
disclosure, the data will be examined to establish the relationship between variables,
using statistical tools to analyse the result.
In order to quantify the extent of risk disclosure in the annual report over the period from
2008 to 2012, this study employs a technique of counting the Indonesian risk keyword
divided by the number of Indonesian sentences. Due to some annual reports being
reported in dual languages, English and Indonesian, the total sentences in dual
languages was divided by two. Kravet and Muslu (2013) asserted that risk disclosure
can be reflected in the total number of sentences with at least one risk keyword.
Measuring risk disclosure by counting the Indonesian risk keyword divided by the number
of Indonesian sentences has several advantages. First of all, by counting the sentences,
multiple counting of the same keywords is avoided. A broader perspective was adopted
by Milne and Adler (1999), who argued that counting sentences is better that just merely
counting keywords, because sentences are more trustworthy and meaningful than words
in describing a particular purpose. Moreover, the practicalities of disclosure can differ
from sentence to sentence. In a study conducted by Haniffa and Cooke (2005) it was
shown that measuring risk disclosure by counting sentences is better than counting
words or pages, because a sentence is more objective in their interpretation of the
connotation and meaning. An annual report may have many pages, but it might just be
131
full of pictures, graphs or numbers and offer little explanation. Hopskins (1996b) also
explained that using sentences for explaining firm information is easier to read and
interpret for users.
In order to boost trustworthiness, and also to aid stakeholders to assess the firm’s
condition and strategies, companies have to provide comprehensive information. The
annual report is a prime medium for presenting information from the company to users,
consisting as it does of a finance summary, analysis and report by management, as well
as financial reports. In addition, an annual report communicates the financial condition
and other conditions (non-financial) for the shareholders, creditors, stakeholders and
potential shareholders to show the firm’s effectiveness in achieving its goals and the
corporate responsibility report of the organisation (Healy & Palepu, 2001). As sources
of information, financial reports are needed by users for consideration in the making of
financial decisions.
5.4 The population and data periods covered
The population of this research is focused on listed and unlisted banks, Islamic and non-
Islamic banks in Indonesia, which released annual reports over the years 2008 to 2012.
The choice of the period covered by the data used in this research was based on a
number of reasons, first since 2008 Indonesian banks have had to manage their risk
based on Basel II, and since 2009 all banks’ managers and staff have been required to
have a risk management certificate, hence they had better knowledge in managing and
reporting risk. In addition, best practice of IFRS (International Financial Reporting
Standards) in Indonesia which was introduced in 2012, forced banks to publish their risk
performance in more detail than they has in previous reports. This meant that by starting

132
the application of IFRS in 2012, banks are likely to have been more transparent in
reporting their performance starting in 2013.
There are 120 banks in Indonesia: based on the listing on the Indonesia stock exchange
there are 32 listed banks and 88 unlisted banks, while in terms of banks based on sharia
principles, there are 11 Islamic banks and 109 non-Islamic banks. One of them,
Muamalat, an Islamic bank, is categorised as an unlisted bank in this study because it
was not trading shares in ISEM, but rather sold Subordinated Sukuk Mudharabah and
subordinated sharia bonds; hence the movement of share price was not available.
5.5 Dependent and independent variables
Based on the research aim, which is to analyse the association between the determinants
and value relevance of risk disclosure in the Indonesian banking sector, the research will
discuss the independent variables which might have a relationship with the dependent
variables and whether risk disclosure has value for users. Along with that, this part
explains dependent and independent variables and their measurement. This part also
explains how to conduct validity and reliability tests.
5.5.1 Dependent variables
Based on the research questions, this research employs two dependent variables,
namely risk disclosure (Y1) and firm value (Y2).
Risk Disclosure (Y1)
Risk disclosure can be measured by a range of methods, but no one measurement is
perfect and has all the advantages and none of the disadvantages. One of the methods
133
for measuring risk disclosure is a disclosure index. Cerf (1961) is the first researcher who
measured risk disclosure by using a disclosure index with 31 items based on the interview
method and scored in four scales. Botosan (1997) employed a disclosure index, whereby
the level of risk disclosure was measured by an ordinal weighted scale. The scales were
built based on the weighting of information as follows: score two if the information shows
quantified disclosure; score one if the information explains disclosure through qualified
information, and zero if it does not give any information. They argued that the information
in some items is more important and relevant than others items for stakeholders.
Moreover, they asserted that quantitative information is more important, useful, and
precise, than qualitative information hence quantitative information has the highest score.
On the other hand, Beretta and Bozzolan (2004) mentioned that qualitative information
is more important than quantitative information.
Numerous studies have attempted to explain the content of disclosure and measure
those contents qualitatively and quantitatively. Hopskins (1996b) argued that the extent
of high quality disclosure information can potentially be measured by how easily it can
be read and interpreted by investors easily. However, due to the difficulty in measuring
investors’ perception of disclosure quality, researchers commonly use disclosure quantity
as a proxy for disclosure quality (Bamber & McMeeking, 2012).
There are many analyses of the quantity of corporate disclosure in different forms,
including reviews of the number of words (Hasseldine, 2005). More recent examples of
quantity based content analysis studies have counted the number of risk relevant
sentences (Linsley & Shrives, 2006). Bamber and McMeeking (2012) explained that

134
there are four reasons why quantity is preferable: because it is less subjective, simple to
measure, efficient, and technical accounting and auditing knowledge is not required.
Hassan et al. (2009) measured levels of disclosure in the Dubai Financial Market by using
the Disclosure Index methodology with 45 items of information which were grouped into
general risk information (10 items of information); accounting policies (13 items); financial
instruments (4 items); derivative hedging (3 items) ; reserves (3 items); segment
information (3 items); financial and other risks (9 items). To measure level of disclosure,
Greco (2011) employed a content analysis method. Another method to measure level of
disclosure used by Hutajulu (2002) was to count the number of standardised text lines
with each line having a maximum 72 characters.
Al-janadi, Rahman, and Omar (2012) employed three unweighted levels of voluntary
disclosure, namely: level 3 if the report explains qualitative and quantitative information;
level 2 if the report exhibits either qualitative or quantitative information; level 1 if the
items are not disclosed. They argued that unweighted levels are better than a weighted
scale because they perceived that all information in the items was crucial and relevant
for stakeholders as they have different needs. Furthermore, Bailey, Karolyi, and Salvac
(2005) used dummy variables to count risks disclosure. Albeit this method only
emphasizes whether a firm reports risk disclosure items or not, without considering the
content of annual reports in more detail and whether it is readable.
Wallace and Naser (1995) attested that disclosure index is a good method and suitable
for checking the mandatory items of disclosure, but is not appropriate for checking
information within voluntary disclosure. Nevertheless, those methods only calculate
135
certain points in particular disclosure related to risk information or items, because firms
should explain risks in their annual reports due to existing regulations. Furthermore, this
method is not able to detect whether the firm explains the risks in more detail or not, the
extent of risk information, even the delta in the company’s performance in every period.
Moreover, Hassan et al. (2009) mentioned that a disclosure index requires judgment in
deciding the type and items of information, and more tends to be more subjective.
Another method for measuring risk disclosure is counting the pages of the annual reports.
Even though it is very easy and quick, pages might not explain the risk in more detail or
may not be able to reflect their performance. Firms may report over many pages, but if
these pages just show a lot of pictures, tables or graphs, and there is less in the
sentences or less information, therefore the meaning may not be understood clearly by
stakeholders, and they could even misunderstand it.
This study does not employ questionnaires or interviews for measuring risk disclosure,
because Hassan and Marston (2010) mentioned that if the design of questionnaires is
not quite done well or properly, it will impact the interpretation and final result. Moreover,
viewing individual reports users of financial information cannot compare the information
among banks, or between listed and unlisted banks, or between Islamic and non-Islamic
banks. The users also cannot remember what was going on with the banks and
comparing over the time 2008-2012.
Kravet and Muslu (2013, p.1094) defined that risk disclosure can be reflected by the total
number of sentences with at least one risk-related keyword. The code tags a sentence
as risk-related if the sentence includes at least one of the following risk-related keywords
136
“(where * implies that suffixes are allowed): can/cannot, could, may, might, risk*,
uncertain*, likely to, subject to, potential*, vary*/varies, depend*, expos*, fluctuat*,
possibl*, susceptible, affect, influenc*, and hedg* “ and compare year-on-year deltas in
the level of disclosure”.
This research also refer to Elshandidy et al. (2013, p. 17) who examined risk disclosure
by reliability and validity before determining risk words; it means that the list keywords
are appropriate to be applied to other researches. The list includes the following words:
“risk*, loss*, decline (declined), decrease (decreased), less, low*, fail (failure), threat,
verse (versed, reverse, reversed), viable, against, catastrophe (catastrophic), shortage,
unable, challenge (challenges), uncertain (uncertainty, uncertainties), gain (gains),
chance (chances), increase (increased), peak (peaked), fluctuate*, differ*, diversify*,
probable*, and significant*”. The words with * means include derivatives from the original
words.
Hopskins (1996b) argued that the extent of the disclosure of quality information in the
sentences can potentially be read and interpreted by investors easily. Previous
researchers have employed some quantity methods for measuring risk disclosure. For
example, Botosan (1997); Hassan et al. (2009); Khotari et al. (2009); Hussainey et al.
(2003); Berreta and Bozzolan, (2004); Abraham and Cox (2007) used content analysis
to measure disclosure level, while Gruning (2011) utilised a combination of words,
sentences and lines.
More recent examples of quantity based content analysis studies have counted the
number of risk relevant sentences (Linsley & Shrives, 2006). Sentences were used to

137
record those disclosures because of conclusions that sentences are more reliable and
valid in cases if the study uses narrative text for counting disclosure of the annual reports
(Milne & Adler, 1999). In addition, Lajili and Zeghal (2005) asserted that risk disclosure
in the annual report are mainly described through non-financial types of data, which tend
to be qualitative and narrative. This is able to provide a clearer description of the extent
of disclosure and gives an emphasis in each item that should be informed to stakeholders
in order to make them clearly understand the firm’s real condition. Finally, by using
sentences instead of words for quantifying the quantity risk disclosure, multiple counting
of the same risk-related information is avoided
In addition, this study does not count merely the words or lines because according to
Ivers (1991) a word is the smallest unit in the sentences, even though it has a meaning
it cannot deliver the idea or message. While counting lines could not reflect the meaning
of risk disclosure, neither it can deliver the idea or message.
Along with that, risk disclosure, as the first-dependent variable (Y1), is proxy by number
of sentences and has at least one of the Indonesian risk keywords divided by total
number of Indonesian sentences in the bank’s annual reports.
In order to measure risk disclosure this study is aided by software QSR Nudist 6 (Non
Numerical Unstructured Data Indexing Searching and Theorizing). The advantages of
QSR Nudist6 are that it is easy to use and gives suppleness in importing data for
distinctive purposes. It is also easy and faster to make data grouping than manually
(Parlalis, 2011). Nevertheless, it has some problems, for example: the annual reports

138
could not be converted in to text because of being corrupted, blank, or having a
password, hence this software cannot process it.
There are some steps to calculate quantity risk disclosure. The first step is to down load
the annual reports in PDF from each bank. The second step is to convert each annual
report into a text file, and then save it in a separate text file. The next step is to identify
words that are associated with risk that are reflected in the sentences in annual reports.
Afterwards, put the text files into QSR Nudist6 and run it.
Firm Value (Y2)
The second dependent variable is firm value (Y2). Due to the population in this research
being listed and unlisted banks, the firm value will be measured by a different method.
For measuring firm value for the listed banks this research will employ Tobin's Q. While
firm value for unlisted banks will be measured by the approach of the Black Scholes
Merton option pricing model.
a. Measuring firm value for listed banks
Firm value of listed banks will be measured by Tobin’s Q because it is able to estimate
the success of management. Changes in Tobin’s Q ratio provides a measurement of
companies’ performance over time (Evans & Gentry, 2003).
Chung and Pruitt (1994) stated the ratio of Tobin’s Q, as follows:
Tobin’s Q = (MVE + PS + DEBT)/TA, where
139
MVE = product of firm’s share price and the number of common stock shares
outstanding
PS = liquidating value of the firm’s outranging preferred stock
DEBT = value of the firm’s short-term liabilities net of its short-term assets plus
book value of the firm’s long term debt (current liabilities – current assets) +
(book value of inventories) + long term debt
TA = book value of the total assets
b. Measuring firm value for unlisted banks
The increase of investment activities is shown by the appearance of a number of
investment alternatives. One of these investment types is the option. Option is one of
the instruments that are classified as a derivative securities stock. Options are called
derivatives because they must have underlying securities. There are two kinds of option,
namely call and put options. In general, the option can be interpreted as a claim to buy
or sell a particular stock that is deliberately created by other investors.
An option is an agreement between two parties, i.e. the writer and the holder. The holder
has a right to buy (call option) or to sell (put option) an underlying asset in a specified
time and specified price (Ryan, 2007) . A call option entitles shareholders to purchase a
number of shares at a specified price at any time before maturity on date, whereas a put
option gives the right to the shareholders to sell a number of shares at a specified price
at any time before rights are exhausted on a given date. Usually the option is sold by the
issuer at a specified price. If the holder sells an underlying asset at a specified time and
price to the writer, it means the holder uses the right of “put option”. Conversely, if the
140
holder buys an underlying asset, it means the holder uses the right of a “call option”. If
the actual price is less than the exercise price, the holder can use the put option right to
get benefit or premium by selling the shares to the writer. On the other hand, if the
exercise price is less than the actual price, the holder can keep the shares or buy the
shares. It means the holder uses the call option right.
The Black Scholes option pricing valuation model is a model that has been widely used
in financial investments. The option value can be measured by the Black Scholes (F.
Black, 1976). The Structural Model introduced in Black and Scholes’ seminal paper in
1973 is concerned with options modelling. This model was developed by Merton in 1973
in and adaptation which uses a bankrupt risk model and modified the Black-Scholes
model (Merton, 1973) and is now known as the Black-Scholes-Merton (BSM). This model
assumes that the stock price variance is a constant, random process in obtaining stock
price, stock does not pay dividends, no transaction costs, and a risk-free interest rate.
Furthermore, option price is strongly influenced by the stock price, the exercise price,
volatility, interest rates, and time (Hull, 2012, p.309).
The reasons for using Black Scholes Merton model for measuring the firm value
of unlisted banks
In the seminal paper Black Scholes recognised that the present of limited liability offered
a call option underlying assets of the firm. This was extended by Merton subsequence
paper. Merton recognised that an equity investor under limited liability was in possession
of a put option on the underlying of assets of the business for their term to maturity. The
equity investor when combining the implied put option associated with the limited liability

141
and their long position in the underlying assets of the firm had through put call parity, a
call option for the term of liability of the firm. The liabilities represent the exercise, strike
price of the implied call option. With this Black Scholes Merton offered a theoretical
mechanism for valuing contingent claims in the business and indeed in any area of
valuation.
The net present value method of valuation give a spot value on the firm but the Black
Scholes model allows one to value the firm where the investor has the ultimate choices
whether to remain invested or not in the future. Black Scholes model measures the
volatility of the firm’s underlying assets on equity.
Equity value is an important number for a business owner to know when selling a
business. Firm equity value (E) is total assets (A) minus liabilities (L), and is reflected in
share price, and share price will increase when assets are higher than liabilities (Ryan
(2007). It can be shown in the figure 5-1.
The Merton model (1974) shows that not only the value of liability and value of the equity
can be measured, but also the probability of loss can be estimated under some
assumptions by using a call option of assets. Black (1976) explains that the premium
from call or put option is determined by: first, the value of underlying assets; second,
volatility of assets; third, the exercise price; fourth the risk free risk; and finally, time to
exercise. It can be written as equity value = f(asset value, asset volatility, value of debt,
risk free risk, time to exercise). It can be shown that value of firm will increase when
assets are higher than liabilities in figure 5. 2.
142
Asset value is the maximum price that assets are worth to the owners and how much
they will be paid for it if the company is sold. Moreover, value of debt or liability is a debt
or obligation of the firm currently arising from past events. Furthermore, volatility is a
movement of securities value that cannot be predicted accurately. A high volatile security
indicates a high risk security.
Problem in the bank is an industry which has high gearing. Equity is a small fraction of
the underlying asset value of the bank. In this situation, the bank’s limited liability give
what we call time value for investors, because in the failure condition, shareholders can
walk away with zero liabilities. Therefore, the equity value of the bank can be regarded
as call option on the underlying asset of the bank. The BSM call options refer to equity
value, while Merton develop bankrupt model implying asset value and volatility of asset.
Share price will very reflective the value of a call option on the underlying asset bank in
the market value (Ryan, 2007). All in all, it is the simple procedure to measure firm value
for unlisted bank by using Black Scholes Merton model.
The steps to measure firm value for unlisted banks
Volatility can be measured by the standard deviation of the continuously generated rates
of return on the underlying assets. Time to exercise is a time when the holder uses the
right for selling or buying the option. Risk free rate is a security interest that has low risk
when there is no inflation. The model of call option based on Black Sholes model as
follows:
C = N (d1) Po – N(d2)Pe–rt where
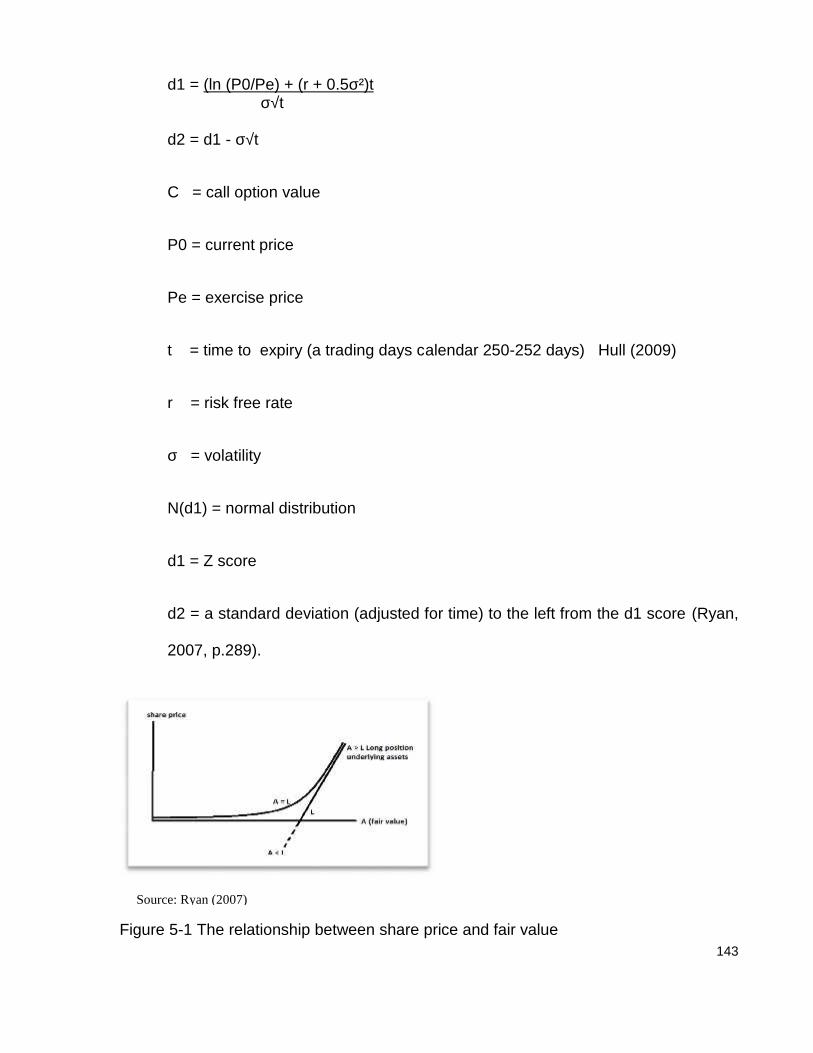
143
d1 = (ln (P0/Pe) + (r + 0.5σ²)tσ√t
d2 = d1 - σ√t
C = call option value
P0 = current price
Pe = exercise price
t = time to expiry (a trading days calendar 250-252 days) Hull (2009)
r = risk free rate
σ = volatility
N(d1) = normal distribution
d1 = Z score
d2 = a standard deviation (adjusted for time) to the left from the d1 score (Ryan,
2007, p.289).
Figure 5-1 The relationship between share price and fair value
Source: Ryan (2007)

144
Source: Ryan (2007)
Figure 5-2 The relationship between value of firm and value of assets
A firm value for equity of an unlisted bank can be achieved by using the implied volatility
of a listed bank. The proxies can be explained in table 5-1 below:
Table 5.1 The valuation variable
No Measurement of value ofoption (C) by BlackScholes model
Measurement for estimating the equityof firm value (E) by Merton model
1 Current price (Po) Assets value (Ao)2 Exercise price (Pe) Total Liabilities (Le)3 Risk free rate (r) Risk free rate ( r )4 Time to exercise day (t) Time to repay liabilities (estimated average
term to maturity of firm liabilities ) (t)5 Volatility of shares (σe) Volatility (standard deviation) of asset
value (σA)E = N (d1) Ao – N(d2)Ae–rt
whered1 = (ln (A0/Ae) + (r + 0.5σ²A)t
σ√td2 = d1 - σA√t
145
In order to achieve an estimated value of equity for the proxy of firm value of unlisted
banks, this research will employ two models i.e. The Merton Structural debt Model and
Black and Scholes Option Pricing Model. To simplify the calculation of those models, it
will be supported by Excel spreadsheet. Three main excels will be used to explain how
the firm value can be measured. First, the volatility estimator spread sheet for achieving
a number of the volatility of equity. Second, The Merton structural debt model spread
sheet will be used for calculating asset volatility of listed banks. Third, the Black and
Scholes option pricing model spread sheet will be used for achieving the estimated value
of equity for unlisted banks.
The three main steps for calculating the estimated value of equity for the proxy of the firm
value of unlisted banks is as follows:
1. Measuring the Annual Volatility of Equity
There are some steps for measuring volatility of equity using a volatility estimator, as
shown in excel spreadsheet (Table 5.2). First, put daily share price in the volatility
estimator spread sheet, at least 101 days (N), in the cell B7-B107. Second, measure %
return by counting = LN (1+ (CPt-CPt-1)/CPt-1. In the excel, the formula is LN (1+ (B7-
B8)/B8 and so on. Put the result in cell C7 until C106. Then, calculate the average of %
return and put the result in cell G6. Afterwards, calculate (101-n)/sum (D7:D106) times
squared of (%return-average daily of %return). Put the results in cell E7 – E106. The
next step is measuring daily volatility (weighted) by square root of sum (E7; E106) and
put the result in cell G8. Finally, measure annual volatility (weighted), that is squared
root of 250 days multiplied daily volatility (weighted). Put the result in cell O8. This
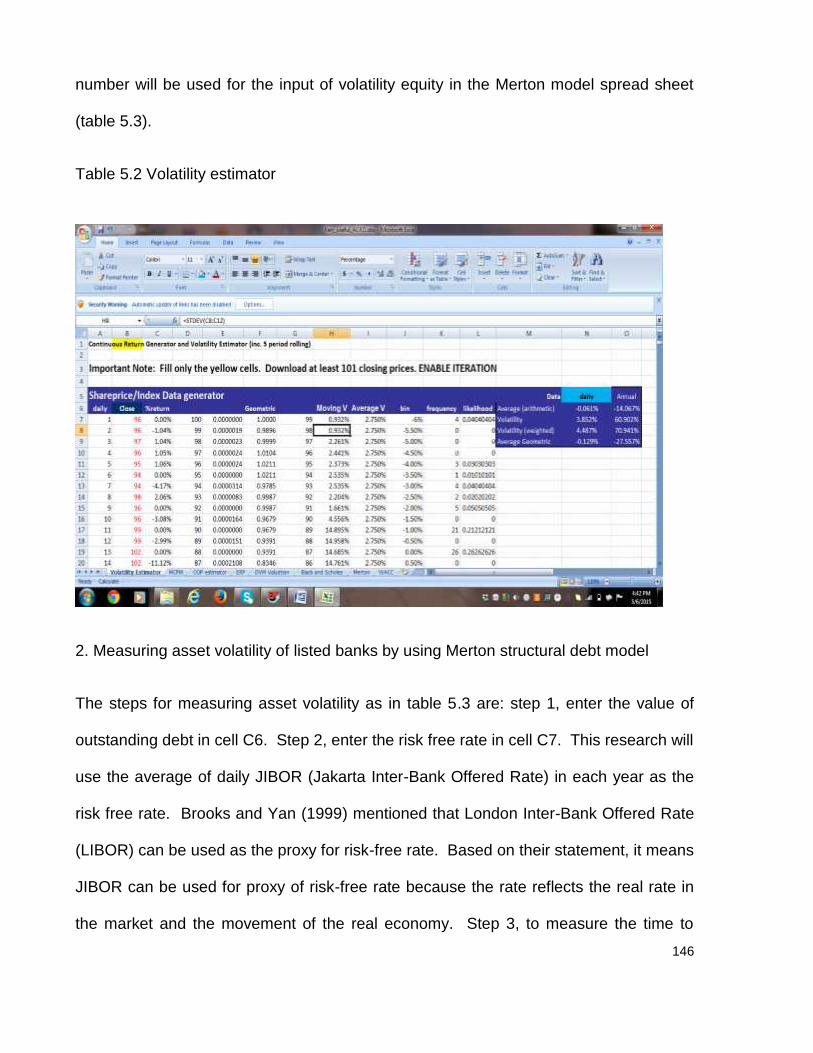
146
number will be used for the input of volatility equity in the Merton model spread sheet
(table 5.3).
Table 5.2 Volatility estimator
2. Measuring asset volatility of listed banks by using Merton structural debt model
The steps for measuring asset volatility as in table 5.3 are: step 1, enter the value of
outstanding debt in cell C6. Step 2, enter the risk free rate in cell C7. This research will
use the average of daily JIBOR (Jakarta Inter-Bank Offered Rate) in each year as the
risk free rate. Brooks and Yan (1999) mentioned that London Inter-Bank Offered Rate
(LIBOR) can be used as the proxy for risk-free rate. Based on their statement, it means
JIBOR can be used for proxy of risk-free rate because the rate reflects the real rate in
the market and the movement of the real economy. Step 3, to measure the time to

147
exercise (days). This research employs an estimate of the average term to maturity of a
bank’s liabilities. The steps for getting an estimate of average term to maturity of bank’s
liabilities (C8) are: first, counting the sum of liabilities in each time maturity which is
divided by total liabilities multiplied by each time of maturity. Second, count 250
transaction days divided by twelve months divided by the sum of liabilities maturity.
Finally, enter the time to exercise (days) in cell C8.
Table 5.3 The Merton structural debt model
Source : modified from (Ryan, 2007, p.348)
Step 4, to measure value of equity by multiplying closing share price with outstanding
shares. Enter the result in cell C9. Step 5, take the number representing the volatility of

148
equity from cell O8 in the volatility estimator spread sheet (table 5.2) as the input for cell
C10 in the Merton model spread sheet.
Step 6 involves measuring d1 that is LN of current asset value divided by value of
outstanding debt, add by risk free rate plus 0.5 multiplied by the square of asset volatility,
multiply time to exercise divided by 250, then divided by asset volatility multiply square
root of time to exercise divided by 250. Enter the result in cell C12. In the excel, it can
be calculated by (LN C3/C6) + (c7 + 0.5 x C4²) x C8/250 / (C4 x SQRT (C8/250)).
Step 7, measuring d2, which is d1 minus asset volatility multiplied by the squared root of
time to exercise day divided by 250. In excel, it should be C12- C4 x SQRT (C8/250).
Enter the result in cell C13.
Step 8, measuring N (d1) is the normal distribution of d1, and enter the result in cell C15.
Step 9, measuring N (d2) is normal distribution of d2 and enter the result in cell C16.
Step 10, measuring the value of the equity call on the firm’s assets, that is N(d1)
multiplied by current assets value minus N(d2) multiplied by value of outstanding debt,
multiplied by exponent of minus risk free rate multiplied by time to exercise divided by
250. In excel, it can be calculated by C15 x C3-C16 x exp(-C7 x C8/250). Enter the
result in cell C18.
Step 11, to measure actual equity is value of equity minus value of equity call on the
firm’s assets. Enter the result in cell C20.
Step 12, the estimate of equity value can be measured by value of equity minus N(d1)
multiplied by asset volatility multiplied by current asset value divided by volatility of
149
equity. Enter the result in cell C21. After that, to measure the squared total is the actual
equity to the power of two plus estimated equity value to the power of two, then enter the
result in cell C22. The next step is to measure current asset value and asset volatility.
Fill any number (just guessing) in the current asset value (cell C3) but it must be greater
than the value of outstanding debt. Enter any number for asset volatility (in percent in
cell C4) (just guessing). If the value of the underlying assets and their volatility cannot
be calculated with ordinary math, a solution algorithm with Solver menu in the excel
program can be used. Moreover, create the menu solver in excel with the target cell,
which is the squared total (cell C22) and delta the total square of its cells, which are
current asset value (cell C3) and asset volatility (cell C4). Volatility of asset value
obtained is used as the estimated asset volatility for unlisted banks in the Black and
Scholes pricing models option.
Furthermore, in order for the proxy bank equity volatility of listed banks obtained to be
suitable for the approach used with the unlisted banks, the listed and unlisted banks
should be classified in accordance with the similarity of their core business. For example,
a cluster of banks which has a core business in retail, agriculture, corporate, etc.
Nevertheless, after grouping based on their core business, most banks in Indonesia,
large and small, are focused on retail business. Accordingly, not only is competitiveness
among banks not fair, but also typical asset volatility of listed banks could not be used as
a proxy for unlisted banks because it cannot reflect the real condition. For clustering
banks in Indonesia, there are two options. First, based on Indonesian Banking
Architecture (IBA); or, second, based on the bank of Indonesia’s Regulation number

150
14/26/PBI/2012 about business activities and office network based on a bank's core
capital.
First, banks in Indonesia can be grouped based on the IBA (www.bi.go.id). Since January
9th 2004, Bank of Indonesia has been planning the Indonesia Banking Architecture, which
it intends would be implemented with a clear vision. The vision of the IBA was to create
a sound and strong banking system, in order to create a stable and efficient financial
system for encouraging the growth of the national economy. Within ten to fifteen years,
the future capital improvement program is expected to lead the creation of a more optimal
banking structure, namely the presence of: first, two to three of the banks moving
towards the status of international banks, which have international capacity and the ability
to operate in the region and internationally, and have capital above Rp.50 trillion. Second
group is three to five national banks which have very broad scope of business and
operate nationally and have capital between Rp.10 trillion and Rp.50 trillion. Third, thirty
to fifty banks whose operations are focused on specific business segments in accordance
with the capability and competence of each bank. These banks have capital between
Rp.100 billion to Rp.10 trillion. Finally, a group of the Rural Banks and banks with limited
scope. Those banks have capital below Rp.100 billion. Grouping banks based on IBA
is only aimed at strengthening the structure of the national banking system, and the
capital of the banks, in order to improve the ability of banks to manage the business and
risks, develop information technology, and increase the scale of its efforts to support the
growth of bank credit capacity. Thereby, clustering banks based on IBA is irrelevant for
this measurement.

151
The second option for clustering banks is to refer to the BI regulation number
14/26/PBI/2012. This regulation classifies banks into four groups based on core capital
(Bank Umum Kelompok Usaha =BUKU). First, BUKU 1 is a bank that has core capital
less than one trillion Rupiah. Second, BUKU 2 is a bank which has core capital between
one trillion Rupiah and less than five trillion Rupiah. Third, BUKU 3 is a bank which has
core capital between five trillion Rupiah and less than thirty trillion Rupiah. Finally, BUKU
4 is a bank which has core capital at least thirty trillion Rupiah. Because this regulation
is more clear and detailed in explanation not only of the classification of core capital, but
also the kinds of business activities and network office in accordance with their core
capital, therefore the clustering of banks within this study will be achieved with reference
to this regulation.
After clustering the banks based on their core capital, then calculating the overall volatility
of the asset volatility of each listed banks group, the result will be used as the input for
estimating the asset volatility of unlisted banks in the Black and Scholes option pricing
model, as shown in table 5.4.
3. Achieving equity volatility of unlisted banks by using Black Scholes Option Pricing
model
The steps for measuring estimated value of equity as a proxy for firm value for unlisted
banks are as follows:
First, enter the value of asset of the unlisted bank in cell C3 in table 5.4. Second, enter
the value of liabilities in Cell C4. Third, enter the average JIBOR as the risk free rate in
cell C5. Afterwards, enter the term to maturity of the liabilities (days) in cell C6. Next,

152
enter the volatility of listed banks’ asset volatility which is in the same cluster with the
unlisted bank in cell C7. In order to measure the overall volatility of each group of listed
banks’ assets volatility, there are three steps to follow. The output of this calculation will
be used as an input for calculating the estimated value of unlisted banks’ equity.
Step 1. Making a prices table
First, enter number of shares in the cell B8 and so for each bank in the same row in table
5.5. Second, enter the daily share price (Pt) for at least 101 days in the columns of each
bank (B10 to B110). Third, calculate the market capitalization i.e. number of shares
multiplied by end of the year closing price (B8*B10) and enter the result in cell B9.
Table 5.4 Black Scholes option pricing model for estimating value of equity
Source: Ryan (2007)

153
Step 2. Making a relatives table
In making a relatives table, it should be on another sheet (table 5.6). First, calculate price
relatives of daily share price i.e. number of cell B10 (Pt) in table 5-5 divided by share
price at t-1 (cell B11), minus 1. The formula is (Pt/Pt-1)-1 and in excel this is (B10/B11)-
1. Then, enter the result in the cell B5 to B102 in table 5.6. Second, put the standard
deviation of price each bank from Table 3 at cell C4 to table 5.6 in the cell B3 and so on.
Third, calculate the weights i.e. market capitalization each bank in the table 5.5 divided
by total market capitalization (in excel is B9/G9) and put the result in cell B4 and so on.
Step 3: Making a correlation table
There are three steps in making correlation for calculating the overall volatility First, type
the weights from table 5.6 into table 5.7 in the cell D1 (horizontally) and in to cell C2
(vertically). Second, calculate standard deviation of weights each bank i.e. 1²σ1². In
excel is squared of cell D1 in the table 5.7 multiplied by squared of cell B3 in the table
5.6 i.e. (D1^2*Relatives!(B3)^2). Then, enter the result in cell D2, and so on. Finally,
calculate the overall volatility of the asset volatility the each group of listed banks i.e.
square root of the total of the weighted in table 5.7. In excel, it can be calculated by
(SQRT(SUM(D2:G5)).
The result of those steps will be used as the input for asset volatility for unlisted banks,
which are in the same groups as listed banks. Next, enter the result (C7 in table 5.7) into
table 5.4 in cell C7.

154
Table 5.5 Daily share price
Table 5.6 Relatives
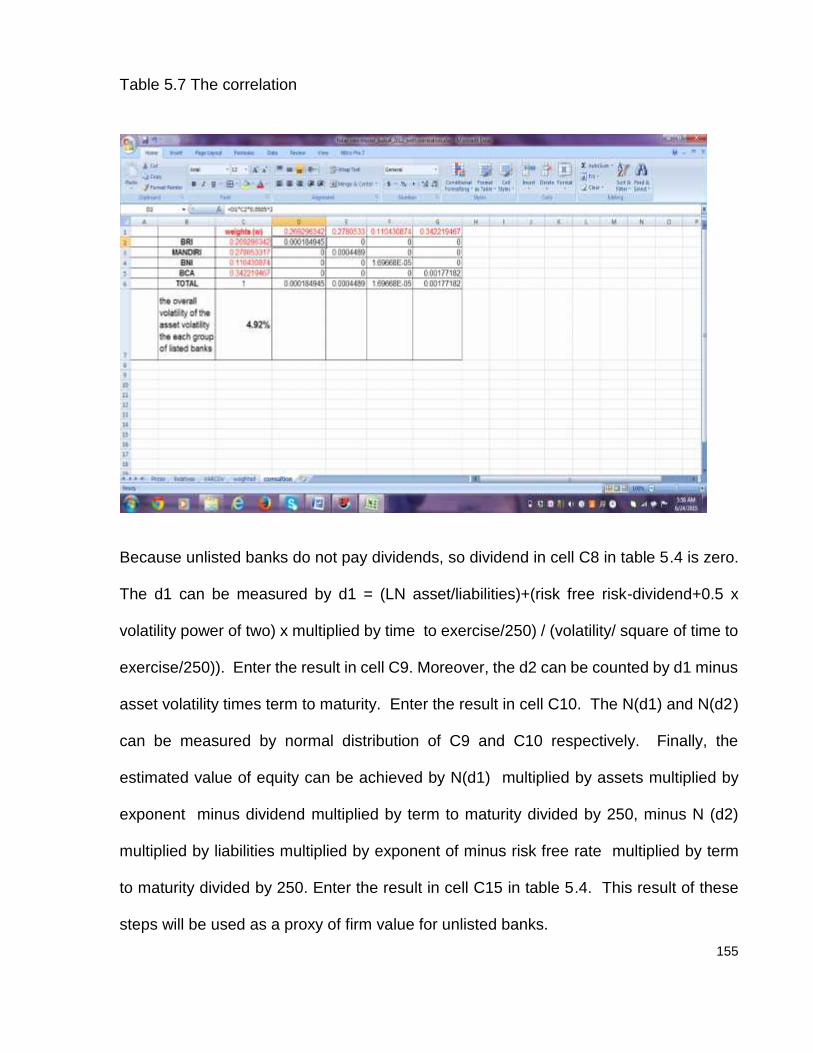
155
Table 5.7 The correlation
Because unlisted banks do not pay dividends, so dividend in cell C8 in table 5.4 is zero.
The d1 can be measured by d1 = (LN asset/liabilities)+(risk free risk-dividend+0.5 x
volatility power of two) x multiplied by time to exercise/250) / (volatility/ square of time to
exercise/250)). Enter the result in cell C9. Moreover, the d2 can be counted by d1 minus
asset volatility times term to maturity. Enter the result in cell C10. The N(d1) and N(d2)
can be measured by normal distribution of C9 and C10 respectively. Finally, the
estimated value of equity can be achieved by N(d1) multiplied by assets multiplied by
exponent minus dividend multiplied by term to maturity divided by 250, minus N (d2)
multiplied by liabilities multiplied by exponent of minus risk free rate multiplied by term
to maturity divided by 250. Enter the result in cell C15 in table 5.4. This result of these
steps will be used as a proxy of firm value for unlisted banks.

156
All in all, by using the Black Scholes option pricing and Merton structural debt model, call
option on its assets can be used as a proxy for the unlisted firm’s equity. Along with that,
measuring firm value for unlisted banks will be calculated by employing Black Scholes
Merton models.
5.5.2 Independent variables
Based on the research aim which is to analyse the relationship between the determinants
and value relevance of risk disclosure in the Indonesian banking sector, the determinants
will be explained as follows:
Firm Size (X1)
Firm size is one of the most important factors which impact the level of risk disclosure.
Firm size could be measured by the following methods for example, market capitalisation,
total sales, total employees, total assets, total revenue. The variable of firm size in this
study will be measured by total assets, because assets could reflect the wealth of a
company. Moreover, it is either the basis of a company’s financial performance
measurement or the comparison of achievement among the same industries. In addition,
due to the population consisting of listed and unlisted banks, while unlisted banks do not
have market capitalisation; and banks do not have total sales, hence total assets are
more appropriate and objective than other variables for reflecting firm size. Then, Firm
Size = Total Assets.
Liquidity (X2)
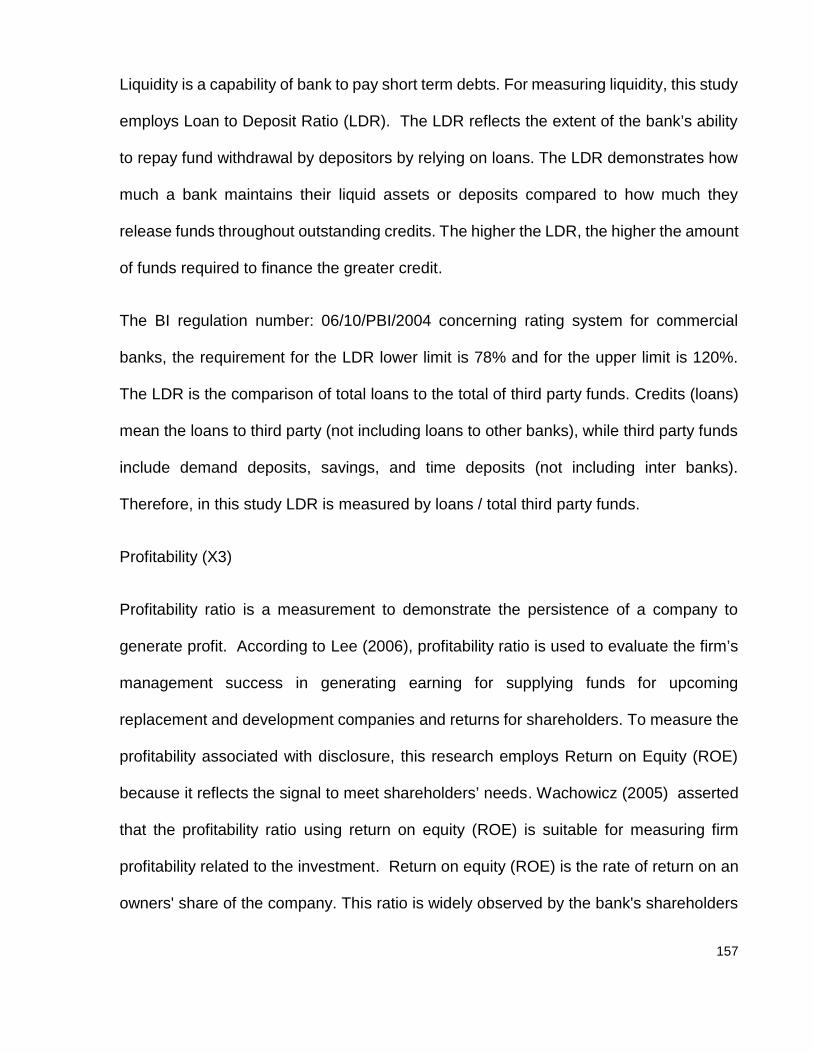
157
Liquidity is a capability of bank to pay short term debts. For measuring liquidity, this study
employs Loan to Deposit Ratio (LDR). The LDR reflects the extent of the bank’s ability
to repay fund withdrawal by depositors by relying on loans. The LDR demonstrates how
much a bank maintains their liquid assets or deposits compared to how much they
release funds throughout outstanding credits. The higher the LDR, the higher the amount
of funds required to finance the greater credit.
The BI regulation number: 06/10/PBI/2004 concerning rating system for commercial
banks, the requirement for the LDR lower limit is 78% and for the upper limit is 120%.
The LDR is the comparison of total loans to the total of third party funds. Credits (loans)
mean the loans to third party (not including loans to other banks), while third party funds
include demand deposits, savings, and time deposits (not including inter banks).
Therefore, in this study LDR is measured by loans / total third party funds.
Profitability (X3)
Profitability ratio is a measurement to demonstrate the persistence of a company to
generate profit. According to Lee (2006), profitability ratio is used to evaluate the firm’s
management success in generating earning for supplying funds for upcoming
replacement and development companies and returns for shareholders. To measure the
profitability associated with disclosure, this research employs Return on Equity (ROE)
because it reflects the signal to meet shareholders’ needs. Wachowicz (2005) asserted
that the profitability ratio using return on equity (ROE) is suitable for measuring firm
profitability related to the investment. Return on equity (ROE) is the rate of return on an
owners' share of the company. This ratio is widely observed by the bank's shareholders

158
and investors in the capital market who want to buy shares. In addition, Return on Equity
(ROE) is the main attention of the shareholders, as it pertains to shares invested in the
company. Furthermore, ROE is significant for assessing the financial performance of the
company to meet shareholders’ expectations (Helfer, 2001). The ROE can be measured
by profit for the year divided by equity or earning after interest and taxes divided by equity.
Leverage (X4)
Leverage ratio is a firm’s financial ratio for measuring the company’s ability in paying long
term debt. Watson et al. (2002) explained that leverage is considered as the variable of
the model because first it demonstrates the company's ability in using debt to increase
profits. Second, leverage can be used as consideration in viewing the potential
bankruptcy risk of a company because most of the bank’s sources of funds are debts.
Third, Höring and Gründl (2011) mentioned that leverage ratio is a popular ratio in risk
disclosure study. Fourth, D’Hulster (2009) asserted that banks with high leverage
supported the previous financial crisis in 2007. This research, leverage is calculated by
debt divided by total assets.
Earnings reinvestment (X5)
Bank (2004) defines that earnings reinvestment is earnings that will not be paid to the
shareholders but will be retained and reinvested in its main business to support a
company’s growth opportunities. Moreover, Bodie et al. (2011) stated that companies
which distribute large dividends initially will have low reinvestment opportunities and in
the future dividends growth rate will be low. Conversely, if the company has an earning
reinvestment policy, while initially investors will receive small earnings, in the long-term

159
investors get benefits by receiving high dividends thereby increasing the value of shares
(Figure 4-1). In other words, the companies with a high reinvestment rate generate higher
dividends in the future and finally it will boost firm value. The earnings reinvestment (b)
is calculated by earnings per share (EPS) minus dividends per share (DPS) divided by
earnings per share (Ryan, 2007, p.377).
Risk Disclosure (X6)
There is a real projection independent of manager’s concept of risk. From the finance
perspective, risk is driving the value of the firm. The formal risk is measured by volatility.
Risk represents the volatility of the firm’s underlying assets measured by standard
deviation by statistical tool.
Subramanian and Reddy (2012) mentioned that disclosure is releasing information for
the public pertaining to the companies’ activities and performance evaluation in the
interest of stakeholders. In this study, risk disclosure is to convey firm risk information to
the market through annual reports. This is measured by a number of Indonesian risk
keyword divided by number of Indonesian sentences in annual reports.
The proxies for the independent variables as determinants are mostly ratios, respectively:
Firm Size (X1) is measured by Total Assets.
Profitability (X2) is measured by ROE (Return on Equity) = Earnings after tax/ Equity
Liquidity (X3) is measured by Loan to Deposit ratio (LDR) or Financing to Deposit Ratio
(FDR) for Islamic Banks (based on the BI regulation No.6/ 10/SBI/2004 31 May 2004),
that is Loan/third sources of funds.
160
Leverage (X4) is measured by debt/assets.
Earnings reinvestment (X5) is measured by b= (EPS-DPS)/EPS.
Risk disclosure (X6) is measured by number of Indonesian risk keyword / number of
Indonesian sentences in annual reports.
Empirical Models
The model of the relationship between the delta of risk disclosure (RD) as the dependent
variable and the delta of determinants of risk disclosure as independent variable are as
follows:
Equation 5- 1: Model 1
RD = o+1assets+2LDR+3ROE+4Lev+5b+
The model of the relationship between the delta of firm value (FV) as the dependent
variable and the delta of risk disclosure and the delta of the determinants of firm value as
independent variable are as follows:
Equation 5- 2: Model 2
FV = o +1assets+2LDR+3ROE-4Lev+5b+6RD+
This study employs a comparative analysis to be able to exhibit company performance
progress over time. The developments of ratio over time will be calculated by the delta,
the difference of the numbers or ratio current year with the last year, based on several
premises. First, narrative information that describes the increase or decrease of the ratio
161
provides more information that can reflect the actual growth rate than merely the limited
numbers. Hence, the numbers would be useless if they are not compared with other
information. Thereby, the information using the (increase or decrease) becomes more
meaningful for users. Second, based on the difference of the numbers of the delta,
instead the annual financial report will be used to explain in more detail the meaning of
delta and why it happened. Third, in this study, the number of words in a sentence such
as "increase", "decrease", "decline" will be a proxy for risk disclosure that illustrate or
have the same meaning as interpretation of delta between risk disclosure in this year and
the previous year. In addition, by analysing the number of RD, it can be seen whether
the company increase or decrease in explaining risk disclosure or whether they convey
the signals in more detail and transparently compared to previous years.
Based on the signalling theory, when companies are more transparent, asymmetric
information will decrease. Thereby, when investors perceive financial statements and
annual report as providing accurate and credible information, it illustrates that the
company is more transparent in risk, and show slow levels of asymmetric information.
In line with the research objective and research questions, how the extent and quality of
risk disclosure in the Indonesian banking sectors can be effectively quantified, it can be
used as a reason why the research model uses the RD. First, RD indicates the extent
of changes in the level corporate-disclosure. Second, the delta can be used to compare
the change of risk disclosure’s extent each year and between firms (decrease or increase
compare with previous year).

162
Third, Collins (1989) highlighted that the difference is more useful in forming expectations
of the company’s future performance. Fourth, the delta used to reduce the dependence
between the period and the earning does not necessarily indicate growth opportunities
now, but could be due to change of growth or decline in economic activity in the previous
period. Fifth, the time series data has an autocorrelation problem, while an
autocorrelation supports non stationary. The data are stationary if the mean, variance
and covariance are constant. A test of stationary is the Unit Root test. In the unit root
process, the data will be smooth (white noise error) and stationary by employing delta
(Gujarati & Porter, 2009). Finally, it is clear that the explanation of the (Y t - Yt-1)
become more meaningful.
In the model 2, this research employs firm value because it is expected that the
increase of firm size, liquidity, profitability, earnings reinvestment, risk disclosure, and the
decreasing of leverage can boost firm value. By FV, it can be seen whether the firm
value increased or decreased compared to the previous year.
The fundamental weakness in using the determinants is biased against the number of
independent variables used in the model. If a variable is added to the model association,
it will certainly increase no matter whether the variables affect the dependent variable.
Therefore, when evaluating the best regression model, this research will use the adjusted
values (adjusted R square). Regarding to the result of r, “in the social science r² as low
as 0.25 are considered useful” (Hussain & Al-Ajmi, 2012, p. 580).
To compare listed and unlisted banks, Islamic banks and non-Islamic banks, risk
disclosure will be measured by t independent test. The definition of t test according to
163
Rock (2007) “the t test for two independent samples is an inferential statistic used to
examine the disparity between two population means, which in turn correspond to the
means of two independent samples”
The measurement of homogeneity in the correlation can be used to find the difference in
correlation coefficients across different groups, however the bias can be detected by a
pre-test. Statistical software, such as SPSS, can examine the Levene test for testing the
homogeneity of variance in these groups. Before using T independent test, the data will
be examined by Levene test (homogeneity of variance), because the number of listed
banks on the Indonesia Stock Exchange (32 banks) and unlisted banks (88 banks), the
Islamic banks (11) and non-Islamic banks (109) are not equal. Homogeneity of variance
can be used to test the similarity of some samples. Generalisation of the population can
be made by the Levene test. Levene Test will appear along with the t-test results. The
criteria is significant value or the value probability is < 0.05, it means data derived from a
different variance of population, while if the probability value significant > 0.05 it means
data derived from a same variance of population.
This research examines fourteen hypotheses that will be tested by quantitative methods
and then make a conclusion whether the hypothesis is accepted or rejected. Before
examining the hypothesis, it is important to test the data that are free from bias, by
investigating the association among variables and checking whether they are free from
multicollinearity, heteroscedasticity, and autocorrelation. Due to this research employing
large data and panel data, a normality test is not needed (Gujarati & Porter, 2009, p. 99).

164
The association between the determinants of firm characteristics namely firm size,
liquidity, profitability, leverage, earnings reinvestment and risk disclosure then
association between firm characteristics, risk disclosure and firm value will be examined
by Partial and Multiple correlation analysis with α = 5% (Neter, 1996).
Value Relevance
Moumen et al. (2013) mentioned that value relevance is if the information in annual
reports is transparent and valuable and useful for investors. According to A. Filip and
Raffournier (2010) value relevance can be described as value relevant if its coefficient is
statistically significant. Moreover, Agostino et al. (2011) asserted that value relevance is
estimated by the degree of explanatory power of the model. In this research, the
coefficient of significant statistical is employed for examining the value relevance of risk
disclosure as it had adopted by Beisland (2009).
5.6 Validity and Reliability Test
Before testing the research models, it must be ensured that the variables can be used
accurately, trustable, valid, acceptable and reliable. Moreover, to make sure that the
measurements work the job properly, it should be tested by reliability and validity. This
study employs counting sentence which has at least one of the risk keywords in
Indonesian language, it is crucial for assuring those keywords are valid and reliable for
this research, hence they must be tested by validity and reliability tests.
The first step for validity and reliability test is to choose banks’ annual reports randomly
as the samples. There are 21 banks (17.5%) of total banks in Indonesia (120) are pointed
as the samples. Second, due to some annual reports not being in English language, the

165
keywords must be translated into Indonesian language. In order to make sure that the
meanings are the same, the keywords were translated by three people who are experts
in finance and three English teachers who understand English and Indonesian language
well. Third, to count sentences containing keywords related to risk, at least one risk
keyword in each sentence, software NVIVO was used. Total score will be tested for
reliability and validity by using SPSS. If the Cronbach’s Alpha shows more than 70%, it
means the measurement is reliable. Moreover, if a keyword has r statistic higher than r
table this means the keyword is valid, and those keywords will be used for measuring
risk disclosure.
Due to the first research objective being to measure the extent of risk disclosure in
Indonesian banking sector and most of the annual reports were issued in Indonesian
language, along with that the translation of keywords from English language into
Indonesian language must be tested by validity before processing. The result of
Indonesian risk keywords are:
Akibat, aktif, ancaman, banyak macam, banyak mendapatkan, barangkali, benar
mengetahui, bencana, bencana alam, beragam, berarti, berbeda, berfluktuasi,
bergantung, berkurang, bermakna, bermasalah, bersemangat, berubah-ubah,
bervariasi, bisa, boleh, boleh jadi, celaka, cenderung, dapat, dapat diduga, daya kerja,
ditengarahi, diversifikasi, fluktuasi, gagal, gangguan, gersang, hilang, hina, keadaan
tidak stabil, kebalikan, kedapatan, kegagalan, kehilangan, kekuatan, kekurangan,
kemajuan, kemunduran, kemungkinan, kemungkinan besar, kemungkinan rugi,
kenaikan, kerugian, kesanggupan, kesempatan, ketidakpastian, ketidaktentuan.

166
The next step is to calculate risk disclosure using the valid keywords by QSR. When the
annual reports were published in dual languages (Indonesian and English) the total
sentences will be divided by two.
Validity
There are 61 risk keywords in English language, nevertheless after translating the
keywords into Indonesian languages the keywords became 150 keywords. It happened
because a keyword has some same meaning (synonyms). After examining by NVIVO
onto 21 annual reports as pre testing, some Indonesian keywords were not found in the
annual reports and the rest keywords are 69.
For making sure the Indonesian keywords are valid, they were tested by validity test.
After testing with validity test, 28 keywords are not valid because r statistic is less than r
table (0.433), and should be excluded. Finally, the 41 risk keywords that are valid for
measuring risk disclosure are: aktif; akibat; ancaman; berbeda; dapat; mampu; tidak
bisa; tidak dapat; boleh; kemungkinan; risiko; kerugian; potensi; berkurang; kekurangan;
kurang; mengurangi; bermasalah; berubah; dampak; fluktuasi; gangguan; menambah;
kenaikan; kesempatan; mendapatkan; keuntungan; mencapai; perolehan; lindung nilai;
masalah; melanggar; mempengaruhi; meningkat; meningkatkan; menurun; turun;
penting; tertinggi; signifikan; tidak stabil. (appendix B).
Reliability
The result indicates Cronchbach’s alpha is 0.79 (> 0.70), that means the keywords have
a high reliability, consistence and can be used more than once or another research
167
whereby the result will produce a consistent data when those keywords are used in other
research.
5.7 Summary
This research tends to positivism because the purpose of theory is to generate
hypotheses. This study employs quantitative methods (econometric models) to find
factors determining risk disclosure and firm value. Moreover, this research analyses the
differences of risk disclosure between listed and unlisted banks, Islamic and non-Islamic
banks. In addition, this study uses secondary data for statistical data analyses to provide
information associated with the determinants on risk disclosure and firm value and value
relevance of risk disclosure.
The relationship between dependent and independent variables are tested with two
models. First model is the association between the delta of risk disclosure and the delta
of firm characteristics, namely: firm size, liquidity, profitability, leverage, and earnings
reinvestment. Second model is the association between the delta of risk disclosure, the
delta of firm characteristics, and the delta of firm value.
This study employs counting sentences which have at least one risk keyword divided by
number of Indonesian sentences in the annual report for quantifying risk disclosure,.
There are 41 Indonesian risk keywords that valid and reliable which can be used for
measuring risk disclosure. In order to measure firm value listed banks, this study
employs Tobin’s Q, while for unlisted banks will be used a new approach namely Black
Scholes Merton model. In 1973, Fischer Black and Myron Scholes found a model to
determine the price of the option (option-pricing). Black-Scholes model is obtained from

168
the integration process of the stock price which is influenced by several factors, including
stock price, strike price, interest rate, time to exercise and volatility. Moreover, the BSM
model is able to estimate value of equity.
The variables which are used in the calculation of firm value of unlisted banks are: a
closing share price (Po) as a proxy for asset value (Ao), the strike price (Pe) as a proxy
of liabilities value (Le), term to maturity (t) is calculated from the maturity of liabilities, risk
free risk (r) is calculated by proxy JIBOR (Jakarta Interbank Offer Rate) and price volatility
stock (σo) as a proxy for asset volatility (σA). For calculating those models, it employs
excel/spreadsheet software. There are three main spread sheets for calculating the
estimated value of equity of unlisted banks, and each spread sheet has many stages.
First, a volatility estimator for calculating the number of equity volatility of listed banks.
Second, a spread sheet of Merton structural model of debt to acquire assets volatility of
listed banks. Finally, Option Black Scholes Pricing models spread sheet for gaining
estimated equity value of unlisted banks.
Because the unlisted banks do not have stock price volatility, the volatility assets values
of listed banks which are calculated by Merton structural model of debt, will be used as
the basis for calculating the estimated volatility of asset of unlisted banks with Black
Scholes option pricing models. In order for these values to be comparable, similar and
reflect the actual comparison, the bank listed and unlisted banks are classified by core
capital based on the BI regulation number 14/26/ PBI/2012.
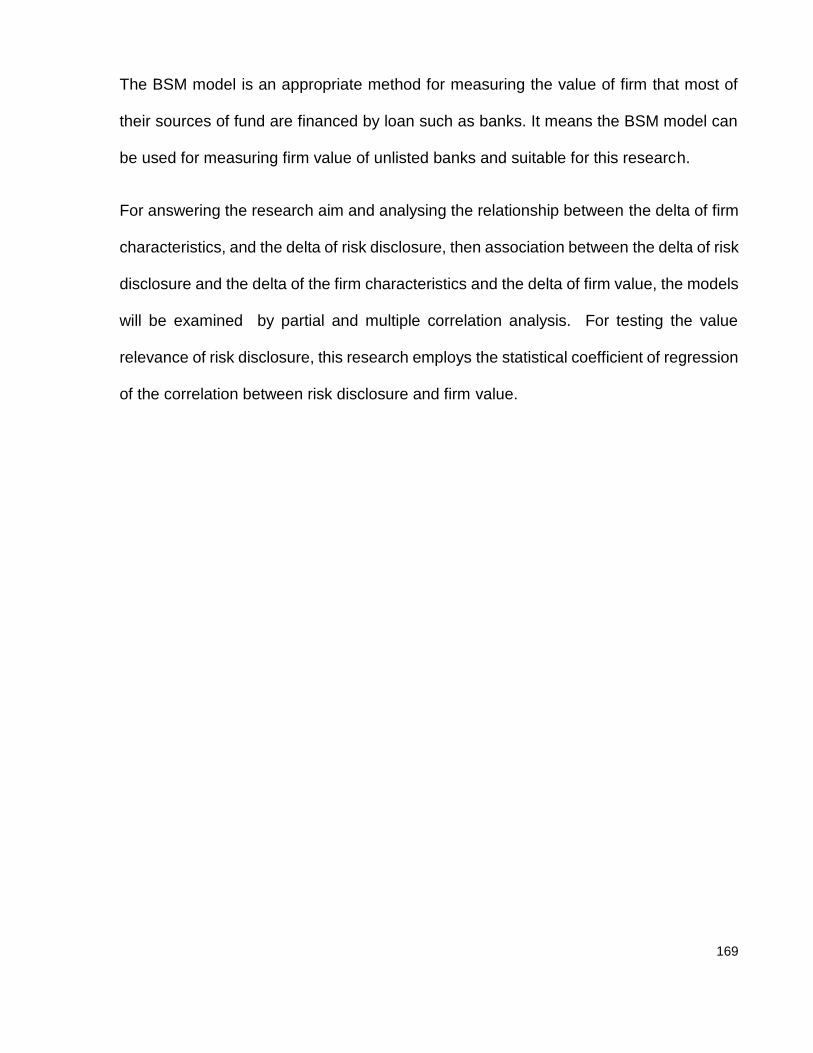
169
The BSM model is an appropriate method for measuring the value of firm that most of
their sources of fund are financed by loan such as banks. It means the BSM model can
be used for measuring firm value of unlisted banks and suitable for this research.
For answering the research aim and analysing the relationship between the delta of firm
characteristics, and the delta of risk disclosure, then association between the delta of risk
disclosure and the delta of the firm characteristics and the delta of firm value, the models
will be examined by partial and multiple correlation analysis. For testing the value
relevance of risk disclosure, this research employs the statistical coefficient of regression
of the correlation between risk disclosure and firm value.

170
CHAPTER 6EMPIRICAL RESULTS AND ANALYSIS
6.1 Introduction
This chapter has eight sub-chapters that explain the empirical results. The first sub-
chapter offers an introduction to explain the main discussion that answers the research
questions. The second sub-chapter describes the research population. The result of the
classic assumption tests is explained in subchapter three. The fourth sub-chapter
provides the result of the first research questions, i.e. how the extent of risk disclosure
can be quantified. The results of the differences between the extent of risk disclosure
between listed and unlisted banks, and between Islamic and non-Islamic banks are
presented in sub-chapter five. The sixth sub-chapter provides data relating to the factors
which affect a bank’s decision to disclose risk. The results in terms of the value relevance
of disclosure by listed and unlisted banks, Islamic and non-Islamic banks are presented
in sub-chapter seven. Finally, this chapter is closed with a conclusion.
6.2 The Research Population
The development of total banks in Indonesia from 2008 to 2012 is demonstrated in table
6.1. It can be seen that the total number of banks in Indonesia tended to decrease slightly,
while the numbers of listed banks and Islamic banks were on the increase. Moreover, the
total number of unlisted banks and non-Islamic banks tended to decrease. This indicates
that the unlisted banks were eager to increase their status into becoming listed banks.
In 1992 the Indonesian government issued Law number 7/1992 that offered an
opportunity for Islamic banks to open, and since 2009 the number of Islamic banks has
been on the increase.

171
Table 6.1 Total banks in Indonesia over the period 2008 to 2012.
2008 2009 2010 2011 2012All banks 124 121 122 120 120Listed banks 28 29 31 31 32Unlisted banks 96 92 91 89 87Islamic banks 5 6 11 11 11Non-Islamic banks 119 115 111 109 109
Sources: www.bi.go.id, www.idx.co.id, The Directory Indonesian Banking. Bank of Indonesia 2009-2013
The main source of this research was banks’ annual reports. In order to obtain the annual
reports, they had to be downloaded through their website or the Indonesia stock
exchange’s website. The impediments to downloading banks’ annual reports were: first,
even though some banks put a link for downloading their annual reports, it could not be
opened. Second, some of the annual report could not be opened because they had a
password and in file exe. Third, annual reports were sometimes made available
separately per each part. Fourth, the PDFs were sometimes blurred and therefore could
not be read.
This study employs a population of banks in Indonesia which released complete annual
reports and financial reports over the period 2008-2012. Accordingly the total population
is 120 banks and therefore the total data should be 600 annual reports (120 banks x 5
years). Nevertheless 187 annual reports were deleted (see appendix E) for various
reasons, which were: five banks were not established before 2010, namely BNI Shariah,
BCA Shariah, Maybank Shariah, Jabar Shariah, Victoria Shariah, while Panin Shariah
was established in 2009; 16 annual reports were blank when they were converted into
text; four annual reports could not be converted; 14 annual reports could not be
downloaded; four texts were damaged; 132 annual reports were not available; six annual

172
report could not be opened because of a password, thereby total data is 413. By deleting
187 annual reports (31.2%) from 600, this might produce a bias which could distort the
information obtained and the results may be not represent the actual situation. However,
although any bias would be difficult to quantify there did not appear, on inspection of the
banks excluded, any reason to believe that they were untypical of the population of banks
more generally.
This study employs delta for each variable in the models, based on the difference
between year t and year t-1. Based on total listed banks there are 32 banks, nevertheless
three of them had changed from unlisted to listed banks since 2010 and one of them was
only established in 2012: finally, the total data (N) was 312, and each sector based on
listing was: 116 listed banks and 196 unlisted banks; while based on Islamic system there
are 27 Islamic banks and 285 non-Islamic banks (see appendix C).
6.3 Classic Assumption Tests
The data of this research is categorised ratio and it employs a large number of data that
can be assumed to have a normal distribution. Therefore, this study used parametric
method. In addition, Gujarati and Porter (2009, p. 100) asserted that the normality
assumption is not crucial as needed for large data. Due to large data (N) being 312 for
total banks and more than 100 for each sector, it means that data are assumed to have
a normal distribution. Meanwhile, since the N of Islamic banks is only 27, it must be tested
by normality test. The result of the normality test for Islamic banks is demonstrated in
appendix F. Based on the table in appendix D, all variables were more than 0.05 and
less than t table, which implies that all variables for Model 1 and Model 2 did not have a
heterocedasticity problem. The data showed higher than 0.1 and VIF was less than 10,

173
meaning those variables did not have a multicollinearity problem. The results showed
that the models are free from autocorrelation problems. Due to the data not having a
problem with normality, heterocesdasticity, multicollinearity, and autocorrelation, the data
can be processed further in order to answer research questions and hypotheses.
Table 6.2 Summary of tolerance and VIF for the correlation with risk disclosure
Variables All banks Listed banks Unlisted banks Islamic banks Non-Islamic banksTolerance VIF Tolerance VIF Tolerance VIF Tolerance VIF Tolerance VIF
Assets 0.961 1.041 0.959 1.043 0.896 1.116 0.883 1.133 0.962 1.039LDR 0.912 1.097 0.952 1.051 0.786 1.272 0.922 1.084 0.887 1.127ROE 0.986 1.015 0.986 1.014 0.897 1.115 0.912 1.097 0.986 1.015Leverage 0.880 1.137 0.978 1.022 0.785 1.273 0.872 1.146 0.863 1.158Earnings Reinv. 0.953 1.050 0.943 1.060 0.880 1.136 NA NA 0.949 1.054
Source: adopted from SPSS
Table 6.3 Summary of tolerance and VIF for the correlation with firm value
Variables All banks Listed banks Unlisted banks Islamic banks Non-Islamic banksTolerance VIF Tolerance VIF Tolerance VIF Tolerance VIF Tolerance VIF
Assets 0.959 1.043 0.952 1.050 0.896 1.116 0.596 1.677 0.959 1.042LDR 0.903 1.107 0.949 1.054 0.784 1.276 0.900 1.111 0.874 1.144ROE 0.985 1.015 0.983 1.017 0.876 1.142 0.880 1.137 0.986 1.015Leverage 0.875 1.142 0.969 1.032 0.755 1.324 0.674 1.484 0.861 1.161EarningsReinv. 0.953 1.050 0.938 1.066 0.879 1.137 NA NA 0.949 1.054
Risk disc. 0.979 1.021 0.971 1.030 0.931 1.074 0.751 1.331 0.973 1.028Source: adopted from SPSS
6.4 The Results Of RQ1: How Can The Extent Of Risk Disclosure In The
Indonesian Banking Sector Be Effectively Quantified?
Table 6.4 and figure 6.1 show the average number of Indonesian risk keyword instances
reported by all banks and the average number of risk disclosure in each bank sector for
every year between 2008 and 2012.It can be seen in figure 6.1 that the average number
of Indonesian risk keywords demonstrated an upward trend for all banks and each bank

174
group. Nevertheless, unlisted banks showed a small decrease in 2009 from 416.47 to
359.52, and then in 2010 the number of risk keywords increased rapidly. The Islamic,
non-Islamic and unlisted banks rose gradually while listed banks climbed sharply, by
almost 360 keywords from 959.77 to 1319.13, particularly in 2011 to 2012. During the
period 2008 to 2012, the number of risk keywords in listed banks was always higher than
other sectors; conversely, Islamic banks mostly had the lowest number. The number of
risk keywords in listed banks was higher than unlisted banks, while non-Islamic banks
were higher than Islamic banks.
Table 6.4 The average number of Indonesian risk keywords in all annual reports
2008 2009 2010 2011 2012 Average(2008-2012)
ALL BANKS 413.81 441.54 532.63 688.97 850.65 617.30
LISTED 573.37 579.32 743.26 959.77 1319.13 849.85
UNLISTED 416.47 359.52 416.04 565.88 661.71 491.49
ISLAMIC 311.50 368.20 375.50 469.00 525.09 432.70
NON-ISLAMIC 421.25 447.45 553.04 714.55 889.16 637.10Source: adopted from SPSS
The lowest and the highest number of risk keywords fluctuated and came from many
variations of bank. The lowest number of risk keywords in 2008 was eight in all banks
and the highest was 2096. The lowest number of total risk keywords recorded was for
the Windu Kencana bank, a listed and non-Islamic bank. The Niaga was the highest
bank, which was a listed and non-Islamic bank.
In 2009, the lowest bank was Fama (72), as unlisted and non-Islamic bank. On the other
side, Niaga bank (1572), as listed and non-Islamic bank remained the highest in terms

175
of risk keywords for two years. Again in 2012, Niaga bank was able to achieve the highest
number of risk keywords, while the smallest number was BPD Sulawesi Tenggara which
only had seven risk keywords in its annual reports.
Table 6.5 The lowest and the highest number of risk keywords
Year Banksector
N =413
risk keywordsSDthe lowest the highest
bank number bank number
2008
All banks 59 WINDU KENCANA 8 NIAGA 2,096 339.24Listed 27 WINDU KENCANA 8 NIAGA 2,096 421.59Unlisted 32 BPD BALI 29 OCBC NISP 613 159.25
Islamic 4 BUKOPIN SYARIAH 137 MANDIRISYARIAH 444 148.33
Non-Islamic 55 WINDU KENCANA 8 NIAGA 2,096 348.65
2009
All banks 67 FAMA 72 NIAGA 1,572 301.30
listed 25 SWADESI/BANK OFINDIA 111 NIAGA 1,572 364.76
Unlisted 42 FAMA 72 BPD.DKI 935 223.13Islamic 5 MEGA SYARIAH 189 MUAMALAT 536 136.70Non-Islamic 62 FAMA 72 NIAGA 1,572 310.68
2010
All banks 87 BANK OF CHINA 77 BII 2,063 380.05Listed 31 CAPITAL 184 BII 2,063 473.94Unlisted 56 BANK OF CHINA 77 BPD.DKI 1,297 253.93Islamic 10 PANIN SYARIAH 101 BRI SYARIAH 717 222.37Non-Islamic 77 BANK OF CHINA 77 BII 2,063 392.32
2011
All banks 96 INA PERDANA 85 BII 2,278 485.40Listed 30 BCA 133 BII 2,278 571.51Unlisted 66 INA PERDANA 85 BPD.DKI 2,246 386.51
Islamic 10 MAYBANK SYARIAH 200 MANDIRISYARIAH 905 226.56
Non-Islamic 86 INA PERDANA 85 BII 2,278 714.55
2012
All banks 104 BPD.SULAWESITNGGR 7 NIAGA 2,627 562.29
Listed 31 SWADESI/BANK OFINDIA 19 NIAGA 2,627 647.84
Unlisted 73 BPD.SULAWESITNGGR 7 BPD.SULAWESI
SLTN 1,995 377.89
Islamic 11 VICTORIA SYARIAH 86 MUAMALAT 1,265 351.22Non-Islamic 93 BPD.SULAWESI
TNGGR 7 NIAGA 2,627 571.31
Source: adopted from QSR6
The bank of China, as an unlisted, non-Islamic bank, had the lowest number of risk
keywords (77) in 2010; meanwhile BII had the highest number of risk keywords (2063).
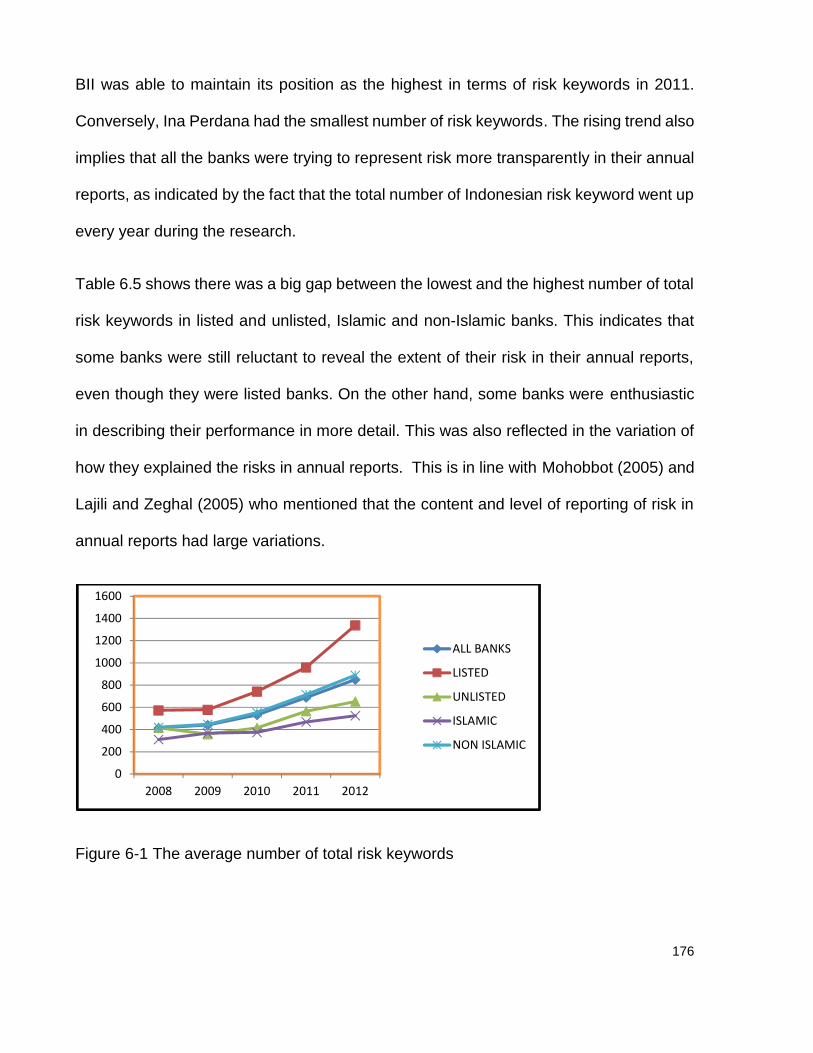
176
BII was able to maintain its position as the highest in terms of risk keywords in 2011.
Conversely, Ina Perdana had the smallest number of risk keywords. The rising trend also
implies that all the banks were trying to represent risk more transparently in their annual
reports, as indicated by the fact that the total number of Indonesian risk keyword went up
every year during the research.
Table 6.5 shows there was a big gap between the lowest and the highest number of total
risk keywords in listed and unlisted, Islamic and non-Islamic banks. This indicates that
some banks were still reluctant to reveal the extent of their risk in their annual reports,
even though they were listed banks. On the other hand, some banks were enthusiastic
in describing their performance in more detail. This was also reflected in the variation of
how they explained the risks in annual reports. This is in line with Mohobbot (2005) and
Lajili and Zeghal (2005) who mentioned that the content and level of reporting of risk in
annual reports had large variations.
Figure 6-1 The average number of total risk keywords
0
200
400
600
800
1000
1200
1400
1600
2008 2009 2010 2011 2012
ALL BANKS
LISTED
UNLISTED
ISLAMIC
NON ISLAMIC

177
The trend in the numbers of Indonesian sentences in the banks’ annual reports between
the years 2008 to 2012 are shown in table 6.6 and figure 6.2. The graph describes that
all sectors had an upward trend, even though in 2009 all sectors declined slightly;
however, after 2010 the total sentences in the annual reports climbed sharply.
The listed banks in the five years always denoted the highest numbers of total sentences
compared with other sectors. The total sentences of the listed banks was bigger than the
unlisted banks, meanwhile the non-Islamic banks’ number of sentences were greater
than the Islamic banks, not only every year but also the average of total sentences from
2008 to 2012. The total sentences of listed banks and non-Islamic banks went up
massively every year after 2010, while unlisted and Islamic banks increased slightly.
This may have been because one of the consequences of being a listed bank is that they
must report their performance more transparently because investors need more detailed
risk information.
Table 6.7 shows that banks had many variations of length in sentences when they
explained their performance in annual reports. In 2008, the least number of sentences
for all banks was BPD Bali (269), as an unlisted and non-Islamic bank, conversely the
largest number was Niaga, as a listed and non-Islamic bank, which had 41,818
sentences. The variation of the number of sentences indicates that some banks reported
their performance in a lot of detail while others were being less transparent. In addition,
Oxelheim (2008) argued that the more information is served by companies, the more
information is received by users, which in turn induces the higher possibility that
stakeholders become confused; therefore there should be an optimal point to decide
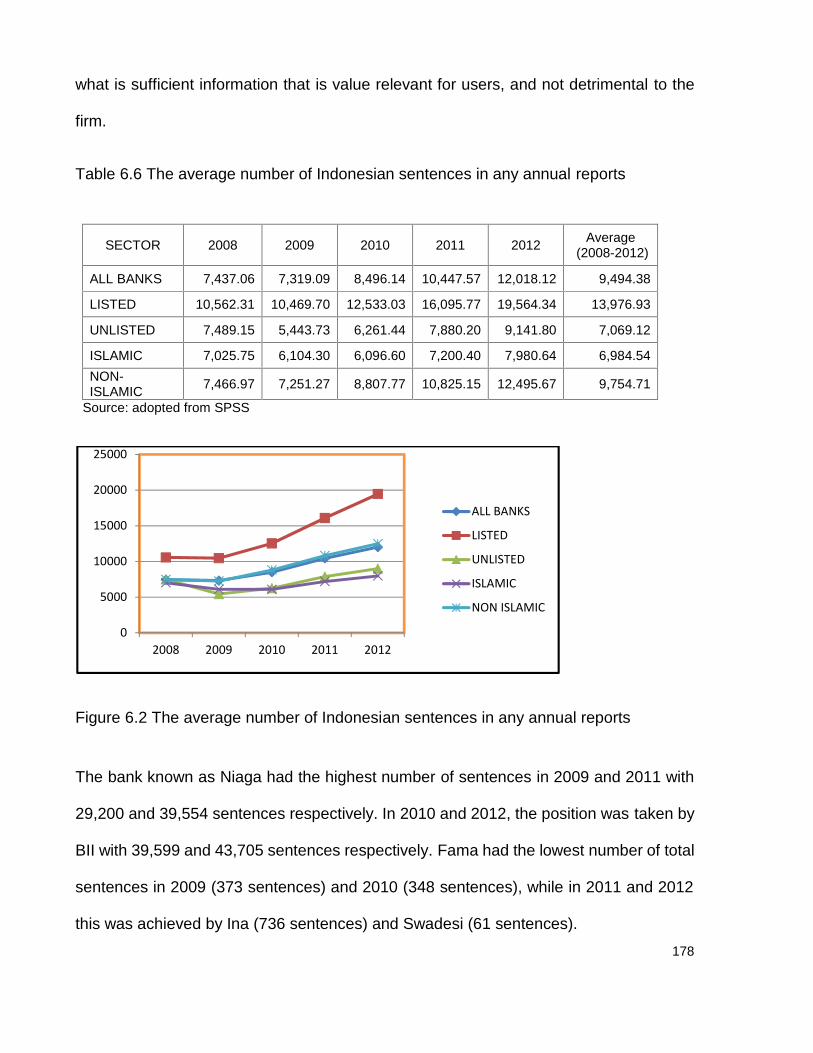
178
what is sufficient information that is value relevant for users, and not detrimental to the
firm.
Table 6.6 The average number of Indonesian sentences in any annual reports
SECTOR 2008 2009 2010 2011 2012 Average(2008-2012)
ALL BANKS 7,437.06 7,319.09 8,496.14 10,447.57 12,018.12 9,494.38
LISTED 10,562.31 10,469.70 12,533.03 16,095.77 19,564.34 13,976.93
UNLISTED 7,489.15 5,443.73 6,261.44 7,880.20 9,141.80 7,069.12
ISLAMIC 7,025.75 6,104.30 6,096.60 7,200.40 7,980.64 6,984.54NON-ISLAMIC 7,466.97 7,251.27 8,807.77 10,825.15 12,495.67 9,754.71
Source: adopted from SPSS
Figure 6.2 The average number of Indonesian sentences in any annual reports
The bank known as Niaga had the highest number of sentences in 2009 and 2011 with
29,200 and 39,554 sentences respectively. In 2010 and 2012, the position was taken by
BII with 39,599 and 43,705 sentences respectively. Fama had the lowest number of total
sentences in 2009 (373 sentences) and 2010 (348 sentences), while in 2011 and 2012
this was achieved by Ina (736 sentences) and Swadesi (61 sentences).
0
5000
10000
15000
20000
25000
2008 2009 2010 2011 2012
ALL BANKS
LISTED
UNLISTED
ISLAMIC
NON ISLAMIC

179
Table 6.7 The lowest and the highest number of Indonesian sentences in all annual
reports
Year Sector N(=413)
Indonesian sentencesSDThe lowest The highest
Bank Number Bank Number
2008
All 59 BPD BALI 269 NIAGA 41,818 6,861.18
Listed 27 HIMPUNANSAUDARA 1,083 NIAGA 41,818 8,171.45
Unlisted 32 BPD BALI 269 BPD SUMATRABRT 12,727 4,048.45
Islamic 4 BUKOPIN SYARIAH 3,970 MUAMALAT 12,222 4,123.95NonIslamic 55 BPD BALI 269 NIAGA 41,818 7,043.06
2009
All 67 FAMA 373 NIAGA 29,200 6,120.19Listed 25 BRI 704 NIAGA 29,200 7,303.52Unlisted 42 FAMA 373 BPD.DKI 15,900 4,406.41Islamic 5 MANDIRI SYARIAH 2,629 MUAMALAT 12,037 3,533.11Non-Islamic 62 FAMA 373 NIAGA 29,200 6,291.08
2010
All 87 FAMA 348 BII 39,599 7,516.77Listed 31 BRI 924 BII 39,599 9,035.66Unlisted 56 FAMA 348 BPD.DKI 22,214 5,435.60Islamic 10 PANIN SYARIAH 719 BNI SYARIAH 10,790 3,687.07Non-Islamic 77 FAMA 348 BII 39,599 7,840.31
2011
All 96 INA 736 NIAGA 39,554 8,721.81Listed 30 BRI 3,814 NIAGA 39,554 10,407.04Unlisted 66 INA 736 BPD.DKI 30,699 6,437.46Islamic 10 PANIN SYARIAH 1,591 BRI SYARIAH 16,518 4,366.98Non-Islamic 86 INA 736 NIAGA 39,554 10,825.12
2012
All 104 SWADESI 61 BII 43,705 9,550.13Listed 31 SWADESI 61 BII 43,705 10,317.25
Unlisted 73 BPD.SULAWESITNGGR 162 BPD.SULAWESI
SLTN 40,952 7,154.82
Islamic 11 VICTORIA SYARIAH 577 MUAMALAT 27,992 8,133.61Non-Islamic 93 SWADESI 61 BII 43,705 9,630.13
Source: adopted from QSR6
The listed banks had the highest number of Indonesian sentences in every year, while
Islamic banks had the lowest (table 6.6). This may have happened because listed banks
were listed on the stock exchange, and therefore had to comply with regulations that
180
obliged them to mandatorily reveal their performance more transparently through
financial statement and annual reports to shareholders. In addition, listed banks
conducted more complicated transactions and administrations related to their listing on
the stock exchange; and had more stakeholders; and were a focus of concern by
regulators, shareholders, analysts and the media. This is in line with Cerf (1961) who
asserted that listed companies are required to release more information than unlisted
firms.
Even though Islamic banks were expected to report more transparently regarding PLS
contracts, they were still weak in explaining their performance in their annual reports.
This was indicated from the number of sentences they used in their annual reports, which
was still lower than the average of all banks (see table 6.6). However, Islamic banks
showed a high volition in describing their performance as exhibited by an upward trend
in their reporting of risk.
The upwards and downwards trends in the number of sentences in annual reports and
the large gap between the banks which had the lowest and the highest number of
sentences indicate that the banks had many variations in describing their risk as
voluntarily disclosure which is what Lajili and Zeghal (2005) and Mohobbot (2005)
mentioned in their research.
In order to compare the average of risk disclosure, it can be seen in table 6.8 and figure
6.3. The average of risk disclosure was counted by the amount of risk keywords divided
by the amount of total sentences in a bank’s annual report. Risk disclosure of all banks

181
and each sector in the five years rose but slightly fluctuated. The trend of risk disclosure
during the period of research went up, particularly among Islamic banks.
Table 6.8 The average of risk disclosure in any annual reports
2008 2009 2010 2011 2012 Average (2008-2012)
ALL BANKS 0.0851 0.0914 0.0901 0.0811 0.0956 0.0889
LISTED 0.0708 0.0813 0.0792 0.0701 0.0865 0.0791
UNLISTED 0.0848 0.0933 0.0962 0.0861 0.0984 0.0942
ISLAMIC 0.0581 0.0759 0.0811 0.0779 0.1130 0.0861
NON-ISLAMIC 0.0870 0.0929 0.0913 0.0815 0.0936 0.0892Source: adopted from SPSS
The average risk disclosure in all banks increased from 2008 to 2009, but then declined
over the following two years, and after that went up in 2012. This also happened in listed
and non-Islamic banks. Meanwhile, risk disclosure of unlisted and Islamic banks climbed
wildly from 2008 to 2010, but dropped in 2011 and continued upward after that. Risk
disclosure of unlisted banks was always higher than listed banks in the period 2008 to
2012. While non-Islamic banks had higher risk disclosure than Islamic banks between
2008 and 2011, in 2012 risk disclosure of Islamic banks dramatically grew by 0.0351 from
0.0779 to 0.1130, which made it higher than non-Islamic banks. Even though listed banks
had the highest total risk keywords and total sentences, (as indicated in tables 6.4 and
6.6), the risk disclosure was still lower than unlisted banks. At the same time, Islamic
banks had lower number of risk keywords, total sentences and risk disclosure compared
to non-Islamic banks.

182
Another feature which stands out in this chart was that in 2011 all the bank sectors that
has previously declined at this point inclined sharply. The final point to note is that all
bank sectors disclosed more risk in their annual reports.
Figure 6.3 The number of risk disclosure in all annual reports in each year
Table 6.9 demonstrates that the gap between the lowest and the highest in terms of risk
disclosure was large; not only among unlisted banks but also listed banks. This also
happened in Islamic banks and non-Islamic banks. The status of being listed on the stock
exchange market or being Islamic banks did not assure that they were willing to explain
their performance voluntarily. It can be seen that Windu Kencana in 2008 and Danamon
in 2009 had the lowest risk disclosure of listed banks with 0.006 and 0.013 respectively.
Meanwhile, BRI Syariah in 2010 and BCA Syariah in 2012 had the lowest risk disclosure
with 0.014 and 0.019 respectively.
0.0000
0.0200
0.0400
0.0600
0.0800
0.1000
0.1200
2008 2009 2010 2011 2012
ALL BANKS
LISTED
UNLISTED
ISLAMIC
NON ISLAMIC

183
BRI, a listed and non-Islamic bank, maintained the highest risk disclosure in the three
years between 2009 and 2011. The highest risk disclosure in 2008 was Jasa Jakarta as
an unlisted and non-Islamic bank, but it 2012 was taken by UOB bank.
On the whole, what stands out was that the trend of total risk keywords increased. The
highest number of total keywords in any annual reports in any year for listed banks was
higher than for unlisted banks; in addition, the fewest number of risk keywords in listed
banks was higher than for unlisted banks. Meanwhile, non-Islamic banks had a higher
number of risk keywords than Islamic banks.
Listed banks had the highest number of risk keywords (table 6.4) and sentences (table
6.6); nevertheless, risk disclosure in listed banks was lower than unlisted banks (table
6.8). However, listed banks have regulations that force them to report their performance
more transparently, due to their listing in ISEM; they have more stakeholders than
unlisted banks and they are more closely monitored by users. It might be the case that
the listed banks tried to explain their performance by writing a large amount of sentences
in their annual reports, but they did not explain their risk in more detail.
Islamic banks still had a lower number of risk disclosure than non-Islamic banks;
however, Islamic banks showed a rising trend, and in 2012 the average number of risk
disclosure increased quite significantly (0.04) from 2011. This have been because the
Islamic bank operations were based on a profit and loss sharing basis thereby they were
trying to show their performance in order to reassure their stakeholders that these banks
were being managed fairly and were obeying Islamic law. Moreover, since 2008 the Bank
of Indonesia issued a regulation (number 21) about sharia banking, whereby Islamic

184
banks were encouraged to promote their existence and to attract stakeholders.
Furthermore, Islamic banks are still in emerging market and are attempting to compete
with non-Islamic bank in attracting investors.
Moreover, banks might not have been explaining their performance in more detail
because they were cautious of the consequences of being transparent. First, by
disclosing the company’s information, it could expose their strategies to their competitors
and even decrease their competitive advantages (Darrough, 1993); Subramanian and
Reddy (2012), such as technology information (production process, marketing
approach), planning and strategy (new target market, product development), and
operational details (sales segments, production costs). Therefore competitors could use
disclosure information to be able to produce similar products or services or counter
products even better, when they read product development plans in the annual report
(Elliott & Jacobson, 1994). In addition,Bhasin (2012) mentioned that even though
disclosure in firm information is able to minimise asymmetrical information, it puts a
company at risk when it exposes its marketing strategies, research and development or
technology.
Second, disclosure leads to increased costs, prices and influences a firm’s profit and
their performance (Elliott & Jacobson, 1994). Based on agency theory, large banks will
report their condition by disclosing more information than smaller banks in order to
minimise asymmetric information between managers and users and also to reduce
agency costs (Watts & Zimmerman, 1983; Inchausti (1977). Furthermore, Hopskins
(1996b) added that a large company will be able to pay financial consultants and analysts
to write the company's report in more detail.

185
Table 6.9 The lowest and the highest number of risk disclosure in each year
Year Sector N=413
Risk disclosureSDThe lowest The highest
Bank Number Bank Number
2008
All banks 59 WINDU KENCANA 0.006 JASA JAKARTA 0.368 0.071
Listed 27 WINDU KENCANA 0.006 HIMPUNANSAUDARA 0.275 0.064
Unlisted 32 MUAMALAT 0.020 JASA JAKARTA 0.368 0.076
Islamic 4 BUKOPINSYARIAH 0.035 MANDIRI
SYARIAH 0.128 0.048
Non-Islamic 55 WINDU KENCANA 0.006 JASA JAKARTA 0.368 0.073
2009
All banks 67 DANAMON 0.013 BRI 0.425 0.074Listed 25 DANAMON 0.013 BRI 0.425 0.081Unlisted 42 FAMA 0.021 WOORI 0.285 0.069
Islamic 5 MEGA SYARIAH 0.041 MANDIRISYARIAH 0.179 0.058
Non-Islamic 62 HANA 0.021 BRI 0.425 0.075
2010
All 87 BRI SYARIAH 0.014 BRI 0.462 0.068Listed 31 BCA 0.031 BRI 0.462 0.079Unlisted 56 BRI SYARIAH 0.014 DIPO 0.304 0.061
Islamic 10 BRI SYARIAH 0.014 VICTORIASYRIAH 0.158 0.043
Non-Islamic 77 BPD.SUMATERA
UTR 0.019 BRI 0.462 0.071
2011
All banks 96 BPD NTB 0.012 BRI 0.353 0.049
Listed 30 EKONOMIRAHARJA 0.027 BRI 0.353 0.057
Unlisted 66 BPD NTB 0.012 BPD.KALIMANTAN SLTN 0.292 0.045
Islamic 10 BRI SYARIAH 0.036 PANIN SYARIAH 0.163 0.038Non-Islamic 86 BPD NTB 0.012 BRI 0.353 0.051
2012
All banks 104 BCA SYARIAH 0.019 UOB 0.464 0.066
Listed 31 HIMPUNANSAUDARA 0.032 BRI 0.384 0.073
Unlisted 73 BCA SYARIAH 0.019 UOB 0.464 0.067
Islamic 11 BCA SYARIAH 0.019 MAYBANKSYARIAH 0.113 0.067
Non-Islamic 93 SINAR HARAPAN
BALI 0.028 UOB 0.464 0.069
Source: adopted from QSR6
In addition, banks disclose quality information in annual reports in order to help investors
read it more easily and interpret it. The increased trend on the total number of risk

186
keyword, number of sentences and risk disclosure in annual report due to being
supported by the number of regulations that issued by the Indonesian Stock Exchange
Market Board and the Bank of Indonesia. Since 1998, the BI has attempted to push
banks to report their performance more transparent by issuing circular letter and law
regulations. Furthermore, unlisted banks had a higher average of risk disclosure than
listed banks, while the average number of risk disclosure of non-Islamic banks was higher
than Islamic banks. All in all, risk disclosure in Indonesian banking sector had an upward
trend. It signifies that the banks were attempting to report their performance more
transparently every year during the research period of 2008 to 2012.
6.5 The Results Of RQ 2: Are There Differences Between The Extent Of Risk
Disclosure Practice Between Listed Banks And Unlisted Banks, And
Between Islamic Banks And Non-Islamic Banks?
This part describes the differences in the extent of risk disclosure between listed and
unlisted banks, and Islamic and non-Islamic banks.
6.5.1 The Differences between Listed and Unlisted Banks
Listing on the stock exchange market is a complex process as well as an expensive one.
The consequences for listed companies are: first, listed companies are obliged to make
periodical reports to regulators while facing high pressure from regulators such as the
Capital Market Supervisory Agency. Second, because they are publicly-traded
companies they have to be transparent in showing their performance; hence their
competitors have easy access to their data and management strategies. Third, listed
companies are required to maintain their relationship with investors by giving progress

187
reports in a timely, accurate and transparent manner. It can therefore be assumed that
listed companies are likely to have more transparent annual reports compared to unlisted
firms. Meanwhile, Brounen et al. (2007) mentioned that unlisted companies had an
absence of transparency.
Table 6.10 shows that the mean of the delta of risk disclosure of listed banks is 0.0045,
while the mean of the delta of risk disclosure of unlisted banks is 0.0067.This result
indicates that the mean of the deltas of risk disclosure of unlisted banks is higher than
listed banks. This is also supported by the data in table 6.8, which shows that unlisted
banks had higher risk disclosure than listed banks in five periods, and that the growth
shows a strong upward trend.
Table 6.10 Listed and Unlisted Banks Group Statistics
VARIABLES SECTOR N Mean Min. Max. SDASSETS Unlisted 196 0.2292 -0.90 6.21 0.54297
Listed 116 1.3751 -2.11 8.73 2.04523LDR Unlisted 196 0.1070 -1.56 3.33 0.49546
Listed 116 0.0010 -0.86 0.86 0.22247ROE Unlisted 196 0.0197 -0.71 0.99 0.14439
Listed 116 0.0294 -3.63 4.55 0.56325LEVERAGE Unlisted 196 0.0567 -0.79 1.06 0.26494
Listed 116 -0.2032 -0.91 0.90 0.39321EARNINGSREINV Unlisted 196 0.0851 -3.92 3.05 0.54528
Listed 116 -0.0148 -2.88 3.29 0.43726RISKDISC Unlisted 196 0.0067 -0.33 0.38 0.06947
Listed 116 0.0045 -0.21 0.22 0.04749FIRMVALUE Unlisted 196 0.3027 -5.69 9.55 1.35563
Listed 116 19.3341 -1,354 4,490 441.28961Sources: adopted form SPSS
Listed banks are constrained by regulation, i.e. the Indonesian Stock Exchange Market
Board Circular letter number SE-02/PM/2002 concerning Guidelines for Preparation of
Financial Statements for Public Company. They are also noticed, monitored and subject
to scrutiny not only by the public but also regulators and the mass media. Moreover,
188
Branco and Rodrigues (2006) added that listed companies are expected to disclose more
in reporting their performance than unlisted banks.
Aljifri et al. (2014) and Wallace et al. (1994) stated that listed companies are more
transparent than unlisted firms, and have a significantly positive relationship with the
extent of disclosure. In addition, listed companies voluntarily disclose more of their
performance in order to attract investors and raise funds, and also try to decrease the
cost of capital and asymmetric information between stakeholders and managers.
However, this research shows that listed banks displayed lower risk transparency than
unlisted banks (table 6.8). This study represents a contradictory result through its finding
that unlisted banks’ annual reports explained risk disclosure to a greater extent than listed
banks. It might be that some companies were reluctant to explain their performance in
more detail because the managers were concerned about the consequences of
disclosure. In addition, the large unlisted banks reported their risk in more detail because
based on agency theory, to minimise asymmetrical information between managers and
users and also to reduce agency costs, large companies report their condition by
disclosing more information than smaller companies (Watts & Zimmerman, 1983;
Inchausti (1997). Furthermore, a large company is more likely to be able to pay financial
consultants and analysts to write the company's report in more detail.
The Levene’s test of the delta of risk disclosure between listed and unlisted is shown in
table 6.11. Levene’s test shows that p value=0.005 < 0.05, which signifies that the
variance of the delta of risk disclosure is heterogeneous. This indicates the variance of
data was similar and the data were scattered far from the mean. Variance represents the
average squared deviations between a group of observations and their respective mean.
189
Nevertheless, p value (2 tailed) of t test is 0.740> 0.05, shows that the delta of risk
disclosure in the listed and unlisted banks was the same. This is possibly because the
regulations of the BI and ISEM pushed banks to report their performance in more detail.
Moreover, other factors could influence the banks to report the risk more transparently
as indicated in Elshandidy et al’s (2008) results. They found that corporate governance
such as board size, proportion of total non-executive directors and independent non-
exclusive directors could influence managers to disclose the risk.
Other data for indicating the differences between listed banks and unlisted banks is as
follows. First, table 6.11 exhibits that the delta of firm size (assets) has a significant
Levene’s test (p value=0) < 0.05. It means that variance in the delta of firm size was
heterogeneous. Moreover, the p value (2 tailed) is 0< 0.05, which signifies that the
differences of delta of assets between listed and unlisted banks was significant.
Furthermore, the mean of the listed banks’ delta of assets is higher than unlisted banks.
This shows that listed banks had higher assets than unlisted banks. Theory suggests that
listed firms find it easier to gather funds from external sources and access banks than
unlisted firms. With their funds they can create more profit and increase their assets.
Moreover, becoming a public company in Indonesia is expensive. The company must
fulfil a range of requirements, such as having net tangible assets of Rp.100,000,000,000
for a main board listing and Rp.5,000,000,000 for the development board. The main
board is for companies operating on a large scale and prospective companies must have
track records. The development board is for prospective companies which have not been
able to be fulfil the requirements of the main board, but they have posted profit

190
(www.idx.co.id). This means that the requirements can be fulfilled by a company that
has a large assets.
Second, the liquidity measured by Loan to Deposit Ratio (LDR) had a Levene’s test (p
value=0.001) < 0.05. This signifies that the variance of the delta of LDR was
heterogeneous. Moreover, p value (2 tailed) is 0.010< 0.05, denotes that the delta of LDR
in the listed and unlisted banks was different.
Heffernan (2005) asserted that a bank is an intermediary institution whose main functions
are to receive money as liabilities from creditors or depositors and from investors as
capital, and further to lend money as assets to debtors or borrowers. Furthermore, it is
common for banks to have a high LDR because they distribute their funds in the form of
loans as one of their main functions and because of the Bank of Indonesia regulations,
which state that in order to make safe lending, banks must distribute their source of funds
into credit with a LDR between 78% - 100%. The cycles of allocation of funds can be
seen in figure 4.3.
The mean of delta LDR in unlisted banks (0.1070) was higher than listed banks (0.001),
as shown in table 6.10. The Levene’s test in table 6.11 also demonstrates that LDR in
listed and unlisted banks was different. This indicates that in the unlisted banks the
proportion of loans distributed from third party funds was higher than in listed banks. The
results demonstrate that unlisted banks tried to distribute a higher percentage of their
third party funds than listed banks. It might be that unlisted banks were attempting to
make higher profits by lending to more risky projects while listed banks were able to
achieve profit from other ways, such as investing their funds in reliably profitable
191
businesses. Moreover, listed companies find it easier to obtain funds from external
sources hence they have less of third source of funds, and distribute it into good
portfolios. Along with that listed banks have a low LDR.
Table 6.11 shows that the variance of the delta of ROE in listed and unlisted banks was
homogeneous. The ROE had p value (2 tailed) t test 0.820, indicating that the delta of
ROE in the listed and unlisted banks was the same. However, based on table 6.10 the
average of delta of ROE in the listed banks was higher than unlisted banks.
This is in line with Capasso et al. (2005) who highlighted that listed companies could
make bigger profits than unlisted firms. It makes sense that listed banks had a higher
profitability ratio than unlisted banks. Listed banks were attempting to achieve high profits
in order to pay dividends to satisfy their shareholders. Therefore, by achieving a high
profit they were able to increase their share price.
The Indonesia Stock Exchange guideline book mentioned that it is easier for listed banks
to get new funding resources from external sources and use the funds for further firm and
market expansion. Capasso et al. (2005) asserted that by selling shares the cost of funds
is cheaper than raising funds from debt, which means the bank’s leverage ratio can be
minimised. Listed companies with low leverage ratio can increase their profit. As shown
in table 6.10, listed banks had a smaller mean leverage ratio than unlisted. This explains
why listed banks were able to achieve higher profit than unlisted ones: because they had
smaller leverage than unlisted banks.
Moreover, the delta of leverage between listed and unlisted banks was different. It is
shown in table 6.11 that p value (0) < 0.05, which indicates that the variance of leverage

192
was heterogeneous, and the p value 2 tailed is 0< 0.05. This shows that the delta of
leverage of listed banks and unlisted banks was different. Even though listed banks still
attempted to attract funds from depositors, listed banks were more focused on collecting
funds from external sources, such as issuing shares on stock markets. On the other hand,
the main sources in unlisted banks are from debts (third party), hence they have higher
leverage. This is in line with Schoubben and Rulle (2004) who claimed that unlisted
companies carry higher debt than listed companies. This corroborates the findings of a
previous researcher, Capasso et al. (2005), who also mentioned that public companies
tend have lower leverage compared to unlisted firms. The listed firms are more
dependent on external sources, hence they have a small leverage ratio compared to
unlisted firms; meanwhile, unlisted companies depend on more internal sources: in doing
so they have a higher leverage.
Furthermore, the variance of delta of earnings reinvestment between listed and unlisted
banks was heterogeneous. This can be explained by data in tables 6.10 and 6.11, which
show that p value 0.017< 0.05, and the p value (2 tailed) is 0.077> 0.05; therefore, the
delta of earnings reinvestment in the listed banks and unlisted banks was the same.
This shows that unlisted banks preferred to reinvest their earnings and tended not to
distribute dividends to their shareholders. This may have been because unlisted banks
needed funds to develop their business. Moreover, table 6.11 shows that the delta of
earnings reinvestment between listed and unlisted banks was the same.
The Clientele Effect states that the group (clientele) of shareholders has different
preferences on dividend policy. The theory maintains that a group of shareholders who
193
need income now prefer a high dividend payout ratio. On the other hand a group of
shareholders who do not need money now prefer to retain the company's net profit for
reinvestment. This result is in accordance with Bodie et al. (2011) who stated that if a
company that prefers to reinvest earnings has an earnings reinvestment policy that
prefers to reinvest earnings, initially investors will receive small earnings, but in the long-
term investors will get greater benefits by receiving high dividends. Conversely,
companies which distribute large dividends initially have low reinvestment opportunities
and in the future dividend growth rates will be low.
Eventually, even though the mean of the delta of firm value of listed banks was higher
than for unlisted banks, as shown in table 6.10, the delta of firm value between listed and
unlisted banks did not show a difference. Moreover, in table 6.11, p value was 0.014<
0.05 (heterogeneous) and p value (2 tailed) was 0.643 > 0.05 which indicates that the
delta of firm value of listed and unlisted banks was the same. There was no difference
between the delta of firm value in listed and unlisted banks during the research period.
This result is supported by Capasso et al. (2005) who demonstrated that listed companies
had higher firm value than unlisted companies. When listed companies enjoy good
financial performance, it has the impact of boosting their stock price, creating a good
image and prestige, and finally it will increase the value of the company. In addition,
when a company has good performance and then reports their information completely,
the users can use the information and thus the information is value relevant for
stakeholders: this will ultimately increase firm value.
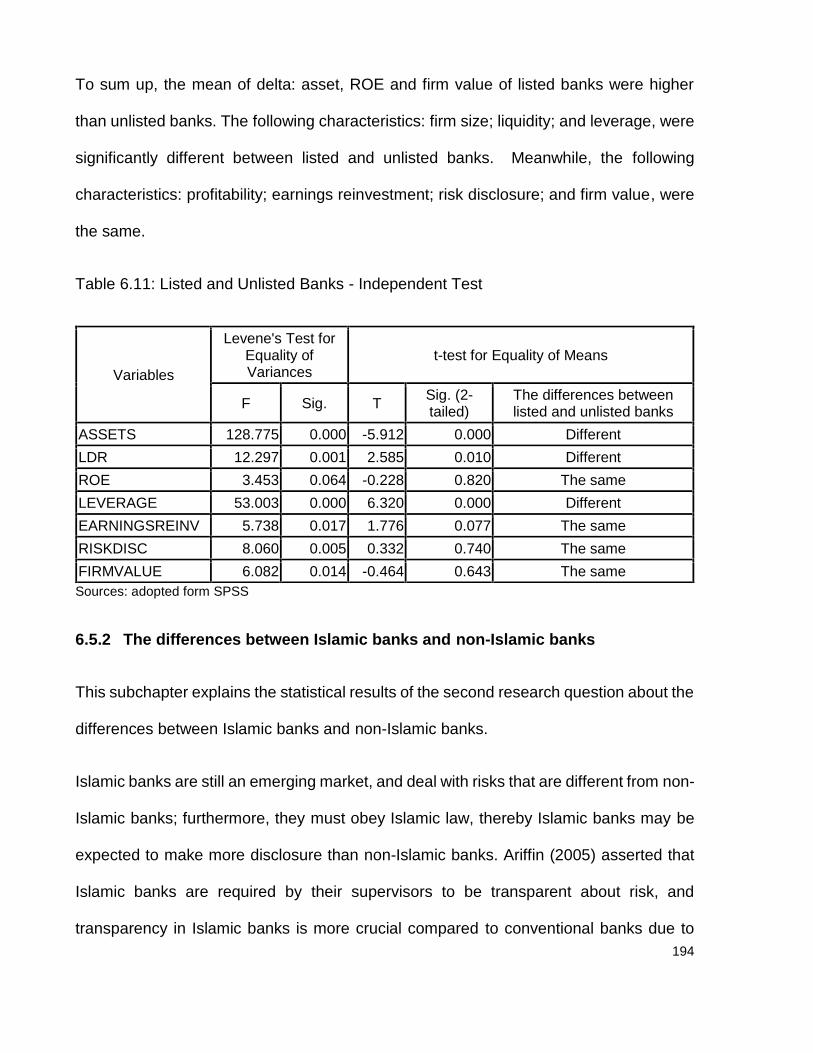
194
To sum up, the mean of delta: asset, ROE and firm value of listed banks were higher
than unlisted banks. The following characteristics: firm size; liquidity; and leverage, were
significantly different between listed and unlisted banks. Meanwhile, the following
characteristics: profitability; earnings reinvestment; risk disclosure; and firm value, were
the same.
Table 6.11: Listed and Unlisted Banks - Independent Test
Sources: adopted form SPSS
6.5.2 The differences between Islamic banks and non-Islamic banks
This subchapter explains the statistical results of the second research question about the
differences between Islamic banks and non-Islamic banks.
Islamic banks are still an emerging market, and deal with risks that are different from non-
Islamic banks; furthermore, they must obey Islamic law, thereby Islamic banks may be
expected to make more disclosure than non-Islamic banks. Ariffin (2005) asserted that
Islamic banks are required by their supervisors to be transparent about risk, and
transparency in Islamic banks is more crucial compared to conventional banks due to
Variables
Levene's Test forEquality ofVariances
t-test for Equality of Means
F Sig. T Sig. (2-tailed)
The differences betweenlisted and unlisted banks
ASSETS 128.775 0.000 -5.912 0.000 DifferentLDR 12.297 0.001 2.585 0.010 DifferentROE 3.453 0.064 -0.228 0.820 The sameLEVERAGE 53.003 0.000 6.320 0.000 DifferentEARNINGSREINV 5.738 0.017 1.776 0.077 The sameRISKDISC 8.060 0.005 0.332 0.740 The sameFIRMVALUE 6.082 0.014 -0.464 0.643 The same

195
Islamic banks employing profit and loss sharing contracts. He also mentioned that Islamic
banks are still lacking in terms of the transparency with which they release risk
information, meaning that shareholders are not properly able to monitor the banks’ risk
profile.
The statistical results of the differences between Islamic banks and non-Islamic banks
are demonstrated in table 6.12 and table 6.13. Table 6.12 shows that the mean of the
delta of risk disclosure in Islamic banks was higher than non-Islamic banks. Moreover, p
value was 0.620 > 0.05, meaning that the data is homogeneous, while p value (2 tailed)
was 0.386> 0.05, meaning that there was no difference in the delta in risk disclosure
between Islamic banks and non-Islamic banks.
This may be accounted for by the fact that since 2008, the Bank of Indonesia has been
trying to develop Islamic banks and to support national development, aiming to improve
overall economic conditions by issuing Republic of Indonesia law number 21/2008 about
sharia banking. Along with that, Islamic banks have tried to disclose their performance in
more detail in their annual reports than non-Islamic banks in order to attract customers
and to gain access to more markets.
Moreover, Ariffin (2005) and Baydoun and Willett (2000) asserted that because Islamic
banks employ profit and loss sharing, it is necessary that they be credible, have an ethical
responsibility and comply with sharia law; hence they report more transparently. In
addition, in order to minimise misperception and mistaken interpretation, stakeholders
should find it easy to understand the banks’ performance, meaning that risk disclosure in
Islamic banks is likely to be more important than in non-Islamic banks.
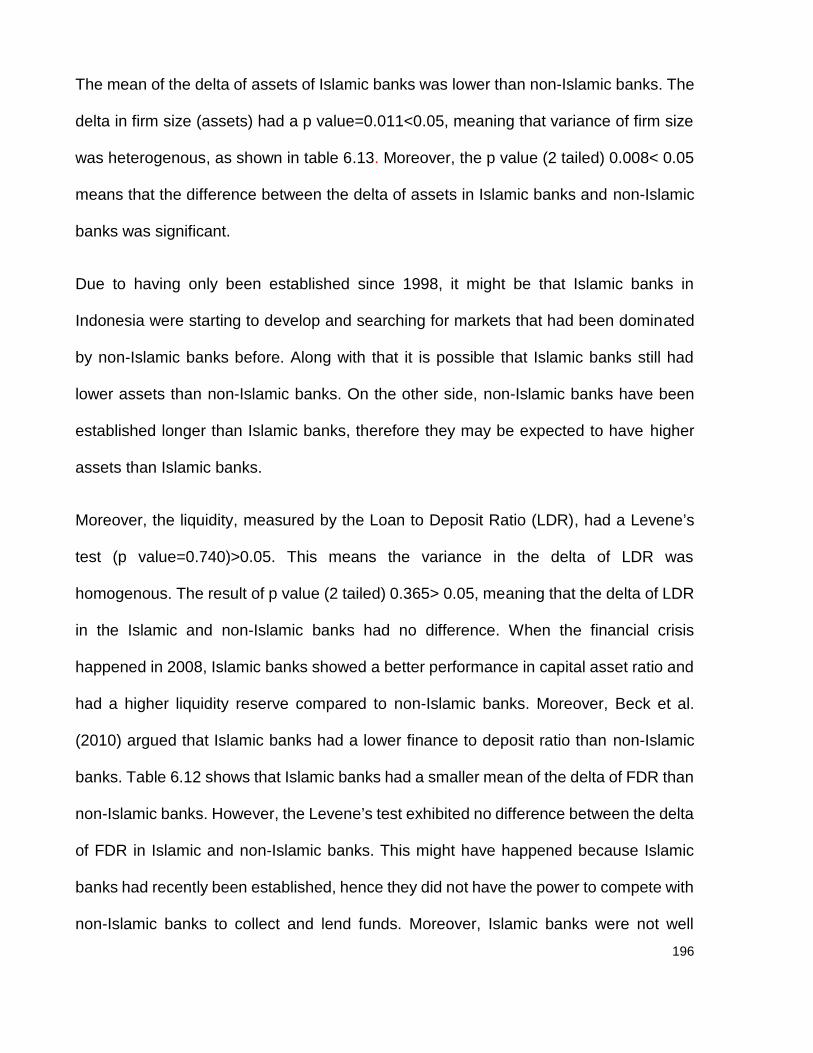
196
The mean of the delta of assets of Islamic banks was lower than non-Islamic banks. The
delta in firm size (assets) had a p value=0.011<0.05, meaning that variance of firm size
was heterogenous, as shown in table 6.13. Moreover, the p value (2 tailed) 0.008< 0.05
means that the difference between the delta of assets in Islamic banks and non-Islamic
banks was significant.
Due to having only been established since 1998, it might be that Islamic banks in
Indonesia were starting to develop and searching for markets that had been dominated
by non-Islamic banks before. Along with that it is possible that Islamic banks still had
lower assets than non-Islamic banks. On the other side, non-Islamic banks have been
established longer than Islamic banks, therefore they may be expected to have higher
assets than Islamic banks.
Moreover, the liquidity, measured by the Loan to Deposit Ratio (LDR), had a Levene’s
test (p value=0.740)>0.05. This means the variance in the delta of LDR was
homogenous. The result of p value (2 tailed) 0.365> 0.05, meaning that the delta of LDR
in the Islamic and non-Islamic banks had no difference. When the financial crisis
happened in 2008, Islamic banks showed a better performance in capital asset ratio and
had a higher liquidity reserve compared to non-Islamic banks. Moreover, Beck et al.
(2010) argued that Islamic banks had a lower finance to deposit ratio than non-Islamic
banks. Table 6.12 shows that Islamic banks had a smaller mean of the delta of FDR than
non-Islamic banks. However, the Levene’s test exhibited no difference between the delta
of FDR in Islamic and non-Islamic banks. This might have happened because Islamic
banks had recently been established, hence they did not have the power to compete with
non-Islamic banks to collect and lend funds. Moreover, Islamic banks were not well
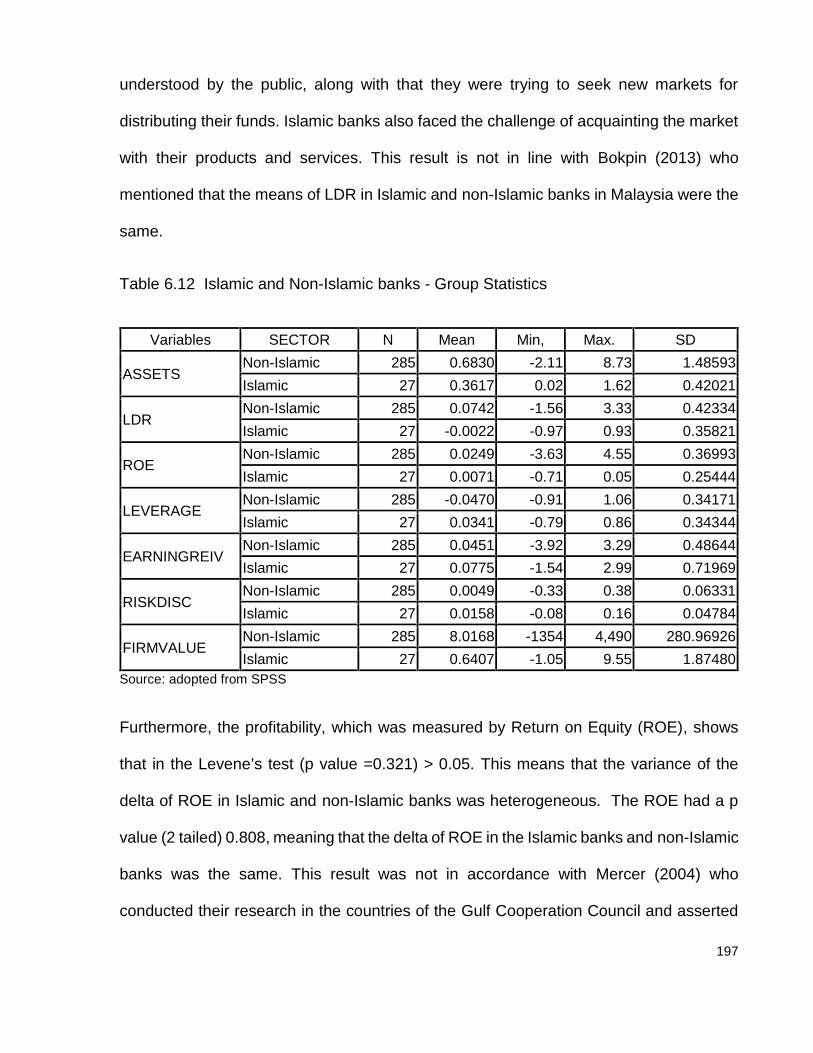
197
understood by the public, along with that they were trying to seek new markets for
distributing their funds. Islamic banks also faced the challenge of acquainting the market
with their products and services. This result is not in line with Bokpin (2013) who
mentioned that the means of LDR in Islamic and non-Islamic banks in Malaysia were the
same.
Table 6.12 Islamic and Non-Islamic banks - Group Statistics
Variables SECTOR N Mean Min, Max. SD
ASSETSNon-Islamic 285 0.6830 -2.11 8.73 1.48593Islamic 27 0.3617 0.02 1.62 0.42021
LDRNon-Islamic 285 0.0742 -1.56 3.33 0.42334Islamic 27 -0.0022 -0.97 0.93 0.35821
ROENon-Islamic 285 0.0249 -3.63 4.55 0.36993Islamic 27 0.0071 -0.71 0.05 0.25444
LEVERAGENon-Islamic 285 -0.0470 -0.91 1.06 0.34171Islamic 27 0.0341 -0.79 0.86 0.34344
EARNINGREIVNon-Islamic 285 0.0451 -3.92 3.29 0.48644Islamic 27 0.0775 -1.54 2.99 0.71969
RISKDISCNon-Islamic 285 0.0049 -0.33 0.38 0.06331Islamic 27 0.0158 -0.08 0.16 0.04784
FIRMVALUENon-Islamic 285 8.0168 -1354 4,490 280.96926Islamic 27 0.6407 -1.05 9.55 1.87480
Source: adopted from SPSS
Furthermore, the profitability, which was measured by Return on Equity (ROE), shows
that in the Levene’s test (p value =0.321) > 0.05. This means that the variance of the
delta of ROE in Islamic and non-Islamic banks was heterogeneous. The ROE had a p
value (2 tailed) 0.808, meaning that the delta of ROE in the Islamic banks and non-Islamic
banks was the same. This result was not in accordance with Mercer (2004) who
conducted their research in the countries of the Gulf Cooperation Council and asserted
198
that in the period before the crisis (2006-2007) and during the crisis (2008-2009), overall
Islamic banks had better performance, particularly in ROA and liquidity.
The relative success of non-Islamic banks in producing higher profit may be due to the
fact that the Islamic banks were still in an emerging market and trying to attract more
customers. Moreover, non-Islamic banks had a longer history, bigger markets and were
more popular. On the other hand, Islamic banks in Indonesia had just been established
a few years previously and were still seeking markets and customers: in this context it
can be understood that Islamic banks made lower profits than non-Islamic banks.
Moreover, is reasonable that Islamic banks had a lower profit than non-Islamic banks,
because Islamic banks had lower assets and FDR and a higher leverage than non-
Islamic banks, as explained before. With their limited assets and a small FDR and a high
leverage, Islamic banks were not able to distribute their funds to as many customers,
hence they had a smaller FDR; therefore, they could not make more profit. In addition,
by having a high leverage ratio, this decreased their profit. In addition, the delta of
leverage between Islamic and non-Islamic banks was the same. Table 6.13 shows that
the p value was 0.675>0.05, meaning that the leverage was heterogeneous, while t test
2 tailed was 0.240> 0.05. This indicates that non-Islamic banks had the same delta of
leverage as Islamic banks.
This result is not in line with Bokpin (2013) who asserted that Islamic banks had a
significant difference in debt to total assets compared with conventional banks, even
though the mean of leverage in Islamic banks was lower than non-Islamic banks. This
may have happened because the Islamic banks’ main sources of funds are from third
parties as liabilities, which were then allocated to investment, sale and purchase

199
transactions, and leasing. Nevertheless, due to Islamic banks having just been
established, they were trying to enter new markets and were thus selling to their potential
source of funds. Along with that, the leverage in Islamic banks was higher than in non-
Islamic banks.
Table 6.13 Islamic and Non-Islamic banks - Independent Test Samples
Source: adopted from SPSS
Furthermore, the variance of the delta in earnings reinvestment between Islamic and non-
Islamic banks was homogeneous. Table 6.13 shows that p value was 0.169>0.05. The
earnings reinvestment had t test (2 tailed) 0.753> 0.05, meaning that the delta of earnings
reinvestment in the Islamic banks and non-Islamic banks was the same.
Roden and Stripling (1997) mentioned that a decision to make dividend payments policy
is important concerning whether cash flow will be paid to investors or will be retained for
reinvestment. A dividend reinvestment plan means that the firms will not pay dividends
but the company will reinvest the funds. The mean of the delta of earnings reinvestment
Variables
Levene's Testfor Equality of
Variancest-test for Equality of Means
F Sig. T Sig. (2-tailed)
The differences betweenIslamic and non-Islamic
banksASSETS 6.583 0.011 2.688 0.008 DifferentLDR 0.111 0.740 0.907 0.365 The sameROE 0.988 0.321 0.243 0.808 The sameLEVERAGE 0.177 0.675 -1.178 0.240 The sameEARNINGSREINV 1.903 0.169 -0.315 0.753 The sameRISKDISC 0.247 0.620 -0.869 0.386 The sameFIRMVALUE 0.322 0.571 0.136 0.892 The same
200
in Islamic banks was higher than in non-Islamic banks (table 6.12). Levene’s test shows
that the delta of earnings reinvestment between Islamic and non-Islamic banks was the
same. This suggests that Islamic banks preferred to reinvest their profit than distribute
dividends to their shareholders. It is possible that Islamic banks preferred to reinvest their
earnings because they were still at a growth level; hence they need more funds to make
them larger and stronger.
The delta of firm value between Islamic banks and non-Islamic banks was the same, as
can be seen in table 6.13; moreover, the p value was 0.571 > 0.05 (homogeneous) and
t test with 2 tailed is 0.892> 0.05. This might have been because a proportion of non-
Islamic banks were listed banks, and due to this their firm value increased due to the
share price increasing on the stock market. Moreover, non-Islamic banks had higher
assets and profit that boosted their firm value.
To sum up, the mean of delta leverage, earnings reinvestment and risk disclosure in
Islamic banks were higher than non-Islamic banks. The mean of delta assets, LDR, ROE
and firm value in non-Islamic banks were higher than Islamic banks. The delta of assets
was significantly different between Islamic and non-Islamic banks.
6.6 The Results of RQ 3: What factors affect a bank’s decision to disclose risk?
In order to answer research question number three, this sub chapter will be divided into
five parts, namely: all banks, listed, unlisted, Islamic and non-Islamic banks. The first
statistical model will be examined for explaining the effect of the delta of firm
characteristics on the delta of risk disclosure and answers the hypotheses.

201
6.6.1 RQ 3.1: The factors affecting banks’ decisions to disclose risk in all banks
Tables 6.14 to 6.24 demonstrate the results of correlation and regression tests between
the delta of firm characteristics and the delta of risk disclosure and the delta of firm value
in all banks. Each hypothesis will be explained as follows:
The association between the delta of risk disclosure and the delta of firm size in
all banks
Table 6.14 shows that the p significance in Pearson correlation between the delta of
assets and the delta of risk disclosure was 0.215> 5% and this indicates that the delta of
assets did not have a relationship with the delta of risk disclosure. The result is also
supported by p value being higher than 0.05 in table 6.15, meaning that the delta of firm
size did not have a positive correlation with the delta of risk disclosure. Therefore, this
study rejects the first hypothesis (H1) and concludes that there is no association between
delta of risk disclosure and delta of firm size in all banks.
Agency theory suggests that large companies with high assets will disclose more in order
to minimise asymmetrical information between managers and users. Furthermore,
signalling theory also asserts that large banks report more transparently in order to send
good signals to users to reassure that with their high assets, larger banks are able to
cover their risks better than small banks. In addition, larger firms will be followed by an
increasing number of stakeholders. Amran, Bin, and Hassan (2009) mentioned that
stakeholders, including public and government, encourage large companies to report
their risks more transparently and explain how they cope with and manage their risks.
202
Moreover, stakeholder theory asserts that bigger companies have more stakeholders
and an obligation under regulations to reveal their performance transparently in order to
fulfil stakeholders’ needs. In addition, Linsley & Shrives (2006) asserted that larger
companies have more complex transactions and undertake more activities. Because of
this the public will pay more attention; in addition the bank will be subject to greater
monitoring by government, regulators, media and the public.
The first hypothesis is that there was a positive association between firm size and risk
disclosure; nevertheless, table 6.14 shows p significant is 0.215> 5% and this indicates
that the delta of assets did not have a relationship with the delta of risk disclosure. The
result is also supported by p value in table 6.15 that is higher than 0.05, meaning that
individually the delta of firm size did not affect the delta of risk disclosure. This indicates
that banks in Indonesia were not transparent in revealing their risks in their annual
reports, based on the delta of assets. Therefore this study rejects the first hypothesis
(H1) and concludes that there is no association between delta of risk disclosure and delta
of firm size. Even though they were large banks, they were still reluctant to explain their
risk transparently. They may have been considering other factors when they reported
their risk in more detail. In this respect, this study is not in line with agency, signalling and
stakeholders theories; however, this result is consistent with Agyei-Mensah (2012); Aljifri
and Hussainey (2007); Mathuva (2012); Rajab and Handley-Schachler (2009); Popova
et al. (2013) who all agreed that firm size has an insignificant association with risk
disclosure.
The association between the delta of risk disclosure and the delta of liquidity in
all banks

203
Table 6.14 shows that the p value of the individual relationship between the delta of risk
disclosure and the delta of LDR was 0.017 and therefore smaller than 0.05. This means
that the association between the delta of risk disclosure and the delta of liquidity was
significantly positive. Nevertheless, the significant relationship of the delta of LDR and
risk disclosure cannot be demonstrated due to p value (0.092) being higher than 0.05, as
shown in table 6.15. Therefore, the second hypothesis (H2) that supposes a positive
association between the delta of risk disclosure and the delta of liquidity is rejected.
Table 6.14 Pearson’s correlation between firm characteristics and risk disclosure and
firm value in all banks
Assets LDR ROE LeverageEarnings
Reinv. Risk Disc.Assets 1LDR 0.056 1
(0.160)ROE -0.007 0.030 1
(0.453) (0.297)Leverage -0.149** 0.260** 0.113* 1
(0.004) (0.000) (0.023)EarningsReinv.
0.071 0.155** 0.057 0.157** 1(0.106) (0.003) (0.157) (0.003)
Risk Disc. 0.045 0.120* -0.009 0.088 0.020 1(0.215) (0.017) (0.440) (0.061) (0.361)
P-values are given in parentheses. The number of observations is 312. ** Correlation is significant at the0.01 level (1- tailed). * Correlation is significant at 0.05 level (1-tailed)
Liquidity demonstrates a bank’s ability to repay short term debts or ability to provide
money when depositors seek to withdraw their deposits. In addition, liquidity is one of the
ratios that can be used for predicting bankruptcy. For banks with a high LDR, larger than
the ratio standard, this implies that such banks face high risk because as debtors they
might not be able to repay their debts.
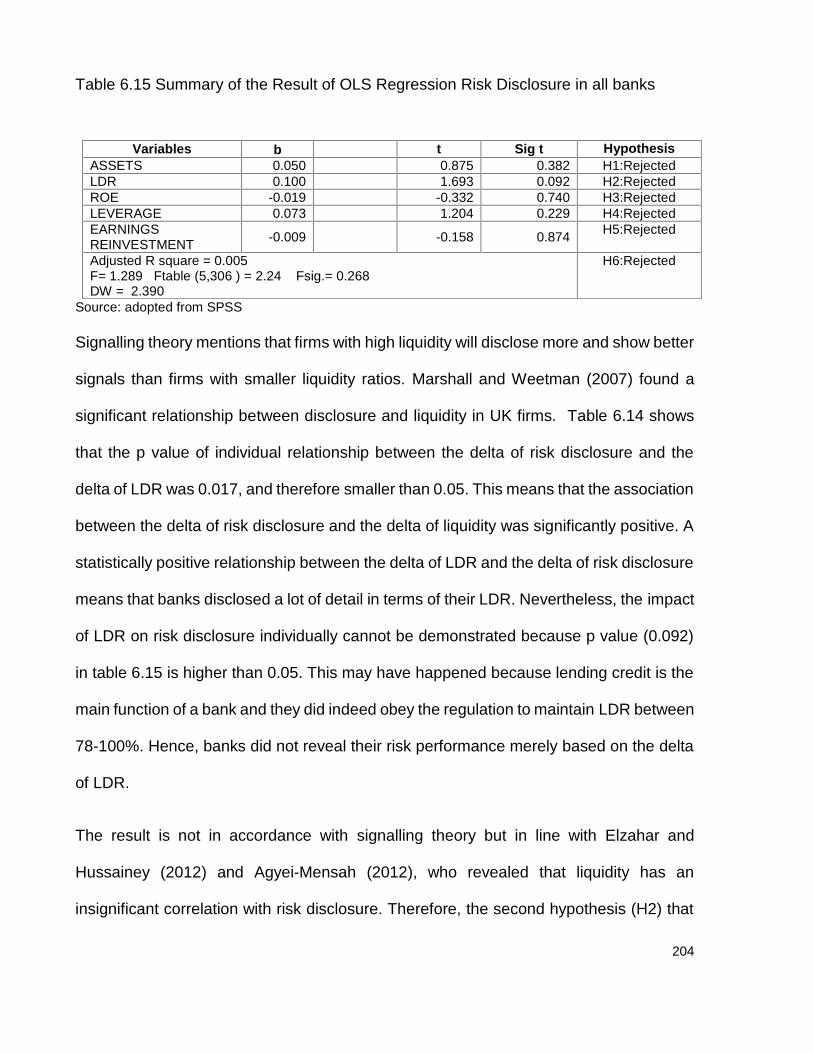
204
Table 6.15 Summary of the Result of OLS Regression Risk Disclosure in all banks
Source: adopted from SPSS
Signalling theory mentions that firms with high liquidity will disclose more and show better
signals than firms with smaller liquidity ratios. Marshall and Weetman (2007) found a
significant relationship between disclosure and liquidity in UK firms. Table 6.14 shows
that the p value of individual relationship between the delta of risk disclosure and the
delta of LDR was 0.017, and therefore smaller than 0.05. This means that the association
between the delta of risk disclosure and the delta of liquidity was significantly positive. A
statistically positive relationship between the delta of LDR and the delta of risk disclosure
means that banks disclosed a lot of detail in terms of their LDR. Nevertheless, the impact
of LDR on risk disclosure individually cannot be demonstrated because p value (0.092)
in table 6.15 is higher than 0.05. This may have happened because lending credit is the
main function of a bank and they did indeed obey the regulation to maintain LDR between
78-100%. Hence, banks did not reveal their risk performance merely based on the delta
of LDR.
The result is not in accordance with signalling theory but in line with Elzahar and
Hussainey (2012) and Agyei-Mensah (2012), who revealed that liquidity has an
insignificant correlation with risk disclosure. Therefore, the second hypothesis (H2) that
Variables t Sig t HypothesisASSETS 0.050 0.875 0.382 H1:RejectedLDR 0.100 1.693 0.092 H2:RejectedROE -0.019 -0.332 0.740 H3:RejectedLEVERAGE 0.073 1.204 0.229 H4:RejectedEARNINGSREINVESTMENT -0.009 -0.158 0.874 H5:Rejected
Adjusted R square = 0.005F= 1.289 Ftable (5,306 ) = 2.24 Fsig.= 0.268DW = 2.390
H6:Rejected

205
supposes a positive association between the delta of risk disclosure and the delta of
liquidity is rejected.
The association between the delta of risk disclosure and the delta of profitability
in all banks
The relationship between the delta of risk disclosure and the delta of profitability can be
seen in table 6.14. The p value was 0.440 which means there was no relationship
between the delta of risk disclosure and the delta of profitability. The relationship of delta
of ROE and the delta of risk disclosure also could not be proven because p value was
more than 0.05, as shown in table 6.15. As a result, the third hypothesis (H3) that
supposes a positive association between the delta of risk disclosure and the delta of
profitability is rejected.
The association between the delta of risk disclosure and the delta of leverage in
all banks
The result of the relationship between the delta of risk disclosure and the delta of leverage
had a p value 0.061, higher than 5% which shows the association between the delta of
risk disclosure and the delta of leverage is insignificant. This study also could not prove
that the delta of leverage has a relationship with the delta of risk disclosure, as signified
in table 6.15 which shows that p value was 0.229, which is higher than 0.05. Therefore,
the fourth hypothesis (H4) that supposes a positive association between the delta of risk
disclosure and the delta of leverage is rejected. A bank is a financial institution with a
high level of debt and a high level of leverage because the main sources of bank funds
are from depositors and creditors. Because of this, it is normal for banks to have high

206
leverage. Ramadan (2012) mentioned that debts could benefit a company in terms of
earning profit and creating opportunities for investments; on the other hand it is harmful
and risky for the firm when it is not able to pay debts back plus the interest. The lenders
can claim bankruptcy if the bank is not able to repay the debts. Doubt over a bank’s ability
to meet its debt obligations will lead investors to have a negative image, and as the
consequence decreases firm share price in listed companies.
Firms with high debt equity may have more incentive to disclose financial information to
suit the needs of their creditors. Therefore, banks are expected to be more closely
monitored by financial supervisors, which drives them to disclose their risk performance.
Furthermore, according to Fama and Miller (1972), for companies with high leverage,
such firms will try to describe their condition in more detail to creditors in order to reassure
that they are able to repay their debts.
The result of the relationship between the delta of risk disclosure and the delta of leverage
has p value of 0.061, which is higher than 5% and indicates that the association between
the delta of risk disclosure and the delta of leverage is insignificant. This study was also
not able to prove that the delta of leverage influences the delta of risk disclosure, as
signified in table 6.15 that p value is 0.229, which is higher than 0.05. By contrast, agency
theory suggests that firms with high leverage will voluntarily report in more detail in order
to satisfy creditors.
This result indicates that banks were reluctant to reveal their risk performance in more
detail based on the delta of leverage. This result is in accordance with previous
researchers, namely Elzahar and Hussainey (2012); Linsley and Shrives (2006); Rajab

207
and Handley-Schachler (2009) who concluded that there was an insignificant relationship
between disclosure and leverage. Therefore, the fourth hypothesis (H4) that supposes a
positive association between the delta of risk disclosure and the delta of leverage is
rejected.
The association between the delta of risk disclosure and the delta of earnings
reinvestment in all banks
Table 6.14 describes the result of the association between the delta of risk disclosure
and delta of earnings reinvestment individually, which shows that p value was 0.361>
0.05. This reflects that the delta of risk disclosure had an insignificant relationship with
the delta of earnings reinvestment. This research did not find any association between
the delta of earnings reinvestment and the delta of risk disclosure because p value was
more than 5%, as represented in table 6.15. Therefore, the fifth hypothesis (H5) that
supposes a positive association between the delta of risk disclosure and the delta of
earnings reinvestment is rejected.
A dividend reinvestment plan means that firms do not pay dividends but the company
reinvests its funds to increase its capital or to expand its business. Firms are able to
reinvest their earnings into simple and low risk investments, for example: buying
equipment, maintaining existing machinery, expanding their company or business, or
paying their debts. In addition, Roden and Stripling (1997) mentioned that a decision over
dividend payments policy is an important issue concerning whether cash flow will be paid
to investors or will be retained for reinvestment.

208
Discussing dividends and earnings reinvestments is still debated difficult decision for
companies, who perceive giving high dividends (low earnings reinvestments) to be good
for shareholders and the company; on the other hand, paying small dividends (high
earnings reinvestments) is also a good decision, as explained by The Clientele Effect
and Bodie et al. (2011).
Table 6.14 describes the result of the association between the delta of risk disclosure
and delta of earnings reinvestment individually, in which the p value is 0.361> 0.05. This
reflects that risk disclosure has an insignificant relationship with earnings reinvestment.
This research also could not find the impact of earnings reinvestment on risk disclosure
because p value was more than 5%, as represented in table 6.15. This result signifies
that the change of earnings reinvestment did not support banks to report risk more
transparently to their investors. Therefore, the fifth hypothesis (H5) that supposes a
positive association between the delta of risk disclosure and the delta of earnings
reinvestment is rejected.
There is an association between delta of firm characteristics and the delta of risk
disclosure in all banks
Table 6.15 shows that F (1.289) < F table and meaning that the delta of firm
characteristics, aggregated with the delta of firm size, liquidity, profitability, leverage, and
earnings reinvestment, did not have a significant relationship with the delta of risk
disclosure. Moreover, adjusted R square for model 1 was only 0.005. This means the
delta of firm size (assets), liquidity (LDR), profitability (ROE), leverage, and earnings
209
reinvestment (b) cannot explain the delta of risk disclosure. Therefore, the sixth
hypothesis (H6) is rejected.
Banks disclose risk more fully because they want to explain how they have managed
their risks well and their willingness to send good signals to stakeholders regarding how
stable the bank is, their capability to reserve funds for covering short term and long term
liabilities, how the funds have been invested and how this provides high dividends to
investors.
Table 6.15 shows that F (1.289) < F table and p value is 0.268, meaning that the
aggregate delta of firm characteristics did not have an association with the delta of risk
disclosure. Moreover, adjusted R square for model 1 was only 0.005. This means the
delta of bank size (assets), liquidity (LDR), profitability (ROE), leverage, and earnings
reinvestment (b) were not able to explain the delta of risk disclosure. In other words,
model 1 was not fit for explaining the relationship between the delta of firm characteristics
and the delta of risk disclosure. As a result, the sixth hypothesis (H6) is rejected.
This result indicates that in reporting their risks in annual reports, banks were affected by
other variables that were not tested in this research. Banks might have many
considerations for making their performance more transparent, since disclosure of their
performance has some consequences. By reporting more transparently, competitors are
not only able to read a bank’s strategies, but also imitate its products. Moreover, Elliott
and Jacobson (1994) argued that when companies make their report more detailed, the
costs of reporting increases, and this influences product price, meaning that profit
decreases.

210
To sum up, this study was not able to show the relationship between the delta of firm
characteristics and the delta of risk disclosure supposed in Model 1. In addition, the
relationship between the delta of risk disclosure and the delta of firm characteristics only
had R square 0.005 and F (1.289) insignificant. This means neither the delta of size,
liquidity, profitability, leverage, nor earnings reinvestment explained and influenced the
delta of risk disclosure. Therefore, Model 1 in this study was not fit for explaining the
factor which affected risk disclosure. For those reasons, the sixth hypothesis was
rejected.1
6.6.2 RQ 3.2: The factors affecting banks’ decisions to disclose risks in listed
banks
This subchapter explains that factors affecting a bank’s decision to disclose risks and
factors affecting a firm value in listed banks, consisting of two models. The statistical
correlation and regression results for the listed banks are summarised in tables 6.16 and
6.17. Each hypothesis will be explained as follows:
The association between the delta of risk disclosure and the delta of firm size in
listed banks
The Pearson’s correlation shows an insignificant association between the delta of risk
disclosure and the delta of assets in listed banks, as shown in table 6.16. The multiple
1 I also tested the association between the delta of risk disclosure and the delta of firm characteristics by employing lagged (first:the increased of the delta of firm characteristics previous year and the delta of risk disclosure in the following year. Second: thedelta of firm characteristics previous year and risk disclosure in the following year). The results showed that there is aninsignificant association between those variables.

211
regression result also did not show an association between the delta of firm size and the
delta of risk disclosure. Therefore, this study rejects the first hypothesis (H1) and
concludes that there is an insignificant association between the delta of risk disclosure
and the delta of firm size in listed banks.
Agency theory asserts that large companies that have high assets will disclose more in
order to minimise asymmetrical information between managers and users, but in this
study the results were contrary.
The multiple regression result was not able to prove the influence of size on risk
disclosure. This means that the delta of the assets of listed banks did not support banks
in reporting their risk in more detail. The result contradicts agency theory; however, it is
in accordance with Popova et al. (2013); Agyei-Mensah (2012); Mathuva (2012) and
Rajab and Handley-Schachler (2009) who all found that firm size did not have any
association with disclosure.
Therefore, this study rejects the first hypothesis (H1) and concludes that there is an
insignificant association between the delta of risk disclosure and the delta of firm size in
listed banks
The association between the delta of risk disclosure and the delta of liquidity in
listed banks
Table 6.16 shows that the p value was 0.382 and higher than alpha 0.05, meaning that
the association between the delta of risk disclosure and the delta of liquidity was
insignificant. In addition, based on table 6.17, LDR did not have a positive correlation
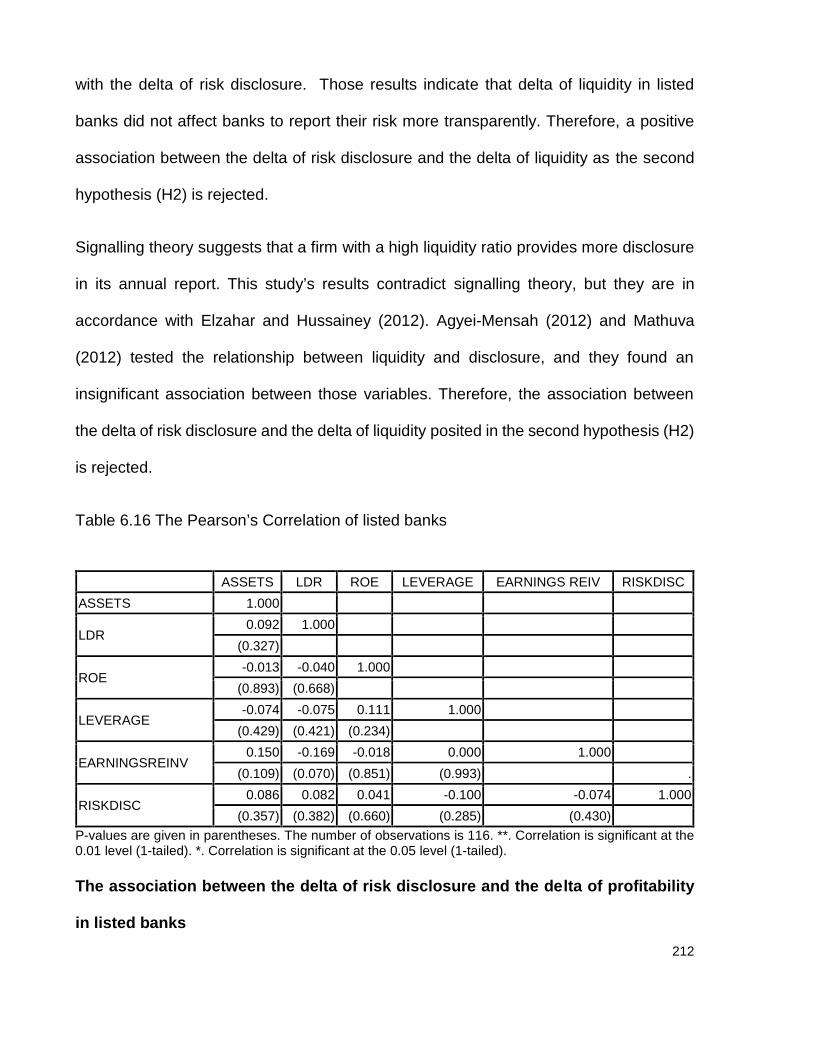
212
with the delta of risk disclosure. Those results indicate that delta of liquidity in listed
banks did not affect banks to report their risk more transparently. Therefore, a positive
association between the delta of risk disclosure and the delta of liquidity as the second
hypothesis (H2) is rejected.
Signalling theory suggests that a firm with a high liquidity ratio provides more disclosure
in its annual report. This study’s results contradict signalling theory, but they are in
accordance with Elzahar and Hussainey (2012). Agyei-Mensah (2012) and Mathuva
(2012) tested the relationship between liquidity and disclosure, and they found an
insignificant association between those variables. Therefore, the association between
the delta of risk disclosure and the delta of liquidity posited in the second hypothesis (H2)
is rejected.
Table 6.16 The Pearson’s Correlation of listed banks
ASSETS LDR ROE LEVERAGE EARNINGS REIV RISKDISCASSETS 1.000
LDR0.092 1.000
(0.327)
ROE-0.013 -0.040 1.000
(0.893) (0.668)
LEVERAGE-0.074 -0.075 0.111 1.000
(0.429) (0.421) (0.234)
EARNINGSREINV0.150 -0.169 -0.018 0.000 1.000
(0.109) (0.070) (0.851) (0.993) .
RISKDISC0.086 0.082 0.041 -0.100 -0.074 1.000
(0.357) (0.382) (0.660) (0.285) (0.430)P-values are given in parentheses. The number of observations is 116. **. Correlation is significant at the0.01 level (1-tailed). *. Correlation is significant at the 0.05 level (1-tailed).
The association between the delta of risk disclosure and the delta of profitability
in listed banks
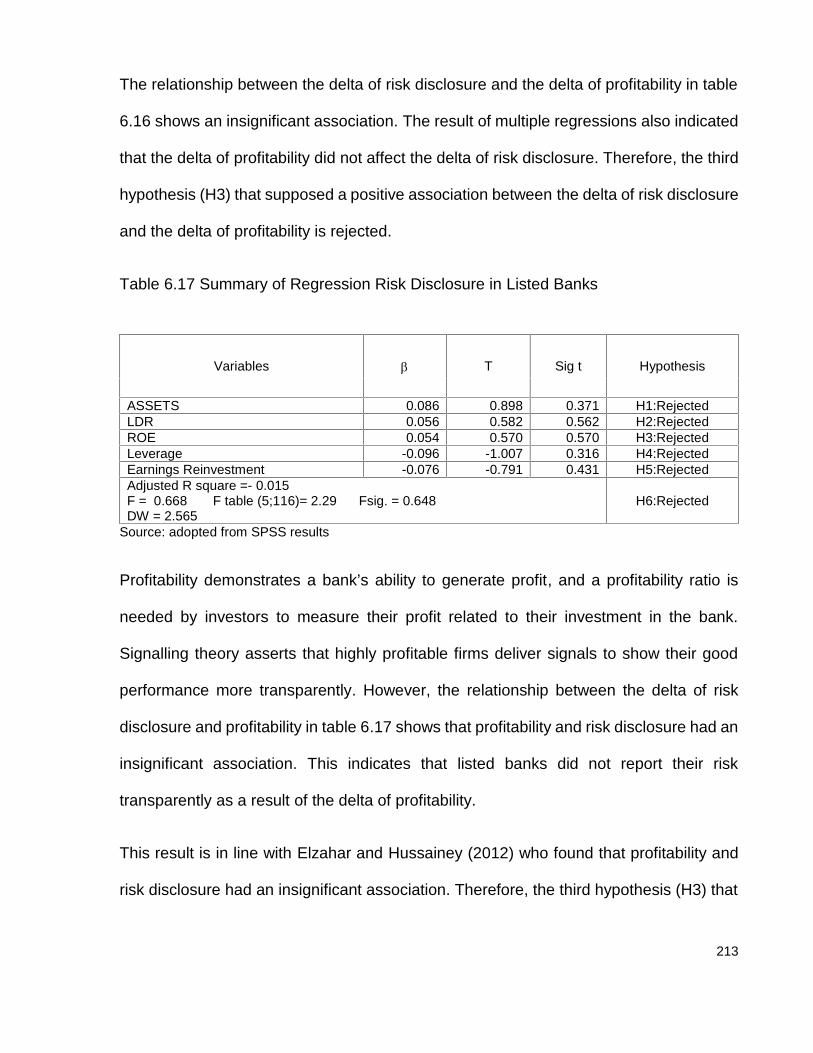
213
The relationship between the delta of risk disclosure and the delta of profitability in table
6.16 shows an insignificant association. The result of multiple regressions also indicated
that the delta of profitability did not affect the delta of risk disclosure. Therefore, the third
hypothesis (H3) that supposed a positive association between the delta of risk disclosure
and the delta of profitability is rejected.
Table 6.17 Summary of Regression Risk Disclosure in Listed Banks
Variables T Sig t Hypothesis
ASSETS 0.086 0.898 0.371 H1:RejectedLDR 0.056 0.582 0.562 H2:RejectedROE 0.054 0.570 0.570 H3:RejectedLeverage -0.096 -1.007 0.316 H4:RejectedEarnings Reinvestment -0.076 -0.791 0.431 H5:RejectedAdjusted R square =- 0.015F = 0.668 F table (5;116)= 2.29 Fsig. = 0.648DW = 2.565
H6:Rejected
Source: adopted from SPSS results
Profitability demonstrates a bank’s ability to generate profit, and a profitability ratio is
needed by investors to measure their profit related to their investment in the bank.
Signalling theory asserts that highly profitable firms deliver signals to show their good
performance more transparently. However, the relationship between the delta of risk
disclosure and profitability in table 6.17 shows that profitability and risk disclosure had an
insignificant association. This indicates that listed banks did not report their risk
transparently as a result of the delta of profitability.
This result is in line with Elzahar and Hussainey (2012) who found that profitability and
risk disclosure had an insignificant association. Therefore, the third hypothesis (H3) that

214
supposed a positive association between the delta of risk disclosure and the delta of
profitability is rejected.
The association between the delta of risk disclosure and the delta of leverage in
the listed banks
The result of the relationship between the delta of risk disclosure and the delta of leverage
is shown in table 6.16. The p significance was 0.316 (table 6.17), which is higher than
the level of confidence (0.05). This means that the association between the delta of risk
disclosure and the delta of leverage in listed banks was insignificant. The result of
regression also indicated that the delta of leverage had an insignificant association with
the delta of risk disclosure. Therefore, the fourth hypothesis (H4) that supposes a positive
association between the delta of risk disclosure and the delta of leverage is rejected.
This result does not fit with agency theory, which suggests that a company with high
leverage will tend to provide firm information in more detail. Firms explain their
performance in more detail in order to minimise asymmetrical information between
managers and depositors with regard to how well they manage their money and cover
risks in order to reassure that they can be relied upon to manage funds. Nevertheless,
in this study listed banks did not reveal their risk performance in more detail to explain
the delta of leverage. This may have been because banks were unwilling to explain
leverage in more detail, because leverage could send a negative image for stakeholders
related to bankruptcy.
The result is in accordance with Andres, Azrofa, and Lopez (2005); Oliveira, Rodrigue,
Craig (2006); Rajab and Schachler (2009) who attested that risk disclosure and leverage

215
did not have an association. Therefore, the fourth hypothesis (H4) that supposes a
positive association between the delta of risk disclosure and the delta of leverage is
rejected.
The association between the delta of risk disclosure and the delta of earnings
reinvestment in listed banks
Table 6.16 shows the result of the association between the delta of risk disclosure and
the delta of earnings reinvestment. The p significance is 0.431, which is higher than 0.05.
This result shows that the delta of risk disclosure in listed banks did not have a
relationship with the delta of earnings reinvestment. This result is supported by the
regression correlation result in table 6.17, which indicates that the delta of earnings
reinvestment had an insignificant influence on the delta of risk disclosure. Therefore, the
fifth hypothesis (H5) that supposes an association between the delta of risk disclosure
and the delta of earnings reinvestment is rejected.
This result reflects that the delta of risk disclosure in listed banks did not have a
relationship with the delta of earnings reinvestment. This means banks did not report
earnings reinvestment in more detail in order to attract the investors. It might have been
because the investors preferred to consider dividends more than earnings reinvestment;
hence, the listed banks did not transparently explain earnings reinvestment. Moreover,
as the dividend theory is still in debate, so that on one side companies perceive that
giving high dividends is good for shareholders and the company, on the other side they
perceive that paying low dividends in good as well. The dividends irrelevance theory
(MM, 1961) suggests that whether the investors get higher or lower dividends from the

216
normal rate gives a signal that the company might have to deal with a default in the future.
Meanwhile the Clientele Effect asserts that one group of investors prefers to receive
dividends now, the other group prefers not to. This indicates that investors have different
points of view that induce banks not to explain risks related to the earnings reinvestment
plan in more detail. Therefore, hypothesis five (H5) that supposes a positive association
between the delta of risk disclosure and the delta of earnings reinvestment is rejected.
The association between the delta of risk disclosure and the delta of firm
characteristics in listed banks
Table 6.17 shows that the adjusted R square was very small (-0.015), which means the
delta of firm size, liquidity, profitability, leverage and earnings reinvestment did not
explain the delta of risk disclosure in listed banks, and that therefore Model 1 in this study
was not fit for explaining the factors influenced listed banks in reporting their risk in more
detail in the annual report. The F in table 6.17 also shows insignificant correlation
between the delta of firm characteristics and the delta of risk disclosure. Along with that,
the sixth hypothesis (H6) that supposes there is an association between the delta of risk
disclosure and the delta of firm characteristics is rejected.
Table 6.17 shows that the F is very small and insignificant, it means that the delta of risk
disclosure in listed banks was not affected by firm characteristics, namely bank size,
liquidity, profitability, leverage, and earnings reinvestment. The adjusted R square of this
model was -0.015, which means the delta of firm size, liquidity, profitability, leverage and
earnings reinvestment could not explain the delta of risk disclosure in listed banks. The
F of this model also showed that in reporting their risks, listed banks were not influenced
217
by firm characteristics. The results show that model 1 of this study was not fit for
predicting the association between firm characteristic and risk disclosure in listed banks.
Therefore, the sixth hypothesis (H6) that supposes there is an association between the
delta of risk disclosure and the delta of firm characteristics is rejected.
6.6.3 RQ 3.3: The factors affecting banks’ decisions to disclose risks - unlisted
banks
This section explains the result of Model 1 and answers the third research question for
unlisted banks. The correlation and regression result for unlisted banks are summarised
in tables 6.18 and 6.19.
The association between the delta of risk disclosure and the delta of firm size in
unlisted banks
The association between the delta of risk disclosure and the delta of assets of unlisted
banks is shown in table 6.18, with p significance of 0.193. This means that the delta of
assets had an insignificant relationship with the delta of risk disclosure. The regression
in table 6.19 shows that the delta of assets did not affect the delta of risk disclosure.
Therefore, this study rejects the first hypothesis (H1) and concludes that the delta of risk
disclosure and the delta of firm size in unlisted banks did not have a positive significant
association.
The association between the delta of risk disclosure and the delta of assets is shown in
tables 6.18 and 6.19. The result shows that the delta of assets had an insignificant
relationship with the delta of risk disclosure. This condition signifies that unlisted banks

218
reporting their risks did not consider merely the delta of assets, but the reporting may
have been based on other variables or considerations regarding the benefit or
disadvantage of disclosure.
This result is in accordance with Popova et al. (2013), and Mathuva (2012) who asserted
that firm size had an insignificant association with risk disclosure. Therefore, this study
rejects the first hypothesis (H1) and concludes that the delta of risk disclosure and the
delta of firm size in unlisted banks did not have a significant association.
The association between the delta of risk disclosure and the delta of liquidity in
unlisted banks
Table 6.18 shows that the relationship between the delta of risk disclosure and the delta
of liquidity was 0.038; this indicates that the association between risk disclosure and
liquidity in unlisted banks was significant. However, this result was not supported by the
result of regression as shown in table 6.19, whereby the delta of liquidity did not influence
unlisted banks to report risk more transparently in their annual reports. Therefore, the
second hypothesis (H2) that supposes a positive association between the delta of risk
disclosure and the delta of liquidity is rejected.
Signalling theory asserts that a firm which has a high liquidity ratio provides more
disclosure in its annual report than a firm with low liquidity. Meanwhile, tables 6.18 and
6.19 indicate that the delta of risk disclosure was not affected by the delta of liquidity in
unlisted banks. It can be stated that neither high nor low liquidity affected the degree of
risk disclosure reported by unlisted banks; however, it may have been affected by other
factors. This result is consistent with Elzahar and Hussainey (2012) and Agyei-Mensah

219
(2012) who found that liquidity had an insignificant association with disclosure.
Therefore, the second hypothesis (H2) that supposes a positive association between the
delta of risk disclosure and the delta of liquidity is rejected.
The association between the delta of risk disclosure and the delta of profitability
in unlisted banks
The relationship between the delta of risk disclosure and the delta of profitability can be
seen in table 6.18. The p value shows an insignificant relationship between the delta of
profitability and the delta of risk disclosure; meanwhile, multiple regressions show that
the delta of profitability had a negative effect on the delta of risk disclosure. As a result,
the third hypothesis (H3) that supposed a positive association between the delta of risk
disclosure and the delta of profitability is rejected
Table 6.18 The Pearson Correlation of unlisted banks
ASSET LDR ROE LEVERAGE EARNINGSRE RISKDISCASSET 1
LDR0.277** 1(0.000)
ROE-0.014 0.149* 1
(0.424) (0.019)
LEVERAGE0.211** 0.403** 0.228** 1(0.002) (0.000) (0.001)
EARNINGSRE0.156* 0.216** 0.250** 0.236** 1
(0.015) (0.001) (0.000) (0.000)
RISKDISC0.062 0.127* -0.094 0.210** 0.049 1
(0.193) (0.038) (0.094) (0.002) (0.249)P-values are given in parentheses. The number of observations is 196. **. Correlation is significant at the0.01 level (1-tailed). *. Correlation is significant at the 0.05 level (1-tailed).

220
Table 6.19 Summary of the Result of Regression Risk Disclosure in unlisted banks
Variables t Sig t HypothesisAssets -0.006 -0.085 0.932 H1:RejectedLDR 0.060 0.755 0.451 H2:RejectedROE -0.159 -2.155 0.032 H3:RejectedLeverage 0.217 2.750 0.007 H4:AcceptedEarnings Reinvestment 0.025 0.341 0.733 H5:RejectedAdjusted R square = 0.044F = 2.816 F table (5;195) = 2.26 Fsig = 0.018DW = 2.324
H6:Accepted
Source: adopted from SPSS results
This result contradicts with Watson et al. (2002) who mentioned that in signalling theory,
highly profitable corporations send positive signals by disclosing more of their
performance in order to ensure their stakeholders are satisfied with the firm’s effort in
gaining profit. In addition, Inchausti (1997) explained that firms with high earnings will
disclose more in their annual report than companies with low earnings.
The result is in line with earlier researchers, i.e. Aljifri et al. (2014); Elzahar and Hussainey
(2012) who found that profitability and disclosure did not have a significant correlation.
Therefore, the third hypothesis (H3) that supposed a positive association between the
delta of risk disclosure and the delta of profitability is rejected.
The association between the delta of risk disclosure and the delta of leverage in
unlisted banks
The statistical result of the relationship between the delta of risk disclosure and the delta
of leverage is shown in table 6.18. The p value shows that the delta of leverage
individually had a significant positive association with the delta of risk disclosure.
Therefore, the fourth hypothesis (H4) that supposes a positive association between the
delta of risk disclosure and the delta of leverage is accepted. This result indicates that
221
unlisted banks revealed their performance in more detail because of their leverage level.
Because the main sources of funds in unlisted banks are from debts, commonly such
banks are highly leveraged; therefore, unlisted banks are more willing to reveal their risks.
Moreover, unlisted banks are willing to disclose risks because they want to show their
capability in managing debts in order to promote a positive image to stakeholders.
Agency theory assumes that firms with high leverage will disclose more to explain their
performance in order to meet their creditors’ interests. The result is in line with agency
theory and Naser et al. (2002), who asserted that highly leveraged firms will disclose
more in their reports to indicate good signals in order to resolve their debts. Therefore,
the fourth hypothesis (H4) that supposes a positive association between the delta of risk
disclosure and the delta of leverage is accepted.
The association between the delta of risk disclosure and the delta of earnings
reinvestment in unlisted banks
Table 6.18 shows the result of the association between the delta of risk disclosure and
the delta of earnings reinvestment. The p significance is 0.249, and reflects that the delta
of risk disclosure in unlisted banks did not have a relationship with the delta of earnings
reinvestment. The regression result (table 6.19) also exhibits that the delta of earnings
reinvestment did not affect the delta of risk disclosure. Therefore, the fifth hypothesis
(H5) that supposes a positive association between the delta of risk disclosure and the
delta of earnings reinvestment is rejected.
Agency theory posits that by paying dividends, agency conflict can be reduced.
According to Baker and Powell (2012), to compensate for a high risk investment, firms
222
which have low disclosure are expected to pay higher dividends. However, while it is
expected that firms with low level disclosure will pay more in dividends than companies
with a high level of disclosure. They Baker and Powell actually found a positive
relationship between the quality of disclosure and dividend per share. Thereby, a
company which has a reinvestment policy should disclose more in order to make sure
that investors, by reinvesting their earnings, will receive higher earnings in the future.
It can be concluded that unlisted banks did not explain their risk more transparently based
on an earnings reinvestment plan. Therefore, the fifth hypothesis (H5) that supposes a
positive association between the delta of risk disclosure and the delta of earnings
reinvestment is rejected.
The association between the delta of risk disclosure and the delta of firm
characteristics in unlisted banks
Table 6.19 shows that the adjusted R square and F are 0.044 and 2.816 respectively.
The delta of firm characteristics could not explain the delta of risk disclosure due to the
adjusted R square being very small. The F indicates that the association between the
delta of risk disclosure and the delta of company characteristics in unlisted banks was
significant. This study accepts the sixth hypothesis (H 6) and concludes that there is an
association between the delta of risk disclosure and the delta of firm characteristics in
unlisted banks.
The unlisted banks provided risk reports but the extent of their disclosure was not merely
based on firm characteristics, and might be explained by other variables. Because F is
higher than F table it means that the delta of aggregate firm characteristics had a

223
significant effect on the delta of risk disclosure. Therefore, this study accepts the sixth
hypothesis (H6) and concludes that there was a significant association between the delta
of risk disclosure and the delta of company characteristics in unlisted banks. Moreover,
the regression of model 1 in this study was not fit for testing the factors affecting unlisted
banks in disclosing more risk in their reporting.
To sum up, individually Pearson’s correlation shows that out of the following: the delta of
firm size, liquidity, profitability, and earnings reinvestment, not one had a significant
relationship with the delta of risk disclosure in unlisted banks. The F statistics in Model 1
was significant. All this evidence indicates that the sixth hypothesis (H6), which supposes
there is a relationship between the delta of risk disclosure and the delta of firm
characteristics should be accepted.
6.6.4 RQ 3.4 The factors affecting a bank’s decision to disclose risk in Islamic
banks
This part answers the factors that affect a bank’s decision to report risk in Islamic and
non-Islamic banks. Because the total number of data sets for the Islamic banks group
was only 27 and in order to demonstrate the influence of firm characteristics on risk
disclosure by regression, the data had to be tested for normality, heterocedasticity,
multicollinearity, and autocollinearity. After testing the normality by a Kolmogorov and
Smirnov test, the variables of the delta of earnings reinvestment and the delta of firm
value did not show up as normal; hence, those variables had to be transformed into
Logarithm (Log), Natural Logarithm (Ln), or inverse, etc. Nevertheless, by transforming
into inverse, Log. and Ln., the earnings reinvestment variables still did not show a normal

224
shape, the rest of N was only 5 (Appendix F). Moreover, most of the delta of earnings
reinvestment data was zero, possibly because Islamic banks did not distribute dividends
between the years 2008-2012. Finally, for the best solution and in order to process
correlation and regression tests, the delta of earnings reinvestment variable was
excluded from the Islamic banks model. Based on those reasons, the firm characteristic
variables which were tested in Islamic banks were size, liquidity, profitability, and
leverage. Along with that, the fifth hypothesis was also excluded. Each correlation is
explained as below:
The association between the delta of risk disclosure and the delta of firm size in
Islamic banks
The association between the delta of risk disclosure and the delta of assets is shown in
table 6.20 whereby p value is 0.077>alpha 5%, meaning that individually the delta of
company size did not have a relationship with the delta of risk disclosure. The statistical
regression in table 6.21 shows that the delta of assets had an insignificant effect on the
delta of risk disclosure. Based on agency theory, it is expected that companies with large
assets have more complicated business and have more stakeholders than small
companies, hence they disclose more in order to minimise asymmetrical information
between managers and users. Nevertheless, this study’s findings contradict agency
theory, and instead support previous scholars, namely Ibrahim (2011); Rajab and
Handley-Schachler (2009) who demonstrate that firm size does not have relationship
with risk disclosure. It means the delta of firm size was not a strong variable in
determining risk disclosure. The statistical regression, as shown in table 6.21, is
insignificant so it is not able to support the first hypothesis. This could be explained by

225
the fact that Islamic banks did not consider assets as the factor that influenced them to
report risk more transparently. Therefore, this study rejects the first hypothesis (H1) and
concludes that there was no association between the delta of risk disclosure and the
delta of firm size.
The association between the delta of risk disclosure and the delta of liquidity in
Islamic banks
Table 6.20 shows that the p value was 0.055, higher than alpha 0.05, meaning that the
association between the delta of risk disclosure and the delta of liquidity was insignificant.
Table 6.21 demonstrates that the delta of liquidity did not affect Islamic banks in
disclosing more risk in their reporting. The result indicates that Islamic banks did not
reveal their risk more transparently based on the delta of finance to deposit ratio (FDR).
This is not in line with signalling theory, which suggests a firm which has a high liquidity
ratio provides more disclosure.
This study does support the findings of previous researchers, i.e. Agyei-Mensah (2012);
Elzahar and Hussainey (2012); Mathuva (2012), who asserted that risk disclosure and
liquidity had an insignificant relationship. It means that liquidity is not a strong factor in
determining risk disclosure in Islamic banks. Therefore, the second hypothesis (H2) that
supposes a positive association between the delta of risk disclosure and the delta of
liquidity is rejected.
The association between the delta of risk disclosure and the delta of profitability
in Islamic banks

226
The relationship between the delta of risk disclosure and the delta of profitability is
demonstrated in table 6.20. The p value signifies that the delta of profitability did not have
a relationship with the delta of risk disclosure. Table 6.21 shows that the delta of
profitability had an insignificant effect on the delta of risk disclosure. This indicates that
Islamic banks did not explain their risk performance in more detail because the delta of
profitability neither increased nor decreased. This result implies that profitability did not
significantly determine risk disclosure in Islamic banks. In other words, Islamic banks did
not consider the delta of profitability in reporting their risk more transparently in their
annual reports.
The research that was done by Elzahar and Hussainey (2012) supports this research
because they also found that profitability had an insignificant association with risk
disclosure. Due to that, the third hypothesis (H3) that supposes a positive association
between the delta of risk disclosure and the delta of profitability is rejected.
Table 6.20 The Pearson’s correlation of firm characteristics, risk disclosure and firm value
in Islamic banks
ASSETS LDR ROE LEVERAGE RISKDISC FIRMVALUEASSET 1
LDR0.051 1
(0.400)
ROE-0.145 0.228 1
(0.235) (0.126)
LEVERAGE-0.323 -0.126 0.122 1
(0.050) (0.265) (0.272)
RISKDISC-0.282 -0.314 -0.180 0.113 1
(0.077) (0.055) (0.185) (0.287)
FIRMVALUE0.210 0.117 -0.049 -0.050 -0.094 1
(0.147) (0.280) (0.405) (0.402) (0.321)P-values are given in parentheses. The number of observations is 27. **. Correlation is significant at the0.01 level (1-tailed). *. Correlation is significant at the 0.05 level (1-tailed).

227
Table 6.21 Summary of the Result of OLS Regression Risk Disclosure in Islamic banks
Variables t t sig HypothesisAssets -0.290 -1.426 0.168 H1:RejectedLDR -0.261 -1.309 0.204 H2:RejectedROE -0.163 -0.814 0.424 H3:RejectedLeverage 0.006 0.031 0.976 H4:RejectedAdjusted R square = 0.047F= 1.323 F table (4;22) = 2.816 Fsig = 0.293DW = 1.756
H6: Rejected
Source: adopted from SPSS
The association between the delta of risk disclosure and the delta of leverage in
Islamic banks
The result of the relationship between the delta of risk disclosure and the delta of leverage
is shown in table 6.20. The p value was 0.287 and higher than 5%, which indicates that
the association between the delta of risk disclosure and the delta of leverage was
insignificant. The evidence of an insignificant effect between the delta of risk disclosure
and the delta of leverage is shown in table 6.21. Therefore, the fourth hypothesis (H4)
that supposes a positive association between the delta of risk disclosure and the delta of
leverage is rejected.
The association between the delta of risk disclosure and the delta of firm
characteristics in Islamic banks
Table 6.21 demonstrates F (1.323) < F table, meaning that aggregate firm characteristics
insignificantly affected the delta of risk disclosure. This result is supported by the adjusted
R square for model 1 being 0.047, which means only about 4.7% of the delta of risk
disclosure was explained by firm size, liquidity, profitability, leverage and the remaining
95.3 % might be explained by other factors which were not tested in this study. It is
228
concluded that Model 1 was not fit for predicting the correlation between the delta of firm
characteristics and the delta of risk disclosure in Islamic banks. Based on those results,
this study rejects the sixth hypothesis (H6) that supposes there is an association between
the delta of risk disclosure and the delta of firm characteristics.
Adjusted R square for model 1 is 0.047, which means only about 4.7% of risk disclosure
was explained by firm size, liquidity, profitability, leverage and the remaining 95.3 % might
be explained by other factors which were not tested in this study. The result suggests
that in reporting risk, Islamic banks were not affected by the delta of firm size, liquidity,
profitability, and leverage. This finding supports the theory that Islamic banks considered
other factors when they decided to report their risk in more detail. Based on those results,
this study rejects the sixth hypothesis (H6) that supposes there is an association between
the delta of risk disclosure and the delta of firm characteristics. Furthermore, it is
concluded that model 1 was not fit for predicting the relationship between the delta of
firm characteristics and the delta of risk disclosure in Islamic banks.
To sum up, for model 1, none of the firm characteristics, namely firm size, liquidity,
profitability, and leverage, had an insignificant association with risk disclosure; even the
adjusted R squared was only 0.047 and F was insignificant. These statistical results
demonstrate that Model 1 was not fit for explaining factors affecting Islamic banks in
reporting risk.
6.6.5 RQ 3.5 The factors affecting banks’ decision to disclose risk in non-Islamic
banks
Each hypothesis for Model 1 will be explained as follows:

229
The association between the delta of risk disclosure and the delta of firm size in
non-Islamic banks
The individual association between the delta of risk disclosure and the delta of firm size
is shown in table 6.22. The probability result of 0.177 means that the delta of assets had
an insignificant relationship with risk disclosure. This is also supported by the p value,
which was higher than 0.05, as shown in table 6.23.
It demonstrates that non-Islamic banks did not disclose more of their performance based
on the delta of assets but possibly based on other factors. The result contradicts agency
theory, which suggests that large companies with high assets disclose more in order to
minimise asymmetrical information between managers and users. However, this study is
in line with previous researchers such as Rajab and Handley-Schachler (2009) and Aljifri
and Hussainey (2007), who demonstrated that firm size did not have a significant
association with disclosure. As a result, this study rejects the first hypothesis (H1), and
concludes that there is an insignificant association between the delta of risk disclosure
and the delta of firm size.
The association between the delta of risk disclosure and the delta of liquidity in
non-Islamic banks
Table 6.22 shows that there was a positive relationship between the delta of risk
disclosure and the delta of liquidity. Moreover, the delta of liquidity affected banks in
reporting their risk, which was indicated by p value 0.038 in table 6.23. This may have
been because banks borrow their source of funds for loans and wanted to show the
stakeholders how the banks effectively manage their liquidity ratio. Non-Islamic banks

230
need to stress their capability to provide funds when customers withdrawn their money
anytime. Thereby, non-Islamic banks explained risk in more detail with regard to the
delta of liquidity.
Watson et al. (2002) asserted that signalling theory posits that firms with high liquidity will
disclose more and deliver better signals than firms with lower liquidity. This result is
consistent with signalling theory and it is supported by Marshall and Weetman (2007)
and Espinosa et al. (2005) who revealed that liquidity had a significant association with
risk disclosure. Therefore, the second hypothesis (H2) that supposes a positive
association between the delta of risk disclosure and the delta of liquidity is accepted.
The association between the delta of risk disclosure and the delta of profitability
in non-Islamic banks
The relationship between the delta of risk disclosure and profitability can be seen in table
6.22. The p significance is higher than alpha 5%, this means that the relationship between
the delta of risk disclosure and the delta of profitability was insignificant. This is supported
by the result in table 6.23. This demonstrates that non-Islamic banks did not consider
whether the delta of profitability had increased or declined when explaining their firm
performance more transparently. This result contradicts signalling theory, which
supposes that highly profitable firms disclose their performance more fully; nevertheless,
it is in line with Inchausti (1997) who mentioned that agency theory suggests companies
with low profit will disclose more to contextualise their worse performance. Moreover,
this study supports the findings of Elzahar and Hussainey (2012), who mentioned that
profitability had an insignificant association with risk disclosure. As a result, the third
231
hypothesis (H3) that supposes a positive association between the delta of risk disclosure
and the delta of profitability is rejected.
The association between the delta of risk disclosure and the delta of leverage in
non-Islamic banks
The result of the relationship between the delta of risk disclosure and the delta of leverage
is shown in table 6.22, with p value higher than 5%. The result means that the association
between the delta of risk disclosure and the delta of leverage is not significant. The
insignificant effect of leverage to risk disclosure is also shown in table 6.23. Non-Islamic
banks did not consider the delta of leverage when they reported their risk performance
more transparently in annual reports. This result is not in accordance with agency theory,
which asserts that highly leveraged companies tend to provide information more
transparently to fulfil their creditors’ interest. However, research done by Elzahar and
Hussainey (2012); Rajab and Handley-Schachler (2009) support this study, because they
agreed that leverage did not have a relationship with risk disclosure. Therefore, the fourth
hypothesis (H4) that supposes a positive association between the delta of risk disclosure
and the delta of leverage is rejected.
The association between the delta of risk disclosure and the delta of earnings
reinvestment in non-Islamic banks
Table 6.23 reveals the result of the association between the delta of risk disclosure and
the delta of earnings reinvestment, which has p significant more than 5%. This result
indicates that risk disclosure had an insignificant correlation with earning reinvestment.
It reflects that risk disclosure had an insignificant correlation with earnings reinvestment.

232
The regression result was not able to support the association above, in other words
earnings reinvestment that had been done by non-Islamic banks did not affect the
transparency with which banks revealed their risk.
The result is not in line with Bamber and McMeeking (2012) who asserted that in
signalling theory, firms with low disclosure are supposed to pay higher dividends. It
connotes that firm with low earnings reinvestment will more transparent in explain their
performance. Moreover, non-Islamic banks explained risk in more detail did so not
merely because of the delta of earnings reinvestment, but possibly affected by other
factors. Therefore, the fifth hypothesis (H5) that supposes a positive association between
the delta of risk disclosure and the delta of earnings reinvestment is rejected.
Table 6.22 The Pearson’s correlation between the delta of firm characteristics, the delta
of risk disclosure and the delta of firm value in non-Islamic banks
ASSETS LDR ROE LEVERAGE EARNINGREIV RISKDISC FIRMVALUEASSETS 1
LDR0.054 1
(0.181)
ROE-0.005 0.019 1
(0.465) (0.374)
LEVERAGE-0.144** 0.295** 0.115* 1(0.007) (0.000) (0.027)
EARNINGREIV0.071 0.179** 0.044 0.157** 1
(0.118) (0.001) (0.230) (0.004)
RISKDISC0.055 0.148** 0.000 0.083 0.031 1
(0.177) (0.006) (0.498) (0.082) (0.303)
FIRMVALUE-0.010 -0.017 0.860** 0.108* -0.002 0.023 1
(0.431) (0.387) (0.000) (0.034) (0.484) (0.352)P-values are given in parentheses. The number of observations is 285. **. Correlation is significant at the0.01 level (1-tailed). *. Correlation is significant at the 0.05 level (1-tailed).
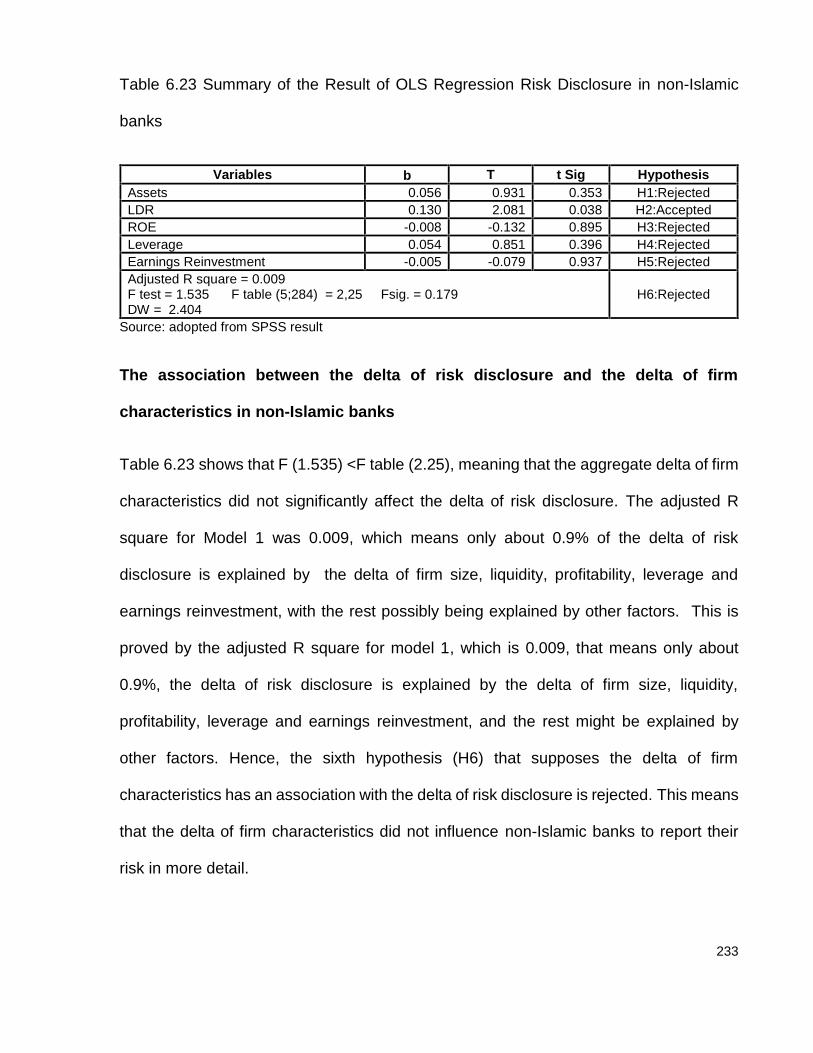
233
Table 6.23 Summary of the Result of OLS Regression Risk Disclosure in non-Islamic
banks
Variables T t Sig HypothesisAssets 0.056 0.931 0.353 H1:RejectedLDR 0.130 2.081 0.038 H2:AcceptedROE -0.008 -0.132 0.895 H3:RejectedLeverage 0.054 0.851 0.396 H4:RejectedEarnings Reinvestment -0.005 -0.079 0.937 H5:RejectedAdjusted R square = 0.009F test = 1.535 F table (5;284) = 2,25 Fsig. = 0.179DW = 2.404
H6:Rejected
Source: adopted from SPSS result
The association between the delta of risk disclosure and the delta of firm
characteristics in non-Islamic banks
Table 6.23 shows that F (1.535) <F table (2.25), meaning that the aggregate delta of firm
characteristics did not significantly affect the delta of risk disclosure. The adjusted R
square for Model 1 was 0.009, which means only about 0.9% of the delta of risk
disclosure is explained by the delta of firm size, liquidity, profitability, leverage and
earnings reinvestment, with the rest possibly being explained by other factors. This is
proved by the adjusted R square for model 1, which is 0.009, that means only about
0.9%, the delta of risk disclosure is explained by the delta of firm size, liquidity,
profitability, leverage and earnings reinvestment, and the rest might be explained by
other factors. Hence, the sixth hypothesis (H6) that supposes the delta of firm
characteristics has an association with the delta of risk disclosure is rejected. This means
that the delta of firm characteristics did not influence non-Islamic banks to report their
risk in more detail.
234
To sum up, for model 1, only the delta of liquidity had a significant positive relationship
with the delta of risk disclosure, while the delta of the following: firm size, profitability,
leverage, and earnings reinvestment did not have relationship with the delta of risk
disclosure. In addition, this study demonstrates that the delta of firm characteristics was
not able to explain the delta of risk disclosure because adjusted R square was very small.
The delta of firm characteristics did not affect risk disclosure, because F test is
insignificant. Therefore, Model 1 was not fit for predicting the association between the
delta of firm characteristics and the delta of risk disclosure. Hence, the sixth hypothesis
(H6) that supposes the delta of firm characteristics have an association with the delta of
risk disclosure is rejected.
All in all, for Model 1, this study found that the delta of firm characteristics was not able
to explain the delta of risk disclosure because the adjusted R square was very small.
Moreover, the delta of firm characteristics aggregate did not affect the delta of risk
disclosure because F test was insignificant.
6.7 The Results of RQ4 - The Value Relevance of Risk Disclosure
This part describes the empirical results in answering research question number four,
which examines the value relevance of risk disclosure. This sub chapter is divided into
five parts, related to the bank sectors.
Harold Lasswell (1948) suggested that a model of communication should answer a
simple question namely: who, says what, in which channel, to whom, and what is the
effect. It means that risk disclosure is value relevant for users when it can signify that a
manager (who) has already reported the firm’s performance (as says what) in the form

235
of its annual report (as which channel). Annual reports are issued for the needs of
stakeholders (as to whom) which are used as material for consideration in making
decisions (as what that effect). Regarding communication theory, a manager as a
representative of a company, sends messages and gives signals through a firm’s annual
reports.
The stakeholders as receivers will read the information in the annual report and consider
it when making decisions. Nevertheless, information in the annual report could contain
noises that make the expected signals more difficult to interpret accurately and this could
cause misperception, and result in reporting that is not in accordance with receivers’
expectation, and finally could affect investors in making their decisions.
Agency theory asserts that companies which provide more transparent information are
able to minimise information asymmetry between managers and users. The annual report
is fruitful and value relevant for investors if firms reveal their information in more detail
and accurately in terms of what the stakeholder needs and is interested in.
6.7.1 RQ 4.1: The value relevance of risk disclosure in all banks
The results of Model 2 are summarised in tables 6.24 to 6.25
The association between the delta of firm value and the delta of firm size in all
banks
The evidence in table 6.24 that p value is 0.432 indicates that individually the delta of
bank size did not have a relationship with the delta of firm value. Besides, p value of

236
regression in table 6.25 also points to an insignificant impact of the delta of assets on the
delta of firm value.
Meanwhile, agency theory asserts that large companies have a strong financial incentive
to pay consultants to produce transparent reports about their performance in order to
minimise agency conflicts between managers and shareholders, and hence increase firm
value (Sheu et al., 2010). Moreover, Al-Akra and Ali (2012), Uyar and Kiliç (2012) assert
that large firms have high total assets, which means managers are able to use assets
more flexibly and productively for financing the firm’s operations in order to generate high
profits, gain a good image with stakeholders, and maintain their reputation and finally
increase firm value.
This result contradicts agency theory and most prior research; however it is in line with
Chen and Chen (2011) who argued that when a firm which has the same profitability, firm
size does not affect firm value. In addition, this might happen because stakeholders
valued the firm not based on assets, but possibly based on other variables that were not
tested in this study.
To sum up, the seventh hypothesis (H7) which asserted there was a positive association
between the delta of firm size and the delta of firm value is rejected.
The association between the delta of firm value and the delta of liquidity in all
banks
The relationship between the delta of firm value and the delta of liquidity had a p value
0.389 with a negative sign. This means the delta of firm value had a negative insignificant
237
association with the delta of liquidity. Moreover, the delta of liquidity did not influence the
banks to report their risks more transparently, because p value in table 6.25 shows a
negative sign and an insignificant correlation.
Even though liquidity is an important ratio for measuring a firm’s ability to repay its short
term debts, it does not support an increase in firm value. It might be that liquidity does
not have a direct correlation with generating profit; therefore, it is not able to support an
increase in share price. Moreover, other factors might influence firm value. This result is
in line with Al-Akra and Ali (2012) who asserted that liquidity does not have an association
with firm value. Hence, the eighth hypothesis (H8) is rejected.
The association between the delta of firm value and the delta of profitability in all
banks
A strong positive significant association between the delta of profitability and the delta of
firm value is shown by p value 0 in table 6.24. This association is also supported by the
result of regression in table 6.25 that shows p value was 0. This result indicates that the
delta of profitability has a positive significant association with the delta of firm value.
Profitability explains how well the banks manage their funds and risks in order to achieve
profit. Stakeholders perceive that highly profitable banks are more beneficial. Along with
that, investors and potential investors tend to be satisfied with what banks have done
and this might make them more interested in buying their shares, and it will push share
price up and then finally increase firm value. Rising profit from year to year shows the
enhancement of banks’ net income that indicates a rise in the value of the firm. It also
gives a positive image for stakeholders and supports firm value increase. The association

238
between profitability and firm value is clearly supported by Uyar and Kiliç (2012) who
asserted a significantly positive correlation between firm value and profitability. All in all,
it was found that highly profitable banks increased their firm value; hence, the ninth
hypothesis (H9) is accepted.
The association between the delta of firm value and the delta of leverage in all
banks
The positive relationship between the delta of firm value and the delta of leverage in this
study is shown by p value 0.035 (table 6.24). Nevertheless, the delta of firm value was
not affected by the delta of leverage as shown in table 6.25 which shows p value was
0.460, and higher than 0.05. Therefore, this research indicates that the delta of leverage
had an insignificant effect on the delta of firm value.
The banks’ main sources of funds are debts from third parties. Banks tend to have high
debts, which reflect their capability to collect their funds and how they manage the funds
efficiently and effectively for making a profit. Khan, Kaleem, and Nazir (2012) argued that
based on agency and signalling theories, in companies with a small proportion of
managerial ownership, debts can be used to minimise free cash flow and the agency
costs of controlling managers, hence the relationship between leverage and firm value
should be positive. By contrast, the amount of leverage can be considered as a predictor
of company risk or bankruptcy. This means that the greater the leverage, the higher the
debt, indicating a greater investment risk that might mean the company cannot pay its
debts. Highly leveraged companies convey a negative sign that supports a negative
reaction for users, which then ultimately affects the value of the company. Accordingly,
239
firms with low leverage increase firm value and the risks are smaller than for highly
leveraged companies. This is supported by Babaei et al. (2013) who found that leverage
had a negative correlation with firm value.
This study is not in line with agency theory, which posits that leverage has a positive
relationship with firm value. Moreover, the result is not in line with the second model,
which supposed that the association between the delta of leverage and the delta of firm
value has a negative sign. However, this research is supported by previous researchers’
results, including Hassan et al. (2009); Uyar and Kiliç (2012); Brooks and Yan (1999),
who mentioned that there is no relationship between leverage and firm value. Because
this research indicates that leverage has an insignificant effect on firm value, the tenth
hypothesis (H10) is rejected.
The association between the delta of firm value and the delta of earnings
reinvestment in all banks
The result shows that p value is insignificant with a negative direction, indicating that the
delta of earnings reinvestment and the delta of firm value had a negative insignificant
correlation. The result of regression also indicates that the delta of earnings reinvestment
did not influence the delta of firm value as shown in table 6.25.
The result is in line with Miller and Modigliani’s (1961) theory, who asserted that dividend
policy does not have an effect on firm value, because firm value is only affected by the
ability of a firm to generate profits and manage business risks. It can be concluded that
earnings reinvestment also does not increase firm value in all banks and other factors
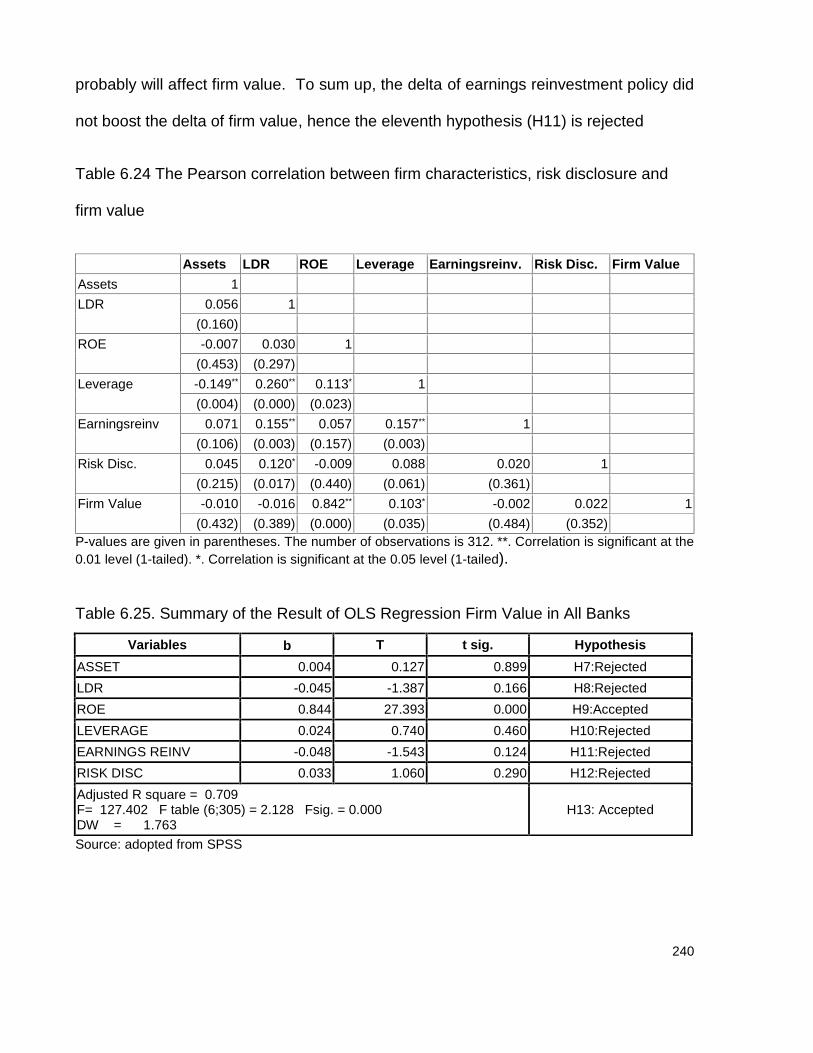
240
probably will affect firm value. To sum up, the delta of earnings reinvestment policy did
not boost the delta of firm value, hence the eleventh hypothesis (H11) is rejected
Table 6.24 The Pearson correlation between firm characteristics, risk disclosure and
firm value
Assets LDR ROE Leverage Earningsreinv. Risk Disc. Firm ValueAssets 1LDR 0.056 1
(0.160)ROE -0.007 0.030 1
(0.453) (0.297)Leverage -0.149** 0.260** 0.113* 1
(0.004) (0.000) (0.023)Earningsreinv 0.071 0.155** 0.057 0.157** 1
(0.106) (0.003) (0.157) (0.003)Risk Disc. 0.045 0.120* -0.009 0.088 0.020 1
(0.215) (0.017) (0.440) (0.061) (0.361)Firm Value -0.010 -0.016 0.842** 0.103* -0.002 0.022 1
(0.432) (0.389) (0.000) (0.035) (0.484) (0.352)P-values are given in parentheses. The number of observations is 312. **. Correlation is significant at the0.01 level (1-tailed). *. Correlation is significant at the 0.05 level (1-tailed).
Table 6.25. Summary of the Result of OLS Regression Firm Value in All Banks
Source: adopted from SPSS
Variables T t sig. HypothesisASSET 0.004 0.127 0.899 H7:RejectedLDR -0.045 -1.387 0.166 H8:RejectedROE 0.844 27.393 0.000 H9:AcceptedLEVERAGE 0.024 0.740 0.460 H10:RejectedEARNINGS REINV -0.048 -1.543 0.124 H11:RejectedRISK DISC 0.033 1.060 0.290 H12:RejectedAdjusted R square = 0.709F= 127.402 F table (6;305) = 2.128 Fsig. = 0.000DW = 1.763
H13: Accepted
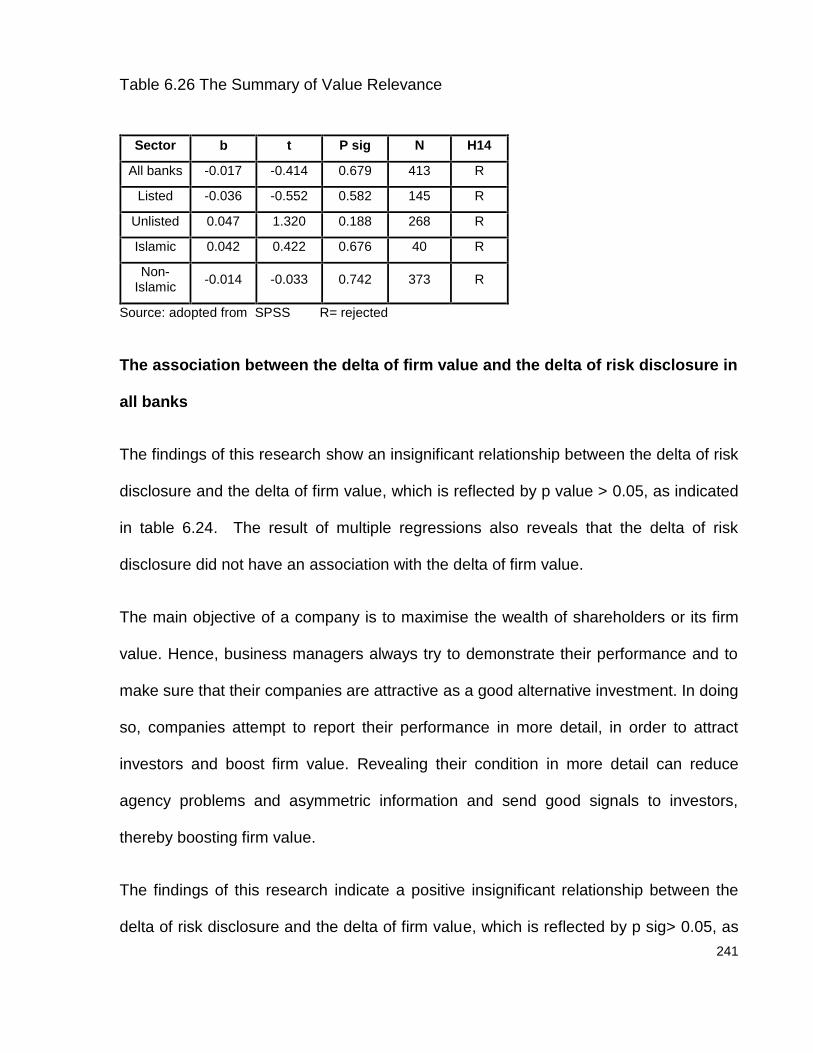
241
Table 6.26 The Summary of Value Relevance
Sector t P sig N H14
All banks -0.017 -0.414 0.679 413 R
Listed -0.036 -0.552 0.582 145 R
Unlisted 0.047 1.320 0.188 268 R
Islamic 0.042 0.422 0.676 40 R
Non-Islamic -0.014 -0.033 0.742 373 R
Source: adopted from SPSS R= rejected
The association between the delta of firm value and the delta of risk disclosure in
all banks
The findings of this research show an insignificant relationship between the delta of risk
disclosure and the delta of firm value, which is reflected by p value > 0.05, as indicated
in table 6.24. The result of multiple regressions also reveals that the delta of risk
disclosure did not have an association with the delta of firm value.
The main objective of a company is to maximise the wealth of shareholders or its firm
value. Hence, business managers always try to demonstrate their performance and to
make sure that their companies are attractive as a good alternative investment. In doing
so, companies attempt to report their performance in more detail, in order to attract
investors and boost firm value. Revealing their condition in more detail can reduce
agency problems and asymmetric information and send good signals to investors,
thereby boosting firm value.
The findings of this research indicate a positive insignificant relationship between the
delta of risk disclosure and the delta of firm value, which is reflected by p sig> 0.05, as
242
indicated in table 6.24. The result of multivariate regression also reveals that risk
disclosure did not have an impact on firm value. This means that even if banks disclosed
more risk in their reports, it did not boost firm value. This result is in accordance with
Wang et al (2013) who examined the influence of voluntary disclosure on firm value, and
reported that an increase in disclosure in annual reports did not create value for a
company. This may be because firms were reluctant to report in more detail because of
the weaknesses of disclosure. By disclosing their performance, it means they show their
strategies and increase cost. Returning to the twelfth hypothesis (H12) posed at the
beginning of this study, the result is obviously different, and therefore the hypothesis is
rejected.
The association between the delta of firm value and the delta of firm
characteristics, and the delta of risk disclosure in all banks
Table 6.25 shows that F (127.402) > F table (12.4), this means that aggregated, the delta
of risk disclosure and the delta of firm characteristics, namely size, liquidity, profitability,
leverage, and earnings reinvestment, had a significant relationship with the delta of firm
value. Based on adjusted R square, the robustness of the association between the delta
of firm value and the delta of company’s characteristics and the delta of risk disclosure is
0.709. This means that the delta of bank size, liquidity, profitability; leverage, earnings
reinvestment, and the delta of risk disclosure explain the delta of firm value about 70.9%.
When aggregate the delta of bank size, profitability ratio, leverage, and risk disclosure
increased, while the delta of liquidity ratio and the delta of earnings reinvestment
decreased, hence the delta of firm value increased, and the rest (29.1%) might be
explained by other factors which were not tested in this research. These results show

243
that model 2 was appropriate to predict the association between the delta of firm value
and the delta of firm characteristics and the delta of risk disclosure simultaneously.
Therefore, the thirteenth hypothesis (H13) that supposes an association between the
delta of firm value and the delta of company characteristics and the delta of risk
disclosure is accepted.
The value relevance of risk disclosure in all banks
The findings of this research indicate a negative insignificant relationship between risk
disclosure and firm value, as indicated in table 6.26. This result shows an insignificant
association between risk disclosure and firm value in all banks in Indonesia.
Regarding communication theory, a manager as a representative of the company, sends
messages and gives signals through annual reports. The stakeholders as receivers will
receive the information from annual reports and consider it in making decisions.
Nevertheless, information in the annual report could contain noises that make the
expected signals more difficult to interpret accurately and this could affect misperception,
and mean that messages are not in accordance with receivers’ expectation, and finally
could affect investors in making their decisions. The communication process with noises
can be seen in figure 3.3.
Agency theory asserts that companies which provide more transparent information are
able to minimise information asymmetry between managers and users. The annual report
is fruitful and value relevant for investors if firms reveal their information in more detail
and accurately in ways that meet the stakeholders’ needs and interests. The result
244
shows that overall, for banks in Indonesia, as shown in table 6.26, p value (0.679) is
insignificant, indicating that risk disclosure in annual reports did not have association with
firm value and was not value relevant for users. The findings of this research indicate a
negative insignificant relationship between risk disclosure and firm value, which is
reflected by p sig> 0.05, as indicated in table 6.26. This means that even though banks
disclosed risk more fully in their reporting, this did not boost firm value. This result is in
accordance with Wang et al. (2013) who examined the influence of voluntary disclosure
on firm value and reported that the increase of disclosure in annual reports did not lead
to the creation of value in a company. This could be because the banks are reluctant to
report more detail because of the weaknesses of disclosure mentioned above.
Therefore, this study rejects the fourteenth hypothesis (H14) that supposes risk
disclosure is value relevant for stakeholders in all banks.
To sum up, Model 2 is fit for predicting the factors affecting bank when reporting risk, and
only the delta of profitability had a significant association with the delta of firm value. The
delta of firm value was explained by size, liquidity, profitability, leverage, earnings
reinvestment, and risk disclosure with adjusted R square 0.709, while the remains
(29.1%) were explained by other variables that were not examined in this study. The delta
of firm value was influenced by the delta of risk disclosure together with the delta of
assets, profitability, leverage which had a positive sign, while the delta of earnings
reinvestment and the delta of liquidity had a negative sign, as explained by F higher than
F table. Meanwhile, risk disclosure was not value relevant.
245
6.7.2 RQ 4.2 The value relevance of risk disclosure in listed banks
Table 6.27 and 6.28 show the results of the relationship between the delta of firm value
and the delta of risk disclosure and the delta of firm characteristics.
The association between the delta of firm value and the delta of firm size in listed
banks
Table 6.27 shows that the p value was higher than 0.05, and this indicates that the delta
of firm value and the delta of assets did not have a significant correlation. Agency theory
suggests that companies with large assets have a strong financial incentive to report their
performance transparently, in order to minimise agency conflicts and foster a good
image, hence increasing firm value. The banks with the biggest assets have the ability
to pay consultants to produce reports that convince investors how strong they are and
good at managing risks. The information sends positive signals to stakeholders and
finally increases firm value. Nevertheless, this result contradicted with agency theory
whereby the results in table 6.27 and 6.28 indicate that the delta of firm value and the
delta of assets did not have a significant correlation in the listed banks. It means that
assets did not affect to increase firm value in the listed banks, and assets is not the only
factor which will increase value of the firm, and other factors might influence firm value
which are not tested in this study. Therefore, the association between the delta of firm
value and the delta of firm size in listed banks that was proposed as the seventh
hypothesis (H7) is rejected.
The association between the delta of firm value and the delta of liquidity in listed
banks

246
The individual relationship between the delta of firm value and the delta of liquidity had a
p significance of 0.679 (see table 6.27). This means that the delta of firm value did not
have an association with the delta of liquidity in listed banks. This study also was not able
to show that the delta of liquidity influenced the delta of firm value, as presented in table
6.28.
This might be because the liquidity ratio (LDR) was not an influential variable that directly
affected share price in the market, therefore it did not affect firm value. This result is in
accordance with Al-Akra and Ali (2012) who stated that liquidity does not have a
relationship with firm value. All in all, this study rejects the eighth hypothesis (H8) that
proposes a positive association between the delta of firm value and the delta of liquidity
in listed banks.
The association between the delta of firm value and the delta of profitability in
listed banks
The results in table 6.27 show that the association between the delta of firm value and
the delta of profitability had a p value 0 with a positive direction. This indicates that the
delta of profitability had a significant positive association with firm value in listed banks.
Table 6.28 also shows a significant positive effect of the delta of profitability on the delta
of firm value.
A highly profitable bank can pass on high earnings to its shareholders. The efficacy of
banks in distributing profit to shareholders produces a good image and impression, hence
increasing the value of the firm, which is reflected in its share price. The relevance of
profitability is clearly supported by the findings offered by Chen and Chen (2011) who

247
argued that profitability can be a factor which can affect firm value. It is also supported
by Uyar and Kiliç (2012) who assert that profitability has a positive relationship with firm
value because stakeholders perceive that highly profitable firms capable of managing
themselves and are a prospective investment. This result in line with MM’s irrelevance
theory, which asserted that firm value is affected by profitability and business risk.
Hence, this study accepts the ninth hypothesis (H9) that supposes there is a positive
association between the delta of firm value and the delta of profitability.
The association between the delta of firm value and the delta of leverage in listed
banks
The individual relationship between the delta of firm value and the delta of leverage in
this study is shown by p value 0.077 (see table 6.27) with a positive direction. This reflects
that the delta of leverage in listed banks did not have a significantly positive association
with the delta of firm value. The result of regression in table 6.28 shows that the delta of
leverage had an insignificant influence on the delta of firm value.
According to pecking order theory, firms prefer to use internal funds, but if they are
insufficient they can raise funds from debt. Even though listed banks obtain funds from
external sources, they still have a high leverage. Leverage can be used for minimising
agency problems by external monitoring of the managers in order to act in ways the
shareholder needs. When agency problems decrease it can increase firm value. In
addition, Horne (1997) asserted that a company with high leverage indicates that the
company is not solvent and this influences its value. It means that if a company is highly
leveraged, the firm value will decrease.

248
The delta of leverage did not affect the delta of firm value, as shown in tables 6.27 and
6.28. This result is not in accordance with agency theory, or Chen and Chen (2011) and
Horne (1997) who suggested a negative direction in this correlation. Nevertheless, this
results is in line with Uyar and Kiliç (2012) who attested that leverage did not affect firm
value. It means that the delta of leverage did not affect the delta of firm value.
This result contradicts Model 2 in this study, which proposes a negative direction.
Meanwhile, the findings indicate that the delta of leverage did not have a relationship with
the delta of firm value. Therefore, the tenth hypothesis (H10) that supposes there is a
negative association between the delta of firm value and the delta of leverage is rejected.
The association between the delta of firm value and the delta of earnings
reinvestment in listed banks
Companies might not distribute their dividends if they prefer to reinvest their earnings
(earnings reinvestment) in profitable investments. Bodie et al. (2011) mentioned that
firms with high earnings reinvestment indicate to investors that initially they will get small
earnings from dividends. However, while banks might give small dividends now, in the
future banks are likely to make high earnings from reinvesting dividends in profitable
investments.
Ross et al. (2008) mentioned that shareholders’ purpose is to increase their wealth by
receiving high dividends when they invest their funds in firms. Along with that, a company
will consider the need for a dividends policy that increases shareholder wealth. Baker
and Powell (2012) added that companies that distribute dividends will have low earnings
reinvestment are supposed to have a high firm value.
249
Firm value can be reflected in a firm’s capability to pay dividends. The distribution of
dividends influences firm value: the higher the dividends, the higher the firm value. Firms
have to allocate their profit productively and effectively in order to achieve two different
purposes; namely, increasing earnings reinvestments, and paying dividends. On one
side firms’ shareholders need to receive high dividends, on the other side companies
want to keep their earnings high in order to reinvest their earnings unimpeded. A firm
with good decision making in the area of earnings reinvestment and paying dividends is
able to maximise its value.
Nevertheless, this study identified the relationship between the delta of earnings
reinvestment and the delta of firm value by p value, which was higher than 5%, as shown
in tables 6.27 and 6.28 respectively. This means that the delta of earnings reinvestment
had an insignificant association with the delta of firm value and connotes that the delta
of earning reinvestments did not increase the delta of firm value therefore the result is
not in line with Baker and Powell (2012). Therefore, the eleventh hypothesis (H11) that
supposes there is a positive association between the delta of firm value and the delta of
earnings reinvestment is rejected.
The association between the delta of firm value and the delta of risk disclosure in
listed banks
The findings of this research show a negative insignificant relationship between the delta
of risk disclosure and the delta of firm value, which is reflected in the p value > 0.05, as
indicated in table 6.27. This result indicates that the delta of risk disclosure did not have
an association with the delta of firm value.

250
Risk information is important for stakeholders. Risk disclosure is a medium of firm
accountability for stakeholders, to send information about its performance, because
investors need to predict risk before making decisions. Jensen and Meckling (1976)
asserted that listed banks that disclose their performance to a greater extent tend to
decrease agency conflict between managers and users and will give a positive
impression to investors, thereby increasing firm value. Besides, listed banks have
regulations to report their performance completely, comprehensively and regularly due
to their listing on the stock market, in order to allow investors and potential investors to
easily understand financial reports and find them useful for consideration before making
less risky financial decisions. When companies send good signals in their reports
transparently, investors are more likely to buy their shares and induce a share price
increase, therefore increasing firm value. However, this study shows that the delta of
risk disclosure has an insignificant relationship with the delta of firm value, as presented
in table 6.27. Furthermore, risk disclosure was not found to affect firm value, as shown
in table 6.28. This result is in accordance with Wang et al. (2013) who attested that risk
disclosure did not increase firm value. They mentioned that this may be because
managers are reluctant to report their performance transparently due to what they
consider to be the disadvantages of disclosure. Since this study did not find any
association between the delta of risk disclosure and the delta of firm value in listed banks,
the twelfth hypothesis (H12) is rejected.

251
Table 6.27 The Pearson’s Correlation of listed banks
ASSETS LDR ROE LEVERAGE EARNINGREIV RISKDISC FIRMVALUEASSETS 1
LDR0.092 1
(0.327)
ROE-0.013 -0.040 1
(0.893) (0.668)
LEVERAGE-0.074 -0.075 0.111 1
(0.429) (0.421) (0.234)
EARNINGREIV0.150 -0.169 -0.018 0.000 1
(0.109) (0.070) (0.851) (0.993)
RISKDISC0.086 0.082 0.041 -0.100 -0.074 1
(0.357) (0.382) (0.660) (0.285) (0.430)
FIRMVALUE-0.027 -0.039 0.888** 0.165 0.001 0.047 1
(0.772) (0.679) (0.000) (0.077) (0.988) (0.615)P-values are given in parentheses. The number of observations is 116. **. Correlation is significant at the0.01 level (1-tailed). *. Correlation is significant at the 0.05 level (1-tailed).
Table 6.28 Summary of the Result of Multiple Regression for Firm Value in Listed banks
Variables t Sig t HypothesisAssets -0.017 -0.372 0.711 H7:RejectedLDR 0.005 0.117 0.907 H8:RejectedROE 0.880 20.071 0.000 H9:AcceptedLeverage 0.068 1.545 0.125 H10:RejectedEarnings Reinvestment 0.022 0.487 0.627 H11:RejectedRisk Disclosure 0.020 0.461 0.645 H12:RejectedAdjusted R square = 0.783F= 70.023 F table(6;115) = 2.18 Fsig = 0.000DW = 1.711
H13:Accepted
Source: adopted from SPSS
The association between the delta of firm value and the delta of firm characteristics
and the delta of risk disclosure in listed banks
One of the most significant findings to emerge from this study is that adjusted R square
for Model 2 is 0.783, as presented in table 6.28. This result means that about 78.3% of
firm value can be explained by firm size (assets), liquidity (LDR), profitability (ROE),

252
leverage, earnings reinvestment, and risk disclosure; while 22.7% might be explained by
other factors. The second major finding was that the multiple regression analysis
revealed that F was 70.023, as shown in table 6.28. This signifies that the aggregate
delta of risk disclosure and the delta of firm characteristics significantly influenced the
delta of firm value, and the delta of profitability was the highest factor.
Listed banks which provide annual reports in order to disclose more of their performance
will boost their firm value. This study is in line with agency theory which theorises that by
revealing risk performance transparently in the annual report and giving good signals to
users, agency conflict between users and managers is minimised, hence increasing firm
value. Therefore, the association between the delta of risk disclosure and the delta of
firm characteristics and the delta of firm value in listed banks is significant and reflected
by the adjusted R square (78.3%) and F (70.023). All in all, the association between the
delta of risk disclosure and the delta of firm characteristics and the delta of firm value in
listed banks was significant, which means that the hypothesis (H13) is accepted.
The value relevance of risk disclosure in listed banks
This study shows that risk disclosure had an insignificant relationship with firm value,
which was reflected by p value 0.582 as presented in table 6.26. Because the association
between risk disclosure and firm value was insignificant, therefore risk disclosure in the
listed banks’ annual reports was not value relevant for users.
Detailed and transparent company information is needed by shareholders who want less
risk in deciding whether to buy shares. By disclosing more detailed and accurate
information, an annual report becomes more fruitful and value relevant for investors.
253
Agency theory asserts that companies which provide more transparent information are
able to minimise information asymmetry between managers and users. However, in this
study, risk disclosure in annual reports in listed banks as a source of information for
making financial decisions did not increase firm value. Therefore the fourteenth
hypothesis (H14) that supposes risk disclosure is value relevant for stakeholders is
rejected. This result supports the findings of Kravet and Muslu (2013), who argued that
risk disclosure is a boilerplate and it is not value relevant for stakeholders. Finally, the
fourteenth hypothesis (H14) that supposes that risk disclosure is value relevant for
stakeholders is rejected.
6.7.3 RQ 4.3 The value relevance of risk disclosure in unlisted banks
The results of the relationship between the delta of firm characteristic and the delta of
risk disclosure and the delta of firm value are demonstrated in tables 6.29 and 6.30.
The association between the delta of firm value and the delta of firm size in unlisted
banks
Table 6.29 shows there was an association between the delta of firm value and the delta
of assets, which had a p significance of 0, and had a positive coefficient. This means
that the delta of firm value in unlisted banks had a significant positive association with
the delta of bank size. This association is strengthened by the results of the regression
in table 6.30, which shows a significant influence of assets on firm value.
This result is in line with Watts and Zimmerman (1983) who attested that in agency
theory, big companies have the financial resources to pay consultants to produce more
254
transparent firm performance reports in order to minimise agency conflicts between
stakeholders and managers, and finally boost firm value. Moreover, McKinnon (1993)
mentioned that companies want to show their capability to prove that firms with high
assets are strong enough to cover their risks; therefore, they send good signals and gain
a good image from stakeholders, hence increasing firm value. This condition is also
shown by the fact that firm value of unlisted banks in this study was measured by Black
Scholes Merton model, whereby the volatility of assets is calculated as equity deducted
by liabilities, and assets were found to be an important factor driving firm value. Because
of this, the seventh hypothesis (H7) that supposes there is a positive association between
the delta of firm value and the delta of firm size is accepted.
The association between the delta of firm value and the delta of liquidity in unlisted
banks
The relationship between the delta of firm value and the delta of liquidity has a p value of
0.004 (table 6.29). It means that individually the delta of liquidity has an association with
the delta of firm value. However, the regression result did not support the association
because table 6.30 shows that the delta of liquidity did not influence unlisted banks in
reporting risk in more detail.
Previous researchers Al-Akra and Ali (2012) support this result because they also found
an insignificant relationship between firm value and liquidity. The result indicates that
whether unlisted banks had either high or low liquidity did not have an effect on increasing
firm value. Moreover, LDR was not relevant for users in consideration of firm value. This
may be because the main function of banks is to be a financial intermediary and money
255
creator, the success of which is measured by how much a bank lends in credits and
creates as money in the liabilities side at the same time, and the condition tested did not
make the firm value increase. Hence, the eighth hypothesis (H8) that supposes there is
a positive association between the delta of firm value and the delta of liquidity is rejected.
The association between the delta of firm value and the delta of profitability in
unlisted banks
The results in table 6.29 demonstrate that the delta of firm value and the delta of
profitability had a statistically insignificant association. The empirical evidence regarding
the influence of the delta of profitability to the delta of firm value is in table 6.30, which
shows an insignificant relationship.
Uyar and Kiliç (2012) mentioned that firm value can be influenced by profitability.
Stakeholders perceive that profit from sales and investment can generate a high
profitability ratio. Rising profits from year to year shows the company's net income
increasing and it indicates that the value of the company rises. Nevertheless, the results
of this study were not in line with previous research. All in all, the result of regression did
not support the ninth hypothesis (H9) and it can be concluded that there is an insignificant
association between the delta of firm value and the delta of profitability in unlisted banks,
hence the ninth hypothesis (H9) is rejected.
The association between the delta of firm value and the delta of leverage in unlisted
banks

256
The relationship between the delta of firm value and the delta of leverage in this study is
shown by p value 0.53 (table 6.29). This demonstrates that the delta of leverage in
unlisted banks did not have an association with the delta of firm value. Table 6.30 also
indicates that the delta of leverage did not affect the delta of firm value in unlisted banks.
Highly leveraged firms with might face higher risk because leverage can be connoted
with a threat of bankruptcy, which can make stakeholders worried. Moreover, the
creditors of such banks also have to deal with a high level of risk, which can lead to
agency problems and finally has a negative effect on firm value. This condition is not
confined to unlisted banks; indeed, banks in general tend to be highly leveraged because
their main sources of funds are from debt, namely from third parties (current account,
saving and time deposit) and second parties (debts from other financial institutions);
hence they find it difficult to raise firm value. Moreover, Hassan et al. (2009); Rajab and
Handley-Schachler (2009) also found that leverage and firm value did not have a
significant relationship. Due to this, the study rejects the tenth hypothesis (H10) that
supposes there is a negative association between the delta of firm value and the delta of
leverage.
The association between the delta of firm value and the delta of earnings
reinvestment in unlisted banks
The relationship between the delta of firm value and the delta of earnings reinvestment
in table 6.29 shows a p value of 0.254, indicating that the delta of earnings reinvestment
did not have a significant association with the delta of firm value. The delta of earnings
reinvestment also did not affect the delta of firm value, as shown in table 6.30.

257
The shareholders’ aim when investing their funds in a company is to earn dividends and
to increase their wealth. Meanwhile, when companies distribute high dividends, it
supposes increasing firm value. Dividend policy is a crucial consideration for companies
when they have to decide whether they will distribute dividends or retain their earnings.
When firms prefer not to distribute dividends it means earnings are retained to add to
their capital or for investing in other profitable business.
The relationship between firm value and earnings reinvestment in tables 6.29 and 6.30
demonstrates that earnings reinvestment did not have a significant association with firm
value. In this study, most unlisted banks during the period of research preferred to retain
their earnings for expanding their business, meaning that shareholders did not consider
earnings reinvestment policy when valuing these firms.
This study is in accordance with Miller and Modigliani (1961) who mentioned that dividend
policy does not have an effect on firm value and cost of capital; however, firm value is
only be determined by the ability of a firm to generate profits and manage business risk.
Due to dividend policy not having an effect on firm value, along with that, earnings
reinvestment also does not affect firm value. Therefore, the eleventh hypothesis (H11)
that supposes there is a positive association between the delta of firm value and the delta
of earnings reinvestment is rejected.
The association between the delta of firm value and the delta of risk disclosure in
unlisted banks
The findings of this research provide evidence of a positive insignificant relationship
between the delta of risk disclosure and the delta of firm value, which is reflected by p

258
value > 0.05, as indicated in table 6.30. It connoted that the delta of risk disclosure did
not affect the delta of firm value. Therefore, the twelfth hypothesis (H12) that supposed
there is a positive association between the delta of risk disclosure and the delta of firm
value is rejected.
Even though the trend of risk disclosure in unlisted banks increased, this did not grow
their firm value. This result is not in line with agency theory, Sheu et.al (2010) and Jensen
and Mecking (1976) who asserted that firms that disclose more will decrease information
asymmetry between managers and users, and finally this increases firm value. This
results may be due to multiple factors that can affect firm value and it is not merely risk-
disclosure variable.
Table 6.29 The Pearson correlation between the delta of firm characteristics, the delta of
risk disclosure and the delta of firm value in unlisted banks.
ASSETS LDR ROE LEVERAGE EARNINGREIV RISKDISC FIRMVALUEASSETS 1
LDR0.277** 1(0.000)
ROE-0.014 0.149* 1
(0.424) (0.019)
LEVERAGE0.211** 0.403** 0.228** 1(0.002) (0.000) (0.001)
EARNINGREIV0.156* 0.216** 0.250** 0.236** 1
(0.015) (0.001) (0.000) (0.000)
RISKDISC0.062 0.127* -0.094 0.210** 0.049 1
(0.193) (0.038) (0.094) (0.002) (0.249)
FIRMVALUE0.486** 0.186** 0.012 0.116 0.048 0.056 1(0.000) (0.004) (0.432) (0.053) (0.254) (0.216)
P-values are given in parentheses. The number of observations is 196. **. Correlation is significant at the0.01 level (1-tailed). *. Correlation is significant at the 0.05 level (1-tailed).
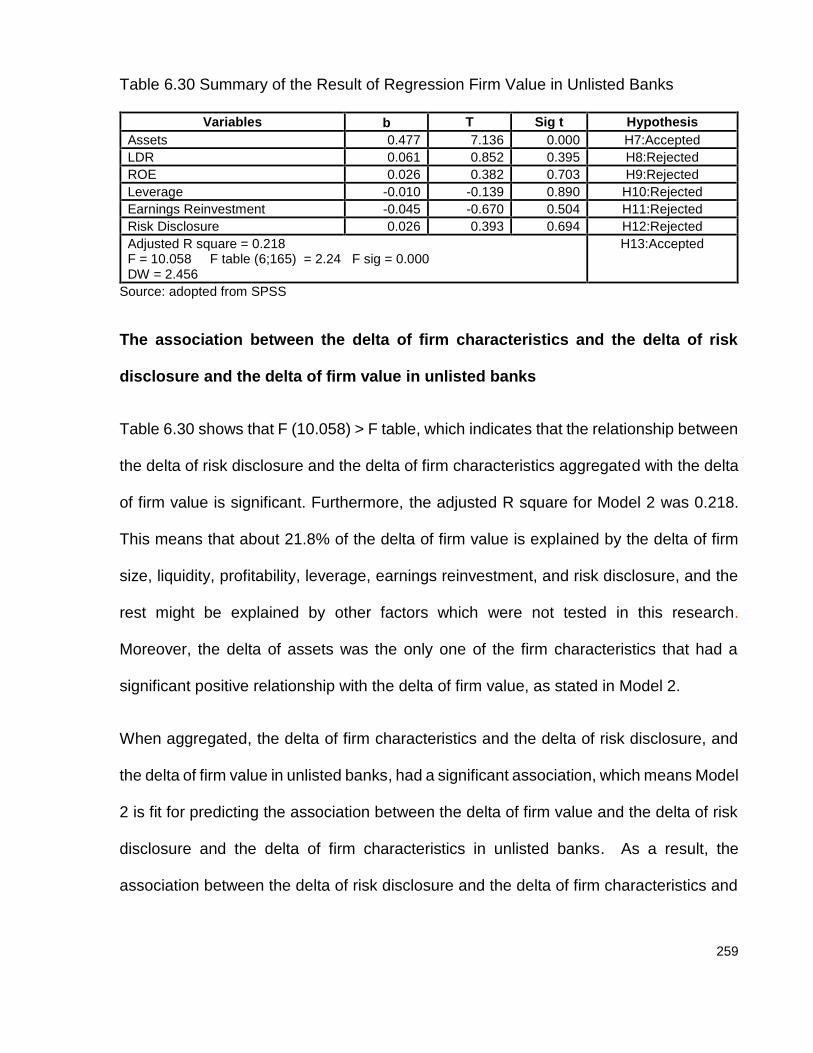
259
Table 6.30 Summary of the Result of Regression Firm Value in Unlisted Banks
Variables T Sig t HypothesisAssets 0.477 7.136 0.000 H7:AcceptedLDR 0.061 0.852 0.395 H8:RejectedROE 0.026 0.382 0.703 H9:RejectedLeverage -0.010 -0.139 0.890 H10:RejectedEarnings Reinvestment -0.045 -0.670 0.504 H11:RejectedRisk Disclosure 0.026 0.393 0.694 H12:RejectedAdjusted R square = 0.218F = 10.058 F table (6;165) = 2.24 F sig = 0.000DW = 2.456
H13:Accepted
Source: adopted from SPSS
The association between the delta of firm characteristics and the delta of risk
disclosure and the delta of firm value in unlisted banks
Table 6.30 shows that F (10.058) > F table, which indicates that the relationship between
the delta of risk disclosure and the delta of firm characteristics aggregated with the delta
of firm value is significant. Furthermore, the adjusted R square for Model 2 was 0.218.
This means that about 21.8% of the delta of firm value is explained by the delta of firm
size, liquidity, profitability, leverage, earnings reinvestment, and risk disclosure, and the
rest might be explained by other factors which were not tested in this research.
Moreover, the delta of assets was the only one of the firm characteristics that had a
significant positive relationship with the delta of firm value, as stated in Model 2.
When aggregated, the delta of firm characteristics and the delta of risk disclosure, and
the delta of firm value in unlisted banks, had a significant association, which means Model
2 is fit for predicting the association between the delta of firm value and the delta of risk
disclosure and the delta of firm characteristics in unlisted banks. As a result, the
association between the delta of risk disclosure and the delta of firm characteristics and
260
the delta of firm value in unlisted banks is significant, which means that the thirteenth
hypothesis (H13) is accepted.
The value relevance of risk disclosure in unlisted banks
This study found that risk disclosure had an insignificant relationship with firm value,
which was reflected by p value 0.188, as presented in table 6.26. Because the
association between risk disclosure and firm value is insignificant, therefore risk
disclosure in the listed banks’ annual reports was not value relevant for users.
This means risk disclosure in unlisted banks’ annual report did not boost firm value and
was not useful to users. Sheu et al. (2010) and Jensen and Meckling (1976) mentioned
that information asymmetry between managers and users can be minimised when the
firms disclose and this increases firm value. By disclosing more detailed and accurate
information, an annual report is considered to be more fruitful and value relevant for
investors. In addition, this result contradicts with Gordon et al. (2010) who mentioned that
in signalling theory, a firm sends signals to stakeholders through annual report is in order
to increase firm value. This means that even when unlisted banks reported their risk more
transparently in their annual reports, it did not significantly enhance firm value. The result
is supported by Wang et al. (2013) who found that more voluntary disclosure did not
boost firm value in China. This is explained by Brounen et al. (2007) who asserted that
unlisted companies still lack transparency and multiple factors that can affect firm value.
Finally, the fourteenth hypothesis (H14) that supposes that risk disclosure is value
relevant for stakeholders is rejected.
261
6.7.4 RQ 4.4 The value relevance of risk disclosure in Islamic banks
As already mentioned above, firm value did not show a normal pattern, so the eleventh
hypothesis was ignored and the delta of firm value was transformed into a Ln.
The relationship between the delta of firm value and the delta of firm size in Islamic
banks
Table 6.31 shows that the association between the delta of firm value and the delta of
bank size had a p value 0.028< 0.05. This means that the delta of firm value had a
significant association with the delta of firm size. The result of regression in table 6.32
supports this evidence with a p value of 0.031.
This result is in accordance with agency theory, which states that large companies have
strong finances which increase firm value. In their research, Uyar and Kiliç (2012) found
that the size of a firm had a significant positive effect on the value of the firm. In addition,
McKinnon (1993) explained that companies with large assets have a financial motivation
to disclose more to show their strength in order to build a good image with stakeholders,
which means large firms communicate good news better than small companies; hence,
this condition helps to boost firm value.
Therefore, the seventh hypothesis (H7) that supposes a positive association between the
delta of firm size and the delta of firm value is accepted.
The association between the delta of firm value and the delta of liquidity in Islamic
banks
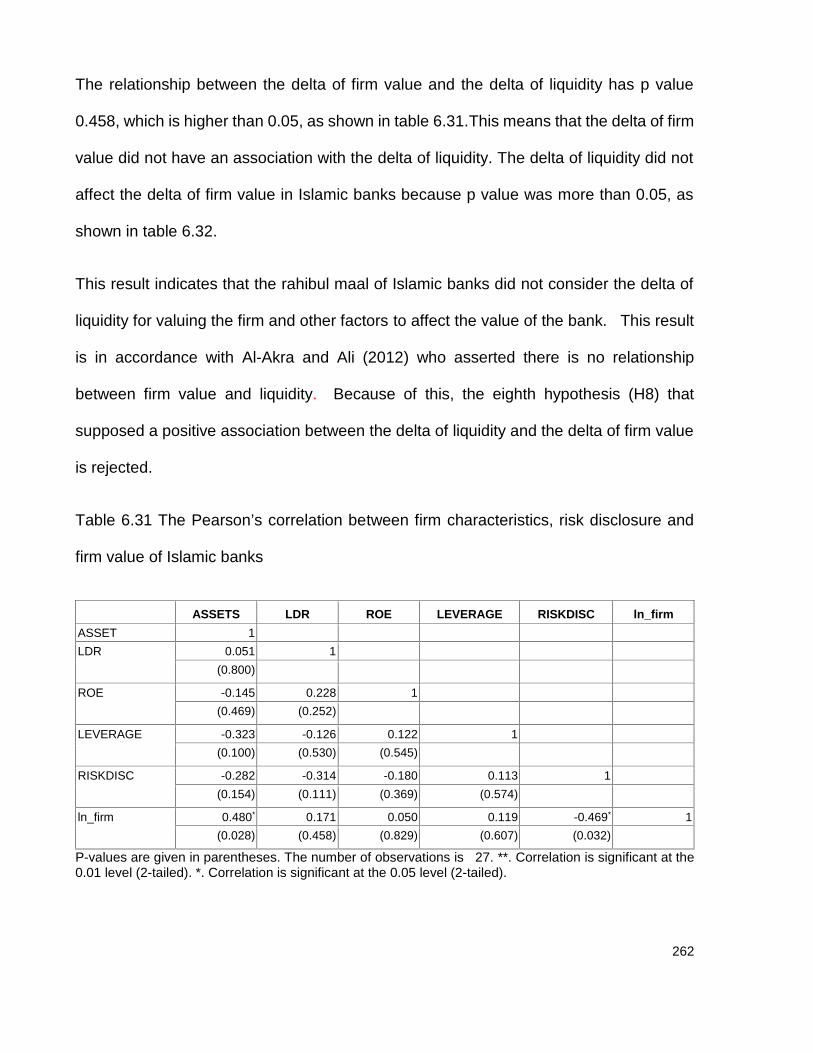
262
The relationship between the delta of firm value and the delta of liquidity has p value
0.458, which is higher than 0.05, as shown in table 6.31.This means that the delta of firm
value did not have an association with the delta of liquidity. The delta of liquidity did not
affect the delta of firm value in Islamic banks because p value was more than 0.05, as
shown in table 6.32.
This result indicates that the rahibul maal of Islamic banks did not consider the delta of
liquidity for valuing the firm and other factors to affect the value of the bank. This result
is in accordance with Al-Akra and Ali (2012) who asserted there is no relationship
between firm value and liquidity. Because of this, the eighth hypothesis (H8) that
supposed a positive association between the delta of liquidity and the delta of firm value
is rejected.
Table 6.31 The Pearson’s correlation between firm characteristics, risk disclosure and
firm value of Islamic banks
ASSETS LDR ROE LEVERAGE RISKDISC ln_firmASSET 1LDR 0.051 1
(0.800)
ROE -0.145 0.228 1(0.469) (0.252)
LEVERAGE -0.323 -0.126 0.122 1(0.100) (0.530) (0.545)
RISKDISC -0.282 -0.314 -0.180 0.113 1(0.154) (0.111) (0.369) (0.574)
ln_firm 0.480* 0.171 0.050 0.119 -0.469* 1(0.028) (0.458) (0.829) (0.607) (0.032)
P-values are given in parentheses. The number of observations is 27. **. Correlation is significant at the0.01 level (2-tailed). *. Correlation is significant at the 0.05 level (2-tailed).
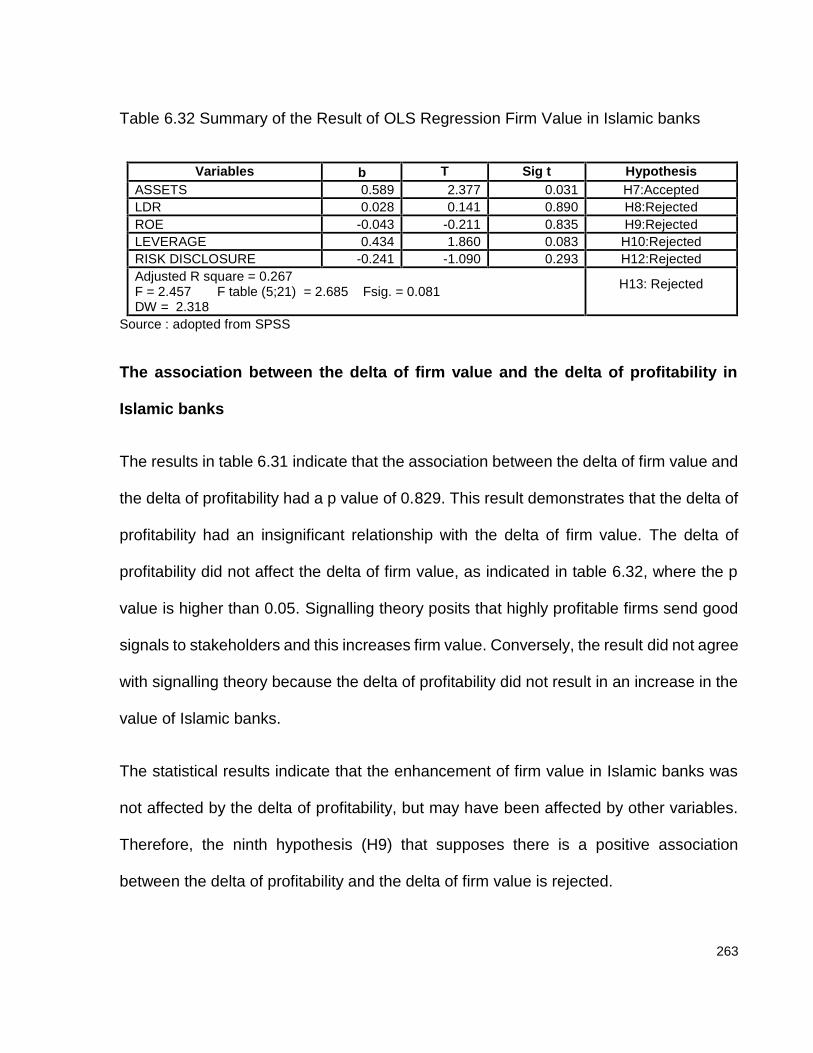
263
Table 6.32 Summary of the Result of OLS Regression Firm Value in Islamic banks
Variables T Sig t HypothesisASSETS 0.589 2.377 0.031 H7:AcceptedLDR 0.028 0.141 0.890 H8:RejectedROE -0.043 -0.211 0.835 H9:RejectedLEVERAGE 0.434 1.860 0.083 H10:RejectedRISK DISCLOSURE -0.241 -1.090 0.293 H12:RejectedAdjusted R square = 0.267F = 2.457 F table (5;21) = 2.685 Fsig. = 0.081DW = 2.318
H13: Rejected
Source : adopted from SPSS
The association between the delta of firm value and the delta of profitability in
Islamic banks
The results in table 6.31 indicate that the association between the delta of firm value and
the delta of profitability had a p value of 0.829. This result demonstrates that the delta of
profitability had an insignificant relationship with the delta of firm value. The delta of
profitability did not affect the delta of firm value, as indicated in table 6.32, where the p
value is higher than 0.05. Signalling theory posits that highly profitable firms send good
signals to stakeholders and this increases firm value. Conversely, the result did not agree
with signalling theory because the delta of profitability did not result in an increase in the
value of Islamic banks.
The statistical results indicate that the enhancement of firm value in Islamic banks was
not affected by the delta of profitability, but may have been affected by other variables.
Therefore, the ninth hypothesis (H9) that supposes there is a positive association
between the delta of profitability and the delta of firm value is rejected.

264
The association between the delta of firm value and the delta of leverage in Islamic
banks
The relationship between the delta of firm value and the delta of leverage in this study is
shown by p value of 0.607> 5%. This result shows that leverage had an insignificant
relationship with firm value in Islamic banks. Moreover, in table 6.32 it can be seen that
leverage did not affect firm value.
This result is supported by Uyar and Kiliç (2012) who attested that leverage did not have
relationship with firm value. Indeed, the relationship between firm value and leverage is
still vague. By contrast, Kouki and Said (2011) explained that high leverage reduces
profits, and as a result shareholders’ wealth declines and this induces a decline in firm
value. Moreover, Korotkikh (n.d.) argued that debt causes financial distress, meaning a
firm cannot pay its debts and this finally decreases firm value. The same researcher also
mentioned that it is difficult to decide whether the relationship between leverage and firm
value is a negative, positive or insignificant relationship because there are many factors
that can act as the mediator in this association, such as corporate governance, manager
behaviour, and taxes. The MM theory mentioned that leverage which increases firm value
due to high debt reduces tax payment and boosts firm value. As a result, the tenth
hypothesis (H10) that supposes there is a negative association between leverage and
firm value is rejected.
The association between the delta of firm value and the delta of risk disclosure in
Islamic banks
265
The finding of this research in table 6.32 shows a negative insignificant relationship
between the delta of risk disclosure and the delta of firm value. The result indicates that
the delta of risk disclosure did not have an association with the delta of firm value.
In order to attract investors, managers’ report their performance in more detail to show
that the company is a good investment. Revealing more detail about their condition can
reduce agency problems and asymmetric information and send good signals to investors,
thereby boosting firm value.
This research found a negative insignificant relationship between the delta of risk
disclosure and the delta of firm value, which is reflected by p sig (0.293) > 0.05, as
indicated in table 6.32. This means that even though Islamic banks disclosed more of
their risk in reports this did not boost firm value. This result is in accordance with (Wang,
2013) who examined the influence of voluntary disclosure on firm value and reported that
an increase in disclosure in annual reports does not lead to the creation of value for a
company. In the population of this study, the result may have been because firms were
reluctant to report more detail because of the weaknesses of disclosure. Returning to
the twelfth hypothesis posed at the beginning of this study, the result is obviously
different. Therefore, the hypothesis (H12) is rejected.
The association between the delta of firm characteristics, the delta of risk
disclosure and the delta of firm value in Islamic banks
Table 6.32 demonstrates that F (2.457) < F table (2.81) and F sig is more than 0.05. This
result means that in aggregate, the delta of firm characteristics and the delta of risk
disclosure did not affect the delta of firm value significantly.

266
Only the delta of assets had a positive relationship with the delta of firm value. The
adjusted R square is 0.267, which implies that 26.7% of firm value is explained by the
delta of firm size, liquidity, profitability, leverage and the delta of risk disclosure. Only the
delta of assets had a positive relationship with the delta of firm value while the delta of
liquidity, profitability, leverage, and risk disclosure did not have an association with firm
value. Therefore, the model 2 was fit more predicting the correlation between the delta
of firm characteristics and the delta of risk disclosure and the delta of firm value.
However, when aggregated, the delta of firm characteristics and the delta of risk
disclosure did not affect the delta of firm value, and the F test is smaller than F table and
insignificant, therefore, the thirteenth hypothesis (H13) is rejected.
The value relevance of risk disclosure in Islamic banks
This study shows that risk disclosure had an insignificant relationship with firm value,
which was reflected by p value 0.676 as presented in table 6.26. This means risk
disclosure in the Islamic banks’ annual reports was not value relevant, because risk
disclosure did not increase firm value. This suggests that risk disclosure was not useful
for rahibulmaal and mudharib, and other users. Islamic banks employ profit and loss
sharing contracts, and in doing so they have to declare their performance transparently,
thereby convincing stakeholders that the banks are acting fairly and abiding by sharia
law. Moreover, particularly in profit and loss sharing arrangements, Islamic banks have
to assure that they share their profit fairly between investors (shahibulmaal) and banks
(mudarib). It can be supposed that Islamic banks will be more transparent in reporting
their risk in order to grow the value of the firm. However, because the association
between risk disclosure and firm value is insignificant this means that risk disclosure in

267
the Islamic banks’ annual reports was not value relevant and useful for rahibulmaal,
mudharib, and other users. To sum up, the fourteenth hypothesis (H14) that supposes
risk disclosure is value relevant for stakeholders is rejected.
This study agree with Al-Akra and Ali (2012) and Hassan et al. (2009) who mentioned
that voluntary disclosure has insignificant with firm value, but this contradicted with Sheu
et al. (2010) and Jensen and Mecking (1976) who asserted that if the company is more
transparent in describing their performance, it can decrease asymmetric information
hence it increases its firm value.
6.7.5 RQ.4.5 The value relevance of risk disclosure in non-Islamic banks
The association between the delta of firm value and the delta of firm characteristics and
the delta of risk disclosure can be explained as follows:
The association between the delta of firm value and the delta of firm size in non-
Islamic bank
Table 6.33 shows that the association between the delta of firm value and the delta of
firm size had a p value of 0.431 and 0.975 in table 6.34, which means that the delta of
firm value had an insignificant association with the delta of firm size. The delta of assets
in non-Islamic banks did not determine firm value. This condition shows that the delta of
firm value of non-Islamic banks was affected by other factors. This result is not in line
with signalling theory, which supposes large firms will deliver good signals to show their
strength and increase firm value (Gordon et al., 2010). Therefore, the seventh hypothesis
268
(H7) that supposes there is a positive association between the delta of firm size and the
delta of firm value is rejected.
The association between the delta of firm value and the delta of liquidity in non-
Islamic banks
The relationship between the delta of firm value and the delta of liquidity had p value
0.387. This means that the delta of firm value did not have an association with the delta
of liquidity. In addition, the delta of liquidity did not affect the delta of firm value, as shown
in table 6.34. The result indicates that the delta of liquidity did not boost firm value; this
may have been because LDR in this study was not a proper variable for supporting firm
value. This ratio reflects liquidity in terms of the banks’ capability to provide money from
reserves to cover creditor withdrawals; nevertheless, the delta of liquidity did not have an
impact on increasing firm value. This finding supports Al-Akra and Ali (2012), who also
found that liquidity has an insignificant correlation with firm value. Therefore, the eighth
hypothesis (H8) that supposes there is a positive association between the delta of
liquidity and the delta of firm value is rejected.
The association between the delta of firm value and the delta of profitability in non-
Islamic banks
The results in table 6.33 show that the association between the delta of firm value and
the delta of profitability has a p value 0. The result indicates that the delta of profitability
had a significant positive association with the delta of firm value. The regression result in
table 6.34 supports the effect of the delta of profitability to firm value.

269
Shareholders perceived that highly profitable banks were able to manage themselves,
hence generate more profit in the future meaning the value of the firm was likely to rise.
In other words, highly profitable non-Islamic banks had a positive perception from users
that made firm value increase. Moreover, Watson et al. (2002) asserted that based on
signalling theory, highly profitable firms deliver good signals to users in order to boost
their firm value. In addition, Uyar and Kiliç (2012) also found that profitability has a
positive association with firm value. Therefore, the ninth hypothesis (H9) that supposes
there is a positive association between the delta of profitability and the delta of firm value
is accepted.
The association between the delta of firm value and the delta of leverage in non-
Islamic banks
The relationship between the delta of firm value and the delta of leverage in this study is
shown by p sig. 0.444> 5% in table 6.34. This result reflects that the delta of leverage
had an insignificant relationship with firm value. This means that the delta of leverage did
not boost the delta of firm value. This result is not in line with agency theory predictions
that leverage has a relationship with firm value, but it is in accordance with Hassan et al.
(2009); Uyar and Kiliç (2012) who found that leverage and firm value did not have a
relationship. It is also in line with MM theory who mentioned that leverage increases firm
value because high debt decreases tax payments and boosts firm value. Due to this, the
tenth hypothesis (H10) that supposes there is a negative association between the delta
of leverage and the delta of firm value is rejected

270
Table 6.33 The Pearson correlation between the delta of firm characteristics, the delta of
risk disclosure and the delta of firm value non-Islamic banks
ASSETS LDR ROE LEVERAGE EARNINGREIV RISKDISC FIRMVALUEASSETS 1LDR 0.054 1
(0.181)ROE -0.005 0.019 1
(0.465) (0.374)LEVERAGE -0.144** 0.295** 0.115* 1
(0.007) (0.000) (0.027)EARNINGREIV 0.071 0.179** 0.044 0.157** 1
(0.118) (0.001) (0.230) (0.004)RISKDISC 0.055 0.148** 0.000 0.083 0.031 1
(0.177) (0.006) (0.498) (0.082) (0.303)FIRMVALUE -0.010 -0.017 0.860** 0.108* -0.002 0.023 1
(0.431) (0.387) (0.000) (0.034) (0.484) (0.352)P-values are given in parentheses. The number of observations is 285. **. Correlation is significant at the0.01 level (1-tailed). *. Correlation is significant at the 0.05 level (1-tailed).
Table 6.34 Summary of Regression between the delta of risk disclosure, the delta of
firm characteristics and the delta of firm value
Variables t sig HypothesisAssets 0.001 0.032 0.975 H7:RejectedLDR -0.038 -1.175 0.241 H8:RejectedROE 0.860 28.121 0.000 H9:AcceptedLeverage 0.025 0.767 0.444 H10:RejectedEarnings Reinvestment -0.038 -1.224 0.222 H11:RejectedRisk Disclosure 0.027 0.877 0.382 H12:RejectedAdjusted R square =0.738F = 134. 522 F table (6;278) = 2.131 Fsig = 0.000DW = 1.681
H13:Accepted
Source: adopted from SPSS
The association between the delta of firm value and the delta of earnings
reinvestment in non-Islamic banks
271
The relationship between the delta of firm value and the delta of earnings reinvestment
in the table 6.33 provides evidence of a p sig. of 0.484, while the p value in table 6.34 is
0.222. This means that the delta of earnings reinvestment did not have an association
with the delta of firm value. In other words, the delta of earnings reinvestment did not
make firm value increase.
Bodie et al. (2011) argued that companies with high earnings reinvestment distribute
small dividends, but in the future investors will receive high dividends, thereby increasing
firm value (figure 4.1). Nevertheless, this research showed that the earnings
reinvestment plans of non-Islamic banks did not enhance firm value. It means that firm
value did not increase merely because of earnings reinvestment plan. Therefore, the
eleventh hypothesis (H11) that supposes there is a positive association between the
delta of earnings reinvestment and the delta of firm value is rejected.
The association between the delta of firm value and the delta of risk disclosure in
non-Islamic banks
The findings of this research provide an insignificant relationship between the delta of
risk disclosure and the delta of firm value, which is reflected by p value > 0.05, as
indicated in table 6.34.
This means that even when non-Islamic banks explained their risk performance more
transparently it did not increase firm value. This result contradicts signalling theory, which
suggests that companies that disclose more risk send good signals for users and that
supports an increase in firm value. However, this research is supported by Al-Akra and

272
Ali (2012); Hassan et al. (2009) who asserted that voluntary disclosure has an
insignificant relationship with firm value.
This result is not in accordance with Sheu et al. (2010) and Jensen and Meckling (1976)
who asserted information asymmetry between managers and users can be minimised by
disclosing firm performance more transparently, and finally this increases firm value. The
insignificant relationship between those variables in non-Islamic banks may be due to
multiple factors that can affect disclosure. Therefore, the twelfth hypothesis (H12) that
supposed there is a positive association between the delta of risk disclosure and the delta
of firm value is rejected.
The association between the delta of firm characteristics and the delta of risk
disclosure and the delta of firm value in non-Islamic banks
Table 6.34 demonstrates that F (134,522) > F table (6.278). This means that the delta of
firm characteristics and the delta of risk disclosure affected the delta of firm value
significantly. This finding is supported by adjusted R square, where the association
between the delta of firm value and the delta of firm characteristics and the delta of risk
disclosure is 0.738, implying that the delta of firm characteristics, namely: firm size;
liquidity; profitability; leverage; earnings reinvestment; and the delta of risk disclosure,
explain approximately 73.8% of the delta of firm value and 26.2% was affected by other
factors that were not tested in this study. This finding means that the firm value of non-
Islamic banks was not affected by only one factor but by aggregates of some variables.
Model 2 was fit for predicting the factors affect the delta of firm characteristics, and the
delta of risk disclosure and the delta of firm value. Finally, the thirteenth hypothesis (H13)

273
that supposes an association between the delta of risk disclosure and the delta of firm
characteristics, and the delta of firm value is accepted.
The value relevance of risk disclosure in non-Islamic banks
This study shows that risk disclosure had an insignificant relationship with firm value,
which was reflected by p value 0.742 as presented in table 6.26. Because the association
between risk disclosure and firm value was insignificant, therefore risk disclosure in the
listed banks’ annual reports was not value relevant to users.
This means that risk disclosure in the non-Islamic banks’ annual report was not value
relevant, it did not increase firm value, and it was not useful for stakeholders. Therefore,
the fourteenth hypothesis (H14) that supposes risk disclosure to be value relevant for
stakeholders must be rejected.
Overall, it can be concluded that the risk information in the annual reports issued by all
banks, listed and unlisted banks, Islamic and non-Islamic banks, did not meet the
stakeholders’ needs and interests. This indicates that the annual reports in the
Indonesian banks still lack information and they are not really transparent.
If agents offer complete information, readers of annual reports can use the information
to make an investment decision and thus the information is value relevant for users and
it will ultimately increase firm value. Instead, because managers have their own interests,
they can sometimes withhold information and fail to convey information more
transparently (nondisclosure). Thereby, the investors cannot obtain the necessary
information that would affect their investment decision.
274
Banks were unwilling to report their condition in more detail because giving information
transparently has several disadvantages. First, by disclosing the company’s information,
it could expose their strategies to the competitors and even decrease their competitive
advantages (Darrough, 1993); Subramanian and Reddy (2012); (Elliott & Jacobson,
1994). In addition, Bhasin (2012) mentioned that even though disclosure in human
resources or risk information is able to minimise asymmetrical information, it puts a
company at risk by exposing its marketing strategies, research and development or
technology in its annual reports.
Second, when they read product development plans in an annual report, competitors are
able to produce similar products or services or counter products; the competitors may
even produce the product better (Elliott & Jacobson, 1994). Third, reporting a company’s
performance completely will increase costs and consequently, this increases product
prices and influences profit and the company’s performance (Elliott & Jacobson, 1994).
Admati and Pfleiderer (2000) mentioned some of the costs that can appear due to
reporting a firm’s performance in more detail, namely the costs of producing,
disseminating, and auditing information.
Fourth, this study’s findings suggest that not only were banks aware of the consequences
of risk disclosure, they also demonstrate that banks in Indonesia still had a low
willingness to explain their performance transparently. This is also supported by
Suhardjanto, Dewi, Rahmawati, and Firazonia (2012) who asserted that even though
there were mandatory regulations to obligate banks to reveal their performance more
transparently, the level of disclosure of banks in Indonesia was still low. Moreover, the
result is strengthened by PricewaterhouseCoopers (2000) who ranked Indonesia the

275
lowest for transparency and disclosure compared with other countries in the Asian
market. Finally, PricewaterhouseCoopers (2008) found that even though banks must
report their performance based on regulations, (such as adopting IFRS, Basel), they still
did not reveal their condition completely. It is therefore understandable that when there
was difficulty in reading and comparing their information, it was not relevant for users.
Moreover, based on research in China by Yuen et al. (2009) the existence of an audit
committee can push managers not to disclose a company’s performance, by suggesting
that managers disclose only enough to fulfil the regulations. In addition, Oxelheim (2008)
argued that the more information is delivered by companies, and the more information
received by users, the higher the possibility that stakeholders will become confused;
therefore, there should be an optimal point to allow firms to decide what is sufficient
information that is value relevant for users, and not detrimental of the firm. By contrast,
Anandarajan et al. (2011) argued that firm disclosure influences value relevance and is
more significant when it is supported by regulations, such as adoption of IFRS (Karğın,
2013), whereby it becomes more valuable to stakeholders.
The relationship between risk disclosure and firm value had spurious result and might
not exist because: first, the exercise was over fitting and out of sample. This might be
more than 31.2% of annual report banks were excluded due to could not being
downloaded, blank, damaged, and were not available. In addition, this research refers to
the use of risk keywords and the previous research’s model, but in a different
environment; therefore it did not work in this study. Presumably they used banks in the
UK as their sample data that was done by Linsley and Shrives (2006); while (Brounen et
al. (2007) had done it in Europa, and banks in US, UEA, Egypt had been done by Hassan
276
et al. (2009), but this study surveyed the Indonesian market, which might have different
conditions.
Second, it is possible managers had different concepts of risk and it does not come up
with focusing of the concept of the risk. From a finance point of view, risk drives the value
of the firm, and the managers recognised the volatility of risk but they demonstrated this
risk to shareholders in ways that were less useful. The managers delivered the risk by
clustering risk keywords and they constructed the risk articulated by risk keywords. The
nature of risk is that investors recognise the outcomes and make judgements based on
history and past evidence. Formal risk is measured by the volatility of value of a firm, and
investors are interested in how risky the firm’s assets are and how this will affect the
volatility of the value of the firm.
A research is based upon the former and the results need to be interpreted accordingly.
Financial accounting does not completely reveal what the value of a firm is and what its
assets are. Managers should seek to describe risk which is measured by the value of the
firm’s underlying assets. While risk keywords come with literature are not apparently
targeting, focusing on the concept or risk that investors really interested in.
Moreover, managers did not actually act in ways that the stakeholders needed and they
did not explain risk in their annual report in more detail, because the managers were
conscious of the consequences of disclosure. In addition, the audit committee can push
the manager not to report their performance fully. This means that communication
between managers and shareholders could be disturbed by noise such as moral hazard,

277
adverse selection or attentiveness. Finally, the fourteenth hypothesis (H14) that
supposes that risk disclosure is value relevant for stakeholders is rejected.
Based on the statistical results, the statistical coefficient correlation between risk
disclosure and firm value was insignificant in all banks, listed, unlisted, Islamic and non-
Islamic banks. This indicates that annual reports were not sending effective signals and
information to investors. Moreover, annual reports might not an effective medium of
communication for explaining risk by banks to stakeholders; therefore, the annual reports
did not meet stakeholders’ interests. This indicates that the risk disclosure in annual
reports was not value relevant for stakeholders and did not affect firm value. The
summary of the hypotheses’ results is represented in table 6.35.
Table 6.35 The resume of hypotheses
Hypotheses All banks Listed Unlisted Islamic Non-IslamicH1 R R R R RH2 R R R R AH3 R R R R RH4 R R A R RH5 R R R NT RH6 R R A R RAdj. R square 0.005 -0.015 0.044 0.047 0.009F 1.289 0.668 2.816 1.323 1.535H7 R R A A RH8 R R R R RH9 A A R R AH10 R R R R RH11 R R R NT RH12 R R R R RH13 A A A R AH14 R R R R RAdj. R square 0.709 0.783 0.218 0.267 0.738F 127.402 70.023 10.058 2.457 134.522
R= rejected A= accepted NT= not tested
278
6.8 Summary
Even though the trend of risk disclosure increased, nevertheless risk information in the
annual reports was not value relevant for stakeholders. The banks were reluctant to
disclose their performance in more detail. This might be because the managers kept the
information, and did not transparently explain firm conditions due to fearing of the
consequences of disclosure. This reflects that communication between banks
(managers) and stakeholders was disturbed by noise, as illustrated in figure 3.3.
The managers did not report transparently due to a variety of reasons. First, reporting
firm performance in more detail increases costs. When costs increase, it influences profit
and finally affects firm performance. Second, competitors can read their strategies and
even produce similar or better quality products or services (Okctabol, 1993). Third, the
audit committee can influence managers not to report in more detail and only to fulfil the
regulations (Yuen et al., 2009). Annual reports did not effectively send signals and
information to stakeholders. This means annual reports were not an effective medium for
communicating risk between banks and stakeholders.
The result of adjusted R square and F demonstrated that the correlation between the
delta of risk disclosure and the delta of firm characteristics and the delta of firm value in
listed banks was stronger than unlisted banks, while the non-Islamic banks had a
stronger association than Islamic banks.
279
CHAPTER 7CONCLUSION
This chapter provides a conclusion of the results to answer the research questions.
Underpinning theories and practical implications will be highlighted, and afterwards the
limitations of this research and suggestions for future research will be presented.
7.1 Conclusion
The purpose of this research is to analyse the association between the determinants and
the value relevance of risk disclosure in the Indonesian banking sector, which is derived
into four research questions. This study was carried out to answer four research
questions, which are explained below:
RQ1: How can the extent of risk disclosure in the Indonesian banking sector be effectively
quantified?
The study has key findings, which include the fact that generally the average number of
Indonesian risk keywords between 2008 and 2012 demonstrated an upward trend, for all
banks and all sectors. The listed banks had the highest average number of risk keywords
in each year studied. Meanwhile, non-Islamic banks had a higher average number of risk
keywords than Islamic banks.
The most obvious finding to emerge from this research was the large gap that fluctuated
between the lowest and the highest number of Indonesian risk keywords, demonstrating
that the content and total number of risk keywords in annual reports had a large variation.
The data strongly suggest that several banks in Indonesia were unwilling to describe the
280
risks they faced in their annual report in more significant detail, for example, some used
fewer than 100 risk keywords.
The number of Indonesian sentences in the annual reports of all banks throughout the
period 2008 to 2012 showed a significant increase, although in 2009 the number of
sentences decreased, but then in 2010 climbed sharply again. The listed banks always
demonstrated the highest number of sentences in every year. Meanwhile non-Islamic
banks always had a higher number of total Indonesian sentences than Islamic banks.
The large gap between the lowest and the highest numbers of risk keywords, sentences
and risk disclosure in every year in all banks demonstrates that banks had many
variations when explaining their performance. Risk disclosure of all banks and each
sector between 2008 and 2012 increased overall but also slightly fluctuated year-to-year.
The trend in the extent of risk disclosure demonstrated went up, even though in 2011 the
extent of risk disclosure declined slightly, it increased again in 2012.
Despite the listed banks having a higher number of risk keywords and number of
sentences than unlisted banks, unlisted banks had a higher risk disclosure than listed
banks. Between 2008 and 2011, Islamic banks had a lower risk disclosure than non-
Islamic banks; nevertheless, in 2012 Islamic banks increased dramatically and recorded
a higher risk disclosure than non-Islamic banks. However, the average risk disclosure of
Islamic banks over the whole study period was still lower than non-Islamic banks.
The average risk disclosure in all banks showed an upward trend. The risk disclosure for
listed banks rose gradually, and even though in 2011 it saw a slight decrease, it went up
sharply in 2012. Those movements signified that listed banks were attempting to report
281
their performance with a greater degree of disclosure, not only because of their
obligations in the regulations of their listing on the stock market, but also in order to attract
investors. Moreover, they had more stakeholders who paid attention to what the banks
had done, their prospects in the future, and their risk profile, and took this into
consideration before making decisions.
The average risk disclosure for the unlisted banks was higher than listed banks and it
went up in the years 2008 to 2010 before falling in 2011; however, after this it increased
again in 2012. This indicates that the unlisted banks were trying to reveal their
performance more transparently. The Islamic banks had a widely fluctuating average risk
disclosure; however, the overall trend was upward. In 2008-2009, the average risk
disclosure for Islamic banks climbed sharply, then increased slightly in 2010, after that
dropped dramatically in 2011, before subsequently climbing sharply again in 2012.
The average risk disclosure of non-Islamic banks increased slightly during 2008 to 2010,
and dropped in 2011; however, the trend was generally upward. Even though the
numbers were always higher than for Islamic banks every single year, in 2012 the extent
of risk disclosure was lower than for Islamic banks. However, the average risk disclosure
for non-Islamic banks from 2008 to 2012 was higher than for Islamic banks.
A final point to note is that the trend of risk disclosure in the Indonesian banking sector
was upward. This means that the banks were trying to report their risk performance more
transparently every single year. In addition, the unlisted banks had a higher average of
risk disclosure than listed banks, while non-Islamic banks had a higher average risk
disclosure than Islamic banks, except in 2012.

282
This condition is in line with signalling and agency theories which mention that
asymmetric information and adverse selection can appear between managers and
stakeholders. This can happen because the managers have more information than
stakeholders (Vitezic, 2011); they have their own commitment and interests, even moral
hazard (Teece, 1996; McAfee and McMillan, 1987), along with that the managers may
have an intention not to report their performance more transparently. Octabol (1993)
asserted that the in a condition of competition, a company may not disclosure to hide the
true condition of their performance. In addition, Mohobbot (2005) and Lajili and Zaghal
(2005) argued that the content and level of reporting of risk in the annual reports has
large variations.
RQ 2: Are there differences between the extent of risk disclosure practice between listed
banks and unlisted banks, and Islamic banks and non-Islamic banks?
The major finding here was based on Levene’s test; the delta of risk disclosure between
listed and unlisted banks was no different, even though the mean of the delta of risk
disclosure in unlisted banks was higher than listed banks. Meanwhile, the delta of firm
value in listed banks was higher than unlisted banks, but Levene’s test showed that the
delta of firm value of listed and unlisted banks was not different.
The mean of the delta of risk disclosure Islamic banks was higher than non-Islamic banks,
but Levene’s test showed that there is no differences between the delta of risk disclosure
in Islamic and non-Islamic banks. In addition, the mean delta of firm value of non-Islamic
banks was higher than Islamic banks, while the delta of firm value in the Islamic and non-
Islamic banks are the same.

283
The results is not in accordance with Cerf (1961) who asserted that listed companies are
required to report their performance more than unlisted companies. It is also contradict
with agency theory which mentioned that in order to minimise asymmetric information
between managers and stakeholders and reduce agency costs, large companies will
explain the information more transparent in the annual report than small companies (Watt
& Zimmerman, 1983; Inchausti, 1977). The results contradicts Wallace et al., (1994)
and Aljifri et al. (2014) who explained that listed companies are expected to disclose
more in reporting their performance than unlisted companies.
The result is not in line with Ariffin (2005); Baydoun and Wullelett (2000) who mentioned
that Islamic banks are required to be transparent compared to conventional banks due
to Islamic banks having more complex transaction and employing PLS.
RQ 3: What factors affect a bank’s decision to disclose risk?
The conclusion in answering the third research question about the factors affecting
banks’ decisions to disclose risks are as follow:
In all banks, the delta of assets, LDR, ROE, leverage, and earnings reinvestment had an
insignificant correlation with the delta of risk disclosure. Firm characteristics did not
explain risk disclosure. When aggregated, the delta of firm size, liquidity, profitability,
leverage and earnings reinvestment were not found to influence the delta of risk
disclosure. Accordingly, Model 1 was not fit for explaining the factors affecting banks’
decisions to report their risks more transparently, and other factors that were not tested
in this study might have been affecting banks in offering more risk disclosure. As a result,
H1, H2, H3, H4, H5, and H6 for all banks were rejected.

284
In the listed banks, the delta of firm size, liquidity, profitability, leverage, and earnings
reinvestment individually did not have an association with the delta of risk disclosure. The
firm characteristics did not affect banks to report risk in more detail. Model 1 was not fit
for explaining factors that influenced the Indonesian listed banks in disclosing more of
their risk in their reports. Finally, H1, H2, H3, H4, H5, and H6 for listed banks were
rejected.
In the unlisted banks, individually the delta of profitability had a significantly negative
association with the delta of risk disclosure. The delta of risk disclosure also had a
positive significant relationship with leverage; nevertheless, it did not have a relationship
with delta assets, liquidity, and earnings reinvestment. The delta of risk disclosure in
unlisted banks could not be explained by delta of firm size, liquidity, profitability, leverage,
or earnings reinvestment. The delta of risk disclosure had a significant association with
the aggregated delta of firm characteristics. Model 1 was fit for predicting the factors
affect the delta of risk disclosure. This study rejected H1, H2, H3, and H5, for unlisted
banks.
The statistical results indicated that none of the delta of the firms’ characteristics
influenced the delta of risk disclosure in Islamic banks. The delta of firm characteristics
did not determine risk disclosure. The delta of firm characteristics did not influence the
delta of risk disclosure. Model 1 was not fit for Islamic banks in predicting factors affecting
banks when reporting risk in their annual report. As a result, H1 to H6 were rejected for
Islamic banks.

285
In the non-Islamic banks, the delta of liquidity had a significant positive relationship with
the delta of risk disclosure, but none of the delta of firm characteristic variables were
significant in affecting the delta of risk disclosure. The delta of risk disclosure could not
be explained by the delta of firm size, liquidity, profitability, leverage, and earnings
reinvestment, but it might by other variables. The delta of firm characteristics did not
affect non-Islamic banks in reporting risks more transparently. As a result, H1, H3, H4,
H5 and H6 were rejected. Model 1 was not fit for non-Islamic banks for predicting factors
affecting non-Islamic banks in the reporting of risk in their annual reports.
The result is not in accordance with agency and signalling theories because almost all
the hypotheses are rejected. Agency theory which mentioned that large companies will
disclose more in their annual report than smaller companies (Watts and Zimmerman,
1983); Inchausti (1997). Marshall and Weetman (2007) attested that based on signalling
theory, firms with high liquidity will disclose more in their reports. Signalling theory
suggested that profitable companies are more transparent in reporting their performance
(Inchausti, 1997). Jensen and Meckling (1976) suggested that highly level leveraged
companies provide information in more detail.
RQ 4: What is the value relevance of risk disclosure in listed banks, unlisted banks,
Islamic banks, and Non-Islamic banks?
For Model 2 in all banks, only the delta of profitability had a significant association with
firm value, while individually the delta of assets, liquidity, leverage, earnings
reinvestment, and the delta of risk disclosure did not influence firm value. The statistical
result showed that by the delta of assets, ROE, leverage, risk disclosure, all of which had

286
a positive sign. The result showed that 70.9% of the delta of firm value is explained by
the delta of size, liquidity, profitability, leverage, earnings reinvestment and the delta of
risk disclosure, while 29.1% was explained by other factors.
The aggregated the delta of firm characteristics and the delta of risk disclosure in all
banks significantly affected the delta of firm value. All banks with an aggregation of high
assets, a low LDR, a high ROE, a high leverage, a small earnings reinvestment and a
high risk disclosure correlated with an increase in firm value, for all kinds of banks. Hence,
H7, H8, H10, H11 H12 were rejected, meanwhile H9 and H13 were accepted. However,
model 2 was fit for testing factors that affected firm value in all banks.
There was a positive relationship between delta of profitability and the delta of firm value;
meanwhile, the delta of assets, liquidity, leverage, earnings reinvestment and risk
disclosure had an insignificant association with firm value in listed banks. The delta of
assets, LDR, ROE, leverage, earnings reinvestment and risk disclosure explained 78.3%
of firm value, and the remaining 21.7% was explained by other variables. The
aggregation of small delta assets, a high delta LDR, ROE, leverage, earnings
reinvestment, and the delta of risk disclosure increased the delta of firm value in the listed
banks. Model 2 was fit for examining firm value of listed banks by factors, namely the
delta of firm size, liquidity, profitability, leverage, earnings reinvestment and risk
disclosure. All in all, H7, H8, H10, H11, and H12 were rejected, while H9 and H13 were
accepted.
Individually, only the delta of assets had a significant positive association with the delta
of firm value. The relationship between the delta of firm characteristics and the delta of

287
risk disclosure, and the delta of firm value in Model 2 for unlisted banks was shown by
an adjusted R square result of 0.218. This indicated that firm size, liquidity, profitability,
leverage, earnings reinvestment and risk disclosure explained about 21.8% of firm value
and that 78.2% might be explained by other factors. The aggregated the delta of firm
value was influenced by delta firm size, liquidity, profitability, negative leverage and
earnings reinvestment, and risk disclosure. Finally, H7 and H13 were accepted,
meanwhile H8, H9, H10, H11 and H12 were rejected for unlisted banks. Model 2 was fit
for examining the association between the delta of firm characteristics and the delta of
risk disclosure with the delta of firm value in the listed banks.
The delta of firm size, liquidity, profitability, leverage and earnings reinvestment and the
delta of risk disclosure determined the delta of firm value. Aggregated, the delta of firm
characteristics and the delta of risk disclosure did not influence the delta of firm value.
Thereby, H8, H9, H10, H12 and H13 were rejected, and only H7 could be accepted for
Islamic banks. Model 2 was fit for examining the association between the delta of firm
characteristics and the delta of risk disclosure and the delta of firm value in the Islamic
banks.
In non-Islamic banks, only the delta of ROE had a significant positive effect on the delta
of firm value, while other variables did not affect the delta of firm value. The delta of firm
characteristics and the delta of risk disclosure, when they were aggregated as the
independent variables, did affect the delta of firm value. The delta of firm value was
determined by the delta of firm characteristics and risk disclosure. Model 2 was fit for
examining the association between the delta of firm characteristics and the delta of risk
288
disclosure and the delta of firm value. The H9 was accepted, but H7, H8, H10, H11 and
H12 were rejected.
The risk disclosure in annual reports for all banks, listed banks, unlisted banks, Islamic
banks, and non-Islamic banks’ annual reports did not have a relationship with firm value.
These results indicate that risk disclosure was not value relevant for users and was
notable for boosting firm value. This means that Indonesian banks were not able to
convey information in terms of the signals related to risk through their annual reports and
financial statements, and those risk reports were not useful for stakeholders. Therefore,
H14 was rejected for all banks, listed banks, unlisted banks, Islamic banks, and non-
Islamic banks.
Companies must maintain good communication with stakeholders by revealing their
performance honesty and transparently. The risk disclosure in the annual reports is not
value relevant, the risk information in annual reports might not be clearly described hence
it is not fruitful for stakeholders and it may not be accepted by users and this does not
increase firm value. Noise could interrupt the communication between banks and
stakeholders such as the manager considering the costs of making reports and being
afraid to expose their strategies (Elliott & Jacobson, 1994) or moral hazard (Arrow, 1971);
hence, stakeholders receive incomplete information that does not meet what they need.
The risk disclosure of annual reports in Indonesian banking sector was not value relevant
for stakeholders, and there is no relationship between risk disclosure and firm value. This
is not in line with agency theory and signalling theories which mention that firm disclosure
is value relevant (Anandarajan et al., 2011; Uyar & Kilic, 2012; Moumen, Othman &
289
Hussainey, 2013). This result contradicts with Al-Akra and Ali (2012) who argued that
voluntary disclosure has a positive association with firm value, nevertheless in line with
Hassan et al. (2009) who asserted that the association between voluntary disclosure and
firm value is positive insignificant. It might happen because first, the exercise was over
fitting and out of sample. Some annual reports could not be downloaded, blank,
damaged, and were not available; hence they were excluded (31.2%). Second, the risk
keyword from prior study which were employed in the UK, US, UEA, or Europe, and were
translated into Indonesian risk keyword might not fit for examining risk disclosure in the
annual report of the Indonesian banking sector. Third, the risk keyword which were
employed in this study based on previous literatures (Kravet and Muslu, 2013);
Elshandidy (2013) which is still need to be interpreted since the risk keyword were not
attract investors. Fourth, the managers might have a different concept of the risk from
investors. Managers send the signal by articulating risk keyword which are not really
drawn the risk as what investors interested in, meanwhile formal risk is measured by the
volatility of the firm’s underlying assets. Fifth, due to considering the consequences of
disclosure such as increase the cost and expose their strategies, hence managers might
not actually act in the shareholders’ interest by reporting their risk performance in more
detail.
7.2 Theoretical Implications
The results suggest some theoretical implications. First, to measure the extent of risk
disclosure, this research utilised a new list of Indonesian risk keywords, which is
significantly different from the methods that were used in previous research, particularly
in Indonesia. When the new method was employed in the banking industry, the results
290
indicated that the extent of risk disclosure in the Indonesia banking sector for all banks,
listed, unlisted, Islamic and non-Islamic banks demonstrated an upward trend. Employing
this new method in different companies or industries could reveal different results and
provide a different interpretation of agency and signalling theories, which will hopefully
enrich disclosure literature.
Second, it is surprising that the extent of risk disclosure was not affected by firm
characteristics, namely: firm size (total assets), liquidity (LDR), profitability (ROE),
leverage (debts/total assets), and earnings reinvestment ((EPS-DPS)/EPS). In other
words, Model 1 was not a fit model for predicting the factors which affect a bank’s
decision to disclose risk. The results therefore were not able to support the results of
previous research and contradict agency and signalling theories. The results of this study
show that there are other opportunities to expand the current models that can improve
the interpretation of the correlation between firm characteristics and risk disclosure, and
augment the disclosure literature.
Third, an aggregation of firm characteristics and risk disclosure significantly affected firm
value. Hence, Model 2 was a fit model for predicting the effect of the delta of firm
characteristics and the delta of risk disclosure on the delta of firm value. The results
showed that there are other opportunities to expand the current models that can improve
the interpretation of the correlation between firm characteristics, risk disclosure and firm
value, particularly for Islamic and unlisted firms.
Fourth, this is the first study that has employed earnings reinvestment as a variable for
predicting the factors that affect a bank’s decision to disclose risk. Even though the
291
results showed an insignificant correlation between risk disclosure and firm value, the
results could add to knowledge about dividend theory, in particular Miller and Modigliani
(1961) and the Clientele Effect theories. It also enriches capital market theory because
the formula of earnings reinvestment employs EPS and DPS, which are related to share
prices and dividends in either listed or unlisted banks, and this has not been explored by
previous research.
Fifth, the major implication for theory from this research is the need to utilise a new
method (the Black Scholes Merton model) for measuring the firm value of unlisted banks.
The application of this method requires some assumptions to be made, and requires data
related to market capitalisation and the share price of listed banks. The application of this
method has the potential to enrich capital market theory and valuation option pricing
theory.
Sixth, the annual reports produced by banks in Indonesia were not found to be value
relevant for stakeholders. Banks did not communicate well with their stakeholders
because they were not able to convey signals and risk information in accordance with
the stakeholders’ needs. These results have theoretical implications for enhancing
signalling theory, stakeholder theory and communication theory.
7.3 Practical Implications
This research suggests some practical implications as follows:
First, this is the first study in which Indonesian risk keywords have been used to explore
the extent of risk disclosure in the Indonesia banking sector. This method represents the
development of a new measurement of risk disclosure.
292
Second, the total number of sentences in the annual reports varied and there was a large
gap between the highest and the lowest. Moreover, the annual reports were not value
relevant for stakeholders. For these reasons, the regulators and banks’ managers should
pay more attention to increasing the usefulness of disclosure for stakeholders, the
completeness of their risk information, and on how to deliver signals and information
more understandably and readably for stakeholders.
Third, this is the first study that has revealed a new method for measuring firm value in
unlisted banks by employing the Black Scholes Merton model. This new method
represents a significant practical implication for financial management knowledge, and
valuation option pricing. The method also makes unlisted banks potentially more
attractive to investors.
Fourth, earnings reinvestment is a new variable that has been employed for the first time
in this study to test its relationship with risk disclosure and firm value, and the factors that
affect a bank’s decision to disclose risk. Even though the results showed that earnings
reinvestment did not significantly affect risk disclosure and firm value, but it should be
considered by managers and shareholders in valuing the firm when the company decides
to reinvest earnings.
Fifth, for regulators this study provides some insights related to risk disclosure. Up until
now, regulators have not yet monitored the depth of disclosure in terms of banks’
performance. It is better to ensure that banks have disclosed their performance in their
annual reports, since the results indicate that risk disclosure in the annual reports was
also not affected by firm characteristics.

293
Sixth, risk disclosure in the Indonesia banking sector varied but the trend tended to be
towards greater transparency. It is recommended that regulators enhance the regulations
in order to push banks voluntarily and transparently to reveal their performance.
Moreover, the regulators also need to consider the disclosure levels within the annual
reports for other industries with regard to the levels of disclosure that are needed by
stakeholders.
The results suggest that banks varied in the extent to which they reported their
performance. Some banks used many sentences while some banks reported their
performance in just a few sentences. This indicates that banks had a different style in
expressing their performance in their annual reports. Stakeholders really need to
understand this point and read annual reports critically, filtering the useful information
from the whole information in an annual report in order to minimise risk before making
financial decisions.
7.4 Limitations
Because Indonesian risk keywords, earnings reinvestment and measurement of firm
value for unlisted banks were used for the first time by the researcher, this research has
some limitations, as follow:
First, in translating the risk keywords into Indonesian, some risk keywords have similar
meanings or the same meanings, for example: “significant” can be translated as
“signifikan” or “penting” or “berarti” or “bermakna”; while “can” has some meanings similar
to “bisa” or “dapat” or “mampu”. Even though those keywords have been tested by
294
validity and reliability in this study, it would be better if they were retested by a different
validity and reliability test if they will be used for other sectors.
Second, because no researcher has used earnings reinvestment before, there are very
limited sources and literature about it; hence, this research has limitations in terms of the
explanations related to the association between earnings reinvestment and other
variables.
Third, there is very little research that has developed a measurement for calculating firm
value for unlisted banks before this study. This study utilised Black Scholes Merton
models for approaching firm value measurement with long methods and some
assumptions. First, risk free risk (r) is calculated using a proxy of JIBOR (Jakarta
Interbank Offer Rate). Second, there is a case for using the volatility of listed banks’
assets for calculating the estimated asset volatility for unlisted banks, whereby the listed
banks should be grouped related to core capital, namely: Commercial Bank Business
Group (Bank Umum Kelompok Usaha =BUKU), as mentioned in the Bank of Indonesia
regulation number 14/26/PBI/2012. Third, for measuring the time to exercise (days), this
model employs an estimate of the average term to maturity of a bank’s liabilities, which
requires judgment in deciding the maturity of liabilities. Some assumptions were adapted
in this method, which means there is a possibility that the result is far from the real
condition. Therefore, this method could be tested in future research that will be suggested
in the next part of this chapter.
Fourth, in the analysis of the differences between Islamic banks and non-Islamic banks,
there was a wide gap between these the size of these two populations. There were only
295
eleven Islamic banks, which must be compared with 109 non-Islamic banks, and the total
data set of the Islamic banks was only 27 pieces of data; this could make for a weak
statistical result.
7.5 Suggestions for Future Research
This study demonstrated a new measurement of firm value for unlisted banks; no
previous researcher has calculated this measurement and this is the first study that has
applied this method; hence, in future research there is a good opportunity to employ this
method for other unlisted firms.
This research tested the relationship between risk disclosure, firm value and earnings
reinvestment, which no researcher has tested before. As a result, this topic offers a real
opportunity for future researchers to explore more about risk disclosure, earnings
reinvestment, and firm value in other industries.
For measuring risk disclosure, this study employed QSRN6 to count keywords in
sentences in annual reports, published in an Indonesian language version. Because this
is the first research using these keywords, in the future scholars could employ them for
other firms’ annual reports, or even find other new risk keywords.
In order to ensure that risk disclosure in the annual reports has value relevance for users,
future researchers should try to collect data through interviews with stakeholders such
as investors, shareholders, financial analysts, depositors, debtors, regulators, and bank
supervisors.
296
The study found no association between risk disclosure and firm characteristics, as
indicated by the fact that the adjusted R square was very small for Model 1 in each group.
This condition could be driven by other factors which are not tested in this study such as:
national regulations (Dobler (2008); Elshandidy et al. (2011); mandated requirements
(Bamber and McMeeking, 2010); stock market regulations (Rajab and Handley-
Schachler (2009); corporate governance (Black, Jang, and Kim, 2006);
KaraİBrahİMoĞLu (2013). These regulations could push companies to disclosure more
of their firm’s performance. This result offers a potentially fruitful area for future
researchers to examine the effect of regulations on risk disclosure.
This study employs LDR for a proxy liquidity ratio as the independent variable, for the
next research it is suggested to employ “Giro Wajib Minimum (GWM)” or reserve
requirement (RR), which is a mandated requirement of the Bank of Indonesia. This ratio
is mandated in order to ensure that banks have a reserve to cover short term debt
withdrawals and also as part of the BI’s role in prudential macro management.
All firms deal with risk; nevertheless, companies with sharia principles have a different
set of risk, dependent on shariah law. Very few researchers have examined the
relationship between risk disclosure and shariah law. It will be an important challenge for
future researchers to measure risks for banks operating within Islamic law and use this
as a variable on the relationship with disclosure.
For future research it is suggested that the study’s questions be examined with more
data and over more years for Islamic banks.
297
REFERENCES
Abraham, S., & Cox, P. (2007). Analysing the determinants of narrative risk informationin UK FTSE 100 annual reports. The British Accounting Review, 39(3), 227-248.
Abraham, S., Marstona, & Slack, T. (2014). Annual Report Business Risk FactorStatements: Views of UK Institutional Investors. School of Management andLanguages, Heriot Watt University, Edinburgh, United Kingdom.
Aburaya, R. (2012). The Relationship Between Corporate Governance AndEnvironmental Disclosure: UK Evidence. Durham University.
Acharya, V. V., Richardson, M., Philipon, T., & Roubini, N. (2009). Restoring FinancialStability: How to repair a Failed System. New Jersey: John Wiley & Sons.
Admati, A. R., & Pfleiderer, P. (2000). Forcing firms to talk: financial disclosure regulationand externalities. The Review of Financial Studies, Vol. 13 No. 3, 479-519.
Agostino, M., Drago, D., & Silipo, D. B. (2011). The value relevance of IFRS in theEuropean banking industry. Review of Quantitative Finance and Accounting,36(3), 437-457. doi: 10.1007/s11156-010-0170-710.2139/ssrn.314001
Agyei-Mensah, B. K. (2012). Association between firm-specific characteristics and levelsof disclosure of financial information of rural banks in the Ashanti region of GhanaJournal of Applied Finance & Banking, vol.2, no.1, 69-92.
Akerlof, G. A. (1970). The market for" lemons": Quality uncertainty and the marketmechanism. The quarterly journal of economics, 488-500.
Akhtaruddin, M., Hossain, M. A., Hossain, M., & Yao, L. (2009). Corporate governanceand voluntary disclosure in corporate annual reports of Malaysian listed firms.Journal of Applied Management Accounting Research, 7(1), 1-19.
Al-Akra, M., & Ali, M. J. (2012). The value relevance of corporate voluntary disclosure inthe Middle-East: The case of Jordan. Journal of Accounting and Public Policy,31(5), 533-549. doi: http://dx.doi.org/10.1016/j.jaccpubpol.2011.10.007
Al-Baluchi, A. E. A. (2006). The Impact of AAOIFI Standards and Other BankCharacteristics on the Level of Voluntary Disclosure in the Annual Reports ofIslamic Banks (PhD), University of Surrey.
Al-janadi, Y., Rahman, R. A., & Omar, N. H. (2012). The level of voluntary disclosurepractices among public listed companies in Saudi Arabia and the UAE: Using amodified voluntary disclosure index. International Journal of Disclosure andGovernance, 9(2), 181-201. doi: http://dx.doi.org/10.1057/jdg.2011.19
Aljifri, K. (2008). Annual report disclosure in a developing country: The case of the UAE.Advances in Accounting, 24(1), 93-100. doi:http://dx.doi.org/10.1016/j.adiac.2008.05.001
Aljifri, K., Alzarouni, A., Ng, C., & Tahir, M. I. (2014). The Association between FirmCharacteristics and Corporate Financial Disclosures: Evidence from UAECompanies. International Journal of Business & Finance Research (IJBFR), 8(3),101-123.
Aljifri, K., & Hussainey, K. (2007). The determinants of forward-looking information inannual reports of UAE companies. Managerial Auditing Journal, 22(9), 881-894.
Amran, A., Bin, A. M. R., & Hassan, B. C. H. M. (2009). Risk Reporting: An ExploratoryStudy on Risk Management Disclosure in Malaysian Annual Report. ManagerialAuditing Journal, Vol. 24, No. 1, 39-57.

298
Anandarajan, A., Francis, B., Hasan, I., & John, K. (2011). Value relevance of banks:global evidence. Review of Quantitative Finance and Accounting, 36(1), 33-55.
Andres, P. d., Azofra, V., & Lopez, F. (2005). Corporate Boards in OECD Countries: size,composition, functioning and effectiveness. Corporate Governance: AnInternational Review, Volume 13 Number 2, 197-210.
Antonio, M. S. i. (2001). Bank syariah:dari teori ke praktek. Jakarta: Gema Insani.Ariffin, N. M. (2005). Enhancing Transparency and Risk Reporting in Islamic Banks.
(PhD), University of Surrey.Arrow, K. (1971). Essays in the theory of risk- bearing. Chicago: Markham.Aryani, D. N. (2015). Determinants of Risk Reporting in Indonesian Listed Banks. Paper
presented at the Postgraduate Research Student Conference University ofGloucestershire, UK.
Ascarya. (2006). Akad dan Produk Bank Syariah: Konsep dan Praktek di BeberapaNegara: Bank Indonesia.
Asutay, M. (2008). PhD-Research Support Workshop Programme: ResearchMethodology. Lecture Paper, School of Government and International Affairs.Durham University. England.
Babaei, Z., Shahveisi, F., & Jamshidinavid, B. (2013). Correlation between FinancialLeverage and Firm Value in Companies Listed in the Tehran Stock Exchange: ACase Study Research Journal of Finance and Accounting, Vol.4 No.5.
Bagnoli, M., & Watts, S. G. (2005). Financial reporting and Voluntary disclosures. .Purdue University.
Bailey, W., Karolyi, G. A., & Salvac, C. (2005). The economic consequences of increaseddisclosure: evidence from international cross-listings. . Journal of FinancialEconomics,, 81(1), 175-213.
Bakar, M. A. (2010). Broad Distinction between Islamic and Conventional Banking. Paperpresented at the Seminar on Islamic Finance, Malaysia.
Baker, H. K., & Powell, G. E. (2012). Dividend policy in Indonesia: survey evidence fromexecutives. Journal of Asia Business Studies, 6(1), 79-92.
Bamber, M., & McMeeking, K. (2010). An examination of voluntary financial instrumentsdisclosures in excess of mandatory requirements by UK FTSE 100 non-financialfirms. Journal of Applied Accounting Research in Accounting Regulation, Vol. 11No. 2, pp. 133-153.
Bamber, M., & McMeeking, K. (2012). The quantity and quality of reporting financialinstruments under International Financial Reporting Standard 7 FinancialInstruments: Disclosure.
Bank, B. o. P. a. F. A. D. D. N. (2004). Direct Investment - Reinvested Earnings (Vol.Issue paper 18): IMF Committee On Balance Of Payments Statistics Balance OfPayments Technical Expert Group, Bopteg
Barakat, A., Chernobai, A., & Wahrenburg, M. (2014). Information asymmetry aroundoperational risk announcements. Journal of Banking & Finance, 48, 152–179.
Barako, D. G., Hancock, P., & Izan, H. (2007). Determinants of voluntary disclosures inKenyan companies annual reports. African Journal of Business Management,1(5), 113-128.
Barth, M. E., Beaver, W. H., & Landsman, W. R. (2001). The Relevance of the ValueRelevance Literature For Financial Accounting Standard Setting: Another View.Rochester, Rochester.
299
Baydoun, N., & Willetts, R. (2000). Islamic Corporate Report. Abacus, 36/1, 1.BCBS. (1998). Enhancing Bank Transparency Public: disclosure and supervisory
information that promote safety and soundness in banking systems. . Basle.Beck, T., Demirgüç-Kunt, A., & Merrouche, O. (2010). Islamic vs. Conventional Banking
Business Model, Efficiency and Stability (Vol. 5446): The World BankDevelopment Research Group Finance and Private Sector Development Team.
Beisland, L. A. (2009). A Review of the Value Relevance Literature. The Open BusinessJournal, 2, 7-27.
Beretta, S., & Bozzolan, S. (2004). A framework for the analysis of firm riskcommunication. The International Journal of Accounting, 39(3), 265-288.
Berle, A. A., & Means, G. C. (1932). The Modern Corporation & Private PropertyRetrieved from http://www.unz.org/Pub/BerleAdolf-1932-00010?View=PDF
Bessis., R. M. i. B. W., Chichester. (2002). Risk Management in Banking. Chichester:Wiley.
Bhasin, M. (2012). 'Voluntary' Corporate Governance Disclosures Made in the AnnualReports: An Empirical Study. International Journal of Management andInnovation, 4(1), 46-67.
BIS. (2003). Consultative Document The New Basel Capital Accord.BIS. (2006). Enhancing corporate governance for banking organisations. Switzerland.BIS. (2010). Principles for enhancing corporate governance Switzerland.Black, B., Jang, H., & Kim, W. (2006). Does Corporate Governance Predict Firms' Market
Values? Evidence from Korea. Journal of Law, Economics & Organization, 22,366-413.
Black, F. (1976). The pricing of commodity contracts. Journal of Financial Economics,3(1), 167-179.
Bodie, Z., Kane, A., & Markus, A. J. (2011). Investment (9 ed.). New York: McGraw-Hill.Bokpin, G. A. (2013). Determinants and value relevance of corporate disclosure :
Evidence from the emerging capital market of Ghana. Journal of AppliedAccounting Research in Accounting Regulation, Vol. 14 No. 2.
Botosan, C. (1997). Disclosure level and cost of capital. Accounting Review, 72 (3).Brooks, R., & Yan, D. Y. (1999). London Inter–Bank Offer Rate (LIBOR) versus Treasury
Rate. The Journal of Fixed Income, Vol. 9, No. 1, 71-83.Brounen, D., Hans Op 't, V., & Raitio, V. (2007). Transparency in the European Non-
listed Real Estate Funds Market. Journal of Real Estate Portfolio Management,13(2), 107-117.
Buser, S. A., & Hess, P. J. (1986). Empirical determinants of the relative yields on taxableand tax-exempt securities. Journal of Financial Economics, 17(2), 335-355.
Capasso, A., Rossi, M., & Simonetti, B. (2005). Ownership Structure Heterogeneity andPerformance: A Comparison between Listed and Unisted Companies.
Cartwright, P. (2006). Risks and returns of prior approval by licensing: The case ofbanking. Journal of Banking Regulation, 7(3/4), 298-309.
Caruana, J. (2011). Financial stability and risk disclosure Paper presented at the FSBRoundtable on risk disclosure, Basel.
Cerf, A. R. (1961). Corporate reporting and investment decisions: Public AccountingResearch Program, Institute of Business and Economic Research, University ofCalifornia.
300
Chakroun, R., & Hussainey, K. (2013). Disclosure Quality in Tunisian Annual Reports. .Paper presented at the Paper presented at the Critical Studies in Accounting,Economics and Finance (CSAF) Conference, Abu Dhabi, UAE.
Chen, C. X., Lu, H., & Sougiannis, T. (2012). The Agency Problem, CorporateGovernance, and the Asymmetrical Behavior of Selling, General, andAdministrative Costs*. Contemporary Accounting Research, Vol. 29 No. 1, 252-282. doi: 10.1111/j.1911-3846.2011.01094.x
Chong, B. S., & Liu, M.-H. (2009). Islamic banking: Interest-free or interest-based?Pacific-Basin Finance Journal, 17(1), 125-144.
Chung, K. H., & Pruitt, S. W. (1994). A simple approximation of Tobin's q. FinancialManagement, 23(3), 70-70.
Churchill, G. A. (2010). Basic Marketing Research (7th ed.): South-Western PublishingCo.
Collins, D. a. K., S.P (1989). An Analysis of the Intertemporal and Cross-SectionalDeterminants of the Earnings Response Coefficients. Journal of Accounting andEconomics, 11, 143-181.
Connelly, B. L., Certo, S. T., Ireland, R. D., & Reutzel, C. R. (2011). Signaling Theory: AReview and Assessment. Journal of Management, 37(1), 39-67.
Craswell, A. T., & Taylor, S. L. (1992). Discretionary Disclosure Of Reserves By Oil AndGas Companies: An Economic Analysis. Journal of Business Finance &Accounting, 19(2), 295-308. doi: 10.1111/j.1468-5957.1992.tb00626.x
Creswell, J. W. (2014). Research design: Qualitative, Quantitative, and Mixed MethodsApproach (4 ed.). London, UK: SAGE Publications, Inc.
Crotty, M. (1998). The Foundations of Social Research London: SageDarrough, M. N. (1993). Disclosure policy and competition: Cournot vs. Bertrand. The
Accounting Review, 68(3), 534.Demirguc-Kunt, & Maksimovic, V. (1999). Institutions, Financial Markets And Firm Debt
Maturity. Journal of Financial Economics, 54, 295-336.Deumes, R. (2008). A Content Analysis of Narrative Risk. Journal of Business
Communication, Volume 45, Number 2, 120-157.Diamond, D., & Verrecchia, R. (1991). Disclosure, Liquidity, and the Cost of Capital. The
Journal of Finance, 46 (4), 1325-1359.Dobler, M. (2008). Incentives for risk reporting - A discretionary disclosure and cheap talk
approach. The International Journal of Accounting, 43(2), 184.Dobler, M., Lajili, K., & Zéghal, D. (2011). Attributes of Corporate Risk Disclosure: An
International Investigation in the Manufacturing Sector. Journal of InternationalAccounting Research, 10(2), 1-22.
Dragomir, & Cristina, M. (2009). Corporate Governance in the European Union: TheImplications for Financial and Narrative Reporting,. International Journal ofBusiness and Economics, Vol. 9, No. 1, 53-64.
Dye, R. A. (1985). Strategic accounting choice and the effects of alternative financialreporting requirements. Journal of Accounting Research, 23(2), 544-574.
Eccles, R., Herz, R., Keegan, E. and Phillips, D. (2001). The Value Reporting Revolution:Moving Beyond the Earnings Game, . New York, NY: John Wiley & Sons.
Eisenhardt, K. M. (1989). Agency theory: An assessment and review. Academy ofmanagement review, 14(1), 57-74.

301
El-Gamal, M. A. (2000). A Basic Guide to Contemporary Islamic Banking and FinanceRetrieved from http://www.lariba.com/dev/knowledge-center/islamic-banking-guide.pdf
Elliott, R. K., & Jacobson, P. D. (1994). Costs and benefits of business informationdisclosure. Accounting Horizons, 8(4), 80.
Elshandidy, T., Fraser, I., & Hussainey, K. (2011). Aggregated, voluntary, and mandatoryrisk disclosure incentives: evidence from UK FTSE all share. workingpaper(Stirling University ).
Elshandidy, T., Fraser, I., & Hussainey, K. (2013). Aggregated, voluntary, and mandatoryrisk disclosure incentives: Evidence from UK FTSE all-share companies.International Review of Financial Analysis, 30(0), 320-333.
Elzahar, H., & Hussainey, K. (2012). Determinants of narrative risk disclosures in UKinterim reports. The Journal of Risk Finance, 13(2), 133-147.
Espinosa, M., Tapia, M., & Trombetta, M. (2005). Disclosure and liquidity. Nº.: UC3MWorking Papers. Bussiness Economics 2005-02.
Estrada, F. (2011). Thomas S. Schelling: Game theory and indirect communicationFacultad de Finanzas: MPRA (Munich Personal RePEc Archive) (Vol. MPRAPaper No. 34988, posted 25): Universidad Externado de Colombia.
Evans, J. P., & Gentry, J. A. (2003). Using Tobin's Q Ratio to Assess the Strategy ofRepuchasing Shares. Finance India, XVII(1), 149-163.
Fama, E. F. (1980). Agency Problems and the Theory of the Firm. The Journal of PoliticalEconomy, 88(2), 288-307.
Fama, E. F., & Jensen, M. C. (1983). Separation of ownership and control. Journal ofLaw and Economics, 26(2), 301-325.
Fathi, J. (2013). Corporate Governance and the Level of Financial Disclosure by TunisianFirm.
Faure, A. (2013). Banking: an introduction (1st ed.): Quoin Institute (Pty) Limited &bookboon.com.
Fiechter, P., & Zhou, J. (2013). The Impact of the Greek Sovereign Debt Crisis onEuropean Banks’ Disclosure and its Economic Consequen. Paper presented atthe Illinois International Journal of Accounting Symposium, China.
Filip, A., & Raffournier, B. (2010). The value relevance of earnings in a transitioneconomy: The case of Romania. The International Journal of Accounting, 45(1),77-103.
Francis, J., LaFond, R., Olsson, P. M., & Schipper, K. (2004). Costs of Equity andEarnings Attributes. The Accounting Review, Vol. 79. No. 4, 967-1010.
Freeman, E. (2010). Strategic Management: A Stakeholder Approach Retrieved fromhttp://books.google.co.uk/books?hl=en&lr=&id=NpmA_qEiOpkC&oi=fnd&pg=PR5&ots=6-cnH1L5TK&sig=5b1qisnHbD4eSIg_PPwSJXokGyI#v=onepage&q&f=false
Freeman, R. E. (2004). The Stakeholder Approach Revisited zfwu, 5 (3), 228-241Frolov, M. (2007). Why do We Need Mandated Rules of Public Disclosure for Banks ? .
Journal of Banking Regulation, 8.2, 177-191.Ghauri, P., & Gronhaug, K. (2005). Research Methods in Business Studies: A Practical
Guide (3rd ed.): Prentice Hall.Gordon, L. A., Loeb, M. P., & Sohail, T. (2010). Market Value Of Voluntary Disclosures
Concerning Information Security. MIS Quarterly, 34(3), 567.
302
Gow-Liang, H., Hsiu-Chen, C., & Chang-Hsi, Y. (2006). A Comprehensive Study onInformation Asymmetry Phenomenon of Agency Relationship in the BankingIndustry. Journal of American Academy of Business, Cambridge, 8(2), 91-97. doi:10.2307/1879431. JSTOR1879431.
Gray, P. S. e. a. (2007). The Research Imagination: An Introduction to Qualitative andQuantitative Methods. Cambridge: Cambridge University Press.
Gray, R., Owen, D., & Adams, C. (1996). Accounting and Accountability: Changes AndChallenges In Corporate and Social Reporting. London: Prentice-Hall.Europe.
Greco, G. (2011). The management’s reaction to new mandatory risk disclosure: Alongitudinal study on Italian listed companies. Corporate Communications:AnInternational Journal, Vol. 17 No. 2, 2012, pp. 113-137.
Gruning, M. (2011). Artificial intellegence measurement of disclosure (AIMD). EuropeanAccounting Review, 20(3), 485-519.
Guilford, J. P., & Fruchte, B. (1978). Fundamental Statistics in Psychology and Education(6 th ed.). New York: McGraw Hill.
Gujarati, D. N., & Porter, D. C. (2009). Basic Econometrics (5th ed.). Singapore: McGraw-Hill.
Hameeda Abu, H., & Al-Ajmi, J. (2012). Risk management practices of conventional andIslamic banks in Bahrain. The Journal of Risk Finance, 13(3), 215-239.
Haniffa, R. M., & Cooke, T. E. (2005). The impact of culture and governance on corporatesocial reporting. Journal of Accounting and Public Policy, 24(5), 391-430.
Hasan, Z. (2011). Money creation and control from Islamic perspective Munich PersonalRePEc Archive (MPRA) Paper No. 28366. NCEIF The Global University of IslamicFinance.
Hassan, Romilly, P., Giorgioni, G., & Power, D. (2009). The value relevance of disclosure:Evidence from the emerging capital market of Egypt. The International Journal ofAccounting, 44(1), 79.
Hassan, A. (n.d.). The Global Financial Crisis and Islamic Banking. Islamic EconomicsUnit, The Islamic Foundation, UK.
Hassan, M. K. (2009b). UAE corporations-specific characteristics and level of riskdisclosure. Managerial Auditing Journal, 24(7), 668-687.
Hassan, M. K., & K.Lewis, M. (2007). Handbook of Islamic Banking Retrieved fromhttp://www.kantakji.com/media/2129/b029.pdf
Hassan, O., & Marston, C. (2010). Disclosure Measurement in the Empirical AccountingLiterature: A Review Article Economics and Finance Working Paper SeriesWorking Paper No. 10-18 fromhttp://www.brunel.ac.uk/about/acad/sss/depts/economics
Hasseldine, J., Salama, A. and Tom, J.S. (2005). Quantity versus quality: the impact ofenvironmental disclosures on the reputations of UK Plcs,.,. The British AccountingReview, 37/2, 231-248.
Healy, P. M., & Palepu, K. (2009). Information Asymmetry, Corporate Disclosure and theCapital Markets: A Review of the Empirical Disclosure Literature. Rochester,Rochester.
Healy, P. M., & Palepu, K. G. (2001). Information asymmetry, corporate disclosure, andthe capital markets: A review of the empirical disclosure literature. Journal ofAccounting and Economics, 31(1–3), 405-440. doi:http://dx.doi.org/10.1016/S0165-4101(01)00018-0

303
Heffernan, S. (2005). Modern Banking. Chichester, England: John Wiley & Sonds,Ltd.Helfer, E. A. (2001). Financial Analysis :Tools and Techniques. United State of America:
McGraw-Hill.Holm, C., & Laursen, P. B. (2007). Risk and Control Developments in Corporate
Governance: changing the role of the external auditor? Corporate Governance:An International Review, 15(2), 322-333.
Hopskins, P. E. (1996a). The effect of financial statement classification of hybrid financialinstruments on financial analysts' stock price judgments. Journal of AccountingResearch, 34, 33-50.
Hopskins, P. E. (1996b). The effect of financial statement classification of hybrid financialinstruments on financial analysts' stock price judgments. . Journal of AccountingResearch, 34, 33-50.
Höring, D., & Gründl, H. (2011). Investigating Risk Disclosure Practices in the EuropeanInsurance Industry. Geneva Papers on Risk & Insurance, 36(3), 380-413.
Hull, J. C. (2009). Option, Futures and Other DerivativesHussain, H. A., & Al-Ajmi, J. (2012). Risk management practices of conventional and
Islamic banks in Bahrain. The Journal of Risk Finance, 13(3) 215-239.Hussainey, K., & Walker, M. (2009). The effects of voluntary disclosure and dividend
propensity on prices leading earnings. Accounting & Business Research (WoltersKluwer UK), 39(1), 37-55.
Hutajulu, S. (2002). Ontent Analysis Of The Evolution Of Discretionary Disclosure AtTexaco Inc.: An Agency Theory Perspective. (PhD), Case Western ReserveUniversity.
IASB. (2010). International Financial Reporting Standard. London: InternationalAccounting Standards Board
Ibrahim, W. H., Ismail, A.G.., Zabaria, W.N. (2011). Disclosure, Risk and Performance inIslamic Banking: A Panel Data Analysis. International Research Journal ofFinance and Economics(Issue 72), 102.
ICAEW. (2011). Reporting Business Risks:Meeting Expectations (pp. iii). UK: FinancialReporting Faculty.
Inchausti, B. (1997). The influence of company characteristics and accounting regulationon information disclosed by Spanish firms. European Accounting Review, Vol. 6No. 1,, 45-68.
Inchausti, B. G. (1997). The influence of company characteristics and accountingregulation on information disclosed by Spanish firms. The European AccountingReview, 6(1), 45-68.
Ivers, M. (1991). The random house guide to good writing. New York: Random House.Jensen, M. C., & Meckling, W. H. (1976). Theory of the firm: Managerial behavior, agency
costs and ownership structure. Journal of Financial Economics, 3(4), 305-360. doi:http://dx.doi.org/10.1016/0304-405X(76)90026-X
Jung, J. (2000). Credits rationing with a moral hazard problem. Seoul Journal ofEconomics, 13(2), 165-183.
Kaplan, S. N., & Stromberg, P. (2003). Financial Contracting Theory Meets the RealWorld: An Empirical Analysis of Venture Capital Contracts. The Review ofEconomic Studies, 70(2), 281-315.

304
KaraİBrahİMoĞLu, Y. Z. (2013). Is Corporate Governance A Determinant of AuditorChoice?-Evidence From Turkey. Kurumsal Yönetim Denetçi Seçiminde Belirleyicimidir?-Türkiye'den Bulgular., 13(2), 273-284.
Karğın, S. (2013). The Impact of IFRS on the Value Relevance of Accounting Information:Evidence from Turkish Firms. International Journal of Economics & Finance, 5(4),71-80. doi: 10.5539/ijef.v5n4p71
Khan, A., Kaleem, A., & Nazir, M. S. (2012). Impact of Financial Leverage on Agencycost of Free Cash Flow: Evidence from the Manufacturing sector of Pakistan.Journal of Basic and Applied Scientific Research,, 2, 7, 6694-6700.
Khan, M. S., & Mirakhor, A. (1989). The Financial System and Monetary Policy in anIslamic Economy. JKAU: Islamic Econ., Vol. 1, 39-57.
Korotkikh, K. (n.d). The Effect of Financial Leverage in Firm Value: Evidence from theNetherlands. (Master), University of Twente, Netherland.
Kouki, M., & Said, H. b. (2011). Does management ownership explain the effect ofleverage on firm value? An analysis of French listed firms. Journal of BusinessStudies Quarterly, Vol. 3, No. 1, 169-186.
Kravet, T., & Muslu, V. (2013). Textual Risk Disclosures and Investors’ Risk Perceptions.Review of Accounting Studies, 18(4), 1088-1122. doi: DOI 10.1007/s11142-013-9228-9
Kurniawan, D. M., & Indriantoro, N. (2000). Corporate Governance in Indonesia. Paperpresented at the The Second Asian Roundtable on Corporate Governance, HongKong, China.
Lajili, K., & Zeghal, D. (2005). A Content Analysis of Risk Management Disclosures inCanadian Annual Reports Canadian Journal of Administrative Sciences, 22(2),125-142.
Lasswell, H. D. (1948). The structure and function of communication in society. Thecommunication of ideas, 37.
Lee, T. (2006). Financial Reporting and Corporate Governance. England: John Wiley &Sons, Ltd.
Leshem, S. (2012). A Signaling Theory of Lockups in Merger University of SouthernCalifornia.
Lewis, M. K. (2001). Islam and accounting. Accounting Forum, Vol 25 No 2.Linsley, & Shrives. (2006). A study of risk disclosures in the annual reports of UK. The
British Accounting Review, 38, 387–404.Linsley, P., & Shrives, P. (2000). Risk management and reporting risk in the UK Journal
of Risk Research, Vol.3 No.1, 115-129.Linsley, P. M., & Shrives, P. J. (2005). Transparency and the disclosure of risk
information in the banking sector. Journal of Financial Regulation andCompliance, 13(3), 205-214.
Lintner, J. (1956). Distribution of Incomes of Corporations Among Dividends, RetainedEarnings and Taxes. American Economic Review, 46 (2), 97-113.
Litzenberger, R. H., & Ramaswamy, K. (1979). The effect of personal taxes and dividendson capital asset prices: Theory and empirical evidence. Journal of FinancialEconomics, 7(2), 163-195.
M.Wachowicz, J. C. V. H. J. (2005). Fundamentals of Financial Management. England:Prentice Hall.
305
Marshall, A., & Weetman, P. (2007). Modelling Transparency in Disclosure: The Case ofForeign Exchange Risk Management. Journal of Business Finance & Accounting,34(5/6), 705.
Mathuva, D. (2012). The Determinants of Forward-looking Disclosures in Interim Reportsfor Non-financial Firms: Evidence from a Developing Country. InternationalJournal of Accounting and Financial Reporting, Vol. 2, No. 2, 125-141.
McAfee, R. P., & McMillan, J. (1987). Competition for agency contracts. The RandJournal of Economics, 296-307.
McGilvery, A., Faff, R., & Pathan, S. (2012). Competitive valuation effects of AustralianIPOs. International Review of Financial Analysis, 24(0), 74-83.
McKinnon, J. L., & Dalimunthe, L. . (1993). Voluntary disclosure of segment informationby Australian diversified companies Accounting & Finance, 33(1), 33-50.
McLeay, M., Radia, A., & Thomas, R. (2014). Money creation in the modern economy,Quarterly Bulletin-Q1.
Mercer, M. (2004). How do investors assess the credibility of management disclosure?Accounting Horizons, 18 (3), 185-196.
Merton, R. C. (1973). Theory of rational option pricing. The Bell Journal of Economicsand Management Science, 141-183.
Miihkinen, A. (2012). What Drives Quality of Firm Risk Disclosure?The Impact of aNational Disclosure Standard and. The International Journal of Accounting, 6.
Miller, M. H., & Modigliani, F. (1961). Dividend policy, growth, and the valuation of shares.the Journal of Business, 34(4), 411-433.
Milne, M. J., & Adler, R. W. (1999). Exploring the reliability of social and environmentaldisclosures. Accounting, Auditing & Accountability Journal, Vol. 12 No. 2, 237-256.
Mirza, A. A., Orrell, M., & Holt, G. J. (2008). IFRS Practical Implementation Guide andWorkbook (Vol. 2nd ed). Canada: John Wiley & Sons, Inc.
Mohobbot, A. M. (2005). Corporate Risk Reporting Practices in Annual Reports ofJapanese Companies. Japanese Journal of Accounting, 16(1), 113-133.
Morgan, A. (2008). A measure of the precision of forward-looking MD&A statements.United States.: Nova Southeastern University.
Morris, R. D. (1987). Signalling, Agency Theory And Accounting Policy Choice.Accounting and Business Research, 18(69), 47-47.
Moumen, N., Othman, H. B., & Hussainey, K. (2013). The Value Relevance of RiskDisclosure in Annual Reports: Evidence from MENA Emerging Markets.
Muzahem, A. (2011). An empirical analysis on the practice and determinants of riskdisclosure in an emerging capital market: the case of United Arab Emirates.(Doctor), University of Portsmouth, Portsmouth.
Myers, S. C., & Majluf, N. S. (1984). Corporate financing and investment decisions whenfirms have information that investors do not have. Journal of Financial Economics,13(2), 187-221. doi: http://dx.doi.org/10.1016/0304-405X(84)90023-0
Naser, K., Al-Khatib, K., & Karbhari, Y. (2002). Empirical evidence on the depth ofcorporate information disclosure in developing countries: The case of Jordan.International Journal of Commerce & Management, 12(3/4), 122-155.
Neter, J., Michael H. Kutner, Christo. (1996). Applied Linear Statistical Models. Boston:McGraw Hill.

306
Ntim, C. G., Lindop, S., & Thomas, D. A. (2011). Corporate Governance and RiskReporting in South Africa: A Study of Corporate Risk Disclosures in the Pre- andPost-2007/2008 Global Financial Crisis Period. School of Management andBusiness Aberystwyth University, Aberystwyth, UK.
Okcabol, F. a. T., T. (1993). Dismantling Financial Disclosure Regulations: Testing TheStigler-Benston Hypothesis. Accounting, Auditing and Accountability Journal,,6(1), 10-36.
Oliveira, J., Rodrigues, L. L., & Craig, R. (2011). Risk-related disclosure practices in theannual reports of Portuguese credit institutions: An exploratory study. Journal ofBanking Regulation, 12(2), 100-118.
Oxelheim, L. (2008). Macroeconomic Turbulence: Corporate Performance,Transparency and Economic Growth. School of Business and the Faculty ofEconomics(Tímarit um viðskipti og efnahagsmál, Special Issue), 59-70.
Papa, V. T., & Peters, S. J. (2011). User Perspectives on Financial Instrument RiskDisclosures under IFRS (Vol. 1): CFA Institute.
Parlalis, S. K. (2011). Management of organisational changes in a case of de-institutionalisation. Journal of Health Organization and Management, 25(4), 355-384.
Penno, M. C. (1997). Information quality and voluntary disclosure. Accounting Review,275-284.
Peraturan Bank Indonesia No. 9/15/PBI/2007 tentang Penerapan Manajemen Resikodalam Penggunaa Teknologi Informasi oleh Bank Umum.
Peraturan Bank Indonesia No: 5/8/PBI/2003 tentang Penerapan Manajemen Resiko BagiBank Umum.
Peraturan Bank Indonesia No: 11/ 25 /PBI/2009 tentang Perubahan Atas Peraturan BankIndonesia no. 5/8/PBI/2003 tentang Penerapan Manajemen Resiko Bagi BankUmum.
Popova, T., Georgakopoulos, G., Sotiropoulos, I., & Vasileiou, K. Z. (2013). MandatoryDisclosure and Its Impact on the Company Value. International BusinessResearch, Vol. 6, No. 5.
Poshakwale , S., & Courtis , J. K. ( 2005). Disclosure Level and Cost of Equity Capital :Evidance From Banking Industry. Managerial and Decision Economic, 26, 341-444.
Post, J. E., Preston, L. E., & Sachs, S. (2002). Managing the extended enterprise: thenew stakeholder view. California management review, 45(1), 6-28.
PricewaterhouseCoopers. (2008). Accounting for change: transparency in the midst ofturmoil: A survey of banks’ 2007 annual reports.
PricewaterhouseCoopers, S. (2000). Corporate Governance 1999 Survey of InstitutionalInvestors: PricewaterhouseCoopers Singapore.
Rajab, B., & Handley-Schachler, M. (2009). Corporate risk disclosure by UK firms: trendsand determinants. World Review of Entrepreneurship, Management andSustainable Development, 5(3), 224-243. doi: 10.1504/WREMSD.2009.026801
Repullo, R., & Suarez, J. (2000). Entrepreneurial moral hazard and bank monitoring: amodel of the credit channel. European Economic Review, 44(10), 1931-1950.
Rock, A. J. (2007). Is the Logic of the t-test for Two Independent Samples Fallacious?An Analysis of the Ontological Status of the Treated Population. North AmericanJournal of Psychology, 9(1), 163-172.
307
Roden, F., & Stripling, T. (1997). Dividend reinvestment plans as efficient methods ofraising equity financing. Review of Financial Economics, 5(1), 91-100.
Ross, S., Westerfiled, R., & Jordan, B. (2008). Fundamentals of Corporate Finance (8thed.). New York: McGraw-Hill.
Ross, S. A. (1979). Disclosure Regulation In Financial Markets: Implications Of ModernFinance Theory And Signaling Theory Issues In Financial Regulation: Regulationof American Business and Industry Pinpoint (pp. 177-202.).
Ryan, B. (2007). Corporate Finance and Valuation. London: Thomson Learning.Ryan, B., Scapen, R., & Theobald, M. (2002). Research Method and Methodology in
Finance and Accounting (2nd ed.). London: Thomson.Sachs, S., Ruhli, E., & Kern, I. (2009). Sustainable Success with Stakeholders: The
Untapped Potential. London: Palgrave Macmillan.Samad, A., & Hassan, M. K. (1999). The Performance of Malaysian Islamic Bank during
1984-1997: An Exploratory Study. International Journal of Islamic FinancialServices, 1(3).
Schelling, T. S., & Estrada, F. (2011). Game theory and indirect communication (Vol.Paper No. 34988). Universidad Externado de Colombia, Facultad de Finanzas:MPRA (Munich Personal RePEc Archive).
Schipper, K. (2003). Principles-based accounting standards. Accounting Horizons, 17(1),61-72.
Schoubben, F., & Rulle, C. V. (2004). The Determinants Of Leverage; DifferencesBetween Quoted And Non Quoted Firms Tijdschrift voor Economie enManagement, XLIX(4).
Sensarma, R. a. J., M. (2009). “Are bank stocks sensitive to risk management?”. TheJournal of Risk Finance, Vol. 10 No. 1, 7-22.
Shannon, C. E., & Weaver, W. (1948). A mathematical theory of communication:American Telephone and Telegraph Company.
Sheu, Chung, H., & Liu, C. L. (2010). Comprehensive Disclosure of Compensation andFirm Value: The Case of Policy Reforms in Emerging Market Journal of Businessand Accounting, 37 Nos 9-10, 1115-1144.
Skinner, D. J. ( 1994). Why Firms Voluntarily Disclose Bad News. Journal of AccountingResearch, 32(1), 38-60.
Spence, M. (1973). Job Market Signaling. Quarterly Journal of Economics, 87(3), 355-374.
Spence, M. (2002). Signaling in retrospect and the informational structure of markets.The American Economic Review, 92(3), 434-459.
Suadiye, G. (2012). Value Relevance of Book Value & Earnings Under the Local GAAPand IFRS: Evidence from Turkey/Yerel Muhasebe Standartlarina ve UFRS'yeGöre Hazirlanan Kar ve Özkaynak Rakamlarinin Hisse Senedi FiyatlarinaYansimasi: Türkiye Örnegi. Ege Akademik Bakis, 12(3), 301-310.
Subramanian, S., & Reddy, V. N. (2012). Corporate governance disclosures andinternational competitiveness: A study of Indian firms. Asian Business &Management, 11(2), 195-218. doi: http://dx.doi.org/10.1057/abm.2012.1
Suhardjanto, D., Dewi, A., Rahmawati, E., & Firazonia. (2012). Peran CorporateGovernance dalam Praktik Risk Disclosure pada Perbankan Indonesia. JurnalAkuntansi & Auditing, 9/No.1, 17-30.

308
Sukuk, Fatwa Number 32 / DSN-MUI / IX / 2002 C.F.R. (National Shariah Board,Indonesian Council of Ulama. 2002).
Surat Edaran No.SE-02/BL/2008 tentang Pedoman Penyajian dan PengungkapanLaporan Keuangan Emiten atau Perusahaan Publik Industri PertambanganUmum, Minyak dan Gas Bumi dan Perbankan.
Teece, D. J. (1996). Firm organization, industrial structure, and technologicalinnovation1.
Tencati, A., Perrini, F., & Pogutz, S. (2004). New Tools to Foster Corporate SociallyResponsible Behavior. Journal of Business Ethics, 53(1-2), 173-190.
Tobin, J. (1963). Commercial Banks as Creators of 'Money' In I. B. a. m. studies (Ed.),Cowles foundation paper 205 (Vol. Homewood: In C. Carson (Ed.), pp. 408-419).
Undang_undang Republik Indonesia No. 21 tahun 2008 tentang Perbankan Syariah (16July 2008).
Usmani, M. M. T. (1998). An Introduction to Islamic Finance Retrieved fromhttp://islamicfinancenews.files.wordpress.com/2009/09/an20introduction20to20islamic20finance.pdf
Uyar, A., & Kiliç, M. (2012). Value relevance of voluntary disclosure: evidence fromTurkish firms. Journal of Intellectual Capital, 13(3), 363-376.
Vitezic, N. (2011). Correlation between social responsibility and efficient performance inCroatian enterprises*. Zbornik Radova Ekonomski Fakultet u Rijeka, 29(2), 423-442.
Wallace, R. S. O., & Naser, K. (1995). Firm-specific determinants of thecomprehensiveness of mandatory disclosure in the corporate annual reports offirms listed on the stock exchange of Hong Kong. Journal of Accounting and PublicPolicy, 14(4), 311-368. doi: http://dx.doi.org/10.1016/0278-4254(95)00042-9
Wallace, R. S. O., Naser, K., & Mora, A. (1994). The relationship between thecomprehensiveness of corporate. Accounting and Business Research, 25(97), 41-41.
Wang, Z., Ali, M. J., & Al-Akra, M. (2013). Value relevance of voluntary disclosure andthe global financial crisis: evidence from China. Managerial Auditing Journal, 28No. 5, 444-468.
Ward, A. T. A. M. (2009). Introduction to Financial Accounting (sixth ed.). London: TheMc Grow-Hill.
Watson, A., Shrives, P., & Marston, C. (2002). Voluntary disclosure of accounting ratiosin the UK. The British Accounting Review, 34(4), 289-313.
Watts, R., & Zimmerman, J. L. (1983). Agency Problems, auditing and theory of the firm:some evidence. Journal of Law and Economics, 12(26), 613-633.
Werner, R. A. (2014). How do banks create money, and why can other firms not do thesame? An explanation for the coexistence of lending and deposit-taking.International Review of Financial Analysis, 36, 71-77.
www.bi.go.id.www.idx.co.id.Yuen, D. C. Y., Liu, M., Zhang, X., & Lu, C. (2009). A Case Study of Voluntary Disclosure
by Chinese Enterprises Asian Journal of Finance & Accounting, 1(2).Zdolsek, D., & Kolar, I. (2013b). Management disclosure practices for disaggregated
(financial) information in Slovenian unlisted companies. Journal for East EuropeanManagement Studies, 18(2), 264-289.

309

310
APPENDIX
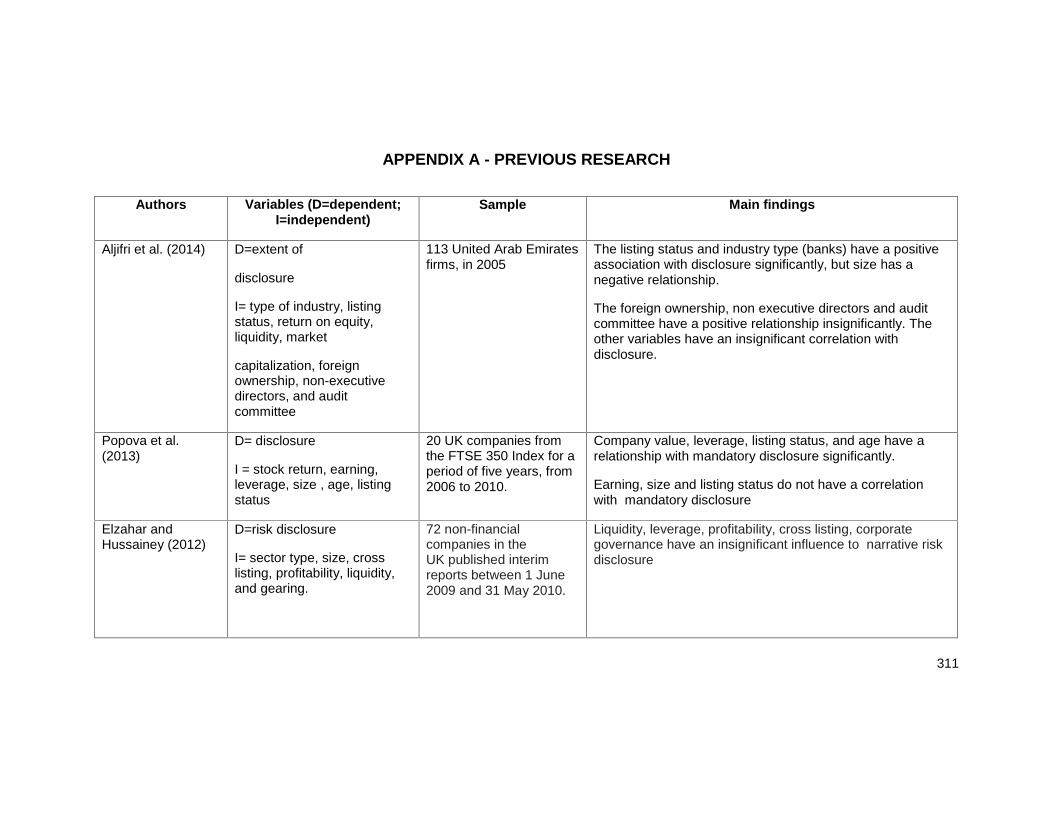
311
APPENDIX A - PREVIOUS RESEARCH
Authors Variables (D=dependent;I=independent)
Sample Main findings
Aljifri et al. (2014) D=extent of
disclosure
I= type of industry, listingstatus, return on equity,liquidity, market
capitalization, foreignownership, non-executivedirectors, and auditcommittee
113 United Arab Emiratesfirms, in 2005
The listing status and industry type (banks) have a positiveassociation with disclosure significantly, but size has anegative relationship.
The foreign ownership, non executive directors and auditcommittee have a positive relationship insignificantly. Theother variables have an insignificant correlation withdisclosure.
Popova et al.(2013)
D= disclosure
I = stock return, earning,leverage, size , age, listingstatus
20 UK companies fromthe FTSE 350 Index for aperiod of five years, from2006 to 2010.
Company value, leverage, listing status, and age have arelationship with mandatory disclosure significantly.
Earning, size and listing status do not have a correlationwith mandatory disclosure
Elzahar andHussainey (2012)
D=risk disclosure
I= sector type, size, crosslisting, profitability, liquidity,and gearing.
72 non-financialcompanies in theUK published interimreports between 1 June2009 and 31 May 2010.
Liquidity, leverage, profitability, cross listing, corporategovernance have an insignificant influence to narrative riskdisclosure
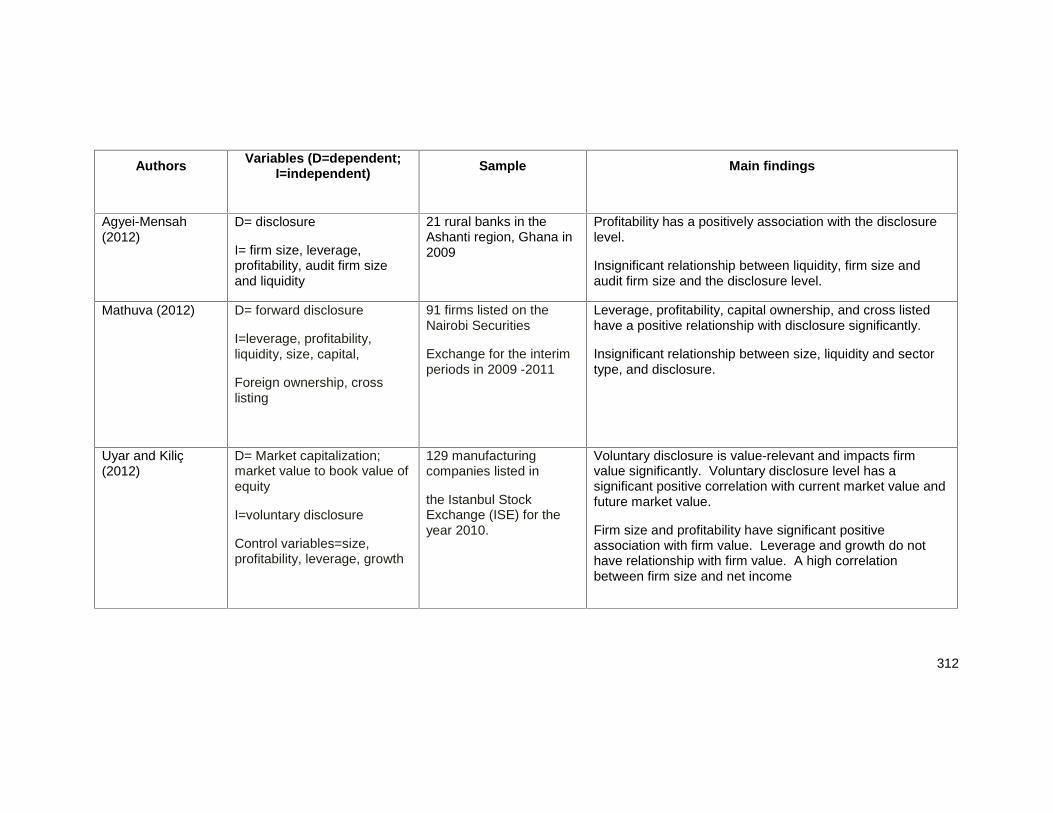
312
Authors Variables (D=dependent;I=independent) Sample Main findings
Agyei-Mensah(2012)
D= disclosure
I= firm size, leverage,profitability, audit firm sizeand liquidity
21 rural banks in theAshanti region, Ghana in2009
Profitability has a positively association with the disclosurelevel.
Insignificant relationship between liquidity, firm size andaudit firm size and the disclosure level.
Mathuva (2012) D= forward disclosure
I=leverage, profitability,liquidity, size, capital,
Foreign ownership, crosslisting
91 firms listed on theNairobi Securities
Exchange for the interimperiods in 2009 -2011
Leverage, profitability, capital ownership, and cross listedhave a positive relationship with disclosure significantly.
Insignificant relationship between size, liquidity and sectortype, and disclosure.
Uyar and Kiliç(2012)
D= Market capitalization;market value to book value ofequity
I=voluntary disclosure
Control variables=size,profitability, leverage, growth
129 manufacturingcompanies listed in
the Istanbul StockExchange (ISE) for theyear 2010.
Voluntary disclosure is value-relevant and impacts firmvalue significantly. Voluntary disclosure level has asignificant positive correlation with current market value andfuture market value.
Firm size and profitability have significant positiveassociation with firm value. Leverage and growth do nothave relationship with firm value. A high correlationbetween firm size and net income
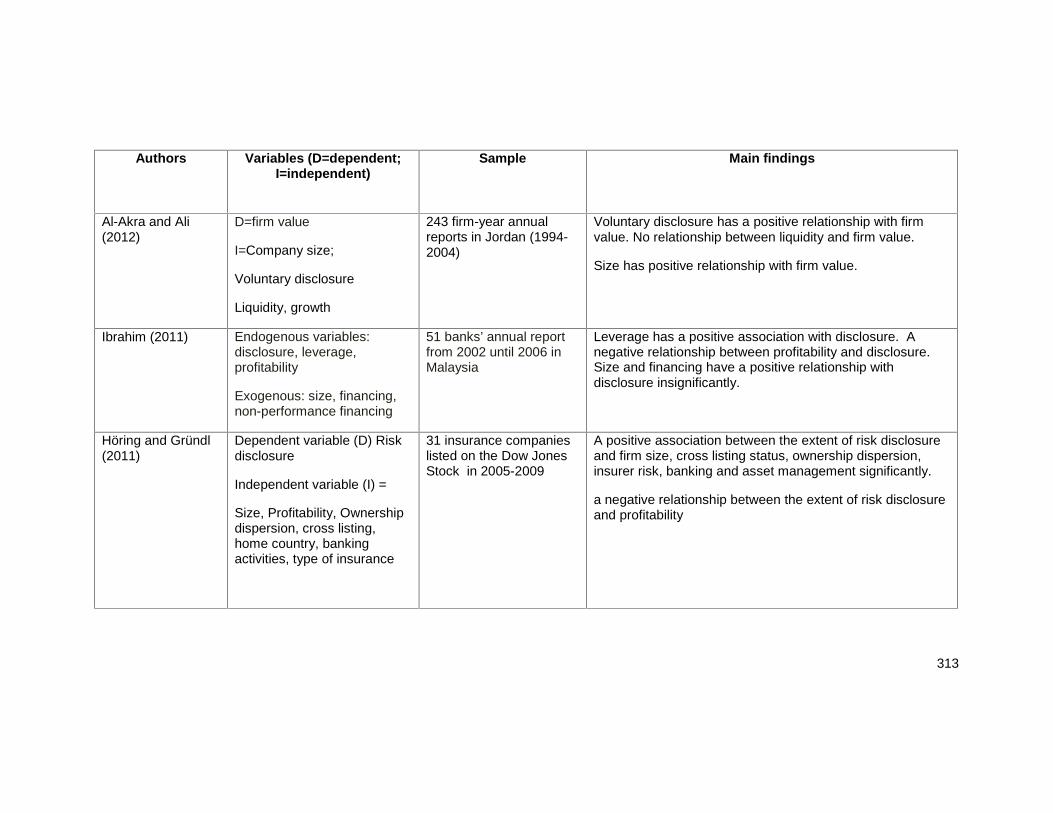
313
Authors Variables (D=dependent;I=independent)
Sample Main findings
Al-Akra and Ali(2012)
D=firm value
I=Company size;
Voluntary disclosure
Liquidity, growth
243 firm-year annualreports in Jordan (1994-2004)
Voluntary disclosure has a positive relationship with firmvalue. No relationship between liquidity and firm value.
Size has positive relationship with firm value.
Ibrahim (2011) Endogenous variables:disclosure, leverage,profitability
Exogenous: size, financing,non-performance financing
51 banks’ annual reportfrom 2002 until 2006 inMalaysia
Leverage has a positive association with disclosure. Anegative relationship between profitability and disclosure.Size and financing have a positive relationship withdisclosure insignificantly.
Höring and Gründl(2011)
Dependent variable (D) Riskdisclosure
Independent variable (I) =
Size, Profitability, Ownershipdispersion, cross listing,home country, bankingactivities, type of insurance
31 insurance companieslisted on the Dow JonesStock in 2005-2009
A positive association between the extent of risk disclosureand firm size, cross listing status, ownership dispersion,insurer risk, banking and asset management significantly.
a negative relationship between the extent of risk disclosureand profitability
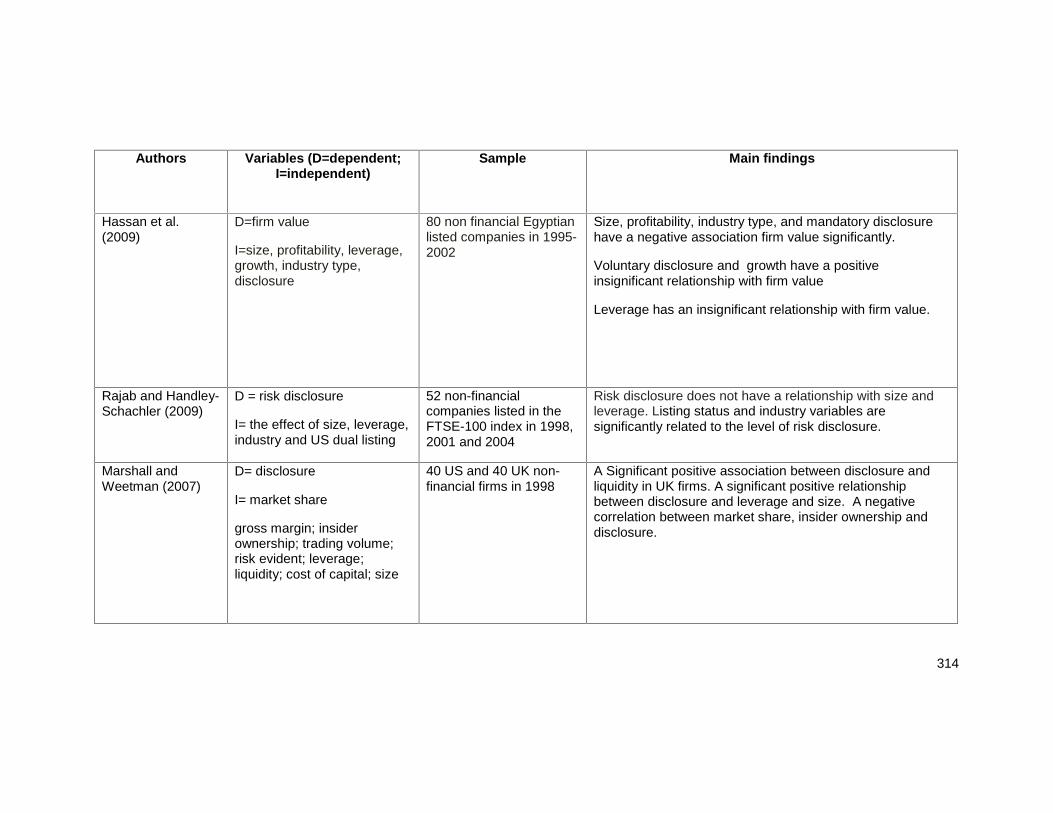
314
Authors Variables (D=dependent;I=independent)
Sample Main findings
Hassan et al.(2009)
D=firm value
I=size, profitability, leverage,growth, industry type,disclosure
80 non financial Egyptianlisted companies in 1995-2002
Size, profitability, industry type, and mandatory disclosurehave a negative association firm value significantly.
Voluntary disclosure and growth have a positiveinsignificant relationship with firm value
Leverage has an insignificant relationship with firm value.
Rajab and Handley-Schachler (2009)
D = risk disclosure
I= the effect of size, leverage,industry and US dual listing
52 non-financialcompanies listed in theFTSE-100 index in 1998,2001 and 2004
Risk disclosure does not have a relationship with size andleverage. Listing status and industry variables aresignificantly related to the level of risk disclosure.
Marshall andWeetman (2007)
D= disclosure
I= market share
gross margin; insiderownership; trading volume;risk evident; leverage;liquidity; cost of capital; size
40 US and 40 UK non-financial firms in 1998
A Significant positive association between disclosure andliquidity in UK firms. A significant positive relationshipbetween disclosure and leverage and size. A negativecorrelation between market share, insider ownership anddisclosure.

315
Authors Variables (D=dependent;I=independent)
Sample Main findings
Aljifri andHussainey (2007)
D=forward looking disclosure
I=firm size, profitability,leverage, sector type, auditorsize
46 listed companies inDubai financial marketand Abu Dubai stockmarket in 2004
A positive correlation between leverage and level ofdisclosure. A negative association between profitability andlevel of forward looking disclosure. An insignificantassociation between sector type, auditor size, firm size andlevel of forward looking disclosure;
Linsley and Shrives(2006)
D=risk disclosure
I= size, leverage ratio, betafactor, book-to- market value,quiscore, asset cover ratio,environmental risk
79 UK firms listed inFTSE 100 index, in 2000
No relationship between leverage, asset cover ratio, book-to-market value, quiscore, beta factor and risk disclosure. Apositive relationship between risk disclosure and size andenvironmental risk.
Espinosa et al.(2005)
D=liquidity I=Disclosure
Control variables: size,Volatility, effective sharesvolume
658 to 704 firm-yearobservations in
Madrid Stock
Exchange (MSE)between 1994 and 2000
A significant positive relationship between disclosure andliquidity.
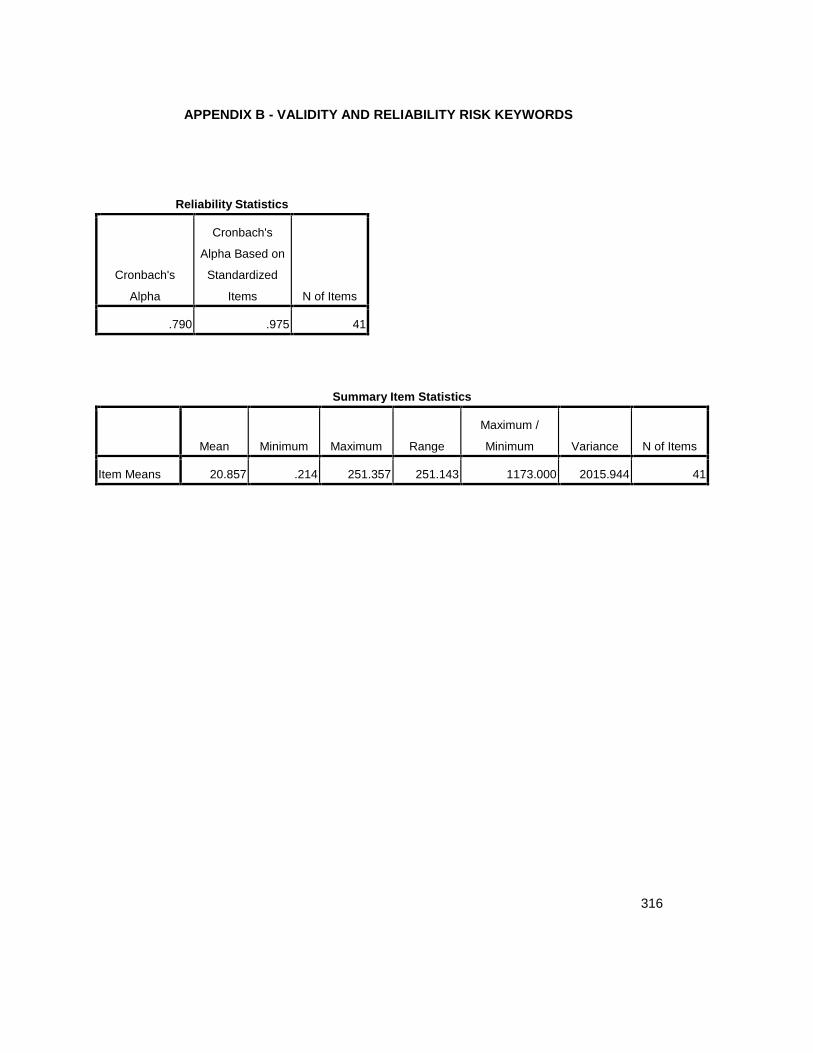
316
APPENDIX B - VALIDITY AND RELIABILITY RISK KEYWORDS
Reliability Statistics
Cronbach's
Alpha
Cronbach's
Alpha Based on
Standardized
Items N of Items
.790 .975 41
Summary Item Statistics
Mean Minimum Maximum Range
Maximum /
Minimum Variance N of Items
Item Means 20.857 .214 251.357 251.143 1173.000 2015.944 41
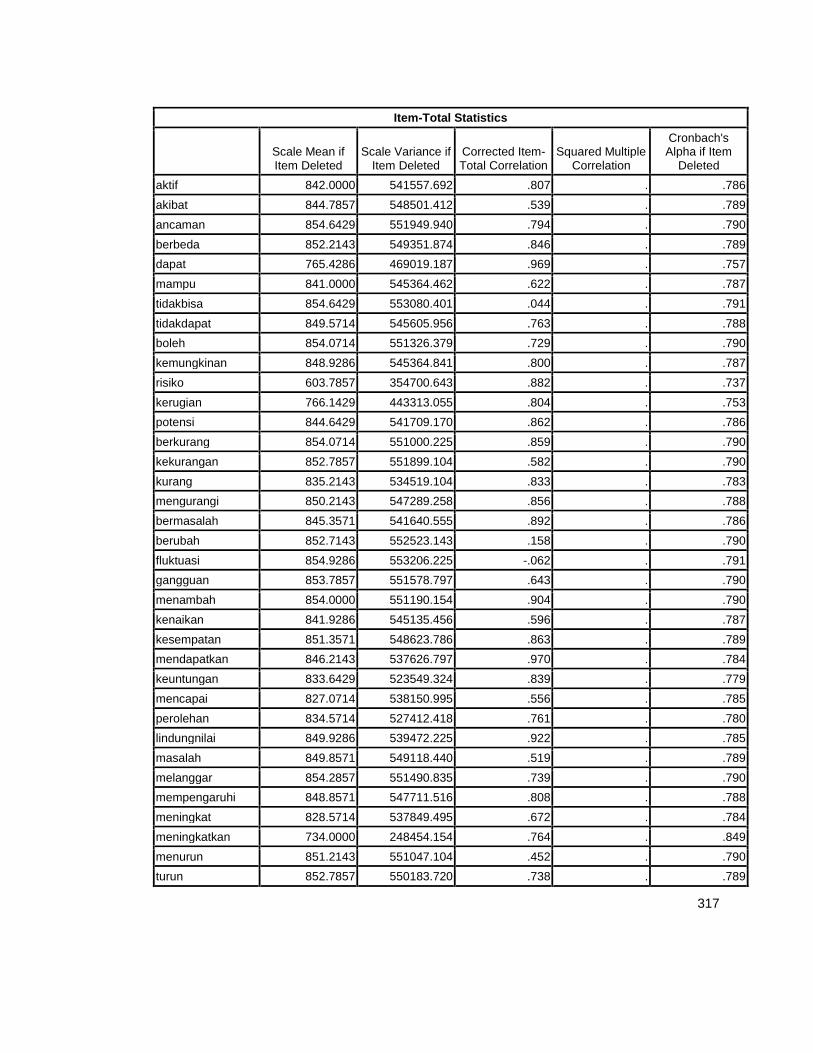
317
Item-Total Statistics
Scale Mean ifItem Deleted
Scale Variance ifItem Deleted
Corrected Item-Total Correlation
Squared MultipleCorrelation
Cronbach'sAlpha if Item
Deletedaktif 842.0000 541557.692 .807 . .786akibat 844.7857 548501.412 .539 . .789ancaman 854.6429 551949.940 .794 . .790berbeda 852.2143 549351.874 .846 . .789dapat 765.4286 469019.187 .969 . .757mampu 841.0000 545364.462 .622 . .787tidakbisa 854.6429 553080.401 .044 . .791tidakdapat 849.5714 545605.956 .763 . .788boleh 854.0714 551326.379 .729 . .790kemungkinan 848.9286 545364.841 .800 . .787risiko 603.7857 354700.643 .882 . .737kerugian 766.1429 443313.055 .804 . .753potensi 844.6429 541709.170 .862 . .786berkurang 854.0714 551000.225 .859 . .790kekurangan 852.7857 551899.104 .582 . .790kurang 835.2143 534519.104 .833 . .783mengurangi 850.2143 547289.258 .856 . .788bermasalah 845.3571 541640.555 .892 . .786berubah 852.7143 552523.143 .158 . .790fluktuasi 854.9286 553206.225 -.062 . .791gangguan 853.7857 551578.797 .643 . .790menambah 854.0000 551190.154 .904 . .790kenaikan 841.9286 545135.456 .596 . .787kesempatan 851.3571 548623.786 .863 . .789mendapatkan 846.2143 537626.797 .970 . .784keuntungan 833.6429 523549.324 .839 . .779mencapai 827.0714 538150.995 .556 . .785perolehan 834.5714 527412.418 .761 . .780lindungnilai 849.9286 539472.225 .922 . .785masalah 849.8571 549118.440 .519 . .789melanggar 854.2857 551490.835 .739 . .790mempengaruhi 848.8571 547711.516 .808 . .788meningkat 828.5714 537849.495 .672 . .784meningkatkan 734.0000 248454.154 .764 . .849menurun 851.2143 551047.104 .452 . .790turun 852.7857 550183.720 .738 . .789
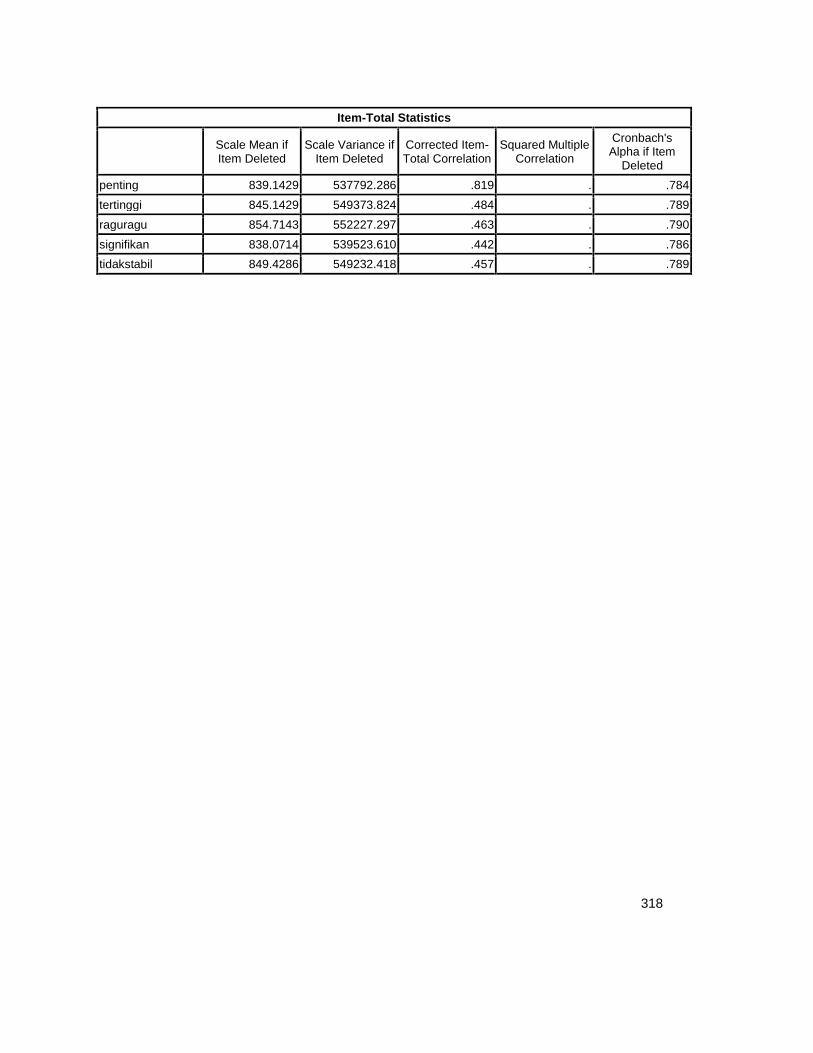
318
Item-Total Statistics
Scale Mean ifItem Deleted
Scale Variance ifItem Deleted
Corrected Item-Total Correlation
Squared MultipleCorrelation
Cronbach'sAlpha if Item
Deletedpenting 839.1429 537792.286 .819 . .784tertinggi 845.1429 549373.824 .484 . .789raguragu 854.7143 552227.297 .463 . .790signifikan 838.0714 539523.610 .442 . .786tidakstabil 849.4286 549232.418 .457 . .789
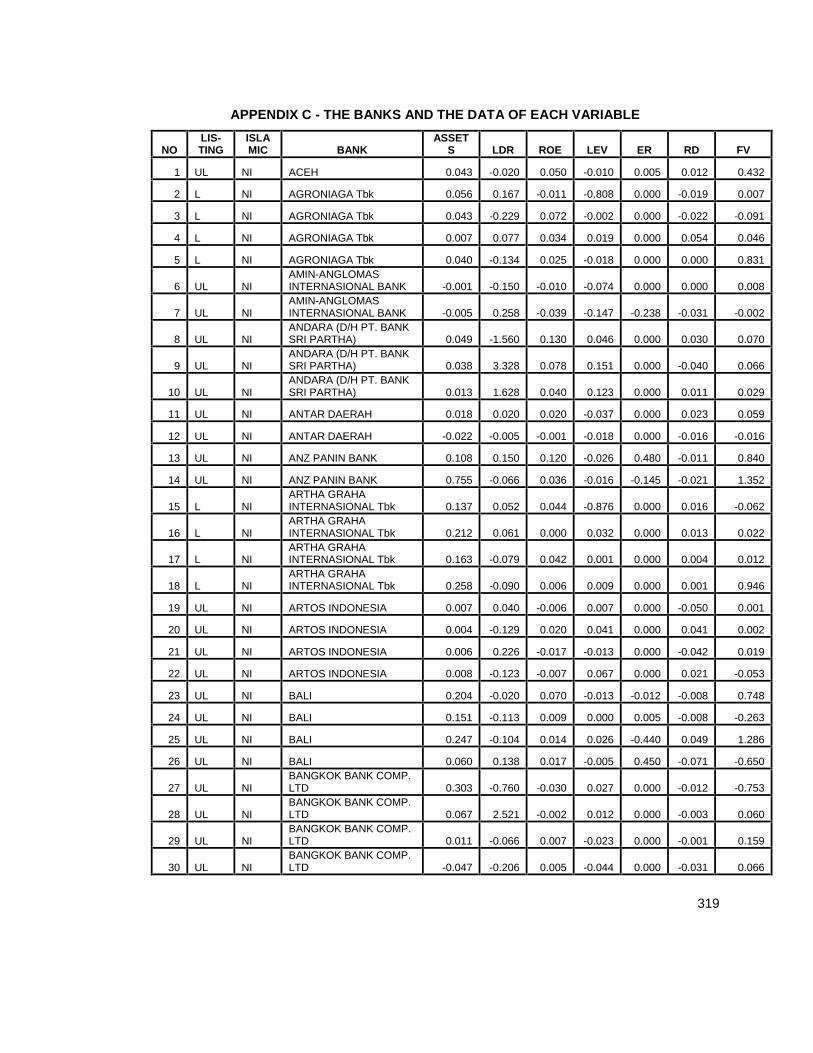
319
APPENDIX C - THE BANKS AND THE DATA OF EACH VARIABLE
NOLIS-TING
ISLAMIC BANK
ASSETS LDR ROE LEV ER RD FV
1 UL NI ACEH 0.043 -0.020 0.050 -0.010 0.005 0.012 0.432
2 L NI AGRONIAGA Tbk 0.056 0.167 -0.011 -0.808 0.000 -0.019 0.007
3 L NI AGRONIAGA Tbk 0.043 -0.229 0.072 -0.002 0.000 -0.022 -0.091
4 L NI AGRONIAGA Tbk 0.007 0.077 0.034 0.019 0.000 0.054 0.046
5 L NI AGRONIAGA Tbk 0.040 -0.134 0.025 -0.018 0.000 0.000 0.831
6 UL NIAMIN-ANGLOMASINTERNASIONAL BANK -0.001 -0.150 -0.010 -0.074 0.000 0.000 0.008
7 UL NIAMIN-ANGLOMASINTERNASIONAL BANK -0.005 0.258 -0.039 -0.147 -0.238 -0.031 -0.002
8 UL NIANDARA (D/H PT. BANKSRI PARTHA) 0.049 -1.560 0.130 0.046 0.000 0.030 0.070
9 UL NIANDARA (D/H PT. BANKSRI PARTHA) 0.038 3.328 0.078 0.151 0.000 -0.040 0.066
10 UL NIANDARA (D/H PT. BANKSRI PARTHA) 0.013 1.628 0.040 0.123 0.000 0.011 0.029
11 UL NI ANTAR DAERAH 0.018 0.020 0.020 -0.037 0.000 0.023 0.059
12 UL NI ANTAR DAERAH -0.022 -0.005 -0.001 -0.018 0.000 -0.016 -0.016
13 UL NI ANZ PANIN BANK 0.108 0.150 0.120 -0.026 0.480 -0.011 0.840
14 UL NI ANZ PANIN BANK 0.755 -0.066 0.036 -0.016 -0.145 -0.021 1.352
15 L NIARTHA GRAHAINTERNASIONAL Tbk 0.137 0.052 0.044 -0.876 0.000 0.016 -0.062
16 L NIARTHA GRAHAINTERNASIONAL Tbk 0.212 0.061 0.000 0.032 0.000 0.013 0.022
17 L NIARTHA GRAHAINTERNASIONAL Tbk 0.163 -0.079 0.042 0.001 0.000 0.004 0.012
18 L NIARTHA GRAHAINTERNASIONAL Tbk 0.258 -0.090 0.006 0.009 0.000 0.001 0.946
19 UL NI ARTOS INDONESIA 0.007 0.040 -0.006 0.007 0.000 -0.050 0.001
20 UL NI ARTOS INDONESIA 0.004 -0.129 0.020 0.041 0.000 0.041 0.002
21 UL NI ARTOS INDONESIA 0.006 0.226 -0.017 -0.013 0.000 -0.042 0.019
22 UL NI ARTOS INDONESIA 0.008 -0.123 -0.007 0.067 0.000 0.021 -0.053
23 UL NI BALI 0.204 -0.020 0.070 -0.013 -0.012 -0.008 0.748
24 UL NI BALI 0.151 -0.113 0.009 0.000 0.005 -0.008 -0.263
25 UL NI BALI 0.247 -0.104 0.014 0.026 -0.440 0.049 1.286
26 UL NI BALI 0.060 0.138 0.017 -0.005 0.450 -0.071 -0.650
27 UL NIBANGKOK BANK COMP.LTD 0.303 -0.760 -0.030 0.027 0.000 -0.012 -0.753
28 UL NIBANGKOK BANK COMP.LTD 0.067 2.521 -0.002 0.012 0.000 -0.003 0.060
29 UL NIBANGKOK BANK COMP.LTD 0.011 -0.066 0.007 -0.023 0.000 -0.001 0.159
30 UL NIBANGKOK BANK COMP.LTD -0.047 -0.206 0.005 -0.044 0.000 -0.031 0.066
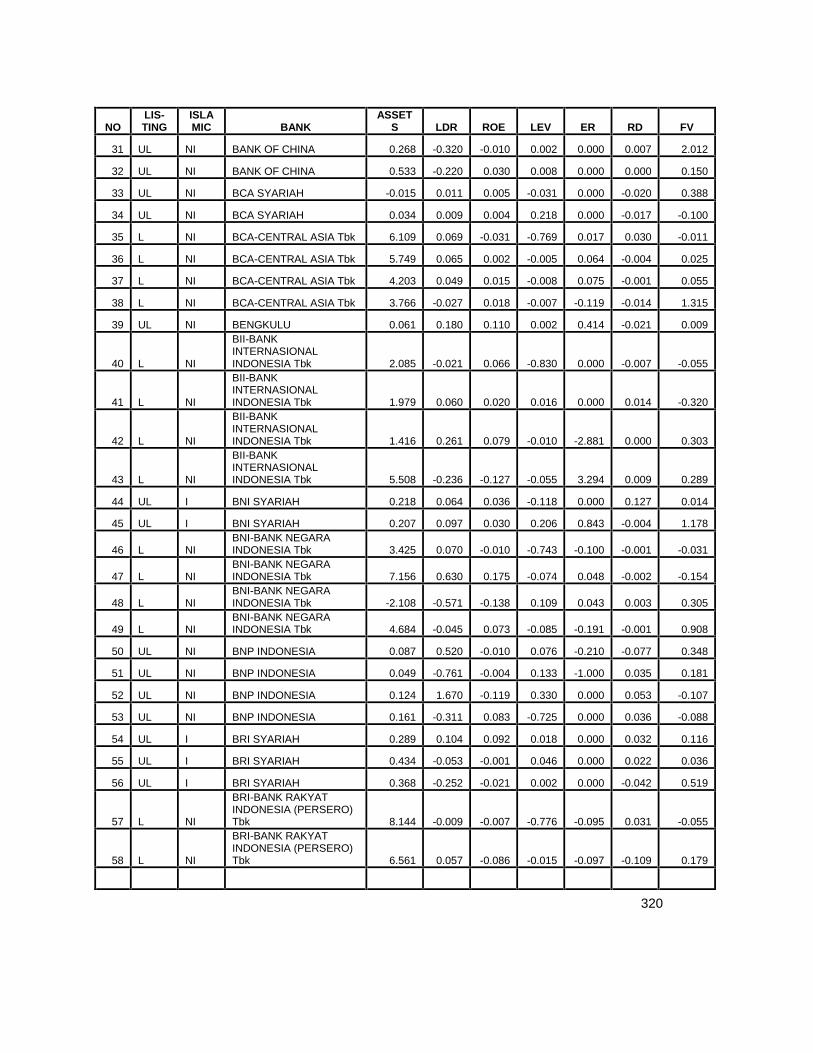
320
NOLIS-TING
ISLAMIC BANK
ASSETS LDR ROE LEV ER RD FV
31 UL NI BANK OF CHINA 0.268 -0.320 -0.010 0.002 0.000 0.007 2.012
32 UL NI BANK OF CHINA 0.533 -0.220 0.030 0.008 0.000 0.000 0.150
33 UL NI BCA SYARIAH -0.015 0.011 0.005 -0.031 0.000 -0.020 0.388
34 UL NI BCA SYARIAH 0.034 0.009 0.004 0.218 0.000 -0.017 -0.100
35 L NI BCA-CENTRAL ASIA Tbk 6.109 0.069 -0.031 -0.769 0.017 0.030 -0.011
36 L NI BCA-CENTRAL ASIA Tbk 5.749 0.065 0.002 -0.005 0.064 -0.004 0.025
37 L NI BCA-CENTRAL ASIA Tbk 4.203 0.049 0.015 -0.008 0.075 -0.001 0.055
38 L NI BCA-CENTRAL ASIA Tbk 3.766 -0.027 0.018 -0.007 -0.119 -0.014 1.315
39 UL NI BENGKULU 0.061 0.180 0.110 0.002 0.414 -0.021 0.009
40 L NI
BII-BANKINTERNASIONALINDONESIA Tbk 2.085 -0.021 0.066 -0.830 0.000 -0.007 -0.055
41 L NI
BII-BANKINTERNASIONALINDONESIA Tbk 1.979 0.060 0.020 0.016 0.000 0.014 -0.320
42 L NI
BII-BANKINTERNASIONALINDONESIA Tbk 1.416 0.261 0.079 -0.010 -2.881 0.000 0.303
43 L NI
BII-BANKINTERNASIONALINDONESIA Tbk 5.508 -0.236 -0.127 -0.055 3.294 0.009 0.289
44 UL I BNI SYARIAH 0.218 0.064 0.036 -0.118 0.000 0.127 0.014
45 UL I BNI SYARIAH 0.207 0.097 0.030 0.206 0.843 -0.004 1.178
46 L NIBNI-BANK NEGARAINDONESIA Tbk 3.425 0.070 -0.010 -0.743 -0.100 -0.001 -0.031
47 L NIBNI-BANK NEGARAINDONESIA Tbk 7.156 0.630 0.175 -0.074 0.048 -0.002 -0.154
48 L NIBNI-BANK NEGARAINDONESIA Tbk -2.108 -0.571 -0.138 0.109 0.043 0.003 0.305
49 L NIBNI-BANK NEGARAINDONESIA Tbk 4.684 -0.045 0.073 -0.085 -0.191 -0.001 0.908
50 UL NI BNP INDONESIA 0.087 0.520 -0.010 0.076 -0.210 -0.077 0.348
51 UL NI BNP INDONESIA 0.049 -0.761 -0.004 0.133 -1.000 0.035 0.181
52 UL NI BNP INDONESIA 0.124 1.670 -0.119 0.330 0.000 0.053 -0.107
53 UL NI BNP INDONESIA 0.161 -0.311 0.083 -0.725 0.000 0.036 -0.088
54 UL I BRI SYARIAH 0.289 0.104 0.092 0.018 0.000 0.032 0.116
55 UL I BRI SYARIAH 0.434 -0.053 -0.001 0.046 0.000 0.022 0.036
56 UL I BRI SYARIAH 0.368 -0.252 -0.021 0.002 0.000 -0.042 0.519
57 L NI
BRI-BANK RAKYATINDONESIA (PERSERO)Tbk 8.144 -0.009 -0.007 -0.776 -0.095 0.031 -0.055
58 L NI
BRI-BANK RAKYATINDONESIA (PERSERO)Tbk 6.561 0.057 -0.086 -0.015 -0.097 -0.109 0.179
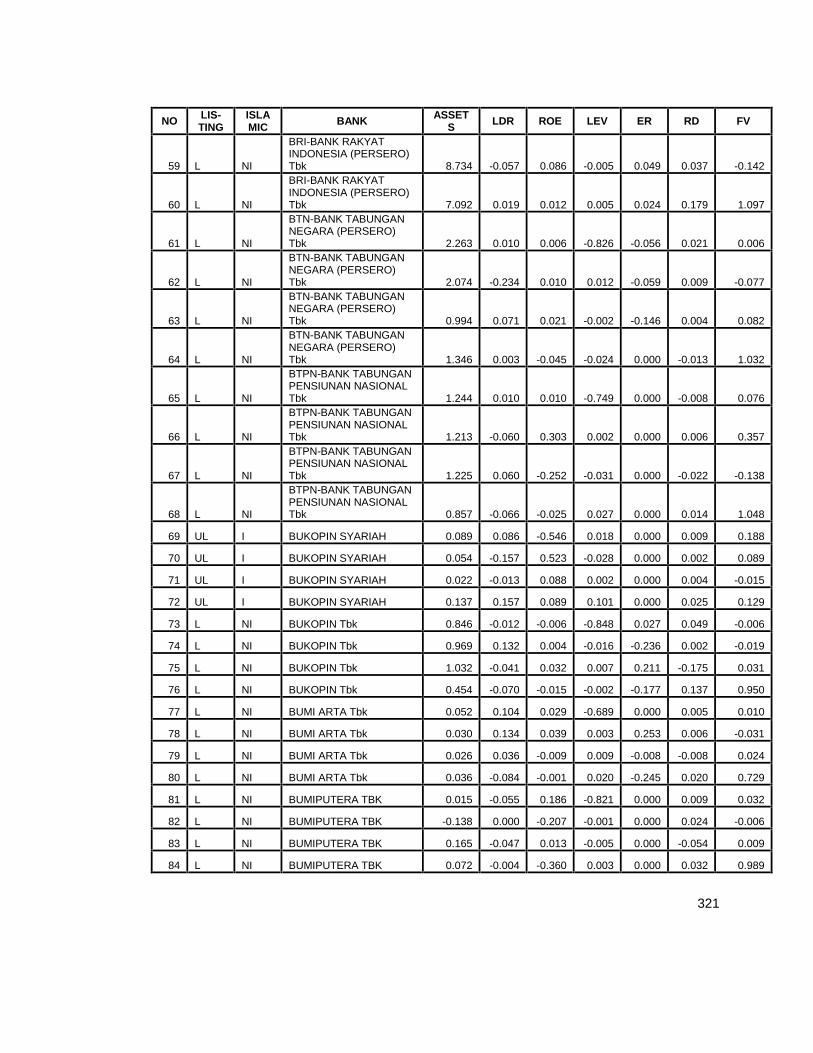
321
NO LIS-TING
ISLAMIC BANK ASSET
S LDR ROE LEV ER RD FV
59 L NI
BRI-BANK RAKYATINDONESIA (PERSERO)Tbk 8.734 -0.057 0.086 -0.005 0.049 0.037 -0.142
60 L NI
BRI-BANK RAKYATINDONESIA (PERSERO)Tbk 7.092 0.019 0.012 0.005 0.024 0.179 1.097
61 L NI
BTN-BANK TABUNGANNEGARA (PERSERO)Tbk 2.263 0.010 0.006 -0.826 -0.056 0.021 0.006
62 L NI
BTN-BANK TABUNGANNEGARA (PERSERO)Tbk 2.074 -0.234 0.010 0.012 -0.059 0.009 -0.077
63 L NI
BTN-BANK TABUNGANNEGARA (PERSERO)Tbk 0.994 0.071 0.021 -0.002 -0.146 0.004 0.082
64 L NI
BTN-BANK TABUNGANNEGARA (PERSERO)Tbk 1.346 0.003 -0.045 -0.024 0.000 -0.013 1.032
65 L NI
BTPN-BANK TABUNGANPENSIUNAN NASIONALTbk 1.244 0.010 0.010 -0.749 0.000 -0.008 0.076
66 L NI
BTPN-BANK TABUNGANPENSIUNAN NASIONALTbk 1.213 -0.060 0.303 0.002 0.000 0.006 0.357
67 L NI
BTPN-BANK TABUNGANPENSIUNAN NASIONALTbk 1.225 0.060 -0.252 -0.031 0.000 -0.022 -0.138
68 L NI
BTPN-BANK TABUNGANPENSIUNAN NASIONALTbk 0.857 -0.066 -0.025 0.027 0.000 0.014 1.048
69 UL I BUKOPIN SYARIAH 0.089 0.086 -0.546 0.018 0.000 0.009 0.188
70 UL I BUKOPIN SYARIAH 0.054 -0.157 0.523 -0.028 0.000 0.002 0.089
71 UL I BUKOPIN SYARIAH 0.022 -0.013 0.088 0.002 0.000 0.004 -0.015
72 UL I BUKOPIN SYARIAH 0.137 0.157 0.089 0.101 0.000 0.025 0.129
73 L NI BUKOPIN Tbk 0.846 -0.012 -0.006 -0.848 0.027 0.049 -0.006
74 L NI BUKOPIN Tbk 0.969 0.132 0.004 -0.016 -0.236 0.002 -0.019
75 L NI BUKOPIN Tbk 1.032 -0.041 0.032 0.007 0.211 -0.175 0.031
76 L NI BUKOPIN Tbk 0.454 -0.070 -0.015 -0.002 -0.177 0.137 0.950
77 L NI BUMI ARTA Tbk 0.052 0.104 0.029 -0.689 0.000 0.005 0.010
78 L NI BUMI ARTA Tbk 0.030 0.134 0.039 0.003 0.253 0.006 -0.031
79 L NI BUMI ARTA Tbk 0.026 0.036 -0.009 0.009 -0.008 -0.008 0.024
80 L NI BUMI ARTA Tbk 0.036 -0.084 -0.001 0.020 -0.245 0.020 0.729
81 L NI BUMIPUTERA TBK 0.015 -0.055 0.186 -0.821 0.000 0.009 0.032
82 L NI BUMIPUTERA TBK -0.138 0.000 -0.207 -0.001 0.000 0.024 -0.006
83 L NI BUMIPUTERA TBK 0.165 -0.047 0.013 -0.005 0.000 -0.054 0.009
84 L NI BUMIPUTERA TBK 0.072 -0.004 -0.360 0.003 0.000 0.032 0.989
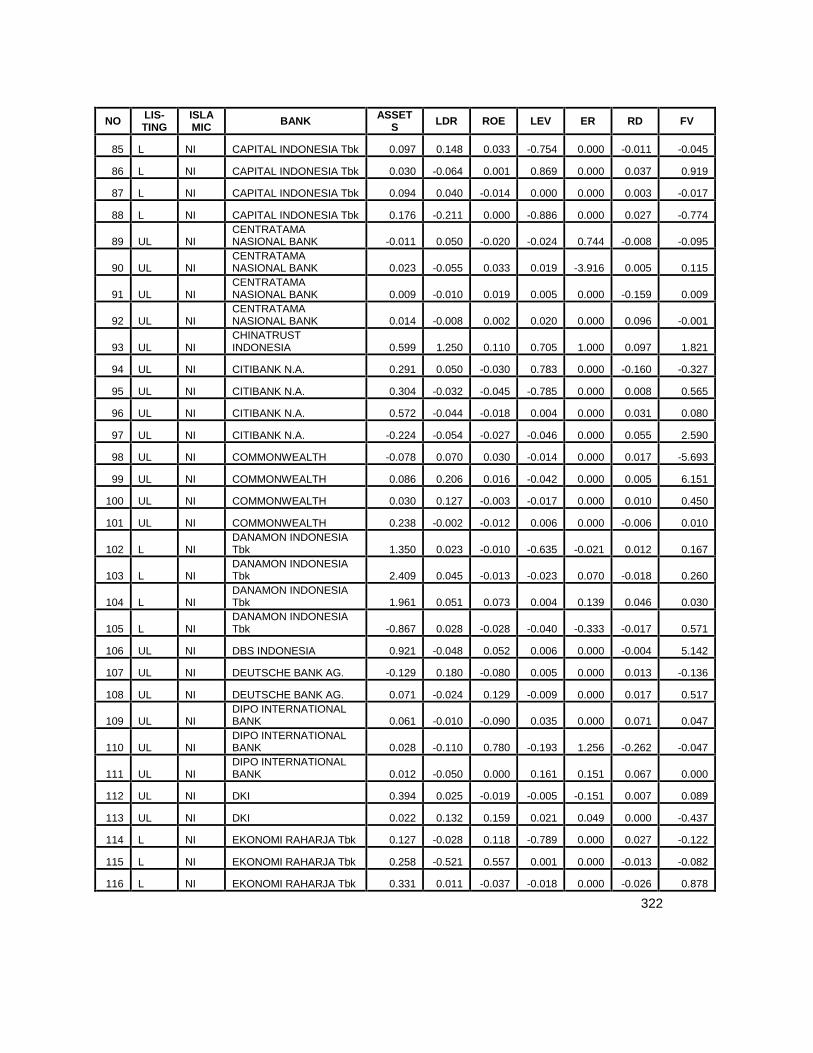
322
NO LIS-TING
ISLAMIC BANK ASSET
S LDR ROE LEV ER RD FV
85 L NI CAPITAL INDONESIA Tbk 0.097 0.148 0.033 -0.754 0.000 -0.011 -0.045
86 L NI CAPITAL INDONESIA Tbk 0.030 -0.064 0.001 0.869 0.000 0.037 0.919
87 L NI CAPITAL INDONESIA Tbk 0.094 0.040 -0.014 0.000 0.000 0.003 -0.017
88 L NI CAPITAL INDONESIA Tbk 0.176 -0.211 0.000 -0.886 0.000 0.027 -0.774
89 UL NICENTRATAMANASIONAL BANK -0.011 0.050 -0.020 -0.024 0.744 -0.008 -0.095
90 UL NICENTRATAMANASIONAL BANK 0.023 -0.055 0.033 0.019 -3.916 0.005 0.115
91 UL NICENTRATAMANASIONAL BANK 0.009 -0.010 0.019 0.005 0.000 -0.159 0.009
92 UL NICENTRATAMANASIONAL BANK 0.014 -0.008 0.002 0.020 0.000 0.096 -0.001
93 UL NICHINATRUSTINDONESIA 0.599 1.250 0.110 0.705 1.000 0.097 1.821
94 UL NI CITIBANK N.A. 0.291 0.050 -0.030 0.783 0.000 -0.160 -0.327
95 UL NI CITIBANK N.A. 0.304 -0.032 -0.045 -0.785 0.000 0.008 0.565
96 UL NI CITIBANK N.A. 0.572 -0.044 -0.018 0.004 0.000 0.031 0.080
97 UL NI CITIBANK N.A. -0.224 -0.054 -0.027 -0.046 0.000 0.055 2.590
98 UL NI COMMONWEALTH -0.078 0.070 0.030 -0.014 0.000 0.017 -5.693
99 UL NI COMMONWEALTH 0.086 0.206 0.016 -0.042 0.000 0.005 6.151
100 UL NI COMMONWEALTH 0.030 0.127 -0.003 -0.017 0.000 0.010 0.450
101 UL NI COMMONWEALTH 0.238 -0.002 -0.012 0.006 0.000 -0.006 0.010
102 L NIDANAMON INDONESIATbk 1.350 0.023 -0.010 -0.635 -0.021 0.012 0.167
103 L NIDANAMON INDONESIATbk 2.409 0.045 -0.013 -0.023 0.070 -0.018 0.260
104 L NIDANAMON INDONESIATbk 1.961 0.051 0.073 0.004 0.139 0.046 0.030
105 L NIDANAMON INDONESIATbk -0.867 0.028 -0.028 -0.040 -0.333 -0.017 0.571
106 UL NI DBS INDONESIA 0.921 -0.048 0.052 0.006 0.000 -0.004 5.142
107 UL NI DEUTSCHE BANK AG. -0.129 0.180 -0.080 0.005 0.000 0.013 -0.136
108 UL NI DEUTSCHE BANK AG. 0.071 -0.024 0.129 -0.009 0.000 0.017 0.517
109 UL NIDIPO INTERNATIONALBANK 0.061 -0.010 -0.090 0.035 0.000 0.071 0.047
110 UL NIDIPO INTERNATIONALBANK 0.028 -0.110 0.780 -0.193 1.256 -0.262 -0.047
111 UL NIDIPO INTERNATIONALBANK 0.012 -0.050 0.000 0.161 0.151 0.067 0.000
112 UL NI DKI 0.394 0.025 -0.019 -0.005 -0.151 0.007 0.089
113 UL NI DKI 0.022 0.132 0.159 0.021 0.049 0.000 -0.437
114 L NI EKONOMI RAHARJA Tbk 0.127 -0.028 0.118 -0.789 0.000 0.027 -0.122
115 L NI EKONOMI RAHARJA Tbk 0.258 -0.521 0.557 0.001 0.000 -0.013 -0.082
116 L NI EKONOMI RAHARJA Tbk 0.331 0.011 -0.037 -0.018 0.000 -0.026 0.878
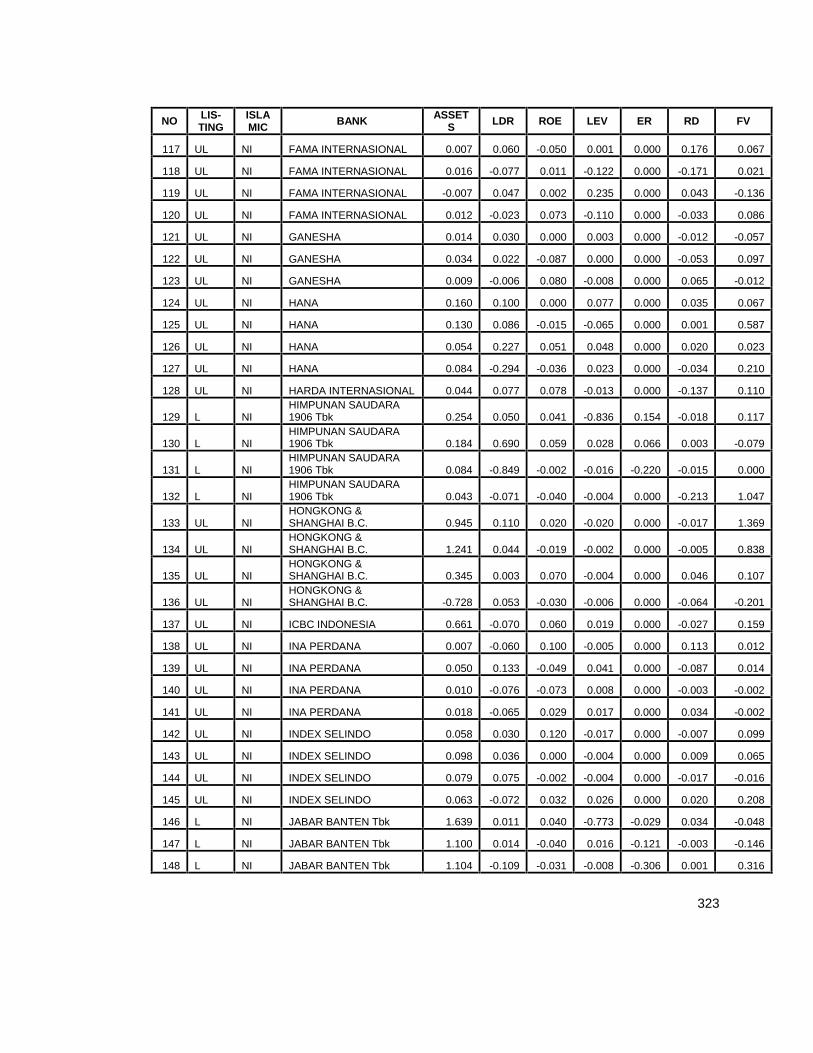
323
NO LIS-TING
ISLAMIC BANK ASSET
S LDR ROE LEV ER RD FV
117 UL NI FAMA INTERNASIONAL 0.007 0.060 -0.050 0.001 0.000 0.176 0.067
118 UL NI FAMA INTERNASIONAL 0.016 -0.077 0.011 -0.122 0.000 -0.171 0.021
119 UL NI FAMA INTERNASIONAL -0.007 0.047 0.002 0.235 0.000 0.043 -0.136
120 UL NI FAMA INTERNASIONAL 0.012 -0.023 0.073 -0.110 0.000 -0.033 0.086
121 UL NI GANESHA 0.014 0.030 0.000 0.003 0.000 -0.012 -0.057
122 UL NI GANESHA 0.034 0.022 -0.087 0.000 0.000 -0.053 0.097
123 UL NI GANESHA 0.009 -0.006 0.080 -0.008 0.000 0.065 -0.012
124 UL NI HANA 0.160 0.100 0.000 0.077 0.000 0.035 0.067
125 UL NI HANA 0.130 0.086 -0.015 -0.065 0.000 0.001 0.587
126 UL NI HANA 0.054 0.227 0.051 0.048 0.000 0.020 0.023
127 UL NI HANA 0.084 -0.294 -0.036 0.023 0.000 -0.034 0.210
128 UL NI HARDA INTERNASIONAL 0.044 0.077 0.078 -0.013 0.000 -0.137 0.110
129 L NIHIMPUNAN SAUDARA1906 Tbk 0.254 0.050 0.041 -0.836 0.154 -0.018 0.117
130 L NIHIMPUNAN SAUDARA1906 Tbk 0.184 0.690 0.059 0.028 0.066 0.003 -0.079
131 L NIHIMPUNAN SAUDARA1906 Tbk 0.084 -0.849 -0.002 -0.016 -0.220 -0.015 0.000
132 L NIHIMPUNAN SAUDARA1906 Tbk 0.043 -0.071 -0.040 -0.004 0.000 -0.213 1.047
133 UL NIHONGKONG &SHANGHAI B.C. 0.945 0.110 0.020 -0.020 0.000 -0.017 1.369
134 UL NIHONGKONG &SHANGHAI B.C. 1.241 0.044 -0.019 -0.002 0.000 -0.005 0.838
135 UL NIHONGKONG &SHANGHAI B.C. 0.345 0.003 0.070 -0.004 0.000 0.046 0.107
136 UL NIHONGKONG &SHANGHAI B.C. -0.728 0.053 -0.030 -0.006 0.000 -0.064 -0.201
137 UL NI ICBC INDONESIA 0.661 -0.070 0.060 0.019 0.000 -0.027 0.159
138 UL NI INA PERDANA 0.007 -0.060 0.100 -0.005 0.000 0.113 0.012
139 UL NI INA PERDANA 0.050 0.133 -0.049 0.041 0.000 -0.087 0.014
140 UL NI INA PERDANA 0.010 -0.076 -0.073 0.008 0.000 -0.003 -0.002
141 UL NI INA PERDANA 0.018 -0.065 0.029 0.017 0.000 0.034 -0.002
142 UL NI INDEX SELINDO 0.058 0.030 0.120 -0.017 0.000 -0.007 0.099
143 UL NI INDEX SELINDO 0.098 0.036 0.000 -0.004 0.000 0.009 0.065
144 UL NI INDEX SELINDO 0.079 0.075 -0.002 -0.004 0.000 -0.017 -0.016
145 UL NI INDEX SELINDO 0.063 -0.072 0.032 0.026 0.000 0.020 0.208
146 L NI JABAR BANTEN Tbk 1.639 0.011 0.040 -0.773 -0.029 0.034 -0.048
147 L NI JABAR BANTEN Tbk 1.100 0.014 -0.040 0.016 -0.121 -0.003 -0.146
148 L NI JABAR BANTEN Tbk 1.104 -0.109 -0.031 -0.008 -0.306 0.001 0.316

324
NO LIS-TING
ISLAMIC BANK ASSET
S LDR ROE LEV ER RD FV
149 UL NI JABAR BANTEN Tbk 0.630 -0.070 0.026 -0.009 0.000 -0.002 -2.037
150 UL I JABAR SYARIAH 0.231 -0.333 -0.049 0.858 0.790 0.004 -0.090
151 UL NI JASA JAKARTA 0.024 0.060 0.000 -0.005 -0.035 0.007 0.076
152 UL NI JASA JAKARTA 0.034 -0.016 -0.016 0.005 0.695 -0.013 -0.080
153 UL NI JASA JAKARTA 0.055 -0.004 0.011 -0.003 -1.267 0.062 0.242
154 UL NI JASA JAKARTA 0.041 0.015 0.011 -0.012 0.000 -0.328 0.103
155 L NI JATIM (go public) 0.427 0.035 0.144 -0.680 -0.710 0.023 0.135
156 UL NI JATIM 0.485 -0.006 -0.215 0.006 0.552 0.007 -2.041
157 UL NI JATIM 0.256 0.114 0.115 -0.019 0.044 -0.017 -0.530
158 UL NI JATIM 0.114 0.192 -0.025 -0.007 0.004 0.014 1.570
159 UL NI JAWA TENGAH 0.350 0.120 0.050 -0.002 0.000 -0.001 0.371
160 UL NI JAWA TENGAH 0.427 -0.041 -0.010 0.001 0.000 -0.008 0.378
161 UL NI JAWA TENGAH 0.393 -0.151 -0.082 0.014 0.000 0.016 0.146
162 UL NI JP MORGAN 1.085 1.200 0.130 0.997 1.000 0.042 0.360
163 UL NI KALIMANTAN BARAT 0.839 0.860 0.260 0.890 0.500 0.151 1.009
164 UL NI KALIMANTAN SELATAN 0.187 -0.119 -0.136 0.030 -0.143 0.190 0.057
165 UL NI KALIMANTAN SELATAN 0.049 0.070 0.019 -0.020 -0.147 0.011 -0.018
166 UL NI KALIMANTAN TENGAH 0.155 -0.177 -0.018 0.008 0.003 0.066 0.192
167 UL NI KALIMANTAN TIMUR 0.795 -0.227 -0.091 0.033 0.000 0.051 0.537
168 UL NI KALIMANTAN TIMUR 0.187 -0.034 0.108 -0.019 0.000 -0.049 0.798
169 UL NI KALIMANTAN TIMUR -0.172 0.511 -0.287 -0.059 0.000 0.043 0.553
170 UL NI KEB INDONESIA 0.131 0.221 -0.013 0.038 0.000 -0.070 0.247
171 UL NI KEB INDONESIA -0.009 0.306 -0.026 -0.041 0.000 0.031 0.115
172 L NI KESAWAN Tbk 0.105 0.120 -0.750 -0.566 0.000 0.037 -0.127
173 L NI KESAWAN Tbk 0.100 0.034 0.712 -0.086 0.000 -0.037 0.436
174 L NI KESAWAN Tbk 0.024 0.047 -0.025 -0.086 0.000 0.019 -0.102
175 L NI KESAWAN Tbk 0.019 -0.077 0.004 -0.013 0.000 -0.014 0.652
176 UL NIKESEJAHTERAANEKONOMI 0.054 -0.060 -0.010 0.003 0.265 0.012 0.077
177 UL NIKESEJAHTERAANEKONOMI 0.047 -0.053 0.023 0.010 1.135 0.000 -0.010
178 UL NILIMAN INTERNATIONALBANK 0.052 1.010 0.020 0.588 1.000 0.065 0.222
179 UL NI MALUKU 0.102 -0.040 -0.050 -0.003 0.200 0.017 0.161
180 UL NI MALUKU 0.106 -0.207 0.099 0.001 0.189 -0.038 0.053
181 UL NI MALUKU 0.049 0.081 0.000 0.013 -0.139 0.032 0.000
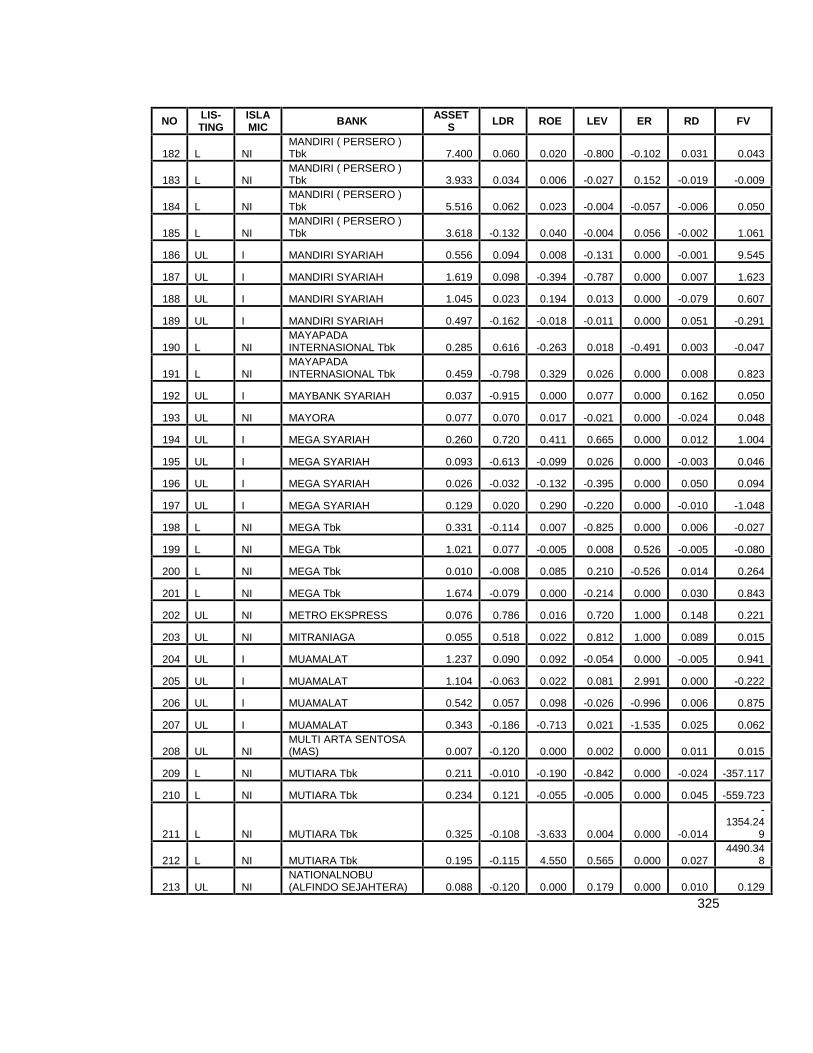
325
NO LIS-TING
ISLAMIC BANK ASSET
S LDR ROE LEV ER RD FV
182 L NIMANDIRI ( PERSERO )Tbk 7.400 0.060 0.020 -0.800 -0.102 0.031 0.043
183 L NIMANDIRI ( PERSERO )Tbk 3.933 0.034 0.006 -0.027 0.152 -0.019 -0.009
184 L NIMANDIRI ( PERSERO )Tbk 5.516 0.062 0.023 -0.004 -0.057 -0.006 0.050
185 L NIMANDIRI ( PERSERO )Tbk 3.618 -0.132 0.040 -0.004 0.056 -0.002 1.061
186 UL I MANDIRI SYARIAH 0.556 0.094 0.008 -0.131 0.000 -0.001 9.545
187 UL I MANDIRI SYARIAH 1.619 0.098 -0.394 -0.787 0.000 0.007 1.623
188 UL I MANDIRI SYARIAH 1.045 0.023 0.194 0.013 0.000 -0.079 0.607
189 UL I MANDIRI SYARIAH 0.497 -0.162 -0.018 -0.011 0.000 0.051 -0.291
190 L NIMAYAPADAINTERNASIONAL Tbk 0.285 0.616 -0.263 0.018 -0.491 0.003 -0.047
191 L NIMAYAPADAINTERNASIONAL Tbk 0.459 -0.798 0.329 0.026 0.000 0.008 0.823
192 UL I MAYBANK SYARIAH 0.037 -0.915 0.000 0.077 0.000 0.162 0.050
193 UL NI MAYORA 0.077 0.070 0.017 -0.021 0.000 -0.024 0.048
194 UL I MEGA SYARIAH 0.260 0.720 0.411 0.665 0.000 0.012 1.004
195 UL I MEGA SYARIAH 0.093 -0.613 -0.099 0.026 0.000 -0.003 0.046
196 UL I MEGA SYARIAH 0.026 -0.032 -0.132 -0.395 0.000 0.050 0.094
197 UL I MEGA SYARIAH 0.129 0.020 0.290 -0.220 0.000 -0.010 -1.048
198 L NI MEGA Tbk 0.331 -0.114 0.007 -0.825 0.000 0.006 -0.027
199 L NI MEGA Tbk 1.021 0.077 -0.005 0.008 0.526 -0.005 -0.080
200 L NI MEGA Tbk 0.010 -0.008 0.085 0.210 -0.526 0.014 0.264
201 L NI MEGA Tbk 1.674 -0.079 0.000 -0.214 0.000 0.030 0.843
202 UL NI METRO EKSPRESS 0.076 0.786 0.016 0.720 1.000 0.148 0.221
203 UL NI MITRANIAGA 0.055 0.518 0.022 0.812 1.000 0.089 0.015
204 UL I MUAMALAT 1.237 0.090 0.092 -0.054 0.000 -0.005 0.941
205 UL I MUAMALAT 1.104 -0.063 0.022 0.081 2.991 0.000 -0.222
206 UL I MUAMALAT 0.542 0.057 0.098 -0.026 -0.996 0.006 0.875
207 UL I MUAMALAT 0.343 -0.186 -0.713 0.021 -1.535 0.025 0.062
208 UL NIMULTI ARTA SENTOSA(MAS) 0.007 -0.120 0.000 0.002 0.000 0.011 0.015
209 L NI MUTIARA Tbk 0.211 -0.010 -0.190 -0.842 0.000 -0.024 -357.117
210 L NI MUTIARA Tbk 0.234 0.121 -0.055 -0.005 0.000 0.045 -559.723
211 L NI MUTIARA Tbk 0.325 -0.108 -3.633 0.004 0.000 -0.014
-1354.24
9
212 L NI MUTIARA Tbk 0.195 -0.115 4.550 0.565 0.000 0.0274490.34
8
213 UL NINATIONALNOBU(ALFINDO SEJAHTERA) 0.088 -0.120 0.000 0.179 0.000 0.010 0.129
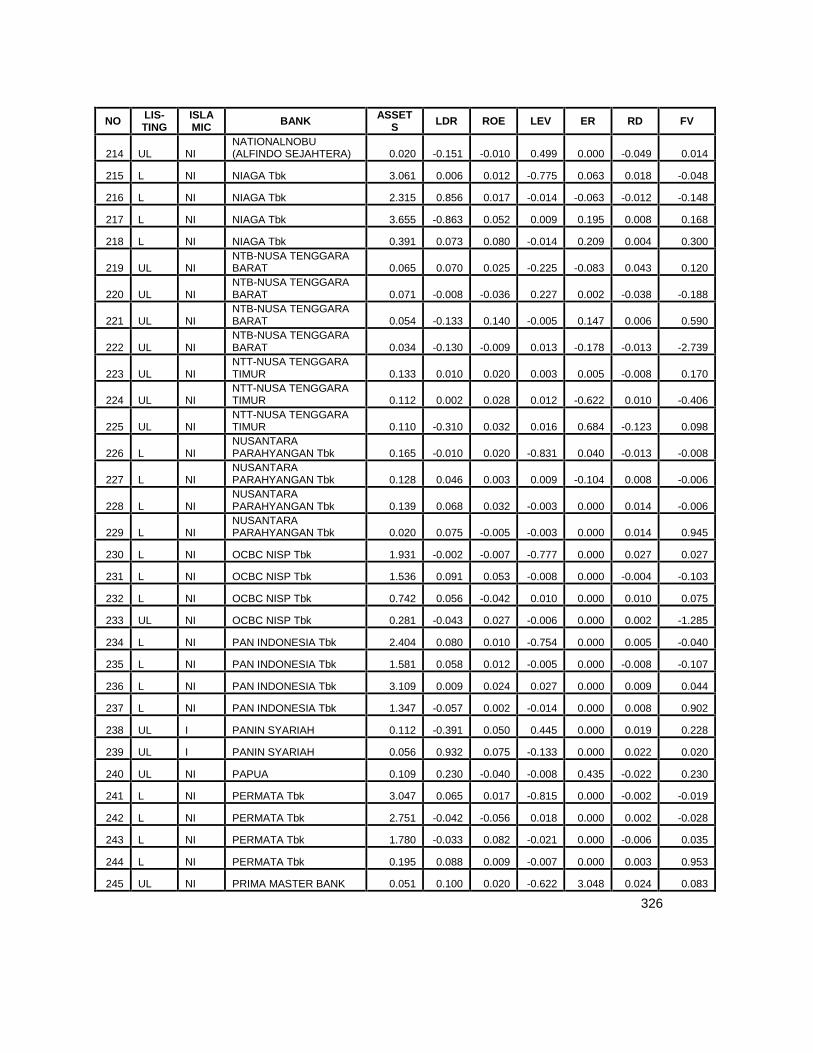
326
NO LIS-TING
ISLAMIC BANK ASSET
S LDR ROE LEV ER RD FV
214 UL NINATIONALNOBU(ALFINDO SEJAHTERA) 0.020 -0.151 -0.010 0.499 0.000 -0.049 0.014
215 L NI NIAGA Tbk 3.061 0.006 0.012 -0.775 0.063 0.018 -0.048
216 L NI NIAGA Tbk 2.315 0.856 0.017 -0.014 -0.063 -0.012 -0.148
217 L NI NIAGA Tbk 3.655 -0.863 0.052 0.009 0.195 0.008 0.168
218 L NI NIAGA Tbk 0.391 0.073 0.080 -0.014 0.209 0.004 0.300
219 UL NINTB-NUSA TENGGARABARAT 0.065 0.070 0.025 -0.225 -0.083 0.043 0.120
220 UL NINTB-NUSA TENGGARABARAT 0.071 -0.008 -0.036 0.227 0.002 -0.038 -0.188
221 UL NINTB-NUSA TENGGARABARAT 0.054 -0.133 0.140 -0.005 0.147 0.006 0.590
222 UL NINTB-NUSA TENGGARABARAT 0.034 -0.130 -0.009 0.013 -0.178 -0.013 -2.739
223 UL NINTT-NUSA TENGGARATIMUR 0.133 0.010 0.020 0.003 0.005 -0.008 0.170
224 UL NINTT-NUSA TENGGARATIMUR 0.112 0.002 0.028 0.012 -0.622 0.010 -0.406
225 UL NINTT-NUSA TENGGARATIMUR 0.110 -0.310 0.032 0.016 0.684 -0.123 0.098
226 L NINUSANTARAPARAHYANGAN Tbk 0.165 -0.010 0.020 -0.831 0.040 -0.013 -0.008
227 L NINUSANTARAPARAHYANGAN Tbk 0.128 0.046 0.003 0.009 -0.104 0.008 -0.006
228 L NINUSANTARAPARAHYANGAN Tbk 0.139 0.068 0.032 -0.003 0.000 0.014 -0.006
229 L NINUSANTARAPARAHYANGAN Tbk 0.020 0.075 -0.005 -0.003 0.000 0.014 0.945
230 L NI OCBC NISP Tbk 1.931 -0.002 -0.007 -0.777 0.000 0.027 0.027
231 L NI OCBC NISP Tbk 1.536 0.091 0.053 -0.008 0.000 -0.004 -0.103
232 L NI OCBC NISP Tbk 0.742 0.056 -0.042 0.010 0.000 0.010 0.075
233 UL NI OCBC NISP Tbk 0.281 -0.043 0.027 -0.006 0.000 0.002 -1.285
234 L NI PAN INDONESIA Tbk 2.404 0.080 0.010 -0.754 0.000 0.005 -0.040
235 L NI PAN INDONESIA Tbk 1.581 0.058 0.012 -0.005 0.000 -0.008 -0.107
236 L NI PAN INDONESIA Tbk 3.109 0.009 0.024 0.027 0.000 0.009 0.044
237 L NI PAN INDONESIA Tbk 1.347 -0.057 0.002 -0.014 0.000 0.008 0.902
238 UL I PANIN SYARIAH 0.112 -0.391 0.050 0.445 0.000 0.019 0.228
239 UL I PANIN SYARIAH 0.056 0.932 0.075 -0.133 0.000 0.022 0.020
240 UL NI PAPUA 0.109 0.230 -0.040 -0.008 0.435 -0.022 0.230
241 L NI PERMATA Tbk 3.047 0.065 0.017 -0.815 0.000 -0.002 -0.019
242 L NI PERMATA Tbk 2.751 -0.042 -0.056 0.018 0.000 0.002 -0.028
243 L NI PERMATA Tbk 1.780 -0.033 0.082 -0.021 0.000 -0.006 0.035
244 L NI PERMATA Tbk 0.195 0.088 0.009 -0.007 0.000 0.003 0.953
245 UL NI PRIMA MASTER BANK 0.051 0.100 0.020 -0.622 3.048 0.024 0.083
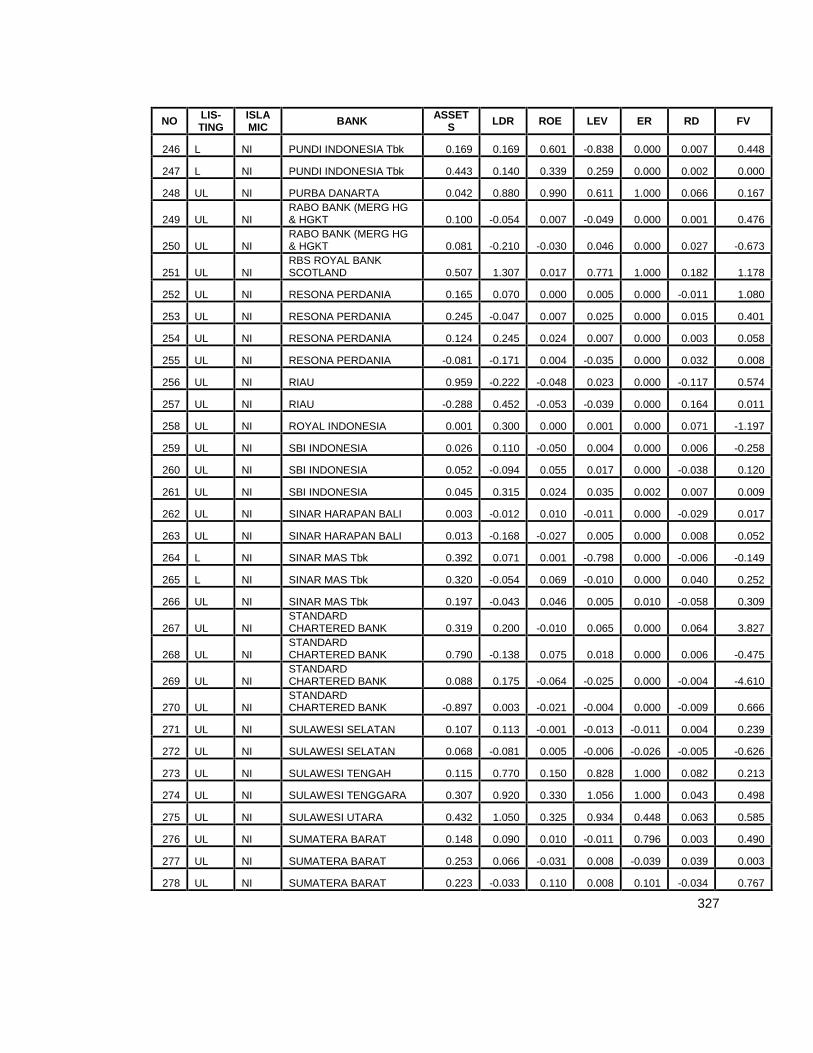
327
NO LIS-TING
ISLAMIC BANK ASSET
S LDR ROE LEV ER RD FV
246 L NI PUNDI INDONESIA Tbk 0.169 0.169 0.601 -0.838 0.000 0.007 0.448
247 L NI PUNDI INDONESIA Tbk 0.443 0.140 0.339 0.259 0.000 0.002 0.000
248 UL NI PURBA DANARTA 0.042 0.880 0.990 0.611 1.000 0.066 0.167
249 UL NIRABO BANK (MERG HG& HGKT 0.100 -0.054 0.007 -0.049 0.000 0.001 0.476
250 UL NIRABO BANK (MERG HG& HGKT 0.081 -0.210 -0.030 0.046 0.000 0.027 -0.673
251 UL NIRBS ROYAL BANKSCOTLAND 0.507 1.307 0.017 0.771 1.000 0.182 1.178
252 UL NI RESONA PERDANIA 0.165 0.070 0.000 0.005 0.000 -0.011 1.080
253 UL NI RESONA PERDANIA 0.245 -0.047 0.007 0.025 0.000 0.015 0.401
254 UL NI RESONA PERDANIA 0.124 0.245 0.024 0.007 0.000 0.003 0.058
255 UL NI RESONA PERDANIA -0.081 -0.171 0.004 -0.035 0.000 0.032 0.008
256 UL NI RIAU 0.959 -0.222 -0.048 0.023 0.000 -0.117 0.574
257 UL NI RIAU -0.288 0.452 -0.053 -0.039 0.000 0.164 0.011
258 UL NI ROYAL INDONESIA 0.001 0.300 0.000 0.001 0.000 0.071 -1.197
259 UL NI SBI INDONESIA 0.026 0.110 -0.050 0.004 0.000 0.006 -0.258
260 UL NI SBI INDONESIA 0.052 -0.094 0.055 0.017 0.000 -0.038 0.120
261 UL NI SBI INDONESIA 0.045 0.315 0.024 0.035 0.002 0.007 0.009
262 UL NI SINAR HARAPAN BALI 0.003 -0.012 0.010 -0.011 0.000 -0.029 0.017
263 UL NI SINAR HARAPAN BALI 0.013 -0.168 -0.027 0.005 0.000 0.008 0.052
264 L NI SINAR MAS Tbk 0.392 0.071 0.001 -0.798 0.000 -0.006 -0.149
265 L NI SINAR MAS Tbk 0.320 -0.054 0.069 -0.010 0.000 0.040 0.252
266 UL NI SINAR MAS Tbk 0.197 -0.043 0.046 0.005 0.010 -0.058 0.309
267 UL NISTANDARDCHARTERED BANK 0.319 0.200 -0.010 0.065 0.000 0.064 3.827
268 UL NISTANDARDCHARTERED BANK 0.790 -0.138 0.075 0.018 0.000 0.006 -0.475
269 UL NISTANDARDCHARTERED BANK 0.088 0.175 -0.064 -0.025 0.000 -0.004 -4.610
270 UL NISTANDARDCHARTERED BANK -0.897 0.003 -0.021 -0.004 0.000 -0.009 0.666
271 UL NI SULAWESI SELATAN 0.107 0.113 -0.001 -0.013 -0.011 0.004 0.239
272 UL NI SULAWESI SELATAN 0.068 -0.081 0.005 -0.006 -0.026 -0.005 -0.626
273 UL NI SULAWESI TENGAH 0.115 0.770 0.150 0.828 1.000 0.082 0.213
274 UL NI SULAWESI TENGGARA 0.307 0.920 0.330 1.056 1.000 0.043 0.498
275 UL NI SULAWESI UTARA 0.432 1.050 0.325 0.934 0.448 0.063 0.585
276 UL NI SUMATERA BARAT 0.148 0.090 0.010 -0.011 0.796 0.003 0.490
277 UL NI SUMATERA BARAT 0.253 0.066 -0.031 0.008 -0.039 0.039 0.003
278 UL NI SUMATERA BARAT 0.223 -0.033 0.110 0.008 0.101 -0.034 0.767
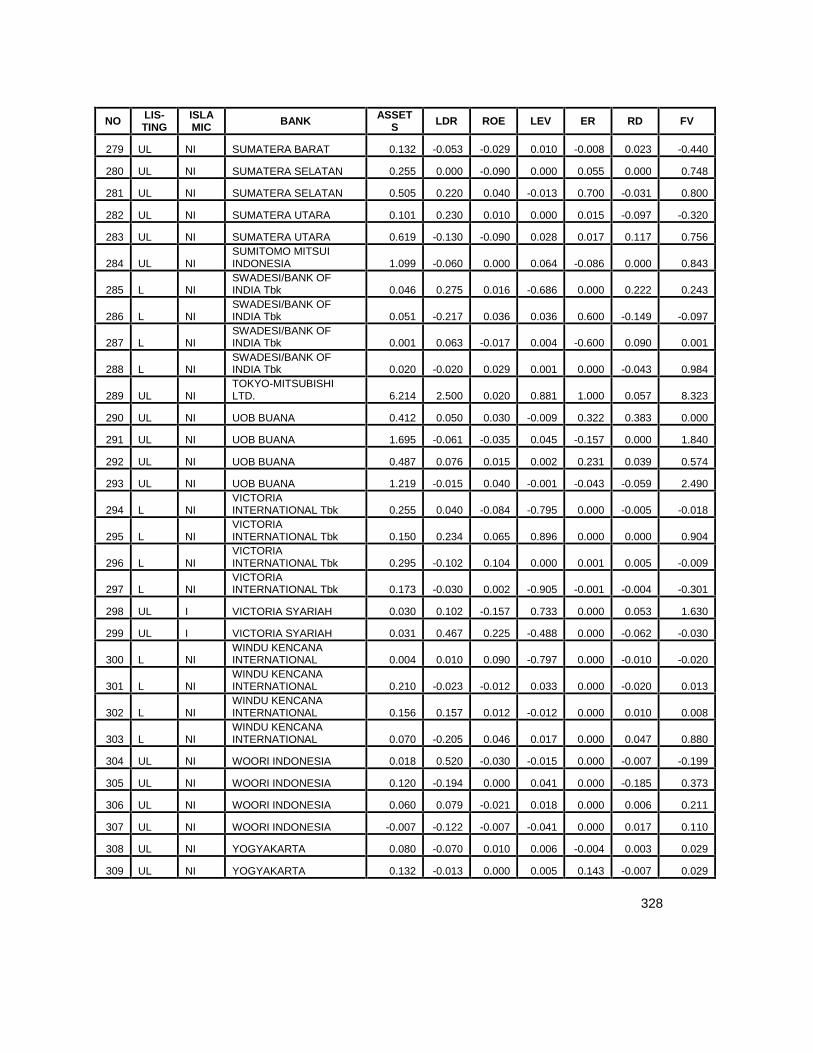
328
NO LIS-TING
ISLAMIC BANK ASSET
S LDR ROE LEV ER RD FV
279 UL NI SUMATERA BARAT 0.132 -0.053 -0.029 0.010 -0.008 0.023 -0.440
280 UL NI SUMATERA SELATAN 0.255 0.000 -0.090 0.000 0.055 0.000 0.748
281 UL NI SUMATERA SELATAN 0.505 0.220 0.040 -0.013 0.700 -0.031 0.800
282 UL NI SUMATERA UTARA 0.101 0.230 0.010 0.000 0.015 -0.097 -0.320
283 UL NI SUMATERA UTARA 0.619 -0.130 -0.090 0.028 0.017 0.117 0.756
284 UL NISUMITOMO MITSUIINDONESIA 1.099 -0.060 0.000 0.064 -0.086 0.000 0.843
285 L NISWADESI/BANK OFINDIA Tbk 0.046 0.275 0.016 -0.686 0.000 0.222 0.243
286 L NISWADESI/BANK OFINDIA Tbk 0.051 -0.217 0.036 0.036 0.600 -0.149 -0.097
287 L NISWADESI/BANK OFINDIA Tbk 0.001 0.063 -0.017 0.004 -0.600 0.090 0.001
288 L NISWADESI/BANK OFINDIA Tbk 0.020 -0.020 0.029 0.001 0.000 -0.043 0.984
289 UL NITOKYO-MITSUBISHILTD. 6.214 2.500 0.020 0.881 1.000 0.057 8.323
290 UL NI UOB BUANA 0.412 0.050 0.030 -0.009 0.322 0.383 0.000
291 UL NI UOB BUANA 1.695 -0.061 -0.035 0.045 -0.157 0.000 1.840
292 UL NI UOB BUANA 0.487 0.076 0.015 0.002 0.231 0.039 0.574
293 UL NI UOB BUANA 1.219 -0.015 0.040 -0.001 -0.043 -0.059 2.490
294 L NIVICTORIAINTERNATIONAL Tbk 0.255 0.040 -0.084 -0.795 0.000 -0.005 -0.018
295 L NIVICTORIAINTERNATIONAL Tbk 0.150 0.234 0.065 0.896 0.000 0.000 0.904
296 L NIVICTORIAINTERNATIONAL Tbk 0.295 -0.102 0.104 0.000 0.001 0.005 -0.009
297 L NIVICTORIAINTERNATIONAL Tbk 0.173 -0.030 0.002 -0.905 -0.001 -0.004 -0.301
298 UL I VICTORIA SYARIAH 0.030 0.102 -0.157 0.733 0.000 0.053 1.630
299 UL I VICTORIA SYARIAH 0.031 0.467 0.225 -0.488 0.000 -0.062 -0.030
300 L NIWINDU KENCANAINTERNATIONAL 0.004 0.010 0.090 -0.797 0.000 -0.010 -0.020
301 L NIWINDU KENCANAINTERNATIONAL 0.210 -0.023 -0.012 0.033 0.000 -0.020 0.013
302 L NIWINDU KENCANAINTERNATIONAL 0.156 0.157 0.012 -0.012 0.000 0.010 0.008
303 L NIWINDU KENCANAINTERNATIONAL 0.070 -0.205 0.046 0.017 0.000 0.047 0.880
304 UL NI WOORI INDONESIA 0.018 0.520 -0.030 -0.015 0.000 -0.007 -0.199
305 UL NI WOORI INDONESIA 0.120 -0.194 0.000 0.041 0.000 -0.185 0.373
306 UL NI WOORI INDONESIA 0.060 0.079 -0.021 0.018 0.000 0.006 0.211
307 UL NI WOORI INDONESIA -0.007 -0.122 -0.007 -0.041 0.000 0.017 0.110
308 UL NI YOGYAKARTA 0.080 -0.070 0.010 0.006 -0.004 0.003 0.029
309 UL NI YOGYAKARTA 0.132 -0.013 0.000 0.005 0.143 -0.007 0.029

329
NO LIS-TING
ISLAMIC BANK ASSET
S LDR ROE LEV ER RD FV
310 UL NI YOGYAKARTA 0.073 0.043 -0.050 0.012 0.001 0.013 0.000
311 UL NI YUDHA BHAKTI 0.027 0.110 -0.010 -0.005 -0.145 0.037 1.554
312 UL NI YUDHA BHAKTI 0.012 0.000 -0.072 0.004 -0.475 -0.008 -0.089
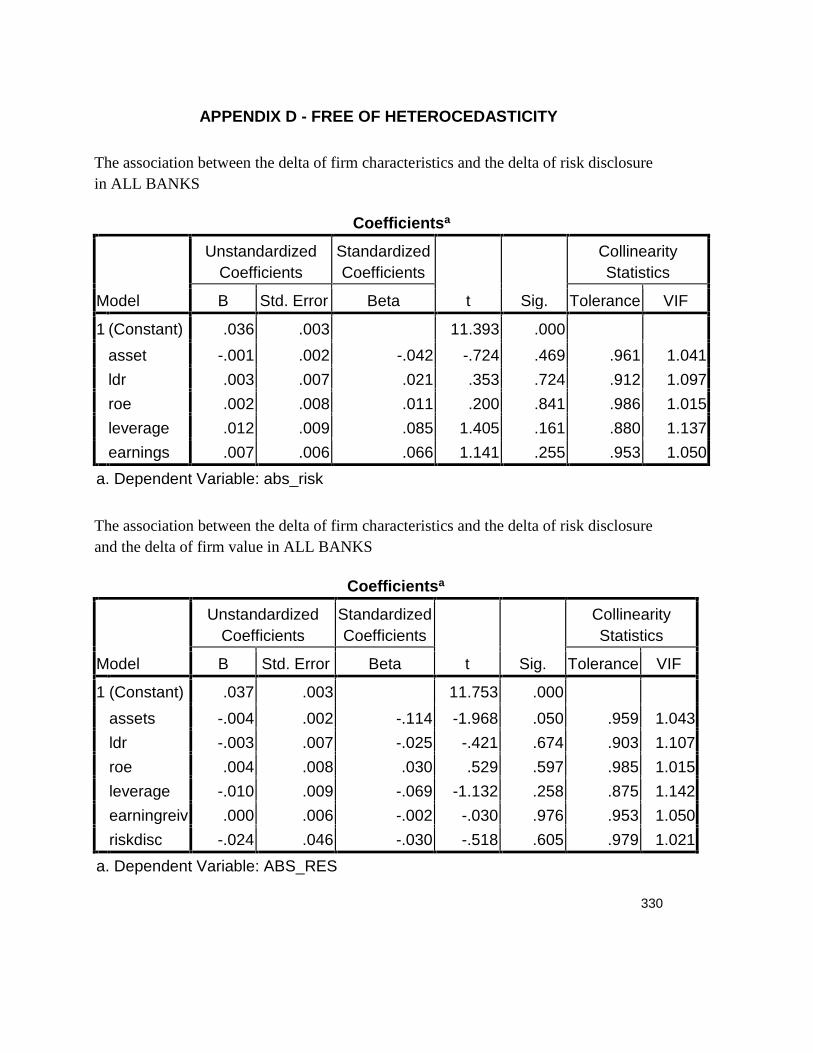
330
APPENDIX D - FREE OF HETEROCEDASTICITY
The association between the delta of firm characteristics and the delta of risk disclosurein ALL BANKS
Coefficientsa
Model
UnstandardizedCoefficients
StandardizedCoefficients
t Sig.
CollinearityStatistics
B Std. Error Beta Tolerance VIF
1 (Constant) .036 .003 11.393 .000asset -.001 .002 -.042 -.724 .469 .961 1.041ldr .003 .007 .021 .353 .724 .912 1.097roe .002 .008 .011 .200 .841 .986 1.015leverage .012 .009 .085 1.405 .161 .880 1.137earnings .007 .006 .066 1.141 .255 .953 1.050
a. Dependent Variable: abs_risk
The association between the delta of firm characteristics and the delta of risk disclosureand the delta of firm value in ALL BANKS
Coefficientsa
Model
UnstandardizedCoefficients
StandardizedCoefficients
t Sig.
CollinearityStatistics
B Std. Error Beta Tolerance VIF
1 (Constant) .037 .003 11.753 .000assets -.004 .002 -.114 -1.968 .050 .959 1.043ldr -.003 .007 -.025 -.421 .674 .903 1.107roe .004 .008 .030 .529 .597 .985 1.015leverage -.010 .009 -.069 -1.132 .258 .875 1.142earningreiv .000 .006 -.002 -.030 .976 .953 1.050riskdisc -.024 .046 -.030 -.518 .605 .979 1.021
a. Dependent Variable: ABS_RES

331
The association between the delta of firm characteristics and the delta of risk disclosurein LISTED BANKS
Coefficientsa
Model
UnstandardizedCoefficients
StandardizedCoefficients
t Sig.
CollinearityStatistics
B Std. Error Beta Tolerance VIF
1 (Constant) .027 .005 5.471 .000asset .000 .002 .025 .256 .799 .959 1.043ldr .005 .017 .028 .286 .776 .952 1.051roe -.001 .007 -.016 -.168 .867 .986 1.014leverage .008 .010 .076 .796 .428 .978 1.022earningsre .004 .009 .041 .421 .674 .943 1.060
a. Dependent Variable: ABS_RISK_LISTED
The association between the delta of firm characteristics and the delta of risk disclosureand the delta of firm value in LISTED BANKS
Coefficientsa
Model
UnstandardizedCoefficients
StandardizedCoefficients
t Sig.
CollinearityStatistics
BStd.Error Beta Tolerance VIF
1 (Constant) 112.263 21.846 5.139 .000asset -11.388 8.382 -.129 -1.359 .177 .952 1.050ldr -18.696 77.196 -.023 -.242 .809 .949 1.054roe 46.785 29.955 .146 1.562 .121 .983 1.017leverage 60.078 43.216 .131 1.390 .167 .969 1.032earningsre 11.905 39.502 .029 .301 .764 .938 1.066riskdisc 177.475 357.598 .047 .496 .621 .971 1.030
a. Dependent Variable: ABS_FIRM_LISTED

332
The association between the delta of firm characteristics and the delta of risk disclosurein UNLISTED BANKS
Coefficientsa
Model
UnstandardizedCoefficients
StandardizedCoefficients
t Sig.
CollinearityStatistics
BStd.Error Beta Tolerance VIF
1 (Constant) .041 .004 9.662 .000asset -.006 .007 -.064 -.847 .398 .896 1.116ldr -.004 .009 -.038 -.465 .643 .786 1.272roe .030 .028 .081 1.072 .285 .897 1.115leverage .008 .016 .037 .462 .645 .785 1.273earningsre .006 .008 .059 .768 .443 .880 1.136
a. Dependent Variable: ABS_RISK_UNLISTED
The association between the delta of firm characteristics and the delta of risk disclosureand the delta of firm value in UNLISTED BANKS
Coefficientsa
Model
UnstandardizedCoefficients
StandardizedCoefficients
t Sig.
CollinearityStatistics
BStd.Error Beta Tolerance VIF
1 (Constant) .506 .084 6.036 .000asset .171 .148 .088 1.151 .251 .896 1.116ldr .035 .174 .016 .200 .842 .784 1.276roe -.185 .564 -.025 -.327 .744 .876 1.142leverage -.278 .331 -.070 -.842 .401 .755 1.324earningre -.004 .149 -.002 -.028 .978 .879 1.137riskdisc .386 1.136 .025 .339 .735 .931 1.074
a. Dependent Variable: ABS_FIRM_UNLISTED

333
The association between the delta of firm characteristics and the delta of risk disclosurein ISLAMIC BANKS
Coefficientsa
Model
UnstandardizedCoefficients
StandardizedCoefficients
t Sig.
CollinearityStatistics
BStd.Error Beta Tolerance VIF
1 (Constant) .037 .008 4.756 .000asset -.013 .015 -.203 -.883 .387 .781 1.280ldr -.023 .016 -.294 -1.389 .179 .918 1.090roe .012 .024 .106 .482 .635 .850 1.176leverage -.017 .018 -.204 -.915 .371 .826 1.211earngre -.001 .009 -.028 -.126 .901 .825 1.212
a. Dependent Variable: ABS_RISK_ISLM
The association between the delta of firm characteristics and the delta of risk disclosureand the delta of firm value in ISLAMIC BANKS
Coefficientsa
Model
UnstandardizedCoefficients
StandardizedCoefficients
t Sig.
CollinearityStatistics
BStd.Error Beta Tolerance VIF
1 (Constant) .671 .547 1.228 .234asset .424 .997 .111 .425 .675 .720 1.388ldr .380 1.075 .084 .354 .727 .852 1.174roe -.162 1.537 -.025 -.105 .917 .826 1.210leverage -.110 1.139 -.023 -.096 .924 .826 1.211earngs -.059 .544 -.027 -.109 .914 .825 1.212riskdis -.784 8.279 -.023 -.095 .926 .806 1.241
a. Dependent Variable: ABS_FIRM_ISL

334
The association between the delta of firm characteristics and the delta of risk disclosurein NON-ISLAMIC BANKS
Coefficientsa
Model
UnstandardizedCoefficients
StandardizedCoefficients
t Sig.
CollinearityStatistics
BStd.Error Beta Tolerance VIF
1 (Constant) .037 .008 4.756 .000asset -.013 .015 -.203 -.883 .387 .781 1.280ldr -.023 .016 -.294 -1.389 .179 .918 1.090roe .012 .024 .106 .482 .635 .850 1.176leverage -.017 .018 -.204 -.915 .371 .826 1.211earngre -.001 .009 -.028 -.126 .901 .825 1.212
a. Dependent Variable: ABS_RISK_ISLM
The association between the delta of firm characteristics and the delta of risk disclosureand the delta of firm value in NON-ISLAMIC BANKS
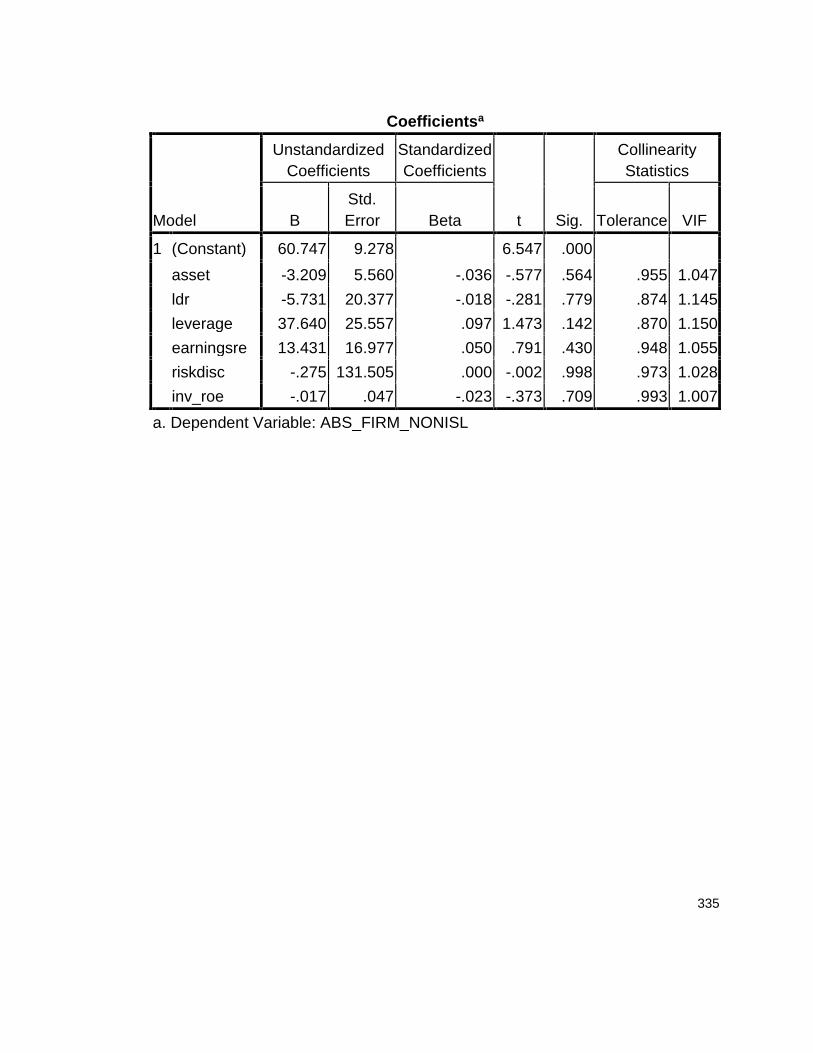
335
Coefficientsa
Model
UnstandardizedCoefficients
StandardizedCoefficients
t Sig.
CollinearityStatistics
BStd.Error Beta Tolerance VIF
1 (Constant) 60.747 9.278 6.547 .000asset -3.209 5.560 -.036 -.577 .564 .955 1.047ldr -5.731 20.377 -.018 -.281 .779 .874 1.145leverage 37.640 25.557 .097 1.473 .142 .870 1.150earningsre 13.431 16.977 .050 .791 .430 .948 1.055riskdisc -.275 131.505 .000 -.002 .998 .973 1.028inv_roe -.017 .047 -.023 -.373 .709 .993 1.007
a. Dependent Variable: ABS_FIRM_NONISL

336
APPENDIX E - THE BANKS WERE EXCLUDED
NO. LISTING ISLAMIC YEAR BANK NOTE1 UL NIB 2008 JAMBI blank2 UL NIB 2008 KALIMANTAN SELATAN blank3 UL NIB 2008 MASPION blank4 UL NIB 2008 SBI INDONESIA blank5 UL NIB 2009 JAMBI blank6 UL NIB 2009 MASPION blank7 UL NIB 2010 JAMBI blank8 UL NIB 2010 MASPION blank9 UL NIB 2010 YOGYAKARTA blank
10 UL NIB 2011 HARDA INTERNASIONAL blank11 UL NIB 2011 JAMBI blank12 UL NIB 2011 MASPION blank13 UL NIB 2011 SULAWESI UTARA blank14 UL NIB 2012 BANK OF AMERICA blank15 UL NIB 2012 JAMBI blank16 L NIB 2012 MAYAPADA INTERNASIONAL Tbk blank17 UL I 2008 BRI SYARIAH cannot be converted18 L NIB 2011 SINAR MAS Tbk cannot be converted19 UL NIB 2012 KALIMANTAN SELATAN cannot be converted20 UL NIB 2012 SULAWESI UTARA cannot be converted21 UL NIB 2008 KALIMANTAN BARAT cannot be downloaded22 UL NIB 2009 KALIMANTAN BARAT cannot be downloaded23 UL NIB 2009 RABO BANK (MERG HG & HGKT cannot be downloaded24 UL NIB 2010 ACEH cannot be downloaded25 UL NIB 2010 PAPUA cannot be downloaded26 UL NIB 2010 PRIMA MASTER BANK cannot be downloaded27 UL NIB 2010 RIAU cannot be downloaded28 UL NIB 2011 KALIMANTAN BARAT cannot be downloaded29 UL NIB 2011 KALIMANTAN TENGAH cannot be downloaded30 UL NIB 2011 MITRANIAGA cannot be downloaded31 UL NIB 2011 RABO BANK (MERG HG & HGKT) cannot be downloaded32 UL NIB 2011 RIAU cannot be downloaded33 UL NIB 2012 CHINATRUST INDONESIA cannot be downloaded34 UL NIB 2012 MITRANIAGA cannot be downloaded

337
NO. LISTING ISLAMIC YEAR BANK NOTE35 UL NIB 2010 KALIMANTAN BARAT damaged36 UL NIB 2011 KEB INDONESIA damaged37 UL NIB 2012 DKI damaged38 UL NIB 2012 KALIMANTAN TIMUR damaged39 UL I 2008 BCA SYARIAH has not established yet40 UL I 2008 BNI SYARIAH has not established yet41 UL I 2008 JABAR SYARIAH has not established yet42 UL I 2008 MAYBANK SYARIAH has not established yet43 UL I 2008 PANIN SYARIAH has not established yet44 UL I 2008 VICTORIA SYARIAH has not established yet45 UL I 2009 BCA SYARIAH has not established yet46 UL I 2009 BNI SYARIAH has not established yet47 UL I 2009 JABAR SYARIAH has not established yet48 UL I 2009 MAYBANK SYARIAH has not established yet49 UL I 2009 VICTORIA SYARIAH has not established yet50 L NIB 2008 PUNDI INDONESIA Tbk na51 UL NIB 2008 ACEH na52 UL NIB 2008 AGRIS na
53 UL NIB 2008AMIN-ANGLOMAS INTERNASIONALBANK na
54 UL NIB 2008 ANDARA (D/H PT. BANK SRI PARTHA) na55 UL NIB 2008 ANTAR DAERAH na56 UL NIB 2008 ANZ PANIN BANK na57 UL NIB 2008 BANK OF AMERICA na58 UL NIB 2008 BANK OF CHINA na59 UL NIB 2008 BENGKULU na60 UL NIB 2008 BISNIS INTERNASIONAL na61 UL NIB 2008 CHINATRUST INDONESIA na62 UL NIB 2008 DBS INDONESIA na63 UL NIB 2008 DEUTSCHE BANK na64 UL NIB 2008 DIPO INTERNATIONAL BANK na65 UL NIB 2008 DKI na66 UL NIB 2008 GANESHA na67 UL NIB 2008 HARDA INTERNASIONAL na68 UL NIB 2008 ICBC INDONESIA na69 UL NIB 2008 JAWA TENGAH na70 UL NIB 2008 JP MORGAN na

338
NO. LISTING ISLAMIC YEAR BANK NOTE71 UL NIB 2008 KALIMANTAN TENGAH na72 UL NIB 2008 KEB INDONESIA na73 UL NIB 2008 KESEJAHTERAAN EKONOMI na74 UL NIB 2008 LAMPUNG na75 UL NIB 2008 LIMAN INTERNATIONAL BANK (dinar) na76 UL NIB 2008 MALUKU na77 UL NIB 2008 MAYORA na78 UL NIB 2008 MESTIKA DHARMA na79 UL NIB 2008 METRO EKSPRESS na80 UL NIB 2008 MITRANIAGA na81 UL NIB 2008 MIZUHO na82 UL NIB 2008 MULTI ARTA SENTOSA (MAS) na
83 UL NIB 2008NATIONALNOBU (ALFINDOSEJAHTERA) na
84 UL NIB 2008 NTT-NUSA TENGGARA TIMUR na85 UL NIB 2008 PAPUA na86 UL NIB 2008 PRIMA MASTER BANK na87 UL NIB 2008 PURBA DANARTA na88 UL NIB 2008 ROYAL BANK SCOTLAND na89 UL NIB 2008 ROYAL INDONESIA na90 UL NIB 2008 SINAR HARAPAN BALI na91 UL NIB 2008 SULAWESI SELATAN na92 UL NIB 2008 SULAWESI TENGAH na93 UL NIB 2008 SULAWESI TENGGARA na94 UL NIB 2008 SULAWESI UTARA na95 UL NIB 2008 SUMATERA UTARA na96 UL NIB 2008 SUMITOMO MITSUI INDONESIA na97 UL NIB 2008 TOKYO-MITSUBISHI LTD. na98 UL NIB 2008 YUDHA BHAKTI na99 UL NIB 2009 ACEH na
100 UL NIB 2009 AGRIS na
101 UL NIB 2009AMIN-ANGLOMAS INTERNASIONALBANK na
102 UL NIB 2009 ANTAR DAERAH na103 UL NIB 2009 ANZ PANIN BANK na104 UL NIB 2009 BANK OF AMERICA na105 UL NIB 2009 BANK OF CHINA na

339
NO. LISTING ISLAMIC YEAR BANK NOTE106 UL NIB 2009 BENGKULU na107 UL NIB 2009 BISNIS INTERNASIONAL na108 UL NIB 2009 CHINATRUST INDONESIA na109 UL NIB 2009 DBS INDONESIA na110 UL NIB 2009 DEUTSCHE BANK na111 L NIB 2009 EKONOMI RAHARJA Tbk na112 UL NIB 2009 ICBC INDONESIA na113 UL NIB 2009 JP MORGAN na114 UL NIB 2009 KALIMANTAN TENGAH na115 UL NIB 2009 KESEJAHTERAAN EKONOMI na116 UL NIB 2009 LAMPUNG na117 UL NIB 2009 LIMAN INTERNATIONAL BANK na118 L NIB 2009 MAYAPADA INTERNASIONAL Tbk na119 UL NIB 2009 MAYORA na120 UL NIB 2009 MESTIKA DHARMA na121 UL NIB 2009 METRO EKSPRESS na122 UL NIB 2009 MITRANIAGA na123 UL NIB 2009 MIZUHO na124 UL NIB 2009 MULTI ARTA SENTOSA (MAS) na
125 UL NIB 2009NATIONALNOBU (ALFINDOSEJAHTERA) na
126 UL I 2009 PANIN SYARIAH na127 UL NIB 2009 PAPUA na128 UL NIB 2009 PRIMA MASTER BANK na129 L NIB 2009 PUNDI INDONESIA Tbk na130 UL NIB 2009 PURBA DANARTA na131 UL NIB 2009 ROYAL BANK SCOTLAND na132 UL NIB 2009 ROYAL INDONESIA na133 UL NIB 2009 SINAR HARAPAN BALI na134 UL NIB 2009 SULAWESI SELATAN na135 UL NIB 2009 SULAWESI TENGAH na136 UL NIB 2009 SULAWESI TENGGARA na137 UL NIB 2009 SULAWESI UTARA na138 UL NIB 2009 SUMATERA SELATAN na139 UL NIB 2009 SUMATERA UTARA na140 UL NIB 2009 SUMITOMO MITSUI INDONESIA na141 UL NIB 2009 TOKYO-MITSUBISHI LTD. na

340
NO. LISTING ISLAMIC YEAR BANK NOTE142 UL NIB 2009 YUDHA BHAKTI na143 UL NIB 2010 AGRIS na144 UL NIB 2010 BANK OF AMERICA na145 UL NIB 2010 BENGKULU na146 UL NIB 2010 BISNIS INTERNASIONAL na147 UL NIB 2010 CHINATRUST INDONESIA na148 UL NIB 2010 DBS INDONESIA na149 UL NIB 2010 HARDA INTERNASIONAL na150 UL NIB 2010 ICBC INDONESIA na151 UL NIB 2010 JP MORGAN na152 UL NIB 2010 LAMPUNG na153 UL NIB 2010 LIMAN INTERNATIONAL BANK na154 UL I 2010 MAYBANK SYARIAH na155 UL NIB 2010 MAYORA na156 UL NIB 2010 METRO EKSPRESS na157 UL NIB 2010 MIZUHO na158 UL NIB 2010 MULTI ARTA SENTOSA (MAS) na159 UL NIB 2010 PURBA DANARTA na160 UL NIB 2010 ROYAL BANK SCOTLAND na161 UL NIB 2010 ROYAL INDONESIA na162 UL NIB 2010 SULAWESI TENGAH na163 UL NIB 2010 SULAWESI TENGGARA na164 UL NIB 2010 SUMATERA SELATAN na165 UL NIB 2010 SUMITOMO MITSUI INDONESIA na166 UL NIB 2010 TOKYO-MITSUBISHI LTD. na167 UL NIB 2011 AGRIS na168 UL NIB 2011 BANK OF AMERICA na169 UL NIB 2011 BISNIS INTERNASIONAL na170 UL I 2011 JABAR SYARIAH na171 UL NIB 2011 JP MORGAN na172 UL NIB 2011 LAMPUNG na173 UL NIB 2011 LIMAN INTERNATIONAL BANK na174 UL NIB 2011 METRO EKSPRESS na175 UL NIB 2011 MIZUHO na176 UL NIB 2011 ROYAL BANK SCOTLAND na177 UL NIB 2011 SULAWESI TENGGARA na178 UL NIB 2011 TOKYO-MITSUBISHI LTD. na

341
NO. LISTING ISLAMIC YEAR BANK NOTE179 UL NIB 2012 LAMPUNG na180 UL NIB 2012 PURBA DANARTA na181 UL NIB 2012 SULAWESI TENGAH na182 UL NIB 2010 MESTIKA DHARMA password183 UL NIB 2011 MESTIKA DHARMA password184 UL NIB 2012 AGRIS password185 UL NIB 2012 MASPION password186 UL NIB 2012 MESTIKA DHARMA password187 UL NIB 2012 MIZUHO passwordUL = Unlisted Banks I = Islamic Banks na = not availableL = Listed Banks NIB = Non-Islamic Banks

342
APPENDIX F - NORMALITY TEST FOR ISLAMIC BANKS VARIABLES
One-Sample Kolmogorov-Smirnov Test
ASSET LDR ROE LEVERAGE EARNINGSREIN RISKDISC FIRMVALUE
N 27 27 27 27 27 27 27
Normal
Parametersa,,b
Mean .3617 -.0022 .0071 .0341 .0775 .0158 .6407
Std.
Deviation
.42021 .35821 .25444 .34344 .71969 .04784 1.87480
Most Extreme
Differences
Absolute .209 .235 .197 .238 .432 .201 .276
Positive .198 .235 .175 .238 .432 .201 .276
Negative -.209 -.136 -.197 -.165 -.383 -.184 -.273
Kolmogorov-Smirnov Z 1.088 1.223 1.022 1.235 2.244 1.046 1.435
Asymp. Sig. (2-tailed) .187 .101 .247 .095 .000 .224 .033
a. Test distribution is Normal.
b. Calculated from data.
After Transforming
One-Sample Kolmogorov-Smirnov Test
ASSET LDR ROE LEVERAGE RISKDISC INV_FIRM INV_EARN log_earnings log_firm ln_firm
N 27 27 27 27 27 27 5 2 21 21
Normal
Parametersa,,b
Mean .3617 -.0022 .0071 .0341 .0158 5.3326 .2262 .6527 -.6297 -1.4499
Std.
Deviation
.42021 .35821 .25444 .34344 .04784 23.92563 1.03657 .10926 .74061 1.70532
Most Extreme
Differences
Absolute .209 .235 .197 .238 .201 .229 .223 .260 .113 .113
Positive .198 .235 .175 .238 .201 .180 .201 .260 .113 .113
Negative -.209 -.136 -.197 -.165 -.184 -.229 -.223 -.260 -.113 -.113
Kolmogorov-Smirnov Z 1.088 1.223 1.022 1.235 1.046 1.192 .498 .368 .519 .519
Asymp. Sig. (2-tailed) .187 .101 .247 .095 .224 .117 .965 .999 .950 .950
a. Test distribution is Normal.
b. Calculated from data.

343
APPENDIX G – RESULTS OF LAGGED
THE LAGGED OF THE ASSOCIATION BETWEEN THE DELTA OF FIRMCHARACTERISTICS AND THE DELTA OF RISK DISCLOSURE IN ALL BANKS
Model Summaryb
Model R R SquareAdjusted R
SquareStd. Error of the
Estimate Durbin-Watson
1 .104a .011 -.015 .05884 2.267a. Predictors: (Constant), earningsreinv, profitability, asset, liquidity, leverageb. Dependent Variable: riskdisc
ANOVAb
Model Sum of Squares df Mean Square F Sig.
1 Regression .007 5 .001 .412 .840a
Residual .658 190 .003
Total .665 195
a. Predictors: (Constant), earningsreinv, profitability, asset, liquidity, leverageb. Dependent Variable: riskdisc
Coefficientsa
Model
Unstandardized CoefficientsStandardizedCoefficients
t Sig.B Std. Error Beta
1 (Constant) .004 .005 .763 .447
asset .000 .003 -.013 -.175 .861
liquidity .003 .010 .023 .291 .771
profitability .000 .010 -.004 -.051 .959
leverage .008 .016 .039 .475 .635
earningsreinv .007 .007 .075 .971 .333a. Dependent Variable: riskdisc
Residuals Statisticsa
Minimum Maximum Mean Std. Deviation N
Predicted Value -.0289 .0246 .0026 .00605 196Residual -.26569 .37823 .00000 .05808 196Std. Predicted Value -5.196 3.656 .000 1.000 196Std. Residual -4.516 6.428 .000 .987 196a. Dependent Variable: riskdisc

344
APPENDIX H – THE RESULTS OF VALUE RELEVANT
THE VALUE RELEVANCE OF RISC DISLCOSURE IN ALL BANKS
Model Summaryb
Model R R SquareAdjusted R
SquareStd. Error of the
Estimate Durbin-Watson
1 .583a .340 .331 258.60683 .601a. Predictors: (Constant), EarningsR, RD, LDR, Leverage, ROE, assetsb. Dependent Variable: FV
ANOVAb
Model Sum of Squares df Mean Square F Sig.
1 Regression 1.401E7 6 2335738.199 34.926 .000a
Residual 2.715E7 406 66877.495
Total 4.117E7 412
a. Predictors: (Constant), EarningsR, RD, LDR, Leverage, ROE, assetsb. Dependent Variable: FV
Coefficientsa
Model
Unstandardized CoefficientsStandardizedCoefficients
t Sig.B Std. Error Beta
1 (Constant) -99.141 58.587 -1.692 .091
RD -81.135 195.870 -.017 -.414 .679
assets -3.357 1.587 -.088 -2.115 .035
LDR 25.890 22.975 .046 1.127 .260
ROE 747.019 51.868 .590 14.402 .000
Leverage -47.008 51.323 -.038 -.916 .360
EarningsR 46.711 28.071 .068 1.664 .097a. Dependent Variable: FV
Residuals Statisticsa
Minimum Maximum Mean Std. Deviation N
Predicted Value -702.6340 2928.6548 31.3196 184.43320 413Residual -675.24432 2923.09912 .00000 256.71687 413Std. Predicted Value -3.980 15.709 .000 1.000 413Std. Residual -2.611 11.303 .000 .993 413a. Dependent Variable: FV

345
THE VALUE RELEVANCE OF RISC DISLCOSURE IN LISTED BANKS
Model Summaryb
Model R R SquareAdjusted R
SquareStd. Error of the
Estimate Durbin-Watson
1 .681a .464 .441 396.55985 .691a. Predictors: (Constant), EarningsR, Leverage, LDR, ROE, RD, assetsb. Dependent Variable: FV
ANOVAb
Model Sum of Squares df Mean Square F Sig.
1 Regression 1.878E7 6 3130313.415 19.905 .000a
Residual 2.170E7 138 157259.715
Total 4.048E7 144
a. Predictors: (Constant), EarningsR, Leverage, LDR, ROE, RD, assetsb. Dependent Variable: FV
Coefficientsa
Model
Unstandardized CoefficientsStandardizedCoefficients
t Sig.B Std. Error Beta
1 (Constant) -298.034 191.171 -1.559 .121
RD -266.155 482.567 -.036 -.552 .582
assets -5.554 2.813 -.132 -1.975 .050
LDR 221.566 176.704 .079 1.254 .212
ROE 981.644 90.999 .678 10.787 .000
Leverage 21.655 96.643 .014 .224 .823
EarningsR 102.826 110.210 .060 .933 .352a. Dependent Variable: FV
Residuals Statisticsa
Minimum Maximum Mean Std. Deviation N
Predicted Value -904.9248 3942.2905 86.5659 361.15056 145
Residual -679.88611 2780.86523 .00000 388.21029 145
Std. Predicted Value -2.745 10.676 .000 1.000 145
Std. Residual -1.714 7.012 .000 .979 145
a. Dependent Variable: FV
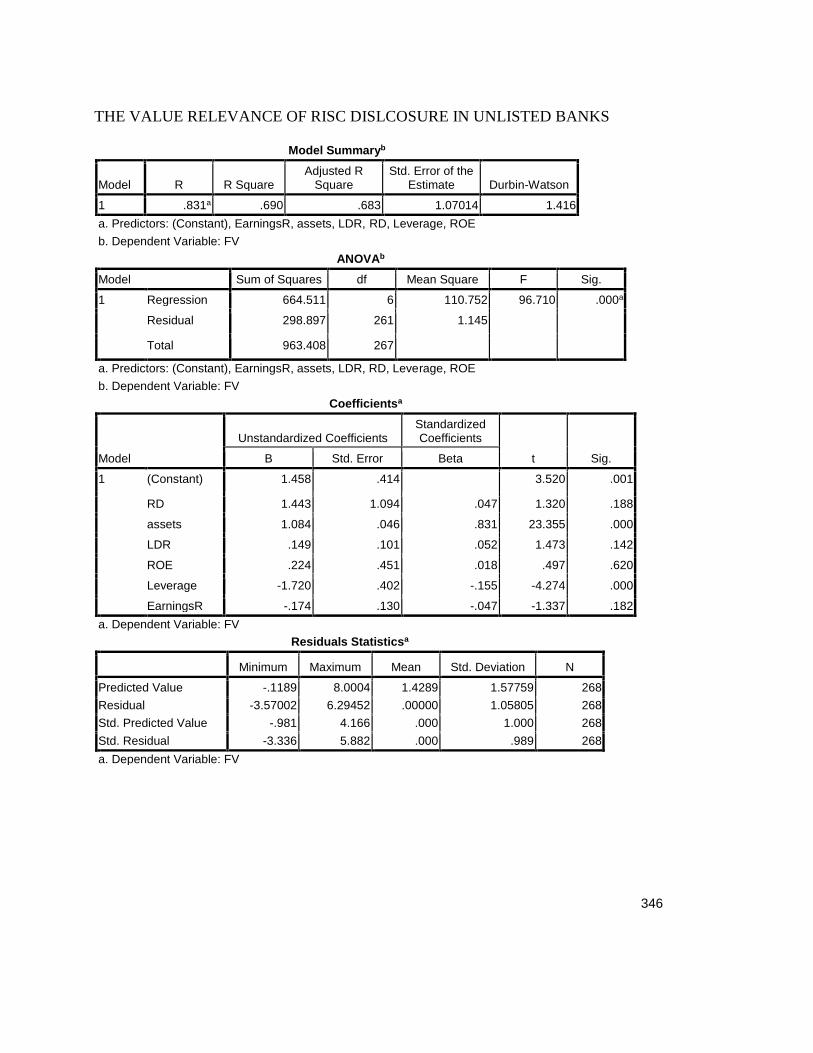
346
THE VALUE RELEVANCE OF RISC DISLCOSURE IN UNLISTED BANKS
Model Summaryb
Model R R SquareAdjusted R
SquareStd. Error of the
Estimate Durbin-Watson
1 .831a .690 .683 1.07014 1.416a. Predictors: (Constant), EarningsR, assets, LDR, RD, Leverage, ROEb. Dependent Variable: FV
ANOVAb
Model Sum of Squares df Mean Square F Sig.
1 Regression 664.511 6 110.752 96.710 .000a
Residual 298.897 261 1.145
Total 963.408 267
a. Predictors: (Constant), EarningsR, assets, LDR, RD, Leverage, ROEb. Dependent Variable: FV
Coefficientsa
Model
Unstandardized CoefficientsStandardizedCoefficients
t Sig.B Std. Error Beta
1 (Constant) 1.458 .414 3.520 .001
RD 1.443 1.094 .047 1.320 .188
assets 1.084 .046 .831 23.355 .000
LDR .149 .101 .052 1.473 .142
ROE .224 .451 .018 .497 .620
Leverage -1.720 .402 -.155 -4.274 .000
EarningsR -.174 .130 -.047 -1.337 .182a. Dependent Variable: FV
Residuals Statisticsa
Minimum Maximum Mean Std. Deviation N
Predicted Value -.1189 8.0004 1.4289 1.57759 268Residual -3.57002 6.29452 .00000 1.05805 268Std. Predicted Value -.981 4.166 .000 1.000 268Std. Residual -3.336 5.882 .000 .989 268a. Dependent Variable: FV
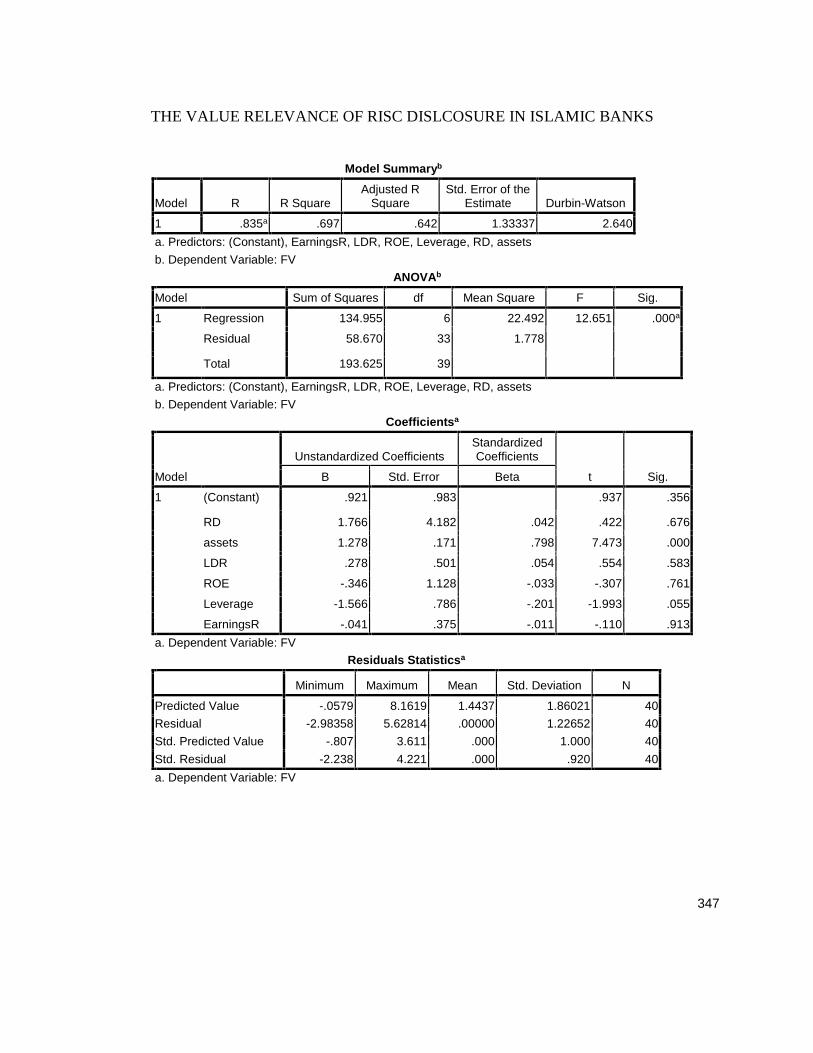
347
THE VALUE RELEVANCE OF RISC DISLCOSURE IN ISLAMIC BANKS
Model Summaryb
Model R R SquareAdjusted R
SquareStd. Error of the
Estimate Durbin-Watson
1 .835a .697 .642 1.33337 2.640a. Predictors: (Constant), EarningsR, LDR, ROE, Leverage, RD, assetsb. Dependent Variable: FV
ANOVAb
Model Sum of Squares df Mean Square F Sig.
1 Regression 134.955 6 22.492 12.651 .000a
Residual 58.670 33 1.778
Total 193.625 39
a. Predictors: (Constant), EarningsR, LDR, ROE, Leverage, RD, assetsb. Dependent Variable: FV
Coefficientsa
Model
Unstandardized CoefficientsStandardizedCoefficients
t Sig.B Std. Error Beta
1 (Constant) .921 .983 .937 .356
RD 1.766 4.182 .042 .422 .676
assets 1.278 .171 .798 7.473 .000
LDR .278 .501 .054 .554 .583
ROE -.346 1.128 -.033 -.307 .761
Leverage -1.566 .786 -.201 -1.993 .055
EarningsR -.041 .375 -.011 -.110 .913a. Dependent Variable: FV
Residuals Statisticsa
Minimum Maximum Mean Std. Deviation N
Predicted Value -.0579 8.1619 1.4437 1.86021 40Residual -2.98358 5.62814 .00000 1.22652 40Std. Predicted Value -.807 3.611 .000 1.000 40Std. Residual -2.238 4.221 .000 .920 40a. Dependent Variable: FV

348
THE VALUE RELEVANCE OF RISC DISLCOSURE IN NON-ISLAMIC BANKS
Model Summaryb
Model R R SquareAdjusted R
SquareStd. Error of the
Estimate Durbin-Watson
1 .605a .366 .356 266.85313 .594a. Predictors: (Constant), EarningsR, assets, LDR, RD, ROE, Leverageb. Dependent Variable: FV
ANOVAb
Model Sum of Squares df Mean Square F Sig.
1 Regression 1.506E7 6 2510648.212 35.257 .000a
Residual 2.606E7 366 71210.595
Total 4.113E7 372
a. Predictors: (Constant), EarningsR, assets, LDR, RD, ROE, Leverageb. Dependent Variable: FV
Coefficientsa
Model
Unstandardized CoefficientsStandardizedCoefficients
t Sig.B Std. Error Beta
1 (Constant) -110.428 64.445 -1.714 .087
RD -68.886 208.761 -.014 -.330 .742
assets -3.627 1.652 -.094 -2.195 .029
LDR 27.868 24.407 .048 1.142 .254
ROE 801.318 55.401 .612 14.464 .000
Leverage -51.154 56.696 -.038 -.902 .368
EarningsR 57.182 31.584 .076 1.810 .071a. Dependent Variable: FV
Residuals Statisticsa
Minimum Maximum Mean Std. Deviation N
Predicted Value -750.0580 3145.0002 34.5234 201.23202 373Residual -728.24091 2904.32764 .00000 264.69234 373Std. Predicted Value -3.899 15.457 .000 1.000 373Std. Residual -2.729 10.884 .000 .992 373a. Dependent Variable: FV

349
APPENDIX I – THE RESULTS OF SPSS
THE DIFFERENCES BETWEEN LISTED AND UNLISTED BANKS GROUP
STATISTICS
Group Statistics
STATUS N Mean Std. Deviation Std. Error MeanASSETS 1 196 .2292 .54297 .03878
2 116 1.3751 2.04523 .18989LDR 1 196 .1070 .49546 .03539
2 116 .0010 .22247 .02066ROE 1 196 .0197 .14439 .01031
2 116 .0294 .56325 .05230LEVERAGE 1 196 .0567 .26494 .01892
2 116 -.2032 .39321 .03651EARNINGREIV 1 196 .0851 .54528 .03895
2 116 -.0148 .43726 .04060RISKDISC 1 196 .0067 .06947 .00496
2 116 .0045 .04749 .00441FIRMVALUE 1 196 .3027 1.35563 .09683
2 116 19.3341 441.28961 40.97271
THE DIFFERENCES BETWEEN ISLAMIC AND NON-ISLAMIC BANKS GROUPSTATISTICS
Group StatisticsISLAMIC N Mean Std. Deviation Std. Error Mean
ASSETS 5 285 .6830 1.48593 .088026 27 .3617 .42021 .08087
LDR 5 285 .0742 .42334 .025086 27 -.0022 .35821 .06894
ROE 5 285 .0249 .36993 .021916 27 .0071 .25444 .04897
LEVERAGE 5 285 -.0470 .34171 .020246 27 .0341 .34344 .06609
EARNINGREIV 5 285 .0451 .48644 .028816 27 .0775 .71969 .13850
RISKDISC 5 285 .0049 .06331 .003756 27 .0158 .04784 .00921
FIRMVALUE 5 285 8.0168 280.96926 16.643186 27 .6407 1.87480 .36080
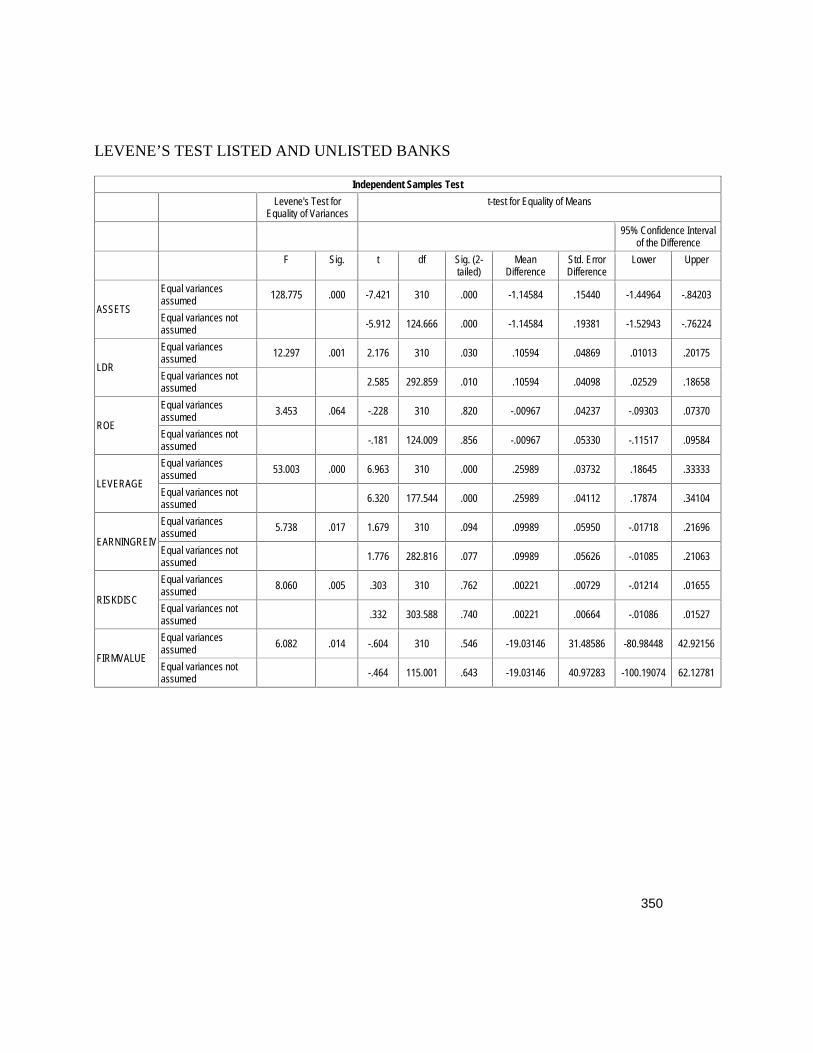
350
LEVENE’S TEST LISTED AND UNLISTED BANKS
Independent Samples TestLevene's Test for
Equality of Variancest-test for Equality of Means
95% Confidence Intervalof the Difference
F Sig. t df Sig. (2-tailed)
MeanDifference
Std. ErrorDifference
Lower Upper
ASSETS
Equal variancesassumed 128.775 .000 -7.421 310 .000 -1.14584 .15440 -1.44964 -.84203
Equal variances notassumed -5.912 124.666 .000 -1.14584 .19381 -1.52943 -.76224
LDR
Equal variancesassumed 12.297 .001 2.176 310 .030 .10594 .04869 .01013 .20175
Equal variances notassumed 2.585 292.859 .010 .10594 .04098 .02529 .18658
ROE
Equal variancesassumed 3.453 .064 -.228 310 .820 -.00967 .04237 -.09303 .07370
Equal variances notassumed -.181 124.009 .856 -.00967 .05330 -.11517 .09584
LEVERAGE
Equal variancesassumed 53.003 .000 6.963 310 .000 .25989 .03732 .18645 .33333
Equal variances notassumed 6.320 177.544 .000 .25989 .04112 .17874 .34104
EARNINGREIV
Equal variancesassumed 5.738 .017 1.679 310 .094 .09989 .05950 -.01718 .21696
Equal variances notassumed 1.776 282.816 .077 .09989 .05626 -.01085 .21063
RISKDISC
Equal variancesassumed 8.060 .005 .303 310 .762 .00221 .00729 -.01214 .01655
Equal variances notassumed .332 303.588 .740 .00221 .00664 -.01086 .01527
FIRMVALUE
Equal variancesassumed 6.082 .014 -.604 310 .546 -19.03146 31.48586 -80.98448 42.92156
Equal variances notassumed -.464 115.001 .643 -19.03146 40.97283 -100.19074 62.12781

351
LEVENE’S TEST BETWEEN ISLAMIC AND NON-ISLAMIC BANKS
Independent Samples TestLevene's Test for
Equality of Variances t-test for Equality of Means95% Confidence Interval of
the Difference
F Sig. t dfSig. (2-tailed)
MeanDifference
Std. ErrorDifference Lower Upper
ASSETS Equal variancesassumed 6.583 .011 1.118 310 .264 .32135 .28743 -.24422 .88691
Equal variancesnot assumed 2.688 109.962 .008 .32135 .11953 .08447 .55822
LDR Equal variancesassumed .111 .740 .907 310 .365 .07639 .08422 -.08933 .24211
Equal variancesnot assumed 1.041 33.282 .305 .07639 .07336 -.07281 .22559
ROE Equal variancesassumed .988 .321 .243 310 .808 .01771 .07283 -.12559 .16100
Equal variancesnot assumed .330 37.319 .743 .01771 .05365 -.09096 .12638
LEVERAGE Equal variancesassumed .177 .675 -
1.178 310 .240 -.08109 .06884 -.21653 .05435
Equal variancesnot assumed
-1.173 31.081 .250 -.08109 .06912 -.22206 .05988
EARNINGREIV Equal variancesassumed 1.903 .169 -.315 310 .753 -.03238 .10272 -.23449 .16973
Equal variancesnot assumed -.229 28.294 .821 -.03238 .14147 -.32203 .25727
RISKDISC Equal variancesassumed .247 .620 -.869 310 .386 -.01088 .01252 -.03551 .01375
Equal variancesnot assumed
-1.094 35.254 .281 -.01088 .00994 -.03105 .00930
FIRMVALUE Equal variancesassumed .322 .571 .136 310 .892 7.37611 54.15156 -99.17500 113.92721
Equal variancesnot assumed .443 284.266 .658 7.37611 16.64709 -25.39110 40.14332
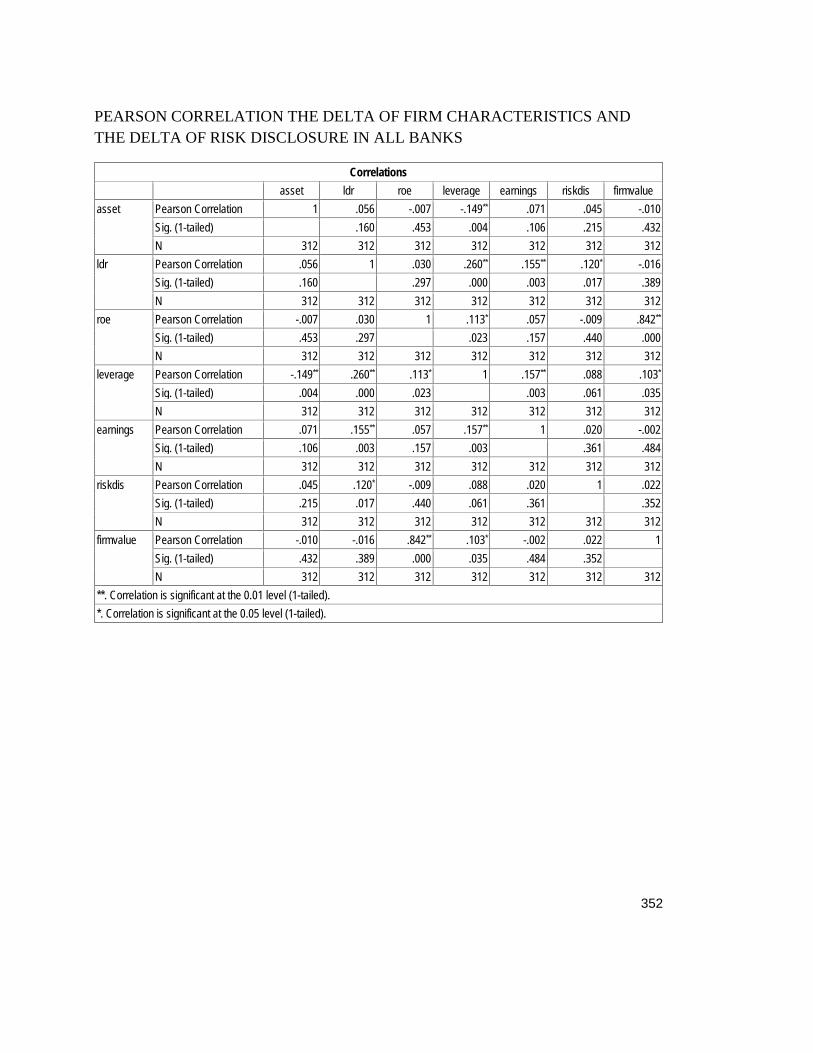
352
PEARSON CORRELATION THE DELTA OF FIRM CHARACTERISTICS ANDTHE DELTA OF RISK DISCLOSURE IN ALL BANKS
Correlationsasset ldr roe leverage earnings riskdis firmvalue
asset Pearson Correlation 1 .056 -.007 -.149** .071 .045 -.010Sig. (1-tailed) .160 .453 .004 .106 .215 .432N 312 312 312 312 312 312 312
ldr Pearson Correlation .056 1 .030 .260** .155** .120* -.016Sig. (1-tailed) .160 .297 .000 .003 .017 .389N 312 312 312 312 312 312 312
roe Pearson Correlation -.007 .030 1 .113* .057 -.009 .842**
Sig. (1-tailed) .453 .297 .023 .157 .440 .000N 312 312 312 312 312 312 312
leverage Pearson Correlation -.149** .260** .113* 1 .157** .088 .103*
Sig. (1-tailed) .004 .000 .023 .003 .061 .035N 312 312 312 312 312 312 312
earnings Pearson Correlation .071 .155** .057 .157** 1 .020 -.002Sig. (1-tailed) .106 .003 .157 .003 .361 .484N 312 312 312 312 312 312 312
riskdis Pearson Correlation .045 .120* -.009 .088 .020 1 .022Sig. (1-tailed) .215 .017 .440 .061 .361 .352N 312 312 312 312 312 312 312
firmvalue Pearson Correlation -.010 -.016 .842** .103* -.002 .022 1Sig. (1-tailed) .432 .389 .000 .035 .484 .352N 312 312 312 312 312 312 312
**. Correlation is significant at the 0.01 level (1-tailed).*. Correlation is significant at the 0.05 level (1-tailed).
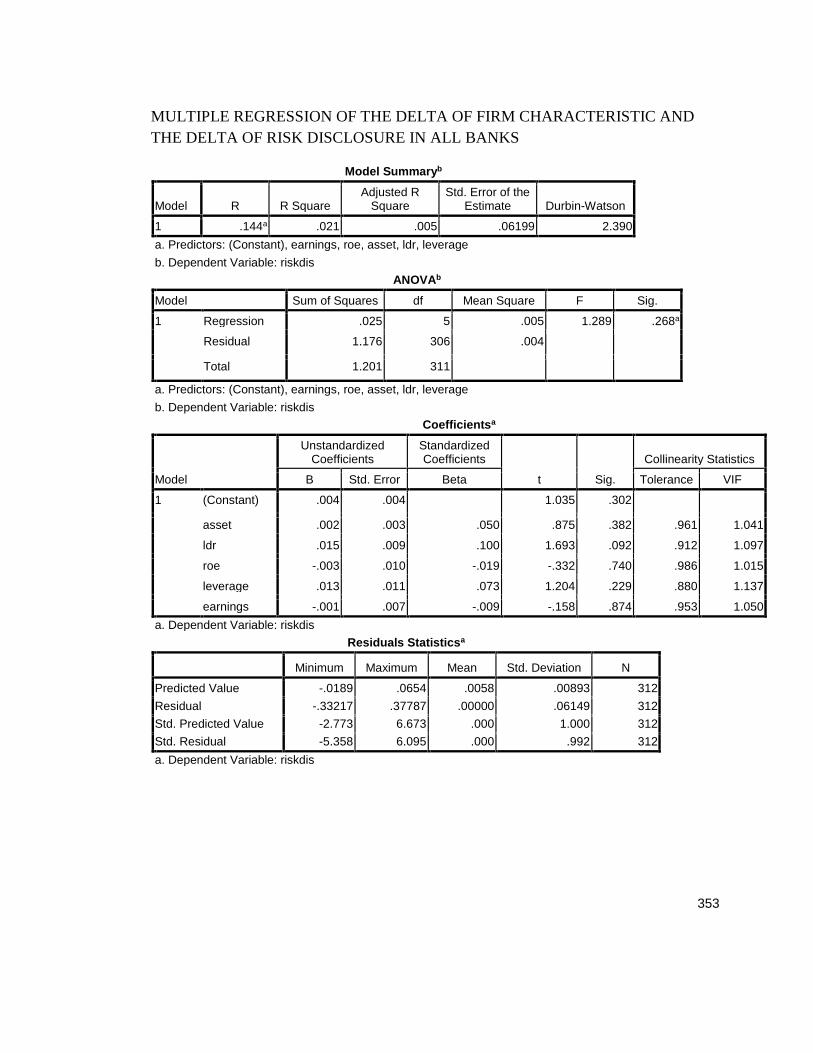
353
MULTIPLE REGRESSION OF THE DELTA OF FIRM CHARACTERISTIC ANDTHE DELTA OF RISK DISCLOSURE IN ALL BANKS
Model Summaryb
Model R R SquareAdjusted R
SquareStd. Error of the
Estimate Durbin-Watson
1 .144a .021 .005 .06199 2.390a. Predictors: (Constant), earnings, roe, asset, ldr, leverageb. Dependent Variable: riskdis
ANOVAb
Model Sum of Squares df Mean Square F Sig.
1 Regression .025 5 .005 1.289 .268a
Residual 1.176 306 .004
Total 1.201 311
a. Predictors: (Constant), earnings, roe, asset, ldr, leverageb. Dependent Variable: riskdis
Coefficientsa
Model
UnstandardizedCoefficients
StandardizedCoefficients
t Sig.
Collinearity Statistics
B Std. Error Beta Tolerance VIF
1 (Constant) .004 .004 1.035 .302
asset .002 .003 .050 .875 .382 .961 1.041
ldr .015 .009 .100 1.693 .092 .912 1.097
roe -.003 .010 -.019 -.332 .740 .986 1.015
leverage .013 .011 .073 1.204 .229 .880 1.137
earnings -.001 .007 -.009 -.158 .874 .953 1.050a. Dependent Variable: riskdis
Residuals Statisticsa
Minimum Maximum Mean Std. Deviation N
Predicted Value -.0189 .0654 .0058 .00893 312Residual -.33217 .37787 .00000 .06149 312Std. Predicted Value -2.773 6.673 .000 1.000 312Std. Residual -5.358 6.095 .000 .992 312a. Dependent Variable: riskdis
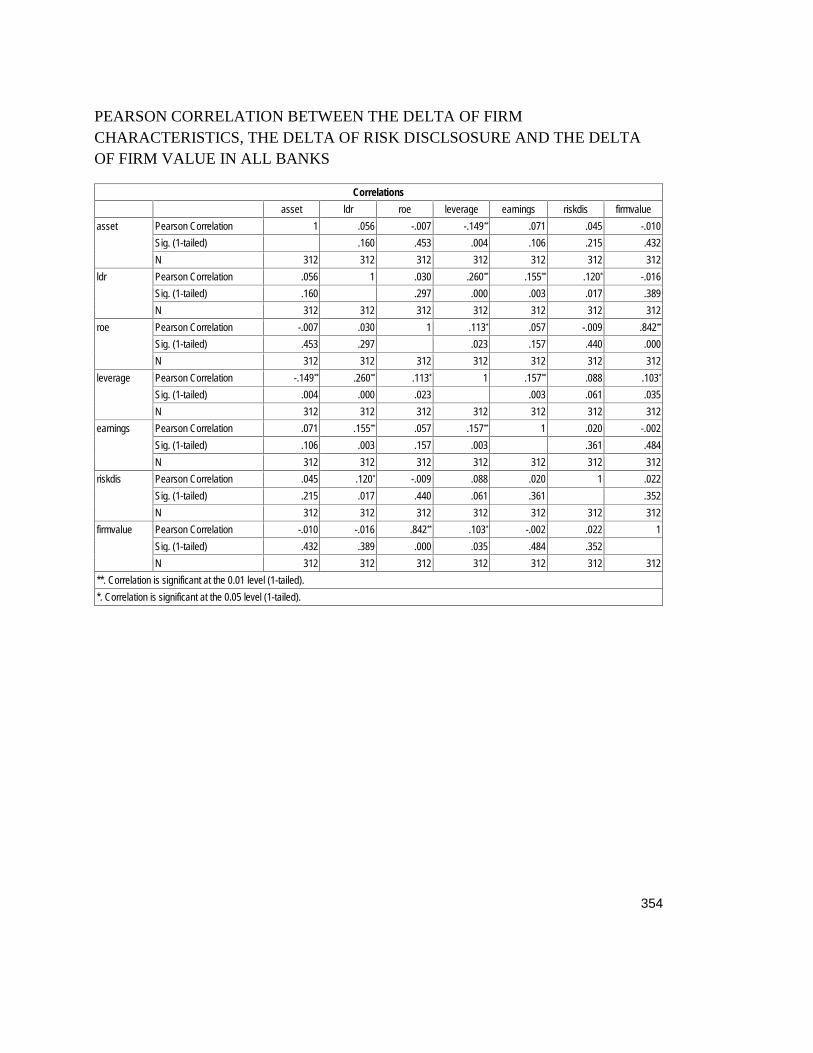
354
PEARSON CORRELATION BETWEEN THE DELTA OF FIRMCHARACTERISTICS, THE DELTA OF RISK DISCLSOSURE AND THE DELTAOF FIRM VALUE IN ALL BANKS
Correlationsasset ldr roe leverage earnings riskdis firmvalue
asset Pearson Correlation 1 .056 -.007 -.149** .071 .045 -.010Sig. (1-tailed) .160 .453 .004 .106 .215 .432N 312 312 312 312 312 312 312
ldr Pearson Correlation .056 1 .030 .260** .155** .120* -.016Sig. (1-tailed) .160 .297 .000 .003 .017 .389N 312 312 312 312 312 312 312
roe Pearson Correlation -.007 .030 1 .113* .057 -.009 .842**
Sig. (1-tailed) .453 .297 .023 .157 .440 .000N 312 312 312 312 312 312 312
leverage Pearson Correlation -.149** .260** .113* 1 .157** .088 .103*
Sig. (1-tailed) .004 .000 .023 .003 .061 .035N 312 312 312 312 312 312 312
earnings Pearson Correlation .071 .155** .057 .157** 1 .020 -.002Sig. (1-tailed) .106 .003 .157 .003 .361 .484N 312 312 312 312 312 312 312
riskdis Pearson Correlation .045 .120* -.009 .088 .020 1 .022Sig. (1-tailed) .215 .017 .440 .061 .361 .352N 312 312 312 312 312 312 312
firmvalue Pearson Correlation -.010 -.016 .842** .103* -.002 .022 1Sig. (1-tailed) .432 .389 .000 .035 .484 .352N 312 312 312 312 312 312 312
**. Correlation is significant at the 0.01 level (1-tailed).*. Correlation is significant at the 0.05 level (1-tailed).
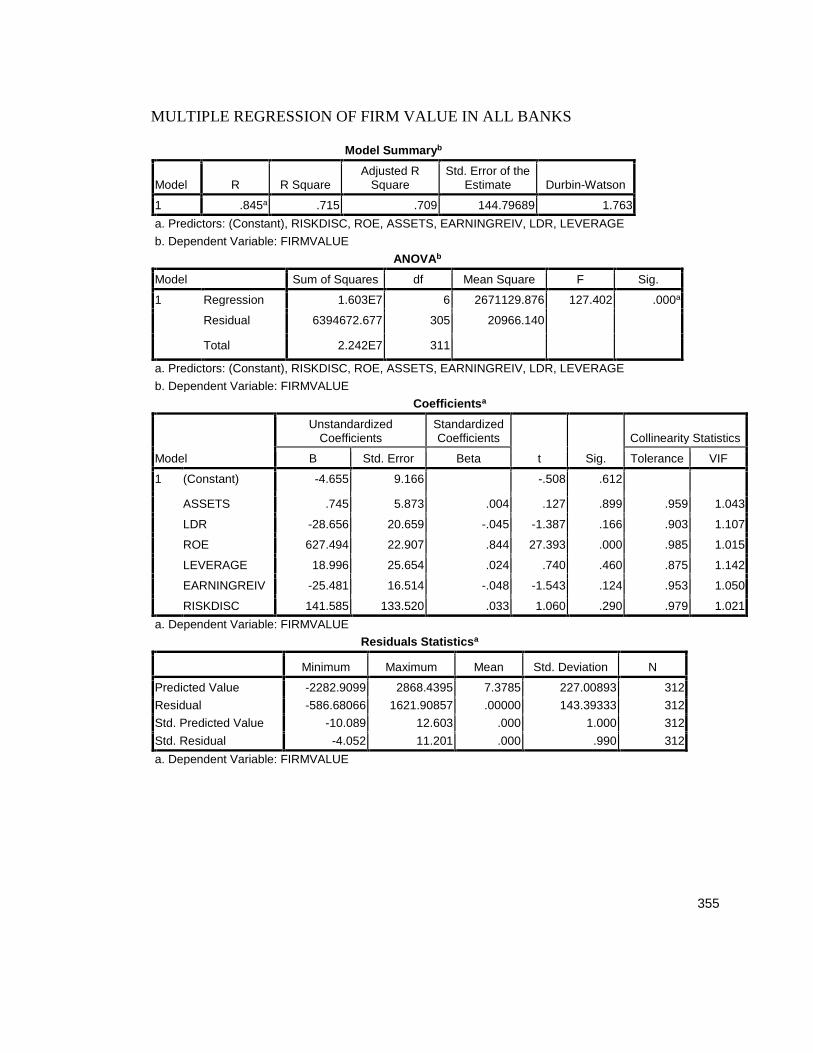
355
MULTIPLE REGRESSION OF FIRM VALUE IN ALL BANKS
Model Summaryb
Model R R SquareAdjusted R
SquareStd. Error of the
Estimate Durbin-Watson
1 .845a .715 .709 144.79689 1.763a. Predictors: (Constant), RISKDISC, ROE, ASSETS, EARNINGREIV, LDR, LEVERAGEb. Dependent Variable: FIRMVALUE
ANOVAb
Model Sum of Squares df Mean Square F Sig.
1 Regression 1.603E7 6 2671129.876 127.402 .000a
Residual 6394672.677 305 20966.140
Total 2.242E7 311
a. Predictors: (Constant), RISKDISC, ROE, ASSETS, EARNINGREIV, LDR, LEVERAGEb. Dependent Variable: FIRMVALUE
Coefficientsa
Model
UnstandardizedCoefficients
StandardizedCoefficients
t Sig.
Collinearity Statistics
B Std. Error Beta Tolerance VIF
1 (Constant) -4.655 9.166 -.508 .612
ASSETS .745 5.873 .004 .127 .899 .959 1.043
LDR -28.656 20.659 -.045 -1.387 .166 .903 1.107
ROE 627.494 22.907 .844 27.393 .000 .985 1.015
LEVERAGE 18.996 25.654 .024 .740 .460 .875 1.142
EARNINGREIV -25.481 16.514 -.048 -1.543 .124 .953 1.050
RISKDISC 141.585 133.520 .033 1.060 .290 .979 1.021a. Dependent Variable: FIRMVALUE
Residuals Statisticsa
Minimum Maximum Mean Std. Deviation N
Predicted Value -2282.9099 2868.4395 7.3785 227.00893 312Residual -586.68066 1621.90857 .00000 143.39333 312Std. Predicted Value -10.089 12.603 .000 1.000 312Std. Residual -4.052 11.201 .000 .990 312a. Dependent Variable: FIRMVALUE
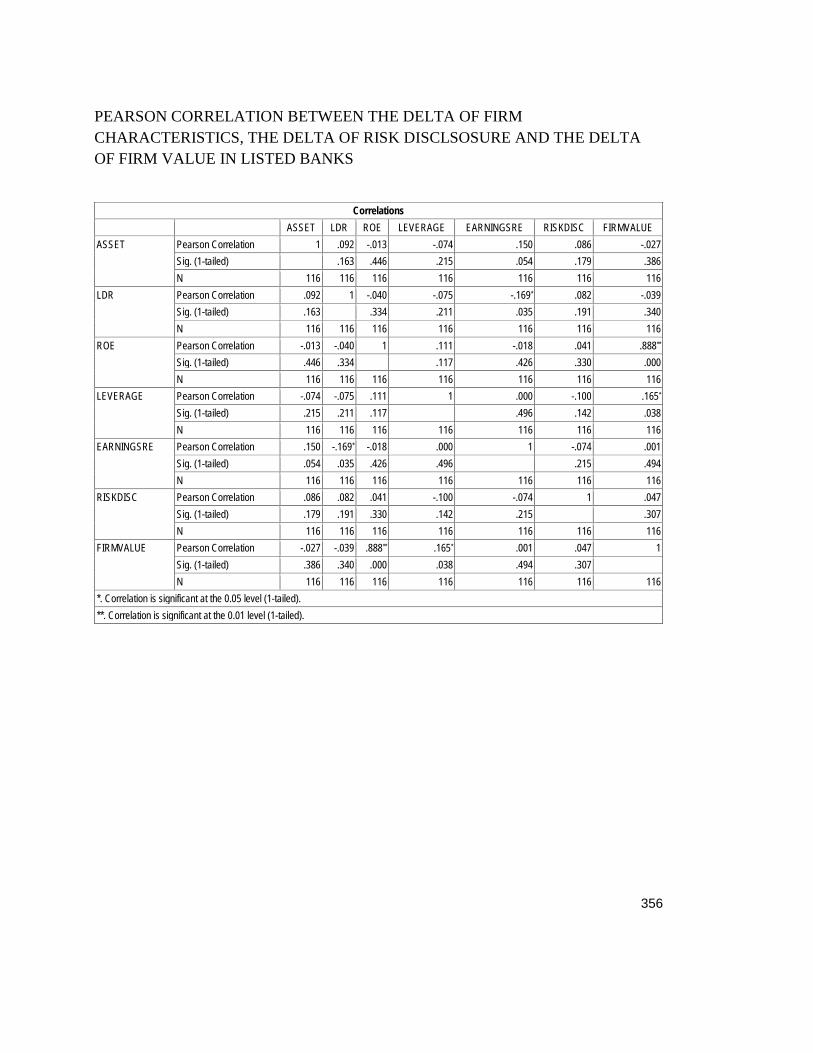
356
PEARSON CORRELATION BETWEEN THE DELTA OF FIRMCHARACTERISTICS, THE DELTA OF RISK DISCLSOSURE AND THE DELTAOF FIRM VALUE IN LISTED BANKS
CorrelationsASSET LDR ROE LEVERAGE EARNINGSRE RISKDISC FIRMVALUE
ASSET Pearson Correlation 1 .092 -.013 -.074 .150 .086 -.027Sig. (1-tailed) .163 .446 .215 .054 .179 .386N 116 116 116 116 116 116 116
LDR Pearson Correlation .092 1 -.040 -.075 -.169* .082 -.039Sig. (1-tailed) .163 .334 .211 .035 .191 .340N 116 116 116 116 116 116 116
ROE Pearson Correlation -.013 -.040 1 .111 -.018 .041 .888**
Sig. (1-tailed) .446 .334 .117 .426 .330 .000N 116 116 116 116 116 116 116
LEVERAGE Pearson Correlation -.074 -.075 .111 1 .000 -.100 .165*
Sig. (1-tailed) .215 .211 .117 .496 .142 .038N 116 116 116 116 116 116 116
EARNINGSRE Pearson Correlation .150 -.169* -.018 .000 1 -.074 .001Sig. (1-tailed) .054 .035 .426 .496 .215 .494N 116 116 116 116 116 116 116
RISKDISC Pearson Correlation .086 .082 .041 -.100 -.074 1 .047Sig. (1-tailed) .179 .191 .330 .142 .215 .307N 116 116 116 116 116 116 116
FIRMVALUE Pearson Correlation -.027 -.039 .888** .165* .001 .047 1Sig. (1-tailed) .386 .340 .000 .038 .494 .307N 116 116 116 116 116 116 116
*. Correlation is significant at the 0.05 level (1-tailed).**. Correlation is significant at the 0.01 level (1-tailed).

357
MULTIPLE REGRESSIONS OF THE DELTA OF FIRM CHARACTERISTICS ANDTHE DELTA OF RISK DISCLOSURE IN LISTED BANKS
Model Summaryb
Model R R SquareAdjusted R
SquareStd. Error of the
Estimate Durbin-Watson
1 .172a .029 -.015 .04783 2.565a. Predictors: (Constant), EARNINGSRE, LEVERAGE, ROE, ASSET, LDRb. Dependent Variable: RISKDISC
ANOVAb
Model Sum of Squares df Mean Square F Sig.
1 Regression .008 5 .002 .668 .648a
Residual .252 110 .002
Total .259 115
a. Predictors: (Constant), EARNINGSRE, LEVERAGE, ROE, ASSET, LDRb. Dependent Variable: RISKDISC
Coefficientsa
Model
UnstandardizedCoefficients
StandardizedCoefficients
t Sig.
Collinearity Statistics
B Std. Error Beta Tolerance VIF
1 (Constant) .000 .006 -.156 .876
ASSET .002 .002 .086 .898 .371 .959 1.043
LDR .012 .021 .056 .582 .562 .952 1.051
ROE .005 .008 .054 .570 .570 .986 1.014
LEVERAGE -.012 .011 -.096 -1.007 .316 .978 1.022
EARNINGSRE -.008 .011 -.076 -.791 .431 .943 1.060a. Dependent Variable: RISKDISC
Residuals Statisticsa
Minimum Maximum Mean Std. Deviation N
Predicted Value -.0200 .0294 .0045 .00815 116Residual -.21119 .21153 .00000 .04678 116Std. Predicted Value -3.002 3.065 .000 1.000 116Std. Residual -4.415 4.422 .000 .978 116a. Dependent Variable: RISKDISC

358
MULTIPLE REGRESSIONS FIRM CHARACTERISTICS AND RISK DISCLOSUREAND FIRM VALUE LISTED BANKS
Model Summaryb
Model R R SquareAdjusted R
SquareStd. Error of the
Estimate Durbin-Watson
1 .891a .794 .783 205.72584 1.711a. Predictors: (Constant), RISKDISC, ROE, EARNINGSRE, LEVERAGE, ASSET, LDRb. Dependent Variable: FIRMVALUE
ANOVAb
Model Sum of Squares df Mean Square F Sig.
1 Regression 1.778E7 6 2963579.876 70.023 .000a
Residual 4613220.409 109 42323.123
Total 2.239E7 115
a. Predictors: (Constant), RISKDISC, ROE, EARNINGSRE, LEVERAGE, ASSET, LDRb. Dependent Variable: FIRMVALUE
Coefficientsa
Model
UnstandardizedCoefficients
StandardizedCoefficients
t Sig.
Collinearity Statistics
B Std. Error Beta Tolerance VIF
1 (Constant) 19.017 25.052 .759 .449
ASSET -3.577 9.612 -.017 -.372 .711 .952 1.050
LDR 10.397 88.524 .005 .117 .907 .949 1.054
ROE 689.457 34.350 .880 20.071 .000 .983 1.017
LEVERAGE 76.562 49.558 .068 1.545 .125 .969 1.032
EARNINGSRE 22.071 45.298 .022 .487 .627 .938 1.066
RISKDISC 189.234 410.071 .020 .461 .645 .971 1.030a. Dependent Variable: FIRMVALUE
Residuals Statisticsa
Minimum Maximum Mean Std. Deviation N
Predicted Value -2490.4106 3202.5220 19.3341 393.21948 116Residual -549.37335 1287.82593 .00000 200.28719 116Std. Predicted Value -6.383 8.095 .000 1.000 116Std. Residual -2.670 6.260 .000 .974 116a. Dependent Variable: FIRMVALUE
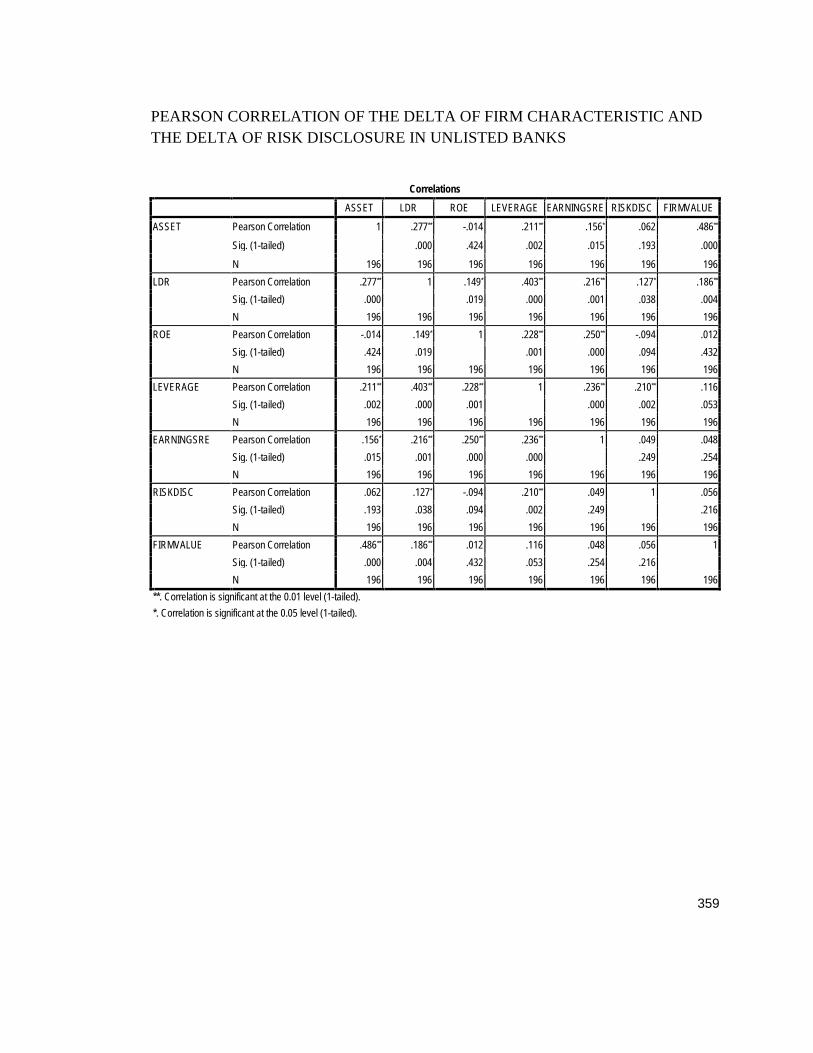
359
PEARSON CORRELATION OF THE DELTA OF FIRM CHARACTERISTIC ANDTHE DELTA OF RISK DISCLOSURE IN UNLISTED BANKS
CorrelationsASSET LDR ROE LEVERAGE EARNINGSRE RISKDISC FIRMVALUE
ASSET Pearson Correlation 1 .277** -.014 .211** .156* .062 .486**
Sig. (1-tailed) .000 .424 .002 .015 .193 .000
N 196 196 196 196 196 196 196LDR Pearson Correlation .277** 1 .149* .403** .216** .127* .186**
Sig. (1-tailed) .000 .019 .000 .001 .038 .004N 196 196 196 196 196 196 196
ROE Pearson Correlation -.014 .149* 1 .228** .250** -.094 .012Sig. (1-tailed) .424 .019 .001 .000 .094 .432N 196 196 196 196 196 196 196
LEVERAGE Pearson Correlation .211** .403** .228** 1 .236** .210** .116Sig. (1-tailed) .002 .000 .001 .000 .002 .053N 196 196 196 196 196 196 196
EARNINGSRE Pearson Correlation .156* .216** .250** .236** 1 .049 .048Sig. (1-tailed) .015 .001 .000 .000 .249 .254N 196 196 196 196 196 196 196
RISKDISC Pearson Correlation .062 .127* -.094 .210** .049 1 .056Sig. (1-tailed) .193 .038 .094 .002 .249 .216N 196 196 196 196 196 196 196
FIRMVALUE Pearson Correlation .486** .186** .012 .116 .048 .056 1Sig. (1-tailed) .000 .004 .432 .053 .254 .216N 196 196 196 196 196 196 196
**. Correlation is significant at the 0.01 level (1-tailed).*. Correlation is significant at the 0.05 level (1-tailed).
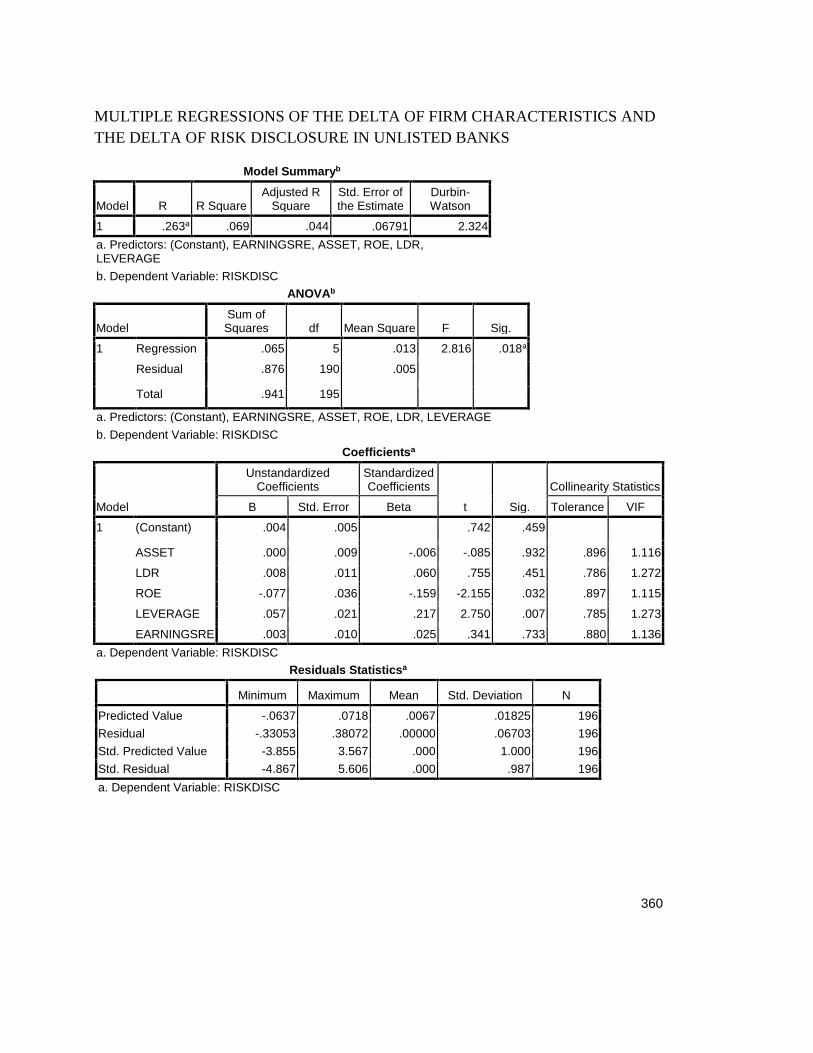
360
MULTIPLE REGRESSIONS OF THE DELTA OF FIRM CHARACTERISTICS ANDTHE DELTA OF RISK DISCLOSURE IN UNLISTED BANKS
Model Summaryb
Model R R SquareAdjusted R
SquareStd. Error ofthe Estimate
Durbin-Watson
1 .263a .069 .044 .06791 2.324a. Predictors: (Constant), EARNINGSRE, ASSET, ROE, LDR,LEVERAGEb. Dependent Variable: RISKDISC
ANOVAb
ModelSum ofSquares df Mean Square F Sig.
1 Regression .065 5 .013 2.816 .018a
Residual .876 190 .005
Total .941 195
a. Predictors: (Constant), EARNINGSRE, ASSET, ROE, LDR, LEVERAGEb. Dependent Variable: RISKDISC
Coefficientsa
Model
UnstandardizedCoefficients
StandardizedCoefficients
t Sig.
Collinearity Statistics
B Std. Error Beta Tolerance VIF
1 (Constant) .004 .005 .742 .459
ASSET .000 .009 -.006 -.085 .932 .896 1.116
LDR .008 .011 .060 .755 .451 .786 1.272
ROE -.077 .036 -.159 -2.155 .032 .897 1.115
LEVERAGE .057 .021 .217 2.750 .007 .785 1.273
EARNINGSRE .003 .010 .025 .341 .733 .880 1.136a. Dependent Variable: RISKDISC
Residuals Statisticsa
Minimum Maximum Mean Std. Deviation N
Predicted Value -.0637 .0718 .0067 .01825 196Residual -.33053 .38072 .00000 .06703 196Std. Predicted Value -3.855 3.567 .000 1.000 196Std. Residual -4.867 5.606 .000 .987 196a. Dependent Variable: RISKDISC
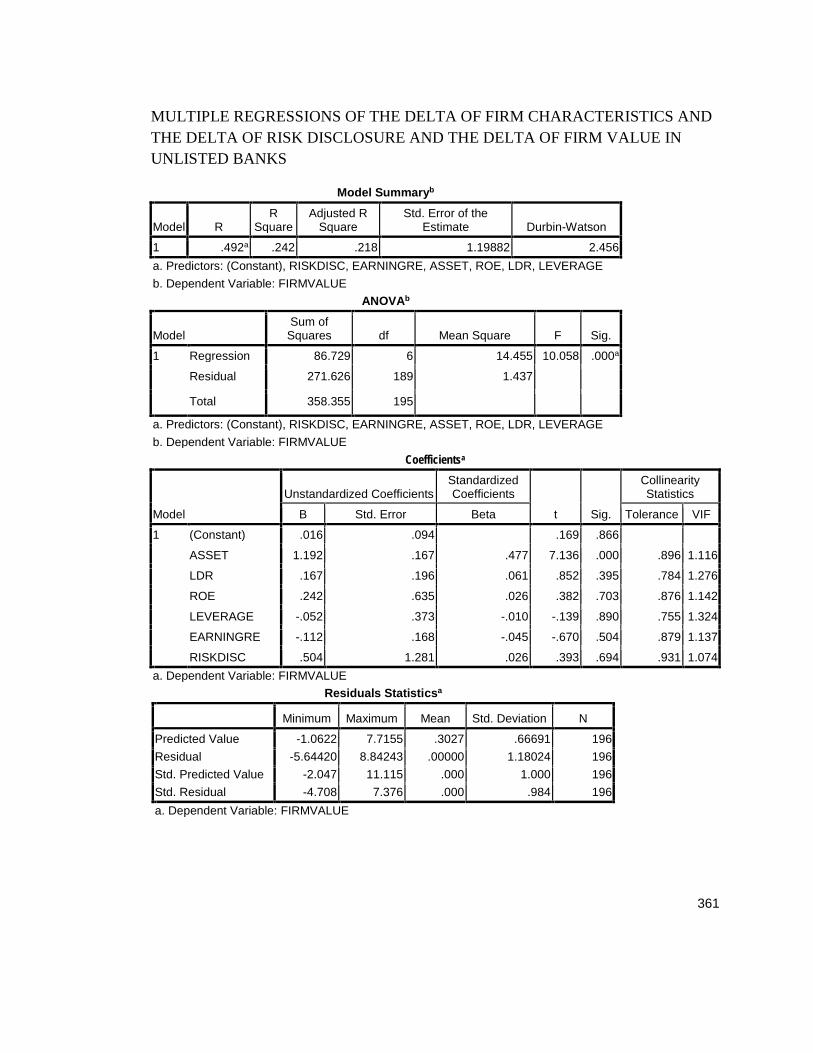
361
MULTIPLE REGRESSIONS OF THE DELTA OF FIRM CHARACTERISTICS ANDTHE DELTA OF RISK DISCLOSURE AND THE DELTA OF FIRM VALUE INUNLISTED BANKS
Model Summaryb
Model RR
SquareAdjusted R
SquareStd. Error of the
Estimate Durbin-Watson
1 .492a .242 .218 1.19882 2.456a. Predictors: (Constant), RISKDISC, EARNINGRE, ASSET, ROE, LDR, LEVERAGEb. Dependent Variable: FIRMVALUE
ANOVAb
ModelSum of
Squares df Mean Square F Sig.
1 Regression 86.729 6 14.455 10.058 .000a
Residual 271.626 189 1.437
Total 358.355 195
a. Predictors: (Constant), RISKDISC, EARNINGRE, ASSET, ROE, LDR, LEVERAGEb. Dependent Variable: FIRMVALUE
Coefficientsa
Model
Unstandardized CoefficientsStandardizedCoefficients
t Sig.
CollinearityStatistics
B Std. Error Beta Tolerance VIF
1 (Constant) .016 .094 .169 .866
ASSET 1.192 .167 .477 7.136 .000 .896 1.116
LDR .167 .196 .061 .852 .395 .784 1.276
ROE .242 .635 .026 .382 .703 .876 1.142
LEVERAGE -.052 .373 -.010 -.139 .890 .755 1.324
EARNINGRE -.112 .168 -.045 -.670 .504 .879 1.137
RISKDISC .504 1.281 .026 .393 .694 .931 1.074a. Dependent Variable: FIRMVALUE
Residuals Statisticsa
Minimum Maximum Mean Std. Deviation N
Predicted Value -1.0622 7.7155 .3027 .66691 196Residual -5.64420 8.84243 .00000 1.18024 196Std. Predicted Value -2.047 11.115 .000 1.000 196Std. Residual -4.708 7.376 .000 .984 196a. Dependent Variable: FIRMVALUE
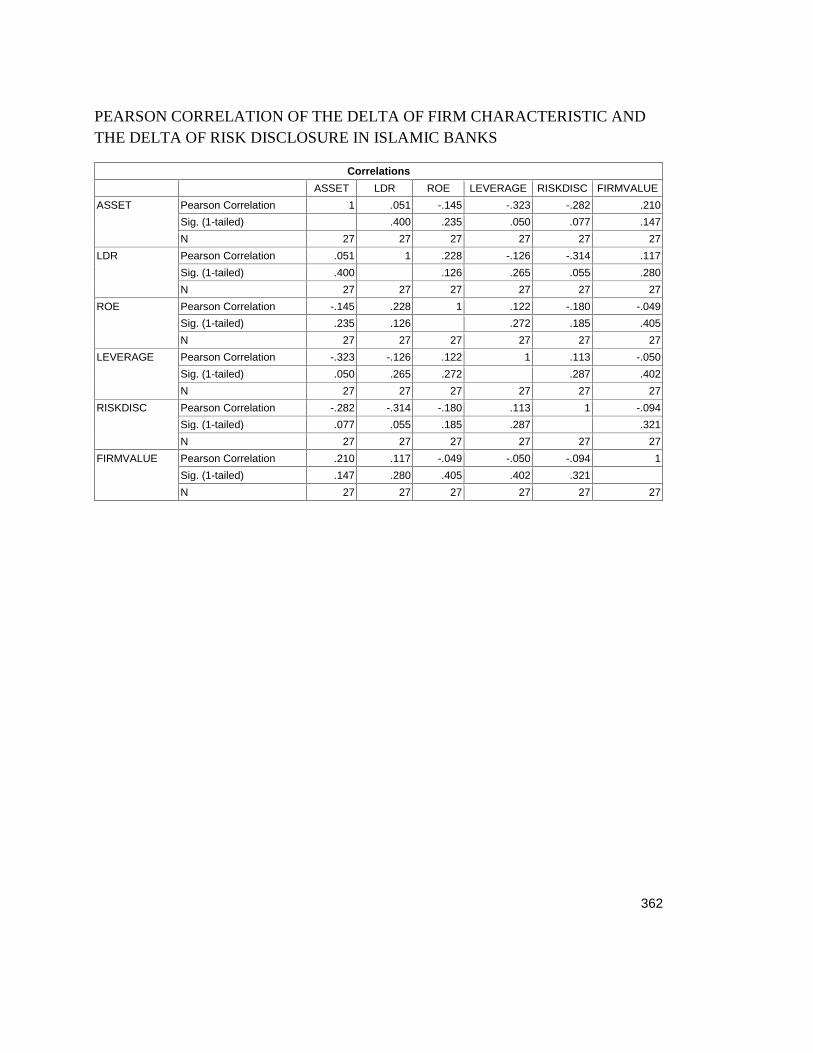
362
PEARSON CORRELATION OF THE DELTA OF FIRM CHARACTERISTIC ANDTHE DELTA OF RISK DISCLOSURE IN ISLAMIC BANKS
CorrelationsASSET LDR ROE LEVERAGE RISKDISC FIRMVALUE
ASSET Pearson Correlation 1 .051 -.145 -.323 -.282 .210Sig. (1-tailed) .400 .235 .050 .077 .147N 27 27 27 27 27 27
LDR Pearson Correlation .051 1 .228 -.126 -.314 .117Sig. (1-tailed) .400 .126 .265 .055 .280N 27 27 27 27 27 27
ROE Pearson Correlation -.145 .228 1 .122 -.180 -.049Sig. (1-tailed) .235 .126 .272 .185 .405N 27 27 27 27 27 27
LEVERAGE Pearson Correlation -.323 -.126 .122 1 .113 -.050Sig. (1-tailed) .050 .265 .272 .287 .402N 27 27 27 27 27 27
RISKDISC Pearson Correlation -.282 -.314 -.180 .113 1 -.094Sig. (1-tailed) .077 .055 .185 .287 .321N 27 27 27 27 27 27
FIRMVALUE Pearson Correlation .210 .117 -.049 -.050 -.094 1Sig. (1-tailed) .147 .280 .405 .402 .321N 27 27 27 27 27 27
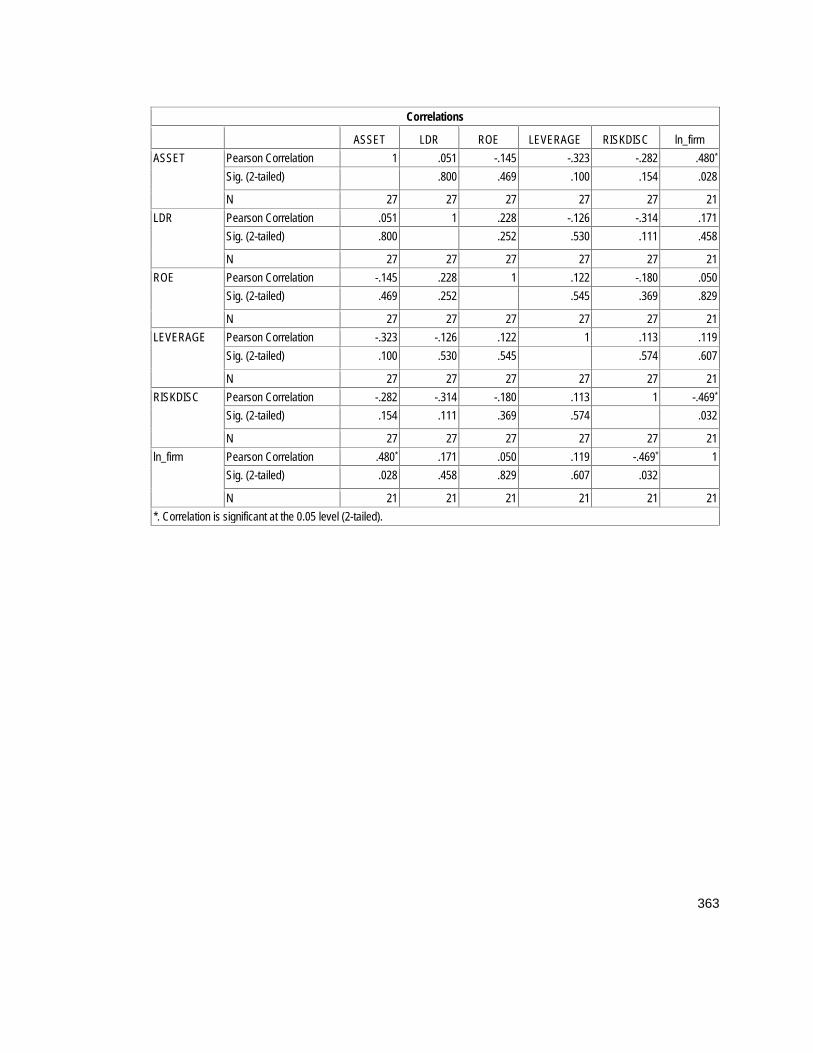
363
Correlations
ASSET LDR ROE LEVERAGE RISKDISC ln_firmASSET Pearson Correlation 1 .051 -.145 -.323 -.282 .480*
Sig. (2-tailed) .800 .469 .100 .154 .028
N 27 27 27 27 27 21LDR Pearson Correlation .051 1 .228 -.126 -.314 .171
Sig. (2-tailed) .800 .252 .530 .111 .458
N 27 27 27 27 27 21ROE Pearson Correlation -.145 .228 1 .122 -.180 .050
Sig. (2-tailed) .469 .252 .545 .369 .829
N 27 27 27 27 27 21LEVERAGE Pearson Correlation -.323 -.126 .122 1 .113 .119
Sig. (2-tailed) .100 .530 .545 .574 .607
N 27 27 27 27 27 21RISKDISC Pearson Correlation -.282 -.314 -.180 .113 1 -.469*
Sig. (2-tailed) .154 .111 .369 .574 .032
N 27 27 27 27 27 21ln_firm Pearson Correlation .480* .171 .050 .119 -.469* 1
Sig. (2-tailed) .028 .458 .829 .607 .032
N 21 21 21 21 21 21*. Correlation is significant at the 0.05 level (2-tailed).
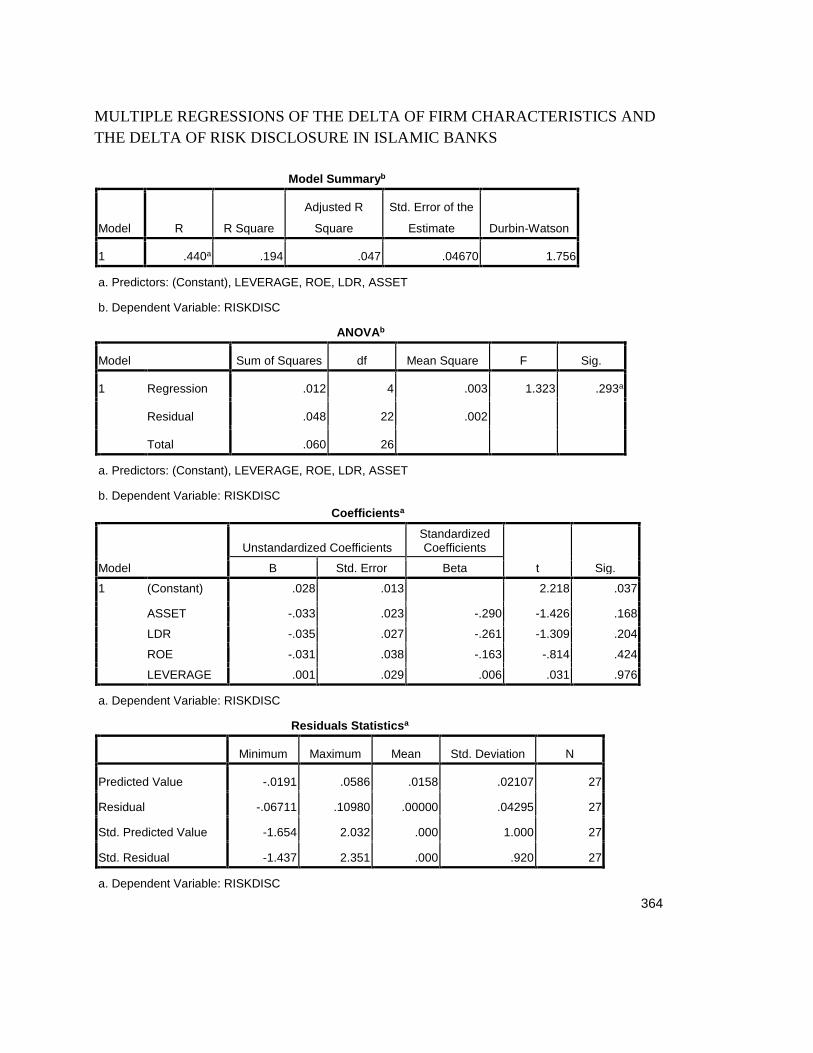
364
MULTIPLE REGRESSIONS OF THE DELTA OF FIRM CHARACTERISTICS ANDTHE DELTA OF RISK DISCLOSURE IN ISLAMIC BANKS
Model Summaryb
Model R R Square
Adjusted R
Square
Std. Error of the
Estimate Durbin-Watson
1 .440a .194 .047 .04670 1.756
a. Predictors: (Constant), LEVERAGE, ROE, LDR, ASSET
b. Dependent Variable: RISKDISC
ANOVAb
Model Sum of Squares df Mean Square F Sig.
1 Regression .012 4 .003 1.323 .293a
Residual .048 22 .002
Total .060 26
a. Predictors: (Constant), LEVERAGE, ROE, LDR, ASSET
b. Dependent Variable: RISKDISCCoefficientsa
Model
Unstandardized CoefficientsStandardizedCoefficients
t Sig.B Std. Error Beta
1 (Constant) .028 .013 2.218 .037
ASSET -.033 .023 -.290 -1.426 .168
LDR -.035 .027 -.261 -1.309 .204
ROE -.031 .038 -.163 -.814 .424
LEVERAGE .001 .029 .006 .031 .976
a. Dependent Variable: RISKDISC
Residuals Statisticsa
Minimum Maximum Mean Std. Deviation N
Predicted Value -.0191 .0586 .0158 .02107 27
Residual -.06711 .10980 .00000 .04295 27
Std. Predicted Value -1.654 2.032 .000 1.000 27
Std. Residual -1.437 2.351 .000 .920 27
a. Dependent Variable: RISKDISC

365
MULTIPLE REGRESSIONS OF THE DELTA OF FIRM CHARACTERISTICS ANDTHE DELTA OF RISK DISCLOSURE AND THE DELTA OF FIRM VALUE INISLAMIC BANKS
Model Summaryb
Model R R SquareAdjustedR Square
Std. Error of theEstimate Durbin-Watson
1 .671a .450 .267 1.46000 2.318a. Predictors: (Constant), RISKDISC, LEVERAGE, LDR, ROE, ASSETb. Dependent Variable: ln_firm
ANOVAb
ModelSum of
Squares df Mean Square F Sig.
1 Regression 26.188 5 5.238 2.457 .081a
Residual 31.974 15 2.132
Total 58.162 20
a. Predictors: (Constant), RISKDISC, LEVERAGE, LDR, ROE, ASSETb. Dependent Variable: ln_firm
Coefficientsa
Model
UnstandardizedCoefficients
StandardizedCoefficients
t Sig.
Collinearity Statistics
B Std. Error Beta Tolerance VIF
1 (Constant) -2.221 .570 -3.895 .001
LDR .125 .892 .028 .141 .890 .900 1.111
ROE -.266 1.257 -.043 -.211 .835 .880 1.137
ASSET 2.329 .980 .589 2.377 .031 .596 1.677
LEVERAGE 2.313 1.244 .434 1.860 .083 .674 1.484
RISKDISC -8.175 7.498 -.241 -1.090 .293 .751 1.331a. Dependent Variable: ln_firm
Residuals Statisticsa
Minimum Maximum Mean Std. Deviation N
Predicted Value -3.4515 .8404 -1.4499 1.14429 21Residual -2.03467 3.46688 .00000 1.26440 21Std. Predicted Value -1.749 2.002 .000 1.000 21Std. Residual -1.394 2.375 .000 .866 21a. Dependent Variable: ln_firm
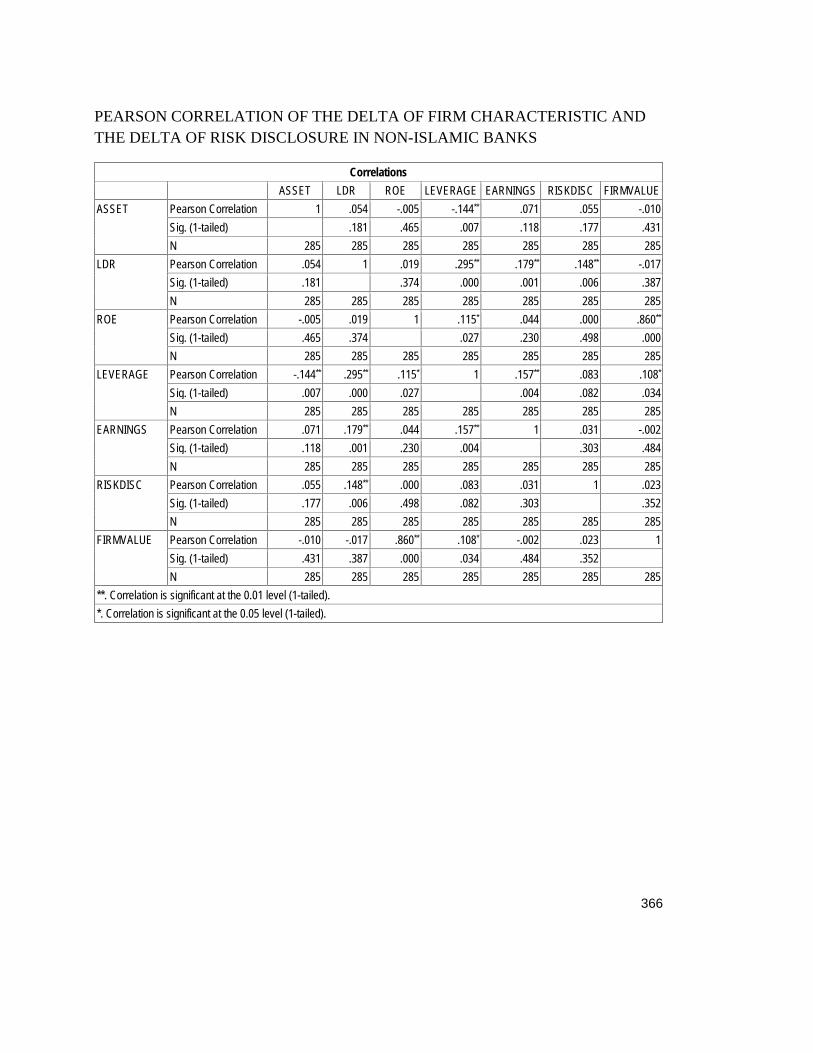
366
PEARSON CORRELATION OF THE DELTA OF FIRM CHARACTERISTIC ANDTHE DELTA OF RISK DISCLOSURE IN NON-ISLAMIC BANKS
CorrelationsASSET LDR ROE LEVERAGE EARNINGS RISKDISC FIRMVALUE
ASSET Pearson Correlation 1 .054 -.005 -.144** .071 .055 -.010Sig. (1-tailed) .181 .465 .007 .118 .177 .431N 285 285 285 285 285 285 285
LDR Pearson Correlation .054 1 .019 .295** .179** .148** -.017Sig. (1-tailed) .181 .374 .000 .001 .006 .387N 285 285 285 285 285 285 285
ROE Pearson Correlation -.005 .019 1 .115* .044 .000 .860**
Sig. (1-tailed) .465 .374 .027 .230 .498 .000N 285 285 285 285 285 285 285
LEVERAGE Pearson Correlation -.144** .295** .115* 1 .157** .083 .108*
Sig. (1-tailed) .007 .000 .027 .004 .082 .034N 285 285 285 285 285 285 285
EARNINGS Pearson Correlation .071 .179** .044 .157** 1 .031 -.002Sig. (1-tailed) .118 .001 .230 .004 .303 .484N 285 285 285 285 285 285 285
RISKDISC Pearson Correlation .055 .148** .000 .083 .031 1 .023Sig. (1-tailed) .177 .006 .498 .082 .303 .352N 285 285 285 285 285 285 285
FIRMVALUE Pearson Correlation -.010 -.017 .860** .108* -.002 .023 1Sig. (1-tailed) .431 .387 .000 .034 .484 .352N 285 285 285 285 285 285 285
**. Correlation is significant at the 0.01 level (1-tailed).*. Correlation is significant at the 0.05 level (1-tailed).

367
MULTIPLE REGRESSIONS OF THE DELTA OF FIRM CHARACTERISTICS ANDTHE DELTA OF RISK DISCLOSURE IN NON-ISLAMIC BANKS
Model Summaryb
Model R R SquareAdjusted R
SquareStd. Error ofthe Estimate
Durbin-Watson
1 .164a .027 .009 .06302 2.404a. Predictors: (Constant), EARNINGS, ROE, ASSET, LDR, LEVERAGEb. Dependent Variable: RISKDISC
ANOVAb
ModelSum ofSquares df Mean Square F Sig.
1 Regression .030 5 .006 1.535 .179a
Residual 1.108 279 .004
Total 1.138 284
a. Predictors: (Constant), EARNINGS, ROE, ASSET, LDR, LEVERAGEb. Dependent Variable: RISKDISC
Coefficientsa
Model
UnstandardizedCoefficients
StandardizedCoefficients
t Sig.
Collinearity Statistics
B Std. Error Beta Tolerance VIF
1 (Constant) .002 .004 .562 .574
ASSET .002 .003 .056 .931 .353 .962 1.039
LDR .020 .009 .130 2.081 .038 .887 1.127
ROE -.001 .010 -.008 -.132 .895 .986 1.015
LEVERAGE .010 .012 .054 .851 .396 .863 1.158
EARNINGS .000 .008 -.005 -.079 .937 .949 1.054a. Dependent Variable: RISKDISC
Residuals Statisticsa
Minimum Maximum Mean Std. Deviation N
Predicted Value -.0277 .0742 .0049 .01036 285Residual -.33061 .37902 .00000 .06246 285Std. Predicted Value -3.145 6.684 .000 1.000 285Std. Residual -5.246 6.015 .000 .991 285a. Dependent Variable: RISKDISC
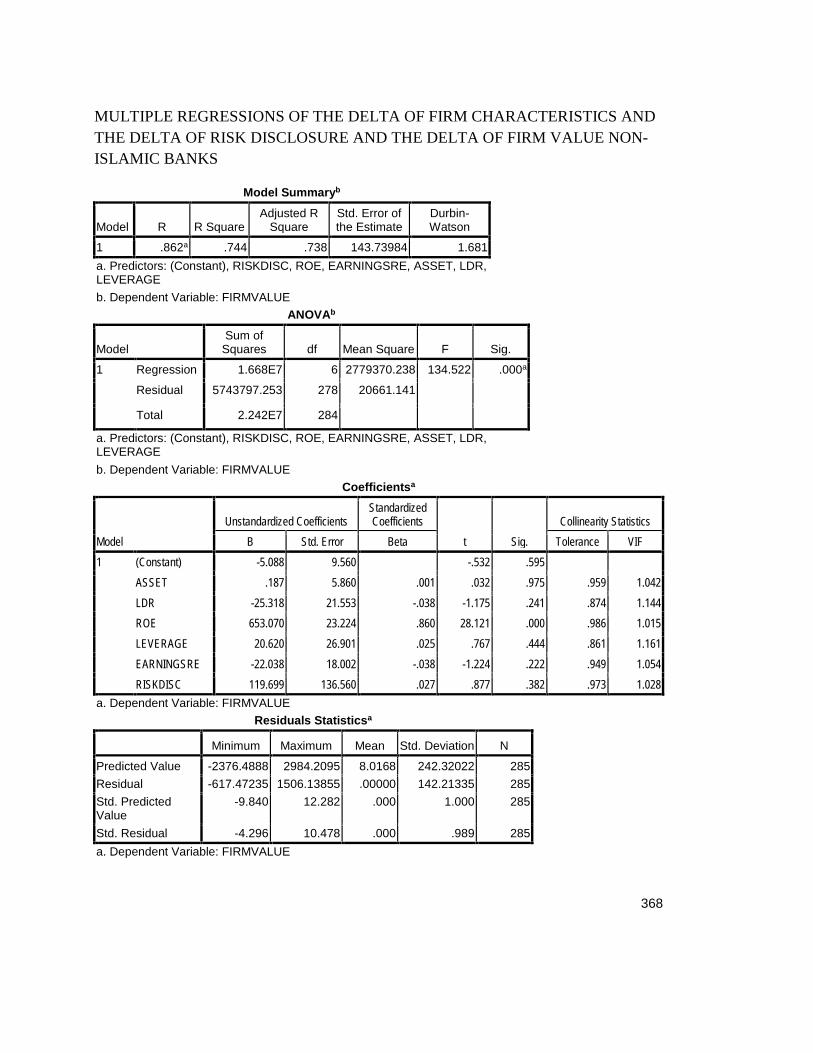
368
MULTIPLE REGRESSIONS OF THE DELTA OF FIRM CHARACTERISTICS ANDTHE DELTA OF RISK DISCLOSURE AND THE DELTA OF FIRM VALUE NON-ISLAMIC BANKS
Model Summaryb
Model R R SquareAdjusted R
SquareStd. Error ofthe Estimate
Durbin-Watson
1 .862a .744 .738 143.73984 1.681a. Predictors: (Constant), RISKDISC, ROE, EARNINGSRE, ASSET, LDR,LEVERAGEb. Dependent Variable: FIRMVALUE
ANOVAb
ModelSum of
Squares df Mean Square F Sig.
1 Regression 1.668E7 6 2779370.238 134.522 .000a
Residual 5743797.253 278 20661.141
Total 2.242E7 284
a. Predictors: (Constant), RISKDISC, ROE, EARNINGSRE, ASSET, LDR,LEVERAGEb. Dependent Variable: FIRMVALUE
Coefficientsa
ModelUnstandardized Coefficients
StandardizedCoefficients
t Sig.Collinearity Statistics
B Std. Error Beta Tolerance VIF1 (Constant) -5.088 9.560 -.532 .595
ASSET .187 5.860 .001 .032 .975 .959 1.042LDR -25.318 21.553 -.038 -1.175 .241 .874 1.144ROE 653.070 23.224 .860 28.121 .000 .986 1.015LEVERAGE 20.620 26.901 .025 .767 .444 .861 1.161EARNINGSRE -22.038 18.002 -.038 -1.224 .222 .949 1.054RISKDISC 119.699 136.560 .027 .877 .382 .973 1.028
a. Dependent Variable: FIRMVALUEResiduals Statisticsa
Minimum Maximum Mean Std. Deviation N
Predicted Value -2376.4888 2984.2095 8.0168 242.32022 285Residual -617.47235 1506.13855 .00000 142.21335 285Std. PredictedValue
-9.840 12.282 .000 1.000 285
Std. Residual -4.296 10.478 .000 .989 285a. Dependent Variable: FIRMVALUE
Related Documents


![RESEARCH ARTICLE Open Access Determinants of frequency and … · 2017. 8. 23. · its relevance [2]. In this study we aimed to determine for how long clinical documents are used](https://static.cupdf.com/doc/110x72/6128820cb15a9e3b7a12dab0/research-article-open-access-determinants-of-frequency-and-2017-8-23-its-relevance.jpg)
