NASA CR- MCR-75-212 FINAL REPORT October 1975 NAS9-13578r The Detection of Tightly Closed Flaws by Nondestructive H° E-1O ;M °, Testing (NDT) Methods E]H° Iv • ~Pq "P€ Ward D. Rummel, Richard A. Rathke, Z,:, '04 O Paul H. Todd, Jr., and Steve J. Mullen r o / 'H W Mr. W. L. Castner z NASA Technical Monitor ~ r4 So 4J W "n ='L BY REPRODUCEC U. SP rING MME PE Final Report of Research Performed under Contract NAS9-13578 for the National Aeronautics and Space Administration Lyndon B. Johnson Space Center Houston, Texas 77058 A - A -

Welcome message from author
This document is posted to help you gain knowledge. Please leave a comment to let me know what you think about it! Share it to your friends and learn new things together.
Transcript

NASA CRshy
MCR-75-212 FINAL REPORT October 1975 NAS9-13578r
The Detection of Tightly Closed Flaws byNondestructiveHdeg
E-1OMdeg Testing (NDT) MethodsE]Hdeg
Ivbull ~Pq Peuro Ward D Rummel Richard A Rathke Z 04O Paul H Todd Jr and Steve J Mullen
r o
H W Mr W L Castner z NASA Technical Monitor
~ r4
So 4J
W n=L
BYREPRODUCEC
U SP rING MME PE Final Report of Research Performed
under Contract NAS9-13578 for the
National Aeronautics and Space Administration
Lyndon B Johnson Space Center
Houston Texas 77058
A - A shy
1 Report No 2 Govornmont Accossion No 3 Recipients Catalog No
4 Title and Subtitle 5 Report Data
THE DETECTION OF TIGHTLY CLOSED FLAWS BY October 1975
NONDESTRUCTIVE TESTING (NDT) METHODS 6 Performing Organization Code
7 Author(s) Ward D Rummel Richard A Rathke 8 Performing Organization Report No Paul H Todd Jr and Steve J Mullen MCR-75-212
9 Performing Organization Name and Address 10 Work Unit No
Martin Marietta Aerospace 11 Contractor Grant No Denver Division NAS9-13578 Denver Colorado 80201
13 Type of Report and Perod Covered Contractor Report12 Sponsoring Agency Name and Address June 1973 - October 1975
National Aeronautics and Space Administration 20546Washington DC
14 Sponsoring Agency Code
15 Supplementary Notes
16 Abstract Liquid penetrant ultrasonic eddy current and x-radiographic techniques were optimized and applied to the evaluation of 2219-T87 aluminum alloy test specimens in integrally
stiffened panel and weld panel configurations Fatigue cracks in integrally
stiffened panels lack-of-fusion in weld panels and fatigue cracks in weld panels
were the flaw types used for evaluation 2319 aluminum alloy weld filler rod was used
for all welding to produce the test specimens Forty seven integrally stiffened panels
containing a total of 146 fatigue cracks ninety three lack-of-penetration (LOP)
specimens containing a total of 239 LOP flaws and one-hundred seventeen welded specimens
containing a total of 293 fatigue cracks were evaluated Specimen thickness were
nominally 0317 cm (0125 inch) and 127 cm (0500 inch) for welded specimens and
0710 cm (0280 inch) for the integrally stiffened panels NDT detection reliability
enhancement was evaluated during separate inspection sequences in the specimens in the as-machined or as-welded post etched and post proof loaded conditions Results
of the nondestructive test (NDT) evaluations were compared to the actual flaw size
obtained by measurement of the fracture specimens after completing all inspection
sequences Inspection data were then analyzed to provide a statistical basis for
determining the flaw detection reliability Analyses were performed at 95 probability
and 95 confidence levels and one sided lower confidence limits were calculated by
the binomial method The data were plotted for each inspection technique specimen
type and flaw type as a function of actual flaw length and depth
PRICES SUBJECT TO CHANGE
17 Key Words 18 Distribution Statement
Nondestructive Testing 2219 Aluminum
Flaw Detection Reliability Welding
Liquid Penetrant Fracture Cont
Ultrasonic Fatigue Crack Unclassified - Unlimited
Eddy Current Cat 18 v-1ndiogranhv 19 Security Classif (of this report) 20 Security Classif (of this page)
Unclassified Unclassified
PREFACE
This report was prepared by Martin Marietta Aerospace under contract NAS 9-13578 Work reported was initiated by National Aeronautics and Space Administration Lyndon B Johnson Space Center to evaluate the capability of nondestructive evaluation techniques to detect flaws in weldments and stringer stiffended panels The work describshyed herein was completed between June 30 1973 and October 30 1975 Work was conducted under the technical direction of Mr W L Castner of the Johnson Space Center
At Martin Marietta Aerospace Mr Ward D Rummel provided technical direction and program management Mr Richard A Rathke was Principle Investigator for eddy current and statistical data analysis Mr Paul H Todd Jr was principle investigator for other nondestrucive-evaluation techniques Dr Conrad F Fiftal C Toth W Post R Chihoski and W Phillips provided support in all sample preparation Messrs Thomas L Tedrow H D Brinkerhoff S Mullen and S R Marston provided support in X-radiographic investigations Additional inspection and analysis support were provided by Messrs L Gentry H Lovinsone R Stadler and J Neri Jr Special X-radiograph analysis was provided by Mr H Ridder Magnaflux Corporation
Management support was provided by Messrs G McGee R Morra C Duclon C Cancallosi and R Daum
Editing and typing were done by Ms B Beddinger and J Dummer
The assistance and cooperation of all contributing personnel are appreciated and gratefully acknowledged We also appreciate the program direction support and contributions of Mr W L Castner
and gratefully acknowledge his continuing participation
ii
CONTENTS
Page
PREFACE
INTRODUCTION I-I and 1-2
STATE-OF-THE-ART NONDESTRUCTIVE TESTING (NDT) METHODS II-i X-radiography 11-2 Penetrant I 11-5
thru TI-il
Ultrasonic Inspection 11-6 Eddy CurrentI 11-8
INTEGRALLY STIFFENED STRINGER PANEL EVALUATION I-i Specimen Preparation 111-4
thru
NDT Optimization I 111-9 Test Specimen Evaluation 111-17 Panel Fracture 111-20 Data Analysis 111-20 Data Results 111-29
111-32
EVALUATIONdeg OF LACK OF PENETRATION (LOP) PANELS IV-i Specimen Preparation IV-4 NDT Optimization
thru
IV-5 Test Specimen Evaluation IV-10 Panel Fracture IV-12 Data Analysis IV-12 Data Results IV-23
IV-34
FATIGUE-CRACKED WELD PANEL EVALUATION Specimen Preparationbull o V-I
NDT Optimization V-5 Test Specimen Evaluation
thru
V-7 Panel Fracture V-9 Data Analysis V-9 Data Results V-25
V-41
CONCLUSIONS AND RECOMMENDATIONS VIand VT-2
Ii
Page
APPENDIX A- LIQUID PENETRANT INSPECTION PROCEDURE FOR WELD PANELS STIFFENED PANELS AND LOP PANELS A-I
APPENDIX B- ULTRASONIC INSPECTION FOR TIGHT FLAW
DETECTION BY NDT PROGRAM - INTEGRALLY STIFFENED PANELS B-I
APPENDIX C- EDDY CURRENT INSPECTION AND RECORDING FOR INTEGRALLY STIFFENED ALUMINUM PANELS C-i
APPENDIX D- X-RADIOGRAPHIC INSPECTION PROCEDURES FOR DETECTION OF FATIGUE CRACKS AND LOP IN WELDED PANELS D-i
APPENDIX E- ULTRASONIC INSPECTION FOR TIGHT FLAWS DETECTION BY NDT PROGRAM - LOP PANELS E-1
APPENDIX F- EDDY CURRENT INSPECTION AND RECORDING OF LACK OF PENETRATION (LOP) ALUMINUM PANELS UNSCARFED CONDITION F-I
APPENDIX r- EbDY CURRENT INSPECTION AND C SCAN RECORDING OF LOP ALUMINUM PANELS SCARFED CONDITION G-i
APPENDIX H- ULTRASONIC INSPECTION FOR TIGHT FLAWS DETECTED BY NDT PROGRAM - WELD PANELS HAVING CROWNS H-I
APPENDIX I- ULTRASONIC INSPECTION FOR TIGHT FLAWS IN PANELS WITH FLUSH WELDS oI-I
APPENDIX J- EDDY CURRENT INSPECTION AND RECORDING OF WELD CRACK ALUMINUM PANELS HAVING CROWNS J-1
APPENDIX K- EDDY CURRENT INSPECTION AND C-SCAN RECORDING OF FLUSH WELD ALUMINUM PANELS K-i
iv
Figure
III-1 Anticipated Surface Stress Distribution for Axially
Loaded 2219-T87 Integrally Stiffened Panel 111-2
111-2 NDT Evaluation Sequence for Integrally Stiffened III-3Panels
111-3 Integrally Stiffened Panel Configuration 111-5 111-4 Schematic Side View of the Starter Flaw and Final
Crack Configurations Integrally Stiffened Panels 111-6
111-5 Ultrasonic Reflected Energy Response 111-12
111-6 Eddy Current Probe 111-14
111-7 Typical Eddy Current Scanning setup for Stringer Panels 111-15
IlI-8 Typical Eddy Current Recordings 111-16
111-9 Stringer-to-Subpanel Attachment 111-18 III-10 Integrally Stiffened Panel Layout and Riveted Panel
Configuration S en 111-19
iii-11 Crack Detection Probability for Integrally Stiffened
Panels by the Penetrant Method Plotte- at 95
Probability and 95 Confidence Level 111-30
111-12 Crack Detection Probability for Integrally Stiffened Panels by the Ultrasonic Method Plotted at 95
Probability and 95 Confidence Level 111-31
111-13 Crack Detection Probability for Integrally Stiffened Panels by the Eddy Current Method Plotted at 95
Probability and 95 Confidence Level 111-32
IV-l Typical Weldment Lack of Penetration Defects IV-I IV-2 NDT Evaluation Sequence for Lack of Penetration
Panels IV-3
IV-3 Schematic View of a Buried LOP in a Weld with Representative Photomicrograph Crossectional Views of a Defect IV-6
IV-4 Spring-Loaded Eddy Current Scanning Probe Holder for Welded Panels with Crowns IV-8
IV-5 Spring-Loaded Eddy Current Scanning Probe Holder
for Flat Panels IV-9
IV-6 Schematic Side View of a LOP (Lune) Flaw Showing Critical Dimensions IV-13
IV-7 Flaw Detection Probability for LOP Panels by the
Penetrant Method Plotted at 95 Probability and 95 Confidence IV-31
IV-8 Flaw Detection Probability for LOP Panels-by the Ultrasonic Method Plotted at 95 Probability and
95 Confidence IV-32
IV-9 Flaw Detection Probability for LOP Panels by the Eddy
Confidence IV-33 Current Method Plotted at 95 Probability and 95
v
IV-1O Flaw Detection Probability for LOP Panels by the X-radiograph Method Plotted at 95 Probability and 95 Confidence -- IV-34
V-I NDT Evaluation Sequence for Fatigue-Cracked Welded Panels V-2
V-2 Fatigue-Cracked Weld Panels V-3 V-3 Schematic Side View of the Starter Flaw and Final
Flaw Configurations for Fatigue-Cracked Weld Panels V-4
V-4 Crack Detection Probability for Longitudinal Welds With Crowns by the Penetrant Method Plotted at 95 Probability and 95 Confidence V-26
V-5 Crack Detection Probability for Longitudinal Welds With Crowns by the Ultrasonic Method Plotted at 95 Probability and 95 Confidence V-27
V-6 Crack Detection Probability for Longitudinal Welds With Crowns by the Eddy Current Method Plotted at 95
Probability and 95 Confidence V-28 V-7 Crack Detection Probability for Longitudinal Welds
With Crowns by the X-radiograph Method Plotted at 95
Probability and 95 Confidence V-29 V-8 Crack Detection Probability for Transverse Welds
with Crowns by the Penetrant Method Plotted at 95 Probability and 95 Confidence V-30
V-9 Crack Detection Probability for Transverse Welds with Crowns by the Ultrasonic Method Plotted at 95 Probability and 95 Confidence V-31
V-10 Crack Detection Probability for Transverse Welds with Crowns by the Eddy Current Method Plotted at 95 Probability and 95 Confidence V-32
V-Il Crack Detection Probability for Transverse Welds with Crowns by the X-radiograph Method Plotted at 95
Probability and 95 Confidence V-33 V-12 Crack Detection Probability for Flush Longitudinal
Welds by the Penetrant Method Plotted at 95 Probability and 95 Confidence V-34
V-13 Crack Detection Probability for Flush Longitudinal Welds by the Ultrasonic Method Plotted at 95 Probability and 95 Confidence V-35
V-14 Crack Detection Probability for Flush Longitudinal Welds by the Eddy Current Method Plotted at 95
Probability and 95 Confidence V-36
V-15 Crack Detection -Probability for Flush Longitudinal Welds by the X-radiograph Method Plotted at 95 Probability and 95 Confidence V-37
V-16 Crack Detection Probability for Flush Transverse Welds by the Penetrant Method Plotted at 95 Probability and 95 Confidence V-38
vi
V-17 Crack Detection Probability for Flush Transverse Welds by the Ultrasonic Method Plotted at P5 Probability and 95 Confidence V-39
V-18 Crack Detection Probability for Flush Transverse Welds by the Eddy Current Method Plotted at 95 Probability and 95 Confidence V-40
V-19 Crack Detection Probability for Flush Transverse Welds by the X-radiograph Method Plotted at 95 Probability and 95 Confidence V-41
vii
Table
III-I Parameters for Fatigue Crack Growth in Integrally Stiffened Panels I-7
II-2 Stringer Panel Flaw Distribution I1-8 111-3 Actual Crack Data Integrally Stiffened Panels 111-21 111-4 NDT Observations Integrally Stiffened Panels 111-23 IV-I Actual Flaw Data LOP Panels IV-14 IV-2 NDT Observations LOP Panels IV-18 IV-3 NDT Observation by the Penetrant Method LOP
IV-4 Panels NDT Observations by the Ultrasonic Method Merged
V-22
Data LOP Panels _ IV-26 V-I Parameters for Fatigue Crack Growth in Welded
Panels V-6 V-2 Actual Crack Data Fatigue Cracked Longitudinal
Welded Panels with Crowns V-10 V-3 Actual Crack Data Fatigue Cracked Transverse
Welded Panels with Crowns_ V-12 V-4 Actual Crack Data Fatigue Cracked Flush
Longitudinal Welded Panels V-13 V-5 Actual Crack Data Fatigue Cracked Flush
Transverse Welded Panels V-15 V-6 NDT Observations Fatigue Cracked Longitudinal
Welded Panels with Crowns V-17 V-7 NDT Observations Fatigue Cracked Transverse
Welded Panels with Crowns V-19 V-8 NDT Observations Fatigue Cracked Flush
Longitudinal Welded Panels V-21 V-9 NDT Observations Fatigue Cracked Flush Transverse
Welded Panels V-24
viii
I INTRODUCTION
Recent advances in engineering structural design and quality assurance techniques have incorporated material fracture characshyteristics as major elements in design criteria Fracture control design criteria in a simplified form are the largest (or critshyical) flaw size(s) that a given material can sustain without fracshyture when subjected to service stresses and environmental condishytions To produce hardware to fracture control design criteria it is necessary to assure that the hardware contains no flaws larger than the critical
Many critical structural hardware components including some pressure vessels do not lend themselves to proof testing for flaw screening purposes Other methods must be used to establish maximum flaw sizes that can exist in these structures so fracture analysis predictions can be made regarding-structural integrity
Nondestructive- testing--ENDT)- is- the only practica-l way-in which included flaws may be detected and characterized The challenge to nondestructive testing engineering technology is thus to (1) detect the flaw (2) determine its size and orientation and (3) precisely locate the flaw Reliance on NDT methods for flaw hardshyware assurance requires a knowledge of the flaw size that each NET method can reliably find The need for establishing a knowshyledge of flaw detection reliability ie the maximum size flaw that can be missed has been identified and has been the subject of other programs involving flat 2219 aluminum alloy specimens The next logical step in terms of NASA Space Shuttle program reshyquirements was to evaluate flaw detection reliability in other space hardware elements This area of need and the lack of such data were pointed out in NASA TMX-64706 which is a recent stateshyof-the-art assessment of NDT methods
Donald E Pettit and David W Hoeppner Fatigue FZcao Growth and NDI Evaluation for Preventing Through-Cracks in Spacecraft Tankshyage Structures NASA CR-128560 September 25 1972
R T Anderson T J DeLacy and R C Stewart Detection of Fatigue Cracks by Nondestructive Testing Methods NASA CR-128946 March 1973
Ward D Rummel Paul H Todd Jr Sandor A Frecska and Richard A Rathke The Detection of Fatigue Cracks by Nondestructive Testing Methods NASA CR-2369 February 1974
I-i
-------------------------------------------------------------
The program reported here was conducted to determine the relishy
ability of nondestructive testing methods in detecting tightly
closed flaws in three Space Shuttle structural elements ie
(1) cracks in the radii of integrally stiffened 2219 aluminum
alloy structures (2) lack of penetration (LOP) in welded 2219
aluminum alloy structures and (3) cracks in the weld area in
welded 2219 aluminum alloy structures X-radiographic penetrant
ultrasonic and eddy current methods were evaluated
As a secondary objective production processing steps were simushy
assess the effects of various operations and constraintslated to on inspection sensitivity and to aid in analysis and planning of
inspection operations at optimum points in the production sequence
Experience has shown that one of the most difficult flaws to deshy
tect by NDT techniques is a small tightly closed flaw and that
this is one of the flaw types most detrimental to load-carrying
Tightly closed flaws may be simulated by artificiallystructures induced fatigue cracks and by lack of penetration (LOP) in two
opposing pass weldments By using these primary flw types the
influences of crack orientation location etc can be evaluated by
systematic variation of sample preparation and inspection sequences
Methods previously developed were used to prepare test specimens
NDT methods were optimized for these specimens in accordance with
industry practices NDT evaluation of samples was conducted and
documented to establish a data base for rigorous analysis of NDT
capabilities Statistical analysis methods established previously
under NASA contract NAS9-12276 and in current investigation under
NASA contract NAS3-18907t were used to analyze and present the
data
Since the output of the program was engineering data care was
taken in the program to randomize samples inspection sequences
and data reporting Inspection analyses were performed indepenshy
dently by operators who had no knowledge of the number of flaws
in test panels Blank panels were introduced to further randomize
data and to negate anticipation of flaws The results are intended
to reflect attainable detection sensitivities and reliabilities when
NDT techniques are directed toward specific flaw types
The program was functionally divided into three elements relating
to the panel and flaw types These elements are discussed separshy
ately in the following chapters
S Klima Assessment of NDT ReZiability Data NAS3-18907
(to be completed in June 1975)
1-2
-----------------------------------------------------------------
-------------------------------------------------------------------
II STATE-OF-THE-ART NONDESTRUCTIVE TESTING (NDT) METHODS
Nondestructive testing nondestructive inspection and nondesshy
tructive evaluation in the broadest sense denote testing inspecshy
tion andor evaluation of a material component or system withshy
out altering or destroying the functional capability of the tested
item Like other forms of testing NDT is used to reduce risk in
the functional performance of the item and as such provides a
measure of insurance for the producer evaluator andor operator
of the item Unlike other forms of testing it offers the capashy
bility for 100 testing or sampling and provides economic advantage
by assurance of no loss of any part of the item These advantages
have been both aids and liabilities in the orderly development of
the technology Although nondestructive testing methods are widely
used little quantitative information concerning testing capashy
bilities has been produced This program was directed toward
quantitative assessment of NDT methods It was not intended to
advance the state of the art in terms of new methods or increased
sensitivity It was intended to provide a practical engineering
tool for application of methods now used in the industry The rshyradiography (X-ray) liquid penetrant ultrasonic and eddy current
test methods generally used for assurance of aluminum alloy matershy
ials components and assemblies were selected for this study
Many testing options are available in application of these methods
This report addresses generally applied techniques as used in stateshy
of-the-art engineering technologies
Robert B Neuschaefer and James B Beal Assessment of and Standshy
ardization for Quantitative Nondestructive Testing NASA TM-Xshy64706 September 30 1972
ASME Boiler and Pressure Vessel Code (Sections I I1 VIII and IX) 1968
Military Standard Radiographic Inspection Sowndness Requireshy
ments for Fusion Welds in Aluminum and Magnesium Missile Composhynents MIL-R-45774 October 1963
J R Alburger A New Significant Penetrant Parameter - Indishy
cation Depletion Time Constant Paper presented before the
American Society for Nondestructive Testing Spring Conference Los Angeles California 1973
B G Martin and C J Adams Detection of Lack of Fusion in
Aluminum Alloy Weldments by Ultrasonic Shear Waves Technical Paperdeg3499 Douglas Aircraft Company 1965
II-i
------------------------------------------------------------------
A X-RADIOGRAPHY
X-radiography is well established as a nondestructive evaluation
tool and has been used indiscriminately as an all-encompassing inspection method for detecting flaws and describing flaw size While pressure vessel specifications frequently require Xshy
radiographic inspection and the criteria allow no evidence of
crack lack of penetration or lack of fusion on radiographs little attempt has been made to establish or control defect detecshy
tion sensitivity Further an analysis of the factors involved
clearly demonstrates that X-radiography is one of the least reshy
liable of the nondestructive techniques available for crack detecshy
tion The quality or sensitivity of a radiograph is measured by reference to a penetrameter image on the film at a location of
maximum obliquity from the source A penetrameter is a physical
standard made of material radiographically similar to the test
object with a thickness less than or equal to 2 of the test obshy
ject thickness and containing three holes of diameters four times
(4T) two times (2T) and equal to (IT) the penetrameter thickness Normal space vehicle sensitivity is 27 as noted by perception of
the 2T hole (Fig II-1)
In theory such a radiograph should reveal a defect with a depth
equal to or greater than 2 of the test object thickness Since
it is however oriented to defects of measureable volume tight
defects of low volume such as cracks and lack of penetration may
not be detected
Op cit ASME Boiler and Pressure Vessel Code
MIL R-45774
11-2
2T dia Hole
1T dia
4T dia
Hole
Thickness T Equal to 2 of the Test Material
Figure I-1 Conventional Penetrmneter (MIL-STD-453)
In practice cracks and lack of penetration defects are detected only if the axis of the crack is located along the axis of the incident radiation Consider for example a test object (Fig 11-2) that contains defects A B and C Defect A lies along the axis of the cone of radiation and should be readily detected at depths approaching the 2 sensitivity requirement Defect B whose depth may approach the plate thickness will not be detected since it lies at an oblique angle to incident radiation Defect C lies along the axis of radiation but will not be detected over its total length This variable-angle property of X-radiation accounts for a higher crack detection record than Would be predicted by g~ometshyric analysis and at the same time emphasizes the fallacy of deshypending on X-radiography for total defect detection and evaluation
11-3
Figure-I1-2 Schematic View of Crack Orientationwith Respect to the Cone of Radiation from an X-ray Tube (Half Section)
Variables in the X-ray technique include such parameters as kiloshyvoltage exposure time source film distance and orientation film
type etc Sensitivity to orientation of fatigue cracks has been demonstrated by Martin Marietta in 2219-T87 parent metal Six
different crack types were used An off-axis exposure of 6 degrees resulted in missing all but one of the cracks A 15-degree offset
caused total crack insensitivity Sensitivity to tight LOP is preshydicted to be poorer than for fatigue cracks Quick-look inspecshytion of known test specimens showed X-radiography to be insensishytive to some LOP but revealed a porosity associated with the lack of penetration
Advanced radiographic techniques have been applied to analysis of
tight cracks including high-resolution X-ray film (Kodak Hi-Rel) and electronic image amplification Exposure times for high-resoshylution films are currently too long for practical application (24
hr 0200-in aluminum) The technique as it stands now may be considered to be a special engineering tool
Electronic image processing has shown some promise for image analyshy
sis when used in the derivative enhancement mode but is affected by
the same geometric limitations as in producing the basic X-radiograph
The image processing technique may also be considered as a useful engineering tool but does not in itself offer promise of reliable crack or lack of penetration detection by X-radiography
This program addressed conventional film X-radiography as generally
applied in industry
11-4
-------------------------------------------------------
B PENETRANT
Penetrants are also used for inspection of pressure vessels to detect flaws and describe flaw length Numerous penetrant mateshyrials are available for general and special applications The differences between materials are essentially in penetration and subsequent visibility which in turn affect the overall sensishytivity to small defects In general fluorescent penetrants are more sensitive than visible dye penetrant materials and are used for critical inspection applications Six fluorescent penetrant materials are in current use for inspection of Saturn hardware ie SKL-4 SKL-HF ZL-22 ZL-44B P545 and P149
To be successful penetrant inspection requires that discontinuishyties be open to the surface and that the surface be free of conshytamination Flowed material from previous machining or scarfing operations may require removal by light buffing with emery paper or by light chemical etching Contamination may be removed by solvent wiping by vapor degreasing and by ultrasonic cleaning in a Freon bath Since ultrasonic cleaning is impractical for large structures solvent wipe and vapor degreasing are most comshymonly used and are most applicable to-this program
Factors affecting sensitivity include not only the material surshyface condition and type of penetrant system used but also the specific sequence and procedures used in performing the inspecshytion Parameters such as penetrant dwell time penetrant removal technique developer application and thickness and visual inspecshytion procedure are controlled by the inspector This in turn must be controlled by training the inspector in the discipline to mainshytain optimum inspection sensitivities
In Martin Marietta work with fatigue cracks (2219T87 aluminum)small tight cracks were often undetectable-by high-sensitivity penetrant materials but were rendered visible by proof loading the samples to 85 of yield strength
In recett work Alburger reports that controlling crack width to 6 to 8 microns results in good evaluation of penetrant mateshyrials while tight cracks having widths of less than 01 micron in width are undetected by state-of-the-art penetrants These values may be used as qualitative benchmarks for estimation of crack tightness in surface-flawed specimens and for comparison of inspection techniques This program addressed conventional fluoshyrescent penetrant techniques as they may be generally applied in industry
Op cit J R Alburger
I-5
C ULTRASONIC INSPECTION
Ultrasonic inspection involves generation of an acoustical wave in a test object detection of resultant reflected transmitted and scattered energy from the volume of the test object and
evaluation by comparison with known physical reference standards
Traditional techniques utilize shear waves for inspection Figure
11-3 illustrates a typical shear wave technique and corresponding oscilloscope presentation An acoustical wave is generated at an angle to the part surface travels through the part and is reshyflected successively by boundaries of the part and also by inshycluded flaw surfaces The presence of a-reflected signal from
the volume of the material indicates the presence of a flaw The relative position of the reflected signal locates the flaw while the relative amplitude describes the size of the flaw Shear wave inspection is a logical tool for evaluating welded specimens and for tankage
FRRNT SUR FACE SIG NAL
REFLECTED SIGNAL
PATH OF
A SOI T - T RA N SD U E R
PART GEOMETRYOSCILLOSCOPE PRESENTATION
Figure I-3 Shear Wave Inspection
By scanning and electronically gating signals obtained from the volume of a part a plan view of a C-scan recording may be genershyated to provide uniform scanning and control of the inspection and to provide a permanent record of inspection
The shear wave technique and related modes are applicable to deshytection of tight cracks Planar (crack life) interfaces were reported to be detectable by ultrasonic shear wave techniques when a test specimen was loaded in compression up to the yield
point -Variable parameters influencing the sensitivity of shear wave inspection include test specimen thickness frequency and type and incident sound angle A technique is best optimized by analysis and by evaluation of representative reference specimens
It was noted that a shear wave is generated by placing a transshy
ducer at an angle to a part surface Variation of the incident angle results in variation in ultrasonic wave propagation modes
and variation of the technique In aluminum a variation in incishydent angle between approximately 14- to 29-degree (water immersion) inclination to the normal results in propagation of energy in the
shear mode (particulate motion transverse to the direction of propshyagation)
Op cit B G Martin and C J Adams
11-6
At an angle of approximately 30 degrees surface or Rayleigh waves that have a circular particulate motion in a plane transshyverse to the direction of propagation and a penetration of about one-half wavelength are generated At angles of approximately 78 126 147 196 256 and 310 to 330 degrees complex Lamb waves that have a particulate motion in symmetrical or asymshymetrical sinusoidal paths along the axis of propagation and that penetrate through the material thickness are generated in the thin (0060-in) materials
In recent years a technique known as Delta inspection has gained considerable attention in weldment evaluation The techshynique consists of irradiating a part with ultrasonic energy propshyagated in the shear mode and detecting redirected scattered and mode-converted energy from an included flaw at a point directly above the flaw (Fig 11-4) The advantage of the technique is the ability to detect crack-like flaws at random orientations
Reevn
TransmittingRedirected Transducer Reradiated Energy_
Path of Sound Energy
Figure 11-4 Schematic View of the Delta Inspection Technique
In addition to variations in the ultrasonic energy propagation modes variations in application may include immersion or contact variation in frequency and variation in transducer size and focus For optimum detection sensitivity and reliability an immersion technique is superior to a contact technique because several inshyspecteion variables are eliminated and a permanent recording may be obtained Although greater inspection sensitivity is obtained at higher ultrasonic frequencies noise and attenuation problems increase and may blank out a defect indication Large transducer size in general decreases the noise problems but also decreases the selectivity because of an averaging over the total transducer face area Focusing improves the selectivity of a larger transshyducer for interrogation of a specific material volume but der creases the sensitivity in the material volume located outside the focal plane
I
This program addressed the conventional -shear wavetechnique as generally applied in industry
H1-7
-------- -----------------------------------------------
D EDDY CURRENT
Eddy current inspection has been demonstrated to be very sensishytive to small flaws in thin aluminum materials and offers conshysiderable potential for routine application Flaw detection by
eddy current methods involves scanning the surface of a test object with a coil probe electronically monitoring the effect of such scanning and noting the variation of the test frequency
to ascertain flaw depth In principle if a probe coil is energized with an alternating current an alternating magnetic field will be generated along the axis of the coil (Fig 11-5) If the coil is placed in contact with a conductor eddy currents
will be generated in the plane of the conductor around the axis of the coil The eddy currents will in turn generate a magnetic field of opposite sign along the coil This effect will load the coil and cause aresultant shift in impedance of the coil (phase and amplitude) Eddy currents generated in the materi al depend on conductivity p) the thickness T the magnetic permeashybility p and the materials continuity For aluminum alloys the permeability is unity and need not be considered
Note HH is the primary magneticp field generated by the coil
2 H is the secondary magnetic feld generated by eddy Current current flow-- ]_ Source
3 Eddy current flow depends on P = electrical conductivity
Probet = thickness (penetration) 12 = magnetic permeability
= continuity (cracks)
H~~
P to)oEddy_
Figure I1-5 Schematic View of on Eddy Current Inspection
Recommended Practice for Standardizing Equipment for Electroshy
magnetic Testing of Seamless Aluminum Alloy Tube ASTM E-215-67
September 1967
11-8
---------------------------------------------------------
The conductivity of 2219-T87 aluminum alloy varies slightly from sheet to sheet but may be considered to be a constant for a given sheet Overheating due to manufacturing processes will changethe conductivity and therefore must be considered as a variable parameter The thickness (penetration) parameter may be conshytrolled by proper selection of a test frequency This variable may also be used to evaluate defect depth and to detect partshythrough cracks from the opposite side For example since at 60 kHz the eddy current penetration depth is approximately 0060 inch in 2219-T87 aluminum alloy cracks should be readily deshytected from either available surface As the frequency decreases the penetration increases so the maximum penetration in 2219 aluminum is calculated to be on the order of 0200 to 0300 inch
In practical application of eddy currents both the material paramshyeters must be known and defined and the system parameters known and controlled Liftoff (ie the spacing between the probe and material surface) must be held constant or must be factored into the results Electronic readout of coil response must be held constant or defined by reference to calibration samples Inspecshytion speeds must be held constant or accounted for Probe orienshytation must be constant or the effects defined and probe wear must be minimized Quantitative inspection results are obtained by accounting for all material and system variables and by refershyence to physically similar known standards
In current Martin Marietta studies of fatigue cracks the eddy -current method is effectively used in describing the crack sizes Figure 11-6 illustrates an eddy current description of two surshyface fatigue cracks in the 2219-T87 aluminum alloy Note the discrimination capability of the method for two cracks that range in size only by a minor amount The double-peak readout in the case of the smaller crack is due to the eddy current probe size and geometry For deep buried flaws the eddy current technique may-not describe the crack volume but will describe the location of the crack with respect to the test sample surface By applyshying conventional ultrasonic C-scan gating and recording techshyniques a permanent C-scan recording of defect location and size may be obtained as illustrated in Figure 11-7
Since the eddy current technique detects local changes in material continuity the visibility of tight defects is greater than with other techniques The eddy current technique will be used as a benchmark for other techniques due to its inherently greater sensishytivity
Ward D Rummel Monitor of the Heat-Affected Zone in 2219-T87 Aluminum Alloy Weldments Transactions of the 1968 Symposiwn on NDT of Welds and MateriaZs Joining Los Angeles California March 11-13 1968
11-9
Larger Crack (a- 0
0 36-i
2c - 029-in)
J
C
Smaller Crack
(a - 0024-in 2c - 0067-1n)
Probe Travel
Figure 11-6 Eddy Current Detection of 2Wo Fatigue Cracks in 2219-T87 Aluminum Alloy
Figure II- Eddy Current C-Scan Recording of a 2219-T8 Alurinun Alloy Panel Ccntaining Three Fatigue Cracks (0 820 inch long and 010 inch deep)
EIGINAL PAGE IS
OF POOR QUALITY
II-10
Although eddy current scanning of irregular shapes is not a genshy
eral industrial practice the techniques and methods applied are
in general usage and interpretation may be aided by recorded data
collection and analysis in future programs
II-ii
-----------------------------------------------------------------
PANEL EVALUATIONII INTEGRALLY STIFFENED STRINGER
Integrally machined stiffened panels and riveted T-stiffened
panels are common aerospace structural design elements and are
Cracks in stiffenedrepresentive of Space Shuttle structure
be the result of a raw material (plate) anomaly orpanels may may be a product of machining heat treating forming operations
or service loading If they are service induced cracks will
most likely form at the tangency point of the rib radius as shown
Note in this figure that a ratherschematically in Figure III-1
sharp stress concentration occurs at the junction of the stress
and fillet radii (the nominal membrane stress in this figure is
30 ksi) This stress concentration extends through the thickness
but decreases from a K of about 14 on the rib side to 12 on t
the opposite side Note also the extremely sharp decrease in
stress at points along the curvature of the fillet Fatigue flaw
growth in stiffened panels was evaluated under a previous NASA
contract in which flaw growth in the rib side was assessed
In a practical sense the difficulty encountered by artificially
extending flaws occurring on the rib side of the fillet means
that these flaws should not be of major concern in flight hard-Thus the most critical ware subjected to a similar loading state
area to be examined by NDT is at the fillet tangency point and the
back surface behind this position because of the severity of cracks
occurring in the region of stress concentration
Cracks in the radius area normally open to thesurface and are aeffectively simulated by the tightly closed fatigue crack as
worst-case condition Artificially induced fatigue cracks in the
radius area were selected for evaluation After the flaw type and
location were established a program plan for test panel preparation
evaluation and analysis was established as shown schematically in
Figure III-2t
E J Beck Fatigue Flaw Growth Behavior in Stiffened and
Biaxial Tension Martin Marietta (Contract NAS9-12439)
Unstiffened Panels Loaded in Aerospace Denver Colorado February 1973
tAll panels prepared in this program were evaluated independently Only the results ofby Rockwell International Space Division
the Martin Marietta studies are shown in this report
III-I
of -Rib
40 Ab
4
m
I
P4
to C
20 P
0shy
14 12 34
Distance in
-10
Figure II--1 Anticipated Surface Stress Distributionfor Axially Loaded 2219-T87 IntegraZly Stiffened Panel
111-2
NDT EVALUATION
Specimen Preparation
Surface Finish Measurement amp Documentation
Dimesioal-RaiogrphyDimensional Ultrasonic Penetrant chemical Penetrant Removal Etch
Surface Finish Measurement amp Documentation
NDT EVALUATION
X-Radiography Ultrasonic Penetrant Penetrant Removal
a Shear Specimens Drill
DilPenetrant e Rivet
NDT EVALUATION
X-Radiography nUltrasonic
Penetrant Removal
4Fracture Specimens
eMeasure amp Document Actual Flaw Sizes
Data Tabulation
Figure I-2 NDT Evaluation Sequence for Integrally Stiffened Panels
H
Ishy
A SPECIMEN PREPARATION
Integrally stiffened panel blanks were machined from 381-centishymeter (-in) thick 2219-T87 aluminum alloy plate to a final stringer height of 254 centimeters (1 in) and an initial skin
thickness of 0780 centimeter (0310 in) The stringers were located asymmetrically to provide a 151-centimeter (597-in) band on the lower stringer and a 126-centimeter (497-in) bar d
on the upper stringer thereby orienting the panel for inspection reference (Fig 111-3) A nominal 63 rms (root-mean-square) surshy
face finish was maintained All stringers were 0635-centimeter
(0250-in) thick and were located perpendicular to the plate
rolling direction
Fatigue cracks were grown in the stiffenerrib area of panel
blanks at random locations along the ribs Starter flaws were introduced by electrodischarge machining (EDM) using shaped electrodes to control final flaw shape Cracks were then extended by fatigue and the surface crack length visdally monitored and conshy
trolled to the required final flaw size and configuration requireshy
ments as shown schematically in Figure 111-4 Nominal flaw sizes and growth parameters are as shown in Table III-1
Following growth of flaws 0076 centimeter (0030 in) was mashychined off the stringer side of the panel using a shell cutter to produce a final membrane thickness of 0710 centimeter (0280 in) a 0317-centimeter (0125-in) radius at the rib and a nominal 63
rms surface finish Use of a shell cutter randomized the surface finish pattern and is representative of techniques used in hardware production Grip ends were then cut off each panel and the panels were cleaned by vapor degreasing and submitted for inspection Forty-threa flawed panels and four unflawed panels were prepared and submitted for inspection Three additional panels were preshypared for use in establishing flaw growth parameters and were deshystroyed to verify growth parameters and techniques Distribution
of flaws in the panels is as shown in Table 111-2
111-4
0375R
600
390 A B C
- 40 9 - -___ 600 - - 597 - - 40 -I
____ ______ _______ ___ ___ ___ ___280
l 310
T (Stock)
I Preflaw Geometry
Flaw L6cation Areas 0250 0 125 D(Typ)
0gso0 Note All dimensions
in inches
63 rms finish Figure I1-3 Integrally Stiffened Panel Configuration
0125 0024 leep ~0030
easel -t 000
0280
Note All dimensions in inches
Case 2 -- 00--0-----
0280 -^ - $-is-- shy
0530 f-0012 Deep
0030 Case 3 -
-
~-$c~v-----P~A - -gt - r-----~~ 0280
Figure ITI-4 Schematic Side View of Starter FZw and Final Crack Configurations Integrally Stiffened Panels
111-6
Table 111-1 Parameters for Fatigue Crack Growth in Integrally Stiffened Panels
MeasuredEDh4 Starter Not Fatigue Final
Flaw Specimen Type of
CASE a2C at Depth Width Length Thickness Loading
1 05 02 0061 cm 0045 cm 0508 cm 0710 cm 3-Point (0280 in) Bending(0024 in) (0018 in-) (0200 in)
bull _(30
2 025 02 0051 cm 0445 cm 0760 cm 0710 cm 3-Point (0280 in) Bending(0020 in) (0175 in) (0300 in)
3 01 02 0031 cm 134 cm 152 cm 0710 cm 3-Point (0280 in) Bending(0012in) (0530in) (0600 in)
1_
Note a = final depth of flaw 2C = final length of flaw t = final panel thickness
Stress Cycles No of No of
Stress (avg) Panels Flaws
207x106 80000 22 102 Nm2
ksi)
207x10 6 25000 22 22 21m2
(30 ksi)
207x10 6 22000 10 22 Nm2
(30 ksi)
H H
Table T1-2
Crack
Designation
1
2
3
Stringer Panel Flaw Distribution
Number of Number of Flaw
Panels Flaws aDetha)
23 102 0152 cm (0060 in)
10 22 0152 cm (0060 in)
10 22 0152 cm (0060 in)
Flaw
Length (2c)
0289 cm (0125 in)
0630 cm (0250 in)
1520 cm (0600 in)
Blanks 4 0
TOTALS 47 146
B NDT OPTIMIZATION
Following preparation of integrally stiffened fatigue-flawed panels an NDT optimization and calibration program was initiated One panel containing cracks of each flaw type (case) was selected for experimental and system evaluations Criteria for establishshyment of specific NDT procedures were (1) penetrant ultrasonic and eddy current inspection from the stringer (rib) side only and (2) NDT evaluation using state-of-the-art practices for initial evaluation and for system calibrations prior to actual inspection Human factors w reminimized by the use of automated C-scan reshycording of ultrasonic and eddy current inspections and through reshydundant evaluation by three different and independent operators External sensitivity indicators were used to provide an additional measurement of sensitivity and control
1 X-radiography
Initial attempts to detect cracks in the stringer panels by Xshyradiography were totally unsuccessful A 1 penetrameter sensishytivity was obtained using a Norelco 150 beryllium window X-ray tube and the following exposure parameters with no success in crack detection
1) 50 kV
2) 20 MA
3) 5-minute exposure
4) 48-in film focal distance (Kodak type M industrial X-ray film)
Various masking techniques were tried using the above exposure parameters with no success
After completion of the initial ultrasonic inspection sequence two panels were selected that contained flaws of the greatest depth as indicated by the altrasonic evaluations Flaws were marginally resolved in one panel using Kodak single-emulsion type-R film and extended exposure times Flaws could not be reshysolved in the second panel using the same exposure techniques
III 9
----------------------------------------------------------------
Special X-radiographic analysis was provided through the courtesy of Mr Henry Ridder Magnaflux Corporation in evaluation of case
2 and case 3 panels using a recently developed microfocus X-ray
system This system decreases image unsharpness which is inshy
herent in conventional X-ray units Although this system thus has
a greater potential for crack detection no success was achieved
Two factors are responsible for the poor results with X-radioshy
graphy (1) fatigue flaws were very tight and were located at
the transition point of the stringer (rib) radius and (2) cracks
grew at a slight angle (from normal) under the stringer Such
angulation decreases the X-ray detection potential using normal
exposures The potential for detection at an angle was evaluated
by making exposures in 1-degree increments at angles from 0 to 15
degrees by applying optimum exposure parameters established by Two panelspenetrameter resolution No crack image was obtained
were evaluated using X-ray opaque penetrant fluids for enhancement
No crack image was obtained
As a result of the poor success in crack detection with these
panels the X-radiographic technique was eliminated from the inshy
tegrally stiffened panel evaluation program
2 Penetrant Evaluation
In our previous work with penetrant materials and optimization
for fatigue crack detection under contract NAS9-12276t we seshy
lected Uresco P-151 a group VII solvent removable fluorescent
penetrant system for evaluation Storage (separation and preshy
cipitation of constituents) difficulties with this material and
recommendations from Uresco resulted in selection of the Uresco
P-149 material for use in this program In previous tests the
P-149 material was rated similar in performance to the P-151
material and is more easily handled Three materials Uresco
P-133 P-149 and P-151 were evaluated with known cracks in
stringer and welded panels and all were determined to be capable
of resolving the required flaw types thus providing a backup
(P-133) material and an assessment of P-151 versus P-149 capashy
bilities A procedure was written for use of the P-149 material
Henry J Ridder High-Sensitivity Radiography with Variable
Microfocus X-ray Unit Paper presented at the WESTEC 1975 ASNT
Spring Conference Los Angeles California (Magnaflux Corporashy
tion MX-100 Microfocus X-ray System)
tWard D Rummel Paul H Todd Jr Sandor A Frecska and Richard
The Detection of Fatigue Cracks by NondestructiveA Rathke Testing Methods NASA CR-2369 February 1974 pp 28-35
fil- o
for all panels in this program This procedure is shown in Appendix A
Removal of penetrant materials between inspections was a major concern for both evaluation of reference panels and the subseshyquent test panels Ultrasonic cleaning using a solvent mixture of 70 lll-trichloroethane and 30 isopropyl alcohol was used initially but was found to attack welded panels and some areas of the stringer panels The procedure was modified to ultrasonic cleaning in 100 (technical grade) isopropyl alcohol The techshynique was verified by application of developer to known cracks with no evidence of bleedout and by continuous monitoring of inspection results The panel cleaning procedure was incorporated as an integral part of the penetrant procedure and is included in Appendix A
3 Ultrasonic Evaluation
Optimization of ultrasonic techniques using panels containing cases 1 2 and 3 cracks was accomplished by analysis and by exshyperimental assessment of the best overall signal-to-noise ratio Primary consideration was given to the control and reproducibilityoffered by shear wave surface wave Lamb wave and Delta techshyniques On the basis of panel configuration and previous experishyence Lamb wave and Delta techniques were eliminated for this work Initial comparison of signal amplitudes at 5 and 10 N z and preshyvious experience with the 2219-787 aluminum alloy resulted in selection of 10 M4z for further evaluation
Panels were hand-scanned in the shear mode at incident anglesvarying from 12 to 36 degrees in the immersion mode using the C-scan recording bridge manipulator Noise from the radius of the stringer made analysis of separation signals difficult A flat reference panel containing an 0180-inch long by 0090-inch deep fatigue crack was selected for use in further analyses of flat and focused transducers at various angles Two possible paths for primary energy reflection were evaluated with respect to energy reflection The first path is the direct reflection of energy from the crack at the initial material interface The second is the energy reflection off the back surface of the panel and subsequent reflection from the crack The reflected energy distribution for two 10-MHz transducers was plotted as shown in Figure Ill-5 Subshysequent C-scan recordings of a case 1 stringer panel resulted in selection of an 18-degree angle of incidence using a 10-MHz 0635shycentimeter diameter flat transducer Recording techniques test setup and test controls were optimized and an inspection evaluashytion procedure written Details of this procedure are shown in Appendix B
III-li
50
040
t 30
A 10 X
a
0 1
30
10 12 14
16 18 20 22 24 26 28 30 32 34
Angle of Incidence dog
(1) 10-Mz 14-in Diamter Flat Transducer
x
36 38
50 60
40 55
~~-40
f
2044 0
0
01
20 _
a loI
euroI
Ag o
x 40
45
(aI0
10 10
12 f
14 I
16 18 318-144I I
20 22 24 26 28
Angle of Incidence dog
(a) 1O-Mq~z 38-in
I 30
I 32 34
I 36
I 38
35
Figure III-5 ultrasonic Reflected Energy Response
iIT-12
4 Eddy Current Evaluation
For eddy current inspection we selected the NDT Instruments Vecshytor III instrument for its long-term electronic stability and selected 100 kHz as the test frequency based on the results of previous work and the required depth of penetration in the alushyminum panels The 100-kHz probe has a 0063-inch core diameter and is a single-coil helically wound probe Automatic C-scan recording was required and the necessary electronic interfaces were fabricated to utilize the Budd SR-150 ultrasonic scanning bridge and recorder system Two critical controls were necessary to assure uniform readout--alignment and liftoff controls A spring-loaded probe holder and scanning fixture were fabricated to enable alignment of the probe on the radius area of the stringer and to provide constant probe pressure as the probe is scanned over a panel Fluorolin tape was used on the sides and bottom of
the probe holder to minimize friction and probe wear Figure 111-6 illustrates the configuration of the probe holder and Figure III-7 illustrates a typical eddy current scanning setup
Various recording techniques were evaluated Conventional C-scan
in which the probe is scanned incrementally in both the x and y directions was not entirely satisfactory because of the rapid decrease in response as the probe was scanned away from the stringer A second raster scan recording technique was also evalshyuated and used for initial inspections In this technique the probe scans the panel in only one direction (x-axis) while the other direction (y-axis) is held constant The recorded output is indicative of changes in the x-axis direction while the y-axis driven at a constant stepping speed builds a repetitive pattern to emphasize anomalies in the x-direction In this technique the sensitivity of the eddy current instrument is held constant
A procedure written for inspection usingthe raster scan techshynique was initially verified on case 1 2 and 3 panels Details of this procedure are shown in Appendix C
An improvement in the recording technique was made by implementshying an analog scan technique This recording is identical to the raster scan technique with the following exceptions The sensishytivity of the eddy current instrument (amplifier gain) is stepped up in discrete increments each time a line scan in the x-direction is completed This technique provides a broad amplifier gain range and allows the operator to detect small and large flaws on
NDT Instruments Inc 705 Coastline Drive Seal Beach California
90740
it-13
Scanning Bridge Mounting Tube
I I SI i-Hinge
Plexiglass Block Contoured to Panel Radius
Eddy Current Probe 6 deg from Vertical
Cut Out to Clear Rivet Heads
Figure 111-6 Eddy Current Probe
111-14
Figure 111- Typical Eddy Current Scanning Setup for Stringer PaneIs
111-15
the same recording It also accommodates some system noise due to panel smoothness and probe backlash Examples of the raster scan and analog scan recordings are shown in Figure 111-8 The dual or shadow trace is due to backlash in the probe holder The inspection procedure was modified and implemented as shown in Appendix C
Raster Scan
10 37
Analog Scan
Figure 111-8 Typical Eddy Current Recordings
111-16
C TEST SPECIMEN EVALUATION
Test specimens were evaluated by optimized penetrant ultrasonic and eddy current inspection procedures in three separate inspecshytion sequences After familiarization with the specific proceshydures to be used the 47 specimens (94 stringers) were evaluated by three different operators for each inspection sequence Inshyspection records were analyzed and recorded by each operator withshyout a knowledge of the total number of cracks present the identityof previous operators or previous inspection results Panel idenshytification tags were changed between inspection sequence 1 and 2 to further randomize inspection results
Sequence 1 - Inspection of As-Machined Panels
The Sequence 1 inspection included penetrant ultrasonic and eddy current procedures by three different operators Each operator independently performed the entire inspection sequence ie made his own ultrasonic and eddy current recordings interpreted his own recordings and interpreted and reported his own results
Inspections were carried out using the optimized methods estabshylished and documented in Appendices A thru C Crack length and depth (ultrasonic only) were estimated to the nearest 016 centishymeter (116 in) and were reported in tabular form for data procshyessing
Cracks in the integrally stiffened (stringer) panels were very tightly closed and few cracks could be visually detected in the as-machined condition
Sequence 2 Inspection after Etching
On completion of the first inspection sequence all specimens were cleaned the radius (flaw) area of each stringer was given a lightmetallurgical etch using Flicks etchant solution and the specishymens were recleaned Less than 00013 centimeter (00005 in) of material was removed by this process Panel thickness and surshyfacd roughness were again measured and recorded Few cracks were visible in the etched condition The specimens were again inshyspected using the optimized methods Panels were evaluated by three independent operators Each operator independently pershyformed each entire inspection operation ie made his own ultrashysonic and eddy current recordings and reported his own results Some difficulty encountered with penetrant was attributed to clogging of the cracks by the various evaluation fluids A mild alkaline cleaning was used to improve penetrant results No measurable change in panel thickness or surface roughness resulted from this cleaning cycle
111-17
Sequence 3 Inspection of Riveted Stringers
Following completion of sequence 2 the stringer (rib) sections were cut out of all panels so a T-shaped section remained Panels were cut to form a 317-centimeter (125-in) web on either side of the stringer The web (cap) section was then drilled on 254-centimeter (1-in) centers and riveted to a 0317-centimeter (0125-in) thick subpanel with the up-set portion of the rivets projecting on the web side (Fig 111-9) The resultant panel simulated a skin-toshystringer joint that is common in built-up aerospace structures Panel layout prior to cutting and after riveting to subpanels is shown in Figure III-10
Riveted panels were again inspected by penetrant ultrasonic and eddy current techniques using the established procedures The eddy current scanning shoe was modified to pass over the rivet heads and an initial check was made to verify that the rivet heads were not influencing the inspection Penetrant inspection was performed independently by three different operators One set of ultrasonic and eddy current (analog scan) recordings was made and the results analyzed by three independent operators
Note All dimensions in inches
-]0250k
125 1 S0R100
--- 05 -- 0125 Typ
00150
Fl 9a 111-9 stringer-to-SubPcmel Attac mnt
111-18
m A
Figure 11--1 Integrally Stiffened Panel Layout and Riveted Pantel Configuration
111-19
D PANEL FRACTURE
Following the final inspection in the riveted panel configuration
the stringer sections were removed from the subpanels and the web
section broken off to reveal the actual flaws Flaw length
depth and location were measured visually using a traveling
microscope and the results recorded in the actual data file Four
of the flaws were not revealed in panel fracture For these the
actual surface length was recorded and attempts were made to grind
down and open up these flaws This operation was not successful
and all of the flaws were lost
E DATA ANALYSIS
1 Data Tabulation
Actual crack data and NDT observations were keypunched and input
to a computer for data tabulation data ordering and data analyshy
sis sequences Table 111-3 lists actual crack data for integrally
stiffened panels Note that the finish values are rms and that
all dimensions are in inches Note also that the final panel
thickness is greater in some cases after etching than before This
lack of agreement is the average of thickness measurements at three
locations and is not an actual thickness increase Likewise the
change in surface finish is not significant due to variation in
measurement at the radius location
Table 111-4 lists nondestructive test observations as ordered
according to the actual crack length An X 0 indicates that there
were no misses by any of the three NDT observers Conversely a
3 indicates that the crack was missed by all observers
2 Data Ordering
Actual crack data (Table 111-3) xTere used as a basis for all subshy
sequent calculations ordering and analysis Cracks were initshy
ially ordered by decreasing actual crack length crack depth and
crack area These data were then stored for use in statistical
analysis sequences
111-20
Table 111-3 Actual Crack Data Integrally Stiffened Panels
PANEL NO
CRACK NO
CRACK LENGTH
CRACK DEPTH
INITIAL FINISH THICKNESS
FINAL FINISH THICKNESS
CRACK FCSITICN X Y
I B I C 2 0 3 C 4 13 4 C 5 A 5 0 E A 6 C 6 0 7 A 7 8 7 C 8 A 8 A 8 a 8 C 8X9 BXD 9 A 9 8 S B 9 C 9 0 9 0
10 A 11 0 12 8 13 B 13 0 14 A 14 C 15 A 15 0 16 B 16 C 16 D 17 A 17 C 17 0 18 A 18 8 18 C 19 A 19 B 19 C 19 V 20 A 21 D 22 C 23 8 23 C 24 A 24 0 25 A 25 C 26 A 26 8 26 0 27 A 27 8 27 0 28 B 28 C 26 U 29 A 29 8 29 C 29 0 31 -
1 2 3 4 5 6 7 8 9
10 11 12 13 14 15 16 17 18 19 20 21 22 23 24 25 26 27 28 29 30 31 32 33 34 35 36 37 38 39 40 41 42 43 44 4E 47 48 49 50 51 52 53 54 55 56 57 58 59 60 E1 62 63 64 65 66 67 68 69 70 71 72
1157 213 0182 0531 0175 0170 0OE5 0170 0174 0100 0172 n179 3180 0142 C142 0050 0183 C194 0200 0166 0187 0149 0202 0105 0163 G100 0262 0273 0269 0271 0273 0275 0286 0272 0275 0276 0208 0302 0c2E5 0275 0266 0278 02g1 0321 0277 02E9 02E8 0288 0561 05E9 0593 0551 0549 0576 0576 0566 0563 0528 0560 057g 0572 0573 0550 0578 0542 0612 0569 0476 0684 0451 0255
0030 0037 3051 0095 0028 0032 0032 0032 0033 0033 0036 0039 0030 0036 0027 0027 0039 0046 0046 0046 U040 0034 0043 0042 0037 0037 0048 0055 0051 0052 0053 0051 0062 051 0053 0050 0038 0080 0043 0049 0049 0046 0052 0060 0053 0047 0054 0056 0064 0065 0070 -0043 0042 0061 0059 0047 0050 0045 0055 0076 0056 0059 0048 0054 0052 0073 0063 0034 0056 0062 0047
52 52 38 57 47 47 77 77 65 65 65 58 58 58 72 72 72 72 72 72 73 73 73 73 73 7 37 17 32 28 28 31 31 39 39 53 53 53 38 38 38 38 38 38 35 35 35 35 30 33 20 31 31 32 32 44 32 34 34 34 29 29 29 33 33 33 52 52 52 52 18
0278C 0278 02800 02790 02790 02790 0279C 02790 0278C 02780 02780 0277C 02770 0277C 02780 012780 02780 02780 0278C 02780 02790 02791 02790 02790 02790 0 2790 0280C 0280e 02800 02790 02790 0280 0280E 0279C 02790 02800 02800 0280 02760 0276C 02760 02800 0280 02800 02810 02810 02810 02810 02800 02780 02800 0279C 02790 02800 02800 02802 0 3040 02790 02790 02790 02760 0276C 02760 02782 02780 0278 02790 02796 02790 02790 02780
32 22 18 30 32 30 32 42 38 40 46 22 30 40 26 26 30 24 30 30 28 22 22 26 26 26 20 22 24 20 20 24 20 26 22 22 23 18 36 20 24 30 18 25 12 25 26 16 22 52 2C 22 22 16 32 44 32 25 14 22 22 20 25 i 24 18 30 41 38 30 18
0281C 02810 02840 0282E 02810 02806 0280C 0279C 0281C 02830 02830 02790 0275C 02790 02800 0280C 0280C 02800 02800 012800 02790 02790 02790 02790 02790 02790 02830 02810 0279C 02830 0281C 02820 0281C 0281E 0281C 0282C 02820 02820 02680 02820 0281C 02820 02830 02840 02820 02820
0202 bull02820 02830 02790 02800 0200 02820 0285E 02790 0280C 03040 02796 02780 0279E 0278C 02770 02776 02780 02780 0279C 02770 02780 0278E 0280C 02780
407 172 304 296 300 Z01 1S7 208 173 170 445 423 168 173 167 457 262 357 139 450 247 374 460 166 263 400 146 244 304 192 380 419 398 389 136 240 155 446 172 387 137 443 137 447 158 433 456 145 400 296 347 390 392 160 400 254 357 157 436 150 427 167 458 250 443 172 416 161 159 437 197
-0 -0 -0 -0 -0 -0 -0 -0 -0 -0 -0 -0 -0 -0 -0 -0 -0 -0 -0 -0 -0 G -0 -0 -0 -0 -0 -0 -0 -0 -0 -0 -0 -0 -0 -0 -0 -0 -0 -0 -0 -0 -0 -0 -0 -0 -0 -0 -0 -0 -0 -0 -0 -0 -0 -0 -0 -0 -0 -0 -0 -0 -0 -0 -0 -0 -0 -0 -0 -0 -0
111-21
Table -11-3 (concl)
31 0 73 0571 0034 22 02776 22 0277C 221 -0 35 C 74 0274 0068 35 02796 35 0279C 378 -0 36 A 75 0126 0025 45 02786 42 02780 178 -0 36 A 76 0179 0038 45 02780 42 0278C 451 -0 36 C 77 0186 0038 45 02780 33 02780 277 -0 36 D 78 0193 0047 45 02786 40 02786 420 -0 37 A 79 0140 0029 50 02790 50 02786 246 -0 37XA 80 0215 0029 50 02796 50 02780E 469 -0 37 8 81 0113 0024 50 0279C 40 02790 151 -0 37 B 82 0182 0045 50 02796 46 027Sf 354 -Go 37 C 83 0109 0026 50 02790 41 02790 124 -0 37 C 84 6063 00plusmn6 50 02790 41 0279C 205 -6 37 0 85 0164 0045 50 02790 18 02796 362 -0 37 D 86 0190 0024 50 02790 18 02790 464 -0 38 A 87 0089 0018 42 02790 24 0279C 165 -0 38 A 88 0175 0039 42 02796 24 02790 458 -F 38 8 89 0078 0016 42 02796 16 02786 280 -0 38 C s0 0140 0031 42 02796 21 0279C 207 -0 38 C Si 0164 0036 42 02790 21 02796 475 -0 38 D 92 0169 0033 42 0279 29 0278C 119 -0 38 D 93 0125 0024 42 02796 29 02781 380 -0 39 A 94 0274 0056 17 02786C 17 02786 172 -0 39 C 95 0181 0042 19 0279C 19 02796 126 -0 32 0 97 0181 0049 24 02790 24 02790 217 -0 39 0 98 0142 0030 24 02796 24 0279 462 -0 40 A 99 0112 0026 50 02780 50 02796 403 -0 40 8 100 0172 0040 50 02786 32 02776 154 -0 40 8 1c1 0134 0033 50 02780 32 02776 256 -0 40 C 102 0114 0024 50 02780 36 02786 127 -0 40 D 103 0061 0009 50 02780 34 02770 371 -0 40 D 104 01E0 0037 50 0278C 34 02770 446 -0 41 A 105 0183 0038 44 02790 2e 0279 205 -0 41 A 106 0120 0022 44 02790 28 02796 462 -C 41 8 107 0127 0028 44 02790 25 02790 134 -0 41 8 108 0O07 0021 44 02796 25 02796 404 -0 41 C 102 0136 0033 44 02790 22 02790 156 -0- 41 C 110 0260 0048 44 02790 22 02796 484 t 42 8 111 0182 0044 33 02786 30 02786 246 42 C 112 0126 0028 33 02780 32 0278C 218 -0 42 C 113 0158 0041 33 02780 32 02786 474 -0 42 0 114 0191 0047 33 02780 35 02780 135 -0 42 D 115 0098 0032 33 02780 35 02786 403 -0 43 A 116 0415 0100 30 02800 36 02786 265 -0 43 A 117 0184 0041 30 02800 36 0278C 460 -0 43 B 118 0177 0041 30 02800 24 02776 154 -0 43 8 119 0163 0036 30 02800 24 02770 411 -0 43 C 120 0095 00plusmn9 30 0280C 30 02796 353 -0 43 0 121 0076 0018 30 02806 22 02786 188 -0 43 D 122 0260 0-023 30 shy 02800 22 02780 440 -0 44 A 123 0166 0019 33 0279C 21 02790 372 -0 44 A 124 0178 0036 33 02790 21 0279C 469 -0 44 8 125 0138 0024 33 027A0 23 02770 213 -0 44 S 126 0132 0031 33 02790 23 02776 423 -0 44 C 127 0160 0037 33 02790 24 02780 107 -0 44 C 128 0113 0026 33 02790 24 0278C 4a6 -0 44 D 129 0179 0040 33 02790 21 0278C 146 -0 44 0 130 0147 0033 33 02790 21 02780 352 -0 45 A 131 0164 0034 28 02770 25 02796 162 -0 45 8 132 0162 0036 28 02776 29 02766 427 -0 45 C 133 0161 0033 28 02770 23 0278C 442 -0 46 A 135 0083 0017 31 02780 24 02770 346 -0 46 A plusmn36 0176 0036 31 02780 24 02771 455 -0 46 C 137 8158 0035 31 d2780 25 0278E 144 -0 46 C 138 0085 0017 31 02780 25 02780 233 -0 46 0 139 0184 0045 31 02780 23 02770 454 -0 47 A 140 0136 0026 33 02780 28 02786 243 -0 47 A 141 0087 0017 33 02780 28 02786 472 -0 47 8 142 0167 0031 33 02780 27 02780 118 -0 47 B 143 0059 0011 33 02780 27 02786 343 -0 47 C 144 0126 0030 33 02780 20 02780 358 -0 47 D 145 0119 0035 33 02780 26 02780 254 -0 47 0 146 0187 0044 33 02780 26 02786 475 -0
111-22
Table 11-4 NDT Observations Integrally Stiffened Panels
PENETRANT ULTRASONIC EDDY CURRENT
INSPECTION SEQUENCE 1 2 3 1 2 3 1 2 3
CRACK NUMBER
ACTUAL vALUE
70 684 0 0 0 0 0 0 0 1 0 67 612 0 1 0 0 0 0 3 0 1 52 593 3 0 0 3 0 0 3 1 1 61 579 0 0 0 0 0 0 1 0 0 65 578 0 0 0 0 0 0 1 0 3 55 576 0 0 0 0 0 3 1 0 0 56 9576 0 0 0 0 0 0 0 0 1 63 573 1 0 0 0 0 0 2 1 3 62 572 0 0 0 0 0 0 2 0 0 73 571 0 1 0 0 0 3 2 0 3 51 569 1 0 0 2 0 0 0 0 2 68 569 0 0 0 0 0 0 0 0 0 57 566 1 0 0 1 0 0 0 0 2 58 563 0 0 0 1 0 0 0 0 0 50 561 0 0 0 0 0 0 0 0 0 60 560 0 1 0 0 o d 0 0 6 53 551 0 0 0 0 0 0 3 2 3 54 549 0 0 0 0 0 0 1 11 1 66 542 0 0 0 1 0 0 0 0 0 4 531 0 1 0 0 0 0 0 0 0
59 528 0 1 0 0 0 3 0 1 0 69 476 0 0 0 0 0 0 2 0 0 71 451 0 0 -0 0 0 3 0 0 1 44 321 0 0 0 0 0 0 2 1 1 38 a302 0 0 0 0 0 0 0 1 0 43 291 0 1 0 0 0 0 1 0 1 49 288 1 0 0 0 0 0 1 0 1 33 286 3 1 0 3 0 2 3 0 0 46 277 0 0 0 0 1 0 2 3 3 36 276 0 1 0 1 0 0 2 2 1 42 276 0 0 0 1 0 0 1 1 0 32 275 0 1 2 0 0 0 1 1 1 35 275 0 0 0 0 1 0 2 1 1 40 275 0 1 0 0 0 0 1 0 2 74 274 0 0 0 0 0 0 2 2 1 94 274 0 0 1 1 0 3 0 0 0 31 273 0 1 0 0 0 0 1 1 2 28 9273 0 2 3 0 0 0 0 0 0 34 272 0 0 0 0 0 0 2 1 1 30 271 0 0 3 0 1 0 2 0 3 47 269 1 0 0 0 0 0 1 0 1 29 269 0 1 2 0 0 0 2 0 2 48 268 0 1 2 1 0 0 1 1 2 41 266 0 0 0 0 0 0 1 1 1
111-23
Table 11Y-4 (cont)
CK ACT NO VAL 1 2 3 1 2- 3 1 2 3 27 262 0 0 0 -0 0 0 2 2 1 80 215 3 0 0 0 0 3 0 0 0 37 208 0 0 0 0 1 0 3 3 3 23 202 0 0 1 1 0 0 0 0 2 19 200 0 0 0 0 0 0 1 1 3
110 200 1 0 0 0 0 0 1 0 0 122 200 1 0 1 0 0 0bull 0 0 2 24 195 1 0 1 0 0 0 1 0 0 18 194 0 0 1 0 0 0 0 0 0 2 193 1 1 3 0 0 0 0 0 0
78 193 0 0 0 0 0 0 0 0 0
114 -shy 91 0 0 0 0 0 0 1 0 1 86 190 3 3 3 0 0 3 1 1 2 21 187 0 0 3 0 2 0 0 0 0 146 187 0 0 0 0 0 3 2 0 1 77 186 0 0 0 0 0 0 0 0 0 139 184 2 0 0 0 0 0 1 0 2 117 o184 0 0 0 0 0 0 0 0 0 17 183 0 0 0 0 0 0 1 1 0
105 183 0 0 0 0 2 3 2 1 0 111 182 3 1 2 0 0 0 0 1 3 3 182 0 0 0 0 0 0 0 0 0
82 182 3 0 0 0 0 0 1 0 3 95 181 0 0 1 1 0 0 0 0 2 97 181 2 2 1 1 0 3 1 1 3 13 180 0 6 0 1 2 2 1 2 2
129 179 0 0 1 1 0 0 1 0 3 12 179 0 0 0 0 0 1 1 0 1 76 179 0 0 0 0 0 0 2 1 2
124 178 0 0 0 0 0 3 1 0 0 118 177 0 0 0 0 0 0 0 1 2 136 176 2 1 -0 0 3 3 1 0 2 88 175 3 3 3 1 0 0 2 2 2 5 175 0 1 0 0 1 3 2- 1 2 9 174 0 0 1 1 0 0 1 0 1
11 172 1 1 3 0 2 3 0 0 1 100 0172 0 0 0 0 0 0 - 1 0 1 8 1170 0 1 0 0 1 0 0 0 1 6 170 0 1 0 0 1 0 0 0 0
92 169 3 1 1 0 1 0 3 3 3 142 167 0 1 0 1 0 0 1 0 0 20 166 0 1 0 0 1 0 1 0 2 91 164 3 2 3 0 0 0 2 2 3
131 164 2 0 1 0 1 0 0 0 0 85 164 3 3 3 0 2 3 1 1 3 25 s163 0 2 3 0 2 0 -1 0 0
111-24
Table 11-4 (coneZ)
CK ACT NO VAL 1 2 -3 1 2 3 1 2 3
119 163 0 1 1 U 0 3 0 plusmn 0 1 0 0 0 0 1 3132 162 0 1
0 2133 161 0 1 1 0 0 1 1 127 160 1 1 1 0 0 3 0 0 0 104 160 0 0 0 0 1 3 0 0 2
10 160 0 0 1 0 0 0 0 0 0 2 0 2137 158 3 2 0 0 2 3
113 158 0 1 0 0 0 0 1 0 0 0 0 11 157 1 O 3 0 0 0
0 022 149 1 2 2 - 0 0 0 2 0 0 1 0 3130 147 0- 0 1 1 3 398 142 2 3 3 1 3 1 1
1 2 1 0 0 014 142 0 0 0 0 315 142 0 0 2 0 2 2 3
90 140 1 2 3 lt1 0 3 3 2 3 1 379 140 1 1 0 0 3 3 2
145 139 2 0 0 0 1 3 2 2 2 1 1 3125 138 0 0 0 0 0 3
140 136 0 0 0 0 0 0 1 1 2
109 136 0 0 0 0 0 0 0 0 3 101 134 1 1 0 0 0 3 0 0 2
126 132 0 0 0 0 1 0 1 0 3 107 127 0 0 0 0 3 3 2 3 3 144 126 0 2 0 0 0 Q 2 0 2 75 126 3 0 1 3 0 3 1 2 3
112 126 2 0 0 0 0 0 0 0 0
93 125 1 -0 1 0 0 0 2 3 3 106 120 0 0 0 3 3 3 3 3 3 1D2 114 1 0 0 0 0 0 0 1 3 128 113 0 0 1 0 0 3 1 0 3 81 113 1 0 0 0 1 3 2 3 3 99 112 0 0 0 3 0 3 3 1 2 83 0109 2 0 0 0 1 3 0 2 3
123 o106 0 1 0 2 3 3 3 3 3 26 100 0 0 1 1 0 3 0 1 0 115 098 3 1 1 0 0 3 2 0 1 108 097 0 0 0 3 3 3 2 3 3 120 095 1 0 2 3 3 1 3 3 3 87 a089 0 2 0 2 3 3 3 3 2
141 087 1 2 1 3 3- 3 3 3 1 138 0085 3 0 1 0 3 3 3 3 3
7 085 0 1 0 1 3 3 0 1 0
135 083 3 2 2 3 3 3 3 3 3 89 078 3 0 2 3 3 3 3 3 3
121 076 0 0 1 3 3 3 3 3 2 84 063 3 0 1 3 2 3 2 3 3
103 o061 0 2 1 3 3 3 3 3 3 143 059 3 1 1 3 3 3 3 3 2 16 050 0 3 3 0 0 0 2 1 1
111-25
3 Statistical Analysis
There are four possible results when an inspection is performed
1) detection of a defect that is present (true positive)
2) failure to detect a defect that is not present (true negative)
3) detection of a defect that is not present (false positive)
4) failure to detect a defect that is present (false negative)
i STATE OF NATURE]
Positive Negative
Positive Positive sitive OF Pos_[TEST (Tx) NATURE[ _____ve
TrueNegaivepN~atie Negative Fale- Negative
Although reporting of false indications (false positive) has a
significant impact on the cost and hence the practicality of an inspection method it was beyond the scope of this investigation Factors conducive to false reporting ie low signal to noise ratio were minimized by the initial work to optimize inspection techniques An inspection may be referred to as a binomial event
if we assume that it can produce only two possible results ie success in detection (true positive) or failure to detect (false negative)
Analysis of data was oriented to demonstrating the sensitivity and
reliability of state-of-the-art NDT methods for the detection of small tightly closed flaws Analysis was separated to evaluate the influences of etching and interference caused by rivets in the
inspection area Flaw size parameters of primary importance in the use of NDT data for fracture control are crack length (2C) and crack depth (a) Analysis was directed to determining the flaw size that would be detected by NDT inspection with a high probability and confidence
For a discussion on false reporting see Jamieson John A et al
Infrared Physics and Engineering McGraw-Hill Book Company Inc page 330
111-2 6
To establish detection probabilities from the data available
traditional reliability methods were applied Reliability is concerned with the probability that a failure will not occur when an inspection method is applied One of the ways to measure reliability is to measure the ratio of the number of successes to the number of trail (or number of chances for failure) This ratio times 100 gives us an estimate of the reliability of an inspection process and is termed a point estimate A point estimate is independent of sample size and may or may not constitute a statistically significant measurement If we assume a totally successful inspection process (no failures) we may use standard reliability tables to select a sample size A reliability of 95 at 95 confidence level was selected for processing all combined data and analyses were based on these conditions For a 95 reliability at 95 confidence level 60 successful inspection trials with no failure are required to establish a valid sampling and hence a statistically significant data point For large crack sizes where detection reliability would be expected to be high this criteria would be expected to be reasonable For smaller crack sizes where detection reliability would be expected to be low the required sample size to meet the 95 reliability95 confidence level criteria would be very large
To establish a reasonable sample size and to maintain some conshytinuity of data we held the sample size constant at 60 NDT obsershy
vations (trials) We then applied confidence limits to the data generated to provide a basis for comparison and analysis of detection successes and to provide an estimate of the true proportion of
cracks of a particular size that can be detected Confidence limits are statistical determinations based on sampling theory and are values (boundaries) within which we expect the true reliabishylity value to lie For a given sample size the higher our confidence level the wider our confidence simply means that the more we know about anything the better our chances are of being right It is a mathematical probability relating the true value of a parameter to an estimate of that parameter and is based on historyrepeating itself
Plotting Methods
In plotting data graphically we have attempted to summarize the results of our studies in a few rigorous analyses Plots were generated by referring to the tables of ordered values by actual
flaw dimension ie crack length
Starting at the longest crack length we counted down 60 inspection observations and calculated a detection reliability (successes divided by trails) A dingle data point was plotted at the largest crack (length in this group) This plotting technique biases
1I1-27
-----------------------------------------------------------------
data in the conservative direction We then backed up 30 obsershy
vations counted down 60 observations and plotted the data point
at the longest crack in this group The process was repeated for
the remaining observations in each inspection operation By use
of the overlapping sampling technique the total amount of data
required could be reduced The overlapping method is applicable
since all observations are independent and hence may be included
in any data sampling group An added advantage is the smoothing
of the curve resulting from such a plotting technique
5 Calculation of Confidence Limits
The analysis and data plotting methods used to assess the variation
in flaw detection reliability with flaw dimension becomes increasshy
ingly lampss rigorous as detection failures increase To maintain
continuity of data analysis and penetration using the same analysis
and plotting methods we have calculated and plotted confidence
limits for each plot point using the available data sample in that
sample group Confidence limits are values within which we expect
the true reliability value to be if an infinitely large sample is
taken For a given sample size the higher our confidence level
the wider our confidence-limits Confidence limits are statistical
determinations based on sampling theory
areThe statistics that are used to determine confidence limits
dependent up the distribution of whatever characteristic we are
measuring Data based on successfailure criteria can be best
described statistically by applying the binomial distribution
The normal Chi-square and Poisson distributions are sometimes
used as approximations to the binomial and are selected on the
basis of available sample size If the sample size is held
constant confidence limits may be applied to these data to establish
the true reliability values A binomial distribution analysis
was applied to the data to find the lower or one-sided confidence
limit based on the proportion of successes in each sample group
Lower confidence limits were calculated by standard statistical
methods and is compatible with the method described by Yee et al+
The lower confidence level Pe is obtained by solving the equation
Alexander McFarlane Mood Introduction to the Theory of Stashy
tistics McGraw-Hill Book Company Inc 1950 pp 233-237
BGW Yee J C Couchman F H Chang and D F Packman
Assessment of NDE ReliabZity Data CR-134834 General Dynamics Corporation Fort Worth Division September 1975
111-28
-------------- -----------------------------------------------------
n-I N-i
i=o P
where G is the confidence level desired N is the number of tests performed n is the number of successes in N tests
and PI is the lower confidence level
Lower confidencelimits were determined at a confidence level of 95 (G=95) using 60 trials (N=60) for all calculations The lower confidence limits are plotted as (-) points on all graphical presentations of data reported herein
F DATA RESULTS
The results of inspection and data analysis are shown graphically in Figures 111-11 111-12 and 111-13 The results clearly indicate an influence of inspection geometry on crack detection reliability when compared to results obtained on flat aluminum panels Although some of the change in reliability may be attributed to a change flaw tightness andor slight changes in the angle of flaw growth most of the change is attributed to geometric interference at the stringer radius Effects of flaw variability were minimized by verifying the location of each flaw at the tangency point of the stringer radius before accepting the flawinspection data Four flaws were eliminated by such analysis
Changes in detection reliability due to the presence of rivets as revealed in the Sequence 3 evaluation further illustrates that obstacles in the inspection area will influence detection results
Op cit Ward D Rummel Paul H Todd Jr Sandor A Frecska
and Richard A Rathke
111-29
100 0 0
100 I0 0
100 C
0
900
00
70
so
0 0
0
0 0 90
008
70
60
0
OO
0
00
- o0
0
0
90
00
60
0
0 0
0- 0-
0 0
0 0
-
0
50 - 0 60
o to
0 404
2 0
0 0 30 O 90 2
0 0 30
I 00
I 90 20
0 0 30
I 60
I 90 120
LENGTH SFECItEN
tIN) INTE STRINMR
LENGTH SpCIN
(IN) INTEO SIRJNGR
LENGTH SPFCIMIN
(IN I 0NTEG STRINGER
100
00 0
00
90
100
0 0
0
100
90 0
00
00
00
0
-
0 O0
70
0
0- 0
0
-
0
70
0000 0
0
0 -
-
0
6 60 - 60
040
301 30 301 O
200 0 20
00 20 10
0
0 020
I0
040
I
060
II
00
I Ir
100 120 0 020
I
040
I
060
t I
080
I I
100 20
0I
0
I
020
I 1
040
I
060
I
000
I
100
I
120
DEPTH IN SPECIHEN [NTE0 STRINGER PENETRANTTEST SO NO 1
ICOWIDE LEVEL - 950Rigure IlIl-1i Crack Detection Probability for Integrally Stiffened Panels bythe Penetrant Method Plotted at 95 Probability and 95 Confidence Level
DCpH (IN ) SECIEN INTEO STRINGER PENETRANTTEST SE0 W 2 CCWIMN C LEVEL shy 95 0
DEPTH (IN)SPCININ INTEG STRINGER
NETRANT TEST EO NO 3 CaEI20CE LEVEL shy 9 0
M00
90
o100
0 0 to 0
0
-- 0
0 0a
0 0
0
o100 0 0
90
00
0 0
70 00 0 0
so0 00 60 o 60
50 - 0 0
40
30
40
30
40
30
-
0
20 20 -shy0h
10 10 10 0
0
0
I OD
30
LENGTH
WCf]J
0 O 0
0
0
0-c
60
(INI
INTEG STRINGER
0
0
I
90
090
t20
00
0
0
100
I
30
I I
0
LENGH IIN)
5PECIHEN INTC
00 0 0
I
STRINGER
I
90
I I
120
00
0
100
00
30
j
60
LENGTH (IN)
S HCN INTEG STRINGER
0
s0 120
0
60
S
70
20
0
ffOo
0
0
680
50
40
0 --
0 IS
0
-s
0
00
0
60
500
40
6o
00
0
0 -40 0- 401 I 40
00
0
13
33 -10
30l to
30
10 01 120
0 IIo o I I I I II I
0 023 040 00 000 100 120 0 00 040 060 080 100 120 0 020 040 060 080 100 120
DEPTH (IN I SPECIhEN INTEG STRINGER ULTRASCIC TEST 000 NO I
HCEaICENCELEVEL - SO 0Figure 111I-12
Crack Detection Probability for Integrally Stiffened Panels by the Ultrasonic Method Plotted at 95 Probability and 95 Confidence Level
DEPTH (IN) SPEEI)KN INTEG STR]NGER ULIRASCNIC TEST MO NO 2 CETOENCE LEVEL M0
SPTH (IN) CIIEN INTEG STRIN ER tTRAS IC TEST SEQ NO CIFIDECE LEVEL = 050
3
100 100 -100
90 0 0 0 90
00
0
080
0 0- 00
0-
0
- 0 000
70 0
00
-0 0 0
0
00
o
45 so
O- 0 50 60_
0 -0
40O 0 0
30 0 0
30 30 0
20 20 0 20 0
10 00 10shy
0 I I I 0 I I I 0 I I I I
0 30 93 90 20 0 30 60 0 20 0 30 60 90 120
LENGTH (IN 5PECIMEN INTEG STRIKoER
LENGTH SFECIMEN
(IN ) INTEG STRINKERfNTEl
LENGTH SOpoundC[MEN
(IN I STRIKER
100 100 100
900
00 0 0
90
o
s0
80
o_50
0 0
50
00
05070
go -0
7
0 0
0 00
0 -7
00
00
00 000 000
0
00
00
0R
I0
=
20
0
a 0 01o 04
Sooo 06 OeO
STIE shy0 12o 50
ooE 00 00 00
SPooEN 0 ao 0 1002
STIERoEC 1[00
00
04 00 8
oNE NE TIE 10 2
Figure 111-13 EMOy CURRNT TEST 6EO NO Ic40ECE LEVEL - 95 0 CONIDENCE EDDY CLIRRtNT TEST LEViEL SEE NO295 0 M LRNTESO-D ENC LEVEL - 950 W3
Crack Detection Probability for Integrally Stiffened Panels c csLVLbull9
by the Eddy CurrentMethod Plotted at 95 Probabilityand 95 Confidence Level
IV EVALUATION OF LACK OF PENETRATION (LOP) PANELS
Welding is a common method of joining major elements in the fabshyrication of structures Tightly closed flaws may be included in a joint during the welding process A lack of penetration (LOP) flaw is one of several types of tightly closed flaws that can form in a weld joint and is representative of the types that commonly occur
Lack of penetration flaws (defects) may be the product of slight variations in welding parameters or of slight variations in welding parameters or of slight variations in weld joint geometry andor fit up Lack of penetration defects are illustrated schematically
Lack of Penetration
(a) Straight Butt Joint Weldment with One Pass from Each Side
Lack -of Penetration
(b) Straight Butt Joint Weldment with Two Passes from One Side
Figure II-I Typical Weldient Lack of Penetration Defects
IV-1
----------------------------------------------------------------
Figure IV-l(a) is the result of a failure to penetrate the weld
joint fully by single passes from each side of the joint This
type of defect is also termed lack of fusion and may be referred
to as such in the literature Figure IV-l(b) is the result of
a failure to penetrate the weld joint fully by two passes from
the same side of a joint
one of the mostA lack of penetration defect has been shown to be
difficult flaws to detect by conventional nondestructive inspection
Because of the high residual compressive stressestechniques present in weldments containing this defect and the tendency
of
the defect to form a diffusion bond under its combined heat and
stress exposure it is possible to miss it using X-radiographic and
Even if the defect is open to theultrasonic inspection methods
surface- it is possible for the joint to be so tightly closed that
Various investigators have conductshypenetrants will not reveal it
ed studies to enhance LOP defect detection A difficult
experiment variable in such programs is the tightness of the defect
Lack of penetration in straight butt joint weldments with one pass
from each-side was-selecteamp for-avaluation This configuration
provided the greatest option in varying defect location through
the thickness of the weld ie open near the surface and buried
and provided the greatest chance for obtaining tightly closed flaws
After the flaw type was established a program plan for test panel
preparation evaluation and analysis was established as shown
schematically in Figure IV-2
B G Martin and C J Adams Detection of Lack of Fusion in
Aluminum Alloy Weidments by Ultrasonic Shear Waves Technical
Douglas Aircraft Company 1965Paper No 3499
Detection of Lack of Fusion Using Opaque AdditivesJ L Cook Contract NAS8-287D8 McDonnell DouglasPhase I Progress Report
Astronautics Company November 1972
Definition of Mutually Optimum NDI and Proof Test Criteria for
2219 Aluminum Pressure Vessels Work in progress Contract NAS3shy
17790 Martin Marietta Aerospace Denver Colorado
IV-2
Dimensional
Finish Preparation Measurement amp
aSurfce Documentationd
NDT EVALUATION
X-radiography Ultrasonic Eddy Current Penetrant Chemical
Penetrant Removal Etch
NDT EVALUATION
X-radiography Proof Test Ultransonic
to 90 of Eddy Current Weld Yield Penetrant Strength - Penetrant Removal
Fracture Specimens
bullMeasure amp Datamp SDocument Flaw Sizes La Tabulation
NDT EVALUATION X-radiography
Ultrasonic
Eddy Current PenetrantPenetrant Removal
fDimensional Surface Finish Measurement amp Documentation
Machine Weld Bead
Flush with Weld Land
efiiensionalSurface Finish Inspection amp Documentation
NDT EVALUATION
X-radiography Ultrasonic -Eddy Current Penetrant Penetrant Removal
Figure IV-2 NDT Evaluation Sequence for Lack of Penetration -Panels
A SPECIMEN PREPARATION
The direct current gas tungsten arc (GTA) weld technique was
selected as the most appropriate method for producing LOP flaws in
commonly used in aerospace condtruction2219-T87 panels and is The tungsten arc allows independent variation of current voltage
This allows for a specificelectrode tip shape and weld travel
reproduction of weld conditions from time to time aswell as
several degrees of freedom for producing nominally proportioned
welds and specific weld deviations The dc GTA can be relied on to
produce a bead of uniform depth and width and always produce a
single specific response to a programmed change in the course of
welding
to measure or observe the presence ofIn experiments that are run
lack of penetration flaws the most trying task is to produce the
LOP predictably Further a control is desired that can alter
the length and width and sometimes the shape of the defect
Commonly an LOP is produced deliberately by a momentary reduction
of current or some other vital weld parameter Such a reduction of
heat naturally reduces the penetration of the melt But even
when the degree of cutback and the duration of cutback are precisely
executed the results are variable
Instead of varying the weld process controls to produce the desired
to locally vary the weld joint thicknessLOP defects we chose At a desired defect location we locally increased the thickness
of the weld joint in accordance with the desired height and
length of the defect
A constant penetration (say 80) in a plate can be decreased to
30 of the original parent metal plate thickness when the arc hits
It will then return to the originalthis thickness increase runs off the reinforcement padpenetration after a lag when it
The height of the pad was programmed to vary the LOP size in a
constant weld run
completed to determine the appropriateAn experimental program was
pad configuration and welding parameters necessary to produce the
Test panels were welded in 4-foot lengths usingrequired defects the direct-current gas tungsten arc welding technique and 2319
aluminum alloy filler wire Buried flaws were produced by balanced
607 penetration passes from both sides of a panel Near-surface
and open flaws were producedby unbalanced (ie 8030) pene-
Defect length andtration-passes from both sides of a panel
controlled by controlling the reinforcement pad conshydepth were figuration Flaws produced by this method are lune shaped as
iv-4
illustrated by the in-plane cross-sectional microphotograph in Figure IV-3
The 4-foot long panels were x-radiographed to assure general weld process control and weld acceptability Panels were then sawed to produce test specimens 151 centimeters (6 in) wide and approximately 227 (9 in) long with the weld running across the 151 centimeter dimension At this point one test specimen from each weld panel produced was fractured to verify defect type and size The reinforcementpads were mechanically ground off to match the contour of the continuous weld bead Seventy 18-inch (032) and seventy 12-inch (127-cm) thick specimens were produced containing an average of two flaws per specimen and having both open and buried defects in 0250 0500 and 1000-inch (064 127 254-cm) lengths Ninety-three of these specimens were selected for NDT evaluation
B NDT OPTIMIZATION
Following preparation of LOP test specimens an NDT optimization and calibration program was initiated Panels containing 0250shyinch long open and buried flaws in 18-inch and 12-inch material thicknesses were selected for evaluation
1 X-Radiography
X-radiographic techniques used for typical production weld inspectshyion were selected for LOP panel evaluation Details of the procedshyure for evaluation of LOP panels are included in Appendix D This procedure was applied to all weld panel evaluations Extra attention was given to panel alignment to provide optimum exposure geometry for detection of the LOP defects
2 Penetrant Evaluation
The penetrant inspection procedure used for evaluation of LOP specimens was the same as that used for evaluation of integrally stiffened panels This procedure is shown in Appendix A
IV-5
Figure IV-3 Schematic View of a Buried LOP in a Weld withRepresentative PhotomicrographCrossectional Views of Defect
3 Ultrasonic Evaluation
Panels used for optimization of X-radiographic evaluation were also used for optimization of ultrasonic evaluation methods Comparison of the techniques was difficult due to apparent differences in the tightness of the defects Additional weld panels containing 164-inch holes drilled at the centerline along the axis of the weld were used to provide an additional comparison of sensitivities
Single and double transducer combinations operating at 5 and 10 megahertz were evaluated for sensitivity and for recorded signalshyto-noise responses A two-transducer automated C-scan technique was selected for panel evaluation This procedure is shown in Appendix E Following the Sequence 1 evaluation cycle (as-welded condition) one of the weld beads was shaved off flush with the specimen surface (Sequence 2 scarfed condition) The ultrasonic evaluation procedure was again optimized This procedure is shown in Appendix F
4 Eddy Current Evaluation
Panels used for optimization of x-radiographic evaluation were also used for optimizationof eddy current methods Depth of penetration in the panel and noise resulting from variations in probe lift-off were primary considerations in selecting an optimum technique A Vector III instrument was selected for its stability A 100-kilohertz probe was selected for evaluation of 18-inch specimens and a 20-kilohertz probe was selected for evaluation of 12-inch specimens These operating frequencies were chosen to enable penetration to the midpoint of each specimens configuration Automated C-scan recording was accomplished with the aid of a spring-loaded probe holder as shown in Figure IV-4 A procedure was established for evaluating welded panels with the crown intact This procedure is shown in Appendix G Following the Sequence 1 evaluation cycle (as-welded condition) one of the weld beads was shaved off flush with the specimen surface (Sequence 2 scarfed condition) The eddy current evaluation procedure was again optimized Automated C-scan recording was accomplished with the aid of a spring-loaded probe holder as shown in Figure IV-5 The procedure for eddy current evaluation of welded flat panels is shown in Appendix H
IV-7
Scanning Bridge Mounting Tube
Double Hing
Sann odrfrWleSpring-Loaded CurrentEddy rb Panels wthPCrown
Spring-oae EdyCretSann PoeRrfrW~
Fir
Panels with Crowns
IV-8
Probe
Shoe Pivot
IScanning Bridge Mounting Tube
Eddy Current _- - P robe
Figure IV-5 Spring-Loaded Eddy Current Scanning Probe Holder for Flat Panels
IV-9
C TEST SPECIMEN EVALUATION
Test specimens were evaluated by optimized x-radiographic penetrant
ultrasonic and eddy current inspection procedures in three separate inspection sequences Two additional penetrant cycles
were completed after etching panels in the as-welded condition and
after etching in the scarfed condition After familiarization
with the specific procedures to be used the 93 specimens were
evaluated by three different operators for each inspection sequence
Inspection records were analyzed and recorded by each operator
without a knowledge of the total number of defects present or
of the previous inspection results
1 Sequence 1 - Inspection of As-Welded Specimens
The Sequence 1 inspection included x~radiographic penetrant
ultrasonic and eddy current inspection procedures One set of
x-radiographs was made The radiographs were then evaluated
independently by three different operators Each operator intershy
preted the x-radiographic image and reported his own results
Penetrant inspection of specimens in the as-welded condition was
performed by one operator Few defects were detected and results
were not included in the data This inspection was somewhat
biased due to the mechanical grinding on the beads to remove the
reinforcement pads The specimens were etched using a light
metallurgical etch (Flicks etchant solution) recleaned using
a mild alkaline cleaner and reinspected Penetrant inspection was
performed independently by three different operators who completed
the entir penetrant inspection process and reported their own
results
One set of C-scan ultrasonic and eddy current recordings were made
The recordings were then evaluated and the results recorded
independently by three different operators
IV-10
Inspections were carried out using the optimized methods establishshy
ed and documented in Appendices A D E and F The locations and relative magnitudes of the NDT indications were recorded by
each operator and coded for data processing
2 Sequence 2 - Inspection after Scarfing
On completion of the first inspection sequence the weld crown on
one side of each LOP panel was removed by scarfing In all cases
the weld crown was removed flush with the parent metal surface
For near-surface LOP flaws the weld crown was removed from the
side nearest to the LOP to open it to the scarfed surface Panels
were cleaned and inspected by the optimized NDT methods One set
of x-radiographs was made The radiographs were then evaluated
independently by three different operators Each operator
interpreted the information on the x-ray film and reported his
own results
Penetrant inspection was performed independently by three different
operators who completed the entire penetrant inspection procedure
and reported their own results Scarfing of the weld crown
resulted in mechanical smearing of the aluminum material thus
decreasing the chances for the penetrant to reveal the flaws The surface was therefore etched using a light metallurgical etch
(Flicks etchant solution) recleaned using a milk alkaline
cleaner-and reinspected by three different operators
One set of C-scan ultrasonic and eddy current recordings was made
The recordings were then evaluated independently by three
different operators Inspections and readout were carried out
using the optimized methods established and documented in Appendices A D E and G The locations and relative magnitudes
of the NDT indications were recorded by each operator and were
coded for data processing
3 Sequence 3 - Inspection after Proof Loading
Following completion of Sequence 2 the LOP panels were proofshy
loaded to approximately 90 of the yield strength for the weld
This loading cycle was performed to simulate a proof load cycle
on functional hardware and to evaluate the enhancement of flaw
detection provided by NDT methods Panels were cleaned and
inspected by optimized NDT methods One set of x-radiographs was
made This set was evaluated independently by three different
operators Each operator interpreted the information on the x-ray
film and reported his own results
IV-11
Penetrant inspections were performed independently by three
different operators who completed the entire penetrant inspection
procedure and reported his own results
One set of C-scan ultrasonic and eddy current recordings was made
The recordings were then evaluated independently by three different
operators Inspections and readout were carried out using the
optimized methods established and documented in Appendices A D
E and G The locations and relative magnitudes of the NDT
indications were recorded by each operator and were coded for data
processing
D PANEL FRACTURE
Following final inspection in the post proof-loaded configuration
the panels were fractured and the actual flaw sizes measured
Flaw sizes- and- locations were-measured with the aid of a traveling
microscope and the results were recorded in the actual data file
tip to the tip of the lunes were measuredThe lengths from the actual flaw length and were used in processingand recorded as
data by the x-ray ultrasonic and eddy current methods The
lengths of the flaw open to the panel surface were measured and
the actual flaw lengths and were used in processingrecorded as data by the penetrant method
The heights of the lunes were measured and recorded as actual
flaw depth and were used in processing all data In addition to
the plan view location within the panel the depth or location
of the lune beneath the surface for buried flaws was recorded
This depth below the surface was used as a criterion for acceptshy
ing data observed by the eddy current method Figure IV-6
schematically shows the measurements taken for the LOP specimens
E- DATA ANALYSIS
1 Data Tabulation
Actual LOP flaw data and NDT observations were coded keypunched
and input to a computer for data tabulation data ordering and
data analysis sequences Table IV-l lists actual flaw data for
LOP specimens Note that all dimensions are in inches
Iv-12
a Flaws Open to the Surface
b Buried Flaws f --)
Figure IV-6 Schematic Side View of a LOP (Lune) Flaw Showing Critical Dimensions
-V-13
Table IV-I Actual Flaw Data LOP Panels
PANEL CRACK CRACK CRACK INITIAL FINAL CRACK POSITION P NO NO LENGTH DEPTH FINISH THICKNESS FINISH THICKNESS X Y DXDU
IC 1 517 035 51 1380 50 1060 123 443 u02 ICA 2 504 040 51 1380 50 1060 285 448 00201 BCA 17 542 02 51 1380 50 1060 230 432 00224
lOCA 19 498 04t 62 1500 25 1330 233 438 00175 1ICA 20 569 047 62 1500 25 1330 382 438 00210 1308 24 194 050 53 1300 50 1150 212 340 160B 28 133 042 87 1840 20 1440 499 342 160B 29 231 042 88 1660 32 1390 409 345 1605 30 268 05u 88 16o0 32 1390 322 345 19ACA 35 346 076 tO 1750 40 1460 194 320 00108 20CA 36 318 057 77 1690 28 1510 200 327 00055 2108 37 263 053 76 1720 50 1510 286 328 2108 38 341 066 7b 720 50 1510 195 327 2208 39 345 065 65 1620 30 1540 392 327 2208 40 258 057 65 1620 30 1540 301 327 240B 4 337 073 81 1780 36 1430 298 320 00075 2408 24CA
45 46
309
336 064 061
81 81
1780
1780 36 36
1430
1430 207 117
322 324 00061
260B 49 1100 091 51 1730 25 1400 450 427 260a 50 1158 087 51 1730 25 1400 302 427 2608 51 1075 08 51 1730 25 1400 156 425 280B 55 1175 088 55 1830 64 1590 476 425 280B 56 1079 090 55 1830 64 1590 309 427 2808 57 1052 093 55 1830 64 1590 142 422 3OCA 61 1156 080 54 1760 28 1320 310 384 00078 30CA o2 1122 071 54 17t0 28 1320 154 380 00095 33CA 69 1125 073 49 1870 65 1250 498 385 00117 33CA 70 1150 072 49 1870 65 1250 331 387 00126 33CA 71 1184 070 49 1870 65 1250 160 385 00154 360B 77 1010 105 53 2050 20 1660 14B 440 308B 78 987 103 53 2050 20 1660 301 440 360B 79 91q 105 53 2050 20 1660 443 440 3708 80 916 104 52 1890 40 1820 448 439 370B 81 890 102 52 1890 40 1820 283 441 370B 82 850 104 52 1890 40 1820 113 441 380B 83 825 120 62 2050 40 1430 521 440 3806 8k 790 117 62 2050 40 1430 353 440 3808 85 q35 116 62 2050 40 1430 195 440 45CA 103 885 035 94 1620 40 1430 320 407 00269 45CA 104 929 041 94 1620 40 1430 159 407 00225 5205 119 698 083 62 1780 25 1520 319 432 5408 121 734 088 55 1660 60 1440 336 431 540B 550B
122 123
788
742 089 0o9
55 50
1660
1750 60 55
1440
1480 186 288
429 429
5508 124 749 073 50 1750 55 1480 139 - 429 561B 125 1075 1 50 1560 35 1180 257 430
5805 6008 60D
127 129 130
1124-1158 1105
083
07
091
51 54 54
1590
1460 1460
40 0 40
1230
1170
1170
349 304 157
432 432 432
oSCA 142 372 059 115 1740 35 1430 299 340 00159 70CA 143 320 055 100 1650 45 1490 290 345 00 9 72CA 72CA
146 147
297
288 070 054
71 71
1630
1630 40 40
1470
1470 464 377
343 342
00197 00259
73CA 148 322 058 112 1670 40 1390 302 344 00176 73CA 149 267 057 112 1670 40 1390 212 342 00171 73CA 150 343 053 112 1670 40 1390 123 342 00225 74CA 74CA
151 shy152
262
250 060 052
105 l5
1620
120 35 35
1490 1490
482 392
342 342
00220 00285
74CA 153 243 050 105 1620 35 1490 304 342 0025 77CA 78CA
156 157
1014 986
046
046 91 86
1430
1470 150 150
1330
1210 351 478
434 433
00244 00246
8OCA 160 961 049 0 1430 150 1260 409 434 00214 80CA 85CA
161 I6
943
874 050 057
40 145
1430
1640 150 125
1260
1370 258 374
433 427
00205shy00155
85CA 167 921 05 145 1640 125 1370 226 427 ooi74 86CA 168 781 049 46 1620 115 1400 273 427 00172 86CA 169 809 049 46 1620 115 1400 127 427 00204 88CA 173 812 085 39 1620 150 1450 445 432 88CA 174 825 080 39 1620 150 1450 279 432 00117 SCA 175 858 074 39 1620 150 1450 105 434 00225 94CA 186 268 075 40 1790 140 1600 194 330 00345 980A 194 277 077 46 1710 115 1250 331 321 950A 195 280 070 4 1710 115 1250 331 321 980A 196 288 083 46 1710 115 1250 151 323 99CA 197 717 097 92 1910 22 1480 286 430 00025 99CA 198 638 101 92 1910 22 1480 129 430 00063
10708 214 b49 062 105 1710 160 1400 453 438 10808 215 724 088 92 1800 36 1360 370 443 108CA 216 676 073 92 1800 36 1360 180 44 11108 220 1210 075 76 1i0 130 1260 323 421 11208 221 1184 077 68 1500 20 1250 400 439 1140B 11408
223 224
1271 1245
097
099 74 74
1430
1430 25 25
1220
1220 354 212
443 444
11508 225 1226 073 111 1410 54 1150 401 438 11508 226 1216 070 111 1410 54 1150 255 438
ICA 501 516 028 120 4830 160 4470 296 428 01594 9CA 509 369 070 230 4950 60 4650 394 430 oi435
lIX 510 261 032 230 4980 45 4660 347 426 IICA -511 393 048 230 4980 45 4660 382 426 0I545 1608 516 338 064 175 4850 130 4450 299 431
I7-14
Table IV-I (Continued)
17CA 517 688 077 b2 4850 55 4550 250 452 190A 2008 2108 2208
519 520 521 522
511
708
362
494
079
090
061
052
77 115 70 57
4850
4860
4750
4800
45 45 70 85
4590
4360
4610
4610
230 196 226 361
453 448 453 438
2308 523 419 070 47 4780 60 4510 366 440 240B 514 562 076 50 4880 40 4660 262 445 24X 2808
525 528
483
686 160 078
50 47
4880
4890 40 22
4660
4630 440 188
445 447
28X 529 145 028 47 4890 22 4630 418 445 28X 3608
530 536
112
964 027 117
47 44
4890
5090 22 45
4630
4690 444 246
445 444
42CA 542 214 024 79 4910 84 4630 303 425 O1If 43CA 44CA 450A
543 544 545
116
173
033
009
032
014
62 o0
39
4840
4870
4860
70 52 50
4540
4550
4540
289 295 296
430 425 430
0160 01497 O114
480A 500A 59CA 60CA
548 550 559 560
094
900
872
889
005 03q 069 063
74 52 72 73
4780
4830
4850 14870
40 45
125 60
4370
4530
4600 4560
311 291 228 364
430 429 423 425
01581 01723 01228 01506
63CA 640A 6408 6408
53 54 565 566
870 435 391 440
058 071 081 076
127 87 87 87
4810
4780
4760
4780
45 80 80 80
4560
4520
4520
4520
211 452 308 154
423 437 437 437
0120
660B 6608 o70B
568 569 570
482
430
531
094
096
085
60 60 63
4920
4920
480
55 55 80
4620
4620
4660
350 247 387
440 440 443
6708 571 568 081 63 4800 80 4660 288 443 68C 572 488 087 69 4740 35 4550 436 443 680 8
573 574
454
518 095 090
o9 69
4740
4740 35 35
4550
4550 330 230
443 444
690B 60 6905 700
575 576 577 578
506 601 568 632
077
071
071
089
82 82 82 53
4620
4620
4c20
4750
78 78 78 90
4580
4580
4580
4480
442 343 239 436
443 443 443 440
7008 7108 710B
579 580 581
611 672 699
105
075
078
53 63 63
4750
4720
4720
90 36 36
4480
4550
4550
312 414 292
440 440 440
7108 720a 720
582 583 584
690 706 730
072
087
083
63 77 77
4720
4910
4910
36 54 54
4550
4650
4650
174 468 347
440 440 440
7208 730 7308
565 586 587
630
672
652
077
091
098
77 45 45
4910
4840
4840
54 45 45
4650
4540
4540
225 427 310
438 435 435
730 588 688 087 5 4840 45 4540 187 435 7708 7808 8108 94C 94C 950 95C 950
594 595 598 619 620 621 422 623
688
682
670
483
474-
665
675
541
-101 127 126 040 035 061 065 041
52 60 29 45 45 58 58 58
4710
4B50
4730
4830
4830
4790
4790
4790
55 80 45 45 45 62 62 62
4370
4600
4330
4540
4540
4630
430
4630
242 347 297 414 297 404 283 169
421 405 415 435 435 434 434 434
01631 01441 01155 0120 01Z
97C 970 97C 980 980
627 628 629 630 31
659 671 562 945 737
063
060
063
083
061
37 37 37 41 41
4950
4950
4950
4920
4920
35 35 3 75 75
4570
4570
4570
4640
4640
407 286 172 395 278
435 435 435 440 440
0ls6 01518 0144 01218 012
1000 100C 1020
634 635 639
1121 1020 1041
065
069
069
105 105 140
4810
4810
4850
125 125 90
4500
4500
4690
380 184 515
425 425 425
01302 01350 01479
102C 1020 104C 1040 1040 1050 1050
640 641 644 645 64 647 648
1075 1075 943 995 846 122 177
058
Obu
048
062
054
012
027
140 140 55 55 55 51 51
4850
4850
4920
4920
4920
4800
4800
90 90 40 40 40 82 82
4690
4690
4590
4590
4590
4600
400
340 160 527 342 169 441 286
425 425 425 425 425 437 437
oi61 01i1 0136 012 01370 01682 01510
1070 1070 108C 1080 1090
651 642 653 654 655
259 132 285 183 289
020
033
038
026
035
165 lb5 9U 90 44
4990
4990
4970
4970
4870
95 95 65 65 48
4700
4700
4670
4670
4550
317 214 248 148 478
435 435 435 435 435
oid6oW10 0i426 01475 01664
1090 1090 1120
656 657 661
198
196
621
032
013
061
44 44
115
4875
4870
4273
48 48 48
4550
4550
4550
379 276 293
435 435 440
01642 0i640 01388
112X 126C 1280
662 675 677
645 1050 1093
064
077
054
115 85 53
4270
4880
4680
48 32 30
4550
4670
4700
410 363 370
440 435 434
01502 0111m4 01368
1320 4CA 4CA 4CA IICA
661 301 302 303 3
431
529
535
515
514
037
044
038
09
053
64 -0 -0 -0 -0
4810
150 -0 -0 -shy0 -0
4530
427 99
268 439 173
450 -0 -0 o -0
01429
IV-15
Table IV-1 (Concluded)
lICA 140B 5308
305 306 307
461
294
773
044
051
091 -shy
-0 0 -0
-0 -0 -0
323 210 416
-0 -0 -0
100B 10008 10008 10208 10208 102DB 1050B 109C6 109C8
4 4 4
11 11 14 53
100 100 100
308 309 310 311 312 313 314 315 316 317 318
619 320 321 322
323 32 325 326
799
750
732
626
733
706
637
660
712
529
535
515
514
461
294
773 1799 750 732
099
096
096
097
094
097
088
088
089
044
038
029
05
044
01
091
099
096
096
-0 -0 -0 -0 -0 -0 -0 -0 --0 -0 -0 -0 -0 -0
-0 -0 -0 -0
S
-0 -0 -0 -o -0 -0 -0 -0 --0 -0 -0 -0 0 -0
-0 -0 -0 -0
147 293 439 103 271 445 261 183 335 99
268 439 173 323 210
416 147 293 439
-0 -0
-0 0
-0 -0 -0 -0 -0 -0 -0 -0 -0 -0 -0
-0 -0 -0 -0
102 102 102 105 109 109
3 7 328 329 330 331 332
628
733
706
637
660
712
097 09 097 088 088 089
-0 -0 -0 -0 -
0
-0 -0 -0 -0 -0 -0
103 271 445 261 183 335
-0 -0 -0 -0 -0 -0
2CB 13C8 55C5
801 802 b03
496
250
907
052
035
068
-0 -0 -0
-0 -0 -0
263 368 294
-0 -0 -0
9005 9008
804 805
1292 1327
117
12 -0 -o
-0 -
158333 -0-0
900B 9108 910D 9108 9308 9308 9308
IIOCB I10CB 1106 11708 124CB
2 13 55 90 90 90 91 91 91 93 9amp 93
110 110 110
806 307 608 809 810 8ll 812 813 614 6 15 316 817 818 819 820 821 822 323 324 825 326 827 828 329 830 831 632
1412 1171 1487 1498 1257 1783 1878 293 22 207
1365 1104 496 250 907 1292 1327 1412 1171 1487 1498 1257 1783 1878 293 242 207
120
115
113
127
118
117
122
040
043
034
127
082
052 035 068 117 124 120 115 113 127 118 117 122 040 043 034
0 -0 -0 -0 -0 -0 -0 -0 -0 -0 -0 -0 -0 -0 -0 -0 -0 -0 -0 -0 -0 -0 -0 -0 -amp -0 -0
-0 -0 -0 -0 -0 -0 -0 -0 -0 -0 -0 -0 -0 -0 -0 -0 -0 -0 -0 -0 -0 -0 -0 -0 -0 -0 -0
515 138 331 504 163 322 510 235 331 432 378 376 263 368 294 158 333 515 138 331 504 168 322 510 35
331 432
-0 -0 -0 -0 -0 -0 -0 -0 -0 -0 -0 -0 -0 -0 -0 -0 -0 -0 -0 -0 -0 -0 -0 -0
0 -0 -0
177 124
833 834
1365 1304
127
082 -Q -0
-0 -0
3e78 376
-0 -D
IV-16
Table IV-2 lists nondestructive test observations as ordered according to the actual flaw length Table IV-3 lists nonshy
destructive test observations by the-penetrant method as
ordered according to actual open flaw length Sequence 10
denotes the inspection cycle which we performed in the as
produced condition and after etching Sequence 15 denotes
the inspection cycle which was performed after scarfing one
crown off the panels Sequences 2 and 3 are inspections
performed after etching the scarfed panels and after proof
loading the panels Sequences 2 and 3 inspections were performshy
ed with the panels in the same condition as noted for ultrasonic eddy current and x-ray inspections performed in the same cycle
A 0 indicates that there were no misses by and of the three NDT observers Conversely a 3 indicates that the flaw was
missed by all of the observers A -0 indicates that no NDT
observations were made for the sequence
2 Data Ordering
Actual flaw data (Table IV-l) were used as a basis for all subshysequent calculation ordering and analysis Flaws were initially
ordered by decreasing actual flaw length depth and area These data were then stored for use in statistical analysis
sequences
3 Data Analysis and Presentation
The same statistical analysis plotting methods and calculation of one-sided confidence limits described for the integrally stiffened panel data were used in analysis of the LOP detection reliability data
4 Ultrasonic Data Analysis
Initial analysis of the ultrasonic testing data revealed a
discrepancy in the ultrasonic data Failure to maintain the
detection level between sequences and to detect large flaws
was attributed to a combination of panel warpage and human factors
in the inspections To verify this discrepancy and to provide
a measure of the true values 16 additional LOP panels containing
33 flaws were selected and subjected to the same Sequence I and
Sequence 3 inspection cycles as the completed panels An additional
optimization cycle performed resulted in changes in the NDT procedures for the LOP panels These changes are shown as
Amendments A and B to the Appendix E procedure The inspection
sequence was repeated twice (double inspection in two runs)
IV-17
Table IV-2 NDT Observations LOP Panels
ULTRASONIC EDDY CURRENT X-RAY
INSPECTION SEQUENCE 1 2 3 1 2 3 1 2 3
CRACK ACTUAL NUMBER VALUE
223 1271 3 0 0 0 3 3 1 0 0 224 1245 0 0 0 1 3 3 1 0 0 225 122b 3 3 U 3 1 2 0 0 0 286 121d 3 3 0 1 1 2 0 0 0 220 1210 3 3 u 0 3 2 2 0 0 71 19184 2 0 0 3 3 3 0 0 0
221 19184 3 3 0 0 1 0 0 0 0 55 1175 3 3 0 1 0 0 0 0 0 50 1158 3 3 0 1 3 3 0 0 0 129 115$ 3 0 -0 3 3 -0 0 0 3 61 1156 3 0 0 3 3 0 0 0 0 70 1150 2 3 0 3 3 0 0 0 0 69 1125 1 3 0 3 3 3 0 0 1 127 62
1124 1122
3 3
3 3
0 0
0 3
2 3
0 1
0 0
0 0
0 0
634 1121 0 0 0 3 3 3 0 0 0 130 1105 1 0 -0 1 3 -0 0 0 3 49 1100 3 3 0 2 3 3 0 0 0
677 1093 1 0 0 3 3 3 0 0 0 56 19079 3 3 0 0 0 0 0 0 0
125 1075 3 1 0 0 3 3 2 0 0 640 1075 3 1 0 1 2 2 3 2 0 641 1076 2 1 1 1 1 3 1 1 0 51 I075- 3 3 3 2 2 3 0 0 0 57 1052 3 2 0 3 2 0 0 0 0
675 1050 2 3 0 2 1 2 2 2 0 639 1041 3 3 0 3 3 1 3 3 1 635 1020 3 2 0 3 2 3 2 2 0 156 1014 3 0 0 3 3 3 0 0 0 77 10010 0 0 0 1 0 0 0 0 0
645 993 2 1 0 3 3 3 3 3 0 78 987 0 u 0 0 0 1 0 0 0
157 986 3 1 0 2 3 3 1 0 0 536 964 3 3 0 0 3 0 3 2 0 160 961 3- 0 0 3 3 3 0 0 0 630 945 3 3 0 2 2 2 2 1 0 644 943 2 0 0 3 3 3 3 2 0 161 943 3 0 0 2 3 2 0 0 0 85 935 0 O -0 0 0 -0 0 0 3 104 929 3 2 0 3 3 3 0 0 0 167 921 3 3 0 3 3 0 0 0 0 79 919 0 0 0 1 0 1 0 0 0 80 916 1 0 0 0 3 1 0 0 0
550 900 3 3 0 1 3 0 3 3 1 81 890 O 0 0 0 0 1 0 0 0
560 889 1 1 0 3 3 1 1 0 0 103 885 3 3 0 3 3 0 0 0
IV-18
Table IV-2 (Continued)
NU VAL 1 2 3 I 2 3 1 2 3
166 o37 shy 3 U U 1 3 0 0 0 0 559 S872 3 3 0 3 3 3 2 2 0 563 870 1 U 0 2 3 3 1 1 0 175 858 3 3 -0 3 3 -0 0 0 3 82 850 1 U U 2 0 0 0 0 0
646 846 3 0 0 2 2 2 3 3 0 174 825 3 3 -0 3 3 -o 0 0 3 b3 825 0 0 -0 1 3 -0 0 0 3 173 812 3 3 -0 3 0 0 0 0 3 169 80) 3 2 0 3 2 3 0 0 0 84 790 U 0 -U 0 3 -0 0 0 3
122 o788 3 3 0 1 3 3 U 0 0 It8 e781 2 j 0 2 0 1 0 0 0 124 9749 3 0 0 2 3 0 0 0 0 123 0742 3 3 0 2 3 0 0 0 0 631 a737 3 3 0 3 2 1 3 1 0 121 734 3 0 0 1 0 3 0 0 U 584 730 3 2 0 2 3 0 0 1 0 215 724 3 3 0 2 3- 3 1 1 0 197 717 1 3 0 1 3 3 0 0 0 520 708 3 2 0 1 3 0 0 2 0 583 706- 3 1 0 0 3 0 0 1 2 581 699 3 3 0 3 2 0 0 0 0 119 o698 3 3 0 1 3 3 0 0 0 582 690 3 0 0 2 2 0 0 1 0 517 s688 1 3 0 1 3 3 3 0 0 588 688 1 0 0 3 3 3 1 1 0 594 688 3 3 0 3 3 0 1 2 0 528 o686 3 3 0 0 3 0 3 2 0 595 682 3 1 0 0 3 3 1 1 0 216 67o 3 3 0 2 3 3 1 0 0 622 675 0 0 0 3 3 1 2 1- 0 580 672 3 3 0 2 2 0 1 1 0 586 672 3 1 0 2 3 3 1 2 0 628 671 3 1 0 3 1 3 3 1 0 598 670 3 3 U 2 3 3 1 1 0 621 665 U 0 0 2 3 3 0 1 0 627 o659 3 1 0 3 2 2 1 1 0 587 652 2 0 0 2 2 3 0 0 0 214 649 3 3 0 3 3 0 0 0 0 662 645 3 3 3 3 3 3 3 3 3 198 63 0 1 U 2 3 3 0 0 0 578 9632 0 0 0 2 1 3 0 0 0 585 o630 J 0 0 2 0 0 0 1 0 661 621 3 3 3 3 3 3 3 3 3 579 611 0 0 0 1 3 3 0 1 0 576 9601 1 0 0 1 0 0 0 0 0 20 569 3 3 0 3 3 3 0 0 0
571 566 3 3 0 2 3 0 1 1 0
IV-19
Table IV-2 (Continued)
CKj ACT NO VAL 1 2 3 1 2 3 1 2 3
577 568 0 0 0 1 0 0 1 0 0 524 562 2 3 0 2 0 1 0 0 0 629 562 3 1 0 3 2 3 3 1 0 17 542 3 3 0 2 3 1 0 0 0
623 541 0 0 0 3 0 3 3 2 0 570 531 3 3 0 1 3 0 0 1 0 574 518 2 3 0 3 2 2 0 1 0
1 517 3 3 0 3 3 3 0 0 0 501 516 3 3 0 3 0 3 3 2 0 519 511 3 3 0 1 0 2 3 0 0 575 506 0 0 0 1 0 0 0 0 0
2 50 3 3 0 3 3 3 0 0 0 19 498 3 3 0 2 3 3 0 0 0
522 494 2 3 0 0 3 0 1 2 0
572 488 0 0 0- 0 2 3 0 1 0 525 483 a 2 0 0 3 3 0 0 0 619 483 3 3 1 3 3 0 3 3 2 568 48e 3 3 U 1 3 0 0 1 0 620 474 3 0 0 1 1 0 3 3 0 5-3 454- 1 0 0- 3 2 3 1 1 0 566 440 U 0 0 2 3 2 0 0 1 564 435 3 2 0 2 3 3 0 0 0 681 431 3 3 0 2 1 3 3 2 0 569 430 0 3 3 2 0 2 0 0 0 523 419 0 0 0 0 3 0 0 0 0 511 393 3 2 0 3 3 3 3 3 0 565 a391 1 0 0 2 2 3 0 0 0
142 372 3 3 0 0 3 3 0 0 0 509 369 3 3 0 3 3 2 3 3 0 521 362 3 3 0 0 3 0 1 2 0 35 346 0 0 0 3 3 3 0 0 0 39 345 0 0 0 1 0 0 0 0 0
150 343 3 3 3 2 3 3 0 0 0 38 341 1 0 0 2 0 3 0 0 0
516 338 0 0 0 2 3 3 0 1 0 44 337 0 0 0 1 3 3 0 0 0 46 336 3 2 0 2 3 2 0 0 0 148 324 3 3 0 1 3 3 0 0 0 143 320 3 3 0 0 3 3 1 0 0 36 318 0 0 0 2 2 1 0 0 0 45 309 0 1 0 2 3 1 0 0 0 146 297 3 3 2 1 3 1 0 0 0 655 289 3 3 0 2 3 3 3 0 0 147 288 3 3 0 2 3 3 0 0 0 196 288 3 3 3 2 3 2 0 0 0 653 285 3 0 -0 3 3 3 3 3 1 195 280 0 3 0 3 3 1 0 0 0 194 277 3 3 0 3 3 0 0 0 0 30 26d -3 1 0 1 2 0 0 0 0
IV-20
Table IV-2 (Concluded)
CK NO
ACT VAL 1 2 3 1 2 3 1 2 3
186 26 3 3 0 1 3 3 0 0 0 149 p261 3 3 0 3 3 3 0 0 0 37 p263 1 0 0 2 1 1 0 0 0
151 262 3 3 u 1 3 3 0 0 0 510 o261 0 0 0 3 3 3 2 3 3 6)1 40
259 258
3 0
3 0
0 0
2 1
1 3
3 0
3 0
2 0
0 0
152 250 3 3 0 3 3 3 0 0 0 153 243 3 3 0 1 3 2 0 0 0 d9 231 3 3 0 2 3 0 0 0 0
542 o214 2 3 0 2 0 3 3 2 0 656 191 3 J 0 3 2 3 0 1 0 657 196 3 3 0 3 1 3 3 2 1 24 194 3 3 0 2 0 3 0 0 0
654 183 3 3 0 2 3 3 3 3 0 648 177 3 0 0 1 3 0 2 2 0 544 173 3 3 0 0 3 0 2 0 1 529 14h 2 3 0 2 3 3 3 2 2 28 133 3 3 u 2 3 3 3 1 0
642 132 -0 -0 0- -0 -0 -0 - -0 -0
647 o122 1 3 2 3 3 2 P 2 3 543 9116 2 3 0 3 3 1 3 1 1 530 i1 0 0 0 2 3 0 1 2 0 548 094 1 3 3 1 3 3 2 3 2 545 033 3 3 1 2 2 3 3 1 3
IV-21
TabZe IV-3 NDT Observations by the Penetrant Method LOP Panels-
PENETRANT
INSPECTION SEQUENCE 10 15 2
CRACK ACTUAL NUMBER VALUE
223 1271 1 3 4 0 224 1o245 1 3 j 0 225 1226 1 3 2 0 226 1o218 1 2 3 0 220 121V 0 3 3 0 221 1184 1 3 3 0 S5 117b 3 3 3 0 50 1158 3 3 3 3 129 1o15 2 3 3 -0 127 1124 2 3 3 0 130 1105 0 3 3 -U 49 1100 3 3 3 3 56 1079 3 3 3 0
125 1075 1 3 21 0 51 1075 3 3 3 2 57 1052 3 3 j 0 77 1010 3 1 0 3 78 987 0 1 0 1 85 935 0 3 3 3 79 919 0 2 0 1 80 916 3 3 2 0 81 89U 0 0 v 0 82 850 0 0 0 0 83 825 0 3 3 -0
173 812 3 3 2 -0 84 79U 0 3 3 3
122 788 0 3 3 0 124 a749 1 3 2 0 123 742 3 3 e 0 121 734 0 3 3 1 584 730 0 0 0 0 215 724 2 3 j 2 520 708 2 3 3 0 583 70c 0 3 2 0 581 699 0 3 3 0 119 698 2 3 3 0 582 o690 0 2 3 0 517 0688 0 3 3 0 588 688 0 3 3 0 594 688 0 3 3 0 595 (8D 3 3- 0
IV-22
Table IV-3 (Coneluded)
CK ACT NO VAL 0 15 2 -
216 676 0 3 3 1 586 672 0 3 3 0 580 o672 0 3 3 2 598 670 e 3 3 0 587 e652 0 3 3 0 214 649 0 3 3 0 578 a632 0 3 3 0 585 630 0 3 3 0 579 611 0 3 e 0 576 601 0 u U 0 571 568 0 2 1 0 577 568 0 0 0 0 524 562 3 2 1 0 570 531 0 2 2 2 574 9518 0 3 J 0 519 511 1 3 3 0 575 50b 0 0 0 0 522 494 3 3 2 1 572 488 0 3 3 1 525 483 3 3 3 1 568 482 3 3 3 0 573 454 2 3 3 0 566 440 0 3 3 0 564 435 2 3 3 0 569 430 1 3 3 0 523 419 2 3 3 0 565 391 0 2 3 0 521 362 1 3 1 0 39 345 3 0 0 0 38 341 0 0 0 0
516 338 U 3 J 0 196 288 3 3 3 3 195 280 3 3 3 2 194 277 3 3 3 0 30 268 3 3 3 2 37 263 3 0 pound 0 40 -o258 3 3 3 0 29 231 2 3 2 0 24 194 3 3 1 1
8 133 1 3 1 0
IV-23
with three different operators making their own C-scan recordings
interpreting the results and documenting the inspections The
operator responsible for the original optimization and recording
sequences was eliminated from this repeat evaluation Additional
care was taken to align warped panels to provide the best
possible evaluation
The results of this repeat cycle showed a definite improvement
in the reliability of the ultrasonic method in detecting LOP
flaws The two data files were merged on the following basis
o Data from the repeat evaluation were ordered by actual flaw
dimension
An analysis was performed by counting down from the largest
flaw to the first miss by the ultrasonic method
The original data were truncated to eliminate all flaws
larger than that of the first miss in the repeat data
The remaining data were merged and analyzed according to the
original plan The merged actual data file used for processing
Sequences 1 and 3 ultrasonic data is shown in Table IV-i
Table IV-A lists nondestructive test observations by the ultrashy
sonic method for the merged data as ordered by actual crack length
The combined data base was analyzed and plotted in the same
manner as that described for the integrally stiffened panels
F DATA RESULTS
The results of inspection and data analysis are shown graphically
in Figures IV-7 IV-8 IV-9 and IV-I0 Figure IV-7 plots
NDT observations by the penetrant method for flaws open to the
surface Figure IV-8 plots NDT observations by the ultrasonic the merged data from the originalinspection method and includes
and repeat evaluations for Sequences 1 and 3 Sequence 2 is for
original data only Figures TV-9 and IV-10 are plots of NDT
observations by the eddy current and x-ray methods for the
original data only
The results of these analyses show the influences of both flaw
geometry and tightness and of the weld bead geometry variations
as inspection variables The benefits of etching and proof
loading for improving NDT reliability are not as great as
those observed for flat specimens This is due to the
IV-24
greater inspection process variability imposed by the panel geometries
Eddy current data for the thin (18-in) panels are believed to accurately reflect the expected detection reliabilities The data are shown at the lower end of the plots in Figure IV-9 Eddy current data for the thick (12-in) panels are not accurately represented by this plot due to the limited depth of penetration approximately 0084 inch at 200 kilohertz No screening of the data at the upper end was performed due to uncertainties in describing the flaw length interrogated at the actual penetration depth
Table IV-4 NDT Observations by the Ultrasonic Method Merged Data LOP Panels
ULTRASONIC
INS PE CkON SEQUENCE 1 2 3
CRACK ACTUAL NUMBER VALUE
812 1878 0 -0 0 829 1878 0 -0 0
8e8 1783 0 -0 o 811 1783 0 -U 0
8U9 1498 0 -0 0 826 1496 0 -0 0 825 1487 0 -0 0 808 1487 0 -0 0 806 1412 U -0 0 -823 -41e 0 -u 616 1365 0 -U U 833 1365 0 -U 0 805 1327 0 -0 0 822 1321 0 -0 0 821 1292 0 -0 0 804 1O292 U -0 Ushy223 1271 3 0 0 827 1251 0 -0 0 810 1251 0 -0 0 224 1245 0 0 0
225 226
1226 1218
3 3
3 3
0 0
220 1210 3 3 0
71 1184 2 0 0 221 1184 3 3 0 55 117S 3 3 0
807 1171 0 -0 0 824 1171 0 -0 0 50 115S 3 3 U 129 1158 3 0 -U 61 l1lbb 3 0 U 70 69
1150 1125
2 1
3 3
U 0
127 1124 3 3 0 62 1122 3 3 0
634 1121 0 0 U 130 loOn 1 0 -0 817 834
1104 1104
(1 -U 0 -u
0 o
49 1100 3 3 0
677 1093 1 0 0 56 1079 3 3 0
641 1075 2 1 1 51 1075 3 3 3
IV-26
Table IV-- (Continued)
CK ACT NO VAL 1 2 3
125 1075 3 640 1075 3 1 0 57 1052 3 0
675 1050 d 3 0 639 1041 3 3 0 635 1020 3 -2 0 156 1014 3 0 U 77 1010 0 0 0
65 993 2 1 0 78 987 0 0 0
1b7 986 3 1 0
536 964 3 3 0 Io 0 961 3 0 0 630 945 3 3 0 644 943 0 0
161 943 3 0 0 85 935 0 0 -0 104 929 3 2 0 167 921 3 3 0 79 919 0 0 0 80 91b 1 0 0
820 907 0 -0 0 803 907 0 -0 0 550 900 3 3 0 81 890 0 0 0
560 0889 1 1 0 103 885 3 3 0 166 874 3 U 0 559 v872 3 3 0 563 870 1 0 0 175 o858 3 3 -0 82 850 1 0 0
646 846 3 0 0 174 825 3 3 -0
$3 825 0 0 -0 173 812 3 3 -0 169 809 3 2 0 308 799 0 -0 0 324 799 U -0 0
84 790 u 0 -0 122 788 3 3 0 168 781 2 3 0 323 e773 0 -0 0 307 773 0 -0 0
v1-27
Table IV- (Continued)
CK Acr
NO VAL 1 2 3
309 750 0 -0 U 3e5 750 0 -U 0 124 749 3 0 0 123 742 3 3 0 641 73( 3 3 0
121 734 3 0 0 312 73j U -U 0
328 733 0 -0 U 326 732 U -0 0 310 732 0 -U 0 564 215
730
72+ 3 3
2 3
U 0
197 717 1 3 0
316 712 0 -0 0 332 712 0 -U 0 520 705 3 2 0 313 70b U -0 0 329 706 0 -U 0 583 a706 3 1 U 581 699 3 0 119 698 3 3 0 582 690 3 0 0
594 686 3 3 0 517 688 1 3 0 588 6886 11 0 528 686 3 3 0
595 68e 3 1 0 216 676 3 3 0 622 675 0 U 0 580 672 3 3 0 586 67 3 1 0
628 671 3 1 0 598 e670 3 3 0 621 o665 0 0 0 331 660 0 -0 0 315 660 0 -0 0 627 659 3 1 U 587 214 662
652
649 64b
e 3 3
0 3 3
0 0 3
198 638 0 1 U 314 631 0 -0 0 330 637 U -u 0 518 632 0 0 U 565 a630 3 0 0 327 628 0 -0 0 311 628 0 -0 0 661 621 3 3 3 579 611 0 0 0 5t6 601 1 0 0
20 569 3 3 0
IV-28
Table IV- (Continued)
CK ACT NO VAL 1 2 3
571 568 3 1 0 57 524
568 562
0 2
0 3
0 0
629 0562 3 1 0 17 o542 3 3 0
623 541 0 0 0 302 535 0 -u 0 318 c535 0 -U 0 570 o531 3 3 0 317 529 0 -0 0 301 o529 0 c0 (
54 518 2 1 0 1 o517 3 3 0
501 51b 3 3 0 303 515 0 -0 0 349 o515 u -0 0 304 514 0 -0 0 320 514 0 -0 0 519 o511 3 3 0 575 506 0 0 0
2 s504 3 3 0 19 498 3 3 0
801 498 3 -0 0 818 498 3 -0 0 522 0494 2 3 0 572 a488 0 0 0
525 483 2 2 0 619 483 3 3 1 568 482 3 3 0 620 474 3 0 0 305 461 0 =0 0 321 o461 U -0 0 573 454 1 0 0 566 440 0 0 0 564 435 3 e 0 681 431 3 3 0 569 430 0 3 3 523 419 0 0 0 511 393 3 2 0 565 391 1 0 0 142 o372 3 3 0 509 o369 3 3 0 521 362 3 3 0 35 346 0 0 0 39 345 0 0 0
150 343 3 3 3 38 341 1 0 0
516 o338 0 0 0 44 337 U 0 0 46 336 3 2 0 148 322 3 3 0 143 320 3 3 0
IV-29
Table IV-4 (Concluded)
CK NO
36 45
16 306 322
813 830 655 147 196 653 195 194 30-
186 149 37 151 510 651 40
8U2 819 152 153 814 831 29
542
815 832 656 657 24
654 648 544 529 28
b42 647 543 530 548 545
AcT VAL
31d 309 29 29 294
293
293
289
288
288
285 28U 271 -268 26t 26t
263
262
261
259
258
250
250 0250 243 242 242 9231 214
201
201
196
19b
194
183
177 6173 145 133 132 122 116 0112 094 033
1
U U J 0
o 0 0 3 -3 3 3 0 3 3 3 3-
1 3 u J U 0 U 3 3 U u 3 2
0 0 3 3 13
3 3 3 e 3
-0 1 2 U 1 3
2 3
U 1 0 3 2
-0 0 -O 0
-0 0 -U 0
3 0 J 0 3 3 0 0 -3 0 3 o 1 0 3 u 3 0 0 0 3 0 0 u 3 0
U U -u u -0 0
3 u 3 0
-U 0 -0 0
3 0 3 0
-0 0 - 0 3 0 3 0 3 0 3 0 0 0 3 0 3 0 3 0 -u -U 3 2 3 0 0 0 3 3 3 1
000 100
bull00
00
8 0
70
0
70
- 60 0 60
50 60
0 - 40 - 04
30 0
0 30
20
-10
0 o
II
o 100 160 I
200
I
250
80
0
0
I
0 0
0
00
0
-
60
0
0 -
I
100
0
1oa 00 e50
LENGTH IIN)SPCCIMEN LOp 19 It PEFTRANT TEST 96ONG 10 COIIIOEOCE LEVEL 960
LENGTH (INISPEOI[N L0P 1181 NETRANT TEST SEQ NO15
COWISWCG LEVEL - 950
100 ]00
90 90 0 0
O00 0o 0 - 0
70 70 0 0
60 600
- 60
tO 6050
40
30
20
0
0
0
0
0
0x
0
40
30
20
0 10
0 50 1 00 150 00 a50
LETH
NPETRMATTST WNO2 COIIINCE LEVEL shy 950
cor~e~ELEVE 00COW
Figure IV-7 Flaw Detection Probability for LOP Panels by the Penetrant Method Plotted at 95 Probability and 95 Confidence
0 0 50
I I
100 150
LEN (IN)
SPECIREN L0 P 11811a3KEIRtOT TEST MOQ NO3 3
IOE(cE LEVEL shy 1)50
600 a50
1 0 100 -- n00
000 000 0-0-0 - 0 0 0 0 0
90 90 90 0 0 0
0 0
80 - 180 80 - shy
70 70 70
t 60 000j 0_ 60 0 60 0 0 0 -0shy
00 o-0 0 0 0 M0 o 50 0 0 - o 50 o [ o - 0 0 CP0 0 40 0o o 0
G0 shy 0 30 shy 0
I 3
20 20
0 I I I f I I I1 050 1 OD 150 2 O0 250 I I I I 0 [ 1 1 f 10 50 160 1 50 2 00 250 50 100 150 20D 250
LENGTH (IN I LEWIN (IN) LENGTH FIN SPECIEN L O P 1812 P CININ L O PPl S CI N 0 P 1E0(N2I
100 00o 00 Ooo 0 degdeg0oO0oVooo
90 00
0- 90 90 - 0 -0
0 0 s0 60 shy
70 00 - 70 70 shy
60 - S -S0t 60060 0 60
0 0 50 050 o shy00 50 0L 5 o shy0 50
r t o -00
0 -0 -- 0 400 0 -0 00 0 30 0
- 0
0o 0 30 - -00 300 -0
20 0 - shy 20 0 20
10010 T
0 t F F I Ft I to I
F I I F I I I I
0 050 100 150 200 250 0 050 100 150 200 n0 0 050 100 150 200 20
SPECI L0 P 118+lt2 DEPTH (IN)LLTRASONIC TST O No EPTH (IN IS C2fN LOP 102CLL-AOIC LVEL 50 SIrCNN LOP 1312ULTRASONICTEST MO NO aWC(c EEL050WI[EO4CE VLTRASOI4C TEST MEO NO 3LEVEL 950 COIIC~fCE LEVL 060
Figure V-8 Flaw Detection Probability for LOP Panels by the Ultrasonic Method PlOtted at 95
Probability and 95 Confidence
I 0 00 I 00
S90 O90
00 80 0
70 70 70
o~S o g so50 0 50 0 0 00 500
0
0 0 0 0
0 00 0 40
0 00 0 000 -- 000
o- 0 0 30 0 -0 1
0 0
tO 10
I I I -I 0 I I I I I I I0 50 100 200 o 5010 060 1 00 i 5o 2 0o 2 5o 0 50 MT 150 200 260
LENGTH IN LENH IN ISPICIMEN LOp I0112 LEOJOTHt INSPCINEN L 0 P 1184112 SPECIMEN LO P 1O8+1I
00 - I 0I 0o
00 60 0
0 70 70 70
6o 60 0 0 5060 50 01--00
0
50 0 0 -0-O40 0
0 0 0 00S
40 0 0 O -0 -0 - 02AD00 0 80 0I 000 0shy
0 shy20 - - 0- shy 20 - - 0 0 00 D- 2- - 0
0I Co - - 10110 shy 10 - shy 00
0 0 00 100 150 200 2500t 0 a050 000 160 200 MIT 0 060 100 ISO z00 200
DEPTH (INSPECIMEN LOP 11012 DEPTH (IN CpO IINlP I HEOY CURRENT TEST SEE NO I L 0 P 1OP 182COOSLOENE LEVEL - 950 EDDY CULREPNTTEST SE W 2 ECOSYCURENT TEST E0 NO ICWIDENEE LEVEE- 060 W20NnCE LEVEL- 95 0
Figure IV-9 Flaw Detection Probability for LOP Panels by the Eddy Current Method Plottd
at 95 Probability and 95 Confidence
I00
0S
80
70
0
50
0
0
000
0
0000 a 000
0 0
290
0
100
80
00
0
0 00
0 00
060
0shy
0
100
90
0
0 O0 O0 0 0 0
0
0 0
000
0-0
0
20cent 0
2002 so 50
30
0
30
0 0I I
301
0 0
20 20
0
10
o50
1 0o
-Zo
t I I 1 I
100 150
LENGTH (IN) SPE CIMEN LOP Iefta
2 0D 250
0
404
110
It
100
-00 0 100 150
IENTH I[N SPECIMlENLOP I0112
20
Io
250 4
0
0
IooD ---shy
0 50 I 0 150
LEWNGT IIN SPdegECIMENLOp 11011e
200 250
O0 0 0 D 0
5 50
40 0
00
-090 so- 40
0 s0 30
20 20
010 0
0
0 0
0-0 100 150 20 250 0 0D
DEPTH (IN)SoCIICN 10 P 0-I2 X-RAYTEST SC WO I COuIECE LEVEL -95 0
Figure IV-10 Flaw Detection Probability for LOP Panels by the X-Radiographic Method Plotted at 95Probabhllty and 95 Confidence
100 150
DEPTHI finSPECIMEN-0 P 181t2 X-RAYTEST SEENO 2 CONFIDECELEVELshy950
200 250 0
0 050 IO0 0S0
DEPTH (IN I SPECIMENLo P 110112 X-RAYTESTSE0 NO3 CONIECE LEVELshy950
200 250
V FATIGUE-CRACKED WELD PANEL EVALUATION
Welding is a common method for joining parts in pressure vessels
and other critical structural hardware Weld cracking in
structures during production test or service is a concern in
design and service reliability analyses Such cracking may be
due to a variety of conditions and prevention of cracking is
a primary responsibility and goal of the welding engineer
When such cracks occur their detection early in the hardware
life cycle is desirable and detection is the responsibility
and goal of the nondestructive test engineer
One difficulty in systematic study of weld crack detection has
been in the controlled fabrication of samples When known
crack-producing parameters are vaired the result is usually a
gross cracking condition that does not represent the normal
production variance Controlled fatigue cracks may be grown
in welds and may be used to simulate weld crack conditions for
service-generated cracks Fatigue cracks will approximate weld
process-generated cracks without the high heat and compressive
stress conditions that change the character of some weld flaws Fatigue cracks in welds were selected for evaluation of NDT methods
A program plan for preparation evaluation and analysis of
fatigue cracked weld panels was established and is shown
schematically in Figure V-1
A SPECIMEN PREPARATION
Weld panel blanks were produced in two different configurations
in 0317-centimeter (0125-in) and 127-centimeter (0500 in)
nominal thicknesses The panel material was 2219-T87 aluminum
alloy with a fusion pass and a single 2319 aluminum alloy filler
pass weld located in the center of each panel Five panels
of each thickness were chemically milled to produce a land area
one inch from each side of the weld and to reduce the thickness
of the milled area to one-half that in the land area The
specimen configuration is shown in Figure V-2
Starter notches were introduced by electrodischarge machining
(EDM) using shaped electrodes to control the final flaw shape
Cracks were then extended in fatigue and the surface crack
length visually monitored and controlled to the required final
flaw size and configuration requirements as shown schematically
in Figure V-3 The flaws were oriented parallel to the weld bead
V-1
NDT EVALUATION
X-radiography Dimensional Ultrasonic eDimensional Surface Finish Eddy Current Surface Finish
Measurement amp Penetrant Chemical Measurement amp
Preparation Documentation Penetrant Remoyal Etch pDocumentation
NDT EVALUATION
X-radiography Ultrasonic Eddy Current Proof Test Penetrant 90 of Yield Penetrant Removal Strength
NDT EVALUATION
X-radiography Ultrasonic e Fracture Specimens Eddy Current Penetrant Measure amp Data
Document Flaw Sizes TabulationPenetrant Removal
Figure V-1 NDT Evaluation Sequence for Fatigue-CrackedWelded Panels
-Flaw Location
6 in
40 in P4T H
_ _ _ _ 18 in Flaw Location-7 - Longitudinal Weld Panel T
12 Th40 in]
Figure V-2 Fatigue-Cracked Weld Panels
V-3
0250 0500 100
0114 0417 0920
01025
CASE 4 CASE 5 CASE 6
0110125 030
Note All dimensions
in inches
Figure V-3 Schematic Side View of the Starter Flaw and FinaZ Flaw Configurashytion for Fatigue-Cracked Weld Panels
v-4
in transverse weld panels and perpendicular to the weld bead in
longitudinal weld panels Flaws were randomly distributed in
the weld bead centerline and in the heat-affected zone (HAZ) of
both transverse and longitudinal weld panels
Initial attempts to grow flaws without shaving (scarfing) the
weld bead flush were unsuccessful In the unscarfed welds flaws
would not grow in the cast weld bead material and several panels - were failed in fatigue before it was decided to shave the welds In the shaved weld panels four of the six flaw configurations were produced in 3-point band fatigue loading using a maximum
bending stress of 14 x 10 Nm2 (20 ksi) Two of the flaw configurations were produced by axially loading the panels to obtain the desired flaw growth The flaw growth parameters and flaw distribution in the panels are shown in Table V-1
Following growth of the flaws panels were machined using a
shell cutter to remove the starter flaws The flush weld panel configurations were produced by uniformly machining the surface of the panel to the as machined flush configuration This
group of panels was designated as fatigue-crack flawed flush welds- Panels with the weld crown intact were produced by
masking the flawed weld area and chemically milling the panel
areas adjacent to the welds to remove approximately 0076 centimeters (0030 in) of material The maskant was then removed and the weld area hand-ground to produce a simulated weld bead configuration This group of panels was designated the fatigue-crack flawed welds with crowns 117 fatigue cracked weld panels were produced containing 293 fatigue cracks
Panels were cleaned and submitted for inspection
B NDT OPTIMIZATION
Following preparation of the fatigue-crack flawed weld specimens
an NDT optimization and calibration program was initiated Panels containing the smallest flaw size in each thickness
group and configuration were selected for evaluation and comparison of NDT techniques
1 X-radiography
X-radiographic exposure techniques established for the LOP
panels were verified for sensitivity on the fatigue crack flawed weld panels The techniques revealed some of the cracks and
v-5
ltTable V-i Parameters for Fatigue-Crack Growth in Welded Panels
CASE
STARTER DEPTH
DIM WIDTH
FINAL FLAW WIDTH
TYPE OF LOADING
STRESS KSI
STRESS CYCLES AVG)
PANELS FLAWS
4 025 114 250 Axial 24 190000 Transverse 45000 Longitudinal
5 025 417 500 3-Point 24 i00000 Transverse 60 13000 Longitudinal 12 inch
Panels 157
6 025 920 1000 3-Point 22 100000 Transverse 11000 Longitudinal
7 015 025 060 Axial 24 169000 Transverse 75000 Longitudinal
8
9
015
015
055
268
125
300
3-Point
3-Point
22
256
180000 Transverse 13000 Longitudinal b57
18 inch 60000 Transverse Panels 7000 Longitudinal
136
failed to reveal others Failure of the techniques were attributshy
ed to the flaw tightness and further evaluation was not pursued The same procedures used for evaluation of the LOP panels were
selected for all weld panel evaluation Details of this prodedure
are included in Appendix D
2 Penetrant Evaluation
The penetrant inspection procedure used for evaluation of
integrally stiffened panels and LOP panels was applied to the
Fatigue-cracked weld panels This procedure is shown in Appendix A
3 Ultrasonic Evaluation
Single- and double-transducer evaluation techniques at 5 10 and 15 megahertz were evaluated as a function of incident angle flaw signal response and the signal-to-noise ratio generated
on the C-scan recording outputs Each flaw orientation panel
configuration and thickness required a different technique for
evaluation The procedures selected and used for evaluation of
weld panels with crowns is shown in Appendix H The procedure selected and used for evaluation of flush weld panels is shown
in Appendix I
4 Eddy Current Evaluation
Each flaw orientation panel configuration and thickness also
required a different technique for eddy current evaluation The procedures selected and used for evaluation of weld panels with crowns is shown in Appendix J The spring-loaded probe
holder used for scanning these panels is shown in Figure IV-4
The procedure selected and used for evaluation of flush weld panels is shown in Appendix K The spring-loaded probe holder used for scanning these panels is shown in Figure IV-5
C TEST SPECIMEN EVALUATION
Test specimens were evaluated by optimized penetrant ultrasonic
eddy current and x-radiographic inspection procedures in three
separate inspection sequences After familiarization with the specific procedures to be used the 117 specimens were evaluated
by three different operators for each inspection sequence
V-7
Inspection records were analyzed and recorded by each operator
without a knowledge of the total number of cracks present or of the previous inspection results
1 Sequence 1 - Inspection of As-Machined Weld Specimens
The Sequence 1 inspection included penetrant ultrasonic eddy
current and x-radiographic inspection procedures
Penetrant inspection of specimens in the as-machined condition
was performed independently by three different operators who
completed the entire penetrant inspection process and reported their own results One set of C-scan ultrasonic and eddy current
recordings were made Tire recordings were then evaluated and
the results recorded independently by three different operators
One set of x-radiographs was made The radiographs were then
evaluated independently by three different operators Each
operator interpreted the x-radiographic image and reported his
own results
Inspections were carried out using the optimized methods establshy
ished and documented in Appendices A D H T J and K
2 Sequence 2 - Inspection after Etching
On completion of the first inspection sequence the surface of
all panels was-given a light metallurgical (Flicks etchant)
solution to remove the residual flowed material from the flaw
area produced by the machining operations Panels were then
reinspected by the optimized NDT procedures
Penetrant inspection was performed independently by three
different operators who completed the entire penetrant inspection
process and reported their own results
One set of C-scan ultrasonic and eddy current recordings were
made The recording were then evaluated and the results recorded
independently by three different operators One set of x-radioshy
graphs was made The radiographs were then evaluated by three
different operators Each operator interpreted the x-radiographic
image and reported his own results
Inspections were carried out using the optimized methods
established and documented in Appendices A D H I J and K
V-8
3 Sequence 3 - Postproof-Load Inspection
Following completion of Sequence3 the weld panels were proofshyloaded to approximately 90 of the yield strength for the weld This loading cycle was performed to simulate a proof-load cycle on functional hardware and to evaluate its benefit to flaw detection by NDT methods Panels were cleaned and inspected by the optimized NDT methods
Penetrant inspection was performed independently by three different operators who completed the entire penetrant inspection procedure and reported his own results One set of C-scan ultrasonic and eddy current recording were made The recordings were then evaluated independently by three different operators One set of x-radiographs was made This set was evaluated independently by three different operators Each operator interpreted the information on the x-ray film and reported his own results
Inspections and readout werd carried out using the optimized methods establishedand documented in Appendices A D H I J and K The locations and relative magnitude of the NDT indications were recorded by each operator and were coded for data processing
D PANEL FRACTURE
Following the final inspection in the postproof-loaded configurations the panels were fractured and the actual flaw sizes measured Flaw sizes and locations were measured with the aid of a traveling microscope and the results were recorded in the actual data file
E DATA ANALYSIS
1 Data Tabulation and Ordering
Actual fatigue crack flaw data for the weld panels were coded keypunched and input to a computer for data tabulation data ordering and data analysis operations Data were segregated by panel type and flaw orientation Table V-2 lists actual flaw data for panels containing fatigue cracks in longitudinal welds with crowns Table V-3 lists actual flaw data for panels containing fatigue cracks in transverse welds with crowns
V-9
Table V-2 Actual Crack Data Fatigue-Cracked Longitudinal Welded Panels with Crowns
PANEL CRACK CRACK CRACK INITIAL FINAL CRACK POSITION NO NO LENGTH DEPTH FINISH THICKNESS FINISH THICKNESS X Y
15 28 305 051 33 1240 50 1000 423 05 16 29 308 040 32 1220 42 0980 194 05 16 16 17
30 31 32
239 Z269 070
022
029
035
32 32 39
1220
1220
1240
42 42 56
0980
0980
11000
325 458 270
05
05
01 17 18
33 34
110
094 040 019
39 36
1240
1220 56 58
1000
0980 404 230
01
01 18 19P 19P 20 20
35 3b 37 38 39
100
050
050
099
107
019
010
010
026
032 -
36 49 49 37 37
1220
1220
1220
1220
12a0
58 64 64 54 54
0980
0970
0970
0980
0980
-404 180 348 173 304
01
01
01
05
05 20 40 095 025 37 1220 54 0980 432 05 21P 21 22 22 22 23 23 24
41 42 43 44 45 46 47 48
051
021
324
257
291
047
120
095
010
007
034
038
045
007
020
018
32 32 32 32 32 50 50 50
1230
1230
1240
1240 - 1240 1230 1230 1230
40 40 60 60 60-46 46 38
0980
0980
0990
0990
0990
0990
0990 0990
182 240 169 299 434 153 453 147
09
09
01
01
01
05
05
05 24 49 117 026 50 1230 38 0990 455 05 25P 25
50 51
050
040 010 020
54 54
1200 1200
44 44
0970
0970 240 361
09
09 26 26
52 53
079 072
026
026 48 48
1210
1210 30 30
0910
0910 209 390
05
05 27 27 28 28 28
54 55 5b 57 58
283
270
090
120
102
039
035
018
027
017
43 43 39 39 39
1220
1220
1240
1240
1240
44 44 38 38 38
0980
0980
1000
1000
1000
257 399 146 281 425
01
01
05
05
05 29 29 40
59 60 80
231
287
510
018
039
116
38 38 27
1220
1220
4670
38 38 28
0970
0970
4700
333 443 435
05
05
05 41 41
81 82
165
369 054 178
40 40
4710
4710 30 30
4710
4710 142 294
05
05 41 42 43 44
83 84 85 86
110
540
530
503
017
133 M155
154
40 -64 51 45
4710
4680
4680
4700
30 24 60 48
4710
4700 4710 4700
427 355 402 226
05
05 09 01
45 87 480 093 43 4710 55 4720 298 05 46 47
88 89
506 1188
124
215 58 57
4680
4700 70 54
4720
4710 430 288
05 05
48 49 50
90 91 92
984
512
494
131
153
103
54 53 47
4700
4710
4680
42 38 48
4720
4710
4700
383 413 249
05
01
05 51 93 995 173 47 4710 45 4720 172 09 52 94 981 108 57 4610 60 4640 300 05 53
215 95 105
498
112 103 023
61 15
4700
1010 58 20
4700 0990
309 141
09 05
215 218 716 713
1
106 107 112 113 201
049
284
990
493
560
007
032
160
116
045
15 45 22 46 -0
1010
1000
4480
4500
20 28 25 30 0
0990 0980 e4580 4530
323 195 178 392 217
05
05 09 09
-0 1 202 157 023 -0 -0 320 -0
v-lo
Table V-2 (Concluded)
2 03 043 009 -0 -0 2 09 -1 2 204 104 023 -0 -0 355 - 2 205 072 015 -0 -0 444 -03 206 622 034 -0 -0 208 -0 3 207 1696 084 -0 -0 361 -0 4 208 129 029 -0 -0 151 -0 4 209 139 036 -0 -0 268 -0 4 210 249 055 -0 -0 364 -0 1 214 560 045 -0 -0 217 -0 1 215 157 023 -0 -0 320 -0 2 216 043 009 -0 -0 209 -02 217 104 023 -0 -0 355 -0 2 218 072 015 -0 -0 444 0 3 219 622 034 -0 -0 208 -0 3 220 1692 084 -0 -0 361 01 4 221 129 029 -0 -0 151 -0 4 222 139 036 -0 -0 2i68 -0 4 223 249 055 -0 -0 364 -06 252 368 076 -O - 310 -0 6 253 276 074 -0 -0 433 -0 7 254 181 048 -0 -0 168 -0 7 255 417 117 -0 -0 296 -07 256 273 059 -0 -0 442 -0
11 260 160 033 -0 -0 133 -0 11 261 270 065 -0 -0 302 -0 ill 262 305 087 -0 -0 A 438 -0 6 264 368 076 -0 -0 310 -06 265 267 074 0 -0 433 -0 7 266 181 048 -0 -0 168 -0 7 267 417 117 -0 -0 296 -0 7 268 273 4059 -0 -0 442 --0
11 272 160 033 -0 -0 133 -0 11 273 270 065 -0 -0 302 -0 11 274 305 087 -0 -0 438 -0
v-I
Table V-3 Actual Crack Data Fatigue-Cracked Transverse Welded Panels with Crowns
PANEL COACK CIACK CACK TNTTTkL FINAL CRACK POSITION
NO Vo LNGTH DEPTH FINISP THICKNFSS FINISH THICKNFSS X Y
I I 047 o015 48 122G 60 0960 09 617
1 2 067 PI9 43 12P 60 0960 09 773
2 3 067 017 44 1220 60 0983 C5 636
2 4 035 i3 44 1220 60 0980 05 665
3 3
5 100 103
C21 024
59 59
123C
1230 58 F8
0990 0990
05
05 433 840
4 7 039 310 39 i27C 50 1000 05 620
4 a 163 517 39 123 50 1000 05 700
5 3 1plusmn1 23 67 1220 62 0980 05 756
6 6
10 I
014 128
q38 021
51 51
1220
1220 54 54
0990
0940 01 0
483 786
7 12 292 145 53 1220 658 09 05 531
8 13 286 039 43 1230 62 0970 05 403
6 14 295 039 43 1230 6 0970 05 620 15 282 03 43 123C E2 0970 05 822
9 9
1 17
966
067 [13 C20
44 44
1220
1220 56 56
0990
0990 09 09
503 629
9 10
18 is
057
172 [13 022
44 55
1220
1230 56 46
3990
0980 09 05
757 465
10 11 11
20 21 22
306
2R3
273
04R C043
C41
55 43 43
1230
123C
1230
46 46 46
0960
0990
0990
05
05
05
760 509 856
12 23 279 01 2 122n 43 1o00 09 806
13 24 065 029 39 1220 52 0980 05 512
13 13 14 30 31 32 32
25 2E 27 61 62 63 64
061
657 101
1032 493 234 397
04
030
13
151 083 057 147
33 39
44 63 33 52 52
M1220 1220 1242 463i 467C 46F0 46Ef
52 52 46 50 26 34 34
1950
0938
0990 4680 4633 4660 4660
C5
05
09
u5
09
05
05
658 804 670 612 498 694 831
33 65 1435 35 61 471n 33 4700 05 50
34 66 49B 122 53 4730 26 4660 05 490
35 67 976 136 53 4690 42 4760 05 654
35 36 36
6B 69 70
941
478
478
109
107 -I16
53 64 64
4690
4690
4690
42 43 48
4760
4710
4710
05
O5
05
1071 420 894
36 37
71 72
471 35
130 147
64 51
4690
4680 48 46
4710
4700 05 09
1371 507
37 73 992 129 51 4680 46 4700 01 1113
38 38
74 75
930 1085
13 169
66 66
462C
4620 60 6C
4680
4680 05 05
458 845
38 76 1376 174 66 4620 60 4680 05 1259
39 39
77 78
519
493 091 n94
56 56
4680 460
55 55
4670
4670 01 01
440 906
39 79 482 085 56 4680 55 4670 09 1384
54 54 54
96 97 98
11
123
112
018
036 01a
43 40 40
422C
422C
4220
46 46 46
0980
0930
0930
01
01
09
461 686 911
55 55 55
113 113
93 100 101 132 103
260
126
148
229
274
045
24 G029 345 035
35 35 35 46 46
4250
425
425C
100
100
36 36 36 22 22
1010
Ii0 1010 098 0983
05 05 35 09 09
438 638 942 532 717
113 505
104 109
288
513 041 122
46 19
100
465 22 30
0990
4E70 Gg9
05 973 958
506 506
8
110 111 257
485
454
233
093
087
066
22 2 -13
4300
4300 24 24 -0
4500
4500 09 01
-0
418 927 C50
8 258 065 015 -1 - - 890 8 259 152 040 -0 4 -O -3 1160
8 269 233 066 -0 -0 -0 650 3 270 065 015 -0 -0 -0 890
9 271 152 040 -0 -0 -0 1160
ORIINALPAV IS
v-12 -t3r--plusmn U11QU7Uzfy
Table V-4 Actual Crack Data Fatigue-Cracked Flush Longitudinal Welded Panels with Crowns
PANEL NO
CRACK NO
CRACK LENGTH
CRACK DEPTH
INITIAL FINISH THICKNESS
FINAL FINISH THICKNESS
CRACK POSITION X v
8 8
501 562
07a
U45 00 o9
30 3u
1080 i08j
20 20
1083
1086 152 258
05
U5 8 8
503 504
63
U88 14 025
30 30
iplusmno86 1080
20 20
1j80 1080
368 437
05
05 10 U0 11 i1 11 11 12 12 12
505 506 57 5a8 509 Siu 511 512 513
083
37 V543
u 7 2
085
073
396
337
347
017
o09 021 a15 Li13
21
058
058
056
15 15 35 35 35 35 lo 10 16
040 i04t 109u 19 1090 1090 j8G 108L 1080
20 20 28 28 28 28 3U 30 30
1j90 1091 1120 1120 1123 112o 093i 093J 593G
219 448 238 316 383 414 169 245 352
65
J5 c01
69
01
09 05 05 5
1 15 15
514 515 516
324
089
a93
n43
024
020
10 13 13
iJ~B 1080 1083
3a 36 36
093i
110
1Lia
433 289 374
U5 5 05
15 plusmn8 18
517 518 519
075 123 G664
015
030
aW14
13 14
1080
107
107C
36 20 20
100
1100
10
438 195 254
05
59 9
18 18 19
520 521 522
j60
068
353
U16
013
058
L4 14 18
li70t 107o
1080
20 2a 30
110
1160
1120
331 397 153
aol 05 05
19 19 24 24 27
523 524 525 526 527
323
56
073
150
212
044
012
014
045
039
18 18 11 11 34
1080 1U8U 1o00 ldO6 1080
30 30 25 25 28
1124
112
1040
1040
1050
316 485 303 449 16
5S 05 i5 65 09
27 27 27
528 529 530
343
271
283
058
46
051
34 34 34
108o plusmn08W 1ae
28 28 28
150
1050
1050
228 303 406
c51 09 9
950 954 950 950
531 532 533 534
348
343
378
337
053
C65
t53 B06C
12 12 12 12
0930
0934
0930 U93U
36 36 36 36
1000 100d 10o loo
215 295 253 345
01
41
U9
o9 951 951
535 536
157
339 021 049
21 21
11plusmn0
1plusmn10 26 26
1000
10Ga 128 262
s5 US
951 30 30 30 30 34 34 34 34 35
537 538 539 540 541 542 543 544 545 546-
300
228
194
191
193 5C6
708
630
5u2
425
42
084
086
070
71
138
199
179
151 W3
21 21 21 21 21 16 16 16 16 23
1110
435i
435o
4353
435Q
44J0
4400
4466
4406
4450
26 20 20 20 29 18 18 18 plusmn8 28
1060
4350
435Q
4350
4350
4400
4400
4400
4400
440Z
363 129 211 362 480 135 238 376 473 93
05
01
09
29
l
69
01 L1
9
0
v-13
Table V-4 (Concluded)
35 35 35
36 36 36 37 37 37 37 38 38 39 39 39 39 41 41 41 41 42 42 42 42 43 43 43 43 44 44 44 44 45 45 45 45 47 47 47 48 48 48 49 49 49 49 50 50 50 so 51 51
547 548 549
551 551 552 553 554 555 556 557 558 559 563 561 562 563 564 565 566 567 568 569 570 571 572 573 574 575 576 577 578 579 583 581 582 583 58 585 586 587 588 589 590 591 592 593 594 595 596 597 598
598
513
446
1009 1176 1562 542 606 447 526
1037 1224 744 937
1098 793 13U 221 224 12j 280 274 319 280 217 251 161 106 210 196 264 136 149 149 148 127 760
11plusmn9 770 895 1289-1110 091 379 392 10 428 479 678 417 1061 1088
13d
103
071
193
215
276
153
178
115
162
161
213
119
187
239 106 U30 071 66 33 113 164 079 097 067 086 043 08 065 057 095 037 040 035 031 029 120 227 120 143 229 214 021 170 182 amp21 Q70 U95 178 079 195 207
23 23 23
14 14 14 14 14 14 14 L8 18 21 21 21 21 14 14 14 L4 26 20 20 20 2 2 2U 20 13 13 13 13 21 21 21 21 15 15 15 15 15 15 22 22 22 22 14 14 14 14 21 21
4450
4450
4450
4450
4450
4450
4430
443i
4430
4430
4436
4430
4430
4430
443C
4430
4370
4370
4370
437u
4460
4460
4460
4460
4 4 8 1
4480
48C
4480
4460
446Z
4460
4460
445j
4450
4450
4450
4460
446
446u
446C
4460
4466
447C
4470
447D
4470
4450
445b
445a
4450
447C
447i
28 28 28
24 24 24 20 20 2 20 18 18 3 30 30 30 i5 i5 15 i5 18 18 18 18 24 24 24 24 28 28 28 28 26 26 26 26 16 16 16 20 20 20 18 18 18 18 25 25 25 25 30 30
4400
4400
4415C
442o
4420
4424
4420
4420
4420
4420
4440
444i
4410
4410
4410
441C
439V
4390
439i
4390
445Q
4450
4450
4+5e
4460
4466
4460
4460
4450
4450
4450
4456
445a
445amp
445r
4450
4450
4 45 L
4450
4450
4450
4450
4470
4471
4470
4470
443a
4430
4430
4430
445e
4450
22b 348 483
116 290 458 192 192 297 300 179 49 190 196 428 440 107 252 372 487 13 204 343 463 128 286 423 513 161 27 386 491 205 304 417 494 183 233 391 138 287 443 225 225 373 375 118 143 367 48f 177 413
65
05
Q5
05
05
05
uI
09
01
09
05
05
1i
09 01 09 05 05 L5 5 j5 05 05 65 05 C5 k5 05 05 05 05 05 69 01 01 09 9 1 -9 05 05 05 0plusmn 09 09 31 05 05 05 05 5 05
52 52 53 53 53 53
500 500 50 510
9 9
599 600 6051 602 603 604 605 606 6W 608
701 702
879 1043 479 565 616 433 139 229 218 190
089 9-0218108
154
215
109
137
155
083
036
08a
059
055
04shy
330
45 45 30 30 3a 30 22 22 22 22
o -
4450
4450 450O 450u 4500 4500 438C 438U 4 3 8u 438o
40 40 22 22 22 22 32 32 32 32
-0
4430
443a
45a0
45JO
4504
4500
4400
44LO
4400
4400
184 393 109 222 342 481 121 229 314 462
218422
05
05
05
05
05
05
65
45 L5
05
G
10 703 073 015 -G -o0 194 -0 plusmn0 9
704 705
113
089 031 o14
-0 -a
4 -0 -0
399 218
-0 -0
9 706 108 036 -4 -0 422 -0 10 7a7 073 015 -g -0 194 0 t0 708 113 031 -0 -0 4 399 -0
V-14
Table V-5 Actual Crack Data Fatigue-Cracked Flush Transverse Welded Panels
PANEL CRACK CRACK CRACK INITIAL FINAL CRACK POSITIONNO NO LENGTH DEPTH FINISH THICKNESS FINISH THICKNESS X Y
960 609 138 059 20 432C 26 4430 05 694960 610 178 066 20 4320 26 4436 05 792960 611 2Z4 -069 20 432C 26 4430 05 924960 612 3C8 124 20 4320 26 443 G 05 1G30960 613 224 679 20 432U 26 443Z 05 1115960 614 235 089 20 420 26 4430 05 1210961 615 178 054 16 4410 I8 4420 05 583961 616 495 215 16 441G 18 4420 05 701961 617 195 07B 16 4416 18 4420 05 83961 618 182 f67 16 441L 18 4420 05 958961 619 235 099 16 4410 18 4424 05 11o5961 620 297 071 16 4410 18 4420 05 1236962 621 2E7 115 15 456C 20 453a 05 686962 622 225 1plusmn0 15 4560 20 4530 05 758962 623 239 1L3 15 4560 20 4530 -05 871962 624 158 050 15 4560 20 4530 05 994962 625 186 063 15 4560 20 4533 35 1069962 626 160 049 15 4560 20 4530 05 1206
Table V-4 lists actual flaw data for fatigue cracks in flush
longitudinal weld panels Table V-5 lists actual flaw data for fatigue crack in flush transverse weld panels
NDT observations were also segregated by panel type and flaw orientation and were tabulated by NDT success for each inspection
sequence according to the ordered flaw size A 0 in the data tabulations indicates that there were no misses (failure to d~tect) by any of the three NDT observers A 3 indicates that
the flaw was missed by all observers A -0 indicates that no NDT observations were made for that sequence Table V-6 lists NDT observations as ordered by actual flaw length for panels
containing fatigue cracks in longitudinal welds with crowns Table V-7 lists NDT observations as ordered by actual flaw length for panels containing fatigue crack in transverse welds with crowns Table V-8 lists NDT observations as ordered by actual flaw length for fatigue cracks in flush longitudinal weld panels Table V-9 lists NDT observations as ordered by actual
flaw length for fatigue cracks in flush transverse weld panels
Actual flaw data were used as a basis for all subsequent ordering
calculations analysis and data plotting Flaws were initially ordered by decreasing flaw length depth and area The data were then stored for use in statistical analysis sequences
2 Data Analysis and Presentation
The same statistical analysis plotting methods and calculations of one-sided confidence limits described for use on the integrally stiffened panel data were used in analysis of the fatigue flaw detection reliability data
3 Ultrasonic Data Analysis
Initial analysis of the ultrasonic testing data revealed a disshycrepancy in the data Failure to maintain-the detection level between sequences and to detect large flaws was attributed to a
combination of panel warpage and human factors in the inspections To verify this discrepancy and to provide a measure of the true
values 11 additional fatigue flawed weld panels containing 27
flaws were selected and subjected to the same Sequence 1 andSequence 3 inspection cycles as the completed panels An additional optimizashy
tion circle performed resulted in changes in the NDT procedures for the
weld panels These changes are shown as Amendments A and B to the
Appendix procedure The inspection sequence was repeated twice (double inspection in two runs) with three different operators making their shy
V-16
Table V-6 NDT Observations Fatigue-CrackedLongitudinal Welded
Panels with Crowns
PENETRANT ULTRASONIC EDDY CURRENT X-RAY
INSPECTION SEQUENCE 1 -2 3 1 2 3 1 2 31 2 3
CRACK A NUMBER VALUE
207 1696 -o -o -o 0 -0 0 -o -0 -0 -o -o -o 220 1692 -o -o -o o -o 0 -o -o o -o -0 -o 89 1188 1 0 0 2 0 0 2 0 3 1 0 0 93 995 0 0 0 1 1 0 2 1 3 0 0 0
112 990 1 2 0 0 0 3 0 3 3 1 1 0 90 984 0 0 0 3 3 1 1 3 3 3 3 0 94 981 0 0 0 2 2 0 -1 1 0 3 3 0
219 622 -0 -0 -0 0 -0 0 -0 -0 -0 -0 -0 -0 206 6221-0 -0 -00 -0 0 -0 -0-0 -0 -0 -0 201 560 -0 -0 -0 0 -0 0 -0 -0 -0 -0 -0 -0 214
84 560 540
-0 2
-0 1
-0 2
0-0 2 0
0 0
-0 1
-0-o 0 0
-0-0 2 3
-0 3
85 |530 1 1 0 3 3 0 2 1 3 3 3 0 91 80
512
510 0 1
0 2
0 0
2 2
2 2
0 0
2 1
3 3
3 1
3 3
3 3
0 3
88 506 1 0 u 3 3 3 1 0 2 3 3 0 86 503 0 2 0 2 3 3 3 3 3 1 0 0 95 498 0 0 0 0 0 0 2 3 0 0 0 0 92 494 1 1 0 3 -3 3 0 0 0 3 2 3
113 87
493 480
0 03
0 0
0 0
0 0
0 0
0 0
3 0
3 0
3 0
0 3
3 1
3 0
255 267
417 417
-0 -0 o0-0-
-0 0 -0 0-0
0 0
-0 -0
-0 -0
-0 -0
-0 -
-0 0
-0 -0
82 369 0 0 0 0 1 0 0 0 0 i 0 264 368 -0 -0 -0 0 -0 0 -0 -o -o0 -0 -0 -0 252 43
368
324 -0
2 -0
2 -0
0 0 3
-0 0
0 1
-o 3
-o 3
-0 3
-0 1
-O 0
-o 1
29 J28
308
305 1 2
1 1
0 0
3 3
0 3
0 2
2 3
0 3
0 3 3
1 2
0 1
262 305 -0 -0 -0 0 -0 0 -0 -0 -0 -0 -0 -0 274 305 -0 -0 -0 0 -0 0 -0 -0 -0 -0 -0-0 45 60
291 I287
2 1
1 1
0 0
3 0
0 0
0 0
3 0
3 0
3 3
3 3
0 3
0 3
107 284 1 1 0 0 0 0 0 0 0 2 2 0 54
253 283 0 276 -0
1 -0
U -0
3 0
2 o
3 1 -0
3 -0 -0
3 -0
3 2 -0 -0
268 273 -0 -0 -0 3 -0 0 -0 -0 -0 shy 0 -0 -0 256 2731-0 -0 -0 3 -0 0 -0 -0 -0 -0 -0 -0 261 270 -0 -0 -0 0 -0 0 -0-0 -0 -0 -0 -0 273 270 -0 -0 -0 0 -0 0 -0 -0 -0 -o0-0 -0 55 270 0 1 0 2 2 3 2 3 3 3 3 3 31
265 269 267
2 -0
1 -0
0 -0
3 0
3 -0
0 0
1 -0
3 -0o
3 - 0
2 -0
1 -0
0 -0
44 _257 2 2 0 3 0 0 3 3 3 a 0 o
V-17
Table V-6 (Concluded)
CK ACT NO VAL 1 2 3 1 -2 1 2 3 1 2 3
210 223
249
249 -0 -0
0 -0
-0 -0
0 0
-0 -0
0 0
-0 -0
-0 -0
-0 -0
-0 -0
-( -0 -0 -0
30 239 3 0 0 2 0 0 2 3 3 2 2 0
59 254
231
181 1
-0 2
-0 3 -0
1 1
0 -0
0 0
2 -0
3 -0
3 -0
3 -0
3--0
0 -0
266 181 -0 -U -U 1 -0 0 -0 -00 - -0 0 -0 81 165 0 0 0 0 0 0 2 0 0 2 3 3
260 160 -0 -0 -0 0 0 0 -0 -0 -0 -0 -0 70
272 160 -0 -0 -0 0 -0 0 -0 -0 -0 -0 -0 -0 215 157 -0 -0 -0 0 -0 0 -0 -0 -0 -0 -0 -0
202 157 -0 -0 -0 0 -0 -a -0 -0 -0 -0 -0-0
222 209 208-L21 47
139 139 e129 129 120
-0 -0 -0 -0 0
-0 -0 -0 -0 -0 -0 -0 -0 1 0
0 0 0 0 3
-0 -0 0 -0 3
0 0 0 0 3
-0 -0 -0 -0 1
-0 -0 -0 -0 3
-0 -0 -0 -0 0
-0 -0 -0 -0 2
-0 -0 -0 -0 2
-0 -0 -0 -0 2
57 o120 0 3 3 1 1 3 1 2 2 3 1 3
49 117 0 1 0 2 3 0 2 3 2 3 3 3
105 112 0 3 0 0 1 0 0 3 3 3 3 3
33 110 0 0 0 1 1 0 2 3 3 3 3 2
83 110 -0 0 0 1 3 3 2 0 0 3 2 2
39 217
107
164 0
-0 0
-0 1
-0 3 0
3 -0
3 0
3 -0
3 -0
3 -0
3 -0
2 -0
2 -0
204 58
104
102 -0 0
-0 3
-0 3
0 3
-0 3
0 3
-0 2
-0 3
-0 2
-0 3
-0 3
ro 3
35 100 0 0 1 2 2 2 1 Q 0 2 2 3
38 099 0 1 1 3 3 2 3 0 2 3 1
48 40
095
095 2 0
1 0
0 0
3 1
3 1
0 1
3 1
3 3
1 0
2 2
3 2
3 2
34 094 0 0 0 1 3 3 1 1 0 3 3 3
56 090 0 3 3 1 3 3 1 1 1 3 3 3
-52 53
205 218
079 072 072 072
1 1
-0 -0
1 1
-0 -0
0 0
-0 -0
0 0 0 0 3 -0
3 0
0 0 0 0
2 1 -0 -0
3 -0 3 -0
-0 -0 -0 -0
0 0
-0 -0
2 1
-0 -0
0 0
-0 0
32 070 0 0 0 2 0 2 3 0 3 3 3 3
41 051 0 0 0 3 3 3 3 3 3 3 2 2
36 050 1 0 0 1 3 1 1 3 2 3 3 3
37 050 3 1 z 2 1 2 2 3 3 3 3 2
50 050 0 1 1 3 3 3 3 3 3 1 2 3
106 049 1 3 3 3 1 0 3 3 3 3 3 3
46 216 203
047 043 043
3 -0 -0
3 -0 -0
3 -0 -0
L3 3 3
3 -0 -0
3 0 0
1 -0 -0
3 -0 -0
0 -0 -0
3 2 0 -0-0
-0 -0
2
-0
51 040 0 1 1 3 3 3 2 3 3 2 2 3
42 021 0 0 0 3 3 3 3 3 3 3 3 1
V-18
Tab e V-7 NDT Observations Fatigue-CrackedTransverse WeZded
Panels with Crowns
PENETRANT ULTRASONIC EDDY CURRENT X-RAY
INSPECTION SEQUENCE 1 2 3 1 2 3 1 2 3 1 2 3 CRACK ACTUAL NUMBER VALUE
E 3 0 0 0 0 0 0 n 0 0 a a 75 1085 0 0 0 0 0 0 0 1 3 3 2 76 61
0 7 102
G0 c
C C 0 0
0 0
1 a
0 0
3 2 3
-2 0
73 992 0 0 1 0 4 0 2 3 72 935 0 0 0 - 0 1 0 0 0 0 0 1 67 97 C 0 a 0 0 C 0 3- 3 2 66 74
941 930
0 3 0
3 1
1 0
0 0
0 a
0 0
1 0 C
a 0
3 3
3 3
3 3
77 10O
5t9
513 a 0
0 0 080
1 0 0 0 0 a
0 a
3 3
31 3
3 2
79 0 a a 3- 3 66 62
43F
493 0 0
0 0 0a
3 2 3
7 3
0 0
0 3
0 3
3 3
1 1
3 3
11G 4 0 0 i 1 C 3 0 0 0 3 1 2 79 482 0 0 C 2 G 3 1 C 1 3 3 3
S 478 0 0 0 1 0 0 0 0 0 3 3 3 70 71
478
41 0 0
C C
I 2
0 0
-1 0
fl 2
p 1 2
0 3
g-3
0 3
11 454 a a a 0 1 -3 0 0 3 1 2 64 337 0 G 1 2 3 3 0 0 0 2 3 3 20 14
30F
295 0 0
C 0
0 0
I 0
G 0
0 0
1 1
0 0
2 0
0 1
0 I
0 0
- 12 1-6 4
292 282 C
0 0 0
C 0
a 0
0 0
0 0
0 C
0 3 0
3 2-
0 2
0 0
17 23F 0 0 0 0 0 0 plusmn 0 0 2 0 1 21 283 1 0 0 1 0 3 1 3 n 2 3 0 1- 292 0 0 0 3 0 0 1 0 G 2 1 G 23 279 0 0 0 1 0 0 0 1 1 3 3 2
101 274 0 a 0 0 0 0 0 0 0 1 plusmn 0 22 273 0 00 3 0 - 0 3 0 0 0 g 21 1 0 0 0 1 a 9 a a
267 73
23 0
-3
-0 1
-3 2 0
3 -0
3 0
0 -0
0 -0
0 -0
3 -0
3 -0
3 -0
269 102
233-0
29 0 -0
0 -0
n 0 0
-0 0
G 0
-0 0
-0 1
- C
-0 2
-D -n 2 0
I 172 1 0 0 I G 0 a a 0 3 2 3 211 E -0 -0-0 C-U-0-0 C -0 -G -0 -0
V-19
Table V- (Concluded)
CK ACT NO VAL 1 2- 3 1 2 3 1 2 3 1 2 3
229 152 -p -o-- Q - -C -0 -0 -0 -0
271 152 -0 -0 0-0 a -0 -c -0 -0 -0 -0 101 148a 0 1 0 2 0 C 3 1 3 -3 2 11 12B o 0 0 0 0 plusmn 3 0 3 2 3 3
i0a 126 a 1 0 1 0 1 0- 3 2 2 9 123 0 3 3 2 3 3 3 0 2 3 3 3
225 123 -0 -0 -0 3 -0 0 -0 -0 -0 -0 -0 -0 212 123 -0 -0 -0 1 -0 0 -0 -0 -0 -0 -0 -0 ge 113 0 3 3 3 3 2 2 2 3 3 3 plusmn 98 il a 3 3 1 1 0 3 2 2
g 111 3 2 1 3 3 3 2 0- 0 3 3 2 10
6 iOC102
3 0
00
C0
1plusmn
30
30
2plusmn
22
32
34
32
33
27 101 0 1 0 3 3 3 2 3 1 2 3 3 5 1-0 c 0 3 3 2 2 2
21 093 1 --shy 0 - -0 0 -0-0 -0 -0 -0 -0 2262
093
067 -C
0 --
P -
2 -1--0
0 0 -0
3 -0 -0
72 -
-0
3 -0
plusmn
3IE 057GEE 00
02
02
3
33
33
33
11
32
33
32
33
259 065 -0 -0 -0 2 -0 0 -0 -0 -G -c -0 -0 270 065 -0-0-0 3-0 0 -0-0-0 -0-0-a
24 069 0 1 a a 0 3 1 3 1 plusmn 2 a 8 063 0 plusmn1 3 3 3 3 c 2 3 3 2
25 061 C 1 0 1 0 0 2 3 3 1 2 1 18 057 1 0 3 3 3 2 7 3 3 3 3 26 057 0 1 2 C 0 a j 3 3 1 2 a 17 047 0 2 2 3 2 3 3 1 2 3 3 3
1 047 2 2 2 3 3 3 3 3 3 3 2 3 7 070 3 2 2 2 0 0 3 3 0 3 2 3 4 0 2 0 0 1 0 0 3 2 0 2 3 2
V-20
Table V-8 NDT Observations Fatigue-Cracked Flush Longitudinal
Welded Panels
PENETRANT ULTRASONIC EDDY CURRENT X-RAY
INS PECTXON SEQUENCE 1 2 3 1 2 3 1 2 3 1 2 3
CRACK ACTUAL NUMBER VALUE
552 1562 0 0 0 0 0 1 0 0 0 0 0 0 5618T 1289 1 0 0 0 0 0 0 0 0 0 0 0 558 1224 0 0 0 0 0 0 1 0 0 0 0 0 551 1176 0 0 0 0 0 0 0 0 0 0 0 0 584 1119 0 0 0 0 0 0 0 0 0 0 0 0 588 1110 1 0 0 0 0 0 0 0 0 1 0 0 561 1098 0 0 0 0 1 0 0 0 0 0 0 0 598 1088 0 0 0 0 0 0 0 0 0 0 0 0 597 I061 0 0 0- 0 0 0 0 0 0 0 1 0 600 1043 0 0 0 0 0 0 0 0 0 0 0 0 557 1037 0 0 0 0 0 0 0 0 0 0 1 0 550 1009 0 0 0 0 0 0 0 0 0 0 0 0 560 937 0 0 -0 0 0 0 0 0 0 3 3 0 586 895 1 0 0 0 0 0 0 0 0 0 0 0 599 879 0 0 0 0 0 0 0 0 0 0 0 0 585 770 0 0 0 0 0 0 0 0 0 3 2 0 583 760 0 0 0 0 0 0 0 0 0 3 3 0 559 744 0 0 0 0 0 0 0 0 0 0 0 0 543 708 1 0 0 0 0 0 0 0 0 0 0 0 562 703 0 0 0 0 0 0 0 0 0 3 3 3 595 o678 0 0 0 0 0 0 00 0 0 1 1 0 544 630 0 0 0 0 0 0 0 0 0 0 1 0 603 616 0 0 0 0 0 0 0 0 0 0 0 0 554 606 0 0 0 0 1 0 0 0 0 3 3 O 547 598 0 0 0 0 0 0 0 0 0 0 2 0 602 565 0 0 0 0 0 0 0 0 0 1 0 0 553 542 0 0 0 0 0 0 0 0 0 -1 0 556 526 0 0 0 0 1 0 0 0 0 2 3 0 548 513 0 0 0 0 0 0 0 0 0 3 3 0 542 9506 0 0 0 0 0 0 0 0 0 2 2 0 545 502 0 0 0 2 1 0 0 0 0 3 3 1 594 o479 0 0 0 0 1 0 0 0 0 3 3- 0 601 479 0 0 0 0 0 0 0 0 0 3 1 0 555 o447 0 0 0 0 0 0 -0 0 0 2 3 0 549 446 0 0 0 0 0 0 0 0 0 3 -3 3 604 433 0 0 0 0 10 0 0 0 0 2 3 3 593 428 0 0 0 0 0 0 0 0 0 3 3 0 546 426 0 0 0 0 0 0 0 0 0 3 3 0
V-21
Table V-8 (Continued)
CK-NO
AcVAL 2 3i 1 2 3 1 2 3 1 2 3
596 417 0 0 0 0 0 0~ 0 0 0 3 3 511 396 0 0 0 0 0 0 0 6 0- 1 00 591 392 0 0 0 0 2 0 0 0 0 -o0 0 590 379 0 0 1 0 2 2 3 3 0 1 -3 3 533 9378 0 -0 0 0 0 0 0 0 0 0 0 522 353 0 0 0 0 0 0 0 0 0 1 10 531 348 0 0 0i 0 0 0 0 0 0o 0 0 0 -513-528 347343 0 o 00 010 00I 0 0 0 0 0 0
0 00
0
532 343 0 0 0 0 0 0 00 0 0 0 0 536 339 0 0 0 0 0 0 0 0 0 3 2 0 512 -534
w337 337
0 0
0 0
0 0
0 0
0 0
0 0
- 0 0
0 -0
0 -1
-0 0 0
0 0
514324 523 323
0 0
0 0
0 0
0
0 0
0 0
0 0
0 0
0 0
A0 0
0 1
0 0
569 319 0 0 0 0 0 0 0 0 0 -3 2 3 537 300 o 0 0 0 0 o- 0o b - - 3 3 0 530 283 0 0 0- 0 1 0 o o -3 0 0 -567 280 0 1 0 0 0 0 0 0 0 0 1 3 570- 280 0 0 0 -0 1 0 0 0 0 -3- 3 2 568 274 0 -0 o 0 0 0 0 -0 o2 1 3 529 271 0 0 0 0 0 0 -O 0 0 3 0 0 577 264 0 0 0 0 o o o o 3 2 2 572 251 0 0 0 0 0 0 0 0 0 3 3 3 606 229 0 1 1 0 0 a 0 0 0 2 2-3 538 228 O0-shy 0 0 0 0 0 0 0 3 -3-3 565 224 0 0 o 0 0 0 0 0 0 2 3 shy564 221 607 218
0 0
0 0
0 0 -
0 0 o0
0 0
0 0
0 0
0 0
3 3
1 3 33
571 217 0 0 0 0 6 0 0 0 0 3 3 3 -527 212 0 0 0 0 0 0 1 0 0 3 -3 -shyl -575 576-
210
196 0 0
0 0
0-0
0 0
0 0
0 0
0 0 - 0
00 -
shy 3 3
-3 3
-3
539 541
194
193 0 0
0 0
0 0
0 -0 0 0
0 0
0 0
0 0
0 0
1 3
3 3
2 -3
540 191 0 0 0 A 0 0 0 0 0 2 3 3 608 190 0 0 1 0 0 2 0 0 0 3 -3 3 573 161 0 0 0o3 3- -3 0 0 0 2 3 3 535 157 0- 0-0 0 0 0 0 3 33 3 0 524 156 0 0 0 0 0 0 3 3 3 3 3 -3 526 150 0 0 0 -3 0 o 0 0 0 3 2 1 580 149 0 0 0 0 0 0 0 0 0 3 3 0 579 149 0 o 2 1 1 0 0-3 0 0 0 0
Table V-8 (Concluded)
CK ACT3 NO VAL 1 -2 3 1 2 3 1 2 3 1 2 3-
581 148 0 0 0 0 0 0 0 0 0 3-3 3 605 9139 u 0 0 0 0 3 0 0 0 93 578 136 0 1 3 0 0 0 0 U 0 3 3 3 563 130 Q 2 3 0 0 0 0 0 0 3 3 582 127 0 0 0 3 1 3 0 1 0 3 3 3 566 120 0 0 0 0 0 0 0 0 0 2 3 2 518 120 0 0 0 3 0 0 0 0 0 3 2 1 704 113 -0 -0 -0 0 -0 0 -0 -0 -0 -0 -0 -0 708 113 -0 -0 -U 0 -0 0 -0 -0 -0 -0 1-0 -shy0 706 -702
108
108 -0-0)-0 -0 -0 -0
0 o
-0 -0
0 0
-0 -0
-0 -0
-0 -0
-0-0 0 -0
-- 0 O
574 106 0 -2 1 1 3 2 3 3 3 3 3 3 592 100 0 3 1 0 0 3 3 3 0 - 3 31 3shy516 093 0 0 0 3 1 0 0 0 3 3 3 0shy
589 091 0 3 1 0 0 0 0 0 0 2 0 0 705 089 -0- 0 -0 0 -0 0 -0 -0 0 0 -0 0 515 701
089 089
0 -0
0--0
0 -0
3 0
0 -
0 0
0 -0
0 -0
3 -0
3 -0
3 -0
1 -0
504 088 1 0 0 3 3 0 0 3 3 3 3 0 509 505
085 08
1 0
1 0
10
3 3
3 0
3 0
3 0
3 0
3 0
3 3 3 32 3shy
517 07 0 0 0 3 0 0 0 0 3 3 3 1 510 07 0 0 0 0 1 3 0 0 0 3 3 707 07i -0 -0 -0 3 -0 0 -0 -0 -0 -0 -0 -0 -7-03 07 -0 -0 -0 3 -0 0 -0 -0 0 -0 -0 -0 508 07i 0 0 0 3 1 3 3 0 3 3 3 3 525 501
07( 07(
0 0
0 0
0 3 3
3 0
0 01
0 0
0 3
3 31
3 -0
2 3
2 0
521 06 0 0 0 3 0 1 0 0 0 1 3 3
519 06 0 0 0 2 0 2 0 0 0 3 3 3 503 06 0 0 0 2 3 0 3 3 -0 3 3 520- 061 0 0 0 0 0 1 0 0 0 3 3 2 502 04 0 1 0 0 0 3 0 3 3 -0 3 2 507 04 1 2 1 3 2 3 3 0 3 3 3 3
-506 03 0 2 2 3 0 0 3 3 3 3 2 3
V-23
Table V-9 NOT Observations Fatigue-Cracked Flush Transverse
Welded Panels
PENETRANT ULTRASONIC EDDY CURRENT X-RAY
INSPECTION SEQUENCE 1 2 3 1 2 3 1 2 3 1 2 3
CRACK ACTUAL NUMBER VALUE
616 e495 0 0 0 0 0 3 0 0 0 3 0 0 612 308 0 0 0 3 0 1 0 0 0 3 3 3 620 297 0 0 0 0 0 3 0 0 0 3 3 3 621 267 0 0 0 0 3 3 0 0 0 3 3 3 623 239 0 0 0 0 0 2 0 6 0 3 3 3 619 235 0 0 0 0 0 2 0 0 0 3 3 3 614 o235 0 0 0 3 0 3 0 0 0 3 -3 -3 622 2Z5 0 0 0 0 0 1 0 -0 0 3 3 3 613 224 0 0 1 3 0 1 0 0 0 3 3 3 611 204 0 2 3 3 2 2 0 0 0 -3 3 3 617 195 0 0 0 0 0 3 0 0 0 3 3 3 625 186 0 2 1 1 0 2 0 0 0 3 3 3 618 182 0 0 0 0 0 3 0 0 0 3 3- 3 615 178 0 0 0 0 0 1 0 3 0 3 3 -3 610 178 0 0 0 3 0 1 0 0 0 3 3 3 626 e160 0 0 2 2 3 3 3 3 0 3 3 3 624 158 0 1 0 0 0 2 3 3 0 3 3 3 609 138 0 1 3 3 0 1 0 0 0 3 3 3
V-24
own C-scan recordings interpretihg the results and documenting the inspections The operatorresponsihle for the original optimization and recording-sequences was eliminated from this repeat evaluation Additional care was taken to align warped panels to provide the best possibleevaluati6n
The results -of this repeat-cycle showed a definite improvement in the reliability of the ultrasonic method in detecting fatigue cracks in welds The two-data files were merged on the following basis
Data from the- repeat evaluation were ordered by actual flaw
dimension
An analysis was performed by counting down from the largest flaw to the first miss by the ultrasonic method
The original data were truncated to eliminate all flaws larger than that of the first miss in the repeat data
The remaining data were merged and analyzed according to the original plan The merged actual data file used for processing Sequences 1 and 3 ultrasonic data is shown in Tables V-2 through V-4 Tables V-5 through V-9 list nondestructive test observations by the ultrasonic method for the merged data as ordered by actual crack length
The combined data base was analyzed and plotted in the same manner as that described for the integrally stiffened panels
DATA RESULTS
The results of inspection and data analysis are shown graphically in Figures V-4 through-V-19 Data are plotted by weld panel type and crack orientation in the welds This separation and plotting shows the differences in detection reliability for the various panel configurations- An insufficient data base was established for optimum analysis of the flush transverse panels at the 95 reliability and 95 confidence level The graphical presentation at this level is shown and it may be used to qualitatively assess the etching and proof loading of these panels
The results of these analyses show the influences of flaw geometry flaw tightness and of inspection process influence on detection reliability
V-25
IO0
90 0
200
90
1 0
90
0
00 0 O
80 80 0
0
70
-0
-
Z
0
60
70
60
0
0
0 70
G0
0
so so so
3 I 40 140
030 30
LJ
20
I I
20
I 4
C1
0 0 30
I00 60 90 120 0 30 60 90 120
0 0
0 30 60 90 220
LENGTH (224ILENGTH 5PECRIEN FATIt CRACK SPEC2IEN
(IN)FATIGUC CRACK
LEWTN SPECHEN
(IN2FATIG E CRACK
200 200 00
SO 90 90 0
B0 0
0
00 0 80 -
0
70
50 -
70
60
0
0
0 70 -
60 shy
8 0 00l 50
- 40 -~4 140 -
30 30
20 20 20
10 10 to
0
0 000 000
I I I
250
I
200 20
o
0 050
I I
100
I
150
I
200
I
200
o
0
I
050
I I
200
III
150
I
a20 20
MPTH (IN)SPCC2MN FATI IE CRACK ENETRMT TEST SEQ NO I
CCIIDENCE LEVEL - 950
Figure V-4 Crack Detection Probability for Longitudinal Welds with Crowns by the Penetrant Method Plotted at 95 Probability and 95 Confidence
DEPTH (IN)SPECIHEN FATrICE CRACK PEETRANT TEST SEC NO 2 C0)SICNE LEVEL - 950
DPTH [IN)SPECICN FATICU CRACK PETRANr TEST SEO W0 3 CONIDEE LEVEL 950
100 - 00 100
90 - 90 90 O 0
00o
70
70
gt 60
S00
o
00
0 oo
0
00
70
70
60 t
-0
00
701
70
0
0
0
-
0
00-4
30 0
0 o
40
30
0 0o
40
30
20 20 20
0 0 10
0
350
I I
100 150 200
I
250
0
0
I
30
I I
60
I
90
[0
220 0
9 I
0
I
I 0
I
150
I I
2 00 250
LENGTH SPECI1CN
(I) fATIGUE CRACK
LENOH (IN) SPECINICN FATICE CRACK
tENOTH (IN) SPEC2ICN FATIGUE CRACK
1 00
go0
60 0
1 00
0o0
0
200
90
0 0 0
00
0 0
70
0
E- shy
iqo -
0
o0-
0
0
-0
70
00 -
5o
40 -
0
Mt
70
60
5
4
0
30 30 30
0 02 0 20
oi0 1 0
0 050 100 200 O 51500 05D 100 50 200 0 0 050 TO0 15D EDO 25o
EPTH IINA SPIIEN FATIGUE CRACK LLTRASCNIC TEST MO W 1oCONI DNCE LEVEL shy 950
Figu re V-5 Crack Deotection Probability for longitudl na YIWeldswithICrowns by the Ultrasonic bullMethod Plotted at 95 Probability and 95 Confidence
DEPTH ]NI SP CI NH rATIGC CRACK O)TRASONiC TEST SCO NW 2 CONIDCE LEVEL shy 950
DEPTH ( IN SIECIEN FAT] WqE CRACK LLTRAWN]C TEST Ma NO 3CC IDENCE LEVEL shy 9 0
100 I OD I 00
90 -90 90
00 O0 80
70 70 70
60 6D 60
0
a0
10
02
-
0
0 0-
0
0 -0
5D
413
0 20 -20
0 -
10
0
2
0
50
40
30
10
0
-
0
0 0
0
0 30 I I
60
LENGTH (ON) SPECINEN FATOGUtCRACK
I
90
I
120
00
0 30
I
60
LENGTH (IN) SPCIflN FATIGE CRACK
90 10 0 30
LENGTH SPECIIEN
60
IIN) FATIGUE CRACK
90 180
100 00
90 90 90
90 90 60
70 70
60 0
4 040
0o os0
0
0
04
50
0
10 000 00
a 05a O0D 150 000 i5aS0 050 100 150 200 250 o 050 10O So 200 0
DE[PTH IN) DEPTH 41N) CEpT [IN)SPEC]NEN FATIGUE CRACK PCIMCN FATIGX CRACK H
SPECIMEN FATIG CRACK ECOy CURRENT TEST SEG NM I ECOy CUJAiCNT TEST SEE W 2C4CCNCC LEVEL EOy CURRENTTEST SEE NO 3- 950 cWJCEnCE LEVEL 950 CON-IDENC LEVEL 95-0EFigure V-6 Crack Detection ProbabilIty for Longitudinal Welds with Crowns bythe Eddy
CurrentMethod Plotted at 95 Probability and 95 Confidence
100 00 100
90 90 90
80 80 60
70
80 Z
70
00 -
70
60 0
5o 50 50
4o 4 40
30 30 30 0
20 040
0 20 0 0 0
0
10
0 0 10 - ]0
0 P
0 -30
I I
60
LENGTH (IN) SPECIMEN FATICUC CRACK
I
90
I
120
0
0 30
1
LENGTH SPECIEN
I
60
IIN) FATIGUC CRACK
I
90
I
120
0
0 30
I
60
LENGTH IIN) SPECIMEN FAT]CUE CRACK
90
I
120
100 200 200
90 90 90
00 00 80
70 70 70
3 o 60
040
-
008o
ooshy
0
+40 040 00
0 0
40
30
20 0 00
00 04
80
20
0
0
0
70
20
20
0
D
0 0
I I I I 0 1I
050 100 150 200 no 0 050
DEPTH (IN)SECIEN FATIOU CRACK X--hAYTOT OSCNO I CONFIDENCELEVEL- 950
Figure V-7 Crack Detection Probability for Longitudinal Welds with Crowns by the X-Radiographlc Method Plotted at 95 Probability and 95 Confidence
I I 100 50
DEPTH (IN)SPECIMENFATIGUECRACK X-RAYTEST SEC NO 2 COM2]ENCCLEVEL 950
I 200
I 250
0
0 050
I I I I
O0 50
OPTH IIN]SPECIMENfATICE CRACK X-RAYTEST SE0MO 3 COSIOCENCELEVEL- 50
I
200 250
100
0
0 000
90 -
1 00
0
0
-
0
SO
70
00
70
0
-
S0
70 0
0
60 6 60
W50
soslW 50
40
30
20
0
20
30
20
10 10 10
0
0
100
90
0
II
50
0
100
LEWTH SPECIEN
150
lIN)FAT[OUECRACK
0
200 250 0
0
100
900
50 I I
100 150
LENGTH (IN)SPEC)MENFATIGUECRACK
00
200 250 0
0
100
90 0
50 I
000
LENGTH SPECIN
150
(INIFAT]GUECRACK
I
200 250
00 o0 00
70
60
70
60
0 70
0
50 500
40 40 40
30 30 30
20 20 20
0 10
0 1 I I I Io
0 100 200 300 400 500 600 0 100
DEPTH (INSPECIEN FATIGUECRACK pENETRANTTESTSO NO I CONWICCCELEVEL- 950
Figure V-8 Crack Detection Probability for Transverse Welds with Crowns by the Penetrant Method Plotted at 95 Probability and 95 Confidence
I I
200 300 400
DEp 1IN)SPECIMENFATIGUECRACK PENERANTTEST SEC NO 2 CONFIDENELEVELshy950
500
I
600
I
10
0
I I
100 200 300 400
DEPTH IN)SPECINIONFATIGUECRACK FEWETRANTTEST M0ONO 3 CONIEEC LEVElL S50
500 600
100 I00 100
90 90 so
10 00 80
70 70 70 0
60 60 o
5 5D0
0_~0 0 0
04
- 0 1
30-D 30 - 30
20 20 20
10 10 10
0 I I I I 0 I I I I I aI
0 50 100 150 200 250 0 50 100 50 2 00 250 0 50 100 150 ao0 250
LEtMTH IN LENGTH (IN I LENGTH IN )SPEC0INE FATIGUE CRACK SPtCIlEN FAT)GUCECRACK SPECIIEN FATIGWE CRACK
100 100 00
9o 90 90
600 60 0 0 000
0 0
70 70 0 - - 7 0 000
6 o 60 _-60 shy
5o60 0 0 o so
40
40 40 - 40 0
30 30 30 o0
20 20 20 0
10 00
0 I
0 100 200 300 400 500 600 0 100 20 300 400 500 600 0 100 200 300 500 600400
DCPTH IN) RT4 IN)SpICIJN FAVI JE CRACK HEPN 0141 TH I1ARASOIC TEST 90 NO I SPECIICN FATIGUE CRACK 2SPCIEN FATIOUE CRACK
IUTRASCAC TEST MO0 OTASO410 7067 SCCONFIDENCELEVEL 950 CC0F NCE LEVEL - 050 COMIOJCE LEVEL - O0
Figure V-9 Crack Detection Probability for Transverse Welds-with Crowns by the Ultrasonic Method Plotted at 95 Probability and 95 Confidence
100 100 100
90 90 90 N
00
70
00
70 C
0
10
0 0
60 60 0
50 so 06
0
-40 40
30 30 0
40 0
S0 20 20 -
10 10 10
0It 0 50
I I I I 100 150
LENGTH (IN)
SPECIMEN FATIGUE CRACIK
a00 a50
0 U 50
I I I
o0 150
LENOT (INI
SPECIHEN FATIGUE CRACK
I
00 e50
000
0 00
I I I
100 150
LENOTH tINI
SPECIMCN FATIGU CRACK
000
I
E0
100 100 0 100
90 0
90 90
00
70
0 00
70
0
-
00
70
0
0
0
3- o -
40 60 4-0
so z -
030 0
20 20
330 30
20
10 10 10
100 00 300 4oo 500 600 0 100 200 300 400 500 600
0 0 000 200 300 400 500 600
(IN) SCIMEN FATIGUJECRACK CCOYCURRENTTES 5EQ NO I C OINCE LEVIEL- 950
Figure V-1O Crack Detection Probability for Transverse Welds with Crowns by the EddyCurrent Method Plotted at 95 Probability and 95 Confidence
OPTHDEPTH (IN) SPCIMEN FATIGUE CRACK EOY CLRENT TEST SEQ NO a CON[CENOE LEV]EL- 95 0
DPTH (IN SPECIIEN FATIGUE CRACK E1 COYRENf TEST SEQ NO COH]CENCE LEVEL - 950
3
00 100 100
0 90 90
80 80 O
70 lt70 70
s0o650 0
600
50 -0
o 4D
3
20
10
30
0
0 0
2
40
30 -
20
0
o10-
0
I-0
0
-
40
30
20
10
0
0
I I I
0
I I I I
50 100 1o 200 P90 0 SD 100 I6R 200 20 0 5 100 150 200 250
LEWINOTH INI SPECIEN FATIGJU CRACK
LENGTH IIN I SFECINEN FATIGUE CRACK
LEINTH SPEClttN
IIN I FATIWUC CRACK
100 O 100
90 90 90
00 80 80
70 70 70 0
50 50
0
50 0
40 0
40 0- 40
20
10
-
0
0
0
20
1O
-
0
20 0
10
0
0
I I I I
100 200 300 400 500 00 0 to0
DEPTH (IN) SPECIIEN FATIGUE CRACK X-RAY TEST M0O NW I COW IOIC LEVEL - 950
Figure V-i Crack Detection Probability for Transverse Welds with Crowns by the X-RadiographicMethod Plotted at 95 Probability and 95 Confidence
I I I
200 300 qao0
DEpPN (IN) SPECIKEN FATIGUE CRACK X-RAY TEST 620 WC Z COICSIONCE LEVEL 950
r
500
I
60D
I o0
0 100
I I I I I
200 300 400
EPTH IIN I SPECIIIEN FATIGUE CRACK X-RAY TEST MO W 3 CNFIDEOE LEVIL 950
I I
500 600
1000 0 0 100 Qo a It 00 0 0 00 0 0 100 0
0 000
90 - - 90 so000 shy0bull 0
00 00 0 00 00
70 70 70 -shy
- J 60
50 50 so
40 40 40
0 30 30
20 20 20
001
0 0 0 I I I0 50 100 150 200 260 0 50 100 150 200 250 0 50 I 00 150 2 00 250
LENGTH (IN) LENGTH (IN) LEINTH IINISFECWIENFATIGWCRACK SPECIroNFATIGOLE SPECIKENFATHUE CRACKCRACK
100 00 0 0 0 0 G0 000 0 - -|oo _o0- 100 0000a 3 0 0
90 - shy 090 0
000 00 00 0 O - shy
0 70 70 - 0
6D 60 oo -j 60
0505
0 0 4 40 40
30 30 30
20 200
10 1O0t
0 I0 I 0 I I I I j I 0 100 E00 300 400 500 600 0 100 200 300 400 500 600 O 100 o I600 30D 400 500
OCPTH (IN IPTH (IN) DEPTH (INISFECIHENFATIOUECRACK SPECINEN FATIUJ CRACK PCIN FATIE CRACKPENETRANTTEST 5Z0 NO I PENETRANTTESTMO TET 60ACK0 NOCIMJT CONFIDENCELEVEl S 0 C$IONFNCCLEVEL- S5 0 WCSIR ELEVELM 950
Figure V-12 Crack Detection Probability for Flush Longitudinal Welds by the Penetrant Method Plotted at 95 Probability and 95 Confidence
0
90 0
1
go
0
0
-0
0shy
0
0
90 0
0 0
70
00 - 3o
-J 000
07o
0 -
70
0
0
l-
- 0 0 4 0 1 0
0
10 no 20 20
0 0 0
0
00 -
0
g8 o -o shy 0
-000
50
-
100 0
L0E OGTINl SFIIr N rATIOLI CRACK
07
0
200 tSO50
1
1
00
0
g 0 -
50
- 0
I
00 10
LCO4TN (IN) SPCC]N rAT[CIC CRACK
0 0
200 250 00I
0
70 -
I 00
00
50 0
000
-
60
0
00
LCNCTH SCCIICN
150
(IN) rATrloJ CRACK
200 50
30
60
O_
00 -00
300 -
00 00 -
30
04
0
50 00 j5 I
10[ 1- 1
0 100 200 3O0 400 500 600 0 100
DEPTH (IN) CI ATGUECRCK0TRASONIC TEST MO W I TRASCNICCONFIDNC LEVEL 00
Figure V-13 Crack Detection Probability for Flush LongitudinalI Welds by the Ultrasonic Method
Plotted at 95 Probability and 95Confidence
Roo Z00 400
DEPTH (I N I SPECiHEN FATI L CRACKTEST MO WCOFIDSNOELEL - 9300
2
500 t oo a
0TRANIC
100 20f 300 400
DPTH I IN I SPECIMIENFATIGUE CRALKTEST O W 3
C I C EE =
500 600
0 0 0 0 -0 0
m0
8
70
0bull0
0
9
00
70
0
0 00
0
90
80
70
0
60 60 bull31
8 8 0
20 20 0o
10 10 10
ITI
0 50 100 150 200 250 0 50 100
I I
150
I I
200 260
0
0
I
50 100
I I
150
I
a 00 250
100
90
80
00 0
0
0 0a
LENGTH SFCCIpoundN
0
(IN FATIOJ CRACK
10
90
0
O0 0
0
0
0
tOETH pOINEcN
0 aO0
0
(Till FATICUJ CRA4
0
90
00
0
00
-
0
wR LENGTH U11N SpCINEN FATIMtUtCRACK
O_0 0
70 70 70
000
O 6 50
063 00
50
0
4 40 4
30 300
20 200
10 10
0
S
I
00
I
20
I
300
I I
MO0
I I
500 600
0
0 100
I
00 300
I
400
I
500 600
I I
0
I II
100 20
1
300
I
40D
I I
500
I
600
DEPTH (INI SCINN FATloUt CRACK EMY CIAORENTTEST SEQ NO I CONFIDENCE LEVEL - 950
Figure V-14 Crack Detection Probability for Flush Longitudinal Welds by the Eddy Current Method Plotted at 95 Probability and 95 Confidence
DEPTH [IIN) SPECIMN rATIUE CRACK EMY CURRENTTMST SEQ NO 2 CONtIDC E LEVEL shy 950
DEPT AI) y CeNT JEST
CYF LETNCELEVEL SEE NOC 3 950
100 100 00
90 90 0
80 80 00
70 70 70
80 60 - 0
50 50 60
- 10 - IN 410
30 00
20 230
20J2 30 0
0
0
0
0
-
50 100
1 a
150 200 250
0
I
0
-010
0
1I
50 100
I
150 200
I
250
I
0
I I
50 100 160 200 250
LEIN SPECIE0N
(ON)FATIOUS CtACK
LENOTH SPECIEN
IN)FAT]G4 CRACK
LECNOTH (IN I SFECIHEN FATIGUE CRACK
I 00
00
100
so
100
90
0 0
80F
0
60
so
P o
0
0
00
-O 0 shy
7
6-00
so oo 0
0
80 B
70
0
50
0 0
3 - 3amp
00
30
U 2110 0 0 01 O 0 0 14] 0 -
0
00
-20 20 0 0 j2
0
0
--
100
I
200
II II
300
II
400
I I
500 600 0 1200 200
II0
Sao0
I I0I
400 0
I
600
I I
0 200 200
I I
DN00
I I I
500
I
000
Figure V-I5
DEPTH IIN) SPECINEN FATIO4E CRACK X-RAY TEST1 MO NO I C0SIOENCEIVEL 50
Crack Detectloji Probabililty for Flush Longitudinal Welds by the X-Radiographic Method Plotted at 95 Probability and 95 Confidence
EPTH IN) SPCCIN FATtI CRACK X-RAY TEST MO NO a COWICENCE LEVEL shy 950
DEPTH (IN) SFPCINCN FATI00E CRACK X-RAY TEST MO NO 3 COFIECA LEVEL shy 00
100 I 00 100
90
80
0
80
o 0
80 0
70 70 70
60 - 60
20 30 - 30
o 3s0 20
10 10 10
0 1
o
100
1 1 100
1 1 1 I I 200 300 400
LENGTH IlNI OPECIINtN FATIOUt CRACK
I 500
I 600
0I
0
100
000 200
LENGTH SPCCIMH
I I 300 400
IIN fATI LE CRACK
I I 500 600
0 0
000
100 I I
e00 300 400
LENGTH (INI SPECI0N FATIGUE CRACK
I I 500 0a
90 90 0 90
00 00 80
70 70 70
0
50
-
6~ o
50
so
- 40 - 40
30 30
20 20 20
10
IT 0 I I II 0 0 I
0 00 100 150 200 254 0 050
DEPTH (IN) SPsCIKN FATIGUE CRACK PEDTRANT TEST 0 0 NO I COWCIENCELEVEL - 950
Figure V-16 Crack Detection Probability for Flush Transverse Welds by the Penetrant MethodPlotted at 95 Probability and 95 Confidence
I I II
100 150
DEPTH (IN ) SPECIMN rATIGUE CRACK IcNIRANT TEST 0 OW 2 COWDENCE LEVEL - 950
I
20
I
o
10
0
0
05
050
I 100 1 50
100 15
DEPTH tIIN I
SPFCIfNE FATIGUE CRACK PENETRANT TEST MO NO 3 CONI0ENCE LEVEL - 9 50
200
200
25C
0 ]00 I 00
9090 90
so 80 0
70
60 - 60 - 60
50 50 so
70 70
I- 410
30 30
- 0 o
30
2020 20
00 010
0 0 I I I 0 I I I I
0 100 200 300 oo 500 600 0 -to 200 300 40 600 -600
LENGTH (INI LENGTH (IN) LENIN (IN) SCIMEN FATIUE CRACK SEtC]IWN FATIGUMCRACK SPECINtN FAT]GUE CRACK
100I OC I 0o
0 100 200 300 oo 600 600
90 90 90
B0o0000
70 70 70
6060000 - so03- 0 3 F
-to 4 50 0 0 50
030 4
300030
0 20 20
t030 10
I I I I 0 I I I I 2 I I I I0
0 050 200 150 200 m0 0 050 Ito 250000 260 0 050 100 50 00 20
DEPTH (IN DEPTH (IN) DEPTH (IN SPECItIEN FATIM CRACK SPECIIN FATIGUE CRACK SPECIHEN FATIGUE CRACK ULTRASONIC TEST SEC I -MO UTRA SO 3NO ULTRASONICTEST 2 ONIC TEST No C0IN ICENCEEVE 50C NENCC LEE -950CONFIENCE LEVampl - S50Figure V-17 Crack Detection Probability for Flush Transverse Welds by the Ultrasonic Method
Plotted at 95 Probability and 95 Confidence
100 100 100
00 90 90
_0 80 00
70 70 70
- 00 -60
50 50 50
E 40I 400
30 30 30
20 20 20
10 010 tO
0 I I o I I II I I o I I I I I I I
0 100 200 300 400 500 600 0 100 200 300 400 500 600 0 100 200 300 400 500 600
LENGTH (IN) LENGTH (IN LEWGIH (IN)SPECIWNFATIGMJCRACK SPECIIEN FATIUC CRACK SPECIMENFATIGWECRACK
I00 100000
90 0 90 90
0 00 0 80
70 70 70
60 60 60
505050
040 40
30 3)3
20 202
10 00 1002
0 I 1 I I i I I I0 I I I I I I I 0 I- I I I I
0 050 100 150 200 250 0 050 100 150 200 250 0 050 100 150 200 250
CEPTH (IN) DEPTH (IN) CEPTH (INSPECICN FATICUECRACK FATIUE CRACK SPECICN FATIGUECRACKSPECCIMEN ECY LURRENTTESTSEONO I ECOYCRRENTTESTSE0 NO 2 ECOYCtCNT TESTSQ NO 3 COWISI CE LEVML 9S50 COWI$NCE LEVE 95-0 CCIICCNCELEVEL- 0
Figure V-IS Crack Detection Probability for Flush Transverse Welds by the Eddy Current Method Plotted at 95 Probability and 95 Confidence
O00 I00
90 00 90
10 00 80
70 70 70
60 so
60 o
60
so
4o 40 40
30 30 30
20 20 20
t O10
0 0 100 200 300
LENGTH (IN I SACCIMrNFATIGM
400
CRACK
2
500 II I
600 I I0
0 I
100 I
200
LEWITH SPCItHN
300 400
IIN)FATIGWECRACK
0
500 I I
600 I
10
I 0 100 aoo
LCNOGT
H
SPCCICN
I I I
300 400
(INIFATIGUECRACK
I
0
500 600
200 I 00 100
90 9 90
0 S0 00
70 70 70
60 60 60
so 50 50
40 40 40
30 30 30
20 20 20
tO 10
0 I I I I I I I [_ ____ ____ ___ 0 I
00 0 0S0 tO t060 200 250 0 050
DEPTH (IN)SPECIVENFATIGUECRACK X-RAYTEST SEC NO I CONIDENCELEVEL- 950
Figure V-19 Crack Detection Probability for Flush Transverse Welds by the X-Radiographic Method Plotted at 95 Probability and 95 Confidence
I I I - I
100 150
DEPTH (IN)SPECIMENFATIGUECRACK X-RAYTEST SECNO 2 C0$IDENCE LEVl - 950
I
200
0 - I
250
10
a0 0
1
060
f I1
100 ISO
CCPTH N)JCIUN FATIGUECRACK X-RAYTEST SEC NO 3 CNFICEICE LEVEL 950
e00
0 1
2S0
VI CONCLUSIONS AND RECOMMENDATIONS
Liquid penetrant ultrasonic eddy current and x-radiographic methods of nondestructive testing were demonstrated to be applicable
and sensitive to the detection of small tightly closed flaws in
stringer stiffened panels and welds in 2219-T87 aluminum alloy
The results vary somewhat for that established for flat parent
metal panel data
For the stringer stiffened panels the stringer member in close
proximity to the flaw and the radius at the flaw influence detection
by all NDT methods evaluated The data are believed to be representshy
ative of a production depot maintenance operation where inspection
can be optimized to an anticipated flaw area and where automated
C-scan recording is used
LOP detection reliabilities obtained are believed to be representashy
tive of a production operation The tightness of the flaw and
diffusion bond formation at the flaw could vary the results
considerably It is-evident that this type of flaw challenges
detection reliability and that efforts to enhance detection should
be used for maximum detection reliability
Data obtained on fatigue cracked weld panels is believed to be a
good model for evaluating the detection sensitivity of cracks
induced by production welding processes The influence of the weld
crown on detection reliability supports a strong case for removing
weld bead crowns prior to inspection for maximum detection
reliability
The quantitative inspection results obtained and presented herein
add to the nondestructive testing technology data bases in detection
reliability These data are necessary to implement fracture control
design and acceptance criteria on critically loaded hardware
Data may be used as a design guide for establishing engineering
This use should however be tempered byacceptance criteria considerations of material type condition and configuration of
the hardware and also by the controls maintained in the inspection
processes For critical items andor for special applications
qualification of the inspection method is necessary on the actual
hardware configuration Improved sensitivities over that reflected
in these data may be expected if rigid configurations and inspection
methods control are imposed
The nature of inspection reliability programs of the type described
herein requires rigid parameter identification and control in order
to generate meaningful data Human factors in the inspection
process and inspection process control will influence the data
VI-I
output and is not readily recognized on the basis of a few samples
A rationale and criteria for handling descrepant data needs to be
developed In addition documentation of all parameters which may
influence inspection results is necessary to enable duplication
of the inspection methods and inspection results in independent
evaluations The same care in analysis and application of the
data must be used in relating the results obtained to a fracture
control program on functional hardware
VI-2
-APPENDIX A-
LIQUID PENETRANT INSPECTION PROCEDURE FOR WELD PANELS STIFFENED PANELS
AND LOP PANELS
10 SCOPE
11 This procedure describes liquid penetrant inspection of
aluminum for detecting surface defects ( fatigue cracks and
LOP at the surface)
20 REFERENCES
21 Uresco Corporation Data Sheet No PN-100
22 Nondestructive Testing Training Handbooks P1-4-2 Liquid Penetrant
Testing General Dynamics Corporation 1967
23 Nondestructive Testing Handbook McMasters Ronald Press 1959
Volume I Sections 6 7 and 8
30 EQUIPMENT
31 Uresco P-149 High Sensitive Fluorescent Penetrant
32 Uresco K-410 Spray Remover
33 Uresco D499C Spray Developer
34 Cheese Cloth
35 Ultraviolet light source (Magnaflux Black-Ray BTl00 with General
Electric H-100 FT4 Projector flood lamp and Magnaflux 3901 filter
36 Quarter inch paint brush
37 Isopropyl Alcohol
38 Rubber Gloves
39 Ultrasonic Cleaner (Sonogen Ultrasonic Generator Mod G1000)
310 Light Meter Weston Model 703 Type 3A
40 PERSONNEL
41 The liquid penetrant inspection shall be performed by technically
qualified personnel
A-i
50 PROCEDURE
541 Clean panels to be penetrant inspected by inmmersing in
isopropyl alcohol in the ultrasonic cleaner and running
for 1 hour stack on tray and air dry
52 Lay panels flat on work bench and apply P-149 penetrant
using a brush to the areas to be inspected Allow a dwell
time of 30 minutes
53 Turn on the ultraviolet light and allow a warm up of 15 minutes
531 Measure the intensity of the ultraviolet light and assure
a minimum reading of 125 foot candles at 15 from the
2 )filter (or 1020--micro watts per cm
54 After the 30 minute penetrant dwell time remove the excess
penetrant remaining on the panel as follows
541 With dry cheese cloth remove as much penetrant as
possible from the surfaces of the panel
542 With cheese cloth dampened with K-410 remover wipe remainder
of surface penetrant from the panel
543 Inspect the panel under ultraviolet light If surface
penetrant remains on the panel repeat step 542
NOTE The check for cleanliness shall be done in a
dark room with no more than two foot candles
of white ambient light
55 Spray developer D-499c on the panels by spraying from the
pressurized container Hold the container 6 to 12 inches
from the area to be inspected Apply the developer in a
light thin coat sufficient to provide a continuous film
on the surface to be inspected
NOTE A heavy coat of developer may mask possible defects
A-2
56 After the 30 minute bleed out time inspect the panels for
cracks under black light This inspection will again be
done in a dark room
57 On data sheet record the location of the crack giving r
dimension to center of fault and the length of the cracks
Also record location as to near center or far as applicable
See paragraph 58
58 Panel orientation and dimensioning of the cracks
RC-tchifle- Poles U j--U0
I
k X---shy
-
e__=8= eld pound r arels
59 After read out is completed repeat paragraph 51 and
turn off ultraviolet light
A-3
-APPENDIX B-
ULTRASONIC INSPECTION FOR TIGHT FLAW DETECTION BY NDT PROGRAM - INTEGRALLY
STIFFENED PANELS
10 SCOPE
11 This procedure covers ultrasonic inspection of stringer panels
for detecting fatigue cracks located in the radius root of the
web and oriented in the plane of the web
20 REFERENCES
21 Manufacturers instruction manual for the UM-715 Reflectoscope
instrument
22 Nondestructive Testing Training Handbook P1-4-4 Volumes I II
and III Ultrasonic Testing General Dynamics 1967
23 Nondestructive Testing Handbook McMasters Ronald Press 1959
Volume II Sections 43-48
30 EQUIPMENT
31 UM-715 Reflectoscope Automation Industries
32 ION PulserReceiver Automation Industries
33 E-550 Transigate Automation Industries
34 SIJ-385 25 inch diameter flat 100 MHz Transducer Automation
Industries
35 SR 150 Budd Ultrasonic Bridge
-6 319 DA Alden Recorder
37 Reference Panel - Panel 1 (Stringer)
38 Attenuator Arenberg Ultrasonic Labs (0 db to 122 db)
40 PERSONNEL
41 The ultrasonic inspection shall be performed only by technically
qualified personnel
B-1
50 PROCEDURE
51 Set up equipment per set up sheet page 3
52 Submerge the stringer reference pane in a water filled inspection
tank (panel 1) Place the panel so the bridge indexes away from
the reference hole
521 Scan the web root area B to produce an ultrasonic C scan
recording of this area (see panel layout on page 4)
522 Compare this C scan recording web root area B with the
reference recording of the same area (see page 5) If the
comparison is favorable precede with paragraph 53
523 If the comparison is not favorable adjust the sensitivity
control as necessary until a favorable recording is obtained
53 Submerge scan and record the stringer panels two at a time
Place the stringers face up
531 Scan and record areas in the following order C A
B and D
532 Identify on the ultrasonic C scan recording each web
root area and corresponding panel tag number
533 On completion of the inspection or at the end of theday
whichever occurs first rescan the web root area of the
stringer panel 1 and compare with reference recording
54 When removing panels from water thoroughly dry each panel
55 Complete the data sheet for each panel inspected (If no defects
are noted so indicate on the data sheet)
551 The X dimension is measured from right to left for web
root areas C and A and from left to right for web
root areas B and D Use the extreme edge of the
stringer indication for zero reference
NOTE Use decimal notation for all measurements
56 After completing the Data Sheeti roll up ultrasonic recording
and on the outside of the roll record the following information
a) Date
b) Name (your)
c) Panel Type (stringer weld LOP)
d) Inspection name (ultrasonic eddy current etc)
e) Sequence nomenclature (before chemical etch after chemical
etch after proof test etc)
B-2
ULTRASONIC SET-UP SHEET
DATE 021274
METHOD PulseEcho 18 incident angle in water
OPERATOR Todd and Rathke
INSTRUMENT UM 715 Reflectoscope with ION PulserReceiver or see attachedset-up sheet tor UFD-I
PULSE LENGTH Min
PULSE TUNING For Max signal
REJECT
SENSITIVITY 20 X 100 (Note Insert 6 db into attenuator and adjust the sensitivity control to obtain a 18 reflected signal from the class I defect in web root area B of panel 1 (See Figure 1) Take 6db out of system before scanning the panels
FREQUENCY 10 MHz
GATE START 4 E
GATE LENGTH 2 (
TRANSDUCER -SIJ 385 25100 SN 24061
WATER PATH 1 14 when transducer was normal to surface
WRITE LEVEL + Auto Reset 8 SYNC Main Pulse
PART Integrally Stiffened Fatigue Crack Panels
SET-UP GEOMETRYJ
I180 Bridge Controls
Carriage Speed 033 IndexIneScan Direction Rate 015 to 20
Step Increment 032
B-3
LAY-OUT SHEET
Reference
J
B-4 0 - y
REFERENCE RECORDING SHEET
Case I
Defect
WEB ROOT AREA
B
Panel B-5
FIGURE 1 Scope Presentation for the
AdjustedSensitivity to 198
ORIGINAL PAGE IS OF POOR QUALITY
B-6
-APPENDIX C -
EDDY CURRENT INSPECTION AND RECORDING FOR INTEGRALLY STIFFENED
ALUMINUM PANELS
10 SCOPE
11 This procedure covers eddy current inspection for detecting
fatiguecracks in integrally stiffened aluminum panels 20 REFERENCES
21 Manufacturers instruction manual for the NDT Instruments
I Model Vector 111 Eddy Current Instrument
22 Nondestructive Testing Training Handbooks Pi-4-5 Volumes I amp II
Eddy Current Testing General Dynamics 1967
23 Nondestructive Testing Handbook McMasters Ronald Press 1959
Volume II Sections 35-41
30 EQUIPMENT
31 NDT Instruments Vector IlI Eddy Current Instrument
311 100KHz Probe for Vector 111 Core diameter 0063 inch
NOTE This is a single core helically wound coil
32 NDE Integrally Stiffened Reference Panel 4 web B
33 SR 150 Budd Ultrasonic Bridge
34 319DA Alden Recorder
35 Special Probe Scanning Fixture 2
36 Special Eddy Current Recorder Controller Circuit
37 Dual DC Power Supply 0-25V O-2A (HP Model 6227B)
40 PROCEDURE
41 Connect 100 KHz Probe to Vector ill instrument
42 Turn instrument power on and set sensitivity course control
to position 1
43 Check batteries by operating power switch to BAT position
Batteries should be checked every two hours of use
431 Meter should read above 70
44 Connect Recorder controller circuit
441 Set Power Supply for +16 volts and -16 volts
C-I
45 Place Fluorolin tape on vertical and horizontal (2 places)
tracking surfaces of scanning block Trim tape to allow
probe penetration
451 Replace tape as needed
46 Set up panel scanning support fixture spacers and shims for
a two panel inspection inner stringer faces
47 Place the reference panel (4 web B Case 1 crack) and one other
panel in support fixture for B stringer scan Align panels careshy
fully for parallelism with scan path Secure panels in position
with weights or clamps
48 Manually place scan probe along the reference panel stringer
face at least one inch from the panel edge
481 Adjust for vector III meter null indication by
alternately using X and R controls with the sensitivity
control set at 1 4Use Scale control to maintain
readings on scale
482 Alternately increase the course sensitivity control
and continue to null the meter until a sensitivity
level of 8 is reached with fine sensitivity control
at 5 Note the final indications on X and R controls
483 Repeat steps 481 and 482 while a thin non-metallic
shim (3 mils thickness) is placed between the panel
horizontal surface and the probe block Again note the
X and R values
484 Set the X and R controls to preliminary lift-off
compensation values based on data of steps 482 and 483
485 Check the meter indications with and without the shim
in place Adjust the X and R controls until the
meter indication is the same for both conditions of
shim placement Record the final settings
X 1600 These are approximate settings and are
R 3195 given here for reference purposes only
SENSTTIVTTY
COURSE 8
FINE 5
C-2
49 Set the Recorder controls for scanning as follows
Index Step Increment 020
Carriage Speed 029
Scan Limits set to scan 1 inch beyond panel edge
Bridge OFF and bridge mechanically clamped
410 Manually move the probe over panel inspection region to
determine scan background level Adjust the Vector III
Scale control to set the background level as close as possible
to the Recorder Controller switching point (meter indication
is 20 for positive-going indication and 22 for negative-going
indication)
411 Initiate the Recorder Scan function
412 Verify that the flaw in B stringer of the reference pinel
is clearly displayed in the recording Repeat step 410
if requited
413 Repeat step 410 and 411 for the second panel in the fixture
Annotate recordings with panelstringer identification
414 Reverse the two panels in the support fixture to scan the
C stringer Repeat steps 47 4101 411 413 and 414
for the remaining panels
415 Set up panel scanning support fixture spacers and shims for
outer stringer faces Relocate scan bridge as required and
clamp
416 Repeat steps 47 410 411 413 and 414 for all panels
for A and D stringer inspections
417 Evaluate recordings for flaws and enter panel stringer
flaw location and length on applicable data sheet Observe
correct orientation of reference edge of each panel when
measuring location of a flaw
50 PERSONNEL
51 Only qualified personnel shall perform inspections
60 SAFETY
61 Operation should be in accordance with Standard Safety Procedure
used in operating any electrical device
C-3
AMENDMENT A
APPENDIX C
NOTE
This amendment covers changes
in procedure from raster
recording to analog recording
442 Connect Autoscaler circuit to Vector III and set
ba6k panel switch to AUTO
48 Initiate the Recorder Scan function Set the Autoscaler
switch to RESET
49 Adjust the Vector 1il Scale control to set the recorder display
for no flaw or surface noise indications
410 Set the Autoscaler switch to RUN
411 When all of the signatures of the panels are indicated (all
white display) stop the recorder Use the carriage Scan
switch on the Recorder Control Panel to stop scan
412 Annotate recordings with panelsidethicknessreference
edge identification data
C-4
-APPENDIX D-
X-RADIOGRAPHIC INSPECTION PROCEDURES FOR DETECTION OF FATIGUE CRACKS
AND LOP IN WELDED PANELS
10 SCOPE
To establish a radiographic technique to detect fatigue cracks and LOP in welded panels
20 REFERENCES
21 MIL-STD-453
30 EQUIPMENT AND MATERIALS
31 Norelco X-ray machine 150 KV 24MA
32- Balteau X-ray machine 50 KV 20MA
33 Kodak Industrial Automatic Processor Model M3
34 MacBeth Quantalog Transmission Densitometer Model TD-100A
35 Viewer High Intensity GE Model BY-Type 1 or equivalent
36 Penetrameters - in accordance with MIL-STD-453
37 Magnifiers 5X and LOX pocket comparator or equivalent
38 Lead numbers lead tape and accessories
40 PERSONNEL
Personnel performing radiographic inspection shall be qualified in accordshyance with MIL-STD-453
50 PROCEDURE
51 An optimum and reasonable production technique using Kodak Type M Industrial X-ray film shall be used to perform the radiography of welded panels The rationale for this technique is based on the reshysults as demonstrated by the radiographs and techniques employed on the actual panels
52 Refer to Table I to determine the correct setup data necessary to produce the proper exposure except
Paragraph (h) Radiographic Density shall be 25 to35
Paragraph (i) Focal Spot size shall be 25 mm
Collimation 1-18 diameter lead diaphram at the tube head
53 Place the film in direct contact with the surface of the panel being radiographed
54 Prepare and place the required film identification on the film and panel
55 The appropriate penetrameter (MIL-STD-453) shall be radiographed with each panel for the duration of the exposure
56 The penetrameters shall be placed on the source side of the panels
57 The radiographic density of the panel shall not vary more than + 15 percent from the density at the MIL-STD-453 penetrameter location
58 Align the direction of the central beam of radiation perpendicular and to the center of the panel being radiographed
59 Expose the film at the selected technique obtained from Table 1
510 Process the exposed film through the Automatic Processor (Table I)
511 The radiographs shall be free from blemishes or film defects which may mask defects or cause confusion in the interpretation of the radiograph for fatigue cracks
512 The density of the radiographs shall be checked with a densitometer (Ref 33) and shall be within a range of 25 to 35 as measured over the machined area of the panel
513 Using a viewer with proper illumination (Ref 34) and magnification (5X and 1OX Pocket Comparator or equivalent) interpret the radioshy
graphs to determine the number location and length of fatigue cracks in each panel radiographed
D-2
TABLE I
DETECTION OF LOP - X-RAY
Type of Film EastmanjKodak Type M
Exposure Parameters Optimum Technique
(a) Kilovoltage
130 - 45 KV
205 - 45 KV
500 - 70 KV
(b) Milliamperes
130-205 - 20 MA
500 - 20 MA
(c) Exposure Time
130-145 - 1 Minutes
146-160 - 2 Minutes
161-180 - 2 Minutes
181-190 - 2 Minutes
190-205 - 3 Minutes
500 - 2 Minutes
(d) TargetFilm Distance
48 Inches
(e) Geometry or Exposure
Perpendicular
(f) Film HoldersScreens
Ready PackNo Screens
(g) Development Parameters
Kodak Model M3 Automatic Processor Development Temperature of 78degF
(h) Radiographic Density
130 - 30
205 - 30
500 - 30
D-3
TABLE 1 (Continued)
(i) Other Pertinent ParametersRemarks
Radiographic Equipment Norelco 150 KV 24 MA Beryllium Window
7 and 25 Focal Spot
WELD CRACKS
Exposure Parameters Optimum Technique
(a) Kilovoltage
18 - 45 KV 12 - 70 KV
(b) Milliamperes
18 - 20 MA 12 - 20 MA
(c) Exposure Time
18 - 1 Minutes 12 - 2k Minutes
(d) TargetFilm Distance
48 Inches
(e) Geometry or Exposure
Perpendicular
(f) Film HoldersScreens
Ready PackNo Screens
(g) Development Parameters
Kodak Model M3 Automatic Processor Development Temperature at 780F
(h) Radiographic Density
060 - 30
205 - 30
i) Other Pertinent ParametersRemarks
Radiographic EquipmentNorelco 150 KV 24 MA
Beryllium Window 7 and 25 Foenl Snnt
D-4
APPENDIX E
ULTRASONIC INSPECTION FOR TIGHT FLAWS DETECTION BY NDT PROGRAM -
LOP PANELS
10 SCOPE
11 This procedure covers ultrasonic inspection of LOP panels for detecting lack of penetration and subsurface defects in Weld area
20 REFERENCE
21 Manufacturers instruction manual for the UM-715 Reflectoscope instrument and Sonatest UFD I instrument
22 Nondestructive Testing Training Handbook P1-4-4 Volumes I II and III Ultrasonic Testing General Dynamics 1967
23 Nondestructive Testing Handbook McMasters Ronald Press 1959 Volume II Sections 43-48
30 EQUIPMENT
31 UM-715 Reflectoscope Automation Industries
32 ION PulserReceiver Automation Industries
33 E-550 Transigate Automation Industries
34 SIJ-360 25 inch diameter flat 50 MHZ Transducer Automation Ind SIL-57A2772 312 inch diameter flat 50 MHZ Transducer Automation Ind
35 SR 150 Budd Ultrasonic Bridge
36 319 DA Alden Recorder
37 Reference Panels Panels 24 amp 36 for 18 Panels and 42 and 109 for 12 inch panels
40 PERSONNEL
41 The ultrasonic inspection shall be performed only by technically qualified personnel
50 PROCEDURE
51 Set up equipment per applicable setup sheet (page 4)
52 Submerge the applicable reference panel for the thickness being inspected Place the panel so the least panel conture is on
the bottom
E- 1
521 Scan the weld area to produce an ultrasonic C scan recording of this area (See panel layouts on page 4)
522 Compare this C scan recording with the referenced recording of the same panel (See page 5 and 6) If the comparison is favorable presede with paragraph 53
523 If comparison is not favorable adjust the controls as necessary until a favorable recording is obtained
53 Submerge scan and record the panels two at a time Place the panels so the least panel conture is on the bottom
531 Identify on the ultrasonic C scan recording the panel number and reference hole orientation
532 On completion of the inspection or at the end of shift whichever occurs first rescan the reference panel and compare with reference recording
54 When removing panels from water thoroughly dry each panel
55 Complete the data sheet for each panel inspected
551 The x dimension is measured from end of weld starting zero at end with reference hole (Use decimal notation for all measurements)
E-2
56 After completing the data sheet roll up ultrasonic
recording and on the outside of the roll record the
following information
A - Date
B - Name of Operator
C - Panel Type
D - Inspection Name
E - Sequence Nomenclature
Er3
Date Oct 1 1974
2i]ethod- Pitch And Catch Stcep delay
Operator- H Loviscne Sweep Max
Instrument- UK-715 ReflectoscoDe ION PnlserReceiver -Q
18H 12 1 Pulse Length- - Q Mine - Q Hin 0-1
Pulse Tuning- - (b- -
Reject-- - - - 10 1Clock- - -b 12 OClock
Sensitivity- 5 X 1 31 X 10
Frequency- M 5 PMZ1HZ
Gate Start- 4 -4
Gate Length- - - - 3 - 3
Transducer- Transmitter- SlI 5o0 SI 3000 - Receiver- SIL 50 SI 15926
Water Path- 2-1116
Write Level -- -A- - -
Part - 18 amp 12 LOP Panels
Sct- p Geometry -
18T (280)
12T(23 deg )
- 230
RA DTh~)301iD hD)j -
Step Stepmarker ilmarkerarker er Transmitter
Ref Hole+--gt I ref
hole-
S Reciever
49)
Use a NG transducer to hold bracket -shy shy
1516
E14
YbDLrrrc PAla
er~tvamp~WcL
V2 uN- ZampWE CC PAA)r 4-1
-==
t -6
E- 6
AIENDIbNT A
APPEMDIX E
SET-UP FOR 18 LOP PANELS
DATE 081175
METHOD Pitch-Catch Pulse-echo 27 340 incident angle
of transmitter and receiver in water (angle indicator 4 340)
OPERATOR Steve Mullen
INSTRUMENT UM 715 Reflectoscope with 10 NPulserReceiver
PULSE LENGTH(2) Min
QPULSE TUNING for Max signal
REJECT 11000 oclock
SENSITIVITY 5 x 10
FREQUENCY 5 MHz
GATE START 4
GATE LENGTH 3
TRANSDUCER Tx-SIZ-5 SN 26963 RX-SIZ-5 SN 35521
WATER PATH 19 from Transducer Housing to part Transducer inserted into housing completely
WRITE LEVEL Reset e + auto
PART 18 LOP Panels for NAS 9-13578
SET-UP GEOMETRY
SCANJ
STEP
ER-7
Ys LOP WeF Pc -sEs kUMMI-7Z1-T A
APPEMDIX E
LOP OEFPkvSL- -d5-
E-8
AI EM ENT B
APPENDIX E
SET UP FOR 12 LOP PANELS
DATE 081275
METHOD Pitch-Catch Pulse-Echo 270 incident angle of Transmitter and Receiver in Water (angle indicator = 40)
OPERATOR Steve Mullen
INSTRUMENT UM-715 Reflectoscope with IONPulserReceiver
PULSE LENGTH ( Min
PULSE TUNING For Max signal
REJECT 1000 oclock
SENSITIVITY 5 x 10
FREQUENCY 5 MHz
GATE START 4 (D
GATE LENGTH 3
TRANSDUCER TX-SIZ-5 SN26963 Rx-SIZ-5 SN 35521
WATER PATH 16 from Transducer Housing to Part Transducer inserted into housing completely
WRITE LEVEL Reset D -- auto
PART 12 LOP Panels for NAS9-13578
SET-UP GEOMETRY
t
49shy
E-9
AIamp1flgtTT B
APPENDIX S
12 LOP Reference Panels
Drill HoleReference Panel 19
LOP Reference Panel 118
E-10
APPENDIX F
EDDY CURRENT INSPECTION AND RECORDING OF LACK OF PENETRATION (LOP) ALUMINUM
PANELS UNSCARFED CONDITION
10 SCOPE
11 This procedure covers eddy current inspection for detecting lack
of penetration flaws in welded aluminum panels
20 REFERENCES
21 Manufacturers instruction manual for the NDT Instruments Model
Vector -11 Eddy Current Instrument
22 Nondestructive Testing Training Handbooks P1-4-5 Volumes I and 11
Eddy Current Testing General Dynamics 1967
23 Nondestructive Testing Handbook McMasters Ronald Press 1959
Volume II Sections 35-41
30 EQUIPMENT
31 NDT Instruments Vector lll Eddy Current Instrument
311 20 KHz Probe for Vector 111 Core Diameter 0250 inch
NOTE This is a single core helically wound coil
32 NDE LOP Reference Panels
321 12 inch panels Nos 1 and 2
322 18 inch panels Nos 89 and 115
3-3 SR 150 Budd Ultrasonic Bridge
34 319DA Alden Recorder
35 Special Probe Scanning Fixture No 1 for LOP Panels0
36 Special Eddy Current Recorder Controller Circuit
37 Dual DC Power Supply 0-25V 0-lA (Hp Model 6227B or equivalent)
38 Special AutoscalerEddy Current Meter Circuit0
F-1
40 PROCEDURE
41 Connect 20 KHz Probe to Vector lll instrument
42 Turn instrument power on and set Sensitivity Course control to
position 1
43 Check batteris by operating power switch to-BAT position (These
should be checked every two hours to use)
431 Meter should read above 70
44 Connect Recorder Controller circuit
441 Set Power Supply for +16 volts and -16 volts
442 Connect Autoscaler Circuit to Vector 111 and set back panel
switch to AUTO
45 Set up weld panel scanning support fixture shims and spacers as
follows
451 Clamp an end scan plate (of the same thickness as welded
panel) to the support fixture Align the end scan plate
perpendicular to the path that the scan probe will travel
over the entire length of the weld bead Place two weld
panels side by side so that the weldbeads are aligned with
the scan probe Secure the LOP panels with weightsclamps
as required Verify that the scan probe holder is making
sufficient contact with the weld bead such that the scan
probe springs are unrestrained by limiting devices Secure
an end scan plate at opposite end of LOP panels Verify
that scan probe holder has sufficient clearance for scan
travel
452 Use shims or clamps to provide smooth scan probe transition
between weld panels and end scan plates0
F-2
46 Set Vector 111 controls as follows
X 1340
R 5170
Sensitivity Course 8 Fine 5
47 Set the Recorder Controls for scanning as follows
Index Step Increment - 020 inch
Carriage Speed - 029
Scan Limits - set to scan 1plusmn inches beyond the panel edges
Bridge - OFF and bridge mechanically clamped
48 Initiate the RecorderScan function Set the Autoscaler switch
to RESET Adjust the Vector 111 Scale control to set the recorder
display for no flow or surface noise indications
49 Set the Autoscaler switch to RUN
410 When all of the signatures of the panels are indicated (white disshy
play) stop the Recorder Use the Carriage Scan switch on the Reshy
corder control panel to stop scan
411 Annotate recordings with panelsidethicknessreference edge
identification data
412 Repeat 45 48 through 411 with panel sides reversed for back
side scan
413 Evaluate recordings for flaws and enter panel flaw location and
length on applicable data sheet Observe correct orientation of
reference hole edge of each panel when measuring location of a flaw
50 PERSONNB
51 Only qualified personnel shall perform inspections
6o SAFETY
61 Operation should be in accordance with Standard Safety Procedure
used in operating any electrical device
F-
APPE DIX G
EDDY CURRENT INSPECTION AND C-SCAN RECORDING OF LOP ALUMIM
PANELS SCARFED CONDITION
10 SCOPE
11 This procedure covers eddy current C-scan inspection detecting
LOP in Aluminum panels with scarfed welds
20 REFERENCES
21 Manufacturers instruction manual for the NDT instruments
Model Vector 111 Eddy Current Instrument
22 Nondestructive Testing Training Handbooks P1-4-5 Volumes
I and II Eddy Current Testing General Dynamics 1967
23 Nondestructive Testing Handbook MeMasters Ronald Press
1959 Volume II Sections 35-41
30 EQUIPMENT
31 M Instruments Vector 111 Eddy Current Instrument
311 20 KHz probe for Vector 111 Core diamter 0250 inch
Note This is a single core helically wound coil
32 SR 150 Budd Ultrasonic Bridge
33 319DA Alden Recorder
34 Special Probe Scanning Fixture for Weld Panels (A)
35 Dual DC Power Supply 0-25V 0-lA (HP Model 6227B or equivalent)
36 DE reference panel no 4 LOP reference panels no 20(1) and
No 36(18)
37 Special Eddy Current Recorder Controller circuit
G-1
40 PROCEDURE
41 Connect 20 KHz probe to Vector 111 instrument
42 Turn instrument power on and set SENSITIVITY COURSE control
to position lo
43 Check batteries by operating power switch to BAT position Batteries
should be checked every two hours of use Meter should read above 70
44 Connect C-scanRecorder Controller Circuit
441 Set Power Supply for +16 volts and -16 volts
442 Set s EC sivtch to EC
44deg3 Set OP AMP switch to OPR
444 Set RUNRESET switch to RESET
45 Set up weld panel scanning support fixture as follows
4o51 Clamp an end scan plate of the same thickness as the weld
panel to the support fixture One weld panel will be
scanned at a time
452 Align the end scan plate using one weld panel so that
the scan probe will be centered over the entire length
of the weld bead
453 Use shims or clamps to provide smooth scan transition
between weld panel and end plates
454 Verify that scan probe is making sufficient contact with
panel
455 Secure the weld panel with weights or clamps as required
456 Secure an end scan plate at opposite end of weld panel
-2
46 Set Vector III controls as follows
X 0500
R 4240
SENSITIVITY COURSE 8 FINE 4
MANUALAUTO switch to MAN
47 Set the Recorder controls for scanning as follows
Index Step Increment - 020 inch
Carriage Speed -029
Scan Limits - set to scan l inches beyond the panel edge
Bridge shy
48 Manually position the scan probe over the center of the weld
49 Manually scan the panel to locate an area of the weld that conshy
tains no flaws (decrease in meter reading)
With the probe at this location adjust the Vector 111 Scale conshy
trol to obtain a meter indication of 10 (meter indication for
switching point is 25)o
410 Set Bridge switch to OFF and locate probe just off the edge of
the weld
411 Set the Bridge switch to BRIDGE
412 Initiate the RecorderScan function
413 Annotate recordings with panel reference edge and serial number
data
414 Evaluate recordings for flaws and enter panel flaw location and
length data on applicable data sheet Observe correct orientation
of reference hold edge of each panel when measuring location of
flaws
50 PERSONNEL
51 only qualified personnel shall perform inspection
60 SAFETY
6i Operation should be in accordance with Standard Safety Procedure
used in operating any electrical device0
C -4
APPENDIX H
ULTRASONIC INSPECTION FOR TIGHT FLAWS DETECTED BY NDT PROGRAM -
WELD PANELS HAVING CROWNS shy
10 SCOPE
11 This procedure covers ultrasonic inspection of weld panels
for detecting fatigue cracks located in the Weld area
20 REFERENCES
21 Manufacturers instruction manual for the UM-715 Reflectoscope
instrument
22 Nondestructive Testing Training Handbook P1-4-4 Volumes I II
and III Ultrasonic Testing General Dynamics 1967
23 Nondestructive Testing Handbook McMasters Ronald Press 1959
Volume II Sections 43-48
30 EQUIPMENT
31 UM-715 Reflectoscope Automation Industries
32 iON PulserReceiver Automation Industries
33 E-550 Transigate Automation Industries
34 UFD-l Sonatest Baltue
35 SIJ-385 25 inch diameter flat 100 MHz Transducer Automation
Industries
36 SR 150 Budd Ultrasonic Bridge
37 319 DA Alden Recorder
38 Reference Panels -For thin panels use 8 for transverse
cracks and 26 for longitudinal cracks For thick panels use
36 for transverse carcks and 41 for longitudinal cracks
40 PERSONNEL
41 The ultrasonic inspection shall be performed only by technically
qualified personnel
50 PROCEDURE
51 get up equipment per setup sheet on page 3
511 Submerge panels Place the reference panels (for the
material thickness and orientation to be inspected)
so the bridge indices toward the reference hole
Produce a C scan recording and compare with the
reference recording
5111 If the comparison is not favorable adjust the
controls as necessary until a favorable recording
is obtained
Submerge scan the weld area and record in both the longitudinal52
and transversedirections Complete one direction then change
bridge controls and complete the other direction (see page 3 amp 4)
521 Identify on the recording the starting edge of the panel
location of Ref hole and direction of scanning with
respect to the weld (Longitudinal or transverse)
53 On completion of the inspection or at the end of shift whichshy
ever occurs first rescan the reference panel (for the orientation
and thickness in progress) and compare recordings
531 When removing panels from water thoroughly dry each panel
54 Complete the data sheet for each panel inspected
541 The X dimension is measured from the edge of panel
Zero designation is the edge with the reference hole
55 After completing the data sheet roll up recordings and on
the outside of roll record the following information
A Date
B Name of Operator
C Panel Type (stringer weld LOP etc)
D Inspection Name(US EC etc)
-2 E Sequence Nomenclature
5BTRAS0NIC SET-P91 SHET Page 3
PATE O1674
TIOD ~ieseeho 32a incident angle in water
OPERATOR Lovisone
ISTRII)ENT Um 715 Refectoscope with iON plserReceivero
PLSE LENGTH -amp Mit
PULSE TnING -ampFor max Signal
OClockREJECT ampThree
S99SIPIVITY Using the ultrasonic fat crack Cal Std panel add shims -or corree thickness of panels to be inspected Alig transducer o small hol of the Stamp anA adjtist sensitivity to obtain a signal of 16inches for transverse and O4 inches for
longitudal
FRMUI4 CV 10 -MHZ
GATE START -04
GATE LEIGTH 2
TRAMSDUCEP Srd 365 25lO0 SAJ 2h061 0
17 measured P 32 tilt center of transducerWAVER PATH to top of panel
1RITE LEVEL ( Auto Reset
PART PATDIUE crack weld p anels with crown
BRIDGE CONTROLS Carriage Speed 030 Step Increment 030
SET-UP GEOMTRr
(--SCAN--gt
STEP5TEP
v-seLongitudal Tr
H-3
~-T I ipTCQn4J n1 iR i -
Xilk
-X1
E Sf IWIINT2
A+6s
QcopyA A-80 Ol
DELAY
xo
USP RNGATE A Tr
D)lELAYGATE
tF I SWEEP RAM~EGAIN AUX GAIN
~ 01poundLf [ TFRE~~ JiTI)PIOINE~~tDm H
10
IOFF
(WV PRflBL DELAY C) PRFRE4 l(J) r R1-4 QOU X)IhI) SINLE T
PANEL 8 FOR TRISVERSE WELD AREA
SCAN OF PANEL 36 FOR TRANSVEE
LD AREA SCAN OF
DEFECT 44 FROM REFERENCE END DEFECT 111 FROM REFERENCE END
REF END
REF END
ORIGINAL PAGE LS
OF PooRQUALsr
PANEL 26 REFERENCE RECORDING FOR LONGITUDAL SCAN OF WELD AREA
REFERENCE END
DEFECT MEASUREMENTS 19-- 37
PANEL 41 REFERENCE RECORDING FOR LONGITUDAL SCAN OF WELD AREA
DEFECTS 295 14
E-6
I
poundS2MEI-MNT A
APPEUDIX H
SET-UP FOR 18 WELDED FATIGUE CRACK PANELS
DATE 082975
METHOD Pitch-Catch Pulse-Echo 27 12 Incident Angle Angle Indicator + 4 120
OPERATOR Steve Mullen
INSTRUMENT UM 715 Reflectoscope with 16NPulserReceiver
PULSE LENGTH Max
PULSE TUNING MAX Signal
REJECT Weld with Crown Flush WeldJ I
SENSITIVITY 10 x 10
FREQUENCY 15 MHZ
GATE START WCroxqn Flush
4 4
GATE LENGTH 3 z 3 t-
TRANSDUCER Transmitter 464-15 MHZ SN 6391 Flat Receiver SIZ-15 MHz SN 10755 Flat
WATER PATH I From Transducer Housing to Panel
WRITE LEVEL + Auto
Reset
PART 18 Weld Panels
SET-UP GEOMETRY
11-040H
F-7
Ys -Leze-~rL
WabrbMEL
pil ERshy
2crKCath~~5bA
AZDE[T B
APPENDIX H
SET-UP FOR 12 WELDED FATIGUE CRACK PANELS
DATE 081575
METHOD Pitch-Catch Pulse-Echo 21 120 incident angle for long defect 180 incident angle for transverse scan in water
Angle Indicator Long = -2 120
Trans= -50
OPERATOR Steve Mullen
INSTRUMENT UM-715 Reflectoscope with IONPulserReceiver
PULSE LENGTH j - 300 oclock
PULSE TUNING For Max Signal
REJECT 1000 oclock
SENSITIVITY 2 x 10
FREQUENCY 5 M4Hz
GATE START 4
GATE LENGTH 3
TRANSDUCER TX-SIZ-5 SN 26963 RX-SIZ-5 SN 35521
WATER PATH 16 From Transducer Housing to the panel
WRITE LEVEL + Auto Reset
PART 12 Fatigue Crack Welded Panels
SET-UP GEOMETRY 12 Weld Panel
H-9
AED T 3
APP-Trlrl H
-DIZILL
APPENDIX i
ULTRASONIC INSPECTION FOR TIGHT FLAWS IN PANELS WITH FLUSH WELDS
10 SCOPE
11 This procedure covers ultrasonic inspection of weld panels with
flush welds
20 REFERENCES
21 Manufacturers instruction manual for the UM-715 Reflectoscope
instrument
22 Nondestructive Testing Training Handbook PI-4-4 Volumes I II
and III Ultrasonic Testing General Dynamics 1967
23 Nondestructive Testing Handbook McMasters Ronald Press 1959
Volume II Section 43-48
24 Manufacturers instruction manual for the Sonatest Flaw Detector UFD 1
30 EQUIPMENT
31 UM-715 Reflectoscope Automation Industries or Sonatest Flaw
Detector UFD-l with Recorder Interface
32 ION PalserReceiver Automation Industries (UM-715 only)
33 E-550 Transigate Automation Industries (UM-715 only)
34 SIJ-385 25 inch diameter flat 100 MHz Transducer
Automation Industries
35 SR 150 Budd Ulatrasonic Bridge
36 319 DA Alden Recorder
37 Reference Panels - For thin panels use 15 and for thick panels
use 30
40 PERSONNEL
41 The ultrasonic inspection shall be performed only by technically
qualified personnel
I-]
-2
50 PROCEDURE
51 Set up equipment per setup sheet on page 3 for UM-715 Reflectoscope
or page 4 for Sonatest equipment
511 Submerge panels Place the reference panels for the
thickness and orientation to be inspected so the bridge
steps away from the reference hole Produce a C-scan
recording and compare with the reference recording
512 If the comparison is not favorable adjust the controls
(excluding controls on the PulserReceiver unit) as
necessary until a favorable recording is obtained
52 Submerge scan the weld area and record in both the longitudinal
and transverse directions Complete one direction then change
bridge controls and complete the other direction (see set up sheets)
53 Identify on the recording the starting edge of the panel
location of reference hole and direction of scanning with respect
to the weld (longitudinal or transverse)
54 Upon completion of Lhe inspection or at the end of the shift
whichever occurs first rescan the reference panel and compare
to the reference recording
NOTE
Dry each panel thoroughly after removing from water
55 Complete the data sheet for each panel inspected
551 The dimension is measured from the edge of the panel
Zero designation is the edge with the reference hole
56 After completing the data sheet roll up recordings and on the
outside of roll record the following information
A Date
B Name of Operator
C Panel type (Flush weld)
D Inspection Name (UIS)
E Inspection Sequence7-
Ultrasonic setup sheet for 3 UM-715 Reflectoscope
DATE 07-16-74
METHOD PulseEchc 320
LovisoneOPERATOR
UM-715 ReflectoscopINSTRUMENT
PULSERRECEIVER UNIT
PULSE LENGTH Q 4Min
PULSE TUNING Q For Max sig 5 f 5l f REJECT n Ten OClock
FREQUENCY 10 MHz ____ _
SENSITIVITY Using the -5 he i Rcv -
Ultrasonic Fat
crack Cal Std
panel add shims for correct thickness of panels
to be inspected Align transducer on small hole
of the Std Panel and adjust sensitivity to obtain
a signal of 16 inches for transverse scan and 04
inches for longitudal scan (Sensitivity adjustment
made with gate turned OFF)
TRANSIGATE UNIT
GATE START 46 4
GATE LENGTH 22
WRITE LEVEL Auto Reset +
SYNC Main Pulse
TRANSDUCER SIJ 385 25100 SN 24061
WATER PATH 17 measured 32 tilt center of transducer to panel
BRIDGE CONTROLS Carriage Speed 030 Step Increment 030
PART TYPE Fatigue crack weld panels with crown and flush welds
18 and 12 thickness SET-UP GEOMETRY
STEP FLSTFP
I1~34
xi ULTRASIMNC bhT-UP Tr-CHNlqUE PROGRAH
DATE ePlo
-3 7 w]d
X10 - I
DELAY Q
110 TB v
TXE
A+B
QA
-
IDTII
SENSITIVITY
A- B
+
I
DEILAY
X10
TRANSDUCER
GATE OUT UFD I
228 WIDTHf
(OFF
XO I
01 IN
X0 I
DELAYT4
21
Xi Xl
Q DISPLAY
NORM LIN0S-P 00
GAIN AUX GAIN
REST LOG OFF
GAIN SWEEP RANE
ON OUT
FREQt - -4
O0
RX
OpIT
R REJECT DOUBLE
ORIGINAL PAGE IS 6F POOR QUAI=
Q _
IN
SINLE OFF PROBE DELAY O
TX PRF
ULTRASON1C SET-UP TEcHNtQUE PRORAM Yj Fflush wjd xi DATE -g
0 x1o
0 +
DELAY 0
Xl
0 x1O TB0 WIDTH
E SENSITIVITY 0
TX
A+B
A-B
DELAY C
TRANSDUCER
GATE OUT UFD 1
WIDTH OFF IN MM MM X0 1 XO I
copy60 xi xi
NORM LIN 0
REST LOG OFF
GAIN AUX GAIN GAIN SWEEP
OUT GANSEPRAZEk
ON OUT
OFF IN
FREQ REJECT DOUBLE U SINGLE
OFF PROBE DELAY 0 TX
PRF
RX 0
BEFEIENOE PANEL 15 I8 Flush
BFEBENCE PANEL O 12H Flush
ORIGINAL PAGE IS OF POOR QUAupy
I-6
- APPENDIX J -
EDDY CURRENT INSPECTION AND RECORDING OF
WELD CRACK ALUMINUM PANELS HAVING CROWNS
10 SCOPE
11 This procedure covers eddy current recorded inspection for
detecting cracks in welded aluminum panels having crowns
20 REFERENCES
21 Manufacturers instruction manual for the NDT Instruments Model
Vector 111 Eddy Current Instrument
22 Nondestructive Testing Training Handbooks PI-4-5 Volumes I and
II Eddy Current Testing General Dynamics 1967
23 Nondestructive Testing Handbook McMasters Ronald Press 1959
Volume II Sections 35-41
30 EQUIPMENT
31 NDT Instruments Vector III Eddy Current Instrument
311 100 KHz Probe for Vector ill Core diameter 0063 inch
NOTE This is a single core helically wound coil
32 NDE Reference Panel 4 Flaw Length 155 inch
33 SR 150 Budd Ultrasonic Bridge
34 319DA Alden Recorder
35 Special Probe Scanning Fixture for Weld Crack Panels (2)
36 Special Eddy Current Recorder Controller Circuit
37 Dual DC Power Supply 0-25V 0-1A (Hp Model 6227B or equivalent)
40 PROCEDURE
41 Connect 100KHz Probe to Vector I1 instrument
42 Turn instrument power on and set Sensitivity Course control to
position 1
43 Check batteries by operating power switch to BAT position
These shobl be checked every two hours of use
431 Meer should read above 70
44 Connect Recorder Controller circuit
441 Set Power Supply for +16 volts and -16 volts
45 Set up weld panel scanning support fixture shims and spacers
as follows
451 If longitudinal welded panels are being scanned clamp an
end plate of the same thickness as welded panel to the
support fixture Align the end scan plate using one
weld panel so that the scan probe will be centered over J-1
the entire length of the weld bead Secure the weld
panel with weightsclamps as required Verify that the
scan probe holder is making sufficient contact with the
weld bead such that the scan probe springs are unrestrained
by limiting devices Secure an end scan plate at opposite
end of weld panel Verify that scan probe holder has
sufficient clearance for scan-travel One logitidinal
welded panel will be scanned at a time
452 If transverse welded panels are being scanned set up
as in 451 except that two weld panels are placed side
by side so that the weld beads are aligned with the scan
probe
453 Use shims or clamps to provide smooth scan probe transition
between weld panel and end plates
46 Set Vector 111 controls as follows
x 1897
R 4040
Sensitivity Course 8 Fine 5
47 Set the Recorder controls for scanning as follows
Index Step Increment 020 inch
Carriage Speed 029
Scan Limits set to scan 1 inches beyond the panel edges
Bridge OFF and bridge mechanically clamped
48 Manually move the scan probe over panel inspection region to
determine background level as close as possible to the Recorder
Controller switching point (meter indication for switching point
is 40 for positive-going indication of a flaw 42 for negativeshy
going indication)
49 Initiate the RecorderScan function
410 Vary the Vector 11 Scale control as required to locate flaws
Use the Carriage Scan switch on the Recorder control panel to
stop scan for resetting of background level
411 Repeat step 48 (background level determination) and 49 for the
second panel if located in the support fixture Annotate recordings
with panel identification data
J-2
412 Evaluate recordings for flaws and enter panel and flaw location
on applicable data sheet Observe correct orientation of
reference hole edge of each panel when measuring location of
a flaw
50 PERSONNEL
51 Only qualified personnel shall perform inspections
60 SAFETY
61 Operation should be in accordance with StandardSafety Procedure
used in operating any electrical device
J-3
AMENDMENT A
- APPENDIX -
NOTE
This amendment covers changes
in procedure from raster scan
recording to analog-recording
442 Connect Autoscaler circuit to Vector ill and set back panel
switch to AUTO
48 Initiate the Recorder Scan function Set the Autoscaler switch
to RESET
49 Adjust the Vector 1il Scale control to set the recorder display for
no flaw or surface noise indications
410 Set the Autoscaler switch to RUN
411 When all of the signatures of the panels are indicated (all white
display) stop the recorder Use the carriage Scan switch on the
Recorder Control Panel to stop scan
412 Annotate recordings with panelsidethicknessreference edge
identification data
413 Evaluate recordings for flaws and enter panel and flaw location
on applicable data sheet Observe correct orientation of reference
hole edge of each panel when measuring location of a flaw
J-4
-APPENDIXK -
EDDY CURRENT INSPECTION AND C-SCAN RECORDING OF
FLUSH WELD ALUMINUM PANELS
10 SCOPE
11 This procedure covers eddy current C-scan inspection
detecting fatigue cracks in Aluminum panels with flush welds
20 REFERENCES
21 Manufacturers instruction manualfor the NDT instruments
Model Vector Ill Eddy Current Instrument
22 Nondestructive Testing Training Handbooks P1-4-5
Volumes I and I1 Eddy Current Testing General Dynamics 1967
23 Nondestructive Testing Handbook MeMasters Ronald Press 1959
Volume II Sections 35-41
30 EQUIPMENT
31 NDT Instruments Vector 111 Eddy Current Instrument
311 100 KHz probe for Vector 111 Core diameter 0063 inch
NOTE This is a single cor helically wound coil
32 SR 150 Budd Ultrasonic Bridge
33 319DA Alden Recorder
34 Special Probe Scanning Fixture for Weld Panels (5)
35 Dual DC Power Supply 0-25V 0-1A (HP Model 6227B or equivalent)
36 NDE reference panel no 41
37 Special Eddy Current Recorder Controller circuit
40 PROCEDURE
41 Connect 100 KIz probe to Vector 111 instrument
2 Turn instrument power on and set SENSITIVITY COURSE control
to position 1
43 Check batteries by operating power switch to BAT position
Batteries should be checked every two hours of use Meter
should read above 70
44 Connect C-scanRecorder Controller Circuit
441 Set Power Supply for +16 volts and -16 volts
442 Set US EC switch to EC
443 Set OP AMP switch to OPR
444 Set RUNRESET switch to RESET
45 Set up weld panel scanning support fixture as follows
451 Clamp an end scan plate of the same thickness as the
weld panel to the support fixture One weld panel
will be scanned at a time
452 Align the end scan plate using one weld panel so that
the scan probe will be centered over the entire length of
the weld bead
453 Use shims or clamps to provide smooth scan transition
between weld panel and end plates
454 Verify that scan probe is making sufficient contact with
panel
455 Secure the weld panel with weights or clamps as required
456 Secure an end scan plate at opposite end of weld panel
46 Set Vector III controls as follows
X 1895
R 4040
SENSITIVITY COURSE 8 FINE 4
MANUALAUTO switch to MAN
47 Set the Recorder controls for scanning as follows
Index Step Increment 020 inch
CarriageSpeed 029
Scan Limits set to scan i inches beyond the panel edge
Bridge BRIDGE
48 Manually position the scan probe over the center of the weld
49 Manually scan the panel to locate an area of the weld that conshy
tains no flaws (decrease in meter reading)
With the probe at this location adjust the Vector ill Scale conshy
trol to obtain a meter indication of 10 (meter indication for
switching point is 25)
410 Set Bridge switch to OFF and locate probe just off the edge
of the weld
411 Set the Bridge switch to BRIDGE
412 Initiate the RecorderScan function
413 Annotate recordings with panel reference edge and serial
number data
41 1 Evaluate recordings for flaws and enter panei flaw location
and length data on applicable data sheet Observe correct
orientation of reference hole edge of each panel when measuring
location of flaws
50 PERSONNL
51 Only qualified personnel shall perform inspection
6o SAFETY
61 Operation should be in accordance with Standard Safety Procedure
used in operating any electrical device
X-5

PREFACE
This report was prepared by Martin Marietta Aerospace under contract NAS 9-13578 Work reported was initiated by National Aeronautics and Space Administration Lyndon B Johnson Space Center to evaluate the capability of nondestructive evaluation techniques to detect flaws in weldments and stringer stiffended panels The work describshyed herein was completed between June 30 1973 and October 30 1975 Work was conducted under the technical direction of Mr W L Castner of the Johnson Space Center
At Martin Marietta Aerospace Mr Ward D Rummel provided technical direction and program management Mr Richard A Rathke was Principle Investigator for eddy current and statistical data analysis Mr Paul H Todd Jr was principle investigator for other nondestrucive-evaluation techniques Dr Conrad F Fiftal C Toth W Post R Chihoski and W Phillips provided support in all sample preparation Messrs Thomas L Tedrow H D Brinkerhoff S Mullen and S R Marston provided support in X-radiographic investigations Additional inspection and analysis support were provided by Messrs L Gentry H Lovinsone R Stadler and J Neri Jr Special X-radiograph analysis was provided by Mr H Ridder Magnaflux Corporation
Management support was provided by Messrs G McGee R Morra C Duclon C Cancallosi and R Daum
Editing and typing were done by Ms B Beddinger and J Dummer
The assistance and cooperation of all contributing personnel are appreciated and gratefully acknowledged We also appreciate the program direction support and contributions of Mr W L Castner
and gratefully acknowledge his continuing participation
ii
CONTENTS
Page
PREFACE
INTRODUCTION I-I and 1-2
STATE-OF-THE-ART NONDESTRUCTIVE TESTING (NDT) METHODS II-i X-radiography 11-2 Penetrant I 11-5
thru TI-il
Ultrasonic Inspection 11-6 Eddy CurrentI 11-8
INTEGRALLY STIFFENED STRINGER PANEL EVALUATION I-i Specimen Preparation 111-4
thru
NDT Optimization I 111-9 Test Specimen Evaluation 111-17 Panel Fracture 111-20 Data Analysis 111-20 Data Results 111-29
111-32
EVALUATIONdeg OF LACK OF PENETRATION (LOP) PANELS IV-i Specimen Preparation IV-4 NDT Optimization
thru
IV-5 Test Specimen Evaluation IV-10 Panel Fracture IV-12 Data Analysis IV-12 Data Results IV-23
IV-34
FATIGUE-CRACKED WELD PANEL EVALUATION Specimen Preparationbull o V-I
NDT Optimization V-5 Test Specimen Evaluation
thru
V-7 Panel Fracture V-9 Data Analysis V-9 Data Results V-25
V-41
CONCLUSIONS AND RECOMMENDATIONS VIand VT-2
Ii
Page
APPENDIX A- LIQUID PENETRANT INSPECTION PROCEDURE FOR WELD PANELS STIFFENED PANELS AND LOP PANELS A-I
APPENDIX B- ULTRASONIC INSPECTION FOR TIGHT FLAW
DETECTION BY NDT PROGRAM - INTEGRALLY STIFFENED PANELS B-I
APPENDIX C- EDDY CURRENT INSPECTION AND RECORDING FOR INTEGRALLY STIFFENED ALUMINUM PANELS C-i
APPENDIX D- X-RADIOGRAPHIC INSPECTION PROCEDURES FOR DETECTION OF FATIGUE CRACKS AND LOP IN WELDED PANELS D-i
APPENDIX E- ULTRASONIC INSPECTION FOR TIGHT FLAWS DETECTION BY NDT PROGRAM - LOP PANELS E-1
APPENDIX F- EDDY CURRENT INSPECTION AND RECORDING OF LACK OF PENETRATION (LOP) ALUMINUM PANELS UNSCARFED CONDITION F-I
APPENDIX r- EbDY CURRENT INSPECTION AND C SCAN RECORDING OF LOP ALUMINUM PANELS SCARFED CONDITION G-i
APPENDIX H- ULTRASONIC INSPECTION FOR TIGHT FLAWS DETECTED BY NDT PROGRAM - WELD PANELS HAVING CROWNS H-I
APPENDIX I- ULTRASONIC INSPECTION FOR TIGHT FLAWS IN PANELS WITH FLUSH WELDS oI-I
APPENDIX J- EDDY CURRENT INSPECTION AND RECORDING OF WELD CRACK ALUMINUM PANELS HAVING CROWNS J-1
APPENDIX K- EDDY CURRENT INSPECTION AND C-SCAN RECORDING OF FLUSH WELD ALUMINUM PANELS K-i
iv
Figure
III-1 Anticipated Surface Stress Distribution for Axially
Loaded 2219-T87 Integrally Stiffened Panel 111-2
111-2 NDT Evaluation Sequence for Integrally Stiffened III-3Panels
111-3 Integrally Stiffened Panel Configuration 111-5 111-4 Schematic Side View of the Starter Flaw and Final
Crack Configurations Integrally Stiffened Panels 111-6
111-5 Ultrasonic Reflected Energy Response 111-12
111-6 Eddy Current Probe 111-14
111-7 Typical Eddy Current Scanning setup for Stringer Panels 111-15
IlI-8 Typical Eddy Current Recordings 111-16
111-9 Stringer-to-Subpanel Attachment 111-18 III-10 Integrally Stiffened Panel Layout and Riveted Panel
Configuration S en 111-19
iii-11 Crack Detection Probability for Integrally Stiffened
Panels by the Penetrant Method Plotte- at 95
Probability and 95 Confidence Level 111-30
111-12 Crack Detection Probability for Integrally Stiffened Panels by the Ultrasonic Method Plotted at 95
Probability and 95 Confidence Level 111-31
111-13 Crack Detection Probability for Integrally Stiffened Panels by the Eddy Current Method Plotted at 95
Probability and 95 Confidence Level 111-32
IV-l Typical Weldment Lack of Penetration Defects IV-I IV-2 NDT Evaluation Sequence for Lack of Penetration
Panels IV-3
IV-3 Schematic View of a Buried LOP in a Weld with Representative Photomicrograph Crossectional Views of a Defect IV-6
IV-4 Spring-Loaded Eddy Current Scanning Probe Holder for Welded Panels with Crowns IV-8
IV-5 Spring-Loaded Eddy Current Scanning Probe Holder
for Flat Panels IV-9
IV-6 Schematic Side View of a LOP (Lune) Flaw Showing Critical Dimensions IV-13
IV-7 Flaw Detection Probability for LOP Panels by the
Penetrant Method Plotted at 95 Probability and 95 Confidence IV-31
IV-8 Flaw Detection Probability for LOP Panels-by the Ultrasonic Method Plotted at 95 Probability and
95 Confidence IV-32
IV-9 Flaw Detection Probability for LOP Panels by the Eddy
Confidence IV-33 Current Method Plotted at 95 Probability and 95
v
IV-1O Flaw Detection Probability for LOP Panels by the X-radiograph Method Plotted at 95 Probability and 95 Confidence -- IV-34
V-I NDT Evaluation Sequence for Fatigue-Cracked Welded Panels V-2
V-2 Fatigue-Cracked Weld Panels V-3 V-3 Schematic Side View of the Starter Flaw and Final
Flaw Configurations for Fatigue-Cracked Weld Panels V-4
V-4 Crack Detection Probability for Longitudinal Welds With Crowns by the Penetrant Method Plotted at 95 Probability and 95 Confidence V-26
V-5 Crack Detection Probability for Longitudinal Welds With Crowns by the Ultrasonic Method Plotted at 95 Probability and 95 Confidence V-27
V-6 Crack Detection Probability for Longitudinal Welds With Crowns by the Eddy Current Method Plotted at 95
Probability and 95 Confidence V-28 V-7 Crack Detection Probability for Longitudinal Welds
With Crowns by the X-radiograph Method Plotted at 95
Probability and 95 Confidence V-29 V-8 Crack Detection Probability for Transverse Welds
with Crowns by the Penetrant Method Plotted at 95 Probability and 95 Confidence V-30
V-9 Crack Detection Probability for Transverse Welds with Crowns by the Ultrasonic Method Plotted at 95 Probability and 95 Confidence V-31
V-10 Crack Detection Probability for Transverse Welds with Crowns by the Eddy Current Method Plotted at 95 Probability and 95 Confidence V-32
V-Il Crack Detection Probability for Transverse Welds with Crowns by the X-radiograph Method Plotted at 95
Probability and 95 Confidence V-33 V-12 Crack Detection Probability for Flush Longitudinal
Welds by the Penetrant Method Plotted at 95 Probability and 95 Confidence V-34
V-13 Crack Detection Probability for Flush Longitudinal Welds by the Ultrasonic Method Plotted at 95 Probability and 95 Confidence V-35
V-14 Crack Detection Probability for Flush Longitudinal Welds by the Eddy Current Method Plotted at 95
Probability and 95 Confidence V-36
V-15 Crack Detection -Probability for Flush Longitudinal Welds by the X-radiograph Method Plotted at 95 Probability and 95 Confidence V-37
V-16 Crack Detection Probability for Flush Transverse Welds by the Penetrant Method Plotted at 95 Probability and 95 Confidence V-38
vi
V-17 Crack Detection Probability for Flush Transverse Welds by the Ultrasonic Method Plotted at P5 Probability and 95 Confidence V-39
V-18 Crack Detection Probability for Flush Transverse Welds by the Eddy Current Method Plotted at 95 Probability and 95 Confidence V-40
V-19 Crack Detection Probability for Flush Transverse Welds by the X-radiograph Method Plotted at 95 Probability and 95 Confidence V-41
vii
Table
III-I Parameters for Fatigue Crack Growth in Integrally Stiffened Panels I-7
II-2 Stringer Panel Flaw Distribution I1-8 111-3 Actual Crack Data Integrally Stiffened Panels 111-21 111-4 NDT Observations Integrally Stiffened Panels 111-23 IV-I Actual Flaw Data LOP Panels IV-14 IV-2 NDT Observations LOP Panels IV-18 IV-3 NDT Observation by the Penetrant Method LOP
IV-4 Panels NDT Observations by the Ultrasonic Method Merged
V-22
Data LOP Panels _ IV-26 V-I Parameters for Fatigue Crack Growth in Welded
Panels V-6 V-2 Actual Crack Data Fatigue Cracked Longitudinal
Welded Panels with Crowns V-10 V-3 Actual Crack Data Fatigue Cracked Transverse
Welded Panels with Crowns_ V-12 V-4 Actual Crack Data Fatigue Cracked Flush
Longitudinal Welded Panels V-13 V-5 Actual Crack Data Fatigue Cracked Flush
Transverse Welded Panels V-15 V-6 NDT Observations Fatigue Cracked Longitudinal
Welded Panels with Crowns V-17 V-7 NDT Observations Fatigue Cracked Transverse
Welded Panels with Crowns V-19 V-8 NDT Observations Fatigue Cracked Flush
Longitudinal Welded Panels V-21 V-9 NDT Observations Fatigue Cracked Flush Transverse
Welded Panels V-24
viii
I INTRODUCTION
Recent advances in engineering structural design and quality assurance techniques have incorporated material fracture characshyteristics as major elements in design criteria Fracture control design criteria in a simplified form are the largest (or critshyical) flaw size(s) that a given material can sustain without fracshyture when subjected to service stresses and environmental condishytions To produce hardware to fracture control design criteria it is necessary to assure that the hardware contains no flaws larger than the critical
Many critical structural hardware components including some pressure vessels do not lend themselves to proof testing for flaw screening purposes Other methods must be used to establish maximum flaw sizes that can exist in these structures so fracture analysis predictions can be made regarding-structural integrity
Nondestructive- testing--ENDT)- is- the only practica-l way-in which included flaws may be detected and characterized The challenge to nondestructive testing engineering technology is thus to (1) detect the flaw (2) determine its size and orientation and (3) precisely locate the flaw Reliance on NDT methods for flaw hardshyware assurance requires a knowledge of the flaw size that each NET method can reliably find The need for establishing a knowshyledge of flaw detection reliability ie the maximum size flaw that can be missed has been identified and has been the subject of other programs involving flat 2219 aluminum alloy specimens The next logical step in terms of NASA Space Shuttle program reshyquirements was to evaluate flaw detection reliability in other space hardware elements This area of need and the lack of such data were pointed out in NASA TMX-64706 which is a recent stateshyof-the-art assessment of NDT methods
Donald E Pettit and David W Hoeppner Fatigue FZcao Growth and NDI Evaluation for Preventing Through-Cracks in Spacecraft Tankshyage Structures NASA CR-128560 September 25 1972
R T Anderson T J DeLacy and R C Stewart Detection of Fatigue Cracks by Nondestructive Testing Methods NASA CR-128946 March 1973
Ward D Rummel Paul H Todd Jr Sandor A Frecska and Richard A Rathke The Detection of Fatigue Cracks by Nondestructive Testing Methods NASA CR-2369 February 1974
I-i
-------------------------------------------------------------
The program reported here was conducted to determine the relishy
ability of nondestructive testing methods in detecting tightly
closed flaws in three Space Shuttle structural elements ie
(1) cracks in the radii of integrally stiffened 2219 aluminum
alloy structures (2) lack of penetration (LOP) in welded 2219
aluminum alloy structures and (3) cracks in the weld area in
welded 2219 aluminum alloy structures X-radiographic penetrant
ultrasonic and eddy current methods were evaluated
As a secondary objective production processing steps were simushy
assess the effects of various operations and constraintslated to on inspection sensitivity and to aid in analysis and planning of
inspection operations at optimum points in the production sequence
Experience has shown that one of the most difficult flaws to deshy
tect by NDT techniques is a small tightly closed flaw and that
this is one of the flaw types most detrimental to load-carrying
Tightly closed flaws may be simulated by artificiallystructures induced fatigue cracks and by lack of penetration (LOP) in two
opposing pass weldments By using these primary flw types the
influences of crack orientation location etc can be evaluated by
systematic variation of sample preparation and inspection sequences
Methods previously developed were used to prepare test specimens
NDT methods were optimized for these specimens in accordance with
industry practices NDT evaluation of samples was conducted and
documented to establish a data base for rigorous analysis of NDT
capabilities Statistical analysis methods established previously
under NASA contract NAS9-12276 and in current investigation under
NASA contract NAS3-18907t were used to analyze and present the
data
Since the output of the program was engineering data care was
taken in the program to randomize samples inspection sequences
and data reporting Inspection analyses were performed indepenshy
dently by operators who had no knowledge of the number of flaws
in test panels Blank panels were introduced to further randomize
data and to negate anticipation of flaws The results are intended
to reflect attainable detection sensitivities and reliabilities when
NDT techniques are directed toward specific flaw types
The program was functionally divided into three elements relating
to the panel and flaw types These elements are discussed separshy
ately in the following chapters
S Klima Assessment of NDT ReZiability Data NAS3-18907
(to be completed in June 1975)
1-2
-----------------------------------------------------------------
-------------------------------------------------------------------
II STATE-OF-THE-ART NONDESTRUCTIVE TESTING (NDT) METHODS
Nondestructive testing nondestructive inspection and nondesshy
tructive evaluation in the broadest sense denote testing inspecshy
tion andor evaluation of a material component or system withshy
out altering or destroying the functional capability of the tested
item Like other forms of testing NDT is used to reduce risk in
the functional performance of the item and as such provides a
measure of insurance for the producer evaluator andor operator
of the item Unlike other forms of testing it offers the capashy
bility for 100 testing or sampling and provides economic advantage
by assurance of no loss of any part of the item These advantages
have been both aids and liabilities in the orderly development of
the technology Although nondestructive testing methods are widely
used little quantitative information concerning testing capashy
bilities has been produced This program was directed toward
quantitative assessment of NDT methods It was not intended to
advance the state of the art in terms of new methods or increased
sensitivity It was intended to provide a practical engineering
tool for application of methods now used in the industry The rshyradiography (X-ray) liquid penetrant ultrasonic and eddy current
test methods generally used for assurance of aluminum alloy matershy
ials components and assemblies were selected for this study
Many testing options are available in application of these methods
This report addresses generally applied techniques as used in stateshy
of-the-art engineering technologies
Robert B Neuschaefer and James B Beal Assessment of and Standshy
ardization for Quantitative Nondestructive Testing NASA TM-Xshy64706 September 30 1972
ASME Boiler and Pressure Vessel Code (Sections I I1 VIII and IX) 1968
Military Standard Radiographic Inspection Sowndness Requireshy
ments for Fusion Welds in Aluminum and Magnesium Missile Composhynents MIL-R-45774 October 1963
J R Alburger A New Significant Penetrant Parameter - Indishy
cation Depletion Time Constant Paper presented before the
American Society for Nondestructive Testing Spring Conference Los Angeles California 1973
B G Martin and C J Adams Detection of Lack of Fusion in
Aluminum Alloy Weldments by Ultrasonic Shear Waves Technical Paperdeg3499 Douglas Aircraft Company 1965
II-i
------------------------------------------------------------------
A X-RADIOGRAPHY
X-radiography is well established as a nondestructive evaluation
tool and has been used indiscriminately as an all-encompassing inspection method for detecting flaws and describing flaw size While pressure vessel specifications frequently require Xshy
radiographic inspection and the criteria allow no evidence of
crack lack of penetration or lack of fusion on radiographs little attempt has been made to establish or control defect detecshy
tion sensitivity Further an analysis of the factors involved
clearly demonstrates that X-radiography is one of the least reshy
liable of the nondestructive techniques available for crack detecshy
tion The quality or sensitivity of a radiograph is measured by reference to a penetrameter image on the film at a location of
maximum obliquity from the source A penetrameter is a physical
standard made of material radiographically similar to the test
object with a thickness less than or equal to 2 of the test obshy
ject thickness and containing three holes of diameters four times
(4T) two times (2T) and equal to (IT) the penetrameter thickness Normal space vehicle sensitivity is 27 as noted by perception of
the 2T hole (Fig II-1)
In theory such a radiograph should reveal a defect with a depth
equal to or greater than 2 of the test object thickness Since
it is however oriented to defects of measureable volume tight
defects of low volume such as cracks and lack of penetration may
not be detected
Op cit ASME Boiler and Pressure Vessel Code
MIL R-45774
11-2
2T dia Hole
1T dia
4T dia
Hole
Thickness T Equal to 2 of the Test Material
Figure I-1 Conventional Penetrmneter (MIL-STD-453)
In practice cracks and lack of penetration defects are detected only if the axis of the crack is located along the axis of the incident radiation Consider for example a test object (Fig 11-2) that contains defects A B and C Defect A lies along the axis of the cone of radiation and should be readily detected at depths approaching the 2 sensitivity requirement Defect B whose depth may approach the plate thickness will not be detected since it lies at an oblique angle to incident radiation Defect C lies along the axis of radiation but will not be detected over its total length This variable-angle property of X-radiation accounts for a higher crack detection record than Would be predicted by g~ometshyric analysis and at the same time emphasizes the fallacy of deshypending on X-radiography for total defect detection and evaluation
11-3
Figure-I1-2 Schematic View of Crack Orientationwith Respect to the Cone of Radiation from an X-ray Tube (Half Section)
Variables in the X-ray technique include such parameters as kiloshyvoltage exposure time source film distance and orientation film
type etc Sensitivity to orientation of fatigue cracks has been demonstrated by Martin Marietta in 2219-T87 parent metal Six
different crack types were used An off-axis exposure of 6 degrees resulted in missing all but one of the cracks A 15-degree offset
caused total crack insensitivity Sensitivity to tight LOP is preshydicted to be poorer than for fatigue cracks Quick-look inspecshytion of known test specimens showed X-radiography to be insensishytive to some LOP but revealed a porosity associated with the lack of penetration
Advanced radiographic techniques have been applied to analysis of
tight cracks including high-resolution X-ray film (Kodak Hi-Rel) and electronic image amplification Exposure times for high-resoshylution films are currently too long for practical application (24
hr 0200-in aluminum) The technique as it stands now may be considered to be a special engineering tool
Electronic image processing has shown some promise for image analyshy
sis when used in the derivative enhancement mode but is affected by
the same geometric limitations as in producing the basic X-radiograph
The image processing technique may also be considered as a useful engineering tool but does not in itself offer promise of reliable crack or lack of penetration detection by X-radiography
This program addressed conventional film X-radiography as generally
applied in industry
11-4
-------------------------------------------------------
B PENETRANT
Penetrants are also used for inspection of pressure vessels to detect flaws and describe flaw length Numerous penetrant mateshyrials are available for general and special applications The differences between materials are essentially in penetration and subsequent visibility which in turn affect the overall sensishytivity to small defects In general fluorescent penetrants are more sensitive than visible dye penetrant materials and are used for critical inspection applications Six fluorescent penetrant materials are in current use for inspection of Saturn hardware ie SKL-4 SKL-HF ZL-22 ZL-44B P545 and P149
To be successful penetrant inspection requires that discontinuishyties be open to the surface and that the surface be free of conshytamination Flowed material from previous machining or scarfing operations may require removal by light buffing with emery paper or by light chemical etching Contamination may be removed by solvent wiping by vapor degreasing and by ultrasonic cleaning in a Freon bath Since ultrasonic cleaning is impractical for large structures solvent wipe and vapor degreasing are most comshymonly used and are most applicable to-this program
Factors affecting sensitivity include not only the material surshyface condition and type of penetrant system used but also the specific sequence and procedures used in performing the inspecshytion Parameters such as penetrant dwell time penetrant removal technique developer application and thickness and visual inspecshytion procedure are controlled by the inspector This in turn must be controlled by training the inspector in the discipline to mainshytain optimum inspection sensitivities
In Martin Marietta work with fatigue cracks (2219T87 aluminum)small tight cracks were often undetectable-by high-sensitivity penetrant materials but were rendered visible by proof loading the samples to 85 of yield strength
In recett work Alburger reports that controlling crack width to 6 to 8 microns results in good evaluation of penetrant mateshyrials while tight cracks having widths of less than 01 micron in width are undetected by state-of-the-art penetrants These values may be used as qualitative benchmarks for estimation of crack tightness in surface-flawed specimens and for comparison of inspection techniques This program addressed conventional fluoshyrescent penetrant techniques as they may be generally applied in industry
Op cit J R Alburger
I-5
C ULTRASONIC INSPECTION
Ultrasonic inspection involves generation of an acoustical wave in a test object detection of resultant reflected transmitted and scattered energy from the volume of the test object and
evaluation by comparison with known physical reference standards
Traditional techniques utilize shear waves for inspection Figure
11-3 illustrates a typical shear wave technique and corresponding oscilloscope presentation An acoustical wave is generated at an angle to the part surface travels through the part and is reshyflected successively by boundaries of the part and also by inshycluded flaw surfaces The presence of a-reflected signal from
the volume of the material indicates the presence of a flaw The relative position of the reflected signal locates the flaw while the relative amplitude describes the size of the flaw Shear wave inspection is a logical tool for evaluating welded specimens and for tankage
FRRNT SUR FACE SIG NAL
REFLECTED SIGNAL
PATH OF
A SOI T - T RA N SD U E R
PART GEOMETRYOSCILLOSCOPE PRESENTATION
Figure I-3 Shear Wave Inspection
By scanning and electronically gating signals obtained from the volume of a part a plan view of a C-scan recording may be genershyated to provide uniform scanning and control of the inspection and to provide a permanent record of inspection
The shear wave technique and related modes are applicable to deshytection of tight cracks Planar (crack life) interfaces were reported to be detectable by ultrasonic shear wave techniques when a test specimen was loaded in compression up to the yield
point -Variable parameters influencing the sensitivity of shear wave inspection include test specimen thickness frequency and type and incident sound angle A technique is best optimized by analysis and by evaluation of representative reference specimens
It was noted that a shear wave is generated by placing a transshy
ducer at an angle to a part surface Variation of the incident angle results in variation in ultrasonic wave propagation modes
and variation of the technique In aluminum a variation in incishydent angle between approximately 14- to 29-degree (water immersion) inclination to the normal results in propagation of energy in the
shear mode (particulate motion transverse to the direction of propshyagation)
Op cit B G Martin and C J Adams
11-6
At an angle of approximately 30 degrees surface or Rayleigh waves that have a circular particulate motion in a plane transshyverse to the direction of propagation and a penetration of about one-half wavelength are generated At angles of approximately 78 126 147 196 256 and 310 to 330 degrees complex Lamb waves that have a particulate motion in symmetrical or asymshymetrical sinusoidal paths along the axis of propagation and that penetrate through the material thickness are generated in the thin (0060-in) materials
In recent years a technique known as Delta inspection has gained considerable attention in weldment evaluation The techshynique consists of irradiating a part with ultrasonic energy propshyagated in the shear mode and detecting redirected scattered and mode-converted energy from an included flaw at a point directly above the flaw (Fig 11-4) The advantage of the technique is the ability to detect crack-like flaws at random orientations
Reevn
TransmittingRedirected Transducer Reradiated Energy_
Path of Sound Energy
Figure 11-4 Schematic View of the Delta Inspection Technique
In addition to variations in the ultrasonic energy propagation modes variations in application may include immersion or contact variation in frequency and variation in transducer size and focus For optimum detection sensitivity and reliability an immersion technique is superior to a contact technique because several inshyspecteion variables are eliminated and a permanent recording may be obtained Although greater inspection sensitivity is obtained at higher ultrasonic frequencies noise and attenuation problems increase and may blank out a defect indication Large transducer size in general decreases the noise problems but also decreases the selectivity because of an averaging over the total transducer face area Focusing improves the selectivity of a larger transshyducer for interrogation of a specific material volume but der creases the sensitivity in the material volume located outside the focal plane
I
This program addressed the conventional -shear wavetechnique as generally applied in industry
H1-7
-------- -----------------------------------------------
D EDDY CURRENT
Eddy current inspection has been demonstrated to be very sensishytive to small flaws in thin aluminum materials and offers conshysiderable potential for routine application Flaw detection by
eddy current methods involves scanning the surface of a test object with a coil probe electronically monitoring the effect of such scanning and noting the variation of the test frequency
to ascertain flaw depth In principle if a probe coil is energized with an alternating current an alternating magnetic field will be generated along the axis of the coil (Fig 11-5) If the coil is placed in contact with a conductor eddy currents
will be generated in the plane of the conductor around the axis of the coil The eddy currents will in turn generate a magnetic field of opposite sign along the coil This effect will load the coil and cause aresultant shift in impedance of the coil (phase and amplitude) Eddy currents generated in the materi al depend on conductivity p) the thickness T the magnetic permeashybility p and the materials continuity For aluminum alloys the permeability is unity and need not be considered
Note HH is the primary magneticp field generated by the coil
2 H is the secondary magnetic feld generated by eddy Current current flow-- ]_ Source
3 Eddy current flow depends on P = electrical conductivity
Probet = thickness (penetration) 12 = magnetic permeability
= continuity (cracks)
H~~
P to)oEddy_
Figure I1-5 Schematic View of on Eddy Current Inspection
Recommended Practice for Standardizing Equipment for Electroshy
magnetic Testing of Seamless Aluminum Alloy Tube ASTM E-215-67
September 1967
11-8
---------------------------------------------------------
The conductivity of 2219-T87 aluminum alloy varies slightly from sheet to sheet but may be considered to be a constant for a given sheet Overheating due to manufacturing processes will changethe conductivity and therefore must be considered as a variable parameter The thickness (penetration) parameter may be conshytrolled by proper selection of a test frequency This variable may also be used to evaluate defect depth and to detect partshythrough cracks from the opposite side For example since at 60 kHz the eddy current penetration depth is approximately 0060 inch in 2219-T87 aluminum alloy cracks should be readily deshytected from either available surface As the frequency decreases the penetration increases so the maximum penetration in 2219 aluminum is calculated to be on the order of 0200 to 0300 inch
In practical application of eddy currents both the material paramshyeters must be known and defined and the system parameters known and controlled Liftoff (ie the spacing between the probe and material surface) must be held constant or must be factored into the results Electronic readout of coil response must be held constant or defined by reference to calibration samples Inspecshytion speeds must be held constant or accounted for Probe orienshytation must be constant or the effects defined and probe wear must be minimized Quantitative inspection results are obtained by accounting for all material and system variables and by refershyence to physically similar known standards
In current Martin Marietta studies of fatigue cracks the eddy -current method is effectively used in describing the crack sizes Figure 11-6 illustrates an eddy current description of two surshyface fatigue cracks in the 2219-T87 aluminum alloy Note the discrimination capability of the method for two cracks that range in size only by a minor amount The double-peak readout in the case of the smaller crack is due to the eddy current probe size and geometry For deep buried flaws the eddy current technique may-not describe the crack volume but will describe the location of the crack with respect to the test sample surface By applyshying conventional ultrasonic C-scan gating and recording techshyniques a permanent C-scan recording of defect location and size may be obtained as illustrated in Figure 11-7
Since the eddy current technique detects local changes in material continuity the visibility of tight defects is greater than with other techniques The eddy current technique will be used as a benchmark for other techniques due to its inherently greater sensishytivity
Ward D Rummel Monitor of the Heat-Affected Zone in 2219-T87 Aluminum Alloy Weldments Transactions of the 1968 Symposiwn on NDT of Welds and MateriaZs Joining Los Angeles California March 11-13 1968
11-9
Larger Crack (a- 0
0 36-i
2c - 029-in)
J
C
Smaller Crack
(a - 0024-in 2c - 0067-1n)
Probe Travel
Figure 11-6 Eddy Current Detection of 2Wo Fatigue Cracks in 2219-T87 Aluminum Alloy
Figure II- Eddy Current C-Scan Recording of a 2219-T8 Alurinun Alloy Panel Ccntaining Three Fatigue Cracks (0 820 inch long and 010 inch deep)
EIGINAL PAGE IS
OF POOR QUALITY
II-10
Although eddy current scanning of irregular shapes is not a genshy
eral industrial practice the techniques and methods applied are
in general usage and interpretation may be aided by recorded data
collection and analysis in future programs
II-ii
-----------------------------------------------------------------
PANEL EVALUATIONII INTEGRALLY STIFFENED STRINGER
Integrally machined stiffened panels and riveted T-stiffened
panels are common aerospace structural design elements and are
Cracks in stiffenedrepresentive of Space Shuttle structure
be the result of a raw material (plate) anomaly orpanels may may be a product of machining heat treating forming operations
or service loading If they are service induced cracks will
most likely form at the tangency point of the rib radius as shown
Note in this figure that a ratherschematically in Figure III-1
sharp stress concentration occurs at the junction of the stress
and fillet radii (the nominal membrane stress in this figure is
30 ksi) This stress concentration extends through the thickness
but decreases from a K of about 14 on the rib side to 12 on t
the opposite side Note also the extremely sharp decrease in
stress at points along the curvature of the fillet Fatigue flaw
growth in stiffened panels was evaluated under a previous NASA
contract in which flaw growth in the rib side was assessed
In a practical sense the difficulty encountered by artificially
extending flaws occurring on the rib side of the fillet means
that these flaws should not be of major concern in flight hard-Thus the most critical ware subjected to a similar loading state
area to be examined by NDT is at the fillet tangency point and the
back surface behind this position because of the severity of cracks
occurring in the region of stress concentration
Cracks in the radius area normally open to thesurface and are aeffectively simulated by the tightly closed fatigue crack as
worst-case condition Artificially induced fatigue cracks in the
radius area were selected for evaluation After the flaw type and
location were established a program plan for test panel preparation
evaluation and analysis was established as shown schematically in
Figure III-2t
E J Beck Fatigue Flaw Growth Behavior in Stiffened and
Biaxial Tension Martin Marietta (Contract NAS9-12439)
Unstiffened Panels Loaded in Aerospace Denver Colorado February 1973
tAll panels prepared in this program were evaluated independently Only the results ofby Rockwell International Space Division
the Martin Marietta studies are shown in this report
III-I
of -Rib
40 Ab
4
m
I
P4
to C
20 P
0shy
14 12 34
Distance in
-10
Figure II--1 Anticipated Surface Stress Distributionfor Axially Loaded 2219-T87 IntegraZly Stiffened Panel
111-2
NDT EVALUATION
Specimen Preparation
Surface Finish Measurement amp Documentation
Dimesioal-RaiogrphyDimensional Ultrasonic Penetrant chemical Penetrant Removal Etch
Surface Finish Measurement amp Documentation
NDT EVALUATION
X-Radiography Ultrasonic Penetrant Penetrant Removal
a Shear Specimens Drill
DilPenetrant e Rivet
NDT EVALUATION
X-Radiography nUltrasonic
Penetrant Removal
4Fracture Specimens
eMeasure amp Document Actual Flaw Sizes
Data Tabulation
Figure I-2 NDT Evaluation Sequence for Integrally Stiffened Panels
H
Ishy
A SPECIMEN PREPARATION
Integrally stiffened panel blanks were machined from 381-centishymeter (-in) thick 2219-T87 aluminum alloy plate to a final stringer height of 254 centimeters (1 in) and an initial skin
thickness of 0780 centimeter (0310 in) The stringers were located asymmetrically to provide a 151-centimeter (597-in) band on the lower stringer and a 126-centimeter (497-in) bar d
on the upper stringer thereby orienting the panel for inspection reference (Fig 111-3) A nominal 63 rms (root-mean-square) surshy
face finish was maintained All stringers were 0635-centimeter
(0250-in) thick and were located perpendicular to the plate
rolling direction
Fatigue cracks were grown in the stiffenerrib area of panel
blanks at random locations along the ribs Starter flaws were introduced by electrodischarge machining (EDM) using shaped electrodes to control final flaw shape Cracks were then extended by fatigue and the surface crack length visdally monitored and conshy
trolled to the required final flaw size and configuration requireshy
ments as shown schematically in Figure 111-4 Nominal flaw sizes and growth parameters are as shown in Table III-1
Following growth of flaws 0076 centimeter (0030 in) was mashychined off the stringer side of the panel using a shell cutter to produce a final membrane thickness of 0710 centimeter (0280 in) a 0317-centimeter (0125-in) radius at the rib and a nominal 63
rms surface finish Use of a shell cutter randomized the surface finish pattern and is representative of techniques used in hardware production Grip ends were then cut off each panel and the panels were cleaned by vapor degreasing and submitted for inspection Forty-threa flawed panels and four unflawed panels were prepared and submitted for inspection Three additional panels were preshypared for use in establishing flaw growth parameters and were deshystroyed to verify growth parameters and techniques Distribution
of flaws in the panels is as shown in Table 111-2
111-4
0375R
600
390 A B C
- 40 9 - -___ 600 - - 597 - - 40 -I
____ ______ _______ ___ ___ ___ ___280
l 310
T (Stock)
I Preflaw Geometry
Flaw L6cation Areas 0250 0 125 D(Typ)
0gso0 Note All dimensions
in inches
63 rms finish Figure I1-3 Integrally Stiffened Panel Configuration
0125 0024 leep ~0030
easel -t 000
0280
Note All dimensions in inches
Case 2 -- 00--0-----
0280 -^ - $-is-- shy
0530 f-0012 Deep
0030 Case 3 -
-
~-$c~v-----P~A - -gt - r-----~~ 0280
Figure ITI-4 Schematic Side View of Starter FZw and Final Crack Configurations Integrally Stiffened Panels
111-6
Table 111-1 Parameters for Fatigue Crack Growth in Integrally Stiffened Panels
MeasuredEDh4 Starter Not Fatigue Final
Flaw Specimen Type of
CASE a2C at Depth Width Length Thickness Loading
1 05 02 0061 cm 0045 cm 0508 cm 0710 cm 3-Point (0280 in) Bending(0024 in) (0018 in-) (0200 in)
bull _(30
2 025 02 0051 cm 0445 cm 0760 cm 0710 cm 3-Point (0280 in) Bending(0020 in) (0175 in) (0300 in)
3 01 02 0031 cm 134 cm 152 cm 0710 cm 3-Point (0280 in) Bending(0012in) (0530in) (0600 in)
1_
Note a = final depth of flaw 2C = final length of flaw t = final panel thickness
Stress Cycles No of No of
Stress (avg) Panels Flaws
207x106 80000 22 102 Nm2
ksi)
207x10 6 25000 22 22 21m2
(30 ksi)
207x10 6 22000 10 22 Nm2
(30 ksi)
H H
Table T1-2
Crack
Designation
1
2
3
Stringer Panel Flaw Distribution
Number of Number of Flaw
Panels Flaws aDetha)
23 102 0152 cm (0060 in)
10 22 0152 cm (0060 in)
10 22 0152 cm (0060 in)
Flaw
Length (2c)
0289 cm (0125 in)
0630 cm (0250 in)
1520 cm (0600 in)
Blanks 4 0
TOTALS 47 146
B NDT OPTIMIZATION
Following preparation of integrally stiffened fatigue-flawed panels an NDT optimization and calibration program was initiated One panel containing cracks of each flaw type (case) was selected for experimental and system evaluations Criteria for establishshyment of specific NDT procedures were (1) penetrant ultrasonic and eddy current inspection from the stringer (rib) side only and (2) NDT evaluation using state-of-the-art practices for initial evaluation and for system calibrations prior to actual inspection Human factors w reminimized by the use of automated C-scan reshycording of ultrasonic and eddy current inspections and through reshydundant evaluation by three different and independent operators External sensitivity indicators were used to provide an additional measurement of sensitivity and control
1 X-radiography
Initial attempts to detect cracks in the stringer panels by Xshyradiography were totally unsuccessful A 1 penetrameter sensishytivity was obtained using a Norelco 150 beryllium window X-ray tube and the following exposure parameters with no success in crack detection
1) 50 kV
2) 20 MA
3) 5-minute exposure
4) 48-in film focal distance (Kodak type M industrial X-ray film)
Various masking techniques were tried using the above exposure parameters with no success
After completion of the initial ultrasonic inspection sequence two panels were selected that contained flaws of the greatest depth as indicated by the altrasonic evaluations Flaws were marginally resolved in one panel using Kodak single-emulsion type-R film and extended exposure times Flaws could not be reshysolved in the second panel using the same exposure techniques
III 9
----------------------------------------------------------------
Special X-radiographic analysis was provided through the courtesy of Mr Henry Ridder Magnaflux Corporation in evaluation of case
2 and case 3 panels using a recently developed microfocus X-ray
system This system decreases image unsharpness which is inshy
herent in conventional X-ray units Although this system thus has
a greater potential for crack detection no success was achieved
Two factors are responsible for the poor results with X-radioshy
graphy (1) fatigue flaws were very tight and were located at
the transition point of the stringer (rib) radius and (2) cracks
grew at a slight angle (from normal) under the stringer Such
angulation decreases the X-ray detection potential using normal
exposures The potential for detection at an angle was evaluated
by making exposures in 1-degree increments at angles from 0 to 15
degrees by applying optimum exposure parameters established by Two panelspenetrameter resolution No crack image was obtained
were evaluated using X-ray opaque penetrant fluids for enhancement
No crack image was obtained
As a result of the poor success in crack detection with these
panels the X-radiographic technique was eliminated from the inshy
tegrally stiffened panel evaluation program
2 Penetrant Evaluation
In our previous work with penetrant materials and optimization
for fatigue crack detection under contract NAS9-12276t we seshy
lected Uresco P-151 a group VII solvent removable fluorescent
penetrant system for evaluation Storage (separation and preshy
cipitation of constituents) difficulties with this material and
recommendations from Uresco resulted in selection of the Uresco
P-149 material for use in this program In previous tests the
P-149 material was rated similar in performance to the P-151
material and is more easily handled Three materials Uresco
P-133 P-149 and P-151 were evaluated with known cracks in
stringer and welded panels and all were determined to be capable
of resolving the required flaw types thus providing a backup
(P-133) material and an assessment of P-151 versus P-149 capashy
bilities A procedure was written for use of the P-149 material
Henry J Ridder High-Sensitivity Radiography with Variable
Microfocus X-ray Unit Paper presented at the WESTEC 1975 ASNT
Spring Conference Los Angeles California (Magnaflux Corporashy
tion MX-100 Microfocus X-ray System)
tWard D Rummel Paul H Todd Jr Sandor A Frecska and Richard
The Detection of Fatigue Cracks by NondestructiveA Rathke Testing Methods NASA CR-2369 February 1974 pp 28-35
fil- o
for all panels in this program This procedure is shown in Appendix A
Removal of penetrant materials between inspections was a major concern for both evaluation of reference panels and the subseshyquent test panels Ultrasonic cleaning using a solvent mixture of 70 lll-trichloroethane and 30 isopropyl alcohol was used initially but was found to attack welded panels and some areas of the stringer panels The procedure was modified to ultrasonic cleaning in 100 (technical grade) isopropyl alcohol The techshynique was verified by application of developer to known cracks with no evidence of bleedout and by continuous monitoring of inspection results The panel cleaning procedure was incorporated as an integral part of the penetrant procedure and is included in Appendix A
3 Ultrasonic Evaluation
Optimization of ultrasonic techniques using panels containing cases 1 2 and 3 cracks was accomplished by analysis and by exshyperimental assessment of the best overall signal-to-noise ratio Primary consideration was given to the control and reproducibilityoffered by shear wave surface wave Lamb wave and Delta techshyniques On the basis of panel configuration and previous experishyence Lamb wave and Delta techniques were eliminated for this work Initial comparison of signal amplitudes at 5 and 10 N z and preshyvious experience with the 2219-787 aluminum alloy resulted in selection of 10 M4z for further evaluation
Panels were hand-scanned in the shear mode at incident anglesvarying from 12 to 36 degrees in the immersion mode using the C-scan recording bridge manipulator Noise from the radius of the stringer made analysis of separation signals difficult A flat reference panel containing an 0180-inch long by 0090-inch deep fatigue crack was selected for use in further analyses of flat and focused transducers at various angles Two possible paths for primary energy reflection were evaluated with respect to energy reflection The first path is the direct reflection of energy from the crack at the initial material interface The second is the energy reflection off the back surface of the panel and subsequent reflection from the crack The reflected energy distribution for two 10-MHz transducers was plotted as shown in Figure Ill-5 Subshysequent C-scan recordings of a case 1 stringer panel resulted in selection of an 18-degree angle of incidence using a 10-MHz 0635shycentimeter diameter flat transducer Recording techniques test setup and test controls were optimized and an inspection evaluashytion procedure written Details of this procedure are shown in Appendix B
III-li
50
040
t 30
A 10 X
a
0 1
30
10 12 14
16 18 20 22 24 26 28 30 32 34
Angle of Incidence dog
(1) 10-Mz 14-in Diamter Flat Transducer
x
36 38
50 60
40 55
~~-40
f
2044 0
0
01
20 _
a loI
euroI
Ag o
x 40
45
(aI0
10 10
12 f
14 I
16 18 318-144I I
20 22 24 26 28
Angle of Incidence dog
(a) 1O-Mq~z 38-in
I 30
I 32 34
I 36
I 38
35
Figure III-5 ultrasonic Reflected Energy Response
iIT-12
4 Eddy Current Evaluation
For eddy current inspection we selected the NDT Instruments Vecshytor III instrument for its long-term electronic stability and selected 100 kHz as the test frequency based on the results of previous work and the required depth of penetration in the alushyminum panels The 100-kHz probe has a 0063-inch core diameter and is a single-coil helically wound probe Automatic C-scan recording was required and the necessary electronic interfaces were fabricated to utilize the Budd SR-150 ultrasonic scanning bridge and recorder system Two critical controls were necessary to assure uniform readout--alignment and liftoff controls A spring-loaded probe holder and scanning fixture were fabricated to enable alignment of the probe on the radius area of the stringer and to provide constant probe pressure as the probe is scanned over a panel Fluorolin tape was used on the sides and bottom of
the probe holder to minimize friction and probe wear Figure 111-6 illustrates the configuration of the probe holder and Figure III-7 illustrates a typical eddy current scanning setup
Various recording techniques were evaluated Conventional C-scan
in which the probe is scanned incrementally in both the x and y directions was not entirely satisfactory because of the rapid decrease in response as the probe was scanned away from the stringer A second raster scan recording technique was also evalshyuated and used for initial inspections In this technique the probe scans the panel in only one direction (x-axis) while the other direction (y-axis) is held constant The recorded output is indicative of changes in the x-axis direction while the y-axis driven at a constant stepping speed builds a repetitive pattern to emphasize anomalies in the x-direction In this technique the sensitivity of the eddy current instrument is held constant
A procedure written for inspection usingthe raster scan techshynique was initially verified on case 1 2 and 3 panels Details of this procedure are shown in Appendix C
An improvement in the recording technique was made by implementshying an analog scan technique This recording is identical to the raster scan technique with the following exceptions The sensishytivity of the eddy current instrument (amplifier gain) is stepped up in discrete increments each time a line scan in the x-direction is completed This technique provides a broad amplifier gain range and allows the operator to detect small and large flaws on
NDT Instruments Inc 705 Coastline Drive Seal Beach California
90740
it-13
Scanning Bridge Mounting Tube
I I SI i-Hinge
Plexiglass Block Contoured to Panel Radius
Eddy Current Probe 6 deg from Vertical
Cut Out to Clear Rivet Heads
Figure 111-6 Eddy Current Probe
111-14
Figure 111- Typical Eddy Current Scanning Setup for Stringer PaneIs
111-15
the same recording It also accommodates some system noise due to panel smoothness and probe backlash Examples of the raster scan and analog scan recordings are shown in Figure 111-8 The dual or shadow trace is due to backlash in the probe holder The inspection procedure was modified and implemented as shown in Appendix C
Raster Scan
10 37
Analog Scan
Figure 111-8 Typical Eddy Current Recordings
111-16
C TEST SPECIMEN EVALUATION
Test specimens were evaluated by optimized penetrant ultrasonic and eddy current inspection procedures in three separate inspecshytion sequences After familiarization with the specific proceshydures to be used the 47 specimens (94 stringers) were evaluated by three different operators for each inspection sequence Inshyspection records were analyzed and recorded by each operator withshyout a knowledge of the total number of cracks present the identityof previous operators or previous inspection results Panel idenshytification tags were changed between inspection sequence 1 and 2 to further randomize inspection results
Sequence 1 - Inspection of As-Machined Panels
The Sequence 1 inspection included penetrant ultrasonic and eddy current procedures by three different operators Each operator independently performed the entire inspection sequence ie made his own ultrasonic and eddy current recordings interpreted his own recordings and interpreted and reported his own results
Inspections were carried out using the optimized methods estabshylished and documented in Appendices A thru C Crack length and depth (ultrasonic only) were estimated to the nearest 016 centishymeter (116 in) and were reported in tabular form for data procshyessing
Cracks in the integrally stiffened (stringer) panels were very tightly closed and few cracks could be visually detected in the as-machined condition
Sequence 2 Inspection after Etching
On completion of the first inspection sequence all specimens were cleaned the radius (flaw) area of each stringer was given a lightmetallurgical etch using Flicks etchant solution and the specishymens were recleaned Less than 00013 centimeter (00005 in) of material was removed by this process Panel thickness and surshyfacd roughness were again measured and recorded Few cracks were visible in the etched condition The specimens were again inshyspected using the optimized methods Panels were evaluated by three independent operators Each operator independently pershyformed each entire inspection operation ie made his own ultrashysonic and eddy current recordings and reported his own results Some difficulty encountered with penetrant was attributed to clogging of the cracks by the various evaluation fluids A mild alkaline cleaning was used to improve penetrant results No measurable change in panel thickness or surface roughness resulted from this cleaning cycle
111-17
Sequence 3 Inspection of Riveted Stringers
Following completion of sequence 2 the stringer (rib) sections were cut out of all panels so a T-shaped section remained Panels were cut to form a 317-centimeter (125-in) web on either side of the stringer The web (cap) section was then drilled on 254-centimeter (1-in) centers and riveted to a 0317-centimeter (0125-in) thick subpanel with the up-set portion of the rivets projecting on the web side (Fig 111-9) The resultant panel simulated a skin-toshystringer joint that is common in built-up aerospace structures Panel layout prior to cutting and after riveting to subpanels is shown in Figure III-10
Riveted panels were again inspected by penetrant ultrasonic and eddy current techniques using the established procedures The eddy current scanning shoe was modified to pass over the rivet heads and an initial check was made to verify that the rivet heads were not influencing the inspection Penetrant inspection was performed independently by three different operators One set of ultrasonic and eddy current (analog scan) recordings was made and the results analyzed by three independent operators
Note All dimensions in inches
-]0250k
125 1 S0R100
--- 05 -- 0125 Typ
00150
Fl 9a 111-9 stringer-to-SubPcmel Attac mnt
111-18
m A
Figure 11--1 Integrally Stiffened Panel Layout and Riveted Pantel Configuration
111-19
D PANEL FRACTURE
Following the final inspection in the riveted panel configuration
the stringer sections were removed from the subpanels and the web
section broken off to reveal the actual flaws Flaw length
depth and location were measured visually using a traveling
microscope and the results recorded in the actual data file Four
of the flaws were not revealed in panel fracture For these the
actual surface length was recorded and attempts were made to grind
down and open up these flaws This operation was not successful
and all of the flaws were lost
E DATA ANALYSIS
1 Data Tabulation
Actual crack data and NDT observations were keypunched and input
to a computer for data tabulation data ordering and data analyshy
sis sequences Table 111-3 lists actual crack data for integrally
stiffened panels Note that the finish values are rms and that
all dimensions are in inches Note also that the final panel
thickness is greater in some cases after etching than before This
lack of agreement is the average of thickness measurements at three
locations and is not an actual thickness increase Likewise the
change in surface finish is not significant due to variation in
measurement at the radius location
Table 111-4 lists nondestructive test observations as ordered
according to the actual crack length An X 0 indicates that there
were no misses by any of the three NDT observers Conversely a
3 indicates that the crack was missed by all observers
2 Data Ordering
Actual crack data (Table 111-3) xTere used as a basis for all subshy
sequent calculations ordering and analysis Cracks were initshy
ially ordered by decreasing actual crack length crack depth and
crack area These data were then stored for use in statistical
analysis sequences
111-20
Table 111-3 Actual Crack Data Integrally Stiffened Panels
PANEL NO
CRACK NO
CRACK LENGTH
CRACK DEPTH
INITIAL FINISH THICKNESS
FINAL FINISH THICKNESS
CRACK FCSITICN X Y
I B I C 2 0 3 C 4 13 4 C 5 A 5 0 E A 6 C 6 0 7 A 7 8 7 C 8 A 8 A 8 a 8 C 8X9 BXD 9 A 9 8 S B 9 C 9 0 9 0
10 A 11 0 12 8 13 B 13 0 14 A 14 C 15 A 15 0 16 B 16 C 16 D 17 A 17 C 17 0 18 A 18 8 18 C 19 A 19 B 19 C 19 V 20 A 21 D 22 C 23 8 23 C 24 A 24 0 25 A 25 C 26 A 26 8 26 0 27 A 27 8 27 0 28 B 28 C 26 U 29 A 29 8 29 C 29 0 31 -
1 2 3 4 5 6 7 8 9
10 11 12 13 14 15 16 17 18 19 20 21 22 23 24 25 26 27 28 29 30 31 32 33 34 35 36 37 38 39 40 41 42 43 44 4E 47 48 49 50 51 52 53 54 55 56 57 58 59 60 E1 62 63 64 65 66 67 68 69 70 71 72
1157 213 0182 0531 0175 0170 0OE5 0170 0174 0100 0172 n179 3180 0142 C142 0050 0183 C194 0200 0166 0187 0149 0202 0105 0163 G100 0262 0273 0269 0271 0273 0275 0286 0272 0275 0276 0208 0302 0c2E5 0275 0266 0278 02g1 0321 0277 02E9 02E8 0288 0561 05E9 0593 0551 0549 0576 0576 0566 0563 0528 0560 057g 0572 0573 0550 0578 0542 0612 0569 0476 0684 0451 0255
0030 0037 3051 0095 0028 0032 0032 0032 0033 0033 0036 0039 0030 0036 0027 0027 0039 0046 0046 0046 U040 0034 0043 0042 0037 0037 0048 0055 0051 0052 0053 0051 0062 051 0053 0050 0038 0080 0043 0049 0049 0046 0052 0060 0053 0047 0054 0056 0064 0065 0070 -0043 0042 0061 0059 0047 0050 0045 0055 0076 0056 0059 0048 0054 0052 0073 0063 0034 0056 0062 0047
52 52 38 57 47 47 77 77 65 65 65 58 58 58 72 72 72 72 72 72 73 73 73 73 73 7 37 17 32 28 28 31 31 39 39 53 53 53 38 38 38 38 38 38 35 35 35 35 30 33 20 31 31 32 32 44 32 34 34 34 29 29 29 33 33 33 52 52 52 52 18
0278C 0278 02800 02790 02790 02790 0279C 02790 0278C 02780 02780 0277C 02770 0277C 02780 012780 02780 02780 0278C 02780 02790 02791 02790 02790 02790 0 2790 0280C 0280e 02800 02790 02790 0280 0280E 0279C 02790 02800 02800 0280 02760 0276C 02760 02800 0280 02800 02810 02810 02810 02810 02800 02780 02800 0279C 02790 02800 02800 02802 0 3040 02790 02790 02790 02760 0276C 02760 02782 02780 0278 02790 02796 02790 02790 02780
32 22 18 30 32 30 32 42 38 40 46 22 30 40 26 26 30 24 30 30 28 22 22 26 26 26 20 22 24 20 20 24 20 26 22 22 23 18 36 20 24 30 18 25 12 25 26 16 22 52 2C 22 22 16 32 44 32 25 14 22 22 20 25 i 24 18 30 41 38 30 18
0281C 02810 02840 0282E 02810 02806 0280C 0279C 0281C 02830 02830 02790 0275C 02790 02800 0280C 0280C 02800 02800 012800 02790 02790 02790 02790 02790 02790 02830 02810 0279C 02830 0281C 02820 0281C 0281E 0281C 0282C 02820 02820 02680 02820 0281C 02820 02830 02840 02820 02820
0202 bull02820 02830 02790 02800 0200 02820 0285E 02790 0280C 03040 02796 02780 0279E 0278C 02770 02776 02780 02780 0279C 02770 02780 0278E 0280C 02780
407 172 304 296 300 Z01 1S7 208 173 170 445 423 168 173 167 457 262 357 139 450 247 374 460 166 263 400 146 244 304 192 380 419 398 389 136 240 155 446 172 387 137 443 137 447 158 433 456 145 400 296 347 390 392 160 400 254 357 157 436 150 427 167 458 250 443 172 416 161 159 437 197
-0 -0 -0 -0 -0 -0 -0 -0 -0 -0 -0 -0 -0 -0 -0 -0 -0 -0 -0 -0 -0 G -0 -0 -0 -0 -0 -0 -0 -0 -0 -0 -0 -0 -0 -0 -0 -0 -0 -0 -0 -0 -0 -0 -0 -0 -0 -0 -0 -0 -0 -0 -0 -0 -0 -0 -0 -0 -0 -0 -0 -0 -0 -0 -0 -0 -0 -0 -0 -0 -0
111-21
Table -11-3 (concl)
31 0 73 0571 0034 22 02776 22 0277C 221 -0 35 C 74 0274 0068 35 02796 35 0279C 378 -0 36 A 75 0126 0025 45 02786 42 02780 178 -0 36 A 76 0179 0038 45 02780 42 0278C 451 -0 36 C 77 0186 0038 45 02780 33 02780 277 -0 36 D 78 0193 0047 45 02786 40 02786 420 -0 37 A 79 0140 0029 50 02790 50 02786 246 -0 37XA 80 0215 0029 50 02796 50 02780E 469 -0 37 8 81 0113 0024 50 0279C 40 02790 151 -0 37 B 82 0182 0045 50 02796 46 027Sf 354 -Go 37 C 83 0109 0026 50 02790 41 02790 124 -0 37 C 84 6063 00plusmn6 50 02790 41 0279C 205 -6 37 0 85 0164 0045 50 02790 18 02796 362 -0 37 D 86 0190 0024 50 02790 18 02790 464 -0 38 A 87 0089 0018 42 02790 24 0279C 165 -0 38 A 88 0175 0039 42 02796 24 02790 458 -F 38 8 89 0078 0016 42 02796 16 02786 280 -0 38 C s0 0140 0031 42 02796 21 0279C 207 -0 38 C Si 0164 0036 42 02790 21 02796 475 -0 38 D 92 0169 0033 42 0279 29 0278C 119 -0 38 D 93 0125 0024 42 02796 29 02781 380 -0 39 A 94 0274 0056 17 02786C 17 02786 172 -0 39 C 95 0181 0042 19 0279C 19 02796 126 -0 32 0 97 0181 0049 24 02790 24 02790 217 -0 39 0 98 0142 0030 24 02796 24 0279 462 -0 40 A 99 0112 0026 50 02780 50 02796 403 -0 40 8 100 0172 0040 50 02786 32 02776 154 -0 40 8 1c1 0134 0033 50 02780 32 02776 256 -0 40 C 102 0114 0024 50 02780 36 02786 127 -0 40 D 103 0061 0009 50 02780 34 02770 371 -0 40 D 104 01E0 0037 50 0278C 34 02770 446 -0 41 A 105 0183 0038 44 02790 2e 0279 205 -0 41 A 106 0120 0022 44 02790 28 02796 462 -C 41 8 107 0127 0028 44 02790 25 02790 134 -0 41 8 108 0O07 0021 44 02796 25 02796 404 -0 41 C 102 0136 0033 44 02790 22 02790 156 -0- 41 C 110 0260 0048 44 02790 22 02796 484 t 42 8 111 0182 0044 33 02786 30 02786 246 42 C 112 0126 0028 33 02780 32 0278C 218 -0 42 C 113 0158 0041 33 02780 32 02786 474 -0 42 0 114 0191 0047 33 02780 35 02780 135 -0 42 D 115 0098 0032 33 02780 35 02786 403 -0 43 A 116 0415 0100 30 02800 36 02786 265 -0 43 A 117 0184 0041 30 02800 36 0278C 460 -0 43 B 118 0177 0041 30 02800 24 02776 154 -0 43 8 119 0163 0036 30 02800 24 02770 411 -0 43 C 120 0095 00plusmn9 30 0280C 30 02796 353 -0 43 0 121 0076 0018 30 02806 22 02786 188 -0 43 D 122 0260 0-023 30 shy 02800 22 02780 440 -0 44 A 123 0166 0019 33 0279C 21 02790 372 -0 44 A 124 0178 0036 33 02790 21 0279C 469 -0 44 8 125 0138 0024 33 027A0 23 02770 213 -0 44 S 126 0132 0031 33 02790 23 02776 423 -0 44 C 127 0160 0037 33 02790 24 02780 107 -0 44 C 128 0113 0026 33 02790 24 0278C 4a6 -0 44 D 129 0179 0040 33 02790 21 0278C 146 -0 44 0 130 0147 0033 33 02790 21 02780 352 -0 45 A 131 0164 0034 28 02770 25 02796 162 -0 45 8 132 0162 0036 28 02776 29 02766 427 -0 45 C 133 0161 0033 28 02770 23 0278C 442 -0 46 A 135 0083 0017 31 02780 24 02770 346 -0 46 A plusmn36 0176 0036 31 02780 24 02771 455 -0 46 C 137 8158 0035 31 d2780 25 0278E 144 -0 46 C 138 0085 0017 31 02780 25 02780 233 -0 46 0 139 0184 0045 31 02780 23 02770 454 -0 47 A 140 0136 0026 33 02780 28 02786 243 -0 47 A 141 0087 0017 33 02780 28 02786 472 -0 47 8 142 0167 0031 33 02780 27 02780 118 -0 47 B 143 0059 0011 33 02780 27 02786 343 -0 47 C 144 0126 0030 33 02780 20 02780 358 -0 47 D 145 0119 0035 33 02780 26 02780 254 -0 47 0 146 0187 0044 33 02780 26 02786 475 -0
111-22
Table 11-4 NDT Observations Integrally Stiffened Panels
PENETRANT ULTRASONIC EDDY CURRENT
INSPECTION SEQUENCE 1 2 3 1 2 3 1 2 3
CRACK NUMBER
ACTUAL vALUE
70 684 0 0 0 0 0 0 0 1 0 67 612 0 1 0 0 0 0 3 0 1 52 593 3 0 0 3 0 0 3 1 1 61 579 0 0 0 0 0 0 1 0 0 65 578 0 0 0 0 0 0 1 0 3 55 576 0 0 0 0 0 3 1 0 0 56 9576 0 0 0 0 0 0 0 0 1 63 573 1 0 0 0 0 0 2 1 3 62 572 0 0 0 0 0 0 2 0 0 73 571 0 1 0 0 0 3 2 0 3 51 569 1 0 0 2 0 0 0 0 2 68 569 0 0 0 0 0 0 0 0 0 57 566 1 0 0 1 0 0 0 0 2 58 563 0 0 0 1 0 0 0 0 0 50 561 0 0 0 0 0 0 0 0 0 60 560 0 1 0 0 o d 0 0 6 53 551 0 0 0 0 0 0 3 2 3 54 549 0 0 0 0 0 0 1 11 1 66 542 0 0 0 1 0 0 0 0 0 4 531 0 1 0 0 0 0 0 0 0
59 528 0 1 0 0 0 3 0 1 0 69 476 0 0 0 0 0 0 2 0 0 71 451 0 0 -0 0 0 3 0 0 1 44 321 0 0 0 0 0 0 2 1 1 38 a302 0 0 0 0 0 0 0 1 0 43 291 0 1 0 0 0 0 1 0 1 49 288 1 0 0 0 0 0 1 0 1 33 286 3 1 0 3 0 2 3 0 0 46 277 0 0 0 0 1 0 2 3 3 36 276 0 1 0 1 0 0 2 2 1 42 276 0 0 0 1 0 0 1 1 0 32 275 0 1 2 0 0 0 1 1 1 35 275 0 0 0 0 1 0 2 1 1 40 275 0 1 0 0 0 0 1 0 2 74 274 0 0 0 0 0 0 2 2 1 94 274 0 0 1 1 0 3 0 0 0 31 273 0 1 0 0 0 0 1 1 2 28 9273 0 2 3 0 0 0 0 0 0 34 272 0 0 0 0 0 0 2 1 1 30 271 0 0 3 0 1 0 2 0 3 47 269 1 0 0 0 0 0 1 0 1 29 269 0 1 2 0 0 0 2 0 2 48 268 0 1 2 1 0 0 1 1 2 41 266 0 0 0 0 0 0 1 1 1
111-23
Table 11Y-4 (cont)
CK ACT NO VAL 1 2 3 1 2- 3 1 2 3 27 262 0 0 0 -0 0 0 2 2 1 80 215 3 0 0 0 0 3 0 0 0 37 208 0 0 0 0 1 0 3 3 3 23 202 0 0 1 1 0 0 0 0 2 19 200 0 0 0 0 0 0 1 1 3
110 200 1 0 0 0 0 0 1 0 0 122 200 1 0 1 0 0 0bull 0 0 2 24 195 1 0 1 0 0 0 1 0 0 18 194 0 0 1 0 0 0 0 0 0 2 193 1 1 3 0 0 0 0 0 0
78 193 0 0 0 0 0 0 0 0 0
114 -shy 91 0 0 0 0 0 0 1 0 1 86 190 3 3 3 0 0 3 1 1 2 21 187 0 0 3 0 2 0 0 0 0 146 187 0 0 0 0 0 3 2 0 1 77 186 0 0 0 0 0 0 0 0 0 139 184 2 0 0 0 0 0 1 0 2 117 o184 0 0 0 0 0 0 0 0 0 17 183 0 0 0 0 0 0 1 1 0
105 183 0 0 0 0 2 3 2 1 0 111 182 3 1 2 0 0 0 0 1 3 3 182 0 0 0 0 0 0 0 0 0
82 182 3 0 0 0 0 0 1 0 3 95 181 0 0 1 1 0 0 0 0 2 97 181 2 2 1 1 0 3 1 1 3 13 180 0 6 0 1 2 2 1 2 2
129 179 0 0 1 1 0 0 1 0 3 12 179 0 0 0 0 0 1 1 0 1 76 179 0 0 0 0 0 0 2 1 2
124 178 0 0 0 0 0 3 1 0 0 118 177 0 0 0 0 0 0 0 1 2 136 176 2 1 -0 0 3 3 1 0 2 88 175 3 3 3 1 0 0 2 2 2 5 175 0 1 0 0 1 3 2- 1 2 9 174 0 0 1 1 0 0 1 0 1
11 172 1 1 3 0 2 3 0 0 1 100 0172 0 0 0 0 0 0 - 1 0 1 8 1170 0 1 0 0 1 0 0 0 1 6 170 0 1 0 0 1 0 0 0 0
92 169 3 1 1 0 1 0 3 3 3 142 167 0 1 0 1 0 0 1 0 0 20 166 0 1 0 0 1 0 1 0 2 91 164 3 2 3 0 0 0 2 2 3
131 164 2 0 1 0 1 0 0 0 0 85 164 3 3 3 0 2 3 1 1 3 25 s163 0 2 3 0 2 0 -1 0 0
111-24
Table 11-4 (coneZ)
CK ACT NO VAL 1 2 -3 1 2 3 1 2 3
119 163 0 1 1 U 0 3 0 plusmn 0 1 0 0 0 0 1 3132 162 0 1
0 2133 161 0 1 1 0 0 1 1 127 160 1 1 1 0 0 3 0 0 0 104 160 0 0 0 0 1 3 0 0 2
10 160 0 0 1 0 0 0 0 0 0 2 0 2137 158 3 2 0 0 2 3
113 158 0 1 0 0 0 0 1 0 0 0 0 11 157 1 O 3 0 0 0
0 022 149 1 2 2 - 0 0 0 2 0 0 1 0 3130 147 0- 0 1 1 3 398 142 2 3 3 1 3 1 1
1 2 1 0 0 014 142 0 0 0 0 315 142 0 0 2 0 2 2 3
90 140 1 2 3 lt1 0 3 3 2 3 1 379 140 1 1 0 0 3 3 2
145 139 2 0 0 0 1 3 2 2 2 1 1 3125 138 0 0 0 0 0 3
140 136 0 0 0 0 0 0 1 1 2
109 136 0 0 0 0 0 0 0 0 3 101 134 1 1 0 0 0 3 0 0 2
126 132 0 0 0 0 1 0 1 0 3 107 127 0 0 0 0 3 3 2 3 3 144 126 0 2 0 0 0 Q 2 0 2 75 126 3 0 1 3 0 3 1 2 3
112 126 2 0 0 0 0 0 0 0 0
93 125 1 -0 1 0 0 0 2 3 3 106 120 0 0 0 3 3 3 3 3 3 1D2 114 1 0 0 0 0 0 0 1 3 128 113 0 0 1 0 0 3 1 0 3 81 113 1 0 0 0 1 3 2 3 3 99 112 0 0 0 3 0 3 3 1 2 83 0109 2 0 0 0 1 3 0 2 3
123 o106 0 1 0 2 3 3 3 3 3 26 100 0 0 1 1 0 3 0 1 0 115 098 3 1 1 0 0 3 2 0 1 108 097 0 0 0 3 3 3 2 3 3 120 095 1 0 2 3 3 1 3 3 3 87 a089 0 2 0 2 3 3 3 3 2
141 087 1 2 1 3 3- 3 3 3 1 138 0085 3 0 1 0 3 3 3 3 3
7 085 0 1 0 1 3 3 0 1 0
135 083 3 2 2 3 3 3 3 3 3 89 078 3 0 2 3 3 3 3 3 3
121 076 0 0 1 3 3 3 3 3 2 84 063 3 0 1 3 2 3 2 3 3
103 o061 0 2 1 3 3 3 3 3 3 143 059 3 1 1 3 3 3 3 3 2 16 050 0 3 3 0 0 0 2 1 1
111-25
3 Statistical Analysis
There are four possible results when an inspection is performed
1) detection of a defect that is present (true positive)
2) failure to detect a defect that is not present (true negative)
3) detection of a defect that is not present (false positive)
4) failure to detect a defect that is present (false negative)
i STATE OF NATURE]
Positive Negative
Positive Positive sitive OF Pos_[TEST (Tx) NATURE[ _____ve
TrueNegaivepN~atie Negative Fale- Negative
Although reporting of false indications (false positive) has a
significant impact on the cost and hence the practicality of an inspection method it was beyond the scope of this investigation Factors conducive to false reporting ie low signal to noise ratio were minimized by the initial work to optimize inspection techniques An inspection may be referred to as a binomial event
if we assume that it can produce only two possible results ie success in detection (true positive) or failure to detect (false negative)
Analysis of data was oriented to demonstrating the sensitivity and
reliability of state-of-the-art NDT methods for the detection of small tightly closed flaws Analysis was separated to evaluate the influences of etching and interference caused by rivets in the
inspection area Flaw size parameters of primary importance in the use of NDT data for fracture control are crack length (2C) and crack depth (a) Analysis was directed to determining the flaw size that would be detected by NDT inspection with a high probability and confidence
For a discussion on false reporting see Jamieson John A et al
Infrared Physics and Engineering McGraw-Hill Book Company Inc page 330
111-2 6
To establish detection probabilities from the data available
traditional reliability methods were applied Reliability is concerned with the probability that a failure will not occur when an inspection method is applied One of the ways to measure reliability is to measure the ratio of the number of successes to the number of trail (or number of chances for failure) This ratio times 100 gives us an estimate of the reliability of an inspection process and is termed a point estimate A point estimate is independent of sample size and may or may not constitute a statistically significant measurement If we assume a totally successful inspection process (no failures) we may use standard reliability tables to select a sample size A reliability of 95 at 95 confidence level was selected for processing all combined data and analyses were based on these conditions For a 95 reliability at 95 confidence level 60 successful inspection trials with no failure are required to establish a valid sampling and hence a statistically significant data point For large crack sizes where detection reliability would be expected to be high this criteria would be expected to be reasonable For smaller crack sizes where detection reliability would be expected to be low the required sample size to meet the 95 reliability95 confidence level criteria would be very large
To establish a reasonable sample size and to maintain some conshytinuity of data we held the sample size constant at 60 NDT obsershy
vations (trials) We then applied confidence limits to the data generated to provide a basis for comparison and analysis of detection successes and to provide an estimate of the true proportion of
cracks of a particular size that can be detected Confidence limits are statistical determinations based on sampling theory and are values (boundaries) within which we expect the true reliabishylity value to lie For a given sample size the higher our confidence level the wider our confidence simply means that the more we know about anything the better our chances are of being right It is a mathematical probability relating the true value of a parameter to an estimate of that parameter and is based on historyrepeating itself
Plotting Methods
In plotting data graphically we have attempted to summarize the results of our studies in a few rigorous analyses Plots were generated by referring to the tables of ordered values by actual
flaw dimension ie crack length
Starting at the longest crack length we counted down 60 inspection observations and calculated a detection reliability (successes divided by trails) A dingle data point was plotted at the largest crack (length in this group) This plotting technique biases
1I1-27
-----------------------------------------------------------------
data in the conservative direction We then backed up 30 obsershy
vations counted down 60 observations and plotted the data point
at the longest crack in this group The process was repeated for
the remaining observations in each inspection operation By use
of the overlapping sampling technique the total amount of data
required could be reduced The overlapping method is applicable
since all observations are independent and hence may be included
in any data sampling group An added advantage is the smoothing
of the curve resulting from such a plotting technique
5 Calculation of Confidence Limits
The analysis and data plotting methods used to assess the variation
in flaw detection reliability with flaw dimension becomes increasshy
ingly lampss rigorous as detection failures increase To maintain
continuity of data analysis and penetration using the same analysis
and plotting methods we have calculated and plotted confidence
limits for each plot point using the available data sample in that
sample group Confidence limits are values within which we expect
the true reliability value to be if an infinitely large sample is
taken For a given sample size the higher our confidence level
the wider our confidence-limits Confidence limits are statistical
determinations based on sampling theory
areThe statistics that are used to determine confidence limits
dependent up the distribution of whatever characteristic we are
measuring Data based on successfailure criteria can be best
described statistically by applying the binomial distribution
The normal Chi-square and Poisson distributions are sometimes
used as approximations to the binomial and are selected on the
basis of available sample size If the sample size is held
constant confidence limits may be applied to these data to establish
the true reliability values A binomial distribution analysis
was applied to the data to find the lower or one-sided confidence
limit based on the proportion of successes in each sample group
Lower confidence limits were calculated by standard statistical
methods and is compatible with the method described by Yee et al+
The lower confidence level Pe is obtained by solving the equation
Alexander McFarlane Mood Introduction to the Theory of Stashy
tistics McGraw-Hill Book Company Inc 1950 pp 233-237
BGW Yee J C Couchman F H Chang and D F Packman
Assessment of NDE ReliabZity Data CR-134834 General Dynamics Corporation Fort Worth Division September 1975
111-28
-------------- -----------------------------------------------------
n-I N-i
i=o P
where G is the confidence level desired N is the number of tests performed n is the number of successes in N tests
and PI is the lower confidence level
Lower confidencelimits were determined at a confidence level of 95 (G=95) using 60 trials (N=60) for all calculations The lower confidence limits are plotted as (-) points on all graphical presentations of data reported herein
F DATA RESULTS
The results of inspection and data analysis are shown graphically in Figures 111-11 111-12 and 111-13 The results clearly indicate an influence of inspection geometry on crack detection reliability when compared to results obtained on flat aluminum panels Although some of the change in reliability may be attributed to a change flaw tightness andor slight changes in the angle of flaw growth most of the change is attributed to geometric interference at the stringer radius Effects of flaw variability were minimized by verifying the location of each flaw at the tangency point of the stringer radius before accepting the flawinspection data Four flaws were eliminated by such analysis
Changes in detection reliability due to the presence of rivets as revealed in the Sequence 3 evaluation further illustrates that obstacles in the inspection area will influence detection results
Op cit Ward D Rummel Paul H Todd Jr Sandor A Frecska
and Richard A Rathke
111-29
100 0 0
100 I0 0
100 C
0
900
00
70
so
0 0
0
0 0 90
008
70
60
0
OO
0
00
- o0
0
0
90
00
60
0
0 0
0- 0-
0 0
0 0
-
0
50 - 0 60
o to
0 404
2 0
0 0 30 O 90 2
0 0 30
I 00
I 90 20
0 0 30
I 60
I 90 120
LENGTH SFECItEN
tIN) INTE STRINMR
LENGTH SpCIN
(IN) INTEO SIRJNGR
LENGTH SPFCIMIN
(IN I 0NTEG STRINGER
100
00 0
00
90
100
0 0
0
100
90 0
00
00
00
0
-
0 O0
70
0
0- 0
0
-
0
70
0000 0
0
0 -
-
0
6 60 - 60
040
301 30 301 O
200 0 20
00 20 10
0
0 020
I0
040
I
060
II
00
I Ir
100 120 0 020
I
040
I
060
t I
080
I I
100 20
0I
0
I
020
I 1
040
I
060
I
000
I
100
I
120
DEPTH IN SPECIHEN [NTE0 STRINGER PENETRANTTEST SO NO 1
ICOWIDE LEVEL - 950Rigure IlIl-1i Crack Detection Probability for Integrally Stiffened Panels bythe Penetrant Method Plotted at 95 Probability and 95 Confidence Level
DCpH (IN ) SECIEN INTEO STRINGER PENETRANTTEST SE0 W 2 CCWIMN C LEVEL shy 95 0
DEPTH (IN)SPCININ INTEG STRINGER
NETRANT TEST EO NO 3 CaEI20CE LEVEL shy 9 0
M00
90
o100
0 0 to 0
0
-- 0
0 0a
0 0
0
o100 0 0
90
00
0 0
70 00 0 0
so0 00 60 o 60
50 - 0 0
40
30
40
30
40
30
-
0
20 20 -shy0h
10 10 10 0
0
0
I OD
30
LENGTH
WCf]J
0 O 0
0
0
0-c
60
(INI
INTEG STRINGER
0
0
I
90
090
t20
00
0
0
100
I
30
I I
0
LENGH IIN)
5PECIHEN INTC
00 0 0
I
STRINGER
I
90
I I
120
00
0
100
00
30
j
60
LENGTH (IN)
S HCN INTEG STRINGER
0
s0 120
0
60
S
70
20
0
ffOo
0
0
680
50
40
0 --
0 IS
0
-s
0
00
0
60
500
40
6o
00
0
0 -40 0- 401 I 40
00
0
13
33 -10
30l to
30
10 01 120
0 IIo o I I I I II I
0 023 040 00 000 100 120 0 00 040 060 080 100 120 0 020 040 060 080 100 120
DEPTH (IN I SPECIhEN INTEG STRINGER ULTRASCIC TEST 000 NO I
HCEaICENCELEVEL - SO 0Figure 111I-12
Crack Detection Probability for Integrally Stiffened Panels by the Ultrasonic Method Plotted at 95 Probability and 95 Confidence Level
DEPTH (IN) SPEEI)KN INTEG STR]NGER ULIRASCNIC TEST MO NO 2 CETOENCE LEVEL M0
SPTH (IN) CIIEN INTEG STRIN ER tTRAS IC TEST SEQ NO CIFIDECE LEVEL = 050
3
100 100 -100
90 0 0 0 90
00
0
080
0 0- 00
0-
0
- 0 000
70 0
00
-0 0 0
0
00
o
45 so
O- 0 50 60_
0 -0
40O 0 0
30 0 0
30 30 0
20 20 0 20 0
10 00 10shy
0 I I I 0 I I I 0 I I I I
0 30 93 90 20 0 30 60 0 20 0 30 60 90 120
LENGTH (IN 5PECIMEN INTEG STRIKoER
LENGTH SFECIMEN
(IN ) INTEG STRINKERfNTEl
LENGTH SOpoundC[MEN
(IN I STRIKER
100 100 100
900
00 0 0
90
o
s0
80
o_50
0 0
50
00
05070
go -0
7
0 0
0 00
0 -7
00
00
00 000 000
0
00
00
0R
I0
=
20
0
a 0 01o 04
Sooo 06 OeO
STIE shy0 12o 50
ooE 00 00 00
SPooEN 0 ao 0 1002
STIERoEC 1[00
00
04 00 8
oNE NE TIE 10 2
Figure 111-13 EMOy CURRNT TEST 6EO NO Ic40ECE LEVEL - 95 0 CONIDENCE EDDY CLIRRtNT TEST LEViEL SEE NO295 0 M LRNTESO-D ENC LEVEL - 950 W3
Crack Detection Probability for Integrally Stiffened Panels c csLVLbull9
by the Eddy CurrentMethod Plotted at 95 Probabilityand 95 Confidence Level
IV EVALUATION OF LACK OF PENETRATION (LOP) PANELS
Welding is a common method of joining major elements in the fabshyrication of structures Tightly closed flaws may be included in a joint during the welding process A lack of penetration (LOP) flaw is one of several types of tightly closed flaws that can form in a weld joint and is representative of the types that commonly occur
Lack of penetration flaws (defects) may be the product of slight variations in welding parameters or of slight variations in welding parameters or of slight variations in weld joint geometry andor fit up Lack of penetration defects are illustrated schematically
Lack of Penetration
(a) Straight Butt Joint Weldment with One Pass from Each Side
Lack -of Penetration
(b) Straight Butt Joint Weldment with Two Passes from One Side
Figure II-I Typical Weldient Lack of Penetration Defects
IV-1
----------------------------------------------------------------
Figure IV-l(a) is the result of a failure to penetrate the weld
joint fully by single passes from each side of the joint This
type of defect is also termed lack of fusion and may be referred
to as such in the literature Figure IV-l(b) is the result of
a failure to penetrate the weld joint fully by two passes from
the same side of a joint
one of the mostA lack of penetration defect has been shown to be
difficult flaws to detect by conventional nondestructive inspection
Because of the high residual compressive stressestechniques present in weldments containing this defect and the tendency
of
the defect to form a diffusion bond under its combined heat and
stress exposure it is possible to miss it using X-radiographic and
Even if the defect is open to theultrasonic inspection methods
surface- it is possible for the joint to be so tightly closed that
Various investigators have conductshypenetrants will not reveal it
ed studies to enhance LOP defect detection A difficult
experiment variable in such programs is the tightness of the defect
Lack of penetration in straight butt joint weldments with one pass
from each-side was-selecteamp for-avaluation This configuration
provided the greatest option in varying defect location through
the thickness of the weld ie open near the surface and buried
and provided the greatest chance for obtaining tightly closed flaws
After the flaw type was established a program plan for test panel
preparation evaluation and analysis was established as shown
schematically in Figure IV-2
B G Martin and C J Adams Detection of Lack of Fusion in
Aluminum Alloy Weidments by Ultrasonic Shear Waves Technical
Douglas Aircraft Company 1965Paper No 3499
Detection of Lack of Fusion Using Opaque AdditivesJ L Cook Contract NAS8-287D8 McDonnell DouglasPhase I Progress Report
Astronautics Company November 1972
Definition of Mutually Optimum NDI and Proof Test Criteria for
2219 Aluminum Pressure Vessels Work in progress Contract NAS3shy
17790 Martin Marietta Aerospace Denver Colorado
IV-2
Dimensional
Finish Preparation Measurement amp
aSurfce Documentationd
NDT EVALUATION
X-radiography Ultrasonic Eddy Current Penetrant Chemical
Penetrant Removal Etch
NDT EVALUATION
X-radiography Proof Test Ultransonic
to 90 of Eddy Current Weld Yield Penetrant Strength - Penetrant Removal
Fracture Specimens
bullMeasure amp Datamp SDocument Flaw Sizes La Tabulation
NDT EVALUATION X-radiography
Ultrasonic
Eddy Current PenetrantPenetrant Removal
fDimensional Surface Finish Measurement amp Documentation
Machine Weld Bead
Flush with Weld Land
efiiensionalSurface Finish Inspection amp Documentation
NDT EVALUATION
X-radiography Ultrasonic -Eddy Current Penetrant Penetrant Removal
Figure IV-2 NDT Evaluation Sequence for Lack of Penetration -Panels
A SPECIMEN PREPARATION
The direct current gas tungsten arc (GTA) weld technique was
selected as the most appropriate method for producing LOP flaws in
commonly used in aerospace condtruction2219-T87 panels and is The tungsten arc allows independent variation of current voltage
This allows for a specificelectrode tip shape and weld travel
reproduction of weld conditions from time to time aswell as
several degrees of freedom for producing nominally proportioned
welds and specific weld deviations The dc GTA can be relied on to
produce a bead of uniform depth and width and always produce a
single specific response to a programmed change in the course of
welding
to measure or observe the presence ofIn experiments that are run
lack of penetration flaws the most trying task is to produce the
LOP predictably Further a control is desired that can alter
the length and width and sometimes the shape of the defect
Commonly an LOP is produced deliberately by a momentary reduction
of current or some other vital weld parameter Such a reduction of
heat naturally reduces the penetration of the melt But even
when the degree of cutback and the duration of cutback are precisely
executed the results are variable
Instead of varying the weld process controls to produce the desired
to locally vary the weld joint thicknessLOP defects we chose At a desired defect location we locally increased the thickness
of the weld joint in accordance with the desired height and
length of the defect
A constant penetration (say 80) in a plate can be decreased to
30 of the original parent metal plate thickness when the arc hits
It will then return to the originalthis thickness increase runs off the reinforcement padpenetration after a lag when it
The height of the pad was programmed to vary the LOP size in a
constant weld run
completed to determine the appropriateAn experimental program was
pad configuration and welding parameters necessary to produce the
Test panels were welded in 4-foot lengths usingrequired defects the direct-current gas tungsten arc welding technique and 2319
aluminum alloy filler wire Buried flaws were produced by balanced
607 penetration passes from both sides of a panel Near-surface
and open flaws were producedby unbalanced (ie 8030) pene-
Defect length andtration-passes from both sides of a panel
controlled by controlling the reinforcement pad conshydepth were figuration Flaws produced by this method are lune shaped as
iv-4
illustrated by the in-plane cross-sectional microphotograph in Figure IV-3
The 4-foot long panels were x-radiographed to assure general weld process control and weld acceptability Panels were then sawed to produce test specimens 151 centimeters (6 in) wide and approximately 227 (9 in) long with the weld running across the 151 centimeter dimension At this point one test specimen from each weld panel produced was fractured to verify defect type and size The reinforcementpads were mechanically ground off to match the contour of the continuous weld bead Seventy 18-inch (032) and seventy 12-inch (127-cm) thick specimens were produced containing an average of two flaws per specimen and having both open and buried defects in 0250 0500 and 1000-inch (064 127 254-cm) lengths Ninety-three of these specimens were selected for NDT evaluation
B NDT OPTIMIZATION
Following preparation of LOP test specimens an NDT optimization and calibration program was initiated Panels containing 0250shyinch long open and buried flaws in 18-inch and 12-inch material thicknesses were selected for evaluation
1 X-Radiography
X-radiographic techniques used for typical production weld inspectshyion were selected for LOP panel evaluation Details of the procedshyure for evaluation of LOP panels are included in Appendix D This procedure was applied to all weld panel evaluations Extra attention was given to panel alignment to provide optimum exposure geometry for detection of the LOP defects
2 Penetrant Evaluation
The penetrant inspection procedure used for evaluation of LOP specimens was the same as that used for evaluation of integrally stiffened panels This procedure is shown in Appendix A
IV-5
Figure IV-3 Schematic View of a Buried LOP in a Weld withRepresentative PhotomicrographCrossectional Views of Defect
3 Ultrasonic Evaluation
Panels used for optimization of X-radiographic evaluation were also used for optimization of ultrasonic evaluation methods Comparison of the techniques was difficult due to apparent differences in the tightness of the defects Additional weld panels containing 164-inch holes drilled at the centerline along the axis of the weld were used to provide an additional comparison of sensitivities
Single and double transducer combinations operating at 5 and 10 megahertz were evaluated for sensitivity and for recorded signalshyto-noise responses A two-transducer automated C-scan technique was selected for panel evaluation This procedure is shown in Appendix E Following the Sequence 1 evaluation cycle (as-welded condition) one of the weld beads was shaved off flush with the specimen surface (Sequence 2 scarfed condition) The ultrasonic evaluation procedure was again optimized This procedure is shown in Appendix F
4 Eddy Current Evaluation
Panels used for optimization of x-radiographic evaluation were also used for optimizationof eddy current methods Depth of penetration in the panel and noise resulting from variations in probe lift-off were primary considerations in selecting an optimum technique A Vector III instrument was selected for its stability A 100-kilohertz probe was selected for evaluation of 18-inch specimens and a 20-kilohertz probe was selected for evaluation of 12-inch specimens These operating frequencies were chosen to enable penetration to the midpoint of each specimens configuration Automated C-scan recording was accomplished with the aid of a spring-loaded probe holder as shown in Figure IV-4 A procedure was established for evaluating welded panels with the crown intact This procedure is shown in Appendix G Following the Sequence 1 evaluation cycle (as-welded condition) one of the weld beads was shaved off flush with the specimen surface (Sequence 2 scarfed condition) The eddy current evaluation procedure was again optimized Automated C-scan recording was accomplished with the aid of a spring-loaded probe holder as shown in Figure IV-5 The procedure for eddy current evaluation of welded flat panels is shown in Appendix H
IV-7
Scanning Bridge Mounting Tube
Double Hing
Sann odrfrWleSpring-Loaded CurrentEddy rb Panels wthPCrown
Spring-oae EdyCretSann PoeRrfrW~
Fir
Panels with Crowns
IV-8
Probe
Shoe Pivot
IScanning Bridge Mounting Tube
Eddy Current _- - P robe
Figure IV-5 Spring-Loaded Eddy Current Scanning Probe Holder for Flat Panels
IV-9
C TEST SPECIMEN EVALUATION
Test specimens were evaluated by optimized x-radiographic penetrant
ultrasonic and eddy current inspection procedures in three separate inspection sequences Two additional penetrant cycles
were completed after etching panels in the as-welded condition and
after etching in the scarfed condition After familiarization
with the specific procedures to be used the 93 specimens were
evaluated by three different operators for each inspection sequence
Inspection records were analyzed and recorded by each operator
without a knowledge of the total number of defects present or
of the previous inspection results
1 Sequence 1 - Inspection of As-Welded Specimens
The Sequence 1 inspection included x~radiographic penetrant
ultrasonic and eddy current inspection procedures One set of
x-radiographs was made The radiographs were then evaluated
independently by three different operators Each operator intershy
preted the x-radiographic image and reported his own results
Penetrant inspection of specimens in the as-welded condition was
performed by one operator Few defects were detected and results
were not included in the data This inspection was somewhat
biased due to the mechanical grinding on the beads to remove the
reinforcement pads The specimens were etched using a light
metallurgical etch (Flicks etchant solution) recleaned using
a mild alkaline cleaner and reinspected Penetrant inspection was
performed independently by three different operators who completed
the entir penetrant inspection process and reported their own
results
One set of C-scan ultrasonic and eddy current recordings were made
The recordings were then evaluated and the results recorded
independently by three different operators
IV-10
Inspections were carried out using the optimized methods establishshy
ed and documented in Appendices A D E and F The locations and relative magnitudes of the NDT indications were recorded by
each operator and coded for data processing
2 Sequence 2 - Inspection after Scarfing
On completion of the first inspection sequence the weld crown on
one side of each LOP panel was removed by scarfing In all cases
the weld crown was removed flush with the parent metal surface
For near-surface LOP flaws the weld crown was removed from the
side nearest to the LOP to open it to the scarfed surface Panels
were cleaned and inspected by the optimized NDT methods One set
of x-radiographs was made The radiographs were then evaluated
independently by three different operators Each operator
interpreted the information on the x-ray film and reported his
own results
Penetrant inspection was performed independently by three different
operators who completed the entire penetrant inspection procedure
and reported their own results Scarfing of the weld crown
resulted in mechanical smearing of the aluminum material thus
decreasing the chances for the penetrant to reveal the flaws The surface was therefore etched using a light metallurgical etch
(Flicks etchant solution) recleaned using a milk alkaline
cleaner-and reinspected by three different operators
One set of C-scan ultrasonic and eddy current recordings was made
The recordings were then evaluated independently by three
different operators Inspections and readout were carried out
using the optimized methods established and documented in Appendices A D E and G The locations and relative magnitudes
of the NDT indications were recorded by each operator and were
coded for data processing
3 Sequence 3 - Inspection after Proof Loading
Following completion of Sequence 2 the LOP panels were proofshy
loaded to approximately 90 of the yield strength for the weld
This loading cycle was performed to simulate a proof load cycle
on functional hardware and to evaluate the enhancement of flaw
detection provided by NDT methods Panels were cleaned and
inspected by optimized NDT methods One set of x-radiographs was
made This set was evaluated independently by three different
operators Each operator interpreted the information on the x-ray
film and reported his own results
IV-11
Penetrant inspections were performed independently by three
different operators who completed the entire penetrant inspection
procedure and reported his own results
One set of C-scan ultrasonic and eddy current recordings was made
The recordings were then evaluated independently by three different
operators Inspections and readout were carried out using the
optimized methods established and documented in Appendices A D
E and G The locations and relative magnitudes of the NDT
indications were recorded by each operator and were coded for data
processing
D PANEL FRACTURE
Following final inspection in the post proof-loaded configuration
the panels were fractured and the actual flaw sizes measured
Flaw sizes- and- locations were-measured with the aid of a traveling
microscope and the results were recorded in the actual data file
tip to the tip of the lunes were measuredThe lengths from the actual flaw length and were used in processingand recorded as
data by the x-ray ultrasonic and eddy current methods The
lengths of the flaw open to the panel surface were measured and
the actual flaw lengths and were used in processingrecorded as data by the penetrant method
The heights of the lunes were measured and recorded as actual
flaw depth and were used in processing all data In addition to
the plan view location within the panel the depth or location
of the lune beneath the surface for buried flaws was recorded
This depth below the surface was used as a criterion for acceptshy
ing data observed by the eddy current method Figure IV-6
schematically shows the measurements taken for the LOP specimens
E- DATA ANALYSIS
1 Data Tabulation
Actual LOP flaw data and NDT observations were coded keypunched
and input to a computer for data tabulation data ordering and
data analysis sequences Table IV-l lists actual flaw data for
LOP specimens Note that all dimensions are in inches
Iv-12
a Flaws Open to the Surface
b Buried Flaws f --)
Figure IV-6 Schematic Side View of a LOP (Lune) Flaw Showing Critical Dimensions
-V-13
Table IV-I Actual Flaw Data LOP Panels
PANEL CRACK CRACK CRACK INITIAL FINAL CRACK POSITION P NO NO LENGTH DEPTH FINISH THICKNESS FINISH THICKNESS X Y DXDU
IC 1 517 035 51 1380 50 1060 123 443 u02 ICA 2 504 040 51 1380 50 1060 285 448 00201 BCA 17 542 02 51 1380 50 1060 230 432 00224
lOCA 19 498 04t 62 1500 25 1330 233 438 00175 1ICA 20 569 047 62 1500 25 1330 382 438 00210 1308 24 194 050 53 1300 50 1150 212 340 160B 28 133 042 87 1840 20 1440 499 342 160B 29 231 042 88 1660 32 1390 409 345 1605 30 268 05u 88 16o0 32 1390 322 345 19ACA 35 346 076 tO 1750 40 1460 194 320 00108 20CA 36 318 057 77 1690 28 1510 200 327 00055 2108 37 263 053 76 1720 50 1510 286 328 2108 38 341 066 7b 720 50 1510 195 327 2208 39 345 065 65 1620 30 1540 392 327 2208 40 258 057 65 1620 30 1540 301 327 240B 4 337 073 81 1780 36 1430 298 320 00075 2408 24CA
45 46
309
336 064 061
81 81
1780
1780 36 36
1430
1430 207 117
322 324 00061
260B 49 1100 091 51 1730 25 1400 450 427 260a 50 1158 087 51 1730 25 1400 302 427 2608 51 1075 08 51 1730 25 1400 156 425 280B 55 1175 088 55 1830 64 1590 476 425 280B 56 1079 090 55 1830 64 1590 309 427 2808 57 1052 093 55 1830 64 1590 142 422 3OCA 61 1156 080 54 1760 28 1320 310 384 00078 30CA o2 1122 071 54 17t0 28 1320 154 380 00095 33CA 69 1125 073 49 1870 65 1250 498 385 00117 33CA 70 1150 072 49 1870 65 1250 331 387 00126 33CA 71 1184 070 49 1870 65 1250 160 385 00154 360B 77 1010 105 53 2050 20 1660 14B 440 308B 78 987 103 53 2050 20 1660 301 440 360B 79 91q 105 53 2050 20 1660 443 440 3708 80 916 104 52 1890 40 1820 448 439 370B 81 890 102 52 1890 40 1820 283 441 370B 82 850 104 52 1890 40 1820 113 441 380B 83 825 120 62 2050 40 1430 521 440 3806 8k 790 117 62 2050 40 1430 353 440 3808 85 q35 116 62 2050 40 1430 195 440 45CA 103 885 035 94 1620 40 1430 320 407 00269 45CA 104 929 041 94 1620 40 1430 159 407 00225 5205 119 698 083 62 1780 25 1520 319 432 5408 121 734 088 55 1660 60 1440 336 431 540B 550B
122 123
788
742 089 0o9
55 50
1660
1750 60 55
1440
1480 186 288
429 429
5508 124 749 073 50 1750 55 1480 139 - 429 561B 125 1075 1 50 1560 35 1180 257 430
5805 6008 60D
127 129 130
1124-1158 1105
083
07
091
51 54 54
1590
1460 1460
40 0 40
1230
1170
1170
349 304 157
432 432 432
oSCA 142 372 059 115 1740 35 1430 299 340 00159 70CA 143 320 055 100 1650 45 1490 290 345 00 9 72CA 72CA
146 147
297
288 070 054
71 71
1630
1630 40 40
1470
1470 464 377
343 342
00197 00259
73CA 148 322 058 112 1670 40 1390 302 344 00176 73CA 149 267 057 112 1670 40 1390 212 342 00171 73CA 150 343 053 112 1670 40 1390 123 342 00225 74CA 74CA
151 shy152
262
250 060 052
105 l5
1620
120 35 35
1490 1490
482 392
342 342
00220 00285
74CA 153 243 050 105 1620 35 1490 304 342 0025 77CA 78CA
156 157
1014 986
046
046 91 86
1430
1470 150 150
1330
1210 351 478
434 433
00244 00246
8OCA 160 961 049 0 1430 150 1260 409 434 00214 80CA 85CA
161 I6
943
874 050 057
40 145
1430
1640 150 125
1260
1370 258 374
433 427
00205shy00155
85CA 167 921 05 145 1640 125 1370 226 427 ooi74 86CA 168 781 049 46 1620 115 1400 273 427 00172 86CA 169 809 049 46 1620 115 1400 127 427 00204 88CA 173 812 085 39 1620 150 1450 445 432 88CA 174 825 080 39 1620 150 1450 279 432 00117 SCA 175 858 074 39 1620 150 1450 105 434 00225 94CA 186 268 075 40 1790 140 1600 194 330 00345 980A 194 277 077 46 1710 115 1250 331 321 950A 195 280 070 4 1710 115 1250 331 321 980A 196 288 083 46 1710 115 1250 151 323 99CA 197 717 097 92 1910 22 1480 286 430 00025 99CA 198 638 101 92 1910 22 1480 129 430 00063
10708 214 b49 062 105 1710 160 1400 453 438 10808 215 724 088 92 1800 36 1360 370 443 108CA 216 676 073 92 1800 36 1360 180 44 11108 220 1210 075 76 1i0 130 1260 323 421 11208 221 1184 077 68 1500 20 1250 400 439 1140B 11408
223 224
1271 1245
097
099 74 74
1430
1430 25 25
1220
1220 354 212
443 444
11508 225 1226 073 111 1410 54 1150 401 438 11508 226 1216 070 111 1410 54 1150 255 438
ICA 501 516 028 120 4830 160 4470 296 428 01594 9CA 509 369 070 230 4950 60 4650 394 430 oi435
lIX 510 261 032 230 4980 45 4660 347 426 IICA -511 393 048 230 4980 45 4660 382 426 0I545 1608 516 338 064 175 4850 130 4450 299 431
I7-14
Table IV-I (Continued)
17CA 517 688 077 b2 4850 55 4550 250 452 190A 2008 2108 2208
519 520 521 522
511
708
362
494
079
090
061
052
77 115 70 57
4850
4860
4750
4800
45 45 70 85
4590
4360
4610
4610
230 196 226 361
453 448 453 438
2308 523 419 070 47 4780 60 4510 366 440 240B 514 562 076 50 4880 40 4660 262 445 24X 2808
525 528
483
686 160 078
50 47
4880
4890 40 22
4660
4630 440 188
445 447
28X 529 145 028 47 4890 22 4630 418 445 28X 3608
530 536
112
964 027 117
47 44
4890
5090 22 45
4630
4690 444 246
445 444
42CA 542 214 024 79 4910 84 4630 303 425 O1If 43CA 44CA 450A
543 544 545
116
173
033
009
032
014
62 o0
39
4840
4870
4860
70 52 50
4540
4550
4540
289 295 296
430 425 430
0160 01497 O114
480A 500A 59CA 60CA
548 550 559 560
094
900
872
889
005 03q 069 063
74 52 72 73
4780
4830
4850 14870
40 45
125 60
4370
4530
4600 4560
311 291 228 364
430 429 423 425
01581 01723 01228 01506
63CA 640A 6408 6408
53 54 565 566
870 435 391 440
058 071 081 076
127 87 87 87
4810
4780
4760
4780
45 80 80 80
4560
4520
4520
4520
211 452 308 154
423 437 437 437
0120
660B 6608 o70B
568 569 570
482
430
531
094
096
085
60 60 63
4920
4920
480
55 55 80
4620
4620
4660
350 247 387
440 440 443
6708 571 568 081 63 4800 80 4660 288 443 68C 572 488 087 69 4740 35 4550 436 443 680 8
573 574
454
518 095 090
o9 69
4740
4740 35 35
4550
4550 330 230
443 444
690B 60 6905 700
575 576 577 578
506 601 568 632
077
071
071
089
82 82 82 53
4620
4620
4c20
4750
78 78 78 90
4580
4580
4580
4480
442 343 239 436
443 443 443 440
7008 7108 710B
579 580 581
611 672 699
105
075
078
53 63 63
4750
4720
4720
90 36 36
4480
4550
4550
312 414 292
440 440 440
7108 720a 720
582 583 584
690 706 730
072
087
083
63 77 77
4720
4910
4910
36 54 54
4550
4650
4650
174 468 347
440 440 440
7208 730 7308
565 586 587
630
672
652
077
091
098
77 45 45
4910
4840
4840
54 45 45
4650
4540
4540
225 427 310
438 435 435
730 588 688 087 5 4840 45 4540 187 435 7708 7808 8108 94C 94C 950 95C 950
594 595 598 619 620 621 422 623
688
682
670
483
474-
665
675
541
-101 127 126 040 035 061 065 041
52 60 29 45 45 58 58 58
4710
4B50
4730
4830
4830
4790
4790
4790
55 80 45 45 45 62 62 62
4370
4600
4330
4540
4540
4630
430
4630
242 347 297 414 297 404 283 169
421 405 415 435 435 434 434 434
01631 01441 01155 0120 01Z
97C 970 97C 980 980
627 628 629 630 31
659 671 562 945 737
063
060
063
083
061
37 37 37 41 41
4950
4950
4950
4920
4920
35 35 3 75 75
4570
4570
4570
4640
4640
407 286 172 395 278
435 435 435 440 440
0ls6 01518 0144 01218 012
1000 100C 1020
634 635 639
1121 1020 1041
065
069
069
105 105 140
4810
4810
4850
125 125 90
4500
4500
4690
380 184 515
425 425 425
01302 01350 01479
102C 1020 104C 1040 1040 1050 1050
640 641 644 645 64 647 648
1075 1075 943 995 846 122 177
058
Obu
048
062
054
012
027
140 140 55 55 55 51 51
4850
4850
4920
4920
4920
4800
4800
90 90 40 40 40 82 82
4690
4690
4590
4590
4590
4600
400
340 160 527 342 169 441 286
425 425 425 425 425 437 437
oi61 01i1 0136 012 01370 01682 01510
1070 1070 108C 1080 1090
651 642 653 654 655
259 132 285 183 289
020
033
038
026
035
165 lb5 9U 90 44
4990
4990
4970
4970
4870
95 95 65 65 48
4700
4700
4670
4670
4550
317 214 248 148 478
435 435 435 435 435
oid6oW10 0i426 01475 01664
1090 1090 1120
656 657 661
198
196
621
032
013
061
44 44
115
4875
4870
4273
48 48 48
4550
4550
4550
379 276 293
435 435 440
01642 0i640 01388
112X 126C 1280
662 675 677
645 1050 1093
064
077
054
115 85 53
4270
4880
4680
48 32 30
4550
4670
4700
410 363 370
440 435 434
01502 0111m4 01368
1320 4CA 4CA 4CA IICA
661 301 302 303 3
431
529
535
515
514
037
044
038
09
053
64 -0 -0 -0 -0
4810
150 -0 -0 -shy0 -0
4530
427 99
268 439 173
450 -0 -0 o -0
01429
IV-15
Table IV-1 (Concluded)
lICA 140B 5308
305 306 307
461
294
773
044
051
091 -shy
-0 0 -0
-0 -0 -0
323 210 416
-0 -0 -0
100B 10008 10008 10208 10208 102DB 1050B 109C6 109C8
4 4 4
11 11 14 53
100 100 100
308 309 310 311 312 313 314 315 316 317 318
619 320 321 322
323 32 325 326
799
750
732
626
733
706
637
660
712
529
535
515
514
461
294
773 1799 750 732
099
096
096
097
094
097
088
088
089
044
038
029
05
044
01
091
099
096
096
-0 -0 -0 -0 -0 -0 -0 -0 --0 -0 -0 -0 -0 -0
-0 -0 -0 -0
S
-0 -0 -0 -o -0 -0 -0 -0 --0 -0 -0 -0 0 -0
-0 -0 -0 -0
147 293 439 103 271 445 261 183 335 99
268 439 173 323 210
416 147 293 439
-0 -0
-0 0
-0 -0 -0 -0 -0 -0 -0 -0 -0 -0 -0
-0 -0 -0 -0
102 102 102 105 109 109
3 7 328 329 330 331 332
628
733
706
637
660
712
097 09 097 088 088 089
-0 -0 -0 -0 -
0
-0 -0 -0 -0 -0 -0
103 271 445 261 183 335
-0 -0 -0 -0 -0 -0
2CB 13C8 55C5
801 802 b03
496
250
907
052
035
068
-0 -0 -0
-0 -0 -0
263 368 294
-0 -0 -0
9005 9008
804 805
1292 1327
117
12 -0 -o
-0 -
158333 -0-0
900B 9108 910D 9108 9308 9308 9308
IIOCB I10CB 1106 11708 124CB
2 13 55 90 90 90 91 91 91 93 9amp 93
110 110 110
806 307 608 809 810 8ll 812 813 614 6 15 316 817 818 819 820 821 822 323 324 825 326 827 828 329 830 831 632
1412 1171 1487 1498 1257 1783 1878 293 22 207
1365 1104 496 250 907 1292 1327 1412 1171 1487 1498 1257 1783 1878 293 242 207
120
115
113
127
118
117
122
040
043
034
127
082
052 035 068 117 124 120 115 113 127 118 117 122 040 043 034
0 -0 -0 -0 -0 -0 -0 -0 -0 -0 -0 -0 -0 -0 -0 -0 -0 -0 -0 -0 -0 -0 -0 -0 -amp -0 -0
-0 -0 -0 -0 -0 -0 -0 -0 -0 -0 -0 -0 -0 -0 -0 -0 -0 -0 -0 -0 -0 -0 -0 -0 -0 -0 -0
515 138 331 504 163 322 510 235 331 432 378 376 263 368 294 158 333 515 138 331 504 168 322 510 35
331 432
-0 -0 -0 -0 -0 -0 -0 -0 -0 -0 -0 -0 -0 -0 -0 -0 -0 -0 -0 -0 -0 -0 -0 -0
0 -0 -0
177 124
833 834
1365 1304
127
082 -Q -0
-0 -0
3e78 376
-0 -D
IV-16
Table IV-2 lists nondestructive test observations as ordered according to the actual flaw length Table IV-3 lists nonshy
destructive test observations by the-penetrant method as
ordered according to actual open flaw length Sequence 10
denotes the inspection cycle which we performed in the as
produced condition and after etching Sequence 15 denotes
the inspection cycle which was performed after scarfing one
crown off the panels Sequences 2 and 3 are inspections
performed after etching the scarfed panels and after proof
loading the panels Sequences 2 and 3 inspections were performshy
ed with the panels in the same condition as noted for ultrasonic eddy current and x-ray inspections performed in the same cycle
A 0 indicates that there were no misses by and of the three NDT observers Conversely a 3 indicates that the flaw was
missed by all of the observers A -0 indicates that no NDT
observations were made for the sequence
2 Data Ordering
Actual flaw data (Table IV-l) were used as a basis for all subshysequent calculation ordering and analysis Flaws were initially
ordered by decreasing actual flaw length depth and area These data were then stored for use in statistical analysis
sequences
3 Data Analysis and Presentation
The same statistical analysis plotting methods and calculation of one-sided confidence limits described for the integrally stiffened panel data were used in analysis of the LOP detection reliability data
4 Ultrasonic Data Analysis
Initial analysis of the ultrasonic testing data revealed a
discrepancy in the ultrasonic data Failure to maintain the
detection level between sequences and to detect large flaws
was attributed to a combination of panel warpage and human factors
in the inspections To verify this discrepancy and to provide
a measure of the true values 16 additional LOP panels containing
33 flaws were selected and subjected to the same Sequence I and
Sequence 3 inspection cycles as the completed panels An additional
optimization cycle performed resulted in changes in the NDT procedures for the LOP panels These changes are shown as
Amendments A and B to the Appendix E procedure The inspection
sequence was repeated twice (double inspection in two runs)
IV-17
Table IV-2 NDT Observations LOP Panels
ULTRASONIC EDDY CURRENT X-RAY
INSPECTION SEQUENCE 1 2 3 1 2 3 1 2 3
CRACK ACTUAL NUMBER VALUE
223 1271 3 0 0 0 3 3 1 0 0 224 1245 0 0 0 1 3 3 1 0 0 225 122b 3 3 U 3 1 2 0 0 0 286 121d 3 3 0 1 1 2 0 0 0 220 1210 3 3 u 0 3 2 2 0 0 71 19184 2 0 0 3 3 3 0 0 0
221 19184 3 3 0 0 1 0 0 0 0 55 1175 3 3 0 1 0 0 0 0 0 50 1158 3 3 0 1 3 3 0 0 0 129 115$ 3 0 -0 3 3 -0 0 0 3 61 1156 3 0 0 3 3 0 0 0 0 70 1150 2 3 0 3 3 0 0 0 0 69 1125 1 3 0 3 3 3 0 0 1 127 62
1124 1122
3 3
3 3
0 0
0 3
2 3
0 1
0 0
0 0
0 0
634 1121 0 0 0 3 3 3 0 0 0 130 1105 1 0 -0 1 3 -0 0 0 3 49 1100 3 3 0 2 3 3 0 0 0
677 1093 1 0 0 3 3 3 0 0 0 56 19079 3 3 0 0 0 0 0 0 0
125 1075 3 1 0 0 3 3 2 0 0 640 1075 3 1 0 1 2 2 3 2 0 641 1076 2 1 1 1 1 3 1 1 0 51 I075- 3 3 3 2 2 3 0 0 0 57 1052 3 2 0 3 2 0 0 0 0
675 1050 2 3 0 2 1 2 2 2 0 639 1041 3 3 0 3 3 1 3 3 1 635 1020 3 2 0 3 2 3 2 2 0 156 1014 3 0 0 3 3 3 0 0 0 77 10010 0 0 0 1 0 0 0 0 0
645 993 2 1 0 3 3 3 3 3 0 78 987 0 u 0 0 0 1 0 0 0
157 986 3 1 0 2 3 3 1 0 0 536 964 3 3 0 0 3 0 3 2 0 160 961 3- 0 0 3 3 3 0 0 0 630 945 3 3 0 2 2 2 2 1 0 644 943 2 0 0 3 3 3 3 2 0 161 943 3 0 0 2 3 2 0 0 0 85 935 0 O -0 0 0 -0 0 0 3 104 929 3 2 0 3 3 3 0 0 0 167 921 3 3 0 3 3 0 0 0 0 79 919 0 0 0 1 0 1 0 0 0 80 916 1 0 0 0 3 1 0 0 0
550 900 3 3 0 1 3 0 3 3 1 81 890 O 0 0 0 0 1 0 0 0
560 889 1 1 0 3 3 1 1 0 0 103 885 3 3 0 3 3 0 0 0
IV-18
Table IV-2 (Continued)
NU VAL 1 2 3 I 2 3 1 2 3
166 o37 shy 3 U U 1 3 0 0 0 0 559 S872 3 3 0 3 3 3 2 2 0 563 870 1 U 0 2 3 3 1 1 0 175 858 3 3 -0 3 3 -0 0 0 3 82 850 1 U U 2 0 0 0 0 0
646 846 3 0 0 2 2 2 3 3 0 174 825 3 3 -0 3 3 -o 0 0 3 b3 825 0 0 -0 1 3 -0 0 0 3 173 812 3 3 -0 3 0 0 0 0 3 169 80) 3 2 0 3 2 3 0 0 0 84 790 U 0 -U 0 3 -0 0 0 3
122 o788 3 3 0 1 3 3 U 0 0 It8 e781 2 j 0 2 0 1 0 0 0 124 9749 3 0 0 2 3 0 0 0 0 123 0742 3 3 0 2 3 0 0 0 0 631 a737 3 3 0 3 2 1 3 1 0 121 734 3 0 0 1 0 3 0 0 U 584 730 3 2 0 2 3 0 0 1 0 215 724 3 3 0 2 3- 3 1 1 0 197 717 1 3 0 1 3 3 0 0 0 520 708 3 2 0 1 3 0 0 2 0 583 706- 3 1 0 0 3 0 0 1 2 581 699 3 3 0 3 2 0 0 0 0 119 o698 3 3 0 1 3 3 0 0 0 582 690 3 0 0 2 2 0 0 1 0 517 s688 1 3 0 1 3 3 3 0 0 588 688 1 0 0 3 3 3 1 1 0 594 688 3 3 0 3 3 0 1 2 0 528 o686 3 3 0 0 3 0 3 2 0 595 682 3 1 0 0 3 3 1 1 0 216 67o 3 3 0 2 3 3 1 0 0 622 675 0 0 0 3 3 1 2 1- 0 580 672 3 3 0 2 2 0 1 1 0 586 672 3 1 0 2 3 3 1 2 0 628 671 3 1 0 3 1 3 3 1 0 598 670 3 3 U 2 3 3 1 1 0 621 665 U 0 0 2 3 3 0 1 0 627 o659 3 1 0 3 2 2 1 1 0 587 652 2 0 0 2 2 3 0 0 0 214 649 3 3 0 3 3 0 0 0 0 662 645 3 3 3 3 3 3 3 3 3 198 63 0 1 U 2 3 3 0 0 0 578 9632 0 0 0 2 1 3 0 0 0 585 o630 J 0 0 2 0 0 0 1 0 661 621 3 3 3 3 3 3 3 3 3 579 611 0 0 0 1 3 3 0 1 0 576 9601 1 0 0 1 0 0 0 0 0 20 569 3 3 0 3 3 3 0 0 0
571 566 3 3 0 2 3 0 1 1 0
IV-19
Table IV-2 (Continued)
CKj ACT NO VAL 1 2 3 1 2 3 1 2 3
577 568 0 0 0 1 0 0 1 0 0 524 562 2 3 0 2 0 1 0 0 0 629 562 3 1 0 3 2 3 3 1 0 17 542 3 3 0 2 3 1 0 0 0
623 541 0 0 0 3 0 3 3 2 0 570 531 3 3 0 1 3 0 0 1 0 574 518 2 3 0 3 2 2 0 1 0
1 517 3 3 0 3 3 3 0 0 0 501 516 3 3 0 3 0 3 3 2 0 519 511 3 3 0 1 0 2 3 0 0 575 506 0 0 0 1 0 0 0 0 0
2 50 3 3 0 3 3 3 0 0 0 19 498 3 3 0 2 3 3 0 0 0
522 494 2 3 0 0 3 0 1 2 0
572 488 0 0 0- 0 2 3 0 1 0 525 483 a 2 0 0 3 3 0 0 0 619 483 3 3 1 3 3 0 3 3 2 568 48e 3 3 U 1 3 0 0 1 0 620 474 3 0 0 1 1 0 3 3 0 5-3 454- 1 0 0- 3 2 3 1 1 0 566 440 U 0 0 2 3 2 0 0 1 564 435 3 2 0 2 3 3 0 0 0 681 431 3 3 0 2 1 3 3 2 0 569 430 0 3 3 2 0 2 0 0 0 523 419 0 0 0 0 3 0 0 0 0 511 393 3 2 0 3 3 3 3 3 0 565 a391 1 0 0 2 2 3 0 0 0
142 372 3 3 0 0 3 3 0 0 0 509 369 3 3 0 3 3 2 3 3 0 521 362 3 3 0 0 3 0 1 2 0 35 346 0 0 0 3 3 3 0 0 0 39 345 0 0 0 1 0 0 0 0 0
150 343 3 3 3 2 3 3 0 0 0 38 341 1 0 0 2 0 3 0 0 0
516 338 0 0 0 2 3 3 0 1 0 44 337 0 0 0 1 3 3 0 0 0 46 336 3 2 0 2 3 2 0 0 0 148 324 3 3 0 1 3 3 0 0 0 143 320 3 3 0 0 3 3 1 0 0 36 318 0 0 0 2 2 1 0 0 0 45 309 0 1 0 2 3 1 0 0 0 146 297 3 3 2 1 3 1 0 0 0 655 289 3 3 0 2 3 3 3 0 0 147 288 3 3 0 2 3 3 0 0 0 196 288 3 3 3 2 3 2 0 0 0 653 285 3 0 -0 3 3 3 3 3 1 195 280 0 3 0 3 3 1 0 0 0 194 277 3 3 0 3 3 0 0 0 0 30 26d -3 1 0 1 2 0 0 0 0
IV-20
Table IV-2 (Concluded)
CK NO
ACT VAL 1 2 3 1 2 3 1 2 3
186 26 3 3 0 1 3 3 0 0 0 149 p261 3 3 0 3 3 3 0 0 0 37 p263 1 0 0 2 1 1 0 0 0
151 262 3 3 u 1 3 3 0 0 0 510 o261 0 0 0 3 3 3 2 3 3 6)1 40
259 258
3 0
3 0
0 0
2 1
1 3
3 0
3 0
2 0
0 0
152 250 3 3 0 3 3 3 0 0 0 153 243 3 3 0 1 3 2 0 0 0 d9 231 3 3 0 2 3 0 0 0 0
542 o214 2 3 0 2 0 3 3 2 0 656 191 3 J 0 3 2 3 0 1 0 657 196 3 3 0 3 1 3 3 2 1 24 194 3 3 0 2 0 3 0 0 0
654 183 3 3 0 2 3 3 3 3 0 648 177 3 0 0 1 3 0 2 2 0 544 173 3 3 0 0 3 0 2 0 1 529 14h 2 3 0 2 3 3 3 2 2 28 133 3 3 u 2 3 3 3 1 0
642 132 -0 -0 0- -0 -0 -0 - -0 -0
647 o122 1 3 2 3 3 2 P 2 3 543 9116 2 3 0 3 3 1 3 1 1 530 i1 0 0 0 2 3 0 1 2 0 548 094 1 3 3 1 3 3 2 3 2 545 033 3 3 1 2 2 3 3 1 3
IV-21
TabZe IV-3 NDT Observations by the Penetrant Method LOP Panels-
PENETRANT
INSPECTION SEQUENCE 10 15 2
CRACK ACTUAL NUMBER VALUE
223 1271 1 3 4 0 224 1o245 1 3 j 0 225 1226 1 3 2 0 226 1o218 1 2 3 0 220 121V 0 3 3 0 221 1184 1 3 3 0 S5 117b 3 3 3 0 50 1158 3 3 3 3 129 1o15 2 3 3 -0 127 1124 2 3 3 0 130 1105 0 3 3 -U 49 1100 3 3 3 3 56 1079 3 3 3 0
125 1075 1 3 21 0 51 1075 3 3 3 2 57 1052 3 3 j 0 77 1010 3 1 0 3 78 987 0 1 0 1 85 935 0 3 3 3 79 919 0 2 0 1 80 916 3 3 2 0 81 89U 0 0 v 0 82 850 0 0 0 0 83 825 0 3 3 -0
173 812 3 3 2 -0 84 79U 0 3 3 3
122 788 0 3 3 0 124 a749 1 3 2 0 123 742 3 3 e 0 121 734 0 3 3 1 584 730 0 0 0 0 215 724 2 3 j 2 520 708 2 3 3 0 583 70c 0 3 2 0 581 699 0 3 3 0 119 698 2 3 3 0 582 o690 0 2 3 0 517 0688 0 3 3 0 588 688 0 3 3 0 594 688 0 3 3 0 595 (8D 3 3- 0
IV-22
Table IV-3 (Coneluded)
CK ACT NO VAL 0 15 2 -
216 676 0 3 3 1 586 672 0 3 3 0 580 o672 0 3 3 2 598 670 e 3 3 0 587 e652 0 3 3 0 214 649 0 3 3 0 578 a632 0 3 3 0 585 630 0 3 3 0 579 611 0 3 e 0 576 601 0 u U 0 571 568 0 2 1 0 577 568 0 0 0 0 524 562 3 2 1 0 570 531 0 2 2 2 574 9518 0 3 J 0 519 511 1 3 3 0 575 50b 0 0 0 0 522 494 3 3 2 1 572 488 0 3 3 1 525 483 3 3 3 1 568 482 3 3 3 0 573 454 2 3 3 0 566 440 0 3 3 0 564 435 2 3 3 0 569 430 1 3 3 0 523 419 2 3 3 0 565 391 0 2 3 0 521 362 1 3 1 0 39 345 3 0 0 0 38 341 0 0 0 0
516 338 U 3 J 0 196 288 3 3 3 3 195 280 3 3 3 2 194 277 3 3 3 0 30 268 3 3 3 2 37 263 3 0 pound 0 40 -o258 3 3 3 0 29 231 2 3 2 0 24 194 3 3 1 1
8 133 1 3 1 0
IV-23
with three different operators making their own C-scan recordings
interpreting the results and documenting the inspections The
operator responsible for the original optimization and recording
sequences was eliminated from this repeat evaluation Additional
care was taken to align warped panels to provide the best
possible evaluation
The results of this repeat cycle showed a definite improvement
in the reliability of the ultrasonic method in detecting LOP
flaws The two data files were merged on the following basis
o Data from the repeat evaluation were ordered by actual flaw
dimension
An analysis was performed by counting down from the largest
flaw to the first miss by the ultrasonic method
The original data were truncated to eliminate all flaws
larger than that of the first miss in the repeat data
The remaining data were merged and analyzed according to the
original plan The merged actual data file used for processing
Sequences 1 and 3 ultrasonic data is shown in Table IV-i
Table IV-A lists nondestructive test observations by the ultrashy
sonic method for the merged data as ordered by actual crack length
The combined data base was analyzed and plotted in the same
manner as that described for the integrally stiffened panels
F DATA RESULTS
The results of inspection and data analysis are shown graphically
in Figures IV-7 IV-8 IV-9 and IV-I0 Figure IV-7 plots
NDT observations by the penetrant method for flaws open to the
surface Figure IV-8 plots NDT observations by the ultrasonic the merged data from the originalinspection method and includes
and repeat evaluations for Sequences 1 and 3 Sequence 2 is for
original data only Figures TV-9 and IV-10 are plots of NDT
observations by the eddy current and x-ray methods for the
original data only
The results of these analyses show the influences of both flaw
geometry and tightness and of the weld bead geometry variations
as inspection variables The benefits of etching and proof
loading for improving NDT reliability are not as great as
those observed for flat specimens This is due to the
IV-24
greater inspection process variability imposed by the panel geometries
Eddy current data for the thin (18-in) panels are believed to accurately reflect the expected detection reliabilities The data are shown at the lower end of the plots in Figure IV-9 Eddy current data for the thick (12-in) panels are not accurately represented by this plot due to the limited depth of penetration approximately 0084 inch at 200 kilohertz No screening of the data at the upper end was performed due to uncertainties in describing the flaw length interrogated at the actual penetration depth
Table IV-4 NDT Observations by the Ultrasonic Method Merged Data LOP Panels
ULTRASONIC
INS PE CkON SEQUENCE 1 2 3
CRACK ACTUAL NUMBER VALUE
812 1878 0 -0 0 829 1878 0 -0 0
8e8 1783 0 -0 o 811 1783 0 -U 0
8U9 1498 0 -0 0 826 1496 0 -0 0 825 1487 0 -0 0 808 1487 0 -0 0 806 1412 U -0 0 -823 -41e 0 -u 616 1365 0 -U U 833 1365 0 -U 0 805 1327 0 -0 0 822 1321 0 -0 0 821 1292 0 -0 0 804 1O292 U -0 Ushy223 1271 3 0 0 827 1251 0 -0 0 810 1251 0 -0 0 224 1245 0 0 0
225 226
1226 1218
3 3
3 3
0 0
220 1210 3 3 0
71 1184 2 0 0 221 1184 3 3 0 55 117S 3 3 0
807 1171 0 -0 0 824 1171 0 -0 0 50 115S 3 3 U 129 1158 3 0 -U 61 l1lbb 3 0 U 70 69
1150 1125
2 1
3 3
U 0
127 1124 3 3 0 62 1122 3 3 0
634 1121 0 0 U 130 loOn 1 0 -0 817 834
1104 1104
(1 -U 0 -u
0 o
49 1100 3 3 0
677 1093 1 0 0 56 1079 3 3 0
641 1075 2 1 1 51 1075 3 3 3
IV-26
Table IV-- (Continued)
CK ACT NO VAL 1 2 3
125 1075 3 640 1075 3 1 0 57 1052 3 0
675 1050 d 3 0 639 1041 3 3 0 635 1020 3 -2 0 156 1014 3 0 U 77 1010 0 0 0
65 993 2 1 0 78 987 0 0 0
1b7 986 3 1 0
536 964 3 3 0 Io 0 961 3 0 0 630 945 3 3 0 644 943 0 0
161 943 3 0 0 85 935 0 0 -0 104 929 3 2 0 167 921 3 3 0 79 919 0 0 0 80 91b 1 0 0
820 907 0 -0 0 803 907 0 -0 0 550 900 3 3 0 81 890 0 0 0
560 0889 1 1 0 103 885 3 3 0 166 874 3 U 0 559 v872 3 3 0 563 870 1 0 0 175 o858 3 3 -0 82 850 1 0 0
646 846 3 0 0 174 825 3 3 -0
$3 825 0 0 -0 173 812 3 3 -0 169 809 3 2 0 308 799 0 -0 0 324 799 U -0 0
84 790 u 0 -0 122 788 3 3 0 168 781 2 3 0 323 e773 0 -0 0 307 773 0 -0 0
v1-27
Table IV- (Continued)
CK Acr
NO VAL 1 2 3
309 750 0 -0 U 3e5 750 0 -U 0 124 749 3 0 0 123 742 3 3 0 641 73( 3 3 0
121 734 3 0 0 312 73j U -U 0
328 733 0 -0 U 326 732 U -0 0 310 732 0 -U 0 564 215
730
72+ 3 3
2 3
U 0
197 717 1 3 0
316 712 0 -0 0 332 712 0 -U 0 520 705 3 2 0 313 70b U -0 0 329 706 0 -U 0 583 a706 3 1 U 581 699 3 0 119 698 3 3 0 582 690 3 0 0
594 686 3 3 0 517 688 1 3 0 588 6886 11 0 528 686 3 3 0
595 68e 3 1 0 216 676 3 3 0 622 675 0 U 0 580 672 3 3 0 586 67 3 1 0
628 671 3 1 0 598 e670 3 3 0 621 o665 0 0 0 331 660 0 -0 0 315 660 0 -0 0 627 659 3 1 U 587 214 662
652
649 64b
e 3 3
0 3 3
0 0 3
198 638 0 1 U 314 631 0 -0 0 330 637 U -u 0 518 632 0 0 U 565 a630 3 0 0 327 628 0 -0 0 311 628 0 -0 0 661 621 3 3 3 579 611 0 0 0 5t6 601 1 0 0
20 569 3 3 0
IV-28
Table IV- (Continued)
CK ACT NO VAL 1 2 3
571 568 3 1 0 57 524
568 562
0 2
0 3
0 0
629 0562 3 1 0 17 o542 3 3 0
623 541 0 0 0 302 535 0 -u 0 318 c535 0 -U 0 570 o531 3 3 0 317 529 0 -0 0 301 o529 0 c0 (
54 518 2 1 0 1 o517 3 3 0
501 51b 3 3 0 303 515 0 -0 0 349 o515 u -0 0 304 514 0 -0 0 320 514 0 -0 0 519 o511 3 3 0 575 506 0 0 0
2 s504 3 3 0 19 498 3 3 0
801 498 3 -0 0 818 498 3 -0 0 522 0494 2 3 0 572 a488 0 0 0
525 483 2 2 0 619 483 3 3 1 568 482 3 3 0 620 474 3 0 0 305 461 0 =0 0 321 o461 U -0 0 573 454 1 0 0 566 440 0 0 0 564 435 3 e 0 681 431 3 3 0 569 430 0 3 3 523 419 0 0 0 511 393 3 2 0 565 391 1 0 0 142 o372 3 3 0 509 o369 3 3 0 521 362 3 3 0 35 346 0 0 0 39 345 0 0 0
150 343 3 3 3 38 341 1 0 0
516 o338 0 0 0 44 337 U 0 0 46 336 3 2 0 148 322 3 3 0 143 320 3 3 0
IV-29
Table IV-4 (Concluded)
CK NO
36 45
16 306 322
813 830 655 147 196 653 195 194 30-
186 149 37 151 510 651 40
8U2 819 152 153 814 831 29
542
815 832 656 657 24
654 648 544 529 28
b42 647 543 530 548 545
AcT VAL
31d 309 29 29 294
293
293
289
288
288
285 28U 271 -268 26t 26t
263
262
261
259
258
250
250 0250 243 242 242 9231 214
201
201
196
19b
194
183
177 6173 145 133 132 122 116 0112 094 033
1
U U J 0
o 0 0 3 -3 3 3 0 3 3 3 3-
1 3 u J U 0 U 3 3 U u 3 2
0 0 3 3 13
3 3 3 e 3
-0 1 2 U 1 3
2 3
U 1 0 3 2
-0 0 -O 0
-0 0 -U 0
3 0 J 0 3 3 0 0 -3 0 3 o 1 0 3 u 3 0 0 0 3 0 0 u 3 0
U U -u u -0 0
3 u 3 0
-U 0 -0 0
3 0 3 0
-0 0 - 0 3 0 3 0 3 0 3 0 0 0 3 0 3 0 3 0 -u -U 3 2 3 0 0 0 3 3 3 1
000 100
bull00
00
8 0
70
0
70
- 60 0 60
50 60
0 - 40 - 04
30 0
0 30
20
-10
0 o
II
o 100 160 I
200
I
250
80
0
0
I
0 0
0
00
0
-
60
0
0 -
I
100
0
1oa 00 e50
LENGTH IIN)SPCCIMEN LOp 19 It PEFTRANT TEST 96ONG 10 COIIIOEOCE LEVEL 960
LENGTH (INISPEOI[N L0P 1181 NETRANT TEST SEQ NO15
COWISWCG LEVEL - 950
100 ]00
90 90 0 0
O00 0o 0 - 0
70 70 0 0
60 600
- 60
tO 6050
40
30
20
0
0
0
0
0
0x
0
40
30
20
0 10
0 50 1 00 150 00 a50
LETH
NPETRMATTST WNO2 COIIINCE LEVEL shy 950
cor~e~ELEVE 00COW
Figure IV-7 Flaw Detection Probability for LOP Panels by the Penetrant Method Plotted at 95 Probability and 95 Confidence
0 0 50
I I
100 150
LEN (IN)
SPECIREN L0 P 11811a3KEIRtOT TEST MOQ NO3 3
IOE(cE LEVEL shy 1)50
600 a50
1 0 100 -- n00
000 000 0-0-0 - 0 0 0 0 0
90 90 90 0 0 0
0 0
80 - 180 80 - shy
70 70 70
t 60 000j 0_ 60 0 60 0 0 0 -0shy
00 o-0 0 0 0 M0 o 50 0 0 - o 50 o [ o - 0 0 CP0 0 40 0o o 0
G0 shy 0 30 shy 0
I 3
20 20
0 I I I f I I I1 050 1 OD 150 2 O0 250 I I I I 0 [ 1 1 f 10 50 160 1 50 2 00 250 50 100 150 20D 250
LENGTH (IN I LEWIN (IN) LENGTH FIN SPECIEN L O P 1812 P CININ L O PPl S CI N 0 P 1E0(N2I
100 00o 00 Ooo 0 degdeg0oO0oVooo
90 00
0- 90 90 - 0 -0
0 0 s0 60 shy
70 00 - 70 70 shy
60 - S -S0t 60060 0 60
0 0 50 050 o shy00 50 0L 5 o shy0 50
r t o -00
0 -0 -- 0 400 0 -0 00 0 30 0
- 0
0o 0 30 - -00 300 -0
20 0 - shy 20 0 20
10010 T
0 t F F I Ft I to I
F I I F I I I I
0 050 100 150 200 250 0 050 100 150 200 n0 0 050 100 150 200 20
SPECI L0 P 118+lt2 DEPTH (IN)LLTRASONIC TST O No EPTH (IN IS C2fN LOP 102CLL-AOIC LVEL 50 SIrCNN LOP 1312ULTRASONICTEST MO NO aWC(c EEL050WI[EO4CE VLTRASOI4C TEST MEO NO 3LEVEL 950 COIIC~fCE LEVL 060
Figure V-8 Flaw Detection Probability for LOP Panels by the Ultrasonic Method PlOtted at 95
Probability and 95 Confidence
I 0 00 I 00
S90 O90
00 80 0
70 70 70
o~S o g so50 0 50 0 0 00 500
0
0 0 0 0
0 00 0 40
0 00 0 000 -- 000
o- 0 0 30 0 -0 1
0 0
tO 10
I I I -I 0 I I I I I I I0 50 100 200 o 5010 060 1 00 i 5o 2 0o 2 5o 0 50 MT 150 200 260
LENGTH IN LENH IN ISPICIMEN LOp I0112 LEOJOTHt INSPCINEN L 0 P 1184112 SPECIMEN LO P 1O8+1I
00 - I 0I 0o
00 60 0
0 70 70 70
6o 60 0 0 5060 50 01--00
0
50 0 0 -0-O40 0
0 0 0 00S
40 0 0 O -0 -0 - 02AD00 0 80 0I 000 0shy
0 shy20 - - 0- shy 20 - - 0 0 00 D- 2- - 0
0I Co - - 10110 shy 10 - shy 00
0 0 00 100 150 200 2500t 0 a050 000 160 200 MIT 0 060 100 ISO z00 200
DEPTH (INSPECIMEN LOP 11012 DEPTH (IN CpO IINlP I HEOY CURRENT TEST SEE NO I L 0 P 1OP 182COOSLOENE LEVEL - 950 EDDY CULREPNTTEST SE W 2 ECOSYCURENT TEST E0 NO ICWIDENEE LEVEE- 060 W20NnCE LEVEL- 95 0
Figure IV-9 Flaw Detection Probability for LOP Panels by the Eddy Current Method Plottd
at 95 Probability and 95 Confidence
I00
0S
80
70
0
50
0
0
000
0
0000 a 000
0 0
290
0
100
80
00
0
0 00
0 00
060
0shy
0
100
90
0
0 O0 O0 0 0 0
0
0 0
000
0-0
0
20cent 0
2002 so 50
30
0
30
0 0I I
301
0 0
20 20
0
10
o50
1 0o
-Zo
t I I 1 I
100 150
LENGTH (IN) SPE CIMEN LOP Iefta
2 0D 250
0
404
110
It
100
-00 0 100 150
IENTH I[N SPECIMlENLOP I0112
20
Io
250 4
0
0
IooD ---shy
0 50 I 0 150
LEWNGT IIN SPdegECIMENLOp 11011e
200 250
O0 0 0 D 0
5 50
40 0
00
-090 so- 40
0 s0 30
20 20
010 0
0
0 0
0-0 100 150 20 250 0 0D
DEPTH (IN)SoCIICN 10 P 0-I2 X-RAYTEST SC WO I COuIECE LEVEL -95 0
Figure IV-10 Flaw Detection Probability for LOP Panels by the X-Radiographic Method Plotted at 95Probabhllty and 95 Confidence
100 150
DEPTHI finSPECIMEN-0 P 181t2 X-RAYTEST SEENO 2 CONFIDECELEVELshy950
200 250 0
0 050 IO0 0S0
DEPTH (IN I SPECIMENLo P 110112 X-RAYTESTSE0 NO3 CONIECE LEVELshy950
200 250
V FATIGUE-CRACKED WELD PANEL EVALUATION
Welding is a common method for joining parts in pressure vessels
and other critical structural hardware Weld cracking in
structures during production test or service is a concern in
design and service reliability analyses Such cracking may be
due to a variety of conditions and prevention of cracking is
a primary responsibility and goal of the welding engineer
When such cracks occur their detection early in the hardware
life cycle is desirable and detection is the responsibility
and goal of the nondestructive test engineer
One difficulty in systematic study of weld crack detection has
been in the controlled fabrication of samples When known
crack-producing parameters are vaired the result is usually a
gross cracking condition that does not represent the normal
production variance Controlled fatigue cracks may be grown
in welds and may be used to simulate weld crack conditions for
service-generated cracks Fatigue cracks will approximate weld
process-generated cracks without the high heat and compressive
stress conditions that change the character of some weld flaws Fatigue cracks in welds were selected for evaluation of NDT methods
A program plan for preparation evaluation and analysis of
fatigue cracked weld panels was established and is shown
schematically in Figure V-1
A SPECIMEN PREPARATION
Weld panel blanks were produced in two different configurations
in 0317-centimeter (0125-in) and 127-centimeter (0500 in)
nominal thicknesses The panel material was 2219-T87 aluminum
alloy with a fusion pass and a single 2319 aluminum alloy filler
pass weld located in the center of each panel Five panels
of each thickness were chemically milled to produce a land area
one inch from each side of the weld and to reduce the thickness
of the milled area to one-half that in the land area The
specimen configuration is shown in Figure V-2
Starter notches were introduced by electrodischarge machining
(EDM) using shaped electrodes to control the final flaw shape
Cracks were then extended in fatigue and the surface crack
length visually monitored and controlled to the required final
flaw size and configuration requirements as shown schematically
in Figure V-3 The flaws were oriented parallel to the weld bead
V-1
NDT EVALUATION
X-radiography Dimensional Ultrasonic eDimensional Surface Finish Eddy Current Surface Finish
Measurement amp Penetrant Chemical Measurement amp
Preparation Documentation Penetrant Remoyal Etch pDocumentation
NDT EVALUATION
X-radiography Ultrasonic Eddy Current Proof Test Penetrant 90 of Yield Penetrant Removal Strength
NDT EVALUATION
X-radiography Ultrasonic e Fracture Specimens Eddy Current Penetrant Measure amp Data
Document Flaw Sizes TabulationPenetrant Removal
Figure V-1 NDT Evaluation Sequence for Fatigue-CrackedWelded Panels
-Flaw Location
6 in
40 in P4T H
_ _ _ _ 18 in Flaw Location-7 - Longitudinal Weld Panel T
12 Th40 in]
Figure V-2 Fatigue-Cracked Weld Panels
V-3
0250 0500 100
0114 0417 0920
01025
CASE 4 CASE 5 CASE 6
0110125 030
Note All dimensions
in inches
Figure V-3 Schematic Side View of the Starter Flaw and FinaZ Flaw Configurashytion for Fatigue-Cracked Weld Panels
v-4
in transverse weld panels and perpendicular to the weld bead in
longitudinal weld panels Flaws were randomly distributed in
the weld bead centerline and in the heat-affected zone (HAZ) of
both transverse and longitudinal weld panels
Initial attempts to grow flaws without shaving (scarfing) the
weld bead flush were unsuccessful In the unscarfed welds flaws
would not grow in the cast weld bead material and several panels - were failed in fatigue before it was decided to shave the welds In the shaved weld panels four of the six flaw configurations were produced in 3-point band fatigue loading using a maximum
bending stress of 14 x 10 Nm2 (20 ksi) Two of the flaw configurations were produced by axially loading the panels to obtain the desired flaw growth The flaw growth parameters and flaw distribution in the panels are shown in Table V-1
Following growth of the flaws panels were machined using a
shell cutter to remove the starter flaws The flush weld panel configurations were produced by uniformly machining the surface of the panel to the as machined flush configuration This
group of panels was designated as fatigue-crack flawed flush welds- Panels with the weld crown intact were produced by
masking the flawed weld area and chemically milling the panel
areas adjacent to the welds to remove approximately 0076 centimeters (0030 in) of material The maskant was then removed and the weld area hand-ground to produce a simulated weld bead configuration This group of panels was designated the fatigue-crack flawed welds with crowns 117 fatigue cracked weld panels were produced containing 293 fatigue cracks
Panels were cleaned and submitted for inspection
B NDT OPTIMIZATION
Following preparation of the fatigue-crack flawed weld specimens
an NDT optimization and calibration program was initiated Panels containing the smallest flaw size in each thickness
group and configuration were selected for evaluation and comparison of NDT techniques
1 X-radiography
X-radiographic exposure techniques established for the LOP
panels were verified for sensitivity on the fatigue crack flawed weld panels The techniques revealed some of the cracks and
v-5
ltTable V-i Parameters for Fatigue-Crack Growth in Welded Panels
CASE
STARTER DEPTH
DIM WIDTH
FINAL FLAW WIDTH
TYPE OF LOADING
STRESS KSI
STRESS CYCLES AVG)
PANELS FLAWS
4 025 114 250 Axial 24 190000 Transverse 45000 Longitudinal
5 025 417 500 3-Point 24 i00000 Transverse 60 13000 Longitudinal 12 inch
Panels 157
6 025 920 1000 3-Point 22 100000 Transverse 11000 Longitudinal
7 015 025 060 Axial 24 169000 Transverse 75000 Longitudinal
8
9
015
015
055
268
125
300
3-Point
3-Point
22
256
180000 Transverse 13000 Longitudinal b57
18 inch 60000 Transverse Panels 7000 Longitudinal
136
failed to reveal others Failure of the techniques were attributshy
ed to the flaw tightness and further evaluation was not pursued The same procedures used for evaluation of the LOP panels were
selected for all weld panel evaluation Details of this prodedure
are included in Appendix D
2 Penetrant Evaluation
The penetrant inspection procedure used for evaluation of
integrally stiffened panels and LOP panels was applied to the
Fatigue-cracked weld panels This procedure is shown in Appendix A
3 Ultrasonic Evaluation
Single- and double-transducer evaluation techniques at 5 10 and 15 megahertz were evaluated as a function of incident angle flaw signal response and the signal-to-noise ratio generated
on the C-scan recording outputs Each flaw orientation panel
configuration and thickness required a different technique for
evaluation The procedures selected and used for evaluation of
weld panels with crowns is shown in Appendix H The procedure selected and used for evaluation of flush weld panels is shown
in Appendix I
4 Eddy Current Evaluation
Each flaw orientation panel configuration and thickness also
required a different technique for eddy current evaluation The procedures selected and used for evaluation of weld panels with crowns is shown in Appendix J The spring-loaded probe
holder used for scanning these panels is shown in Figure IV-4
The procedure selected and used for evaluation of flush weld panels is shown in Appendix K The spring-loaded probe holder used for scanning these panels is shown in Figure IV-5
C TEST SPECIMEN EVALUATION
Test specimens were evaluated by optimized penetrant ultrasonic
eddy current and x-radiographic inspection procedures in three
separate inspection sequences After familiarization with the specific procedures to be used the 117 specimens were evaluated
by three different operators for each inspection sequence
V-7
Inspection records were analyzed and recorded by each operator
without a knowledge of the total number of cracks present or of the previous inspection results
1 Sequence 1 - Inspection of As-Machined Weld Specimens
The Sequence 1 inspection included penetrant ultrasonic eddy
current and x-radiographic inspection procedures
Penetrant inspection of specimens in the as-machined condition
was performed independently by three different operators who
completed the entire penetrant inspection process and reported their own results One set of C-scan ultrasonic and eddy current
recordings were made Tire recordings were then evaluated and
the results recorded independently by three different operators
One set of x-radiographs was made The radiographs were then
evaluated independently by three different operators Each
operator interpreted the x-radiographic image and reported his
own results
Inspections were carried out using the optimized methods establshy
ished and documented in Appendices A D H T J and K
2 Sequence 2 - Inspection after Etching
On completion of the first inspection sequence the surface of
all panels was-given a light metallurgical (Flicks etchant)
solution to remove the residual flowed material from the flaw
area produced by the machining operations Panels were then
reinspected by the optimized NDT procedures
Penetrant inspection was performed independently by three
different operators who completed the entire penetrant inspection
process and reported their own results
One set of C-scan ultrasonic and eddy current recordings were
made The recording were then evaluated and the results recorded
independently by three different operators One set of x-radioshy
graphs was made The radiographs were then evaluated by three
different operators Each operator interpreted the x-radiographic
image and reported his own results
Inspections were carried out using the optimized methods
established and documented in Appendices A D H I J and K
V-8
3 Sequence 3 - Postproof-Load Inspection
Following completion of Sequence3 the weld panels were proofshyloaded to approximately 90 of the yield strength for the weld This loading cycle was performed to simulate a proof-load cycle on functional hardware and to evaluate its benefit to flaw detection by NDT methods Panels were cleaned and inspected by the optimized NDT methods
Penetrant inspection was performed independently by three different operators who completed the entire penetrant inspection procedure and reported his own results One set of C-scan ultrasonic and eddy current recording were made The recordings were then evaluated independently by three different operators One set of x-radiographs was made This set was evaluated independently by three different operators Each operator interpreted the information on the x-ray film and reported his own results
Inspections and readout werd carried out using the optimized methods establishedand documented in Appendices A D H I J and K The locations and relative magnitude of the NDT indications were recorded by each operator and were coded for data processing
D PANEL FRACTURE
Following the final inspection in the postproof-loaded configurations the panels were fractured and the actual flaw sizes measured Flaw sizes and locations were measured with the aid of a traveling microscope and the results were recorded in the actual data file
E DATA ANALYSIS
1 Data Tabulation and Ordering
Actual fatigue crack flaw data for the weld panels were coded keypunched and input to a computer for data tabulation data ordering and data analysis operations Data were segregated by panel type and flaw orientation Table V-2 lists actual flaw data for panels containing fatigue cracks in longitudinal welds with crowns Table V-3 lists actual flaw data for panels containing fatigue cracks in transverse welds with crowns
V-9
Table V-2 Actual Crack Data Fatigue-Cracked Longitudinal Welded Panels with Crowns
PANEL CRACK CRACK CRACK INITIAL FINAL CRACK POSITION NO NO LENGTH DEPTH FINISH THICKNESS FINISH THICKNESS X Y
15 28 305 051 33 1240 50 1000 423 05 16 29 308 040 32 1220 42 0980 194 05 16 16 17
30 31 32
239 Z269 070
022
029
035
32 32 39
1220
1220
1240
42 42 56
0980
0980
11000
325 458 270
05
05
01 17 18
33 34
110
094 040 019
39 36
1240
1220 56 58
1000
0980 404 230
01
01 18 19P 19P 20 20
35 3b 37 38 39
100
050
050
099
107
019
010
010
026
032 -
36 49 49 37 37
1220
1220
1220
1220
12a0
58 64 64 54 54
0980
0970
0970
0980
0980
-404 180 348 173 304
01
01
01
05
05 20 40 095 025 37 1220 54 0980 432 05 21P 21 22 22 22 23 23 24
41 42 43 44 45 46 47 48
051
021
324
257
291
047
120
095
010
007
034
038
045
007
020
018
32 32 32 32 32 50 50 50
1230
1230
1240
1240 - 1240 1230 1230 1230
40 40 60 60 60-46 46 38
0980
0980
0990
0990
0990
0990
0990 0990
182 240 169 299 434 153 453 147
09
09
01
01
01
05
05
05 24 49 117 026 50 1230 38 0990 455 05 25P 25
50 51
050
040 010 020
54 54
1200 1200
44 44
0970
0970 240 361
09
09 26 26
52 53
079 072
026
026 48 48
1210
1210 30 30
0910
0910 209 390
05
05 27 27 28 28 28
54 55 5b 57 58
283
270
090
120
102
039
035
018
027
017
43 43 39 39 39
1220
1220
1240
1240
1240
44 44 38 38 38
0980
0980
1000
1000
1000
257 399 146 281 425
01
01
05
05
05 29 29 40
59 60 80
231
287
510
018
039
116
38 38 27
1220
1220
4670
38 38 28
0970
0970
4700
333 443 435
05
05
05 41 41
81 82
165
369 054 178
40 40
4710
4710 30 30
4710
4710 142 294
05
05 41 42 43 44
83 84 85 86
110
540
530
503
017
133 M155
154
40 -64 51 45
4710
4680
4680
4700
30 24 60 48
4710
4700 4710 4700
427 355 402 226
05
05 09 01
45 87 480 093 43 4710 55 4720 298 05 46 47
88 89
506 1188
124
215 58 57
4680
4700 70 54
4720
4710 430 288
05 05
48 49 50
90 91 92
984
512
494
131
153
103
54 53 47
4700
4710
4680
42 38 48
4720
4710
4700
383 413 249
05
01
05 51 93 995 173 47 4710 45 4720 172 09 52 94 981 108 57 4610 60 4640 300 05 53
215 95 105
498
112 103 023
61 15
4700
1010 58 20
4700 0990
309 141
09 05
215 218 716 713
1
106 107 112 113 201
049
284
990
493
560
007
032
160
116
045
15 45 22 46 -0
1010
1000
4480
4500
20 28 25 30 0
0990 0980 e4580 4530
323 195 178 392 217
05
05 09 09
-0 1 202 157 023 -0 -0 320 -0
v-lo
Table V-2 (Concluded)
2 03 043 009 -0 -0 2 09 -1 2 204 104 023 -0 -0 355 - 2 205 072 015 -0 -0 444 -03 206 622 034 -0 -0 208 -0 3 207 1696 084 -0 -0 361 -0 4 208 129 029 -0 -0 151 -0 4 209 139 036 -0 -0 268 -0 4 210 249 055 -0 -0 364 -0 1 214 560 045 -0 -0 217 -0 1 215 157 023 -0 -0 320 -0 2 216 043 009 -0 -0 209 -02 217 104 023 -0 -0 355 -0 2 218 072 015 -0 -0 444 0 3 219 622 034 -0 -0 208 -0 3 220 1692 084 -0 -0 361 01 4 221 129 029 -0 -0 151 -0 4 222 139 036 -0 -0 2i68 -0 4 223 249 055 -0 -0 364 -06 252 368 076 -O - 310 -0 6 253 276 074 -0 -0 433 -0 7 254 181 048 -0 -0 168 -0 7 255 417 117 -0 -0 296 -07 256 273 059 -0 -0 442 -0
11 260 160 033 -0 -0 133 -0 11 261 270 065 -0 -0 302 -0 ill 262 305 087 -0 -0 A 438 -0 6 264 368 076 -0 -0 310 -06 265 267 074 0 -0 433 -0 7 266 181 048 -0 -0 168 -0 7 267 417 117 -0 -0 296 -0 7 268 273 4059 -0 -0 442 --0
11 272 160 033 -0 -0 133 -0 11 273 270 065 -0 -0 302 -0 11 274 305 087 -0 -0 438 -0
v-I
Table V-3 Actual Crack Data Fatigue-Cracked Transverse Welded Panels with Crowns
PANEL COACK CIACK CACK TNTTTkL FINAL CRACK POSITION
NO Vo LNGTH DEPTH FINISP THICKNFSS FINISH THICKNFSS X Y
I I 047 o015 48 122G 60 0960 09 617
1 2 067 PI9 43 12P 60 0960 09 773
2 3 067 017 44 1220 60 0983 C5 636
2 4 035 i3 44 1220 60 0980 05 665
3 3
5 100 103
C21 024
59 59
123C
1230 58 F8
0990 0990
05
05 433 840
4 7 039 310 39 i27C 50 1000 05 620
4 a 163 517 39 123 50 1000 05 700
5 3 1plusmn1 23 67 1220 62 0980 05 756
6 6
10 I
014 128
q38 021
51 51
1220
1220 54 54
0990
0940 01 0
483 786
7 12 292 145 53 1220 658 09 05 531
8 13 286 039 43 1230 62 0970 05 403
6 14 295 039 43 1230 6 0970 05 620 15 282 03 43 123C E2 0970 05 822
9 9
1 17
966
067 [13 C20
44 44
1220
1220 56 56
0990
0990 09 09
503 629
9 10
18 is
057
172 [13 022
44 55
1220
1230 56 46
3990
0980 09 05
757 465
10 11 11
20 21 22
306
2R3
273
04R C043
C41
55 43 43
1230
123C
1230
46 46 46
0960
0990
0990
05
05
05
760 509 856
12 23 279 01 2 122n 43 1o00 09 806
13 24 065 029 39 1220 52 0980 05 512
13 13 14 30 31 32 32
25 2E 27 61 62 63 64
061
657 101
1032 493 234 397
04
030
13
151 083 057 147
33 39
44 63 33 52 52
M1220 1220 1242 463i 467C 46F0 46Ef
52 52 46 50 26 34 34
1950
0938
0990 4680 4633 4660 4660
C5
05
09
u5
09
05
05
658 804 670 612 498 694 831
33 65 1435 35 61 471n 33 4700 05 50
34 66 49B 122 53 4730 26 4660 05 490
35 67 976 136 53 4690 42 4760 05 654
35 36 36
6B 69 70
941
478
478
109
107 -I16
53 64 64
4690
4690
4690
42 43 48
4760
4710
4710
05
O5
05
1071 420 894
36 37
71 72
471 35
130 147
64 51
4690
4680 48 46
4710
4700 05 09
1371 507
37 73 992 129 51 4680 46 4700 01 1113
38 38
74 75
930 1085
13 169
66 66
462C
4620 60 6C
4680
4680 05 05
458 845
38 76 1376 174 66 4620 60 4680 05 1259
39 39
77 78
519
493 091 n94
56 56
4680 460
55 55
4670
4670 01 01
440 906
39 79 482 085 56 4680 55 4670 09 1384
54 54 54
96 97 98
11
123
112
018
036 01a
43 40 40
422C
422C
4220
46 46 46
0980
0930
0930
01
01
09
461 686 911
55 55 55
113 113
93 100 101 132 103
260
126
148
229
274
045
24 G029 345 035
35 35 35 46 46
4250
425
425C
100
100
36 36 36 22 22
1010
Ii0 1010 098 0983
05 05 35 09 09
438 638 942 532 717
113 505
104 109
288
513 041 122
46 19
100
465 22 30
0990
4E70 Gg9
05 973 958
506 506
8
110 111 257
485
454
233
093
087
066
22 2 -13
4300
4300 24 24 -0
4500
4500 09 01
-0
418 927 C50
8 258 065 015 -1 - - 890 8 259 152 040 -0 4 -O -3 1160
8 269 233 066 -0 -0 -0 650 3 270 065 015 -0 -0 -0 890
9 271 152 040 -0 -0 -0 1160
ORIINALPAV IS
v-12 -t3r--plusmn U11QU7Uzfy
Table V-4 Actual Crack Data Fatigue-Cracked Flush Longitudinal Welded Panels with Crowns
PANEL NO
CRACK NO
CRACK LENGTH
CRACK DEPTH
INITIAL FINISH THICKNESS
FINAL FINISH THICKNESS
CRACK POSITION X v
8 8
501 562
07a
U45 00 o9
30 3u
1080 i08j
20 20
1083
1086 152 258
05
U5 8 8
503 504
63
U88 14 025
30 30
iplusmno86 1080
20 20
1j80 1080
368 437
05
05 10 U0 11 i1 11 11 12 12 12
505 506 57 5a8 509 Siu 511 512 513
083
37 V543
u 7 2
085
073
396
337
347
017
o09 021 a15 Li13
21
058
058
056
15 15 35 35 35 35 lo 10 16
040 i04t 109u 19 1090 1090 j8G 108L 1080
20 20 28 28 28 28 3U 30 30
1j90 1091 1120 1120 1123 112o 093i 093J 593G
219 448 238 316 383 414 169 245 352
65
J5 c01
69
01
09 05 05 5
1 15 15
514 515 516
324
089
a93
n43
024
020
10 13 13
iJ~B 1080 1083
3a 36 36
093i
110
1Lia
433 289 374
U5 5 05
15 plusmn8 18
517 518 519
075 123 G664
015
030
aW14
13 14
1080
107
107C
36 20 20
100
1100
10
438 195 254
05
59 9
18 18 19
520 521 522
j60
068
353
U16
013
058
L4 14 18
li70t 107o
1080
20 2a 30
110
1160
1120
331 397 153
aol 05 05
19 19 24 24 27
523 524 525 526 527
323
56
073
150
212
044
012
014
045
039
18 18 11 11 34
1080 1U8U 1o00 ldO6 1080
30 30 25 25 28
1124
112
1040
1040
1050
316 485 303 449 16
5S 05 i5 65 09
27 27 27
528 529 530
343
271
283
058
46
051
34 34 34
108o plusmn08W 1ae
28 28 28
150
1050
1050
228 303 406
c51 09 9
950 954 950 950
531 532 533 534
348
343
378
337
053
C65
t53 B06C
12 12 12 12
0930
0934
0930 U93U
36 36 36 36
1000 100d 10o loo
215 295 253 345
01
41
U9
o9 951 951
535 536
157
339 021 049
21 21
11plusmn0
1plusmn10 26 26
1000
10Ga 128 262
s5 US
951 30 30 30 30 34 34 34 34 35
537 538 539 540 541 542 543 544 545 546-
300
228
194
191
193 5C6
708
630
5u2
425
42
084
086
070
71
138
199
179
151 W3
21 21 21 21 21 16 16 16 16 23
1110
435i
435o
4353
435Q
44J0
4400
4466
4406
4450
26 20 20 20 29 18 18 18 plusmn8 28
1060
4350
435Q
4350
4350
4400
4400
4400
4400
440Z
363 129 211 362 480 135 238 376 473 93
05
01
09
29
l
69
01 L1
9
0
v-13
Table V-4 (Concluded)
35 35 35
36 36 36 37 37 37 37 38 38 39 39 39 39 41 41 41 41 42 42 42 42 43 43 43 43 44 44 44 44 45 45 45 45 47 47 47 48 48 48 49 49 49 49 50 50 50 so 51 51
547 548 549
551 551 552 553 554 555 556 557 558 559 563 561 562 563 564 565 566 567 568 569 570 571 572 573 574 575 576 577 578 579 583 581 582 583 58 585 586 587 588 589 590 591 592 593 594 595 596 597 598
598
513
446
1009 1176 1562 542 606 447 526
1037 1224 744 937
1098 793 13U 221 224 12j 280 274 319 280 217 251 161 106 210 196 264 136 149 149 148 127 760
11plusmn9 770 895 1289-1110 091 379 392 10 428 479 678 417 1061 1088
13d
103
071
193
215
276
153
178
115
162
161
213
119
187
239 106 U30 071 66 33 113 164 079 097 067 086 043 08 065 057 095 037 040 035 031 029 120 227 120 143 229 214 021 170 182 amp21 Q70 U95 178 079 195 207
23 23 23
14 14 14 14 14 14 14 L8 18 21 21 21 21 14 14 14 L4 26 20 20 20 2 2 2U 20 13 13 13 13 21 21 21 21 15 15 15 15 15 15 22 22 22 22 14 14 14 14 21 21
4450
4450
4450
4450
4450
4450
4430
443i
4430
4430
4436
4430
4430
4430
443C
4430
4370
4370
4370
437u
4460
4460
4460
4460
4 4 8 1
4480
48C
4480
4460
446Z
4460
4460
445j
4450
4450
4450
4460
446
446u
446C
4460
4466
447C
4470
447D
4470
4450
445b
445a
4450
447C
447i
28 28 28
24 24 24 20 20 2 20 18 18 3 30 30 30 i5 i5 15 i5 18 18 18 18 24 24 24 24 28 28 28 28 26 26 26 26 16 16 16 20 20 20 18 18 18 18 25 25 25 25 30 30
4400
4400
4415C
442o
4420
4424
4420
4420
4420
4420
4440
444i
4410
4410
4410
441C
439V
4390
439i
4390
445Q
4450
4450
4+5e
4460
4466
4460
4460
4450
4450
4450
4456
445a
445amp
445r
4450
4450
4 45 L
4450
4450
4450
4450
4470
4471
4470
4470
443a
4430
4430
4430
445e
4450
22b 348 483
116 290 458 192 192 297 300 179 49 190 196 428 440 107 252 372 487 13 204 343 463 128 286 423 513 161 27 386 491 205 304 417 494 183 233 391 138 287 443 225 225 373 375 118 143 367 48f 177 413
65
05
Q5
05
05
05
uI
09
01
09
05
05
1i
09 01 09 05 05 L5 5 j5 05 05 65 05 C5 k5 05 05 05 05 05 69 01 01 09 9 1 -9 05 05 05 0plusmn 09 09 31 05 05 05 05 5 05
52 52 53 53 53 53
500 500 50 510
9 9
599 600 6051 602 603 604 605 606 6W 608
701 702
879 1043 479 565 616 433 139 229 218 190
089 9-0218108
154
215
109
137
155
083
036
08a
059
055
04shy
330
45 45 30 30 3a 30 22 22 22 22
o -
4450
4450 450O 450u 4500 4500 438C 438U 4 3 8u 438o
40 40 22 22 22 22 32 32 32 32
-0
4430
443a
45a0
45JO
4504
4500
4400
44LO
4400
4400
184 393 109 222 342 481 121 229 314 462
218422
05
05
05
05
05
05
65
45 L5
05
G
10 703 073 015 -G -o0 194 -0 plusmn0 9
704 705
113
089 031 o14
-0 -a
4 -0 -0
399 218
-0 -0
9 706 108 036 -4 -0 422 -0 10 7a7 073 015 -g -0 194 0 t0 708 113 031 -0 -0 4 399 -0
V-14
Table V-5 Actual Crack Data Fatigue-Cracked Flush Transverse Welded Panels
PANEL CRACK CRACK CRACK INITIAL FINAL CRACK POSITIONNO NO LENGTH DEPTH FINISH THICKNESS FINISH THICKNESS X Y
960 609 138 059 20 432C 26 4430 05 694960 610 178 066 20 4320 26 4436 05 792960 611 2Z4 -069 20 432C 26 4430 05 924960 612 3C8 124 20 4320 26 443 G 05 1G30960 613 224 679 20 432U 26 443Z 05 1115960 614 235 089 20 420 26 4430 05 1210961 615 178 054 16 4410 I8 4420 05 583961 616 495 215 16 441G 18 4420 05 701961 617 195 07B 16 4416 18 4420 05 83961 618 182 f67 16 441L 18 4420 05 958961 619 235 099 16 4410 18 4424 05 11o5961 620 297 071 16 4410 18 4420 05 1236962 621 2E7 115 15 456C 20 453a 05 686962 622 225 1plusmn0 15 4560 20 4530 05 758962 623 239 1L3 15 4560 20 4530 -05 871962 624 158 050 15 4560 20 4530 05 994962 625 186 063 15 4560 20 4533 35 1069962 626 160 049 15 4560 20 4530 05 1206
Table V-4 lists actual flaw data for fatigue cracks in flush
longitudinal weld panels Table V-5 lists actual flaw data for fatigue crack in flush transverse weld panels
NDT observations were also segregated by panel type and flaw orientation and were tabulated by NDT success for each inspection
sequence according to the ordered flaw size A 0 in the data tabulations indicates that there were no misses (failure to d~tect) by any of the three NDT observers A 3 indicates that
the flaw was missed by all observers A -0 indicates that no NDT observations were made for that sequence Table V-6 lists NDT observations as ordered by actual flaw length for panels
containing fatigue cracks in longitudinal welds with crowns Table V-7 lists NDT observations as ordered by actual flaw length for panels containing fatigue crack in transverse welds with crowns Table V-8 lists NDT observations as ordered by actual flaw length for fatigue cracks in flush longitudinal weld panels Table V-9 lists NDT observations as ordered by actual
flaw length for fatigue cracks in flush transverse weld panels
Actual flaw data were used as a basis for all subsequent ordering
calculations analysis and data plotting Flaws were initially ordered by decreasing flaw length depth and area The data were then stored for use in statistical analysis sequences
2 Data Analysis and Presentation
The same statistical analysis plotting methods and calculations of one-sided confidence limits described for use on the integrally stiffened panel data were used in analysis of the fatigue flaw detection reliability data
3 Ultrasonic Data Analysis
Initial analysis of the ultrasonic testing data revealed a disshycrepancy in the data Failure to maintain-the detection level between sequences and to detect large flaws was attributed to a
combination of panel warpage and human factors in the inspections To verify this discrepancy and to provide a measure of the true
values 11 additional fatigue flawed weld panels containing 27
flaws were selected and subjected to the same Sequence 1 andSequence 3 inspection cycles as the completed panels An additional optimizashy
tion circle performed resulted in changes in the NDT procedures for the
weld panels These changes are shown as Amendments A and B to the
Appendix procedure The inspection sequence was repeated twice (double inspection in two runs) with three different operators making their shy
V-16
Table V-6 NDT Observations Fatigue-CrackedLongitudinal Welded
Panels with Crowns
PENETRANT ULTRASONIC EDDY CURRENT X-RAY
INSPECTION SEQUENCE 1 -2 3 1 2 3 1 2 31 2 3
CRACK A NUMBER VALUE
207 1696 -o -o -o 0 -0 0 -o -0 -0 -o -o -o 220 1692 -o -o -o o -o 0 -o -o o -o -0 -o 89 1188 1 0 0 2 0 0 2 0 3 1 0 0 93 995 0 0 0 1 1 0 2 1 3 0 0 0
112 990 1 2 0 0 0 3 0 3 3 1 1 0 90 984 0 0 0 3 3 1 1 3 3 3 3 0 94 981 0 0 0 2 2 0 -1 1 0 3 3 0
219 622 -0 -0 -0 0 -0 0 -0 -0 -0 -0 -0 -0 206 6221-0 -0 -00 -0 0 -0 -0-0 -0 -0 -0 201 560 -0 -0 -0 0 -0 0 -0 -0 -0 -0 -0 -0 214
84 560 540
-0 2
-0 1
-0 2
0-0 2 0
0 0
-0 1
-0-o 0 0
-0-0 2 3
-0 3
85 |530 1 1 0 3 3 0 2 1 3 3 3 0 91 80
512
510 0 1
0 2
0 0
2 2
2 2
0 0
2 1
3 3
3 1
3 3
3 3
0 3
88 506 1 0 u 3 3 3 1 0 2 3 3 0 86 503 0 2 0 2 3 3 3 3 3 1 0 0 95 498 0 0 0 0 0 0 2 3 0 0 0 0 92 494 1 1 0 3 -3 3 0 0 0 3 2 3
113 87
493 480
0 03
0 0
0 0
0 0
0 0
0 0
3 0
3 0
3 0
0 3
3 1
3 0
255 267
417 417
-0 -0 o0-0-
-0 0 -0 0-0
0 0
-0 -0
-0 -0
-0 -0
-0 -
-0 0
-0 -0
82 369 0 0 0 0 1 0 0 0 0 i 0 264 368 -0 -0 -0 0 -0 0 -0 -o -o0 -0 -0 -0 252 43
368
324 -0
2 -0
2 -0
0 0 3
-0 0
0 1
-o 3
-o 3
-0 3
-0 1
-O 0
-o 1
29 J28
308
305 1 2
1 1
0 0
3 3
0 3
0 2
2 3
0 3
0 3 3
1 2
0 1
262 305 -0 -0 -0 0 -0 0 -0 -0 -0 -0 -0 -0 274 305 -0 -0 -0 0 -0 0 -0 -0 -0 -0 -0-0 45 60
291 I287
2 1
1 1
0 0
3 0
0 0
0 0
3 0
3 0
3 3
3 3
0 3
0 3
107 284 1 1 0 0 0 0 0 0 0 2 2 0 54
253 283 0 276 -0
1 -0
U -0
3 0
2 o
3 1 -0
3 -0 -0
3 -0
3 2 -0 -0
268 273 -0 -0 -0 3 -0 0 -0 -0 -0 shy 0 -0 -0 256 2731-0 -0 -0 3 -0 0 -0 -0 -0 -0 -0 -0 261 270 -0 -0 -0 0 -0 0 -0-0 -0 -0 -0 -0 273 270 -0 -0 -0 0 -0 0 -0 -0 -0 -o0-0 -0 55 270 0 1 0 2 2 3 2 3 3 3 3 3 31
265 269 267
2 -0
1 -0
0 -0
3 0
3 -0
0 0
1 -0
3 -0o
3 - 0
2 -0
1 -0
0 -0
44 _257 2 2 0 3 0 0 3 3 3 a 0 o
V-17
Table V-6 (Concluded)
CK ACT NO VAL 1 2 3 1 -2 1 2 3 1 2 3
210 223
249
249 -0 -0
0 -0
-0 -0
0 0
-0 -0
0 0
-0 -0
-0 -0
-0 -0
-0 -0
-( -0 -0 -0
30 239 3 0 0 2 0 0 2 3 3 2 2 0
59 254
231
181 1
-0 2
-0 3 -0
1 1
0 -0
0 0
2 -0
3 -0
3 -0
3 -0
3--0
0 -0
266 181 -0 -U -U 1 -0 0 -0 -00 - -0 0 -0 81 165 0 0 0 0 0 0 2 0 0 2 3 3
260 160 -0 -0 -0 0 0 0 -0 -0 -0 -0 -0 70
272 160 -0 -0 -0 0 -0 0 -0 -0 -0 -0 -0 -0 215 157 -0 -0 -0 0 -0 0 -0 -0 -0 -0 -0 -0
202 157 -0 -0 -0 0 -0 -a -0 -0 -0 -0 -0-0
222 209 208-L21 47
139 139 e129 129 120
-0 -0 -0 -0 0
-0 -0 -0 -0 -0 -0 -0 -0 1 0
0 0 0 0 3
-0 -0 0 -0 3
0 0 0 0 3
-0 -0 -0 -0 1
-0 -0 -0 -0 3
-0 -0 -0 -0 0
-0 -0 -0 -0 2
-0 -0 -0 -0 2
-0 -0 -0 -0 2
57 o120 0 3 3 1 1 3 1 2 2 3 1 3
49 117 0 1 0 2 3 0 2 3 2 3 3 3
105 112 0 3 0 0 1 0 0 3 3 3 3 3
33 110 0 0 0 1 1 0 2 3 3 3 3 2
83 110 -0 0 0 1 3 3 2 0 0 3 2 2
39 217
107
164 0
-0 0
-0 1
-0 3 0
3 -0
3 0
3 -0
3 -0
3 -0
3 -0
2 -0
2 -0
204 58
104
102 -0 0
-0 3
-0 3
0 3
-0 3
0 3
-0 2
-0 3
-0 2
-0 3
-0 3
ro 3
35 100 0 0 1 2 2 2 1 Q 0 2 2 3
38 099 0 1 1 3 3 2 3 0 2 3 1
48 40
095
095 2 0
1 0
0 0
3 1
3 1
0 1
3 1
3 3
1 0
2 2
3 2
3 2
34 094 0 0 0 1 3 3 1 1 0 3 3 3
56 090 0 3 3 1 3 3 1 1 1 3 3 3
-52 53
205 218
079 072 072 072
1 1
-0 -0
1 1
-0 -0
0 0
-0 -0
0 0 0 0 3 -0
3 0
0 0 0 0
2 1 -0 -0
3 -0 3 -0
-0 -0 -0 -0
0 0
-0 -0
2 1
-0 -0
0 0
-0 0
32 070 0 0 0 2 0 2 3 0 3 3 3 3
41 051 0 0 0 3 3 3 3 3 3 3 2 2
36 050 1 0 0 1 3 1 1 3 2 3 3 3
37 050 3 1 z 2 1 2 2 3 3 3 3 2
50 050 0 1 1 3 3 3 3 3 3 1 2 3
106 049 1 3 3 3 1 0 3 3 3 3 3 3
46 216 203
047 043 043
3 -0 -0
3 -0 -0
3 -0 -0
L3 3 3
3 -0 -0
3 0 0
1 -0 -0
3 -0 -0
0 -0 -0
3 2 0 -0-0
-0 -0
2
-0
51 040 0 1 1 3 3 3 2 3 3 2 2 3
42 021 0 0 0 3 3 3 3 3 3 3 3 1
V-18
Tab e V-7 NDT Observations Fatigue-CrackedTransverse WeZded
Panels with Crowns
PENETRANT ULTRASONIC EDDY CURRENT X-RAY
INSPECTION SEQUENCE 1 2 3 1 2 3 1 2 3 1 2 3 CRACK ACTUAL NUMBER VALUE
E 3 0 0 0 0 0 0 n 0 0 a a 75 1085 0 0 0 0 0 0 0 1 3 3 2 76 61
0 7 102
G0 c
C C 0 0
0 0
1 a
0 0
3 2 3
-2 0
73 992 0 0 1 0 4 0 2 3 72 935 0 0 0 - 0 1 0 0 0 0 0 1 67 97 C 0 a 0 0 C 0 3- 3 2 66 74
941 930
0 3 0
3 1
1 0
0 0
0 a
0 0
1 0 C
a 0
3 3
3 3
3 3
77 10O
5t9
513 a 0
0 0 080
1 0 0 0 0 a
0 a
3 3
31 3
3 2
79 0 a a 3- 3 66 62
43F
493 0 0
0 0 0a
3 2 3
7 3
0 0
0 3
0 3
3 3
1 1
3 3
11G 4 0 0 i 1 C 3 0 0 0 3 1 2 79 482 0 0 C 2 G 3 1 C 1 3 3 3
S 478 0 0 0 1 0 0 0 0 0 3 3 3 70 71
478
41 0 0
C C
I 2
0 0
-1 0
fl 2
p 1 2
0 3
g-3
0 3
11 454 a a a 0 1 -3 0 0 3 1 2 64 337 0 G 1 2 3 3 0 0 0 2 3 3 20 14
30F
295 0 0
C 0
0 0
I 0
G 0
0 0
1 1
0 0
2 0
0 1
0 I
0 0
- 12 1-6 4
292 282 C
0 0 0
C 0
a 0
0 0
0 0
0 C
0 3 0
3 2-
0 2
0 0
17 23F 0 0 0 0 0 0 plusmn 0 0 2 0 1 21 283 1 0 0 1 0 3 1 3 n 2 3 0 1- 292 0 0 0 3 0 0 1 0 G 2 1 G 23 279 0 0 0 1 0 0 0 1 1 3 3 2
101 274 0 a 0 0 0 0 0 0 0 1 plusmn 0 22 273 0 00 3 0 - 0 3 0 0 0 g 21 1 0 0 0 1 a 9 a a
267 73
23 0
-3
-0 1
-3 2 0
3 -0
3 0
0 -0
0 -0
0 -0
3 -0
3 -0
3 -0
269 102
233-0
29 0 -0
0 -0
n 0 0
-0 0
G 0
-0 0
-0 1
- C
-0 2
-D -n 2 0
I 172 1 0 0 I G 0 a a 0 3 2 3 211 E -0 -0-0 C-U-0-0 C -0 -G -0 -0
V-19
Table V- (Concluded)
CK ACT NO VAL 1 2- 3 1 2 3 1 2 3 1 2 3
229 152 -p -o-- Q - -C -0 -0 -0 -0
271 152 -0 -0 0-0 a -0 -c -0 -0 -0 -0 101 148a 0 1 0 2 0 C 3 1 3 -3 2 11 12B o 0 0 0 0 plusmn 3 0 3 2 3 3
i0a 126 a 1 0 1 0 1 0- 3 2 2 9 123 0 3 3 2 3 3 3 0 2 3 3 3
225 123 -0 -0 -0 3 -0 0 -0 -0 -0 -0 -0 -0 212 123 -0 -0 -0 1 -0 0 -0 -0 -0 -0 -0 -0 ge 113 0 3 3 3 3 2 2 2 3 3 3 plusmn 98 il a 3 3 1 1 0 3 2 2
g 111 3 2 1 3 3 3 2 0- 0 3 3 2 10
6 iOC102
3 0
00
C0
1plusmn
30
30
2plusmn
22
32
34
32
33
27 101 0 1 0 3 3 3 2 3 1 2 3 3 5 1-0 c 0 3 3 2 2 2
21 093 1 --shy 0 - -0 0 -0-0 -0 -0 -0 -0 2262
093
067 -C
0 --
P -
2 -1--0
0 0 -0
3 -0 -0
72 -
-0
3 -0
plusmn
3IE 057GEE 00
02
02
3
33
33
33
11
32
33
32
33
259 065 -0 -0 -0 2 -0 0 -0 -0 -G -c -0 -0 270 065 -0-0-0 3-0 0 -0-0-0 -0-0-a
24 069 0 1 a a 0 3 1 3 1 plusmn 2 a 8 063 0 plusmn1 3 3 3 3 c 2 3 3 2
25 061 C 1 0 1 0 0 2 3 3 1 2 1 18 057 1 0 3 3 3 2 7 3 3 3 3 26 057 0 1 2 C 0 a j 3 3 1 2 a 17 047 0 2 2 3 2 3 3 1 2 3 3 3
1 047 2 2 2 3 3 3 3 3 3 3 2 3 7 070 3 2 2 2 0 0 3 3 0 3 2 3 4 0 2 0 0 1 0 0 3 2 0 2 3 2
V-20
Table V-8 NDT Observations Fatigue-Cracked Flush Longitudinal
Welded Panels
PENETRANT ULTRASONIC EDDY CURRENT X-RAY
INS PECTXON SEQUENCE 1 2 3 1 2 3 1 2 3 1 2 3
CRACK ACTUAL NUMBER VALUE
552 1562 0 0 0 0 0 1 0 0 0 0 0 0 5618T 1289 1 0 0 0 0 0 0 0 0 0 0 0 558 1224 0 0 0 0 0 0 1 0 0 0 0 0 551 1176 0 0 0 0 0 0 0 0 0 0 0 0 584 1119 0 0 0 0 0 0 0 0 0 0 0 0 588 1110 1 0 0 0 0 0 0 0 0 1 0 0 561 1098 0 0 0 0 1 0 0 0 0 0 0 0 598 1088 0 0 0 0 0 0 0 0 0 0 0 0 597 I061 0 0 0- 0 0 0 0 0 0 0 1 0 600 1043 0 0 0 0 0 0 0 0 0 0 0 0 557 1037 0 0 0 0 0 0 0 0 0 0 1 0 550 1009 0 0 0 0 0 0 0 0 0 0 0 0 560 937 0 0 -0 0 0 0 0 0 0 3 3 0 586 895 1 0 0 0 0 0 0 0 0 0 0 0 599 879 0 0 0 0 0 0 0 0 0 0 0 0 585 770 0 0 0 0 0 0 0 0 0 3 2 0 583 760 0 0 0 0 0 0 0 0 0 3 3 0 559 744 0 0 0 0 0 0 0 0 0 0 0 0 543 708 1 0 0 0 0 0 0 0 0 0 0 0 562 703 0 0 0 0 0 0 0 0 0 3 3 3 595 o678 0 0 0 0 0 0 00 0 0 1 1 0 544 630 0 0 0 0 0 0 0 0 0 0 1 0 603 616 0 0 0 0 0 0 0 0 0 0 0 0 554 606 0 0 0 0 1 0 0 0 0 3 3 O 547 598 0 0 0 0 0 0 0 0 0 0 2 0 602 565 0 0 0 0 0 0 0 0 0 1 0 0 553 542 0 0 0 0 0 0 0 0 0 -1 0 556 526 0 0 0 0 1 0 0 0 0 2 3 0 548 513 0 0 0 0 0 0 0 0 0 3 3 0 542 9506 0 0 0 0 0 0 0 0 0 2 2 0 545 502 0 0 0 2 1 0 0 0 0 3 3 1 594 o479 0 0 0 0 1 0 0 0 0 3 3- 0 601 479 0 0 0 0 0 0 0 0 0 3 1 0 555 o447 0 0 0 0 0 0 -0 0 0 2 3 0 549 446 0 0 0 0 0 0 0 0 0 3 -3 3 604 433 0 0 0 0 10 0 0 0 0 2 3 3 593 428 0 0 0 0 0 0 0 0 0 3 3 0 546 426 0 0 0 0 0 0 0 0 0 3 3 0
V-21
Table V-8 (Continued)
CK-NO
AcVAL 2 3i 1 2 3 1 2 3 1 2 3
596 417 0 0 0 0 0 0~ 0 0 0 3 3 511 396 0 0 0 0 0 0 0 6 0- 1 00 591 392 0 0 0 0 2 0 0 0 0 -o0 0 590 379 0 0 1 0 2 2 3 3 0 1 -3 3 533 9378 0 -0 0 0 0 0 0 0 0 0 0 522 353 0 0 0 0 0 0 0 0 0 1 10 531 348 0 0 0i 0 0 0 0 0 0o 0 0 0 -513-528 347343 0 o 00 010 00I 0 0 0 0 0 0
0 00
0
532 343 0 0 0 0 0 0 00 0 0 0 0 536 339 0 0 0 0 0 0 0 0 0 3 2 0 512 -534
w337 337
0 0
0 0
0 0
0 0
0 0
0 0
- 0 0
0 -0
0 -1
-0 0 0
0 0
514324 523 323
0 0
0 0
0 0
0
0 0
0 0
0 0
0 0
0 0
A0 0
0 1
0 0
569 319 0 0 0 0 0 0 0 0 0 -3 2 3 537 300 o 0 0 0 0 o- 0o b - - 3 3 0 530 283 0 0 0- 0 1 0 o o -3 0 0 -567 280 0 1 0 0 0 0 0 0 0 0 1 3 570- 280 0 0 0 -0 1 0 0 0 0 -3- 3 2 568 274 0 -0 o 0 0 0 0 -0 o2 1 3 529 271 0 0 0 0 0 0 -O 0 0 3 0 0 577 264 0 0 0 0 o o o o 3 2 2 572 251 0 0 0 0 0 0 0 0 0 3 3 3 606 229 0 1 1 0 0 a 0 0 0 2 2-3 538 228 O0-shy 0 0 0 0 0 0 0 3 -3-3 565 224 0 0 o 0 0 0 0 0 0 2 3 shy564 221 607 218
0 0
0 0
0 0 -
0 0 o0
0 0
0 0
0 0
0 0
3 3
1 3 33
571 217 0 0 0 0 6 0 0 0 0 3 3 3 -527 212 0 0 0 0 0 0 1 0 0 3 -3 -shyl -575 576-
210
196 0 0
0 0
0-0
0 0
0 0
0 0
0 0 - 0
00 -
shy 3 3
-3 3
-3
539 541
194
193 0 0
0 0
0 0
0 -0 0 0
0 0
0 0
0 0
0 0
1 3
3 3
2 -3
540 191 0 0 0 A 0 0 0 0 0 2 3 3 608 190 0 0 1 0 0 2 0 0 0 3 -3 3 573 161 0 0 0o3 3- -3 0 0 0 2 3 3 535 157 0- 0-0 0 0 0 0 3 33 3 0 524 156 0 0 0 0 0 0 3 3 3 3 3 -3 526 150 0 0 0 -3 0 o 0 0 0 3 2 1 580 149 0 0 0 0 0 0 0 0 0 3 3 0 579 149 0 o 2 1 1 0 0-3 0 0 0 0
Table V-8 (Concluded)
CK ACT3 NO VAL 1 -2 3 1 2 3 1 2 3 1 2 3-
581 148 0 0 0 0 0 0 0 0 0 3-3 3 605 9139 u 0 0 0 0 3 0 0 0 93 578 136 0 1 3 0 0 0 0 U 0 3 3 3 563 130 Q 2 3 0 0 0 0 0 0 3 3 582 127 0 0 0 3 1 3 0 1 0 3 3 3 566 120 0 0 0 0 0 0 0 0 0 2 3 2 518 120 0 0 0 3 0 0 0 0 0 3 2 1 704 113 -0 -0 -0 0 -0 0 -0 -0 -0 -0 -0 -0 708 113 -0 -0 -U 0 -0 0 -0 -0 -0 -0 1-0 -shy0 706 -702
108
108 -0-0)-0 -0 -0 -0
0 o
-0 -0
0 0
-0 -0
-0 -0
-0 -0
-0-0 0 -0
-- 0 O
574 106 0 -2 1 1 3 2 3 3 3 3 3 3 592 100 0 3 1 0 0 3 3 3 0 - 3 31 3shy516 093 0 0 0 3 1 0 0 0 3 3 3 0shy
589 091 0 3 1 0 0 0 0 0 0 2 0 0 705 089 -0- 0 -0 0 -0 0 -0 -0 0 0 -0 0 515 701
089 089
0 -0
0--0
0 -0
3 0
0 -
0 0
0 -0
0 -0
3 -0
3 -0
3 -0
1 -0
504 088 1 0 0 3 3 0 0 3 3 3 3 0 509 505
085 08
1 0
1 0
10
3 3
3 0
3 0
3 0
3 0
3 0
3 3 3 32 3shy
517 07 0 0 0 3 0 0 0 0 3 3 3 1 510 07 0 0 0 0 1 3 0 0 0 3 3 707 07i -0 -0 -0 3 -0 0 -0 -0 -0 -0 -0 -0 -7-03 07 -0 -0 -0 3 -0 0 -0 -0 0 -0 -0 -0 508 07i 0 0 0 3 1 3 3 0 3 3 3 3 525 501
07( 07(
0 0
0 0
0 3 3
3 0
0 01
0 0
0 3
3 31
3 -0
2 3
2 0
521 06 0 0 0 3 0 1 0 0 0 1 3 3
519 06 0 0 0 2 0 2 0 0 0 3 3 3 503 06 0 0 0 2 3 0 3 3 -0 3 3 520- 061 0 0 0 0 0 1 0 0 0 3 3 2 502 04 0 1 0 0 0 3 0 3 3 -0 3 2 507 04 1 2 1 3 2 3 3 0 3 3 3 3
-506 03 0 2 2 3 0 0 3 3 3 3 2 3
V-23
Table V-9 NOT Observations Fatigue-Cracked Flush Transverse
Welded Panels
PENETRANT ULTRASONIC EDDY CURRENT X-RAY
INSPECTION SEQUENCE 1 2 3 1 2 3 1 2 3 1 2 3
CRACK ACTUAL NUMBER VALUE
616 e495 0 0 0 0 0 3 0 0 0 3 0 0 612 308 0 0 0 3 0 1 0 0 0 3 3 3 620 297 0 0 0 0 0 3 0 0 0 3 3 3 621 267 0 0 0 0 3 3 0 0 0 3 3 3 623 239 0 0 0 0 0 2 0 6 0 3 3 3 619 235 0 0 0 0 0 2 0 0 0 3 3 3 614 o235 0 0 0 3 0 3 0 0 0 3 -3 -3 622 2Z5 0 0 0 0 0 1 0 -0 0 3 3 3 613 224 0 0 1 3 0 1 0 0 0 3 3 3 611 204 0 2 3 3 2 2 0 0 0 -3 3 3 617 195 0 0 0 0 0 3 0 0 0 3 3 3 625 186 0 2 1 1 0 2 0 0 0 3 3 3 618 182 0 0 0 0 0 3 0 0 0 3 3- 3 615 178 0 0 0 0 0 1 0 3 0 3 3 -3 610 178 0 0 0 3 0 1 0 0 0 3 3 3 626 e160 0 0 2 2 3 3 3 3 0 3 3 3 624 158 0 1 0 0 0 2 3 3 0 3 3 3 609 138 0 1 3 3 0 1 0 0 0 3 3 3
V-24
own C-scan recordings interpretihg the results and documenting the inspections The operatorresponsihle for the original optimization and recording-sequences was eliminated from this repeat evaluation Additional care was taken to align warped panels to provide the best possibleevaluati6n
The results -of this repeat-cycle showed a definite improvement in the reliability of the ultrasonic method in detecting fatigue cracks in welds The two-data files were merged on the following basis
Data from the- repeat evaluation were ordered by actual flaw
dimension
An analysis was performed by counting down from the largest flaw to the first miss by the ultrasonic method
The original data were truncated to eliminate all flaws larger than that of the first miss in the repeat data
The remaining data were merged and analyzed according to the original plan The merged actual data file used for processing Sequences 1 and 3 ultrasonic data is shown in Tables V-2 through V-4 Tables V-5 through V-9 list nondestructive test observations by the ultrasonic method for the merged data as ordered by actual crack length
The combined data base was analyzed and plotted in the same manner as that described for the integrally stiffened panels
DATA RESULTS
The results of inspection and data analysis are shown graphically in Figures V-4 through-V-19 Data are plotted by weld panel type and crack orientation in the welds This separation and plotting shows the differences in detection reliability for the various panel configurations- An insufficient data base was established for optimum analysis of the flush transverse panels at the 95 reliability and 95 confidence level The graphical presentation at this level is shown and it may be used to qualitatively assess the etching and proof loading of these panels
The results of these analyses show the influences of flaw geometry flaw tightness and of inspection process influence on detection reliability
V-25
IO0
90 0
200
90
1 0
90
0
00 0 O
80 80 0
0
70
-0
-
Z
0
60
70
60
0
0
0 70
G0
0
so so so
3 I 40 140
030 30
LJ
20
I I
20
I 4
C1
0 0 30
I00 60 90 120 0 30 60 90 120
0 0
0 30 60 90 220
LENGTH (224ILENGTH 5PECRIEN FATIt CRACK SPEC2IEN
(IN)FATIGUC CRACK
LEWTN SPECHEN
(IN2FATIG E CRACK
200 200 00
SO 90 90 0
B0 0
0
00 0 80 -
0
70
50 -
70
60
0
0
0 70 -
60 shy
8 0 00l 50
- 40 -~4 140 -
30 30
20 20 20
10 10 to
0
0 000 000
I I I
250
I
200 20
o
0 050
I I
100
I
150
I
200
I
200
o
0
I
050
I I
200
III
150
I
a20 20
MPTH (IN)SPCC2MN FATI IE CRACK ENETRMT TEST SEQ NO I
CCIIDENCE LEVEL - 950
Figure V-4 Crack Detection Probability for Longitudinal Welds with Crowns by the Penetrant Method Plotted at 95 Probability and 95 Confidence
DEPTH (IN)SPECIHEN FATrICE CRACK PEETRANT TEST SEC NO 2 C0)SICNE LEVEL - 950
DPTH [IN)SPECICN FATICU CRACK PETRANr TEST SEO W0 3 CONIDEE LEVEL 950
100 - 00 100
90 - 90 90 O 0
00o
70
70
gt 60
S00
o
00
0 oo
0
00
70
70
60 t
-0
00
701
70
0
0
0
-
0
00-4
30 0
0 o
40
30
0 0o
40
30
20 20 20
0 0 10
0
350
I I
100 150 200
I
250
0
0
I
30
I I
60
I
90
[0
220 0
9 I
0
I
I 0
I
150
I I
2 00 250
LENGTH SPECI1CN
(I) fATIGUE CRACK
LENOH (IN) SPECINICN FATICE CRACK
tENOTH (IN) SPEC2ICN FATIGUE CRACK
1 00
go0
60 0
1 00
0o0
0
200
90
0 0 0
00
0 0
70
0
E- shy
iqo -
0
o0-
0
0
-0
70
00 -
5o
40 -
0
Mt
70
60
5
4
0
30 30 30
0 02 0 20
oi0 1 0
0 050 100 200 O 51500 05D 100 50 200 0 0 050 TO0 15D EDO 25o
EPTH IINA SPIIEN FATIGUE CRACK LLTRASCNIC TEST MO W 1oCONI DNCE LEVEL shy 950
Figu re V-5 Crack Deotection Probability for longitudl na YIWeldswithICrowns by the Ultrasonic bullMethod Plotted at 95 Probability and 95 Confidence
DEPTH ]NI SP CI NH rATIGC CRACK O)TRASONiC TEST SCO NW 2 CONIDCE LEVEL shy 950
DEPTH ( IN SIECIEN FAT] WqE CRACK LLTRAWN]C TEST Ma NO 3CC IDENCE LEVEL shy 9 0
100 I OD I 00
90 -90 90
00 O0 80
70 70 70
60 6D 60
0
a0
10
02
-
0
0 0-
0
0 -0
5D
413
0 20 -20
0 -
10
0
2
0
50
40
30
10
0
-
0
0 0
0
0 30 I I
60
LENGTH (ON) SPECINEN FATOGUtCRACK
I
90
I
120
00
0 30
I
60
LENGTH (IN) SPCIflN FATIGE CRACK
90 10 0 30
LENGTH SPECIIEN
60
IIN) FATIGUE CRACK
90 180
100 00
90 90 90
90 90 60
70 70
60 0
4 040
0o os0
0
0
04
50
0
10 000 00
a 05a O0D 150 000 i5aS0 050 100 150 200 250 o 050 10O So 200 0
DE[PTH IN) DEPTH 41N) CEpT [IN)SPEC]NEN FATIGUE CRACK PCIMCN FATIGX CRACK H
SPECIMEN FATIG CRACK ECOy CURRENT TEST SEG NM I ECOy CUJAiCNT TEST SEE W 2C4CCNCC LEVEL EOy CURRENTTEST SEE NO 3- 950 cWJCEnCE LEVEL 950 CON-IDENC LEVEL 95-0EFigure V-6 Crack Detection ProbabilIty for Longitudinal Welds with Crowns bythe Eddy
CurrentMethod Plotted at 95 Probability and 95 Confidence
100 00 100
90 90 90
80 80 60
70
80 Z
70
00 -
70
60 0
5o 50 50
4o 4 40
30 30 30 0
20 040
0 20 0 0 0
0
10
0 0 10 - ]0
0 P
0 -30
I I
60
LENGTH (IN) SPECIMEN FATICUC CRACK
I
90
I
120
0
0 30
1
LENGTH SPECIEN
I
60
IIN) FATIGUC CRACK
I
90
I
120
0
0 30
I
60
LENGTH IIN) SPECIMEN FAT]CUE CRACK
90
I
120
100 200 200
90 90 90
00 00 80
70 70 70
3 o 60
040
-
008o
ooshy
0
+40 040 00
0 0
40
30
20 0 00
00 04
80
20
0
0
0
70
20
20
0
D
0 0
I I I I 0 1I
050 100 150 200 no 0 050
DEPTH (IN)SECIEN FATIOU CRACK X--hAYTOT OSCNO I CONFIDENCELEVEL- 950
Figure V-7 Crack Detection Probability for Longitudinal Welds with Crowns by the X-Radiographlc Method Plotted at 95 Probability and 95 Confidence
I I 100 50
DEPTH (IN)SPECIMENFATIGUECRACK X-RAYTEST SEC NO 2 COM2]ENCCLEVEL 950
I 200
I 250
0
0 050
I I I I
O0 50
OPTH IIN]SPECIMENfATICE CRACK X-RAYTEST SE0MO 3 COSIOCENCELEVEL- 50
I
200 250
100
0
0 000
90 -
1 00
0
0
-
0
SO
70
00
70
0
-
S0
70 0
0
60 6 60
W50
soslW 50
40
30
20
0
20
30
20
10 10 10
0
0
100
90
0
II
50
0
100
LEWTH SPECIEN
150
lIN)FAT[OUECRACK
0
200 250 0
0
100
900
50 I I
100 150
LENGTH (IN)SPEC)MENFATIGUECRACK
00
200 250 0
0
100
90 0
50 I
000
LENGTH SPECIN
150
(INIFAT]GUECRACK
I
200 250
00 o0 00
70
60
70
60
0 70
0
50 500
40 40 40
30 30 30
20 20 20
0 10
0 1 I I I Io
0 100 200 300 400 500 600 0 100
DEPTH (INSPECIEN FATIGUECRACK pENETRANTTESTSO NO I CONWICCCELEVEL- 950
Figure V-8 Crack Detection Probability for Transverse Welds with Crowns by the Penetrant Method Plotted at 95 Probability and 95 Confidence
I I
200 300 400
DEp 1IN)SPECIMENFATIGUECRACK PENERANTTEST SEC NO 2 CONFIDENELEVELshy950
500
I
600
I
10
0
I I
100 200 300 400
DEPTH IN)SPECINIONFATIGUECRACK FEWETRANTTEST M0ONO 3 CONIEEC LEVElL S50
500 600
100 I00 100
90 90 so
10 00 80
70 70 70 0
60 60 o
5 5D0
0_~0 0 0
04
- 0 1
30-D 30 - 30
20 20 20
10 10 10
0 I I I I 0 I I I I I aI
0 50 100 150 200 250 0 50 100 50 2 00 250 0 50 100 150 ao0 250
LEtMTH IN LENGTH (IN I LENGTH IN )SPEC0INE FATIGUE CRACK SPtCIlEN FAT)GUCECRACK SPECIIEN FATIGWE CRACK
100 100 00
9o 90 90
600 60 0 0 000
0 0
70 70 0 - - 7 0 000
6 o 60 _-60 shy
5o60 0 0 o so
40
40 40 - 40 0
30 30 30 o0
20 20 20 0
10 00
0 I
0 100 200 300 400 500 600 0 100 20 300 400 500 600 0 100 200 300 500 600400
DCPTH IN) RT4 IN)SpICIJN FAVI JE CRACK HEPN 0141 TH I1ARASOIC TEST 90 NO I SPECIICN FATIGUE CRACK 2SPCIEN FATIOUE CRACK
IUTRASCAC TEST MO0 OTASO410 7067 SCCONFIDENCELEVEL 950 CC0F NCE LEVEL - 050 COMIOJCE LEVEL - O0
Figure V-9 Crack Detection Probability for Transverse Welds-with Crowns by the Ultrasonic Method Plotted at 95 Probability and 95 Confidence
100 100 100
90 90 90 N
00
70
00
70 C
0
10
0 0
60 60 0
50 so 06
0
-40 40
30 30 0
40 0
S0 20 20 -
10 10 10
0It 0 50
I I I I 100 150
LENGTH (IN)
SPECIMEN FATIGUE CRACIK
a00 a50
0 U 50
I I I
o0 150
LENOT (INI
SPECIHEN FATIGUE CRACK
I
00 e50
000
0 00
I I I
100 150
LENOTH tINI
SPECIMCN FATIGU CRACK
000
I
E0
100 100 0 100
90 0
90 90
00
70
0 00
70
0
-
00
70
0
0
0
3- o -
40 60 4-0
so z -
030 0
20 20
330 30
20
10 10 10
100 00 300 4oo 500 600 0 100 200 300 400 500 600
0 0 000 200 300 400 500 600
(IN) SCIMEN FATIGUJECRACK CCOYCURRENTTES 5EQ NO I C OINCE LEVIEL- 950
Figure V-1O Crack Detection Probability for Transverse Welds with Crowns by the EddyCurrent Method Plotted at 95 Probability and 95 Confidence
OPTHDEPTH (IN) SPCIMEN FATIGUE CRACK EOY CLRENT TEST SEQ NO a CON[CENOE LEV]EL- 95 0
DPTH (IN SPECIIEN FATIGUE CRACK E1 COYRENf TEST SEQ NO COH]CENCE LEVEL - 950
3
00 100 100
0 90 90
80 80 O
70 lt70 70
s0o650 0
600
50 -0
o 4D
3
20
10
30
0
0 0
2
40
30 -
20
0
o10-
0
I-0
0
-
40
30
20
10
0
0
I I I
0
I I I I
50 100 1o 200 P90 0 SD 100 I6R 200 20 0 5 100 150 200 250
LEWINOTH INI SPECIEN FATIGJU CRACK
LENGTH IIN I SFECINEN FATIGUE CRACK
LEINTH SPEClttN
IIN I FATIWUC CRACK
100 O 100
90 90 90
00 80 80
70 70 70 0
50 50
0
50 0
40 0
40 0- 40
20
10
-
0
0
0
20
1O
-
0
20 0
10
0
0
I I I I
100 200 300 400 500 00 0 to0
DEPTH (IN) SPECIIEN FATIGUE CRACK X-RAY TEST M0O NW I COW IOIC LEVEL - 950
Figure V-i Crack Detection Probability for Transverse Welds with Crowns by the X-RadiographicMethod Plotted at 95 Probability and 95 Confidence
I I I
200 300 qao0
DEpPN (IN) SPECIKEN FATIGUE CRACK X-RAY TEST 620 WC Z COICSIONCE LEVEL 950
r
500
I
60D
I o0
0 100
I I I I I
200 300 400
EPTH IIN I SPECIIIEN FATIGUE CRACK X-RAY TEST MO W 3 CNFIDEOE LEVIL 950
I I
500 600
1000 0 0 100 Qo a It 00 0 0 00 0 0 100 0
0 000
90 - - 90 so000 shy0bull 0
00 00 0 00 00
70 70 70 -shy
- J 60
50 50 so
40 40 40
0 30 30
20 20 20
001
0 0 0 I I I0 50 100 150 200 260 0 50 100 150 200 250 0 50 I 00 150 2 00 250
LENGTH (IN) LENGTH (IN) LEINTH IINISFECWIENFATIGWCRACK SPECIroNFATIGOLE SPECIKENFATHUE CRACKCRACK
100 00 0 0 0 0 G0 000 0 - -|oo _o0- 100 0000a 3 0 0
90 - shy 090 0
000 00 00 0 O - shy
0 70 70 - 0
6D 60 oo -j 60
0505
0 0 4 40 40
30 30 30
20 200
10 1O0t
0 I0 I 0 I I I I j I 0 100 E00 300 400 500 600 0 100 200 300 400 500 600 O 100 o I600 30D 400 500
OCPTH (IN IPTH (IN) DEPTH (INISFECIHENFATIOUECRACK SPECINEN FATIUJ CRACK PCIN FATIE CRACKPENETRANTTEST 5Z0 NO I PENETRANTTESTMO TET 60ACK0 NOCIMJT CONFIDENCELEVEl S 0 C$IONFNCCLEVEL- S5 0 WCSIR ELEVELM 950
Figure V-12 Crack Detection Probability for Flush Longitudinal Welds by the Penetrant Method Plotted at 95 Probability and 95 Confidence
0
90 0
1
go
0
0
-0
0shy
0
0
90 0
0 0
70
00 - 3o
-J 000
07o
0 -
70
0
0
l-
- 0 0 4 0 1 0
0
10 no 20 20
0 0 0
0
00 -
0
g8 o -o shy 0
-000
50
-
100 0
L0E OGTINl SFIIr N rATIOLI CRACK
07
0
200 tSO50
1
1
00
0
g 0 -
50
- 0
I
00 10
LCO4TN (IN) SPCC]N rAT[CIC CRACK
0 0
200 250 00I
0
70 -
I 00
00
50 0
000
-
60
0
00
LCNCTH SCCIICN
150
(IN) rATrloJ CRACK
200 50
30
60
O_
00 -00
300 -
00 00 -
30
04
0
50 00 j5 I
10[ 1- 1
0 100 200 3O0 400 500 600 0 100
DEPTH (IN) CI ATGUECRCK0TRASONIC TEST MO W I TRASCNICCONFIDNC LEVEL 00
Figure V-13 Crack Detection Probability for Flush LongitudinalI Welds by the Ultrasonic Method
Plotted at 95 Probability and 95Confidence
Roo Z00 400
DEPTH (I N I SPECiHEN FATI L CRACKTEST MO WCOFIDSNOELEL - 9300
2
500 t oo a
0TRANIC
100 20f 300 400
DPTH I IN I SPECIMIENFATIGUE CRALKTEST O W 3
C I C EE =
500 600
0 0 0 0 -0 0
m0
8
70
0bull0
0
9
00
70
0
0 00
0
90
80
70
0
60 60 bull31
8 8 0
20 20 0o
10 10 10
ITI
0 50 100 150 200 250 0 50 100
I I
150
I I
200 260
0
0
I
50 100
I I
150
I
a 00 250
100
90
80
00 0
0
0 0a
LENGTH SFCCIpoundN
0
(IN FATIOJ CRACK
10
90
0
O0 0
0
0
0
tOETH pOINEcN
0 aO0
0
(Till FATICUJ CRA4
0
90
00
0
00
-
0
wR LENGTH U11N SpCINEN FATIMtUtCRACK
O_0 0
70 70 70
000
O 6 50
063 00
50
0
4 40 4
30 300
20 200
10 10
0
S
I
00
I
20
I
300
I I
MO0
I I
500 600
0
0 100
I
00 300
I
400
I
500 600
I I
0
I II
100 20
1
300
I
40D
I I
500
I
600
DEPTH (INI SCINN FATloUt CRACK EMY CIAORENTTEST SEQ NO I CONFIDENCE LEVEL - 950
Figure V-14 Crack Detection Probability for Flush Longitudinal Welds by the Eddy Current Method Plotted at 95 Probability and 95 Confidence
DEPTH [IIN) SPECIMN rATIUE CRACK EMY CURRENTTMST SEQ NO 2 CONtIDC E LEVEL shy 950
DEPT AI) y CeNT JEST
CYF LETNCELEVEL SEE NOC 3 950
100 100 00
90 90 0
80 80 00
70 70 70
80 60 - 0
50 50 60
- 10 - IN 410
30 00
20 230
20J2 30 0
0
0
0
0
-
50 100
1 a
150 200 250
0
I
0
-010
0
1I
50 100
I
150 200
I
250
I
0
I I
50 100 160 200 250
LEIN SPECIE0N
(ON)FATIOUS CtACK
LENOTH SPECIEN
IN)FAT]G4 CRACK
LECNOTH (IN I SFECIHEN FATIGUE CRACK
I 00
00
100
so
100
90
0 0
80F
0
60
so
P o
0
0
00
-O 0 shy
7
6-00
so oo 0
0
80 B
70
0
50
0 0
3 - 3amp
00
30
U 2110 0 0 01 O 0 0 14] 0 -
0
00
-20 20 0 0 j2
0
0
--
100
I
200
II II
300
II
400
I I
500 600 0 1200 200
II0
Sao0
I I0I
400 0
I
600
I I
0 200 200
I I
DN00
I I I
500
I
000
Figure V-I5
DEPTH IIN) SPECINEN FATIO4E CRACK X-RAY TEST1 MO NO I C0SIOENCEIVEL 50
Crack Detectloji Probabililty for Flush Longitudinal Welds by the X-Radiographic Method Plotted at 95 Probability and 95 Confidence
EPTH IN) SPCCIN FATtI CRACK X-RAY TEST MO NO a COWICENCE LEVEL shy 950
DEPTH (IN) SFPCINCN FATI00E CRACK X-RAY TEST MO NO 3 COFIECA LEVEL shy 00
100 I 00 100
90
80
0
80
o 0
80 0
70 70 70
60 - 60
20 30 - 30
o 3s0 20
10 10 10
0 1
o
100
1 1 100
1 1 1 I I 200 300 400
LENGTH IlNI OPECIINtN FATIOUt CRACK
I 500
I 600
0I
0
100
000 200
LENGTH SPCCIMH
I I 300 400
IIN fATI LE CRACK
I I 500 600
0 0
000
100 I I
e00 300 400
LENGTH (INI SPECI0N FATIGUE CRACK
I I 500 0a
90 90 0 90
00 00 80
70 70 70
0
50
-
6~ o
50
so
- 40 - 40
30 30
20 20 20
10
IT 0 I I II 0 0 I
0 00 100 150 200 254 0 050
DEPTH (IN) SPsCIKN FATIGUE CRACK PEDTRANT TEST 0 0 NO I COWCIENCELEVEL - 950
Figure V-16 Crack Detection Probability for Flush Transverse Welds by the Penetrant MethodPlotted at 95 Probability and 95 Confidence
I I II
100 150
DEPTH (IN ) SPECIMN rATIGUE CRACK IcNIRANT TEST 0 OW 2 COWDENCE LEVEL - 950
I
20
I
o
10
0
0
05
050
I 100 1 50
100 15
DEPTH tIIN I
SPFCIfNE FATIGUE CRACK PENETRANT TEST MO NO 3 CONI0ENCE LEVEL - 9 50
200
200
25C
0 ]00 I 00
9090 90
so 80 0
70
60 - 60 - 60
50 50 so
70 70
I- 410
30 30
- 0 o
30
2020 20
00 010
0 0 I I I 0 I I I I
0 100 200 300 oo 500 600 0 -to 200 300 40 600 -600
LENGTH (INI LENGTH (IN) LENIN (IN) SCIMEN FATIUE CRACK SEtC]IWN FATIGUMCRACK SPECINtN FAT]GUE CRACK
100I OC I 0o
0 100 200 300 oo 600 600
90 90 90
B0o0000
70 70 70
6060000 - so03- 0 3 F
-to 4 50 0 0 50
030 4
300030
0 20 20
t030 10
I I I I 0 I I I I 2 I I I I0
0 050 200 150 200 m0 0 050 Ito 250000 260 0 050 100 50 00 20
DEPTH (IN DEPTH (IN) DEPTH (IN SPECItIEN FATIM CRACK SPECIIN FATIGUE CRACK SPECIHEN FATIGUE CRACK ULTRASONIC TEST SEC I -MO UTRA SO 3NO ULTRASONICTEST 2 ONIC TEST No C0IN ICENCEEVE 50C NENCC LEE -950CONFIENCE LEVampl - S50Figure V-17 Crack Detection Probability for Flush Transverse Welds by the Ultrasonic Method
Plotted at 95 Probability and 95 Confidence
100 100 100
00 90 90
_0 80 00
70 70 70
- 00 -60
50 50 50
E 40I 400
30 30 30
20 20 20
10 010 tO
0 I I o I I II I I o I I I I I I I
0 100 200 300 400 500 600 0 100 200 300 400 500 600 0 100 200 300 400 500 600
LENGTH (IN) LENGTH (IN LEWGIH (IN)SPECIWNFATIGMJCRACK SPECIIEN FATIUC CRACK SPECIMENFATIGWECRACK
I00 100000
90 0 90 90
0 00 0 80
70 70 70
60 60 60
505050
040 40
30 3)3
20 202
10 00 1002
0 I 1 I I i I I I0 I I I I I I I 0 I- I I I I
0 050 100 150 200 250 0 050 100 150 200 250 0 050 100 150 200 250
CEPTH (IN) DEPTH (IN) CEPTH (INSPECICN FATICUECRACK FATIUE CRACK SPECICN FATIGUECRACKSPECCIMEN ECY LURRENTTESTSEONO I ECOYCRRENTTESTSE0 NO 2 ECOYCtCNT TESTSQ NO 3 COWISI CE LEVML 9S50 COWI$NCE LEVE 95-0 CCIICCNCELEVEL- 0
Figure V-IS Crack Detection Probability for Flush Transverse Welds by the Eddy Current Method Plotted at 95 Probability and 95 Confidence
O00 I00
90 00 90
10 00 80
70 70 70
60 so
60 o
60
so
4o 40 40
30 30 30
20 20 20
t O10
0 0 100 200 300
LENGTH (IN I SACCIMrNFATIGM
400
CRACK
2
500 II I
600 I I0
0 I
100 I
200
LEWITH SPCItHN
300 400
IIN)FATIGWECRACK
0
500 I I
600 I
10
I 0 100 aoo
LCNOGT
H
SPCCICN
I I I
300 400
(INIFATIGUECRACK
I
0
500 600
200 I 00 100
90 9 90
0 S0 00
70 70 70
60 60 60
so 50 50
40 40 40
30 30 30
20 20 20
tO 10
0 I I I I I I I [_ ____ ____ ___ 0 I
00 0 0S0 tO t060 200 250 0 050
DEPTH (IN)SPECIVENFATIGUECRACK X-RAYTEST SEC NO I CONIDENCELEVEL- 950
Figure V-19 Crack Detection Probability for Flush Transverse Welds by the X-Radiographic Method Plotted at 95 Probability and 95 Confidence
I I I - I
100 150
DEPTH (IN)SPECIMENFATIGUECRACK X-RAYTEST SECNO 2 C0$IDENCE LEVl - 950
I
200
0 - I
250
10
a0 0
1
060
f I1
100 ISO
CCPTH N)JCIUN FATIGUECRACK X-RAYTEST SEC NO 3 CNFICEICE LEVEL 950
e00
0 1
2S0
VI CONCLUSIONS AND RECOMMENDATIONS
Liquid penetrant ultrasonic eddy current and x-radiographic methods of nondestructive testing were demonstrated to be applicable
and sensitive to the detection of small tightly closed flaws in
stringer stiffened panels and welds in 2219-T87 aluminum alloy
The results vary somewhat for that established for flat parent
metal panel data
For the stringer stiffened panels the stringer member in close
proximity to the flaw and the radius at the flaw influence detection
by all NDT methods evaluated The data are believed to be representshy
ative of a production depot maintenance operation where inspection
can be optimized to an anticipated flaw area and where automated
C-scan recording is used
LOP detection reliabilities obtained are believed to be representashy
tive of a production operation The tightness of the flaw and
diffusion bond formation at the flaw could vary the results
considerably It is-evident that this type of flaw challenges
detection reliability and that efforts to enhance detection should
be used for maximum detection reliability
Data obtained on fatigue cracked weld panels is believed to be a
good model for evaluating the detection sensitivity of cracks
induced by production welding processes The influence of the weld
crown on detection reliability supports a strong case for removing
weld bead crowns prior to inspection for maximum detection
reliability
The quantitative inspection results obtained and presented herein
add to the nondestructive testing technology data bases in detection
reliability These data are necessary to implement fracture control
design and acceptance criteria on critically loaded hardware
Data may be used as a design guide for establishing engineering
This use should however be tempered byacceptance criteria considerations of material type condition and configuration of
the hardware and also by the controls maintained in the inspection
processes For critical items andor for special applications
qualification of the inspection method is necessary on the actual
hardware configuration Improved sensitivities over that reflected
in these data may be expected if rigid configurations and inspection
methods control are imposed
The nature of inspection reliability programs of the type described
herein requires rigid parameter identification and control in order
to generate meaningful data Human factors in the inspection
process and inspection process control will influence the data
VI-I
output and is not readily recognized on the basis of a few samples
A rationale and criteria for handling descrepant data needs to be
developed In addition documentation of all parameters which may
influence inspection results is necessary to enable duplication
of the inspection methods and inspection results in independent
evaluations The same care in analysis and application of the
data must be used in relating the results obtained to a fracture
control program on functional hardware
VI-2
-APPENDIX A-
LIQUID PENETRANT INSPECTION PROCEDURE FOR WELD PANELS STIFFENED PANELS
AND LOP PANELS
10 SCOPE
11 This procedure describes liquid penetrant inspection of
aluminum for detecting surface defects ( fatigue cracks and
LOP at the surface)
20 REFERENCES
21 Uresco Corporation Data Sheet No PN-100
22 Nondestructive Testing Training Handbooks P1-4-2 Liquid Penetrant
Testing General Dynamics Corporation 1967
23 Nondestructive Testing Handbook McMasters Ronald Press 1959
Volume I Sections 6 7 and 8
30 EQUIPMENT
31 Uresco P-149 High Sensitive Fluorescent Penetrant
32 Uresco K-410 Spray Remover
33 Uresco D499C Spray Developer
34 Cheese Cloth
35 Ultraviolet light source (Magnaflux Black-Ray BTl00 with General
Electric H-100 FT4 Projector flood lamp and Magnaflux 3901 filter
36 Quarter inch paint brush
37 Isopropyl Alcohol
38 Rubber Gloves
39 Ultrasonic Cleaner (Sonogen Ultrasonic Generator Mod G1000)
310 Light Meter Weston Model 703 Type 3A
40 PERSONNEL
41 The liquid penetrant inspection shall be performed by technically
qualified personnel
A-i
50 PROCEDURE
541 Clean panels to be penetrant inspected by inmmersing in
isopropyl alcohol in the ultrasonic cleaner and running
for 1 hour stack on tray and air dry
52 Lay panels flat on work bench and apply P-149 penetrant
using a brush to the areas to be inspected Allow a dwell
time of 30 minutes
53 Turn on the ultraviolet light and allow a warm up of 15 minutes
531 Measure the intensity of the ultraviolet light and assure
a minimum reading of 125 foot candles at 15 from the
2 )filter (or 1020--micro watts per cm
54 After the 30 minute penetrant dwell time remove the excess
penetrant remaining on the panel as follows
541 With dry cheese cloth remove as much penetrant as
possible from the surfaces of the panel
542 With cheese cloth dampened with K-410 remover wipe remainder
of surface penetrant from the panel
543 Inspect the panel under ultraviolet light If surface
penetrant remains on the panel repeat step 542
NOTE The check for cleanliness shall be done in a
dark room with no more than two foot candles
of white ambient light
55 Spray developer D-499c on the panels by spraying from the
pressurized container Hold the container 6 to 12 inches
from the area to be inspected Apply the developer in a
light thin coat sufficient to provide a continuous film
on the surface to be inspected
NOTE A heavy coat of developer may mask possible defects
A-2
56 After the 30 minute bleed out time inspect the panels for
cracks under black light This inspection will again be
done in a dark room
57 On data sheet record the location of the crack giving r
dimension to center of fault and the length of the cracks
Also record location as to near center or far as applicable
See paragraph 58
58 Panel orientation and dimensioning of the cracks
RC-tchifle- Poles U j--U0
I
k X---shy
-
e__=8= eld pound r arels
59 After read out is completed repeat paragraph 51 and
turn off ultraviolet light
A-3
-APPENDIX B-
ULTRASONIC INSPECTION FOR TIGHT FLAW DETECTION BY NDT PROGRAM - INTEGRALLY
STIFFENED PANELS
10 SCOPE
11 This procedure covers ultrasonic inspection of stringer panels
for detecting fatigue cracks located in the radius root of the
web and oriented in the plane of the web
20 REFERENCES
21 Manufacturers instruction manual for the UM-715 Reflectoscope
instrument
22 Nondestructive Testing Training Handbook P1-4-4 Volumes I II
and III Ultrasonic Testing General Dynamics 1967
23 Nondestructive Testing Handbook McMasters Ronald Press 1959
Volume II Sections 43-48
30 EQUIPMENT
31 UM-715 Reflectoscope Automation Industries
32 ION PulserReceiver Automation Industries
33 E-550 Transigate Automation Industries
34 SIJ-385 25 inch diameter flat 100 MHz Transducer Automation
Industries
35 SR 150 Budd Ultrasonic Bridge
-6 319 DA Alden Recorder
37 Reference Panel - Panel 1 (Stringer)
38 Attenuator Arenberg Ultrasonic Labs (0 db to 122 db)
40 PERSONNEL
41 The ultrasonic inspection shall be performed only by technically
qualified personnel
B-1
50 PROCEDURE
51 Set up equipment per set up sheet page 3
52 Submerge the stringer reference pane in a water filled inspection
tank (panel 1) Place the panel so the bridge indexes away from
the reference hole
521 Scan the web root area B to produce an ultrasonic C scan
recording of this area (see panel layout on page 4)
522 Compare this C scan recording web root area B with the
reference recording of the same area (see page 5) If the
comparison is favorable precede with paragraph 53
523 If the comparison is not favorable adjust the sensitivity
control as necessary until a favorable recording is obtained
53 Submerge scan and record the stringer panels two at a time
Place the stringers face up
531 Scan and record areas in the following order C A
B and D
532 Identify on the ultrasonic C scan recording each web
root area and corresponding panel tag number
533 On completion of the inspection or at the end of theday
whichever occurs first rescan the web root area of the
stringer panel 1 and compare with reference recording
54 When removing panels from water thoroughly dry each panel
55 Complete the data sheet for each panel inspected (If no defects
are noted so indicate on the data sheet)
551 The X dimension is measured from right to left for web
root areas C and A and from left to right for web
root areas B and D Use the extreme edge of the
stringer indication for zero reference
NOTE Use decimal notation for all measurements
56 After completing the Data Sheeti roll up ultrasonic recording
and on the outside of the roll record the following information
a) Date
b) Name (your)
c) Panel Type (stringer weld LOP)
d) Inspection name (ultrasonic eddy current etc)
e) Sequence nomenclature (before chemical etch after chemical
etch after proof test etc)
B-2
ULTRASONIC SET-UP SHEET
DATE 021274
METHOD PulseEcho 18 incident angle in water
OPERATOR Todd and Rathke
INSTRUMENT UM 715 Reflectoscope with ION PulserReceiver or see attachedset-up sheet tor UFD-I
PULSE LENGTH Min
PULSE TUNING For Max signal
REJECT
SENSITIVITY 20 X 100 (Note Insert 6 db into attenuator and adjust the sensitivity control to obtain a 18 reflected signal from the class I defect in web root area B of panel 1 (See Figure 1) Take 6db out of system before scanning the panels
FREQUENCY 10 MHz
GATE START 4 E
GATE LENGTH 2 (
TRANSDUCER -SIJ 385 25100 SN 24061
WATER PATH 1 14 when transducer was normal to surface
WRITE LEVEL + Auto Reset 8 SYNC Main Pulse
PART Integrally Stiffened Fatigue Crack Panels
SET-UP GEOMETRYJ
I180 Bridge Controls
Carriage Speed 033 IndexIneScan Direction Rate 015 to 20
Step Increment 032
B-3
LAY-OUT SHEET
Reference
J
B-4 0 - y
REFERENCE RECORDING SHEET
Case I
Defect
WEB ROOT AREA
B
Panel B-5
FIGURE 1 Scope Presentation for the
AdjustedSensitivity to 198
ORIGINAL PAGE IS OF POOR QUALITY
B-6
-APPENDIX C -
EDDY CURRENT INSPECTION AND RECORDING FOR INTEGRALLY STIFFENED
ALUMINUM PANELS
10 SCOPE
11 This procedure covers eddy current inspection for detecting
fatiguecracks in integrally stiffened aluminum panels 20 REFERENCES
21 Manufacturers instruction manual for the NDT Instruments
I Model Vector 111 Eddy Current Instrument
22 Nondestructive Testing Training Handbooks Pi-4-5 Volumes I amp II
Eddy Current Testing General Dynamics 1967
23 Nondestructive Testing Handbook McMasters Ronald Press 1959
Volume II Sections 35-41
30 EQUIPMENT
31 NDT Instruments Vector IlI Eddy Current Instrument
311 100KHz Probe for Vector 111 Core diameter 0063 inch
NOTE This is a single core helically wound coil
32 NDE Integrally Stiffened Reference Panel 4 web B
33 SR 150 Budd Ultrasonic Bridge
34 319DA Alden Recorder
35 Special Probe Scanning Fixture 2
36 Special Eddy Current Recorder Controller Circuit
37 Dual DC Power Supply 0-25V O-2A (HP Model 6227B)
40 PROCEDURE
41 Connect 100 KHz Probe to Vector ill instrument
42 Turn instrument power on and set sensitivity course control
to position 1
43 Check batteries by operating power switch to BAT position
Batteries should be checked every two hours of use
431 Meter should read above 70
44 Connect Recorder controller circuit
441 Set Power Supply for +16 volts and -16 volts
C-I
45 Place Fluorolin tape on vertical and horizontal (2 places)
tracking surfaces of scanning block Trim tape to allow
probe penetration
451 Replace tape as needed
46 Set up panel scanning support fixture spacers and shims for
a two panel inspection inner stringer faces
47 Place the reference panel (4 web B Case 1 crack) and one other
panel in support fixture for B stringer scan Align panels careshy
fully for parallelism with scan path Secure panels in position
with weights or clamps
48 Manually place scan probe along the reference panel stringer
face at least one inch from the panel edge
481 Adjust for vector III meter null indication by
alternately using X and R controls with the sensitivity
control set at 1 4Use Scale control to maintain
readings on scale
482 Alternately increase the course sensitivity control
and continue to null the meter until a sensitivity
level of 8 is reached with fine sensitivity control
at 5 Note the final indications on X and R controls
483 Repeat steps 481 and 482 while a thin non-metallic
shim (3 mils thickness) is placed between the panel
horizontal surface and the probe block Again note the
X and R values
484 Set the X and R controls to preliminary lift-off
compensation values based on data of steps 482 and 483
485 Check the meter indications with and without the shim
in place Adjust the X and R controls until the
meter indication is the same for both conditions of
shim placement Record the final settings
X 1600 These are approximate settings and are
R 3195 given here for reference purposes only
SENSTTIVTTY
COURSE 8
FINE 5
C-2
49 Set the Recorder controls for scanning as follows
Index Step Increment 020
Carriage Speed 029
Scan Limits set to scan 1 inch beyond panel edge
Bridge OFF and bridge mechanically clamped
410 Manually move the probe over panel inspection region to
determine scan background level Adjust the Vector III
Scale control to set the background level as close as possible
to the Recorder Controller switching point (meter indication
is 20 for positive-going indication and 22 for negative-going
indication)
411 Initiate the Recorder Scan function
412 Verify that the flaw in B stringer of the reference pinel
is clearly displayed in the recording Repeat step 410
if requited
413 Repeat step 410 and 411 for the second panel in the fixture
Annotate recordings with panelstringer identification
414 Reverse the two panels in the support fixture to scan the
C stringer Repeat steps 47 4101 411 413 and 414
for the remaining panels
415 Set up panel scanning support fixture spacers and shims for
outer stringer faces Relocate scan bridge as required and
clamp
416 Repeat steps 47 410 411 413 and 414 for all panels
for A and D stringer inspections
417 Evaluate recordings for flaws and enter panel stringer
flaw location and length on applicable data sheet Observe
correct orientation of reference edge of each panel when
measuring location of a flaw
50 PERSONNEL
51 Only qualified personnel shall perform inspections
60 SAFETY
61 Operation should be in accordance with Standard Safety Procedure
used in operating any electrical device
C-3
AMENDMENT A
APPENDIX C
NOTE
This amendment covers changes
in procedure from raster
recording to analog recording
442 Connect Autoscaler circuit to Vector III and set
ba6k panel switch to AUTO
48 Initiate the Recorder Scan function Set the Autoscaler
switch to RESET
49 Adjust the Vector 1il Scale control to set the recorder display
for no flaw or surface noise indications
410 Set the Autoscaler switch to RUN
411 When all of the signatures of the panels are indicated (all
white display) stop the recorder Use the carriage Scan
switch on the Recorder Control Panel to stop scan
412 Annotate recordings with panelsidethicknessreference
edge identification data
C-4
-APPENDIX D-
X-RADIOGRAPHIC INSPECTION PROCEDURES FOR DETECTION OF FATIGUE CRACKS
AND LOP IN WELDED PANELS
10 SCOPE
To establish a radiographic technique to detect fatigue cracks and LOP in welded panels
20 REFERENCES
21 MIL-STD-453
30 EQUIPMENT AND MATERIALS
31 Norelco X-ray machine 150 KV 24MA
32- Balteau X-ray machine 50 KV 20MA
33 Kodak Industrial Automatic Processor Model M3
34 MacBeth Quantalog Transmission Densitometer Model TD-100A
35 Viewer High Intensity GE Model BY-Type 1 or equivalent
36 Penetrameters - in accordance with MIL-STD-453
37 Magnifiers 5X and LOX pocket comparator or equivalent
38 Lead numbers lead tape and accessories
40 PERSONNEL
Personnel performing radiographic inspection shall be qualified in accordshyance with MIL-STD-453
50 PROCEDURE
51 An optimum and reasonable production technique using Kodak Type M Industrial X-ray film shall be used to perform the radiography of welded panels The rationale for this technique is based on the reshysults as demonstrated by the radiographs and techniques employed on the actual panels
52 Refer to Table I to determine the correct setup data necessary to produce the proper exposure except
Paragraph (h) Radiographic Density shall be 25 to35
Paragraph (i) Focal Spot size shall be 25 mm
Collimation 1-18 diameter lead diaphram at the tube head
53 Place the film in direct contact with the surface of the panel being radiographed
54 Prepare and place the required film identification on the film and panel
55 The appropriate penetrameter (MIL-STD-453) shall be radiographed with each panel for the duration of the exposure
56 The penetrameters shall be placed on the source side of the panels
57 The radiographic density of the panel shall not vary more than + 15 percent from the density at the MIL-STD-453 penetrameter location
58 Align the direction of the central beam of radiation perpendicular and to the center of the panel being radiographed
59 Expose the film at the selected technique obtained from Table 1
510 Process the exposed film through the Automatic Processor (Table I)
511 The radiographs shall be free from blemishes or film defects which may mask defects or cause confusion in the interpretation of the radiograph for fatigue cracks
512 The density of the radiographs shall be checked with a densitometer (Ref 33) and shall be within a range of 25 to 35 as measured over the machined area of the panel
513 Using a viewer with proper illumination (Ref 34) and magnification (5X and 1OX Pocket Comparator or equivalent) interpret the radioshy
graphs to determine the number location and length of fatigue cracks in each panel radiographed
D-2
TABLE I
DETECTION OF LOP - X-RAY
Type of Film EastmanjKodak Type M
Exposure Parameters Optimum Technique
(a) Kilovoltage
130 - 45 KV
205 - 45 KV
500 - 70 KV
(b) Milliamperes
130-205 - 20 MA
500 - 20 MA
(c) Exposure Time
130-145 - 1 Minutes
146-160 - 2 Minutes
161-180 - 2 Minutes
181-190 - 2 Minutes
190-205 - 3 Minutes
500 - 2 Minutes
(d) TargetFilm Distance
48 Inches
(e) Geometry or Exposure
Perpendicular
(f) Film HoldersScreens
Ready PackNo Screens
(g) Development Parameters
Kodak Model M3 Automatic Processor Development Temperature of 78degF
(h) Radiographic Density
130 - 30
205 - 30
500 - 30
D-3
TABLE 1 (Continued)
(i) Other Pertinent ParametersRemarks
Radiographic Equipment Norelco 150 KV 24 MA Beryllium Window
7 and 25 Focal Spot
WELD CRACKS
Exposure Parameters Optimum Technique
(a) Kilovoltage
18 - 45 KV 12 - 70 KV
(b) Milliamperes
18 - 20 MA 12 - 20 MA
(c) Exposure Time
18 - 1 Minutes 12 - 2k Minutes
(d) TargetFilm Distance
48 Inches
(e) Geometry or Exposure
Perpendicular
(f) Film HoldersScreens
Ready PackNo Screens
(g) Development Parameters
Kodak Model M3 Automatic Processor Development Temperature at 780F
(h) Radiographic Density
060 - 30
205 - 30
i) Other Pertinent ParametersRemarks
Radiographic EquipmentNorelco 150 KV 24 MA
Beryllium Window 7 and 25 Foenl Snnt
D-4
APPENDIX E
ULTRASONIC INSPECTION FOR TIGHT FLAWS DETECTION BY NDT PROGRAM -
LOP PANELS
10 SCOPE
11 This procedure covers ultrasonic inspection of LOP panels for detecting lack of penetration and subsurface defects in Weld area
20 REFERENCE
21 Manufacturers instruction manual for the UM-715 Reflectoscope instrument and Sonatest UFD I instrument
22 Nondestructive Testing Training Handbook P1-4-4 Volumes I II and III Ultrasonic Testing General Dynamics 1967
23 Nondestructive Testing Handbook McMasters Ronald Press 1959 Volume II Sections 43-48
30 EQUIPMENT
31 UM-715 Reflectoscope Automation Industries
32 ION PulserReceiver Automation Industries
33 E-550 Transigate Automation Industries
34 SIJ-360 25 inch diameter flat 50 MHZ Transducer Automation Ind SIL-57A2772 312 inch diameter flat 50 MHZ Transducer Automation Ind
35 SR 150 Budd Ultrasonic Bridge
36 319 DA Alden Recorder
37 Reference Panels Panels 24 amp 36 for 18 Panels and 42 and 109 for 12 inch panels
40 PERSONNEL
41 The ultrasonic inspection shall be performed only by technically qualified personnel
50 PROCEDURE
51 Set up equipment per applicable setup sheet (page 4)
52 Submerge the applicable reference panel for the thickness being inspected Place the panel so the least panel conture is on
the bottom
E- 1
521 Scan the weld area to produce an ultrasonic C scan recording of this area (See panel layouts on page 4)
522 Compare this C scan recording with the referenced recording of the same panel (See page 5 and 6) If the comparison is favorable presede with paragraph 53
523 If comparison is not favorable adjust the controls as necessary until a favorable recording is obtained
53 Submerge scan and record the panels two at a time Place the panels so the least panel conture is on the bottom
531 Identify on the ultrasonic C scan recording the panel number and reference hole orientation
532 On completion of the inspection or at the end of shift whichever occurs first rescan the reference panel and compare with reference recording
54 When removing panels from water thoroughly dry each panel
55 Complete the data sheet for each panel inspected
551 The x dimension is measured from end of weld starting zero at end with reference hole (Use decimal notation for all measurements)
E-2
56 After completing the data sheet roll up ultrasonic
recording and on the outside of the roll record the
following information
A - Date
B - Name of Operator
C - Panel Type
D - Inspection Name
E - Sequence Nomenclature
Er3
Date Oct 1 1974
2i]ethod- Pitch And Catch Stcep delay
Operator- H Loviscne Sweep Max
Instrument- UK-715 ReflectoscoDe ION PnlserReceiver -Q
18H 12 1 Pulse Length- - Q Mine - Q Hin 0-1
Pulse Tuning- - (b- -
Reject-- - - - 10 1Clock- - -b 12 OClock
Sensitivity- 5 X 1 31 X 10
Frequency- M 5 PMZ1HZ
Gate Start- 4 -4
Gate Length- - - - 3 - 3
Transducer- Transmitter- SlI 5o0 SI 3000 - Receiver- SIL 50 SI 15926
Water Path- 2-1116
Write Level -- -A- - -
Part - 18 amp 12 LOP Panels
Sct- p Geometry -
18T (280)
12T(23 deg )
- 230
RA DTh~)301iD hD)j -
Step Stepmarker ilmarkerarker er Transmitter
Ref Hole+--gt I ref
hole-
S Reciever
49)
Use a NG transducer to hold bracket -shy shy
1516
E14
YbDLrrrc PAla
er~tvamp~WcL
V2 uN- ZampWE CC PAA)r 4-1
-==
t -6
E- 6
AIENDIbNT A
APPEMDIX E
SET-UP FOR 18 LOP PANELS
DATE 081175
METHOD Pitch-Catch Pulse-echo 27 340 incident angle
of transmitter and receiver in water (angle indicator 4 340)
OPERATOR Steve Mullen
INSTRUMENT UM 715 Reflectoscope with 10 NPulserReceiver
PULSE LENGTH(2) Min
QPULSE TUNING for Max signal
REJECT 11000 oclock
SENSITIVITY 5 x 10
FREQUENCY 5 MHz
GATE START 4
GATE LENGTH 3
TRANSDUCER Tx-SIZ-5 SN 26963 RX-SIZ-5 SN 35521
WATER PATH 19 from Transducer Housing to part Transducer inserted into housing completely
WRITE LEVEL Reset e + auto
PART 18 LOP Panels for NAS 9-13578
SET-UP GEOMETRY
SCANJ
STEP
ER-7
Ys LOP WeF Pc -sEs kUMMI-7Z1-T A
APPEMDIX E
LOP OEFPkvSL- -d5-
E-8
AI EM ENT B
APPENDIX E
SET UP FOR 12 LOP PANELS
DATE 081275
METHOD Pitch-Catch Pulse-Echo 270 incident angle of Transmitter and Receiver in Water (angle indicator = 40)
OPERATOR Steve Mullen
INSTRUMENT UM-715 Reflectoscope with IONPulserReceiver
PULSE LENGTH ( Min
PULSE TUNING For Max signal
REJECT 1000 oclock
SENSITIVITY 5 x 10
FREQUENCY 5 MHz
GATE START 4 (D
GATE LENGTH 3
TRANSDUCER TX-SIZ-5 SN26963 Rx-SIZ-5 SN 35521
WATER PATH 16 from Transducer Housing to Part Transducer inserted into housing completely
WRITE LEVEL Reset D -- auto
PART 12 LOP Panels for NAS9-13578
SET-UP GEOMETRY
t
49shy
E-9
AIamp1flgtTT B
APPENDIX S
12 LOP Reference Panels
Drill HoleReference Panel 19
LOP Reference Panel 118
E-10
APPENDIX F
EDDY CURRENT INSPECTION AND RECORDING OF LACK OF PENETRATION (LOP) ALUMINUM
PANELS UNSCARFED CONDITION
10 SCOPE
11 This procedure covers eddy current inspection for detecting lack
of penetration flaws in welded aluminum panels
20 REFERENCES
21 Manufacturers instruction manual for the NDT Instruments Model
Vector -11 Eddy Current Instrument
22 Nondestructive Testing Training Handbooks P1-4-5 Volumes I and 11
Eddy Current Testing General Dynamics 1967
23 Nondestructive Testing Handbook McMasters Ronald Press 1959
Volume II Sections 35-41
30 EQUIPMENT
31 NDT Instruments Vector lll Eddy Current Instrument
311 20 KHz Probe for Vector 111 Core Diameter 0250 inch
NOTE This is a single core helically wound coil
32 NDE LOP Reference Panels
321 12 inch panels Nos 1 and 2
322 18 inch panels Nos 89 and 115
3-3 SR 150 Budd Ultrasonic Bridge
34 319DA Alden Recorder
35 Special Probe Scanning Fixture No 1 for LOP Panels0
36 Special Eddy Current Recorder Controller Circuit
37 Dual DC Power Supply 0-25V 0-lA (Hp Model 6227B or equivalent)
38 Special AutoscalerEddy Current Meter Circuit0
F-1
40 PROCEDURE
41 Connect 20 KHz Probe to Vector lll instrument
42 Turn instrument power on and set Sensitivity Course control to
position 1
43 Check batteris by operating power switch to-BAT position (These
should be checked every two hours to use)
431 Meter should read above 70
44 Connect Recorder Controller circuit
441 Set Power Supply for +16 volts and -16 volts
442 Connect Autoscaler Circuit to Vector 111 and set back panel
switch to AUTO
45 Set up weld panel scanning support fixture shims and spacers as
follows
451 Clamp an end scan plate (of the same thickness as welded
panel) to the support fixture Align the end scan plate
perpendicular to the path that the scan probe will travel
over the entire length of the weld bead Place two weld
panels side by side so that the weldbeads are aligned with
the scan probe Secure the LOP panels with weightsclamps
as required Verify that the scan probe holder is making
sufficient contact with the weld bead such that the scan
probe springs are unrestrained by limiting devices Secure
an end scan plate at opposite end of LOP panels Verify
that scan probe holder has sufficient clearance for scan
travel
452 Use shims or clamps to provide smooth scan probe transition
between weld panels and end scan plates0
F-2
46 Set Vector 111 controls as follows
X 1340
R 5170
Sensitivity Course 8 Fine 5
47 Set the Recorder Controls for scanning as follows
Index Step Increment - 020 inch
Carriage Speed - 029
Scan Limits - set to scan 1plusmn inches beyond the panel edges
Bridge - OFF and bridge mechanically clamped
48 Initiate the RecorderScan function Set the Autoscaler switch
to RESET Adjust the Vector 111 Scale control to set the recorder
display for no flow or surface noise indications
49 Set the Autoscaler switch to RUN
410 When all of the signatures of the panels are indicated (white disshy
play) stop the Recorder Use the Carriage Scan switch on the Reshy
corder control panel to stop scan
411 Annotate recordings with panelsidethicknessreference edge
identification data
412 Repeat 45 48 through 411 with panel sides reversed for back
side scan
413 Evaluate recordings for flaws and enter panel flaw location and
length on applicable data sheet Observe correct orientation of
reference hole edge of each panel when measuring location of a flaw
50 PERSONNB
51 Only qualified personnel shall perform inspections
6o SAFETY
61 Operation should be in accordance with Standard Safety Procedure
used in operating any electrical device
F-
APPE DIX G
EDDY CURRENT INSPECTION AND C-SCAN RECORDING OF LOP ALUMIM
PANELS SCARFED CONDITION
10 SCOPE
11 This procedure covers eddy current C-scan inspection detecting
LOP in Aluminum panels with scarfed welds
20 REFERENCES
21 Manufacturers instruction manual for the NDT instruments
Model Vector 111 Eddy Current Instrument
22 Nondestructive Testing Training Handbooks P1-4-5 Volumes
I and II Eddy Current Testing General Dynamics 1967
23 Nondestructive Testing Handbook MeMasters Ronald Press
1959 Volume II Sections 35-41
30 EQUIPMENT
31 M Instruments Vector 111 Eddy Current Instrument
311 20 KHz probe for Vector 111 Core diamter 0250 inch
Note This is a single core helically wound coil
32 SR 150 Budd Ultrasonic Bridge
33 319DA Alden Recorder
34 Special Probe Scanning Fixture for Weld Panels (A)
35 Dual DC Power Supply 0-25V 0-lA (HP Model 6227B or equivalent)
36 DE reference panel no 4 LOP reference panels no 20(1) and
No 36(18)
37 Special Eddy Current Recorder Controller circuit
G-1
40 PROCEDURE
41 Connect 20 KHz probe to Vector 111 instrument
42 Turn instrument power on and set SENSITIVITY COURSE control
to position lo
43 Check batteries by operating power switch to BAT position Batteries
should be checked every two hours of use Meter should read above 70
44 Connect C-scanRecorder Controller Circuit
441 Set Power Supply for +16 volts and -16 volts
442 Set s EC sivtch to EC
44deg3 Set OP AMP switch to OPR
444 Set RUNRESET switch to RESET
45 Set up weld panel scanning support fixture as follows
4o51 Clamp an end scan plate of the same thickness as the weld
panel to the support fixture One weld panel will be
scanned at a time
452 Align the end scan plate using one weld panel so that
the scan probe will be centered over the entire length
of the weld bead
453 Use shims or clamps to provide smooth scan transition
between weld panel and end plates
454 Verify that scan probe is making sufficient contact with
panel
455 Secure the weld panel with weights or clamps as required
456 Secure an end scan plate at opposite end of weld panel
-2
46 Set Vector III controls as follows
X 0500
R 4240
SENSITIVITY COURSE 8 FINE 4
MANUALAUTO switch to MAN
47 Set the Recorder controls for scanning as follows
Index Step Increment - 020 inch
Carriage Speed -029
Scan Limits - set to scan l inches beyond the panel edge
Bridge shy
48 Manually position the scan probe over the center of the weld
49 Manually scan the panel to locate an area of the weld that conshy
tains no flaws (decrease in meter reading)
With the probe at this location adjust the Vector 111 Scale conshy
trol to obtain a meter indication of 10 (meter indication for
switching point is 25)o
410 Set Bridge switch to OFF and locate probe just off the edge of
the weld
411 Set the Bridge switch to BRIDGE
412 Initiate the RecorderScan function
413 Annotate recordings with panel reference edge and serial number
data
414 Evaluate recordings for flaws and enter panel flaw location and
length data on applicable data sheet Observe correct orientation
of reference hold edge of each panel when measuring location of
flaws
50 PERSONNEL
51 only qualified personnel shall perform inspection
60 SAFETY
6i Operation should be in accordance with Standard Safety Procedure
used in operating any electrical device0
C -4
APPENDIX H
ULTRASONIC INSPECTION FOR TIGHT FLAWS DETECTED BY NDT PROGRAM -
WELD PANELS HAVING CROWNS shy
10 SCOPE
11 This procedure covers ultrasonic inspection of weld panels
for detecting fatigue cracks located in the Weld area
20 REFERENCES
21 Manufacturers instruction manual for the UM-715 Reflectoscope
instrument
22 Nondestructive Testing Training Handbook P1-4-4 Volumes I II
and III Ultrasonic Testing General Dynamics 1967
23 Nondestructive Testing Handbook McMasters Ronald Press 1959
Volume II Sections 43-48
30 EQUIPMENT
31 UM-715 Reflectoscope Automation Industries
32 iON PulserReceiver Automation Industries
33 E-550 Transigate Automation Industries
34 UFD-l Sonatest Baltue
35 SIJ-385 25 inch diameter flat 100 MHz Transducer Automation
Industries
36 SR 150 Budd Ultrasonic Bridge
37 319 DA Alden Recorder
38 Reference Panels -For thin panels use 8 for transverse
cracks and 26 for longitudinal cracks For thick panels use
36 for transverse carcks and 41 for longitudinal cracks
40 PERSONNEL
41 The ultrasonic inspection shall be performed only by technically
qualified personnel
50 PROCEDURE
51 get up equipment per setup sheet on page 3
511 Submerge panels Place the reference panels (for the
material thickness and orientation to be inspected)
so the bridge indices toward the reference hole
Produce a C scan recording and compare with the
reference recording
5111 If the comparison is not favorable adjust the
controls as necessary until a favorable recording
is obtained
Submerge scan the weld area and record in both the longitudinal52
and transversedirections Complete one direction then change
bridge controls and complete the other direction (see page 3 amp 4)
521 Identify on the recording the starting edge of the panel
location of Ref hole and direction of scanning with
respect to the weld (Longitudinal or transverse)
53 On completion of the inspection or at the end of shift whichshy
ever occurs first rescan the reference panel (for the orientation
and thickness in progress) and compare recordings
531 When removing panels from water thoroughly dry each panel
54 Complete the data sheet for each panel inspected
541 The X dimension is measured from the edge of panel
Zero designation is the edge with the reference hole
55 After completing the data sheet roll up recordings and on
the outside of roll record the following information
A Date
B Name of Operator
C Panel Type (stringer weld LOP etc)
D Inspection Name(US EC etc)
-2 E Sequence Nomenclature
5BTRAS0NIC SET-P91 SHET Page 3
PATE O1674
TIOD ~ieseeho 32a incident angle in water
OPERATOR Lovisone
ISTRII)ENT Um 715 Refectoscope with iON plserReceivero
PLSE LENGTH -amp Mit
PULSE TnING -ampFor max Signal
OClockREJECT ampThree
S99SIPIVITY Using the ultrasonic fat crack Cal Std panel add shims -or corree thickness of panels to be inspected Alig transducer o small hol of the Stamp anA adjtist sensitivity to obtain a signal of 16inches for transverse and O4 inches for
longitudal
FRMUI4 CV 10 -MHZ
GATE START -04
GATE LEIGTH 2
TRAMSDUCEP Srd 365 25lO0 SAJ 2h061 0
17 measured P 32 tilt center of transducerWAVER PATH to top of panel
1RITE LEVEL ( Auto Reset
PART PATDIUE crack weld p anels with crown
BRIDGE CONTROLS Carriage Speed 030 Step Increment 030
SET-UP GEOMTRr
(--SCAN--gt
STEP5TEP
v-seLongitudal Tr
H-3
~-T I ipTCQn4J n1 iR i -
Xilk
-X1
E Sf IWIINT2
A+6s
QcopyA A-80 Ol
DELAY
xo
USP RNGATE A Tr
D)lELAYGATE
tF I SWEEP RAM~EGAIN AUX GAIN
~ 01poundLf [ TFRE~~ JiTI)PIOINE~~tDm H
10
IOFF
(WV PRflBL DELAY C) PRFRE4 l(J) r R1-4 QOU X)IhI) SINLE T
PANEL 8 FOR TRISVERSE WELD AREA
SCAN OF PANEL 36 FOR TRANSVEE
LD AREA SCAN OF
DEFECT 44 FROM REFERENCE END DEFECT 111 FROM REFERENCE END
REF END
REF END
ORIGINAL PAGE LS
OF PooRQUALsr
PANEL 26 REFERENCE RECORDING FOR LONGITUDAL SCAN OF WELD AREA
REFERENCE END
DEFECT MEASUREMENTS 19-- 37
PANEL 41 REFERENCE RECORDING FOR LONGITUDAL SCAN OF WELD AREA
DEFECTS 295 14
E-6
I
poundS2MEI-MNT A
APPEUDIX H
SET-UP FOR 18 WELDED FATIGUE CRACK PANELS
DATE 082975
METHOD Pitch-Catch Pulse-Echo 27 12 Incident Angle Angle Indicator + 4 120
OPERATOR Steve Mullen
INSTRUMENT UM 715 Reflectoscope with 16NPulserReceiver
PULSE LENGTH Max
PULSE TUNING MAX Signal
REJECT Weld with Crown Flush WeldJ I
SENSITIVITY 10 x 10
FREQUENCY 15 MHZ
GATE START WCroxqn Flush
4 4
GATE LENGTH 3 z 3 t-
TRANSDUCER Transmitter 464-15 MHZ SN 6391 Flat Receiver SIZ-15 MHz SN 10755 Flat
WATER PATH I From Transducer Housing to Panel
WRITE LEVEL + Auto
Reset
PART 18 Weld Panels
SET-UP GEOMETRY
11-040H
F-7
Ys -Leze-~rL
WabrbMEL
pil ERshy
2crKCath~~5bA
AZDE[T B
APPENDIX H
SET-UP FOR 12 WELDED FATIGUE CRACK PANELS
DATE 081575
METHOD Pitch-Catch Pulse-Echo 21 120 incident angle for long defect 180 incident angle for transverse scan in water
Angle Indicator Long = -2 120
Trans= -50
OPERATOR Steve Mullen
INSTRUMENT UM-715 Reflectoscope with IONPulserReceiver
PULSE LENGTH j - 300 oclock
PULSE TUNING For Max Signal
REJECT 1000 oclock
SENSITIVITY 2 x 10
FREQUENCY 5 M4Hz
GATE START 4
GATE LENGTH 3
TRANSDUCER TX-SIZ-5 SN 26963 RX-SIZ-5 SN 35521
WATER PATH 16 From Transducer Housing to the panel
WRITE LEVEL + Auto Reset
PART 12 Fatigue Crack Welded Panels
SET-UP GEOMETRY 12 Weld Panel
H-9
AED T 3
APP-Trlrl H
-DIZILL
APPENDIX i
ULTRASONIC INSPECTION FOR TIGHT FLAWS IN PANELS WITH FLUSH WELDS
10 SCOPE
11 This procedure covers ultrasonic inspection of weld panels with
flush welds
20 REFERENCES
21 Manufacturers instruction manual for the UM-715 Reflectoscope
instrument
22 Nondestructive Testing Training Handbook PI-4-4 Volumes I II
and III Ultrasonic Testing General Dynamics 1967
23 Nondestructive Testing Handbook McMasters Ronald Press 1959
Volume II Section 43-48
24 Manufacturers instruction manual for the Sonatest Flaw Detector UFD 1
30 EQUIPMENT
31 UM-715 Reflectoscope Automation Industries or Sonatest Flaw
Detector UFD-l with Recorder Interface
32 ION PalserReceiver Automation Industries (UM-715 only)
33 E-550 Transigate Automation Industries (UM-715 only)
34 SIJ-385 25 inch diameter flat 100 MHz Transducer
Automation Industries
35 SR 150 Budd Ulatrasonic Bridge
36 319 DA Alden Recorder
37 Reference Panels - For thin panels use 15 and for thick panels
use 30
40 PERSONNEL
41 The ultrasonic inspection shall be performed only by technically
qualified personnel
I-]
-2
50 PROCEDURE
51 Set up equipment per setup sheet on page 3 for UM-715 Reflectoscope
or page 4 for Sonatest equipment
511 Submerge panels Place the reference panels for the
thickness and orientation to be inspected so the bridge
steps away from the reference hole Produce a C-scan
recording and compare with the reference recording
512 If the comparison is not favorable adjust the controls
(excluding controls on the PulserReceiver unit) as
necessary until a favorable recording is obtained
52 Submerge scan the weld area and record in both the longitudinal
and transverse directions Complete one direction then change
bridge controls and complete the other direction (see set up sheets)
53 Identify on the recording the starting edge of the panel
location of reference hole and direction of scanning with respect
to the weld (longitudinal or transverse)
54 Upon completion of Lhe inspection or at the end of the shift
whichever occurs first rescan the reference panel and compare
to the reference recording
NOTE
Dry each panel thoroughly after removing from water
55 Complete the data sheet for each panel inspected
551 The dimension is measured from the edge of the panel
Zero designation is the edge with the reference hole
56 After completing the data sheet roll up recordings and on the
outside of roll record the following information
A Date
B Name of Operator
C Panel type (Flush weld)
D Inspection Name (UIS)
E Inspection Sequence7-
Ultrasonic setup sheet for 3 UM-715 Reflectoscope
DATE 07-16-74
METHOD PulseEchc 320
LovisoneOPERATOR
UM-715 ReflectoscopINSTRUMENT
PULSERRECEIVER UNIT
PULSE LENGTH Q 4Min
PULSE TUNING Q For Max sig 5 f 5l f REJECT n Ten OClock
FREQUENCY 10 MHz ____ _
SENSITIVITY Using the -5 he i Rcv -
Ultrasonic Fat
crack Cal Std
panel add shims for correct thickness of panels
to be inspected Align transducer on small hole
of the Std Panel and adjust sensitivity to obtain
a signal of 16 inches for transverse scan and 04
inches for longitudal scan (Sensitivity adjustment
made with gate turned OFF)
TRANSIGATE UNIT
GATE START 46 4
GATE LENGTH 22
WRITE LEVEL Auto Reset +
SYNC Main Pulse
TRANSDUCER SIJ 385 25100 SN 24061
WATER PATH 17 measured 32 tilt center of transducer to panel
BRIDGE CONTROLS Carriage Speed 030 Step Increment 030
PART TYPE Fatigue crack weld panels with crown and flush welds
18 and 12 thickness SET-UP GEOMETRY
STEP FLSTFP
I1~34
xi ULTRASIMNC bhT-UP Tr-CHNlqUE PROGRAH
DATE ePlo
-3 7 w]d
X10 - I
DELAY Q
110 TB v
TXE
A+B
QA
-
IDTII
SENSITIVITY
A- B
+
I
DEILAY
X10
TRANSDUCER
GATE OUT UFD I
228 WIDTHf
(OFF
XO I
01 IN
X0 I
DELAYT4
21
Xi Xl
Q DISPLAY
NORM LIN0S-P 00
GAIN AUX GAIN
REST LOG OFF
GAIN SWEEP RANE
ON OUT
FREQt - -4
O0
RX
OpIT
R REJECT DOUBLE
ORIGINAL PAGE IS 6F POOR QUAI=
Q _
IN
SINLE OFF PROBE DELAY O
TX PRF
ULTRASON1C SET-UP TEcHNtQUE PRORAM Yj Fflush wjd xi DATE -g
0 x1o
0 +
DELAY 0
Xl
0 x1O TB0 WIDTH
E SENSITIVITY 0
TX
A+B
A-B
DELAY C
TRANSDUCER
GATE OUT UFD 1
WIDTH OFF IN MM MM X0 1 XO I
copy60 xi xi
NORM LIN 0
REST LOG OFF
GAIN AUX GAIN GAIN SWEEP
OUT GANSEPRAZEk
ON OUT
OFF IN
FREQ REJECT DOUBLE U SINGLE
OFF PROBE DELAY 0 TX
PRF
RX 0
BEFEIENOE PANEL 15 I8 Flush
BFEBENCE PANEL O 12H Flush
ORIGINAL PAGE IS OF POOR QUAupy
I-6
- APPENDIX J -
EDDY CURRENT INSPECTION AND RECORDING OF
WELD CRACK ALUMINUM PANELS HAVING CROWNS
10 SCOPE
11 This procedure covers eddy current recorded inspection for
detecting cracks in welded aluminum panels having crowns
20 REFERENCES
21 Manufacturers instruction manual for the NDT Instruments Model
Vector 111 Eddy Current Instrument
22 Nondestructive Testing Training Handbooks PI-4-5 Volumes I and
II Eddy Current Testing General Dynamics 1967
23 Nondestructive Testing Handbook McMasters Ronald Press 1959
Volume II Sections 35-41
30 EQUIPMENT
31 NDT Instruments Vector III Eddy Current Instrument
311 100 KHz Probe for Vector ill Core diameter 0063 inch
NOTE This is a single core helically wound coil
32 NDE Reference Panel 4 Flaw Length 155 inch
33 SR 150 Budd Ultrasonic Bridge
34 319DA Alden Recorder
35 Special Probe Scanning Fixture for Weld Crack Panels (2)
36 Special Eddy Current Recorder Controller Circuit
37 Dual DC Power Supply 0-25V 0-1A (Hp Model 6227B or equivalent)
40 PROCEDURE
41 Connect 100KHz Probe to Vector I1 instrument
42 Turn instrument power on and set Sensitivity Course control to
position 1
43 Check batteries by operating power switch to BAT position
These shobl be checked every two hours of use
431 Meer should read above 70
44 Connect Recorder Controller circuit
441 Set Power Supply for +16 volts and -16 volts
45 Set up weld panel scanning support fixture shims and spacers
as follows
451 If longitudinal welded panels are being scanned clamp an
end plate of the same thickness as welded panel to the
support fixture Align the end scan plate using one
weld panel so that the scan probe will be centered over J-1
the entire length of the weld bead Secure the weld
panel with weightsclamps as required Verify that the
scan probe holder is making sufficient contact with the
weld bead such that the scan probe springs are unrestrained
by limiting devices Secure an end scan plate at opposite
end of weld panel Verify that scan probe holder has
sufficient clearance for scan-travel One logitidinal
welded panel will be scanned at a time
452 If transverse welded panels are being scanned set up
as in 451 except that two weld panels are placed side
by side so that the weld beads are aligned with the scan
probe
453 Use shims or clamps to provide smooth scan probe transition
between weld panel and end plates
46 Set Vector 111 controls as follows
x 1897
R 4040
Sensitivity Course 8 Fine 5
47 Set the Recorder controls for scanning as follows
Index Step Increment 020 inch
Carriage Speed 029
Scan Limits set to scan 1 inches beyond the panel edges
Bridge OFF and bridge mechanically clamped
48 Manually move the scan probe over panel inspection region to
determine background level as close as possible to the Recorder
Controller switching point (meter indication for switching point
is 40 for positive-going indication of a flaw 42 for negativeshy
going indication)
49 Initiate the RecorderScan function
410 Vary the Vector 11 Scale control as required to locate flaws
Use the Carriage Scan switch on the Recorder control panel to
stop scan for resetting of background level
411 Repeat step 48 (background level determination) and 49 for the
second panel if located in the support fixture Annotate recordings
with panel identification data
J-2
412 Evaluate recordings for flaws and enter panel and flaw location
on applicable data sheet Observe correct orientation of
reference hole edge of each panel when measuring location of
a flaw
50 PERSONNEL
51 Only qualified personnel shall perform inspections
60 SAFETY
61 Operation should be in accordance with StandardSafety Procedure
used in operating any electrical device
J-3
AMENDMENT A
- APPENDIX -
NOTE
This amendment covers changes
in procedure from raster scan
recording to analog-recording
442 Connect Autoscaler circuit to Vector ill and set back panel
switch to AUTO
48 Initiate the Recorder Scan function Set the Autoscaler switch
to RESET
49 Adjust the Vector 1il Scale control to set the recorder display for
no flaw or surface noise indications
410 Set the Autoscaler switch to RUN
411 When all of the signatures of the panels are indicated (all white
display) stop the recorder Use the carriage Scan switch on the
Recorder Control Panel to stop scan
412 Annotate recordings with panelsidethicknessreference edge
identification data
413 Evaluate recordings for flaws and enter panel and flaw location
on applicable data sheet Observe correct orientation of reference
hole edge of each panel when measuring location of a flaw
J-4
-APPENDIXK -
EDDY CURRENT INSPECTION AND C-SCAN RECORDING OF
FLUSH WELD ALUMINUM PANELS
10 SCOPE
11 This procedure covers eddy current C-scan inspection
detecting fatigue cracks in Aluminum panels with flush welds
20 REFERENCES
21 Manufacturers instruction manualfor the NDT instruments
Model Vector Ill Eddy Current Instrument
22 Nondestructive Testing Training Handbooks P1-4-5
Volumes I and I1 Eddy Current Testing General Dynamics 1967
23 Nondestructive Testing Handbook MeMasters Ronald Press 1959
Volume II Sections 35-41
30 EQUIPMENT
31 NDT Instruments Vector 111 Eddy Current Instrument
311 100 KHz probe for Vector 111 Core diameter 0063 inch
NOTE This is a single cor helically wound coil
32 SR 150 Budd Ultrasonic Bridge
33 319DA Alden Recorder
34 Special Probe Scanning Fixture for Weld Panels (5)
35 Dual DC Power Supply 0-25V 0-1A (HP Model 6227B or equivalent)
36 NDE reference panel no 41
37 Special Eddy Current Recorder Controller circuit
40 PROCEDURE
41 Connect 100 KIz probe to Vector 111 instrument
2 Turn instrument power on and set SENSITIVITY COURSE control
to position 1
43 Check batteries by operating power switch to BAT position
Batteries should be checked every two hours of use Meter
should read above 70
44 Connect C-scanRecorder Controller Circuit
441 Set Power Supply for +16 volts and -16 volts
442 Set US EC switch to EC
443 Set OP AMP switch to OPR
444 Set RUNRESET switch to RESET
45 Set up weld panel scanning support fixture as follows
451 Clamp an end scan plate of the same thickness as the
weld panel to the support fixture One weld panel
will be scanned at a time
452 Align the end scan plate using one weld panel so that
the scan probe will be centered over the entire length of
the weld bead
453 Use shims or clamps to provide smooth scan transition
between weld panel and end plates
454 Verify that scan probe is making sufficient contact with
panel
455 Secure the weld panel with weights or clamps as required
456 Secure an end scan plate at opposite end of weld panel
46 Set Vector III controls as follows
X 1895
R 4040
SENSITIVITY COURSE 8 FINE 4
MANUALAUTO switch to MAN
47 Set the Recorder controls for scanning as follows
Index Step Increment 020 inch
CarriageSpeed 029
Scan Limits set to scan i inches beyond the panel edge
Bridge BRIDGE
48 Manually position the scan probe over the center of the weld
49 Manually scan the panel to locate an area of the weld that conshy
tains no flaws (decrease in meter reading)
With the probe at this location adjust the Vector ill Scale conshy
trol to obtain a meter indication of 10 (meter indication for
switching point is 25)
410 Set Bridge switch to OFF and locate probe just off the edge
of the weld
411 Set the Bridge switch to BRIDGE
412 Initiate the RecorderScan function
413 Annotate recordings with panel reference edge and serial
number data
41 1 Evaluate recordings for flaws and enter panei flaw location
and length data on applicable data sheet Observe correct
orientation of reference hole edge of each panel when measuring
location of flaws
50 PERSONNL
51 Only qualified personnel shall perform inspection
6o SAFETY
61 Operation should be in accordance with Standard Safety Procedure
used in operating any electrical device
X-5


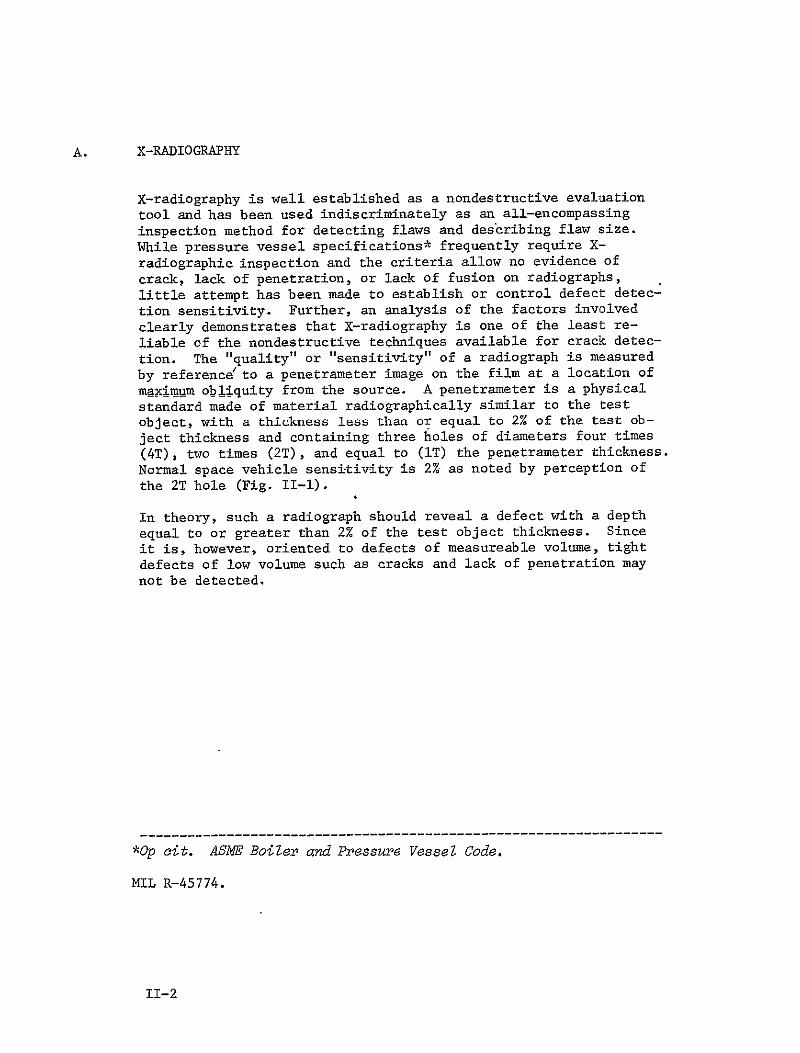

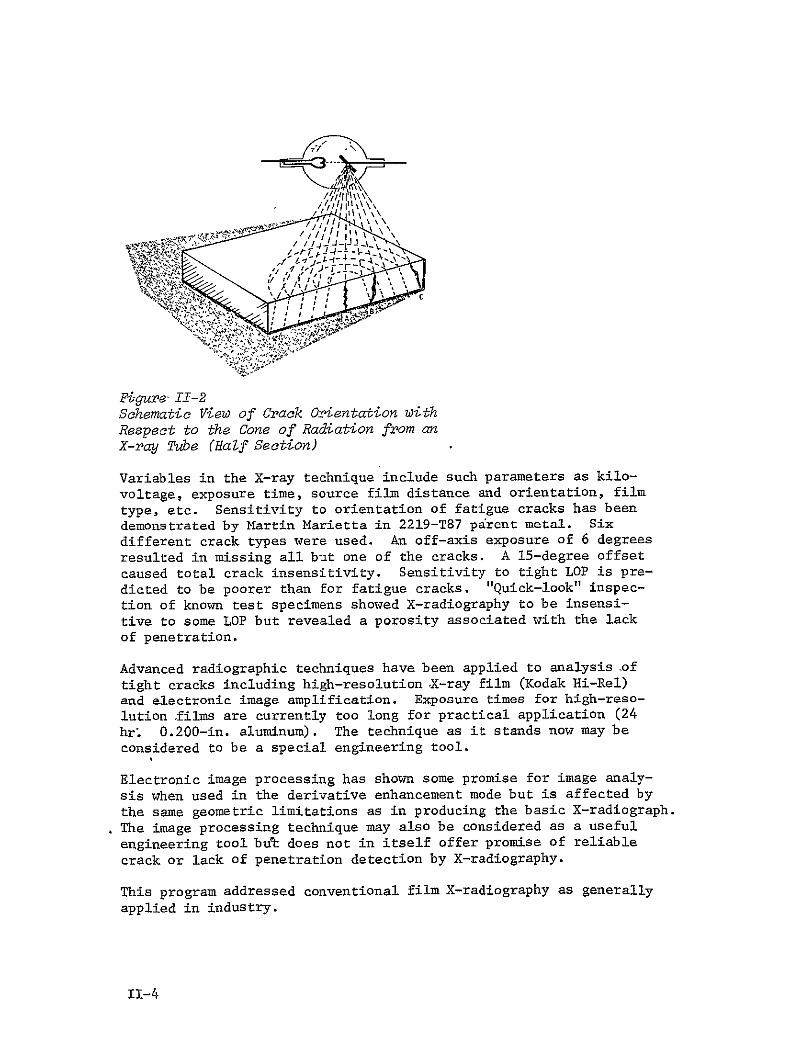
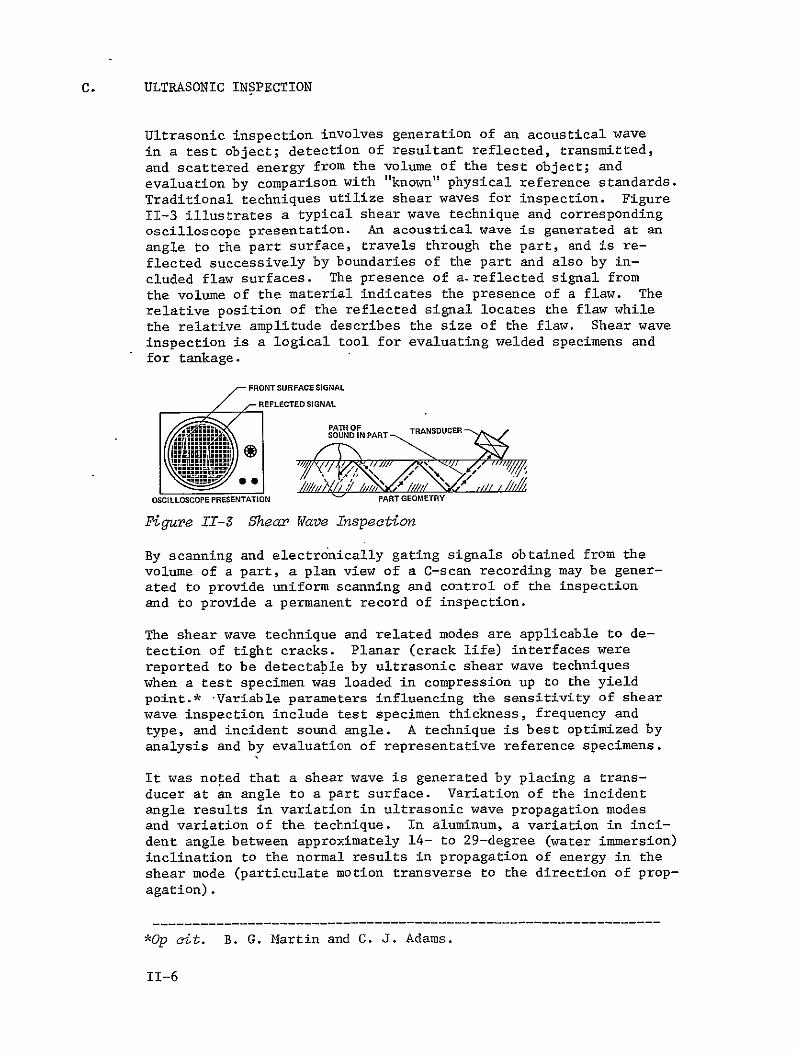

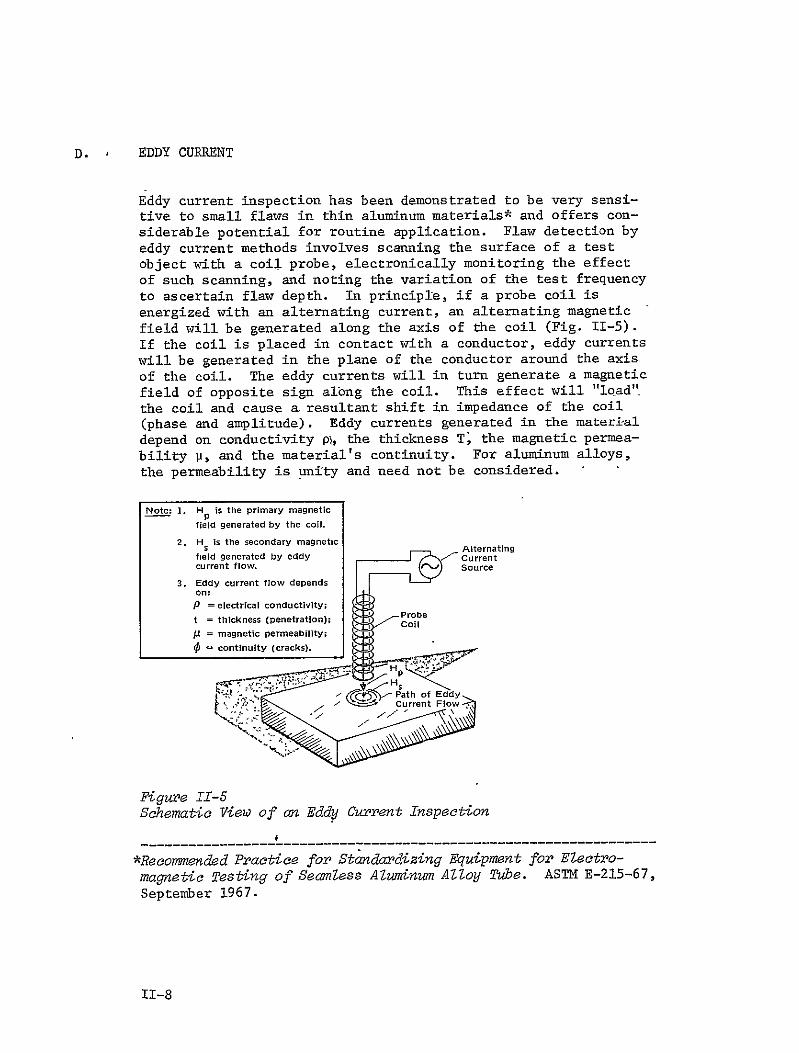


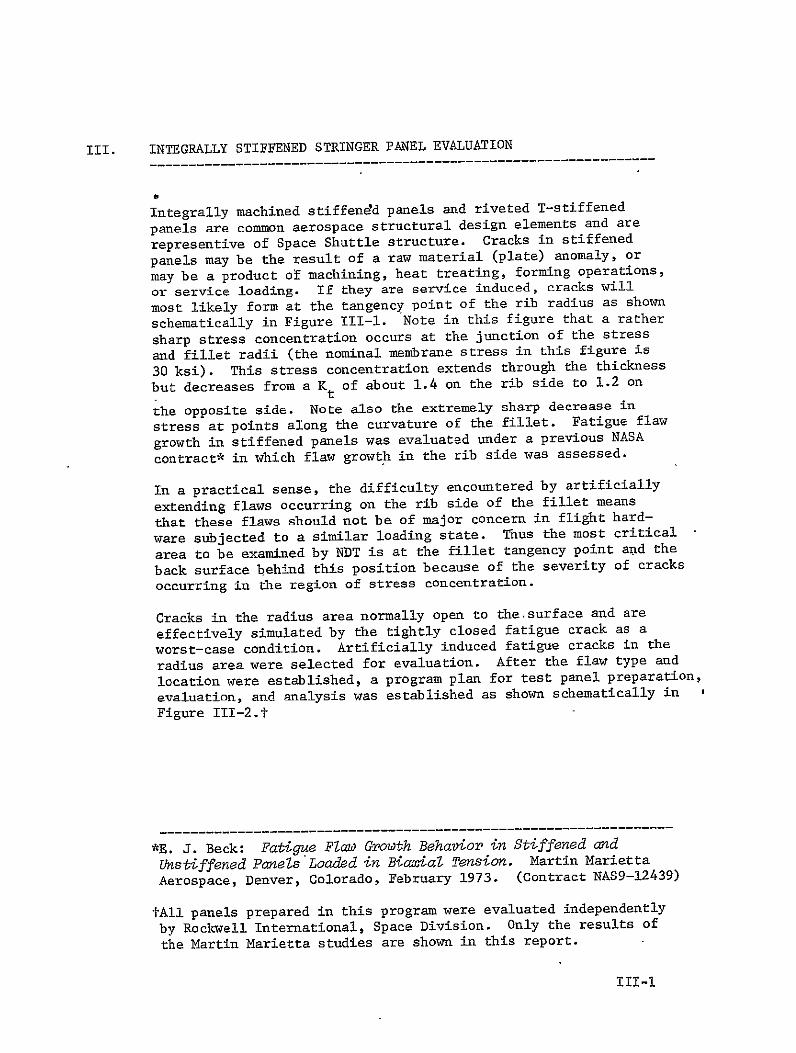

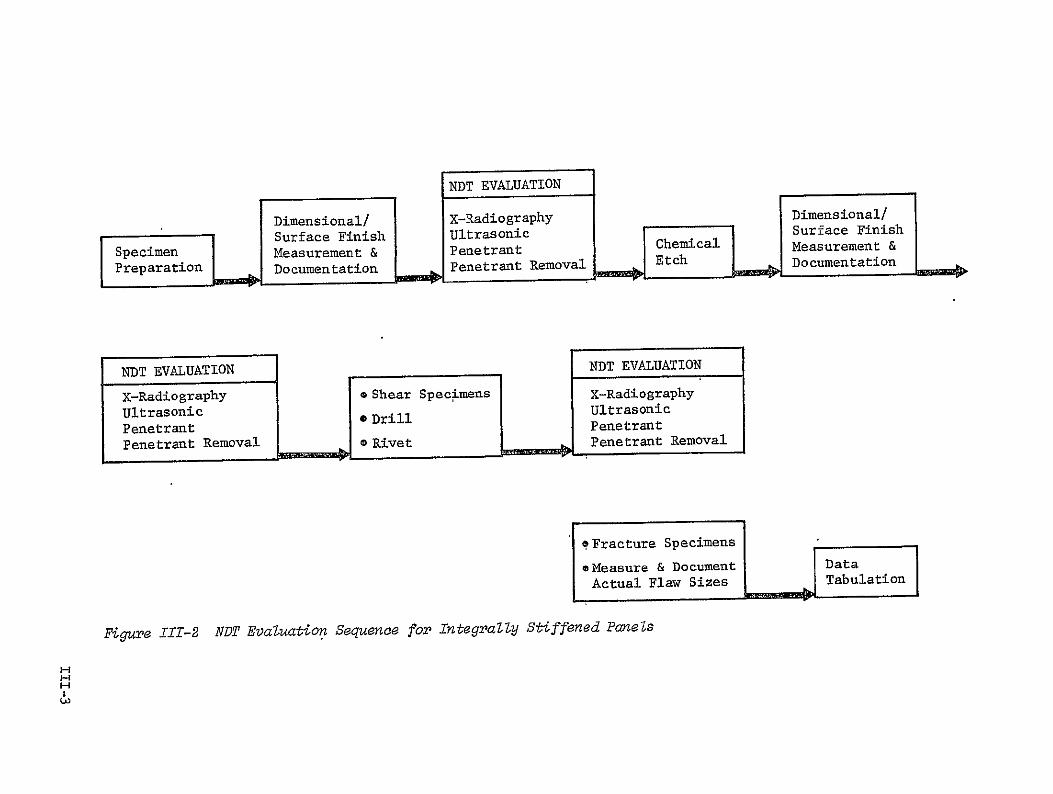
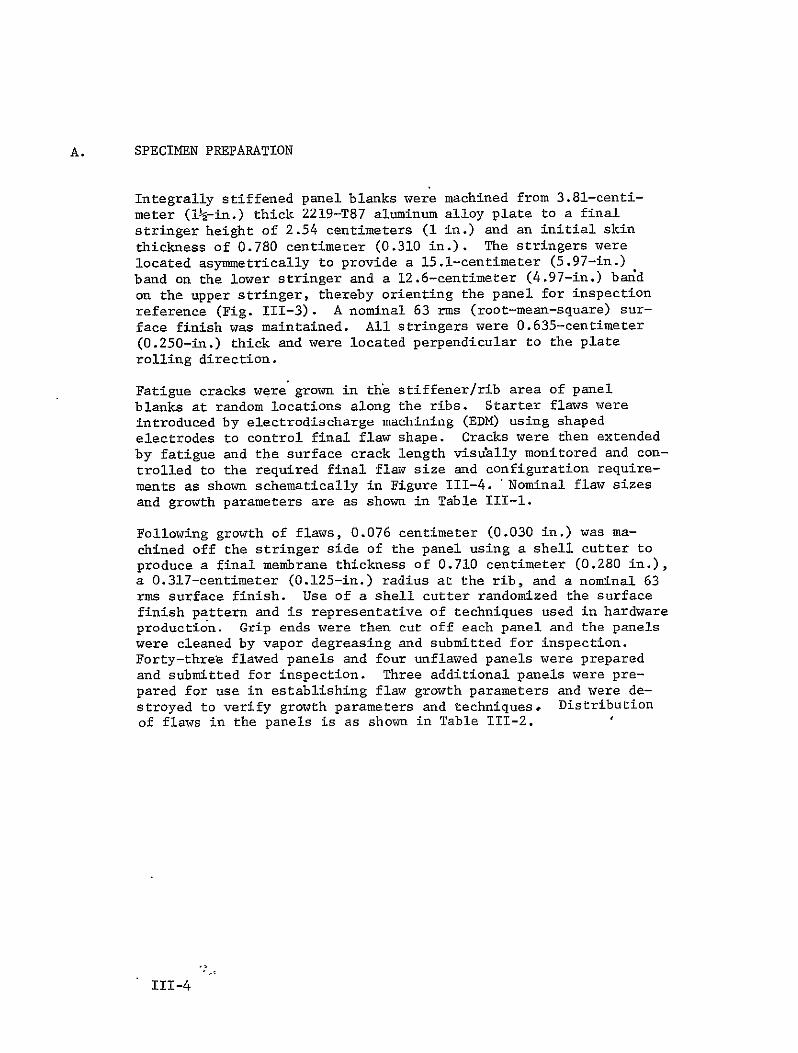


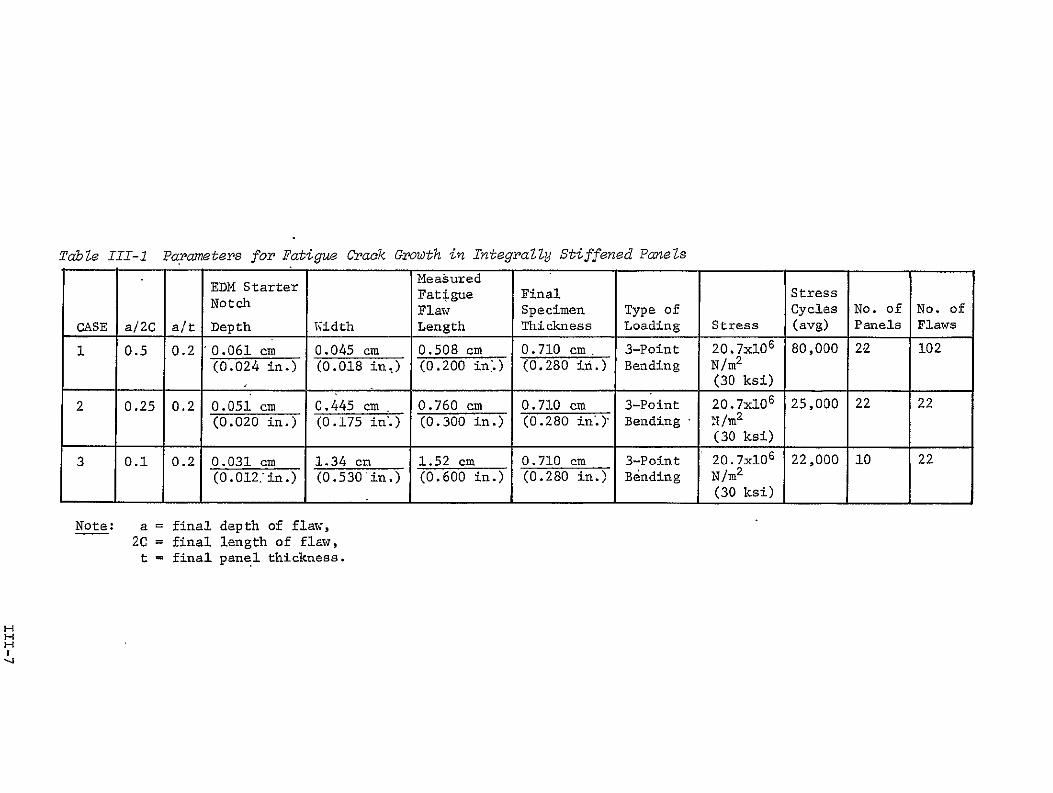
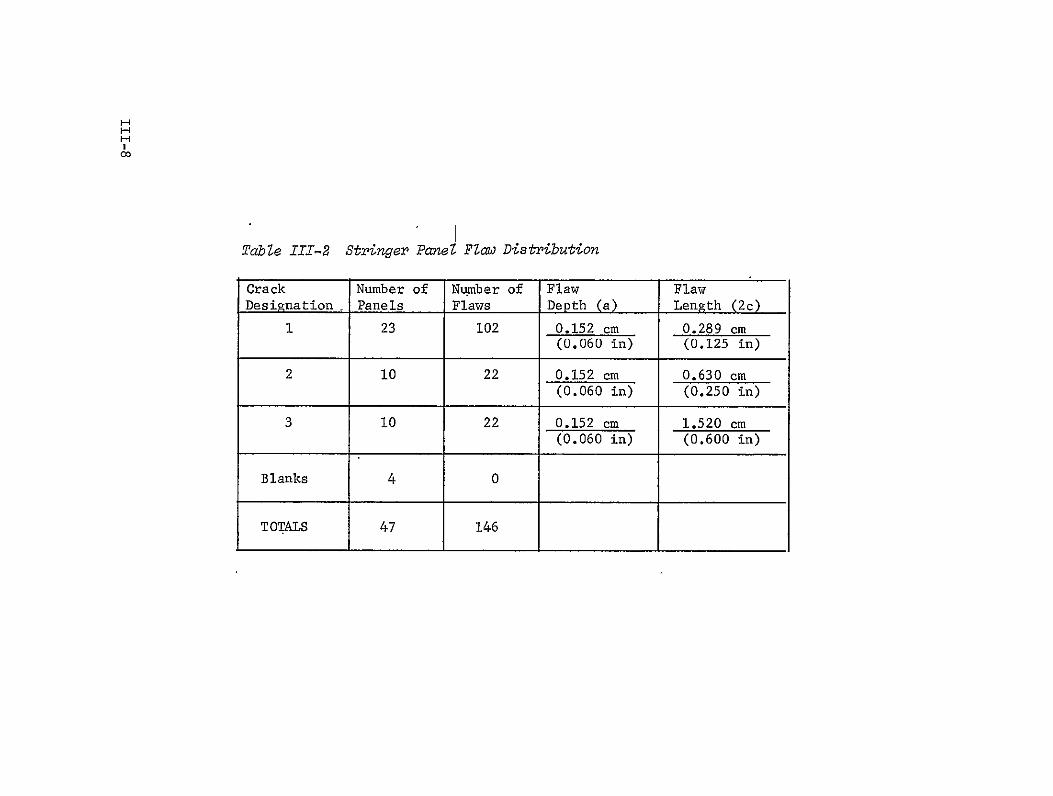


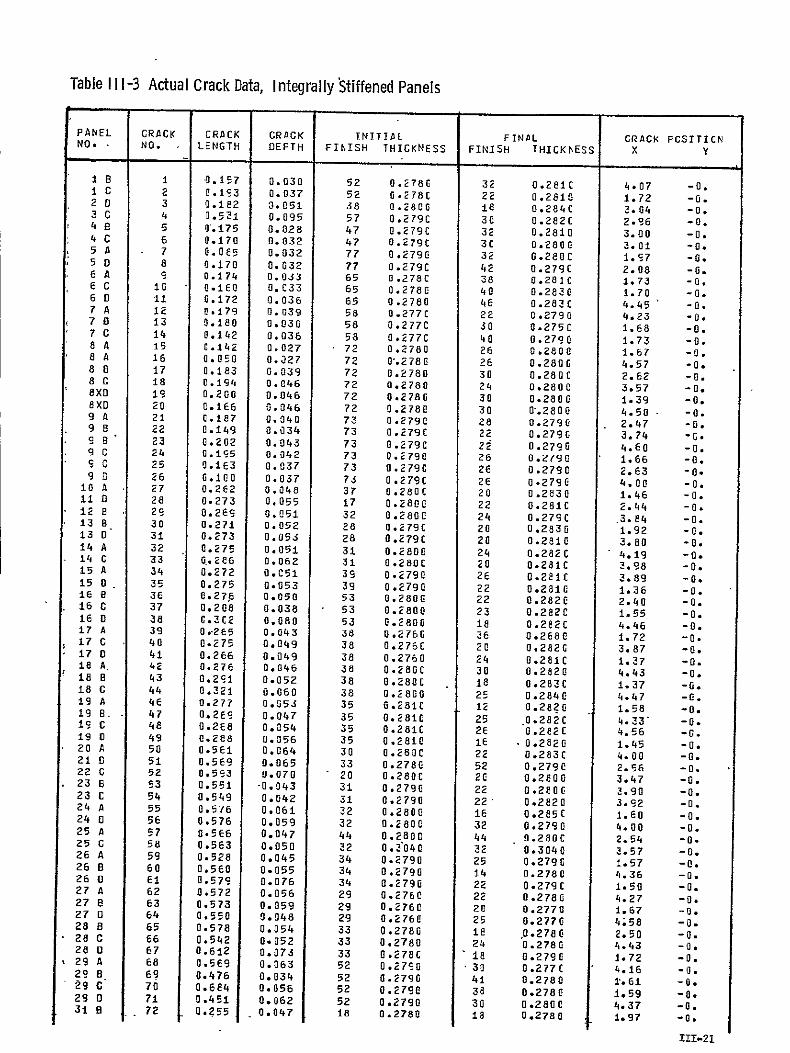


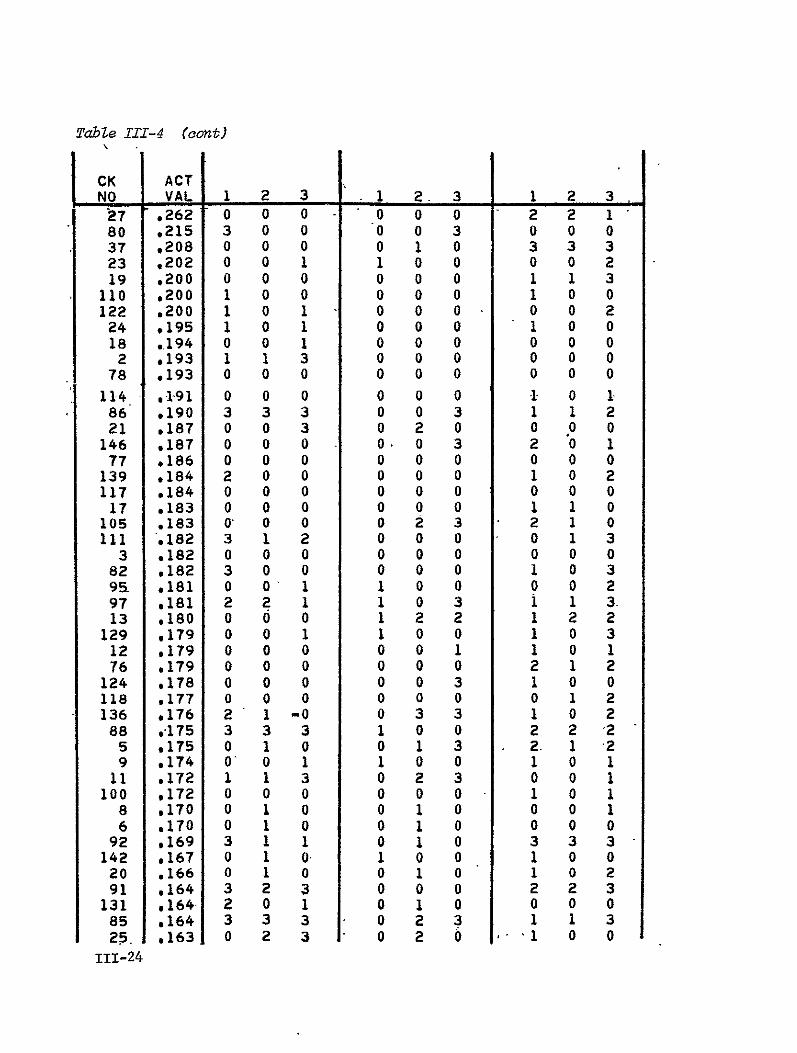


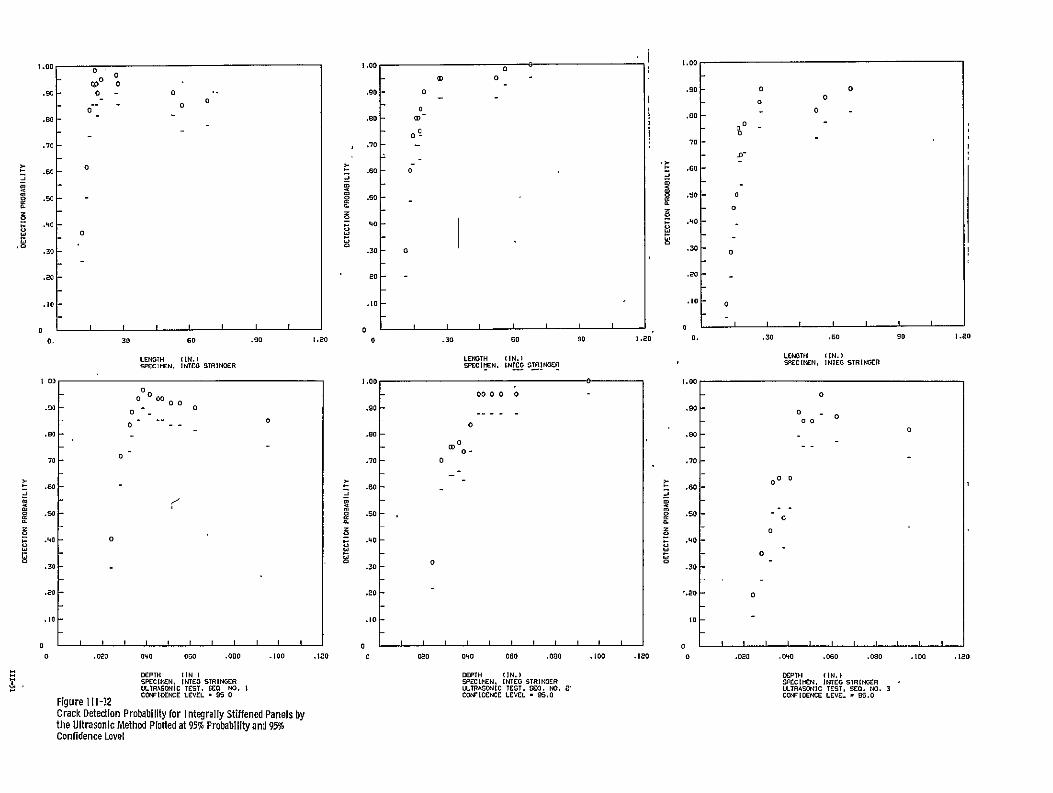
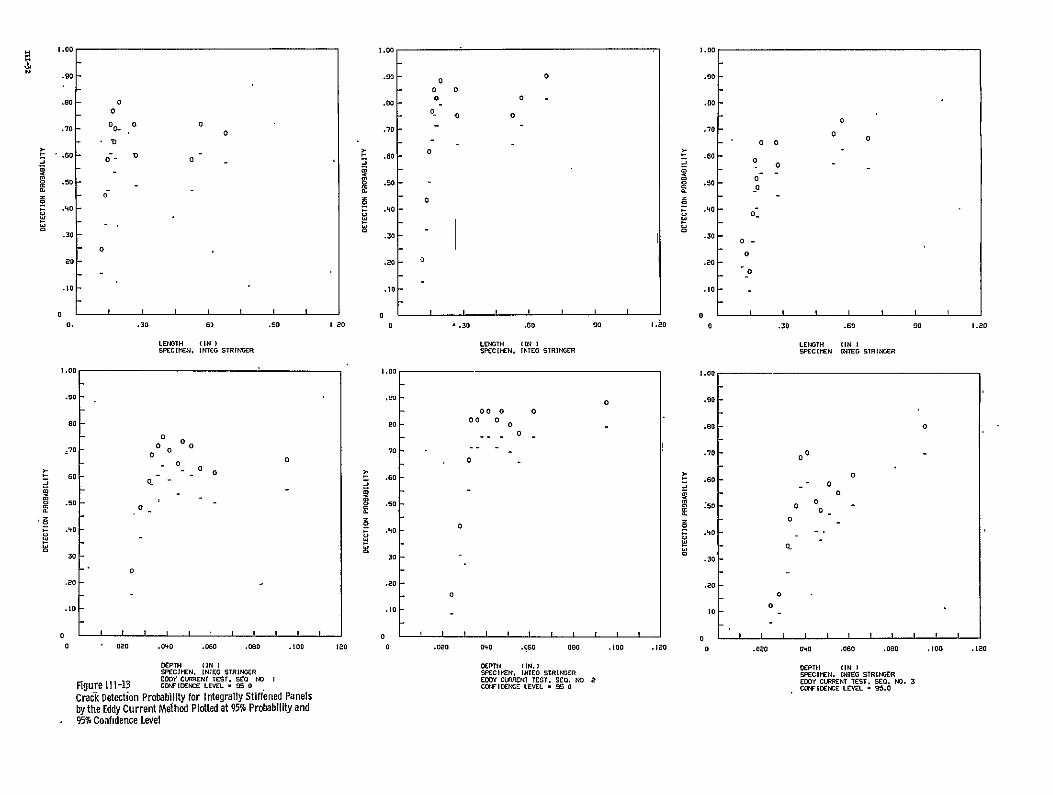


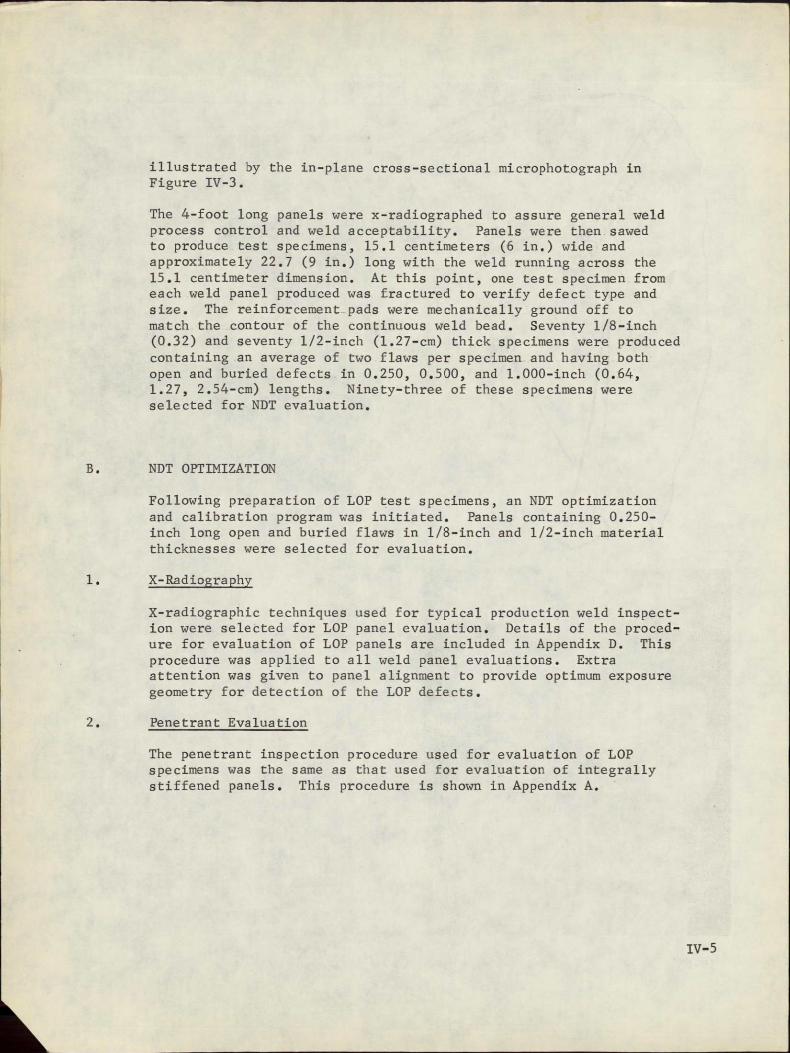


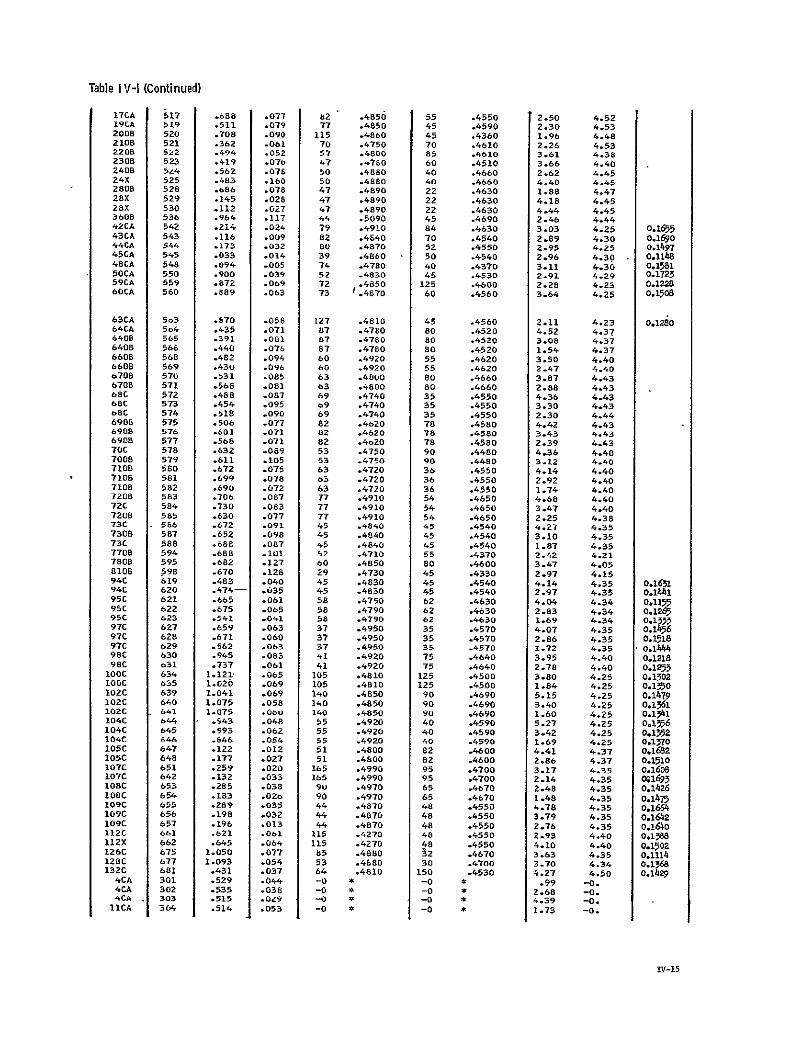


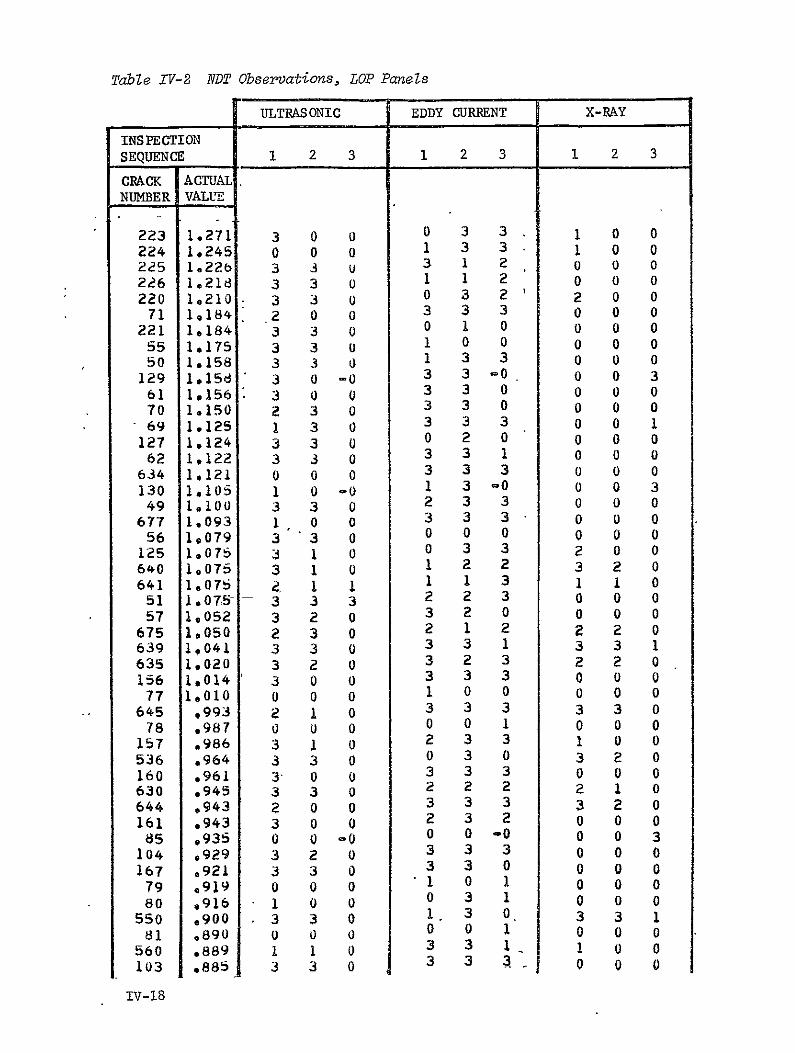
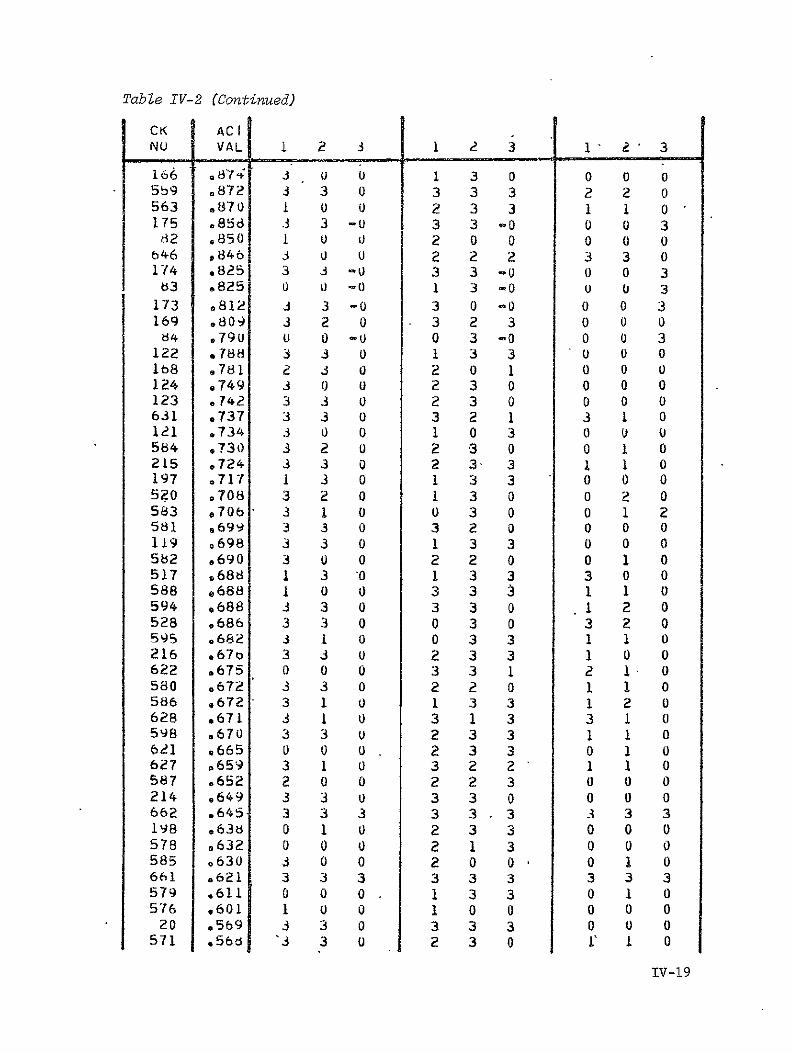

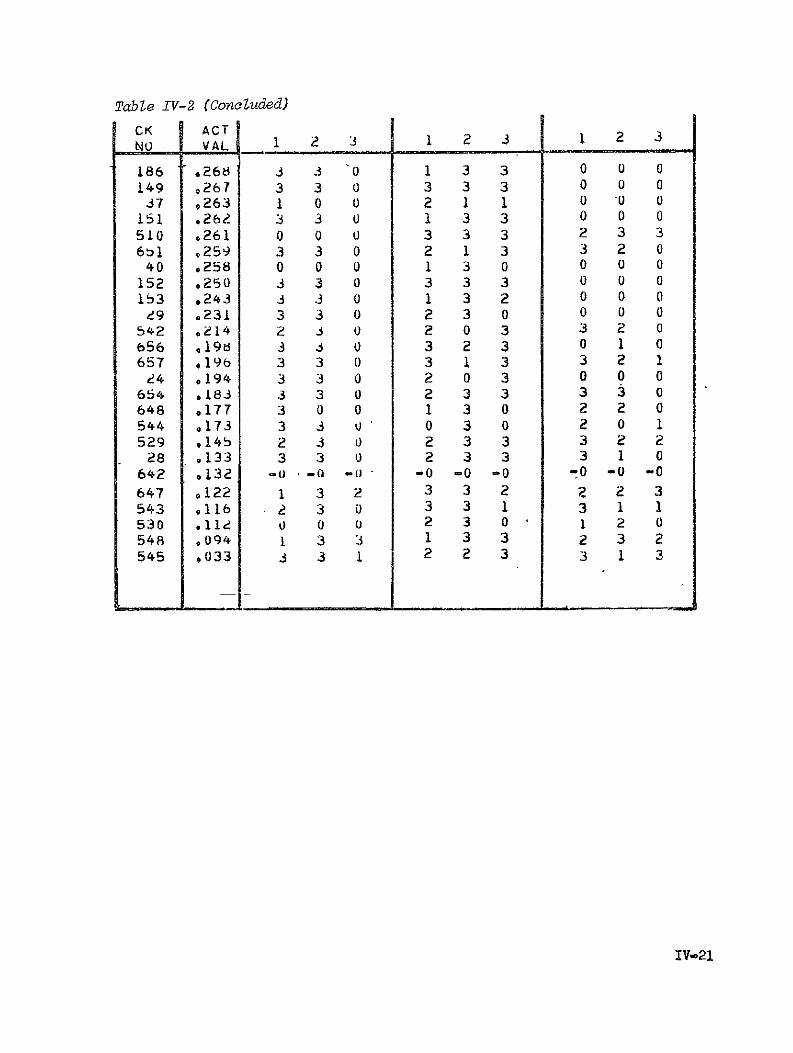

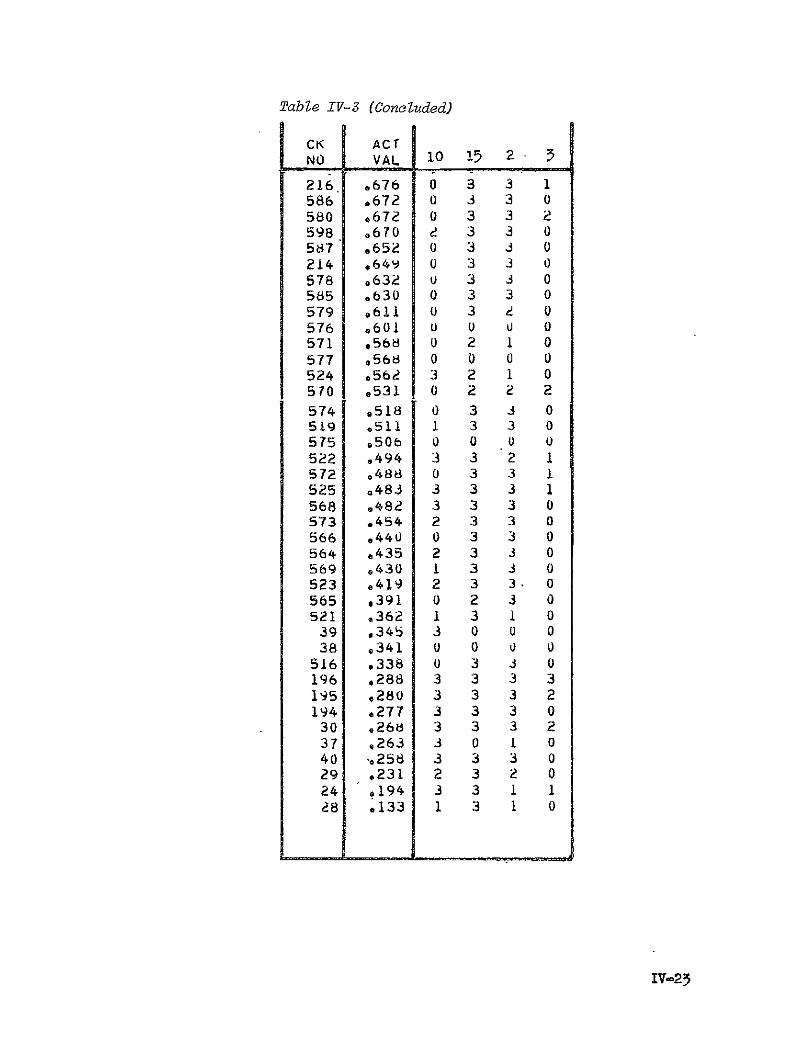


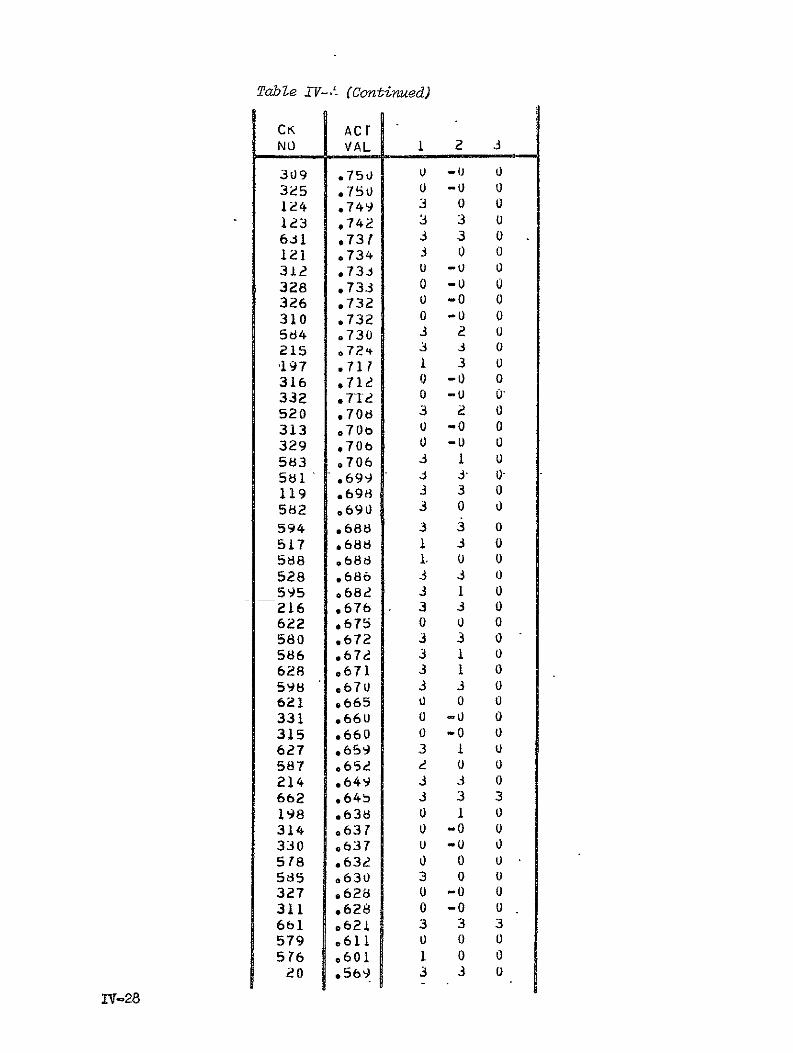


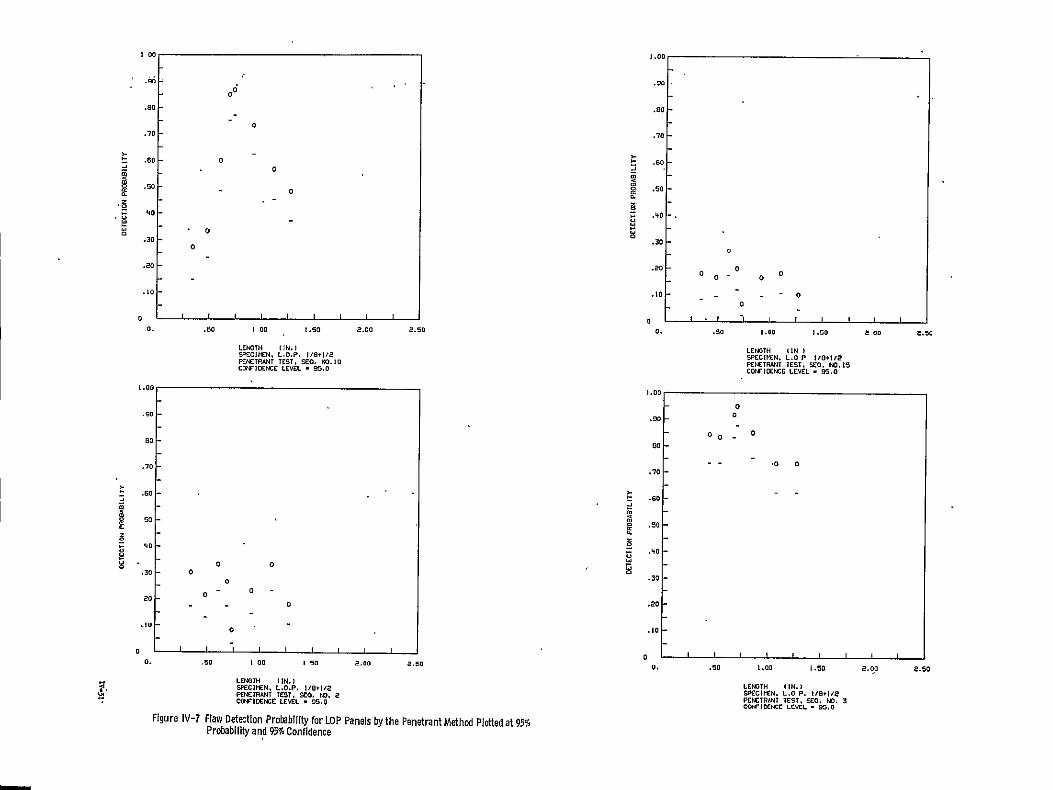
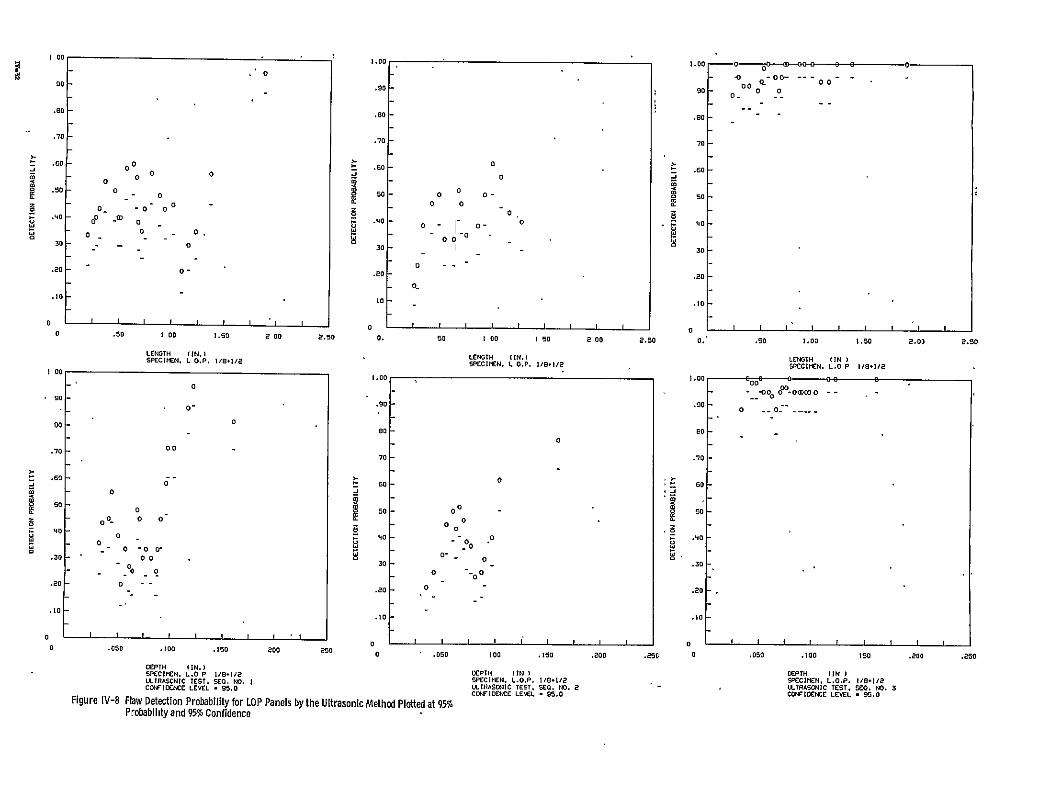


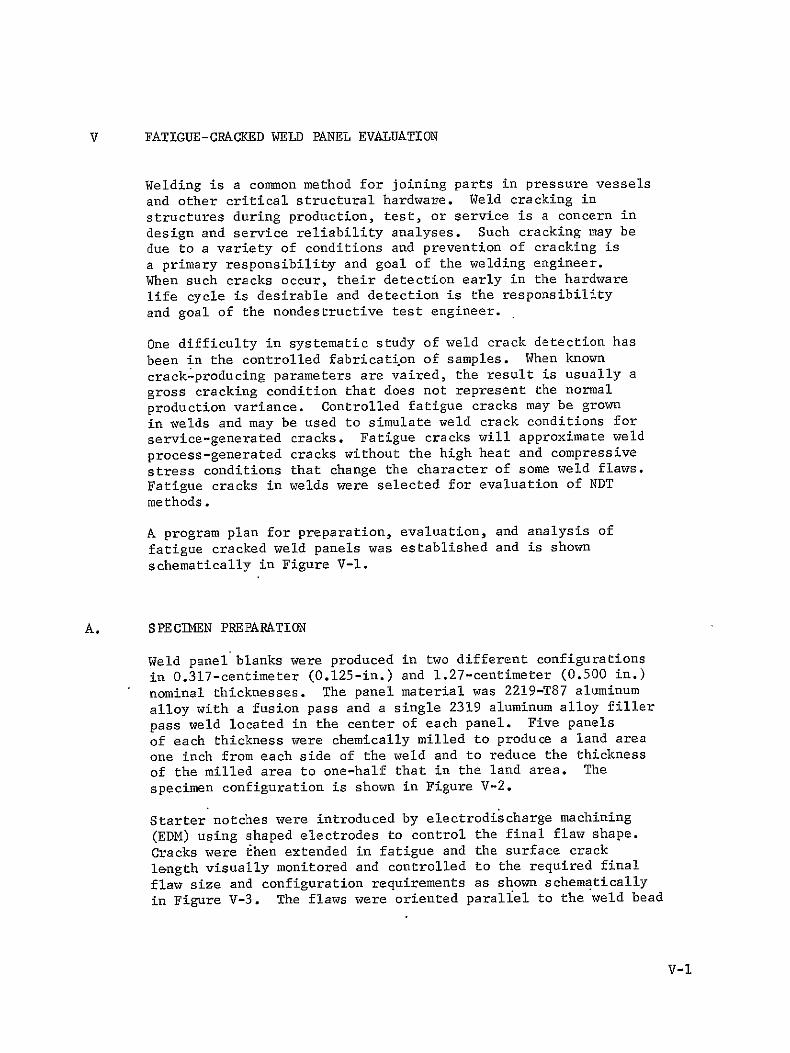


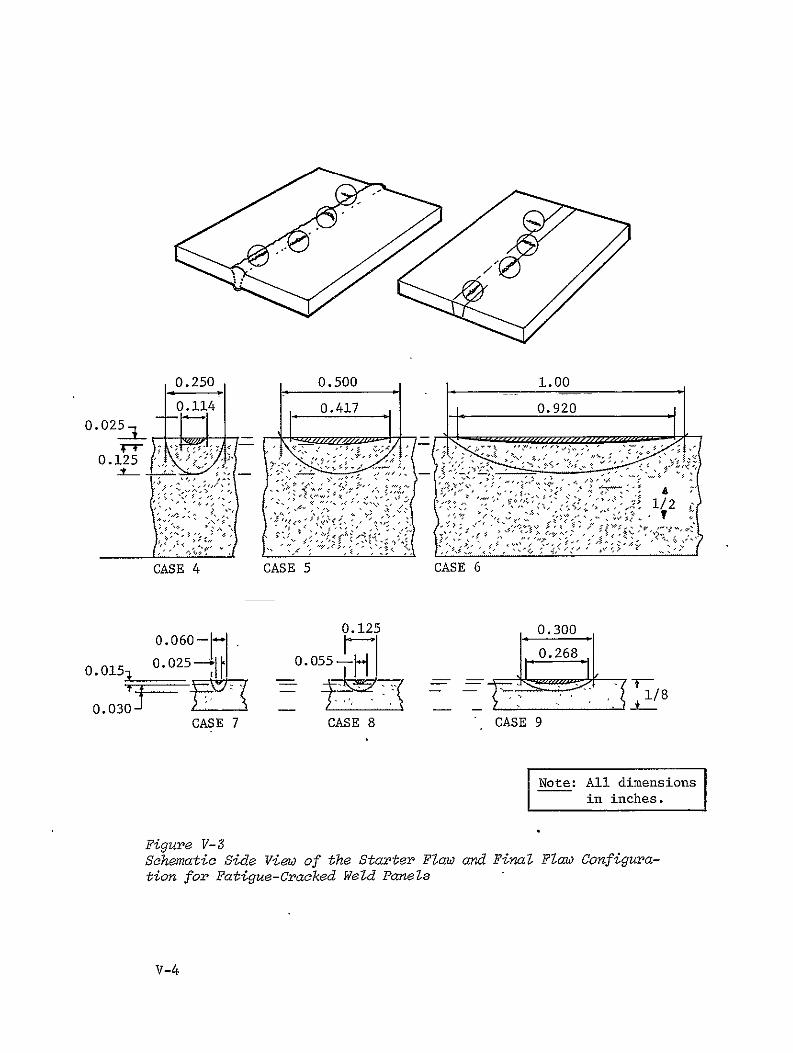


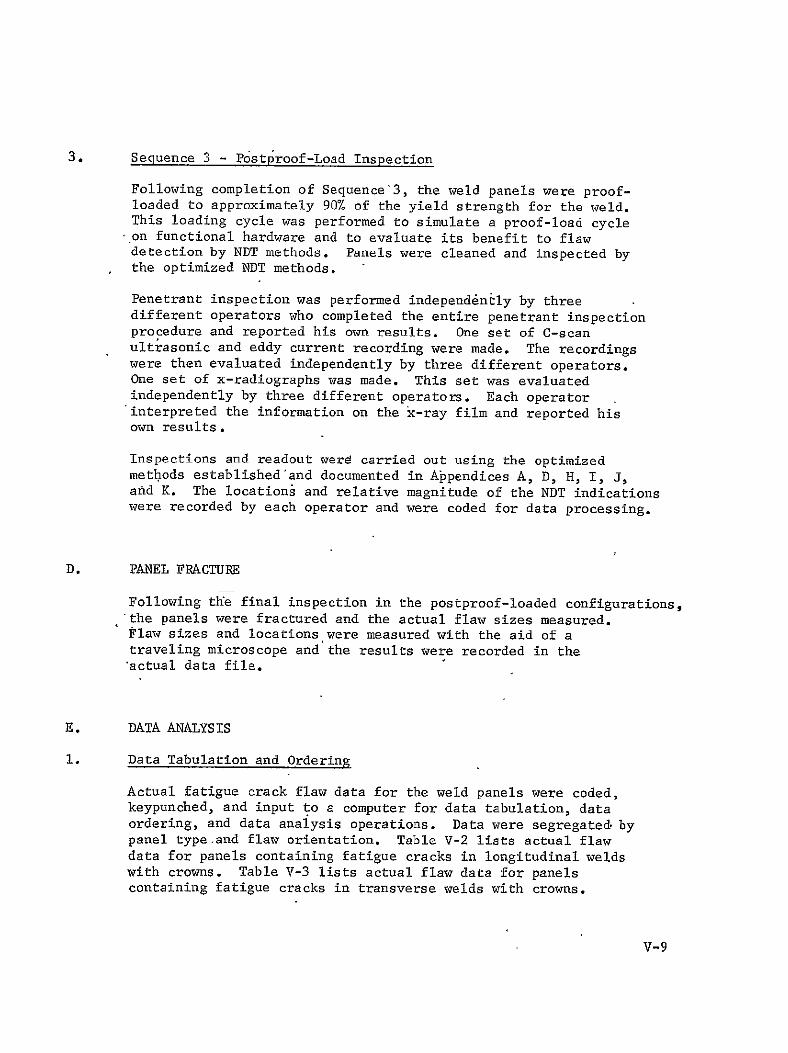


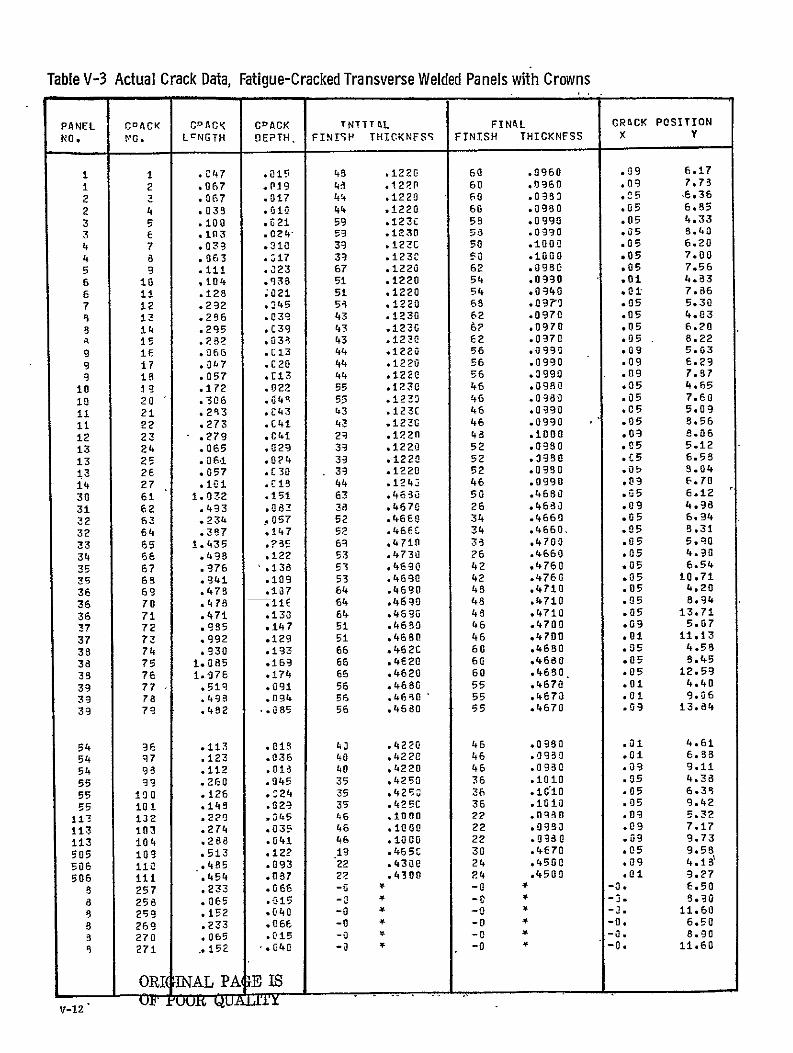


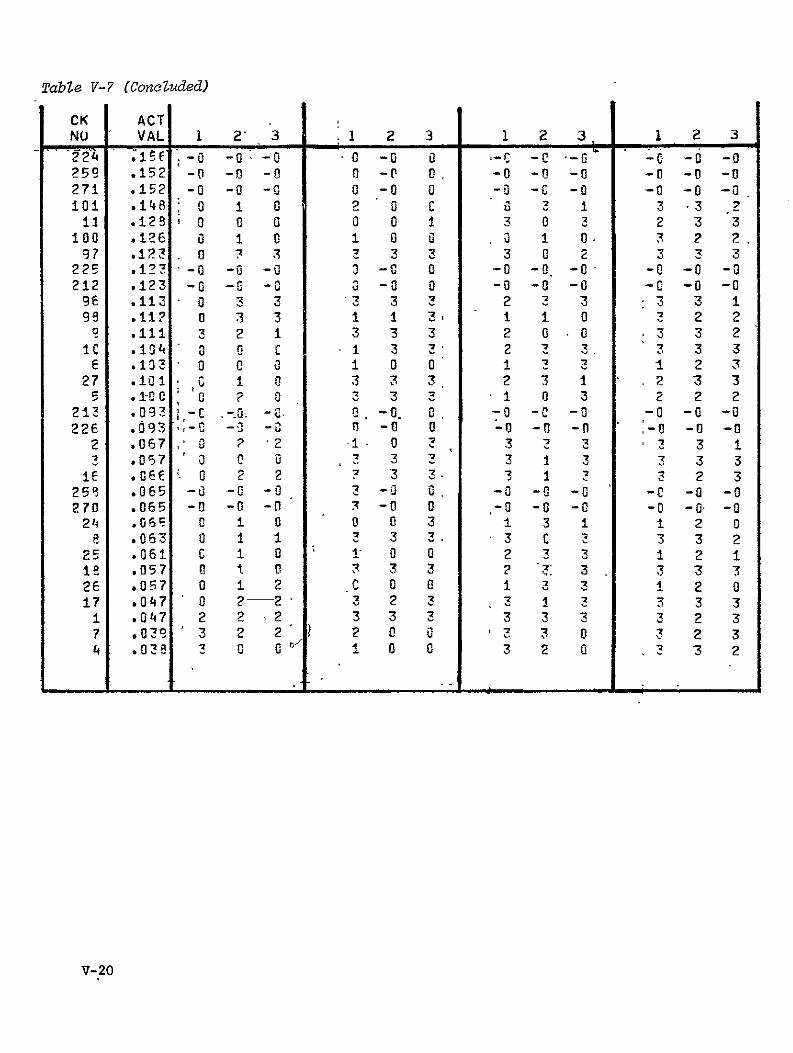
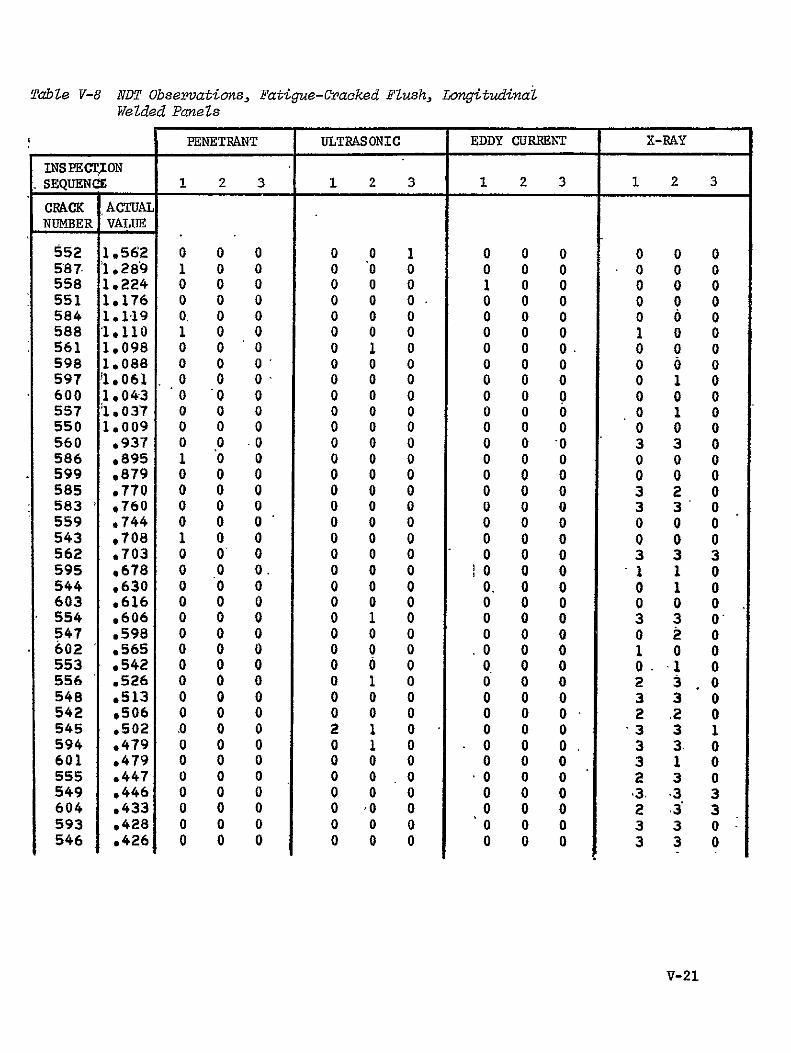


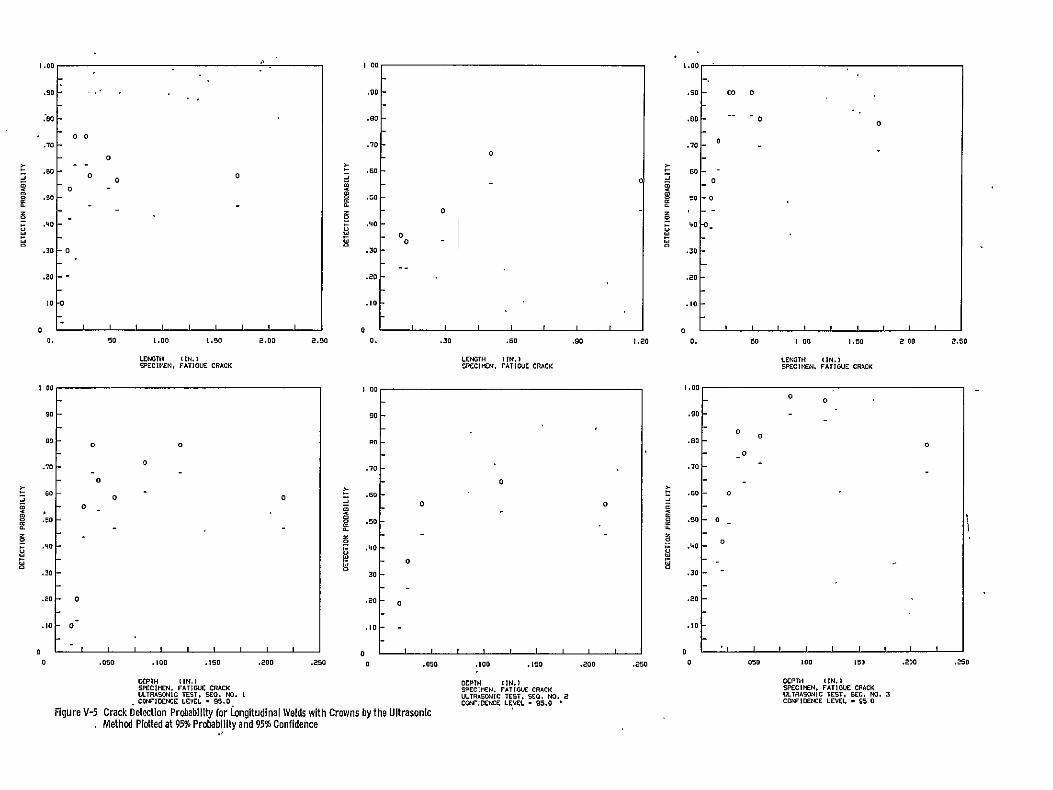

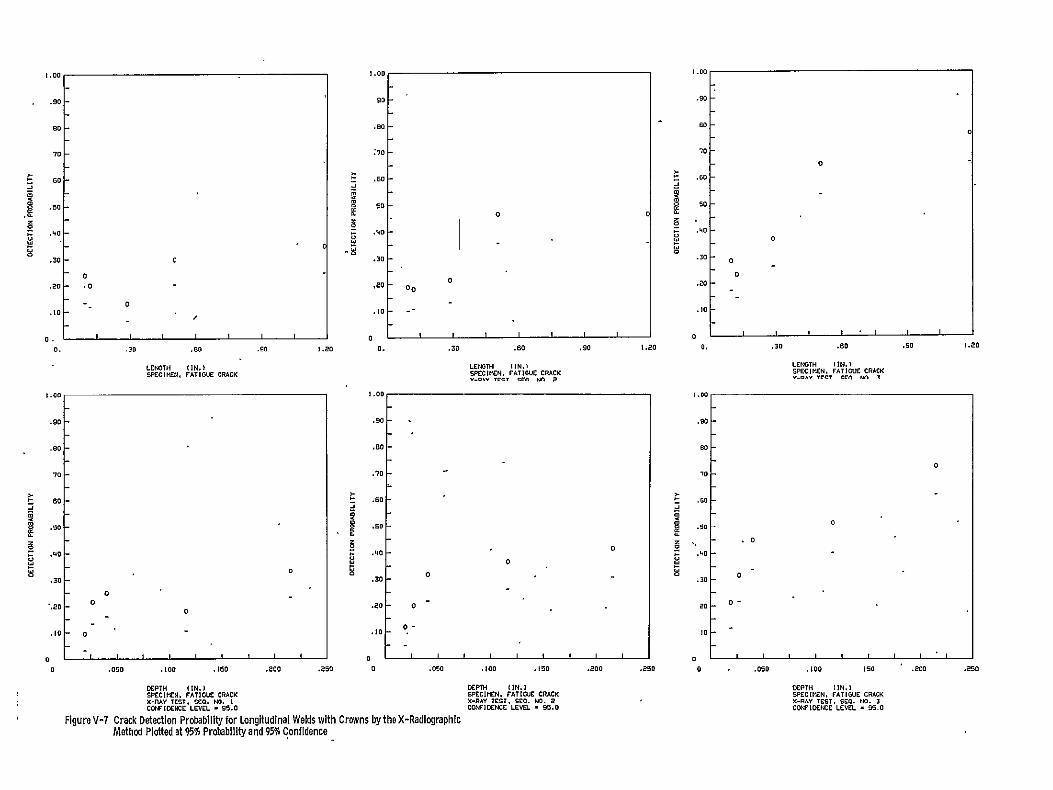
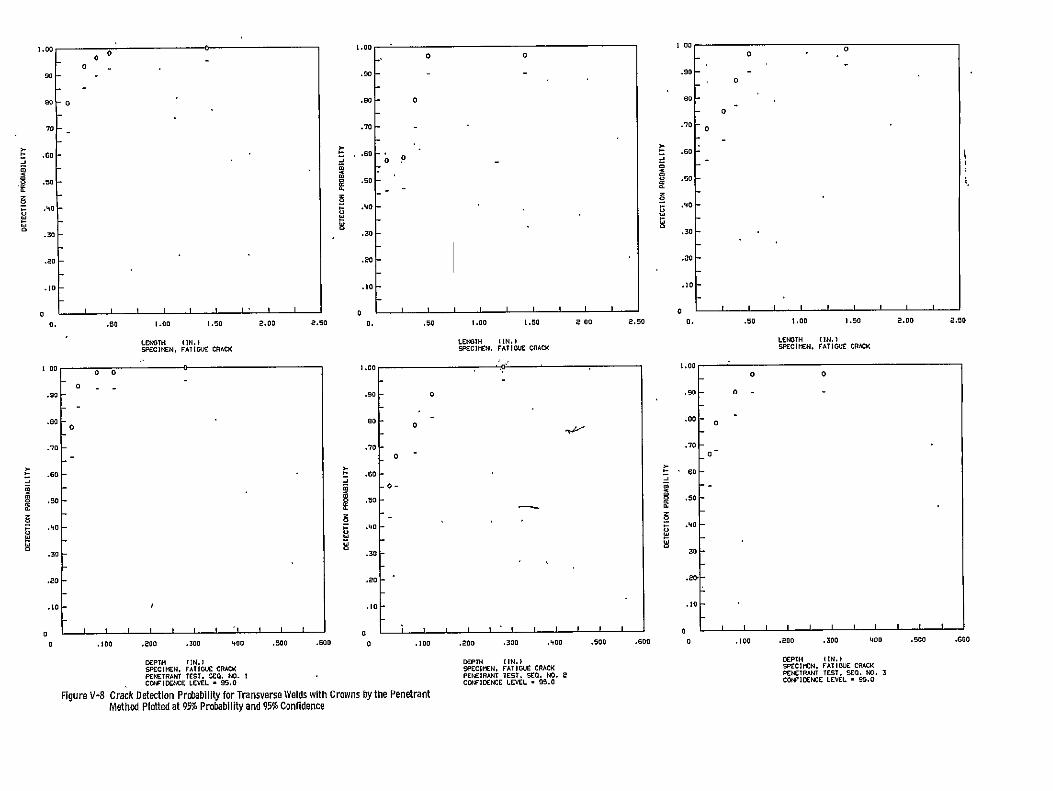


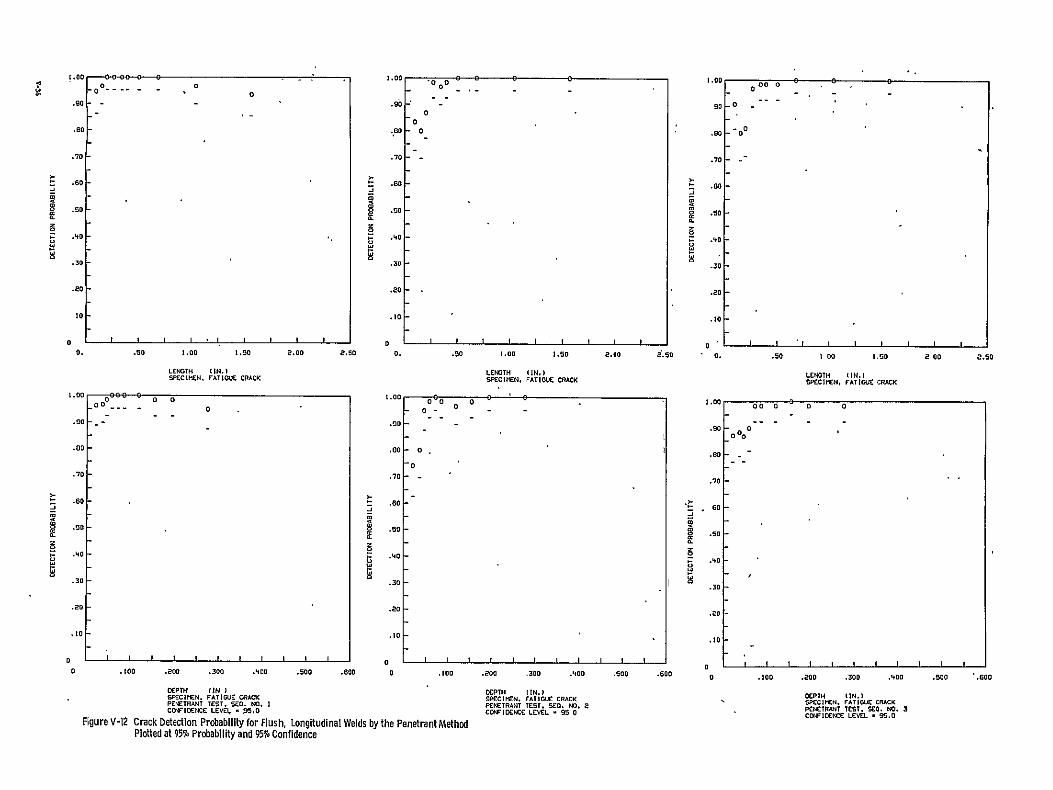

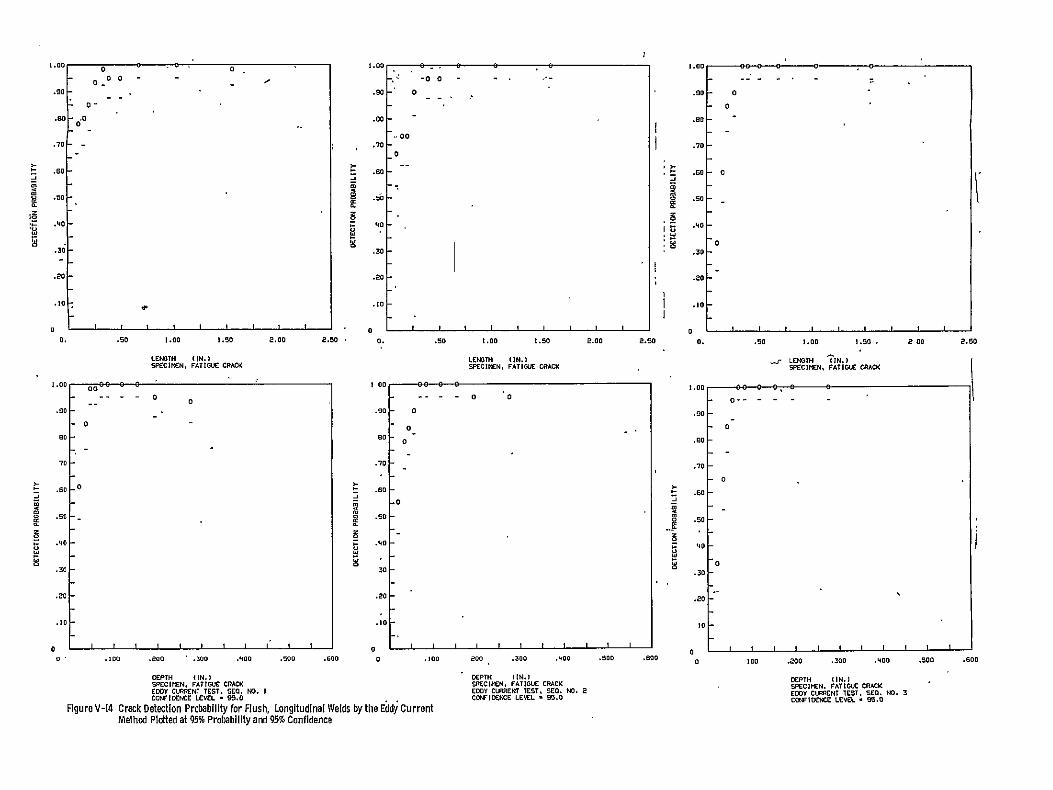

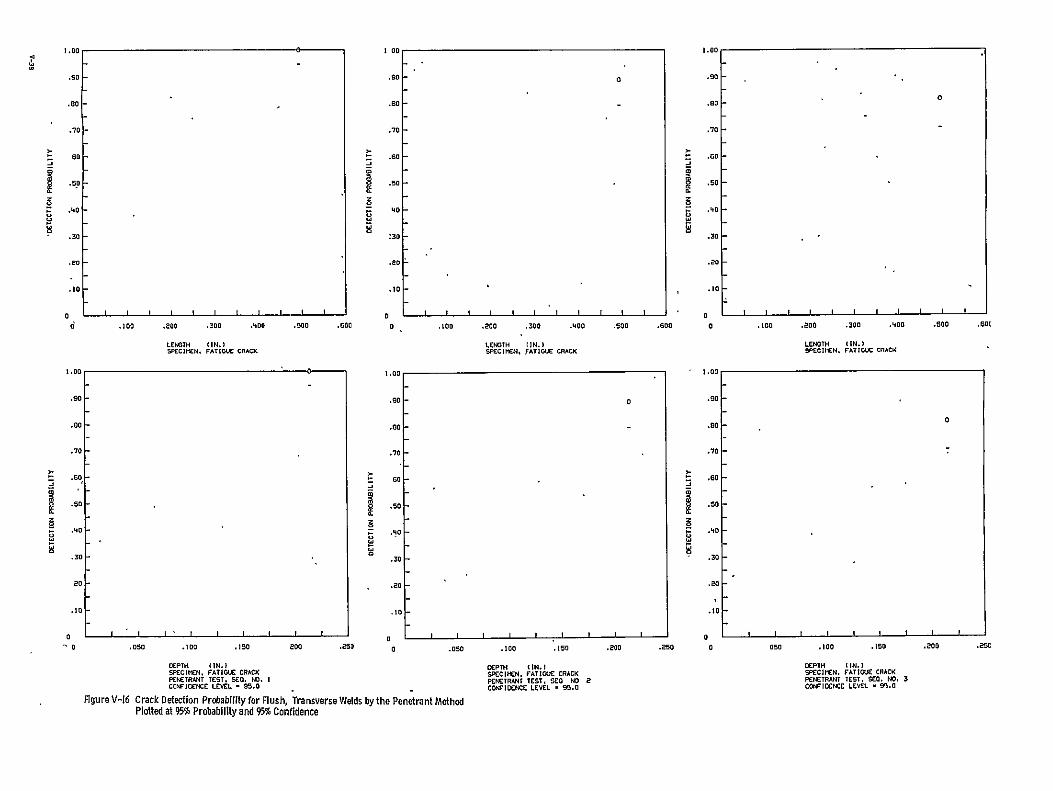
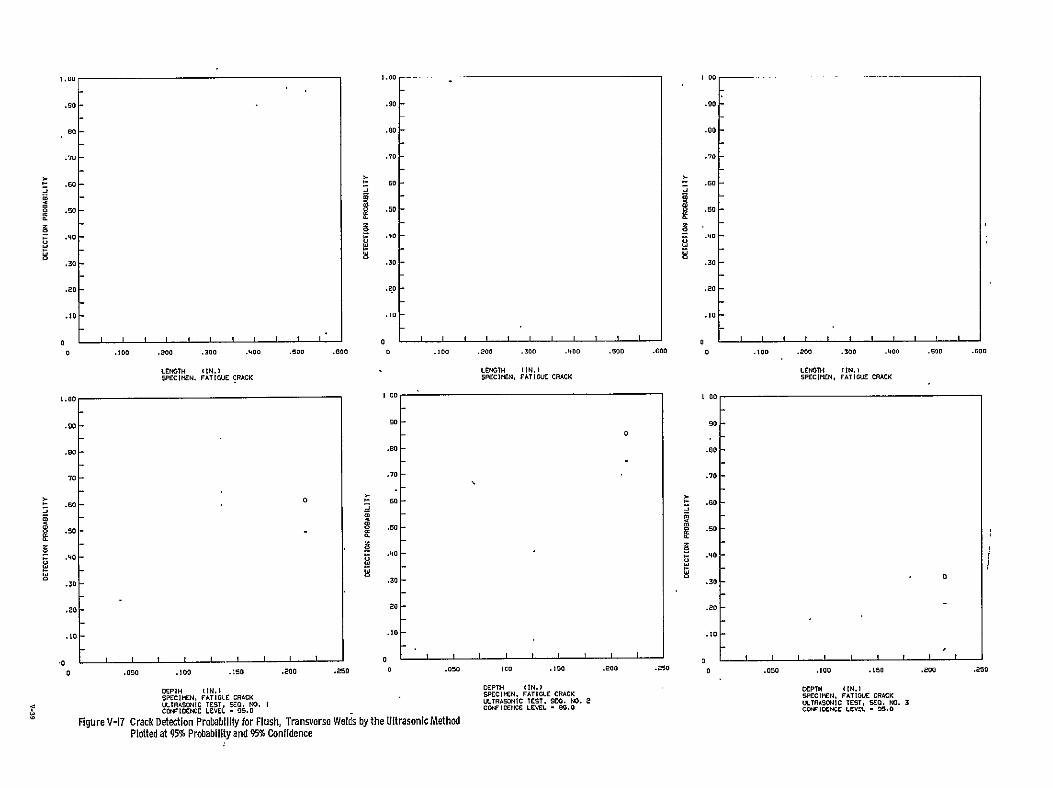

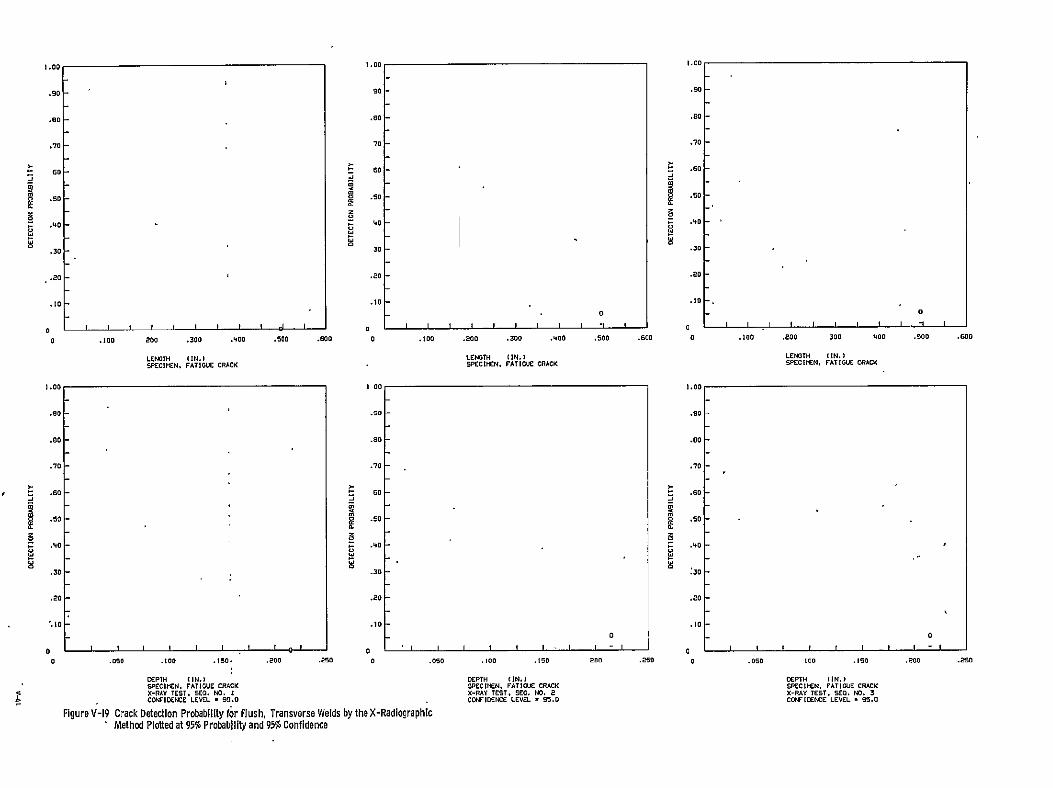
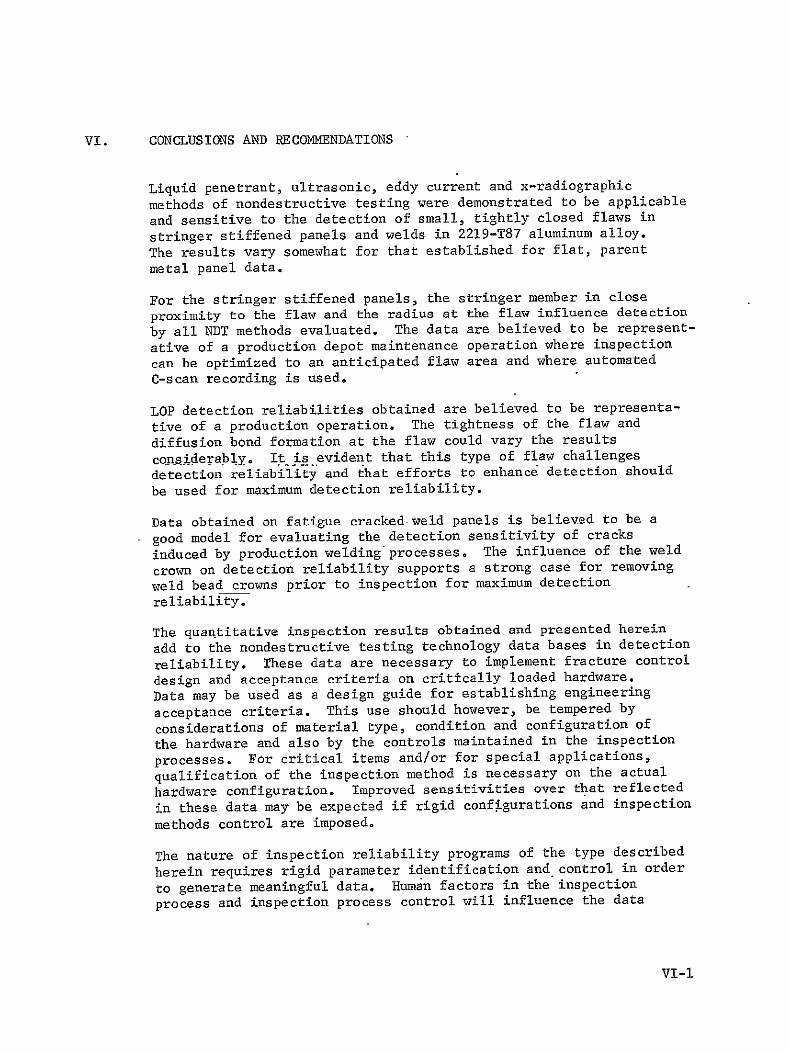

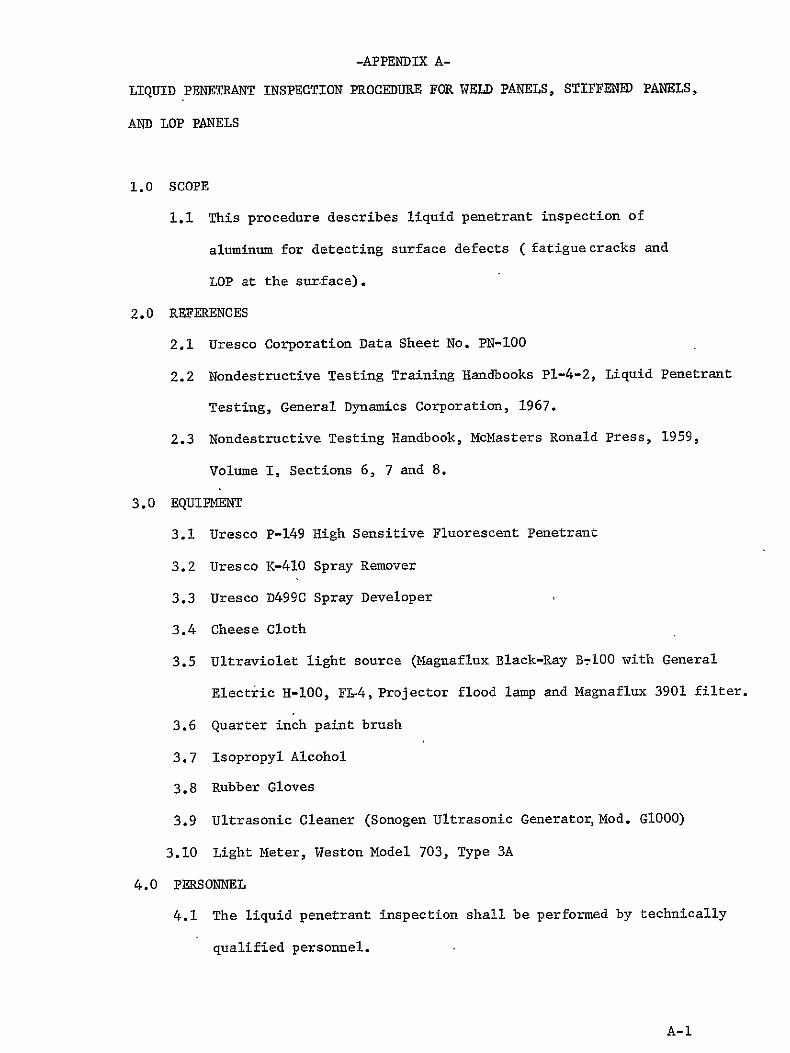

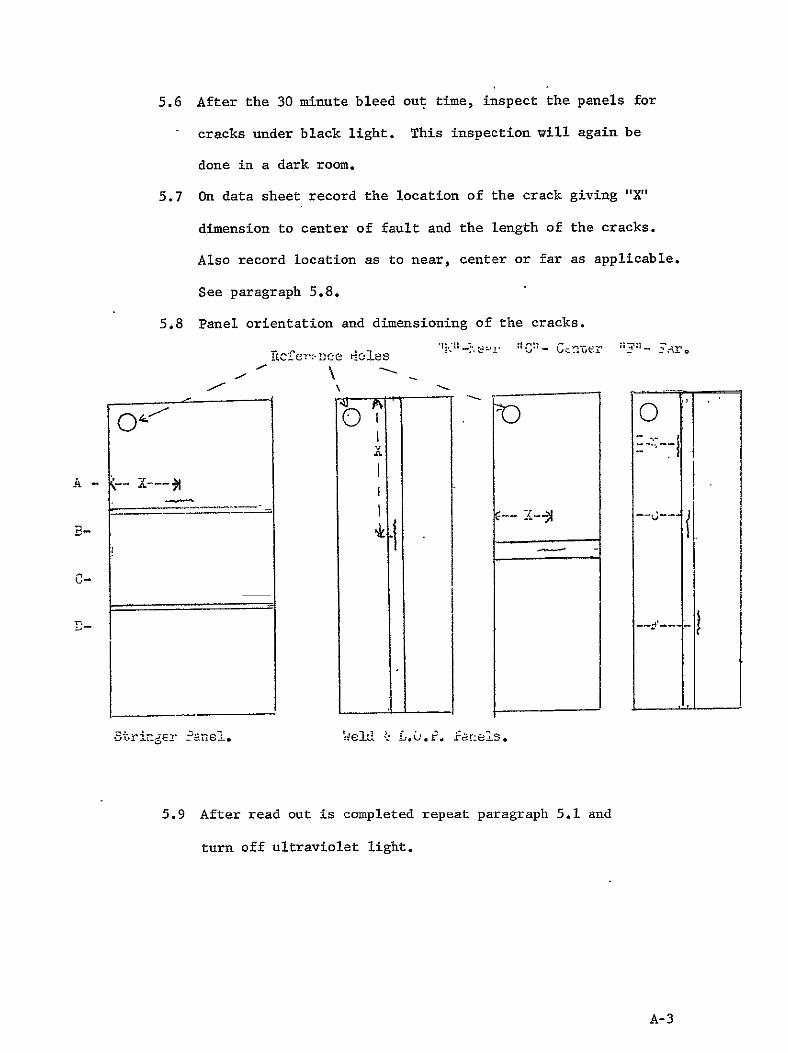

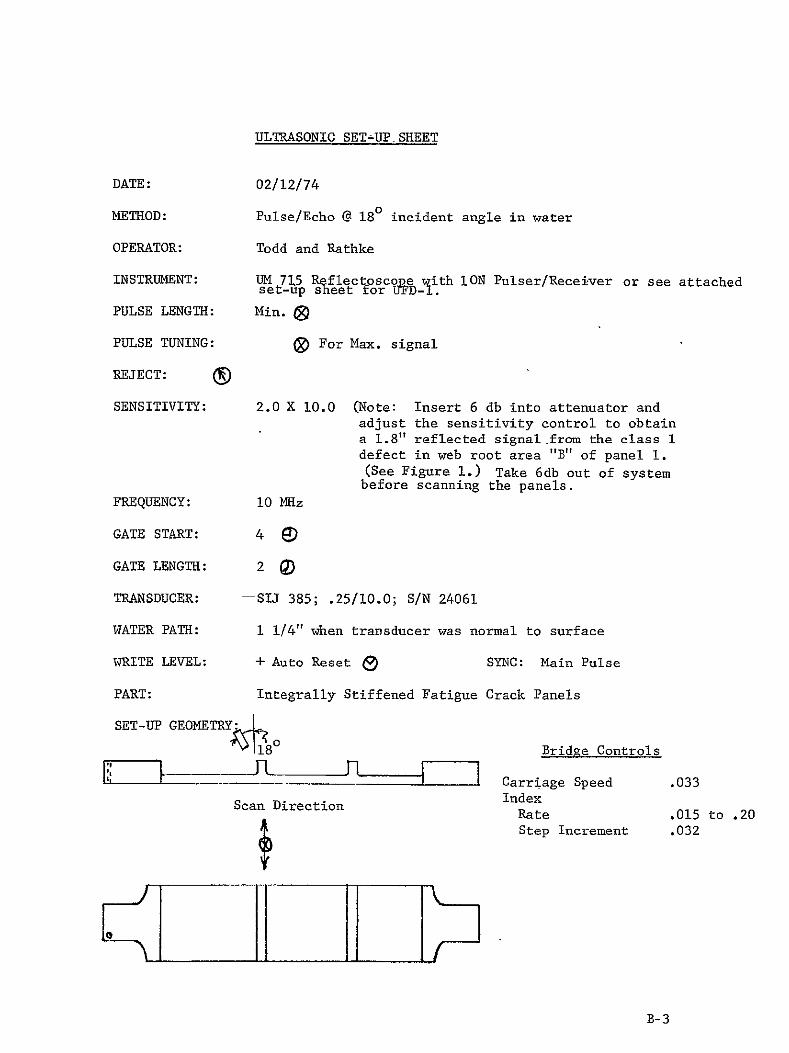
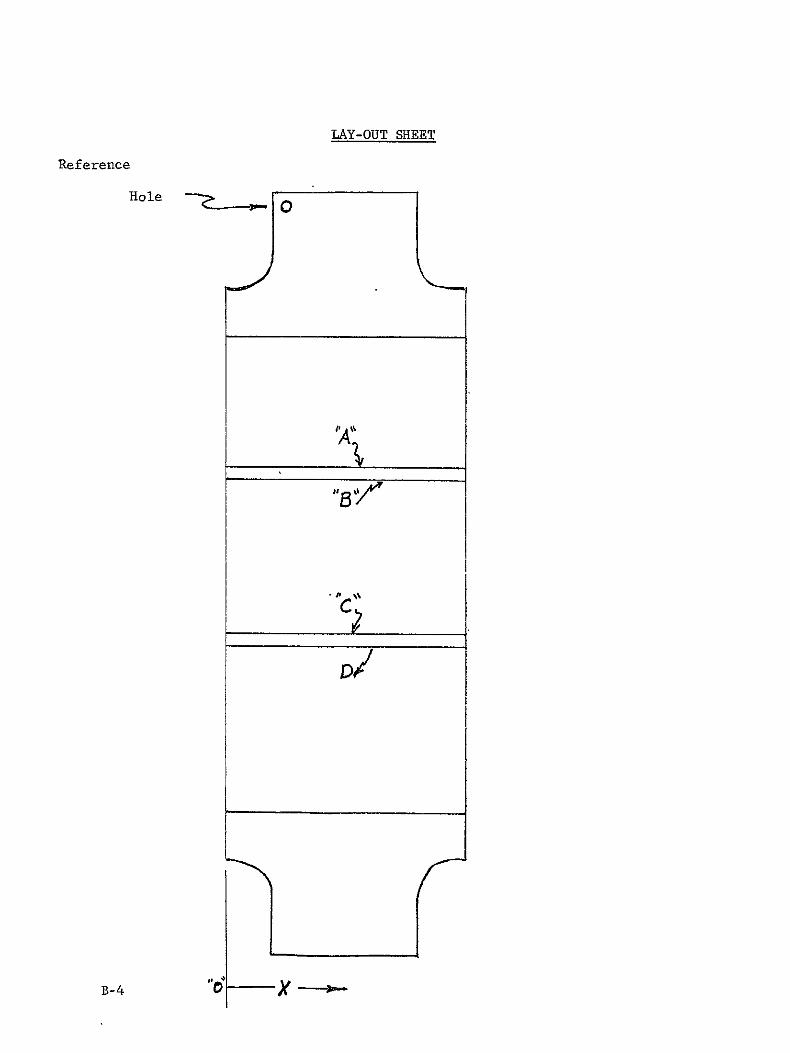


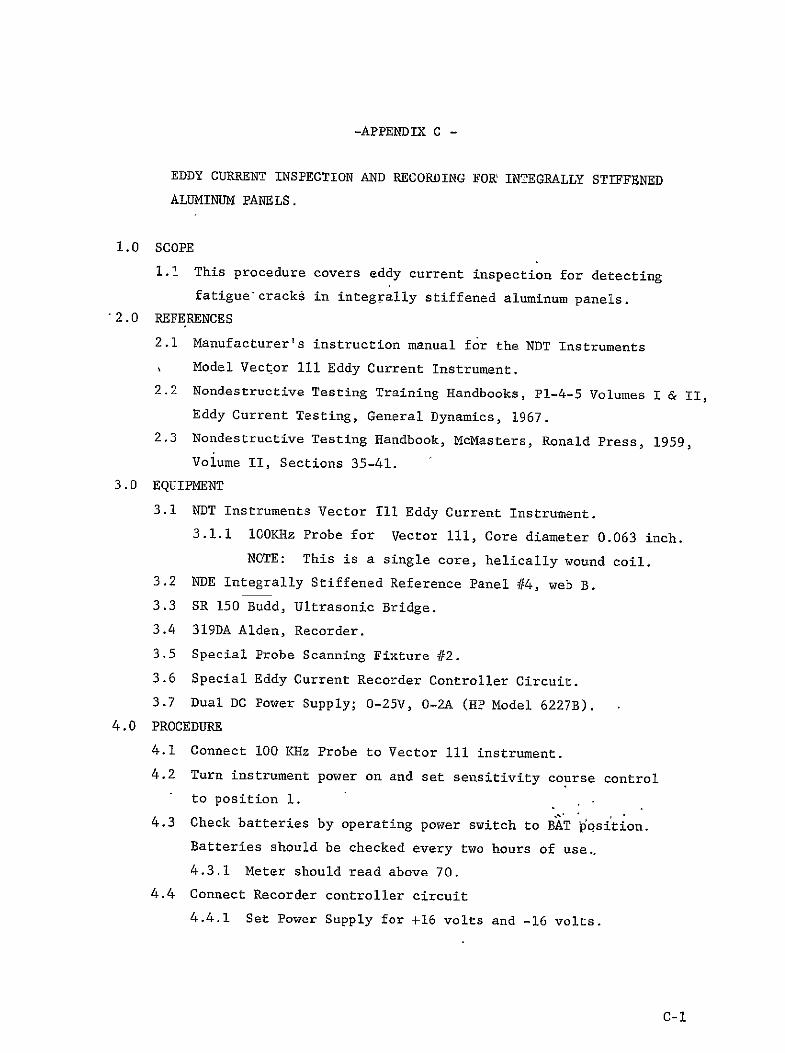
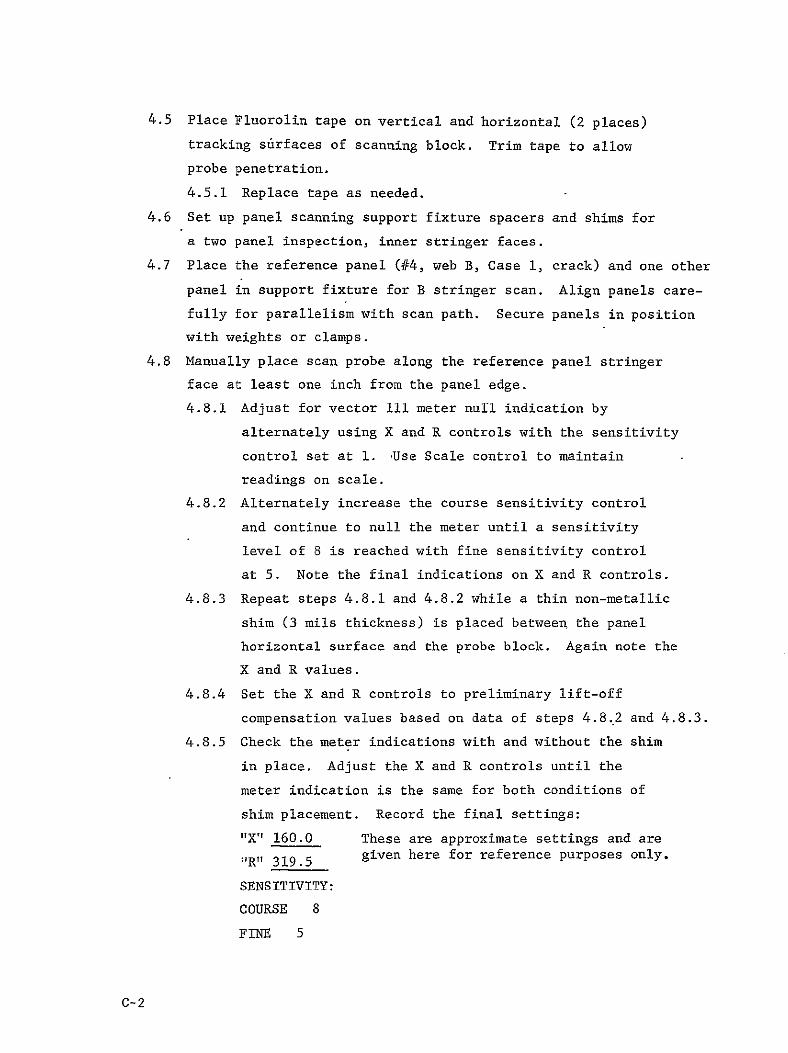
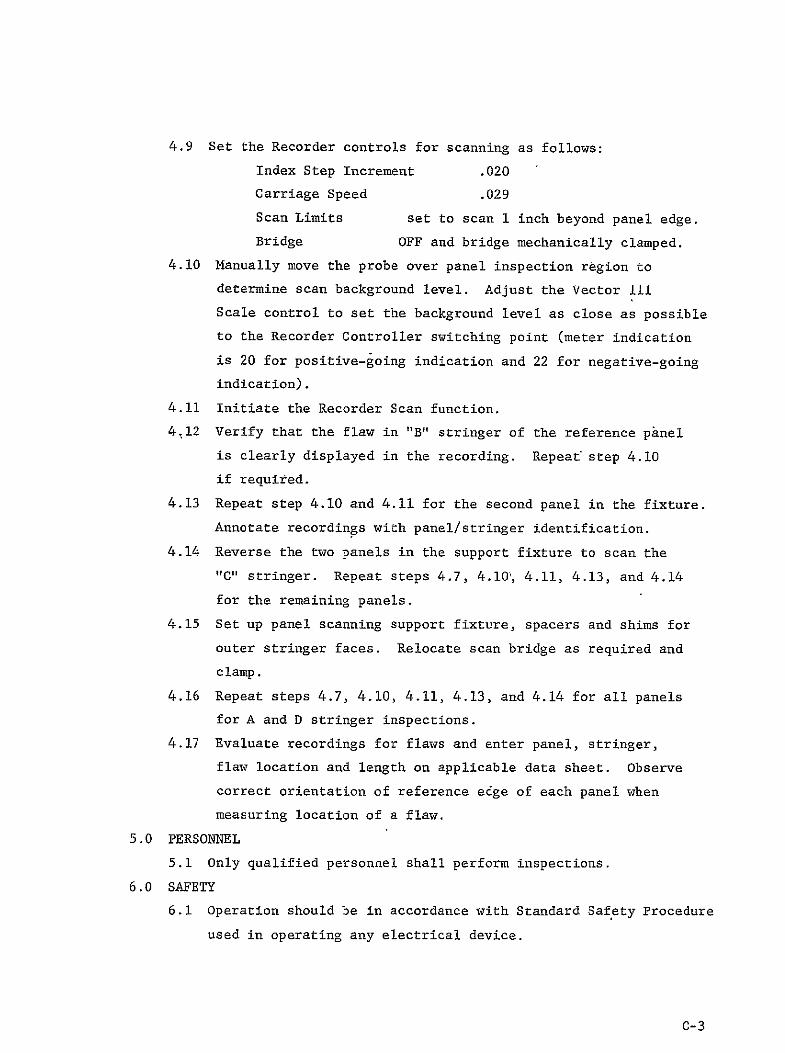


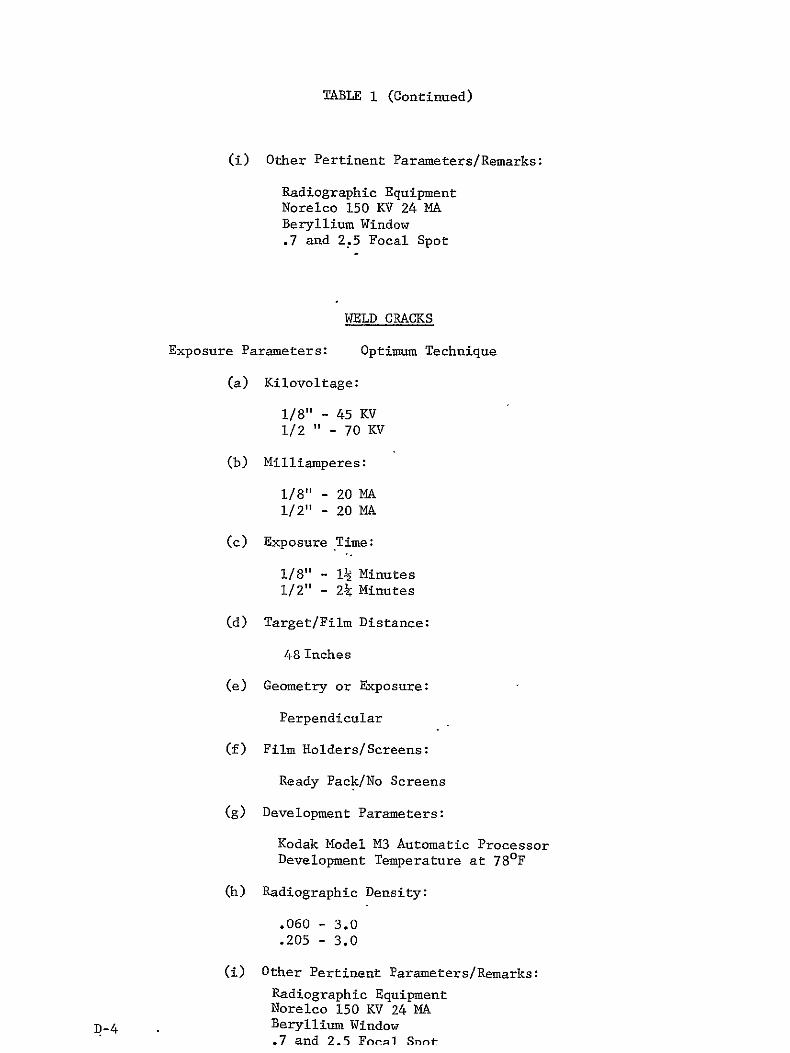


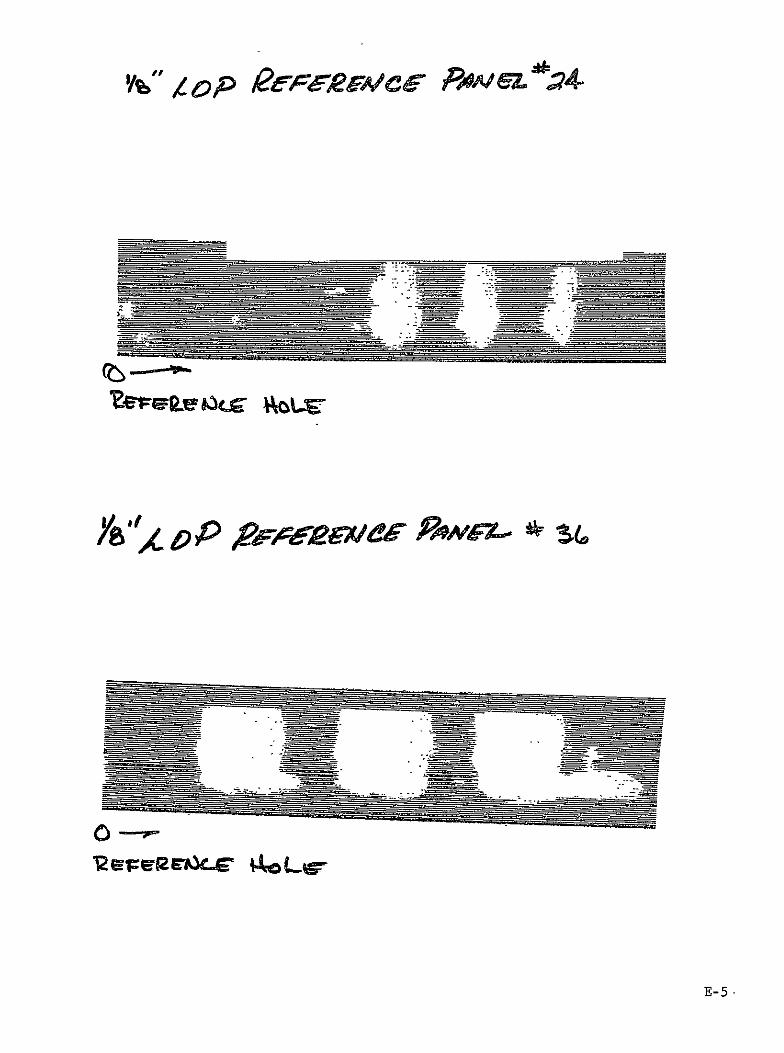
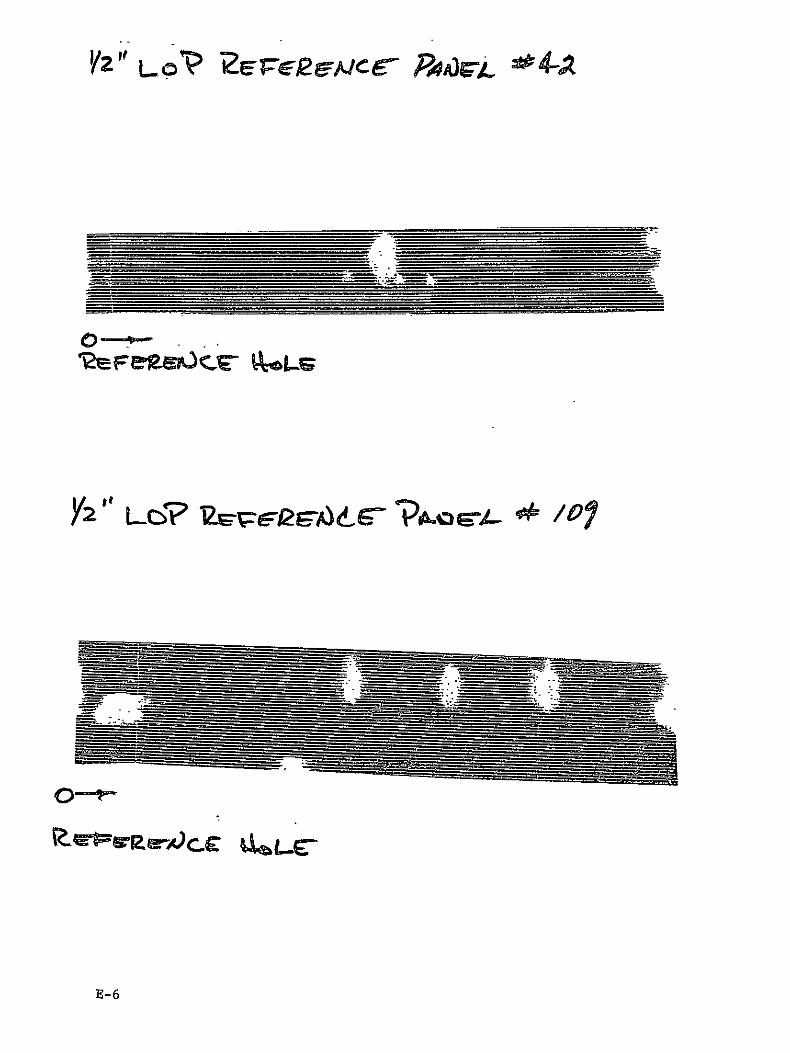
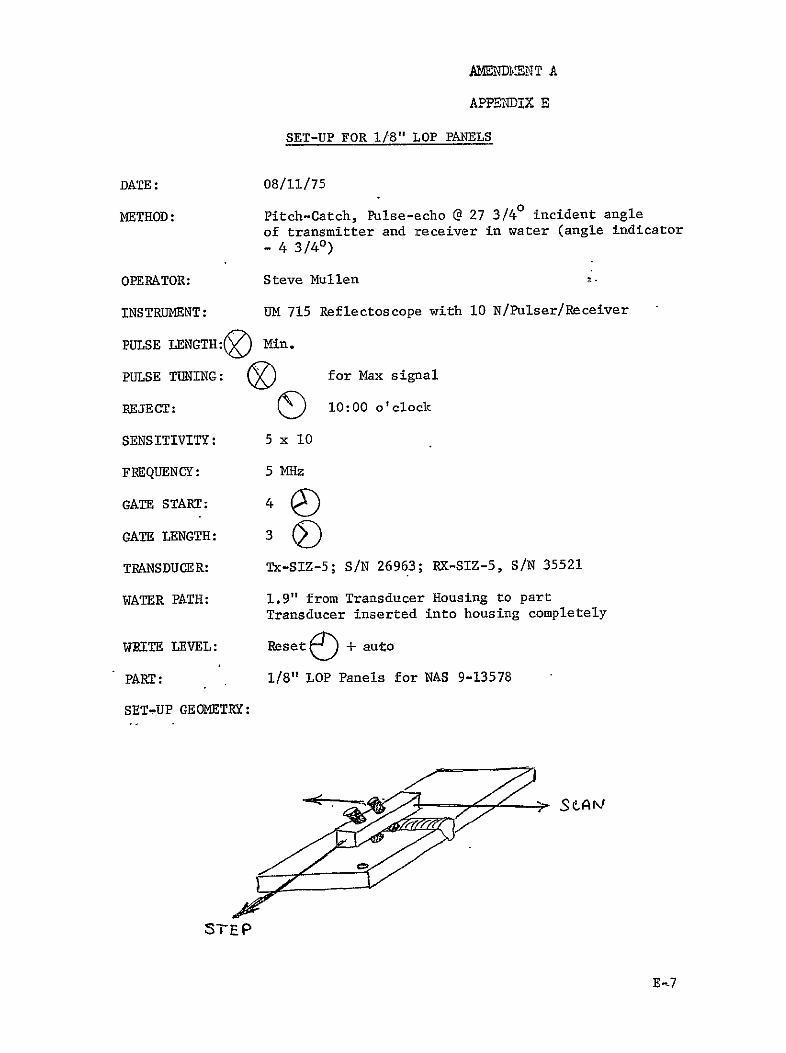
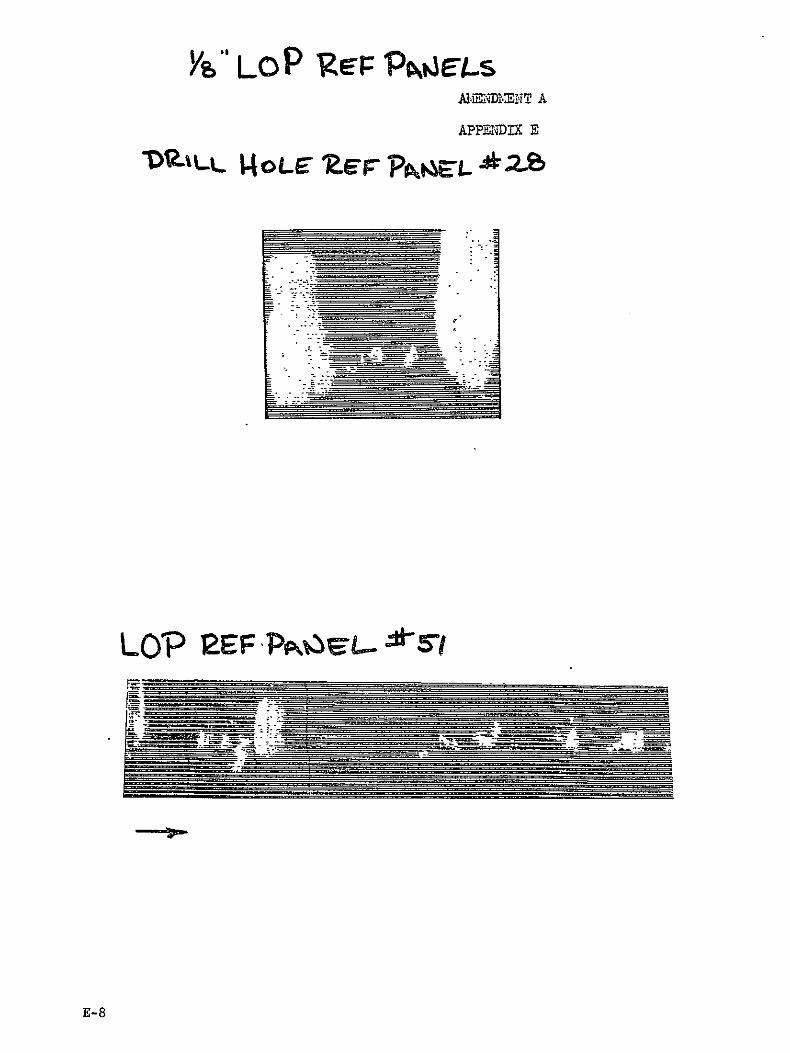


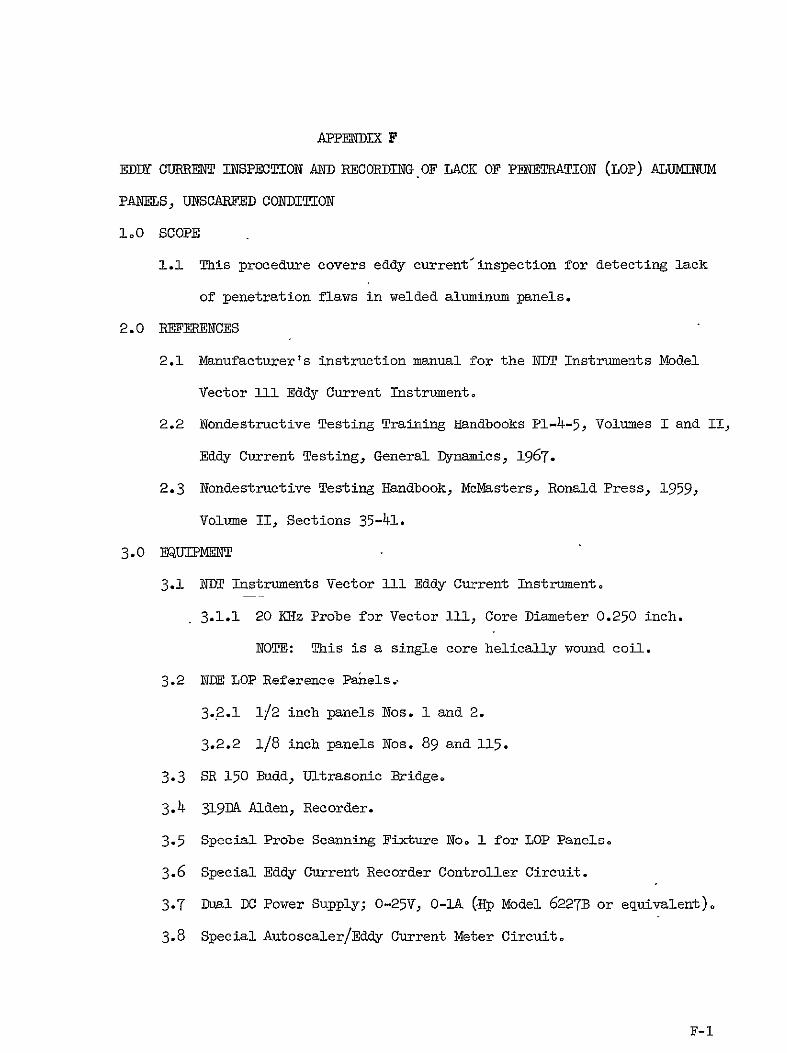


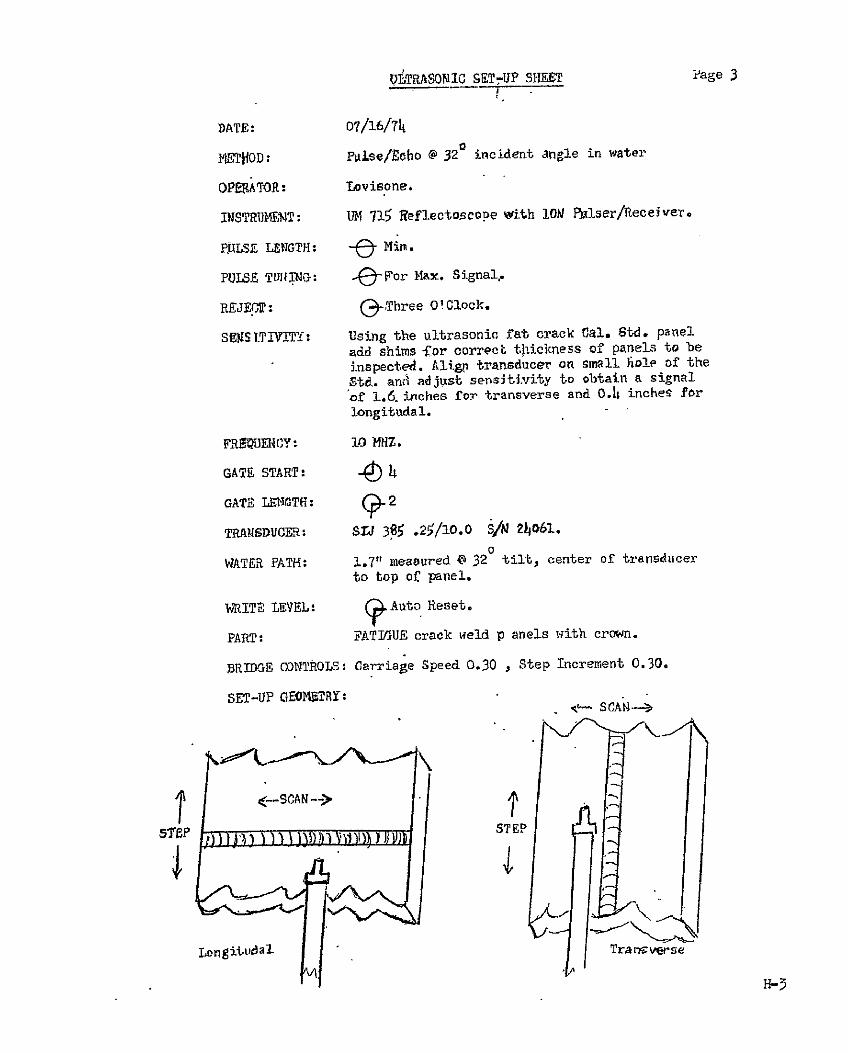


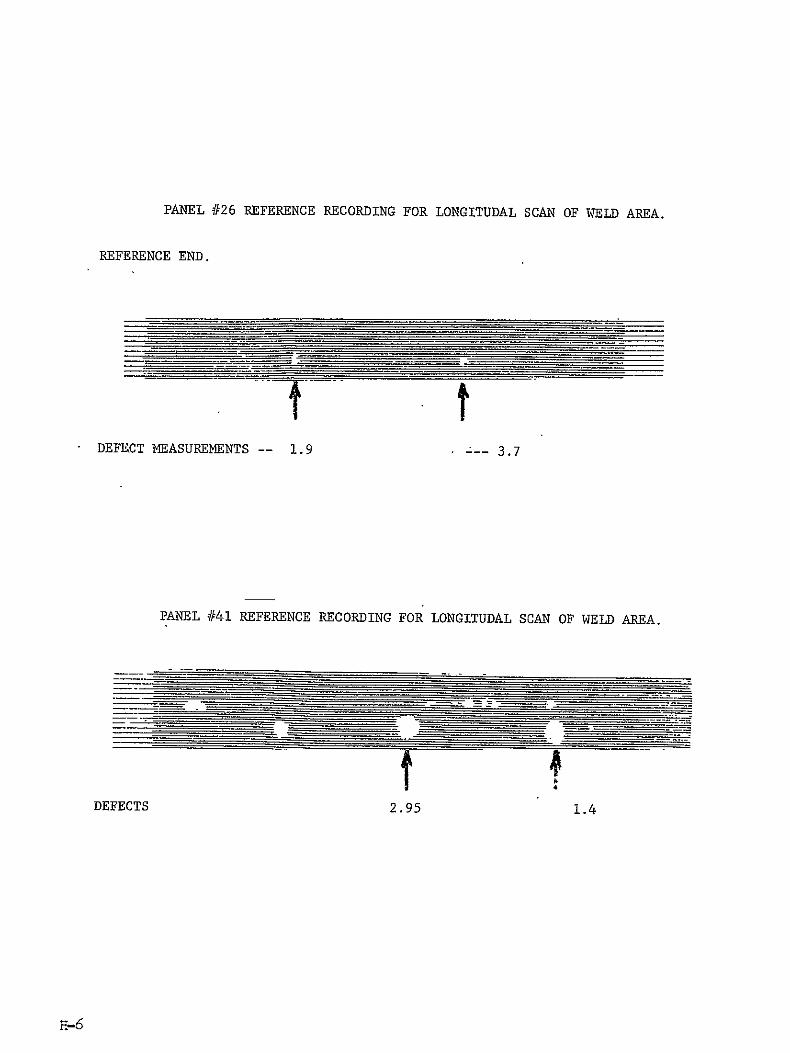
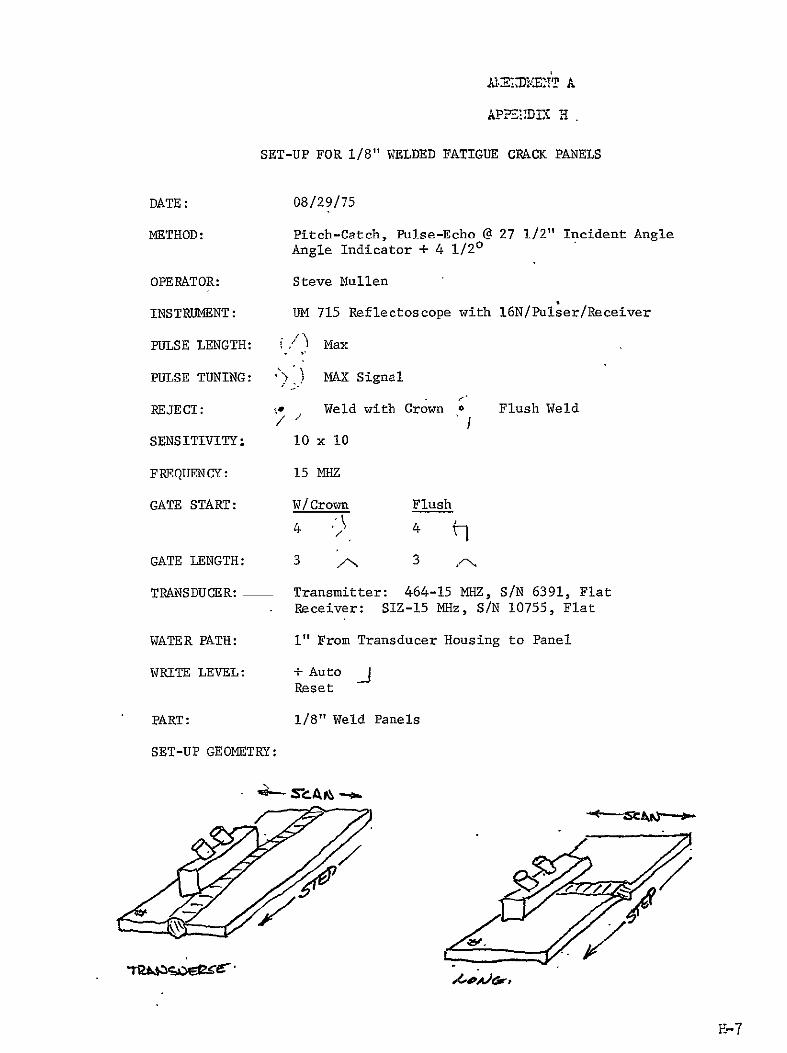
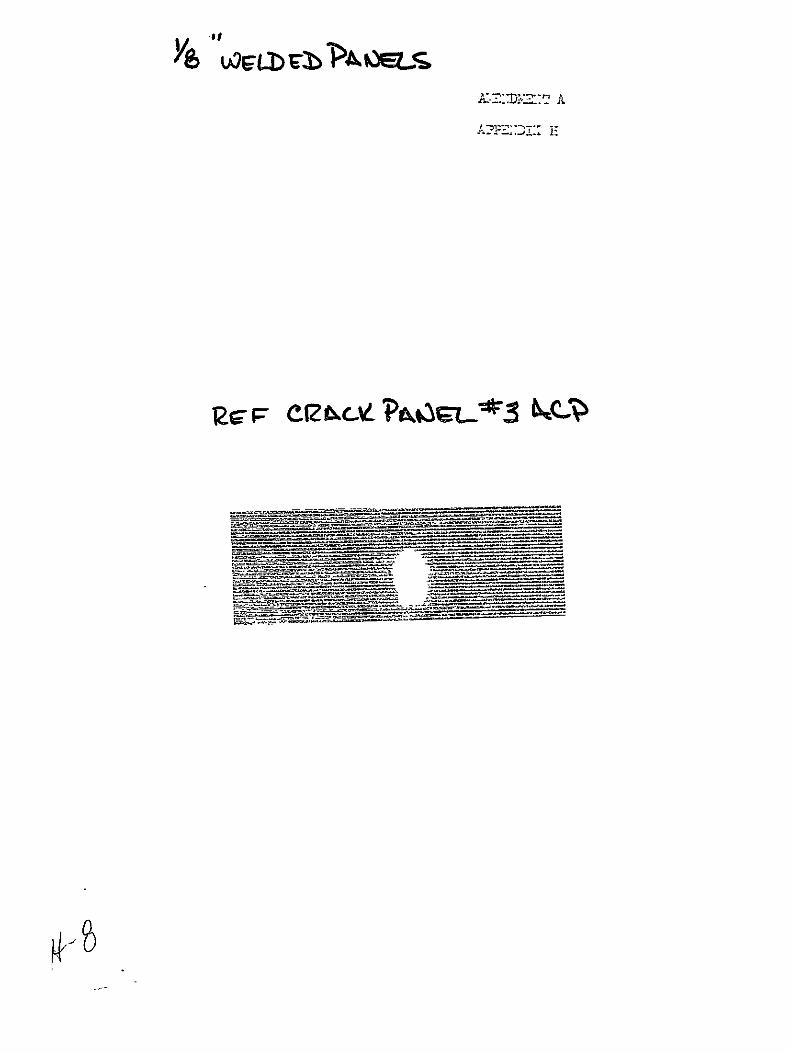
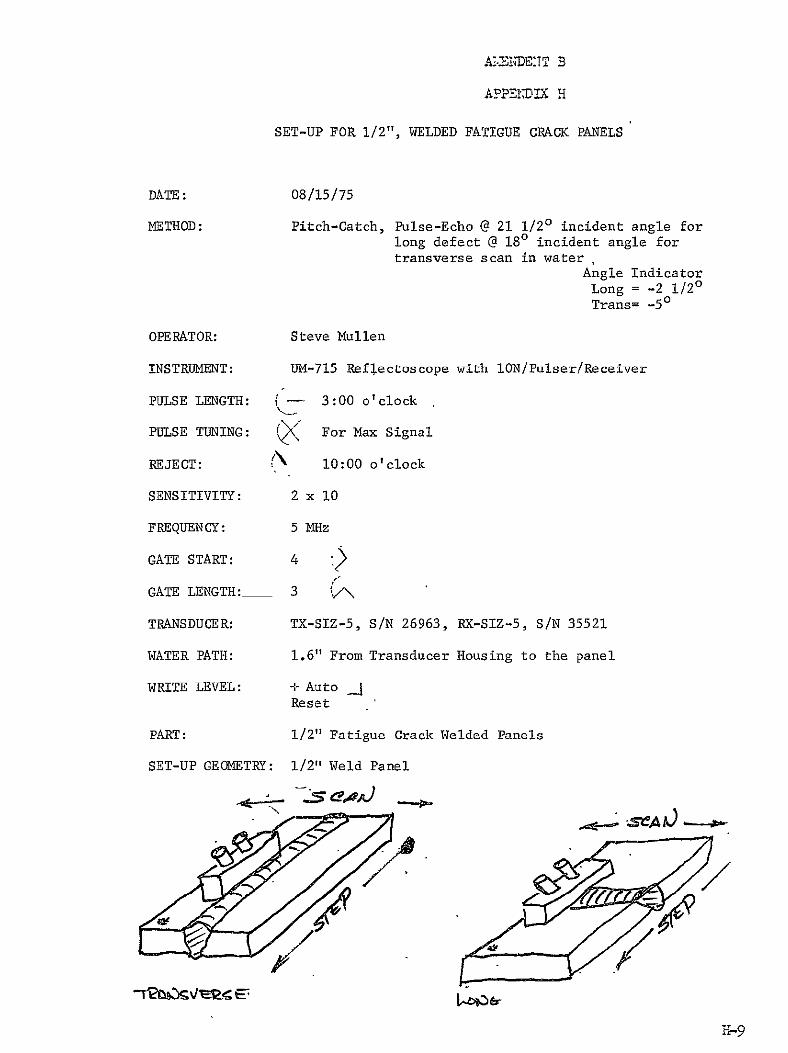


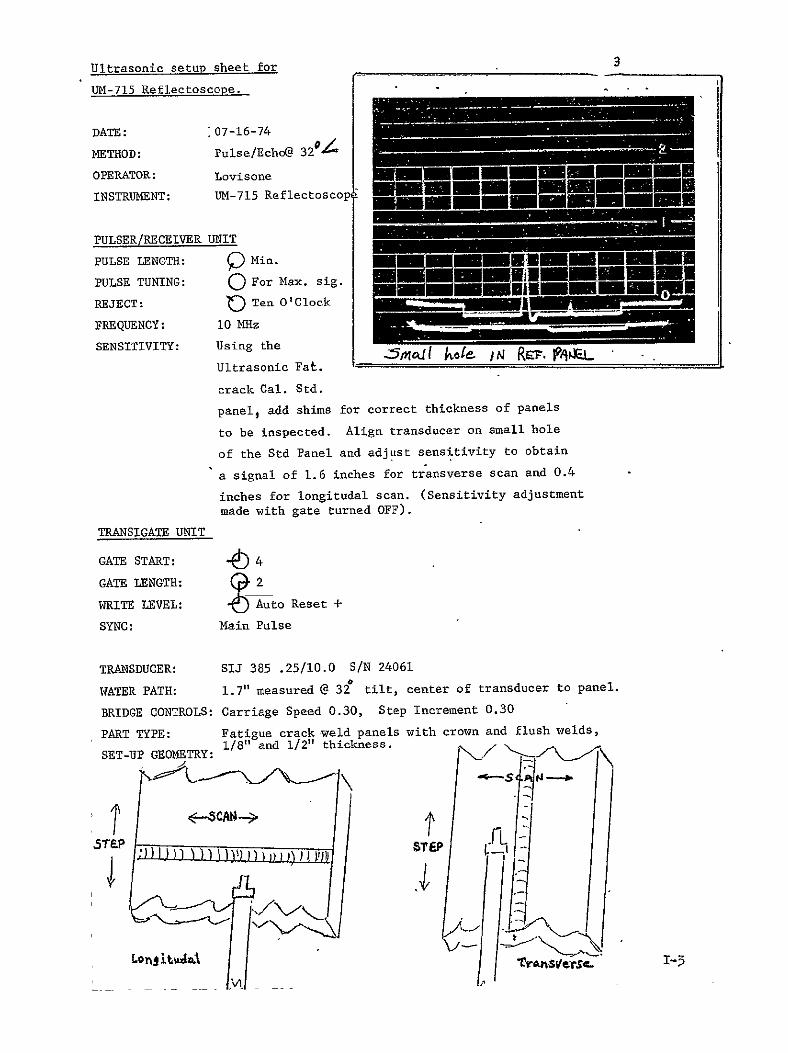

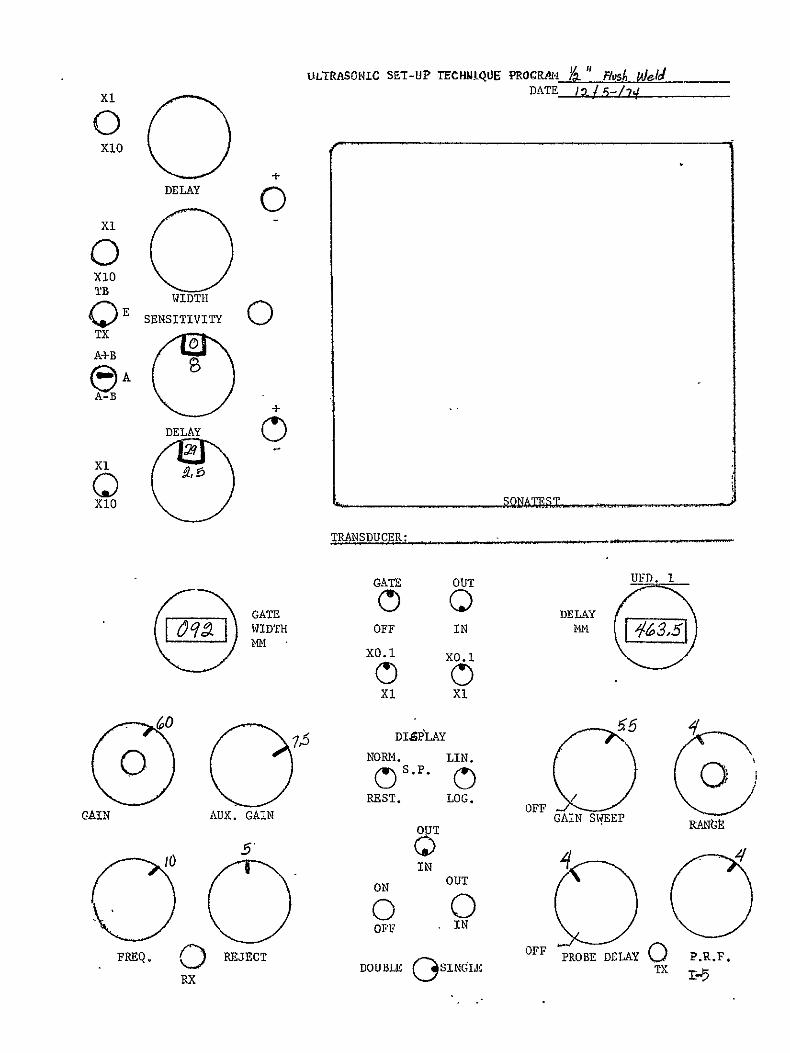


Related Documents


![Enhancement of the POD of Flaws in the Bulk of Highly ...Defense Handbook ‘Nondestructive Evaluation System Reliability Assessment’ in its updated version of 2007 [3], we have](https://static.cupdf.com/doc/110x72/5e9b406154edd336832942de/enhancement-of-the-pod-of-flaws-in-the-bulk-of-highly-defense-handbook-anondestructive.jpg)


