The Depoliticization of Inequality and Redistribution: Explaining the Decline of Class Voting Geoffrey Evans University of Oxford James Tilley University of Oxford The collapse of the class basis of party choice in Britain since the 1980s has been assumed to result from the diminishing distinctiveness of social classes in the postindustrial world. We argue instead that class dealignment results from the impact of an ideologically restricted choice set on the electoral relevance of values concerning inequality and redistribution. As these values provide a mechanism through which class divisions translate into differences in party choice, their declining relevance produces a concomitant decline in the effect of class position. These propositions are tested using British survey data covering the period from 1983 to 2010. We show that a supply-side constriction in the choices presented to voters, rather than the weakening of class divisions, accounts for the declining political relevance of redistributive values and the class basis of party choice. The politics of class influences class voting, not vice versa. U nderstanding the extent to which party choices are structured by social divisions and the factors that account for changes in the extent of such divisions are arguably two of the most important questions to be addressed in political science. However, most studies of these issues have examined only whether a source of political division, usually class or religion, has become a less important explanation of party choice. More recently there have been attempts to examine correlates of cleavage strength, but only at an aggregate level. This article extends these debates by proposing and testing a microlevel explanation of how parties shape cleavages through the ideological choices they present to voters and the impact of these on the relevance of voters’ beliefs about inequality and redistribution for their party preferences. We focus on the class-party asso- ciation in Britain over the period 1983–2010 for which there are comparable over-time measures not only of social structure and political choices, but of the key intervening mechanism: voters’ attitudes towards redistribution and inequality. 1 The significance of the class cleavage for British politics is a long-established topic of controversy. Though often characterized as a uniquely class-divided society, in recent decades the dominant view has become one in which the influence of class on political preferences has declined or even disappeared. Whereas in the 1950s and 1960s class was seen as the basis of British politics, it has since declined in salience to such a degree that even proponents of the persistence of class voting in the 1980s (Evans, Heath, and Payne 1991; Heath, Jowell, and Curtice 1985) observed that by the late 1990s class no longer seemed to matter that much for vote choice (Evans, Heath, and Payne 1999). Why has this abrupt decline occurred? The customary explanation of the decline of class politics focuses on the vitiating effects of the transition from an industrial to a postindustrial society on the distinctiveness of social classes, resulting in the blurring of differences between them. Dalton argues that ‘‘few individuals now possess exclusively middle class or working class social characteristics, and the degree of class overlap is increasing over time’’ (Dalton 2008, 156), a view echoed by Clarke et al., for whom the decline of class voting in Britain was caused by a society in which ‘‘class boundaries have become increasingly fluid’’ (2004, 2). During this same period, however, another proc- ess was in train: as Mair, Muller and Plasser observe: The Journal of Politics, Vol. 74, No. 4, October 2012, Pp. 963–976 doi:10.1017/S0022381612000618 Ó Southern Political Science Association, 2012 ISSN 0022-3816 1 An online appendix for this article is available at http://journals.cambridge.org/jop. Data and supporting materials necessary to reproduce the numerical results in the article will be made available at www.nuffield.ox.ac.uk/users/evansg/data. 963

Welcome message from author
This document is posted to help you gain knowledge. Please leave a comment to let me know what you think about it! Share it to your friends and learn new things together.
Transcript
The Depoliticization of Inequality and Redistribution:Explaining the Decline of Class Voting
Geoffrey Evans University of Oxford
James Tilley University of Oxford
The collapse of the class basis of party choice in Britain since the 1980s has been assumed to result from thediminishing distinctiveness of social classes in the postindustrial world. We argue instead that class dealignmentresults from the impact of an ideologically restricted choice set on the electoral relevance of values concerninginequality and redistribution. As these values provide a mechanism through which class divisions translate intodifferences in party choice, their declining relevance produces a concomitant decline in the effect of class position.These propositions are tested using British survey data covering the period from 1983 to 2010. We show that asupply-side constriction in the choices presented to voters, rather than the weakening of class divisions, accounts forthe declining political relevance of redistributive values and the class basis of party choice. The politics of classinfluences class voting, not vice versa.
Understanding the extent to which partychoices are structured by social divisionsand the factors that account for changes in
the extent of such divisions are arguably two of themost important questions to be addressed in politicalscience. However, most studies of these issues haveexamined only whether a source of political division,usually class or religion, has become a less importantexplanation of party choice. More recently therehave been attempts to examine correlates of cleavagestrength, but only at an aggregate level. This articleextends these debates by proposing and testing amicrolevel explanation of how parties shape cleavagesthrough the ideological choices they present to votersand the impact of these on the relevance of voters’beliefs about inequality and redistribution for theirparty preferences. We focus on the class-party asso-ciation in Britain over the period 1983–2010 forwhich there are comparable over-time measures notonly of social structure and political choices, but ofthe key intervening mechanism: voters’ attitudestowards redistribution and inequality.1
The significance of the class cleavage for Britishpolitics is a long-established topic of controversy.Though often characterized as a uniquely class-divided
society, in recent decades the dominant view hasbecome one in which the influence of class on politicalpreferences has declined or even disappeared. Whereasin the 1950s and 1960s class was seen as the basis ofBritish politics, it has since declined in salience to sucha degree that even proponents of the persistence ofclass voting in the 1980s (Evans, Heath, and Payne1991; Heath, Jowell, and Curtice 1985) observed thatby the late 1990s class no longer seemed to matter thatmuch for vote choice (Evans, Heath, and Payne 1999).Why has this abrupt decline occurred? The customaryexplanation of the decline of class politics focuses onthe vitiating effects of the transition from an industrialto a postindustrial society on the distinctiveness ofsocial classes, resulting in the blurring of differencesbetween them. Dalton argues that ‘‘few individualsnow possess exclusively middle class or working classsocial characteristics, and the degree of class overlap isincreasing over time’’ (Dalton 2008, 156), a viewechoed by Clarke et al., for whom the decline of classvoting in Britain was caused by a society in which‘‘class boundaries have become increasingly fluid’’(2004, 2).
During this same period, however, another proc-ess was in train: as Mair, Muller and Plasser observe:
The Journal of Politics, Vol. 74, No. 4, October 2012, Pp. 963–976 doi:10.1017/S0022381612000618
� Southern Political Science Association, 2012 ISSN 0022-3816
1An online appendix for this article is available at http://journals.cambridge.org/jop. Data and supporting materials necessary toreproduce the numerical results in the article will be made available at www.nuffield.ox.ac.uk/users/evansg/data.
963
‘‘confronted by either a shrinking base of core voters,or by a more fragmented and instrumental constit-uency... parties are obliged to develop new responsesand new strategies’’ (2004, 4). The British Labourparty accordingly followed several other West Euro-pean left parties down the road to centrist socialdemocracy by moving to the ideological center in anattempt to become a ‘‘catch-all’’ party appealing farbeyond its traditional class base (Webb 2004). Theresult was a pronounced ideological convergencebetween the two main parties during the 1990s, withchange occurring most strikingly following the elec-tion of Tony Blair to the leadership of the Labourparty in 1994 (Bara 2006; Budge 1999). This strategicshift on the left was later echoed in reverse by theConservatives on the right (Curtice 2009; Green2011).
Prima facie, both of these interpretations ofrecent social and political change are consistent withevidence of the decline in class voting. To understandwhich best accounts for the observed changes, we mustfirst specify their differing empirical implications.
Testing the Competing Explanations of theDecline of Class Voting
The conventional approach to understanding socialand political change has focused on changes in theclass system itself and can thus be considered ademand-side approach to the structuring of politicaldivisions: the lack of class differences in values andpolicy preferences weakens the demand for parties tooffer distinctive options in these respects. The reasonsgiven for the decline of these class differences inpreferences are well-known (see Evans 2000 for areview) and have taken various forms: rising livingstandards and the spread of affluence, the changinggender composition of class positions, the growthof alternative social bases of interests that cross-cutclass position, the expansion of mass higher educa-tion, the decline of traditional communities andincreased social mobility, and the emergence of newpolitical values resulting from the increased securityand affluence of the postwar era (e.g. Franklin 1985;Franklin et al. 1992; Kitschelt 1994; Rose andMcAllister 1986). Despite their differences, thesearguments all share the assumption that the erosionof the distinctiveness of social classes is the sourceof changes in the relationship between party andclass. As a result ‘‘while the political cues providedby traditional class groups (and parties) persist . . .these cues are simply less relevant to today’s voters’’(Dalton 2008, 156–57).
Conclusions concerning the impact of the blurringand fracturing of the class structure on political choicehave usually been inferred, retrospectively, from anobserved decline in class voting, rather than measuredindependently and then used to account for suchdeclines. In earlier work (Evans and Tilley 2012), wehave tested the assumption that the fracturing of classstructure explains its declining effect on party choiceby controlling for the changing composition of classesand find little support for the demand-side approach.We did not, however, test directly whether a decline inthe effects of class position on values and preferencescan account for a decline in the effect of class on partychoice.
The approach advocated in our research is asupply-side argument. For voters to respond toparties’ programmatic positions, the parties mustadopt distinctive positions. Without these, the mostcommon motivations for party choice are likely torelate to widely shared preferences, or ‘‘valence’’issues (for further illustration and application ofthis argument to the British case, see Evans andTilley 2012; Green 2007; Green and Hobolt 2008).The basic premise, that parties need to diverge onmatters of relevance to people in different classes forthere to be class differences in party preferences, isnot new. As far back as the 1950s Converse arguedthat parties needed to take distinctive positions onclass issues for voters to use their own class positionsas a basis for their vote (Converse 1958, 395–99), aview echoed in The American Voter (Campbell et al.1960) and more recently in The American VoterRevisited via the concept of status polarization: ‘‘Wecan imagine that, as the parties converge or divergewith regard to class-based policies, status polarizationdecreases or increases accordingly’’ (Lewis-Beck et al.2008, 347). Przeworski likewise argues that ‘‘the relativesalience of class as a determinant of voting behaviouris a cumulative consequence of strategies pursued bypolitical parties of the left’’ (1985, 100–01). In short,without party strategy that emphasizes class differencesin interests, class position is less likely to be stronglyassociated with party choice.
In the British context, a variant of this generalthesis has been advanced by Kelley, McAllister,and Mughan (1985) who refer to a ‘‘party-appealshypothesis’’—in which parties of the left seek supportfrom the middle class—to account for higher levels ofLabour support than would otherwise be expectedgiven the shrinking size of the working class, and byEvans, for whom ‘‘variations in class voting areargued to derive from differences in the redistributivepolicy choices offered to voters’’ (2000, 411). Party
964 geoffrey evans and james tilley
polarization should increase the magnitude of theassociation between social position and party choice,party convergence should reduce it. Ideological con-vergence weakens the strength of the signals fromparties to voters and the motivation for choosingparties as a result of interests derived from class positionis reduced—and vice versa for polarization. Voter re-sponses to party polarization and the extent to whichthis drives changes in class-based preferences thusdepend upon the choices voters are offered (the supplyside), as well as the continued presence of class differ-ences in ideological preferences (the demand side).
The supply-side argument has been examined tosome degree by the analysis of party polarizationalong ideological dimensions using scales from thecomparative manifesto project (Budge et al. 2001).Positions on the left-right dimension of the CMP inBritain have been found to be associated with thestrength of the class-party association (Evans, Heath,and Payne 1999; Evans and Tilley 2012), and com-parative evidence has pointed to similar patternsin other countries (Elff 2009; Oskarson 2005). Whatthese studies lack, however, is empirical informationon the microlevel mechanisms through which theeffects of policy convergence can be understood. Inother words, evidence that the relationship betweenvoters’ own ideological beliefs and their party choicesis affected by party policy changes and how this in turnimpacts on the relation between their class positionand their party choice. Without this evidence the in-ference that party positions shape class voting involvesa leap of faith regarding the mechanisms that connectparty positions to voters’ choices.
We therefore need a more precise operationaliza-tion of political effects on cleavages and the mecha-nisms through which these work. In this article weaddress this question by opening ‘‘the black box’’ andexamining an individual-level analogue to the left-rightdimension of party competition—left-right values—that can explain why classes sometimes vote differently,and other times do not. Through this we attempt toprovide an argument that supersedes the weak basesfor inference provided by the post hoc, untested inter-pretations characteristic of demand-side approachesor the essentially aggregate correlations that form thebasis of evidence for supply-side arguments.
The Role of Left-Right Values
By left-right values we mean the positions voters takeon issues concerning inequality, redistribution, andthe unfettered operation of the free market. At oneend of the continuum is a perception of unjust
inequality and a desire for redistribution, with thegovernment perceived as a key agent of redistributionand, at the other, an endorsement of existing inequal-ities and rejection of the need for government in-tervention to ameliorate them.2 This redistributiveversus free-market dimension has been found to forma long-term, stable and central element of Britishvoters’ political orientations, providing a heuristicfor making political choices. Moreover, class positionprovides both a consistent and relatively strong in-fluence on these values (Heath, Evans, and Martin1994; Evans, Heath, and Lalljee 1996), whereas otherpotential sources of these orientations have been foundto be weaker and less stable (Evans 1993).3
The significance of these issues for understandingclass voting has long been taken as given: ‘‘In alldemocratic nations, including the United States,there has been a correlation between socioeconomicstatus and political beliefs and voting. The less priv-ileged have supported parties that stood for greaterequality and welfare protection, through governmentintervention, against the strain of a free enterpriseeconomy’’ (Lipset 1991, 208), but their role in explain-ing the magnitude of the association has not so farbeen tested. The demand-side argument predicts thatthe association between class position and left-rightvalues will generally weaken over time as classes losetheir distinctiveness. As a result, the association be-tween class and party choice becomes weaker. Thepremise of the supply-side thesis, in contrast, is thatideological convergence by parties weakens the strengthof the ideological signals sent to voters so that voters’left-right position becomes less relevant to their partychoice. Classes still differ in their views on inequalityand redistribution, but the motivation for choosingparties on such grounds derived from class position isreduced (and vice versa when parties polarize). Duringa period of ideological convergence, such as in Britainover the 1990s, class voting should decline evenwhen class differences in attitudes relating to inequalityand redistribution, the core elements of the left-rightideological dimension, remain stable. In short: the
2The terms ‘‘values,’’ ‘‘ideology,’’ and ‘‘core beliefs’’ can be usedinterchangeably to denote an overarching, or underlying, ori-entation which summarizes important areas of voters’ attitudestowards politics. We use the term ‘‘values’’ to avoid confusionwith the content-free self-placement measures of ‘‘left-rightideology’’ commonly used in survey studies of electoral behavior.
3There is also a body of U.S. research demonstrating that peoplehold fundamental and enduring attitudes towards economic andpolitical principles like equality and that these enduring corebeliefs can account in large part for attitudes towards moretransient political issues (Ansolabehere, Rodden, and Snyder2008; Feldman 1988; Goren 2005).
inequality, redistribution, and class politics 965
demand-side argument assumes that the decline of theclass-party association results from declining divisionsin orientations towards redistribution and inequalitybetween classes, whereas the supply-side argumentassumes that it results from the declining relevance ofthese divisions to party choice
We test these competing processes by first describ-ing the pattern of change in the observed class-partyassociation. This pattern of change then becomes thevariation to be explained through the introduction ofcontrol variables. Our interest is not in accounting forthe strength of class effects on party choice per se, butin accounting for the change in the strength of theseclass effects.
Hypotheses
The demand-side arguments contend that the blurringof class boundaries as a result of social and economicchange will have weakened the effects of class positionon party choice. Class divisions have been weakened bycross-cutting social characteristics. So, for example, theincrease of trade union members who are not workingclass will have weakened the political distinctiveness ofthat class. More generally, we can therefore hypothesizethat:
H1: Controlling for the effects of social positionother than class should account for changes in theclass-party association.
This test of the demand-side thesis to some degreereplicates earlier work (Evans and Tilley 2012) and istherefore not in itself a major step forward. However,when we examine the role of the individual-levelmechanism—left-right values—we bring new insightsto bear on the relative efficacy of demand-side versussupply-side arguments. From the demand-side argu-ment we can infer that if the distinctiveness of classeshas declined, the effect of class position on left-rightvalues will also decline. As a consequence, classeswill be less strongly associated with different partiesbecause they have less differentiated value positionson inequality and redistribution. If the relationshipbetween class and left-right values has weakened asparties happen to have converged, left-right values willaccount for a greater proportion of the class-partyassociation when parties are far apart from one another(i.e., at the start of the period we are examining) thanwhen they are close together (as at the end of theperiod). As a result, any observed change that we see inthe class-party association should be removed orreduced by controlling for the association between
class position and values. Therefore, we hypothesizethat:
H2: Controlling for the effect of left-right valuesshould account for changes in the class-partyassociation.
In contrast, our value-relevance argument impliesthat, over time, party ideological convergence hasweakened the association between voters’ left-rightvalues and their party choice, which has in turnweakened the link from class position to party choice.The association between class and left-right valueshas remains relatively unchanged. The change is inthe political relevance of those values. Therefore:
H3: Controlling for the effect of left-right valuesconditional on the level of party polarization shouldaccount for changes in the class-party association.
Data and Measurement
We use data from the British Social Attitudes (BSA)surveys carried out annually between 1983 and 20104
that consistently measures our dependent variable,although later statistical models only contain datafrom 1986 to 2010 as the earliest BSAs are missingcrucial independent variables. The dependent variableis a general measure of party support that combinesboth partisanship and voting preferences. This meanswe are able to use a dependent variable that enablesparty preference to be operationalized meaningfullyduring nonelection years. To measure party supportwe use a series of questions:
1) ‘‘Generally speaking do you think of yourself as asupporter of any one political party?’’
2) [IF NO] ‘‘Do you think of yourself as a little closerto one political party than to others?’’
3) [IF NO] ‘‘If there were a general election tomor-row, which political party do you think you wouldbe most likely to support?’’
4There were no surveys in 1988 and 1992, and the regressionmodels we report here do not use the 1983, 1984, 1985, and 1997surveys as unfortunately some of the values items (and certain ofthe social characteristic questions) were not included. The total Nfor the full dataset of 26 surveys is 82,406; for the reduced set of22 surveys used in the models the N is 75,919. We exclude 4,532respondents who refused to answer the party-support questionsor who were ‘‘other’’ party supporters, but the main reason themodels presented here use a lower N of 52,843 is that the valuesquestions were only asked on the self-completion part of the BSAquestionnaire in almost all years. This substantially lowers theamount of usable data.
966 geoffrey evans and james tilley
This gives 18% of nonsupporters overall, increas-ing from 12% in 1983 to 23% in 2010. These are verysimilar proportions of party support and no supportto those using party identification as measured by theBritish Election Studies (BES) for the years that BESand BSA overlap (1987, 1997, 2001, 2005, and 2010).We have excluded the small number of respondentsthat identified with a party other than one of thethree main parties,5 and thus we have a dependentvariable with four categories: Labour supporters,Conservative supporters, Liberal supporters (‘‘Liberal’’here is shorthand for Liberal, SDP, and LiberalDemocrat supporters), and supporters of no party.
Measuring Values
Since 1986, the BSA surveys have included a scale ofleft-right values that has received extensive testing ofits reliability and validity (Evans, Heath, and Lalljee1996). This contains five items that capture thekey aspects of left-right values; respondents wereasked to what extent they agreed with the followingstatements:
1) ‘‘There is one law for the rich and one law for thepoor.’’
2) ‘‘Ordinary working people do not get their fairshare of the nation’s wealth.’’
3) ‘‘Big business benefits owners at the expense ofworkers.’’
4) ‘‘Government should redistribute income fromthe better off to those who are less well off.’’
5) ‘‘Management will always try to get the better ofemployees if it gets the chance.’’
The scale was developed from a large battery ofitems designed specifically to measure this left-rightideological domain and which were selected for even-tual inclusion in the scale on the basis of establishedcriteria for scale construction, rather than the moreusual practice of summating ostensibly similar itemson the basis of ‘‘face validity.’’6 All these questions hada Likert-scale response format from ‘‘Strongly agree’’to ‘‘Agree,’’ ‘‘Neither agree nor disagree,’’ ‘‘Disagree,’’
or ‘‘Strongly disagree.’’ Following standard procedure,we summed the individual-item responses and dividedby five. The scale is coded so that 5 represents the mostright-wing set of responses and 1 the most left-wing,which gives a mean of 2.53 (this is fairly constant overtime, with a minimum in 1995 of 2.36 and a maximumof 2.68 in 2004) and a standard deviation of 0.77over the whole sample. For the combined 1986–2010dataset, principal component analysis reveals only onefactor, and the scale has a very satisfactory Cronbach’salpha of 0.82, which does not drop below 0.79 for anyindividual survey.
Measuring Social Class: Occupationand Income
We measure class using two different variables:occupation and income. The former is a reducedversion of the commonly employed Goldthorpeoccupational-class schema (Erikson and Goldthorpe1992), which categorizes people by their current or,if out of the workforce, their former occupation.We categorize people into five occupational groups:the ‘‘salariat’’ (professional and managerial workers),‘‘routine nonmanual’’ workers, the ‘‘petty bourgeois’’(broadly speaking the self-employed), ‘‘foremen andsupervisors,’’ and the ‘‘working class’’ (skilled andunskilled manual workers).7 Our measure of incomeis household income quintile, also giving us fivecategories.8 We use these two measures of socialposition to measure class in order to try and dem-onstrate that the arguments we propose do not dependon a particular operationalization of class position.
5Other party supporters (around half are respondents thatidentify with one of the two nationalist parties, with the Greensand UKIP constituting most of the rest) make up less than 5% ofthe total sample.
6We use the five-item multiple indicator scale as it is more reliablethan left-right self-placement, particularly for less-informedrespondents (Evans, Heath, and Payne 1996) as the labels ‘‘left’’and ‘‘right’’ can mean different things to different people.Ansolabehere, Rodden, and Martin (2008) likewise advocate theuse of similar validated multiple-indicator measures.
7Unusually among measures of social class, this schema has beenthe subject of extensive validation procedures, in which measuresof occupational attributes such as employment conditions,promotion prospects, job uncertainty, and control over workhave been shown to cluster into latent classes that correspondclosely to those categories (Evans and Mills 1998). Here we baseoccupational class on the 19-category socioeconomic group(SEG) to maintain continuity over time. Respondents in thepersonal-service SEG class were classified to the working class,salariat, or petit bourgeois class depending on whether they wereemployees or self-employed and whether they had a managerialcomponent to their job. Individuals not currently working, duefor example to unemployment or retirement, are assigned to theirlast occupation, and those who had never had a job or who wereunable to be assigned to a class were assigned to their husband orwife’s class.
8As the question on income in all the BSA surveys is categorical,we are not precisely placing respondents on an income scale, butrather fitting nearest categories into each of the quintiles. Incomequintiles are referenced to the individual survey sample, so thebottom quintile refers to the bottom income quintile in thesurvey, not the population. In practice, since these are represen-tative surveys, this does not give large discrepancies.
inequality, redistribution, and class politics 967
Income is clearly distinct from occupational class asusually conceptualized by sociologists, but in politicalscience it is not unusual to treat income as a measureof class position (Bartels 2008; Leighley and Nagler1992, 2007). The logic of our argument should applyto both occupational class, which encompasses ideas ofworking conditions and life-time expected income(Goldthorpe and McKnight 2006), and the currentlevels of income that people are receiving. People inoccupational groups that have poorer working con-ditions now and will have less opportunities in thefuture should behave similarly to those with low levelsof income today. In both those cases we would expectthat people will be interested in more redistributionand government intervention and therefore moreinterested in parties that provide those policies, com-pared to those in occupations with better current andfuture working conditions and those with currentlyhigher incomes.
Measures of Social Structural Controls
We also include a large number of other independentvariables in our models that are likely to be correlatedwith both party preference and occupation/income.Of most importance are those aspects of social changethat have been thought to affect the association betweenclass and party. We focus here on: trade union mem-bership (current member, former member, not currentmember); sector of employment (private sector, public,or charity sector); employment status (retired, unem-ployed, or incapacitated, looking after the home orin education/training, in employment); housing type(social housing, private rental, or owner-occupier);educational qualification (degree, some higher educa-tion, A-level or equivalent, O-Level or equivalent, CSEor equivalent, apprenticeship, no qualifications); andfinally region (Scotland, Wales, North, Midlands andEast, Southwest, Southeast). We also include othercontrols that while not central to accounts of classconvergence are likely to be related to both party choiceand class, these are religion (Church of England,Catholic, Church of Scotland, nonconformist, non-specified Christian, no religion, or non-Christian);ethnicity (white or nonwhite); birth-year (categorizedinto eight 10-year birth cohorts); and sex.
Operationalizing Party Left-Right Position
Our primary indicator of party ideological position isa measure of the difference between the two mainparties’ manifesto positions on a left-right dimension.We also show this is highly correlated with voters’
own perceptions of party closeness. The manifestopositions were constructed by Budge and colleaguesas part of the Comparative Manifesto Project (CMP)and have been used by various scholars to examineparties’ ideological movements over time (Budgeet al. 2001; Elff 2009; Hellwig 2008; McDonald andBudge 2005). We use the left-right scale because‘‘the basic logic of party competition in Britainremains similar to that which held in the 1950s . . . apredominantly left-right dimension of competition’’(Webb 2004, 39). The CMP left-right dimension is anestablished measure of party position based on contentanalyses of the programs of the main political parties atevery postwar election. We also look at voters’ per-ceptions of how the parties move using a question fromthe BES surveys during this period, which asked res-pondents: ‘‘Considering everything the Conservativeand Labour parties stand for, would you say there is agreat deal of difference between them, some difference,or not much difference?’’
Analysis
The Pattern of Change in the Class-PartyAssociation
First, we examine the association between class andparty choice over time. Figures 1a to 1d show thepattern of change in the occupational class-party andincome-party association from 1983 to 2010. Thefigures are observed percentages supporting each ofthe main parties for the top and bottom occupationalgroupings (the salariat and the working class) and thetop and bottom income quintiles in every year.
Looking first at Figure 1a, Conservative support,we see a clear pattern of change. The gap between thesalariat and the working class declines from 30% in1983 to only 11% in 2001, then increases somewhatagain by the end of the 2000s. The same pattern holdsfor income. The gap in the 1980s averages around25%, but this reduces to nearly 10% by 2001, afterwhich it creeps up again. The trend for Labour supportby occupation and income shown in Figure 1b issimilar. The gap between the salariat and the workingclass declines from 30% in 1983 to around 10% overthe 2000s. Almost exactly the same pattern is seen forthe relationship between income and Labour support:it matters much more in the 1980s than it does in the2000s. So there has been change, and it has beensubstantial. By 2001, income and occupational classwere much weaker predictors of major party support
968 geoffrey evans and james tilley
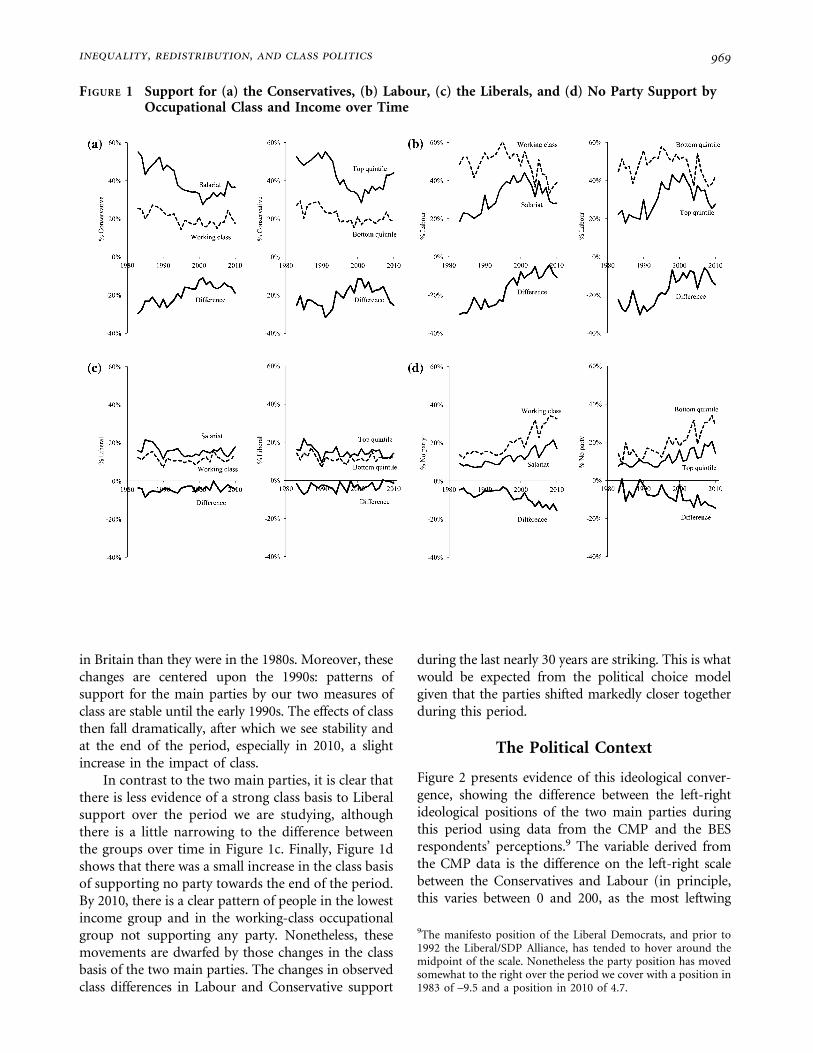
in Britain than they were in the 1980s. Moreover, thesechanges are centered upon the 1990s: patterns ofsupport for the main parties by our two measures ofclass are stable until the early 1990s. The effects of classthen fall dramatically, after which we see stability andat the end of the period, especially in 2010, a slightincrease in the impact of class.
In contrast to the two main parties, it is clear thatthere is less evidence of a strong class basis to Liberalsupport over the period we are studying, althoughthere is a little narrowing to the difference betweenthe groups over time in Figure 1c. Finally, Figure 1dshows that there was a small increase in the class basisof supporting no party towards the end of the period.By 2010, there is a clear pattern of people in the lowestincome group and in the working-class occupationalgroup not supporting any party. Nonetheless, thesemovements are dwarfed by those changes in the classbasis of the two main parties. The changes in observedclass differences in Labour and Conservative support
during the last nearly 30 years are striking. This is whatwould be expected from the political choice modelgiven that the parties shifted markedly closer togetherduring this period.
The Political Context
Figure 2 presents evidence of this ideological conver-gence, showing the difference between the left-rightideological positions of the two main parties duringthis period using data from the CMP and the BESrespondents’ perceptions.9 The variable derived fromthe CMP data is the difference on the left-right scalebetween the Conservatives and Labour (in principle,this varies between 0 and 200, as the most leftwing
FIGURE 1 Support for (a) the Conservatives, (b) Labour, (c) the Liberals, and (d) No Party Support byOccupational Class and Income over Time
9The manifesto position of the Liberal Democrats, and prior to1992 the Liberal/SDP Alliance, has tended to hover around themidpoint of the scale. Nonetheless the party position has movedsomewhat to the right over the period we cover with a position in1983 of –9.5 and a position in 2010 of 4.7.
inequality, redistribution, and class politics 969
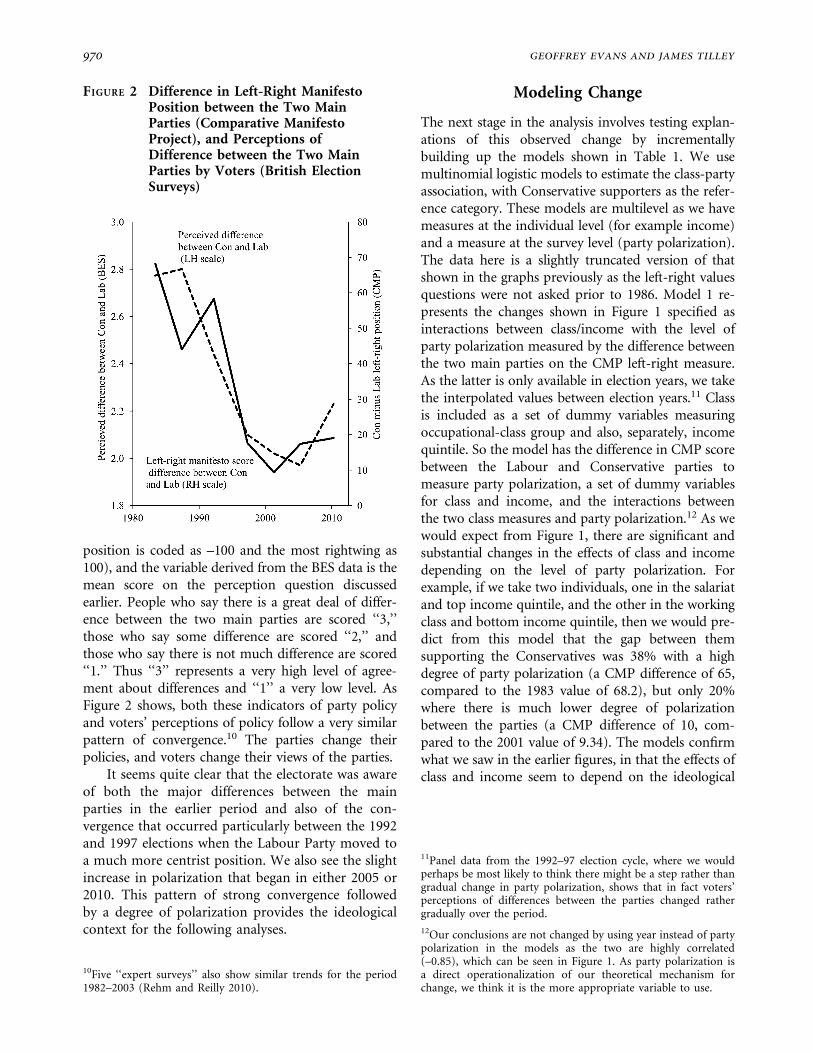
position is coded as –100 and the most rightwing as100), and the variable derived from the BES data is themean score on the perception question discussedearlier. People who say there is a great deal of differ-ence between the two main parties are scored ‘‘3,’’those who say some difference are scored ‘‘2,’’ andthose who say there is not much difference are scored‘‘1.’’ Thus ‘‘3’’ represents a very high level of agree-ment about differences and ‘‘1’’ a very low level. AsFigure 2 shows, both these indicators of party policyand voters’ perceptions of policy follow a very similarpattern of convergence.10 The parties change theirpolicies, and voters change their views of the parties.
It seems quite clear that the electorate was awareof both the major differences between the mainparties in the earlier period and also of the con-vergence that occurred particularly between the 1992and 1997 elections when the Labour Party moved toa much more centrist position. We also see the slightincrease in polarization that began in either 2005 or2010. This pattern of strong convergence followedby a degree of polarization provides the ideologicalcontext for the following analyses.
Modeling Change
The next stage in the analysis involves testing explan-ations of this observed change by incrementallybuilding up the models shown in Table 1. We usemultinomial logistic models to estimate the class-partyassociation, with Conservative supporters as the refer-ence category. These models are multilevel as we havemeasures at the individual level (for example income)and a measure at the survey level (party polarization).The data here is a slightly truncated version of thatshown in the graphs previously as the left-right valuesquestions were not asked prior to 1986. Model 1 re-presents the changes shown in Figure 1 specified asinteractions between class/income with the level ofparty polarization measured by the difference betweenthe two main parties on the CMP left-right measure.As the latter is only available in election years, we takethe interpolated values between election years.11 Classis included as a set of dummy variables measuringoccupational-class group and also, separately, incomequintile. So the model has the difference in CMP scorebetween the Labour and Conservative parties tomeasure party polarization, a set of dummy variablesfor class and income, and the interactions betweenthe two class measures and party polarization.12 As wewould expect from Figure 1, there are significant andsubstantial changes in the effects of class and incomedepending on the level of party polarization. Forexample, if we take two individuals, one in the salariatand top income quintile, and the other in the workingclass and bottom income quintile, then we would pre-dict from this model that the gap between themsupporting the Conservatives was 38% with a highdegree of party polarization (a CMP difference of 65,compared to the 1983 value of 68.2), but only 20%where there is much lower degree of polarizationbetween the parties (a CMP difference of 10, com-pared to the 2001 value of 9.34). The models confirmwhat we saw in the earlier figures, in that the effects ofclass and income seem to depend on the ideological
FIGURE 2 Difference in Left-Right ManifestoPosition between the Two MainParties (Comparative ManifestoProject), and Perceptions ofDifference between the Two MainParties by Voters (British ElectionSurveys)
10Five ‘‘expert surveys’’ also show similar trends for the period1982–2003 (Rehm and Reilly 2010).
11Panel data from the 1992–97 election cycle, where we wouldperhaps be most likely to think there might be a step rather thangradual change in party polarization, shows that in fact voters’perceptions of differences between the parties changed rathergradually over the period.
12Our conclusions are not changed by using year instead of partypolarization in the models as the two are highly correlated(–0.85), which can be seen in Figure 1. As party polarization isa direct operationalization of our theoretical mechanism forchange, we think it is the more appropriate variable to use.
970 geoffrey evans and james tilley
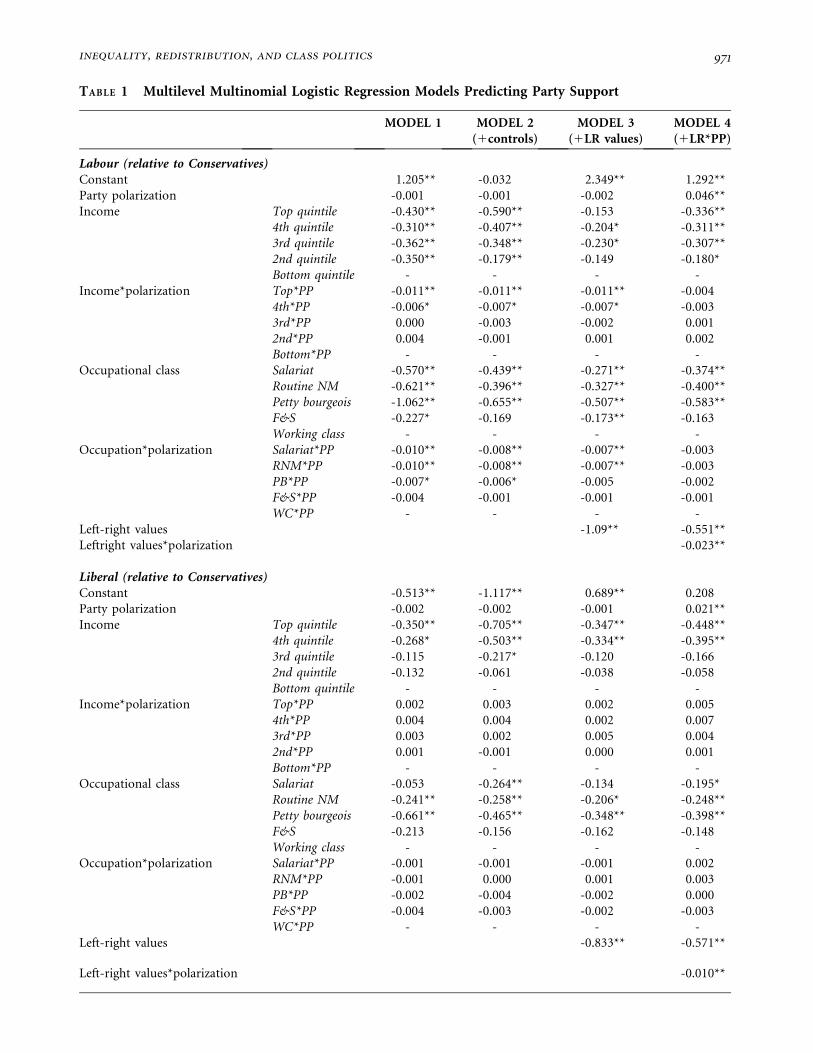
TABLE 1 Multilevel Multinomial Logistic Regression Models Predicting Party Support
MODEL 1 MODEL 2(1controls)
MODEL 3(1LR values)
MODEL 4(1LR*PP)
Labour (relative to Conservatives)Constant 1.205** -0.032 2.349** 1.292**Party polarization -0.001 -0.001 -0.002 0.046**Income Top quintile -0.430** -0.590** -0.153 -0.336**
4th quintile -0.310** -0.407** -0.204* -0.311**3rd quintile -0.362** -0.348** -0.230* -0.307**2nd quintile -0.350** -0.179** -0.149 -0.180*Bottom quintile - - - -
Income*polarization Top*PP -0.011** -0.011** -0.011** -0.0044th*PP -0.006* -0.007* -0.007* -0.0033rd*PP 0.000 -0.003 -0.002 0.0012nd*PP 0.004 -0.001 0.001 0.002Bottom*PP - - - -
Occupational class Salariat -0.570** -0.439** -0.271** -0.374**Routine NM -0.621** -0.396** -0.327** -0.400**Petty bourgeois -1.062** -0.655** -0.507** -0.583**F&S -0.227* -0.169 -0.173** -0.163Working class - - - -
Occupation*polarization Salariat*PP -0.010** -0.008** -0.007** -0.003RNM*PP -0.010** -0.008** -0.007** -0.003PB*PP -0.007* -0.006* -0.005 -0.002F&S*PP -0.004 -0.001 -0.001 -0.001WC*PP - - - -
Left-right values -1.09** -0.551**Leftright values*polarization -0.023**
Liberal (relative to Conservatives)Constant -0.513** -1.117** 0.689** 0.208Party polarization -0.002 -0.002 -0.001 0.021**Income Top quintile -0.350** -0.705** -0.347** -0.448**
4th quintile -0.268* -0.503** -0.334** -0.395**3rd quintile -0.115 -0.217* -0.120 -0.1662nd quintile -0.132 -0.061 -0.038 -0.058Bottom quintile - - - -
Income*polarization Top*PP 0.002 0.003 0.002 0.0054th*PP 0.004 0.004 0.002 0.0073rd*PP 0.003 0.002 0.005 0.0042nd*PP 0.001 -0.001 0.000 0.001Bottom*PP - - - -
Occupational class Salariat -0.053 -0.264** -0.134 -0.195*Routine NM -0.241** -0.258** -0.206* -0.248**Petty bourgeois -0.661** -0.465** -0.348** -0.398**F&S -0.213 -0.156 -0.162 -0.148Working class - - - -
Occupation*polarization Salariat*PP -0.001 -0.001 -0.001 0.002RNM*PP -0.001 0.000 0.001 0.003PB*PP -0.002 -0.004 -0.002 0.000F&S*PP -0.004 -0.003 -0.002 -0.003WC*PP - - - -
Left-right values -0.833** -0.571**
Left-right values*polarization -0.010**
inequality, redistribution, and class politics 971
difference between the parties. When the parties areclose together, as in 2001, class and income are weakerpredictors than when the parties are further apart, as
in 1983.Model 2 shows to what degree these changes are
accounted for by over-time increases in social heter-
ogeneity within classes. To answer this question, we
add to Model 1 the control variables mentioned
earlier: employment status, employment sector,
educational attainment, housing type, trade union
membership, region, religion, sex, ethnicity, and birth
cohort. Unsurprisingly, the inclusion of these controls
improves model fit substantially: the –2log-likelihood
change is very large. However, the inclusion of this
extensive range of controls, most of which are asso-
ciated with class position, has only a modest effect on
the parameters for changes in the effect of occupational
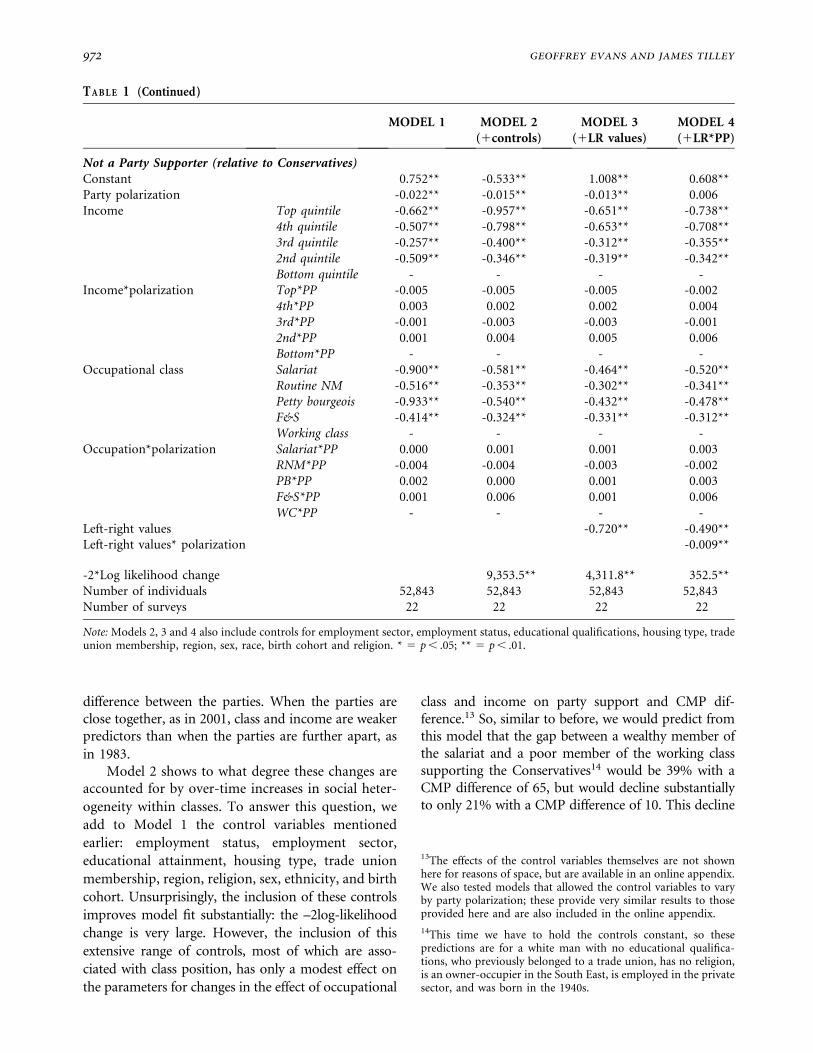
class and income on party support and CMP dif-ference.13 So, similar to before, we would predict fromthis model that the gap between a wealthy member ofthe salariat and a poor member of the working classsupporting the Conservatives14 would be 39% with aCMP difference of 65, but would decline substantiallyto only 21% with a CMP difference of 10. This decline
TA B L E 1 (Continued)
MODEL 1 MODEL 2(1controls)
MODEL 3(1LR values)
MODEL 4(1LR*PP)
Not a Party Supporter (relative to Conservatives)Constant 0.752** -0.533** 1.008** 0.608**Party polarization -0.022** -0.015** -0.013** 0.006Income Top quintile -0.662** -0.957** -0.651** -0.738**
4th quintile -0.507** -0.798** -0.653** -0.708**3rd quintile -0.257** -0.400** -0.312** -0.355**2nd quintile -0.509** -0.346** -0.319** -0.342**Bottom quintile - - - -
Income*polarization Top*PP -0.005 -0.005 -0.005 -0.0024th*PP 0.003 0.002 0.002 0.0043rd*PP -0.001 -0.003 -0.003 -0.0012nd*PP 0.001 0.004 0.005 0.006Bottom*PP - - - -
Occupational class Salariat -0.900** -0.581** -0.464** -0.520**Routine NM -0.516** -0.353** -0.302** -0.341**Petty bourgeois -0.933** -0.540** -0.432** -0.478**F&S -0.414** -0.324** -0.331** -0.312**Working class - - - -
Occupation*polarization Salariat*PP 0.000 0.001 0.001 0.003RNM*PP -0.004 -0.004 -0.003 -0.002PB*PP 0.002 0.000 0.001 0.003F&S*PP 0.001 0.006 0.001 0.006WC*PP - - - -
Left-right values -0.720** -0.490**Left-right values* polarization -0.009**
-2*Log likelihood change 9,353.5** 4,311.8** 352.5**Number of individuals 52,843 52,843 52,843 52,843Number of surveys 22 22 22 22
Note: Models 2, 3 and 4 also include controls for employment sector, employment status, educational qualifications, housing type, tradeunion membership, region, sex, race, birth cohort and religion. * 5 p , .05; ** 5 p , .01.
13The effects of the control variables themselves are not shownhere for reasons of space, but are available in an online appendix.We also tested models that allowed the control variables to varyby party polarization; these provide very similar results to thoseprovided here and are also included in the online appendix.
14This time we have to hold the controls constant, so thesepredictions are for a white man with no educational qualifica-tions, who previously belonged to a trade union, has no religion,is an owner-occupier in the South East, is employed in the privatesector, and was born in the 1940s.
972 geoffrey evans and james tilley
is almost exactly the same as the decline we saw inmodel 1. Thus the change in the association betweenclass and party is not accounted for by the changingcomposition of classes (hypothesis 1).
Model 3 includes voters’ left-right values. If therelationship between class position and left-rightvalues had changed over time, then controlling forthese values would reduce the change in the effect ofclass on party choice (hypothesis 2). This is not whatwe observe. Controlling for left-right values reducesthe main class and income coefficients for the Labourversus Conservative contrast, which is to be expectedgiven the established association between social po-sition and left-right values, but has no effect on thechange in the association between class and party asthe parties move towards and away from the center.So again from this model, holding the controlvariables constant as before and left-right values atthe mean of 2.5, we would predict the gap betweenthe wealthy salariat and poor working class support-ing the Conservatives would be 30% with a CMPdifference of 65, but that it would fall to only 13%with a CMP difference of 10. Neither hypothesis (1)nor hypothesis (2) is supported. Controlling for com-positional differences and values weakens the maineffects of income and occupation upon party choice,but it does not eliminate the conditional relationshipbetween these variables and party polarization onparty choice.
Hypothesis (3) proposes instead that the decliningeffect of left-right values on party choice over timeaccounts for the decline in the class-party association.Accordingly model 4 includes an interaction betweenleft-right values and party polarization. This capturesthe pattern of change estimated to follow from theideological convergence of the main parties of the leftand right. As predicted by the political choice model,this essentially eliminates the change in the effect ofclass due to party polarization, and these changes are nolonger statistically significant. The gap between the richsalariat and the poor working class, holding the con-trols constant as before, in the proportion supportingthe Conservatives is now very similar at high levels ofdifference between the parties (21%) as it is at low levelsof difference (17%). As the main parties converge,voters’ own left-right positions become less relevant totheir political support, and given the constant associ-ation between occupational class/income and left-rightvalues, this weakening impact translates into muchweaker class and income effects on party choice.
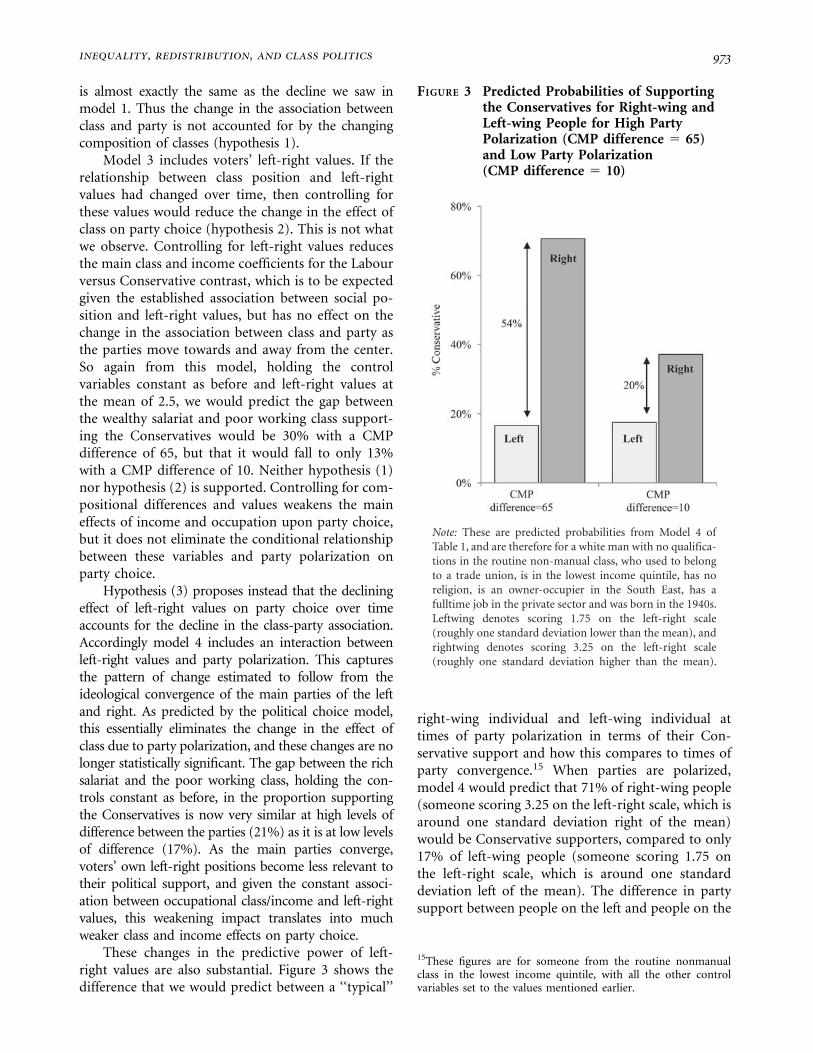
These changes in the predictive power of left-right values are also substantial. Figure 3 shows thedifference that we would predict between a ‘‘typical’’
right-wing individual and left-wing individual attimes of party polarization in terms of their Con-servative support and how this compares to times ofparty convergence.15 When parties are polarized,model 4 would predict that 71% of right-wing people(someone scoring 3.25 on the left-right scale, which isaround one standard deviation right of the mean)would be Conservative supporters, compared to only17% of left-wing people (someone scoring 1.75 onthe left-right scale, which is around one standarddeviation left of the mean). The difference in partysupport between people on the left and people on the
FIGURE 3 Predicted Probabilities of Supportingthe Conservatives for Right-wing andLeft-wing People for High PartyPolarization (CMP difference 5 65)and Low Party Polarization(CMP difference 5 10)
15These figures are for someone from the routine nonmanualclass in the lowest income quintile, with all the other controlvariables set to the values mentioned earlier.
inequality, redistribution, and class politics 973
right is unsurprisingly huge. Yet if the parties aremore centrist, our model predicts that the effect ofleft-right values on party support substantially re-duces. The difference between left- and right-wingvoters, which was 54% with a CMP difference of 65,is only 20% with a CMP difference of 10. Left-rightideology matters to voters’ party choices, but itmatters a lot less when parties are offering policyoptions that do not differ ideologically from oneanother.
Conclusions
It is common to assert that British politics no longerpolarizes around social class. However little progresshas been made in understanding the mechanisms thatcan explain why this major political change hasoccurred. Here we have argued that this dealignmentresults from the declining political relevance of valuesconcerning redistribution and inequality. These resultshold regardless of whether occupation or income isused to measure class position. Whereas conventionalwisdom has emphasized the blurring of boundariesbetween classes, our analysis indicates instead thatdealignment results from the centrist movement of theparties, especially the Labour Party. This has resultedin a weakening of the left-right ideological signals sentto voters by the two main parties and a consequentdecline in the impact of voters’ positions on inequalityand redistribution on their party choice. During thesame period, the relationship between class positionand values remained relatively unchanged: the lattersimply mattered much less for party choice.
Our argument posits that the electorate is respon-sive to the choices offered by parties. If patterns ofparty convergence were not tracked by voter percep-tions, we could not explain why relatively stable classdifferences in resources, opportunities, and valueorientations failed to produce similar class differencesin political choices. The traditional view of the motiva-tional basis of class voting (that it reflects an almostunthinking adherence to organizations representingclass interests) plays no role in our account. Far frombeing a ‘‘throw back’’ to an age of tribalism, classvoting is treated as the rational expression of individ-ual differences in (primarily) economic interests thatcluster as a result of shared characteristics derivingfrom similar incomes and conditions of employment.If parties do not offer programs that differ in theserespects, there is little reason to expect class differencesin party choice. Equally of course, if parties do offer
different programs, then we should see differencesreemerge between the rich and poor. And indeed asthe divisions between the parties grew again slightly inthe late 2000s in Britain, we have seen a weak re-surgence of party choices based on class and income.This pattern is perhaps even more evident in theUnited States, where parties have polarized moresubstantially in recent years, with an associated in-crease in the relationship between income and partychoice (Bartels 2008).
Although the emphasis in our argument is on thedemand side and the choices parties present to voters,this does not indicate that party polarization is notresponsive to social change. Indeed, our assumptionis that it is endogenous: left-wing parties respond tothe shrinking of their working-class support base bybroadening their appeal. However, it could also beargued that the dissipation of class divisions hascaused parties to converge on the middle ground ofleft-right politics as the electoral benefits of a class-based appeal decline. Although possible, this seemsunlikely as the continued presence of occupationalclass and income effects on left-right values suggestthat those divisions in preferences are robust. But wecannot remove the possibility that parties believe,albeit erroneously at the start of this period, that classis longer linked to party choice and therefore adopt acentrist position. Nonetheless, the evidence frominterviews with politicians involved with the NewLabour project suggests that it was the declining sizeof their core constituency that loomed largest in theirconsiderations (Harrop and Shaw 1989; Mandelsonand Liddle 1996; Shaw 1994).16
A further source of endogeneity is that class-partydealignment itself influences party convergence byincreasing the incentives to pursue the support of themedian voter. To the degree that the positions of theparties respond to class dealignment, as well aspotentially causing it, our estimates of party effectswill be inflated. However, the decline in the classbasis of party choice follows the accession of TonyBlair to the leadership of the Labour Party and theconsequent rebranding of the party as centrist ‘‘New’’Labour. It does not precede it. So although theavailable evidence cannot rule out reciprocal influence,the timing of the one-step change in the class-party
16And in this they are correct, for in our data the working classand foremen and supervisor occupational groups make up 48%of the population in 1983, but only 34% by 2010.
974 geoffrey evans and james tilley
association provides support for the argument that inthis case party positioning impacts on class differencesin party choice rather than vice versa.
These caveats aside, what does our analysisimply for the future of class politics? Firstly, classvoting can and should increase over time if partieschoose to polarize along relevant ideologicaldivisions. As Adams, Green, and Milazzo argue:‘‘non-convergence of the British public’s policybeliefs has an important implication for parties’election strategies: namely, that the electoral‘‘market’’ for clearly left- and right-wing socialwelfare policies today has not changed markedlyover the past twenty years’’ (2011, 4). Indeed, given theeconomic crisis that Britain and most of the Westernworld is currently embroiled in, class-related differencesin economic interests might be expected to increaserather than diminish. In principle, this should providea good basis for the mobilization of class basesof electoral support by parties, should they choose todo so.
Secondly, although most of the debates on thedecline of class politics have focused on the dilemmasfaced by parties on the left and how they respond tothem, these are not the only parties that can be theagents of change. Strategic shifts by the Labour Partymay have been prompted by the declining size of theirworking-class constituency, but this is not the onlyparty which seeks votes. As long as there are persistentclass differences in resources and opportunities, thenthere remains the possibility that parties on both theleft and right can emphasize policies that benefit classconstituencies. Thus the Conservative Party, and otherparties of the right such as the Republican Party in theUnited States, can reemphasize class divisions in a formthat differentiates a larger middle class from a smallerworking class. The targeting and demonization of poor,welfare-dependent categories of the electorate is, per-haps, an expression of this manifestation of ‘‘right-wing class politics.’’
Finally, though our focus here is on the classcleavage, which in the British context is historicallythe most prominent social basis of political choice,in other societies it could be cleavages relating toreligion or ethnicity that are to some degree shapedby what parties offer with respect to program orpolicy differentiation. The message that partiescan and do shape social divisions to politics neednot be limited therefore to understanding classpolitics, but to understanding how differences inpreferences in any socially divided society can beaccentuated or attenuated by the supply of relevantparty signals.
Acknowledgments
We would like to thank the editors and the anonymousreviewers for The Journal of Politics, whose thoughtfulcomments and suggestions have greatly improved thearticle.
References
Adams, James, Jane Green, and Caitlin Milazzo. 2011. ‘‘Has theBritish Public Depolarized along with Political Elites?An American Perspective on British Public Opinion.’’Comparative Political Studies, November 7, 2011doi:10.1177/0010414011421764.
Ansolabehere, Stephen, Jonathan Rodden, and James N. Snyder,Jr. 2008. ‘‘The Strength of Issues: Using Multiple Measures toGauge Preference Stability, Ideological Constraint, and IssueVoting.’’ American Political Science Review 102 (2): 215–32.
Bara, Judith. 2006. ‘‘The 2005 Manifestos: A Sense of Deja Vu?’’Journal of Elections, Public Opinion and Parties 16 (3): 265–81.
Bartels, Larry M. 2008. Unequal Democracy: The PoliticalEconomy of the New Gilded Age. New York: Russell SageFoundation.
Budge, Ian. 1999. ‘‘Party Policy and Ideology: Reversingthe 1950s.’’ In Critical Elections: British Parties and Voters inLong-Term Perspective, ed. Geoffrey Evans and Pippa Norris.London: Sage, 1–21.
Budge, Ian, Hans-Dieter Klingemann, Andrea Volkens, andJudith Bara. 2001. Mapping Policy Preferences, Estimates forParties, Governments and Electors 1945–1998. Oxford: OxfordUniversity Press.
Campbell, Angus, Phillip E. Converse, Warren E. Miller, andDonald E. Stokes. 1960. The American Voter. Chicago:University of Chicago Press.
Clarke, Harold, David Sanders, Marianne Stewart, and PaulWhitely. 2004. Political Choice in Britain. Oxford, UK: OxfordUniversity Press.
Converse, Phillip. 1958. ‘‘The Shifting Role of Class in PoliticalAttitudes and Behaviour.’’ In Readings in Social Psychology,3rd ed., ed. E. E. Maccoby, T. M. Newcomb, and E. L. Hartley.New York: Holt, 388–99.
Curtice, John. 2009. ‘‘Back in Contention? The Conservatives’Electoral Prospects.’’ Political Quarterly 80 (2): 172–83.
Dalton, Russell. 2008. Citizen Politics: Public Opinion and PoliticalParties in Advanced Industrial Democracies. 5th ed. Chatham,NJ: Chatham House Publishers.
Elff, Martin. 2009. ‘‘Social Divisions, Party Positions, andElectoral Behaviour.’’ Electoral Studies 28 (2): 297–308.
Erikson, Robert, and John H. Goldthorpe. 1992. The ConstantFlux. A Study of Class Mobility in Industrial Societies. Oxford,UK: Clarendon Press.
Evans, Geoffrey. 1993. ‘‘The Decline of Class Divisions in Britain?Class and Ideological Preferences in the 1960s and the 1980s.’’British Journal of Sociology 44 (3): 449–71.
Evans, Geoffrey. 2000. ‘‘The Continued Significance of ClassVoting.’’ Annual Review of Political Science 3:401–17.
Evans, Geoffrey, Anthony Heath, and Mansur Lalljee. 1996.‘‘Measuring Left-Right and Libertarian-Authoritarian Valuesin the British Electorate.’’ British Journal of Sociology 47 (1):93–112.
inequality, redistribution, and class politics 975
Evans, Geoffrey, Anthony Heath, and Clive Payne. 1991.‘‘Modelling the Class/Party Relationship 1964–87.’’ ElectoralStudies 10 (1): 99–117.
Evans, Geoffrey, Anthony Heath, and Clive Payne. 1999. ‘‘Class:Labour as a Catch All Party?’’ In Critical Elections: BritishParties and Voters in Long-Term Perspective, ed. GeoffreyEvans and Pippa Norris. London: Sage, 87–101.
Evans, Geoffrey, and Colin Mills. 1998. ‘‘Identifying ClassStructure: A Latent Class Analysis of the Criterion-Relatedand Construct Validity of the Goldthorpe Class Schema.’’European Sociological Review 14 (1): 87–106.
Evans, Geoffrey, and James Tilley. 2012. ‘‘How Parties ShapeClass Politics: Explaining the Decline of the Class Basis of PartySupport.’’ British Journal of Political Science 42 (1): 137–61.
Feldman, Stanley. 1988. ‘‘Structure and Consistency in PublicOpinion: The Role of Core Beliefs and Values.’’ AmericanJournal of Political Science 32 (3): 416–40.
Franklin, Mark. 1985. The Decline of Class Voting in Britain:Changes in the Basis of Electoral Choice, 1964 1983. Oxford,UK: Clarendon Press.
Franklin, Mark, Tom Mackie, Henry Valen, et al. 1992. ElectoralChange: Responses to Evolving Social and Attitudinal Structuresin Western Countries. Cambridge: Cambridge University Press.
Goldthorpe, J. H., and A. McKnight. 2006. ‘‘The Economic Basisof Social Class.’’ In Mobility and Inequality: Frontiers ofResearch in Sociology and Economics, ed. Steven L. Morgan,David B. Grusky, and Gary S. Fields. Stanford, CA: StanfordUniversity Press, 109–36.
Goren, Paul. 2005. ‘‘Party Identification and Core PoliticalValues.’’ American Journal of Political Science 49 (4): 881–96.
Green, Jane. 2007. ‘‘When Voters and Parties Agree: ValenceIssues and Party Competition.’’ Political Studies 55 (3):629–55.
Green, Jane. 2011. ‘‘A Test of Core Vote Theories: The BritishConservatives, 1997–2005.’’ British Journal of Political Science41 (4): 735–64.
Green, Jane, and Sara Hobolt. 2008. ‘‘Owning the Issue Agenda:Party Strategies and Vote Choices in British Elections.’’Electoral Studies 27 (3): 460–76.
Harrop, Martin, and Andrew Shaw. 1989. Can Labour Win?London: Unwin Hyman.
Heath, Anthony, Geoffrey Evans, and Jean Martin. 1994. ‘‘TheMeasurement of Core Beliefs and Values: The Development ofBalanced Socialist/Laissez-Faire and Libertarian/AuthoritarianScales.’’ British Journal of Political Science 24 (1): 115–32.
Heath, Anthony, Roger Jowell, and John Curtice. 1985. HowBritain Votes. Oxford, UK: Pergamon Press.
Hellwig, Timothy. 2008. ‘‘Explaining the Salience of Left-RightIdeology in Post-Industrial Democracies: The Role ofStructural Economic Change.’’ European Journal of PoliticalResearch 47 (6): 687–709.
Kelley, Jonathan, Ian McAllister, and Anthony Mughan. 1985.‘‘The Decline of Class Revisited: Class and Party in England,
1964–1979.’’ American Political Science Review 79 (3):719–37.
Kitschelt, Herbert. 1994. The Transformation of European SocialDemocracy. Cambridge: Cambridge University Press.
Leighley, Jan E., and Jonathan Nagler. 1992. ‘‘SocioeconomicClass Bias in Turnout, 1964–1988: The Voters Remain theSame.’’ American Political Science Review 86 (3): 725–36.
Leighley, Jan E., and Jonathan Nagler. 2007. Unions, VoterTurnout, and Class Bias in the U.S. Electorate, 1964–2004.Journal of Politics 69 (2): 430–41.
Lewis-Beck, Michael S., William G. Jacoby, Helmut Norpoth, andHerbert F. Weisberg. 2008). The American Voter Revisited.Ann Arbor: University of Michigan Press.
Lipset, Seymour Martin. 1991. ‘‘No Third Way: A ComparativePerspective on the Left.’’ In The Crisis of Leninism and theDecline of the Left, ed. D. Chirot. Seattle: University ofWashington Press, 183–232.
Mair, Peter, Wolfgang Muller, and Fritz Plasser. 2004.‘‘Introduction: Electoral Challenges and Party Responses.’’In Political Parties and Electoral Change, ed. Peter Mair,Wolfgang Muller, and Fritz Plasser. London: Sage, 1–19.
Mandelson, Peter, and Roger Liddle. 1996. The Blair Revolution:Can New Labour Deliver? London: Faber & Faber.
McDonald, Michael, and Ian Budge. 2005. Elections, Parties, andDemocracy: Conferring the Median Mandate. Oxford, UK:Oxford University Press.
Oskarson, Maria. 2005. ‘‘Social Structure and Party Choice.’’ InThe European Voter, ed. J. Thomassen. Oxford, UK: OxfordUniversity Press, 84–105.
Przeworski, Adam. 1985. Capitalism and Social Democracy.Cambridge: Cambridge University Press.
Rehm, Philipp, and Timothy Reilly. 2010. ‘‘United We Stand:Constituency Homogeneity and Comparative Party Polar-ization.’’ Electoral Studies 29 (1): 40–53.
Rose, Richard, and Ian McAllister. 1986. Voters Begin to Choose:From Closed-Class to Open Elections in Britain. London: Sage.
Shaw, Eric. 1994. The Labour Party since 1979: Crisis andTransformation. London: Routledge.
Webb, Paul. 2004. ‘‘Party Responses to the Changing ElectoralMarkets in Britain.’’ In Political Parties and Electoral Change,ed. Peter Mair, Wolfgang Muller, and Fritz Plasser. London:Sage, 20–48.
Geoffrey Evans is Professor at the Universityof Oxford and Official Fellow in Politics, NuffieldCollege, Oxford, OX1 1NF, UK.
James Tilley is a University Lecturer in Quanti-tative Political Science at the University of Oxfordand Fellow of Jesus College, Oxford, OX1 3DW, UK.
976 geoffrey evans and james tilley
Related Documents