The “Delaware Study” Full Name: The University of Delaware National Study of Instructional Costs and Productivity Initiated in 1992 by researchers at the University of Delaware

The “Delaware Study” Full Name: The University of Delaware National Study of Instructional Costs and Productivity Initiated in 1992 by researchers at the.
Dec 16, 2015
Welcome message from author
This document is posted to help you gain knowledge. Please leave a comment to let me know what you think about it! Share it to your friends and learn new things together.
Transcript

The “Delaware Study”
Full Name: The University of Delaware National Study of Instructional Costs and Productivity
Initiated in 1992 by researchers
at the University of Delaware
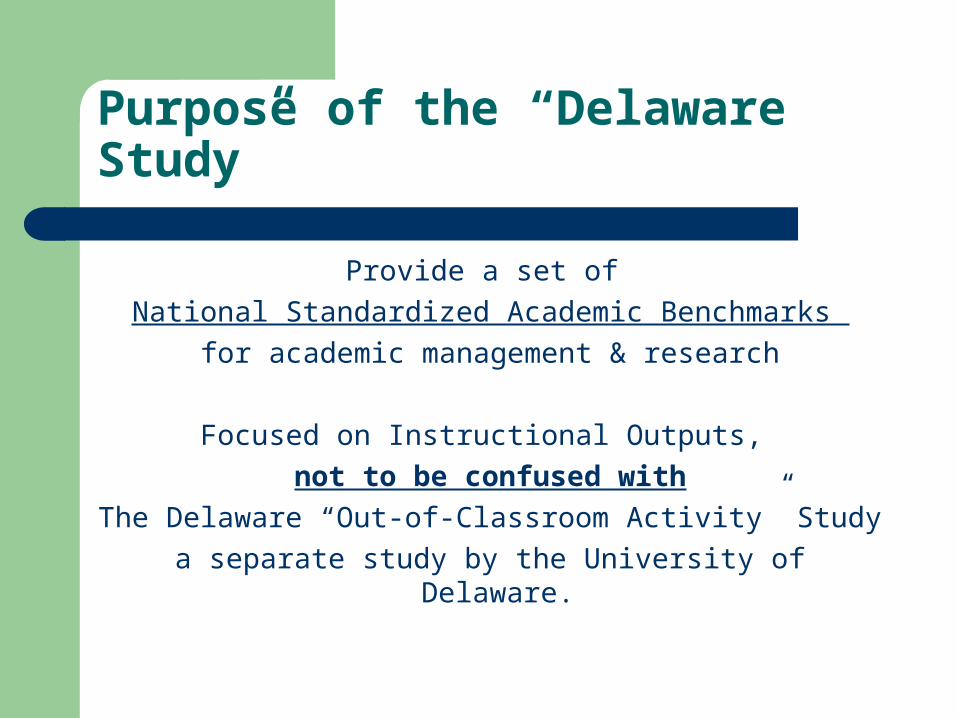
Purpose of the “Delaware Study”
Provide a set of
National Standardized Academic Benchmarks
for academic management & research
Focused on Instructional Outputs,
not to be confused with
The Delaware “Out-of-Classroom Activity” Study
a separate study by the University of Delaware.

How is the Study Conducted?
Invitation to U.S. public and private universities and colleges
Participating institutions complete a ‘Data Collection Form’ giving
course, faculty, and cost/expenditure data
Data analyzed by the University of Delaware; results sent to institutions.

Who Participates?
In 2005-06
Over 200 participating institutions
from 39 states
including 47 Research Institutions

What are the “National Standardized Benchmarks”?
Measures of:
PRODUCTIVITY: Faculty teaching workloads credit hours / full-time equated faculty (FTEF)
COST OF INSTRUCTION: $ (direct instructional cost) / credit hour
SCHOLARLY ACTIVITY: $ (separately budgeted scholarly activity)
by Academic Discipline

What are the “Academic Disciplines”?
The U.S. Department of Education provides a “Classification of Instructional Programs (CIP),”
a listing of different academic programs
Wayne State utilizes approximately 80 of these Academic Disciplines in classifying its Course Subject Offerings.
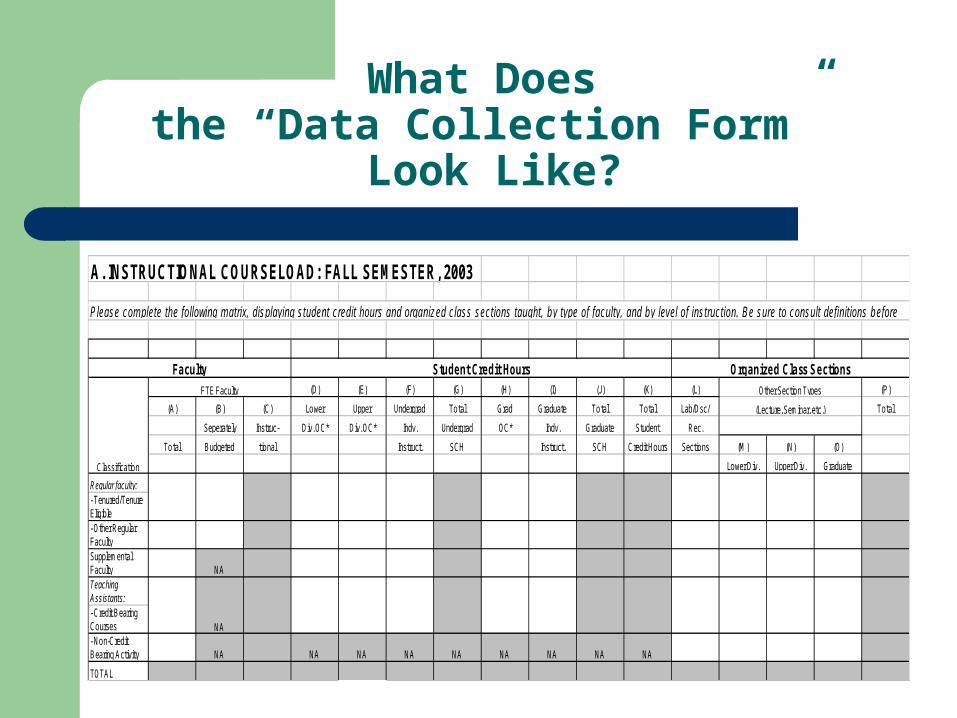
What Does the “Data Collection Form”
Look Like?
A. INSTRUCTIONAL COURSELOAD: FALL SEMESTER, 2003
(D) (E) (F) (G) (H) (I) (J ) (K) (L) (P )
(A) (B) (C) Lower Upper Undergrad Total Grad Graduate Total Total Lab/Dsc/ Total
Seperately Instruc- Div. OC* Div. OC* Indv. Undergrad OC* Indv. Graduate Student Rec.
Total Budgeted tional Instruct. SCH Instruct. SCH Credit Hours Sections (M) (N) (O)
Lower Div. Upper Div. Graduate
Regular faculty:- Tenured/Tenure Eligible- Other Regular FacultySupplemental Faculty NATeaching Assistants:- Credit Bearing Courses- Non-Credit Bearing Activity NA NA NA NA NA NA NA NA NA
TOTAL
NA
Classification
FTE Faculty Other Section Types
(Lecture, Seminar, etc.)
Please complete the following matrix, displaying student credit hours and organized class sections taught, by type of faculty, and by level of instruction. Be sure to consult definitions before
Faculty Student Credit Hours Organized Class Sections
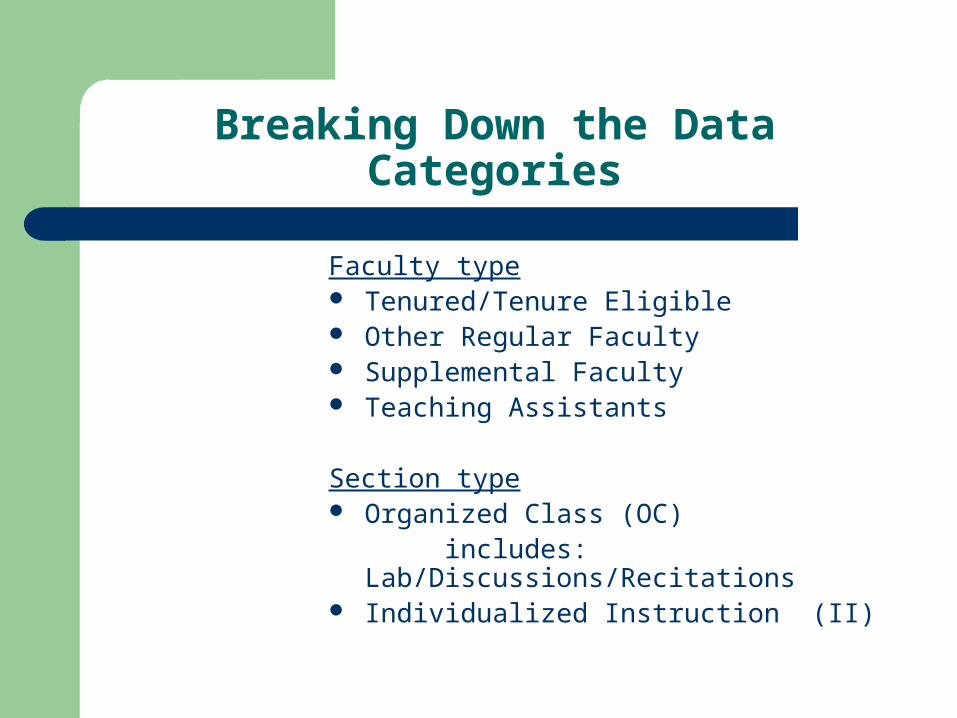
Breaking Down the Data Categories
Faculty type Tenured/Tenure Eligible Other Regular Faculty Supplemental Faculty Teaching Assistants
Section type Organized Class (OC)
includes: Lab/Discussions/Recitations Individualized Instruction (II)
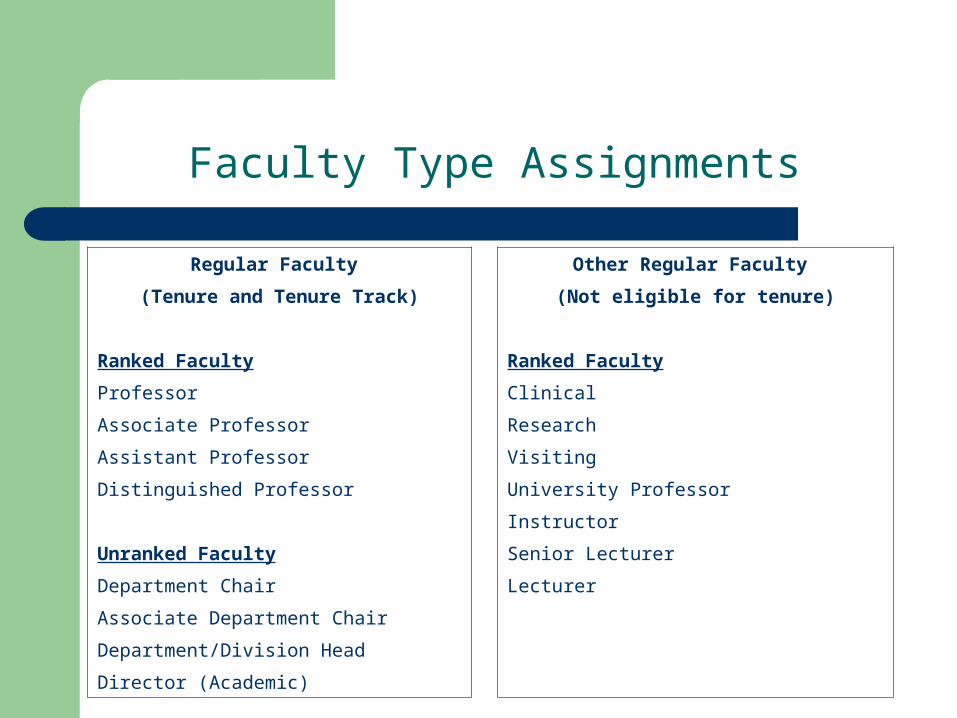
Faculty Type Assignments
Regular Faculty Other Regular Faculty
(Tenure and Tenure Track) (Not eligible for tenure)
Ranked Faculty Ranked Faculty
Professor Clinical
Associate Professor Research
Assistant Professor Visiting
Distinguished Professor University Professor
Instructor
Unranked Faculty Senior Lecturer
Department Chair Lecturer
Associate Department Chair
Department/Division Head
Director (Academic)

Faculty Type Assignments-Cont’d
Supplemental Faculty Teaching Assistants
(Non-recurring appointments)
All Part-time Faculty Classifications
Part-time Faculty
All graduate assistants EXCEPT Graduate Research Assistants
Hourly Part-time Faculty
Summer Assignment of 9 month Faculty
Part-time Faculty-University Employee, Additional Service, with or without retirement.

Individualized Instruction Courses
ANT 7994 DIR STD: MDCL ANT
ANT 7995 DIRECTED STUDY
ANT 7998 FIELD PROBLEM
ANT 7999 MASTERS ESSAY DIR
ANT 9990 PREDOC CAND RSCH
ANT 9991 DOC CAND STATUS 1
ANT 9992 DOC CAND STATUS 2
ANT 9993 DOC CAND STATUS 3
ANT 9994 DOC CAND STATUS 4
ANT 9995 DOC CAND MNTCE STUS
ANT 9999 DOCT DISS RSCH&DIR
APA 5810 DIR PRJ: PAINTING
APH 5850 DIR PRJ: PHOTOGRAPHY
APH 8850 MFA STUDIO: PHOT
APR 5840 DIR PRJ: PRINTMAKING
ARB 3990 DIRECTED STUDY
ASL 5810 SPEC TPCS IN SCULPT
ASL 8820 MFA STUDIO: SCLPT
ASN 3540 INTNSV JAPANESE
AUD 6020 PHYS CNCPTS: CLIN APP
AUD 6310 CLINCL PRCTM SERIES
AUD 7990 DIR STUDY
BBE 6600 INTSHP: BBE TEACHING
BEP 5000 BRAZIL EXCHANGE PROGRAM
BEP 7000 BRAZIL EXCHANGE PROGRAM
BIO 2990 MARC SEMINAR
BIO 3990 DIRECTED STUDY

3 Important Caveatsin Using the Study

Caveat #1The Relationship between Course Subject and Academic Discipline
There is NOT a 1:1 relationship between Academic Department and Academic Discipline. The relationship is 1:Many.
Example:
Sociology Department
(College of Liberal Arts and Sciences)
CIP Code45.11
Sociology
College of Social Work
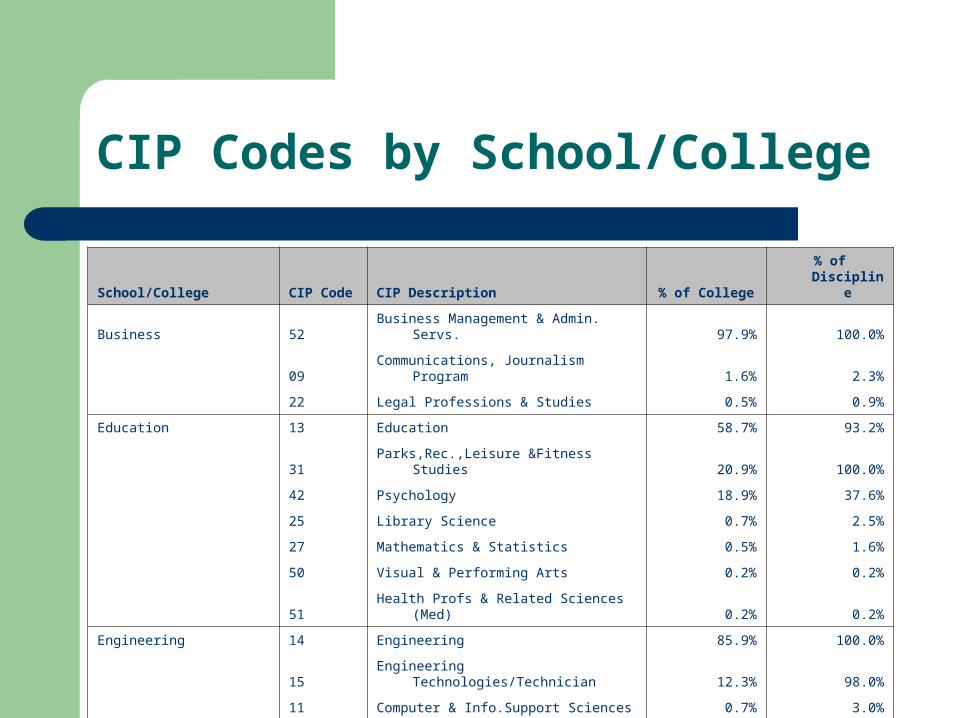
CIP Codes by School/College
School/College CIP Code CIP Description % of College % of Discipline
Business 52 Business Management & Admin. Servs. 97.9% 100.0%
09 Communications, Journalism Program 1.6% 2.3%
22 Legal Professions & Studies 0.5% 0.9%
Education 13 Education 58.7% 93.2%
31 Parks,Rec.,Leisure &Fitness Studies 20.9% 100.0%
42 Psychology 18.9% 37.6%
25 Library Science 0.7% 2.5%
27 Mathematics & Statistics 0.5% 1.6%
50 Visual & Performing Arts 0.2% 0.2%
51 Health Profs & Related Sciences (Med) 0.2% 0.2%
Engineering 14 Engineering 85.9% 100.0%
15 Engineering Technologies/Technician 12.3% 98.0%
11 Computer & Info.Support Sciences 0.7% 3.0%
27 Mathematics & Statistics 0.5% 1.0%
30 Multi/interdisciplinary Studies 0.5% 9.1%

School/College CIP Code CIP Description % of College % of Discipline
Fine, Performing and Comm Arts 50 Visual & Performing Arts 78.9% 99.8%
09 Communications, Journalism Program 19.6% 92.5%
23 English Language & Literature/Lette 1.1% 2.7%
05 Area,Ethnic,Cultural&Gender Studies 0.2% 1.9%
13 Education 0.2% 0.3%
22 Legal Professions & Studies 0.2% 0.9%
Graduate School 25 Library Science 72.9% 22.2%
13 Education 22.9% 2.9%
45 Social Sciences 2.1% 0.2%
54 History 2.1% 0.8%
Law 22 Legal Professions & Studies 100.0% 94.5%
Liberal Arts and Science 40 Physical Sciences 24.2% 99.9%
45 Social Sciences 13.0% 90.6%
26 Biological & Biomedical Sciences 11.2% 72.7%
23 English Language & Literature/Lette 8.9% 96.2%
16 Foreign Languages, Lit. & Linguisti 7.8% 99.5%
42 Psychology 6.7% 62.0%
27 Mathematics & Statistics 6.7% 96.9%
54 History 4.6% 97.7%
38 Philosophy & Religious Studies 3.5% 100.0%
11 Computer & Info.,Support Sciences 3.4% 95.0%
44 Public Admin.&Social Service Profs. 3.4% 100.0%

School/College CIP Code CIP Description % of College % of Discipline
Liberal Arts and Sciences, Cont'd. 05 Area,Ethnic,Cultural&Gender Studies 1.6% 86.5%
51 Health Profs&Related Sciences(Med) 1.4% 7.4%
19 Family & Consumer, Human Sciences 1.0% 100.0%
24 Liberal Arts & Sci.,Gen Studies&Hum 0.8% 100.0%
43 Criminal Justice Administration 0.8% 95.7%
30 Multi/interdisciplinary Studies 0.4% 50.0%
13 Education 0.2% 1.6%
25 Library Science 0.2% 3.2%
09 Communications, Journalism Program 0.1% 3.0%
22 Legal Professions & Studies 0.1% 3.7%
15 Engineering Technologies/Technician 0.0% 2.0%
Medicine 26 Biological & Biomedical Sciences 77.2% 26.6%
51 Health Profs&Related Sciences(Med) 20.1% 5.7%
13 Education 2.0% 0.8%
42 Psychology 0.7% 0.3%
Nursing 51 Health Profs&Related Sciences(Med) 100.0% 37.8%

School/College CIP Code CIP Description % of College % of Discipline
Pharmacy and Health Sciences 51 Health Profs&Related Sciences(Med) 84.4% 37.1%
12 Mortuary Science 10.8% 100.0%
25 Library Science 3.9% 5.7%
13 Education 0.4% 0.3%
43 Criminal Justice Administration 0.4% 4.3%
University Libraries 25 Library Science 55.8% 60.8%
51 Health Profs&Related Sciences(Med) 36.0% 11.8%
13 Education 2.3% 1.1%
45 Social Sciences 2.3% 1.0%
23 English Language & Literature/Lette 1.7% 1.1%
09 Communications, Journalism Program 0.6% 0.8%
16 Foreign Languages, Lit. & Linguisti 0.6% 0.5%
40 Physical Sciences 0.6% 0.1%
Urban, Labor and Metro Affairs 45 Social Sciences 49.3% 8.2%
25 Library Science 13.4% 5.7%
30 Multi/interdisciplinary Studies 13.4% 40.9%
05 Area,Ethnic,Cultural&Gender Studies 9.0% 11.5%
26 Biological & Biomedical Sciences 4.5% 0.7%
09 Communications, Journalism Program 3.0% 1.5%
11 Computer & Info.,Support Sciences 3.0% 2.0%
54 History 3.0% 1.5%
27 Mathematics & Statistics 1.5% 0.5%

Caveats #2 Course Subject Classification
Given that the Delaware Study is intended as a cost study, classification of a course is by the instructional account paying for the instructor.
In some instances, this is not the same as the department offering the course.
A detailed breakdown is given in Appendix D of the Report.
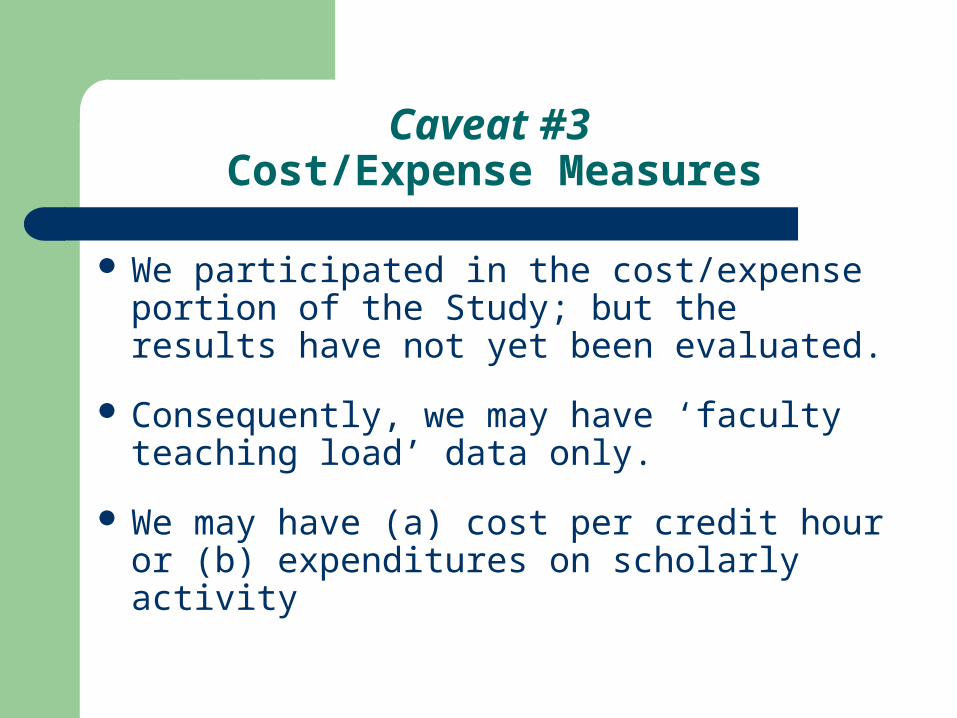
Caveat #3 Cost/Expense Measures
We participated in the cost/expense portion of the Study; but the results have not yet been evaluated.
Consequently, we may have ‘faculty teaching load’ data only.
We may have (a) cost per credit hour or (b) expenditures on scholarly activity
An Additional Caveat
2nd year of Wayne State’s Participation, fewer data issues required resolution.
Data deemed usable, with appropriate caution for possible outlying anomalies
Content of the Study
Summary Tables & Charts Table A- Faculty Teaching Workloads (SCH/FTEF) Table B- % Distribution of SCH by Faculty Category Table C- % Distribution of SCH by Course Level
For Table A-C above:-Summary-Detail-Charts
Quartiles for Table A - SCH and Class Sections Appendices

Total Total Total Total N SCH/FTE SCH/FTE SCH/FTE SCH/FTE
Wayne State University 1 190 274 444 132Research 47 194 376 336 297Doctoral 33 174 293 298 235Comprehensive 73 198 245 265 214
N % UG % GR % UG % GR % UG % GR % UG % GRWayne State University 1 39 73 17 10 32 12 10 0Research 47 46 83 17 5 16 8 12 0Doctoral 33 46 77 16 5 20 8 5 0Comprehensive 73 55 76 10 3 18 9 0 0
% UG % GR % UG % GRN OC+II OC+II OC+II OC+II
Wayne State University 1 67 31 64 18Research 47 72 26 83 15Doctoral 33 73 21 79 13Comprehensive 73 79 15 82 10
Table A - TotalsStudent Credit Hours per FTE Faculty
Tenured/Tenure-Track, Other Regular Faculty, Supplemental Faculty and Teaching Assistants
Tenure/Tenure Track Other Regular
Table C - TotalsNormative Percent of Student Credit Hours by Course Level within Faculty Category
Tenure/Tenure-Track and Other Regular Faculty
Tenure/Tenure Track Other Regular Supplemental Teaching Assistants
Table B - TotalsNormative Percent of Student Credit Hours Across Faculty Category and Course Level
Tenure/Tenure Track Other Regular Supplemental Teaching Assistants
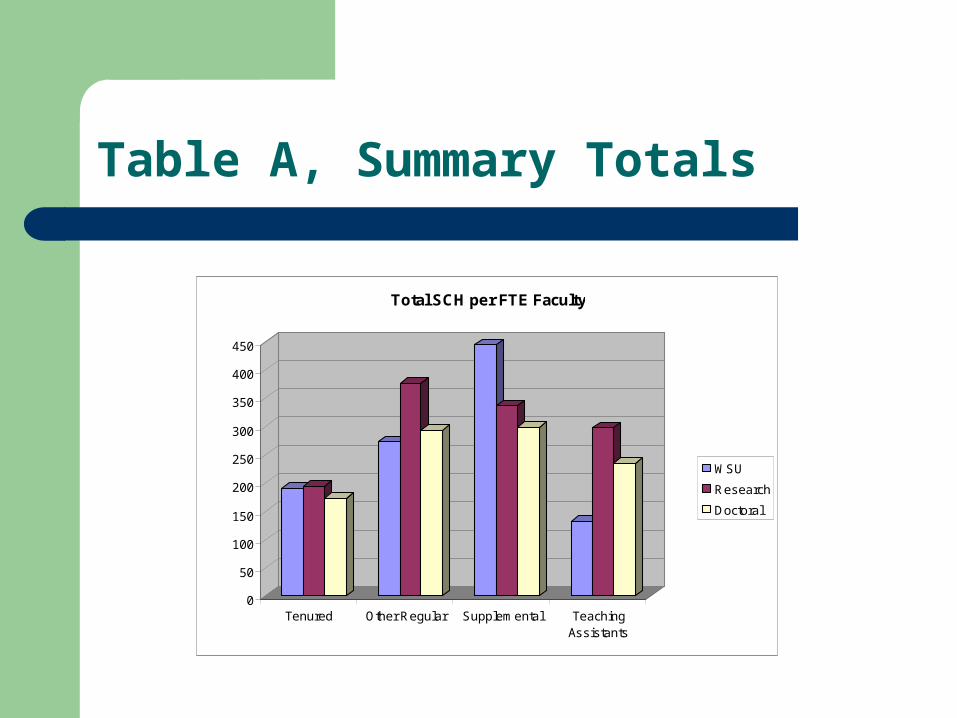
Table A, Summary Totals
0
50
100
150
200
250
300
350
400
450
Tenured Other Regular Supplemental TeachingAssistants
Total SCH per FTE Faculty
WSU
Research
Doctoral

Table A, “Student Credit Hours Per FTE”
FTE FTE FTE FTE Total Students Total Students Total Students Total Students
CIP Discipline/Carnegie Classification N SCH Taught SCH Taught SCH Taught SCH Taught 23.01 English Language and Literature, General
Wayne State University 1 163 12.2 188 12.7 363 24.3 302 20.1Research 47 144 10.7 250 17.0 263 17.7 263 17.5Doctoral 33 146 10.9 246 16.6 263 17.9 244 16.3Comprehensive 67 212 14.4 259 17.3 258 17.3 272 18.1Urban 10 150 11.2 259 13.8 249 16.6 273 18.2
Tenure/Tenure Track Other Regular Supplemental Teaching Assistants
Table A - Summary
Student Credit Hours per FTE FacultyTenured/Tenure-Track, Other Regular Faculty, Supplemental Faculty and Teaching Assistants
(Based on Fall 2003 Data)

Chart A, “Student Credit Hours per FTE Faculty”
0
5
10
15
20
25
Tenure Other Regular Supplemental Teaching Assts
Undergrad/Grad FTE Students Taught
WSU
Research
Doctoral
Urban

Table B, “Normative Percent of Student Credit Hours across Faculty Category”
CIP Discipline/Carnegie ClassificationN% UG % Gr % UG % Gr % UG % Gr % UG % Gr % UG % Gr
14.19 Mechanical Engineering Wayne State University1 92 67 0 0 2 33 6 0 100 100Research 38 80 94 7 1 10 5 1 0 98 100Doctoral 13 73 86 5 0 18 13 0 0 96 99Comprehensive 13 82 93 11 0 7 5 0 0 100 98
TotalTenure/Tenure Track Other Regular Faculty Supplemental Faculty Teaching Assistants
Table B - Summary
Normative Percent of Student Credit Hours Across Faculty Category and Course LevelTenured/Tenure-Track, Other Regular Faculty, Supplemental Faculty and Teaching Assistants
(Based on Fall 2003 Data)
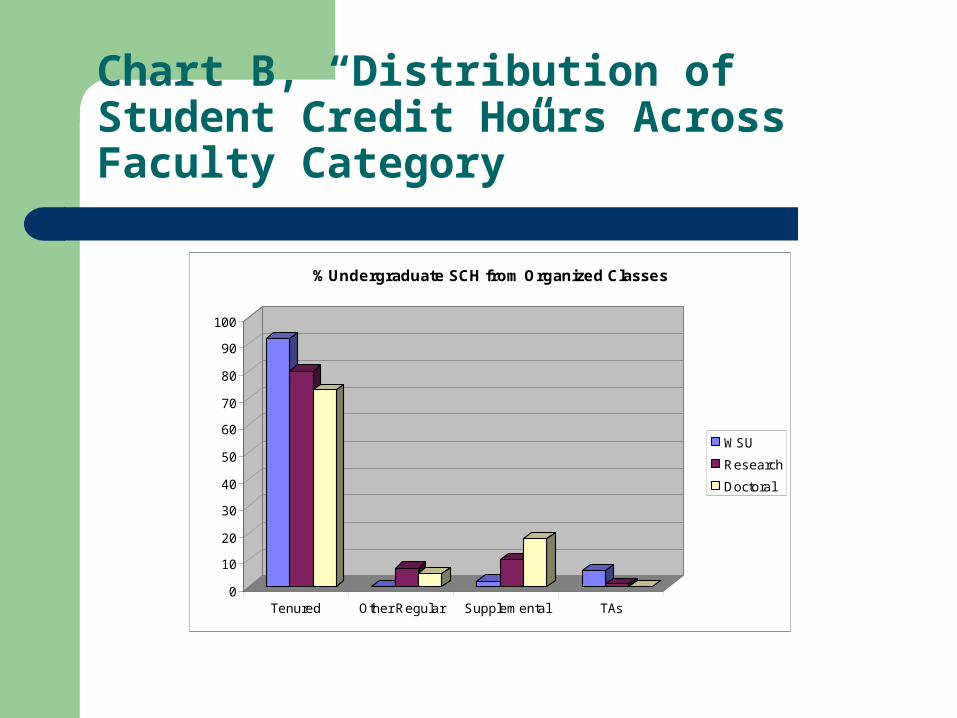
Chart B, “Distribution of Student Credit Hours Across Faculty Category”
0
10
20
30
40
50
60
70
80
90
100
Tenured Other Regular Supplemental TAs
% Undergraduate SCH from Organized Classes
WSU
Research
Doctoral

Table C, “Normative Percent of Student Credit Hours within Faculty Category”
% UG % GR % UG % GR
CIP Discipline/Carnegie Classification N OC+II OC+II OC+II OC+II16.09 Romance Languages, Literatures, and Linguistics, General
Wayne State University 1 86 14 100 0Research 21 82 19 99 1Doctoral 5 81 19 97 3Comprehensive 21 100 3 100 0
Tenure/Tenure Track Other Regular Faculty
Table C - Summary
Normative Percent of Student Credit Hours across Course Level within Faculty CategoryTenure/Tenure-Track and Other Regular Faculty

Chart C, “Percent of Student Credit Hours within Faculty Category”
0
10
20
30
40
50
60
70
80
90
Undergraduate Graduate
Percent of SCH for Tenure, Tenure-Track Faculty
WSU
Research
Doctoral
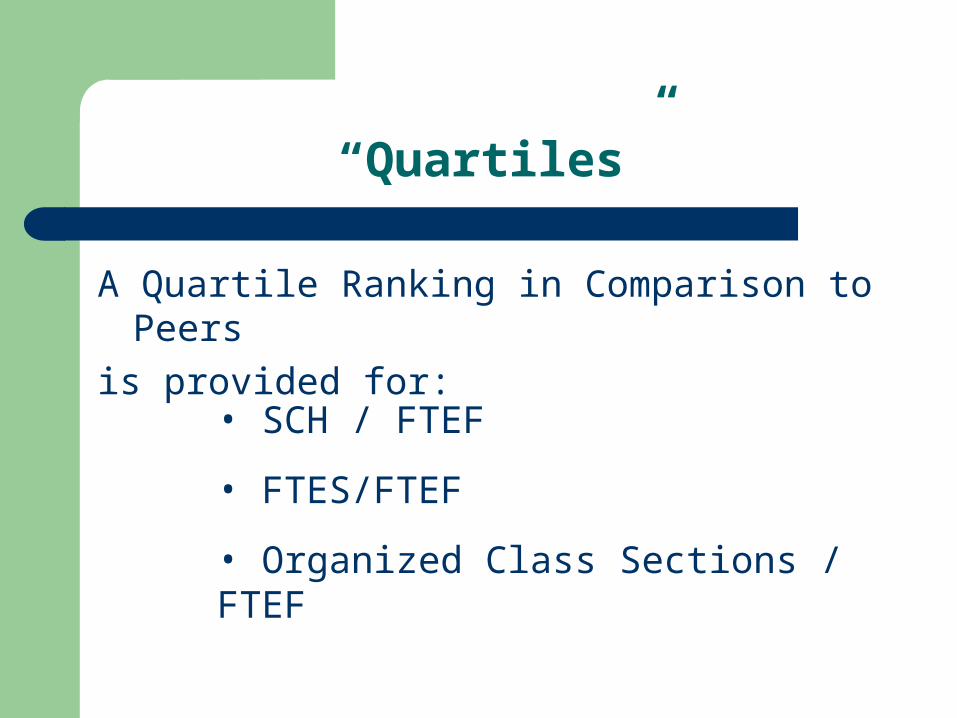
“Quartiles”
A Quartile Ranking in Comparison to Peers
is provided for:
• SCH / FTEF
• FTES/FTEF
• Organized Class Sections / FTEF
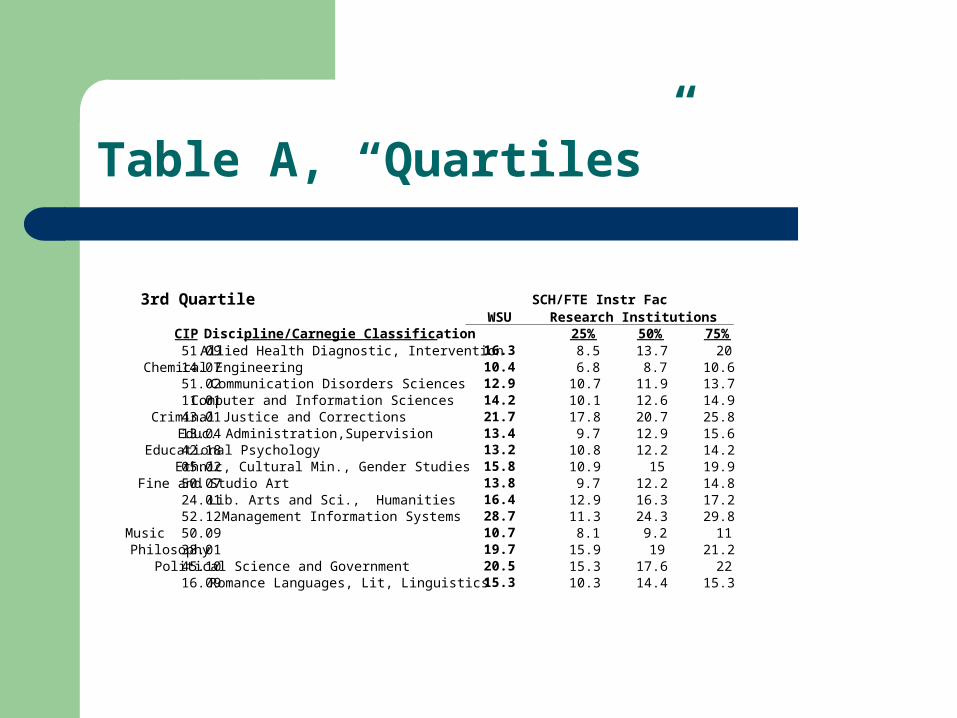
Table A, “Quartiles”
WSUCIP Discipline/Carnegie Classification 25% 50% 75%
51.09 Allied Health Diagnostic, Intervention 16.3 8.5 13.7 2014.07 Chemical Engineering 10.4 6.8 8.7 10.651.02 Communication Disorders Sciences 12.9 10.7 11.9 13.711.01 Computer and Information Sciences 14.2 10.1 12.6 14.943.01 Criminal Justice and Corrections 21.7 17.8 20.7 25.813.04 Educ. Administration,Supervision 13.4 9.7 12.9 15.642.18 Educational Psychology 13.2 10.8 12.2 14.205.02 Ethnic, Cultural Min., Gender Studies 15.8 10.9 15 19.950.07 Fine and Studio Art 13.8 9.7 12.2 14.824.01 Lib. Arts and Sci., Humanities 16.4 12.9 16.3 17.252.12 Management Information Systems 28.7 11.3 24.3 29.850.09 Music 10.7 8.1 9.2 1138.01 Philosophy 19.7 15.9 19 21.245.10 Political Science and Government 20.5 15.3 17.6 2216.09 Romance Languages, Lit, Linguistics 15.3 10.3 14.4 15.3
3rd Quartile SCH/FTE Instr FacResearch Institutions

Closing Considerations
Why Participate in the Delaware Study?
Comparisons are made at the academic discipline level of analysis.
Teaching workloads are analyzed by faculty type, i.e., tenured and tenure track;
other permanent faculty; supplemental faculty; and graduate teaching
assistants.
Participants can define their own peer groups.
The data definitions, methodology and data collection tools are regularly
reviewed by representatives from participating institutions.
The Delaware Study is longitudinal, and enables you to track trend data over
extended periods of time.
The measures enjoy widespread national acceptance and use.
Contact Information
Paul N. Moniodis
Executive Director, Institutional Research
1309 Faculty/Administration Building
(313) 577-5743
Related Documents