The degree of astrocyte activation in multiple system atrophy is inversely proportional to the distance to α-synuclein inclusions Rowan Radford a , Alex Rcom-H'cheo-Gauthier a , Mathew B. Wong a , Emma D. Eaton b , Marion Quilty b , Catherine Blizzard b , Anwar Norazit c , Adrian Meedeniya a , James C. Vickers b , Wei Ping Gai d , Gilles J. Guillemin e , Adrian K. West b , Tracey C. Dickson b , Roger Chung e , Dean L. Pountney a, ⁎ a Menzies Health Institute Queensland, Griffith University, Gold Coast, Australia b Menzies Research Institute Tasmania, University of Tasmania, Hobart, Australia c Department of Biomedical Science, Faculty of Medicine, University of Malaya, Kuala Lumpur, Malaysia d School of Human Physiology, Flinders University of South Australia, Adelaide, Australia e School of Advanced Medicine, Macquarie University, Sydney, Australia abstract article info Article history: Received 9 May 2014 Revised 17 February 2015 Accepted 26 February 2015 Available online 27 February 2015 Keywords: Alpha-synuclein Multiple system atrophy Neuroinflammation Progressive supranuclear palsy Quantitative morphometry Multiple system atrophy (MSA) exhibits widespread astrogliosis together with α-synuclein (α-syn) glial cyto- plasmic inclusions (GCIs) in mature oligodendrocytes. We quantified astrocyte activation by morphometric anal- ysis of MSA cases, and investigated the correlation to GCI proximity. Using Imaris software, we obtained “skinned” three-dimensional models of GFAP-positive astrocytes in MSA and control tissue (n = 75) from con- focal z-stacks and measured the astrocyte process length and thickness and radial distance to the GCI. Astrocytes proximal to GCI-containing oligodendrocytes (r b 25 μm) had significantly (p, 0.05) longer and thicker processes characteristic of activation than distal astrocytes (r N 25 μm), with a reciprocal linear correlation (m, 90 μm 2 ) be- tween mean process length and radial distance to the nearest GCI (R 2 , 0.7). In primary cell culture studies, α-syn addition caused ERK-dependent activation of rat astrocytes and perinuclear α-syn inclusions in mature (MOSP- positive) rat oligodendrocytes. Activated astrocytes were also observed in close proximity to α-syn deposits in a unilateral rotenone-lesion mouse model. Moreover, unilateral injection of MSA tissue-derived α-syn into the mouse medial forebrain bundle resulted in widespread neuroinflammation in the α-syn-injected, but not sham-injected hemisphere. Taken together, our data suggests that the action of localized concentrations of α-syn may underlie both astrocyte and oligodendrocyte MSA pathological features. © 2015 Elsevier Inc. All rights reserved. 1. Introduction Neurodegenerative diseases cause malfunction and declining struc- tural integrity in the central nervous system, which leads to characteristic motor, cognitive, and/or behavioural abnormalities. Another common feature in many neurodegenerative diseases is the presence of abnormal microscopically-visible intracellular protein deposits or inclusion bodies (IBs) (Richter-landsberg and Leyk, 2013). Multiple system atrophy (MSA) is a rare, progressive neurodegenerative disease, with patients presenting with combinations of autonomic failure (urogenital dys- function and orthostatic hypotension), Parkinsonism, cerebellar ataxia and/or pyramidal malfunction (Wenning et al., 2011; Radford et al., 2014). The clinical signs of MSA correspond with neuronal atrophy in multiple brain regions, such as the striatum, substantia nigra (SN) pars compacta, cerebellum, inferior olives, pontine nuclei, locus coeruleus, intermediolateral columns, and motor and frontal cortices (Kuzdas-Wood et al., 2014; Ahmed et al., 2012). Another feature of MSA pathology is widespread gliosis (proliferation and hypertrophy of microglia and astro- cytes), which is associated with neuronal loss (Ishizawa et al., 2004; Fellner et al., 2011; Song et al., 2009). The main pathological feature of MSA is the presence of glial cyto- plasmic inclusions (GCIs) in oligodendrocytes, and is required for posi- tive MSA diagnosis (Jellinger and lantos, 2010). Similar to Lewy Bodies (LB) in Parkinson's Disease (PD), GCIs are complex protein aggregates comprising components, such as ubiquitin-conjugates, organelles (mito- chondria and lysosomes), molecular chaperones, small-ubiquitin-like modifier (SUMO-1), cytoskeletal and microtubule proteins (Pountney et al., 2005a, 2005b; Wenning et al., 2008; Wong et al., 2013) and IB distribution positively correlates with neural degradation and disease severity in MSA (Ishizawa et al., 2008). The principal protein in GCIs is the neuronal protein, α-synuclein (α-syn), which makes up the core of the insoluble protein fibrils (Gai et al., 1999, 2003; Pountney et al., 2004). However, as α-syn is not endogenously expressed by mature Molecular and Cellular Neuroscience 65 (2015) 68–81 ⁎ Corresponding author at: School of Medical Science, Griffith University, Gold Coast, QLD, Australia. E-mail address: d.pountney@griffith.edu.au (D.L. Pountney). http://dx.doi.org/10.1016/j.mcn.2015.02.015 1044-7431/© 2015 Elsevier Inc. All rights reserved. Contents lists available at ScienceDirect Molecular and Cellular Neuroscience journal homepage: www.elsevier.com/locate/ymcne

Welcome message from author
This document is posted to help you gain knowledge. Please leave a comment to let me know what you think about it! Share it to your friends and learn new things together.
Transcript

Molecular and Cellular Neuroscience 65 (2015) 68–81
Contents lists available at ScienceDirect
Molecular and Cellular Neuroscience
j ourna l homepage: www.e lsev ie r .com/ locate /ymcne
The degree of astrocyte activation inmultiple system atrophy is inverselyproportional to the distance to α-synuclein inclusions
Rowan Radford a, Alex Rcom-H'cheo-Gauthier a, Mathew B. Wong a, Emma D. Eaton b, Marion Quilty b,Catherine Blizzard b, Anwar Norazit c, Adrian Meedeniya a, James C. Vickers b, Wei Ping Gai d,Gilles J. Guillemin e, Adrian K. West b, Tracey C. Dickson b, Roger Chung e, Dean L. Pountney a,⁎a Menzies Health Institute Queensland, Griffith University, Gold Coast, Australiab Menzies Research Institute Tasmania, University of Tasmania, Hobart, Australiac Department of Biomedical Science, Faculty of Medicine, University of Malaya, Kuala Lumpur, Malaysiad School of Human Physiology, Flinders University of South Australia, Adelaide, Australiae School of Advanced Medicine, Macquarie University, Sydney, Australia
⁎ Corresponding author at: School of Medical Science,QLD, Australia.
E-mail address: [email protected] (D.L. Poun
http://dx.doi.org/10.1016/j.mcn.2015.02.0151044-7431/© 2015 Elsevier Inc. All rights reserved.
a b s t r a c t
a r t i c l e i n f oArticle history:Received 9 May 2014Revised 17 February 2015Accepted 26 February 2015Available online 27 February 2015
Keywords:Alpha-synucleinMultiple system atrophyNeuroinflammationProgressive supranuclear palsyQuantitative morphometry
Multiple system atrophy (MSA) exhibits widespread astrogliosis together with α-synuclein (α-syn) glial cyto-plasmic inclusions (GCIs) inmature oligodendrocytes.We quantified astrocyte activation bymorphometric anal-ysis of MSA cases, and investigated the correlation to GCI proximity. Using Imaris software, we obtained“skinned” three-dimensional models of GFAP-positive astrocytes in MSA and control tissue (n = 75) from con-focal z-stacks andmeasured the astrocyte process length and thickness and radial distance to the GCI. Astrocytesproximal to GCI-containing oligodendrocytes (r b 25 μm) had significantly (p, 0.05) longer and thicker processescharacteristic of activation than distal astrocytes (r N 25 μm), with a reciprocal linear correlation (m, 90 μm2) be-tweenmean process length and radial distance to the nearest GCI (R2, 0.7). In primary cell culture studies,α-synaddition caused ERK-dependent activation of rat astrocytes and perinuclear α-syn inclusions in mature (MOSP-positive) rat oligodendrocytes. Activated astrocytes were also observed in close proximity to α-syn deposits in aunilateral rotenone-lesion mouse model. Moreover, unilateral injection of MSA tissue-derived α-syn into themouse medial forebrain bundle resulted in widespread neuroinflammation in the α-syn-injected, but notsham-injected hemisphere. Taken together, our data suggests that the action of localized concentrations of α-synmay underlie both astrocyte and oligodendrocyte MSA pathological features.
© 2015 Elsevier Inc. All rights reserved.
1. Introduction
Neurodegenerative diseases cause malfunction and declining struc-tural integrity in the central nervous system, which leads to characteristicmotor, cognitive, and/or behavioural abnormalities. Another commonfeature in many neurodegenerative diseases is the presence of abnormalmicroscopically-visible intracellular protein deposits or inclusion bodies(IBs) (Richter-landsberg and Leyk, 2013). Multiple system atrophy(MSA) is a rare, progressive neurodegenerative disease, with patientspresenting with combinations of autonomic failure (urogenital dys-function and orthostatic hypotension), Parkinsonism, cerebellar ataxiaand/or pyramidal malfunction (Wenning et al., 2011; Radford et al.,2014). The clinical signs of MSA correspond with neuronal atrophy inmultiple brain regions, such as the striatum, substantia nigra (SN)
Griffith University, Gold Coast,
tney).
pars compacta, cerebellum, inferior olives, pontine nuclei, locus coeruleus,intermediolateral columns, andmotor and frontal cortices (Kuzdas-Woodet al., 2014; Ahmed et al., 2012). Another feature of MSA pathology iswidespread gliosis (proliferation and hypertrophy of microglia and astro-cytes), which is associated with neuronal loss (Ishizawa et al., 2004;Fellner et al., 2011; Song et al., 2009).
The main pathological feature of MSA is the presence of glial cyto-plasmic inclusions (GCIs) in oligodendrocytes, and is required for posi-tive MSA diagnosis (Jellinger and lantos, 2010). Similar to Lewy Bodies(LB) in Parkinson's Disease (PD), GCIs are complex protein aggregatescomprising components, such as ubiquitin-conjugates, organelles (mito-chondria and lysosomes), molecular chaperones, small-ubiquitin-likemodifier (SUMO-1), cytoskeletal and microtubule proteins (Pountneyet al., 2005a, 2005b; Wenning et al., 2008; Wong et al., 2013) and IBdistribution positively correlates with neural degradation and diseaseseverity in MSA (Ishizawa et al., 2008). The principal protein in GCIs isthe neuronal protein, α-synuclein (α-syn), which makes up the core ofthe insoluble protein fibrils (Gai et al., 1999, 2003; Pountney et al.,2004). However, as α-syn is not endogenously expressed by mature
69R. Radford et al. / Molecular and Cellular Neuroscience 65 (2015) 68–81
oligodendrocytes (Miller et al., 2005), the protein that occurs in oligoden-drocytes in disease is likely taken up from the extracellular space. Inter-estingly, a recent study has found a point mutation of α-syn (G51D) inpossible autosomal dominant cases of early onset Parkinsonism in aBritish family with both LB and GCI pathology (Kiely et al., 2013). Thisfurther implicates α-syn in MSA pathogenesis. The function of α-syn iscurrently unknown, although it is believed to play a role in synaptic trans-mission through vesicle recycling, and calcium homeostasis (Waxmanand Giasson, 2009). Wild-type α-syn aggregates readily and post-translationalmodifications ofα-syn found in pathological isolates, includ-ing nitration, oxidation, ubiquitination, truncations, and certain phos-phorylations, promote aggregation (Radford et al., 2014). Other factorshave also been observed to induce aggregation, such as oxidative stress,inflammation and metal binding (e.g. Ca2+) (Goodwin et al., 2013; Tienet al., 2013; Lowe et al., 2004; Nath et al., 2011; Follett et al., 2013). More-over, in vitro data shows that α-syn is also toxic at elevated doses to cul-tured neural cells (Stefanova et al., 2001; Wan and Chung, 2012).
Although it has been suggested that α-syn IBs may cause neurotox-icity, many studies indicate that IB formation is a way of sequesteringcytotoxic soluble α-syn oligomer species (Chiba et al., 2012), in a man-ner similar to aggresome biogenesis. Oligomeric α-syn species havebeen shown to cause inhibition of the ubiquitin–proteasome system(UPS) and lysosomal autophagy (Cookson and van Der Brug, 2008;Lindersson et al., 2004) and potentially toxic annular oligomers havealso been isolated from MSA cases (Pountney et al., 2004, Pountney etal., 2005c). Moreover, α-syn pathology has been observed in humanfoetal grafts in PD patients and in animal models, suggesting a form ofcell-to-cell spread (Kordower and brundin, 2009; Chu and Kordower,2010; Hansen et al., 2011). Furthermore, it has been shown that neu-rons can secreteα-syn in exosomes and that other cells, including oligo-dendrocytes, can take up α-syn by endocytosis, leading to thehypothesis that some forms of α-syn can cause disease in a prion-likemanner (Angot et al., 2010). These findings give credence to the ideathat oligodendroglial α-syn inclusions in MSA arise from extracellularsources (Marques and Outeiro, 2012; Vekrellis and Stefanis, 2012).
Neuroinflammation is a feature of neurodegenerative diseases, suchas PD and MSA. During neuroinflammation, microglia and astrocytesundergo distinct phenotypic changes, which can be used to determineneuroinflammation. Microglia increase expression of ionized calciumbinding adaptor molecule-1 (Iba-1) and undergo a change in morphol-ogy to a phagocytic phenotype (Kettenmann et al., 2011; Jonas et al.,2012). Astrocytes become activated in neuroinflammation, with in-creased expression of glial fibrillary acidic protein (GFAP) along withhypertrophy of astrocytic processes (Lee et al., 2010; Pekny andNilsson, 2005). Elevated levels of pro-inflammatory cytokines havebeen observed in the serum, cerebrospinalfluid and post-mortem tissueof MSA and PD patients (Long-Smith et al., 2009; Kaufman et al., 2013)consistent with a switch to a pro-inflammatory environment. Also, in-creased toll-like receptor (TLR) expression has been observed in animalmodels of MSA and PD (Drouin-Ouellet and Cicchetti, 2012).
We sought to investigate the hypothesis that both astrocyte activa-tion and GCIs are caused by the action of extracellular α-syn secretedby neurons acting differentially on the astrocyte and oligodendrocytecell types. In post-mortemhuman tissue studies,we examined astrocytemorphology as a quantitativemeasure of the degree of astrocyte activa-tion and hypothesized that GCIs themselves could represent markers ofhigh local extracellular α-syn concentration. We applied analytical cellmorphometry to quantify astrocyte activation in MSA tissue sectionsand found a reciprocal correlation between the degree of astrocyte acti-vation and radial distance to the nearest α-syn glial deposit. Direct evi-dence for the influence of extracellularα-syn is providedby primary cellculture andmousemodel studieswhere IBs formpreferentially in oligo-dendrocytes when exposed to endogenous α-syn, whereas, astrocytesprimarily undergo activation. Thus, both major pathological features ofMSA, GCIs and activated astrocytes, may be attributed to the influenceof localized α-syn concentrations.
2. Materials & methods
2.1. Human tissue
Formalin-fixed human brain tissue was from the South AustralianBrain Bank and diagnosis of disease was conducted at autopsyconforming to the consensus criteria (MSC/16/11/HREC). Four MSA-Pcases neuropathologically categorized as striatonigral degenerationsubtype (age at death: 70 ± 7, post-mortem interval (PMI) 8 ± 3 h),4 cases of PSP (age at death 73 ± 3; PMI 8 ± 4 h), and 4 age-matchednormal cases (age at death 73±9; PMI 14±8 h)were examined. Visu-al and frontal cortex and putamen of MSA and the substantia nigra ofPSP cases were examined. The visual cortex of normal cases was exam-ined for comparison.
2.2. Mouse Surgery
Unilateral lesion was by stereotactic injection of rotenone into themedial forebrain bundle (MFB) of the right hemisphere of C57 blackmice (n= 5; 6–12months), as described (Weetman et al., 2013), in ac-cordancewith the guidelines provided by the Griffith University AnimalEthics committee (BPS/01/07/AEC). Mice were sacrificed 2 weeks afterrotenone injection and brain tissue infused with a modified Zamboni'sfixative, optically cleared, dehydrated, frozen, cryosectioned (30 μmcoronal slices) and treated for immunofluorescence.
For GCI injections, C57 blackmice (n=2; 6–12months) received bi-lateral injections (2 μL) into theMFB of both hemispheres, sham controlto one hemisphere, to the other solution containing GCIs purified fromMSA human patients, as described (Gai et al., 1999). The purified GCIswere isolated from 2 g of cortical MSA tissue before being resuspendedin 50 μL of sterile phosphate buffered saline (PBS) with brief sonication.The GCI was then diluted 1:1 with polyethylene glycol for the injection.Brains were harvested after 23 days and sections (30 μm) were ob-served under light microscopy to view the injection site in both GCIand sham hemispheres before being selected for immunofluorescence.
2.3. Antibodies
Anti-GFAP antibodies were; rabbit polyclonal (Life Technologies,Invitrogen, USA) in the human and rotenone lesioned tissue, DAKO(Denmark) rabbit polyclonal for rat primary cultures, mouse monoclo-nal conjugated with Cyan 3 (Cy3) from Sigma-Aldrich (USA) in theGCI mouse to avoid interaction with the rabbit Iba-1. LB509 mouseanti-α-syn monoclonal, rabbit polyclonal anti-α-syn and anti-MOSPantibodies were purchased from Abcam (UK). A mouse monoclonal an-tibody (RD4) was used to visualise aggregated tau in PSP cases. This an-tibody was provided by R. de Silva and is specific for the 4-repeatisomer, which is found hyperphosphorylated in PSP tau inclusions (DeSilva et al., 2003). Rabbit anti-Tsg101 antibody (1:200; Abcam, UK)was used as an exosome marker. Anti-ERK-1/2 phosphorylated mousemonoclonal was from Invitrogen (USA). Anti-IDO1 antibody (IDO,indoleamine-2, 3-dioxygenase 1) was as described (Chen et al., 2010).Anti-Munc-18 rabbit polyclonal antibody was from Abcam (UK) and isselective for Munc18-1 and Munc18-2 isoforms. Alexa Fluor 488 anti-mouse and Alexa Fluor 568 anti-rabbit Fluorescent secondary antibod-ies were used (Molecular Probes, Invitrogen, USA).
2.4. Immunohistochemistry
Formalin-fixed paraffin embedded human tissue sections were de-parafinized, then rehydrated and heat induced antigen retrieval wasperformed in 1mMEDTA pH8 solution at 100 °C. Sectionswere blockedin 20% normal horse serum (NHS) in TBS for 1 h and incubated withprimary antibodies (GFAP 1:500 all cases, α-syn 1:1000 for MSA andcontrols, RD4 1:200 for PSP, 1:100 IDO1 and Munc-18 for MSA) in 1%NHS-TBS overnight at 4 °C. Tissue was then washed for 3 × 5 min in
70 R. Radford et al. / Molecular and Cellular Neuroscience 65 (2015) 68–81
TBS, secondary antibodies (Alexa Fluor; 1:200) in 1% NHS-TBS incubat-ed for 90 min at room temperature, washed again with TBS (3 × 5min)and mounted (Prolong GOLD with DAPI; Life Technologies, USA).
Unilateral rotenone-lesioned mouse tissue sections were thawed,blocked with 20% NHS-TBS and incubated in 1% NHS-TBS containingprimary antibodies (GFAP 1:500 and α-syn 1:1000) overnight at 4 °C.GCI-injected mouse tissue was thawed, permeabilized in dimethyl sulf-oxide for 30 min, then flushed with PBS for 2 × 10 min, blocked in 10%normal donkey serum (NDS) PBS for 1 h, then primary antibody solu-tion (Iba-1 and mouse GFAP-Cy3 at 1:600 each in 10% NDS-PBS) over-night, washed in PBS for 2 × 10 min, incubated in secondary antibody(Alexa Fluor; 1:400) for three hours and mounted using VECTASHIELDwith DAPI (Vector Laboratories, USA).
2.5. Primary cell cultures
Primary cultures enriched for oligodendrocytes or astrocytes wereobtained from neonatal Hooded Wistar rats. Mixed glial cultures ofoligodendrocytes and astrocytes were established using standard pro-cedures (McCarthy and de Vellis, 1980), in accordance with the guide-lines provided by the University of Tasmania Ethics committee. Briefly,1–2 days old rat pupswere chilled on ice for 10min, and rapidly decap-itated. Cerebral hemispheres were removed and cell suspensions pre-pared using trypsin (0.25%) and a cell sieve (40 μm). Cells were platedand grown in DMEM-F12 media containing 10% foetal calf serum andantibiotic–antimycotic (Invitrogen, USA) for 7 to 9 days (37 °C, 5%CO2). Oligodendroglial cells were released from the bed layer of astro-cytes using a Heraeus orbital shaker, and replated at a density of1.5 × 104 cells on 18 mm glass coverslips pre-incubated with poly-L-lysine (Sigma, USA). Cells were grown in Neurobasal media contain-ing B27 supplement, 0.5 mM glutamine and antibiotic–antimycotic(Invitrogen) for 7 days in vitro (DIV). Half media changes were per-formed every 3–5 days. Four cultures (coverslips) were treated undereach experimental condition of α-syn or BSA (Sigma, USA) incubation.
Cultures of cortical astrocytes (N95% purity) were prepared as de-scribed previously (Chung et al., 2004). Briefly, cerebral cortices dissect-ed from postnatal days 1–3 Hooded Wistar rats were placed in HBSSmedium (Sigma, USA), trypsinized (0.25% w/v) and incubated at 37 °Cfor 25 min. Medium was replaced with DMEM + 10% foetal calfserum (Invitrogen, USA) and tissue triturated, cell suspension filtered(0.6 mm gauze), diluted with DMEM-10S, centrifuged (10 min; 500 g;4 °C), supernatant removed and DMEM-10S added, followed by gentletrituration. This cell suspension was added to a poly-L-lysine-coatedflask containing DMEM-10S and incubated for 24 h before the mediawas replaced. Media was then replaced every 48 h until the cells wereconfluent (8–10 days), then the flask was shaken (250 rpm; 37 °C;24 h), medium replaced with fresh DMEM-10S supplemented withAra-C (Sigma, USA) and repeated (48 h), before cells were split. Priorto experimentation, confluent cultures were maintained in serum-freemedium for at least 3 days. MAPK and JAK-STAT signalling pathway in-hibitors (PD98059 and AG490, respectively) were obtained from Sigma,USA.
Recombinant α-syn (wt, A53T) was purified as described (Loweet al., 2004). Briefly, recombinant α-syn was expressed in EscherichiaColi BL21 (DE3) transformed with the pET11d vector containing theα-syn cDNA described previously (Jensen et al., 2000) and purified byanion exchange and gel permeation chromatography (N95% by SDS-PAGE). Lyophilised protein was reconstituted in sterile MilliQ water ata concentration of 1 mg/ml, and stored at−20 °C.
For immunofluorescence, cells were fixed in 4% paraformaldehydefor 30mins at RT, labelled using anti-GFAP, anti-MOSP or anti-α-syn pri-mary antibodies and species-appropriate Alexa Fluor fluorescent sec-ondary antibodies (Molecular Probes, USA). All primary antibodiesused were tested for non-specific binding. There was no non-specificinteraction between the antibody directed to human α-syn and the en-dogenous rat protein. Nuclear Yellow (0.001%) (Sigma, USA)was added
for the final 10min of the secondary antibody incubation prior to wash-ing and mounting.
For quantitative immunocytochemistry, astrocytes (3 cultures perexperimental condition) were plated into 24-well plates at a constantcell density of 1 × 10⁴ cells/well in DMEM-10S. After the cells becameconfluent (3– 4 days), serum-free medium was applied to the culturesfor three days, after which cells were treated with either α-syn or con-trol (TBS). Twenty-four hours afterα-syn treatment, the cells and blankcontrols were fixed with 4% paraformaldehyde, washed with PBS-0.1%Triton-X, incubated with 0.3% hydrogen peroxide to quench endoge-nous peroxidase, blockedwith 1% BSA in PBS for 30min, followed by ad-dition of thepolyclonal rabbit anti-GFAP (1:1000; DAKO) and secondaryanti-rabbit HRP-conjugated (1:2000) antibodies, both for 1 h. HRP wasdetected using the TMB-detection system (KPL), by transferring 50 μlof the product (n = 6) to a 96-well plate for analysis by plate reader.
For Western analysis, astrocytes were resuspended in cell lysis buff-er (20 mM Tris, pH7.4, 200 mM NaCl, 7.5 mM MgCl2, 0.2 mM EDTA,0.75% Ipegal, 10% glycerol), gently triturated and stored at –20 °C.Total protein concentrations of samples were determined by Bradfordassay, and 10 mg total protein diluted 1:1 with 2% SDS loading buffer,incubated at 70 °C for 10 min and run on NuPage 10% Bis–Tris pre-cast SDS-PAGE gels (Invitrogen; 200 V, 25 min) then electro-transferred to nitrocellulose membrane (4 °C, 20 V), blocked in 5% w/vskimmed milk powder in PBS-T for 1 h, washed three times in PBS-Tfollowed by a 1 h incubation with the anti-phospho ERK1/2 antibody(1:500; Cell Signalling, USA) and developed by chemiluminescence(Supersignal™West Pico Chemiluminescent, Pierce) for 5 min, and ex-posed to ECL film for detection. Three different astrocyte cultures wereused to provide experimental replicates.
Microscopic cell analysis was carried out using a Leica DMLB2 fluo-rescentmicroscope, with images captured using a cooled CCDMagnifire(Optronics) camera and software (version 2.0). Laser scanning micros-copy, using an Optiscan F900e krypton/argon system attached to anOlympus BX50 epifluorescence microscope was further utilised to in-vestigate the intracellular localisation of α-syn accumulations. Forquantitation,five randomfields of view (40×)were captured per cover-slip, across four different cultures. The total number of nuclei and num-ber of nuclei showing condensed, apoptotic morphology were counted,together with total oligodendrocytes (MOSP-immunopositive) and as-trocytes (GFAP-immunopositive). The number of intracellular inclu-sions immunopositive for α-syn, defined as distinct focal cytoplasmicaccumulations, was also counted.
2.6. Confocal imaging and reconstructions
Tissue images were obtained using an Olympus Fluoview FV1000confocal laser-scanning microscope. Image sizes of 1024 × 1024 pixelswere obtained to allow for the greatest spatial discrimination betweenpixels and maximise resolution potential in the XY dimension. Serialoptical sections at intervals of 0.5 μm in the Z dimension were capturedto allow for three-dimensional (3-D) reconstruction. DAPI, AF-488 andAF-568 (Human and Rotenone lesioned mice) and DAPI, AF-488 andAF-594 (GCI mouse) filters were imaged together in separate channelssequentially. The images were then cropped, false coloured andexported using Olympus FV-ASW 3.2 Viewer. Imaris software version6.4.2 (Bitplane®) was used to generate the 3-D reconstructed imagesand solid skinned cell-surface rendering was using Surface function(12–14 cell models per case).
Human tissue was imaged in white matter tracts of the visual (MSAand Normal) and frontal (MSA) cortical regions and in the SN of PSP.Negative controls with secondary antibodies only were performed andautofluorescent properties found in histological sections by lipofuscinwas minimized by selecting white matter regions. White matter tractsof theMFB, through the internal capsule to the corpus callosum and ex-ternal capsulewere imaged in both control and lesioned hemispheres ofmouse models. Pure white matter tracts were chosen to avoid the
71R. Radford et al. / Molecular and Cellular Neuroscience 65 (2015) 68–81
admixture of grey and white matter. GCI mouse sections were imagedadjacent to the injection site at the medial forebrain bundle in boththeGCI-injected and sham-injected hemispheres. Imageswithin 4 fieldsof view of the injection site were classified as proximal (r, b300 μm)whilst outside this area was classified as distal (N300 μm).
2.7. 3-D quantitative & qualitative analysis
Imaris software version 6.4.2 (Bitplane®)was used to analyse the 3-D reconstructed images. Astrocyte processes were analysed automati-cally using the filament tracer method as well as manual measurementto allow for comparison. Automatic tracingwas conducted by highlight-ing a region of interest, which encompassed an astrocyte. Seed point se-lection was evaluated and some removed if from an obvious externalsource. All levels used for the threshold algorithms were automaticallygenerated and with no input from the operator to limit bias. The algo-rithm used was Approximate Circle of cross-section area (Mestrallet,2011). Manual measurements were performed by using the polygonline measurement, which allows for tracking in slice mode. Lengthwas measured from the cell body to the end of the process, whilstthree diameters were measured along the filament (at the start, at themiddle and at the end) before being averaged to give an approximationof thickness. The distance from the astrocyte to the closest visible inclu-sion wasmeasured from themiddle of the astrocyte nucleus to the cen-tre of the inclusion using the Imaris Measurement function, whichallows the distance between two or more points to be measured in 3Dspace. Measurement accuracy was visually ascertained and comparedto a measurement obtained in slice view before being accepted. Z-projection images were acquired by using the snapshot function inImaris.
2.8. Statistical Methods
Mean astrocyte process thickness and lengthwas calculated by aver-aging the process length or thickness of the number of processes of eachastrocyte (n=5–8) thatwere in the section plane. The standard error ofthemeanwas calculated for each astrocyte in both thickness and length.Linear regression analysis was used to assess the association betweenthe mean astrocyte process length and thickness and the reciprocaldistance from the astrocyte to the nearest GCI in MSA. Astrocytes weregrouped based on their proximity to the closest GCI (less than25 μm = Proximal and greater than 25 μm = distal). The means ofthe two groups were then compared by using an independent, two-tailed t-test to assess if there was a significant difference. Linear regres-sionwas performedwith the combined normal andMSA astrocyte data,in order to define the X-intercept. Normal tissue data is plotted at 0 onthe reciprocal distance plots.
3. Results
We hypothesized that GCIs would represent a marker for the pres-ence of a locally raised extracellular α-syn concentration. Thus, the de-gree of activation of astrocytes in MSA tissue would be greater when inclose proximity to glialα-syn deposits. In order to quantify astrocyte ac-tivation in MSA tissue, we analysed the morphology of GFAP-positiveastrocytes in three-dimensional reconstructions of cortical whitematter.
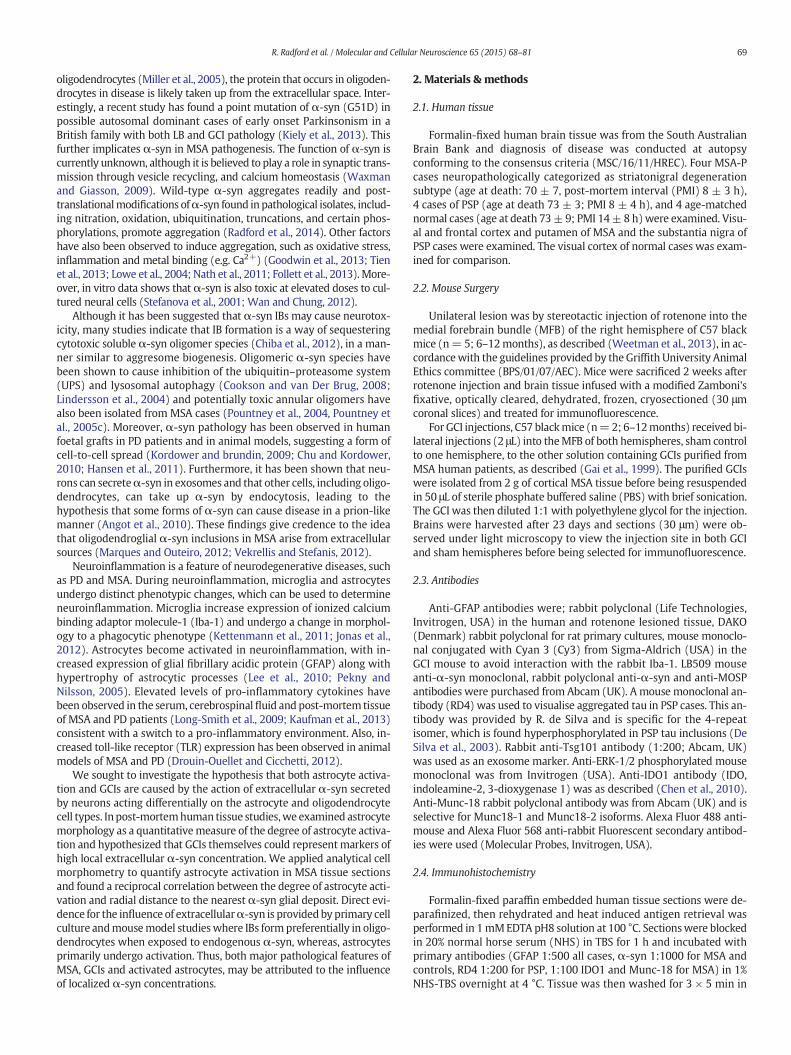
The presence of activated astrocytes expressing high levels of GFAPand exhibiting long, thick process arbours was seen in thewhite matterof all four cases of MSA in both frontal and visual regions (Fig. 1A–B). Alarge number of perinuclear GCIs were also observed in oligodendro-cytes in the white matter of the frontal and visual regions of all fourcases. It was observed that highly activated astrocytes with long, thickprocesses were in close proximity to GCIs (Fig. 1A–B), whilst astrocytesthat were further away from a GCI had a less activated type of morphol-ogy (Fig. 1D). Astrocytes in the putamen, which was characterized by
high neuronal loss, also exhibited highGFAP expression, although abun-dant autofluorescent granules were closely associated with α-syn de-posits, limiting further analysis (Fig. 1C). Astrocytes were also imagedin the white matter of the visual cortex of four cases of normal tissue(Fig. 1F, G) and had comparatively less intense GFAP immunoreactivityand less stellate morphology, similar to astrocytes distal to a GCI in theMSA tissue.
3.1. Primary Oligodendrocyte and Astrocyte Culture Reveals Addition ofExogenous Alpha-synuclein causes oligodendrocyte inclusion bodies andERK1/2-dependent astrocyte activation
In order to examine the influence of exogenous α-syn on glial celltypes, we treated Wistar rat primary cell cultures enriched for bothastrocytes and oligodendrocytes by addition of purified recombinantα-syn to the culture medium (Fig. 2). We examined the influence ofcontrol protein (BSA; Fig. 2A–B) and α-syn (Fig. 2C–F) addition tocultures enriched forWistar rat oligodendrocytes (4 cultures per condi-tion, 5 fields of view each). Oligodentrocytes were marked either bymyelin basic protein (MBP) or myelin oligodendrocyte specific protein(MOSP), which is a marker of mature oligodendrocytes (Dyer andMatthieu, 1994). Oligodendrocytes in vitro have previously beencharacterised (Itoh et al., 2002) as mature cells that are myelinatedafter 7 DIV. We found that oligodendrocytes were immunoreactive forMOSP after 7 DIV with a subset of cells exhibiting a more mature,more intensely MOSP-positive phenotype and more extensive, thickerprocesses than others. The cultures contained both oligodendrocytesas defined by MBP/MOSP expression (green, Fig. 2A & E) and astrocytespositive for GFAP (red, Fig. 2B & F). By 7 DIV, the distinction betweenoligodendrocytes and astrocytes is clear, with the oligodendrocytesimmunonegative for GFAP, and themature astrocytes showing no immu-noreactivity for MOSP. Morphologically, the oligodendrocytes have flat-tened processes highly immunoreactive for MOSP. At 7 DIV + 3 days,there were 5.5 ± 2.2 astrocytes and 21.2 ± 5.4 oligodendrocytes perfield of view and this was essentially unchanged at 6.6 ± 1.4 and23.5 ± 9.3, respectively, at 7 DIV +5 days. In the α-syn-treated cultures,therewere 6.5±2.2 and 7.1±4.5 astrocytes per field of view and 18.2±7.6 and 20.4 ± 7.6 oligodendrocytes per field of view at 7 DIV +3 and 7DIV + 5, respectively.
Exposure to 10 μg of recombinant human α-syn for three days at 7DIV resulted in a pattern of punctate immunoreactivity for the recombi-nant human α-syn on oligodendrocyte processes (Fig. 2D) comparedto control (Fig. 2A & C). Immunoreactivity for α-syn also appearedwithin intracellular inclusions, with the formation of frequent large,perinuclear accumulations at 5 days exposure to exogenous α-syn(Fig. 2E). Cell counting revealed 0.5 ± 0.09 α-syn-positive intracellularinclusions perfield of view at 7 DIV+3 days incubationwithα-syn and4.6 ± 0.9 inclusions at 7 DIV + 5 days, with 0.08 ± 0.07 inclusions perfield for the control cultures at either incubation time.We found thatα-syn treatment resulted in uptake of α-syn and the occurrence of α-synintracellular cytoplasmic accumulations in oligodendrocytes, but thesewere rare in astrocytes over the same timescale (Fig. 2F). This indicatesoligodendrocytes aremore able to take up exogenousα-syn than astro-cytes and respond by the formation of intracellular inclusions immuno-reactive forα-syn. The addition of exogenous protein at 7 DIV appearedto have little effect on cell health. The number of apoptotic nuclei as apercentage of the total nuclei in treated cellswas not significantly differ-ent from controls (p, 0.05). Furthermore, the total number of astrocytesand oligodendrocytes did not vary across experimental conditions. Theuptake and accumulation ofα-syn occurred predominantly in oligoden-drocytes with a more mature phenotype evidenced by extensivedendritic arbours and highMOSP expression. Thus,α− syn is preferen-tially takenupbymature oligodendrocytes, rather than immature oligo-dendrocytes or astrocytes. This is in agreement with recent studies thatshowGCIs inMSA cases do not occur in oligodendrocyte precursor cells,
Fig. 1. Representative images of GFAP-positive astrocytes in MSA and normal tissue. (A–C) Intensely GFAP immunoreactive astrocytes (thick arrow) proximal to GCIs (thin arrow) in theunderlying white matter of frontal and visual cortices, and putamen of MSA tissue, with thickened and extended processes. (D) astrocytes distal to GCIs show less intense GFAP stainingand lack extended processes. (E) Normal visual cortex. All images are Z-projections of confocal stacks created using Imaris. Scale bars = 20 μm.
72 R. Radford et al. / Molecular and Cellular Neuroscience 65 (2015) 68–81
but are restricted to mature oligodendrocytes in post-mortem tissue(Ahmed et al., 2013) consistent with an uptake model.
To evaluate the effect of human recombinant α-syn protein on ratcortical astrocytes, we applied wild-type α − syn and the mutantA53Tα-syn at a concentration of 1 μg/ml for 24 h to confluent astrocytemonocultures (n=3). Addition ofwtα-syn to astrocyte cultures result-ed in increased GFAP expression and astrocytes with more extended,stellate morphology (Fig. 3A). This was more pronounced using theA53T α-syn mutant that is more prone to aggregation (Conway et al.,1998). Using quantitative immunocytochemistry for GFAP, we con-firmed that wild-type α-syn (at a concentration range of 1–10 μg/ml)
induced a mild but not statistically significant increase in GFAP expres-sion, whilst A53T α-syn at the same concentration range increasedGFAP expression over control with statistical significance (Fig. 3B); p,0.01). In order to examine the intracellular signalling pathway relatedto α-syn mediated astrocyte activation, we examined changes inERK1/2 phosphorylation and the influence of MAPK and JAK/STAT in-hibitors. Western blotting confirmed elevated levels of phosphorylatedERK1/2 within 1 h of stimulation with A53T α− syn and to a lesser ex-tentwild-typeα-syn (Fig. 3B, inset). It iswell established that a range ofcytokines are capable of inducing reactive astrogliosis, including in par-ticular IL-1β, TNF-α, IFN-γ and TGF-β1 (Balasingam et al., 1994).Whilst

Fig. 2.α-Synuclein addition to rat primary cultures induces oligodendrocyte inclusion bodies. BSA (A, B) andα-syn (C-F) addition (7 DIV) to primaryWistar rat glial co-cultures enrichedfor oligodendrocytes at 3 and 5 days post-addition shows perinuclearα-syn inclusion bodies (arrows) inmature,MOSP-positive oligodendrocytes (D, E), but not GFAP-positive astrocytes(F). (A) BSA (red) and myelin basic protein (MBP) (green), (B) BSA (green) and GFAP (red). (C, D) α-syn (green) and Myelin Oligodendrocyte Specific Protein (MOSP) (red). (E) α-syn(red) andMyelin Oligodendrocyte Specific Protein (MOSP) (green). Arrow indicates an intracellular inclusion. (F)α-syn (green) and GFAP (red), reveals no co-location of the exogenousprotein with astrocytes, as well as the presence of non-astrocytic inclusions at 7DIV + 5 days exposure (arrow). Blue indicates cell nuclei utilising nuclear yellow. Scale = 50 μm. (Forinterpretation of the references to colour in this figure legend, the reader is referred to the web version of this article.)
73R. Radford et al. / Molecular and Cellular Neuroscience 65 (2015) 68–81
these cytokines act upon distinct membrane receptors to activate mul-tiple intracellular pathways, a common downstream effector of all ofthese molecules is the extracellular signal-regulated kinase (ERK) sub-family of mitogen-activated protein kinases (MAPKs). To investigatewhether α-syn is inducing astrogliotic changes via the MAPK pathway,astrocytes were pre-treated with PD98059 30 min prior to treatmentwith 1 μg/ml A53Tα-syn. This almost completely blocked the inductionof GFAP expression by A53T α-syn (Fig. 3B). Since the JAK/STAT inhibi-tor AG490 had little effect, α-syn appears to act specifically upon thispathway, (Fig. 3B). Thus, ERK1/2 phosphorylation was increased uponα-syn treatment (Fig. 3B, inset) and the increase in GFAP expressioncould be blocked by MAPKK inhibitor treatment (Fig. 3B).
3.2. Quantitative morphometry reveals astrocyte process thickness andlength significantly greater proximal to GCIs in multiple system atrophy
MSA tissue of the visual cortexwas analysed for IDO1 expression as amolecular marker of neuroinflammation (Chen et al., 2010). Intense
perinuclear, granular glial IDO1 expression was observed in areas ofthewhitematter, whichwere positive for GCI bearing oligodendrocytes(Fig. 4A–B). From the qualitative assessment of the white matter, itappeared that there was an inverse relationship between astrocyteactivation and GCI proximity. As a molecular marker of astrocyteactivation,MSA tissue sections from the frontal cortex were qualitative-ly assessed for Munc-18 expression, as astrocytic expression of both theMunc18-1 and Munc18-2 isoforms detected is induced by cytokines(Burgoyne et al., 2009). In regions containing GCI positive oligodendro-cytes, high Munc-18 expression was observed in astrocytic cell types(Fig. 3C–E). Close proximity to GCIs was related to high Munc-18expression level in these cells, concomitant with highly stellatemorphology (Fig. 3C–E) and consistent with astrocyte activation. Toinvestigate if α-syn is present in exosomes in close proximity towhite matter GCIs in MSA, we co-immunostained for both α-synthe exosomemarker, Tsg101 (Fig. 4F). We found occasional extracel-lular puncta in close proximity to GCIs that were positive for bothTsg101 and α-syn.

Fig. 3.α-Synuclein addition to rat primary cultures induces activated astrocytes. (A)α-syn (wild-type and A53Tmutant) addition toWistar rat primary astrocytes monoculture inducesactivated morphology. (B) α-syn (wild-type and A53T mutant) addition to Wistar rat primary astrocytes induces ERK1/2 phosphorylation (inset) and A53T α-syn leads to significantlyincreased (p, 0.01; n = 3) GFAP expression that is blocked by the MAPK inhibitor, PD98059, but not AG490. Western blotting (inset; representative of three experiments) demonstratedthatα-syn treatment resulted in elevated levels of phosphorylated ERK1/2. Astrocytes were pre-treated with 10 μMof either PD98059 or AG490, followed by addition ofα-syn. PD98059but not AG490 significantly blocked α-syn mediated up regulation of GFAP as measured by quantitative immunocytochemistry, consistent with activation of the ERK1/2-dependentpathway.
74 R. Radford et al. / Molecular and Cellular Neuroscience 65 (2015) 68–81
3.3. Morphometric measures of astrocyte activation in MSA are linearlycorrelated to reciprocal distance to GCI
In order to obtain a more quantitative view of astrocyte activation,53 fibrous white matter astrocytes were reconstructed as three-dimensional skinned models (12–14 per case) and measured usingboth Imaris automatic tracing and manual tracing (Fig. 3G–J). To assessif the proximity of the closest GCI had a significant effect upon themeanastrocyte process length and thickness, the astrocytes were divided intotwo groups. The groups were related to the astrocyte distance to theclosest GCI, with astrocytes within 25 μm of a GCI classified as proximaland those at a distance greater than 25 μmassigned as distal (Fig. 5A–E).An independent t-test was then performed to assess if there was a sig-nificant difference between the two groups. Themean astrocyte processlength and mean thickness was significantly greater (p, 0.05) in the as-trocyteswithin 25 μmof the nearest GCI than those astrocytes thatwereat a distance greater than 25 μm (distal MSA astrocytes mean processlength, 16.09 μm and thickness, 1.15 μm).
To test the apparent reciprocal relationship between astrocyteactivation and GCI proximity, linear regression analysis was performedbetween themean astrocyte process length and thickness and the recip-rocal of distance to GCI (1/distance to closest GCI). A strong positive cor-relation between mean astrocyte process length and the reciprocal GCI
distance was determined by both automatic and manual measurements,respectively, indicating that GCI proximity can account for ~60% of vari-ability in astrocyte mean process length in MSA cases. Fig. 6A illustratesa cluster of astrocytes at varying distance to the closest visible α-syn de-posit (arrows), indicating a strong correlation between close proximityto GCI and highly extended process arbours (brace) characteristic of acti-vated (stellate) astrocytes. GFAP positive astrocytes were also imaged inthewhitematter of the visual cortex of four cases of normal tissue. The as-trocytes of the normal tissue displayed comparatively less intense GFAPimmunoreactivity and less stellate morphology, similar to astrocytes dis-tal to a GCI in the MSA tissue (Figs. 1E & 5D). The astrocytes in normalcases lacked the intense GFAP staining of the soma and processes ob-served in astrocytes proximal to a GCI in MSA tissue. There were no IBsof α-syn in any of the normal tissue examined. Fig. 6B illustrates a hypo-thetical model for α-syn activation of astrocytes and GCI formation fromextracellular α-syn secreted by distant neurons. Quantitative morpho-metric analysis was conducted on 22 astrocytes from the normal tissue;with more than 5 measured in each case. These astrocytes had a meanprocess length and thickness that was comparable to the astrocytes distalto a GCI in the MSA tissue (Imaris automated measurement of mean as-trocyte process length, 15.23 μm and thickness, 0.93 μm). The normal as-trocyte measurements define the X-intercept (1/distance to nearestGCI = 0), as no GCIs were present in the normal tissue. Linear regression

Fig. 4.MSA tissue shows enhanced neuroinflammation andα-syn-positive exosomes. (A–B) Representative images of neuroinflammationmarker, IDO1 (red), showing high expression inMSA tissue (frontal cortex) and intense perinuclear punctate expression (small indented arrows) in the vicinity of GCIs (normal arrow). Scale bar=5 μm. (C–E) Example images of Munc-18 (red) expression in MSA visual cortex, illustrating the intense astrocytic expression (thick arrows) observed in areas of high GCI (normal arrows) pathology. (F) Extracellular puncta(small arrows) positive forα-syn and the exosomemarker, Tsg101 (GCI, large arrow). Scale bar= 20 μm. (For interpretation of the references to colour in this figure legend, the reader isreferred to the web version of this article.)
75R. Radford et al. / Molecular and Cellular Neuroscience 65 (2015) 68–81
analysis determined a linear correlation between mean process lengthand reciprocal GCI distance with a high goodness of fit (Fig. 6C; R2 =0.7). Linear regression analysis also revealed a correlation betweenmean astrocyte process thickness and reciprocal GCI distance (Fig. 6D;R2 = 0.4), although with a lower level of variance explained by themodel.
3.4. Astrocyte process thickness and length are not correlated to distance totau coiled body in progressive supranuclear palsy
For comparison, we also examined tissue from cases of PSP, whichshow tau protein deposits in oligodendrocytes, rather than α-syn. InPSP, glial protein aggregate pathology is observed in the form of denseoligodendroglial coiled bodies positive for the four-repeat form of tau(Tau 4R), but immunonegative for α-syn. Astrocytes in the SN wereinvestigated in four PSP cases using immunofluorescence confocal mi-croscopy (Fig. 7A–B). The presence of diffuse 4-repeat tau accumulationin astrocytes (astrocytic tufts) was similar to that observed previously(Fig. 7A, thin arrow; Motoi et al., 2004), together with astrocytes withdiminished GFAP, particularly in the soma, and slightly enlarged andabnormally shaped nuclei [Fig. 7B], contributing to the notion thatastrocytic tau inclusions are part of a degenerative process, ratherthan a reactive one (Togo and Dickson, 2002). Munc18-positive astro-cytes were not observed in PSP tissue. Glial tau inclusions (coiledbodies) in oligodendrocytes were observed in both the grey matterand superficial white matter. Astrocytes proximal or distal to anoligodendroglial tau inclusion showed no consistent difference in theirprocess length or thickness. A total of 20 astrocytes (5 from each caseof PSP) were measured. To determine if there is any associationbetween the mean process length and thickness and the distanceof the astrocyte from the nearest glial tau inclusion, scatter plotswere generated against reciprocal distance, similar to the MSA data(Fig. 7C–D). From these graphs, there was no correlation between themean astrocyte length or thickness and distance to the closest glial tauinclusion.
3.5. Unilateral rotenone lesioned mouse shows activated astrocytes proximalto oligodendrocyte alpha-synuclein inclusion bodies
Recently, we have reported a mouse model of α-synucleinopathythat utilises stereotactic unilateral injection of the mitochondrial com-plex 1 inhibitor, rotenone, into the medial forebrain bundle (MFB)(Weetman et al., 2013). In thismodel, unilateralmovement dysfunctionwas observed correlated with the occurrence of α-syn aggregates andwasmore severe in agedmice (Weetman et al., 2013). On further exam-ination, we observed both glial and neuronal α-syn cytoplasmic de-posits in the lesioned, but not the unlesioned hemisphere in corticalareas remote from the injection site at 2 week post-lesion.We reasonedthat the occurrence of glial and neuronal cytoplasmic α-syn inclusionbodies in response to lesion recapitulated some features of MSA. Wetherefore investigated the morphology of astrocytes both proximal toand distal from the glial α-syn deposits in white matter tracts (n =5). Thick sections (30 μm; perfusion fixed) of C57 mouse brain tissuewere examined by immunofluorescence and confocal microscopy.Both rotenone-lesioned and control hemispheres were examined andimaged by single confocal z-slices (Fig. 8A–B). The area near the MFBwas classified as proximal, whilst the internal capsule, thalamus andstriatum were classified as distal. The LB509 anti-α-syn antibodydisplayed some non-specific binding to blood vessels that was easilydistinguished. Astrocyte activation, characterized by thickened and ex-tended processes and high GFAP expression, was observed primarilyin the lesioned hemisphere proximal to theMFB. This also correspondedwith perinuclear α-syn aggregates in both glial and neuronal cells.
3.6. GCI injected mouse shows extensive astrocyte activation proximal toinjection site
In order to test directly if extracellular pathologicalα-syn aggregatescould induce astrocyte activation, we immunopurified GCIs fromunfixed fresh, frozen MSA brain tissue, dispersed by brief sonication inPBS and injected 1:1with PEG vehicle intomouseMFB (n=2) similarly
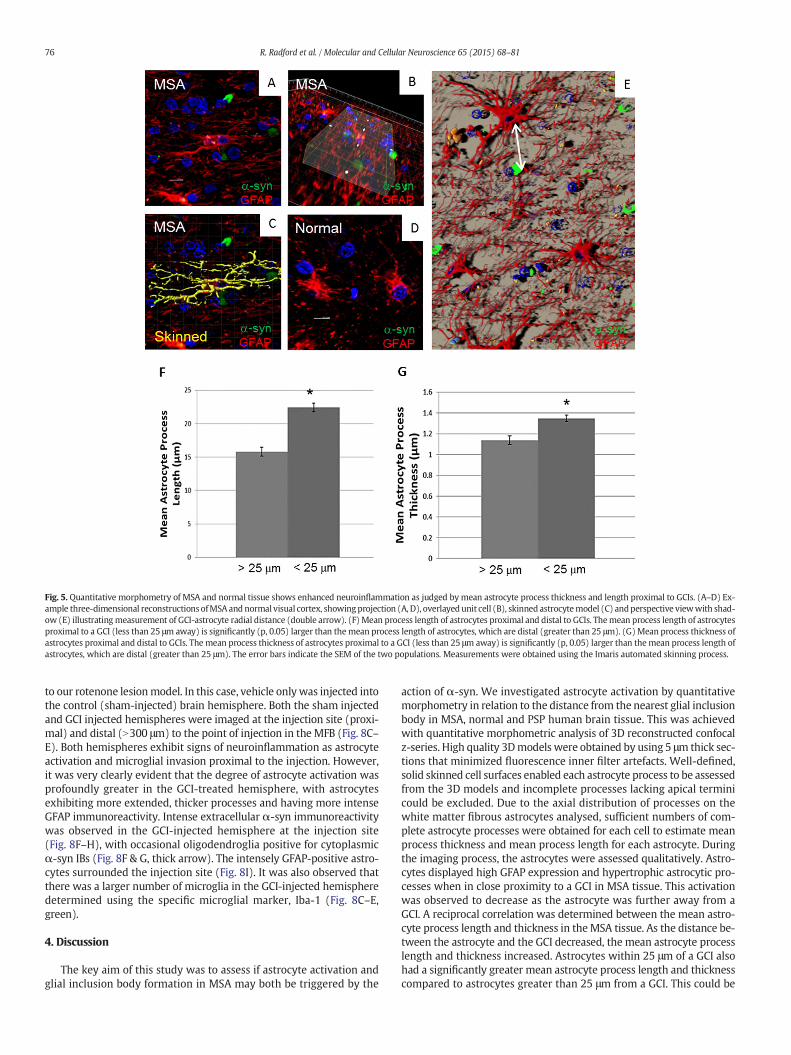
Fig. 5. Quantitative morphometry of MSA and normal tissue shows enhanced neuroinflammation as judged by mean astrocyte process thickness and length proximal to GCIs. (A–D) Ex-ample three-dimensional reconstructions ofMSA and normal visual cortex, showingprojection (A, D), overlayed unit cell (B), skinned astrocytemodel (C) andperspective viewwith shad-ow (E) illustratingmeasurement of GCI-astrocyte radial distance (double arrow). (F) Mean process length of astrocytes proximal and distal to GCIs. Themean process length of astrocytesproximal to a GCI (less than 25 μm away) is significantly (p, 0.05) larger than themean process length of astrocytes, which are distal (greater than 25 μm). (G)Mean process thickness ofastrocytes proximal and distal to GCIs. The mean process thickness of astrocytes proximal to a GCI (less than 25 μm away) is significantly (p, 0.05) larger than themean process length ofastrocytes, which are distal (greater than 25 μm). The error bars indicate the SEM of the two populations. Measurements were obtained using the Imaris automated skinning process.
76 R. Radford et al. / Molecular and Cellular Neuroscience 65 (2015) 68–81
to our rotenone lesionmodel. In this case, vehicle onlywas injected intothe control (sham-injected) brain hemisphere. Both the sham injectedand GCI injected hemispheres were imaged at the injection site (proxi-mal) and distal (N300 μm) to the point of injection in the MFB (Fig. 8C–E). Both hemispheres exhibit signs of neuroinflammation as astrocyteactivation and microglial invasion proximal to the injection. However,it was very clearly evident that the degree of astrocyte activation wasprofoundly greater in the GCI-treated hemisphere, with astrocytesexhibiting more extended, thicker processes and having more intenseGFAP immunoreactivity. Intense extracellular α-syn immunoreactivitywas observed in the GCI-injected hemisphere at the injection site(Fig. 8F–H), with occasional oligodendroglia positive for cytoplasmicα-syn IBs (Fig. 8F & G, thick arrow). The intensely GFAP-positive astro-cytes surrounded the injection site (Fig. 8I). It was also observed thatthere was a larger number of microglia in the GCI-injected hemispheredetermined using the specific microglial marker, Iba-1 (Fig. 8C–E,green).
4. Discussion
The key aim of this study was to assess if astrocyte activation andglial inclusion body formation in MSA may both be triggered by the
action of α-syn. We investigated astrocyte activation by quantitativemorphometry in relation to the distance from the nearest glial inclusionbody in MSA, normal and PSP human brain tissue. This was achievedwith quantitative morphometric analysis of 3D reconstructed confocalz-series. High quality 3Dmodels were obtained by using 5 μm thick sec-tions that minimized fluorescence inner filter artefacts. Well-defined,solid skinned cell surfaces enabled each astrocyte process to be assessedfrom the 3D models and incomplete processes lacking apical terminicould be excluded. Due to the axial distribution of processes on thewhite matter fibrous astrocytes analysed, sufficient numbers of com-plete astrocyte processes were obtained for each cell to estimate meanprocess thickness and mean process length for each astrocyte. Duringthe imaging process, the astrocytes were assessed qualitatively. Astro-cytes displayed high GFAP expression and hypertrophic astrocytic pro-cesses when in close proximity to a GCI in MSA tissue. This activationwas observed to decrease as the astrocyte was further away from aGCI. A reciprocal correlation was determined between the mean astro-cyte process length and thickness in theMSA tissue. As the distance be-tween the astrocyte and the GCI decreased, the mean astrocyte processlength and thickness increased. Astrocytes within 25 μm of a GCI alsohad a significantly greater mean astrocyte process length and thicknesscompared to astrocytes greater than 25 μm from a GCI. This could be
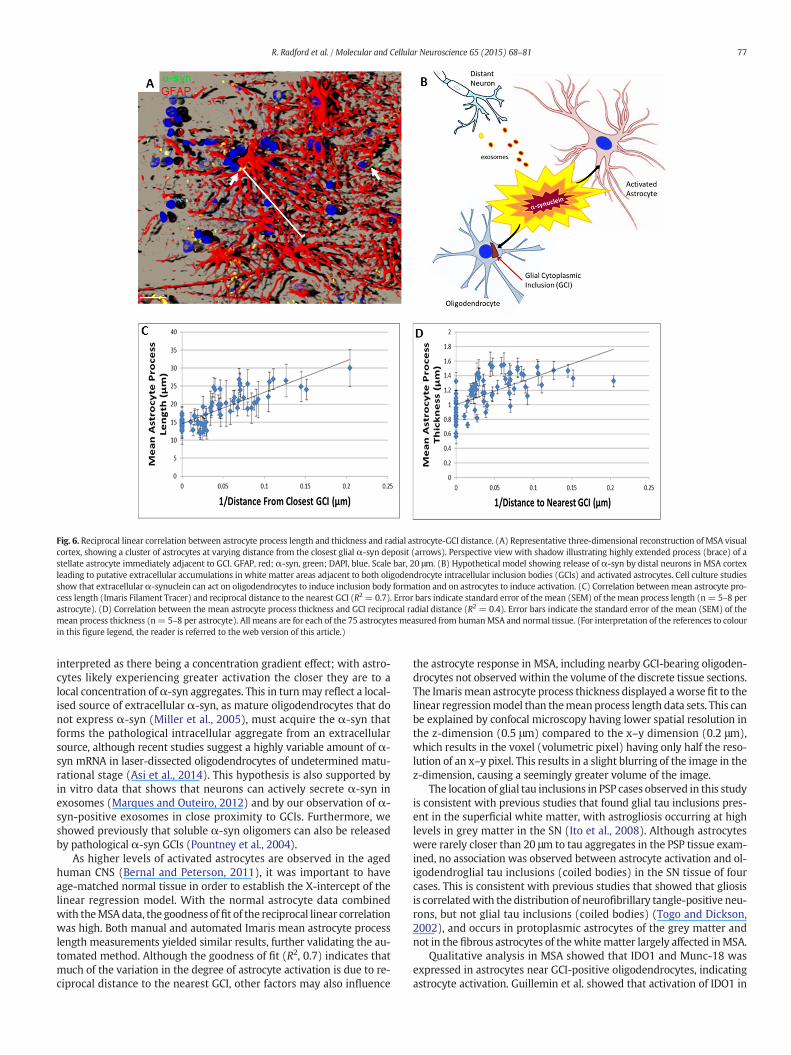
Fig. 6. Reciprocal linear correlation between astrocyte process length and thickness and radial astrocyte-GCI distance. (A) Representative three-dimensional reconstruction of MSA visualcortex, showing a cluster of astrocytes at varying distance from the closest glial α-syn deposit (arrows). Perspective view with shadow illustrating highly extended process (brace) of astellate astrocyte immediately adjacent to GCI. GFAP, red; α-syn, green; DAPI, blue. Scale bar, 20 μm. (B) Hypothetical model showing release of α-syn by distal neurons in MSA cortexleading to putative extracellular accumulations in white matter areas adjacent to both oligodendrocyte intracellular inclusion bodies (GCIs) and activated astrocytes. Cell culture studiesshow that extracellularα-synuclein can act on oligodendrocytes to induce inclusion body formation and on astrocytes to induce activation. (C) Correlation betweenmean astrocyte pro-cess length (Imaris Filament Tracer) and reciprocal distance to the nearest GCI (R2 = 0.7). Error bars indicate standard error of themean (SEM) of themean process length (n = 5–8 perastrocyte). (D) Correlation between the mean astrocyte process thickness and GCI reciprocal radial distance (R2 = 0.4). Error bars indicate the standard error of the mean (SEM) of themean process thickness (n= 5–8 per astrocyte). All means are for each of the 75 astrocytes measured from humanMSA and normal tissue. (For interpretation of the references to colourin this figure legend, the reader is referred to the web version of this article.)
77R. Radford et al. / Molecular and Cellular Neuroscience 65 (2015) 68–81
interpreted as there being a concentration gradient effect; with astro-cytes likely experiencing greater activation the closer they are to alocal concentration ofα-syn aggregates. This in turnmay reflect a local-ised source of extracellular α-syn, as mature oligodendrocytes that donot express α-syn (Miller et al., 2005), must acquire the α-syn thatforms the pathological intracellular aggregate from an extracellularsource, although recent studies suggest a highly variable amount of α-syn mRNA in laser-dissected oligodendrocytes of undetermined matu-rational stage (Asi et al., 2014). This hypothesis is also supported byin vitro data that shows that neurons can actively secrete α-syn inexosomes (Marques and Outeiro, 2012) and by our observation of α-syn-positive exosomes in close proximity to GCIs. Furthermore, weshowed previously that soluble α-syn oligomers can also be releasedby pathological α-syn GCIs (Pountney et al., 2004).
As higher levels of activated astrocytes are observed in the agedhuman CNS (Bernal and Peterson, 2011), it was important to haveage-matched normal tissue in order to establish the X-intercept of thelinear regression model. With the normal astrocyte data combinedwith theMSAdata, the goodness of fit of the reciprocal linear correlationwas high. Both manual and automated Imaris mean astrocyte processlength measurements yielded similar results, further validating the au-tomated method. Although the goodness of fit (R2, 0.7) indicates thatmuch of the variation in the degree of astrocyte activation is due to re-ciprocal distance to the nearest GCI, other factors may also influence
the astrocyte response in MSA, including nearby GCI-bearing oligoden-drocytes not observed within the volume of the discrete tissue sections.The Imarismean astrocyte process thickness displayed aworsefit to thelinear regressionmodel than themeanprocess length data sets. This canbe explained by confocal microscopy having lower spatial resolution inthe z-dimension (0.5 μm) compared to the x–y dimension (0.2 μm),which results in the voxel (volumetric pixel) having only half the reso-lution of an x–y pixel. This results in a slight blurring of the image in thez-dimension, causing a seemingly greater volume of the image.
The location of glial tau inclusions in PSP cases observed in this studyis consistent with previous studies that found glial tau inclusions pres-ent in the superficial white matter, with astrogliosis occurring at highlevels in grey matter in the SN (Ito et al., 2008). Although astrocyteswere rarely closer than 20 μm to tau aggregates in the PSP tissue exam-ined, no association was observed between astrocyte activation and ol-igodendroglial tau inclusions (coiled bodies) in the SN tissue of fourcases. This is consistent with previous studies that showed that gliosisis correlatedwith the distribution of neurofibrillary tangle-positive neu-rons, but not glial tau inclusions (coiled bodies) (Togo and Dickson,2002), and occurs in protoplasmic astrocytes of the grey matter andnot in the fibrous astrocytes of the whitematter largely affected inMSA.
Qualitative analysis in MSA showed that IDO1 and Munc-18 wasexpressed in astrocytes near GCI-positive oligodendrocytes, indicatingastrocyte activation. Guillemin et al. showed that activation of IDO1 in

Fig. 7.Astrocyte activation is not correlated to tau coiled body proximity in progressive supranuclear palsy. (A, B) Representative images of PSP substantia nigra (SN) showing tau 4R-pos-itive glial coiled bodies (white thin arrow) andGFAP-positive astrocytes (large outlined arrow). Scale bar=20 μm. (C) Scatter plot ofmean astrocyte process length and reciprocal distancefrom glial tau inclusion in PSP tissue. (D) Scatter plot of mean astrocyte thickness and reciprocal distance from glial tau inclusion in PSP tissue. Error bars are ±SEM for each astrocyte.
78 R. Radford et al. / Molecular and Cellular Neuroscience 65 (2015) 68–81
human astrocytes leads to increased production of kynurenine, a potentimmunodulator molecule, and kynurenic acid, a neuroprotective me-tabolites, both deriving from tryptophan metabolism (Guillemin et al.,2001). Whereas Burgoyne et al. found cytokine-dependent inductionof astrocytic Munc18 expression (Burgoyne et al., 2009). Moreover,the quantitative morphometry data implies that astrocytes are under-going neuroinflammation when in close proximity to a GCI in MSA tis-sue. We hypothesized that both the occurrence of GCIs and activatedastrocytesmay be induced by the action of a raised concentration of ex-tracellularα-syn acting on each of these cell types. Similarly, in culture,oligodendrocytes produce low levels of α-syn protein during early de-velopment, peaking at three DIV, and insignificantly in mature cells(Richter-Landsberg et al., 2000). Previous studies have also shown anendocytic mechanism of α-syn uptake (Konno et al., 2012). Thus, GCIslikely originate from oligodendrocyte-specific uptake of α-syn releasedby or secreted by other cell types to the extracellular space. In the cur-rent study, complementary data was provided by primary cell culturestudies that showed α-syn addition to the culture medium resulted inα-syn perinuclear inclusion bodies in mature oligodendrocytes, butnot astrocytes. Previously, α-syn treatment has been found to cause ac-tivation by interaction with TLR-4 (Fellner et al., 2013). Here, astrocytecultureswere found to be directly activated byα-syn addition, especial-ly the aggregation-prone A53T mutant, and this involved increased
GFAP expression and ERK1/2 phosphorylation. Use of a MAPKK inhibi-tor blocked α-syn-dependent increase in GFAP expression, consistentwith involvement of the ERK1/2 pathway. Whereas, blocking the JAK/STAT pathway was ineffective.
We assessed if injecting purifiedα-syn aggregates from pathologicalMSA tissue into amouse could cause gliosis and neuroinflammation andcould be distinguished from a sham injection. Therewas a profound dif-ference between the lesioned and sham-injected hemisphere, with thelesioned hemisphere displaying a greater level of neuroinflammation,exhibiting large numbers of highly activated astrocytes and microgliain various stages of activation proximal to the injection site. This is con-sistent with other recent studies where recombinant α-syn or Lewybody-enriched extracts from PD have been injected and caused neuro-inflammation (Recasens et al., 2014). Reyes et al. have also shown trans-fer of α-syn from host over-expressing neurons to graftedoligodendrocytes in rat (Reyes et al., 2014). The lesioned hemispherealso showed signs of neuroinflammation at points distal to the injectionsite suggesting that the pathologicalα-syn aggregates had induced neu-roinflammation distal from the injection site (N65 μm). This may be theresult of the shift to a predominance of pro-inflammatory cytokines re-leased by damaged neurons and activated astrocytes and microglia(Allan et al., 2005). Astrocyte activation in relation to α-syn aggregateswas also investigated in the unilateral rotenone (oxidative stress)

79R. Radford et al. / Molecular and Cellular Neuroscience 65 (2015) 68–81

80 R. Radford et al. / Molecular and Cellular Neuroscience 65 (2015) 68–81
mouse model. Aggregated α-syn was observed in both neurons andglial cells, particularly in the lesioned hemisphere, in regions close totheMFB injection site. Greater numbers of activated astrocyteswere ob-served in close proximity to cellular α-syn deposits, but this was lesspronounced than with the GCI-mouse model.
We investigated the hypothesis that the widespread regional distri-bution of GCI burden, especially in cortical white matter tracts, reflectsthe influence of extracellular α-syn and that the same extracellular α-syn concentrations that lead to GCIs would also act directly on nearbyastrocytes to cause activation. Our findings suggest that astrocyte acti-vation is acutely sensitive to the proximity of α-syn aggregates inMSA white matter and showed that proportionately greater astrocyteactivation is associatedwith being closer to a GCI. We have investigatedtissue from the striatonigral degeneration subtype of MSA and ourfindings may not apply to the olivopontocerebellar atrophy subtype.In the current study, we have used GCIs as an intracellular proxy forthere being or having once been abnormal extracellularα-syn in a local-ised region of brain tissue. Consistent with this, we observed α-syn-positive exosomes close to GCI-bearing cells. Our analysis provides di-rect evidence from human pathological tissue about α-syn distributionwhere the quantitative assessment of extracellular α-syn is not possi-ble. As the observation of molecular markers of neuroinflammation,such as IDO1, cannot accurately be quantitated in terms of the degreeof activation, we have used themean thickness and length of astrocytesas a quantitative morphometric measure of activation. This is able toprovide a numerical scale of the degree of astrocyte activation that can-not readily be obtained by the assessment of molecular markers of as-trocyte activation. Although it is clear that α-syn uptake byoligodendrocyteswould have the effect of lowering localized extracellu-lar concentration of the protein, the occurrence of a GCIwould still indi-cate that α-syn was once extracellular with the ability to act on bothastrocyte and oligodendrocyte cell types.
Astrocyte activation was observed near glial α-syn aggregates in aunilateral rotenone lesioned mouse model. Moreover, pathological α-syn isolated from human MSA tissue induced microglial proliferationand astrocyte activation when injected into the mouse brain. Further-more,α-syn treatment of primary cells caused GCI-like inclusion bodiesinmature oligodendrocytes and activation of astrocytes, especially withthe aggregation-prone A53T mutant protein, that could be blocked byMAPKK inhibition. The mode of uptake of α-syn by mature oligoden-drocytes in human tissue is unclear. Furthermore, the white matteraxons are covered by myelin, so that the only site at which neuronal el-ements could be exposed to the extracellular spacewould be at nodes ofRanvier. In the current model, stressed neurons may release α-syn, in-cluding by the exosome pathway, which may then accumulate in theextracellular space where the protein acts differentially on each glialcell type. This has great significance for the development of specificanti-inflammatory therapies for MSA, such as therapeutic recombinantmonoclonal antibodies that may target the interaction between extra-cellular α-syn species and glial cell surface receptors.
Acknowledgements
Financial support of the Clem Jones Foundation, Griffith HealthInstitute, Australian Research Council (LIEF) and the Menzies ResearchInstitute Tasmania is gratefully acknowledged.
Fig. 8. Astrocyte activation in unilateral rotenone-lesioned mouse and GCI-injected mouse modmouse (rotenone lesioned hemisphere) showing activated astrocytes (white outlined arrow)distal from the injection site (B; internal capsule). (C–I) GCI injected mouse. (C, D) RepresentatC, E) and distal (N300 μm; D) to the point of injection. The sham-injected hemisphere close tofrequent highly GFAP positive astrocytes that appear larger and have extended processes. Therea few displaying an activated phenotype (cellular hypertrophy and retracted projections (chicdented arrow head). Normal arrows indicate ramified microglia; Chicken foot arrow marks re(F) Occasional oligodendrocytes were observed with perinuclear α-syn deposits (thick arrow)posit. (H,I) 4× view showing GCI injection site (thin arrow) with thick arrows indicating needleexcept as indicated.
References
Ahmed, Z., et al., 2012. The neuropathology, pathophysiology and genetics of multiplesystem atrophy. Neuropathol. Appl. Neurobiol. 38 (1), 4–24.
Ahmed, Z., et al., 2013. Identification and quantification of oligodendrocyte precursor cellsin multiple system atrophy, progressive supranuclear palsy and Parkinson's disease.Brain Pathol. 23 (3), 263–273.
Allan, S.M., et al., 2005. Interleukin-1 and neuronal injury. Nat. Rev. Immunol. 5 (8),629–640.
Angot, E., et al., 2010. Are synucleinopathies prion-like disorders? Lancet Neurol. 9 (11),1128–1138.
Asi, Y.T., Simpson, J.E., Heath, P.R., Wharton, S.B., Lees, A.J., Revesz, T., Houlden, H., Holton,J.L., 2014. Alpha-synuclein mRNA expression in oligodendrocytes in MSA. Glia 62 (6),964–970.
Balasingam, V., et al., 1994. Reactive astrogliosis in the neonatal mouse brain and its mod-ulation by cytokines. J. Neurosci. 14 (2), 846–856.
Bernal, G.M., Peterson, D.A., 2011. Phenotypic and gene expressionmodificationwith nor-mal brain aging in GFAP-positive astrocytes and neural stem cells. Aging Cell 10 (3),466–482.
Burgoyne, R.D., et al., 2009. The functions of munc18-1 in regulated exocytosis. Ann. N. Y.Acad. Sci. 1152 (1), 76–86.
Chen, Y., et al., 2010. The kynurenine pathway and inflammation in amyotrophic lateralsclerosis. Neurotox. Res. 18 (2), 132–142.
Chiba, Y., et al., 2012. Immunohistochemical localization of aggresomal proteins in glialcytoplasmic inclusions in multiple system atrophy. Neuropathol. Appl. Neurobiol.38 (6), 559–571.
Chu, Y., Kordower, J.H., 2010. Lewy body pathology in fetal grafts. Ann. N. Y. Acad. Sci.1184 (1), 55–67.
Chung, R.S., et al., 2004. Neuron-glia communication: metallothionein expression is spe-cifically up-regulated by astrocytes in response to neuronal injury. J. Neurochem.88 (2), 454–461.
Conway, K.A., Harper, J.D., Lansbury, P.T., 1998. Accelerated in vitro fibril formation by amutant alpha-synuclein linked to early-onset Parkinson disease. Nat. Med. 4 (11),1318–1320.
Cookson, M.R., van der Brug, M., 2008. Cell systems and the toxic mechanism(s) of α-synuclein. Exp. Neurol. 209 (1), 5–11.
De Silva, R., et al., 2003. Pathological inclusion bodies in tauopathies contain distinct com-plements of tau with three or four microtubule-binding repeat domains as demon-strated by new specific monoclonal antibodies. Neuropathol. Appl. Neurobiol. 29(3), 288–302.
Drouin-Ouellet, J., Cicchetti, F., 2012. Inflammation and neurodegeneration: the storyʻretolledʼ. Trends Pharmacol. Sci. 33 (10), 542–551.
Dyer, C.A., Matthieu, J.-M., 1994. Antibodies to myelin/oligodendrocyte-specific proteinand myelin/oligodendrocyte glycoprotein signal distinct changes in the organizationof cultured oligodendroglial membrane sheets. J. Neurochem. 62 (2), 777–787.
Fellner, L., et al., 2011. Glial dysfunction in the pathogenesis of α-synucleinopathies:emerging concepts. Acta Neuropathol. 121 (6), 675–693.
Fellner, L., et al., 2013. Toll-like receptor 4 is required for α-synuclein dependent activa-tion of microglia and astroglia. Glia 61 (3), 349–360.
Follett, J., et al., 2013. Potassium depolarization and raised calcium induces α-synucleinaggregates. Neurotox. Res. 23 (4), 378–392.
Gai, W.P., et al., 1999. α-Synuclein immunoisolation of glial inclusions frommultiple sys-tem atrophy brain tissue reveals multiprotein components. J. Neurochem. 73 (5),2093–2100.
Gai,W.P., et al., 2003.α-Synuclein fibrils constitute the central core of oligodendroglial in-clusion filaments in multiple system atrophy. Exp. Neurol. 181 (1), 68–78.
Goodwin, et al., 2013. Raised calcium and oxidative stress cooperatively promote alpha-synuclein aggregate formation. Neurochem Int. 62 (5), 703–711.
Guillemin, G.J., Kerr, S.J., Smythe, G.A., Smith, D.G., Kapoor, V., Armati, P.J., Croitoru, J.,Brew, B.J., 2001. Kynurenine pathway metabolism in human astrocytes: a paradoxfor neuronal protection. J. Neurochem. 78, 842–853.
Hansen, C., et al., 2011. α-Synuclein propagates from mouse brain to grafted dopaminer-gic neurons and seeds aggregation in cultured human cells. J. Clin. Invest. 121 (2),715–725.
Ishizawa, K., et al., 2004. Microglial activation parallels system degeneration in multiplesystem atrophy. J. Neuropathol. Exp. Neurol. 63 (1), 43–52.
Ishizawa, K., et al., 2008. Glial cytoplasmic inclusions and tissue injury in multiple systematrophy: a quantitative study inwhitematter (olivopontocerebellar system) and graymatter (nigrostriatal system). Neuropathology 28 (3), 249–257.
Ito, K., et al., 2008. Astrocytic tau pathology positively correlates with neurofibrillary tan-gle density in progressive supranuclear palsy. Acta Neuropathol. 115 (6), 623–628.
Itoh, T., et al., 2002. AMPA glutamate receptor-mediated calcium signaling is transientlyenhanced during development of oligodendrocytes. J. Neurochem. 81 (2), 390–402.
els proximal to α-synuclein. (A, B) Representative images of unilateral rotenone injected-close to glial α-syn aggregates (white arrow) proximal to the injection site (A; MFB) andive images of GCI-injected and (E) sham-injected hemispheres at injection site (proximal;the injection site shows limited astrogliosis. The area proximal to the GCI injection showsis also a large number of lba-1-positive ramifiedmicroglia (normalwhite arrow) aswell asken foot arrow)). Phagocytic microglia lack projections and have enlarged cell bodies (in-active microglia and indented arrowheads show microglia with a phagocytic phenotype.and frequent astrocytes showed surface α-syn. (G) Enlargement of perinuclear α-syn de-track. (H)α-syn immunofluorescence. (I) GFAP immunofluorescence. Scale bar= 50 μm,

81R. Radford et al. / Molecular and Cellular Neuroscience 65 (2015) 68–81
Jellinger, K., Lantos, P., 2010. Papp–Lantos inclusions and the pathogenesis of multiplesystem atrophy: an update. Acta Neuropathol. 119 (6), 657–667.
Jensen, P.H., et al., 2000. Microtubule-associated protein 1B Is a component of corticallewy bodies and binds α-synuclein filaments. J. Biol. Chem. 275 (28), 21500–21507.
Jonas, R.A., et al., 2012. The spider effect: morphological and orienting classification of mi-croglia in response to stimuli in vivo. PLoS One 7 (2), e30763.
Kaufman, E., et al., 2013. Proinflammatory cytokines are elevated in serum of patientswith multiple system atrophy. PLoS One 8 (4), e62354.
Kettenmann, H., et al., 2011. Physiology of microglia. Physiol. Rev. 91 (2), 461–553.Kiely, A., et al., 2013. α-Synucleinopathy associated with G51D SNCAmutation: a link be-
tween Parkinson's disease and multiple system atrophy? Acta Neuropathol. 125 (5),753–769.
Konno,M., et al., 2012. Suppression of dynamin GTPase decreases alpha-synuclein uptake byneuronal and oligodendroglial cells: a potent therapeutic target for synucleinopathy.Mol. Neurodegener. 7 (1), 38.
Kordower, J.H., Brundin, P., 2009. Propagation of host disease to grafted neurons: accumu-lating evidence. Exp. Neurol. 220 (2), 224–225.
Kuzdas-Wood, D., Stefanova, N., Jellinger, K.A., Seppi, K., Schlossmacher, M.G., Poewe, W.,Wenning, G.K., 2014. Towards translational therapies for multiple system atrophy.Prog. Neurobiol. 118, 19–35.
Lee, H.-J., Kim, C., Lee, S.-J., 2010. Alpha-synuclein stimulation of astrocytes: potential rolefor neuroinflammation and neuroprotection. Oxidative Med. Cell. Longev. 3 (4),283–287.
Lindersson, E., et al., 2004. Proteasomal inhibition by α-synuclein filaments and oligo-mers. J. Biol. Chem. 279 (13), 12924–12934.
Long-Smith, C.M., Sullivan, A.M., Nolan, Y.M., 2009. The influence of microglia on thepathogenesis of Parkinson's disease. Prog. Neurobiol. 89 (3), 277–287.
Lowe, R., et al., 2004. Calcium(II) selectively induces α-synuclein annular oligomers viainteraction with the C-terminal domain. Protein Sci. 13 (12), 3245–3252.
Marques, O., Outeiro, T.F., 2012. Alpha-synuclein: from secretion to dysfunction anddeath. Cell. Death Dis. 3, e350.
McCarthy, K.D., de Vellis, J., 1980. Preparation of separate astroglial and oligodendroglialcell cultures from rat cerebral tissue. J. Cell Biol. 85 (3), 890–902.
Mestrallet, C.A., 2011. Homeostasis of dendritic spines in hippocampal CA1 cells. Depart-ment of Neuroscience, Physiology and Pharmacology. University College London,London.
Miller, D.W., et al., 2005. Absence of α-synuclein mRNA expression in normal and multi-ple system atrophy oligodendroglia. J. Neural Transm. 112 (12), 1613–1624.
Motoi, Y., et al., 2004. Glial localization of four-repeat tau in atypical progressivesupranuclear palsy. Neuropathology 24 (1), 60–65.
Nath, S., et al., 2011. Raised calcium promotesα-synuclein aggregate formation. Mol. Cell.Neurosci. 46 (2), 516–526.
Pekny, M., Nilsson, M., 2005. Astrocyte activation and reactive gliosis. Glia 50 (4),427–434.
Pountney, D.L., et al., 2004. Annularα-synuclein species from purifiedmultiple system at-rophy inclusions. J. Neurochem. 90 (2), 502–512.
Pountney, D.L., et al., 2005a. SUMO-1 marks subdomains within glial cytoplasmic inclu-sions of multiple system atrophy. Neurosci. Lett. 381 (1–2), 74–79.
Pountney, D.L., et al., 2005b. αB-Crystallin is a major component of glial cytoplasmic in-clusions in multiple system atrophy. Neurotox. Res. 7 (1–2), 77–85.
Pountney, D., Voelcker, N., Gai, W., 2005c. Annular alpha-synuclein oligomers are poten-tially toxic agents in alpha-synucleinopathy. Hypothesis. Neurotox. Res. 7 (1–2),59–67.
Radford, R., Wong, M.B., Pountney, D.L., 2014. Neurodegenerative aspects of multiple sys-tem atrophy. In: Kostrzewa, R.M. (Ed.), Handbook of Neurotoxicity 110. SpringerScience + Business Media, New York (ISBN-13: 978-1461458357).
Recasens, A., Dehay, B., Bové, J., Carballo-Carbajal, I., Dovero, S., Pérez-Villalba, A.,Fernagut, P.O., Blesa, J., Parent, A., Perier, C., Fariñas, I., Obeso, J.A., Bezard, E., Vila,M., 2014. Lewy body extracts from Parkinson disease brains trigger α-synuclein pa-thology and neurodegeneration in mice and monkeys. Ann. Neurol. 75, 351–362.http://dx.doi.org/10.1002/ana.24066.
Reyes, J.F., Rey, N.L., Bousset, L., Melki, R., Brundin, P., Angot, E., 2014. Alpha-synucleintransfers from neurons to oligodendrocytes. Glia 62 (3), 387–398.
Richter-Landsberg, C., Leyk, J., 2013. Inclusion body formation, macroautophagy, and therole of HDAC6 in neurodegeneration. Acta Neuropathol. 126 (6), 793–807. http://dx.doi.org/10.1007/s00401-013-1158-x.
Richter-Landsberg, C., et al., 2000. α-Synuclein is developmentally expressed in culturedrat brain oligodendrocytes. J. Neurosci. Res. 62 (1), 9–14.
Song, Y.J.C., et al., 2009. Degeneration in different Parkinsonian syndromes relates to as-trocyte type and astrocyte protein expression. J. Neuropathol. Exp. Neurol. 68 (10),1073–1083. http://dx.doi.org/10.1097/NEN.0b013e3181b66f1b.
Stefanova, N., et al., 2001. Glial cell death induced by overexpression of α-synuclein.J. Neurosci. Res. 65 (5), 432–438.
Tien, L.T., et al., 2013. Neonatal exposure to lipopolysaccharide enhances accumulation ofα-synuclein aggregation and dopamine transporter protein expression in thesubstantia nigra in responses to rotenone challenge in later life. Toxicology 308,96–103.
Togo, T., Dickson, D., 2002. Tau accumulation in astrocytes in progressive supranuclearpalsy is a degenerative rather than a reactive process. Acta Neuropathol. 104 (4),398–402.
Vekrellis, K., Stefanis, L., 2012. Targeting intracellular and extracellular alpha-synuclein asa therapeutic strategy in Parkinson's disease and other synucleinopathies. ExpertOpin. Ther. Targets 16 (4), 421–432.
Wan, O.W., Chung, K.K.K., 2012. The role of alpha-synuclein oligomerization and aggrega-tion in cellular and animal models of Parkinson's disease. PLoS One 7 (6), e38545.
Waxman, E.A., Giasson, B.I., 2009. Molecular mechanisms of α-synuclein neurodegenera-tion. Biochim. Biophys. Acta (BBA)-Mol. Basis Dis. 1792 (7), 616–624.
Weetman, J., et al., 2013. Increased SUMO-1 expression in the unilateral rotenone-lesioned mouse model of Parkinson's disease. Neurosci. Lett. 544, 119–124.
Wenning, G.K., et al., 2008. Multiple system atrophy: a primary oligodendrogliopathy.Ann. Neurol. 64 (3), 239–246.
Wenning, G.K., Litvan, I., Tolosa, E., 2011. Milestones in atypical and secondary Parkinson-isms. Mov. Disord. 26 (6), 1083–1095.
Wong, M., et al., 2013. SUMO-1 is associated with a subset of lysosomes in glial proteinaggregate diseases. Neurotox. Res. 23 (1), 1–21.
Related Documents


