ELSEVIER Tectonophysics 303 (1999) 109–130 The deformation of the Egersund–Ogna anorthosite massif, south Norway: finite-element modelling of diapirism J.D. Barnichon a , H. Havenith b , B. Hoffer b , R. Charlier a , D. Jongmans b , J.C. Duchesne c,* a De ´partement MSM, Universite ´ de Lie `ge, 6 Quai Banning, B-4000 Lie `ge, Belgium b Laboratoire de Ge ´ologie de l’Inge ´nieur, LGIH, Universite ´ de Lie `ge, Bat. B19, B-4000 Sart Tilman, Belgium c Lab. Ass. Ge ´ologie, Pe ´trologie et Ge ´ochimie, Universite ´ de Lie `ge, Bat. B20, B-4000 Sart Tilman, Belgium Accepted 30 October 1998 Abstract This paper aims at testing the mechanical relevance of the petrological model of anorthosite massif diapiric emplace- ment. The Egersund–Ogna massif (S. Norway) is of particular interest because recent petrological and geochronological data constrain the initial geometry, emplacement conditions and timing (about 2 m.y.). The formation of this anorthosite massif is in agreement with the classical petrological model, in which accumulation of plagioclase takes place in a deep-seated magma chamber at the crust–mantle limit, from which masses of plagioclase separate and rise through the lower crust up to the final level of emplacement at mid-crustal depths. The Egersund–Ogna massif also displays a foliated inner margin, in which strain ellipsoids have been reconstructed by investigating at 51 sites the deformation of megacrysts of high-alumina orthopyroxene. Based on these petrological data, a model made up of one rigid layer (upper granitic crust) and three viscous layers (lower part of the granitic crust, noritic lower crust and anorthosite) has been built up. The upper crust behaviour is represented by an elastoplastic law and the viscous layers obey elastic-viscoplastic laws with Newtonian viscosity. An inverse density gradient is considered between the lower crust .d D 3:00/ and the anorthosite .d D 2:75/, the loading consisting only in gravity. The modelling is carried out under axisymmetrical conditions, using the LAGAMINE finite-element code coupled with an automatic re-meshing algorithm designed to deal with large strains in complex structures. The results show that, from a mechanical point of view, the diapirism model is a robust and consistent assumption for the emplacement of anorthosites, because realistic diapir and rim-syncline shapes are obtained. Moreover, the numerically obtained emplacement time (about 2.5 m.y.) is in agreement with the available geochronological data, and the computed strain field is coherent with field measurements, especially regarding the circumferential extension, which becomes the largest extension strain component in the expansion phase. 1999 Elsevier Science B.V. All rights reserved. Keywords: anorthosite; diapir; finite-element modelling; Rogaland 1. Introduction Diapirism results from the buoyant upwelling of a light viscous liquid when overlain by a heavier one. L Corresponding author. Tel.: C32 43 66 2255; Fax: C32 43 66 2921; E-mail: [email protected] Such state is metastable, i.e. every perturbation of the system will lead to overturning the two liquid layers in order to reach the stable balanced state where the lighter liquid floats above the heavier one. The initial stage of this instability is described ana- lytically by the Rayleigh–Taylor instability, observed both in plutonic and sedimentary environments, from 0040-1951/99/$ – see front matter 1999 Elsevier Science B.V. All rights reserved. PII:S0040-1951(98)00247-9

Welcome message from author
This document is posted to help you gain knowledge. Please leave a comment to let me know what you think about it! Share it to your friends and learn new things together.
Transcript
ELSEVIER Tectonophysics 303 (1999) 109–130
The deformation of the Egersund–Ogna anorthosite massif,south Norway: finite-element modelling of diapirism
J.D. Barnichon a, H. Havenith b, B. Hoffer b, R. Charlier a, D. Jongmans b, J.C. Duchesne c,*
a Departement MSM, Universite de Liege, 6 Quai Banning, B-4000 Liege, Belgiumb Laboratoire de Geologie de l’Ingenieur, LGIH, Universite de Liege, Bat. B19, B-4000 Sart Tilman, Belgium
c Lab. Ass. Geologie, Petrologie et Geochimie, Universite de Liege, Bat. B20, B-4000 Sart Tilman, Belgium
Accepted 30 October 1998
Abstract
This paper aims at testing the mechanical relevance of the petrological model of anorthosite massif diapiric emplace-ment. The Egersund–Ogna massif (S. Norway) is of particular interest because recent petrological and geochronologicaldata constrain the initial geometry, emplacement conditions and timing (about 2 m.y.). The formation of this anorthositemassif is in agreement with the classical petrological model, in which accumulation of plagioclase takes place in adeep-seated magma chamber at the crust–mantle limit, from which masses of plagioclase separate and rise through thelower crust up to the final level of emplacement at mid-crustal depths. The Egersund–Ogna massif also displays a foliatedinner margin, in which strain ellipsoids have been reconstructed by investigating at 51 sites the deformation of megacrystsof high-alumina orthopyroxene. Based on these petrological data, a model made up of one rigid layer (upper graniticcrust) and three viscous layers (lower part of the granitic crust, noritic lower crust and anorthosite) has been built up.The upper crust behaviour is represented by an elastoplastic law and the viscous layers obey elastic-viscoplastic laws withNewtonian viscosity. An inverse density gradient is considered between the lower crust .d D 3:00/ and the anorthosite.d D 2:75/, the loading consisting only in gravity. The modelling is carried out under axisymmetrical conditions, using theLAGAMINE finite-element code coupled with an automatic re-meshing algorithm designed to deal with large strains incomplex structures. The results show that, from a mechanical point of view, the diapirism model is a robust and consistentassumption for the emplacement of anorthosites, because realistic diapir and rim-syncline shapes are obtained. Moreover,the numerically obtained emplacement time (about 2.5 m.y.) is in agreement with the available geochronological data, andthe computed strain field is coherent with field measurements, especially regarding the circumferential extension, whichbecomes the largest extension strain component in the expansion phase. 1999 Elsevier Science B.V. All rights reserved.
Keywords: anorthosite; diapir; finite-element modelling; Rogaland
1. Introduction
Diapirism results from the buoyant upwelling of alight viscous liquid when overlain by a heavier one.
Ł Corresponding author. Tel.: C32 43 66 2255; Fax: C32 43 662921; E-mail: [email protected]
Such state is metastable, i.e. every perturbation ofthe system will lead to overturning the two liquidlayers in order to reach the stable balanced statewhere the lighter liquid floats above the heavier one.The initial stage of this instability is described ana-lytically by the Rayleigh–Taylor instability, observedboth in plutonic and sedimentary environments, from
0040-1951/99/$ – see front matter 1999 Elsevier Science B.V. All rights reserved.PII: S 0 0 4 0 - 1 9 5 1 ( 9 8 ) 0 0 2 4 7 - 9

110 J.D. Barnichon et al. / Tectonophysics 303 (1999) 109–130
crustal to metre scale (Ronnlund, 1989). Numerousexamples of salt diapirism have been described (e.g.Jackson and Seni, 1983).
Pluton emplacement through diapirism has beenthe object of many petrological and structural studies.Since the pioneering field work of Pitcher and Berger(1972) and the experiments of Ramberg (1967), moststudies have been essentially devoted to granites forwhich the concept of diapirs has been strongly de-bated (e.g. England, 1990; Paterson and Fowler, 1993;Vernon and Paterson, 1993; Vigneresse, 1995; Pater-son and Vernon, 1996). It is beyond the scope ofthis article to discuss the different arguments aboutthis controversial subject and we will only brieflypresent some main ideas. Following Brun et al. (1981)and England (1990), the main diagnostic criteria andstructural features for the recognition of diapiric bod-ies are: (1) sub-circular shaped bodies of low den-sity surrounded by denser rocks; (2) parallel foliationswithin the diapir and the host rocks; (3) increase of thestrain intensity towards the margin of the diapir witha horizontal extension in the upper part of the diapiricstructure; (4) important deformation in the countryrocks; (5) development of a rim synform; (6) steeplyplunging lineations and shear components. However,other processes like stoping, fracture-controlled em-placement, zone melting or ballooning can also beinvolved in the emplacement and deformation of plu-tons (Paterson et al., 1991). Many of the expectedfeatures of diapirs can therefore result from someor a combination of these mechanisms, and typicalcharacteristics of ascent mechanism can be obliter-ated during emplacement or by younger tectonic pro-cesses. These are the reasons why direct evidence ofdiapirism is generally difficult to find out in plutons.
Diapirism has long been invoked for the emplace-ment of massif-type anorthosites. Martignole andSchrijver (1970) first attempted to interpret defor-mation structures in the Morin anorthosite in termsof syn-emplacement deformation due to buoyancy of
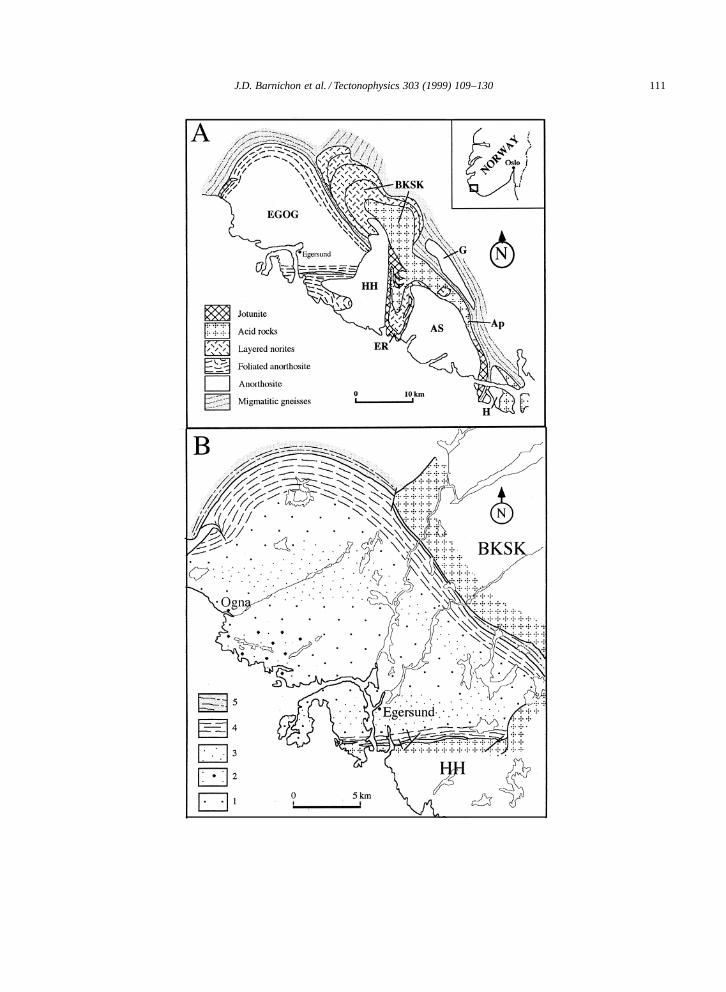
Fig. 1. (A) Geological map of the Rogaland anorthosite complex, southern Norway (after Michot and Michot, 1969; Wilson et al.,1996). Abbreviations: Ap D Apophysis, AS D Ana–Sira anorthosite massif, BKSK D Bjerkreim–Sokndal layered intrusion, EGOG DEgersund–Ogna anorthosite massif, ER D Eia–Rekefjord jotunitic intrusion, G D Garsaknat leuconoritic body, H D Hidra leuconoriticbody, HH D Haland–Helleren anorthosite massif. (B) Geological map of the Egersund–Ogna anorthosite massif (after Michot andMichot, 1969; Maquil and Duchesne, 1984; Duchesne and Maquil, 1987). Abbreviations: BKSK D Bjerkreim–Sokndal layered intrusion,HH D Haland–Helleren anorthosite massif. Legend: 1 D anorthosite; 2 D anorthosite rich in HAOM; 3 D leuconorite; 4 D foliatedanorthosite and leuconorite; 5 D migmatitic gneiss.
anorthosite. The concept was further developed byDuchesne (1984), Longhi and Ashwal (1985) andWiebe (1992) to become a basic component of thepetrological model of anorthosite formation (Ash-wal, 1993). Anorthosite plutons in classical areas ofstudy such as the Adirondacks Mts or Morin massif(Quebec) have been reworked by post-emplacementdeformation and metamorphism (see e.g. Wiebe,1992). Moreover, some of the features initially in-voked in the Morin massif in favour of diapirismhave now been reinterpreted by Martignole (1996)as resulting from tectonic transport along a shearzone. On the other hand, accurate U–Pb dating ofthe Rogaland anorthosite plutonism (southern Nor-way) (Scharer et al., 1996) has shown that theseanorthosites were emplaced later than the last re-gional deformation and, having thus escaped post-emplacement deformation, are excellent examples ofpristine anorthosites.
We recall here the petrological arguments infavour of diapirism of the Egersund–Ogna massif(EGOG), provide some data on the strain distribu-tion in the inner margin of the intrusion, and presenta finite-element (FE) simulation of the diapiric em-placement, in which geochronological and petrolog-ical data are used to define a reasonable geometryand rheology of the model. The main objective ofthis paper is to test the consistency of the petrolog-ical model by numerical modelling. A LagrangianFE code coupled with an automatic re-meshing al-gorithm and artificial passive markers is used for themodelling.
2. The EGOG massive anorthosite
2.1. Geological setting
The Rogaland anorthositic province of south-ern Norway (Fig. 1A) encompasses three large
J.D. Barnichon et al. / Tectonophysics 303 (1999) 109–130 111

112 J.D. Barnichon et al. / Tectonophysics 303 (1999) 109–130
J.D. Barnichon et al. / Tectonophysics 303 (1999) 109–130 113
anorthosite massifs, EGOG massif, the Haland–Helleren (HH), and the Ana–Sira (AS) bodies as wellas a layered intrusion: the Bjerkreim–Sokndal mas-sif (BKSK) (Michot and Michot, 1969; Duchesne,1987a). These bodies were emplaced in migmatiticgneisses and have induced a large aureole of gran-ulite facies thermal metamorphism (see the reviewby Maijer, 1987). Precise U–Pb dating (Scharer etal., 1996) clearly shows that all the anorthosite mas-sifs intruded at 931 š 2 Ma, in a very short timeinterval (probably 2 m.y. or less), some 60 m.y. afterthe last pervasive regional deformation and imbri-cation of continental terranes. No shear zones oflarge amplitude or structures potentially favouringtheir emplacement have been recognized around theanorthosite province (Falkum, 1985). Anorthositemassifs thus appear in their pristine post-collisionalor anorogenic state.
The EGOG massif (Fig. 1B), broadly circular (c.20 km in diameter), is dome-shaped and shows a 1–3-km-thick inner margin of foliated leuconorite (Mi-chot and Michot, 1969). In the north, the foliation isconcordant both with the contact and with the folia-tion of migmatitic country gneisses. In the east, thefoliated margin, dipping 80ºE, is separated from theBKSK intrusion by a continuous highly deformednorito-granitic screen. In the south, a similar, thoughdiscontinuous, screen — called the norito-graniticzone by Michot and Michot (1969) — separates theEGOG from the Haland massif, which is also foli-ated parallel to the contact. The southeastern tip ofEGOG is truncated by the unfoliated Helleren mas-sif. The EGOG foliation is generally steep (dippingat 60º–90º) in the southern margin, whereas it dips ata lower angle (35º–65º) in the northern contact withmigmatitic gneisses.
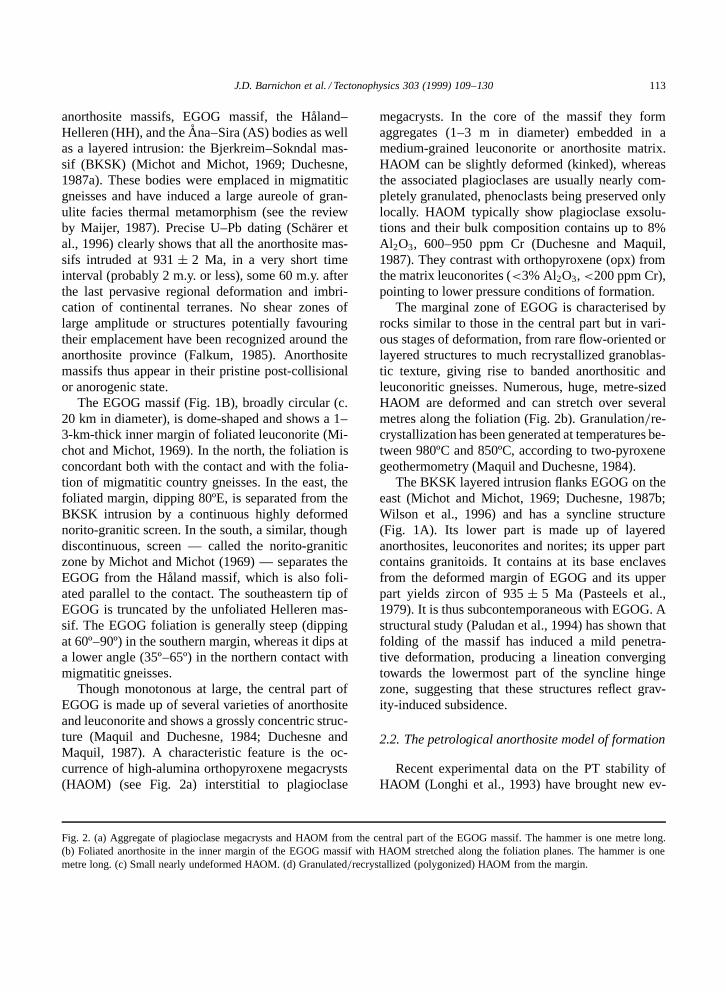
Though monotonous at large, the central part ofEGOG is made up of several varieties of anorthositeand leuconorite and shows a grossly concentric struc-ture (Maquil and Duchesne, 1984; Duchesne andMaquil, 1987). A characteristic feature is the oc-currence of high-alumina orthopyroxene megacrysts(HAOM) (see Fig. 2a) interstitial to plagioclase
Fig. 2. (a) Aggregate of plagioclase megacrysts and HAOM from the central part of the EGOG massif. The hammer is one metre long.(b) Foliated anorthosite in the inner margin of the EGOG massif with HAOM stretched along the foliation planes. The hammer is onemetre long. (c) Small nearly undeformed HAOM. (d) Granulated=recrystallized (polygonized) HAOM from the margin.
megacrysts. In the core of the massif they formaggregates (1–3 m in diameter) embedded in amedium-grained leuconorite or anorthosite matrix.HAOM can be slightly deformed (kinked), whereasthe associated plagioclases are usually nearly com-pletely granulated, phenoclasts being preserved onlylocally. HAOM typically show plagioclase exsolu-tions and their bulk composition contains up to 8%Al2O3, 600–950 ppm Cr (Duchesne and Maquil,1987). They contrast with orthopyroxene (opx) fromthe matrix leuconorites (<3% Al2O3,<200 ppm Cr),pointing to lower pressure conditions of formation.
The marginal zone of EGOG is characterised byrocks similar to those in the central part but in vari-ous stages of deformation, from rare flow-oriented orlayered structures to much recrystallized granoblas-tic texture, giving rise to banded anorthositic andleuconoritic gneisses. Numerous, huge, metre-sizedHAOM are deformed and can stretch over severalmetres along the foliation (Fig. 2b). Granulation=re-crystallization has been generated at temperatures be-tween 980ºC and 850ºC, according to two-pyroxenegeothermometry (Maquil and Duchesne, 1984).
The BKSK layered intrusion flanks EGOG on theeast (Michot and Michot, 1969; Duchesne, 1987b;Wilson et al., 1996) and has a syncline structure(Fig. 1A). Its lower part is made up of layeredanorthosites, leuconorites and norites; its upper partcontains granitoids. It contains at its base enclavesfrom the deformed margin of EGOG and its upperpart yields zircon of 935 š 5 Ma (Pasteels et al.,1979). It is thus subcontemporaneous with EGOG. Astructural study (Paludan et al., 1994) has shown thatfolding of the massif has induced a mild penetra-tive deformation, producing a lineation convergingtowards the lowermost part of the syncline hingezone, suggesting that these structures reflect grav-ity-induced subsidence.
2.2. The petrological anorthosite model of formation
Recent experimental data on the PT stability ofHAOM (Longhi et al., 1993) have brought new ev-
114 J.D. Barnichon et al. / Tectonophysics 303 (1999) 109–130
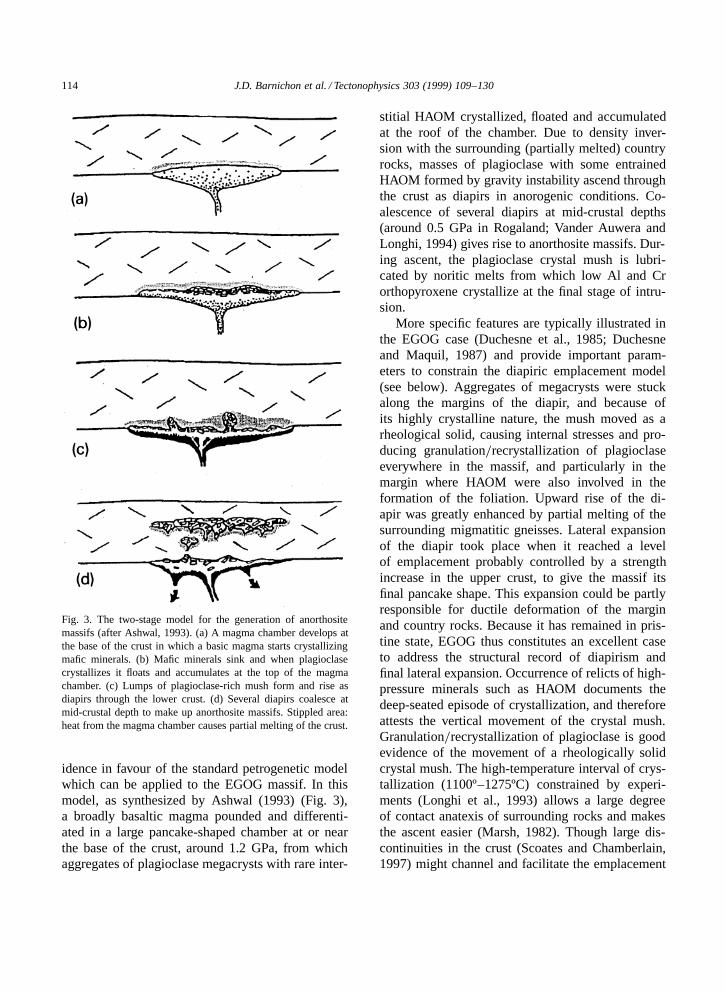
Fig. 3. The two-stage model for the generation of anorthositemassifs (after Ashwal, 1993). (a) A magma chamber develops atthe base of the crust in which a basic magma starts crystallizingmafic minerals. (b) Mafic minerals sink and when plagioclasecrystallizes it floats and accumulates at the top of the magmachamber. (c) Lumps of plagioclase-rich mush form and rise asdiapirs through the lower crust. (d) Several diapirs coalesce atmid-crustal depth to make up anorthosite massifs. Stippled area:heat from the magma chamber causes partial melting of the crust.
idence in favour of the standard petrogenetic modelwhich can be applied to the EGOG massif. In thismodel, as synthesized by Ashwal (1993) (Fig. 3),a broadly basaltic magma pounded and differenti-ated in a large pancake-shaped chamber at or nearthe base of the crust, around 1.2 GPa, from whichaggregates of plagioclase megacrysts with rare inter-
stitial HAOM crystallized, floated and accumulatedat the roof of the chamber. Due to density inver-sion with the surrounding (partially melted) countryrocks, masses of plagioclase with some entrainedHAOM formed by gravity instability ascend throughthe crust as diapirs in anorogenic conditions. Co-alescence of several diapirs at mid-crustal depths(around 0.5 GPa in Rogaland; Vander Auwera andLonghi, 1994) gives rise to anorthosite massifs. Dur-ing ascent, the plagioclase crystal mush is lubri-cated by noritic melts from which low Al and Crorthopyroxene crystallize at the final stage of intru-sion.
More specific features are typically illustrated inthe EGOG case (Duchesne et al., 1985; Duchesneand Maquil, 1987) and provide important param-eters to constrain the diapiric emplacement model(see below). Aggregates of megacrysts were stuckalong the margins of the diapir, and because ofits highly crystalline nature, the mush moved as arheological solid, causing internal stresses and pro-ducing granulation=recrystallization of plagioclaseeverywhere in the massif, and particularly in themargin where HAOM were also involved in theformation of the foliation. Upward rise of the di-apir was greatly enhanced by partial melting of thesurrounding migmatitic gneisses. Lateral expansionof the diapir took place when it reached a levelof emplacement probably controlled by a strengthincrease in the upper crust, to give the massif itsfinal pancake shape. This expansion could be partlyresponsible for ductile deformation of the marginand country rocks. Because it has remained in pris-tine state, EGOG thus constitutes an excellent caseto address the structural record of diapirism andfinal lateral expansion. Occurrence of relicts of high-pressure minerals such as HAOM documents thedeep-seated episode of crystallization, and thereforeattests the vertical movement of the crystal mush.Granulation=recrystallization of plagioclase is goodevidence of the movement of a rheologically solidcrystal mush. The high-temperature interval of crys-tallization (1100º–1275ºC) constrained by experi-ments (Longhi et al., 1993) allows a large degreeof contact anatexis of surrounding rocks and makesthe ascent easier (Marsh, 1982). Though large dis-continuities in the crust (Scoates and Chamberlain,1997) might channel and facilitate the emplacement

J.D. Barnichon et al. / Tectonophysics 303 (1999) 109–130 115
of some anorthosite massifs, no evidence of suchstructure is found in Rogaland, but part of the com-plex extends under the sea (Fig. 1A).
3. Strain data
Although some limited deformation is observedin the centre of EGOG, the higher strain intensitiesare located in the inner margin. The later displaysseveral deformational features commonly found inplutons, such as foliation, deformed crysts, shearzones and folds. A strong strain gradient is observedfrom the massif boundary towards the centre. Asmentioned above, the petrology and the observedstructures support deformation in the solid state atthe pluton boundary.
Strain analyses have been performed on outcropsat 51 sites, mainly within the foliated inner margin.HAOM and plagioclase megacrysts have been usedas strain markers to determine the shape and ori-entation of the finite strain ellipsoid. At each site,sections across the deformed crystals were studiedon one to four different outcropping surfaces, de-pending on the local topography. On one specificoutcropping surface, the cryst sections present asub-elliptical shape whose great axis has usually aconstant orientation (Fig. 2d). For each surface amean ellipticity has been computed from the shapemeasurements of up to 30 crystal sections. More than1500 ellipses were measured in this study. At eachsite, a finite strain ellipsoid was then calculated fromthe orientation and ellipticity of ellipses observed ondifferent surfaces. We used the program developedby Ratschbacher et al. (1994) from the method pro-posed by Milton (1980) to fit a strain ellipsoid tothree different elliptical sections. Due to the lack ofmultiple surface exposures at many sites, only eightellipsoids were constructed with Milton’s method.Taking into account the foliation orientation, we alsocomputed fourteen ellipsoids from ellipses in twodifferent planes. Finally, strain ellipses were deter-mined at 29 sites on planes perpendicular to thefoliation, using singular mean-ellipses on arbitrarilyoriented planes. The reliability of the results pro-vided by the last two methods was checked on theeight sites with three or more elliptical sections. TheX Z sections of the ellipsoids are generally well ap-
proximated by the last two methods and the wholeset of results may be considered as coherent.
The method used in this study relies on twosevere assumptions. Firstly, it is assumed that or-thopyroxene deforms isotropically, which might notbe the case because of their strong [100] parting.If the cryst is properly oriented, this parting canact as slip planes allowing extensive deformation.It is indeed not uncommon to find on the sameoutcrop a HAOM cryst showing a much larger el-lipticity than the average of the other crysts. Suchcrysts have been discarded in the averages. Secondly,the initial shapes of the crysts used as markers arecertainly not spheres (Fig. 2c), and there are clearlimitations in estimating absolute finite strain ellip-soids from shape ratios of HAOM and plagioclasecrysts. During ascent in the magma mush and theiremplacement, these crysts have been affected by asolid-state deformation, as shown by the plagioclaseand HAOM granulation observed in the bulk of thepluton. A limited deformation study in the centre ofthe massif has shown a faint sub-horizontal foliation.Inside this plane, the shape ratio Rxy measured oncrysts is less than 2, while Rxz can reach a maximumof 3. With these values in mind, the analysis of or-thopyroxene and plagioclase markers presented hereis based on the spatial variation of their shape ratherthan on their absolute strain. Indeed, in spite of thelimitations mentioned before, cryst shape analysishas provided useful insights on strain patterns andvariations within the massif.
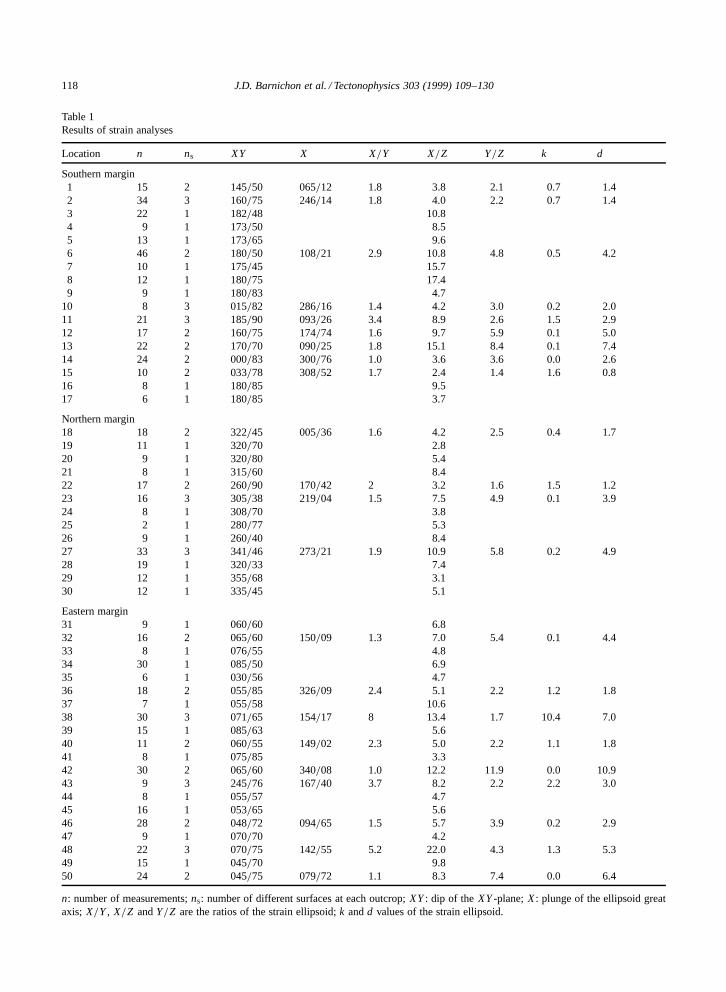
Results of the strain analysis are presented inTable 1. The type and intensity of the strain are ex-pressed by the k- and d-values of the strain ellipsoid(Ramsay and Huber, 1983) following:
k D�Rxy � 1
�Ryz � 1
Ð (1)
d Dq�
Rxy � 1Ð2 C �Ryz � 1
Ð2(2)
where Rxy and Ryz are the ratios of the finite strainellipsoid axes.
Fig. 4 maps horizontal ellipse sections (X Z orY Z ) and the strain rate distribution (Rxz -values) inthe marginal zones. In general, strong strain is con-fined to the border and decreases towards the centralpart of the massif. The highest strains (Rxz > 11 and

116 J.D. Barnichon et al. / Tectonophysics 303 (1999) 109–130

J.D. Barnichon et al. / Tectonophysics 303 (1999) 109–130 117
d > 5) are found in the south and east, close to theadjacent magmatic intrusions (HH and BKSK). Inthe north and south, the cryst stretching (X-axis) isgenerally sub-horizontal and parallel to the margin(Fig. 4a), and strain ellipsoids predominantly showoblate shape with k-values ranging between 0.0 and0.7. The d-values are intermediate to high (mainlybetween 1 and 5). Two ellipsoids show slight con-striction (k D 1:5 and 1.6). In the south, the maximalstrain is located immediately near the contact anddecreases towards the centre, whereas in the northand east, strain is generally more important at somedistance from the contact (š1 km, inside the easternmargin) (Fig. 4b). Along the border with the BKSKintrusion in the east, the strain intensity is high(1:8 < d < 11 and 5 < Rxz < 13) and X plungedata show a horizontal elongation in the northernpart, passing to a subvertical stretching in the south-ern part. In conclusion, the structural features andthe strain pattern observed in the EGOG pluton areconsistent with the petrological anorthosite modelbased on diapirism and late lateral expansion witha solid-state deformation. This model will now betested by finite-element modelling.
4. Finite-element modelling of the EGOGemplacement
4.1. Overview of previous modelling studies
Diapirism has first been studied experimentallyconsidering real fluid materials (Nettleton, 1934,1943; Koyi, 1991). These studies highlighted the re-lation between diapir shape and viscosity ratio. Laterexperiments using clay and silicone models submit-ted to an increased gravity field (using centrifugeapparatus) have been performed by Ramberg (1967,1981) and other authors (e.g. Talbot et al., 1991).In their experiments, the analysis was based on thestudy of the displacement field at the final stage,
Fig. 4. (a) Map of subhorizontal X Z - or Y Z -sections. Filled ellipses are true X Z -sections, computed from the analysis of two or moreoutcrop surfaces. The ellipses marked with an asterisk have been obtained from at least three different surfaces. Empty ellipses arecomputed with a singular mean elliptic section on a horizontal surface. Equal-area, lower-hemisphere projections of X -axis orientationsare plotted for the four indicated zones. (b) Map of strain ratio distribution along the EGOG margin .Rxz-values). Investigated areas aredarkened according to the strain intensity. Abbreviations: MG D migmatitic gneisses; others as in Fig. 1.
using destructive methods (usually a set of cross-sec-tions). These experiments revealed the three-dimen-sional geometry of the diapiric phenomenon, whichis comparable to a cellular pattern (Talbot et al.,1991). Numerous two-dimensional numerical sim-ulations of diapirism have been performed in paststudies, based on fluid mechanic description in whichthe fluids are considered as incompressible mate-rials (Woidt, 1978; Schmeling, 1987; Zaleski andJulien, 1992). These models have led to conclusionssimilar to those of experiments about the viscosityratio influence on the finite diapir shape. More re-cently, simulations based on solid mechanic descrip-tion have been performed (see e.g. Poliakov et al.,1993). Most of these studies assume a plane straincondition. Recently, a complex modelling of saltdiapirism including erosion and sedimentation pro-cesses has been presented by Poliakov et al. (1996)and has demonstrated the mechanical relevance ofsyn-sedimentary diapirism for salt rocks.
4.2. Specificities of the method used in this study
The test of the diapirism model is based on apurely mechanical analysis carried out with theLAGAMINE finite-element (FE) code (Charlier,1987; Barnichon, 1998). This code uses an implicitresolution method (based on Newton–Raphson iter-ations) of the equilibrium equations, which ensuresthe correctness of the computed (approximated) so-lution. Large strains, displacements and rotations areaccounted for through an updated Lagrangian for-mulation of the kinematic and through the use ofthe Jaumann objective stress rate. A more generaldescription of the non-linear finite-element methodcan be found in Zienkiewicz and Taylor (1989).
The present FE code is coupled with an automaticadaptive re-meshing algorithm (Barnichon, 1998), inorder to avoid large distortion of the mesh resultingfrom very important material flow. This re-meshingprocedure is automatically activated when a given
118 J.D. Barnichon et al. / Tectonophysics 303 (1999) 109–130
Table 1Results of strain analyses
Location n ns XY X X=Y X=Z Y=Z k d
Southern margin1 15 2 145=50 065=12 1.8 3.8 2.1 0.7 1.42 34 3 160=75 246=14 1.8 4.0 2.2 0.7 1.43 22 1 182=48 10.84 9 1 173=50 8.55 13 1 173=65 9.66 46 2 180=50 108=21 2.9 10.8 4.8 0.5 4.27 10 1 175=45 15.78 12 1 180=75 17.49 9 1 180=83 4.7
10 8 3 015=82 286=16 1.4 4.2 3.0 0.2 2.011 21 3 185=90 093=26 3.4 8.9 2.6 1.5 2.912 17 2 160=75 174=74 1.6 9.7 5.9 0.1 5.013 22 2 170=70 090=25 1.8 15.1 8.4 0.1 7.414 24 2 000=83 300=76 1.0 3.6 3.6 0.0 2.615 10 2 033=78 308=52 1.7 2.4 1.4 1.6 0.816 8 1 180=85 9.517 6 1 180=85 3.7
Northern margin18 18 2 322=45 005=36 1.6 4.2 2.5 0.4 1.719 11 1 320=70 2.820 9 1 320=80 5.421 8 1 315=60 8.422 17 2 260=90 170=42 2 3.2 1.6 1.5 1.223 16 3 305=38 219=04 1.5 7.5 4.9 0.1 3.924 8 1 308=70 3.825 2 1 280=77 5.326 9 1 260=40 8.427 33 3 341=46 273=21 1.9 10.9 5.8 0.2 4.928 19 1 320=33 7.429 12 1 355=68 3.130 12 1 335=45 5.1
Eastern margin31 9 1 060=60 6.832 16 2 065=60 150=09 1.3 7.0 5.4 0.1 4.433 8 1 076=55 4.834 30 1 085=50 6.935 6 1 030=56 4.736 18 2 055=85 326=09 2.4 5.1 2.2 1.2 1.837 7 1 055=58 10.638 30 3 071=65 154=17 8 13.4 1.7 10.4 7.039 15 1 085=63 5.640 11 2 060=55 149=02 2.3 5.0 2.2 1.1 1.841 8 1 075=85 3.342 30 2 065=60 340=08 1.0 12.2 11.9 0.0 10.943 9 3 245=76 167=40 3.7 8.2 2.2 2.2 3.044 8 1 055=57 4.745 16 1 053=65 5.646 28 2 048=72 094=65 1.5 5.7 3.9 0.2 2.947 9 1 070=70 4.248 22 3 070=75 142=55 5.2 22.0 4.3 1.3 5.349 15 1 045=70 9.850 24 2 045=75 079=72 1.1 8.3 7.4 0.0 6.4
n: number of measurements; ns: number of different surfaces at each outcrop; XY : dip of the XY -plane; X : plunge of the ellipsoid greataxis; X=Y , X=Z and Y=Z are the ratios of the strain ellipsoid; k and d values of the strain ellipsoid.

J.D. Barnichon et al. / Tectonophysics 303 (1999) 109–130 119
ratio of overdistorted elements is reached, follow-ing Habraken (1989). The high level of automationof this procedure easily allows the user to performcomputations with very large strains=displacements.The re-meshing algorithm has been designed to dealwith complex multidomain geometries and is there-fore not restricted to the type of geometries consid-ered here. In addition, artificial passive markers havebeen introduced to follow the distortion through there-meshing phases (Barnichon, 1998).
In the present study, both fluid-like and solid-likebehaviours have been considered depending on thedepth. The upper crust behaves as a solid, whereasthe deeper part of the crust — i.e. the lower graniticcrust and the noritic crust — exhibits a viscousbehaviour closer to a fluid. In this framework, anadvantage of a solid mechanic over a fluid mechanicformulation lies in the ability of the first one to repre-sent both behaviours, provided the materials exhibitsome compressibility. Therefore, viscous solid andelastoplastic behaviours have been used together, asdetailed in the next section.
4.3. Model
As already mentioned in Section 2, the study ofEGOG provides good constraints on the geometryand timing of emplacement.
4.3.1. ConstraintsThe depth of the initial magma chamber is con-
strained by the stability of HAOM at about 1.2 GPa,while the final emplacement pressure of Rogalandanorthosites is likely to be close to 0.5 Gpa. Thepetrological model exposed above assumes that thediapir moved upward across the whole lower crust(noritic composition) and that emplacement stoppedat the limit between the upper crust (granitic com-position) and the lower crust. The density of theupper crust is considered equal to the granite one,i.e. d ³ 2:7, and the density of the lower crustfalls in the range 3:0 < d < 3:2 (Hall, 1986). Itfollows from these pressure estimates and densityvalues that the lower crust extends approximatelyfrom 40 km to 18 km depth, and that the uppercrust has a thickness of 18 km. Although the den-sity of the plagioclase megacrysts (An50) at 1200ºCfalls in the range 2:63 < d < 2:65 (Campbell et al.,
1978), a conservative density value of d D 2:75 hasbeen adopted here for the anorthosite crystal mush,considering that some liquid (corresponding to 18to 32% in volume) of higher density (lower crust)may have been entrapped in the mush. The initialanorthosite cumulate at the roof of the deep-seatedchamber is represented by an infinite horizontal layerwith a thickness of 2 km to 5 km and located at 40km depth. Based on these assumptions, a lithologicalprofile (Fig. 5a) has been adopted. A value of 2 m.y.has been chosen for the timing of emplacement.
4.3.2. Constitutive laws for the continental crustThe rheology of the layered structure presented
in Fig. 5a has now to be evaluated. As proposed byDavy and Cobbold (1991), two main flow mecha-nisms have been considered for the crust.
The first one is a time-independent brittle be-haviour (Byerlee, 1978), which is usually consideredto follow Mohr–Coulomb’s plastic criterion:
¦1 � ¦3
2D c C ¦1 C ¦3
2tan� (3)
where c is the cohesion and � the friction angle. Herethe values � D 37º and c D 0 have been adopted.In numerical applications, this behaviour will beapproximated by an elastoplastic law based on aDrucker Prager yield criterion f , modified followingVan Eekelen (1980):
f D I I O¦ C m
�I¦ � 3c
tan�
�D 0 (4)
where O¦ , I¦ and I I O¦ represent the stress deviator, thefirst stress invariant and the second deviatoric stressinvariant, respectively. They are defined by (wherethe convention summation applies to all repeatedindices, and Ži j is the Kronecker delta):
O¦i j D ¦i j � I¦3Ži j ;
Ži j D8<:1 if i D j
0 if i 6D j
I¦ D ¦kk
I I O¦ Dr
1
2O¦i j O¦i j
(5)
In Eq. 4), coefficient m depends on the thirddeviatoric stress invariant in order to closely match

120 J.D. Barnichon et al. / Tectonophysics 303 (1999) 109–130
Fig. 5. Different steps in the computation of a rheological profile for the crust: (a) choice of a lithological profile; (b) choice of ageothermal profile (from Chapman, 1986); (c) computation of a non-linear rheological profile for P" D 10�13 s�1 and linearization of theviscous parts following Davy and Cobbold (1991).
the Mohr–Coulomb criterion given in Eq. 3 (seeBarnichon and Charlier, 1996, and Barnichon, 1998,for the detailed formulation of m). A non-associatedand perfectly plastic law is assumed.
The second mechanism is a time-dependent vis-cous behaviour obeying a power law:
PO" D A exp
�� Q
RT
�O¦ n (6)
which links the deviatoric stress tensor O¦ to thedeviatoric strain rate tensor PO" (Carter and Tsenn,1987). In this relation, Q is the activation energyof creep, R the gas constant, T the absolute tem-perature, A and n material constants. Such non-lin-ear behaviour is obviously temperature-dependent.Values for these parameters for a broad range ofminerals and rocks have been reported in Carter andTsenn (1987) (Table 2). As a first approximation, alinear Newtonian behaviour is considered here, i.e.
Table 2Parameters of the power law (from Carter and Tsenn, 1987)
Rock or mineral type n Q A(kJ mole�1) (MPa�n s�1)
Westerly granite (dry) 3.3 186.5 �5.7Maryland diabase (dry) 3.05 276 �1.2Hale albite (dry) 3.9 234.2 �5.63
exponent n D 1 in Eq. 6, which then simplifies to:
PO" D O¦�
(7)
provided the dynamic viscosity � is defined by:
1
�D A exp
�� Q
RT
�(8)
The Newtonian behaviour will be approximatedby an elastic-viscoplastic law for which the elasticdomain is bounded by a Von Mises surface. In thismodel, the viscoplastic deviatoric strain rate PO"vp
isgiven by
PO"vp D B
KO¦ (9)
where coefficient B=K is equivalent to the inverseof viscosity and K is the yield limit (equivalent tocohesion).
For both elastoplastic and elastic-viscoplasticlaws, the volumic part of the behaviour followsHooke’s law:
P¦m D � P"m (10)
where the elastic compressibility modulus � can beexpressed as a function of Young modulus E andPoisson ratio ¹ following:
� D E
3.1� 2¹/(11)
J.D. Barnichon et al. / Tectonophysics 303 (1999) 109–130 121
From the two flow behaviours presented above(Mohr–Coulomb and power law), correspondingrheological profiles can be computed provided ad-ditional assumptions are made: a steady state ther-mal field is considered (Fig. 5b) following Chapman(1986), and an homogeneous strain rate is assumedthroughout the considered domain. In the presentcase, the strain value is approximated by assum-ing that the initially 2-km-thick anorthosite layerwill flow upward through the lower crust (22 kmthickness), which gives an approximate strain value" D 22=2 D 11. Assuming that the emplacementtook place in about 2 m.y. leads to the strain rate P":P" D 11
2�3:15ð 1012
Ð ³ 1:7ð 10�13 s�1 (12)
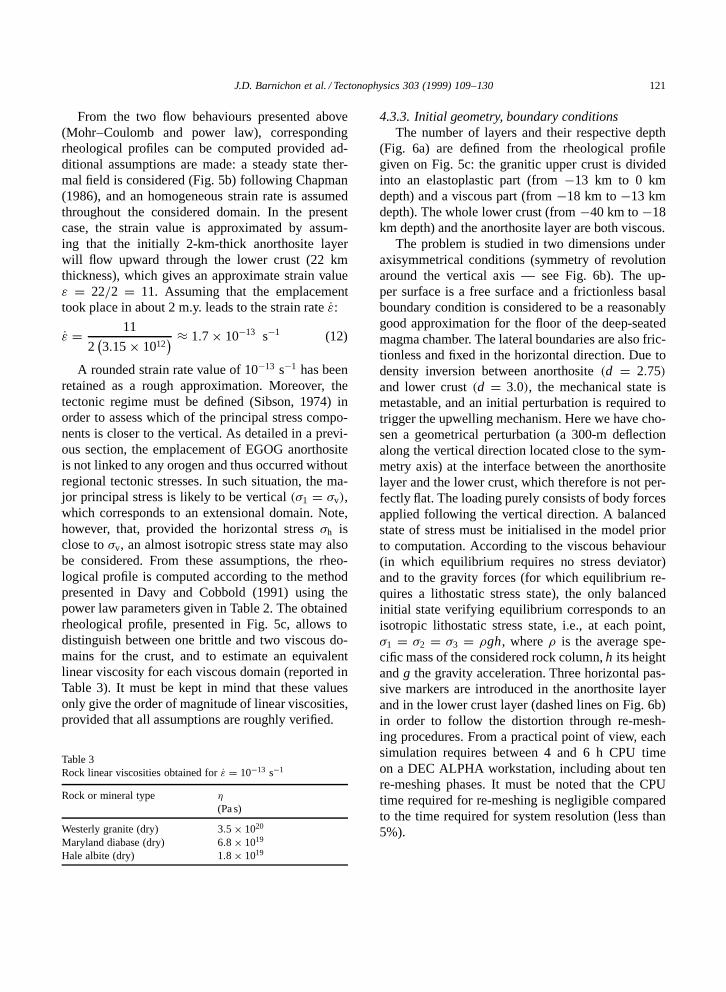
A rounded strain rate value of 10�13 s�1 has beenretained as a rough approximation. Moreover, thetectonic regime must be defined (Sibson, 1974) inorder to assess which of the principal stress compo-nents is closer to the vertical. As detailed in a previ-ous section, the emplacement of EGOG anorthositeis not linked to any orogen and thus occurred withoutregional tectonic stresses. In such situation, the ma-jor principal stress is likely to be vertical .¦1 D ¦v/,which corresponds to an extensional domain. Note,however, that, provided the horizontal stress ¦h isclose to ¦v, an almost isotropic stress state may alsobe considered. From these assumptions, the rheo-logical profile is computed according to the methodpresented in Davy and Cobbold (1991) using thepower law parameters given in Table 2. The obtainedrheological profile, presented in Fig. 5c, allows todistinguish between one brittle and two viscous do-mains for the crust, and to estimate an equivalentlinear viscosity for each viscous domain (reported inTable 3). It must be kept in mind that these valuesonly give the order of magnitude of linear viscosities,provided that all assumptions are roughly verified.
Table 3Rock linear viscosities obtained for P" D 10�13 s�1
Rock or mineral type �
(Pa s)
Westerly granite (dry) 3:5ð 1020
Maryland diabase (dry) 6:8ð 1019
Hale albite (dry) 1:8ð 1019
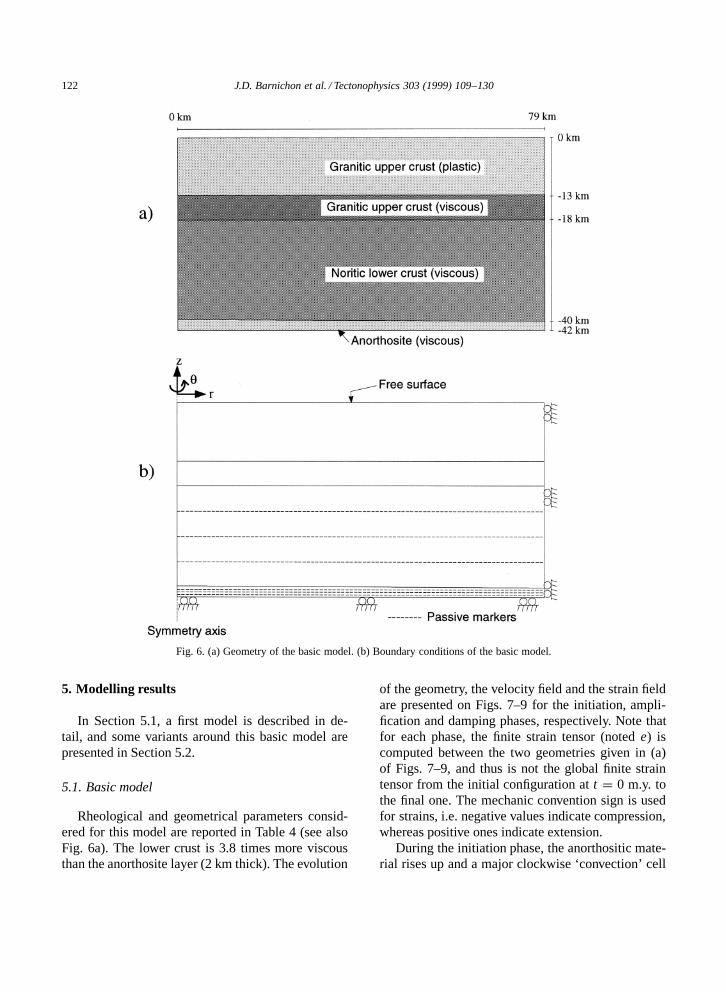
4.3.3. Initial geometry, boundary conditionsThe number of layers and their respective depth
(Fig. 6a) are defined from the rheological profilegiven on Fig. 5c: the granitic upper crust is dividedinto an elastoplastic part (from �13 km to 0 kmdepth) and a viscous part (from �18 km to �13 kmdepth). The whole lower crust (from �40 km to �18km depth) and the anorthosite layer are both viscous.
The problem is studied in two dimensions underaxisymmetrical conditions (symmetry of revolutionaround the vertical axis — see Fig. 6b). The up-per surface is a free surface and a frictionless basalboundary condition is considered to be a reasonablygood approximation for the floor of the deep-seatedmagma chamber. The lateral boundaries are also fric-tionless and fixed in the horizontal direction. Due todensity inversion between anorthosite .d D 2:75/and lower crust .d D 3:0/, the mechanical state ismetastable, and an initial perturbation is required totrigger the upwelling mechanism. Here we have cho-sen a geometrical perturbation (a 300-m deflectionalong the vertical direction located close to the sym-metry axis) at the interface between the anorthositelayer and the lower crust, which therefore is not per-fectly flat. The loading purely consists of body forcesapplied following the vertical direction. A balancedstate of stress must be initialised in the model priorto computation. According to the viscous behaviour(in which equilibrium requires no stress deviator)and to the gravity forces (for which equilibrium re-quires a lithostatic stress state), the only balancedinitial state verifying equilibrium corresponds to anisotropic lithostatic stress state, i.e., at each point,¦1 D ¦2 D ¦3 D ²gh, where ² is the average spe-cific mass of the considered rock column, h its heightand g the gravity acceleration. Three horizontal pas-sive markers are introduced in the anorthosite layerand in the lower crust layer (dashed lines on Fig. 6b)in order to follow the distortion through re-mesh-ing procedures. From a practical point of view, eachsimulation requires between 4 and 6 h CPU timeon a DEC ALPHA workstation, including about tenre-meshing phases. It must be noted that the CPUtime required for re-meshing is negligible comparedto the time required for system resolution (less than5%).
122 J.D. Barnichon et al. / Tectonophysics 303 (1999) 109–130
Fig. 6. (a) Geometry of the basic model. (b) Boundary conditions of the basic model.
5. Modelling results
In Section 5.1, a first model is described in de-tail, and some variants around this basic model arepresented in Section 5.2.
5.1. Basic model
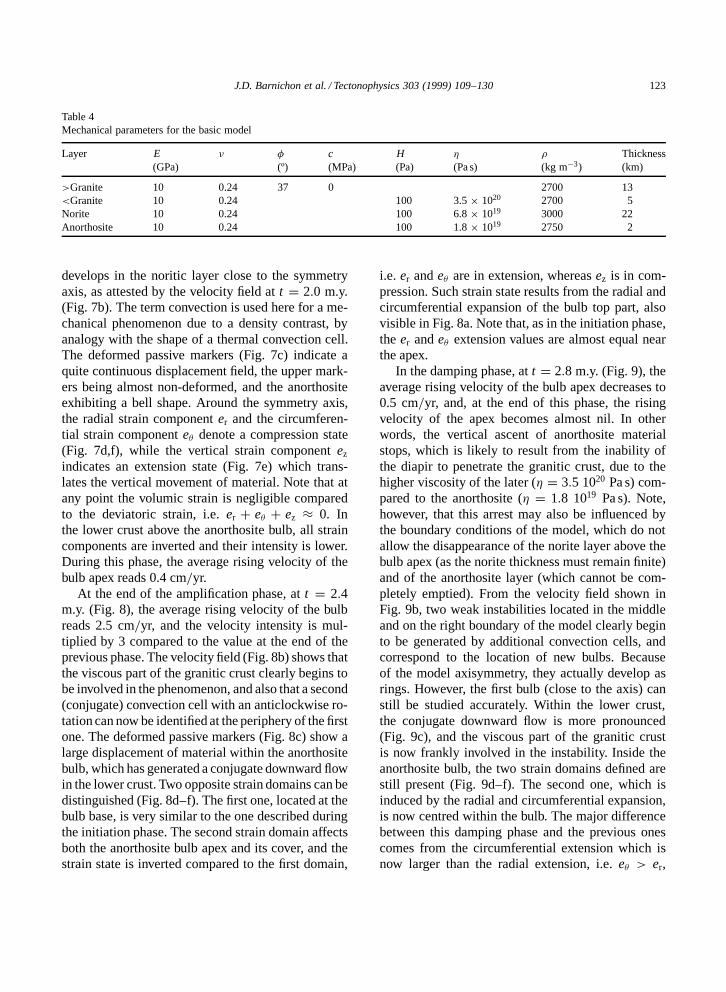
Rheological and geometrical parameters consid-ered for this model are reported in Table 4 (see alsoFig. 6a). The lower crust is 3.8 times more viscousthan the anorthosite layer (2 km thick). The evolution
of the geometry, the velocity field and the strain fieldare presented on Figs. 7–9 for the initiation, ampli-fication and damping phases, respectively. Note thatfor each phase, the finite strain tensor (noted e) iscomputed between the two geometries given in (a)of Figs. 7–9, and thus is not the global finite straintensor from the initial configuration at t D 0 m.y. tothe final one. The mechanic convention sign is usedfor strains, i.e. negative values indicate compression,whereas positive ones indicate extension.
During the initiation phase, the anorthositic mate-rial rises up and a major clockwise ‘convection’ cell
J.D. Barnichon et al. / Tectonophysics 303 (1999) 109–130 123
Table 4Mechanical parameters for the basic model
Layer E ¹ � c H � ² Thickness(GPa) (º) (MPa) (Pa) (Pa s) (kg m�3) (km)
>Granite 10 0.24 37 0 2700 13<Granite 10 0.24 100 3.5 ð 1020 2700 5Norite 10 0.24 100 6.8 ð 1019 3000 22Anorthosite 10 0.24 100 1.8 ð 1019 2750 2
develops in the noritic layer close to the symmetryaxis, as attested by the velocity field at t D 2:0 m.y.(Fig. 7b). The term convection is used here for a me-chanical phenomenon due to a density contrast, byanalogy with the shape of a thermal convection cell.The deformed passive markers (Fig. 7c) indicate aquite continuous displacement field, the upper mark-ers being almost non-deformed, and the anorthositeexhibiting a bell shape. Around the symmetry axis,the radial strain component er and the circumferen-tial strain component e� denote a compression state(Fig. 7d,f), while the vertical strain component ez
indicates an extension state (Fig. 7e) which trans-lates the vertical movement of material. Note that atany point the volumic strain is negligible comparedto the deviatoric strain, i.e. er C e� C ez ³ 0. Inthe lower crust above the anorthosite bulb, all straincomponents are inverted and their intensity is lower.During this phase, the average rising velocity of thebulb apex reads 0.4 cm=yr.
At the end of the amplification phase, at t D 2:4m.y. (Fig. 8), the average rising velocity of the bulbreads 2.5 cm=yr, and the velocity intensity is mul-tiplied by 3 compared to the value at the end of theprevious phase. The velocity field (Fig. 8b) shows thatthe viscous part of the granitic crust clearly begins tobe involved in the phenomenon, and also that a second(conjugate) convection cell with an anticlockwise ro-tation can now be identified at the periphery of the firstone. The deformed passive markers (Fig. 8c) show alarge displacement of material within the anorthositebulb, which has generated a conjugate downward flowin the lower crust. Two opposite strain domains can bedistinguished (Fig. 8d–f). The first one, located at thebulb base, is very similar to the one described duringthe initiation phase. The second strain domain affectsboth the anorthosite bulb apex and its cover, and thestrain state is inverted compared to the first domain,
i.e. er and e� are in extension, whereas ez is in com-pression. Such strain state results from the radial andcircumferential expansion of the bulb top part, alsovisible in Fig. 8a. Note that, as in the initiation phase,the er and e� extension values are almost equal nearthe apex.
In the damping phase, at t D 2:8 m.y. (Fig. 9), theaverage rising velocity of the bulb apex decreases to0.5 cm=yr, and, at the end of this phase, the risingvelocity of the apex becomes almost nil. In otherwords, the vertical ascent of anorthosite materialstops, which is likely to result from the inability ofthe diapir to penetrate the granitic crust, due to thehigher viscosity of the later (� D 3:5 1020 Pa s) com-pared to the anorthosite (� D 1:8 1019 Pa s). Note,however, that this arrest may also be influenced bythe boundary conditions of the model, which do notallow the disappearance of the norite layer above thebulb apex (as the norite thickness must remain finite)and of the anorthosite layer (which cannot be com-pletely emptied). From the velocity field shown inFig. 9b, two weak instabilities located in the middleand on the right boundary of the model clearly beginto be generated by additional convection cells, andcorrespond to the location of new bulbs. Becauseof the model axisymmetry, they actually develop asrings. However, the first bulb (close to the axis) canstill be studied accurately. Within the lower crust,the conjugate downward flow is more pronounced(Fig. 9c), and the viscous part of the granitic crustis now frankly involved in the instability. Inside theanorthosite bulb, the two strain domains defined arestill present (Fig. 9d–f). The second one, which isinduced by the radial and circumferential expansion,is now centred within the bulb. The major differencebetween this damping phase and the previous onescomes from the circumferential extension which isnow larger than the radial extension, i.e. e� > er,

124 J.D. Barnichon et al. / Tectonophysics 303 (1999) 109–130
Fig. 7. Basic model initiation phase: (a) deformed geometry at t D 0 m.y. (full line) and t D 2:0 m.y. (dashed line); (b) velocities att D 2:0 m.y.; (c) passive markers (thick lines) at t D 2:0 m.y.; (d, e, f) radial er, vertical ez and circumferential e� components of thestrain tensor computed for the time range 0 < t < 2:0 m.y. Negative values indicate compression.
whereas in the initiation and amplification phasesthese components were quite similar.
It is worth pointing out that the rigid upper crustis not involved in the instability and remains almost
undeformed. Besides the strength difference betweenthe crust layers, a reason may lie in the absence of aninverse density gradient between the upper crust andthe anorthosite.

J.D. Barnichon et al. / Tectonophysics 303 (1999) 109–130 125
Fig. 8. Basic model amplification phase: (a) deformed geometry at t D 2:2 m.y. (full line) and t D 2:4 m.y. (dashed line); (b) velocitiesat t D 2:4 m.y.; (c) passive markers (thick lines) at t D 2:4 m.y.; (d, e, f) radial er, vertical ez and circumferential e� components of thestrain tensor computed for the time range 2:2 < t < 2:4 m.y. Negative values indicate compression.
5.2. Variants of the basic model
In all the tested models, an instability sys-tematically develops at the interface between the
lighter anorthosite and the lower crust, which furtherevolves in the rise of an anorthosite bulb throughthe lower crust. Differences in the finite shape ofthe anorthosite intrusion and in the rate of upward

126 J.D. Barnichon et al. / Tectonophysics 303 (1999) 109–130
Fig. 9. Basic model damping phase: (a) deformed geometry at t D 2:7 m.y. (full line) and t D 2:8 m.y. (dashed line); (b) velocities att D 2:8 m.y.; (c) passive markers (thick lines) at t D 2:8 m.y.; (d, e, f) radial er, vertical ez and circumferential e� components of thestrain tensor computed for the time range 2:7 < t < 2:8 m.y. Negative values indicate compression.
flow are observed between the models, and generallyagree with results obtained by Woidt (1978). Devel-opment of Rayleigh–Taylor instabilities for a widerange of parameter values (viscosity, geometry) is
strong evidence of the robustness of modelling re-sults and of their physical meaning. Three of the per-formed models are briefly presented in the following,highlighting differences with the basic model and in-

J.D. Barnichon et al. / Tectonophysics 303 (1999) 109–130 127
vestigating the influence of anorthosite thickness ha
and viscosity �a.In Model 2, the anorthosite viscosity �a has been
divided by 10. Model 3 is similar to the basic model,except that the anorthosite thickness ha has beenchosen equal to 5 km. Finally, in Model 4, boththe anorthosite thickness and viscosity have beenchanged. The modified parameter values are givenin Table 5, while the geometry evolution and the de-formed markers are presented in Fig. 10 for the threedifferent models. When the anorthosite viscosity �a
Fig. 10. Influence of anorthosite viscosity and thickness: (a) geometry evolution for Model 2; (b) deformed geometry and markers (thicklines) at t D 1:4 m.y. for Model 2; (c) geometry evolution for Model 3; (d) deformed geometry and markers (thick lines) at t D 1:7 m.y.for Model 3; (e) geometry evolution for Model 4; (f) deformed geometry and markers (thick lines) at t D 0:9 m.y. for Model 4.
is close to the lower crust viscosity �n (basic modeland Model 3), the bulb geometry evolves towards amushroom shape which is wider (radius over 20 km),more pronounced with a 5-km-thick anorthosite layer(Model 3, Fig. 10c). On the contrary, if the anorthositeviscosity is much smaller than the lower crust one(Models 2 and 4 for which the ratio �n=�a D 38), thebulb shape evolves towards a geometry with a thickertrunk. Again, the presence of a thicker anorthositelayer allows to increase the massif radius to about24 km against 11 km in Model 3. These results are

128 J.D. Barnichon et al. / Tectonophysics 303 (1999) 109–130
Table 5Values of parameters for the variants of the basic model
Diapir model ha �a
(km) (Pa s)
1 2 1:8ð 1019
2 2 1:8ð 1018
3 5 1:8ð 1019
4 5 1:8ð 1018
consistent with previous diapir computations (see e.g.Woidt, 1978), which showed that the final geometryis strongly dependent on the source layer thickness.Note also that, when the anorthosite layer is thicker(Models 3 and 4), the rings are well developed and theinstability wavelength increases. On the other hand,when the anorthosite is less viscous (Models 2 and 4),the emplacement duration is shorter and the conjugatedownward flow within the lower crust is less devel-oped than in the other cases (basic model and Model3). Dividing the viscosity by ten approximately di-minishes the emplacement time by a factor two.
In conclusion, for the range of parameter val-ues used in the simulation, the emplacement timestrongly depends on the anorthosite viscosity, whilethe final diameter of the intrusion appears to bemainly controlled by the source layer thickness. Forthe tested models, the anorthosite body intrudes in atime interval varying between 0.9 and 2.8 m.y., andreaches a final diameter between 24 km and 48 km.These values are in the range of observations for theEGOG massif. Note also that, when the anorthositelayer is thicker (Models 3 and 4), the rings are welldeveloped and the instability wavelength increases.
6. Discussion
The EGOG pristine petrological characters con-strain major parameters of its emplacement mecha-nism in the framework of the classical petrologicalmodel of diapirism: the depths of the deep-seatedmagma chamber and of the final level of intrusion(about 40 km and 18 km, respectively), the mushynature, temperature and density of the anorthositematerial, the timing of the intrusion (about 2 m.y.),and the anorogenic geodynamic setting. On the otherhand, deformed orthopyroxene megacrysts can be
used as markers to reconstruct strain ellipsoids andto characterise the strain pattern in the foliated innermargin. The dominant structural features in the mar-gin of EGOG are a sub-horizontal crystal stretchingdirection parallel to the margin and a decrease of thestrain intensity towards the centre of the massif.
FE modelling has been performed with input pa-rameters deriving from petrological constraints inorder to test the petrological model in Rogaland. Asimple rheological behaviour has been chosen forthe anorthosite and the noritic crust, which are char-acterised by specific viscosity values. A limitationof our computation is thus that the influence ofthe temperature on the rheology has not been takeninto account during the deformation (steady stateassumption).
Simulation results show that buoyant rise ofanorthositic material actually takes place in quiteacceptable timings for a wide range of parametervalues. This model can thus be considered as robustand does not require an accurate definition of thestate of the material (liquid, solid, crystal mush, pla-gioclase suspension, etc.) provided a viscosity valueis assessed. The displacement of material takes theshape of an anorthosite bulb, which rises through theviscous lower crust until it reaches the limit with themore rigid upper crust. Uprise is usually followedby horizontal expansion which gives a mushroomshape. We suggest to call diapirism the whole pro-cess (uprise and expansion), because there is noreason to distinguish two different mechanisms: thephenomenon is continuous and basically the samephysical properties control the whole evolution.
FE modelling indicates that anorthosite diapirismis correlated with a downward flow of lower crustalmaterial along the flanks of the structure. In Ro-galand, this process could explain the synclinal de-formation of the neighbouring BKSK massif, whichwould adequately be described as a rim syncline.
A good agreement is found between structuraldata obtained in the margin of the EGOG body andthe calculated strain distribution. Observed horizon-tal lineations in the inner margin correspond to apredominant extension of the circumferential com-ponent of the strain tensor occurring during the laststage of deformation. Local occurrence of verticallineations in the inner margin of EGOG can also beaccounted for by the vertical extension computed in
J.D. Barnichon et al. / Tectonophysics 303 (1999) 109–130 129
the lower part of the bulb, but their coexistence nextto horizontal lineations is intriguing. More data areneeded to decide whether they are relicts transportedfrom the lower part, or whether they result fromsubsidence of the neighbouring BKSK massif.
Finally, numerical modelling of the EGOG mas-sif demonstrates that the diapirism suggested in thepetrological model is an acceptable mechanism forthe emplacement of anorthosite through an homo-geneous lower crust in an anorogenic setting. Ithowever does not imply that diapirism is the onlypossible mechanism, nor that it requires such con-straining conditions. If buoyancy can explain thephenomenon in a homogeneous crust, a fortiori anyweakness zone would favour and channel the upris-ing through the crust.
Acknowledgements
The authors have benefited from the constructivecomments of four anonymous reviewers and of R.Heilbronner. This work is a contribution to the In-ternational Geological Correlation Program, Project290. Financial support to J.C. Duchesne and B. Hof-fer was provided by the Belgian Fund for BasicJoint Research and to H. Havenith by the FourmarierFoundation.
References
Ashwal, L., 1993. Anorthosites. Springer, Berlin, 422 pp.Barnichon, J.D., 1998. Finite Element Modelling in Structural
and Petroleum Geology. Doctoral thesis, Universite de Liege.Barnichon, J.D., Charlier, R., 1996. Finite element modelling
of the competition between shear bands in the early stagesof thrusting: strain localisation analysis and constitutive lawinfluence. In: Buchanan, P.G., Nieuwland, D.A. (Eds.), Mod-ern Developments in Structural Interpretation, Validation andModelling. Geol. Soc. London Spec. Publ. 99, 235–250.
Brun, J.P., Gapais, D., Le Theoff, B., 1981. The mantled gneissdomes of Kuopo (Finland): interfering diapirs. Tectonophysics74, 283–304.
Byerlee, J.D., 1978. Friction of rocks. Pure Appl. Geophys. 116,615–626.
Campbell, I.H., Roeder, P.L., Dixon, J.M., 1978. Plagioclasebuoyancy in basaltic liquids as determined with a centrifugefurnace. Contrib. Mineral. Petrol. 67, 369–377.
Carter, N.L., Tsenn, M.C., 1987. Flow properties of continentallithosphere. Tectonophysics 136, 27–63.
Chapman, D.S., 1986. Thermal gradients in the continental crust.In: Dawson, J.B., Carswell, D.A., Hall, J., Wedepohl, K.H.(Eds.), The Nature of the Lower Continental Crust. Geol. Soc.London Spec. Publ. 24, 63–70.
Charlier, R., 1987. Approche unifiee de quelques problemes nonlineaires de mecanique des milieux continus par la methodedes elements finis. Doctoral thesis, Universite de Liege.
Davy, P., Cobbold, P.R., 1991. Experiments on shortening of a4-layer model of the continental lithosphere. Tectonophysics188, 1–25.
Duchesne, J.C., 1984. Massif anorthosites: another partisan re-view. In: Brown, W.S. (Ed.), Feldspars and Feldspathoids.NATO Adv. Stud. Inst., Reidel, Dordrecht, C137, pp. 411–433.
Duchesne, J.C., 1987a. The Rogaland intrusive massifs: easternpart. In: Maijer, C., Padget, P. (Eds.), The Geology of South-ernmost Norway: An Excursion Guide. Nor. Geol. Unders.,Spec. Publ. 1, 63–66.
Duchesne, J.C., 1987b. The Bjerkreim–Sokndal massif. In: Mai-jer, C., Padget, P. (Eds.), The Geology of Southernmost Nor-way. Nor. Geol. Unders., Spec. Publ. 1, 56–59.
Duchesne, J.C., Maquil, R., 1987. The Egersund–Ogna massif.In: Maijer, C., Padget, P. (Eds.), The Geology of SouthernmostNorway: An Excursion Guide. Nor. Geol. Unders. Spec. Publ.1, 50–56.
Duchesne, J.C., Maquil, R., Demaiffe, D., 1985. The Rogalandanorthosites: facts and speculations. In: Tobi, A.C., Touret,J.L.R. (Eds.), The Deep Proterozoic Crust in the North At-lantic Province. NATO Adv. Stud. Inst., Reidel, Dordrecht,C158, pp. 449–476.
England, R.W., 1990. The identification of granitic diapirs. J.Geol. Soc. London 147, 931–933.
Falkum, T., 1985. Geotectonic evolution of southern Scandi-navia in light of a Late-Proterozoic plate collision. In: Tobi,A.C., Touret, J.L.R. (Eds.), The Deep Proterozoic Crust in theNorth Atlantic Provinces. NATO Adv. Sci. Inst. Ser., Reidel,Dordrecht, C158, pp. 309–322.
Habraken, A.M., 1989. Contribution a la modelisation du for-mage des metaux par la methode des elements finis. DoctoralThesis, Universite de Liege.
Hall, J., 1986. The physical properties of layered rocks in deepcontinental crust. In: Dawson, J.B., Carswell, D.A., Hall, J.,Wedepohl, K.H. (Eds.), The Nature of the Lower ContinentalCrust. Geol. Soc. London Spec. Publ. 24, 51–62.
Jackson, M.P.A., Seni, S.J., 1983. Evolution of salt structures,East Texas Diapir Province, 2. Patterns and rates of halokine-sis. Am. Assoc. Pet. Geol. Bull. 67 (8), 1245–1274.
Koyi, H., 1991. Mushroom diapirs penetrating overburdens withhigh effective viscosities. Geology 19, 1229–1232.
Longhi, J., Ashwal, L.D., 1985. Two-stage models for lunar andterrestrial anorthosites: petrogenesis without a magma ocean.Proc. Lunar Planet. Sci. Conf. 15th, Part 2, J. Geophys. Res.90 (Suppl.), C571–C584.
Longhi, J., Fram, M.S., Vander Auwera, J., Montieth, J.N., 1993.Pressure effects, kinetics, and rheology of anorthositic andrelated magmas. Am. Mineral. 78, 1016–1030.
Maijer, C., 1987. The metamorphic envelope of the Rogaland in-
130 J.D. Barnichon et al. / Tectonophysics 303 (1999) 109–130
trusive complex. In: Maijer, C., Padget, P. (Eds.), The Geologyof Southernmost Norway. Nor. Geol. Unders., Spec. Publ. 1,68–73.
Maquil, R., Duchesne, J.C., 1984. Geothermometrie par les py-roxenes et mise en place du massif anorthositique d’Egersund–Ogna (Rogaland, Norvege meridionale). Ann. Soc. Geol. Belg.107, 27–49.
Marsh, B.D., 1982. On the mechanics of igneous diapirism,stoping, and zone melting. Am. J. Sci. 282, 808–855.
Martignole, J., 1996. Tectonic setting of anorthositic complexesof the Grenville Province, Canada. In: Demaiffe, D. (Ed.),Petrology and Geochemistry of Magmatic Suites of Rocks inthe Continental and Oceanic Crusts. A volume dedicated toJean Michot, ULB–MRAC, Brussels, pp. 3–18.
Martignole, J., Schrijver, K., 1970. Tectonic significance andevolution of the Morin anorthosite, Grenville Province, Que-bec. Bull. Geol. Soc. Finl. 42, 165–209.
Michot, J., Michot, P., 1969. The problem of anorthosites: theSouth Rogaland igneous complex, southern Norway. In: Isach-sen, Y.W. (Ed.), Origin of Anorthosite and Related Rocks.N.Y. State Mus. Sci. Serv. Mem. 18, 399–410.
Milton, N.J., 1980. Determination of the strain ellipsoid frommeasurement on any three sections. Tectonophysics 64, 19–27.
Nettleton, L.L., 1934. Fluids mechanics of salt domes. Am.Assoc. Pet. Geol. Bull. 18 (9), 1175–1204.
Nettleton, L.L., 1943. Recent experimental and geophysical evi-dence of mechanics of salt-dome formation. Am. Assoc. Pet.Geol. Bull. 27 (1), 51–63.
Paludan, J., Hansen, U.B., Olesen, N.Ø., 1994. Structural evo-lution of the Precambrian Bjerkreim–Sokndal intrusion, SouthNorway. Nor. Geol. Tidsskr. 74, 185–198.
Pasteels, P., Demaiffe, D., Michot, J., 1979. U–Pb and Rb–Sr geochronology of the eastern part of the south Rogalandigneous complex, southern Norway. Lithos 12, 199–208.
Paterson, S.R., Fowler, T.K., 1993. Re-examining pluton em-placement processes. J. Struct. Geol. 15, 191–206.
Paterson, S.R., Vernon, R.H., 1996. Bursting the bubble of bal-looning plutons: a return to nested diapirs emplaced by multi-ple processes. Geol. Soc. Am. Bull. 107, 1356–1380.
Paterson, S.R., Vernon, R.H., Fowler, T.K., 1991. Aureole tec-tonics. In: Kerrick, D.M. (Ed.), Contact Metamorphism. Min-eralogical Society of America, 26, pp. 673–722.
Pitcher, W.S., Berger, A.R., 1972. The Geology of Donegal. AStudy of Granite Emplacement and Unroofing. Wiley, NewYork, 435 pp.
Poliakov, A.N.B., Cundall, P.A., Podladchikov, Y.Y., Lyakhovsky,V.A., 1993. An explicit inertial method for the simulation ofviscoelastic flow: an evaluation of elastic effects on diapiricflow in two and three-layers models. In: Stone, D.B., Runcorn,S.K. (Eds.), Flow and Creep in the Solar System: Observa-tions, Modelling and Theory. Kluwer, Amsterdam, pp. 175–195.
Poliakov, A.N.B., Podladchikov, Y.Y., Dawson, E.CH., Talbot,C.J., 1996. Salt diapirism with simultaneous brittle faultingand viscous. In: Alsop, G.I., Blundell, D.J., Davison, I. (Eds.),
Salt Tectonics. Geol. Soc. London Spec. Publ. 100, 291–302.Ramberg, H., 1967. Gravity, Deformation and the Earth’s Crust
as Studied by Centrifuged Models. Academic Press, NewYork, 214 pp.
Ramberg, H., 1981. Gravity, Deformation and the Earth’s Crust.Academic Press, London, 405 pp.
Ramsay, J.G., Huber, M.I., 1983. The Techniques of ModernStructural Geology, Vol. 1. Strain Analysis. Academic press,London, 307 pp.
Ratschbacher, L., Spemer, B., Meschede, M., Frisch, W., 1994.Computer Teckniken und Anwendungen: Eine Programm-biblothek zur quantitativen Structuranalyse. Institut und Mu-seum fur Geologie und Palaontologie, Tubingen.
Ronnlund, P., 1989. Viscosity estimates from natural Rayleigh–Taylor instabilities. Terra Nova 1, 344–348.
Scharer, U., Wilmart, E., Duchesne, J.C., 1996. The short du-ration and anorogenic character of anorthosite magmatism:U–Pb dating of the Rogaland complex, Norway. Earth Planet.Sci. Lett. 139, 335–350.
Schmeling, H., 1987. On the relation between initials condi-tions and late stages of Rayleigh–Taylor instabilities. Tectono-physics 133, 65–80.
Scoates, J.S., Chamberlain, K.R., 1997. Orogenic to post-oro-genic origin for the 1.76 Ga Horse Creek anorthosite complex,Wyoming, USA. J. Geol. 105, 331–343.
Sibson, R.H., 1974. Frictional constraint on thrust, wrench andnormal faults. Nature 249, 542–544.
Talbot, C.J., Ronnlund, P., Schmeling, H., Jackson, M.P.A., Koyi,H., 1991. Diapiric spoke patterns. Tectonophysics 188, 187–201.
Vander Auwera, J., Longhi, J., 1994. Experimental study of ajotunite (hypersthene monzodiorite): constraints on the parentmagma composition and crystallization conditions (P , T , fO2 )of the Bjerkreim–Sokndal layered intrusion. Contrib. Mineral.Petrol. 118, 60–78.
Van Eekelen, H.A.M., 1980. Isotropic yield surfaces in threedimensions for use in soil mechanics. Int. J. Num. Anal. Meth.Geomech. 4, 98–101.
Vernon, R.H., Paterson, S.R., 1993. The Ardara pluton, Ireland:deflating an expanded intrusion. Lithos 31, 17–32.
Vigneresse, J.L., 1995. Crustal regime of deformation and ascentof granitic magma. Tectonophysics 249, 187–202.
Wiebe, R.A., 1992. Proterozoic anorthosite complexes. In:Condie, K.C. (Ed.), Proterozoic Crustal Evolution. Elsevier,Amsterdam, pp. 215–262.
Wilson, J.R., Robins, B., Nielsen, F., Duchesne, J.C., VanderAuwera, J., 1996. The Bjerkreim–Sokndal layered intrusion,Southwest Norway. In: Cawthorn, R.G. (Ed.), Layering inIgneous Complexes. Elsevier, Amsterdam, pp. 231–256.
Woidt, W.D., 1978. Finite element calculations applied to salt-dome analysis. Tectonophysics 50, 369–386.
Zaleski, S., Julien, P., 1992. Numerical simulation of Rayleigh–Taylor instability for single and multiple salt diapirs. Tectono-physics 206, 55–69.
Zienkiewicz, O.C., Taylor, R.L., 1989. The Finite ElementMethod. McGraw-Hill, London, 4th ed., 648 pp.
Related Documents