AUTHOR QUERY FORM Journal: BRES Please e-mail or fax your responses and any corrections to: E-mail: [email protected] Fax: +1 619 699 6721 Article Number: 41536 Dear Author, Any queries or remarks that have arisen during the processing of your manuscript are listed below and highlighted by flags in the proof. Please check your proof carefully and mark all corrections at the appropriate place in the proof (e.g., by using on- screen annotation in the PDF file) or compile them in a separate list. For correction or revision of any artwork, please consult http://www.elsevier.com/artworkinstructions. Any queries or remarks that have arisen during the processing of your manuscript are listed below and highlighted by flags in the proof. Click on the ‘Q’ link to go to the location in the proof. Location in article Query / Remark: click on the Q link to go Please insert your reply or correction at the corresponding line in the proof Q1 This sentence has been slightly modified for clarity. Please check that the meaning is still correct, and amend if necessary. Q2 Citation “Greicius et al., 2004” has not been found in the reference list. Please supply full details for this reference. Q3 This sentence has been slightly modified for clarity. Please check that the meaning is still correct, and amend if necessary. Q4 This sentence has been slightly modified for clarity. Please check that the meaning is still correct, and amend if necessary. Q5 This sentence has been slightly modified for clarity. Please check that the meaning is still correct, and amend if necessary. Q6 This sentence has been slightly modified for clarity. Please check that the meaning is still correct, and amend if necessary. Q7 Please provide a caption. Q8 Uncited reference: This section comprises references that occur in the reference list but not in the body of the text. Please position each reference in the text or, alternatively, delete it. Any reference not dealt with will be retained in this section. Thank you. Q9 The following reference is not cited in text:[bib38] Knyazev, 2007.Please provide the necessary citation(s). Thank you for your assistance. Our reference: BRES 41536 P-authorquery-v8 Page 1 of 1

Welcome message from author
This document is posted to help you gain knowledge. Please leave a comment to let me know what you think about it! Share it to your friends and learn new things together.
Transcript
AUTHOR QUERY FORM
Journal: BRES Please e-mail or fax your responses and any corrections to:E-mail: [email protected]: +1 619 699 6721
Article Number: 41536
Dear Author,
Any queries or remarks that have arisen during the processing of your manuscript are listed below and highlighted by flags inthe proof. Please check your proof carefully and mark all corrections at the appropriate place in the proof (e.g., by using on-screen annotation in the PDF file) or compile them in a separate list.
For correction or revision of any artwork, please consult http://www.elsevier.com/artworkinstructions.
Any queries or remarks that have arisen during the processing of your manuscript are listed below and highlighted by flags inthe proof. Click on the ‘Q’ link to go to the location in the proof.
Locationin article
Query / Remark: click on the Q link to goPlease insert your reply or correction at the corresponding line in the proof
Q1 This sentence has been slightly modified for clarity. Please check that the meaning is still correct, andamend if necessary.
Q2 Citation “Greicius et al., 2004” has not been found in the reference list. Please supply full details for thisreference.
Q3 This sentence has been slightly modified for clarity. Please check that the meaning is still correct, andamend if necessary.
Q4 This sentence has been slightly modified for clarity. Please check that the meaning is still correct, andamend if necessary.
Q5 This sentence has been slightly modified for clarity. Please check that the meaning is still correct, andamend if necessary.
Q6 This sentence has been slightly modified for clarity. Please check that the meaning is still correct, andamend if necessary.
Q7 Please provide a caption.
Q8 Uncited reference: This section comprises references that occur in the reference list but not in the body ofthe text. Please position each reference in the text or, alternatively, delete it. Any reference not dealt withwill be retained in this section. Thank you.
Q9 The following reference is not cited in text:[bib38] Knyazev, 2007.Please provide the necessary citation(s).
Thank you for your assistance.
Our reference: BRES 41536 P-authorquery-v8
Page 1 of 1
Пользователь
Записка
Figure caption for supplementary data appears in this same file at the page that is situated just after highlights.
1 Highlights
2 Brain Research xx (2011) xxx–xxx
4
5 The default mode network and EEG alpha oscillations: An independent6 component analysis
7
8 Gennady G. Knyazev⁎, Jaroslav Y. Slobodskoj-Plusnin, Andrey V. Bocharov, Liudmila V. Pylkova
9 Institute of Physiology, Siberian Branch of the Russian Academy of Medical Sciences, Novosibirsk, Russia
1011 ► Spontaneous self-referential thought is accompanied by enhanced alpha activity in the posterior DMN hub. ► DMN function-related12 stimuli disrupt synchrony of spontaneous alpha oscillations.► DMN function-related stimuli cause partial phase-locking of alpha activity in13 the posterior cingulate gyrus. ► Alpha oscillations might be involved in spontaneous thought processes.
14
15
B R A I N R E S E A R C H X X ( 2 0 1 1 ) X X X
BRES-41536; No. of pages: 1; 4C:
0006-8993/$ – see front matter © 2011 Published by Elsevier B.V.doi:10.1016/j.brainres.2011.05.052
ava i l ab l e a t www.sc i enced i r ec t . com
www.e l sev i e r . com/ loca te /b ra i n res
Please cite this article as: Knyazev, G.G., et al., The default mode network and EEG alpha oscillations: An independentcomponent analysis, Brain Res. (2011), doi:10.1016/j.brainres.2011.05.052
Fig. 1S Topography of significant correlations of SRTS scores with alpha power during rest with eyes closed.
Fig. 2S Results of statistical comparison of event-related spectral perturbations (upper panels) and inter-trialcoherence (bottom panels) measures in subjects performing the explicit judgment (left column) and the social game(right column) tasks. Areas with no significant differences (PFDR<0.05) are zeroed out and plotted in green. Red colorshows synchronization, blue color—desynchronization. Cortical maps at the top of the figure show corticaldistribution of most pronounced effects.
Figure 3S sLORETA results of statistical testing. Upper row shows significant correlations of SRTS scores with alphaband current source density in resting condition. Yellow color shows positive correlations. Middle and bottom rowsshow test vs. reference interval contrast for alpha band current source density in the social game and the implicitjudgment task, respectively. Blue color shows decrease of alpha band current source density in the test relative tothe reference interval.
Figure 4S Electrode locations on the scalp surface.
Original text:
Inserted Text
" – "
1
2
3
4
5
6
7
910
11
12
13
14
15
16
17
18
19
20Q1
21
22
23
24
25
26
27
28
29
30
31
32
33
34
35
36
37
38
39
40
4142
43
4445
46
47
B R A I N R E S E A R C H X X ( 2 0 1 1 ) X X X – X X X
BRES-41536; No. of pages: 14; 4C:
ava i l ab l e a t www.sc i enced i r ec t . com
www.e l sev i e r . com/ loca te /b ra i n res
Research Report
The default mode network and EEG alpha oscillations: Anindependent component analysis
Gennady G. Knyazev⁎, Jaroslav Y. Slobodskoj-Plusnin,Andrey V. Bocharov, Liudmila V. PylkovaInstitute of Physiology, Siberian Branch of the Russian Academy of Medical Sciences, Novosibirsk, Russia
A R T I C L E I N F O
⁎ Corresponding author. Fax: +7 383 332 42 54E-mail address: [email protected] (G.G.Abbreviations: ANOVA, analysis of varianc
alogram; ERP, event-related potential; ERSPfunctional magnetic resonance imaging; GLMpositron emission tomography; PH, posterio
0006-8993/$ – see front matter © 2011 Publisdoi:10.1016/j.brainres.2011.05.052
Please cite this article as: Knyazev, G.Gcomponent analysis, Brain Res. (2011), d
A B S T R A C T
Article history:Accepted 20 May 2011
Q1
The default mode network (DMN) has been principally investigated using positron emissiontomography (PET) and functional magnetic resonance imaging (fMRI) and has receivedmixed support in electroencephalographic (EEG) studies. In particular, the existing evidenceis too inconsistent to allow formulation of specific hypotheses linking DMN activity totraditional EEG frequency bands. In this study, we aimed to test whether blinddecomposition methods are able to identify in EEG data spatial patterns resembling theDMN as it is described in PET and fMRI studies. Further we aimed to test a degree of task-relatedness identified in traditional EEG frequency band DMN patterns. To answer thesequestions we collected data both in a resting state and during performance of twoexperimental tasks: an explicit judgment of facial affect and a social game task. Individualdifferences in amount of self-referential thoughts during the resting state weremeasured bya short self-report scale. Only alpha band spatial patterns simultaneously showed aconsiderable overlap with the DMN and high correlations with presumptive DMN function-related outcomes both in the resting state and during the social game task. Spontaneousself-referential thoughts were associated with enhanced alpha activity in the posterior DMNhub, whereas processing of DMN function-related external stimuli disrupted this activityand simultaneously caused partial alpha phase-locking to external events. This evidenceimplies that synchronization of internal mental processes, as opposed to the processing ofexternal stimuli, might be the primary function of alpha oscillations which is bound to berelated to activity of the DMN.
© 2011 Published by Elsevier B.V.
Keywords:Default mode networkEEGAlpha oscillationsSocial cognitionIndependent component analysisLORETA
48
49
50
51
1. Introduction
The default mode network (DMN) concept was first introducedin 2001 (Raichle et al., 2001) and has rapidly become a central
.Knyazev).e; BOLD, blood oxygen le, event-related spectral, general linear model; Mr hub; sLORETA, standard
hed by Elsevier B.V.
., et al., The default moi:10.1016/j.brainres.201
theme in cognitive neuroscience. This concept comes from anemergent body of evidence showing a consistent pattern ofdeactivation across a network of brain regions that occursduring the initiation of task-related activity (Raichle et al.,
vel dependent; DMN, default mode network; EEG, electroenceph-perturbations; FDR, false discovery rate; FH, frontal hub; fMRI,PFC, medial prefrontal cortex; PCC, posterior cingulate cortex; PET,ized low-resolution brain electromagnetic tomography
ode network and EEG alpha oscillations: An independent1.05.052
Original text:
Inserted Text
of DMN patterns identified in the traditional EEG frequency bands.
Original text:
Inserted Text
"s"
Original text:
Inserted Text
";"
Пользователь
Записка
Cancelled установлено Пользователь
Пользователь
Записка
Cancelled установлено Пользователь
Пользователь
Вычеркивание
52
53
54
55
56
57
58
59
60
61
62
63
64
65
66
67
68
69
70
71
72
73
74
75
76
77
78
79
80
81Q2
82
83
84
85
86
87
88
89
90
91
92
93
94
95
96
97
98
99
100
101
102
103
104
105
106
107
108
109
110
111
112
113
114
115
116
117
118
119
120
121
122
123
124
125
126
127
128
129
130
131
132
133
134
135
136
137
138
139
140
141
142
143
144
145
146
147
148
149
150
151
152
153
154
155
156
157
158
159
160
161
162
163
164
165
166
167
168
169
170
171
2 B R A I N R E S E A R C H X X ( 2 0 1 1 ) X X X – X X X
2001; Raichle and Snyder, 2007). The DMN includes theprecuneus/posterior cingulate cortex (PCC), the medial pre-frontal cortex (MPFC), and medial, lateral, and inferior parietalcortices. Although deactivated during task performance, thisnetwork is active in the resting brain with a high degree offunctional connectivity between regions. The more demand-ing the task the stronger the deactivation appears to be(McKiernan et al., 2006; Singh and Fawcett, 2008). A notableexception to this general pattern of deactivation during goal-directed activity occurs in relation to tasks requiring self-referential thought and social cognition (Gobbini et al., 2007;Mitchell, 2006). Mitchell (2006) suggested that social cognitionis one of the functions of the DMN. DMN was shown to beactivated during social interaction task as compared to a non-social control task sharing many of the same features (Rillinget al., 2004; 2008). In spite of this body of evidence suggestingthat some aspect of DMN activity may be related to socialcognition, this needs to be also considered in light of otherevidence, showing the robustness of coherent DMN activityfluctuations even under conditions of sedation and generalanesthesia (e.g., Greicius et al., 2008; Vincent et al., 2007).Vincent et al. (2007) suggest that these coherent systemfluctuations probably reflect an evolutionarily conservedaspect of brain functional organization that transcends levelsof consciousness.
In order to draw out the relevant and appropriate implica-tions from the above presented findings, the key methodolog-ical issues should be taken into account. The DMN has beenprincipally investigated using functional magnetic resonanceimaging (fMRI, e.g. Greicius et al., 2003; 2004;2007), althoughpositron emission tomography (PET; e.g. Raichle et al., 2001)and electrophysiology (e.g. Helps et al., 2008; Laufs et al., 2003b;Scheeringa et al., 2008) have also been employed. AlthoughfMRI blood oxygen level dependent (BOLD) signal imaging isideal for providing a representation of the spatial organizationof brain function, it is as yet unclear how these changes relateto concurrent changes in the spatial extent and magnitude ofneuronal events (Debener et al., 2006). The aspect of neuronalactivity which best predicts changes in BOLD contrast (i.e.combined neuronal spiking, local field potentials, changes inspontaneous rhythms, etc.) has not been established definitely(Huettel et al., 2004). Hence there may be a degree ofincongruence between hemodynamic and electrophysiologi-cal signals. Moreover, despite the excellent spatial resolutionof fMRI, the temporal resolution is poor. In contrast, electro-encephalogram (EEG) has excellent temporal resolution inwhich electrophysiological correlates of spontaneous or event-related changes in neuronal activity may be examined.Researchers have examined DMN activity in terms of tradi-tional bands of EEG activity (Chen et al., 2008) and in terms ofvery slow EEG frequencies (Helps et al., 2008; Vanhatalo et al.,2004). Chen et al. (2008) compared the spatial distribution andspectral power of seven bands of resting state EEG activity, ineyes closed and eyes open condition. They termed the definedset of regional and frequency specific activity, the EEG default-mode network (EEG-DMN), and propose that the EEG-DMNshould now be examined in the context of task-induceddemands and in patient groups.
Simultaneous EEG–fMRI allows the empirical determina-tion of the degree of overlap between EEG and fMRI BOLD
Please cite this article as: Knyazev, G.G., et al., The default mcomponent analysis, Brain Res. (2011), doi:10.1016/j.brainres.201
signal. This growing body of literature has noted correlationsbetween the DMN and gamma (Mantini et al., 2007), beta(Laufs et al., 2003b; Mantini et al., 2007), alpha (Laufs et al.,2003a; Mantini et al., 2007), and theta (Meltzer et al., 2007;Scheeringa et al., 2008). Mid-range beta (17–23 Hz) was stronglycorrelated with task-independent deactivations in PCC, pre-cuneus, temporo-parietal and dorsomedial prefrontal cortex(Laufs et al., 2003b). In view of the lack of association betweenalpha and resting state brain activity, Laufs et al. (2003b)hypothesize that alpha may act as a baseline for specific brainstructures associated with the attentional system, and morespecifically the task-positive network (Laufs et al., 2006). Incontrast, Mantini et al. (2007) reported positive correlationsbetween beta (13–30 Hz) and alpha (8–13 Hz) with the PCC,precuneus, bilateral superior frontal gyrus and the medialfrontal gyrus. Further, regions in the DMN associated withself-referential processing such as the medial pre-frontalcortex (MPFC) were positively correlated with gamma (30–50 Hz; Mantini et al., 2007). In addition, medial frontal thetapower changes were negatively correlated with the BOLDresponse in medial frontal regions, PCC/precuneus, andbilaterally in inferior frontal, inferior parietal and middletemporal cortices and the cerebellum (Scheeringa et al., 2008).Further, Meltzer et al. (2007) found that fronto-medial thetawas most strongly negatively correlated with the MPFC,although negative correlations were also found with otherDMN areas such as PCC.
The observed weak to moderate correlations between re-gions associated with the DMN and a variety of EEG frequencydomain features do not necessarily support the idea that anyfeature in the EEG has theDMNas a specific source. Moreover, itmight be questioned whether the DMN actually exists as asource in the EEG. Perhaps, as Chen et al. (2008) suggest, insteadof trying to findout a correspondence between EEG features andDMN topography we should consider two different phenomena—the fMRI-DMN and the EEG-DMN. However, if we admit theexistence of method-specific phenomena in the brain that donot correlate with each other, we should be very careful inconsidering their possible functional correlates. It is quitepossible that some functional processesmay have no reflectionin the BOLD signalwhile they have a clearmanifestation in EEG,and vice versa. However, functional processes that are ascribedto DMN, such as self-referential thought and social cognition,are bound to have some manifestation in cortical electricalactivity. In this connection, it should be noted that most of theEEG and EEG-fMRI DMN studies investigated only the restingstate. However, most inferences about presumable DMNfunctions were made from comparisons of its activity indifferent states. Therefore, an investigation of EEG correlatesof psychological processes that are ascribed to DMN is clearlyneeded. It should be also noted that most of the EEG and EEG-fMRI studies investigated either cortical EEG spectral powerdistribution (e.g., Chen et al., 2008) or its correlation with theBOLD signal (Laufs et al., 2003b; Mantini et al., 2007; Scheeringaet al., 2008). However, fMRI studies have employed a number ofspecific analytic techniques for a more purposeful analysis ofDMN functions. Two of these techniques, region-of-interest(ROI) seed-based correlation approaches and independentcomponent analysis (ICA), are most commonly employed inthe literature. Seed-based approaches use regression or
ode network and EEG alpha oscillations: An independent1.05.052
Original text:
Inserted Text
"cortex"
Original text:
Inserted Text
","
Original text:
Inserted Text
","
Original text:
Inserted Text
","
Original text:
Inserted Text
" – "
172
173
174
175
176
177
178
179
180
181
182
183
184
185
186
187
188
189
190
191
192
193
194
195
196
197
198
199
200
201
202
203
204Q3
205
206
207
208
209
210
211
212
213
214
215
216
217Q4
218
219
220221
222
223
224
225
226
227
228
229
230
231
232
233
234
235
236
237
238
239
240
241
242
243
244
245
246
247
248
249
250
251
252
253
254
255
256
257
258
259
260
261
262
263
264
265
266
267
268
269
270
271
272
3B R A I N R E S E A R C H X X ( 2 0 1 1 ) X X X – X X X
correlation analyses to examine activity in selected voxels orROI (Uddinetal., 2008). Incontrast, ICA isamodel-freeapproach,which, unlike ROI seed-based analysis, is not bounded by apriori predictions. ICA decomposes data into maximally (tem-porally or spatially) independent components, representing thecharacteristic time and spatial signatures of the sourcesunderlying the recorded mixed signals (McKeown et al., 1998).While there are theoretical advantages/disadvantages of eachmethod—a direct comparison reveals comparable results(Greicius et al., 2004).
In this studywe aimed to investigate EEG correlates of DMNactivity both in “rest” and in two experimental tasks. In ourchoice of the experimental tasks we proceeded from anecessity for them to share the same kind of stimuli butpresented in different contexts. Specifically, we were guidedby the above presented evidence linking DMN with socialcognition. Therefore, in the target task we wanted to modelsocial interactions with virtual “persons.” Pictures of thesepersonswere presented at the screen and the participants hadto establish virtual relations with these “persons.” In thecontrol task, participants were presented with the samepictures, but their task in this case was just to evaluate adegree of hostility–friendliness of presented faces. It is clearthat the second task does not exclude a possibility of self-referential processing, because pictures of human faces mayunpredictably trigger self-referential thoughts (for example, ifthe presented face resembles someone familiar to theparticipant). However, we might be reasonably confidentthat these processes should be more pronounced in theformer than in the latter task.
In all cases we sought to determine a degree of “task-relatedness” identified in traditional EEG frequency bandspatial patterns. To do this, we employed the ICA approachin a fashion that is most commonly used in relevant fMRIstudies. Contrary to PET/fMRI data, which allow localizingbrain activity in a 3D brain volume, EEG data give only a 2Drepresentation. To overcome this limitation, different sourcereconstruction techniques have been devised. In this study,sLORETA (Pascual-Marqui, 2002) was applied to the data todetermine the cortical sources measured on the skull surfaceelectrical activity. We aimed to answer the following researchquestions: (1) to test whether blind separation methods likeICA applied to 3D-reconstructed EEG data allow reproducingmajor DMN features outlined in fMRI research; (2) to evaluate adegree of “task-relatedness” obtained in traditional EEGfrequency band spatial patterns; (3) to examine separatelyevoked and induced oscillatory responses in experimentaltasks with stimuli presentation.
273
274
275
276
277
278
279
280
281
282
283
284
2. Results
Behavioral results, channel-level analysis, and sLORETAwhole brain results are presented in Supplementary data.
2.1. Identification of default mode network activity
3D current source density data were analyzed using combinedgroup ICA and statistical parametric mapping techniques.Group ICA was performed for each condition and each
Please cite this article as: Knyazev, G.G., et al., The default mcomponent analysis, Brain Res. (2011), doi:10.1016/j.brainres.201
frequency band separately. Besides, in the explicit judgmentand social game tasks, separate analyses were performed forinduced and evoked oscillations. In total, these analysesgenerated thirty sets of results (each set comprising 20independent components). For each set of results, we per-formed spatial sorting of the components using the GIFTsoftware. The component that (spatially) correlated mostsignificantly with the DMN template (see Section 5) wasselected as the default mode component. For all conditionsand frequency bands, the respective components demon-strated moderate correlations to the DMN template (Pearson'sr range=0.55 to 0.68). One-sample T-test in SPM5 was used toassess the statistical significance of each identified DMNpattern. For a particular pattern, each subject's respectiveindependent component image (z score spatial map) wasentered into a second-level random-effects analysis andassessed statistically using a threshold of PFDR<0.05 (whole-brain corrected) and minimum cluster size of 8 contiguousvoxels (Harrison et al., 2008). All ICs that showed highestcorrelations to the DMN template proved to be statisticallysignificant across subjects.
2.2. Functional comparison of identified networks
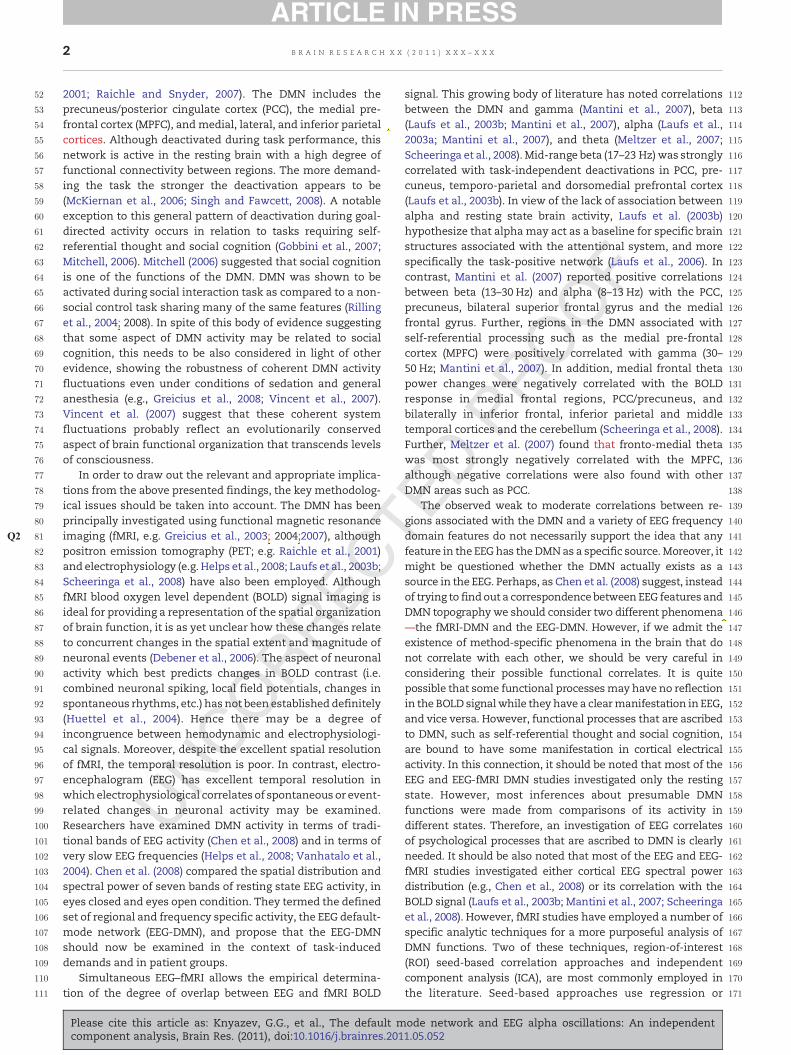
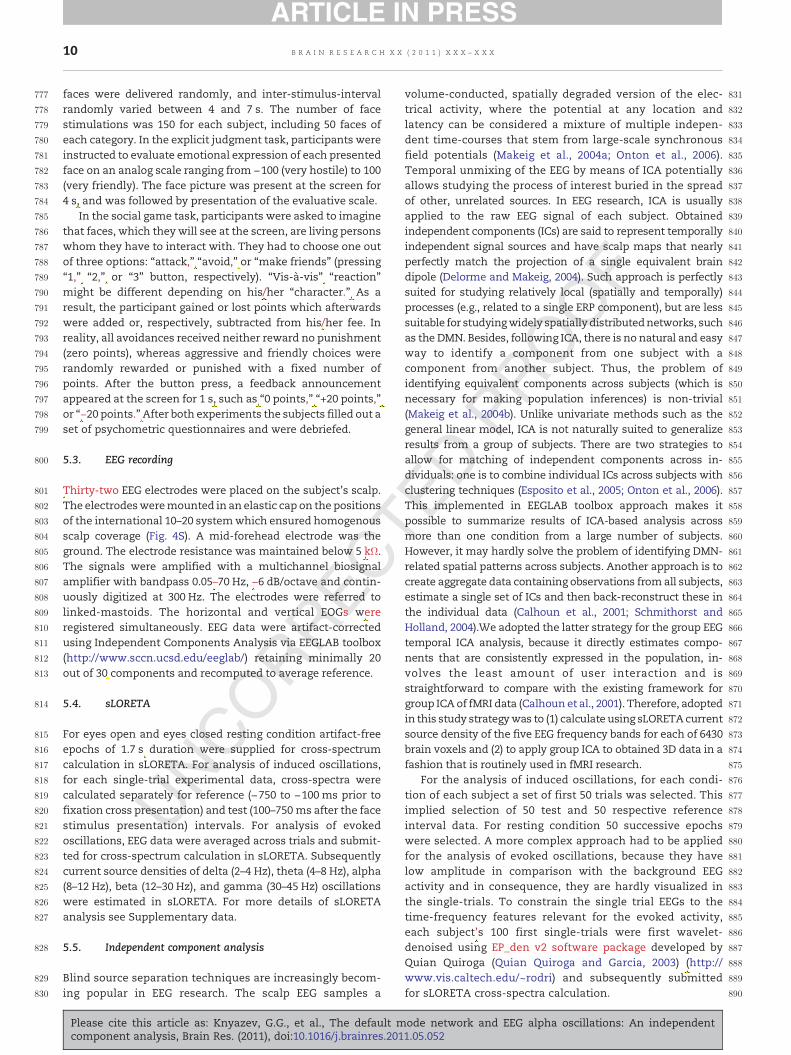
2.2.1. Resting conditionAfter the initial spatial identification of networks in eachfrequency band, a degree of their “task-relatedness” for eachexperimental condition was evaluated. For resting condition,thedegree of “task-relatedness”was evaluated in the between-subject domain. For each component, a correlation betweenthis component scores and SRTS scores was calculated.Bonferroni correction was applied to correct for multiplecomparisons. There were no significant correlations in theeyes open condition. In the eyes closed condition, one alphaband component showed significant correlation with SRTSscores (r=0.44, P=0.0019). This component also showed high-est (among the 20 alpha band components) spatial correlationto the DMN template (r=0.56). Spatial correlations with FH andPH templates were additionally calculated. The DMN alphaband component showed highest (among the 20 alpha bandcomponents) spatial correlation to the PH template (r=0.49),but low spatial correlation to the FH template (r=0.04).Component's anatomy mostly included the precuneus (BA7)(Fig. 1).
2.2.2. Induced oscillationsFor induced oscillations data, which comprised a succession ofreference and test intervals, the degree of “task-relatedness”was assessed by means of temporal sorting analysis using theGIFT software. For each set of ICA results, the associated timecourse for all ICs was correlated with an idealized referencefunction (see Section 5for details) of the respective experi-ment. The component that (temporally) correlated mostsignificantly with the reference function was selected as themost task-related. For the social game task, the highesttemporal correlation to the respective reference function(r=0.87) was again found in the alpha band of frequenciesand was also associated with the IC that showed the highestspatial correlation to the DMN template (r=0.64). For otherfrequency bands, the identified default mode network
ode network and EEG alpha oscillations: An independent1.05.052
Original text:
Inserted Text
"."
Original text:
Inserted Text
"."
Original text:
Inserted Text
"of "
Original text:
Inserted Text
"s"
Original text:
Inserted Text
"s"
Original text:
Inserted Text
"of "
Original text:
Inserted Text
"of "
Original text:
Inserted Text
"s"
Original text:
Inserted Text
"section"
Original text:
Inserted Text
"s"
Original text:
Inserted Text
"section "
Original text:
Inserted Text
" – "
Original text:
Inserted Text
"-"
Original text:
Inserted Text
"Methods Experimental procedures "
Original text:
Inserted Text
"’"
Original text:
Inserted Text
"were "
Original text:
Inserted Text
"’"
Original text:
Inserted Text
"’"
Original text:
Inserted Text
"Methods "
Пользователь
Записка
Cancelled установлено Пользователь
Пользователь
Записка
Cancelled установлено Пользователь
Пользователь
Вычеркивание
Пользователь
Вставить текст
of spatial patterns identified in the traditional EEG frequency bands.
Пользователь
Записка
Cancelled установлено Пользователь
Пользователь
Записка
Cancelled установлено Пользователь
Пользователь
Вычеркивание
Пользователь
Вставить текст
of spatial patterns obtained in the traditional EEG frequency bands
285
286
287
288
289
290
291
292
293
294
295
296
297
298
299
300
301
302
303
304
305
306
307
308
309
310
311
312
313
314
315
316
317
318
319
320
321
322
323
324
325
326
327
328
329
330
Fig. 1 – Spatial pattern of the alpha band DMN component that was identified in rest with eyes closed condition and showed thehighest correlation with SRTS scores. The scale is in z-scores.
4 B R A I N R E S E A R C H X X ( 2 0 1 1 ) X X X – X X X
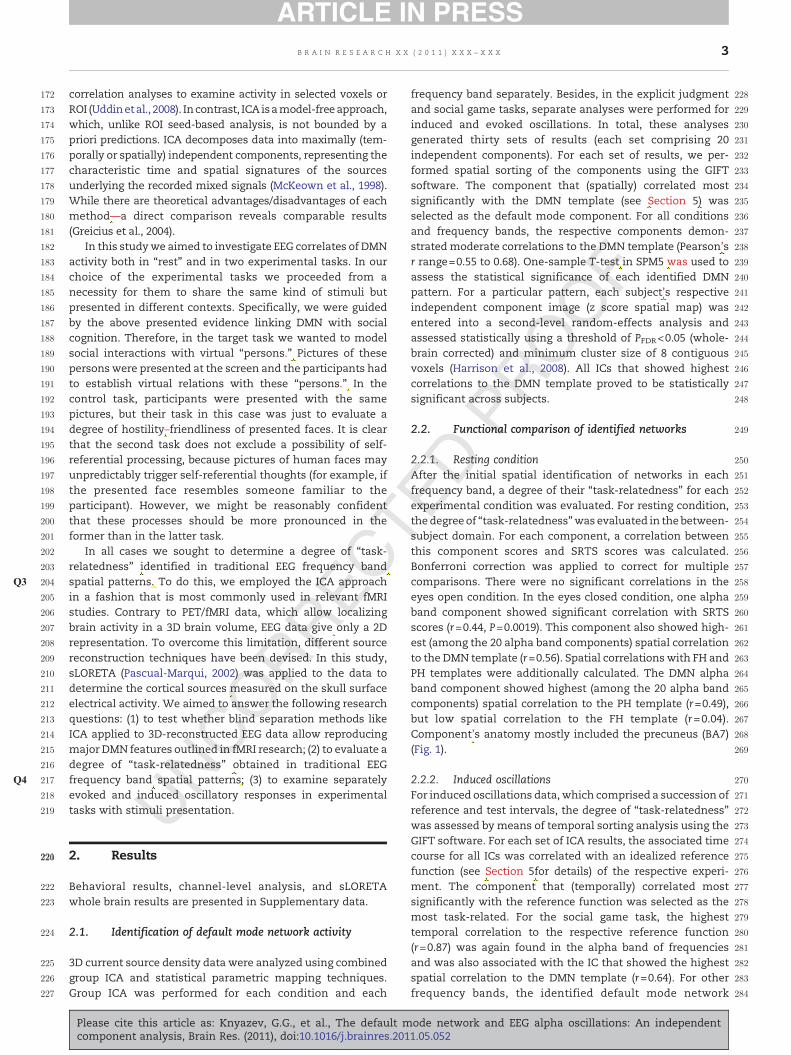
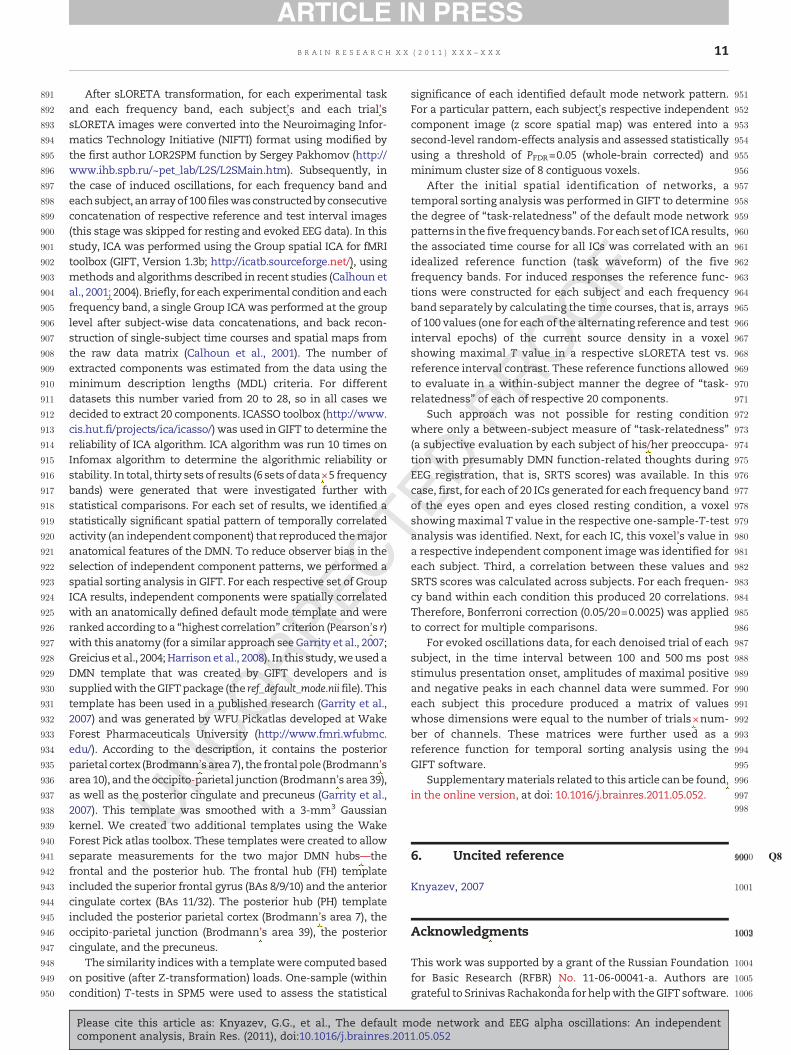
patterns did not demonstrate the highest correlation to therespective reference function and generally these correlationswere lower than for alpha band. The DMN alpha bandcomponent showed highest (among the 20 alpha bandcomponents) spatial correlation to the PH template (r=0.58),but no spatial correlation to the FH template (r=0). Compo-nent's anatomy again mostly included the precuneus (BA7and BA19). Fig. 2 shows the default mode network pattern andits associated time course that was identified for alphafrequency band in the social game experiment.
Note that each pair of consecutive points at the ICactivation plot represents a trial of the social game task,which consists of the reference (marked with vertical gridlines) and the test interval. The observed saw-edged patternwith ups corresponding to the reference and downs corre-sponding to the test interval signifies that DMN alphaoscillations tend to desynchronize during the face presenta-tion period relative to the inter-trial interval. This pattern waspositively andmost robustly correlated with the idealized (i.e.,associated with the activity in the most task-related voxel)reference function relative to other estimated ICs.
For the explicit judgment task, none of the components,that showed the highest temporal correlation to the respective
Please cite this article as: Knyazev, G.G., et al., The default mcomponent analysis, Brain Res. (2011), doi:10.1016/j.brainres.201
reference function, was associated with the DMN pattern.Their spatial correlations with the DMN template ranged from0.08 to 0.35. Thus, task-related DMN patterns were observedonly in the alpha band of frequencies and only in the restingcondition with eyes closed and in the social game task.
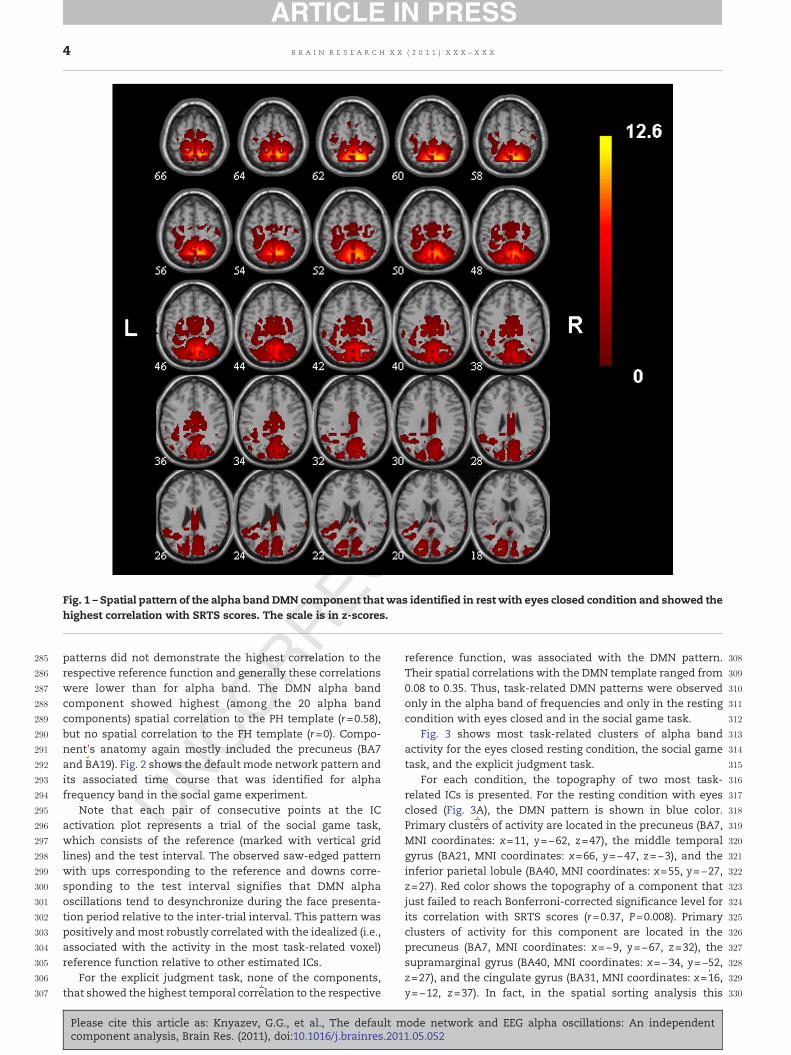
Fig. 3 shows most task-related clusters of alpha bandactivity for the eyes closed resting condition, the social gametask, and the explicit judgment task.
For each condition, the topography of two most task-related ICs is presented. For the resting condition with eyesclosed (Fig. 3A), the DMN pattern is shown in blue color.Primary clusters of activity are located in the precuneus (BA7,MNI coordinates: x=11, y=−62, z=47), the middle temporalgyrus (BA21, MNI coordinates: x=66, y=−47, z=−3), and theinferior parietal lobule (BA40, MNI coordinates: x=55, y=−27,z=27). Red color shows the topography of a component thatjust failed to reach Bonferroni-corrected significance level forits correlation with SRTS scores (r=0.37, P=0.008). Primaryclusters of activity for this component are located in theprecuneus (BA7, MNI coordinates: x=−9, y=−67, z=32), thesupramarginal gyrus (BA40, MNI coordinates: x=−34, y=−52,z=27), and the cingulate gyrus (BA31, MNI coordinates: x=16,y=−12, z=37). In fact, in the spatial sorting analysis this
ode network and EEG alpha oscillations: An independent1.05.052
Original text:
Inserted Text
" o"
Original text:
Inserted Text
", "
Original text:
Inserted Text
"−"
Original text:
Inserted Text
"’"
331
332
333
334
335
336
337
338
339
340
341
342
343
344
345
346
347
348
349
350
351
352
Fig. 2 – Spatial pattern and its associated time course of the alpha band DMN component that was identified for the inducedalpha band responses during the social game task and showed the highest temporal correlation with respective referencefunction. Each pair of consecutive points at the time course represents a trial of the social game task (only first 18 trials areshown), which consists of the reference (marked with vertical grid lines) and the test interval. The observed pattern shows thatthis component's alpha oscillations desynchronize during the test interval relative to the reference interval. Both the color scaleat the bottom part of the figure and the y axis at the time course plot are in z-scores. (For interpretation of the references to colorin this figure legend, the reader is referred to the web version of this article.)
5B R A I N R E S E A R C H X X ( 2 0 1 1 ) X X X – X X X
component showed the second largest correlation to the DMNtemplate (r=0.46).
For the social game task (Fig. 3B), the DMN pattern is againshown in blue color. Primary clusters of activity are located inthe precuneus (BA7, MNI coordinates: x=−11, y=−67, z=42)and the cingulate gyrus (BA31, MNI coordinates: x=−9, y=−52,z=42). Red color shows the topography of a component thatshowed the second largest temporal correlation to therespective reference function (r=0.87). This component alsoshowed the third largest correlation to the DMN template(r=0.28). Primary clusters of activity for this component are
Fig. 3 – Two most task-related components in the alpha band oclosed condition (A), the social game task (B), and the explicit jud
Please cite this article as: Knyazev, G.G., et al., The default mcomponent analysis, Brain Res. (2011), doi:10.1016/j.brainres.201
located in the paracentral lobule (BA3, MNI coordinates: x=16,y=−42, z=57) and the precuneus (BA7, MNI coordinates: x=−4,y=−52, z=52).
For the explicit judgment task (Fig. 3C), the most task-related component is shown in blue color. Primary clustersof activity are located in the precentral gyrus (BA4, MNIcoordinates: x=−44, y=−12, z=42), the insula (BA13, MNIcoordinates: x=−34, y=−7, z=17), and the cingulate gyrus(BA24, MNI coordinates: x=−19, y=−17, z=42). Red colorshows the topography of a component that showed thesecond largest temporal correlation to the respective
f frequencies overlaid on one another for the rest with eyesgment task (C). The scales are in z-scores.
ode network and EEG alpha oscillations: An independent1.05.052
Original text:
Inserted Text
", "
Original text:
Inserted Text
", "
Original text:
Inserted Text
"’"
353
354
355
356
357
358
359
360
361
362
363
364
365
366
367
368
369
370
371
372
373
374
375
376
377
378
379
380
381
382
383
384
385
386
387
388
389
390
391
392
393
394
395
396397
398
399
400
401
402
403
404
405
406
407
408
409
410
411
412
413
414
415
416
417
418
419
420
421
422
423
6 B R A I N R E S E A R C H X X ( 2 0 1 1 ) X X X – X X X
reference function (r=0.52). Primary clusters of activity forthis component are located in the precuneus (BA7, MNIcoordinates: x=−14, y=−47, z=52), the precentral gyrus (BA4,MNI coordinates: x=−29, y=−32, z=52), and the superiortemporal gyrus (BA22, MNI coordinates: x=41, y=−32, z=7).Both components showed low spatial correlations with theDMN template (r=0.10 and 0.31, respectively).
Finally, we evaluated the degree of correspondence be-tween alpha band DMN-related spatial patterns in the eyesclosed resting condition and in the social game task. Spatialcorrelation between respective patterns was calculated usingthe GIFT software. The eyes closed rest DMN pattern showedhigh spatial correlationwith the social game task DMNpattern(r=0.81).
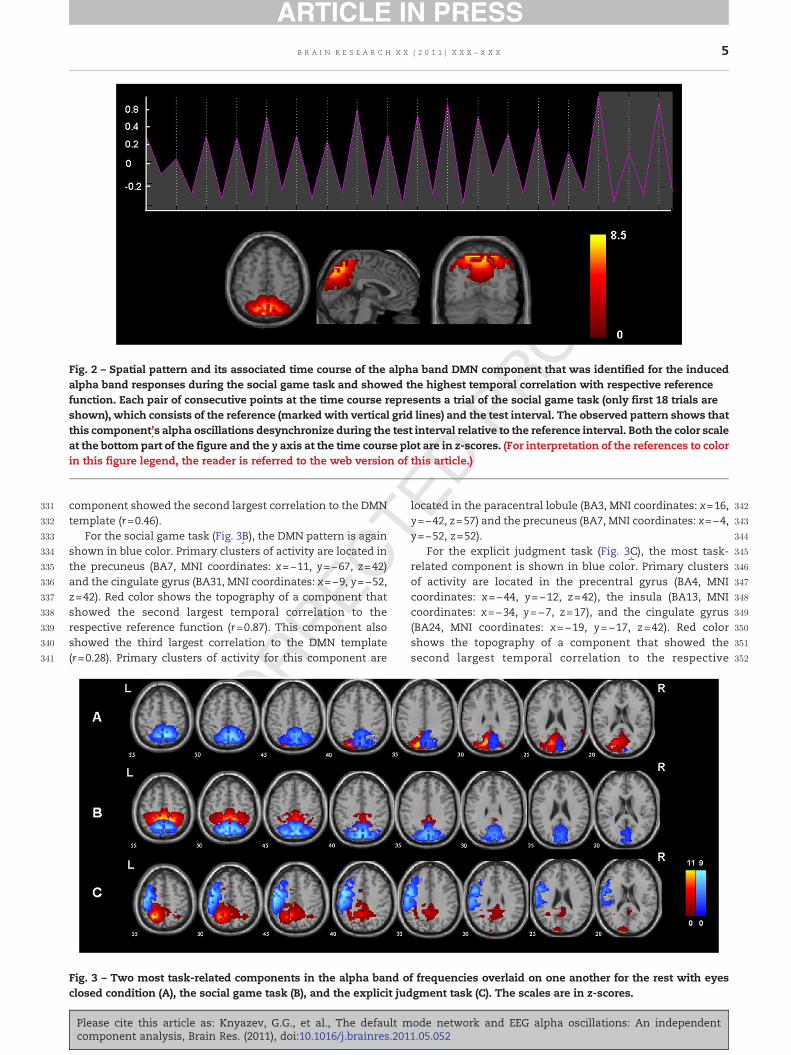
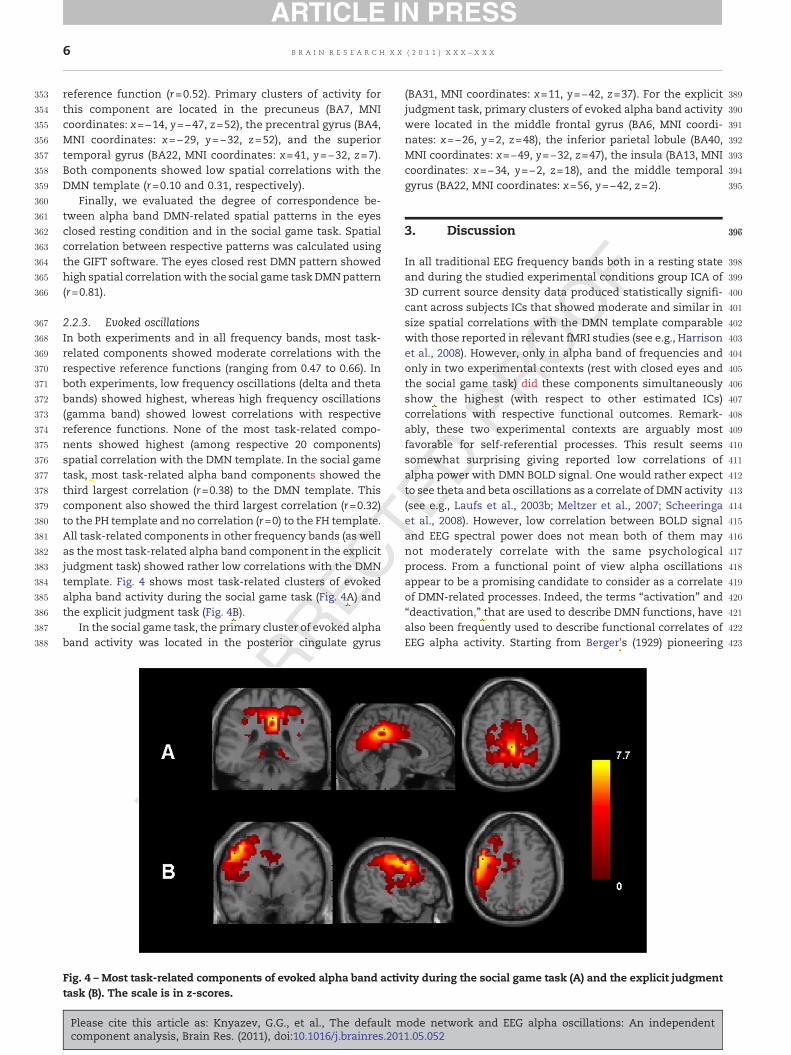
2.2.3. Evoked oscillationsIn both experiments and in all frequency bands, most task-related components showed moderate correlations with therespective reference functions (ranging from 0.47 to 0.66). Inboth experiments, low frequency oscillations (delta and thetabands) showed highest, whereas high frequency oscillations(gamma band) showed lowest correlations with respectivereference functions. None of the most task-related compo-nents showed highest (among respective 20 components)spatial correlation with the DMN template. In the social gametask, most task-related alpha band components showed thethird largest correlation (r=0.38) to the DMN template. Thiscomponent also showed the third largest correlation (r=0.32)to the PH template and no correlation (r=0) to the FH template.All task-related components in other frequency bands (as wellas themost task-related alpha band component in the explicitjudgment task) showed rather low correlations with the DMNtemplate. Fig. 4 shows most task-related clusters of evokedalpha band activity during the social game task (Fig. 4A) andthe explicit judgment task (Fig. 4B).
In the social game task, the primary cluster of evoked alphaband activity was located in the posterior cingulate gyrus
Fig. 4 – Most task-related components of evoked alpha band activtask (B). The scale is in z-scores.
Please cite this article as: Knyazev, G.G., et al., The default mcomponent analysis, Brain Res. (2011), doi:10.1016/j.brainres.201
(BA31, MNI coordinates: x=11, y=−42, z=37). For the explicitjudgment task, primary clusters of evoked alpha band activitywere located in the middle frontal gyrus (BA6, MNI coordi-nates: x=−26, y=2, z=48), the inferior parietal lobule (BA40,MNI coordinates: x=−49, y=−32, z=47), the insula (BA13, MNIcoordinates: x=−34, y=−2, z=18), and the middle temporalgyrus (BA22, MNI coordinates: x=56, y=−42, z=2).
3. Discussion
In all traditional EEG frequency bands both in a resting stateand during the studied experimental conditions group ICA of3D current source density data produced statistically signifi-cant across subjects ICs that showed moderate and similar insize spatial correlations with the DMN template comparablewith those reported in relevant fMRI studies (see e.g., Harrisonet al., 2008). However, only in alpha band of frequencies andonly in two experimental contexts (rest with closed eyes andthe social game task) did these components simultaneouslyshow the highest (with respect to other estimated ICs)correlations with respective functional outcomes. Remark-ably, these two experimental contexts are arguably mostfavorable for self-referential processes. This result seemssomewhat surprising giving reported low correlations ofalpha power with DMN BOLD signal. One would rather expectto see theta and beta oscillations as a correlate of DMN activity(see e.g., Laufs et al., 2003b; Meltzer et al., 2007; Scheeringaet al., 2008). However, low correlation between BOLD signaland EEG spectral power does not mean both of them maynot moderately correlate with the same psychologicalprocess. From a functional point of view alpha oscillationsappear to be a promising candidate to consider as a correlateof DMN-related processes. Indeed, the terms “activation” and“deactivation,” that are used to describe DMN functions, havealso been frequently used to describe functional correlates ofEEG alpha activity. Starting from Berger's (1929) pioneering
ity during the social game task (A) and the explicit judgment
ode network and EEG alpha oscillations: An independent1.05.052
Original text:
Inserted Text
", "
Original text:
Inserted Text
", "
Original text:
Inserted Text
"ed"
Original text:
Inserted Text
","
Original text:
Inserted Text
"’"
Пользователь
Вычеркивание
Пользователь
Вставить текст
the
Пользователь
Вставить текст
424
425
426
427
428
429
430
431
432
433
434
435
436
437
438
439
440
441
442
443
444
445
446
447
448
449
450
451
452
453
454
455
456
457
458
459
460
461
462
463
464
465
466
467
468
469
470
471
472
473
474
475
476
477
478
479
480
481
482
483
484
485
486
487
488
489
490
491
492
493
494
495
496
497
498
499
500
501
502
503
504
505
506
507
508
509
510
511
512
513
514
515
516
517
518
519
520
521
522
523
524
525
526
527
528
529
530
531
532
533
534
535
536
537
538
539
540
541
542
543
7B R A I N R E S E A R C H X X ( 2 0 1 1 ) X X X – X X X
works, many studies have noted a task-related decrease inalpha power. This finding was so pervasive that alpha powerhas come to be considered as correlate of “idling” and a reversemeasure of activation (Adrian and Matthews, 1934). Later, theidling hypothesis has been largely overtaken by a frameworkwhere the amplitude of alpha oscillations reflects a level ofcortical inhibition (Klimesch, 1996; Klimesch et al., 2007;Pfurtscheller, 2003). From such point of view, deactivationshould be associated with an increase of alpha power,whereas activation should be associated with a decrease ofalpha power. Indeed, in some studies the BOLD signal hasbeen shown to correlate negatively with EEG power in thealpha band (Goldman et al., 2002; Moosmann et al., 2003, butsee Laufs et al., 2003b; Mantini et al., 2007). Accordingly, it issuggested that DMN alpha blocking should be more pro-nounced in tasks requiring self-referential thought and socialcognition (Panksepp and Northoff, 2009). Indeed, this studydata show that at least in one part of the DMN, namely in itsposterior hub including precuneus and posterior cingulate, thedynamics of alpha band blocking during virtual social in-teractions shows the best (with respect to other spatialpatterns) correspondence to an idealized reference function.This evidence appears to suggest that self-referential process-es are accompanied with alpha blocking in the posterior DMNhub. This reasoning absolutely fails however if we try to applyit to the rest with eyes closed data where self-referentialthought appears to be associatedwith alpha power increase inthe same brain regions (note that spatial correlation betweenthe two spatial patterns is 0.81). Contradictory as thesefindings may seem, they are in line with many publishedobservations.
Indeed, in spite of pervasive findings of task-relateddecrease in alpha power, there have been observations oftask-related increase in alpha power. Noteworthy, most ofthese observations were made in such states as mentalimagery, imagination, or internal attention (e.g. Cooper et al.,2003; 2006; Klinger et al., 1973; Ray and Cole, 1985a; b).Klimesch et al. (2007) suggested that alpha synchronizationmay reflect top-down control processes, whereas alphadesynchronization reflects bottom-up release of this inhibi-tory control. These data posit a direct and active role for alphaoscillations in the mechanisms of attention and conscious-ness (Palva and Palva, 2007). On the whole, it could besummarized that internal mental processes are frequentlyassociated with an increase of alpha power. This increase isparalleled by an inhibition of sensory perception and de-creased attention. Contrariwise, states of increased attentionand sensory perception are associated with a decrease inalpha power (and, naturally, with a disruption of internalmental processes). Thus, alpha power appears to correlatepositively with internal mental processes and negatively withattention to the external world and processing of sensoryinformation. However, as Palva and Palva (2007) rightly note,alpha phase relationships with the stimulus and with otheroscillations should be taken into account when consideringtheir possible functional significance. The above descriptionrelates only to spontaneous and the so-called induced (notstimulus phase-locked) alpha activity. Quite different picturearises when we consider evidence related to the so-calledevoked (stimulus phase-locked) alpha responses, which
Please cite this article as: Knyazev, G.G., et al., The default mcomponent analysis, Brain Res. (2011), doi:10.1016/j.brainres.201
correlate positively with specific sensory processes (Basar,1998; 1999; Dinse et al., 1997; Silva et al., 1991). If one takes intoaccount that, according to the most currently popular view(e.g., Jansen et al., 2003; Klimesch et al., 2004; Makeig et al.,2002), evoked oscillations arise due to partial phase locking ofongoing oscillations (i.e. resetting of the alpha phases afterstimulation), the whole picture seems to correspond to thefollowing pattern. In states associated with internal mentalprocesses alpha activity is increased. This alpha powerincrease has arguably functional significance, i.e., participatesin the integration of relevant cortical areas and simultaneous-ly inhibits irrelevant ones (i.e., those areas that may supply aninput which is apt to interrupt the ongoing mental process)(Klimesch et al., 2007). This explains as to why enhancedbackground alpha oscillations correlate positively with mem-ory (Klimesch et al., 2003), but negatively with visualdiscrimination (Hanslmayr et al., 2005) performance. Recently,Jensen et al. observed that visual discriminability of athreshold stimulus decreased with an increase in pre-stimulus occipito-parietal alpha band power (van Dijk et al.,2008). Likewise, they reported that in a go-no-go task falsealarms were preceded by higher levels of alpha band power inthe occipital cortex and bilateral somatosensory cortices ascompared to correct withholds on no-go trials (Mazaheri et al.,2009). All these data could be easily accounted for by admittingalpha power as a correlate of the stream of thoughts.Appearance of a sensory event disrupts this stream alongwith ongoing alpha oscillations in relevant cortical areas (i.e.,in cortical areas that are involved in the adequate processingof this particular event), but also causes their partial phaselocking to the sensory event. Presumably, these phase-lockedalpha responses also have functional significance, i.e., inte-grate neural populations participating in the event processing.
Such interpretation implies that synchronization of inter-nal mental processes, as opposed to the processing ofexteroceptive stimuli, might be considered as the primaryfunction of alpha oscillations. No wonder then that theydominate EEGs of human beings (Basar and Guntekin, 2009;Knyazev and Slobodskaya, 2003) whose internal life ispresumably much richer than that of lower mammals. Insuch capacity alpha oscillations are bound to be related toactivity of the DMN, which mostly operates in absence ofexternal stimuli. Last but not least, most DMN researchersemphasize its intimate link with memory. Alpha oscillationsare also associated with memory (Klimesch, 1996; Klimesch etal., 2004). Klimesch et al. (2008) suggest that associated withalpha oscillations ‘operating system’may operate under directtop-down control or in an ‘automated,’ ‘default’-like mode.
During the eyes closed resting condition, DMN-related self-referential thought and social cognition are preferentiallyassociated with (enhanced) alpha oscillations. Appearance ofrelevant to the DMN's function stimuli (face stimuli in contextof the social game task) disrupts ongoing alpha oscillations.The observed spatio-temporal pattern of this alpha blockingimplies that repeated transitions from restingmode to stimuliprocessing within the posterior DMN hub constitute the mostprominent feature characteristic of oscillatory responses tothis experimental situation. It is not the case in the otherexperimental situation, namely, the explicit judgment task. Inthis case other temporally correlated networks appear to play
ode network and EEG alpha oscillations: An independent1.05.052
Original text:
Inserted Text
","
Original text:
Inserted Text
" and"
Original text:
Inserted Text
", 1985b"
Original text:
Inserted Text
","
Original text:
Inserted Text
"and colleagues "
Original text:
Inserted Text
"’"
544
545
546
547
548
549
550
551
552
553
554
555
556
557
558
559
560
561
562
563
564
565
566
567
568
569
570
571
572
573
574
575
576
577
578
579
580
581
582
583
584
585
586
587
588
589
590
591
592
593
594
595
596
597
598
599
600
601
602
603
604
605
606
607
608
609
610
611
612
613
614
615
616
617
618
619
620
621
622
623
624
625
626
627
628
629
630
631
632
633
634
635
636
637
638
639
640
641
642
643 Q5
644
645
646
647
648
649
650
651
652
653
654
655
656
657
658
659
660
661
662
663
8 B R A I N R E S E A R C H X X ( 2 0 1 1 ) X X X – X X X
the leading part. In particular, brain networks associated withconscious recognition of visual patterns (the ventral visualstream, Goodale and Milner, 2008) and the left hemisphereareas involved in classification of visual stimuli in terms ofverbal representations appear to be most task-relevant(Knyazev et al., 2009). The blocking of ongoing alpha oscilla-tions upon appearance of relevant to the DMN's functionstimuli is paralleled by (actually is preceded with, see Fig. 1) aphase-locked to the stimulus response. This presumablymeans the stimulus resets phase of a (minor) part of alphaoscillators in such a way that they start to oscillate incoherence with each other and the stimulus mode. At thesame time the stimulus disrupts synchrony of other oscilla-tors so that they start to oscillate in asynchrony with eachother and the stimulus mode. Although the most task-relatedspatial pattern of evoked alpha responses did not show thehighest correlation to the DMN template, it substantiallyoverlaps with its posterior hub. Indeed, the posterior cingulatecortex constituting its major part is the “heart” of the DMN(Fransson and Marrelec, 2008). Although mostly speculative,the interpretation linking alpha oscillations with the DMN hasrecently received a support in a study by Jann et al. (2009) whohave shown that the BOLD correlates of global alpha bandsynchronization in a resting state are located in brain areasinvolved in the DMN.
Finally, some limitations and dim points need to bediscussed. The most considerable limitation relates to thefact that EEG source localization and ICA were performed onthe basis of a somewhat sparse 32 electrodes array. Numerousstudies show that localization accuracy improves with in-creasing number of recording electrodes (e.g., Krings et al.,1999; Laarne et al., 2000; Lantz et al., 2003). ICA decompositionmethods generally also require sufficient number of electrodesfor reliable and valid component extraction. One could arguehowever that 32 electrodes are sufficient, so long as there isapproximately homogenous scalp coverage as is the case inthis study (see Fig. 4S). Thus, Congedo (2006) has shown bypoint spread function simulations that using an approximatehead model sLORETA is capable of exact localization of singledipoles with as few as six electrodes (given the spatialsampling of the scalp is appropriate). Simulation data showthat using 32 electrodes instead of 19 improves the localizationby 2.7 mm on average, while using 63 instead of 32 electrodesleads to improvements of less than 1 mm (Yvert et al., 1997).Therefore, 32 electrodes array could be considered a tradeoffbetween acceptable localization accuracy and reasonableprice. Indeed, although high density electrode arrays areincreasingly becoming available, many recently publishedstudies using source localization and ICA (separately or incombination with each other) still use 32 or less electrodesarrays (e.g., Congedo et al., 2010; Marco-Pallares et al., 2005;Musso et al., 2010; Travis et al., 2010 and many others).Importantly, increasing the number of electrodes increasesthe spatial resolution, that is, the ability to resolve two closely-spaced dipoles, not the localization ability (Congedo, 2006). Itcouldbe argued that high spatial resolution is notnecessary forthe localization of such widespread network as DMN. More-over, localization error which might arise due to sparseelectrode array is random by nature and should average outin a large-sample group analysis (as is the case in this study),
Please cite this article as: Knyazev, G.G., et al., The default mcomponent analysis, Brain Res. (2011), doi:10.1016/j.brainres.201
especially when using the group ICA, because it directlyestimates components that are consistently expressed in thepopulation and ignores idiosyncratic and random features(Calhoun et al., 2001; Schmithorst and Holland, 2004). Finally,in a reasonably large sample, a randomerrormay decrease thesignal-to-noise ratio, which would result in decreasing theprobability to find a statistically significant effect. That meansthat negative results reported in this study (i.e., absence ofsignificant associations related to delta, theta, beta, andgamma bands and to the anterior DMN hub) should be treatedwith caution and need to be confirmed in further studies usingdenser electrode arrays. However, positive findings related toalpha band could hardly be attributed to errors arising due toinaccurate localization in the 3D space. Besides, spatiallocalization of significant correlations of e.g. SRTS scoreswith alpha power is similar at all analysis levels, i.e., in rawchannel data beforeapplicationof sLORETAand ICA (Fig. 1S), insLORETA 3D data (Fig. 3S), and in ICs derived from 3Dmatrices(Fig. 1).
Second limitation relates to the fact that the data from 32channels are cleaned with ICA in EEGLAB, projected into amuch higher-dimensional space, and then submitted forindependent component analysis. This procedure may poten-tially artificially stretch the content of the data and lead toappearance of spurious components. To diminish suchpossibility, we always retained at least 20 components duringartifact rejection and extracted no more than 20 componentsin the GIFT analysis. Moreover, all components that showedhighest spatial correlation to the DMN template were statis-tically significant across subjects. Basing on this we could bereasonably confident that our results are not just an artifact.Besides, it seems highly improbable that spurious artifactualcomponents may simultaneously show high correlations toboth spatial and functional criteria both of which are takenfrom completely different areas of research (i.e., fMRI and PETstudies). Nevertheless, in order to cross-validate our resultswe have conducted another analysis which may not bereported here in detail due to space limitation. In this analysiswe tried to overcome potential pitfalls associated with thestep of performing ICA on 3D inverse LORETA solution. In thiscase temporal group ICA was performed on filtered fivefrequency bands in the 2D EEG data using Group ICA of EEGtoolbox (EEGIFT, Version 1.0c; http://icatb.sourceforge.net/).Extracted ICs were then submitted for sLORETA and theirspatial 3D images were imported into the Group spatial ICA forfMRI toolbox for the analysis identical to the one described inthis paper. These ICs showed generally lower correlationswith the DMN template than the ICs derived from 3D data.However, in spite of some minor deviations, the generalpattern of results was similar to the one reported here. Thus,only in the alpha band of frequencies were found componentsthat simultaneously showed high spatial correlation to theDMN template and high “task-relatedness.” Moreover, thesecomponents also showed high correlation to the PH templateand low correlations to the FH template.
Thirdly, in spite of the fact that spatial correlations ofobtained ICs with the DMN template are comparable in sizewith those reported in relevant fMRI studies, the spatialdistribution of these ICs differs from the typical fMRI-DMNpattern. Themain difference is the complete lack of structures
ode network and EEG alpha oscillations: An independent1.05.052
Original text:
Inserted Text
"negative results "
Original text:
Inserted Text
"positive findings "
Original text:
Inserted Text
"r"
Original text:
Inserted Text
"five frequency bands "
Original text:
Inserted Text
"."
Original text:
Inserted Text
"’"
Original text:
Inserted Text
"a coherent"
Original text:
Inserted Text
"ous"
Original text:
Inserted Text
"ve"
Original text:
Inserted Text
"Most "
Пользователь
Записка
Rejected установлено Пользователь
Пользователь
Вычеркивание
Пользователь
Вычеркивание
Пользователь
Вычеркивание
Пользователь
Вставить текст
2S
664
665
666
667
668
669
670
671
672
673
674
675
676
677
678
679
680
681
682
683
684
685
686
687
688
689
690
691
692
693
694
695
696
697
698
699
700
701
702
703
704
705
706
707
708
709
710711
712
713
714
715
716
717
718
719Q6
720
721
722
723
724
725
726
727
728
729
730
731
732
733
734
735
736737
738
739
740
741
742
743
744
745
746
747
748
749
750
751
752
753
754
755
756
757
758
759
760
761
762
9B R A I N R E S E A R C H X X ( 2 0 1 1 ) X X X – X X X
belonging to the frontal DMN hub. Whether these discrepan-cies arise because the physiology and mechanics of EEG andfMRI measurements are fundamentally different such thateach method locally emphasizes or underestimates the samepatterns of activity in a different way, or these discrepanciesappear due to above discussed methodological limitationsremains as yet unclear.
Fourthly, the interpretation of the results may not be asstraightforward as it appears from the above discussion.Particularly, it would be wrong to conclude that self-referential thought and social cognition are the maincorrelates of alpha activity. They might be but one amongother kinds of internal mental processes that correlate withenhanced alpha oscillations. Moreover, DMN activity isclearly not limited to alpha oscillations. In this study,statistically significant components showing moderate spa-tial correlation with the DMN template were found in allfrequencies, but they did not show highest, relative to othercomponents, correlations with selected reference functions.It should be taken into account however that selectedfunctional correlates of DMN activity reflect only few fromdescribed in the literature presumptive DMN functions.Thus, self-referential thought was measured by just threeitems and social interactions were modeled by a specificsocial game that is not identical to experimental manipula-tions used in most relevant PET and fMRI studies. The socialgame task requires dynamic decisions and behavioral re-sponses, which are absent in such tasks as the moraldilemma task (Harrison et al., 2008), or passive watching ofvideos (Krämer et al., 2010). Moreover, the explicit judgmenttask, which we used for comparison, is not attentionally orcognitively demanding, which is a prerequisite for causingDMN deactivation (McKiernan et al., 2006; Singh and Fawcett,2008). Further research is required to test whether regular-ities observed in this study hold on across other relevantexperimental contexts. It is quite possible that some otherexperimental conditions relevant to presumptive DMNfunctions would allow unrevealing the contribution ofother frequency bands to DMN activity. Particularly thetaand beta seem most likely candidates (Laufs et al., 2003b;Scheeringa et al., 2008), or broadband EEG signatures(Mantini et al., 2007). Furthermore, further research shouldnot be limited to the analysis of oscillation amplitudes.Investigation of phase relationships in different frequencybands within putative DMN regions seems very promising(see Palva and Palva, 2007).
763
764
765
766
767
768
769
770
771
772
773
774
775
776
4. Conclusion
In this study, we deliberately chose analytical approaches thatare routinely used in fMRI research and applied them to theanalysis of EEG data. In this endeavor, we were motivated by adesire to try to reproduce major DMN-related findings in EEGdomain. In particular, wewere interested to test whether blinddecomposition methods like ICA are able to identify in 3D-reconstructed EEG data spatial patterns resembling the DMNas it is described in PET and fMRI studies. Further we intendedto test a degree of task-relatedness identified in traditionalEEG frequency bands spatial patterns. In spite of evident
Please cite this article as: Knyazev, G.G., et al., The default mcomponent analysis, Brain Res. (2011), doi:10.1016/j.brainres.201
inherent to EEG data limitations, such as low spatial resolutionand low signal to noise ratio, the applied analytical ap-proaches allowed us to reproduce at least some of DMNspatial features and reveal functional correlates that arebroadly compatible with those described in relevant PET andfMRI studies. It appears that, comparative to other frequencybands, alpha oscillations are most robustly associated withDMN-related functional outcomes. The whole pattern ofresults fits to a hypothesis that spontaneous (“default”) self-referential mental processes are associated with enhancedwithin the posterior DMN hub alpha activity, whereas proces-sing of DMN function-related external stimuli disrupts syn-chrony of these spontaneous oscillations but simultaneouslycauses their partial phase-locking to the external events.
5. Experimental procedures
5.1. Subjects
Resting state and the social game data were collected in asample of 48 subjects (26 men and 22 women, age range 18 to30 years). In the explicit emotion judgment task the sampleincluded 40 participants (19 men and 21 women; age range 17to 32 years). Both samples consisted of healthy, right-handedvolunteers with normal or corrected to normal vision whoreceived a sum equivalent to about 5% of the monthly livingwage for participation. All applicable subject protectionguidelines and regulations were followed in the conduct ofthe research in accordance with the Declaration of Helsinki.All participants gave informed consent to the study. The studyhas been approved by the Institute of Physiology ethicalcommittee.
5.2. Instruments and procedures
During the experiment the subjects sat in a soundproof anddimly illuminated room. The spontaneous EEG registrationlasted about 6 min and included alternating 2 min intervalswith eyes open and eyes closed. Just after the spontaneousEEG registration participants were asked to fill out a briefquestionnaire describing their state and thoughts during thepreceding period. Three items from this questionnaire wereselected to measure individual variation in the degree of self-referential thought and social cognition. “During the proce-dure I (1) recollected pleasant episodes of relationships withmy boy/girl-friend; (2) thought of something pleasant that Iexpect in the near future; (3) recollected episodes from myown life.” All itemsweremeasured on a five-point Likert scale.The self-referential thought scale (SRTS) showed high internalconsistency reliability (Cronbach's alpha=0.85).
In both experimental tasks we used as stimulation anensemble of the photographs presented by Ekman and Friesen(1976). We selected 30 photographs, specifically, 5 differentfemales and 5 different males with 3 different facial expres-sions (angry, happy, and neutral). The pictureswere presentedblack and white (17×17 cm) and displayed on a screen at adistance of 120 cm from the subjects. In both experiments,first, a fixation cross appearedat the center of the screen for 1 s.Then a face picture was presented. Angry, happy, and neutral
ode network and EEG alpha oscillations: An independent1.05.052
Original text:
Inserted Text
"regularities "
Original text:
Inserted Text
"of "
Original text:
Inserted Text
"."
Original text:
Inserted Text
"c"
Original text:
Inserted Text
"ec"
Original text:
Inserted Text
"Either"
Original text:
Inserted Text
","
Original text:
Inserted Text
";"
Original text:
Inserted Text
":"
Original text:
Inserted Text
"\"
Original text:
Inserted Text
"’"
Пользователь
Записка
Rejected установлено Пользователь
Пользователь
Вычеркивание
Пользователь
Вставить текст
of spatial patterns identified in the traditional EEG frequency bands
777
778
779
780
781
782
783
784
785
786
787
788
789
790
791
792
793
794
795
796
797
798
799
800
801
802
803
804
805
806
807
808
809
810
811
812
813
814
815
816
817
818
819
820
821
822
823
824
825
826
827
828
829
830
831
832
833
834
835
836
837
838
839
840
841
842
843
844
845
846
847
848
849
850
851
852
853
854
855
856
857
858
859
860
861
862
863
864
865
866
867
868
869
870
871
872
873
874
875
876
877
878
879
880
881
882
883
884
885
886
887
888
889
890
10 B R A I N R E S E A R C H X X ( 2 0 1 1 ) X X X – X X X
faces were delivered randomly, and inter-stimulus-intervalrandomly varied between 4 and 7 s. The number of facestimulations was 150 for each subject, including 50 faces ofeach category. In the explicit judgment task, participants wereinstructed to evaluate emotional expression of each presentedface on an analog scale ranging from −100 (very hostile) to 100(very friendly). The face picture was present at the screen for4 s, and was followed by presentation of the evaluative scale.
In the social game task, participants were asked to imaginethat faces, which they will see at the screen, are living personswhom they have to interact with. They had to choose one outof three options: “attack,” “avoid,” or “make friends” (pressing“1,” “2,” or “3” button, respectively). “Vis-à-vis” “reaction”might be different depending on his/her “character.” As aresult, the participant gained or lost points which afterwardswere added or, respectively, subtracted from his/her fee. Inreality, all avoidances received neither reward no punishment(zero points), whereas aggressive and friendly choices wererandomly rewarded or punished with a fixed number ofpoints. After the button press, a feedback announcementappeared at the screen for 1 s, such as “0 points,” “+20 points,”or “−20 points.”After both experiments the subjects filled out aset of psychometric questionnaires and were debriefed.
5.3. EEG recording
Thirty-two EEG electrodes were placed on the subject's scalp.The electrodesweremounted in an elastic cap on the positionsof the international 10–20 systemwhich ensured homogenousscalp coverage (Fig. 4S). A mid-forehead electrode was theground. The electrode resistance was maintained below 5 kΩ.The signals were amplified with a multichannel biosignalamplifier with bandpass 0.05–70 Hz, −6 dB/octave and contin-uously digitized at 300 Hz. The electrodes were referred tolinked-mastoids. The horizontal and vertical EOGs wereregistered simultaneously. EEG data were artifact-correctedusing Independent Components Analysis via EEGLAB toolbox(http://www.sccn.ucsd.edu/eeglab/) retaining minimally 20out of 30 components and recomputed to average reference.
5.4. sLORETA
For eyes open and eyes closed resting condition artifact-freeepochs of 1.7 s duration were supplied for cross-spectrumcalculation in sLORETA. For analysis of induced oscillations,for each single-trial experimental data, cross-spectra werecalculated separately for reference (−750 to −100 ms prior tofixation cross presentation) and test (100–750 ms after the facestimulus presentation) intervals. For analysis of evokedoscillations, EEG data were averaged across trials and submit-ted for cross-spectrum calculation in sLORETA. Subsequentlycurrent source densities of delta (2–4 Hz), theta (4–8 Hz), alpha(8–12 Hz), beta (12–30 Hz), and gamma (30–45 Hz) oscillationswere estimated in sLORETA. For more details of sLORETAanalysis see Supplementary data.
5.5. Independent component analysis
Blind source separation techniques are increasingly becom-ing popular in EEG research. The scalp EEG samples a
Please cite this article as: Knyazev, G.G., et al., The default mcomponent analysis, Brain Res. (2011), doi:10.1016/j.brainres.201
volume-conducted, spatially degraded version of the elec-trical activity, where the potential at any location andlatency can be considered a mixture of multiple indepen-dent time-courses that stem from large-scale synchronousfield potentials (Makeig et al., 2004a; Onton et al., 2006).Temporal unmixing of the EEG by means of ICA potentiallyallows studying the process of interest buried in the spreadof other, unrelated sources. In EEG research, ICA is usuallyapplied to the raw EEG signal of each subject. Obtainedindependent components (ICs) are said to represent temporallyindependent signal sources and have scalp maps that nearlyperfectly match the projection of a single equivalent braindipole (Delorme and Makeig, 2004). Such approach is perfectlysuited for studying relatively local (spatially and temporally)processes (e.g., related to a single ERP component), but are lesssuitable for studyingwidely spatiallydistributednetworks, suchas the DMN. Besides, following ICA, there is no natural and easyway to identify a component from one subject with acomponent from another subject. Thus, the problem ofidentifying equivalent components across subjects (which isnecessary for making population inferences) is non-trivial(Makeig et al., 2004b). Unlike univariate methods such as thegeneral linear model, ICA is not naturally suited to generalizeresults from a group of subjects. There are two strategies toallow for matching of independent components across in-dividuals: one is to combine individual ICs across subjects withclustering techniques (Esposito et al., 2005; Onton et al., 2006).This implemented in EEGLAB toolbox approach makes itpossible to summarize results of ICA-based analysis acrossmore than one condition from a large number of subjects.However, it may hardly solve the problem of identifying DMN-related spatial patterns across subjects. Another approach is tocreate aggregate data containing observations fromall subjects,estimate a single set of ICs and then back-reconstruct these inthe individual data (Calhoun et al., 2001; Schmithorst andHolland, 2004).We adopted the latter strategy for the group EEGtemporal ICA analysis, because it directly estimates compo-nents that are consistently expressed in the population, in-volves the least amount of user interaction and isstraightforward to compare with the existing framework forgroup ICA of fMRI data (Calhoun et al., 2001). Therefore, adoptedin this study strategywas to (1) calculate using sLORETA currentsource density of the five EEG frequency bands for each of 6430brain voxels and (2) to apply group ICA to obtained 3D data in afashion that is routinely used in fMRI research.
For the analysis of induced oscillations, for each condi-tion of each subject a set of first 50 trials was selected. Thisimplied selection of 50 test and 50 respective referenceinterval data. For resting condition 50 successive epochswere selected. A more complex approach had to be appliedfor the analysis of evoked oscillations, because they havelow amplitude in comparison with the background EEGactivity and in consequence, they are hardly visualized inthe single-trials. To constrain the single trial EEGs to thetime-frequency features relevant for the evoked activity,each subject's 100 first single-trials were first wavelet-denoised using EP_den v2 software package developed byQuian Quiroga (Quian Quiroga and Garcia, 2003) (http://www.vis.caltech.edu/~rodri) and subsequently submittedfor sLORETA cross-spectra calculation.
ode network and EEG alpha oscillations: An independent1.05.052
Original text:
Inserted Text
"ec"
Original text:
Inserted Text
","
Original text:
Inserted Text
","
Original text:
Inserted Text
","
Original text:
Inserted Text
","
Original text:
Inserted Text
"’"
Original text:
Inserted Text
"."
Original text:
Inserted Text
"ec"
Original text:
Inserted Text
":"
Original text:
Inserted Text
","
Original text:
Inserted Text
","
Original text:
Inserted Text
"."
Original text:
Inserted Text
"ec"
Original text:
Inserted Text
"EP_den v2 software package "
Original text:
Inserted Text
"\"
Original text:
Inserted Text
"\"
Original text:
Inserted Text
"-"
Original text:
Inserted Text
"32 "
Original text:
Inserted Text
" kOhms"
Original text:
Inserted Text
" - "
Original text:
Inserted Text
"-"
Original text:
Inserted Text
"as"
Original text:
Inserted Text
"’"
Пользователь
Вычеркивание
Пользователь
Вставить текст
32
891
892
893
894
895
896
897
898
899
900
901
902
903
904
905
906
907
908
909
910
911
912
913
914
915
916
917
918
919
920
921
922
923
924
925
926
927
928
929
930
931
932
933
934
935
936
937
938
939
940
941
942
943
944
945
946
947
948
949
950
951
952
953
954
955
956
957
958
959
960
961
962
963
964
965
966
967
968
969
970
971
972
973
974
975
976
977
978
979
980
981
982
983
984
985
986
987
988
989
990
991
992
993
994
995
996
997
998
9991000 Q8
1001
10021003
1004
1005
1006
11B R A I N R E S E A R C H X X ( 2 0 1 1 ) X X X – X X X
After sLORETA transformation, for each experimental taskand each frequency band, each subject's and each trial'ssLORETA images were converted into the Neuroimaging Infor-matics Technology Initiative (NIFTI) format using modified bythe first author LOR2SPM function by Sergey Pakhomov (http://www.ihb.spb.ru/~pet_lab/L2S/L2SMain.htm). Subsequently, inthe case of induced oscillations, for each frequency band andeachsubject, anarrayof100 fileswasconstructedbyconsecutiveconcatenation of respective reference and test interval images(this stage was skipped for resting and evoked EEG data). In thisstudy, ICA was performed using the Group spatial ICA for fMRItoolbox (GIFT, Version 1.3b; http://icatb.sourceforge.net/), usingmethods and algorithms described in recent studies (Calhoun etal., 2001; 2004). Briefly, for each experimental condition andeachfrequency band, a single Group ICA was performed at the grouplevel after subject-wise data concatenations, and back recon-struction of single-subject time courses and spatial maps fromthe raw data matrix (Calhoun et al., 2001). The number ofextracted components was estimated from the data using theminimum description lengths (MDL) criteria. For differentdatasets this number varied from 20 to 28, so in all cases wedecided to extract 20 components. ICASSO toolbox (http://www.cis.hut.fi/projects/ica/icasso/) was used inGIFT to determine thereliability of ICA algorithm. ICA algorithm was run 10 times onInfomax algorithm to determine the algorithmic reliability orstability. In total, thirty sets of results (6 sets of data×5 frequencybands) were generated that were investigated further withstatistical comparisons. For each set of results, we identified astatistically significant spatial pattern of temporally correlatedactivity (an independent component) that reproduced themajoranatomical features of the DMN. To reduce observer bias in theselection of independent component patterns, we performed aspatial sorting analysis in GIFT. For each respective set of GroupICA results, independent components were spatially correlatedwith an anatomically defined default mode template and wererankedaccording to a “highest correlation” criterion (Pearson's r)with this anatomy (for a similar approach seeGarrity et al., 2007;Greicius et al., 2004; Harrison et al., 2008). In this study,weused aDMN template that was created by GIFT developers and issuppliedwith theGIFTpackage (the ref_default_mode.nii file). Thistemplate has been used in a published research (Garrity et al.,2007) and was generated by WFU Pickatlas developed at WakeForest Pharmaceuticals University (http://www.fmri.wfubmc.edu/). According to the description, it contains the posteriorparietal cortex (Brodmann'sarea7), the frontal pole (Brodmann'sarea 10), and theoccipito-parietal junction (Brodmann's area 39),as well as the posterior cingulate and precuneus (Garrity et al.,2007). This template was smoothed with a 3-mm3 Gaussiankernel. We created two additional templates using the WakeForest Pick atlas toolbox. These templates were created to allowseparate measurements for the two major DMN hubs—thefrontal and the posterior hub. The frontal hub (FH) templateincluded the superior frontal gyrus (BAs 8/9/10) and the anteriorcingulate cortex (BAs 11/32). The posterior hub (PH) templateincluded the posterior parietal cortex (Brodmann's area 7), theoccipito-parietal junction (Brodmann's area 39), the posteriorcingulate, and the precuneus.
The similarity indiceswith a templatewere computed basedon positive (after Z-transformation) loads. One-sample (withincondition) T-tests in SPM5 were used to assess the statistical
Please cite this article as: Knyazev, G.G., et al., The default mcomponent analysis, Brain Res. (2011), doi:10.1016/j.brainres.201
significance of each identified default mode network pattern.For a particular pattern, each subject's respective independentcomponent image (z score spatial map) was entered into asecond-level random-effects analysis and assessed statisticallyusing a threshold of PFDR=0.05 (whole-brain corrected) andminimum cluster size of 8 contiguous voxels.
After the initial spatial identification of networks, atemporal sorting analysis was performed in GIFT to determinethe degree of “task-relatedness” of the default mode networkpatterns in the five frequencybands. For each set of ICA results,the associated time course for all ICs was correlated with anidealized reference function (task waveform) of the fivefrequency bands. For induced responses the reference func-tions were constructed for each subject and each frequencyband separately by calculating the time courses, that is, arraysof 100 values (one for each of the alternating reference and testinterval epochs) of the current source density in a voxelshowing maximal T value in a respective sLORETA test vs.reference interval contrast. These reference functions allowedto evaluate in a within-subject manner the degree of “task-relatedness” of each of respective 20 components.
Such approach was not possible for resting conditionwhere only a between-subject measure of “task-relatedness”(a subjective evaluation by each subject of his/her preoccupa-tion with presumably DMN function-related thoughts duringEEG registration, that is, SRTS scores) was available. In thiscase, first, for each of 20 ICs generated for each frequency bandof the eyes open and eyes closed resting condition, a voxelshowingmaximal T value in the respective one-sample-T-testanalysis was identified. Next, for each IC, this voxel's value ina respective independent component image was identified foreach subject. Third, a correlation between these values andSRTS scores was calculated across subjects. For each frequen-cy band within each condition this produced 20 correlations.Therefore, Bonferroni correction (0.05/20=0.0025) was appliedto correct for multiple comparisons.
For evoked oscillations data, for each denoised trial of eachsubject, in the time interval between 100 and 500 ms poststimulus presentation onset, amplitudes of maximal positiveand negative peaks in each channel data were summed. Foreach subject this procedure produced a matrix of valueswhose dimensions were equal to the number of trials×num-ber of channels. These matrices were further used as areference function for temporal sorting analysis using theGIFT software.
Supplementarymaterials related to this article can be found,in the online version, at doi: 10.1016/j.brainres.2011.05.052.
6. Uncited reference
Knyazev, 2007
Acknowledgments
This work was supported by a grant of the Russian Foundationfor Basic Research (RFBR) No. 11-06-00041-a. Authors aregrateful to Srinivas Rachakonda for helpwith theGIFT software.
ode network and EEG alpha oscillations: An independent1.05.052
Original text:
Inserted Text
". net/"
Original text:
Inserted Text
"e"
Original text:
Inserted Text
"’"
Original text:
Inserted Text
"’"
Original text:
Inserted Text
","
Original text:
Inserted Text
"x"
Original text:
Inserted Text
"’"
Original text:
Inserted Text
"’"
Original text:
Inserted Text
"’"
Original text:
Inserted Text
"’"
Original text:
Inserted Text
" – "
Original text:
Inserted Text
"’"
Original text:
Inserted Text
"’"
Original text:
Inserted Text
"’"
Original text:
Inserted Text
"\"
Original text:
Inserted Text
"’"
Original text:
Inserted Text
"x"
Original text:
Inserted Text
" online "
Original text:
Inserted Text
"№ "
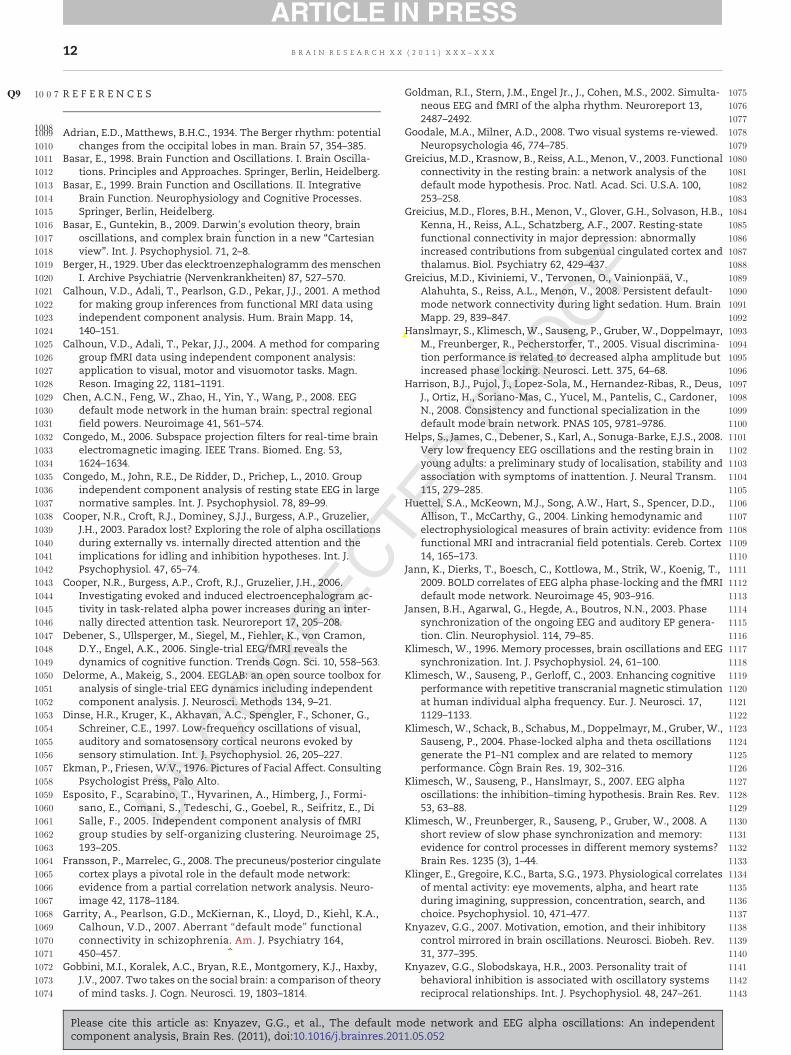
10 0 7Q9
10081009
1010
1011
1012
1013
1014
1015
1016
1017
1018
1019
1020
1021
1022
1023
1024
1025
1026
1027
1028
1029
1030
1031
1032
1033
1034
1035
1036
1037
1038
1039
1040
1041
1042
1043
1044
1045
1046
1047
1048
1049
1050
1051
1052
1053
1054
1055
1056
1057
1058
1059
1060
1061
1062
1063
1064
1065
1066
1067
1068
1069
1070
1071
1072
1073
1074
1075
1076
1077
1078
1079
1080
1081
1082
1083
1084
1085
1086
1087
1088
1089
1090
1091
1092
1093
1094
1095
1096
1097
1098
1099
1100
1101
1102
1103
1104
1105
1106
1107
1108
1109
1110
1111
1112
1113
1114
1115
1116
1117
1118
1119
1120
1121
1122
1123
1124
1125
1126
1127
1128
1129
1130
1131
1132
1133
1134
1135
1136
1137
1138
1139
1140
1141
1142
1143
12 B R A I N R E S E A R C H X X ( 2 0 1 1 ) X X X – X X X
R E F E R E N C E S
Adrian, E.D., Matthews, B.H.C., 1934. The Berger rhythm: potentialchanges from the occipital lobes in man. Brain 57, 354–385.
Basar, E., 1998. Brain Function and Oscillations. I. Brain Oscilla-tions. Principles and Approaches. Springer, Berlin, Heidelberg.
Basar, E., 1999. Brain Function and Oscillations. II. IntegrativeBrain Function. Neurophysiology and Cognitive Processes.Springer, Berlin, Heidelberg.
Basar, E., Guntekin, B., 2009. Darwin's evolution theory, brainoscillations, and complex brain function in a new “Cartesianview”. Int. J. Psychophysiol. 71, 2–8.
Berger, H., 1929. Uber das elecktroenzephalogrammdesmenschenI. Archive Psychiatrie (Nervenkrankheiten) 87, 527–570.
Calhoun, V.D., Adali, T., Pearlson, G.D., Pekar, J.J., 2001. A methodfor making group inferences from functional MRI data usingindependent component analysis. Hum. Brain Mapp. 14,140–151.
Calhoun, V.D., Adali, T., Pekar, J.J., 2004. A method for comparinggroup fMRI data using independent component analysis:application to visual, motor and visuomotor tasks. Magn.Reson. Imaging 22, 1181–1191.
Chen, A.C.N., Feng, W., Zhao, H., Yin, Y., Wang, P., 2008. EEGdefault mode network in the human brain: spectral regionalfield powers. Neuroimage 41, 561–574.
Congedo, M., 2006. Subspace projection filters for real-time brainelectromagnetic imaging. IEEE Trans. Biomed. Eng. 53,1624–1634.
Congedo, M., John, R.E., De Ridder, D., Prichep, L., 2010. Groupindependent component analysis of resting state EEG in largenormative samples. Int. J. Psychophysiol. 78, 89–99.
Cooper, N.R., Croft, R.J., Dominey, S.J.J., Burgess, A.P., Gruzelier,J.H., 2003. Paradox lost? Exploring the role of alpha oscillationsduring externally vs. internally directed attention and theimplications for idling and inhibition hypotheses. Int. J.Psychophysiol. 47, 65–74.
Cooper, N.R., Burgess, A.P., Croft, R.J., Gruzelier, J.H., 2006.Investigating evoked and induced electroencephalogram ac-tivity in task-related alpha power increases during an inter-nally directed attention task. Neuroreport 17, 205–208.
Debener, S., Ullsperger, M., Siegel, M., Fiehler, K., von Cramon,D.Y., Engel, A.K., 2006. Single-trial EEG/fMRI reveals thedynamics of cognitive function. Trends Cogn. Sci. 10, 558–563.
Delorme, A., Makeig, S., 2004. EEGLAB: an open source toolbox foranalysis of single-trial EEG dynamics including independentcomponent analysis. J. Neurosci. Methods 134, 9–21.
Dinse, H.R., Kruger, K., Akhavan, A.C., Spengler, F., Schoner, G.,Schreiner, C.E., 1997. Low-frequency oscillations of visual,auditory and somatosensory cortical neurons evoked bysensory stimulation. Int. J. Psychophysiol. 26, 205–227.
Ekman, P., Friesen, W.V., 1976. Pictures of Facial Affect. ConsultingPsychologist Press, Palo Alto.
Esposito, F., Scarabino, T., Hyvarinen, A., Himberg, J., Formi-sano, E., Comani, S., Tedeschi, G., Goebel, R., Seifritz, E., DiSalle, F., 2005. Independent component analysis of fMRIgroup studies by self-organizing clustering. Neuroimage 25,193–205.
Fransson, P., Marrelec, G., 2008. The precuneus/posterior cingulatecortex plays a pivotal role in the default mode network:evidence from a partial correlation network analysis. Neuro-image 42, 1178–1184.
Garrity, A., Pearlson, G.D., McKiernan, K., Lloyd, D., Kiehl, K.A.,Calhoun, V.D., 2007. Aberrant “default mode” functionalconnectivity in schizophrenia. Am. J. Psychiatry 164,450–457.
Gobbini, M.I., Koralek, A.C., Bryan, R.E., Montgomery, K.J., Haxby,J.V., 2007. Two takes on the social brain: a comparison of theoryof mind tasks. J. Cogn. Neurosci. 19, 1803–1814.
Please cite this article as: Knyazev, G.G., et al., The default mcomponent analysis, Brain Res. (2011), doi:10.1016/j.brainres.201
Goldman, R.I., Stern, J.M., Engel Jr., J., Cohen, M.S., 2002. Simulta-neous EEG and fMRI of the alpha rhythm. Neuroreport 13,2487–2492.
Goodale, M.A., Milner, A.D., 2008. Two visual systems re-viewed.Neuropsychologia 46, 774–785.
Greicius, M.D., Krasnow, B., Reiss, A.L., Menon, V., 2003. Functionalconnectivity in the resting brain: a network analysis of thedefault mode hypothesis. Proc. Natl. Acad. Sci. U.S.A. 100,253–258.
Greicius, M.D., Flores, B.H., Menon, V., Glover, G.H., Solvason, H.B.,Kenna, H., Reiss, A.L., Schatzberg, A.F., 2007. Resting-statefunctional connectivity in major depression: abnormallyincreased contributions from subgenual cingulated cortex andthalamus. Biol. Psychiatry 62, 429–437.
Greicius, M.D., Kiviniemi, V., Tervonen, O., Vainionpää, V.,Alahuhta, S., Reiss, A.L., Menon, V., 2008. Persistent default-mode network connectivity during light sedation. Hum. BrainMapp. 29, 839–847.
Hanslmayr, S., Klimesch,W., Sauseng, P., Gruber, W., Doppelmayr,M., Freunberger, R., Pecherstorfer, T., 2005. Visual discrimina-tion performance is related to decreased alpha amplitude butincreased phase locking. Neurosci. Lett. 375, 64–68.
Harrison, B.J., Pujol, J., Lopez-Sola, M., Hernandez-Ribas, R., Deus,J., Ortiz, H., Soriano-Mas, C., Yucel, M., Pantelis, C., Cardoner,N., 2008. Consistency and functional specialization in thedefault mode brain network. PNAS 105, 9781–9786.
Helps, S., James, C., Debener, S., Karl, A., Sonuga-Barke, E.J.S., 2008.Very low frequency EEG oscillations and the resting brain inyoung adults: a preliminary study of localisation, stability andassociation with symptoms of inattention. J. Neural Transm.115, 279–285.
Huettel, S.A., McKeown, M.J., Song, A.W., Hart, S., Spencer, D.D.,Allison, T., McCarthy, G., 2004. Linking hemodynamic andelectrophysiological measures of brain activity: evidence fromfunctional MRI and intracranial field potentials. Cereb. Cortex14, 165–173.
Jann, K., Dierks, T., Boesch, C., Kottlowa, M., Strik, W., Koenig, T.,2009. BOLD correlates of EEG alpha phase-locking and the fMRIdefault mode network. Neuroimage 45, 903–916.
Jansen, B.H., Agarwal, G., Hegde, A., Boutros, N.N., 2003. Phasesynchronization of the ongoing EEG and auditory EP genera-tion. Clin. Neurophysiol. 114, 79–85.
Klimesch, W., 1996. Memory processes, brain oscillations and EEGsynchronization. Int. J. Psychophysiol. 24, 61–100.
Klimesch, W., Sauseng, P., Gerloff, C., 2003. Enhancing cognitiveperformance with repetitive transcranialmagnetic stimulationat human individual alpha frequency. Eur. J. Neurosci. 17,1129–1133.
Klimesch,W., Schack, B., Schabus, M., Doppelmayr, M., Gruber,W.,Sauseng, P., 2004. Phase-locked alpha and theta oscillationsgenerate the P1–N1 complex and are related to memoryperformance. Cogn Brain Res. 19, 302–316.
Klimesch, W., Sauseng, P., Hanslmayr, S., 2007. EEG alphaoscillations: the inhibition–timing hypothesis. Brain Res. Rev.53, 63–88.
Klimesch, W., Freunberger, R., Sauseng, P., Gruber, W., 2008. Ashort review of slow phase synchronization and memory:evidence for control processes in different memory systems?Brain Res. 1235 (3), 1–44.
Klinger, E., Gregoire, K.C., Barta, S.G., 1973. Physiological correlatesof mental activity: eye movements, alpha, and heart rateduring imagining, suppression, concentration, search, andchoice. Psychophysiol. 10, 471–477.
Knyazev, G.G., 2007. Motivation, emotion, and their inhibitorycontrol mirrored in brain oscillations. Neurosci. Biobeh. Rev.31, 377–395.
Knyazev, G.G., Slobodskaya, H.R., 2003. Personality trait ofbehavioral inhibition is associated with oscillatory systemsreciprocal relationships. Int. J. Psychophysiol. 48, 247–261.
ode network and EEG alpha oscillations: An independent1.05.052
Original text:
Inserted Text
"" Am"
Original text:
Inserted Text
"’"
Original text:
Inserted Text
"-"
Пользователь
Вставить текст
Greicius, M.D., Srivastava, G., Reiss, A.L., Menon, V., 2004. Default-mode network activity distinguishes Alzheimer’s disease from healthy aging: evidence from functional MRI. Proc. Natl. Acad. Sci. U.S.A. 101, 4637–4642.
Пользователь
Вычеркивание
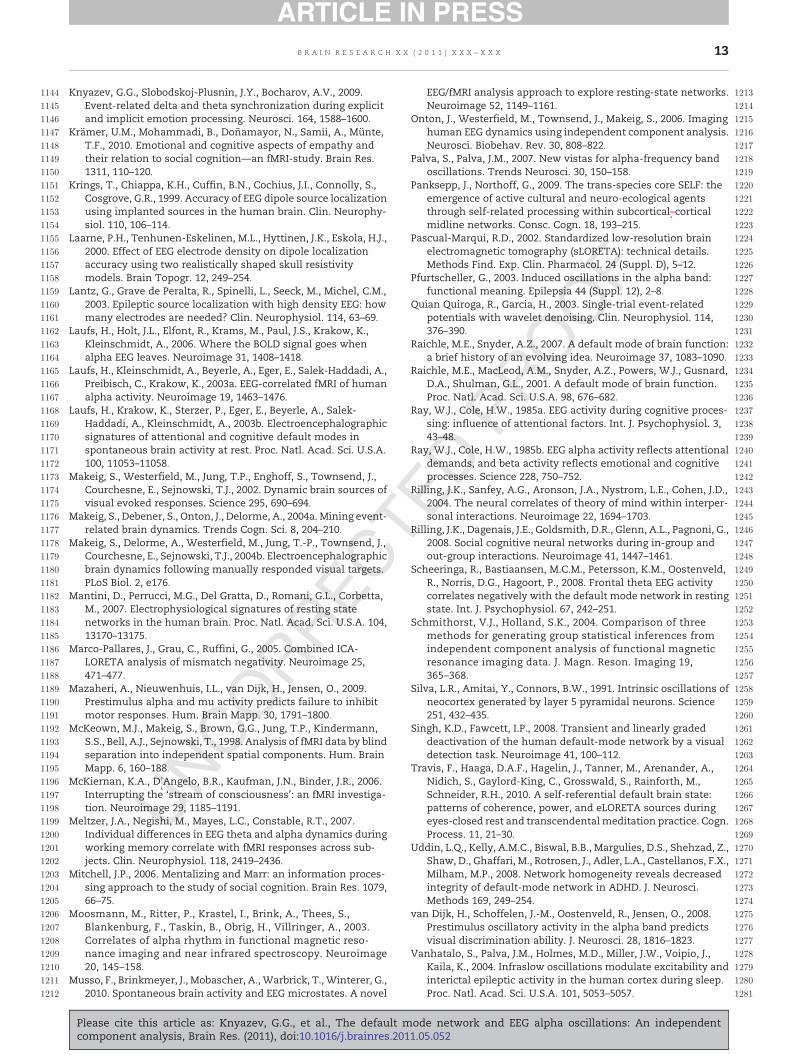
1144
1145
1146
1147
1148
1149
1150
1151
1152
1153
1154
1155
1156
1157
1158
1159
1160
1161
1162
1163
1164
1165
1166
1167
1168
1169
1170
1171
1172
1173
1174
1175
1176
1177
1178
1179
1180
1181
1182
1183
1184
1185
1186
1187
1188
1189
1190
1191
1192
1193
1194
1195
1196
1197
1198
1199
1200
1201
1202
1203
1204
1205
1206
1207
1208
1209
1210
1211
1212
1213
1214
1215
1216
1217
1218
1219
1220
1221
1222
1223
1224
1225
1226
1227
1228
1229
1230
1231
1232
1233
1234
1235
1236
1237
1238
1239
1240
1241
1242
1243
1244
1245
1246
1247
1248
1249
1250
1251
1252
1253
1254
1255
1256
1257
1258
1259
1260
1261
1262
1263
1264
1265
1266
1267
1268
1269
1270
1271
1272
1273
1274
1275
1276
1277
1278
1279
1280
1281
13B R A I N R E S E A R C H X X ( 2 0 1 1 ) X X X – X X X
Knyazev, G.G., Slobodskoj-Plusnin, J.Y., Bocharov, A.V., 2009.Event-related delta and theta synchronization during explicitand implicit emotion processing. Neurosci. 164, 1588–1600.
Krämer, U.M., Mohammadi, B., Doñamayor, N., Samii, A., Münte,T.F., 2010. Emotional and cognitive aspects of empathy andtheir relation to social cognition—an fMRI-study. Brain Res.1311, 110–120.
Krings, T., Chiappa, K.H., Cuffin, B.N., Cochius, J.I., Connolly, S.,Cosgrove, G.R., 1999. Accuracy of EEG dipole source localizationusing implanted sources in the human brain. Clin. Neurophy-siol. 110, 106–114.
Laarne, P.H., Tenhunen-Eskelinen, M.L., Hyttinen, J.K., Eskola, H.J.,2000. Effect of EEG electrode density on dipole localizationaccuracy using two realistically shaped skull resistivitymodels. Brain Topogr. 12, 249–254.
Lantz, G., Grave de Peralta, R., Spinelli, L., Seeck, M., Michel, C.M.,2003. Epileptic source localization with high density EEG: howmany electrodes are needed? Clin. Neurophysiol. 114, 63–69.
Laufs, H., Holt, J.L., Elfont, R., Krams, M., Paul, J.S., Krakow, K.,Kleinschmidt, A., 2006. Where the BOLD signal goes whenalpha EEG leaves. Neuroimage 31, 1408–1418.
Laufs, H., Kleinschmidt, A., Beyerle, A., Eger, E., Salek-Haddadi, A.,Preibisch, C., Krakow, K., 2003a. EEG-correlated fMRI of humanalpha activity. Neuroimage 19, 1463–1476.
Laufs, H., Krakow, K., Sterzer, P., Eger, E., Beyerle, A., Salek-Haddadi, A., Kleinschmidt, A., 2003b. Electroencephalographicsignatures of attentional and cognitive default modes inspontaneous brain activity at rest. Proc. Natl. Acad. Sci. U.S.A.100, 11053–11058.
Makeig, S., Westerfield, M., Jung, T.P., Enghoff, S., Townsend, J.,Courchesne, E., Sejnowski, T.J., 2002. Dynamic brain sources ofvisual evoked responses. Science 295, 690–694.
Makeig, S., Debener, S., Onton, J., Delorme, A., 2004a. Mining event-related brain dynamics. Trends Cogn. Sci. 8, 204–210.
Makeig, S., Delorme, A., Westerfield, M., Jung, T.-P., Townsend, J.,Courchesne, E., Sejnowski, T.J., 2004b. Electroencephalographicbrain dynamics following manually responded visual targets.PLoS Biol. 2, e176.
Mantini, D., Perrucci, M.G., Del Gratta, D., Romani, G.L., Corbetta,M., 2007. Electrophysiological signatures of resting statenetworks in the human brain. Proc. Natl. Acad. Sci. U.S.A. 104,13170–13175.
Marco-Pallares, J., Grau, C., Ruffini, G., 2005. Combined ICA-LORETA analysis of mismatch negativity. Neuroimage 25,471–477.
Mazaheri, A., Nieuwenhuis, I.L., van Dijk, H., Jensen, O., 2009.Prestimulus alpha and mu activity predicts failure to inhibitmotor responses. Hum. Brain Mapp. 30, 1791–1800.
McKeown, M.J., Makeig, S., Brown, G.G., Jung, T.P., Kindermann,S.S., Bell, A.J., Sejnowski, T., 1998. Analysis of fMRI data by blindseparation into independent spatial components. Hum. BrainMapp. 6, 160–188.
McKiernan, K.A., D'Angelo, B.R., Kaufman, J.N., Binder, J.R., 2006.Interrupting the ‘stream of consciousness’: an fMRI investiga-tion. Neuroimage 29, 1185–1191.
Meltzer, J.A., Negishi, M., Mayes, L.C., Constable, R.T., 2007.Individual differences in EEG theta and alpha dynamics duringworking memory correlate with fMRI responses across sub-jects. Clin. Neurophysiol. 118, 2419–2436.
Mitchell, J.P., 2006. Mentalizing and Marr: an information proces-sing approach to the study of social cognition. Brain Res. 1079,66–75.
Moosmann, M., Ritter, P., Krastel, I., Brink, A., Thees, S.,Blankenburg, F., Taskin, B., Obrig, H., Villringer, A., 2003.Correlates of alpha rhythm in functional magnetic reso-nance imaging and near infrared spectroscopy. Neuroimage20, 145–158.
Musso, F., Brinkmeyer, J., Mobascher, A., Warbrick, T., Winterer, G.,2010. Spontaneous brain activity and EEG microstates. A novel
Please cite this article as: Knyazev, G.G., et al., The default mcomponent analysis, Brain Res. (2011), doi:10.1016/j.brainres.201
EEG/fMRI analysis approach to explore resting-state networks.Neuroimage 52, 1149–1161.
Onton, J., Westerfield, M., Townsend, J., Makeig, S., 2006. Imaginghuman EEG dynamics using independent component analysis.Neurosci. Biobehav. Rev. 30, 808–822.
Palva, S., Palva, J.M., 2007. New vistas for alpha-frequency bandoscillations. Trends Neurosci. 30, 150–158.
Panksepp, J., Northoff, G., 2009. The trans-species core SELF: theemergence of active cultural and neuro-ecological agentsthrough self-related processing within subcortical–corticalmidline networks. Consc. Cogn. 18, 193–215.
Pascual-Marqui, R.D., 2002. Standardized low-resolution brainelectromagnetic tomography (sLORETA): technical details.Methods Find. Exp. Clin. Pharmacol. 24 (Suppl. D), 5–12.
Pfurtscheller, G., 2003. Induced oscillations in the alpha band:functional meaning. Epilepsia 44 (Suppl. 12), 2–8.
Quian Quiroga, R., Garcia, H., 2003. Single-trial event-relatedpotentials with wavelet denoising. Clin. Neurophysiol. 114,376–390.
Raichle, M.E., Snyder, A.Z., 2007. A default mode of brain function:a brief history of an evolving idea. Neuroimage 37, 1083–1090.
Raichle, M.E., MacLeod, A.M., Snyder, A.Z., Powers, W.J., Gusnard,D.A., Shulman, G.L., 2001. A default mode of brain function.Proc. Natl. Acad. Sci. U.S.A. 98, 676–682.
Ray, W.J., Cole, H.W., 1985a. EEG activity during cognitive proces-sing: influence of attentional factors. Int. J. Psychophysiol. 3,43–48.
Ray, W.J., Cole, H.W., 1985b. EEG alpha activity reflects attentionaldemands, and beta activity reflects emotional and cognitiveprocesses. Science 228, 750–752.
Rilling, J.K., Sanfey, A.G., Aronson, J.A., Nystrom, L.E., Cohen, J.D.,2004. The neural correlates of theory of mind within interper-sonal interactions. Neuroimage 22, 1694–1703.
Rilling, J.K., Dagenais, J.E., Goldsmith, D.R., Glenn, A.L., Pagnoni, G.,2008. Social cognitive neural networks during in-group andout-group interactions. Neuroimage 41, 1447–1461.
Scheeringa, R., Bastiaansen, M.C.M., Petersson, K.M., Oostenveld,R., Norris, D.G., Hagoort, P., 2008. Frontal theta EEG activitycorrelates negatively with the default mode network in restingstate. Int. J. Psychophysiol. 67, 242–251.
Schmithorst, V.J., Holland, S.K., 2004. Comparison of threemethods for generating group statistical inferences fromindependent component analysis of functional magneticresonance imaging data. J. Magn. Reson. Imaging 19,365–368.
Silva, L.R., Amitai, Y., Connors, B.W., 1991. Intrinsic oscillations ofneocortex generated by layer 5 pyramidal neurons. Science251, 432–435.
Singh, K.D., Fawcett, I.P., 2008. Transient and linearly gradeddeactivation of the human default-mode network by a visualdetection task. Neuroimage 41, 100–112.
Travis, F., Haaga, D.A.F., Hagelin, J., Tanner, M., Arenander, A.,Nidich, S., Gaylord-King, C., Grosswald, S., Rainforth, M.,Schneider, R.H., 2010. A self-referential default brain state:patterns of coherence, power, and eLORETA sources duringeyes-closed rest and transcendental meditation practice. Cogn.Process. 11, 21–30.
Uddin, L.Q., Kelly, A.M.C., Biswal, B.B., Margulies, D.S., Shehzad, Z.,Shaw, D., Ghaffari, M., Rotrosen, J., Adler, L.A., Castellanos, F.X.,Milham, M.P., 2008. Network homogeneity reveals decreasedintegrity of default-mode network in ADHD. J. Neurosci.Methods 169, 249–254.
van Dijk, H., Schoffelen, J.-M., Oostenveld, R., Jensen, O., 2008.Prestimulus oscillatory activity in the alpha band predictsvisual discrimination ability. J. Neurosci. 28, 1816–1823.
Vanhatalo, S., Palva, J.M., Holmes, M.D., Miller, J.W., Voipio, J.,Kaila, K., 2004. Infraslow oscillations modulate excitability andinterictal epileptic activity in the human cortex during sleep.Proc. Natl. Acad. Sci. U.S.A. 101, 5053–5057.
ode network and EEG alpha oscillations: An independent1.05.052
Original text:
Inserted Text
"’"
Original text:
Inserted Text
"-"

1282
1283
1284
1285
1286
1287
1288
1289
1290
14 B R A I N R E S E A R C H X X ( 2 0 1 1 ) X X X – X X X
Vincent, J.L., Patel, G.H., Fox, M.D., Snyder, A.Z., Baker, J.T., VanEssen, D.C., Zempel, J.M., Snyder, L.H., Corbetta, M., Raichle,M.E., 2007. Intrinsic functional architecture in the anaesthe-tized monkey brain. Nature 447, 83–86.
Please cite this article as: Knyazev, G.G., et al., The default mcomponent analysis, Brain Res. (2011), doi:10.1016/j.brainres.201
Yvert, B., Bertrand, O., Thévenet, M., Echallier, J.F., Pernier, J.,1997. A systematic evaluation of the spherical modelaccuracy in EEG dipole localization. EEG Clin. Neurophysiol.102, 452–459.
ode network and EEG alpha oscillations: An independent1.05.052
Related Documents


