JUNE 2016 THEMATIC REPORT THE CRISIS OF AFFORDABILITY IN REAL ESTATE An investment case for housing in the middle of the pyramid Mario López-Alcalá June 2016

Welcome message from author
This document is posted to help you gain knowledge. Please leave a comment to let me know what you think about it! Share it to your friends and learn new things together.
Transcript

JUNE 2016
THEMATIC REPORT
THE CRISIS OF AFFORDABILITY IN REAL ESTATE An investment case for housing in the middle of the pyramid
Mario López-Alcalá
June 2016

MSCI.COM | PAGE 2 OF 48 © 2016 MSCI Inc. All rights reserved. Please refer to the disclaimer at the end of this document.
THE CRISIS OF AFFORDABILITY IN REAL ESTATE | JUNE 2016
Executive Summary............................................................................ 4
Key findings .......................................................................................................................4
1 Affordable housing for the middle of the pyramid ...................... 6
1.1 Defining affordability: how much and for whom, how big, where? ........ 6
1.2 Affordability as a long-term investment theme....................................... 7
1.3 Median housing costs for rental housing relative to income .................. 7
1.4 Median housing costs for homeownership relative to income ............... 9
Years needed to save for a down payment ......................................................................9
Monthly mortgage payments ........................................................................................ 11
1.5 Housing investment market: rentals or homeownership? .................... 12
1.6 Potential affordable housing market size .............................................. 13
1.7 Residential portfolios mapping by sites’ affordability in MSCI ACWI IMI’s
real estate companies ....................................................................................... 15
2 Affordable commercial properties ............................................ 18
2.1 SMEs’ global economic importance, and policy & business barriers .... 18
2.2 SMEs’ share of GDP relative to home country’s market and region ..... 19
2.3 Commercial portfolios mapping by SMEs’ share from country’s GDP in
MSCI ACWI IMI’S real estate companies .......................................................... 20
3 Enablers: stakeholders easing affordable real estate ................ 22
3.1 The value chain of affordable real estate among MSCI ACWI IMI
constituents ...................................................................................................... 22
Banks .............................................................................................................................. 23
Building products ........................................................................................................... 23
Construction and engineering ....................................................................................... 24
Construction materials .................................................................................................. 24
3.2 Public policies on affordable residential real estate .............................. 25
3.3 Affordability and its relationship with sustainability ............................. 26
CONTENTS

MSCI.COM | PAGE 3 OF 48 © 2016 MSCI Inc. All rights reserved. Please refer to the disclaimer at the end of this document.
THE CRISIS OF AFFORDABILITY IN REAL ESTATE | JUNE 2016
Appendix .......................................................................................... 27
Methodology and assumptions for defining housing affordability .................. 27
How much & for whom? ................................................................................................ 27
How big? ........................................................................................................................ 28
Countries and cities in this report..................................................................... 29
Annex I – City and country summary tables ..................................... 30
Annex II – Property portfolios and SME loans .................................. 36

MSCI.COM | PAGE 4 OF 48 © 2016 MSCI Inc. All rights reserved. Please refer to the disclaimer at the end of this document.
THE CRISIS OF AFFORDABILITY IN REAL ESTATE | JUNE 2016
EXECUTIVE SUMMARY
In this report, we aimed to define and assess real estate affordability for middle-income
households and commercial real estate market participants (the “middle of the pyramid”).
We estimated that the potential affordable housing market catered to this population
segment is significant: USD 502 billion, covering 50.4 million households, an increase of 7.3%
from 2015. While our data cannot answer the question of an “unaffordability bubble” for
median income market participants, we did find that only four countries among the 97 we
analyzed had affordable real estate available that covered at least 50% urban populations
for rentals, and only six countries for homeownership.
By 2050, two-thirds of the world population is expected to live in cities, about a fifth of that
urban population will be characterized as middle-of-the pyramid based on income
distribution. The steep inflow of creditworthy middle-income working population into
metropolitan areas suggests a long-term opportunity for investors to address rising demand
for affordable housing options in both residential and commercial space.
In the short-term, we considered unaffordability in real estate markets as a potential risk, as
data has shown that rental and sales prices for the luxury market segment (real estate
priced in the top quintile of local pricing) have already peaked and have started to decline,
while the opposite has happened with more affordable housing segments. The result for an
investor may be a diversification imbalance, with real estate overexposure to the luxury
market at the cost of a more diversified portfolio of high credit-worthy, sustainable cash
flow properties that could be a defensive hedge against economic cycles.
The affordability gap in the market, with more than 50 million households by 2020
potentially left out of the biggest cities globally given the lack of affordable options,
extended to business markets as well, with SMEs squeezed. In both cases, indirect market
participants could also feel the effects of a top-heavy global real estate market.
KEY FINDINGS
Rental housing costs and mortgage payments represented an unaffordable burden for
households earning a median disposable income in 75% of the 307 cities across 97
countries that we analyzed as of December 31, 2015. Data suggests that while
unaffordable housing was more prevalent in emerging markets than in developed ones,
it is a phenomenon experienced across the world.
We identified 10 cities, including Shanghai, New York, Washington DC, Seoul, and
London, with the largest potential for offering affordable housing both in terms of the
number of households that meet investment criteria, as well as the size of the
investable universe (30% of the global sample of 307 cities).
We analyzed affordable market penetration for 161 real estate company constituents
on the MSCI ACWI Investable Market Index (IMI) as of December 2015 and found that
25 companies (15%) held assets or were exposed to cities with extreme levels of
MSCI.COM | PAGE 5 OF 48 © 2016 MSCI Inc. All rights reserved. Please refer to the disclaimer at the end of this document.
THE CRISIS OF AFFORDABILITY IN REAL ESTATE | JUNE 2016
unaffordable housing costs (where median housing costs were greater than 100% of
median disposable income). The biggest companies by market capitalization were Hang
Lung, Sun Hung Kai and Swire Properties.
Conversely, we found 49 real estate companies (30%) had property assets located in
cities where housing costs were considered affordable (with costs less than 40% of
disposable income). The biggest companies by market capitalization were AvalonBay,
Equity Residential and CapitaLand Ltd. However, only 23 companies may be actively
targeting affordable housing solutions with explicit offerings.
In only four companies (Scentre, Schroder REIT, Bixmor and Growthpoint), we found
evidence of programs that address the SME segment. These companies represented
only 1.8% of the total assets’ value of the MSCI ACWI IMI real estate constituents.
We evaluated 180 public policies that relate to affordable housing in 33 countries. We
found that Canada, India and USA, which had the highest number of policies, enjoyed
higher levels of housing affordability, either rental, ownership or both, as of 2015.
MSCI.COM | PAGE 6 OF 48 © 2016 MSCI Inc. All rights reserved. Please refer to the disclaimer at the end of this document.
THE CRISIS OF AFFORDABILITY IN REAL ESTATE | JUNE 2016
1 AFFORDABLE HOUSING FOR THE MIDDLE OF THE PYRAMID1
While the term “affordable housing” is usually associated with the population at the base of
the income pyramid, in this report we explore housing affordability for population at the
middle of the pyramid (earning +/- 15% of a city local median disposable income). As of the
end of 2015, we find that housing for people in the middle of the pyramid is unaffordable in
most cities and countries that we studied. However, the potential affordable housing market
catered to this population segment is significant (USD 502 billion by 2020), and it is fueled by
high potential monthly rents (> USD 1,000) and by credit worthy households. All results are
as of December 31, 2015, unless otherwise stated.
1.1 DEFINING AFFORDABILITY: HOW MUCH AND FOR WHOM, HOW BIG, WHERE?
Despite media attention on ever-rising housing costs, policy makers, academics and
investors lack a consistent global measure of housing affordability. We seek to create a
common definition of housing affordability, which includes multiple factors that reflect city
level economic conditions (household disposable income, utility and apartment prices) and
country specific household features. The elements used here for defining affordable housing
for a population segment earning approximately the local median disposable income, are:2
housing costs not exceeding 40% of the annual median disposable income per
household;
maximum occupancy of two people per bedroom to avoid household
overcrowding; and,
urban housing.
Public policies that point to the affordability threshold show that in Canada and in the EU
this threshold rose from 20% in the 1950s3 to 40% in 20144. This difference illustrates the
increasing economic burden of housing costs, possibly at the expense of other basic needs,
such as food, clothing, education, healthcare or leisure.5
1 The author thanks Bert Teuben, Brian Browdie, Christina Cudworth, Cyrus Lotfipour, Jahiz Barlas, Jerry Lettieri, Linda-
Eling Lee, Matt Moscardi, Morgan Ellis, Niel Harmse, Olga Emelianova, Phil Barttram, Jianpeng Wen, Zhen Li, Sam Block,
Veronique Menou and Whitney Rauschenbach for many helpful comments and conversations from the inception of
this project to its completion.
2 See Appendix for underlying assumptions on defining affordability, and the size of urban population in countries and
cities in this report relative to the world.
3 Hulchanski, J. David, “The concept of housing affordability: Six contemporary uses of the housing expenditure to
income”, 1995, Housing Studies, Vol. 10 Issue 4.
4 Di Meglio, E., “Housing conditions in 2014”, Eurostat news release, 204/2015 - 23 November 2015.
5 We found no quantitative research in historical and contemporary academic or policy sources on the marginal effect of
housing costs on other basic needs in order to establish an affordability threshold. We found that this analysis was only
available at the national level, where excessive reliance on domestic savings and government debt for housing
programs potentially crowd out investments in health and education. See: Dasgupta, B., “Urbanization and Housing
Investment”, 2014, World Bank.

MSCI.COM | PAGE 7 OF 48 © 2016 MSCI Inc. All rights reserved. Please refer to the disclaimer at the end of this document.
THE CRISIS OF AFFORDABILITY IN REAL ESTATE | JUNE 2016
Source: United Nations World Urbanization Prospects.
1.2 AFFORDABILITY AS A LONG-TERM INVESTMENT THEME
Urbanization is a byproduct of economic development across the world and, hence, may be
an important theme in long-term institutional investment strategies. Regardless of the
development stage or path chosen by a county to improve living conditions, population in
urban areas has increased at the expense of rural and suburban locations in all regions
around the world and the United Nations World Urbanization Prospects estimates that this
will continue to be the case (see Figure 1). The United Nations World Urbanization Prospects
points out that urbanization trends globally will only increase population in cities, which
could heighten the importance of affordability. Therefore, we focus on evaluating housing
affordability in urban areas.
FIGURE 1. Urbanization by Region in 2010 and 2050
1.3 MEDIAN HOUSING COSTS FOR RENTAL HOUSING RELATIVE TO INCOME
Our research indicates that rental housing costs represented an unaffordable burden for
households earning the local median disposable income and renting a median-priced
residential unit in 75% of the sample cities (see Figure 2). Data suggests that while
unaffordable rental housing options were more prevalent in emerging markets (EM) than in
developed (DM) ones, it is a phenomenon experienced across the world (see Figure 3).

MSCI.COM | PAGE 8 OF 48 © 2016 MSCI Inc. All rights reserved. Please refer to the disclaimer at the end of this document.
THE CRISIS OF AFFORDABILITY IN REAL ESTATE | JUNE 2016
EM & affordable rentals DM & affordable rentals
EM & unaffordable rentals DM & unaffordable rentals
No data
Median housing costs as a proportion of median disposable income in 307 cities of 97 countries, which account for approximately 658 million inhabitants or 19% of urban population in those countries. Sources: ILOstat, Numbeo and MSCI ESG Research.
FIGURE 2. Median housing costs for rental properties as percentage of median disposable income by city.
FIGURE 3. Developed and emerging markets characterized by affordability of urban rental
residential properties.
MSCI.COM | PAGE 9 OF 48 © 2016 MSCI Inc. All rights reserved. Please refer to the disclaimer at the end of this document.
THE CRISIS OF AFFORDABILITY IN REAL ESTATE | JUNE 2016
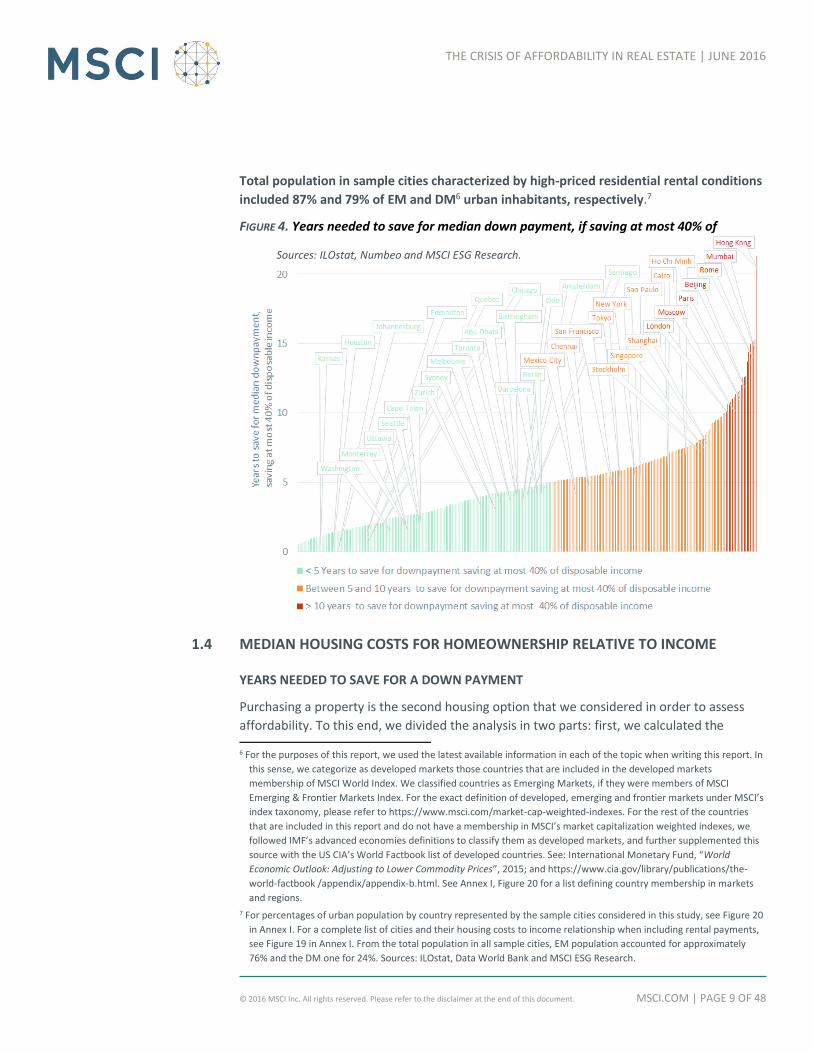
Total population in sample cities characterized by high-priced residential rental conditions
included 87% and 79% of EM and DM6 urban inhabitants, respectively.7
FIGURE 4. Years needed to save for median down payment, if saving at most 40% of disposable income
1.4 MEDIAN HOUSING COSTS FOR HOMEOWNERSHIP RELATIVE TO INCOME
YEARS NEEDED TO SAVE FOR A DOWN PAYMENT
Purchasing a property is the second housing option that we considered in order to assess
affordability. To this end, we divided the analysis in two parts: first, we calculated the 6 For the purposes of this report, we used the latest available information in each of the topic when writing this report. In
this sense, we categorize as developed markets those countries that are included in the developed markets
membership of MSCI World Index. We classified countries as Emerging Markets, if they were members of MSCI
Emerging & Frontier Markets Index. For the exact definition of developed, emerging and frontier markets under MSCI’s
index taxonomy, please refer to https://www.msci.com/market-cap-weighted-indexes. For the rest of the countries
that are included in this report and do not have a membership in MSCI’s market capitalization weighted indexes, we
followed IMF’s advanced economies definitions to classify them as developed markets, and further supplemented this
source with the US CIA’s World Factbook list of developed countries. See: International Monetary Fund, “World
Economic Outlook: Adjusting to Lower Commodity Prices”, 2015; and https://www.cia.gov/library/publications/the-
world-factbook /appendix/appendix-b.html. See Annex I, Figure 20 for a list defining country membership in markets
and regions.
7 For percentages of urban population by country represented by the sample cities considered in this study, see Figure 20
in Annex I. For a complete list of cities and their housing costs to income relationship when including rental payments,
see Figure 19 in Annex I. From the total population in all sample cities, EM population accounted for approximately
76% and the DM one for 24%. Sources: ILOstat, Data World Bank and MSCI ESG Research.
Sources: ILOstat, Numbeo and MSCI ESG Research.
MSCI.COM | PAGE 10 OF 48 © 2016 MSCI Inc. All rights reserved. Please refer to the disclaimer at the end of this document.
THE CRISIS OF AFFORDABILITY IN REAL ESTATE | JUNE 2016
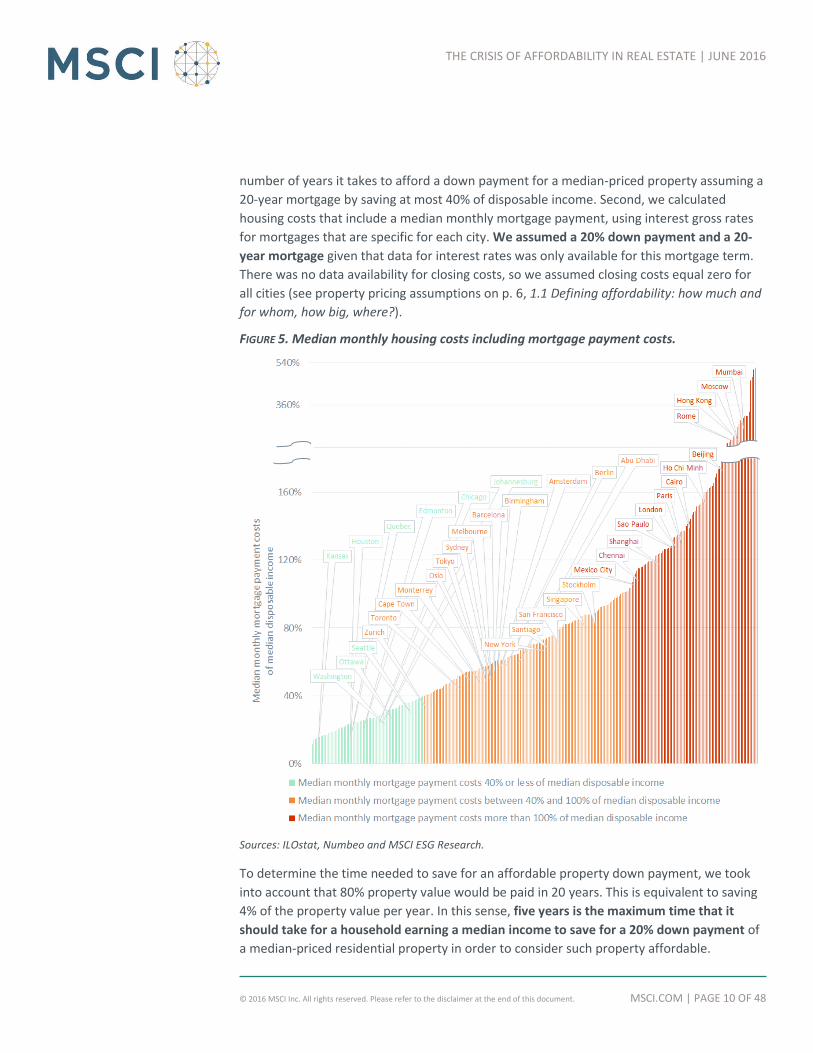
Sources: ILOstat, Numbeo and MSCI ESG Research.
number of years it takes to afford a down payment for a median-priced property assuming a
20-year mortgage by saving at most 40% of disposable income. Second, we calculated
housing costs that include a median monthly mortgage payment, using interest gross rates
for mortgages that are specific for each city. We assumed a 20% down payment and a 20-
year mortgage given that data for interest rates was only available for this mortgage term.
There was no data availability for closing costs, so we assumed closing costs equal zero for
all cities (see property pricing assumptions on p. 6, 1.1 Defining affordability: how much and
for whom, how big, where?).
FIGURE 5. Median monthly housing costs including mortgage payment costs.
To determine the time needed to save for an affordable property down payment, we took
into account that 80% property value would be paid in 20 years. This is equivalent to saving
4% of the property value per year. In this sense, five years is the maximum time that it
should take for a household earning a median income to save for a 20% down payment of
a median-priced residential property in order to consider such property affordable.
MSCI.COM | PAGE 11 OF 48 © 2016 MSCI Inc. All rights reserved. Please refer to the disclaimer at the end of this document.
THE CRISIS OF AFFORDABILITY IN REAL ESTATE | JUNE 2016
EM & affordable mortgages DM & affordable mortgages
EM & unaffordable mortgages DM & unaffordable mortgages
No data
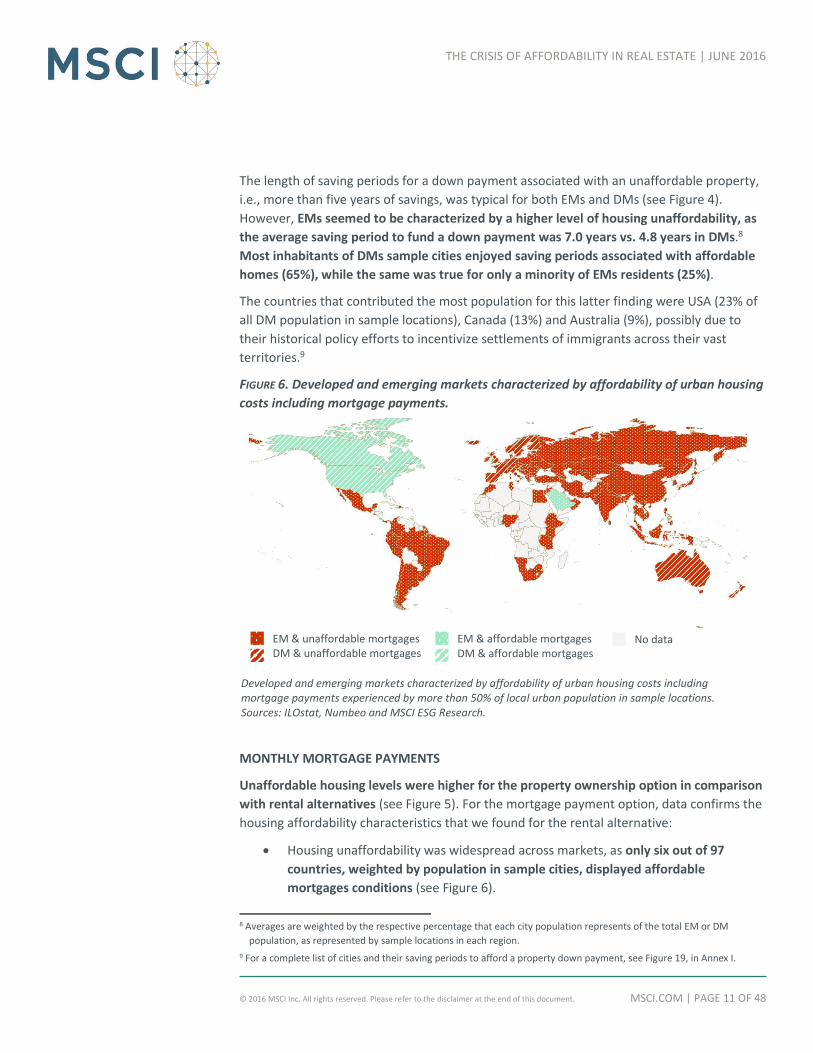
Developed and emerging markets characterized by affordability of urban housing costs including mortgage payments experienced by more than 50% of local urban population in sample locations. Sources: ILOstat, Numbeo and MSCI ESG Research.
The length of saving periods for a down payment associated with an unaffordable property,
i.e., more than five years of savings, was typical for both EMs and DMs (see Figure 4).
However, EMs seemed to be characterized by a higher level of housing unaffordability, as
the average saving period to fund a down payment was 7.0 years vs. 4.8 years in DMs.8
Most inhabitants of DMs sample cities enjoyed saving periods associated with affordable
homes (65%), while the same was true for only a minority of EMs residents (25%).
The countries that contributed the most population for this latter finding were USA (23% of
all DM population in sample locations), Canada (13%) and Australia (9%), possibly due to
their historical policy efforts to incentivize settlements of immigrants across their vast
territories.9
FIGURE 6. Developed and emerging markets characterized by affordability of urban housing
costs including mortgage payments.
MONTHLY MORTGAGE PAYMENTS
Unaffordable housing levels were higher for the property ownership option in comparison
with rental alternatives (see Figure 5). For the mortgage payment option, data confirms the
housing affordability characteristics that we found for the rental alternative:
Housing unaffordability was widespread across markets, as only six out of 97
countries, weighted by population in sample cities, displayed affordable
mortgages conditions (see Figure 6).
8 Averages are weighted by the respective percentage that each city population represents of the total EM or DM
population, as represented by sample locations in each region.
9 For a complete list of cities and their saving periods to afford a property down payment, see Figure 19, in Annex I.

MSCI.COM | PAGE 12 OF 48 © 2016 MSCI Inc. All rights reserved. Please refer to the disclaimer at the end of this document.
THE CRISIS OF AFFORDABILITY IN REAL ESTATE | JUNE 2016
See Annex I, Figure 20 for a list defining country membership in markets and regions. Housing costs represent cities averages costs weighted by population. Sources: ILOstat, Numbeo and MSCI ESG Research.
DM Asia-Pacific
DM Europe
DM North America
DM North Africa-Middle East
EM Sub-Saharan Africa
EM Asia-Pacific
EM Europe
EM Latin America
EM North Africa-Middle East
DM
EM
All regions
0%
40%
80%
120%
160%
200%
0% 40% 80% 120% 160%
Ho
usi
ng
cost
s p
ayin
ga
mo
rtga
geas
a %
of
dis
po
sab
le in
com
e
Housing costs paying rent as a % of disposable income
Cheaper to rent
Cheaper to own
There was a higher proportion of cities and associated population in EMs than in
DMs that displayed an unaffordable mortgage profile. In EMs, unaffordable
mortgages characterized 95% of EM sample cities (associated with 97% of total EM
sample population), while for DMs these mortgages typified 54% of cities (69% of
population).10
FIGURE 7. Housing expenses as a percentage of disposable income under home rental vs. home ownership scenarios.
1.5 HOUSING INVESTMENT MARKET: RENTALS OR HOMEOWNERSHIP?
Aggregating country data at the regional level, we found that the only region where cost of
housing on average (cities’ average costs weighted by population) fell below 40% of
disposable income was DM North America (NA) for the homeownership case. In DM NA,
housing costs when paying a mortgage typically represented 37% of disposable income (see
Figure 7). With the exception of EM Sub-Saharan Africa (AF) and DM NA, we find that
housing costs when paying a mortgage are higher than when paying a rent for all regions,
this difference ranges from 24% in DM Europe (EUR) to 108% in EM EUR. This difference is
mainly driven by high mortgage costs in Ukrainian and Russian cities. Cities in EM EUR have 10 For a complete list of cities and their housing costs to income relationship when including mortgage payments, see
Figure 19 in Annex I.

MSCI.COM | PAGE 13 OF 48 © 2016 MSCI Inc. All rights reserved. Please refer to the disclaimer at the end of this document.
THE CRISIS OF AFFORDABILITY IN REAL ESTATE | JUNE 2016
Right side axis corresponds to an aggregate market size (in USD billions) as measured by 40% of median disposable household income in each city multiplied by the number of qualifying households per city. Left side axis corresponds to the number of such qualifying households, as defined by +/- 15% of median income excluding households with a credit default risk. Sources: FICO, ILOstat, Numbeo, US Census Bureau and MSCI ESG Research.
among the highest median housing costs, as the lowest housing costs in the region are 50%
and 61%, respectively for rental and mortgage options.
1.6 POTENTIAL AFFORDABLE HOUSING MARKET SIZE
The definition of the market size for affordable residential properties could be different for
different investor types. An institutional impact investor concerned with generating the
widest positive impact could give more weight to the number of households in a particular
location that could potentially benefit from capital deployment. Conversely, a strategic
investor could pay more attention to the aggregate magnitude of the potential spending on
housing costs that households could afford in a certain city, together with the size of
potential monthly payments to gauge market depth and prospective revenue. Both types of
investors may utilize a combination of the aforementioned metrics to make their investment
decisions, together with supplementary data such as population growth rate, GDP size and
growth rate, and availability of basic services, among others.
FIGURE 8. Potential market size for affordable residential properties by city

MSCI.COM | PAGE 14 OF 48 © 2016 MSCI Inc. All rights reserved. Please refer to the disclaimer at the end of this document.
THE CRISIS OF AFFORDABILITY IN REAL ESTATE | JUNE 2016
Shanghai Sources: FICO, ILOstat, Numbeo, US Census Bureau and MSCI ESG Research.
To calculate the market size for affordable residential properties by city, we accounted for
approximately +/- 15% of households around the median income bracket.11
However, we did not include 21% of those households, as their income levels are associated
with credit defaults and, hence, might exceed the risk appetite of investors.12
For the sample cities included in this study, we calculated that the total annual value of the
affordable housing market was approximately USD 468 billion and 46.9 million households
(see Figure 8). Assuming a projected growth rate of 1.7% annually that urban population will
experience over the next five years at the country level (other things equal),13 we estimate
that the affordable market in the sample cities could grow to USD 502 billion and 50.4
million households by 2020. We found that 10% of these global cities included in the
analysis (or 32 of them) concentrated about 54% of the affordable market opportunity by
value in USD and nearly 40% of all households (see Figure 9).
FIGURE 9. Top 10 cities for affordable residential properties ranked by market size in USD.
The two biggest shares of the market volume are located in DM NA and EM Asia-Pacific
(EM AP), 26% by USD each. For DM NA, the high median level of potential monthly
expenditure (USD 1,490) and a high population (13% of households of the total sample)
drive this outcome. For EM AP, the result is due to the high population level in the region 11 Income distributions across countries vary and, hence, the number of income brackets above and below the median
income level that contain 15% of the local population will be different. In general, however, income distributions in
countries display more households grouped in brackets that are below the median income level than above it. In this,
sense, less income brackets of the same size below the median income level will account for 15% of population, than
those that will account for this population percentage above that same income level. Using as a reference the USA
income distribution, represented by a GINI coefficient of 45.0, countries with GINI coefficients above this level (i.e.,
with more unequal income distributions) will have relatively more population than the USA below the median income
level. See Appendix I, Figure 20 for a list of countries and their GINI coefficients.
12 We used FICO definition of poor credit, as having debts with 90 or more days past due over a 24 month window. We
also used FICO’s delinquency rate by income deciles to adjust the household size by city that could be eligible as renter
or borrower. See: Bell, R., “Does making a high salary automatically mean one is a good credit risk?”, 2010, Risk &
Compliance, FICO Blog
13 Source: World Bank http://data.worldbank.org/indicator/SP.URB.TOTL?display=default.
MSCI.COM | PAGE 15 OF 48 © 2016 MSCI Inc. All rights reserved. Please refer to the disclaimer at the end of this document.
THE CRISIS OF AFFORDABILITY IN REAL ESTATE | JUNE 2016
Sources: ILOstat, Numbeo, SNL Financial and MSCI ESG Research.
(34% of households of the total sample), given that median potential expenditure in
housing is relatively low (USD 370), see Figure 9.
The top 10 cities represent about 30% of this market in USD from global sample cities (see
Figure 9). For all of these top cities, data suggests that households could afford relatively
high housing costs per month, which in all cases go beyond USD 1,000 with exception of
Beijing (USD 800) and Moscow (USD 720). For a detailed list of market sizes and housing
costs by city, see Figure 19 in Annex I.
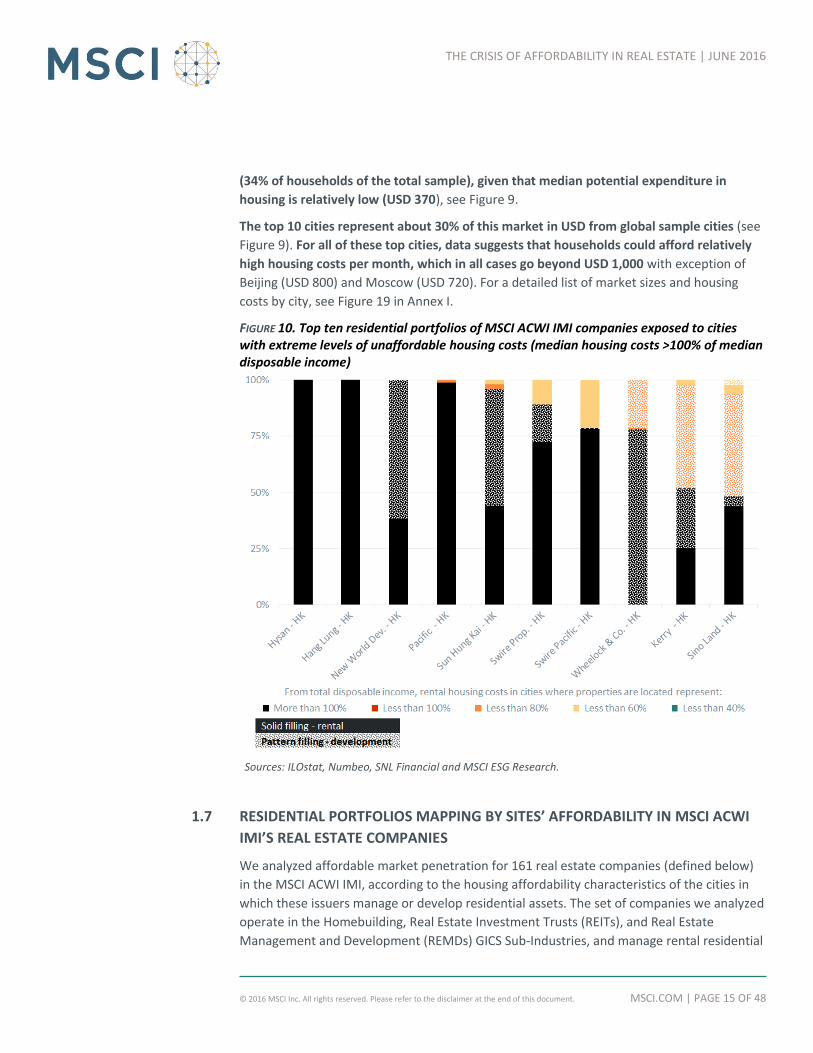
FIGURE 10. Top ten residential portfolios of MSCI ACWI IMI companies exposed to cities with extreme levels of unaffordable housing costs (median housing costs >100% of median disposable income)
1.7 RESIDENTIAL PORTFOLIOS MAPPING BY SITES’ AFFORDABILITY IN MSCI ACWI
IMI’S REAL ESTATE COMPANIES
We analyzed affordable market penetration for 161 real estate companies (defined below)
in the MSCI ACWI IMI, according to the housing affordability characteristics of the cities in
which these issuers manage or develop residential assets. The set of companies we analyzed
operate in the Homebuilding, Real Estate Investment Trusts (REITs), and Real Estate
Management and Development (REMDs) GICS Sub-Industries, and manage rental residential

MSCI.COM | PAGE 16 OF 48 © 2016 MSCI Inc. All rights reserved. Please refer to the disclaimer at the end of this document.
THE CRISIS OF AFFORDABILITY IN REAL ESTATE | JUNE 2016
Sources: Corporate reports, ILOstat, Numbeo, SNL Financial and MSCI ESG Research.
properties in 2,345 cities across 32 countries.14 These companies collectively manage or own
about 3 million residential units with total assets of USD 1.7 trillion.
From the 25 companies that are exposed to cities with higher levels of unaffordable
housing costs (i.e., where median housing costs >100% of median disposable income) 14 are
REMDs based in Hong-Kong, and nine of these companies have 50% of more in their
properties in these cities (see Figure 10). The rest of the companies exposed to these
markets are mostly US based REITs.15 The housing units located in these markets represent
about 2% of the total residential portfolio of MSCI ACWI IMI companies. Only China
Overseas Land & Investment (MSCI ESG: B) and AvalonBay (MSCI ESG: BB), with 2% and 1%
of their portfolios exposed to these extremely unaffordable cities, provide affordable
housing options.
FIGURE 11. Top ten residential portfolios of companies exposed to cities where housing costs are affordable (median housing costs <40% of median disposable income)
14 For cities where housing affordability data was not available, we estimated affordability levels according with
population size, market type and region. Portfolio breakdowns were done by number of residential units in buildings, if
no number of units was available, we used number of buildings instead. We included only multi-family, single-family
and student housing in the definition of residential units.
15 For aggregated portfolios by region and industry, and a full list of companies’ portfolio segmentation by affordability of
cities, see Figures 21 and 23, respectively, in Annex II – Property Portfolios.

MSCI.COM | PAGE 17 OF 48 © 2016 MSCI Inc. All rights reserved. Please refer to the disclaimer at the end of this document.
THE CRISIS OF AFFORDABILITY IN REAL ESTATE | JUNE 2016
Market reports point that residential property growth in cities with extreme unaffordable
housing costs, such as New York or London, has been concentrated in the high-end market
(top 20% of properties by property price and rental levels) after the sub-prime crisis.16
However, rental and sales prices for this luxury market segment have already peaked and
have started to decline, while the opposite has happened with more affordable housing
segments. This is due to market saturation at the top, while in the middle and bottom
segments new residential construction keeps falling behind population and employment
growth. In other words, companies that continue to focus in cities with extremely high
housing costs and that do not offer affordable housing options, might experience tighter
profit margins that those firms in similar markets but with affordable housing offerings.
On the other side of the spectrum, there are 49 companies with properties located in cities
where housing costs are affordable (<40% of disposable income). However, there are only
six companies that have 50% or more of their portfolios located in these affordable
markets (see Figure 11). From these companies, only Swiss Prime (MSCI ESG: BBB), which
has 100% of its portfolio in these markets, offer affordable housing options.
Only 9% of residential units globally (managed or in development) are located in cities
where rental levels are affordable, with North American REITs accounting for 79% of these
units. The vast majority of companies’ residential portfolios are located in places where
housing costs range just about the housing affordability threshold, with housing costs
ranging from 40% to 60% of disposable income (see Figure 21, in Annex II). Despite the fact
that nearly 95% of companies manage or develop the majority of their residential portfolios
in locations characterized by unaffordable housing costs, only 23 companies, representing
24% of all residential units, have explicit offerings for housing affordability.17
Finally, we grouped properties with available information on occupancy rates into two
groups, one with properties owned by companies that have affordable housing options
and one with properties owned by companies that do not provide these options. We
found no statistical difference between the occupancy rates of each group.18
16 See Mooney, J., “'Circus sideshow' in NYC luxury residential market takes a dark turn”, 2016, Target Market, SNL
Financial; Stuart, J., “Hot Luxury Items Turn a Bit Cooler”, 03/11/2016, The New York Times. Bagli, C., “At Dizzying
Heights, Prices of Luxury Apartments May Have Found Ceiling”, 03/16/2016, The New York Times; Barbanel, J.
“Manhattan Apartment Sales Hit Speed Bump”, 03/17/2016, The Wall Street Journal. Bagli, C., “Sony Building Is Sold,
Ending Plan for Conversion to Luxury Apartments”, 04/29/2016, The New York Times.
17 The following companies are constituents of MSCI ACWI IMI and have affordable housing offerings. However, there
was no geospatial information available from our data sources to establish portfolio distribution by cities’ housing
affordability level: Sekisui House, Equity Lifestyle, Empiric Student, Icade S.A., Northview, Stockland, Adler, Cedar,
China Vanke, Circle Anglia, Douja, Deutsche Wohneng, Lend Lease, Notting Hill, Robinsons, Sanctuary, U and I.
18 P value = 0.4. For cos. with no affordable options n = 1,328 properties, �̅� = 95.05%. For cos. with affordable options n =
297 properties, �̅� = 94.74%.

MSCI.COM | PAGE 18 OF 48 © 2016 MSCI Inc. All rights reserved. Please refer to the disclaimer at the end of this document.
THE CRISIS OF AFFORDABILITY IN REAL ESTATE | JUNE 2016
EM & above regional median contribution of SMEs to GDP
DM & above regional median contribution of SMEs to GDP
EM & below regional median contribution of SMEs to GDP
DM & below regional median contribution of SMEs to GDP
No data
Sources: ADB, EU Commission, national governments’ documentation, World Bank and MSCI ESG Research.
2 AFFORDABLE COMMERCIAL PROPERTIES
2.1 SMES’ GLOBAL ECONOMIC IMPORTANCE, AND POLICY & BUSINESS BARRIERS
From our meta-analysis of existing literature, we estimate that globally small and medium
enterprises’ (SME) median contribution to a country’s GDP is approximately 50% and we
estimate that the median share of employment that is concentrated in these companies is
about 66%.19 According to the Association of Chartered Certified Accountants, SMEs in the
economic downturn around the world were more likely to hold on to their staff, to continue
to create jobs and, in the aftermath, served as the backbone of the global economy.20
FIGURE 12. Country characterization by SME contribution to national GDP, by country above
and below regional medians
While the aforementioned facts illustrate the key role that SMEs has played in national
economies and societies across the world, affordable business-to-business services catered
to this enterprise segment, in general, lag the breadth and depth of the ones that bigger
companies enjoy.21 Two main reasons why SMEs experience this lagging access to business
services are:
19 For GDP shares, we use SMEs’ data as defined by national governments due to lack of granular data, which implies that
SMEs’ definitions in terms of sizes by employees or by value contribution are heterogeneous. For employment shares,
we used World Bank’s data for SMEs of 250 employees or less.
20 Association of Chartered Certified Accountants, “Small business: a global agenda”, 2010.
21 Beck, T., et al, “Financial and legal constraints to firm growth: does firm size matter?”, 2005, Journal of Finance 60.

MSCI.COM | PAGE 19 OF 48 © 2016 MSCI Inc. All rights reserved. Please refer to the disclaimer at the end of this document.
THE CRISIS OF AFFORDABILITY IN REAL ESTATE | JUNE 2016
Sources: African Development Bank, European Commission, national governments’ documentation, SNL Financial, World Bank and MSCI ESG Research.
1. lack of access to finance targeted to SMEs;22 and,
2. government measures fail to promote SMEs (taxes, grants, ease of doing business).
2.2 SMES’ SHARE OF GDP RELATIVE TO HOME COUNTRY’S MARKET AND REGION
Considering the economic importance of SMEs and the barriers they face, we use the
proportion from countries’ GDPs that these firms represent to gauge the potential market
for a property company if it decided to serve this business segment. The larger role of
SMEs in an economy is associated with higher levels of GDP per capita, smaller shares of the
informal sector in the economy and, in the case of SMEs employment share in
manufacturing, reduced costs of market entry, high property rights protection and more
efficient credit-information sharing.23 In this sense, SMEs’ size in an economy has been
strongly associated with a competitive business environment, which could represent a
desirable factor to consider for impact and strategic investors. We find that, in general,
SMEs in developed markets have had a higher participation in their home economies (see
Figure 12 and last column to the right in Figure 22 in Annex II).24
FIGURE 13. MSCI ACWI IMI real estate constituents that provide affordable real estate for
commercial purposes (proportions by asset values as of December 2015).
22 This includes financing that recognizes the stage of development of an SME (seeding, start-up, etc.) and that adjusts for
negative revenue generation, and for little collateral or risk capital. OECD, “The SME financing gap: theory and
evidence", 2006, Financial Market Trends, Vol. 2006/2.
23 Ayyagari, M., et al, “Small and medium enterprises across the globe”, 2005, World Bank.
24 For a full list of SMEs’ share of countries’ GDP, see Annex I – Figure 20.

MSCI.COM | PAGE 20 OF 48 © 2016 MSCI Inc. All rights reserved. Please refer to the disclaimer at the end of this document.
THE CRISIS OF AFFORDABILITY IN REAL ESTATE | JUNE 2016
2.3 COMMERCIAL PORTFOLIOS MAPPING BY SMES’ SHARE FROM COUNTRY’S GDP
IN MSCI ACWI IMI’S REAL ESTATE COMPANIES
We characterized the commercial property portfolios of 282 property companies in the
MSCI ACWI IMI Index according to the GDP share that SMEs represent in the countries
where properties are located. Companies included in this mapping exercise belong to the
Homebuilding, Real Estate Investment Trusts, and Real Estate Management and
Development GICS Sub-Industries. These companies manage commercial properties in 8,433
cities in 72 countries, their assets sum approximately USD 2.4 trillion as of end of 2015 and,
in this mapping, we account for 51,819 managed properties.25 We excluded from this
mapping 2,691 buildings in the companies’ development pipeline.
We found that lack of access to affordable commercial spaces is not the exception to the
gap of business-to-business services for SMEs, as only Scentre (MSCI ESG: BBB),
Growthpoint (MSCI ESG: A), Schroder REIT (MSCI ESG: AA) and Brixmor (MSCI ESG: BBB)
provide evidence of programs that address the SME segment. The commercial buildings
from these companies represented only 1.8% of the total properties analyzed in this study
(see Figure 13).26
The commercial portfolio mapping by SMEs’ contribution to national GDP, showed that
most properties from MSCI ACWI IMI property companies were located in countries where
these contributions are higher than regional median values, both for the DM (71% of
properties) and EM (90%) cases (see Figure 22 in Annex II). However, this aggregated view
might be misleading for the DM EUR case, which is the only DM region where companies
owned properties mostly in countries where SMEs’ GDP share was below the regional
median.27 For the EM case, Chinese (28% of all EM properties mapped) and South African
(47%) companies drove the high proportion of properties managed in countries that have
above market & regional median proportions of their GDP generated by SMEs.
With respect to the industry breakdown, the global REITs industry, DM NA had the highest
company count, managed most of its properties in countries where the SMEs’ contribution
to GDP is higher than the market & regional median. The opposite was the case for the
Homebuilding and REMD industries, where the latter commercial assets is mostly managed
by European firms classified under the Real Estate Operating Companies GICS sub-industry
(see Figure 22 in Annex II).
25 In the definition of commercial buildings, we included only properties for which their primary use was lodging,
industrial, mixed use, office and retail.
26 See Annex II – Figure 24 for the full mapping of all companies in the set.
27 The small GDP contribution from SMEs in countries from this region could be due to a high share of government
activity in the economy (France), a large share of the economy represented by large corporations (United Kingdom) or
a combination of both, among other factors. See of instance “Business economy – size class analysis”, at
http://ec.europa.eu/eurostat/statistics-explained/index.php/Business_economy_-_size_class_analysis; and, Timbeau,
X., “Is government expenditure in France too high?”, 2012, French Economic Observatory - Sciences Po.

MSCI.COM | PAGE 21 OF 48 © 2016 MSCI Inc. All rights reserved. Please refer to the disclaimer at the end of this document.
THE CRISIS OF AFFORDABILITY IN REAL ESTATE | JUNE 2016
Finally, we found no statistical difference between the occupancy rates of properties
managed by companies that had affordable commercial offerings from properties
managed by companies that do not provide evidence of having these offerings. 28 As it was
the case in the affordable housing options, we acknowledge that data might be insufficient
to claim that, in general, there is no occupancy rate differential between companies offering
affordable commercial spaces options and those not offering these spaces.
28 P value = 0.5. For cos. with no affordable options n = 11,762 properties, �̅� = 92.03%. For cos. with affordable options n =
519 properties, �̅� = 92.30%.

MSCI.COM | PAGE 22 OF 48 © 2016 MSCI Inc. All rights reserved. Please refer to the disclaimer at the end of this document.
THE CRISIS OF AFFORDABILITY IN REAL ESTATE | JUNE 2016
Sources: Company reporting, MSCI ESG Research.
3 ENABLERS: STAKEHOLDERS EASING AFFORDABLE REAL ESTATE
3.1 THE VALUE CHAIN OF AFFORDABLE REAL ESTATE AMONG MSCI ACWI IMI
CONSTITUENTS
The growing problem of unaffordable real estate relates to, among other factors, a
relentless drift from rural population towards urban centers that tightens rental and
homeownership markets with higher rents and property prices, stricter mortgage
requirements, and a highly competitive environment that dilute profit margins for
employers and contribute to stagnant salaries.29 Still, together with property companies, we
identified the Banking, Construction and Engineering, Construction Materials and Building
Products industries, as fundamental links in the value chain for providing affordable real
estate, including construction, renovation and expansion of properties. We identified that
this value chain, however, had a direct effect mostly on affordable homeownership and
SME financing and an indirect effect, if any, in affordable housing rentals from a higher
supply of homes.
FIGURE 14. SME financing as percentage of total loans by region in MSCI ACWI IMI banks
29 See Bolton, M., et al, “Out of reach”, 2015, National Low Income Housing Coalition; and, Lozano-Gracia, N., et al,
“Housing Consumption and Urbanization”, 2014, World Bank.
MSCI.COM | PAGE 23 OF 48 © 2016 MSCI Inc. All rights reserved. Please refer to the disclaimer at the end of this document.
THE CRISIS OF AFFORDABILITY IN REAL ESTATE | JUNE 2016
Sources: Company reporting, MSCI ESG Research.
BANKS
We analyzed the total loan portfolios of 446 banks that are constituents of the MSCI ACWI
IMI, which accounted for USD 14.5 trillion in loans. We found that only HSBC Holdings PLC.
(MSCI ESG: B) explicitly accounted for loans for affordable housing for its UK business.
However, the company considered these loans high risk and it bundled them together with
interest only and sub-prime loans. This bundling categorization suggests that this bank’s
loans for affordable housing did not cater to a market segment identified by good credit
history and a sufficient income to serve its debts (see section 1.4 Median housing costs for
homeownership relative to income, in page 9, in this report for further context).30
While we found no evidence of SME specific credit lines that explicitly target commercial
real estate, SME financing is wide spread across the world. From the same 446 banks
universe in the MSCI ACWI IMI, 199 banks explicitly account for SME lending as part of their
total loans. The region with the most active bank lending to SMEs is Asia-Pacific for both
developed (39% median percentage of total loans to SMEs) and emerging markets (20%),
together with banks located in Northern Africa and the Middle East (22%), see Figure 14.
DM North American banks, where USA-based banks are the majority, have the lowest share
of these types of loans, with a median value of merely 4%. We observe that, in general,
banks located in Emerging Markets have a bigger median share of their loan portfolios
devoted to SMEs (17%) than those in developed markets (12%).31
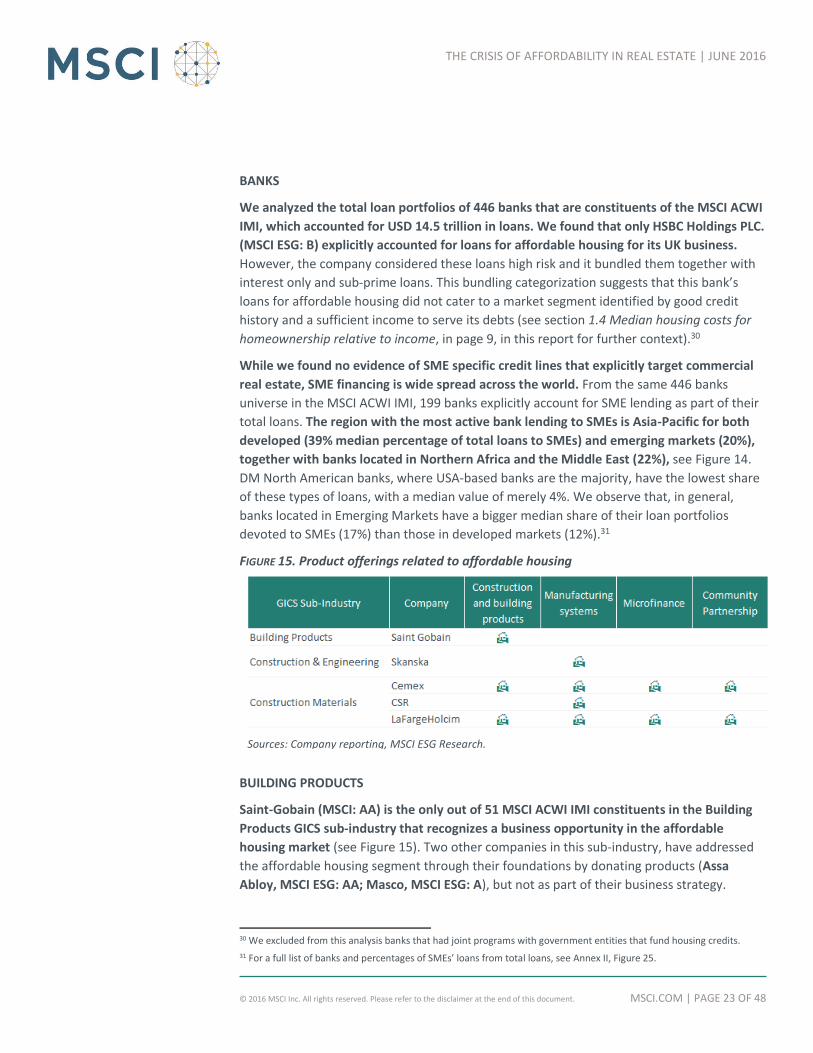
FIGURE 15. Product offerings related to affordable housing
BUILDING PRODUCTS
Saint-Gobain (MSCI: AA) is the only out of 51 MSCI ACWI IMI constituents in the Building
Products GICS sub-industry that recognizes a business opportunity in the affordable
housing market (see Figure 15). Two other companies in this sub-industry, have addressed
the affordable housing segment through their foundations by donating products (Assa
Abloy, MSCI ESG: AA; Masco, MSCI ESG: A), but not as part of their business strategy.
30 We excluded from this analysis banks that had joint programs with government entities that fund housing credits.
31 For a full list of banks and percentages of SMEs’ loans from total loans, see Annex II, Figure 25.

MSCI.COM | PAGE 24 OF 48 © 2016 MSCI Inc. All rights reserved. Please refer to the disclaimer at the end of this document.
THE CRISIS OF AFFORDABILITY IN REAL ESTATE | JUNE 2016
Affordable homeownership & upgrading existing property
Affordable homeownership & affordable renting
Affordable homeownership
Affordable renting
Affordable homeownership, upgrading existing property & affordable renting No data
Sources: Hammam, S., “Housing Matters”. 2014, World Bank; Woetzel, J., et al, “A blueprint for addressing the global affordable housing challenge”, 2014, McKinsey Global Institute; World Bank, ”Access to Affordable and Low-Income Housing in East Asia and the Pacific” 2014, World Bank; Boiron, P., et al, “Commercial Real Estate Investing in Canada: The Complete Reference for Real Estate Professionals”, 2010, John Wiley & Sons, MSCI ESG Research.
CONSTRUCTION AND ENGINEERING
Skanska's (MSCI ESG: AAA), the only company out of 89 constituents of this industry in the
MSCI ACWI IMI, manufactures affordable houses under the brand BoKlok through a joint
venture with IKEA. The company produces BoKlok modules that can be fully assembled on-
site in one day.
CONSTRUCTION MATERIALS
From 42 companies in the industry peer set of the Construction Materials sub-industry in
the MSCI ACWI IMI, Cemex (MSCI ESG: BBB) and LafargeHolcim (MSCI ESG: AA) are two of
the three companies that offer a range of affordable housing products, including not only
construction materials, but also microfinance and manufacturing systems. In addition,
these two companies participate in community partnership programs to build and enhance
knowledge and skills on affordable housing (see Figure 15). CSR Ltd. (MSCI ESG: BBB) is the
third company that offers some affordable housing solutions by piloting prefabricated
concrete walls in collaboration with Mirvac (MSCI ESG: AAA) (see Figure 15). CSR Ltd. (MSCI
ESG: BBB) and Mirvac (MSCI ESG: AAA) have both achieved a faster construction time and
lower costs. However, this pilot program has not become an extended business practice for
CSR Ltd. (MSCI ESG: BBB).
FIGURE 16. Affordable residential real estate policies by country

MSCI.COM | PAGE 25 OF 48 © 2016 MSCI Inc. All rights reserved. Please refer to the disclaimer at the end of this document.
THE CRISIS OF AFFORDABILITY IN REAL ESTATE | JUNE 2016
3.2 PUBLIC POLICIES ON AFFORDABLE RESIDENTIAL REAL ESTATE
From our meta-analysis of existing literature, we found little evidence of regulations that
target fostering affordable real estate for commercial purposes. However, the evidence of
policies aimed at residential affordability is abundant (see sources in Figure 16). We
evaluated 180 policies that relate to affordable homeownership,32 upgrading existing
property33 and affordable renting34 in 33 countries across the world and the European
Union. The most numerous policies across countries were those related to homeownership,
followed by rental ones. While the list of policies in these countries might not be
exhaustive, we found that countries with the highest number of policies enjoyed some
type of housing affordability, either rental, ownership or both.35
This is the case for the USA (31 policies) with median affordable levels of homeownership,
India (17) with median levels of affordable rental housing and Canada (13) with median
affordable levels for both, rental and homeownership. The two exceptions to this pattern
are the UK (14) and China (13), where median levels of housing unaffordability for rentals
and homeownership are high. For the UK case, research points that land use and land use
change restrictions are the main source for housing unaffordability.36 While for the China
case, the rapid urbanization of the country and the highly speculative residential market
seem to be the cause.37
32 Policies that relate to affordable homeownership include: fund homeowner associations to aggregate demand, laws
that set minimum requirements for "decent" housing, mortgage guarantees, loans and subsidies for homebuyers and
developers, securitization of mortgages, tax credits, laws allowing foreign funding, programs that cap home prices in
exchange of guarantees for developers, share ownership schemes, schemes for vulnerable population (including
disabled, elderly, homeless and those living in overcrowded conditions), programs first-time buyers, programs for
cross-checking eligibility of benefits, lotteries and waiting list schemes, grants, guidance and technical assistance
programs, government housing organizations, land or unit allocation for affordable housing, slum rehabilitation
through new infrastructure, land auctioning for affordable housing purposes, taxes to fund affordable housing, reduced
permitting times, infill affordable homeownership, facilitation of brownfield remediation, tax exemptions for
developers, density bonuses, saving programs for down payments, zoning, tenure formalization, direct financing,
valorization charges, differentiated utilities charges.
33 Policies that relate to upgrading existing property include: weatherization programs, energy efficiency for affordable
housing, funding of housing associations that allocate funds for refurbishing existing housing stock, tax relief for
upgrading sub-standard homes, forgivable loans for major repairs, rehabilitation of slum housing, utility credits for
upgrading of substandard housing, grants for energy and water efficiency projects, expedite permitting, technical
assistance and guidance.
34 Policies that relate to affordable renting include: rent control, subsidized apartment buildings, tax credits, housing
vouchers, rent subsidies, tax and legal protections for tenants, criteria for assigning affordable rentals based in needs,
technical assistance for affordable rentals, quotas of affordable units for new developments, programs for preserving
affordable housing, public rental housing.
35 See definition of housing affordability in the section 1.1 Defining affordability: how much and for whom, how big,
where?, page 6, in this report.
36 Hilber, C., et al, “The impact of supply constraints on house prices in England”, 2014, Economic Journal.
37 Chiang, A. L., “China's ‘affordable housing’ numbers don't quite add up", 2012, Reuters.
MSCI.COM | PAGE 26 OF 48 © 2016 MSCI Inc. All rights reserved. Please refer to the disclaimer at the end of this document.
THE CRISIS OF AFFORDABILITY IN REAL ESTATE | JUNE 2016
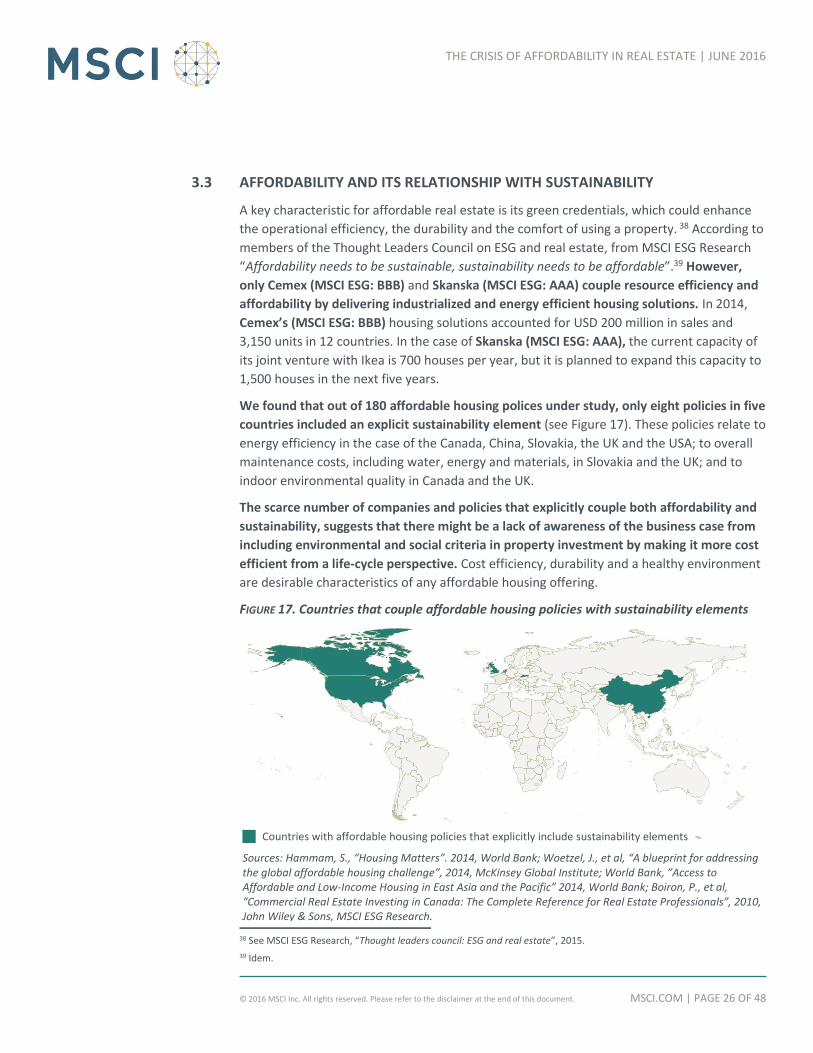
Countries with affordable housing policies that explicitly include sustainability elements
Sources: Hammam, S., “Housing Matters”. 2014, World Bank; Woetzel, J., et al, “A blueprint for addressing the global affordable housing challenge”, 2014, McKinsey Global Institute; World Bank, ”Access to Affordable and Low-Income Housing in East Asia and the Pacific” 2014, World Bank; Boiron, P., et al, “Commercial Real Estate Investing in Canada: The Complete Reference for Real Estate Professionals”, 2010, John Wiley & Sons, MSCI ESG Research.
3.3 AFFORDABILITY AND ITS RELATIONSHIP WITH SUSTAINABILITY
A key characteristic for affordable real estate is its green credentials, which could enhance
the operational efficiency, the durability and the comfort of using a property. 38 According to
members of the Thought Leaders Council on ESG and real estate, from MSCI ESG Research
“Affordability needs to be sustainable, sustainability needs to be affordable”.39 However,
only Cemex (MSCI ESG: BBB) and Skanska (MSCI ESG: AAA) couple resource efficiency and
affordability by delivering industrialized and energy efficient housing solutions. In 2014,
Cemex’s (MSCI ESG: BBB) housing solutions accounted for USD 200 million in sales and
3,150 units in 12 countries. In the case of Skanska (MSCI ESG: AAA), the current capacity of
its joint venture with Ikea is 700 houses per year, but it is planned to expand this capacity to
1,500 houses in the next five years.
We found that out of 180 affordable housing polices under study, only eight policies in five
countries included an explicit sustainability element (see Figure 17). These policies relate to
energy efficiency in the case of the Canada, China, Slovakia, the UK and the USA; to overall
maintenance costs, including water, energy and materials, in Slovakia and the UK; and to
indoor environmental quality in Canada and the UK.
The scarce number of companies and policies that explicitly couple both affordability and
sustainability, suggests that there might be a lack of awareness of the business case from
including environmental and social criteria in property investment by making it more cost
efficient from a life-cycle perspective. Cost efficiency, durability and a healthy environment
are desirable characteristics of any affordable housing offering.
FIGURE 17. Countries that couple affordable housing policies with sustainability elements
38 See MSCI ESG Research, “Thought leaders council: ESG and real estate”, 2015.
39 Idem.
MSCI.COM | PAGE 27 OF 48 © 2016 MSCI Inc. All rights reserved. Please refer to the disclaimer at the end of this document.
THE CRISIS OF AFFORDABILITY IN REAL ESTATE | JUNE 2016
APPENDIX
METHODOLOGY AND ASSUMPTIONS FOR DEFINING HOUSING AFFORDABILITY
HOW MUCH & FOR WHOM?
For assessing residential affordability, we include two housing options: rental properties
and homeownership. For both options, we use the same assumption of median housing
costs not exceeding 40% of the annual median disposable income per household, i.e., net
income after policy interventions, such as taxes and subsidies. This threshold, however, does
not include potential housing-related savings aimed to cover, for instance, home
improvements, home appliances and furniture, or a property down payment.
We consider this 40% rule to be a representative measure of housing affordability for
several reasons. First, this threshold reflects the latest related reference threshold in a
common indicator used at the European Union level.40 Second, this threshold approximates
the maximum front-end qualifying ratio in the USA,41 as percentage of median income after
taxes, which we found to be 37%.42 Finally, it is a market practice in the US, to set an annual
gross salary qualification requirement to lease a property at a level of 40 times or higher the
monthly property rent, which represents about 40% of net disposable income using the
aforementioned tax assumptions.
We calculate net income levels per household at the city level by, first, using Numbeo’s
database43 of local individual incomes and, second, by extrapolating at the city level the
40 Di Meglio, E., Op. Cit. The Indicators Sub-group of the EU Social Protection Committee developed this threshold
empirically. The most important reason for the choice of this threshold is that it proved to be less sensitive to
measurement errors and to the poor international comparability linked to the major national differences in the
implementation of the housing cost burden definition (e.g., content of mortgage repayments in the housing cost
burden numerator). In this sense, a 40% threshold is more likely to identify correctly the population most at risk
because of housing cost burden. Source: personal communication, European Commission Directorate General of
Employment, Social Affairs & Inclusion, January 2016.
41 A qualifying ratio is a measure of housing expenses of a borrower for a mortgage, compared to the borrower’s gross
monthly income. This ratio is used by lenders to approve borrowers for accessing a mortgage loan. The borrower's
front-end ratio is generally limited to 28% as a market practice.
42 The marginal federal income tax rate in the USA for population earning a gross annual income in the percentile range of
41 to 60, is 25%. Gross income for this population bracket ranges for single taxable incomes between USD 37,451 to
USD 90,750, and for head of household between USD 50,201 to USD $129,600. Source: U.S. Code § 1411 - Imposition of
Tax.
43 Numbeo is a crowd-sourced information database, see http://www.numbeo.com. We acknowledge the uncertainty in
the quality of raw, voluntarily reported data given, but not limited, to the following considerations: (A) Data from
different periods.- the data that is used in the present report was retrieved in December 2015, but the stamp date and
exchange rate that were utilized to calculate each value that we use is uncertain. (B) Statistical significance of data.-
there is uncertainty in the statistical significance of data, given that the number of observations that were used to
calculate each value is unknown. (C) Overestimation of values.- given that data input is provided by home seekers and
by people related to leasing real estate, it is possible that the values overestimate income and rental levels in a market,
as new rents are usually higher than existing ones and usually leasers with the best income profile get to rent a
property. (D) Data aggregation. - values only reflect properties of certain size and location in a city, it is unknown if the
characteristics chosen by Numbeo as typical for properties in each location truly reflect local real estate markets.

MSCI.COM | PAGE 28 OF 48 © 2016 MSCI Inc. All rights reserved. Please refer to the disclaimer at the end of this document.
THE CRISIS OF AFFORDABILITY IN REAL ESTATE | JUNE 2016
number of economically active people per household of the respective country.44 We
include rent or mortgage payments as part of housing costs in the rental and
homeownership sections, respectively, together with local costs of utilities.45
HOW BIG?
For establishing minimum livable space sizes, we followed the Canadian National Occupancy
Standard on housing suitability of private household and adopted a maximum occupancy of
two people per bedroom to avoid household overcrowding.46 We consider that this
persons-per-bedroom standard best addresses overcrowding concerns and fits lack of
harmonized definitions across countries and limitations of Numbeo’s data on the apartment
characteristics.47 Together with addressing fire safety issues, existing literature suggests that
housing overcrowding is associated with the spread of some airborne and enteric infectious
diseases, poor school or work performance, slow recovery from illness and psychological
stress in both children and adults, but particularly in women, among other adverse effects.48
We assumed that the typical household configuration at the national level, in terms of
number of persons, gender and age composition of household members, was representative
at the city level. In general, however, gender and age composition of a typical household at
the national level become imperceptible and only number of household members remains
as a meaningful variable to inform minimal housing sizes of an affordable, not overcrowded
dwelling. For 70 out of 98 countries that we analyze, we found that the minimal housing
size to avoid overcrowding was two bedrooms. Only for 28 countries, all in EM, the
minimal size was three bedrooms (e.g., India, Mexico, S. Africa).
44 See http://www.ilo.org/ilostat. All values that were used for this report correspond to ILO’s projections for 2015.
45 Utilities cost include both internet (speed: 10 Mbps; data package: unlimited data; broadband connection: cable/ADSL)
and basic utilities (electricity, heating, water, garbage collection) for an 85 m2 (915 ft2) space, which we assumed it was
close enough to our assumption of a two bedroom and 80 m2 (861 ft2). We made no further assumptions for a three
room apartment of 110 m2 (1,184 ft2), due to lack of data. See http://www.numbeo.com.
46 See http://www.statcan.gc.ca/eng/concepts/definitions/dwelling06. The Canadian National Occupancy Standard on
maximum occupancy rate of two people per bedroom is generally in line with the occupancy requirements in the US
that stipulate residential property occupancy rate per person to be on average 200 ft2 (specific standards vary by state).
This requirement translates to 800 ft2 (75 m2) per family of four and is comparable to a two-bedroom apartment
requirement set by the CNOS.
47 Data limitations include lack of information to identify number of rooms and size of rooms per apartment by city from
the available data sources. The use of a hybrid measure that includes people-per-bedroom, people-per-room and area-
per-person would be ideal to define a housing size that more accurately precludes household overcrowding. See
Econometrica, Blake, K,. Kellerson, R., Simic, A., ICF, “Measuring Overcrowding in Housing”, 2007, U.S. Department of
Housing and Urban Development Office of Policy Development and Research.
48 Overcrowding definitions when using number of rooms to determine a minimal accepted size of a housing unit include
restrictions by age and gender to determine whether persons can share the same room. In the Canadian legislation,
children under five of different sexes are permitted to share a room. The age at which young adults should have their
own room is 18, unless they are a couple. Any person aged five to 17 of the same sex are permitted to share a room.
Gray, A., “Definitions of Crowding and the Effects of Crowding on Health: a Literature Review”, 2001, Ministry of Social
Policy, Te Manatu¯ mo¯ nga¯ Kaupapa Oranga Tangata, New Zealand.

MSCI.COM | PAGE 29 OF 48 © 2016 MSCI Inc. All rights reserved. Please refer to the disclaimer at the end of this document.
THE CRISIS OF AFFORDABILITY IN REAL ESTATE | JUNE 2016
Sources: United Nations World Urbanization Prospects.
COUNTRIES AND CITIES IN THIS REPORT
In this report, we account for 307 cities in 97 countries, which comprise approximately 658
million inhabitants or 19% of urban population in those countries. These 97 countries made
up in 2015 for 89% of the world’s urban population and by 2050 they will represent
approximately 83% (see Figure 18).
FIGURE 18. Urban population from 2000 to 2010.

MSCI.COM | PAGE 30 OF 48 © 2016 MSCI Inc. All rights reserved. Please refer to the disclaimer at the end of this document.
THE CRISIS OF AFFORDABILITY IN REAL ESTATE | JUNE 2016
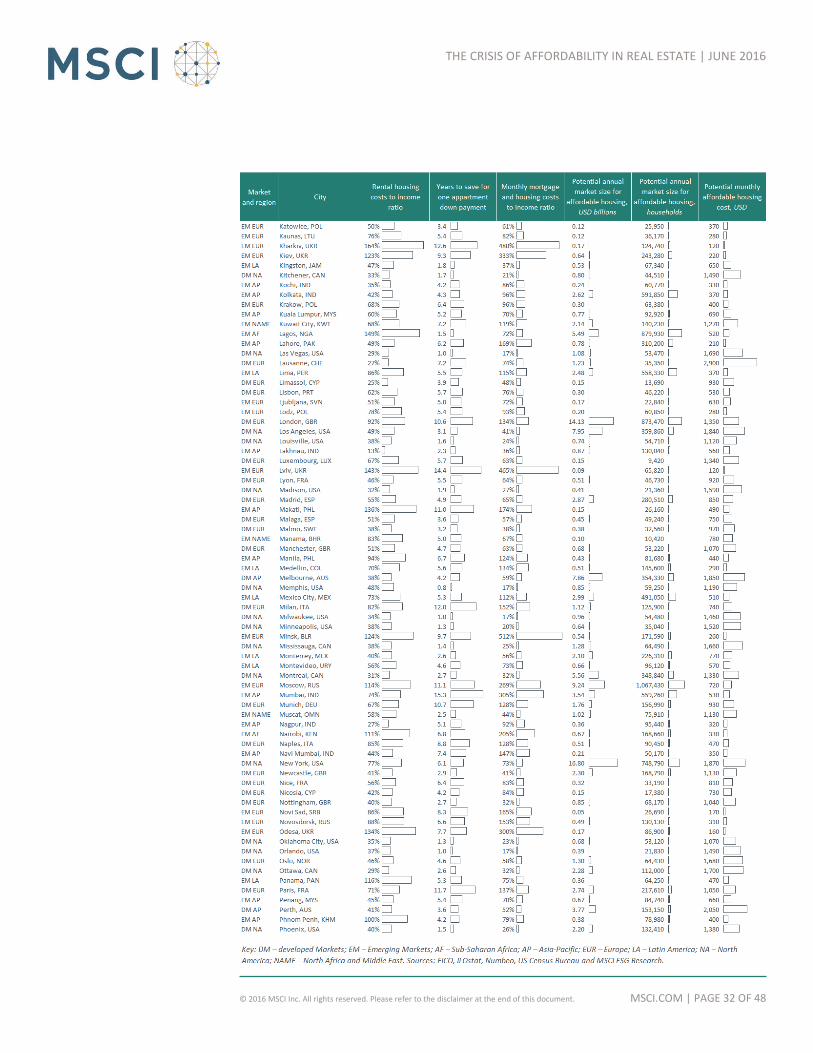
ANNEX I – CITY AND COUNTRY SUMMARY TABLES
FIGURE 19 Affordable housing features by city globally.

MSCI.COM | PAGE 31 OF 48 © 2016 MSCI Inc. All rights reserved. Please refer to the disclaimer at the end of this document.
THE CRISIS OF AFFORDABILITY IN REAL ESTATE | JUNE 2016
MSCI.COM | PAGE 32 OF 48 © 2016 MSCI Inc. All rights reserved. Please refer to the disclaimer at the end of this document.
THE CRISIS OF AFFORDABILITY IN REAL ESTATE | JUNE 2016

MSCI.COM | PAGE 33 OF 48 © 2016 MSCI Inc. All rights reserved. Please refer to the disclaimer at the end of this document.
THE CRISIS OF AFFORDABILITY IN REAL ESTATE | JUNE 2016

MSCI.COM | PAGE 34 OF 48 © 2016 MSCI Inc. All rights reserved. Please refer to the disclaimer at the end of this document.
THE CRISIS OF AFFORDABILITY IN REAL ESTATE | JUNE 2016

MSCI.COM | PAGE 35 OF 48 © 2016 MSCI Inc. All rights reserved. Please refer to the disclaimer at the end of this document.
THE CRISIS OF AFFORDABILITY IN REAL ESTATE | JUNE 2016
FIGURE 20 Proportion of urban population from sample cities, GINI coefficient and SMEs’
share of national GDP
Key: DM – developed Markets; EM – Emerging Markets; AF – Sub-Saharan Africa; AP – Asia-Pacific; EUR – Europe; LA – Latin America; NA – North America; NAME – North Africa and Middle East. Sources: African Development Bank, European Commission, national governments’ documentation, World Bank and MSCI ESG Research. For the purposes of this report, we categorize as developed markets those countries that are included in the developed markets membership of MSCI World Index. We classified countries as Emerging Markets, if they were members of MSCI Emerging & Frontier Markets Index. For the exact definition of developed, emerging and frontier markets under MSCI’s index taxonomy, please refer to https://www.msci.com/market-cap-weighted-indexes. For the rest of the countries that are included in this report and do not have a membership in MSCI’s market capitalization weighted indexes, we followed IMF’s advanced economies definitions to classify them as developed markets, and further supplemented this source with the US CIA’s World Factbook list of developed countries. See: International Monetary Fund, “World Economic Outlook: Adjusting to Lower Commodity Prices”, 2015; and https://www.cia.gov/library/publications/the-world-factbook /appendix/appendix-b.html.

MSCI.COM | PAGE 36 OF 48 © 2016 MSCI Inc. All rights reserved. Please refer to the disclaimer at the end of this document.
THE CRISIS OF AFFORDABILITY IN REAL ESTATE | JUNE 2016
Sources: Corporate reports, ILOstat, Numbeo, SNL Financial and MSCI ESG Research.
ANNEX II – PROPERTY PORTFOLIOS AND SME LOANS
FIGURE 21. Residential portfolios aggregated by region and industry depending on housing affordability of cities where properties are located

MSCI.COM | PAGE 37 OF 48 © 2016 MSCI Inc. All rights reserved. Please refer to the disclaimer at the end of this document.
THE CRISIS OF AFFORDABILITY IN REAL ESTATE | JUNE 2016
Sources: African Development Bank, European Commission, national governments’ documentation, SNL Financial, World Bank and MSCI ESG Research.
FIGURE 22. Commercial portfolio mapping by SME contribution to national GDP

MSCI.COM | PAGE 38 OF 48 © 2016 MSCI Inc. All rights reserved. Please refer to the disclaimer at the end of this document.
THE CRISIS OF AFFORDABILITY IN REAL ESTATE | JUNE 2016
* = company with affordable residential offerings. Sources: Corporate reports, ILOstat, Numbeo, SNL Financial and MSCI ESG Research.
FIGURE 23 Residential portfolio segmentation by housing affordability level of location

MSCI.COM | PAGE 39 OF 48 © 2016 MSCI Inc. All rights reserved. Please refer to the disclaimer at the end of this document.
THE CRISIS OF AFFORDABILITY IN REAL ESTATE | JUNE 2016
* = company with affordable residential offerings. Sources: Corporate reports, ILOstat, Numbeo, SNL Financial and MSCI ESG Research.

MSCI.COM | PAGE 40 OF 48 © 2016 MSCI Inc. All rights reserved. Please refer to the disclaimer at the end of this document.
THE CRISIS OF AFFORDABILITY IN REAL ESTATE | JUNE 2016
FIGURE 24 Commercial portfolio segmentation by SME contribution to national GDP relative
to median values by market and region
* = company with affordable commercial offerings. Sources: African Development Bank, European Commission, national governments’ documentation, SNL Financial, World Bank and MSCI ESG Research.

MSCI.COM | PAGE 41 OF 48 © 2016 MSCI Inc. All rights reserved. Please refer to the disclaimer at the end of this document.
THE CRISIS OF AFFORDABILITY IN REAL ESTATE | JUNE 2016
* = company with affordable commercial offerings. Sources: African Development Bank, European Commission, national governments’ documentation, SNL Financial, World Bank and MSCI ESG Research.

MSCI.COM | PAGE 42 OF 48 © 2016 MSCI Inc. All rights reserved. Please refer to the disclaimer at the end of this document.
THE CRISIS OF AFFORDABILITY IN REAL ESTATE | JUNE 2016
* = company with affordable commercial offerings. Sources: African Development Bank, European Commission, national governments’ documentation, SNL Financial, World Bank and MSCI ESG Research.

MSCI.COM | PAGE 43 OF 48 © 2016 MSCI Inc. All rights reserved. Please refer to the disclaimer at the end of this document.
THE CRISIS OF AFFORDABILITY IN REAL ESTATE | JUNE 2016
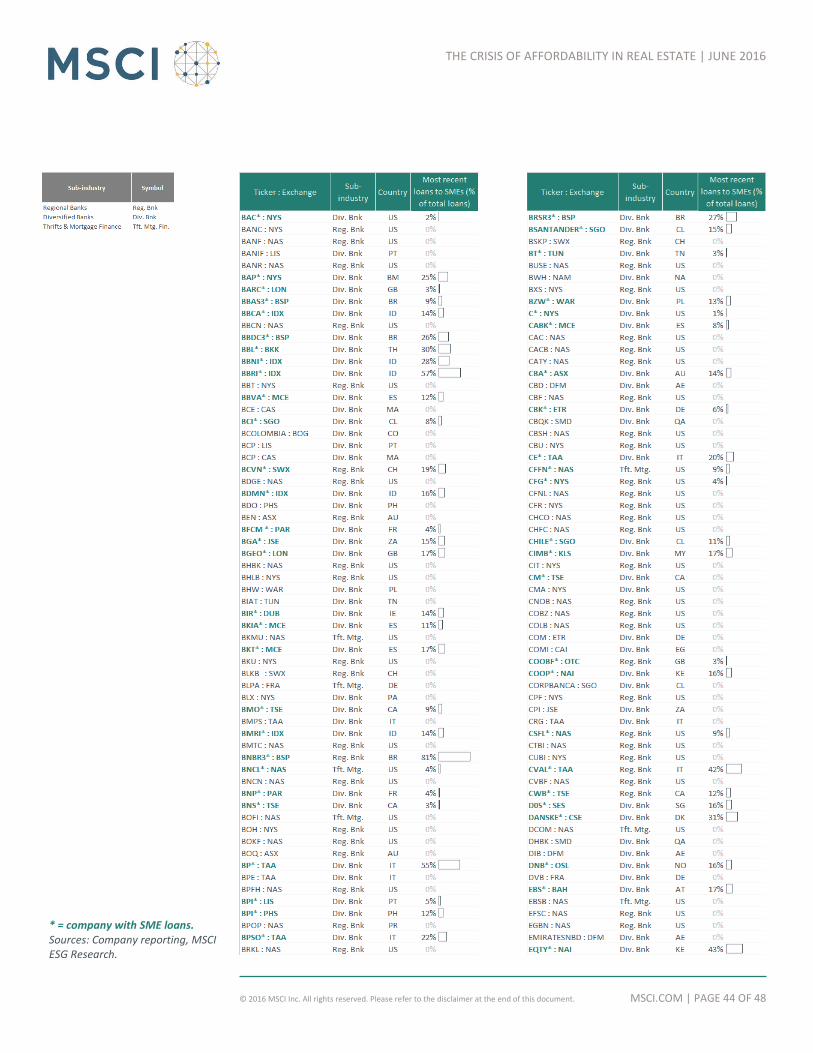
* = company with SME loans. Sources: Company reporting, MSCI ESG Research.
FIGURE 25 SME financing as percentage of total loans by company49
49 N.B.: For MSCI’s Sustainable Impact Index, we use the following formula for calculating the percentage of revenues
coming from SMEs: (percentage of loans to SME) * (net interest income) / total sales.
* = company with affordable commercial offerings. Sources: African Development Bank, European Commission, national governments’ documentation, SNL Financial, World Bank and MSCI ESG Research.
MSCI.COM | PAGE 44 OF 48 © 2016 MSCI Inc. All rights reserved. Please refer to the disclaimer at the end of this document.
THE CRISIS OF AFFORDABILITY IN REAL ESTATE | JUNE 2016
* = company with SME loans. Sources: Company reporting, MSCI ESG Research.

MSCI.COM | PAGE 45 OF 48 © 2016 MSCI Inc. All rights reserved. Please refer to the disclaimer at the end of this document.
THE CRISIS OF AFFORDABILITY IN REAL ESTATE | JUNE 2016
* = company with SME loans. Sources: Company reporting, MSCI ESG Research.

MSCI.COM | PAGE 46 OF 48 © 2016 MSCI Inc. All rights reserved. Please refer to the disclaimer at the end of this document.
THE CRISIS OF AFFORDABILITY IN REAL ESTATE | JUNE 2016
* = company with SME loans. Sources: Company reporting, MSCI ESG Research.
JUNE 2016
THEMATIC REPORT
AMERICAS
+ 1 212 804 5299
EUROPE, MIDDLE EAST & AFRICA
+ 44 20 7618 2510
ASIA PACIFIC
+ 612 9033 9339
ABOUT MSCI ESG RESEARCH PRODUCTS
AND SERVICES
MSCI ESG Research products and services
are provided by MSCI ESG Research Inc.,
and are designed to provide in-depth
research, ratings and analysis of
environmental, social and governance-
related business practices to companies
worldwide. ESG ratings, data and analysis
from MSCI ESG Research Inc. are also used
in the construction of the MSCI ESG
Indexes. MSCI ESG Research Inc. is a
Registered Investment Adviser under the
Investment Advisers Act of 1940 and a
subsidiary of MSCI Inc.
ABOUT MSCI
For more than 40 years, MSCI’s research-
based indexes and analytics have helped
the world’s leading investors build and
manage better portfolios. Clients rely on
our offerings for deeper insights into the
drivers of performance and risk in their
portfolios, broad asset class coverage and
innovative research.
Our line of products and services includes
indexes, analytical models, data, real estate
benchmarks and ESG research.
MSCI serves 98 of the top 100 largest
money managers, according to the most
recent P&I ranking.
For more information, visit us at
www.msci.com.
CONTACT US

THE CRISIS OF AFFORDABILITY IN REAL ESTATE | JUNE 2016
MSCI.COM | PAGE 48 OF 48 © 2016 MSCI Inc. All rights reserved.
This document and all of the information contained in it, including without limitation all text, data, graphs, charts (collectively, the “Information”) is the property of MSCI Inc. or its subsidiaries (collectively, “MSCI”), or MSCI’s licensors, direct or indirect suppliers or any third party involved in making or compiling any Information (collectively, with MSCI, the “Information Providers”) and is provided for informational purposes only. The Information may not be modified, reverse-engineered, reproduced or redisseminated in whole or in part without prior written permission from MSCI.
The Information may not be used to create derivative works or to verify or correct other data or information. For example (but without limitation), the Information may not be used to create indexes, databases, risk models, analytics, software, or in connection with the issuing, offering, sponsoring, managing or marketing of any securities, portfolios, financial products or other investment vehicles utilizing or based on, linked to, tracking or otherwise derived from the Information or any other MSCI data, information, products or services.
The user of the Information assumes the entire risk of any use it may make or permit to be made of the Information. NONE OF THE INFORMATION PROVIDERS MAKES ANY EXPRESS OR IMPLIED WARRANTIES OR REPRESENTATIONS WITH RESPECT TO THE INFORMATION (OR THE RESULTS TO BE OBTAINED BY THE USE THEREOF), AND TO THE MAXIMUM EXTENT PERMITTED BY APPLICABLE LAW, EACH INFORMATION PROVIDER EXPRESSLY DISCLAIMS ALL IMPLIED WARRANTIES (INCLUDING, WITHOUT LIMITATION, ANY IMPLIED WARRANTIES OF ORIGINALITY, ACCURACY, TIMELINESS, NON-INFRINGEMENT, COMPLETENESS, MERCHANTABILITY AND FITNESS FOR A PARTICULAR PURPOSE) WITH RESPECT TO ANY OF THE INFORMATION.
Without limiting any of the foregoing and to the maximum extent permitted by applicable law, in no event shall any Information Provider have any liability regarding any of the Information for any direct, indirect, special, punitive, consequential (including lost profits) or any other damages even if notified of the possibility of such damages. The foregoing shall not exclude or limit any liability that may not by applicable law be excluded or limited, including without limitation (as applicable), any liability for death or personal injury to the extent that such injury results from the negligence or willful default of itself, its servants, agents or sub-contractors.
Information containing any historical information, data or analysis should not be taken as an indication or guarantee of any future performance, analysis, forecast or prediction. Past performance does not guarantee future results.
The Information should not be relied on and is not a substitute for the skill, judgment and experience of the user, its management, employees, advisors and/or clients when making investment and other business decisions. All Information is impersonal and not tailored to the needs of any person, entity or group of persons.
None of the Information constitutes an offer to sell (or a solicitation of an offer to buy), any security, financial product or other investment vehicle or any trading strategy.
It is not possible to invest directly in an index. Exposure to an asset class or trading strategy or other category represented by an index is only available through third party investable instruments (if any) based on that index. MSCI does not issue, sponsor, endorse, market, offer, review or otherwise express any opinion regarding any fund, ETF, derivative or other security, investment, financial product or trading strategy that is based on, linked to or seeks to provide an investment return related to the performance of any MSCI index (collectively, “Index Linked Investments”). MSCI makes no assurance that any Index Linked Investments will accurately track index performance or provide positive investment returns. MSCI Inc. is not an investment adviser or fiduciary and MSCI makes no representation regarding the advisability of investing in any Index Linked Investments.
Index returns do not represent the results of actual trading of investible assets/securities. MSCI maintains and calculates indexes, but does not manage actual assets. Index returns do not reflect payment of any sales charges or fees an investor may pay to purchase the securities underlying the index or Index Linked Investments. The imposition of these fees and charges would cause the performance of an Index Linked Investment to be different than the MSCI index performance.
The Information may contain back tested data. Back-tested performance is not actual performance, but is hypothetical. There are frequently material differences between back tested performance results and actual results subsequently achieved by any investment strategy.
Constituents of MSCI equity indexes are listed companies, which are included in or excluded from the indexes according to the application of the relevant index methodologies. Accordingly, constituents in MSCI equity indexes may include MSCI Inc., clients of MSCI or suppliers to MSCI. Inclusion of a security within an MSCI index is not a recommendation by MSCI to buy, sell, or hold such security, nor is it considered to be investment advice.
Data and information produced by various affiliates of MSCI Inc., including MSCI ESG Research Inc. and Barra LLC, may be used in calculating certain MSCI indexes. More information can be found in the relevant index methodologies on www.msci.com.
MSCI receives compensation in connection with licensing its indexes to third parties. MSCI Inc.’s revenue includes fees based on assets in Index Linked Investments. Information can be found in MSCI Inc.’s company filings on the Investor Relations section of www.msci.com.
MSCI ESG Research Inc. is a Registered Investment Adviser under the Investment Advisers Act of 1940 and a subsidiary of MSCI Inc. Except with respect to any applicable products or services from MSCI ESG Research, neither MSCI nor any of its products or services recommends, endorses, approves or otherwise expresses any opinion regarding any issuer, securities, financial products or instruments or trading strategies and MSCI’s products or services are not intended to constitute investment advice or a recommendation to make (or refrain from making) any kind of investment decision and may not be relied on as such. Issuers mentioned or included in any MSCI ESG Research materials may include MSCI Inc., clients of MSCI or suppliers to MSCI, and may also purchase research or other products or services from MSCI ESG Research. MSCI ESG Research materials, including materials utilized in any MSCI ESG Indexes or other products, have not been submitted to, nor received approval from, the United States Securities and Exchange Commission or any other regulatory body.
Any use of or access to products, services or information of MSCI requires a license from MSCI. MSCI, Barra, RiskMetrics, IPD, FEA, InvestorForce, and other MSCI brands and product names are the trademarks, service marks, or registered trademarks of MSCI or its subsidiaries in the United States and other jurisdictions. The Global Industry Classification Standard (GICS) was developed by and is the exclusive property of MSCI and Standard & Poor’s. “Global Industry Classification Standard (GICS)” is a service mark of MSCI and Standard & Poor’s.
NOTICE AND DISCLAIMER
Related Documents