Aalborg Universitet The Crest Wing Wave Energy Device 2nd phase testing Kofoed, Jens Peter; Antonishen, Michael Patrick Publication date: 2009 Document Version Publisher's PDF, also known as Version of record Link to publication from Aalborg University Citation for published version (APA): Kofoed, J. P., & Antonishen, M. P. (2009). The Crest Wing Wave Energy Device: 2nd phase testing. Aalborg: Department of Civil Engineering, Aalborg University. DCE Technical reports, No. 59 General rights Copyright and moral rights for the publications made accessible in the public portal are retained by the authors and/or other copyright owners and it is a condition of accessing publications that users recognise and abide by the legal requirements associated with these rights. ? Users may download and print one copy of any publication from the public portal for the purpose of private study or research. ? You may not further distribute the material or use it for any profit-making activity or commercial gain ? You may freely distribute the URL identifying the publication in the public portal ? Take down policy If you believe that this document breaches copyright please contact us at [email protected] providing details, and we will remove access to the work immediately and investigate your claim. Downloaded from vbn.aau.dk on: januar 31, 2019

Welcome message from author
This document is posted to help you gain knowledge. Please leave a comment to let me know what you think about it! Share it to your friends and learn new things together.
Transcript

Aalborg Universitet
The Crest Wing Wave Energy Device
2nd phase testing
Kofoed, Jens Peter; Antonishen, Michael Patrick
Publication date:2009
Document VersionPublisher's PDF, also known as Version of record
Link to publication from Aalborg University
Citation for published version (APA):Kofoed, J. P., & Antonishen, M. P. (2009). The Crest Wing Wave Energy Device: 2nd phase testing. Aalborg:Department of Civil Engineering, Aalborg University. DCE Technical reports, No. 59
General rightsCopyright and moral rights for the publications made accessible in the public portal are retained by the authors and/or other copyright ownersand it is a condition of accessing publications that users recognise and abide by the legal requirements associated with these rights.
? Users may download and print one copy of any publication from the public portal for the purpose of private study or research. ? You may not further distribute the material or use it for any profit-making activity or commercial gain ? You may freely distribute the URL identifying the publication in the public portal ?
Take down policyIf you believe that this document breaches copyright please contact us at [email protected] providing details, and we will remove access tothe work immediately and investigate your claim.
Downloaded from vbn.aau.dk on: januar 31, 2019
ISSN 1901-726X DCE Technical Report No. 59
The Crest Wing Wave Energy Device
- 2nd phase testing
J. P. Kofoed M. Antonishen
Department of Civil Engineering


DCE Technical Report No. 59
The Crest Wing Wave Energy Device – 2nd phase testing
by
J. P. Kofoed M. Antonishen
March 2009
© Aalborg University
Aalborg University Department of Civil Engineering
Water and Soil


Scientific Publications at the Department of Civil Engineering
Technical Reports are published for timely dissemination of research results and scientific work
carried out at the Department of Civil Engineering (DCE) at Aalborg University. This medium
allows publication of more detailed explanations and results than typically allowed in scientific
journals.
Technical Memoranda are produced to enable the preliminary dissemination of scientific work by
the personnel of the DCE where such release is deemed to be appropriate. Documents of this kind
may be incomplete or temporary versions of papers—or part of continuing work. This should be
kept in mind when references are given to publications of this kind.
Contract Reports are produced to report scientific work carried out under contract. Publications of
this kind contain confidential matter and are reserved for the sponsors and the DCE. Therefore,
Contract Reports are generally not available for public circulation.
Lecture Notes contain material produced by the lecturers at the DCE for educational purposes. This
may be scientific notes, lecture books, example problems or manuals for laboratory work, or
computer programs developed at the DCE.
Theses are monograms or collections of papers published to report the scientific work carried out at
the DCE to obtain a degree as either PhD or Doctor of Technology. The thesis is publicly available
after the defence of the degree.
Latest News is published to enable rapid communication of information about scientific work
carried out at the DCE. This includes the status of research projects, developments in the
laboratories, information about collaborative work and recent research results.
Published 2009 by
Aalborg University
Department of Civil Engineering
Sohngaardsholmsvej 57,
DK-9000 Aalborg, Denmark
Printed in Aalborg at Aalborg University
ISSN 1901-726X
DCE Technical Report No. 59

Recent publications in the DCE Technical Report Series
Borgarino, B. and Kofoed, J. P.: Development of a generic power simulation tool for
overtopping based wave energy devices. DCE Technical Report No. 35, ISSN 1901-726X.
Dep. of Civil Eng., Aalborg University, September 2007.
Kofoed, J. P. & Antonishen, M.: The Crest Wing Wave Energy Device. DCE Technical
Report No. 42. ISSN1901-726X. Dep. of Civil Eng., Aalborg University, Sept. 2008.
Margheritini, Lucia ; Morris, Alex: Model tests on overall forces on the SSG pilot plant. DCE
Technical Report No. 31, ISSN 1901-726X. Dep. of Civil Eng., Aalborg University, October
2007.

1
Preface
This report presents the results of a continuation of an experimental study of the wave energy
converting abilities of the Crest Wing wave energy converter (WEC), in the following referred to as
‘Phase 2’. The Crest Wing is a WEC that uses its movement in matching the shape of an oncoming wave
to generate power.
Model tests have been performed using scale models (length scale 1:30), provided by WaveEnergyFyn,
in regular and irregular wave states that can be found in Assessment of Wave Energy Devices. Best
Practice as used in Denmark (Frigaard et al., 2008). The tests were carried out at Dept. of Civil
Engineering, Aalborg University (AAU) in the 3D deep water wave tank. The displacement and force
applied to a power take off system, provided by WaveEnergyFyn, were measured and used to calculate
mechanical power available to the power take off.
The tests have been performed by Jens Peter Kofoed and Mike Antonishen, AAU, in co-operation with
Henning Pilgaard, WaveEnergyFyn (referred to as ‘the client’), who was present in the laboratory during
the tests. The testing took place in December, 2008. The report has been prepared by Jens Peter Kofoed
and Mike Antonishen (tlf.: +45 9635 8474, e-mail: [email protected]).
Aalborg, March, 2009
Version Date Author Comment
0.1 27.03.2009 JPK First draft
1.0 30.03.2009 JPK/MA Final version

2

3
Table of Contents 1. Introduction .............................................................................................................................................. 5
2. Test Setup ................................................................................................................................................. 7
2.1. Power measurement ......................................................................................................................... 8
3. Test Program ........................................................................................................................................... 11
4. Results ..................................................................................................................................................... 15
4.1. Skirt Length Optimization ................................................................................................................ 15
4.2. Inlet/Outlet Testing .......................................................................................................................... 16
4.3. Variable Weight Testing ................................................................................................................... 16
4.3.1. Original Device .......................................................................................................................... 17
4.3.2. New Device ............................................................................................................................... 17
4.4. Horizontal Skirt Variations ............................................................................................................... 18
4.5 Power Production Tests .................................................................................................................... 19
4.6. Power Matrix.................................................................................................................................... 20
4.7. Final Explorations ............................................................................................................................. 24
5. Conclusions ............................................................................................................................................. 27
References .................................................................................................................................................. 29
Appendix A .................................................................................................................................................. 31
A.1 Skirt Length Optimization ................................................................................................................. 31
A.2 Inlet/Outlet Testing .......................................................................................................................... 32
A.3 Original Device Variable Weight Testing, Outlet Attached-No Inlet ................................................ 33
A.4 Irregular Tests, Outlet Attached-No Inlet, No Weight Added .......................................................... 33
A.5 Horizontal Skirt Variations, Outlet Attached-No Inlet ...................................................................... 34
A.6 New Device Weight Tests, Outlet-No Inlet ....................................................................................... 35
A.7 Power Matrix Testing, Outlet-No Inlet ............................................................................................. 36
A.8 Final Explorations .............................................................................................................................. 37

4

5
1. Introduction The Crest Wing Wave Energy Converter is currently being developed by Henning Pilgaard, of
WaveEnergyFyn, Denmark. For an introduction to the concept please refer to Kofoed & Antonishen
(2008) who reported on the initial testing of the Crest Wing WEC.
The current study is a continuation of the study reported by Kofoed & Antonishen (2008), focusing on
the relative reference setup, following up on the following issues:
Skirt length optimization
Inlet/outlet
Influence of weight
Horizontal skirt variations
Scaling/sizing of the device
These items are treated in the following.
Values presented in the following figures and tables all refer to laboratory scale unless stated otherwise.

6
7
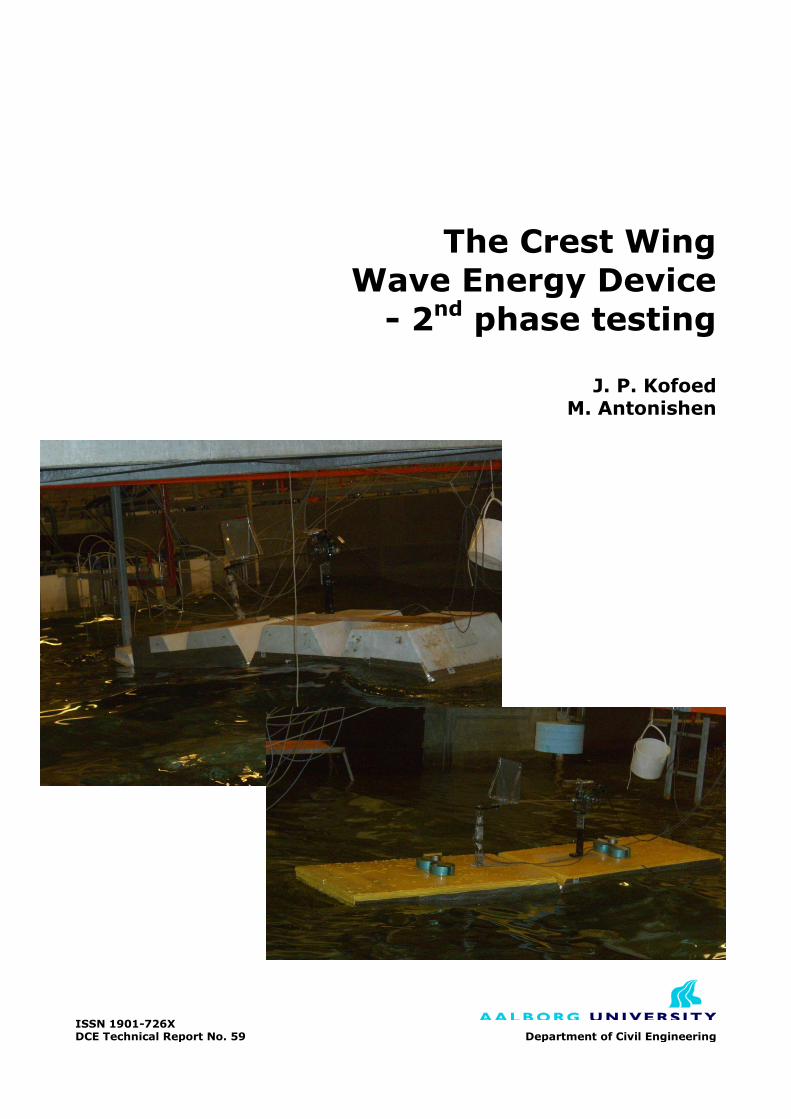
2. Test Setup All testing was performed with models supplied by the client (at an assumed length scale of 1:30).
All data points were recorded at a sample frequency of 25 Hz.
The anchoring of the Crest Wing was recreated to match the test setup used by Kofoed & Antonishen
(2008), exactly. The converter is anchored at both ends with springs and the characteristic of the
anchoring system in calm water is presented in Figure 1.
Figure 1: Anchoring Characteristics Kofoed & Antonishen (2008). For the current study, the relative reference setup is valid.
Waves have been measured using 8 separate wave gauges placed in front of and around the device. The
PTO used for testing was supplied by the client. It involves a disc brake through which the loading
provided to the system can be adjusted. This represents the PTO system, which in full scale will include
generator. Loading the PTO was done by placing masses in a bucket hanging vertically down from the
hand control for the disc break.

8
Figure 2: The test model (here Original Device with Inlet mounted) in the wave basin. Wave gauges in front of device used for calculation of incoming waves and their energy contents.
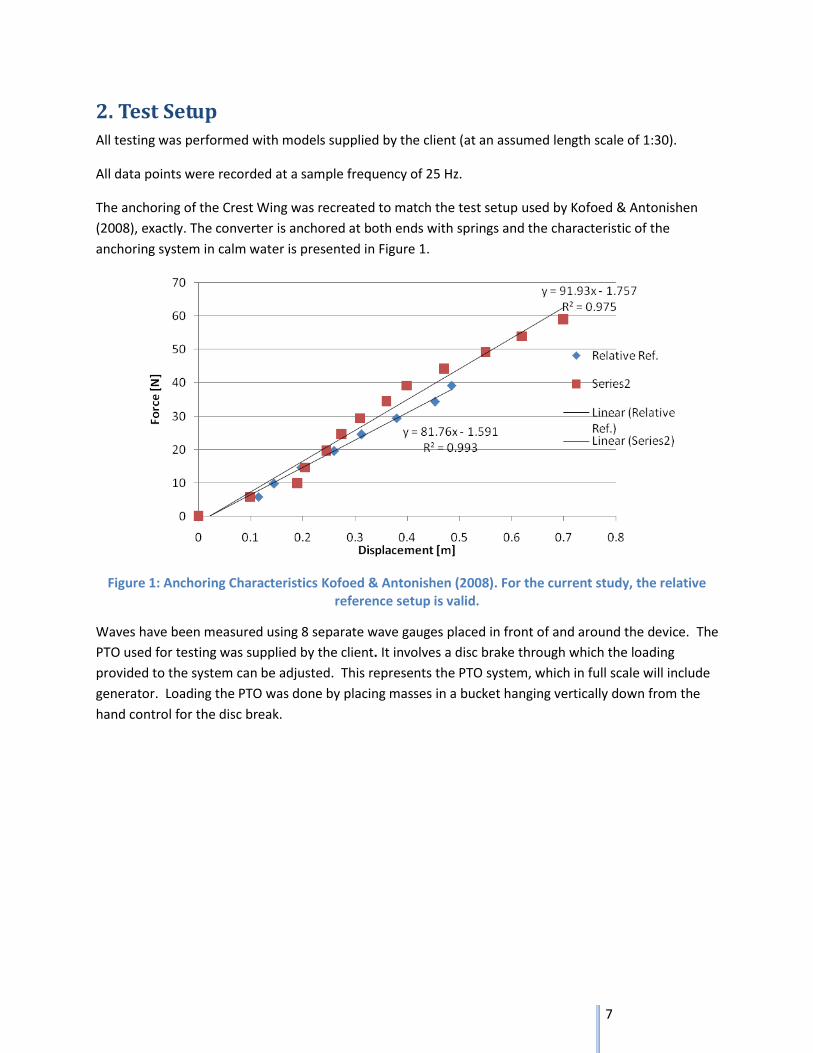
2.1. Power measurement
The test set up for testing is shown in Figure 3. Displacement is measured by a non-contact ultrasonic
displacement sensor while force measurements were taken by a ‘bone’ (a strain gauge equipped
cantilever beam) installed under the PTO model. Watching the movement of this device it was
hypothesized that the vertical force Fv would be very close to 0 because none of the force coming in this
direction has any effect on the displacement of the device and therefore it should not be included when
calculating power generated. Another thing that was noticed while looking at the results was that the
displacement measurement had some noise in it. Due to this, the measured data was filtered (using a
low pass filter) to ensure maximum reliability before any power calculations were made. In this case the
power calculation was done by taking
Where is the horizontal force calculated from moment 1 and is the horizontal force
calculated from moment 2.
9
Figure 3: PTO model setup. At left the disc brake providing the PTO load on the system is visible. At the right the ‘bone’ used for measurement of force is visible.

10
11
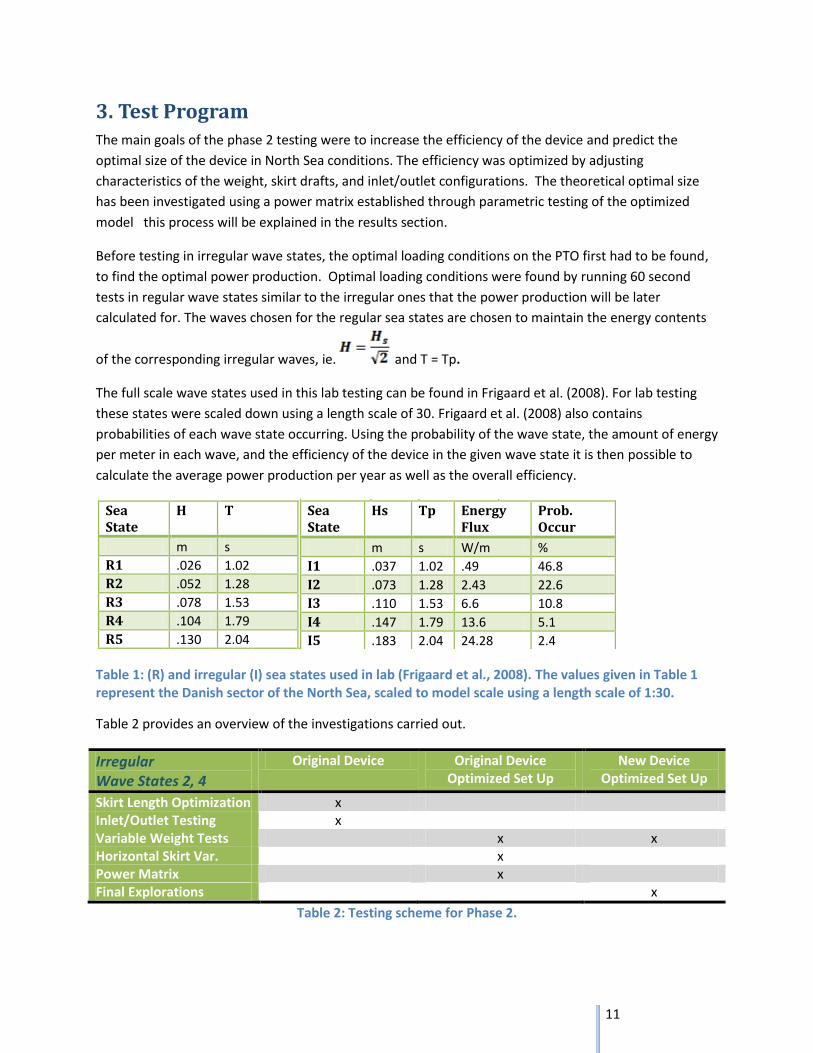
3. Test Program The main goals of the phase 2 testing were to increase the efficiency of the device and predict the
optimal size of the device in North Sea conditions. The efficiency was optimized by adjusting
characteristics of the weight, skirt drafts, and inlet/outlet configurations. The theoretical optimal size
has been investigated using a power matrix established through parametric testing of the optimized
model this process will be explained in the results section.
Before testing in irregular wave states, the optimal loading conditions on the PTO first had to be found,
to find the optimal power production. Optimal loading conditions were found by running 60 second
tests in regular wave states similar to the irregular ones that the power production will be later
calculated for. The waves chosen for the regular sea states are chosen to maintain the energy contents
of the corresponding irregular waves, ie. and T = Tp.
The full scale wave states used in this lab testing can be found in Frigaard et al. (2008). For lab testing
these states were scaled down using a length scale of 30. Frigaard et al. (2008) also contains
probabilities of each wave state occurring. Using the probability of the wave state, the amount of energy
per meter in each wave, and the efficiency of the device in the given wave state it is then possible to
calculate the average power production per year as well as the overall efficiency.
Sea State
H T
m s
R1 .026 1.02
R2 .052 1.28
R3 .078 1.53
R4 .104 1.79
R5 .130 2.04
Sea State
Hs Tp Energy Flux
Prob. Occur
m s W/m %
I1 .037 1.02 .49 46.8
I2 .073 1.28 2.43 22.6
I3 .110 1.53 6.6 10.8
I4 .147 1.79 13.6 5.1
I5 .183 2.04 24.28 2.4
Sea State
H T
m s
R1 .026 1.02
R2 .052 1.28
R3 .078 1.53
R4 .104 1.79
R5 .130 2.04
Sea State
Hs Tp Energy Flux
Prob. Occur
m s W/m %
I1 .037 1.02 .49 46.8
I2 .073 1.28 2.43 22.6
I3 .110 1.53 6.6 10.8
I4 .147 1.79 13.6 5.1
I5 .183 2.04 24.28 2.4
Table 1: (R) and irregular (I) sea states used in lab (Frigaard et al., 2008). The values given in Table 1 represent the Danish sector of the North Sea, scaled to model scale using a length scale of 1:30.
Table 2 provides an overview of the investigations carried out.
Irregular Wave States 2, 4
Original Device Original Device Optimized Set Up
New Device Optimized Set Up
Skirt Length Optimization x Inlet/Outlet Testing x Variable Weight Tests x x Horizontal Skirt Var. x Power Matrix x Final Explorations x
Table 2: Testing scheme for Phase 2.
12
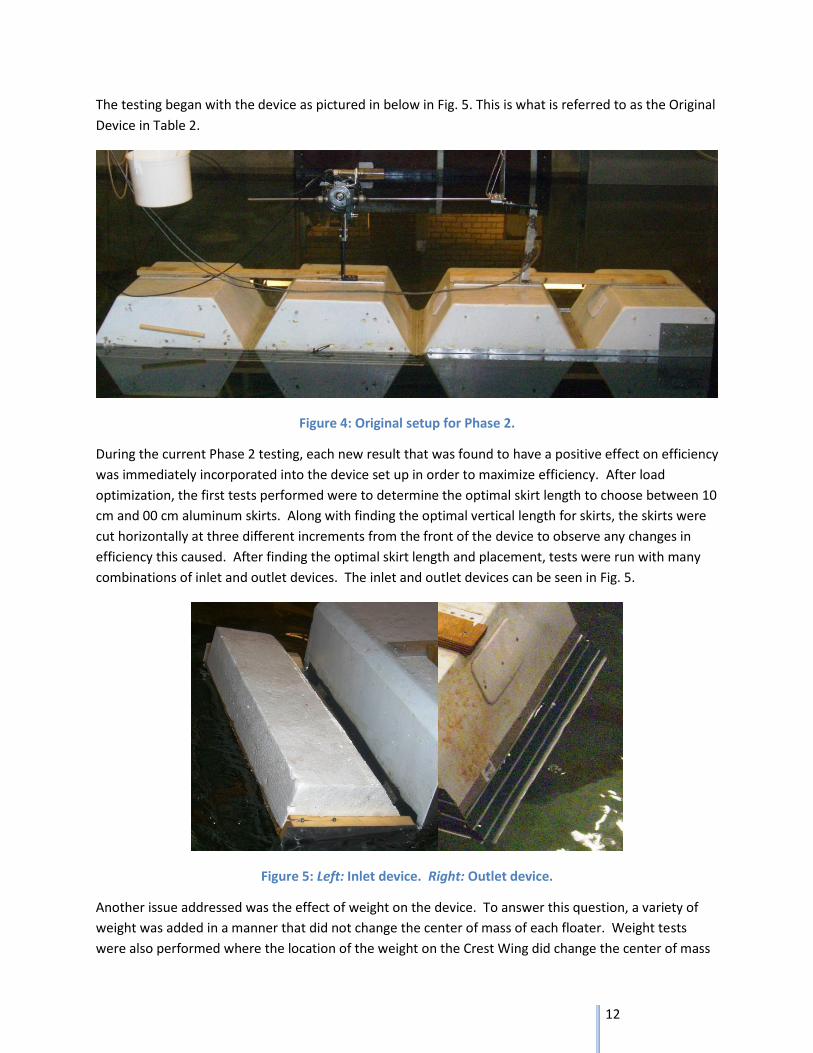
The testing began with the device as pictured in below in Fig. 5. This is what is referred to as the Original
Device in Table 2.
Figure 4: Original setup for Phase 2.
During the current Phase 2 testing, each new result that was found to have a positive effect on efficiency
was immediately incorporated into the device set up in order to maximize efficiency. After load
optimization, the first tests performed were to determine the optimal skirt length to choose between 10
cm and 00 cm aluminum skirts. Along with finding the optimal vertical length for skirts, the skirts were
cut horizontally at three different increments from the front of the device to observe any changes in
efficiency this caused. After finding the optimal skirt length and placement, tests were run with many
combinations of inlet and outlet devices. The inlet and outlet devices can be seen in Fig. 5.
Figure 5: Left: Inlet device. Right: Outlet device.
Another issue addressed was the effect of weight on the device. To answer this question, a variety of
weight was added in a manner that did not change the center of mass of each floater. Weight tests
were also performed where the location of the weight on the Crest Wing did change the center of mass
13
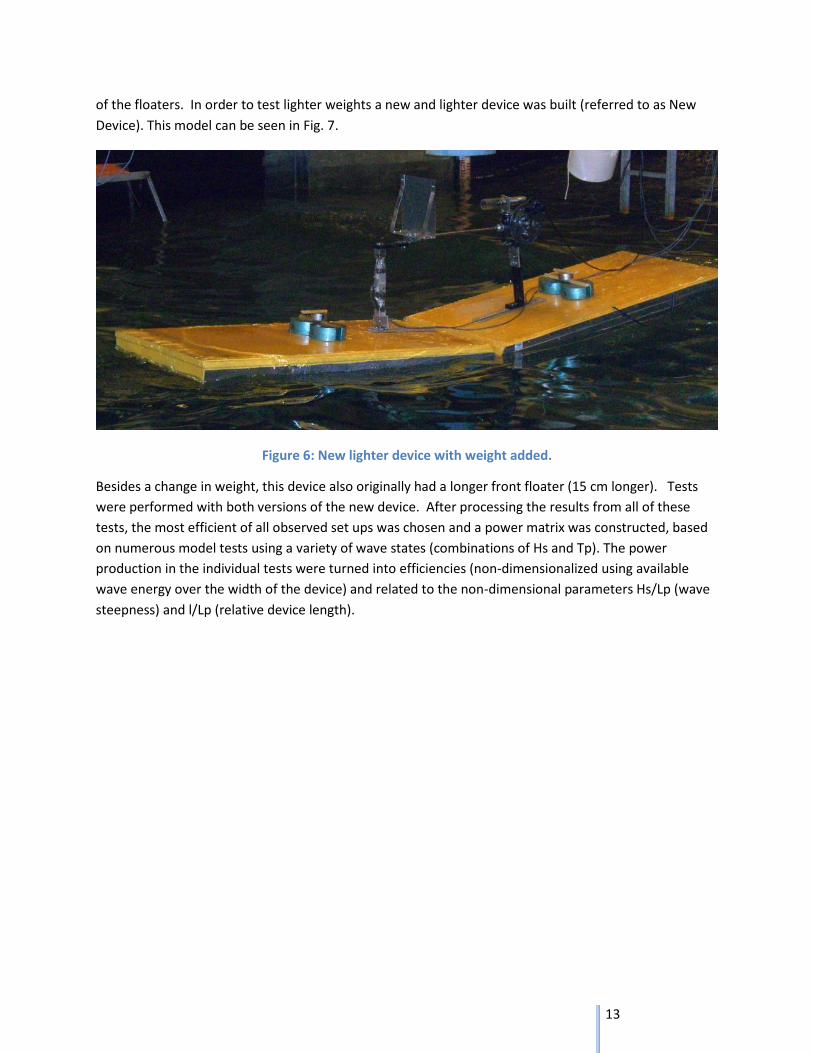
of the floaters. In order to test lighter weights a new and lighter device was built (referred to as New
Device). This model can be seen in Fig. 7.
Figure 6: New lighter device with weight added.
Besides a change in weight, this device also originally had a longer front floater (15 cm longer). Tests
were performed with both versions of the new device. After processing the results from all of these
tests, the most efficient of all observed set ups was chosen and a power matrix was constructed, based
on numerous model tests using a variety of wave states (combinations of Hs and Tp). The power
production in the individual tests were turned into efficiencies (non-dimensionalized using available
wave energy over the width of the device) and related to the non-dimensional parameters Hs/Lp (wave
steepness) and l/Lp (relative device length).

14

15
4. Results Before looking at any results it should be noted that in lower wave states, regular and irregular, the
forces and displacements experienced are so low that electronic noise in the measurements can play a
relatively large role in the results. In order to ensure good results, some of the signals were run through
low pass filters. Very careful attention was given to the filtering of these results to ensure that it was
done well and only when needed.
Besides load optimization tests using regular waves, all tests had a duration of 20 minute using irregular
tests (corresponding to roughly 1.000 waves). Results in wave states 1 and 2 could not be fully optimized
because a low enough load could not be achieved with the available PTO model to find peak production
in these states. Because of this, wave states with higher energy waves should be given more attention
(results from wave state 4 more reliable than those from waves state 2).
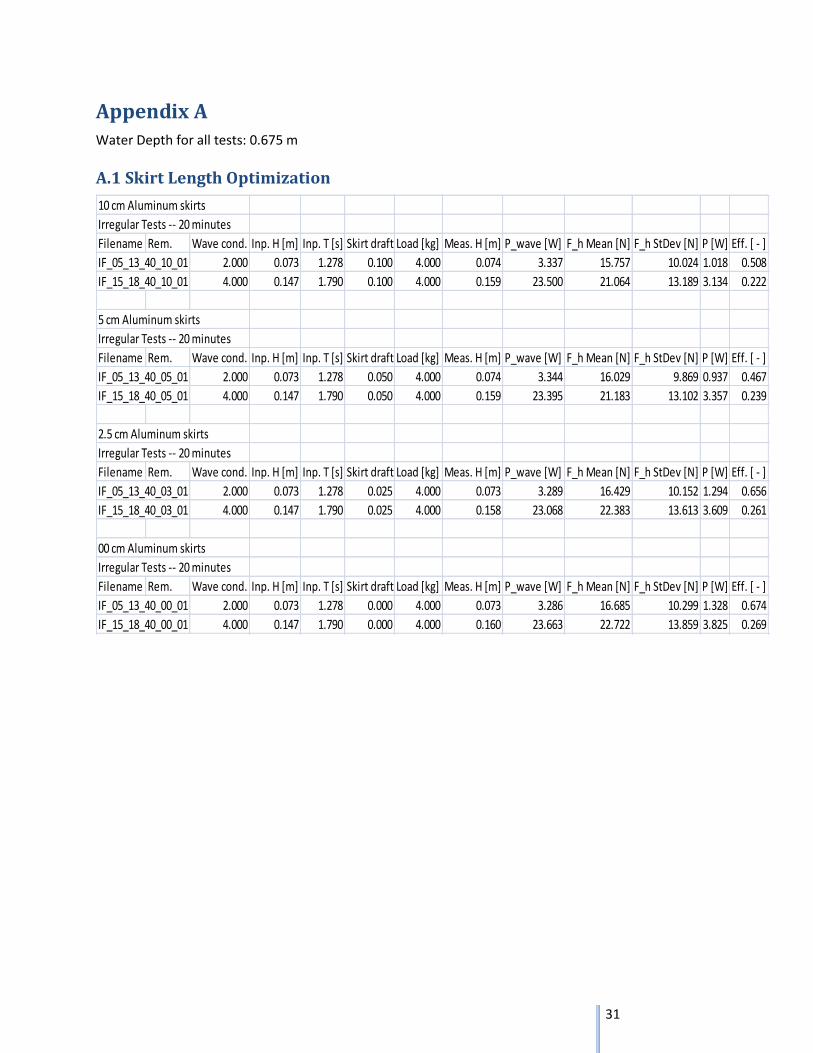
4.1. Skirt Length Optimization
Figure 7: Analysis of Skirt Length vs. Efficiency for the Crest Wing WEC. Data can be found in Appendix A.1.
Fig. 7 further confirms a relationship between skirt length and efficiency that was found in the Phase 1
tests (Kofoed & Antonishen, 2008). The Crest Wing functions best when it has no skirts attached, but
only marginally worse with 2.5 cm skirts. The configuration with 2.5 cm skirts were chosen for the
further testing, as the skirts play a pivotal role in stabilizing the Crest Wing against lateral movements,
which causes power losses.

16
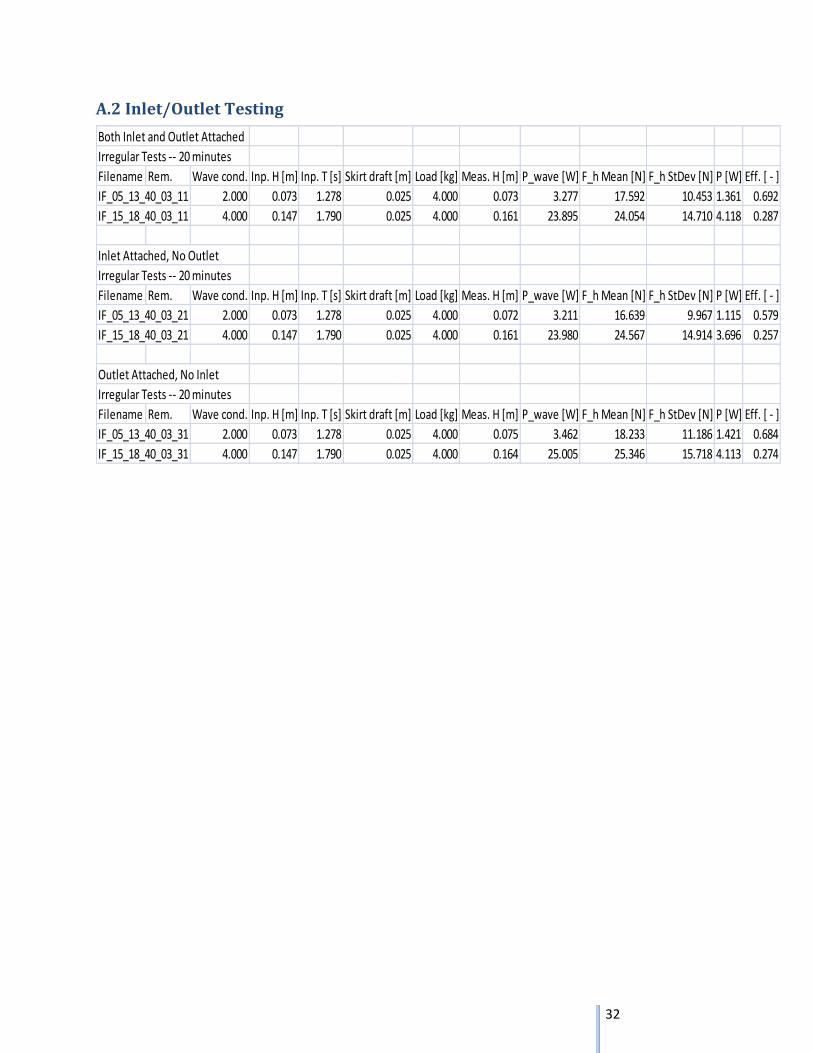
4.2. Inlet/Outlet Testing
0
0.1
0.2
0.3
0.4
0.5
0.6
0.7
0.8
0 1 2 3 4 5
Effi
cie
ncy
[-]
Wave State
Inlet+Outlet
Inlet
Outlet
Figure 8: Tests on the effect of inlet and outlet devices on the Crest Wing WEC with 2.5 cm skirts attached. Data can be found in Appendix A.2.
The results given in Fig. 8 clearly show that taking the outlet off of the device always gives a significant
drop in efficiency where taking the inlet off results in much less of a change. This data along with
qualitative analysis of the forces seen on the inlet and outlet devices lead to the conclusion that the
most sensible choice, in terms of what configuration to use in further testing, is using the device with
only outlet connected and no inlet.
4.3. Variable Weight Testing
It should be noted that in this section, addition of weights did not change the center of mass of the
device or either floater unless otherwise noted.
17
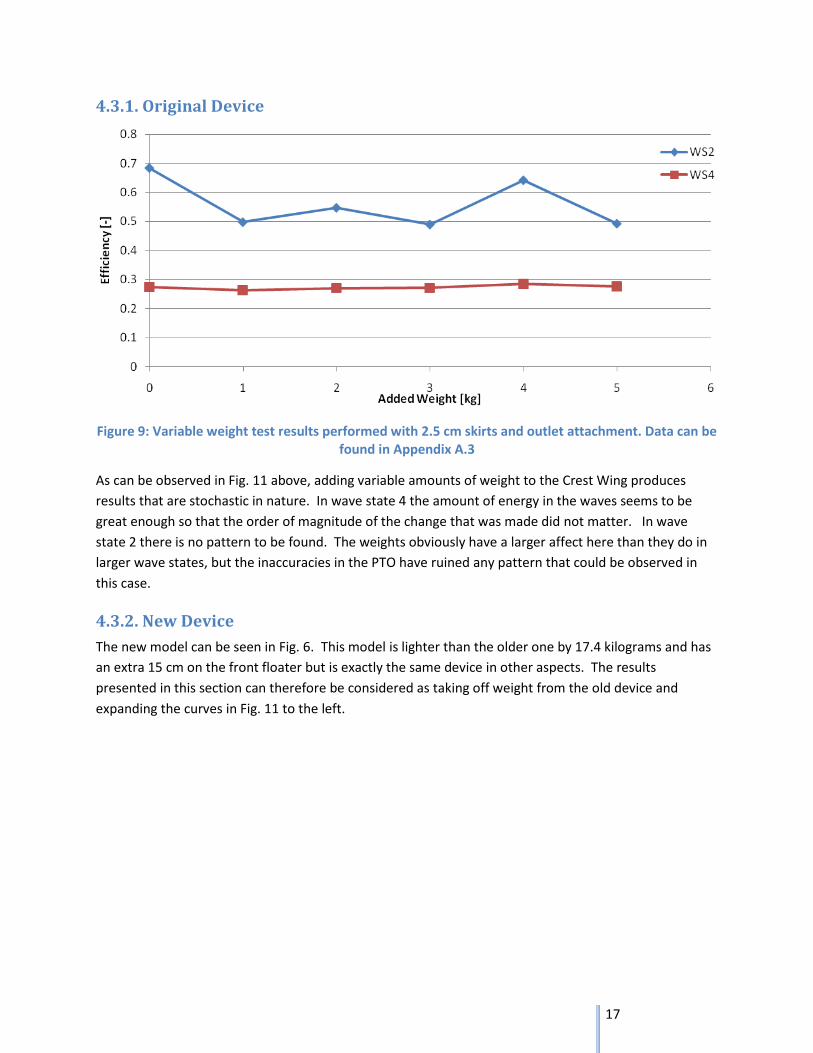
4.3.1. Original Device
Figure 9: Variable weight test results performed with 2.5 cm skirts and outlet attachment. Data can be found in Appendix A.3
As can be observed in Fig. 11 above, adding variable amounts of weight to the Crest Wing produces
results that are stochastic in nature. In wave state 4 the amount of energy in the waves seems to be
great enough so that the order of magnitude of the change that was made did not matter. In wave
state 2 there is no pattern to be found. The weights obviously have a larger affect here than they do in
larger wave states, but the inaccuracies in the PTO have ruined any pattern that could be observed in
this case.
4.3.2. New Device
The new model can be seen in Fig. 6. This model is lighter than the older one by 17.4 kilograms and has
an extra 15 cm on the front floater but is exactly the same device in other aspects. The results
presented in this section can therefore be considered as taking off weight from the old device and
expanding the curves in Fig. 11 to the left.

18
Figure 10: Added weight to the new device. The zero point on this graph represents the weight of the original device used in all previous tests. Data can be found in Appendix A.6
The data in Fig. 10 adds more weight to the argument that adding and subtracting weights of the sizes
shown does nothing to the efficiency of the device. The two green data points are special because the
weight was added to the outsides of each floater, changing each individual floaters center of mass but
leaving the total center of mass unchanged. This change had almost no affect on the device and further
exploration is not warranted. The difference between the efficiency in wave state 4 between Fig. 11 and
Fig. 12 can be explained by the added 15 cm on the front of the newer prototype
4.4. Horizontal Skirt Variations
Figure 11: A short exploration of horizontal skirt length on the Crest Wing WEC. Data can be found in Appendix A.5.
19
The data presented in Fig. 11 suggests that the front part of the skirts does not actually do much for the
device as the efficiency did not change when taking them away. Since the skirts do make a difference
overall vs. having no skirts, it is safe to say that this difference comes from the rear part of the skirts
which were not moved during these tests. It might be useful in the future to cut off sections from the
back of the skirts to see what affect this has on efficiency.
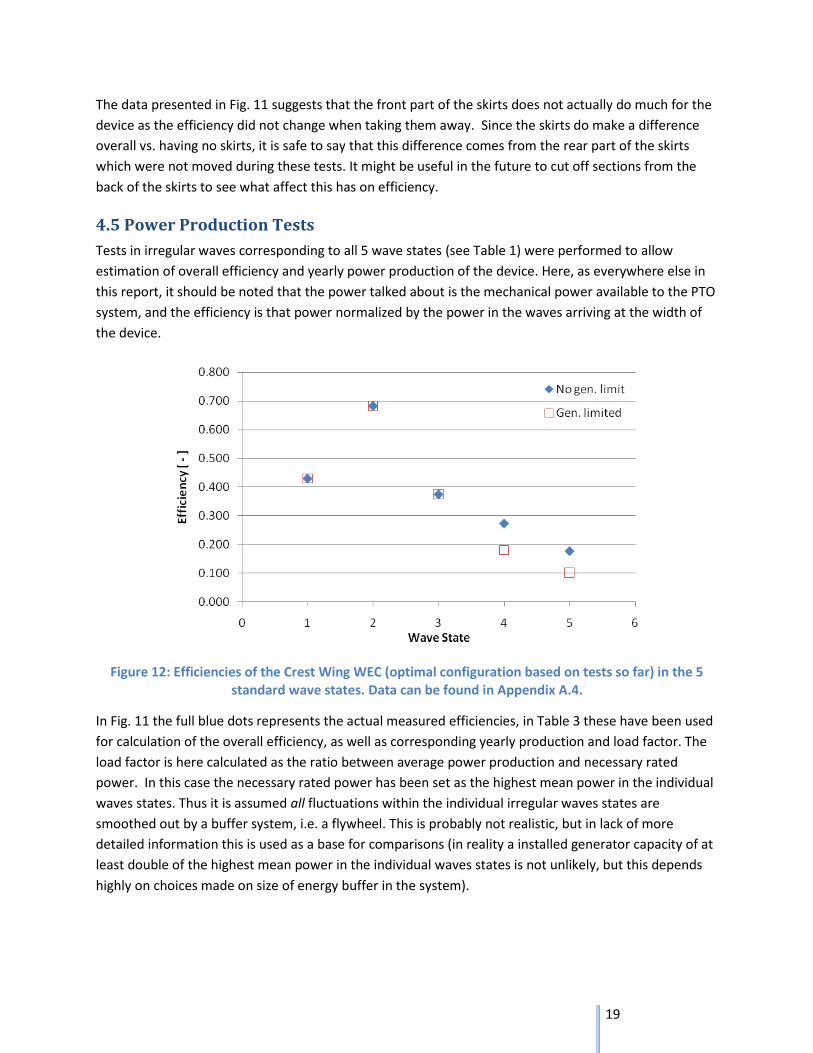
4.5 Power Production Tests
Tests in irregular waves corresponding to all 5 wave states (see Table 1) were performed to allow
estimation of overall efficiency and yearly power production of the device. Here, as everywhere else in
this report, it should be noted that the power talked about is the mechanical power available to the PTO
system, and the efficiency is that power normalized by the power in the waves arriving at the width of
the device.
Figure 12: Efficiencies of the Crest Wing WEC (optimal configuration based on tests so far) in the 5 standard wave states. Data can be found in Appendix A.4.
In Fig. 11 the full blue dots represents the actual measured efficiencies, in Table 3 these have been used
for calculation of the overall efficiency, as well as corresponding yearly production and load factor. The
load factor is here calculated as the ratio between average power production and necessary rated
power. In this case the necessary rated power has been set as the highest mean power in the individual
waves states. Thus it is assumed all fluctuations within the individual irregular waves states are
smoothed out by a buffer system, i.e. a flywheel. This is probably not realistic, but in lack of more
detailed information this is used as a base for comparisons (in reality a installed generator capacity of at
least double of the highest mean power in the individual waves states is not unlikely, but this depends
highly on choices made on size of energy buffer in the system).
20
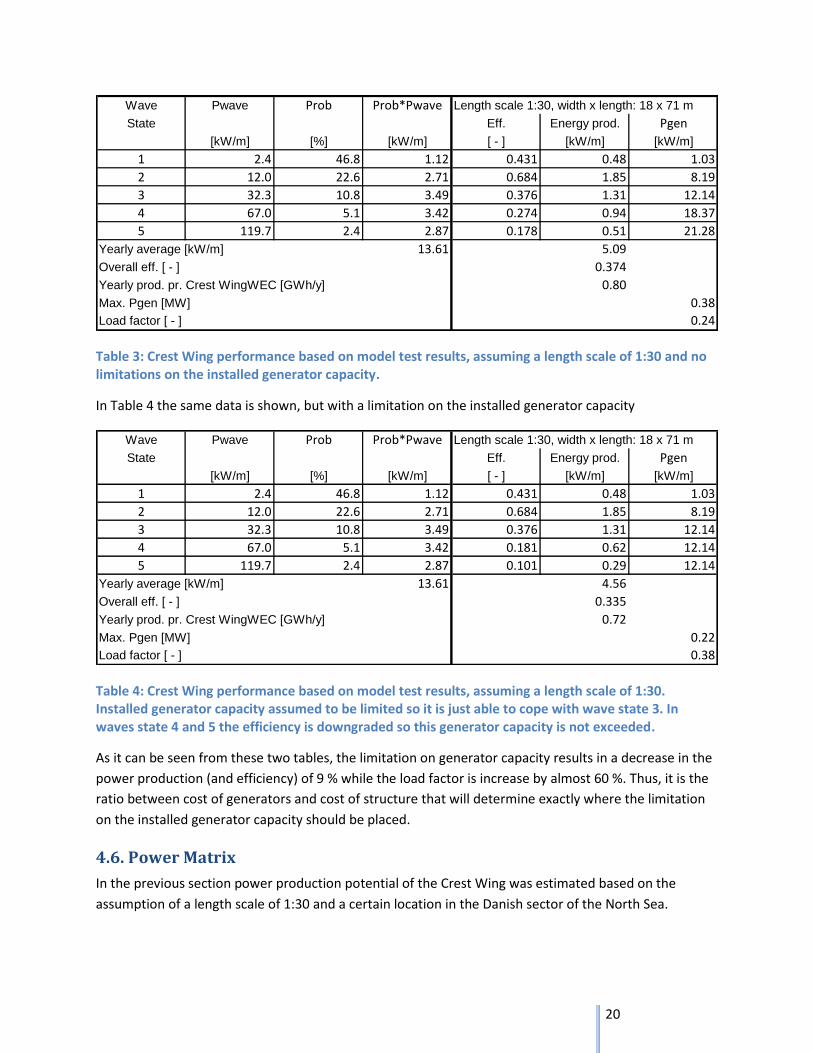
Wave Pwave Prob Prob*Pwave Length scale 1:30, width x length: 18 x 71 m
State Eff. Energy prod. Pgen
[kW/m] [%] [kW/m] [ - ] [kW/m] [kW/m]
1 2.4 46.8 1.12 0.431 0.48 1.03
2 12.0 22.6 2.71 0.684 1.85 8.19
3 32.3 10.8 3.49 0.376 1.31 12.14
4 67.0 5.1 3.42 0.274 0.94 18.37
5 119.7 2.4 2.87 0.178 0.51 21.28
Yearly average [kW/m] 13.61 5.09
Overall eff. [ - ] 0.374
Yearly prod. pr. Crest WingWEC [GWh/y] 0.80
Max. Pgen [MW] 0.38
Load factor [ - ] 0.24
Table 3: Crest Wing performance based on model test results, assuming a length scale of 1:30 and no limitations on the installed generator capacity.
In Table 4 the same data is shown, but with a limitation on the installed generator capacity
Wave Pwave Prob Prob*Pwave Length scale 1:30, width x length: 18 x 71 m
State Eff. Energy prod. Pgen
[kW/m] [%] [kW/m] [ - ] [kW/m] [kW/m]
1 2.4 46.8 1.12 0.431 0.48 1.03
2 12.0 22.6 2.71 0.684 1.85 8.19
3 32.3 10.8 3.49 0.376 1.31 12.14
4 67.0 5.1 3.42 0.181 0.62 12.14
5 119.7 2.4 2.87 0.101 0.29 12.14
Yearly average [kW/m] 13.61 4.56
Overall eff. [ - ] 0.335
Yearly prod. pr. Crest WingWEC [GWh/y] 0.72
Max. Pgen [MW] 0.22
Load factor [ - ] 0.38
Table 4: Crest Wing performance based on model test results, assuming a length scale of 1:30. Installed generator capacity assumed to be limited so it is just able to cope with wave state 3. In waves state 4 and 5 the efficiency is downgraded so this generator capacity is not exceeded.
As it can be seen from these two tables, the limitation on generator capacity results in a decrease in the
power production (and efficiency) of 9 % while the load factor is increase by almost 60 %. Thus, it is the
ratio between cost of generators and cost of structure that will determine exactly where the limitation
on the installed generator capacity should be placed.
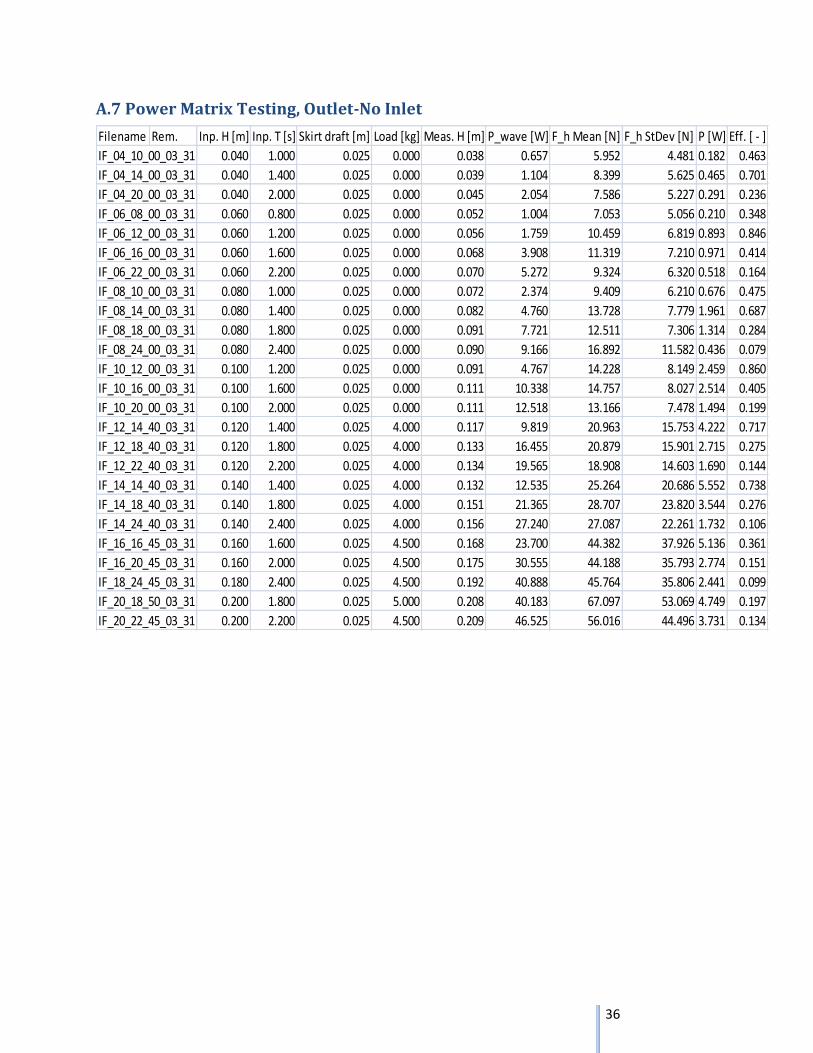
4.6. Power Matrix
In the previous section power production potential of the Crest Wing was estimated based on the
assumption of a length scale of 1:30 and a certain location in the Danish sector of the North Sea.
21
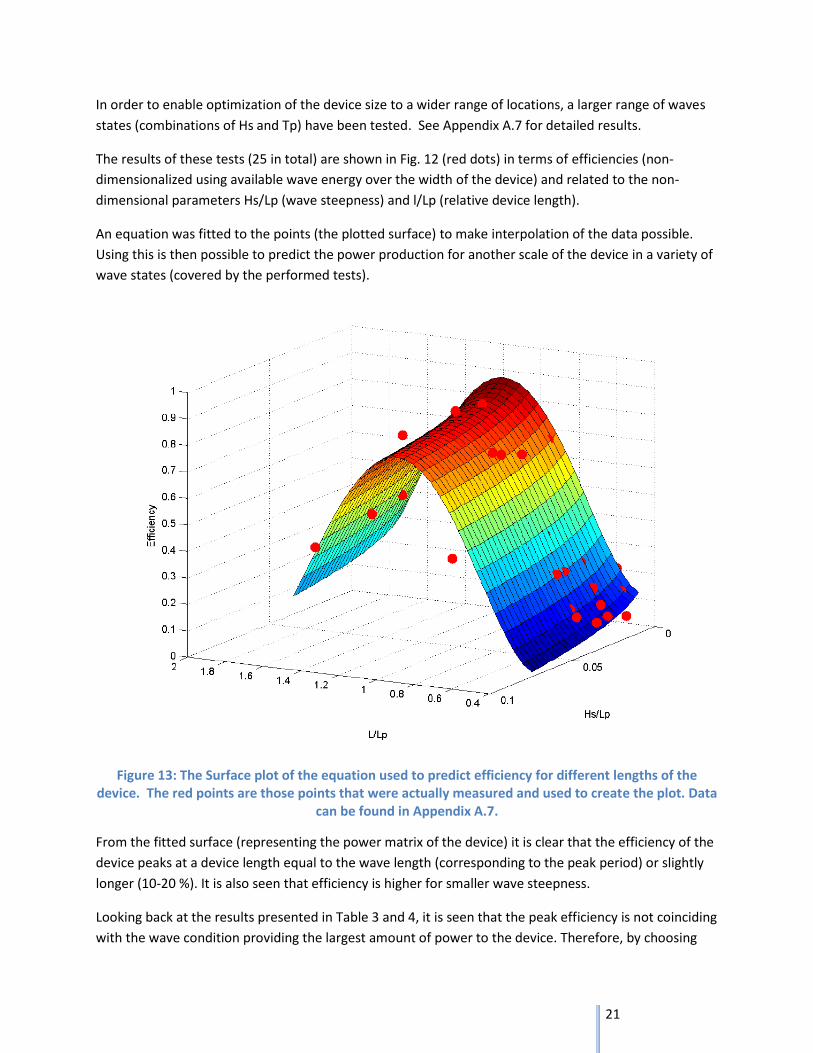
In order to enable optimization of the device size to a wider range of locations, a larger range of waves
states (combinations of Hs and Tp) have been tested. See Appendix A.7 for detailed results.
The results of these tests (25 in total) are shown in Fig. 12 (red dots) in terms of efficiencies (non-
dimensionalized using available wave energy over the width of the device) and related to the non-
dimensional parameters Hs/Lp (wave steepness) and l/Lp (relative device length).
An equation was fitted to the points (the plotted surface) to make interpolation of the data possible.
Using this is then possible to predict the power production for another scale of the device in a variety of
wave states (covered by the performed tests).
Figure 13: The Surface plot of the equation used to predict efficiency for different lengths of the device. The red points are those points that were actually measured and used to create the plot. Data
can be found in Appendix A.7.
From the fitted surface (representing the power matrix of the device) it is clear that the efficiency of the
device peaks at a device length equal to the wave length (corresponding to the peak period) or slightly
longer (10-20 %). It is also seen that efficiency is higher for smaller wave steepness.
Looking back at the results presented in Table 3 and 4, it is seen that the peak efficiency is not coinciding
with the wave condition providing the largest amount of power to the device. Therefore, by choosing
22
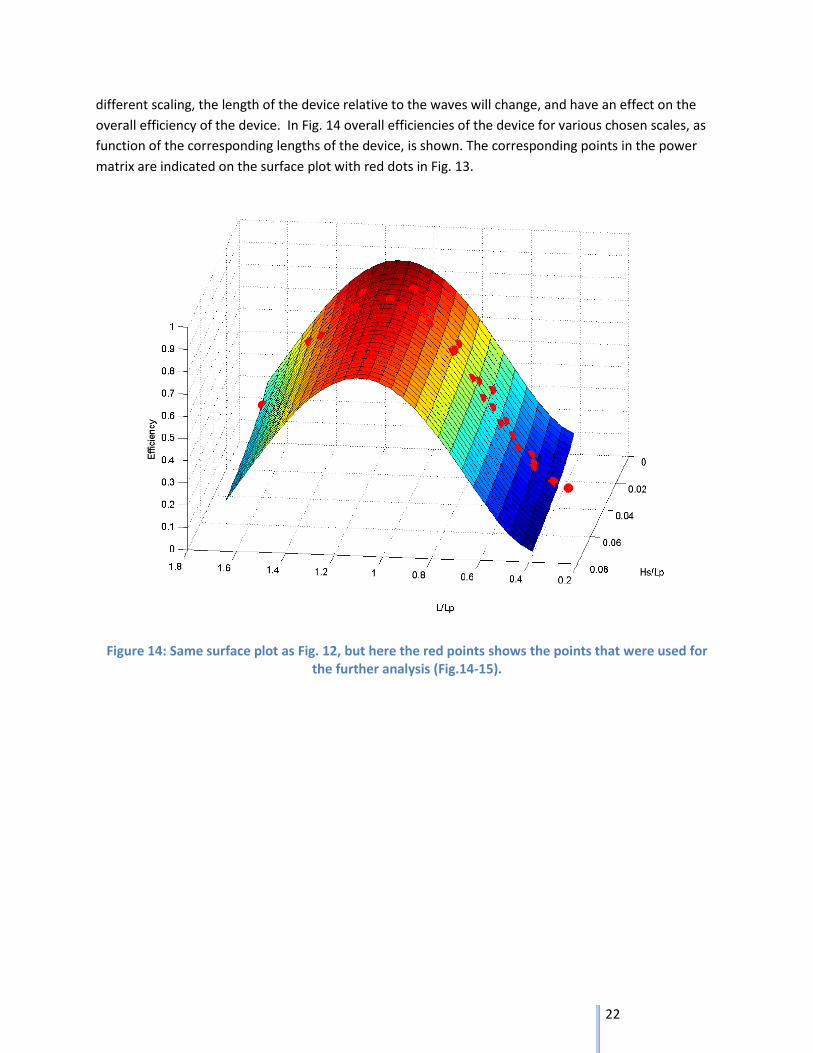
different scaling, the length of the device relative to the waves will change, and have an effect on the
overall efficiency of the device. In Fig. 14 overall efficiencies of the device for various chosen scales, as
function of the corresponding lengths of the device, is shown. The corresponding points in the power
matrix are indicated on the surface plot with red dots in Fig. 13.
Figure 14: Same surface plot as Fig. 12, but here the red points shows the points that were used for the further analysis (Fig.14-15).

23
0
0.1
0.2
0.3
0.4
0.5
0.6
0.7
40 60 80 100 120
Ove
rall
eff
icie
ncy
[ -
]
Device length [m]
No Limits
Realistic Generator Capacity
Figure 15: An analysis of device length in full scale vs. power production. The "No Limits" curve is for the case where a limitless generator capacity is assumed and the other case assumes limits on the
generator capacity. Data can be found in Appendix A.
In Fig. 14 the blue line corresponds to the situation where no limitations have been put on the maximum
power that the system can handle (installed capacity) (situation corresponding to Table 3 in previous
section). In this situation it is seen the overall efficiency continues to grow for increasing length of the
device, up to a length of approx. 100 m.
The red line corresponds to the situation where the installed capacity is limited to the level necessary to
handle all the available power up to and including wave state 3 (situation corresponding to Table 4 in
previous section). In this situation it is also seen that the overall efficiency continues to grow for
increasing length of the device, up to a length of approx. 100 m, but the growth flattens out already
around 80 m.
So the next question is then what is the economically optimal size of the device? When the length of the
device is growing, it is simultaneously assumed it is also enlarged in the two other dimensions as well.
Thus the volume of the device grows with the length cubes (l^B, B=3). The power production of the
device is calculated by multiplying the available power in the waves per meter by the overall efficiency
and the width of the device. Thus, if it is assumed the cost of the device follows the volume, then even
though an increase in the efficiency is gained by enlarging the device the overall economics will not
necessarily improve.
Now, it is not given that the price will be directly proportional to the volume of the device. It is likely
that there will be savings due to larger volumes, meaning that B is likely to be less than 3. This is also
linked to the fact that not much attention has been given to what structure is actually needed in the
device – maybe the height of the structure does not need to be increase proportionally to the length
and the width. Therefore an analysis of relative power production per cost as function of device length
has been performed for various B values. The results hereof are shown in Fig. 15.

24
Figure 16: Analysis of relative power production pr. cost as a function of device length for varying B values. This analysis is performed with the above mentioned limitation on generator capacity applied.
From data supplied by the client it is suggested that the costs are directly related to the volume of the
device. This means that a B value near 3 is probably the most appropriate. Thus, taking this effect into
account the optimal size of device is likely to be in the lower range, i.e. around a device length of 60 m.
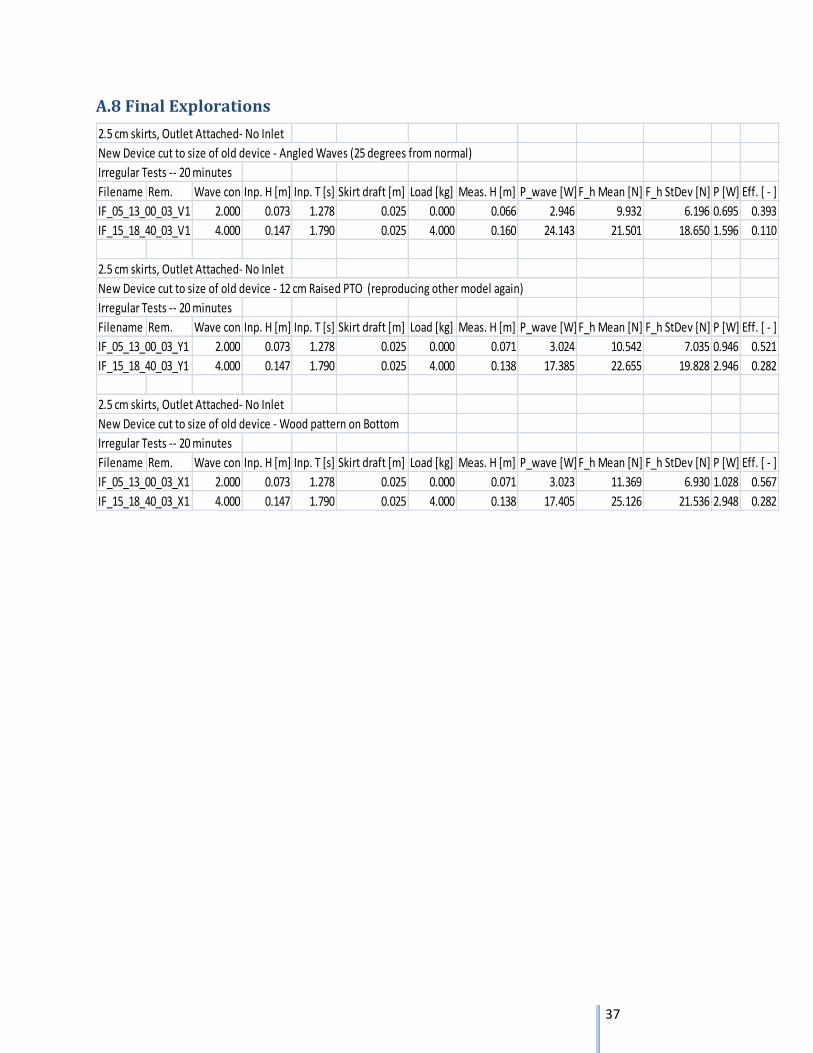
4.7. Final Explorations
A few final tests were performed to confirm assumptions that were made or to allow for educated
assumptions for the future. The results hereof are shown in Fig. 16.

25
Figure 17: Results for the final tests taken on the Crest Wing WEC in December. Data found in Appendix A.8.
The results above show that changing the contour on the bottom of the device and changing the height
of the PTO does little or nothing to efficiency but angling the waves changes it considerably. A large drop
in efficiency can be observed in Fig. 16 when the new prototype was tested with irregular waves at a
constant angle of 25 degrees from the normal 2D waves. The skirts are useful when considering
stability of the device especially in lower wave states but if this is at the cost of efficiency when the wave
direction is not aligned with the device then the presence of skirts should be reconsidered. The Crest
Wing would benefit from further testing with angled waves and 3D sea states.

26
27
5. Conclusions From the tests, results and analysis carried out in this second phase of testing the following conclusions
have been drawn:
While adding stability, skirt drafts on the Crest Wing also reduce efficiency most notably in 3D
wave states. The best balance between stability and efficiency was found using 2.5 cm skirts.
All inlet devices designed to this point have no effect on efficiency. The outlet device had a
significant effect on the Crest Wing’s efficiency. In larger scale testing, an outlet should be
included.
Variable weight testing revealed very little to no effect of the weight of the device within the
tested parameter range. This is taken as an indication of ratio between weight of the elements
of the device and the corresponding cross sectional area in the water plane is far away from a
value resulting in a natural frequency being near the ranges of the waves. Thus, natural
oscillations of the elements are not achieved. However, it is also considered unlike that this can
be achieved for this type of device.
The tests with variation of the horizontal extent of the skirts indicated that the skirts on the
front part of the device do very little to no good for the efficiency of the device.
Based on power production tests over all the 5 standard waves states showed that in the
assumed length scale of 1:30 the device can achieve an overall efficiency (the ratio between the
mechanical power available to the PTO system and the power in the waves arriving at the width
of the device, averaged over long time, i.e. a year) of 37 %. Introducing a limitation on the
installed capacity corresponding to what is necessary to handle the power in wave states up to
no. 3 (incl.), reduces this by 9 %, but increases the load factor by 60 %.
Based on an established non-dimensional power matrix for the device the effect of device size
on overall efficiency was analyzed. It was found that increasing the size from the approx. 70 m
(corresponding to the assumed length scale of 1:30) to 100-110 m would increase the overall
efficiency by approx. 40 % if no limitations were put on the installed capacity. If applying the
limitation on the installed capacity corresponding to what is necessary to handle the power in
wave states up to no. 3 (incl.), this increase was reduced to approx. 15 %. However, taking
device cost into account it seems unlikely that it is economically feasible to increase the length
of the device beyond the approx. 70 m. It might even be better to decrease it a little bit,
depending on the cost structure.
Finally, it was found that the device performance was quite sensitive to misalignment between
the device and the direction of the waves. A reduction of efficiency of approx. 25 % for an
oblique wave attack of 25° was found in wave state 2 and even much larger in wave state 4.

28

29
References Frigaard, Kofoed , and Nielsen: Assessment of Wave Energy Devices. Best Practice as used in Denmark.
World Renewable Energy Congress (WREC X), Glasgow, UK. July, 2008.
Kofoed, J. P. & Antonishen, M.: The Crest Wing Wave Energy Device. DCE Technical Report No. 42.
ISSN1901-726X. Dep. of Civil Eng., Aalborg University, Sept. 2008.

30
31
Appendix A Water Depth for all tests: 0.675 m
A.1 Skirt Length Optimization
10 cm Aluminum skirts
Irregular Tests -- 20 minutes
Filename Rem. Wave cond. Inp. H [m] Inp. T [s] Skirt draft [m]Load [kg] Meas. H [m] P_wave [W] F_h Mean [N] F_h StDev [N] P [W] Eff. [ - ]
IF_05_13_40_10_01 2.000 0.073 1.278 0.100 4.000 0.074 3.337 15.757 10.024 1.018 0.508
IF_15_18_40_10_01 4.000 0.147 1.790 0.100 4.000 0.159 23.500 21.064 13.189 3.134 0.222
5 cm Aluminum skirts
Irregular Tests -- 20 minutes
Filename Rem. Wave cond. Inp. H [m] Inp. T [s] Skirt draft [m]Load [kg] Meas. H [m] P_wave [W] F_h Mean [N] F_h StDev [N] P [W] Eff. [ - ]
IF_05_13_40_05_01 2.000 0.073 1.278 0.050 4.000 0.074 3.344 16.029 9.869 0.937 0.467
IF_15_18_40_05_01 4.000 0.147 1.790 0.050 4.000 0.159 23.395 21.183 13.102 3.357 0.239
2.5 cm Aluminum skirts
Irregular Tests -- 20 minutes
Filename Rem. Wave cond. Inp. H [m] Inp. T [s] Skirt draft [m]Load [kg] Meas. H [m] P_wave [W] F_h Mean [N] F_h StDev [N] P [W] Eff. [ - ]
IF_05_13_40_03_01 2.000 0.073 1.278 0.025 4.000 0.073 3.289 16.429 10.152 1.294 0.656
IF_15_18_40_03_01 4.000 0.147 1.790 0.025 4.000 0.158 23.068 22.383 13.613 3.609 0.261
00 cm Aluminum skirts
Irregular Tests -- 20 minutes
Filename Rem. Wave cond. Inp. H [m] Inp. T [s] Skirt draft [m]Load [kg] Meas. H [m] P_wave [W] F_h Mean [N] F_h StDev [N] P [W] Eff. [ - ]
IF_05_13_40_00_01 2.000 0.073 1.278 0.000 4.000 0.073 3.286 16.685 10.299 1.328 0.674
IF_15_18_40_00_01 4.000 0.147 1.790 0.000 4.000 0.160 23.663 22.722 13.859 3.825 0.269
32
A.2 Inlet/Outlet Testing
Both Inlet and Outlet Attached
Irregular Tests -- 20 minutes
Filename Rem. Wave cond. Inp. H [m] Inp. T [s] Skirt draft [m] Load [kg] Meas. H [m] P_wave [W] F_h Mean [N] F_h StDev [N] P [W] Eff. [ - ]
IF_05_13_40_03_11 2.000 0.073 1.278 0.025 4.000 0.073 3.277 17.592 10.453 1.361 0.692
IF_15_18_40_03_11 4.000 0.147 1.790 0.025 4.000 0.161 23.895 24.054 14.710 4.118 0.287
Inlet Attached, No Outlet
Irregular Tests -- 20 minutes
Filename Rem. Wave cond. Inp. H [m] Inp. T [s] Skirt draft [m] Load [kg] Meas. H [m] P_wave [W] F_h Mean [N] F_h StDev [N] P [W] Eff. [ - ]
IF_05_13_40_03_21 2.000 0.073 1.278 0.025 4.000 0.072 3.211 16.639 9.967 1.115 0.579
IF_15_18_40_03_21 4.000 0.147 1.790 0.025 4.000 0.161 23.980 24.567 14.914 3.696 0.257
Outlet Attached, No Inlet
Irregular Tests -- 20 minutes
Filename Rem. Wave cond. Inp. H [m] Inp. T [s] Skirt draft [m] Load [kg] Meas. H [m] P_wave [W] F_h Mean [N] F_h StDev [N] P [W] Eff. [ - ]
IF_05_13_40_03_31 2.000 0.073 1.278 0.025 4.000 0.075 3.462 18.233 11.186 1.421 0.684
IF_15_18_40_03_31 4.000 0.147 1.790 0.025 4.000 0.164 25.005 25.346 15.718 4.113 0.274

33
A.3 Original Device Variable Weight Testing, Outlet Attached-No Inlet
4 Kilos Added to each floater
Irregular Tests -- 20 minutes
Filename Rem. Wave cond.Inp. H [m] Inp. T [s] Skirt draft [m] Load [kg] Meas. H [m] P_wave [W] F_h Mean [N] F_h StDev [N] P [W] Eff. [ - ]
IF_05_13_40_03_41 2.000 0.073 1.278 0.025 4.000 0.074 3.310 16.117 12.167 1.274 0.642
IF_15_18_40_03_41 4.000 0.147 1.790 0.025 4.000 0.159 23.305 25.681 18.414 3.992 0.285
2 Kilos Added to each floater
Irregular Tests -- 20 minutes
Filename Rem. Wave cond.Inp. H [m] Inp. T [s] Skirt draft [m] Load [kg] Meas. H [m] P_wave [W] F_h Mean [N] F_h StDev [N] P [W] Eff. [ - ]
IF_05_13_40_03_51 2.000 0.073 1.278 0.025 4.000 0.074 3.355 16.076 13.180 1.101 0.547
IF_15_18_40_03_51 4.000 0.147 1.790 0.025 4.000 0.160 23.783 26.805 20.237 3.868 0.271
1 Kilo Added to each floater
Irregular Tests -- 20 minutes
Filename Rem. Wave cond.Inp. H [m] Inp. T [s] Skirt draft [m] Load [kg] Meas. H [m] P_wave [W] F_h Mean [N] F_h StDev [N] P [W] Eff. [ - ]
IF_05_13_40_03_61 2.000 0.073 1.278 0.025 4.000 0.074 3.351 16.557 14.293 1.000 0.497
IF_15_18_40_03_61 4.000 0.147 1.790 0.025 4.000 0.160 23.635 28.344 22.160 3.735 0.263
3 Kilos Added to each floater
Irregular Tests -- 20 minutes
Filename Rem. Wave cond.Inp. H [m] Inp. T [s] Skirt draft [m] Load [kg] Meas. H [m] P_wave [W] F_h Mean [N] F_h StDev [N] P [W] Eff. [ - ]
IF_05_13_40_03_71 2.000 0.073 1.278 0.025 4.000 0.073 3.313 17.193 15.131 0.973 0.489
IF_15_18_40_03_71 4.000 0.147 1.790 0.025 4.000 0.160 23.690 29.230 23.170 3.854 0.271
5 Kilos Added to each floater
Irregular Tests -- 20 minutes
Filename Rem. Wave cond.Inp. H [m] Inp. T [s] Skirt draft [m] Load [kg] Meas. H [m] P_wave [W] F_h Mean [N] F_h StDev [N] P [W] Eff. [ - ]
IF_05_13_40_03_81 2.000 0.073 1.278 0.025 4.000 0.075 3.425 17.377 15.859 1.012 0.492
IF_15_18_40_03_81 4.000 0.147 1.790 0.025 4.000 0.160 23.738 30.064 24.076 3.947 0.277
A.4 Irregular Tests, Outlet Attached-No Inlet, No Weight Added
Irregular Tests -- 20 minutes
Filename Rem. Wave cond.Inp. H [m] Inp. T [s] Skirt draft [m] Load [kg] Meas. H [m] P_wave [W] F_h Mean [N] F_h StDev [N] P [W] Eff. [ - ]
IF_03_10_40_03_31 1.000 0.037 1.022 0.025 4.000 0.030 0.404 6.400 5.184 0.104 0.431
IF_05_13_40_03_31 2.000 0.073 1.278 0.025 4.000 0.075 3.462 18.233 11.186 1.421 0.684
IF_11_15_40_03_31 3.000 0.110 1.530 0.025 4.000 0.120 11.345 26.132 22.014 2.558 0.376
IF_15_18_40_03_31 4.000 0.147 1.790 0.025 4.000 0.164 25.005 25.346 15.718 4.113 0.274
IF_18_20_45_03_31 5.000 0.183 2.045 0.025 4.500 0.197 39.445 44.918 35.767 4.208 0.178
IF_18_20_50_03_31 5.000 0.183 2.045 0.025 5.000 0.196 39.080 55.163 42.359 3.915 0.167

34
A.5 Horizontal Skirt Variations, Outlet Attached-No Inlet
Front Skirts cut by 10.5 Cm
Irregular Tests -- 20 minutes
Filename Rem. Wave cond.Inp. H [m] Inp. T [s] Skirt draft [m] Load [kg] Meas. H [m] P_wave [W] F_h Mean [N] F_h StDev [N] P [W] Eff. [ - ]
IF_05_13_40_03_91 2.000 0.073 1.278 0.025 4.000 0.072 3.188 16.059 12.186 1.196 0.625
IF_15_18_40_03_91 4.000 0.147 1.790 0.025 4.000 0.157 22.855 26.016 19.125 4.145 0.302
Front Skirts cut by 21 Cm
Irregular Tests -- 20 minutes
Filename Rem. Wave cond.Inp. H [m] Inp. T [s] Skirt draft [m] Load [kg] Meas. H [m] P_wave [W] F_h Mean [N] F_h StDev [N] P [W] Eff. [ - ]
IF_05_13_40_03_A1 2.000 0.073 1.278 0.025 4.000 0.072 3.199 16.602 13.879 1.127 0.587
IF_15_18_40_03_A1 4.000 0.147 1.790 0.025 4.000 0.157 22.853 27.551 20.924 4.157 0.303
Front Skirts cut by 31.5 Cm
Irregular Tests -- 20 minutes
Filename Rem. Wave cond.Inp. H [m] Inp. T [s] Skirt draft [m] Load [kg] Meas. H [m] P_wave [W] F_h Mean [N] F_h StDev [N] P [W] Eff. [ - ]
IF_05_13_40_03_B1 2.000 0.073 1.278 0.025 4.000 0.072 3.191 16.958 14.317 1.067 0.558
IF_15_18_40_03_B1 4.000 0.147 1.790 0.025 4.000 0.158 23.045 28.162 22.038 4.187 0.303

35
A.6 New Device Weight Tests, Outlet-No Inlet
0 Kilos Added
Irregular Tests -- 20 minutes
Filename Rem. Wave cond.Inp. H [m] Inp. T [s] Skirt draft [m] Load [kg] Meas. H [m] P_wave [W]F_h Mean [N] F_h StDev [N] P [W] Eff. [ - ]
IF_05_13_00_03_C1 2.000 0.073 1.278 0.025 0.000 0.069 2.989 10.795 6.824 1.050 0.585
IF_15_18_40_03_C1 4.000 0.147 1.790 0.025 4.000 0.156 22.698 20.247 14.035 2.712 0.199
8 Kilos Added, no change to Center of Mass
Irregular Tests -- 20 minutes
Filename Rem. Wave cond.Inp. H [m] Inp. T [s] Skirt draft [m] Load [kg] Meas. H [m] P_wave [W]F_h Mean [N] F_h StDev [N] P [W] Eff. [ - ]
IF_05_13_00_03_D1 2.000 0.073 1.278 0.025 0.000 0.070 3.062 10.952 6.972 1.082 0.589
IF_15_18_40_03_D1 4.000 0.147 1.790 0.025 4.000 0.154 22.130 20.462 14.248 2.780 0.209
18 Kilos Added, no change to Center of Mass
Irregular Tests -- 20 minutes
Filename Rem. Wave cond.Inp. H [m] Inp. T [s] Skirt draft [m] Load [kg] Meas. H [m] P_wave [W]F_h Mean [N] F_h StDev [N] P [W] Eff. [ - ]
IF_05_13_00_03_E1 2.000 0.073 1.278 0.025 0.000 0.071 3.079 10.888 6.845 1.109 0.600
IF_15_18_40_03_E1 4.000 0.147 1.790 0.025 4.000 0.158 23.020 20.829 14.627 2.936 0.213
4 Kilos Added, Outer edges, change in Center of Mass of each individual floater.
Irregular Tests -- 20 minutes
Filename Rem. Wave cond.Inp. H [m] Inp. T [s] Skirt draft [m] Load [kg] Meas. H [m] P_wave [W]F_h Mean [N] F_h StDev [N] P [W] Eff. [ - ]
IF_05_13_00_03_F1 2.000 0.073 1.278 0.025 0.000 0.070 2.985 11.288 7.087 1.089 0.608
IF_15_18_40_03_F1 4.000 0.147 1.790 0.025 4.000 0.156 22.425 21.379 15.372 2.882 0.214
IF_15_18_45_03_F1comparison test, confirming we have correct loading conditions4.000 0.147 1.790 0.025 4.500 0.156 22.520 29.814 23.827 3.007 0.223
36
A.7 Power Matrix Testing, Outlet-No Inlet
Filename Rem. Inp. H [m] Inp. T [s] Skirt draft [m] Load [kg] Meas. H [m] P_wave [W] F_h Mean [N] F_h StDev [N] P [W] Eff. [ - ]
IF_04_10_00_03_31 0.040 1.000 0.025 0.000 0.038 0.657 5.952 4.481 0.182 0.463
IF_04_14_00_03_31 0.040 1.400 0.025 0.000 0.039 1.104 8.399 5.625 0.465 0.701
IF_04_20_00_03_31 0.040 2.000 0.025 0.000 0.045 2.054 7.586 5.227 0.291 0.236
IF_06_08_00_03_31 0.060 0.800 0.025 0.000 0.052 1.004 7.053 5.056 0.210 0.348
IF_06_12_00_03_31 0.060 1.200 0.025 0.000 0.056 1.759 10.459 6.819 0.893 0.846
IF_06_16_00_03_31 0.060 1.600 0.025 0.000 0.068 3.908 11.319 7.210 0.971 0.414
IF_06_22_00_03_31 0.060 2.200 0.025 0.000 0.070 5.272 9.324 6.320 0.518 0.164
IF_08_10_00_03_31 0.080 1.000 0.025 0.000 0.072 2.374 9.409 6.210 0.676 0.475
IF_08_14_00_03_31 0.080 1.400 0.025 0.000 0.082 4.760 13.728 7.779 1.961 0.687
IF_08_18_00_03_31 0.080 1.800 0.025 0.000 0.091 7.721 12.511 7.306 1.314 0.284
IF_08_24_00_03_31 0.080 2.400 0.025 0.000 0.090 9.166 16.892 11.582 0.436 0.079
IF_10_12_00_03_31 0.100 1.200 0.025 0.000 0.091 4.767 14.228 8.149 2.459 0.860
IF_10_16_00_03_31 0.100 1.600 0.025 0.000 0.111 10.338 14.757 8.027 2.514 0.405
IF_10_20_00_03_31 0.100 2.000 0.025 0.000 0.111 12.518 13.166 7.478 1.494 0.199
IF_12_14_40_03_31 0.120 1.400 0.025 4.000 0.117 9.819 20.963 15.753 4.222 0.717
IF_12_18_40_03_31 0.120 1.800 0.025 4.000 0.133 16.455 20.879 15.901 2.715 0.275
IF_12_22_40_03_31 0.120 2.200 0.025 4.000 0.134 19.565 18.908 14.603 1.690 0.144
IF_14_14_40_03_31 0.140 1.400 0.025 4.000 0.132 12.535 25.264 20.686 5.552 0.738
IF_14_18_40_03_31 0.140 1.800 0.025 4.000 0.151 21.365 28.707 23.820 3.544 0.276
IF_14_24_40_03_31 0.140 2.400 0.025 4.000 0.156 27.240 27.087 22.261 1.732 0.106
IF_16_16_45_03_31 0.160 1.600 0.025 4.500 0.168 23.700 44.382 37.926 5.136 0.361
IF_16_20_45_03_31 0.160 2.000 0.025 4.500 0.175 30.555 44.188 35.793 2.774 0.151
IF_18_24_45_03_31 0.180 2.400 0.025 4.500 0.192 40.888 45.764 35.806 2.441 0.099
IF_20_18_50_03_31 0.200 1.800 0.025 5.000 0.208 40.183 67.097 53.069 4.749 0.197
IF_20_22_45_03_31 0.200 2.200 0.025 4.500 0.209 46.525 56.016 44.496 3.731 0.134
37
A.8 Final Explorations
2.5 cm skirts, Outlet Attached- No Inlet
New Device cut to size of old device - Angled Waves (25 degrees from normal)
Irregular Tests -- 20 minutes
Filename Rem. Wave cond.Inp. H [m] Inp. T [s] Skirt draft [m] Load [kg] Meas. H [m] P_wave [W]F_h Mean [N] F_h StDev [N] P [W] Eff. [ - ]
IF_05_13_00_03_V1 2.000 0.073 1.278 0.025 0.000 0.066 2.946 9.932 6.196 0.695 0.393
IF_15_18_40_03_V1 4.000 0.147 1.790 0.025 4.000 0.160 24.143 21.501 18.650 1.596 0.110
2.5 cm skirts, Outlet Attached- No Inlet
New Device cut to size of old device - 12 cm Raised PTO (reproducing other model again)
Irregular Tests -- 20 minutes
Filename Rem. Wave cond.Inp. H [m] Inp. T [s] Skirt draft [m] Load [kg] Meas. H [m] P_wave [W]F_h Mean [N] F_h StDev [N] P [W] Eff. [ - ]
IF_05_13_00_03_Y1 2.000 0.073 1.278 0.025 0.000 0.071 3.024 10.542 7.035 0.946 0.521
IF_15_18_40_03_Y1 4.000 0.147 1.790 0.025 4.000 0.138 17.385 22.655 19.828 2.946 0.282
2.5 cm skirts, Outlet Attached- No Inlet
New Device cut to size of old device - Wood pattern on Bottom
Irregular Tests -- 20 minutes
Filename Rem. Wave cond.Inp. H [m] Inp. T [s] Skirt draft [m] Load [kg] Meas. H [m] P_wave [W]F_h Mean [N] F_h StDev [N] P [W] Eff. [ - ]
IF_05_13_00_03_X1 2.000 0.073 1.278 0.025 0.000 0.071 3.023 11.369 6.930 1.028 0.567
IF_15_18_40_03_X1 4.000 0.147 1.790 0.025 4.000 0.138 17.405 25.126 21.536 2.948 0.282
Related Documents